UNITED STATES
SECURITIES AND EXCHANGE COMMISSION
Washington, DC 20549
FORMN-CSRS
CERTIFIED SHAREHOLDER REPORT OF REGISTERED
MANAGEMENT INVESTMENT COMPANIES
Investment Company Act file number811-02781
Templeton Funds
(Exact name of registrant as specified in charter)
300 S.E. 2nd Street, Fort Lauderdale, FL 33301-1923
(Address of principal executive offices) (Zip code)
Craig S. Tyle, One Franklin Parkway, San Mateo, CA 94403-1906
(Name and address of agent for service)
Registrant’s telephone number, including area code: (954)527-7500
Date of fiscal year end: 8/31
Date of reporting period: 2/28/19
Item 1. Reports to Stockholders.
Internet Delivery of Fund Reports Unless You Request Paper Copies:Effective January 1, 2021, as permitted by the SEC, paper copies of the Fund’s shareholder reports will no longer be sent by mail, unless you specifically request them from the Fund or your financial intermediary. Instead, the reports will be made available on a website, and you will be notified by mail each time a report is posted and provided with a website link to access the report.
If you already elected to receive shareholder reports electronically, you will not be affected by this change and you need not take any action. If you have not signed up for electronic delivery, we would encourage you to join fellow shareholders who have. You may elect to receive shareholder reports and other communications electronically from the Fund by calling (800)632-2301 or by contacting your financial intermediary.
You may elect to continue to receive paper copies of all your future shareholder reports free of charge by contacting your financial intermediary or, if you invest directly with a Fund, calling (800)632-2301 to let the Fund know of your request. Your election to receive reports in paper will apply to all funds held in your account.
Franklin Templeton
Successful investing begins with ambition. And achievement only comes when you reach for it. That’s why we continually strive to deliver better outcomes for investors. No matter what your goals are, our deep, global investment expertise allows us to offer solutions that can help.
During our more than 70 years of experience, we’ve managed through all kinds of markets—up, down and those in between. We’re always preparing for what may come next. It’s because of this, combined with our strength as one of the world’s largest asset managers that we’ve earned the trust of millions of investors around the world.
Dear Shareholder:
During the six months ended February 28, 2019, the global economy generally expanded and many companies reported solid revenues and earnings. Global markets were pressured by concerns about increased technology company regulation, U.S. and European Union political uncertainties, major central banks’ interest-rate policies and the impact of the U.S.-China trade dispute on global growth and corporate earnings. Nearperiod-end, the U.S. Federal Reserve’s indications of a cautious approach to its monetary policy decisions and investor optimism about U.S.-China trade negotiations supported markets. In this environment, stocks in global developed and emerging markets excluding the U.S. had negative returns, as measured by the MSCI All Country World Index ex USA Index.
We are committed to our long-term perspective and disciplined investment approach as we conduct a rigorous, fundamental analysis of securities with a regular emphasis on investment risk management.
Historically, patient investors have achieved rewarding results by evaluating their goals, diversifying their assets globally and maintaining a disciplined investment program, all hallmarks of the Templeton investment philosophy developed more than 60 years ago. We continue to recommend investors consult their financial advisors and review their portfolios to design a long-term strategy and portfolio allocation that meet their individual needs, goals and risk tolerance.
Templeton Foreign Fund’s semiannual report includes more detail about prevailing conditions and a discussion about investment decisions during the period. Please remember all securities markets fluctuate, as do mutual fund share prices.
We thank you for investing with Franklin Templeton, welcome your questions and comments, and look forward to serving your investment needs in the years ahead.
Sincerely,

Norman J. Boersma, CFA
President and Chief Executive Officer –
Investment Management
Templeton Funds
This letter reflects our analysis and opinions as of February 28, 2019, unless otherwise indicated. The information is not a complete analysis of every aspect of any market, country, industry, security or fund. Statements of fact are from sources considered reliable.
CFA® is a trademark owned by CFA Institute.
|
Not FDIC Insured | May Lose Value | No Bank Guarantee |
| | | | |
| | | |
| franklintempleton.com | | Not part of the semiannual report | | 1 |
Visitfranklintempleton.comfor fund updates, to access your account, or to find helpful financial planning tools.
| | | | |
| | | |
2 | | Semiannual Report | | franklintempleton.com |
Semiannual Report
Templeton Foreign Fund
This semiannual report for Templeton Foreign Fund covers the period ended February 28, 2019.
Your Fund’s Goal and Main Investments
The Fund seeks long-term capital growth. Under normal market conditions, the Fund invests at least 80% of its net assets in “foreign securities,” as described in the prospectus. These securities are predominantly equity securities of companies located outside the U.S., including developing markets.
Performance Overview
The Fund’s Class A shares had a-3.05% cumulative total return for the six months under review. In comparison, the Fund’s benchmark, the MSCI All Country World Index (ACWI) ex USA Index, which measures stock performance in global developed and emerging markets excluding the U.S., had a-2.34% total return.1 For the10-year period ended February 28, 2019, the Fund’s Class A shares posted a +157.42% cumulative total return, compared with the MSCI ACWI ex USA Index’s +162.35% cumulative total return for the same period.1 Please note index performance information is provided for reference and we do not attempt to track the index but rather undertake investments on the basis of fundamental research. You can find more performance data in the Performance Summary beginning on page 7.
Performance data represent past performance, which does not guarantee future results. Investment return and principal value will fluctuate, and you may have a gain or loss when you sell your shares. Current performance may differ from figures shown. For most recentmonth-end performance, go tofranklintempleton.comor call(800)342-5236.
Economic and Market Overview
The global economy expanded during the six months under review, despite weakness in certain regions. Global developed and emerging market stocks were aided at certain points during the period by upbeat economic data in some regions,
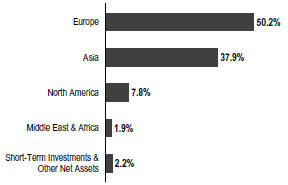
Geographic Composition
Based on Total Net Assets as of 2/28/19
encouraging corporate earnings reports, the U.S. Federal Reserve’s (Fed’s) indications of a cautious approach to its monetary policy decisions and optimism about a potential U.S.-China trade deal.
However, various factors weighed on global markets at certain points during the period, including concerns about tighter regulation of technology companies, political uncertainties in the U.S. and the European Union, the Fed’s interest-rate path and the European Central Bank’s (ECB’s) unwinding of its bond purchase program. Markets were further pressured by U.S. trade disputes with China and other trading partners, and their impact on global growth and corporate earnings. In this environment, global stocks, as measured by the MSCI ACWI, had a-2.70% total return for the six months ended February 28, 2019.1
The U.S. economy grew in 2018’s fourth quarter, though at a slower pace from the previous quarter partly due to a decline in housing investment. The unemployment rate was 3.8% in August 2018, and though it varied during the period, it remained unchanged atperiod-end.2 The annual inflation rate, as measured by the Consumer Price Index, decreased from 2.7% in August 2018 to 1.5% atperiod-end.2 The Fed raised its target range for the federal funds rate twice during the period,
1. Source: Morningstar. As of 2/28/19, the Fund’s Class A10-year average annual total return not including the maximum sales charge was +9.92%, compared with the MSCI ACWI ex USA Index’s10-year average annual total return of +10.13%.
The index is unmanaged and includes reinvestment of any income or distributions. It does not reflect any fees, expenses or sales charges. One cannot invest directly in an index, and an index is not representative of the Fund’s portfolio.
2. Source: U.S. Bureau of Labor Statistics.
The dollar value, number of shares or principal amount, and names of all portfolio holdings are listed in the Fund’s Statement of Investments (SOI).
The SOI begins on page 15.
| | | | |
| | | |
| franklintempleton.com | | Semiannual Report | | 3 |
TEMPLETON FOREIGN FUND
to 2.25%–2.50%, and continued reducing its balance sheet as part of its plan to normalize monetary policy. At its January meeting, the Fed held its target range for the federal funds rate unchanged and mentioned it would be patient in deciding further rate adjustments. Furthermore, the Fed’s January meeting minutes indicated that most policymakers favored announcing the end of balance sheet normalization by the end of 2019.
In Europe, the U.K.’s quarterly gross domestic product (GDP) growth accelerated in 2018’s third quarter but moderated in the fourth quarter. The Bank of England kept its key policy rate unchanged during the period. After moderating in 2018’s third quarter, the eurozone’s quarterly GDP grew in the fourth quarter. The bloc’s annual inflation rate ended the period lower than in August 2018. The ECB kept its benchmark interest rate unchanged during the period and concluded its bond purchase program at the end of 2018. In January 2019, the ECB reiterated that it expected key interest rates to remain unchanged through at least the summer of 2019 and intended to reinvest principal payments from maturing bonds for an extended period of time.
In Asia, Japan’s quarterly GDP contracted in 2018’s third quarter but grew in the fourth quarter. The Bank of Japan left its benchmark interest rate unchanged during the period and continued its monetary stimulus measures.
In emerging markets, Brazil’s quarterly GDP growth accelerated in 2018’s third quarter but moderated in the fourth quarter. The Central Bank of Brazil kept its benchmark interest rate unchanged during the period. Russia’s annual GDP growth stabilized in 2018��s third quarter and accelerated in the fourth quarter. The Bank of Russia increased its key rate twice during the period to curtail inflation risks. China’s annual GDP growth moderated in 2018’s third and fourth quarters. The People’s Bank of China left its benchmark interest rate unchanged during the period, but it took measures to improve financial liquidity to mitigate the negative effects of the U.S.-China trade dispute and support economic growth. Overall, emerging market stocks, as measured by the MSCI Emerging Markets Index, posted a +0.46% total return during thesix-month period.1
Investment Strategy
Our investment strategy employs abottom-up, value-oriented, long-term approach. We focus on the market price of a
Top 10 Sectors/Industries
2/28/19
| | |
| | | % of Total
Net Assets |
Banks | | 17.3% |
Pharmaceuticals | | 12.4% |
Oil, Gas & Consumable Fuels | | 11.3% |
Metals & Mining | | 4.8% |
Diversified Telecommunication Services | | 4.2% |
Technology Hardware, Storage & Peripherals | | 3.8% |
Semiconductors & Semiconductor Equipment | | 3.0% |
Insurance | | 2.9% |
Chemicals | | 2.7% |
Wireless Telecommunication Services | | 2.3% |
company’s securities relative to our evaluation of the company’s long-term earnings, asset value and cash flow potential. Our analysis includes an assessment of the potential impacts of material environmental, social and governance (ESG) factors on the long-term risk and return profile of a company. We also consider the company’s price/earnings ratio, price/cash flow ratio, profit margins and liquidation value.
Manager’s Discussion
During the six months under review, stock-specific issues in the underweighted financials sector detracted significantly from the Fund’s performance relative to its benchmark, the MSCI ACWI ex USA Index.3 Irish lender Bank of Ireland Group was one of the sector’s biggest detractors as its stock declined amid Brexit concerns and mixed earnings results. We continue to believe the market is not currently pricing in Bank of Ireland’s ability to generate returns above its cost of capital in an attractive banking market. Conversely, the financials sector also delivered one of the Fund’s top contributors: Chinese life insurer China Life Insurance. Its shares rallied as China’s increased stimulus measures buoyed regional markets and the firm announced well-received changes to its management team and corporate strategy.
Stock selection in the overweighted health care sector also detracted, pressured by Israeli pharmaceuticals firm Teva Pharmaceutical Industries, the Fund’s biggest detractor.4 Teva’s share price declined amid weakness in the U.S. generic drug market and slumping sales of one of the firm’s aging blockbuster drugs. Yet, we believe such headwinds are well discounted by a share price hovering neartwo-decade lows, and
3. The financials sector comprises banks, capital markets and insurance in the SOI.
4. The health care sector comprises health care providers and services, life sciences tools and services, and pharmaceuticals in the SOI.
| | | | |
| | | |
4 | | Semiannual Report | | franklintempleton.com |
TEMPLETON FOREIGN FUND
we are encouraged by the company’s ongoing efforts to reduce debt, cut costs and stabilize declining sales.
Elsewhere, Chinese internet search firm Baidu also finished among the Fund’s biggest detractors. Broad-based concerns about economic uncertainty in China hurt the stock, offsetting the firm’s better-than-expected sales growth and rapid increase in users.
Top 10 Holdings
2/28/19
| | | | |
| |
Company Sector/Industry, Country | | % of Total
Net Assets | |
Samsung Electronics Co. Ltd. | | | 3.9% | |
Technology Hardware, Storage & Peripherals, South Korea | | | | |
BP PLC | | | 3.2% | |
Oil, Gas & Consumable Fuels, U.K. | | | | |
Roche Holding AG | | | 2.8% | |
Pharmaceuticals, Switzerland | | | | |
BNP Paribas SA | | | 2.7% | |
Banks, France | | | | |
Standard Chartered PLC | | | 2.7% | |
Banks, U.K. | | | | |
Royal Dutch Shell PLC | | | 2.7% | |
Oil, Gas & Consumable Fuels, U.K. | | | | |
Sanofi | | | 2.2% | |
Pharmaceuticals, France | | | | |
Eni SpA | | | 2.2% | |
Oil, Gas & Consumable Fuels, Italy | | | | |
Wheaton Precious Metals Corp. | | | 2.1% | |
Metals & Mining, Canada | | | | |
ING Groep NV | | | 2.1% | |
Banks, Netherlands | | | | |
Turning to contributors, stock selection in the modestly overweighted materials sector notably contributed to relative performance.5 The sector delivered the Fund’s top contributor: Canadian precious metals firm Wheaton Precious Metals. Wheaton benefited from a favorable settlement related to a Canadian tax audit that had weighed on its shares for years. We have long believed Wheaton was likely to prevail in this matter and believe the removal of uncertainty could pave the way for wider appreciation of Wheaton’s unique, asset-light precious metals streaming model.
Stock selection and a favorable overweighting in the energy sector also contributed to relative results.6 Dutch oil services
Top 10 Countries
2/28/19
| | | | |
| | | % of Total
Net Assets | |
U.K. | | | 16.6% | |
Japan | | | 11.4% | |
France | | | 10.2% | |
China | | | 10.1% | |
South Korea | | | 8.2% | |
Netherlands | | | 6.0% | |
Germany | | | 5.9% | |
Canada | | | 5.8% | |
Switzerland | | | 4.6% | |
Italy | | | 2.7% | |
firm SBM Offshore (not part of the index) was the sector’s top contributor. Shares of the manufacturer of floating oil platforms rallied after the company announced a strong order book, raised its dividend and initiated a share buyback program. Conversely, the energy sector also included one of the Fund’s biggest detractors: Canadian exploration and production firm Husky Energy. Its shares declined during the period as operational, strategic and regulatory concerns compounded the weak oil price backdrop. We view Husky’s price decline as excessive (due to thin liquidity and high oil price sensitivity) and expect most of the company’s issues to be favorably resolved. We believe Husky’s shares represent compelling long-term value based on what we consider a lowprice-to-cash flow ratio, which represents a significant discount to their long-term average valuation.
Elsewhere, shares of Chinese telecommunication services firm China Telecom advanced after the company confirmed its entry into the Philippine market as the country’s third major service provider. We continue to think broader industry concerns are overshadowing the solid operating performance and attractive valuation of China Telecom, and we remain holders in anticipation of further potential share price appreciation.
From a regional standpoint, the Middle East and Africa region notably detracted from relative results due to our single holding in the area: the aforementioned Israeli pharmaceuticals firm Teva. In Europe, weakness in the U.K. and Ireland partially offset strength in the Netherlands and Denmark. Asia and North America notably contributed, buoyed by stock selection in Japan and Canada, respectively.
5. The materials sector comprises chemicals, construction materials, and metals and mining in the SOI.
6. The energy sector comprises energy equipment and services and oil, gas and consumable fuels in the SOI.
See www.franklintempletondatasources.com for additional data provider information.
| | | | |
| | | |
| franklintempleton.com | | Semiannual Report | | 5 |
TEMPLETON FOREIGN FUND
It is important to recognize the effect of currency movements on the Fund’s performance. In general, if the value of the U.S. dollar goes up compared with a foreign currency, an investment traded in that foreign currency will go down in value because it will be worth fewer U.S. dollars. This can have a negative effect on Fund performance. Conversely, when the U.S. dollar weakens in relation to a foreign currency, an investment traded in that foreign currency will increase in value, which can contribute to Fund performance. For the six months ended February 28, 2019, the U.S. dollar rose in value relative to many currencies in which the Fund’s investments were traded. As a result, the Fund’s performance was negatively affected by the portfolio’s investment predominantly in securities withnon-U.S. currency exposure.
Thank you for your continued participation in Templeton Foreign Fund. We look forward to serving your future investment needs.
| | |
 | | 
Tucker Scott, CFA Co-Lead Portfolio Manager |
| |
 | | 
Christopher James Peel, CFA Co-Lead Portfolio Manager Norman J. Boersma, CFA Heather Arnold, CFA Herbert J. Arnett, Jr. Peter Moeschter, CFA Portfolio Management Team |
The foregoing information reflects our analysis, opinions and portfolio holdings as of February 28, 2019, the end of the reporting period. The way we implement our main investment strategies and the resulting portfolio holdings may change depending on factors such as market and economic conditions. These opinions may not be relied upon as investment advice or an offer for a particular security. The information is not a complete analysis of every aspect of any market, country, industry, security or the Fund. Statements of fact are from sources considered reliable, but the investment manager makes no representation or warranty as to their completeness or accuracy. Although historical performance is no guarantee of future results, these insights may help you understand our investment management philosophy.
| | | | |
| | | |
6 | | Semiannual Report | | franklintempleton.com |
TEMPLETON FOREIGN FUND
Performance Summary as of February 28, 2019
The performance table does not reflect any taxes that a shareholder would pay on Fund dividends, capital gain distributions, if any, or any realized gains on the sale of Fund shares. Total return reflects reinvestment of the Fund’s dividends and capital gain distributions, if any, and any unrealized gains or losses. Your dividend income will vary depending on dividends or interest paid by securities in the Fund’s portfolio, adjusted for operating expenses of each class. Capital gain distributions are net profits realized from the sale of portfolio securities.
Performance as of 2/28/191
Cumulative total return excludes sales charges. Average annual total return includes maximum sales charges. Sales charges will vary depending on the size of the investment and the class of share purchased. The maximum is 5.50% and the minimum is 0%.Class A:5.50% maximum initial sales charge;Advisor Class:no sales charges. For other share classes, visitfranklintempleton.com.
| | | | | | | | |
| Share Class | | Cumulative
Total Return2 | | | Average Annual
Total Return3 | |
| | |
A4 | | | | | | | | |
| | |
6-Month | | | -3.05% | | | | -8.41% | |
| | |
1-Year | | | -6.11% | | | | -11.25% | |
| | |
5-Year | | | -0.89% | | | | -1.31% | |
| | |
10-Year | | | +157.42% | | | | +9.31% | |
| | |
Advisor | | | | | | | | |
| | |
6-Month | | | -2.97% | | | | -2.97% | |
| | |
1-Year | | | -5.94% | | | | -5.94% | |
| | |
5-Year | | | +0.44% | | | | +0.09% | |
| | |
10-Year | | | +163.92% | | | | +10.19% | |
Performance data represent past performance, which does not guarantee future results. Investment return and principal value will fluctuate, and you may have a gain or loss when you sell your shares. Current performance may differ from figures shown. For most recentmonth-end performance, go tofranklintempleton.comor call(800)342-5236.
See page 8 for Performance Summary footnotes.
| | | | |
| | | |
| franklintempleton.com | | Semiannual Report | | 7 |
TEMPLETON FOREIGN FUND
PERFORMANCE SUMMARY
Distributions(9/1/18–2/28/19)
| | | | |
| Share Class | | Net Investment
Income | |
| |
A | | | $0.1774 | |
| |
C | | | $0.0213 | |
| |
R | | | $0.1597 | |
| |
R6 | | | $0.2093 | |
| |
Advisor | | | $0.1956 | |
Total Annual Operating Expenses5
| | | | | | | | |
| Share Class | | With Fee Waiver | | | Without Fee Waiver | |
A | | | 1.10% | | | | 1.15% | |
| Advisor | | | 0.85% | | | | 0.90% | |
Each class of shares is available to certain eligible investors and has different annual fees and expenses, as described in the prospectus.
All investments involve risks, including possible loss of principal. Special risks are associated with foreign investing, including currency fluctuations, economic instability and political developments; investments in developing markets involve heightened risks related to the same factors. Currency rates may fluctuate significantly over short periods of time, and can reduce returns. Because the Fund may invest its assets in companies in a specific region, including Europe, it is subject to greater risks of adverse developments in that region and/or the surrounding regions than a fund that is more broadly diversified geographically. Current political and financial uncertainty surrounding the European Union may increase market volatility and the economic risk of investing in companies in Europe. Derivatives, including currency management strategies, involve costs and can create economic leverage in the portfolio which may result in significant volatility and cause the Fund to participate in losses (as well as enable gains) on an amount that exceeds the Fund’s initial investment. The Fund may not achieve the anticipated benefits, and may realize losses when a counterparty fails to perform as promised. The Fund is actively managed but there is no guarantee that the manager’s investment decisions will produce the desired results. The Fund’s prospectus also includes a description of the main investment risks.
1. The Fund has an expense reduction and a fee waiver associated with any investments it makes in a Franklin Templeton money fund and/or other Franklin Templeton fund, contractually guaranteed through 12/31/19. Fund investment results reflect the expense reduction and fee waiver; without these reductions, the results would have been lower.
2. Cumulative total return represents the change in value of an investment over the periods indicated.
3. Average annual total return represents the average annual change in value of an investment over the periods indicated. Return for less than one year, if any, has not been annualized.
4. Prior to 9/10/18, these shares were offered at a higher initial sales charge of 5.75%, thus actual returns would have differed. Total returns with sales charges have been restated to reflect the current maximum initial sales charge of 5.50%.
5. Figures are as stated in the Fund’s current prospectus and may differ from the expense ratios disclosed in the Your Fund’s Expenses and Financial Highlights sections in this report. In periods of market volatility, assets may decline significantly, causing total annual Fund operating expenses to become higher than the figures shown.
| | | | |
| | | |
8 | | Semiannual Report | | franklintempleton.com |
TEMPLETON FOREIGN FUND
Your Fund’s Expenses
As a Fund shareholder, you can incur two types of costs: (1) transaction costs, including sales charges (loads) on Fund purchases and redemptions; and (2) ongoing Fund costs, including management fees, distribution and service(12b-1) fees, and other Fund expenses. All mutual funds have ongoing costs, sometimes referred to as operating expenses. The table below shows ongoing costs of investing in the Fund and can help you understand these costs and compare them with those of other mutual funds. The table assumes a $1,000 investment held for the six months indicated.
Actual Fund Expenses
The table below provides information about actual account values and actual expenses in the columns under the heading “Actual.” In these columns the Fund’s actual return, which includes the effect of Fund expenses, is used to calculate the “Ending Account Value” for each class of shares. You can estimate the expenses you paid during the period by following these steps (ofcourse, your account value and expenses will differ from those in this illustration):Divide your account value by $1,000 (ifyour account had an $8,600 value, then $8,600÷ $1,000 = 8.6). Then multiply the result by the number in the row for your class of shares under the headings “Actual” and “Expenses Paid During Period” (ifActual Expenses Paid During Period were $7.50, then 8.6 x $7.50 = $64.50). In this illustration, the actual expenses paid this period are $64.50.
Hypothetical Example for Comparison with Other Funds
Under the heading “Hypothetical” in the table, information is provided about hypothetical account values and hypothetical expenses based on the Fund’s actual expense ratio and an assumed rate of return of 5% per year before expenses, which is not the Fund’s actual return. This information may not be used to estimate the actual ending account balance or expenses you paid for the period, but it can help you compare ongoing costs of investing in the Fund with those of other funds. To do so, compare this 5% hypothetical example for the class of shares you hold with the 5% hypothetical examples that appear in the shareholder reports of other funds.
Please note that expenses shown in the table are meant to highlight ongoing costs and do not reflect any transactional costs. Therefore, information under the heading “Hypothetical” is useful in comparing ongoing costs only, and will not help you compare total costs of owning different funds. In addition, if transactional costs were included, your total costs would have been higher.
| | | | | | | | | | | | |
| | | | | Actual (actual return after expenses) | | Hypothetical (5% annual return before expenses) | | |
| | | | | | | | |
Share
Class | | Beginning
Account
Value 9/1/18 | | Ending
Account
Value 2/28/19 | | Expenses
Paid During
Period
9/1/18–2/28/191,2
| | Ending
Account
Value 2/28/19 | | Expenses Paid During Period 9/1/18–2/28/191,2 | | Net
Annualized
Expense
Ratio2 |
| | | | | | |
A | | $1,000 | | $969.50 | | $5.18 | | $1,019.54 | | $5.31 | | 1.06% |
C | | $1,000 | | $965.70 | | $8.82 | | $1,015.82 | | $9.05 | | 1.81% |
R | | $1,000 | | $967.50 | | $6.39 | | $1,018.30 | | $6.56 | | 1.31% |
R6 | | $1,000 | | $971.00 | | $3.27 | | $1,021.47 | | $3.36 | | 0.67% |
Advisor | | $1,000 | | $970.30 | | $3.96 | | $1,020.78 | | $4.06 | | 0.81% |
1. Expenses are equal to the annualized expense ratio for thesix-month period as indicated above—in the far right column—multiplied by the simple average account value over the period indicated, and then multiplied by 181/365 to reflect theone-half year period.
2. Reflects expenses after fee waivers and expense reimbursements. Does not include acquired fund fees and expenses.
| | | | |
| | | |
| franklintempleton.com | | Semiannual Report | | 9 |
TEMPLETON FUNDS
Financial Highlights
Templeton Foreign Fund
| | | | | | | | | | | | | | | | | | | | | | |
| | | Six Months Ended
February 28, 2019 | | | Year Ended August 31, |
| | | (unaudited) | | | 2018 | | | 2017 | | | 2016 | | | 2015 | | | 2014 |
| | | | | | |
Class A | | | | | | | | | | | | | | | | | | | | | | |
Per share operating performance | | | | | | | | | | | | | | | | | | | | | | |
(for a share outstanding throughout the period) | | | | | | | | | | | | | | | | | | | | | | |
Net asset value, beginning of period | | | $ 7.69 | | | | $ 7.81 | | | | $ 6.87 | | | | $ 6.74 | | | | $ 8.58 | | | $ 7.67 |
| | | | | | |
Income from investment operationsa: | | | | | | | | | | | | | | | | | | | | | | |
Net investment incomeb | | | 0.07 | | | | 0.12 | | | | 0.11 | | | | 0.11 | | | | 0.12 | | | 0.20c |
Net realized and unrealized gains (losses) | | | (0.32 | ) | | | (0.13 | ) | | | 0.96 | | | | 0.11 | | | | (1.52 | ) | | 1.12 |
| | | | | | |
Total from investment operations | | | (0.25 | ) | | | (0.01 | ) | | | 1.07 | | | | 0.22 | | | | (1.40 | ) | | 1.32 |
| | | | | | |
Less distributions from: | | | | | | | | | | | | | | | | | | | | | | |
Net investment income | | | (0.18 | ) | | | (0.11 | ) | | | (0.13 | ) | | | (0.09 | ) | | | (0.21 | ) | | (0.11) |
Net realized gains | | | — | | | | — | | | | — | | | | (— | )d | | | (0.23 | ) | | (0.30) |
| | | | | | |
Total distributions | | | (0.18 | ) | | | (0.11 | ) | | | (0.13 | ) | | | (0.09 | ) | | | (0.44 | ) | | (0.41) |
| | | | | | |
Net asset value, end of period | | | $ 7.26 | | | | $ 7.69 | | | | $ 7.81 | | | | $ 6.87 | | | | $ 6.74 | | | $ 8.58 |
| | | | | | |
Total returne | | | (3.05)% | | | | (0.15)% | | | | 15.83% | | | | 3.46% | | | | (16.46)% | | | 17.61% |
| | | | | | |
Ratios to average net assetsf | | | | | | | | | | | | | | | | | | | | | | |
Expenses before waiver and payments by affiliates | | | 1.14% | | | | 1.16% | | | | 1.21% | | | | 1.22% | | | | 1.18% | | | 1.16% |
Expenses net of waiver and payments by affiliates | | | 1.06% | | | | 1.11% | g | | | 1.21% | g,h | | | 1.22% | g,h | | | 1.18% | h | | 1.16% |
Net investment income | | | 2.06% | | | | 1.54% | | | | 1.55% | | | | 1.66% | | | | 1.54% | | | 2.39%c |
| | | | | | |
Supplemental data | | | | | | | | | | | | | | | | | | | | | | |
Net assets, end of period (000’s) | | | $2,802,526 | | | | $2,929,181 | | | | $3,287,394 | | | | $3,644,336 | | | | $4,165,454 | | | $4,524,854 |
Portfolio turnover rate | | | 13.83% | | | | 23.01% | | | | 42.56% | | | | 22.89% | | | | 29.12% | | | 30.82% |
aThe amount shown for a share outstanding throughout the period may not correlate with the Statement of Operations for the period due to the timing of sales and repurchases of the Fund’s shares in relation to income earned and/or fluctuating fair value of the investments of the Fund.
bBased on average daily shares outstanding.
cNet investment income per share includes approximately $0.07 per share related to income received in the form of special dividends in connection with certain Fund holdings. Excluding this amount, the ratio of net investment income to average net assets would have been 1.57%.
dAmount rounds to less than $0.01 per share.
eTotal return does not reflect sales commissions or contingent deferred sales charges, if applicable, and is not annualized for periods less than one year.
fRatios are annualized for periods less than one year.
gBenefit of expense reduction rounds to less than 0.01%.
hBenefit of waiver and payments by affiliates rounds to less than 0.01%.
| | | | |
| | | |
10 | | Semiannual Report | The accompanying notes are an integral part of these financial statements. | | franklintempleton.com |
TEMPLETON FUNDS
FINANCIAL HIGHLIGHTS
Templeton Foreign Fund(continued)
| | | | | | | | | | | | | | | | | | | | | | |
| | | Six Months Ended
February 28, 2019 | | | Year Ended August 31, |
| | | (unaudited) | | | 2018 | | | 2017 | | | 2016 | | | 2015 | | | 2014 |
| | | | | | |
Class C | | | | | | | | | | | | | | | | | | | | | | |
Per share operating performance | | | | | | | | | | | | | | | | | | | | | | |
(for a share outstanding throughout the period) | | | | | | | | | | | | | | | | | | | | | | |
Net asset value, beginning of period | | | $ 7.49 | | | | $ 7.60 | | | | $ 6.69 | | | | $ 6.56 | | | | $ 8.35 | | | $ 7.48 |
| | | | | | |
Income from investment operationsa: | | | | | | | | | | | | | | | | | | | | | | |
Net investment incomeb | | | 0.04 | | | | 0.06 | | | | 0.05 | | | | 0.06 | | | | 0.05 | | | 0.13c |
Net realized and unrealized gains (losses) | | | (0.30 | ) | | | (0.12 | ) | | | 0.94 | | | | 0.11 | | | | (1.46 | ) | | 1.10 |
| | | | | | |
Total from investment operations | | | (0.26 | ) | | | (0.06 | ) | | | 0.99 | | | | 0.17 | | | | (1.41 | ) | | 1.23 |
| | | | | | |
Less distributions from: | | | | | | | | | | | | | | | | | | | | | | |
Net investment income | | | (0.02 | ) | | | (0.05 | ) | | | (0.08 | ) | | | (0.04 | ) | | | (0.15 | ) | | (0.06) |
Net realized gains | | | — | | | | — | | | | — | | | | (— | )d | | | (0.23 | ) | | (0.30) |
| | | | | | |
Total distributions | | | (0.02 | ) | | | (0.05 | ) | | | (0.08 | ) | | | (0.04 | ) | | | (0.38 | ) | | (0.36) |
| | | | | | |
Net asset value, end of period | | | $ 7.21 | | | | $ 7.49 | | | | $ 7.60 | | | | $ 6.69 | | | | $ 6.56 | | | $ 8.35 |
| | | | | | |
Total returne | | | (3.43)% | | | | (0.79)% | | | | 14.92% | | | | 2.64% | | | | (17.04)% | | | 16.72% |
| | | | | | |
Ratios to average net assetsf | | | | | | | | | | | | | | | | | | | | | | |
Expenses before waiver and payments by affiliates | | | 1.89% | | | | 1.91% | | | | 1.96% | | | | 1.97% | | | | 1.93% | | | 1.91% |
Expenses net of waiver and payments by affiliates | | | 1.81% | | | | 1.86% | g | | | 1.96% | g,h | | | 1.97% | g,h | | | 1.93% | h | | 1.91% |
Net investment income | | | 1.31% | | | | 0.79% | | | | 0.80% | | | | 0.91% | | | | 0.79% | | | 1.64%c |
| | | | | | |
Supplemental data | | | | | | | | | | | | | | | | | | | | | | |
Net assets, end of period (000’s) | | | $118,768 | | | | $281,640 | | | | $346,032 | | | | $397,512 | | | | $468,128 | | | $617,421 |
Portfolio turnover rate | | | 13.83% | | | | 23.01% | | | | 42.56% | | | | 22.89% | | | | 29.12% | | | 30.82% |
aThe amount shown for a share outstanding throughout the period may not correlate with the Statement of Operations for the period due to the timing of sales and repurchases of the Fund’s shares in relation to income earned and/or fluctuating fair value of the investments of the Fund.
bBased on average daily shares outstanding.
cNet investment income per share includes approximately $0.07 per share related to income received in the form of special dividends in connection with certain Fund holdings. Excluding this amount, the ratio of net investment income to average net assets would have been (0.82)%.
dAmount rounds to less than $0.01 per share.
eTotal return does not reflect sales commissions or contingent deferred sales charges, if applicable, and is not annualized for periods less than one year.
fRatios are annualized for periods less than one year.
gBenefit of expense reduction rounds to less than 0.01%.
hBenefit of waiver and payments by affiliates rounds to less than 0.01%.
| | | | |
| | | |
| franklintempleton.com | | The accompanying notes are an integral part of these financial statements. | Semiannual Report | | 11 |
TEMPLETON FUNDS
FINANCIAL HIGHLIGHTS
Templeton Foreign Fund(continued)
| | | | | | | | | | | | | | | | | | | | | | |
| | | Six Months Ended
February 28, 2019 | | | Year Ended August 31, |
| | | (unaudited) | | | 2018 | | | 2017 | | | 2016 | | | 2015 | | | 2014 |
| | | | | | |
Class R | | | | | | | | | | | | | | | | | | | | | | |
Per share operating performance | | | | | | | | | | | | | | | | | | | | | | |
(for a share outstanding throughout the period) | | | | | | | | | | | | | | | | | | | | | | |
Net asset value, beginning of period | | | $ 7.53 | | | | $ 7.65 | | | | $ 6.73 | | | | $ 6.61 | | | | $ 8.42 | | | $ 7.54 |
| | | | | | |
Income from investment operationsa: | | | | | | | | | | | | | | | | | | | | | | |
Net investment incomeb | | | 0.06 | | | | 0.10 | | | | 0.09 | | | | 0.09 | | | | 0.09 | | | 0.18c |
Net realized and unrealized gains (losses) | | | (0.32 | ) | | | (0.12 | ) | | | 0.94 | | | | 0.10 | | | | (1.48 | ) | | 1.09 |
| | | | | | |
Total from investment operations | | | (0.26 | ) | | | (0.02 | ) | | | 1.03 | | | | 0.19 | | | | (1.39 | ) | | 1.27 |
| | | | | | |
Less distributions from: | | | | | | | | | | | | | | | | | | | | | | |
Net investment income | | | (0.16 | ) | | | (0.10 | ) | | | (0.11 | ) | | | (0.07 | ) | | | (0.19 | ) | | (0.09) |
Net realized gains | | | — | | | | — | | | | — | | | | (— | )d | | | (0.23 | ) | | (0.30) |
| | | | | | |
Total distributions | | | (0.16 | ) | | | (0.10 | ) | | | (0.11 | ) | | | (0.07 | ) | | | (0.42 | ) | | (0.39) |
| | | | | | |
Net asset value, end of period | | | $ 7.11 | | | | $ 7.53 | | | | $ 7.65 | | | | $ 6.73 | | | | $ 6.61 | | | $ 8.42 |
| | | | | | |
Total returne | | | (3.25)% | | | | (0.32)% | | | | 15.57% | | | | 3.10% | | | | (16.63)% | | | 17.22% |
| | | | | | |
Ratios to average net assetsf | | | | | | | | | | | | | | | | | | | | | | |
Expenses before waiver and payments by affiliates | | | 1.39% | | | | 1.41% | | | | 1.46% | | | | 1.47% | | | | 1.43% | | | 1.41% |
Expenses net of waiver and payments by affiliates | | | 1.31% | | | | 1.36% | g | | | 1.46% | g,h | | | 1.47% | g,h | | | 1.43% | h | | 1.41% |
Net investment income | | | 1.81% | | | | 1.29% | | | | 1.30% | | | | 1.41% | | | | 1.29% | | | 2.14%c |
| | | | | | |
Supplemental data | | | | | | | | | | | | | | | | | | | | | | |
Net assets, end of period (000’s) | | | $138,287 | | | | $148,638 | | | | $153,516 | | | | $159,802 | | | | $174,865 | | | $207,738 |
Portfolio turnover rate | | | 13.83% | | | | 23.01% | | | | 42.56% | | | | 22.89% | | | | 29.12% | | | 30.82% |
aThe amount shown for a share outstanding throughout the period may not correlate with the Statement of Operations for the period due to the timing of sales and repurchases of the Fund’s shares in relation to income earned and/or fluctuating fair value of the investments of the Fund.
bBased on average daily shares outstanding.
cNet investment income per share includes approximately $0.07 per share related to income received in the form of special dividends in connection with certain Fund holdings. Excluding this amount, the ratio of net investment income to average net assets would have been 1.32%.
dAmount rounds to less than $0.01 per share.
eTotal return is not annualized for periods less than one year.
fRatios are annualized for periods less than one year.
gBenefit of expense reduction rounds to less than 0.01%.
hBenefit of waiver and payments by affiliates rounds to less than 0.01%.
| | | | |
| | | |
12 | | Semiannual Report | The accompanying notes are an integral part of these financial statements. | | franklintempleton.com |
TEMPLETON FUNDS
FINANCIAL HIGHLIGHTS
Templeton Foreign Fund(continued)
| | | | | | | | | | | | | | | | | | | | | | |
| | | Six Months Ended
February 28, 2019 | | | Year Ended August 31, |
| | | (unaudited) | | | 2018 | | | 2017 | | | 2016 | | | 2015 | | | 2014 |
| | | | | | |
Class R6 | | | | | | | | | | | | | | | | | | | | | | |
Per share operating performance | | | | | | | | | | | | | | | | | | | | | | |
(for a share outstanding throughout the period) | | | | | | | | | | | | | | | | | | | | | | |
Net asset value, beginning of period | | | $ 7.58 | | | | $ 7.70 | | | | $ 6.78 | | | | $ 6.66 | | | | $ 8.49 | | | $ 7.59 |
| | | | | | |
Income from investment operationsa: | | | | | | | | | | | | | | | | | | | | | | |
Net investment incomeb | | | 0.09 | | | | 0.15 | | | | 0.16 | | | | 0.14 | | | | 0.15 | | | 0.25c |
Net realized and unrealized gains (losses) | | | (0.33 | ) | | | (0.12 | ) | | | 0.93 | | | | 0.11 | | | | (1.50 | ) | | 1.10 |
| | | | | | |
Total from investment operations | | | (0.24 | ) | | | 0.03 | | | | 1.09 | | | | 0.25 | | | | (1.35 | ) | | 1.35 |
| | | | | | |
Less distributions from: | | | | | | | | | | | | | | | | | | | | | | |
Net investment income | | | (0.21 | ) | | | (0.15 | ) | | | (0.17 | ) | | | (0.13 | ) | | | (0.25 | ) | | (0.15) |
Net realized gains | | | — | | | | — | | | | — | | | | (— | )d | | | (0.23 | ) | | (0.30) |
| | | | | | |
Total distributions | | | (0.21 | ) | | | (0.15 | ) | | | (0.17 | ) | | | (0.13 | ) | | | (0.48 | ) | | (0.45) |
| | | | | | |
Net asset value, end of period | | | $ 7.13 | | | | $ 7.58 | | | | $ 7.70 | | | | $ 6.78 | | | | $ 6.66 | | | $ 8.49 |
| | | | | | |
Total returne | | | (2.90)% | | | | 0.24% | | | | 16.52% | | | | 3.92% | | | | (16.08)% | | | 18.16% |
| | | | | | |
Ratios to average net assetsf | | | | | | | | | | | | | | | | | | | | | | |
Expenses before waiver and payments by affiliates | | | 0.76% | | | | 0.73% | | | | 0.74% | | | | 0.72% | | | | 0.72% | | | 0.72% |
Expenses net of waiver and payments by affiliates | | | 0.67% | | | | 0.68% | g | | | 0.73% | g | | | 0.72% | g,h | | | 0.72% | h | | 0.72% |
Net investment income | | | 2.45% | | | | 1.97% | | | | 2.03% | | | | 2.16% | | | | 2.00% | | | 2.83%c |
| | | | | | |
Supplemental data | | | | | | | | | | | | | | | | | | | | | | |
Net assets, end of period (000’s) | | | $1,467,791 | | | | $1,496,328 | | | | $1,757,902 | | | | $880,092 | | | | $816,746 | | | $666,249 |
Portfolio turnover rate | | | 13.83% | | | | 23.01% | | | | 42.56% | | | | 22.89% | | | | 29.12% | | | 30.82% |
aThe amount shown for a share outstanding throughout the period may not correlate with the Statement of Operations for the period due to the timing of sales and repurchases of the Fund’s shares in relation to income earned and/or fluctuating fair value of the investments of the Fund.
bBased on average daily shares outstanding.
cNet investment income per share includes approximately $0.07 per share related to income received in the form of special dividends in connection with certain Fund holdings. Excluding this amount, the ratio of net investment income to average net assets would have been 2.01%.
dAmount rounds to less than $0.01 per share.
eTotal return is not annualized for periods less than one year.
fRatios are annualized for periods less than one year.
gBenefit of expense reduction rounds to less than 0.01%.
hBenefit of waiver and payments by affiliates rounds to less than 0.01%.
| | | | |
| | | |
| franklintempleton.com | | The accompanying notes are an integral part of these financial statements. | Semiannual Report | | 13 |
TEMPLETON FUNDS
FINANCIAL HIGHLIGHTS
Templeton Foreign Fund(continued)
| | | | | | | | | | | | | | | | | | | | | | |
| | | Six Months Ended
February 28, 2019 | | | Year Ended August 31, |
| | | (unaudited) | | | 2018 | | | 2017 | | | 2016 | | | 2015 | | | 2014 |
| | | | | | |
Advisor Class | | | | | | | | | | | | | | | | | | | | | | |
Per share operating performance | | | | | | | | | | | | | | | | | | | | | | |
(for a share outstanding throughout the period) | | | | | | | | | | | | | | | | | | | | | | |
Net asset value, beginning of period | | | $ 7.58 | | | | $ 7.70 | | | | $ 6.78 | | | | $ 6.66 | | | | $ 8.49 | | | $ 7.59 |
| | | | | | |
Income from investment operationsa: | | | | | | | | | | | | | | | | | | | | | | |
Net investment incomeb | | | 0.08 | | | | 0.14 | | | | 0.13 | | | | 0.12 | | | | 0.13 | | | 0.22c |
Net realized and unrealized gains (losses) | | | (0.32 | ) | | | (0.12 | ) | | | 0.94 | | | | 0.11 | | | | (1.50 | ) | | 1.11 |
| | | | | | |
Total from investment operations | | | (0.24 | ) | | | 0.02 | | | | 1.07 | | | | 0.23 | | | | (1.37 | ) | | 1.33 |
| | | | | | |
Less distributions from: | | | | | | | | | | | | | | | | | | | | | | |
Net investment income | | | (0.20 | ) | | | (0.14 | ) | | | (0.15 | ) | | | (0.11 | ) | | | (0.23 | ) | | (0.13) |
Net realized gains | | | — | | | | — | | | | — | | | | (— | )d | | | (0.23 | ) | | (0.30) |
| | | | | | |
Total distributions | | | (0.20 | ) | | | (0.14 | ) | | | (0.15 | ) | | | (0.11 | ) | | | (0.46 | ) | | (0.43) |
| | | | | | |
Net asset value, end of period | | | $ 7.14 | | | | $ 7.58 | | | | $ 7.70 | | | | $ 6.78 | | | | $ 6.66 | | | $ 8.49 |
| | | | | | |
Total returne | | | (2.97)% | | | | 0.16% | | | | 16.10% | | | | 3.65% | | | | (16.25)% | | | 17.93% |
| | | | | | |
Ratios to average net assetsf | | | | | | | | | | | | | | | | | | | | | | |
Expenses before waiver and payments by affiliates | | | 0.89% | | | | 0.91% | | | | 0.96% | | | | 0.97% | | | | 0.93% | | | 0.91% |
Expenses net of waiver and payments by affiliates | | | 0.81% | | | | 0.86% | g | | | 0.96% | g,h | | | 0.97% | g,h | | | 0.93% | h | | 0.91% |
Net investment income | | | 2.31% | | | | 1.79% | | | | 1.80% | | | | 1.91% | | | | 1.79% | | | 2.64%c |
| | | | | | |
Supplemental data | | | | | | | | | | | | | | | | | | | | | | |
Net assets, end of period (000’s) | | | $1,270,356 | | | | $1,627,827 | | | | $1,717,937 | | | | $1,125,431 | | | | $1,206,146 | | | $1,727,057 |
Portfolio turnover rate | | | 13.83% | | | | 23.01% | | | | 42.56% | | | | 22.89% | | | | 29.12% | | | 30.82% |
aThe amount shown for a share outstanding throughout the period may not correlate with the Statement of Operations for the period due to the timing of sales and repurchases of the Fund’s shares in relation to income earned and/or fluctuating fair value of the investments of the Fund.
bBased on average daily shares outstanding.
cNet investment income per share includes approximately $0.07 per share related to income received in the form of special dividends in connection with certain Fund holdings. Excluding this amount, the ratio of net investment income to average net assets would have been 1.82%.
dAmount rounds to less than $0.01 per share.
eTotal return is not annualized for periods less than one year.
fRatios are annualized for periods less than one year.
gBenefit of expense reduction rounds to less than 0.01%.
hBenefit of waiver and payments by affiliates rounds to less than 0.01%.
| | | | |
| | | |
14 | | Semiannual Report | The accompanying notes are an integral part of these financial statements. | | franklintempleton.com |
TEMPLETON FUNDS
Statement of Investments, February 28, 2019 (unaudited)
Templeton Foreign Fund
| | | | | | | | | | |
| | | Industry | | Shares | | | Value | |
Common Stocks 97.8% | | | | | | | | | | |
Canada 5.8% | | | | | | | | | | |
Alamos Gold Inc., A | | Metals & Mining | | | 13,422,620 | | | $ | 64,965,481 | |
Cenovus Energy Inc. | | Oil, Gas & Consumable Fuels | | | 4,747,382 | | | | 43,512,256 | |
Goldcorp Inc. | | Metals & Mining | | | 4,322,900 | | | | 45,666,750 | |
Husky Energy Inc. | | Oil, Gas & Consumable Fuels | | | 4,945,010 | | | | 54,982,137 | |
Wheaton Precious Metals Corp. | | Metals & Mining | | | 5,719,860 | | | | 124,412,824 | |
| | | |
| | | | | | | | | 333,539,448 | |
China 10.1% | | | | | | | | | | |
aBaidu Inc., ADR | | Interactive Media & Services | | | 570,020 | | | | 92,651,051 | |
China Life Insurance Co. Ltd., H | | Insurance | | | 33,667,000 | | | | 92,640,810 | |
China Mobile Ltd. | | Wireless Telecommunication Services | | | 8,343,920 | | | | 87,799,967 | |
China Telecom Corp. Ltd., H | | Diversified Telecommunication Services | | | 210,770,042 | | | | 114,114,804 | |
Kunlun Energy Co. Ltd. | | Oil, Gas & Consumable Fuels | | | 6,373,280 | | | | 6,998,653 | |
NetEase Inc., ADR | | Entertainment | | | 201,290 | | | | 44,931,954 | |
Shanghai Pharmaceuticals Holding Co. Ltd., H | | Health Care Providers & Services | | | 21,234,930 | | | | 47,719,248 | |
Sinopec Engineering Group Co. Ltd. | | Construction & Engineering | | | 52,748,630 | | | | 47,912,065 | |
Sinopharm Group Co. Ltd., H | | Health Care Providers & Services | | | 11,638,200 | | | | 51,743,454 | |
| | | |
| | | | | | | | | 586,512,006 | |
Denmark 2.1% | | | | | | | | | | |
A.P. Moeller-Maersk AS, B | | Marine | | | 48,300 | | | | 65,084,219 | |
Vestas Wind Systems AS | | Electrical Equipment | | | 700,880 | | | | 58,332,771 | |
| | | |
| | | | | | | | | 123,416,990 | |
France 10.2% | | | | | | | | | | |
AXA SA | | Insurance | | | 2,964,662 | | | | 75,182,193 | |
BNP Paribas SA | | Banks | | | 3,107,673 | | | | 159,261,439 | |
Cie Generale des Etablissements Michelin SCA | | Auto Components | | | 415,600 | | | | 49,872,407 | |
Compagnie de Saint-Gobain | | Building Products | | | 1,273,630 | | | | 45,865,541 | |
Sanofi | | Pharmaceuticals | | | 1,532,345 | | | | 128,107,991 | |
Total SA | | Oil, Gas & Consumable Fuels | | | 1,313,070 | | | | 74,662,640 | |
Veolia Environnement SA | | Multi-Utilities | | | 2,749,470 | | | | 60,358,525 | |
| | | |
| | | | | | | | | 593,310,736 | |
Germany 5.9% | | | | | | | | | | |
Bayer AG | | Pharmaceuticals | | | 1,139,775 | | | | 91,113,600 | |
E.ON SE | | Multi-Utilities | | | 6,230,840 | | | | 68,640,202 | |
Gerresheimer AG | | Life Sciences Tools & Services | | | 524,020 | | | | 40,233,143 | |
Merck KGaA | | Pharmaceuticals | | | 625,928 | | | | 64,631,894 | |
Siemens AG | | Industrial Conglomerates | | | 266,292 | | | | 29,117,185 | |
Telefonica Deutschland Holding AG | | Diversified Telecommunication Services | | | 14,562,250 | | | | 47,803,219 | |
| | | |
| | | | | | | | | 341,539,243 | |
Hong Kong 2.3% | | | | | | | | | | |
CK Hutchison Holdings Ltd. | | Industrial Conglomerates | | | 9,733,820 | | | | 103,603,384 | |
Swire Pacific Ltd., A | | Real Estate Management & Development | | | 899,500 | | | | 10,696,942 | |
Value Partners Group Ltd. | | Capital Markets | | | 25,533,870 | | | | 20,753,029 | |
| | | |
| | | | | | | | | 135,053,355 | |
India 0.8% | | | | | | | | | | |
Hero Motocorp Ltd. | | Automobiles | | | 1,053,000 | | | | 39,065,349 | |
Jain Irrigation Systems Ltd. | | Machinery | | | 6,520,634 | | | | 5,232,891 | |
| | | |
| | | | | | | | | 44,298,240 | |
| | | | |
| | | |
| franklintempleton.com | | Semiannual Report | | 15 |
TEMPLETON FUNDS
STATEMENT OF INVESTMENTS (UNAUDITED)
| | | | | | | | | | |
| Templeton Foreign Fund(continued) | |
| | | Industry | | Shares | | | Value | |
| | | |
Common Stocks(continued) | | | | | | | | | | |
Ireland 1.7% | | | | | | | | | | |
Bank of Ireland Group PLC | | Banks | | | 9,577,030 | | | $ | 62,255,741 | |
CRH PLC | | Construction Materials | | | 1,224,170 | | | | 38,765,313 | |
| | | |
| | | | | | | | | 101,021,054 | |
Israel 1.9% | | | | | | | | | | |
aTeva Pharmaceutical Industries Ltd., ADR | | Pharmaceuticals | | | 6,488,260 | | | | 109,197,416 | |
Italy 2.7% | | | | | | | | | | |
Eni SpA | | Oil, Gas & Consumable Fuels | | | 7,257,844 | | | | 125,201,926 | |
Tenaris SA | | Energy Equipment & Services | | | 2,367,530 | | | | 31,588,269 | |
| | | |
| | | | | | | | | 156,790,195 | |
Japan 11.4% | | | | | | | | | | |
Astellas Pharma Inc. | | Pharmaceuticals | | | 3,988,480 | | | | 61,503,009 | |
Ezaki Glico Co. Ltd. | | Food Products | | | 765,190 | | | | 38,724,677 | |
Mitsui Fudosan Co. Ltd. | | Real Estate Management & Development | | | 2,376,620 | | | | 56,245,998 | |
Panasonic Corp. | | Household Durables | | | 8,532,800 | | | | 78,479,250 | |
Seven & i Holdings Co. Ltd. | | Food & Staples Retailing | | | 1,518,540 | | | | 66,685,224 | |
Sumitomo Metal Mining Co. Ltd. | | Metals & Mining | | | 1,522,370 | | | | 44,587,157 | |
Sumitomo Mitsui Financial Group Inc. | | Banks | | | 1,509,810 | | | | 53,404,558 | |
Sumitomo Rubber Industries Ltd. | | Auto Components | | | 3,811,550 | | | | 48,941,882 | |
Suntory Beverage & Food Ltd. | | Beverages | | | 1,224,050 | | | | 53,928,714 | |
Taiheiyo Cement Corp. | | Construction Materials | | | 1,803,511 | | | | 61,576,198 | |
Takeda Pharmaceutical Co. Ltd. | | Pharmaceuticals | | | 2,398,710 | | | | 96,189,465 | |
| | | |
| | | | | | | | | 660,266,132 | |
Luxembourg 0.4% | | | | | | | | | | |
SES SA, IDR | | Media | | | 1,093,647 | | | | 21,974,709 | |
Netherlands 6.0% | | | | | | | | | | |
Flow Traders | | Capital Markets | | | 1,637,407 | | | | 47,492,950 | |
ING Groep NV | | Banks | | | 9,050,058 | | | | 119,739,677 | |
NXP Semiconductors NV | | Semiconductors & Semiconductor Equipment | | | 953,320 | | | | 87,057,183 | |
SBM Offshore NV | | Energy Equipment & Services | | | 4,855,024 | | | | 91,615,740 | |
| | | |
| | | | | | | | | 345,905,550 | |
Singapore 1.4% | | | | | | | | | | |
Singapore Telecommunications Ltd. | | Diversified Telecommunication Services | | | 37,106,420 | | | | 82,882,577 | |
Singapore Telecommunications Ltd., ADR | | Diversified Telecommunication Services | | | 31,720 | | | | 705,612 | |
| | | |
| | | | | | | | | 83,588,189 | |
South Korea 8.2% | | | | | | | | | | |
Hana Financial Group Inc. | | Banks | | | 2,117,210 | | | | 73,058,469 | |
KB Financial Group Inc. | | Banks | | | 1,891,567 | | | | 74,512,814 | |
Korea Electric Power Corp. | | Electric Utilities | | | 1,172,650 | | | | 36,298,343 | |
Lotte Chemical Corp. | | Chemicals | | | 239,460 | | | | 67,848,347 | |
Samsung Electronics Co. Ltd. | | Technology Hardware, Storage & Peripherals | | | 5,573,860 | | | | 223,279,170 | |
| | | |
| | | | | | | | | 474,997,143 | |
Switzerland 4.6% | | | | | | | | | | |
Landis+Gyr Group AG | | Electronic Equipment, Instruments & Components | | | 505,600 | | | | 32,089,125 | |
Roche Holding AG | | Pharmaceuticals | | | 591,540 | | | | 164,338,067 | |
UBS Group AG | | Capital Markets | | | 5,313,970 | | | | 67,612,502 | |
| | | |
| | | | | | | | | 264,039,694 | |
| | | | |
| | | |
16 | | Semiannual Report | | franklintempleton.com |
TEMPLETON FUNDS
STATEMENT OF INVESTMENTS (UNAUDITED)
Templeton Foreign Fund(continued)
| | | | | | | | | | |
| | | Industry | | Shares | | | Value | |
| | | |
Common Stocks(continued) | | | | | | | | | | |
Taiwan 1.5% | | | | | | | | | | |
Taiwan Semiconductor Manufacturing Co. Ltd. | | Semiconductors & Semiconductor Equipment | | | 10,960,090 | | | | $ 84,975,719 | |
Thailand 2.2% | | | | | | | | | | |
Bangkok Bank PCL, fgn | | Banks | | | 4,493,860 | | | | 30,447,555 | |
Bangkok Bank PCL, NVDR | | Banks | | | 8,789,130 | | | | 58,158,245 | |
Kasikornbank PCL, fgn | | Banks | | | 5,897,730 | | | | 36,971,681 | |
| | | |
| | | | | | | | | 125,577,481 | |
United Kingdom 16.6% | | | | | | | | | | |
BAE Systems PLC | | Aerospace & Defense | | | 7,724,400 | | | | 47,737,501 | |
Barclays PLC | | Banks | | | 34,469,980 | | | | 75,044,244 | |
BP PLC | | Oil, Gas & Consumable Fuels | | | 26,126,400 | | | | 185,163,352 | |
aCobham PLC | | Aerospace & Defense | | | 22,045,509 | | | | 34,397,040 | |
HSBC Holdings PLC (GBP Traded) | | Banks | | | 11,227,170 | | | | 91,257,577 | |
HSBC Holdings PLC (HKD Traded) | | Banks | | | 950,940 | | | | 7,771,305 | |
Johnson Matthey PLC | | Chemicals | | | 2,128,006 | | | | 87,289,455 | |
Kingfisher PLC | | Specialty Retail | | | 22,946,174 | | | | 73,673,972 | |
Royal Dutch Shell PLC, B | | Oil, Gas & Consumable Fuels | | | 4,964,660 | | | | 155,681,800 | |
Standard Chartered PLC | | Banks | | | 19,871,115 | | | | 158,540,082 | |
Vodafone Group PLC | | Wireless Telecommunication Services | | | 27,077,955 | | | | 48,221,000 | |
| | | |
| | | | | | | | | 964,777,328 | |
United States 2.0% | | | | | | | | | | |
Oracle Corp. | | Software | | | 2,260,980 | | | | 117,864,887 | |
| | | |
Total Common Stocks
(Cost $5,421,620,989) | | | | | | | | | 5,668,645,515 | |
| | | |
| | | | | Principal
Amount | | | | |
Short Term Investments (Cost $101,000,000) 1.7% | | | | | | | | |
| | | |
Time Deposits 1.7% | | | | | | | | | | |
United States 1.7% | | | | | | | | | | |
Royal Bank of Canada, 2.35%, 3/01/19 | | | | $ | 101,000,000 | | | | 101,000,000 | |
| | | | | | | | | | |
| | | |
Total Investments (Cost $5,522,620,989) 99.5% | | | | | | | | | 5,769,645,515 | |
Other Assets, less Liabilities 0.5% | | | | | | | | | 28,082,693 | |
| | | | | | | | | | |
| | | |
Net Assets 100.0% | | | | | | | | | $5,797,728,208 | |
| | | | | | | | | | |
See Abbreviations on page 29.
aNon-income producing.
| | | | |
| | | |
| franklintempleton.com | | The accompanying notes are an integral part of these financial statements. | Semiannual Report | | 17 |
TEMPLETON FUNDS
Financial Statements
Statement of Assets and Liabilities
February 28, 2019 (unaudited)
Templeton Foreign Fund
| | | | |
Assets: | | | | |
Investments in securities: | | | | |
Cost - Unaffiliated issuers | | | $5,522,620,989 | |
| | | | |
| |
Value - Unaffiliated issuers | | | $5,769,645,515 | |
Cash | | | 668,867 | |
Foreign currency, at value (cost $112,406) | | | 112,406 | |
Receivables: | | | | |
Investment securities sold | | | 18,614,431 | |
Capital shares sold | | | 3,887,265 | |
Dividends | | | 30,314,275 | |
European Union tax reclaims | | | 5,816,520 | |
Other assets | | | 6,338 | |
| | | | |
| |
Total assets | | | 5,829,065,617 | |
| | | | |
| |
Liabilities: | | | | |
Payables: | | | | |
Capital shares redeemed | | | 25,619,171 | |
Management fees | | | 2,831,899 | |
Distribution fees | | | 679,088 | |
Transfer agent fees | | | 1,539,087 | |
Accrued expenses and other liabilities | | | 668,164 | |
| | | | |
| |
Total liabilities | | | 31,337,409 | |
| | | | |
| |
Net assets, at value | | | $5,797,728,208 | |
| | | | |
Net assets consist of: | | | | |
Paid-in capital | | | $5,835,388,399 | |
Total distributable earnings (loss) | | | (37,660,191 | ) |
| | | | |
| |
Net assets, at value | | | $5,797,728,208 | |
| | | | |
| | | | |
| | | |
18 | | Semiannual Report | The accompanying notes are an integral part of these financial statements. | | franklintempleton.com |
TEMPLETON FUNDS
FINANCIAL STATEMENTS
Statement of Assets and Liabilities(continued)
February 28, 2019 (unaudited)
Templeton Foreign Fund
| | | | |
Class A: | | | | |
Net assets, at value | | | $2,802,525,751 | |
| | | | |
Shares outstanding | | | 386,284,656 | |
| | | | |
Net asset value per sharea | | | $7.26 | |
| | | | |
Maximum offering price per share (net asset value per share ÷ 94.50%) | | | $7.68 | |
| | | | |
Class C: | | | | |
Net assets, at value | | | $ 118,768,096 | |
| | | | |
Shares outstanding | | | 16,482,284 | |
| | | | |
Net asset value and maximum offering price per sharea | | | $7.21 | |
| | | | |
Class R: | | | | |
Net assets, at value | | | $ 138,286,828 | |
| | | | |
Shares outstanding | | | 19,452,932 | |
| | | | |
Net asset value and maximum offering price per share | | | $7.11 | |
| | | | |
Class R6: | | | | |
Net assets, at value | | | $1,467,791,078 | |
| | | | |
Shares outstanding | | | 205,943,501 | |
| | | | |
Net asset value and maximum offering price per share | | | $7.13 | |
| | | | |
Advisor Class: | | | | |
Net assets, at value | | | $1,270,356,455 | |
| | | | |
Shares outstanding | | | 177,984,782 | |
| | | | |
Net asset value and maximum offering price per share | | | $7.14 | |
| | | | |
aRedemption price is equal to net asset value less contingent deferred sales charges, if applicable.
| | | | |
| | | |
| franklintempleton.com | | The accompanying notes are an integral part of these financial statements. | Semiannual Report | | 19 |
TEMPLETON FUNDS
FINANCIAL STATEMENTS
Statement of Operations
for the six months ended February 28, 2019 (unaudited)
Templeton Foreign Fund
| | | | |
Investment income: | | | | |
Dividends: (net of foreign taxes)* | | | | |
Unaffiliated issuers | | | $ 89,774,155 | |
Interest: | | | | |
Unaffiliated issuers | | | 1,902,042 | |
Income from securities loaned: | | | | |
Unaffiliated issuers (net of fees and rebates) | | | 15,652 | |
Non-controlled affiliates (Note 3f) | | | 74,868 | |
| | | | |
| |
Total investment income | | | 91,766,717 | |
| | | | |
| |
Expenses: | | | | |
Management fees (Note 3a) | | | 20,271,172 | |
Distribution fees: (Note 3c) | | | | |
Class A | | | 3,460,817 | |
Class C | | | 812,845 | |
Class R | | | 344,641 | |
Transfer agent fees: (Note 3e) | | | | |
Class A | | | 2,384,060 | |
Class C | | | 139,998 | |
Class R | | | 119,115 | |
Class R6 | | | 269,714 | |
Advisor Class | | | 1,174,929 | |
Custodian fees (Note 4) | | | 371,832 | |
Reports to shareholders | | | 251,208 | |
Registration and filing fees | | | 85,050 | |
Professional fees | | | 88,558 | |
Trustees’ fees and expenses | | | 101,080 | |
Other | | | 70,789 | |
| | | | |
| |
Total expenses | | | 29,945,808 | |
Expenses waived/paid by affiliates (Note 3f and 3g) | | | (2,477,146) | |
| | | | |
| |
Net expenses | | | 27,468,662 | |
| | | | |
| |
Net investment income | | | 64,298,055 | |
| | | | |
Realized and unrealized gains (losses): | | | | |
Net realized gain (loss) from: | | | | |
Investments: | | | | |
Unaffiliated issuers | | | (3,084,439) | |
Foreign currency transactions | | | 827,488 | |
| | | | |
| |
Net realized gain (loss) | | | (2,256,951) | |
| | | | |
| |
Net change in unrealized appreciation (depreciation) on: | | | | |
Investments: | | | | |
Unaffiliated issuers | | | (271,507,575) | |
Translation of other assets and liabilities denominated in foreign currencies | | | 4,495 | |
| | | | |
| |
Net change in unrealized appreciation (depreciation) | | | (271,503,080) | |
| | | | |
| |
Net realized and unrealized gain (loss) | | | (273,760,031 | ) |
| | | | |
| |
Net increase (decrease) in net assets resulting from operations | | $ | (209,461,976 | ) |
| | | | |
| |
*Foreign taxes withheld on dividends | | $ | 5,016,037 | |
| | | | |
| | | |
20 | | Semiannual Report | The accompanying notes are an integral part of these financial statements. | | franklintempleton.com |
TEMPLETON FUNDS
FINANCIAL STATEMENTS
��
Statements of Changes in Net Assets
Templeton Foreign Fund
| | | | | | | | |
| | | Six Months Ended
February 28, 2019
(unaudited) | | | Year Ended
August 31, 2018 | |
Increase (decrease) in net assets: | | | | | | | | |
Operations: | | | | | | | | |
Net investment income | | | $ 64,298,055 | | | | $ 118,425,714 | |
Net realized gain (loss) | | | (2,256,951 | ) | | | 177,918,320 | |
Net change in unrealized appreciation (depreciation) | | | (271,503,080 | ) | | | (265,947,803 | ) |
| | | | |
| | |
Net increase (decrease) in net assets resulting from operations | | | (209,461,976 | ) | | | 30,396,231 | |
| | | | |
| | |
Distributions to shareholders: (Note 1e) | | | | | | | | |
Class A | | | (68,149,995) | | | | (45,938,794) | |
Class C | | | (366,884 | ) | | | (2,307,223 | ) |
Class R | | | (3,143,046 | ) | | | (2,044,262 | ) |
Class R6 | | | (42,923,314 | ) | | | (38,039,633 | ) |
Advisor Class | | | (34,608,197 | ) | | | (28,775,654 | ) |
| | | | |
| | |
Total distributions to shareholders | | | (149,191,436 | ) | | | (117,105,566 | ) |
| | | | |
| | |
Capital share transactions: (Note 2) | | | | | | | | |
Class A | | | 36,713,285 | | | | (318,451,833 | ) |
Class C | | | (151,427,642 | ) | | | (60,908,186 | ) |
Class R | | | (2,192,999 | ) | | | (2,801,703 | ) |
Class R6 | | | 53,449,164 | | | | (241,696,462 | ) |
Advisor Class | | | (263,773,760 | ) | | | (68,600,065 | ) |
| | | | |
| | |
Total capital share transactions | | | (327,231,952 | ) | | | (692,458,249 | ) |
| | | | |
| | |
Net increase (decrease) in net assets | | | (685,885,364 | ) | | | (779,167,584 | ) |
Net assets: | | | | | | | | |
Beginning of period | | | 6,483,613,572 | | | | 7,262,781,156 | |
| | | | |
| | |
End of period (Note 1e) | | | $5,797,728,208 | | | | $6,483,613,572 | |
| | | | |
| | | | |
| | | |
| franklintempleton.com | | The accompanying notes are an integral part of these financial statements. | Semiannual Report | | 21 |
TEMPLETON FUNDS
Notes to Financial Statements (unaudited)
Templeton Foreign Fund
1. Organization and Significant Accounting Policies
Templeton Funds (Trust) is registered under the Investment Company Act of 1940 (1940 Act) as anopen-end management investment company, consisting of three separate funds and applies the specialized accounting and reporting guidance in U.S. Generally Accepted Accounting Principles (U.S. GAAP). Templeton Foreign Fund (Fund) is included in this report. The Fund offers five classes of shares: Class A, Class C, Class R, Class R6 and Advisor Class. Beginning on October 19, 2018, Class C shares automatically convert to Class A shares after they have been held for 10 years. Each class of shares may differ by its initial sales load, contingent deferred sales charges, voting rights on matters affecting a single class, its exchange privilege and fees due to differing arrangements for distribution and transfer agent fees.
The following summarizes the Fund’s significant accounting policies.
a. Financial Instrument Valuation
The Fund’s investments in financial instruments are carried at fair value daily. Fair value is the price that would be received to sell an asset or paid to transfer a liability in an orderly transaction between market participants on the measurement date. The Fund calculates the net asset value (NAV) per share each business day as of 4 p.m. Eastern time or the regularly scheduled close of the New York Stock Exchange (NYSE), whichever is earlier. Under compliance policies and procedures approved by the Trust’s Board of Trustees (the Board), the Fund’s administrator has responsibility for oversight of valuation, including leading the cross-functional Valuation Committee (VC). The Fund may utilize independent pricing services, quotations from securities and financial instrument dealers, and other market sources to determine fair value.
Equity securities listed on an exchange or on the NASDAQ National Market System are valued at the last quoted sale price or the official closing price of the day, respectively. Foreign equity securities are valued as of the close of trading on the foreign stock exchange on which the security is primarily traded, or as of 4 p.m. Eastern time. The value is then converted into its U.S. dollar equivalent at the foreign exchange rate in effect at 4 p.m. Eastern time on the day that the value of the security is determined.Over-the-counter (OTC) securities are valued within the range of the most recent quoted bid and ask prices. Securities that trade in multiple markets or on multiple
exchanges are valued according to the broadest and most representative market. Certain equity securities are valued based upon fundamental characteristics or relationships to similar securities.
Investments inopen-end mutual funds are valued at the closing NAV. Investments in time deposits are valued at cost, which approximates fair value.
The Fund has procedures to determine the fair value of financial instruments for which market prices are not reliable or readily available. Under these procedures, the Fund primarily employs a market-based approach which may use related or comparable assets or liabilities, recent transactions, market multiples, book values, and other relevant information for the investment to determine the fair value of the investment. An income-based valuation approach may also be used in which the anticipated future cash flows of the investment are discounted to calculate fair value. Discounts may also be applied due to the nature or duration of any restrictions on the disposition of the investments. Due to the inherent uncertainty of valuations of such investments, the fair values may differ significantly from the values that would have been used had an active market existed.
Trading in securities on foreign securities stock exchanges and OTC markets may be completed before 4 p.m. Eastern time. In addition, trading in certain foreign markets may not take place on every Fund’s business day. Occasionally, events occur between the time at which trading in a foreign security is completed and 4 p.m. Eastern time that might call into question the reliability of the value of a portfolio security held by the Fund. As a result, differences may arise between the value of the Fund’s portfolio securities as determined at the foreign market close and the latest indications of value at 4 p.m. Eastern time. In order to minimize the potential for these differences, the VC monitors price movements following the close of trading in foreign stock markets through a series of country specific market proxies (such as baskets of American Depositary Receipts, futures contracts and exchange traded funds). These price movements are measured against established trigger thresholds for each specific market proxy to assist in determining if an event has occurred that may call into question the reliability of the values of the foreign securities held by the Fund. If such an event occurs, the securities may be valued using fair value procedures, which may include the use of independent pricing services.
| | | | |
| | | |
22 | | Semiannual Report | | franklintempleton.com |
TEMPLETON FUNDS
NOTES TO FINANCIAL STATEMENTS (UNAUDITED)
Templeton Foreign Fund(continued)
When the last day of the reporting period is anon-business day, certain foreign markets may be open on those days that the Fund’s NAV is not calculated, which could result in differences between the value of the Fund’s portfolio securities on the last business day and the last calendar day of the reporting period. Any significant security valuation changes due to an open foreign market are adjusted and reflected by the Fund for financial reporting purposes.
b. Foreign Currency Translation
Portfolio securities and other assets and liabilities denominated in foreign currencies are translated into U.S. dollars based on the exchange rate of such currencies against U.S. dollars on the date of valuation. The Fund may enter into foreign currency exchange contracts to facilitate transactions denominated in a foreign currency. Purchases and sales of securities, income and expense items denominated in foreign currencies are translated into U.S. dollars at the exchange rate in effect on the transaction date. Portfolio securities and assets and liabilities denominated in foreign currencies contain risks that those currencies will decline in value relative to the U.S. dollar. Occasionally, events may impact the availability or reliability of foreign exchange rates used to convert the U.S. dollar equivalent value. If such an event occurs, the foreign exchange rate will be valued at fair value using procedures established and approved by the Board.
The Fund does not separately report the effect of changes in foreign exchange rates from changes in market prices on securities held. Such changes are included in net realized and unrealized gain or loss from investments in the Statement of Operations.
Realized foreign exchange gains or losses arise from sales of foreign currencies, currency gains or losses realized between the trade and settlement dates on securities transactions and the difference between the recorded amounts of dividends, interest, and foreign withholding taxes and the U.S. dollar equivalent of the amounts actually received or paid. Net unrealized foreign exchange gains and losses arise from changes in foreign exchange rates on foreign denominated assets and liabilities other than investments in securities held at the end of the reporting period.
c. Securities Lending
The Fund participates in an agency based securities lending program to earn additional income. The Fund receives cash collateral against the loaned securities in an amount equal to at
least 102% of the fair value of the loaned securities. Collateral is maintained over the life of the loan in an amount not less than 100% of the fair value of loaned securities, as determined at the close of Fund business each day; any additional collateral required due to changes in security values is delivered to the Fund on the next business day. The collateral is deposited into a joint cash account with other funds and is used to invest in a money market fund managed by Franklin Advisers, Inc., an affiliate of the Fund. The Fund may receive income from the investment of cash collateral, in addition to lending fees and rebates paid by the borrower. Income from securities loaned, net of fees paid to the securities lending agent and/or third-party vendor, is reported separately in the Statement of Operations. The Fund bears the market risk with respect to the collateral investment, securities loaned, and the risk that the agent may default on its obligations to the Fund. If the borrower defaults on its obligation to return the securities loaned, the Fund has the right to repurchase the securities in the open market using the collateral received. The securities lending agent has agreed to indemnify the Fund in the event of default by a third party borrower. At February 28, 2019, the Fund had no securities on loan.
d. Income and Deferred Taxes
It is the Fund’s policy to qualify as a regulated investment company under the Internal Revenue Code. The Fund intends to distribute to shareholders substantially all of its taxable income and net realized gains to relieve it from federal income and excise taxes. As a result, no provision for U.S. federal income taxes is required.
The Fund may be subject to foreign taxation related to income received, capital gains on the sale of securities and certain foreign currency transactions in the foreign jurisdictions in which it invests. Foreign taxes, if any, are recorded based on the tax regulations and rates that exist in the foreign markets in which the Fund invests. When a capital gain tax is determined to apply, the Fund records an estimated deferred tax liability in an amount that would be payable if the securities were disposed of on the valuation date.
As a result of several court cases, in certain countries across the European Union, the Fund filed additional tax reclaims for previously withheld taxes on dividends earned in those countries (EU reclaims). These additional filings are subject to various administrative proceedings by the local jurisdictions’ tax authorities within the European Union, as well as a number
| | | | |
| | | |
| franklintempleton.com | | Semiannual Report | | 23 |
TEMPLETON FUNDS
NOTES TO FINANCIAL STATEMENTS (UNAUDITED)
Templeton Foreign Fund(continued)
1. Organization and Significant Accounting Policies(continued)
d. Income and Deferred Taxes(continued)
of related judicial proceedings. Income recognized, if any, for EU reclaims is reflected as other income in the Statement of Operations and any related receivable, if any, is reflected as European Union tax reclaims in the Statement of Assets and Liabilities. When uncertainty exists as to the ultimate resolution of these proceedings, the likelihood of receipt of these EU reclaims, and the potential timing of payment, no amounts are reflected in the financial statements. For U.S. income tax purposes, EU reclaims received by the Fund, if any, reduce the amounts of foreign taxes Fund shareholders can use as tax credits in their individual income tax returns.
The Fund may recognize an income tax liability related to its uncertain tax positions under U.S. GAAP when the uncertain tax position has a less than 50% probability that it will be sustained upon examination by the tax authorities based on its technical merits. As of February 28, 2019, the Fund has determined that no tax liability is required in its financial statements related to uncertain tax positions for any open tax years (or expected to be taken in future tax years). Open tax years are those that remain subject to examination and are based on the statute of limitations in each jurisdiction in which the Fund invests.
e. Security Transactions, Investment Income, Expenses and Distributions
Security transactions are accounted for on trade date. Realized gains and losses on security transactions are determined on a specific identification basis. Interest income and estimated expenses are accrued daily. Dividend income is recorded on theex-dividend date except for certain dividends from securities where the dividend rate is not available. In such cases, the dividend is recorded as soon as the information is received by the Fund. Distributions to shareholders are recorded on theex-dividend date. Distributable earnings are determined according to income tax regulations (tax basis) and may differ
from earnings recorded in accordance with U.S. GAAP. These differences may be permanent or temporary. Permanent differences are reclassified among capital accounts to reflect their tax character. These reclassifications have no impact on net assets or the results of operations. Temporary differences are not reclassified, as they may reverse in subsequent periods.*
Common expenses incurred by the Trust are allocated among the Funds based on the ratio of net assets of each Fund to the combined net assets of the Trust or based on the ratio of number of shareholders of each Fund to the combined number of shareholders of the Trust. Fund specific expenses are charged directly to the Fund that incurred the expense.
Realized and unrealized gains and losses and net investment income, excluding class specific expenses, are allocated daily to each class of shares based upon the relative proportion of net assets of each class. Differences in per share distributions by class are generally due to differences in class specific expenses.
f. Accounting Estimates
The preparation of financial statements in accordance with U.S. GAAP requires management to make estimates and assumptions that affect the reported amounts of assets and liabilities at the date of the financial statements and the amounts of income and expenses during the reporting period. Actual results could differ from those estimates.
g. Guarantees and Indemnifications
Under the Trust’s organizational documents, its officers and trustees are indemnified by the Trust against certain liabilities arising out of the performance of their duties to the Trust. Additionally, in the normal course of business, the Trust, on behalf of the Fund, enters into contracts with service providers that contain general indemnification clauses. The Trust’s maximum exposure under these arrangements is unknown as this would involve future claims that may be made against the Trust that have not yet occurred. Currently, the Trust expects the risk of loss to be remote.
*Effective during the current reporting period, it is no longer required to present certain line items in the Statements of Changes in Net Assets. The below prior period amounts affected by this change are shown as they were in the prior year Statements of Changes in Net Assets.
| | | | |
| | | |
24 | | Semiannual Report | | franklintempleton.com |
TEMPLETON FUNDS
NOTES TO FINANCIAL STATEMENTS (UNAUDITED)
Templeton Foreign Fund(continued)
For the year ended August 31, 2018, distributions to shareholders were as follows:
Distributions from net investment income:
| | | | |
Class A | | $ | (45,938,794 | ) |
Class C | | | (2,307,223 | ) |
Class R | | | (2,044,262 | ) |
Class R6 | | | (38,039,633 | ) |
Advisor Class | | | (28,775,654 | ) |
For the year ended August 31, 2018, undistributed net investment income included in net assets was $103,368,680.
2. Shares of Beneficial Interest
At February 28, 2019, there were an unlimited number of shares authorized (without par value). Transactions in the Fund’s shares were as follows:
| | | | | | | | | | | | | | | | |
| | | Six Months Ended
February 28, 2019 | | | Year Ended August 31, 2018 | |
| | | Shares | | | Amount | | | Shares | | | Amount | |
| | | | |
Class A Shares: | | | | | | | | | | | | | | | | |
Shares solda | | | 40,841,691 | | | $ | 295,978,137 | | | | 60,288,358 | | | $ | 481,363,237 | |
Shares issued in reinvestment of distributions | | | 9,160,942 | | | | 60,462,213 | | | | 5,091,690 | | | | 40,682,600 | |
Shares redeemed | | | (44,541,485 | ) | | | (319,727,065 | ) | | | (105,562,715 | ) | | | (840,497,670 | ) |
| | | | |
Net increase (decrease) | | | 5,461,148 | | | $ | 36,713,285 | | | | (40,182,667 | ) | | $ | (318,451,833 | ) |
| | | | |
Class C Shares: | | | | | | | | | | | | | | | | |
Shares sold | | | 1,226,602 | | | $ | 8,604,207 | | | | 3,827,342 | | | $ | 29,864,007 | |
Shares issued in reinvestment of distributions | | | 53,121 | | | | 349,007 | | | | 285,470 | | | | 2,232,372 | |
Shares redeemeda | | | (22,404,848 | ) | | | (160,380,856 | ) | | | (12,010,993 | ) | | | (93,004,565 | ) |
| | | | |
Net increase (decrease) | | | (21,125,125 | ) | | $ | (151,427,642 | ) | | | (7,898,181 | ) | | $ | (60,908,186 | ) |
| | | | |
Class R Shares: | | | | | | | | | | | | | | | | |
Shares sold | | | 2,345,185 | | | $ | 16,637,557 | | | | 6,707,134 | | | $ | 52,353,029 | |
Shares issued in reinvestment of distributions | | | 456,753 | | | | 2,955,188 | | | | 239,779 | | | | 1,879,867 | |
Shares redeemed | | | (3,088,194 | ) | | | (21,785,744 | ) | | | (7,267,977 | ) | | | (57,034,599 | ) |
| | | | |
Net increase (decrease) | | | (286,256 | ) | | $ | (2,192,999 | ) | | | (321,064 | ) | | $ | (2,801,703 | ) |
| | | | |
Class R6 Shares: | | | | | | | | | | | | | | | | |
Shares sold | | | 35,280,337 | | | $ | 249,293,297 | | | | 63,036,598 | | | $ | 498,171,947 | |
Shares issued in reinvestment of distributions | | | 6,213,456 | | | | 40,263,197 | | | | 4,723,492 | | | | 37,079,411 | |
Shares redeemed | | | (32,933,319 | ) | | | (236,107,330 | ) | | | (98,535,316 | ) | | | (776,947,820 | ) |
| | | | |
Net increase (decrease) | | | 8,560,474 | | | $ | 53,449,164 | | | | (30,775,226 | ) | | $ | (241,696,462 | ) |
| | | | |
Advisor Class Shares: | | | | | | | | | | | | | | | | |
Shares sold | | | 26,834,421 | | | $ | 189,157,547 | | | | 63,095,318 | | | $ | 494,556,825 | |
Shares issued in reinvestment of distributions | | | 4,889,130 | | | | 31,730,456 | | | | 3,269,695 | | | | 25,699,807 | |
Shares redeemed | | | (68,438,276 | ) | | | (484,661,763 | ) | | | (74,661,946 | ) | | | (588,856,697 | ) |
| | | | |
Net increase (decrease) | | | (36,714,725 | ) | | $ | (263,773,760 | ) | | | (8,296,933 | ) | | $ | (68,600,065 | ) |
aMay include a portion of Class C shares that were automatically converted to Class A.
| | | | |
| | | |
| franklintempleton.com | | Semiannual Report | | 25 |
TEMPLETON FUNDS
NOTES TO FINANCIAL STATEMENTS (UNAUDITED)
Templeton Foreign Fund(continued)
3. Transactions with Affiliates
Franklin Resources, Inc. is the holding company for various subsidiaries that together are referred to as Franklin Templeton. Certain officers and trustees of the Trust are also officers and/or directors of the following subsidiaries:
| | |
| Subsidiary | | Affiliation |
| Templeton Global Advisors Limited (TGAL) | | Investment manager |
| Franklin Templeton Services, LLC (FT Services) | | Administrative manager |
| Franklin Templeton Distributors, Inc. (Distributors) | | Principal underwriter |
| Franklin Templeton Investor Services, LLC (Investor Services) | | Transfer agent |
a. Management Fees
The Fund pays an investment management fee to TGAL based on the average daily net assets of the Fund as follows:
| | |
| Annualized Fee Rate | | Net Assets |
| 0.705% | | Up to and including $1 billion |
| 0.690% | | Over $1 billion, up to and including $5 billion |
| 0.675% | | Over $5 billion, up to and including $10 billion |
| 0.655% | | Over $10 billion, up to and including $15 billion |
| 0.635% | | Over $15 billion, up to and including $20 billion |
| 0.615% | | Over $20 billion, up to and including $25 billion |
| 0.605% | | Over $25 billion, up to and including $30 billion |
| 0.595% | | Over $30 billion, up to and including $35 billion |
| 0.585% | | In excess of $35 billion |
For the period ended February 28, 2019, the annualized gross effective investment management fee rate was 0.691% of the Fund’s average daily net assets.
b. Administrative Fees
Under an agreement with TGAL, FT Services provides administrative services to the Fund. The fee is paid by TGAL based on the Fund’s average daily net assets, and is not an additional expense of the Fund.
c. Distribution Fees
The Board has adopted distribution plans for each share class, with the exception of Class R6 and Advisor Class shares, pursuant to Rule12b-1 under the 1940 Act. Under the Fund’s Class A reimbursement distribution plan, the Fund reimburses Distributors for costs incurred in connection with the servicing, sale and distribution of the Fund’s shares up to the maximum annual plan rate. Under the Class A reimbursement distribution plan, costs exceeding the maximum for the current plan year cannot be reimbursed in subsequent periods. In addition, under the Fund’s Class C and R compensation distribution plans, the Fund pays Distributors for costs incurred in connection with the servicing, sale and distribution of the Fund’s shares up to the maximum annual plan rate for each class. The plan year, for purposes of monitoring compliance with the maximum annual plan rates, is February 1 through January 31.
The maximum annual plan rates, based on the average daily net assets, for each class, are as follows:
| | | | |
Class A | | | 0.25 | % |
Class C | | | 1.00 | % |
Class R | | | 0.50 | % |
| | | | |
| | | |
26 | | Semiannual Report | | franklintempleton.com |
TEMPLETON FUNDS
NOTES TO FINANCIAL STATEMENTS (UNAUDITED)
Templeton Foreign Fund(continued)
d. Sales Charges/Underwriting Agreements
Front-end sales charges and contingent deferred sales charges (CDSC) do not represent expenses of the Fund. These charges are deducted from the proceeds of sales of Fund shares prior to investment or from redemption proceeds prior to remittance, as applicable. Distributors has advised the Fund of the following commission transactions related to the sales and redemptions of the Fund’s shares for the period:
| | | | |
Sales charges retained net of commissions paid to unaffiliated brokers/dealers | | $ | 78,486 | |
CDSC retained | | $ | 10,561 | |
Effective September 10, 2018, the Board approved changes to certainfront-end sales charges and dealer commissions on Class A shares. Further details are disclosed in the Fund’s Prospectus.
e. Transfer Agent Fees
Each class of shares pays transfer agent fees to Investor Services for its performance of shareholder servicing obligations. The fees are based on an annualized asset based fee of 0.02% plus a transaction based fee. In addition, the Fund reimburses Investor Services for out of pocket expenses incurred and, except for Class R6, reimburses shareholder servicing fees paid to third parties. These fees are allocated daily based upon their relative proportion of such classes’ aggregate net assets. Class R6 pays Investor Services transfer agent fees specific to that class.
For the period ended February 28, 2019, the Fund paid transfer agent fees of $4,087,816, of which $1,525,967 was retained by Investor Services.
f. Investments in Affiliated Management Investment Companies
The Fund invests in one or more affiliated management investment companies for purposes other than exercising a controlling influence over the management or policies. Management fees paid by the Fund are waived on assets invested in the affiliated management investment companies, as noted in the Statement of Operations, in an amount not to exceed the management and administrative fees paid directly or indirectly by each affiliate. During the period ended February 28, 2019, the Fund held investments in affiliated management investment companies as follows:
| | | | | | | | | | | | | | | | | | | | | | | | | | | | | | | | |
| | | Number of
Shares Held
at Beginning
of Period | | | Gross
Additions | | | Gross
Reductions | | | Number of
Shares
Held at End
of Period | | | Value
at End
of
Period | | | Income
from
securities
loaned | | | Realized
Gain
(Loss) | | | Net Change in
Unrealized
Appreciation
(Depreciation) | |
| | | | | | | | |
Non-Controlled Affiliates | | | | | | | | | | | | | | | | | | | | | | | | | | | | | | | | |
Institutional Fiduciary Trust Money Market Portfolio, 2.06% | | | — | | | | 49,998,217 | | | | (49,998,217 | ) | | | — | | | | $ — | | | | $74,868 | | | | $ — | | | | $ — | |
g. Waiver and Expense Reimbursements
TGAL and Investor services have contractually agreed in advance to waive or limit their respective fees and to assume as their own expense certain expenses otherwise payable by the Fund so that the expenses (excluding distribution fees, acquired fund fees and expenses and certainnon-routine expenses or costs, including those relating to litigation, indemnification, reorganizations, and liquidations) for Class A, Class C, Class R and Advisor Class of the Fund do not exceed 0.85%, and for Class R6 do not exceed 0.69%, based on the average net assets of each class until December 31, 2019. Total expenses waived or paid are not subject to recapture subsequent to the Fund’s fiscal year end.
Prior to January 1, 2019, expenses (excluding certain fees and expenses as previously disclosed) for Class R6 were limited to 0.65% based on the average net assets of the class.
| | | | |
| | | |
| franklintempleton.com | | Semiannual Report | | 27 |
TEMPLETON FUNDS
NOTES TO FINANCIAL STATEMENTS (UNAUDITED)
Templeton Foreign Fund(continued)
4. Expense Offset Arrangement
The Fund has entered into an arrangement with its custodian whereby credits realized as a result of uninvested cash balances are used to reduce a portion of the Fund’s custodian expenses. During the period ended February 28, 2019, there were no credits earned.
5. Income Taxes
For tax purposes, capital losses may be carried over to offset future capital gains.
At August 31, 2018, the capital loss carryforwards were as follows:
| | | | |
Capital loss carryforwards not subject to expiration: | | | | |
Short term | | $ | 16,856,215 | |
Long term | | | 272,919,490 | |
| | | | |
Total capital loss carryforwards | | $ | 289,775,705 | |
| | | | |
At February 28, 2019, the cost of investments and net unrealized appreciation (depreciation) for income tax purposes were as follows:
| | | | |
Cost of investments | | $ | 5,543,970,623 | |
| | | | |
| |
Unrealized appreciation | | $ | 717,512,011 | |
Unrealized depreciation | | | (491,837,119 | ) |
| | | | |
| |
Net unrealized appreciation (depreciation) | | $ | 225,674,892 | |
| | | | |
Differences between income and/or capital gains as determined on a book basis and a tax basis are primarily due to differing treatment of passive foreign investment company shares.
6. Investment Transactions
Purchases and sales of investments (excluding short term securities) for the period ended February 28, 2019, aggregated $799,491,451 and $1,127,478,909, respectively.
7. Concentration of Risk
Investing in foreign securities may include certain risks and considerations not typically associated with investing in U.S. securities, such as fluctuating currency values and changing local and regional economic, political and social conditions, which may result in greater market volatility. Current political and financial uncertainty surrounding the European Union may increase market volatility and the economic risk of investing in securities in Europe. In addition, certain foreign securities may not be as liquid as U.S. securities.
8. Credit Facility
The Fund, together with other U.S. registered and foreign investment funds (collectively, Borrowers), managed by Franklin Templeton, are borrowers in a joint syndicated senior unsecured credit facility totaling $2 billion (Global Credit Facility) which matures on February 7, 2020. This Global Credit Facility provides a source of funds to the Borrowers for temporary and emergency purposes, including the ability to meet future unanticipated or unusually large redemption requests.
| | | | |
| | | |
28 | | Semiannual Report | | franklintempleton.com |
TEMPLETON FUNDS
NOTES TO FINANCIAL STATEMENTS (UNAUDITED)
Templeton Foreign Fund(continued)
Under the terms of the Global Credit Facility, the Fund shall, in addition to interest charged on any borrowings made by the Fund and other costs incurred by the Fund, pay its share of fees and expenses incurred in connection with the implementation and maintenance of the Global Credit Facility, based upon its relative share of the aggregate net assets of all of the Borrowers, including an annual commitment fee of 0.15% based upon the unused portion of the Global Credit Facility. These fees are reflected in other expenses in the Statement of Operations. During the period ended February 28, 2019, the Fund did not use the Global Credit Facility.
9. Fair Value Measurements
The Fund follows a fair value hierarchy that distinguishes between market data obtained from independent sources (observable inputs) and the Fund’s own market assumptions (unobservable inputs). These inputs are used in determining the value of the Fund’s financial instruments and are summarized in the following fair value hierarchy:
| | • | | Level 1 – quoted prices in active markets for identical financial instruments |
| | • | | Level 2 – other significant observable inputs (including quoted prices for similar financial instruments, interest rates, prepayment speed, credit risk, etc.) |
| | • | | Level 3 – significant unobservable inputs (including the Fund’s own assumptions in determining the fair value of financial instruments) |
The input levels are not necessarily an indication of the risk or liquidity associated with financial instruments at that level.
A summary of inputs used as of February 28, 2019, in valuing the Fund’s assets carried at fair value, is as follows:
| | | | | | | | | | | | | | | | |
| | | Level 1 | | | Level 2 | | | Level 3 | | | Total | |
Assets: | | | | | | | | | | | | | | | | |
Investments in Securities:a | | | | | | | | | | | | | | | | |
Equity Investments | | $ | 5,668,645,515 | | | $ | — | | | $ | — | | | $ | 5,668,645,515 | |
Short Term Investments | | | — | | | | 101,000,000 | | | | — | | | | 101,000,000 | |
| | | | |
Total Investments in Securities | | $ | 5,668,645,515 | | | $ | 101,000,000 | | | $ | — | | | $ | 5,769,645,515 | |
| | | | |
aFor detailed categories, see the accompanying Statement of Investments.
10. Subsequent Events
The Fund has evaluated subsequent events through the issuance of the financial statements and determined that no events have occurred that require disclosure.
Abbreviations
| | | | | | |
Currency | | Selected Portfolio |
| | | |
GBP | | British Pound | | ADR | | American Depositary Receipt |
HKD | | Hong Kong Dollar | | IDR | | International Depositary Receipt |
| | | | NVDR | | Non-Voting Depositary Receipt |
| | | | |
| | | |
| franklintempleton.com | | Semiannual Report | | 29 |
TEMPLETON FUNDS
Tax Information (unaudited)
Templeton Foreign Fund
At August 31, 2018, more than 50% of the Fund’s total assets were invested in securities of foreign issuers. In most instances, foreign taxes were withheld from income paid to the Fund on these investments. As shown in the table below, the Fund hereby reports to shareholders the foreign source income and foreign taxes paid, pursuant to Section 853 of the Internal Revenue Code. This written statement will allow shareholders of record on December 20, 2018, to treat their proportionate share of foreign taxes paid by the Fund as having been paid directly by them. The shareholder shall consider these amounts as foreign taxes paid in the tax year in which they receive the Fund distribution.
The following table provides a detailed analysis of foreign tax paid, foreign source income, and foreign source qualified dividends as reported by the Fund to shareholders of record.
| | | | | | | | | | | | |
| Class | | Foreign Tax Paid
Per Share | | | Foreign Source
Income Per Share | | | Foreign Source Qualified
Dividends Per Share | |
| | | |
Class A | | | $0.0242 | | | | $0.1669 | | | | $0.1218 | |
Class C | | | $0.0242 | | | | $ — | | | | $ — | |
Class R | | | $0.0242 | | | | $0.1511 | | | | $0.1104 | |
Class R6 | | | $0.0242 | | | | $0.1992 | | | | $0.1457 | |
Advisor Class | | | $0.0242 | | | | $0.1841 | | | | $0.1346 | |
Foreign Tax Paid Per Share is the amount per share available to you, as a tax credit (assuming you held your shares in the Fund for a minimum of 16 days during the31-day period beginning 15 days before theex-dividend date of the Fund’s distribution to which the foreign taxes relate), or, as a tax deduction.
Foreign Source Income Per Share is the amount per share of income dividends attributable to foreign securities held by the Fund, plus any foreign taxes withheld on these dividends. The amounts reported include foreign source qualified dividends that have not been adjusted for the rate differential applicable to such dividend income.1
Foreign Source Qualified Dividends Per Share is the amount per share of foreign source qualified dividends plus any foreign taxes withheld on these dividends. These amounts represent the portion of the Foreign Source Income Per Share that were derived from qualified foreign securities held by the Fund.1
In February 2019, shareholders received Form1099-DIV which included their share of taxes paid and foreign source income distributed during the calendar year 2018. The Foreign Source Income reported on Form1099-DIV was not adjusted for the rate differential on foreign source qualified dividend income. Shareholders are advised to check with their tax advisors for information on the treatment of these amounts on their 2018 individual income tax returns.
1Qualified dividends are taxed at reduced long term capital gains tax rates. In determining the amount of foreign tax credit that may be applied against the U.S. tax liability of individuals receiving foreign source qualified dividends, adjustments may be required to the foreign tax credit limitation calculation to reflect the rate differential applicable to such dividend income. The rules however permit certain individuals to elect not to apply the rate differential adjustments for capital gains and/or dividends for any taxable year. Please consult your tax advisor and the instructions to Form 1116 for more information.
| | | | |
| | | |
30 | | Semiannual Report | | franklintempleton.com |
TEMPLETON FUNDS
TEMPLETON FOREIGN FUND
Shareholder Information
Proxy Voting Policies and Procedures
The Fund’s investment manager has established Proxy Voting Policies and Procedures (Policies) that the Fund uses to determine how to vote proxies relating to portfolio securities. Shareholders may view the Fund’s complete Policies online at franklintempleton.com. Alternatively, shareholders may request copies of the Policies free of charge by calling the Proxy Group collect at (954)527-7678 or by sending a written request to: Franklin Templeton Companies, LLC, 300 S.E. 2nd Street, Fort Lauderdale, FL 33301, Attention: Proxy Group. Copies of the Fund’s proxy voting records are also made available online at franklintempleton.com and posted on the U.S. Securities and Exchange Commission’s website at sec.gov and reflect the most recent12-month period ended June 30.
Quarterly Statement of Investments
The Trust, on behalf of the Fund, files a complete statement of investments with the U.S. Securities and Exchange Commission for the first and third quarters for each fiscal year as an exhibit to its report on FormN-PORT. Shareholders may view the filed FormN-PORT by visiting the Commission’s website at sec.gov. The filed form may also be viewed and copied at the Commission’s Public Reference Room in Washington, DC. Information regarding the operations of the Public Reference Room may be obtained by calling(800) SEC-0330.
| | | | |
| | | |
| franklintempleton.com | | Semiannual Report | | 31 |
This page intentionally left blank.
| | |
 | | Semiannual Report and Shareholder Letter |
| | Templeton Foreign Fund |
| | Investment Manager |
| | Templeton Global Advisors Limited |
| | Distributor |
| | Franklin Templeton Distributors, Inc. |
| | (800) DIAL BEN®/342-5236 franklintempleton.com |
| | Shareholder Services |
| | (800)632-2301 |
Authorized for distribution only when accompanied or preceded by a summary prospectus and/or prospectus. Investors should carefully consider a fund’s investment goals, risks, charges and expenses before investing. A prospectus contains this and other information; please read it carefully before investing.
To help ensure we provide you with quality service, all calls to and from our service areas are monitored and/or recorded.
| | |
© 2019 Franklin Templeton Investments. All rights reserved. | | 104 S 04/19 |

Internet Delivery of Fund Reports Unless You Request Paper Copies:Effective January 1, 2021, as permitted by the SEC, paper copies of the Fund’s shareholder reports will no longer be sent by mail, unless you specifically request them from the Fund or your financial intermediary. Instead, the reports will be made available on a website, and you will be notified by mail each time a report is posted and provided with a website link to access the report.
If you already elected to receive shareholder reports electronically, you will not be affected by this change and you need not take any action. If you have not signed up for electronic delivery, we would encourage you to join fellow shareholders who have. You may elect to receive shareholder reports and other communications electronically from the Fund by calling (800)632-2301 or by contacting your financial intermediary.
You may elect to continue to receive paper copies of all your future shareholder reports free of charge by contacting your financial intermediary or, if you invest directly with a Fund, calling (800)632-2301 to let the Fund know of your request. Your election to receive reports in paper will apply to all funds held in your account.
Franklin Templeton
Successful investing begins with ambition. And achievement only comes when you reach for it. That’s why we continually strive to deliver better outcomes for investors. No matter what your goals are, our deep, global investment expertise allows us to offer solutions that can help.
During our more than 70 years of experience, we’ve managed through all kinds of markets—up, down and those in between. We’re always preparing for what may come next. It’s because of this, combined with our strength as one of the world’s largest asset managers that we’ve earned the trust of millions of investors around the world.
Dear Shareholder:
During the six months ended February 28, 2019, the global economy generally expanded and many companies reported solid revenues and earnings. Global markets were pressured by concerns about increased technology company regulation, U.S. and European Union political uncertainties, major central banks’ interest-rate policies and the impact of the U.S.-China trade dispute on global growth and corporate earnings. Nearperiod-end, the U.S. Federal Reserve’s indications of a cautious approach to its monetary policy decisions and investor optimism about U.S.-China trade negotiations supported markets. In this environment, global developed and emerging market stocks had negative returns, as measured by the MSCI All Country World Index.
We are committed to our long-term perspective and disciplined investment approach as we conduct a rigorous, fundamental analysis of securities with a regular emphasis on investment risk management.
Historically, patient investors have achieved rewarding results by evaluating their goals, diversifying their assets globally and maintaining a disciplined investment program, all hallmarks of the Templeton investment philosophy developed more than 60 years ago. We continue to recommend investors consult their financial advisors and review their portfolios to design a long-term strategy and portfolio allocation that meet their individual needs, goals and risk tolerance.
Templeton World Fund’s semiannual report includes more detail about prevailing conditions and a discussion about investment decisions during the period. Please remember all securities markets fluctuate, as do mutual fund share prices.
We thank you for investing with Franklin Templeton, welcome your questions and comments, and look forward to serving your investment needs in the years ahead.
Sincerely,
Norman J. Boersma, CFA
President and Chief Executive Officer –
Investment Management
Templeton Funds
This letter reflects our analysis and opinions as of February 28, 2019, unless otherwise indicated. The information is not a complete analysis of every aspect of any market, country, industry, security or fund. Statements of fact are from sources considered reliable.
CFA® is a trademark owned by CFA Institute.
|
Not FDIC Insured | May Lose Value | No Bank Guarantee |
| | | | |
| | | |
| franklintempleton.com | | Not part of the semiannual report | | 1 |
Visitfranklintempleton.comfor fund updates, to access your account, or to find helpful financial planning tools.
| | | | |
| | | |
2 | | Semiannual Report | | franklintempleton.com |
Semiannual Report
Templeton World Fund
This semiannual report for Templeton World Fund covers the period ended February 28, 2019.
Your Fund’s Goal and Main Investments
The Fund seeks long-term capital growth. Under normal market conditions, the Fund invests primarily in equity securities of companies located anywhere in the world, including developing markets. Under normal circumstances, the Fund will invest in issuers located in at least three different countries (including the U.S.). The Fund regularly uses certain derivative instruments to seek to hedge against currency risks.
Performance Overview
The Fund’s Class A shares had a-4.45% cumulative total return for the six months under review. In comparison, the Fund’s benchmark, the MSCI All Country World Index (ACWI) 100% Hedged to USD, which measures stock performance in global developed and emerging markets, had a-2.15% total return.1 Also in comparison, the Fund’s second benchmark, the MSCI ACWI, had a-2.70% total return,2 and the Fund’s third benchmark, the Linked MSCI ACWI 100% Hedged to USD/World, had a-2.15% total return.3 For the10-year period ended February 28, 2019, the Fund’s Class A shares posted a +182.95% cumulative total return, compared with the Linked MSCI ACWI 100% Hedged to USD/World’s +268.15% cumulative total return for the same period.3 Please note index performance information is provided for reference and we do not attempt to track the index but rather undertake investments on the basis of fundamental research. You can find more performance data in the Performance Summary beginning on page 7.
Performance data represent past performance, which does not guarantee future results. Investment return and principal value will fluctuate, and you may have a gain or loss when you sell your shares. Current performance may differ from figures
Geographic Composition*
Based on Total Net Assets as of 2/28/19
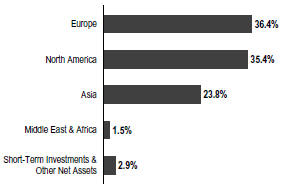
*Figures reflect certain derivatives held in the portfolio (or their underlying reference assets) and may not total 100% or may be negative due to rounding, use of any derivatives, unsettled trades or other factors.
shown. For most recentmonth-end performance, go tofranklintempleton.comor call(800)342-5236.
Economic and Market Overview
The global economy expanded during the six months under review, despite weakness in certain regions. Global developed and emerging market stocks were aided at certain points during the period by upbeat economic data in some regions, encouraging corporate earnings reports, the U.S. Federal Reserve’s (Fed’s) indications of a cautious approach to its monetary policy decisions and optimism about a potential U.S.-China trade deal.
However, various factors weighed on global markets at certain points during the period, including concerns about tighter regulation of technology companies, political uncertainties in the U.S. and the European Union (EU), the Fed’s interest-rate path and the European Central Bank’s (ECB’s) unwinding of its bond purchase program. Markets were further pressured by U.S. trade disputes with China and other trading partners, and
1. Source: FactSet.
2. Source: Morningstar.
3. Source: FactSet. The Linked MSCI ACWI 100% Hedged to USD/World reflects performance of the MSCI World Index through 6/29/2016 and performance of the MSCI ACWI 100% Hedged to USD thereafter. As of 2/28/19, the Fund’s Class A10-year average annual total return not including the maximum sales charge was +10.96%, compared with the Linked MSCI ACWI 100% Hedged to USD/World’s10-year average annual total return of +13.92%.
The indexes are unmanaged and include reinvestment of any income or distributions. They do not reflect any fees, expenses or sales charges. One cannot invest directly in an index, and an index is not representative of the Fund’s portfolio.
The dollar value, number of shares or principal amount, and names of all portfolio holdings are listed in the Fund’s Statement of Investments (SOI).
The SOI begins on page 14.
| | | | |
| | | |
| franklintempleton.com | | Semiannual Report | | 3 |
TEMPLETON WORLD FUND
their impact on global growth and corporate earnings. In this environment, global stocks, as measured by the MSCI ACWI, had a-2.70% total return for the six months ended February 28, 2019.2
The U.S. economy grew in 2018’s fourth quarter, though at a slower pace from the previous quarter partly due to a decline in housing investment. The unemployment rate was 3.8% in August 2018, and though it varied during the period, it remained unchanged atperiod-end.4 The annual inflation rate, as measured by the Consumer Price Index, decreased from 2.7% in August 2018 to 1.5% atperiod-end.4 The Fed raised its target range for the federal funds rate twice during the period, to 2.25%–2.50%, and continued reducing its balance sheet as part of its plan to normalize monetary policy. At its January meeting, the Fed held its target range for the federal funds rate unchanged and mentioned it would be patient in deciding further rate adjustments. Furthermore, the Fed’s January meeting minutes indicated that most policymakers favored announcing the end of balance sheet normalization by the end of 2019.
In Europe, the U.K.’s quarterly gross domestic product (GDP) growth accelerated in 2018’s third quarter but moderated in the fourth quarter. The Bank of England kept its key policy rate unchanged during the period. After moderating in 2018’s third quarter, the eurozone’s quarterly GDP grew in the fourth quarter. The bloc’s annual inflation rate ended the period lower than in August 2018. The ECB kept its benchmark interest rate unchanged during the period and concluded its bond purchase program at the end of 2018. In January 2019, the ECB reiterated that it expected key interest rates to remain unchanged through at least the summer of 2019 and intended to reinvest principal payments from maturing bonds for an extended period of time.
In Asia, Japan’s quarterly GDP contracted in 2018’s third quarter but grew in the fourth quarter. The Bank of Japan left its benchmark interest rate unchanged during the period and continued its monetary stimulus measures.
In emerging markets, Brazil’s quarterly GDP growth accelerated in 2018’s third quarter but moderated in the fourth quarter. The Central Bank of Brazil kept its benchmark interest rate unchanged during the period. Russia’s annual GDP growth stabilized in 2018’s third quarter and accelerated in the fourth quarter. The Bank of Russia increased its key rate twice during
Top 10 Sectors/Industries
2/28/19
| | |
| | | % of Total
Net Assets |
Banks | | 14.3% |
Pharmaceuticals | | 14.1% |
Oil, Gas & Consumable Fuels | | 11.9% |
Food & Staples Retailing | | 4.2% |
Diversified Telecommunication Services | | 3.9% |
Media | | 3.8% |
Wireless Telecommunication Services | | 3.3% |
Industrial Conglomerates | | 2.8% |
Multi-Utilities | | 2.8% |
Biotechnology | | 2.7% |
the period to curtail inflation risks. China’s annual GDP growth moderated in 2018’s third and fourth quarters. The People’s Bank of China left its benchmark interest rate unchanged during the period, but it took measures to improve financial liquidity to mitigate the negative effects of the U.S.-China trade dispute and support economic growth. Overall, emerging market stocks, as measured by the MSCI Emerging Markets Index, posted a +0.46% total return during thesix-month period.2
Investment Strategy
Our investment strategy employs abottom-up, value-oriented, long-term approach. We focus on the market price of a company’s securities relative to our evaluation of the company’s long-term earnings, asset value and cash flow potential. Our analysis includes an assessment of the potential impacts of material environmental, social and governance (ESG) factors on the long-term risk and return profile of a company. We also consider the company’s price/earnings ratio, price/cash flow ratio, profit margins and liquidation value.
Manager’s Discussion
During the six months under review, major detractors from the Fund’s performance relative to its benchmark, the MSCI ACWI 100% Hedged to USD, included stock selection in several overweighted sectors. In particular, stock-specific issues among the Fund’s overweighted health care holdings notably detracted from relative performance.5 The sector included two of the Fund’s biggest detractors during the period: Israeli pharmaceuticals firm Teva Pharmaceutical Industries and U.S. pharmaceuticals firm Allergan. Teva was pressured by
4. Source: U.S. Bureau of Labor Statistics.
5. The health care sector comprises biotechnology, health care providers and services, and pharmaceuticals in the SOI.
| | | | |
| | | |
4 | | Semiannual Report | | franklintempleton.com |
TEMPLETON WORLD FUND
weakness in the U.S. generic drug market and slumping sales of one of the firm’s aging blockbuster drugs. Yet, we believe such headwinds are well discounted by a share price hovering neartwo-decade lows, and we are encouraged by the company’s ongoing efforts to reduce debt, cut costs and stabilize declining sales. Meanwhile, Allergan has come under pressure from various angles in 2018, causing its stock andprice-to-earnings ratio to decline, but we believe the company’s solid free cash flow yield could potentially limit significant downside. We continue to like the company’s core aesthetics franchise, a durable business growing at amid-single-digit pace with a strong brand and high barriers to entry. Conversely, the health care sector also delivered one of the Fund’s top contributors: Swiss pharmaceuticals firm Roche Holding. Its shares rallied after the firm exceeded profit estimates and touted the earnings potential of a new crop of drugs replacing its aging blockbuster drugs.
Stock selection in the overweighted financials sector also detracted, pressured by a stake in Swiss investment bank UBS Group.6 Along with its regional banking peers, its stock was impacted by weak European economic data and subdued projections for ECB interest-rate hikes. Although the macro backdrop has delayed our investment thesis on UBS, we do not believe the thesis is broken. Our analysis indicates UBS has the ability to improve profitability by stabilizing wealth management margins, bolstering net interest income and achieving cost efficiencies. We are also pleased to see management guiding toward greater capital returns for shareholders as regulatory risk diminishes. Conversely, the financials sector also delivered one of the Fund’s top contributors: Chinese life insurer China Life Insurance. Its shares rallied as China’s increased stimulus measures buoyed regional markets and the firm announced well-received changes to its management team and corporate strategy.
Stock-specific weakness also negatively impacted relative returns in the underweighted industrials sector.7 Shares of German industrial conglomerate Siemens declined amid weak power turbine demand and tensions with EU regulators on a desired merger. Conversely, the sector also delivered one of the Fund’s top contributors: Danish wind-turbine manufacturer Vestas Wind Systems. Its shares surged after the firm maintained full-year 2018 guidance in the face of tougher competition, signaling to analysts that management
expects a
Top 10 Holdings
2/28/19
| | | | |
| |
Company Sector/Industry, Country | | % of Total
Net Assets | |
Citigroup Inc. | | | 2.4% | |
Banks, U.S. | | | | |
Oracle Corp. | | | 2.4% | |
Software, U.S. | | | | |
Royal Dutch Shell PLC | | | 2.3% | |
Oil, Gas & Consumable Fuels, U.K. | | | | |
Roche Holding AG | | | 2.3% | |
Pharmaceuticals, Switzerland | | | | |
SES SA | | | 2.3% | |
Media, Luxembourg | | | | |
BP PLC | | | 2.2% | |
Oil, Gas & Consumable Fuels, U.K. | | | | |
Eni SpA | | | 2.2% | |
Oil, Gas & Consumable Fuels, Italy | | | | |
Samsung Electronics Co. Ltd. | | | 2.2% | |
Technology Hardware, Storage & Peripherals, South Korea | | | | |
Singapore Telecommunications Ltd. | | | 2.1% | |
Diversified Telecommunication Services, Singapore | | | | |
Kellogg Co. | | | 2.0% | |
Food Products, U.S. | | | | |
strong finish to 2018. We were encouraged by the stabilization in pricing and strength in new orders, and we believe Vestas is well-positioned to participate in the long-term growth of the wind manufacturing industry.
Elsewhere, Chinese internet search firm Baidu finished among the Fund’s biggest detractors. Broad-based concerns about economic uncertainty in China hurt the stock, offsetting the firm’s better-than-expected sales growth and rapid increase in users.
Turning to contributors, stock selection and an underweighting in the materials sector contributed significantly to relative returns.8 The sector delivered one of the Fund’s top contributors: Canadian precious metals firm Wheaton Precious Metals. Wheaton benefited from a favorable settlement related to a Canadian tax audit that had weighed on its shares for years. We have long believed Wheaton was likely to prevail in this matter and believe the removal of uncertainty could pave the way for wider appreciation of Wheaton’s unique, asset-light precious metals streaming model.
6. The financials sector comprises banks, capital markets, consumer finance and insurance in the SOI.
7. The industrials sector comprises air freight and logistics, building products, electrical equipment, industrial conglomerates, machinery and marine in the SOI.
8. The materials sector comprises chemicals, construction materials, and metals and mining in the SOI.
See www.franklintempletondatasources.com for additional data provider information.
| | | | |
| | | |
| franklintempleton.com | | Semiannual Report | | 5 |
TEMPLETON WORLD FUND
Top 10 Countries
2/28/19
| | | | |
| | | % of Total
Net Assets | |
U.S. | | | 33.4% | |
U.K. | | | 9.8% | |
Japan | | | 6.9% | |
France | | | 6.2% | |
China | | | 6.2% | |
Germany | | | 5.7% | |
South Korea | | | 4.0% | |
Switzerland | | | 3.9% | |
Netherlands | | | 3.0% | |
Denmark | | | 2.3% | |
Elsewhere, shares of Chinese telecommunication services firm China Telecom advanced after the company confirmed its entry into the Philippine market as the country’s third major service provider. We continue to think broader industry concerns are overshadowing the solid operating performance and attractive valuation of China Telecom, and we remain holders in anticipation of further potential share price appreciation.
From a regional standpoint, stock selection in the U.S. detracted significantly from the Fund’s relative returns, as did stock selection and an overweighting in Europe to a lesser extent. Stock selection in Asia, particularly in Japan, contributed to relative results.
The Fund’s currency hedges had a positive effect on Fund performance during the six months under review. However, one cannot expect the same results for future periods.
Thank you for your continued participation in Templeton World Fund. We look forward to serving your future investment needs.
| | |
| |
 | | 
Norman J. Boersma, CFA Lead Portfolio Manager Heather Arnold, CFA Christopher James Peel, CFA Herbert J. Arnett, Jr. Peter Moeschter, CFA Portfolio Management Team |
The foregoing information reflects our analysis, opinions and portfolio holdings as of February 28, 2019, the end of the reporting period. The way we implement our main investment strategies and the resulting portfolio holdings may change depending on factors such as market and economic conditions. These opinions may not be relied upon as investment advice or an offer for a particular security. The information is not a complete analysis of every aspect of any market, country, industry, security or the Fund. Statements of fact are from sources considered reliable, but the investment manager makes no representation or warranty as to their completeness or accuracy. Although historical performance is no guarantee of future results, these insights may help you understand our investment management philosophy.
| | | | |
| | | |
6 | | Semiannual Report | | franklintempleton.com |
TEMPLETON WORLD FUND
Performance Summary as of February 28, 2019
The performance table does not reflect any taxes that a shareholder would pay on Fund dividends, capital gain distributions, if any, or any realized gains on the sale of Fund shares. Total return reflects reinvestment of the Fund’s dividends and capital gain distributions, if any, and any unrealized gains or losses. Your dividend income will vary depending on dividends or interest paid by securities in the Fund’s portfolio, adjusted for operating expenses of each class. Capital gain distributions are net profits realized from the sale of portfolio securities.
Performance as of 2/28/191
Cumulative total return excludes sales charges. Average annual total return includes maximum sales charges. Sales charges will vary depending on the size of the investment and the class of share purchased. The maximum is 5.50% and the minimum is 0%.Class A:5.50% maximum initial sales charge;Advisor Class:no sales charges. For other share classes, visitfranklintempleton.com.
| | | | | | | | |
| Share Class | | Cumulative
Total Return2 | | | Average Annual
Total Return3 | |
| | |
A4 | | | | | | | | |
| | |
6-Month | | | -4.45% | | | | -9.69% | |
| | |
1-Year | | | -1.77% | | | | -7.20% | |
| | |
5-Year | | | +11.58% | | | | +1.06% | |
| | |
10-Year | | | +182.95% | | | | +10.34% | |
| | |
Advisor | | | | | | | | |
| | |
6-Month | | | -4.34% | | | | -4.34% | |
| | |
1-Year | | | -1.48% | | | | -1.48% | |
| | |
5-Year | | | +12.97% | | | | +2.47% | |
| | |
10-Year | | | +190.05% | | | | +11.24% | |
Performance data represent past performance, which does not guarantee future results. Investment return and principal value will fluctuate, and you may have a gain or loss when you sell your shares. Current performance may differ from figures shown. For most recentmonth-end performance, go tofranklintempleton.comor call(800)342-5236.
See page 8 for Performance Summary footnotes.
| | | | |
| | | |
| franklintempleton.com | | Semiannual Report | | 7 |
TEMPLETON WORLD FUND
PERFORMANCE SUMMARY
Distributions(9/1/18–2/28/19)
| | | | | | | | | | | | | | | | |
| Share Class | | Net Investment
Income | | | Short-Term
Capital Gain | | | Long-Term
Capital Gain | | | Total | |
| | | | |
A | | | $0.6723 | | | | $0.2541 | | | | $1.6723 | | | | $2.5987 | |
| | | | |
C | | | $0.2842 | | | | $0.2541 | | | | $1.6723 | | | | $2.2106 | |
| | | | |
R6 | | | $0.7240 | | | | $0.2541 | | | | $1.6723 | | | | $2.6504 | |
| | | | |
Advisor | | | $0.7163 | | | | $0.2541 | | | | $1.6723 | | | | $2.6427 | |
Total Annual Operating Expenses5
| | | | | | | | |
| Share Class | | With Fee Waiver | | | Without Fee Waiver | |
A | | | 1.05% | | | | 1.05% | |
| Advisor | | | 0.80% | | | | 0.80% | |
Each class of shares is available to certain eligible investors and has different annual fees and expenses, as described in the prospectus.
All investments involve risks, including possible loss of principal. Special risks are associated with foreign investing, including currency fluctuations, economic instability and political developments; investments in developing markets involve heightened risks related to the same factors. Currency rates may fluctuate significantly over short periods of time, and can reduce returns. Because the Fund may invest its assets in companies in a specific region, including Europe, it is subject to greater risks of adverse developments in that region and/or the surrounding regions than a fund that is more broadly diversified geographically. Current political and financial uncertainty surrounding the European Union may increase market volatility and the economic risk of investing in companies in Europe. Derivatives, including currency management strategies, involve costs and can create economic leverage in the portfolio which may result in significant volatility and cause the Fund to participate in losses (as well as enable gains) on an amount that exceeds the Fund’s initial investment. The Fund may not achieve the anticipated benefits, and may realize losses when a counterparty fails to perform as promised. The Fund is actively managed but there is no guarantee that the manager’s investment decisions will produce the desired results. The Fund’s prospectus also includes a description of the main investment risks.
1. The Fund has a fee waiver associated with any investment it makes in a Franklin Templeton money fund and/or other Franklin Templeton fund, contractually guaranteed through 12/31/19. Fund investment results reflect the fee waiver; without this waiver, the results would have been lower.
2. Cumulative total return represents the change in value of an investment over the periods indicated.
3. Average annual total return represents the average annual change in value of an investment over the periods indicated. Return for less than one year, if any, has not been annualized.
4. Prior to 9/10/18, these shares were offered at a higher initial sales charge of 5.75%, thus actual returns would have differed. Total returns with sales charges have been restated to reflect the current maximum initial sales charge of 5.50%.
5. Figures are as stated in the Fund’s current prospectus and may differ from the expense ratios disclosed in the Your Fund’s Expenses and Financial Highlights sections in this report. In periods of market volatility, assets may decline significantly, causing total annual Fund operating expenses to become higher than the figures shown.
| | | | |
| | | |
8 | | Semiannual Report | | franklintempleton.com |
TEMPLETON WORLD FUND
Your Fund’s Expenses
As a Fund shareholder, you can incur two types of costs: (1) transaction costs, including sales charges (loads) on Fund purchases and redemptions; and (2) ongoing Fund costs, including management fees, distribution and service(12b-1) fees, and other Fund expenses. All mutual funds have ongoing costs, sometimes referred to as operating expenses. The table below shows ongoing costs of investing in the Fund and can help you understand these costs and compare them with those of other mutual funds. The table assumes a $1,000 investment held for the six months indicated.
Actual Fund Expenses
The table below provides information about actual account values and actual expenses in the columns under the heading “Actual.” In these columns the Fund’s actual return, which includes the effect of Fund expenses, is used to calculate the “Ending Account Value” for each class of shares. You can estimate the expenses you paid during the period by following these steps (ofcourse, your account value and expenses will differ from those in this illustration):Divide your account value by $1,000 (ifyour account had an $8,600 value, then $8,600÷ $1,000 = 8.6). Then multiply the result by the number in the row for your class of shares under the headings “Actual” and “Expenses Paid During Period” (ifActual Expenses Paid During Period were $7.50, then 8.6 x $7.50 = $64.50). In this illustration, the actual expenses paid this period are $64.50.
Hypothetical Example for Comparison with Other Funds
Under the heading “Hypothetical” in the table, information is provided about hypothetical account values and hypothetical expenses based on the Fund’s actual expense ratio and an assumed rate of return of 5% per year before expenses, which is not the Fund’s actual return. This information may not be used to estimate the actual ending account balance or expenses you paid for the period, but it can help you compare ongoing costs of investing in the Fund with those of other funds. To do so, compare this 5% hypothetical example for the class of shares you hold with the 5% hypothetical examples that appear in the shareholder reports of other funds.
Please note that expenses shown in the table are meant to highlight ongoing costs and do not reflect any transactional costs. Therefore, information under the heading “Hypothetical” is useful in comparing ongoing costs only, and will not help you compare total costs of owning different funds. In addition, if transactional costs were included, your total costs would have been higher.
| | | | | | | | | | | | |
| | | | | Actual
(actual return after expenses) | | Hypothetical (5% annual return before expenses) | | |
| | | | | | | | |
Share
Class | | Beginning
Account
Value 9/1/18 | | Ending
Account
Value 2/28/19 | | Expenses Paid During
Period
9/1/18–2/28/191,2 | | Ending
Account
Value 2/28/19 | | Expenses Paid During
Period
9/1/18–2/28/191,2 | | Net
Annualized
Expense
Ratio2 |
| | | | | | |
A | | $1,000 | | $955.50 | | $5.04 | | $1,019.64 | | $5.21 | | 1.04% |
C | | $1,000 | | $951.60 | | $8.71 | | $1,015.87 | | $9.00 | | 1.80% |
R6 | | $1,000 | | $957.10 | | $3.59 | | $1,021.12 | | $3.71 | | 0.74% |
Advisor | | $1,000 | | $956.60 | | $3.88 | | $1,020.83 | | $4.01 | | 0.80% |
1. Expenses are equal to the annualized expense ratio for thesix-month period as indicated above—in the far right column—multiplied by the simple average account value over the period indicated, and then multiplied by 181/365 to reflect theone-half year period.
2. Reflects expenses after fee waivers and expense reimbursements. Does not include acquired fund fees and expenses.
| | | | |
| | | |
| franklintempleton.com | | Semiannual Report | | 9 |
TEMPLETON FUNDS
Financial Highlights
Templeton World Fund
| | | | | | | | | | | | | | | | | | | | | | |
| | | Six Months Ended
February 28, 2019 | | | Year Ended August 31, |
| | | (unaudited) | | | 2018 | | | 2017 | | | 2016 | | | 2015 | | | 2014 |
| | | | | | |
Class A | | | | | | | | | | | | | | | | | | | | | | |
Per share operating performance | | | | | | | | | | | | | | | | | | | | | | |
(for a share outstanding throughout the period) | | | | | | | | | | | | | | | | | | | | | | |
Net asset value, beginning of period | | | $17.24 | | | | $16.94 | | | | $15.47 | | | | $16.51 | | | | $20.18 | | | $18.02 |
| | | | | | |
Income from investment operationsa: | | | | | | | | | | | | | | | | | | | | | | |
Net investment incomeb | | | 0.07 | | | | 0.28 | | | | 0.27 | | | | 0.26 | | | | 0.29 | | | 0.43c |
Net realized and unrealized gains (losses) | | | (1.13 | ) | | | 1.03 | | | | 2.21 | | | | (0.17 | ) | | | (2.35 | ) | | 2.75 |
| | | | | | |
Total from investment operations | | | (1.06 | ) | | | 1.31 | | | | 2.48 | | | | 0.09 | | | | (2.06 | ) | | 3.18 |
| | | | | | |
Less distributions from: | | | | | | | | | | | | | | | | | | | | | | |
Net investment income | | | (0.67 | ) | | | (0.02 | ) | | | (0.57 | ) | | | (0.28 | ) | | | (0.52 | ) | | (0.19) |
Net realized gains | | | (1.93 | ) | | | (0.99 | ) | | | (0.44 | ) | | | (0.85 | ) | | | (1.09 | ) | | (0.83) |
| | | | | | |
Total distributions | | | (2.60 | ) | | | (1.01 | ) | | | (1.01 | ) | | | (1.13 | ) | | | (1.61 | ) | | (1.02) |
| | | | | | |
Net asset value, end of period | | | $13.58 | | | | $17.24 | | | | $16.94 | | | | $15.47 | | | | $16.51 | | | $20.18 |
| | | | | | |
Total returnd | | | (4.45)% | | | | 7.81% | | | | 16.45% | | | | 0.84% | | | | (10.59)% | | | 17.96% |
| | | | | | |
Ratios to average net assetse | | | | | | | | | | | | | | | | | | | | | | |
Expenses | | | 1.04% | f | | | 1.04% | g | | | 1.06% | f,g | | | 1.07% | f | | | 1.06% | f | | 1.05% |
Net investment income | | | 0.91% | | | | 1.64% | | | | 1.63% | | | | 1.73% | | | | 1.61% | | | 2.20%c |
| | | | | | |
Supplemental data | | | | | | | | | | | | | | | | | | | | | | |
Net assets, end of period (000’s) | | | $3,563,476 | | | | $3,973,648 | | | | $4,240,117 | | | | $4,195,518 | | | | $4,791,792 | | | $5,917,398 |
Portfolio turnover rate | | | 11.19% | | | | 28.39% | | | | 31.46% | | | | 21.62% | | | | 15.73% | | | 18.56% |
aThe amount shown for a share outstanding throughout the period may not correlate with the Statement of Operations for the period due to the timing of sales and repurchases of the Fund’s shares in relation to income earned and/or fluctuating fair value of the investments of the Fund.
bBased on average daily shares outstanding.
cNet investment income per share includes approximately $0.18 per share related to income received in the form of special dividends in connection with certain Fund holdings. Excluding this amount, the ratio of net investment income to average net assets would have been 1.30%.
dTotal return does not reflect sales commissions or contingent deferred sales charges, if applicable, and is not annualized for periods less than one year.
eRatios are annualized for periods less than one year.
fBenefit of waiver and payments by affiliates rounds to less than 0.01%.
gBenefit of expense reduction rounds to less than 0.01%.
| | | | |
| | | |
10 | | Semiannual Report | The accompanying notes are an integral part of these financial statements. | | franklintempleton.com |
TEMPLETON FUNDS
FINANCIAL HIGHLIGHTS
Templeton World Fund(continued)
| | | | | | | | | | | | | | | | | | | | | | |
| | | Six Months Ended
February 28, 2019 | | | Year Ended August 31, |
| | | (unaudited) | | | 2018 | | | 2017 | | | 2016 | | | 2015 | | | 2014 |
| | | | | | |
Class C | | | | | | | | | | | | | | | | | | | | | | |
Per share operating performance | | | | | | | | | | | | | | | | | | | | | | |
(for a share outstanding throughout the period) | | | | | | | | | | | | | | | | | | | | | | |
Net asset value, beginning of period | | | $16.35 | | | | $16.21 | | | | $14.84 | | | | $15.86 | | | | $19.44 | | | $17.40 |
| | | | | | |
Income from investment operationsa: | | | | | | | | | | | | | | | | | | | | | | |
Net investment incomeb | | | — | c | | | 0.14 | | | | 0.14 | | | | 0.14 | | | | 0.15 | | | 0.27d |
Net realized and unrealized gains (losses) | | | (1.05 | ) | | | 0.99 | | | | 2.12 | | | | (0.16 | ) | | | (2.26 | ) | | 2.66 |
| | | | | | |
Total from investment operations | | | (1.05 | ) | | | 1.13 | | | | 2.26 | | | | (0.02 | ) | | | (2.11 | ) | | 2.93 |
| | | | | | |
Less distributions from: | | | | | | | | | | | | | | | | | | | | | | |
Net investment income | | | (0.28 | ) | | | — | | | | (0.45 | ) | | | (0.15 | ) | | | (0.38 | ) | | (0.06) |
Net realized gains | | | (1.93 | ) | | | (0.99 | ) | | | (0.44 | ) | | | (0.85 | ) | | | (1.09 | ) | | (0.83) |
| | | | | | |
Total distributions | | | (2.21 | ) | | | (0.99 | ) | | | (0.89 | ) | | | (1.00 | ) | | | (1.47 | ) | | (0.89) |
| | | | | | |
Net asset value, end of period | | | $13.09 | | | | $16.35 | | | | $16.21 | | | | $14.84 | | | | $15.86 | | | $19.44 |
| | | | | | |
Total returne | | | (4.84)% | | | | 7.01% | | | | 15.59% | | | | 0.11% | | | | (11.27)% | | | 17.08% |
| | | | | | |
Ratios to average net assetsf | | | | | | | | | | | | | | | | | | | | | | |
Expenses | | | 1.80% | g | | | 1.80% | h | | | 1.81% | g,h | | | 1.82% | g | | | 1.81% | g | | 1.80% |
Net investment income | | | 0.15% | | | | 0.88% | | | | 0.88% | | | | 0.98% | | | | 0.86% | | | 1.45%d |
| | | | | | |
Supplemental data | | | | | | | | | | | | | | | | | | | | | | |
Net assets, end of period (000’s) | | | $38,669 | | | | $117,879 | | | | $138,534 | | | | $158,126 | | | | $193,309 | | | $241,635 |
Portfolio turnover rate | | | 11.19% | | | | 28.39% | | | | 31.46% | | | | 21.62% | | | | 15.73% | | | 18.56% |
aThe amount shown for a share outstanding throughout the period may not correlate with the Statement of Operations for the period due to the timing of sales and repurchases of the Fund’s shares in relation to income earned and/or fluctuating fair value of the investments of the Fund.
bBased on average daily shares outstanding.
cAmount rounds to less than $0.01 per share.
dNet investment income per share includes approximately $0.18 per share related to income received in the form of special dividends in connection with certain Fund holdings. Excluding this amount, the ratio of net investment income to average net assets would have been 0.55%.
eTotal return does not reflect sales commissions or contingent deferred sales charges, if applicable, and is not annualized for periods less than one year.
fRatios are annualized for periods less than one year.
gBenefit of waiver and payments by affiliates rounds to less than 0.01%.
hBenefit of expense reduction rounds to less than 0.01%.
| | | | |
| | | |
| franklintempleton.com | | The accompanying notes are an integral part of these financial statements. | Semiannual Report | | 11 |
TEMPLETON FUNDS
FINANCIAL HIGHLIGHTS
Templeton World Fund(continued)
| | | | | | | | | | | | | | | | | | | | | | |
| | | Six Months Ended
February 28, 2019 | | | Year Ended August 31, |
| | | (unaudited) | | | 2018 | | | 2017 | | | 2016 | | | 2015 | | | 2014 |
| | | | | | |
Class R6 | | | | | | | | | | | | | | | | | | | | | | |
Per share operating performance | | | | | | | | | | | | | | | | | | | | | | |
(for a share outstanding throughout the period) | | | | | | | | | | | | | | | | | | | | | | |
Net asset value, beginning of period | | | $17.21 | | | | $16.92 | | | | $15.45 | | | | $16.50 | | | | $20.18 | | | $18.02 |
| | | | | | |
Income from investment operationsa: | | | | | | | | | | | | | | | | | | | | | | |
Net investment incomeb | | | 0.09 | | | | 0.33 | | | | 0.32 | | | | 0.32 | | | | 0.35 | | | 0.57c |
Net realized and unrealized gains (losses) | | | (1.13 | ) | | | 1.03 | | | | 2.22 | | | | (0.18 | ) | | | (2.35 | ) | | 2.67 |
| | | | | | |
Total from investment operations | | | (1.04 | ) | | | 1.36 | | | | 2.54 | | | | 0.14 | | | | (2.00 | ) | | 3.24 |
| | | | | | |
Less distributions from: | | | | | | | | | | | | | | | | | | | | | | |
Net investment income | | | (0.72 | ) | | | (0.08 | ) | | | (0.63 | ) | | | (0.34 | ) | | | (0.59 | ) | | (0.25) |
Net realized gains | | | (1.93 | ) | | | (0.99 | ) | | | (0.44 | ) | | | (0.85 | ) | | | (1.09 | ) | | (0.83) |
| | | | | | |
Total distributions | | | (2.65 | ) | | | (1.07 | ) | | | (1.07 | ) | | | (1.19 | ) | | | (1.68 | ) | | (1.08) |
| | | | | | |
Net asset value, end of period | | | $13.52 | | | | $17.21 | | | | $16.92 | | | | $15.45 | | | | $16.50 | | | $20.18 |
| | | | | | |
Total returnd | | | (4.29)% | | | | 8.13% | | | | 16.87% | | | | 1.18% | | | | (10.30)% | | | 18.40% |
| | | | | | |
Ratios to average net assetse | | | | | | | | | | | | | | | | | | | | | | |
| | | | | | |
Expenses before waiver and payments by affiliates and expense reduction | | | 0.77% | | | | 0.74% | | | | 0.73% | | | | 0.72% | | | | 0.72% | | | 0.72% |
Expenses net of waiver and payments by affiliates and expense reduction | | | 0.74% | | | | 0.72% | f | | | 0.73% | f,g | | | 0.72% | g | | | 0.72% | g | | 0.72% |
Net investment income | | | 1.21% | | | | 1.96% | | | | 1.96% | | | | 2.08% | | | | 1.95% | | | 2.53%c |
| | | | | | |
Supplemental data | | | | | | | | | | | | | | | | | | | | | | |
Net assets, end of period (000’s) | | | $52,606 | | | | $51,431 | | | | $55,504 | | | | $50,487 | | | | $51,733 | | | $55,175 |
Portfolio turnover rate | | | 11.19% | | | | 28.39% | | | | 31.46% | | | | 21.62% | | | | 15.73% | | | 18.56% |
aThe amount shown for a share outstanding throughout the period may not correlate with the Statement of Operations for the period due to the timing of sales and repurchases of the Fund’s shares in relation to income earned and/or fluctuating fair value of the investments of the Fund.
bBased on average daily shares outstanding.
cNet investment income per share includes approximately $0.18 per share related to income received in the form of special dividends in connection with certain Fund holdings. Excluding this amount, the ration of net investment income to average net assets would have been 1.63%.
dTotal return is not annualized for periods less than one year.
eRatios are annualized for periods less than one year.
fBenefit of expense reduction rounds to less than 0.01%.
gBenefit of waiver and payments by affiliates rounds to less than 0.01%.
| | | | |
| | | |
12 | | Semiannual Report | The accompanying notes are an integral part of these financial statements. | | franklintempleton.com |
TEMPLETON FUNDS
FINANCIAL HIGHLIGHTS
Templeton World Fund(continued)
| | | | | | | | | | | | | | | | | | | | | | |
| | | Six Months Ended
February 28, 2019 | | | Year Ended August 31, |
| | | (unaudited) | | | 2018 | | | 2017 | | | 2016 | | | 2015 | | | 2014 |
| | | | | | |
Advisor Class | | | | | | | | | | | | | | | | | | | | | | |
Per share operating performance | | | | | | | | | | | | | | | | | | | | | | |
(for a share outstanding throughout the period) | | | | | | | | | | | | | | | | | | | | | | |
Net asset value, beginning of period | | | $17.23 | | | | $16.93 | | | | $15.46 | | | | $16.50 | | | | $20.18 | | | $18.01 |
| | | | | | |
Income from investment operationsa: | | | | | | | | | | | | | | | | | | | | | | |
Net investment incomeb | | | 0.09 | | | | 0.32 | | | | 0.32 | | | | 0.30 | | | | 0.33 | | | 0.48c |
Net realized and unrealized gains (losses) | | | (1.13 | ) | | | 1.03 | | | | 2.20 | | | | (0.17 | ) | | | (2.35 | ) | | 2.75 |
| | | | | | |
Total from investment operations | | | (1.04 | ) | | | 1.35 | | | | 2.52 | | | | 0.13 | | | | (2.02 | ) | | 3.23 |
| | | | | | |
Less distributions from: | | | | | | | | | | | | | | | | | | | | | | |
Net investment income | | | (0.72 | ) | | | (0.06 | ) | | | (0.61 | ) | | | (0.32 | ) | | | (0.57 | ) | | (0.23) |
Net realized gains | | | (1.93 | ) | | | (0.99 | ) | | | (0.44 | ) | | | (0.85 | ) | | | (1.09 | ) | | (0.83) |
| | | | | | |
Total distributions | | | (2.65 | ) | | | (1.05 | ) | | | (1.05 | ) | | | (1.17 | ) | | | (1.66 | ) | | (1.06) |
| | | | | | |
Net asset value, end of period | | | $13.54 | | | | $17.23 | | | | $16.93 | | | | $15.46 | | | | $16.50 | | | $20.18 |
| | | | | | |
Total returnd | | | (4.34)% | | | | 8.09% | | | | 16.74% | | | | 1.12% | | | | (10.38)% | | | 18.29% |
| | | | | | |
Ratios to average net assetse | | | | | | | | | | | | | | | | | | | | | | |
Expenses | | | 0.80% | f | | | 0.80% | g | | | 0.81% | f,g | | | 0.82% | f | | | 0.81% | f | | 0.80% |
Net investment income | | | 1.15% | | | | 1.88% | | | | 1.88% | | | | 1.98% | | | | 1.86% | | | 2.45%c |
| | | | | | |
Supplemental data | | | | | | | | | | | | | | | | | | | | | | |
Net assets, end of period (000’s) | | | $131,201 | | | | $146,883 | | | | $157,237 | | | | $113,455 | | | | $181,661 | | | $273,478 |
Portfolio turnover rate | | | 11.19% | | | | 28.39% | | | | 31.46% | | | | 21.62% | | | | 15.73% | | | 18.56% |
aThe amount shown for a share outstanding throughout the period may not correlate with the Statement of Operations for the period due to the timing of sales and repurchases of the Fund’s shares in relation to income earned and/or fluctuating fair value of the investments of the Fund.
bBased on average daily shares outstanding.
cNet investment income per share includes approximately $0.18 per share related to income received in the form of special dividends in connection with certain Fund holdings. Excluding this amount, the ratio of net investment income to average net assets would have been 1.55%.
dTotal return is not annualized for periods less than one year.
eRatios are annualized for periods less than one year.
fBenefit of waiver and payments by affiliates rounds to less than 0.01%.
gBenefit of expense reduction rounds to less than 0.01%.
| | | | |
| | | |
| franklintempleton.com | | The accompanying notes are an integral part of these financial statements. | Semiannual Report | | 13 |
TEMPLETON FUNDS
Statement of Investments, February 28, 2019 (unaudited)
Templeton World Fund
| | | | | | | | | | |
| | | Industry | | Shares | | | Value | |
Common Stocks 97.1% | | | | | | | | | | |
Canada 2.0% | | | | | | | | | | |
Husky Energy Inc. | | Oil, Gas & Consumable Fuels | | | 2,394,910 | | | $ | 26,628,312 | |
Wheaton Precious Metals Corp. | | Metals & Mining | | | 2,305,185 | | | | 50,140,139 | |
| | | |
| | | | | | | | | 76,768,451 | |
China 6.2% | | | | | | | | | | |
aBaidu Inc., ADR | | Interactive Media & Services | | | 299,800 | | | | 48,729,492 | |
China Life Insurance Co. Ltd., H | | Insurance | | | 15,950,000 | | | | 43,889,296 | |
China Mobile Ltd. | | Wireless Telecommunication Services | | | 3,965,970 | | | | 41,732,427 | |
China Telecom Corp. Ltd., H | | Diversified Telecommunication Services | | | 89,898,540 | | | | 48,672,735 | |
Kunlun Energy Co. Ltd. | | Oil, Gas & Consumable Fuels | | | 46,951,930 | | | | 51,559,048 | |
| | | |
| | | | | | | | | 234,582,998 | |
Denmark 2.3% | | | | | | | | | | |
A.P. Moeller-Maersk AS, B | | Marine | | | 29,530 | | | | 39,791,656 | |
Vestas Wind Systems AS | | Electrical Equipment | | | 550,002 | | | | 45,775,512 | |
| | | |
| | | | | | | | | 85,567,168 | |
France 6.2% | | | | | | | | | | |
BNP Paribas SA | | Banks | | | 1,298,690 | | | | 66,555,020 | |
Compagnie de Saint-Gobain | | Building Products | | | 634,910 | | | | 22,864,168 | |
Credit Agricole SA | | Banks | | | 1,616,380 | | | | 20,650,610 | |
Sanofi | | Pharmaceuticals | | | 762,310 | | | | 63,731,081 | |
Veolia Environnement SA | | Multi-Utilities | | | 2,804,120 | | | | 61,558,245 | |
| | | |
| | | | | | | | | 235,359,124 | |
Germany 5.7% | | | | | | | | | | |
Bayer AG | | Pharmaceuticals | | | 823,040 | | | | 65,793,808 | |
E.ON SE | | Multi-Utilities | | | 4,004,370 | | | | 44,112,955 | |
Merck KGaA | | Pharmaceuticals | | | 510,255 | | | | 52,687,765 | |
Siemens AG | | Industrial Conglomerates | | | 503,480 | | | | 55,052,049 | |
| | | |
| | | | | | | | | 217,646,577 | |
Hong Kong 1.4% | | | | | | | | | | |
CK Hutchison Holdings Ltd. | | Industrial Conglomerates | | | 4,827,560 | | | | 51,382,864 | |
India 1.7% | | | | | | | | | | |
Bharti Airtel Ltd. | | Wireless Telecommunication Services | | | 9,220,920 | | | | 41,399,119 | |
Hero Motocorp Ltd. | | Automobiles | | | 676,490 | | | | 25,097,168 | |
| | | |
| | | | | | | | | 66,496,287 | |
Ireland 0.5% | | | | | | | | | | |
Bank of Ireland Group PLC | | Banks | | | 2,683,980 | | | | 17,447,284 | |
Israel 1.5% | | | | | | | | | | |
aTeva Pharmaceutical Industries Ltd., ADR | | Pharmaceuticals | | | 3,487,534 | | | | 58,695,197 | |
Italy 2.2% | | | | | | | | | | |
Eni SpA | | Oil, Gas & Consumable Fuels | | | 4,781,374 | | | | 82,481,413 | |
Japan 6.9% | | | | | | | | | | |
Mitsui Fudosan Co. Ltd. | | Real Estate Management & Development | | | 1,763,640 | | | | 41,738,979 | |
Panasonic Corp. | | Household Durables | | | 4,897,240 | | | | 45,041,689 | |
Seven & i Holdings Co. Ltd. | | Food & Staples Retailing | | | 764,900 | | | | 33,589,848 | |
Sumitomo Mitsui Financial Group Inc. | | Banks | | | 522,680 | | | | 18,488,084 | |
Suntory Beverage & Food Ltd. | | Beverages | | | 774,410 | | | | 34,118,651 | |
Taiheiyo Cement Corp. | | Construction Materials | | | 637,000 | | | | 21,748,710 | |
Takeda Pharmaceutical Co. Ltd. | | Pharmaceuticals | | | 1,668,230 | | | | 66,896,854 | |
| | | |
| | | | | | | | | 261,622,815 | |
| | | | |
| | | |
14 | | Semiannual Report | | franklintempleton.com |
TEMPLETON FUNDS
STATEMENT OF INVESTMENTS (UNAUDITED)
| | | | | | | | | | |
| Templeton World Fund(continued) | |
| | | Industry | | Shares | | | Value | |
| | | |
Common Stocks(continued) | | | | | | | | | | |
Luxembourg 2.3% | | | | | | | | | | |
SES SA, IDR | | Media | | | 4,255,256 | | | | $ 85,501,092 | |
Netherlands 3.0% | | | | | | | | | | |
Aegon NV | | Insurance | | | 7,603,232 | | | | 40,889,146 | |
Akzo Nobel NV | | Chemicals | | | 47,780 | | | | 4,333,115 | |
ING Groep NV | | Banks | | | 5,200,322 | | | | 68,804,518 | |
| | | |
| | | | | | | | | 114,026,779 | |
Singapore 2.1% | | | | | | | | | | |
Singapore Telecommunications Ltd. | | Diversified Telecommunication Services | | | 35,154,451 | | | | 78,522,571 | |
South Korea 4.0% | | | | | | | | | | |
Hana Financial Group Inc. | | Banks | | | 774,787 | | | | 26,735,540 | |
KB Financial Group Inc. | | Banks | | | 1,099,016 | | | | 43,292,558 | |
Samsung Electronics Co. Ltd. | | Technology Hardware, Storage & Peripherals | | | 2,040,400 | | | | 81,734,887 | |
| | | |
| | | | | | | | | 151,762,985 | |
Spain 0.5% | | | | | | | | | | |
Telefonica SA | | Diversified Telecommunication Services | | | 2,208,510 | | | | 19,064,098 | |
Switzerland 3.9% | | | | | | | | | | |
Novartis AG | | Pharmaceuticals | | | 142,820 | | | | 13,026,432 | |
Roche Holding AG | | Pharmaceuticals | | | 315,502 | | | | 87,650,858 | |
UBS Group AG | | Capital Markets | | | 3,625,320 | | | | 46,126,899 | |
| | | |
| | | | | | | | | 146,804,189 | |
Thailand 1.5% | | | | | | | | | | |
Bangkok Bank PCL, fgn | | Banks | | | 8,609,670 | | | | 58,333,683 | |
United Kingdom 9.8% | | | | | | | | | | |
BP PLC | | Oil, Gas & Consumable Fuels | | | 11,860,416 | | | | 84,057,290 | |
HSBC Holdings PLC | | Banks | | | 5,903,390 | | | | 47,984,405 | |
Kingfisher PLC | | Specialty Retail | | | 14,264,670 | | | | 45,800,006 | |
Man Group PLC | | Capital Markets | | | 6,562,461 | | | | 12,023,382 | |
Royal Dutch Shell PLC, B | | Oil, Gas & Consumable Fuels | | | 2,826,457 | | | | 88,632,034 | |
Standard Chartered PLC | | Banks | | | 6,246,036 | | | | 49,833,492 | |
Vodafone Group PLC | | Wireless Telecommunication Services | | | 23,273,525 | | | | 41,445,989 | |
| | | |
| | | | | | | | | 369,776,598 | |
United States 33.4% | | | | | | | | | | |
Advance Auto Parts Inc. | | Specialty Retail | | | 107,930 | | | | 17,460,915 | |
Allergan PLC | | Pharmaceuticals | | | 480,810 | | | | 66,212,345 | |
aAlphabet Inc., A | | Interactive Media & Services | | | 29,510 | | | | 33,244,490 | |
AmerisourceBergen Corp. | | Health Care Providers & Services | | | 561,740 | | | | 46,792,942 | |
Amgen Inc. | | Biotechnology | | | 74,211 | | | | 14,106,027 | |
Apache Corp. | | Oil, Gas & Consumable Fuels | | | 1,707,120 | | | | 56,642,242 | |
Capital One Financial Corp. | | Consumer Finance | | | 626,450 | | | | 52,358,691 | |
Cardinal Health Inc. | | Health Care Providers & Services | | | 690,340 | | | | 37,513,076 | |
aCelgene Corp. | | Biotechnology | | | 313,910 | | | | 26,092,199 | |
Citigroup Inc. | | Banks | | | 1,402,610 | | | | 89,738,988 | |
Comcast Corp., A | | Media | | | 1,514,448 | | | | 58,563,704 | |
aCommScope Holding Co. Inc. | | Communications Equipment | | | 1,414,050 | | | | 32,961,506 | |
Coty Inc., A | | Personal Products | | | 5,290,970 | | | | 58,200,670 | |
Eli Lilly & Co. | | Pharmaceuticals | | | 253,670 | | | | 32,035,984 | |
Exxon Mobil Corp. | | Oil, Gas & Consumable Fuels | | | 767,250 | | | | 60,635,767 | |
Gilead Sciences Inc. | | Biotechnology | | | 955,550 | | | | 62,129,861 | |
Kellogg Co. | | Food Products | | | 1,326,730 | | | | 74,641,830 | |
| | | | |
| | | |
| franklintempleton.com | | Semiannual Report | | 15 |
TEMPLETON FUNDS
STATEMENT OF INVESTMENTS (UNAUDITED)
| | | | | | | | | | |
| Templeton World Fund(continued) | |
| | | Industry | | Shares | | | Value | |
| | | |
Common Stocks(continued) | | | | | | | | | | |
United States(continued) | | | | | | | | | | |
aKnowles Corp. | | Electronic Equipment, Instruments & Components | | | 1,985,470 | | | $ | 32,323,452 | |
The Kroger Co. | | Food & Staples Retailing | | | 1,814,080 | | | | 53,206,966 | |
aMattel Inc. | | Leisure Products | | | 2,864,840 | | | | 41,310,993 | |
aNavistar International Corp. | | Machinery | | | 1,114,980 | | | | 42,781,783 | |
Oracle Corp. | | Software | | | 1,718,791 | | | | 89,600,575 | |
Perrigo Co. PLC | | Pharmaceuticals | | | 525,830 | | | | 25,607,921 | |
United Parcel Service Inc., B | | Air Freight & Logistics | | | 512,170 | | | | 56,441,134 | |
Walgreens Boots Alliance Inc. | | Food & Staples Retailing | | | 1,001,470 | | | | 71,294,649 | |
Wells Fargo & Co. | | Banks | | | 692,470 | | | | 34,547,328 | |
| | | |
| | | | | | | | | 1,266,446,038 | |
| | | |
Total Common Stocks (Cost $3,559,587,359) | | | | | | | | | 3,678,288,211 | |
| | | | | Principal
Amount | | | | |
Short Term Investments (Cost $29,000,000) 0.8% | | | | | | | | |
| | | |
Time Deposits 0.8% | | | | | | | | | | |
| | | |
United States 0.8% | | | | | | | | | | |
Royal Bank of Canada, 2.35%, 3/01/19 | | | | $ | 29,000,000 | | | | 29,000,000 | |
| | | | | | | | | | |
| | | |
Total Investments (Cost $3,588,587,359) 97.9% | | | | | | | | | 3,707,288,211 | |
Other Assets, less Liabilities 2.1% | | | | | | | | | 78,663,766 | |
| | | | | | | | | | |
| | | |
Net Assets 100.0% | | | | | | | | | $3,785,951,977 | |
| | | | | | | | | | |
aNon-income producing.
| | | | |
| | | |
16 | | �� Semiannual Report | | franklintempleton.com |
TEMPLETON FUNDS
STATEMENT OF INVESTMENTS (UNAUDITED)
Templeton World Fund(continued)
At February 28, 2019, the Fund had the following forward exchange contracts outstanding. See Note 1(c).
Forward Exchange Contracts
| | | | | | | | | | | | | | | | | | | | | | | | | | | | |
| Currency | | Counterpartya | | | Type | | | Quantity | | | Contract
Amount | | | Settlement
Date | | | Unrealized
Appreciation | | | Unrealized
Depreciation | |
| |
OTC Forward Exchange Contracts | | | | | | | | | | | | | | | | | | | | | | | | | | | | |
British Pound | | | BOFA | | | | Sell | | | | 55,603,493 | | | $ | 71,146,337 | | | | 4/11/19 | | | $ | — | | | $ | (2,761,679 | ) |
British Pound | | | GSCO | | | | Sell | | | | 55,592,504 | | | | 71,103,369 | | | | 4/11/19 | | | | — | | | | (2,790,041 | ) |
British Pound | | | HSBK | | | | Sell | | | | 55,599,927 | | | | 71,134,936 | | | | 4/11/19 | | | | — | | | | (2,768,341 | ) |
British Pound | | | MSCO | | | | Sell | | | | 55,601,718 | | | | 71,117,377 | | | | 4/11/19 | | | | — | | | | (2,788,280 | ) |
British Pound | | | UBSW | | | | Sell | | | | 55,599,694 | | | | 71,137,584 | | | | 4/11/19 | | | | — | | | | (2,765,382 | ) |
Canadian Dollar | | | BOFA | | | | Sell | | | | 20,403,726 | | | | 15,445,880 | | | | 4/11/19 | | | | — | | | | (76,845 | ) |
Canadian Dollar | | | GSCO | | | | Sell | | | | 20,405,139 | | | | 15,443,879 | | | | 4/11/19 | | | | — | | | | (79,920 | ) |
Canadian Dollar | | | HSBK | | | | Sell | | | | 20,404,267 | | | | 15,444,911 | | | | 4/11/19 | | | | — | | | | (78,226 | ) |
Canadian Dollar | | | MSCO | | | | Sell | | | | 20,403,546 | | | | 15,452,640 | | | | 4/11/19 | | | | — | | | | (69,947 | ) |
Canadian Dollar | | | UBSW | | | | Sell | | | | 20,401,611 | | | | 15,441,165 | | | | 4/11/19 | | | | — | | | | (79,951 | ) |
Danish Krone | | | BOFA | | | | Buy | | | | 4,024,804 | | | | 614,078 | | | | 4/11/19 | | | | 1,851 | | | | — | |
Danish Krone | | | BOFA | | | | Buy | | | | 7,052,854 | | | | 1,079,961 | | | | 4/11/19 | | | | — | | | | (639 | ) |
Danish Krone | | | BOFA | | | | Sell | | | | 11,570,000 | | | | 1,755,427 | | | | 4/11/19 | | | | — | | | | (15,168 | ) |
Danish Krone | | | BOFA | | | | Sell | | | | 112,268,991 | | | | 17,372,351 | | | | 4/11/19 | | | | 191,461 | | | | — | |
Danish Krone | | | GSCO | | | | Buy | | | | 4,024,804 | | | | 614,097 | | | | 4/11/19 | | | | 1,832 | | | | — | |
Danish Krone | | | GSCO | | | | Buy | | | | 8,052,854 | | | | 1,233,084 | | | | 4/11/19 | | | | — | | | | (730 | ) |
Danish Krone | | | GSCO | | | | Sell | | | | 11,570,000 | | | | 1,755,850 | | | | 4/11/19 | | | | — | | | | (14,745 | ) |
Danish Krone | | | GSCO | | | | Sell | | | | 112,235,584 | | | | 17,365,059 | | | | 4/11/19 | | | | 189,281 | | | | — | |
Danish Krone | | | HSBK | | | | Buy | | | | 4,024,804 | | | | 614,063 | | | | 4/11/19 | | | | 1,866 | | | | — | |
Danish Krone | | | HSBK | | | | Buy | | | | 7,052,854 | | | | 1,079,956 | | | | 4/11/19 | | | | — | | | | (635 | ) |
Danish Krone | | | HSBK | | | | Sell | | | | 11,570,000 | | | | 1,755,568 | | | | 4/11/19 | | | | — | | | | (15,027 | ) |
Danish Krone | | | HSBK | | | | Sell | | | | 112,242,087 | | | | 17,365,313 | | | | 4/11/19 | | | | 188,540 | | | | — | |
Danish Krone | | | MSCO | | | | Buy | | | | 4,024,804 | | | | 614,078 | | | | 4/11/19 | | | | 1,851 | | | | — | |
Danish Krone | | | MSCO | | | | Buy | | | | 7,052,854 | | | | 1,079,983 | | | | 4/11/19 | | | | — | | | | (662 | ) |
Danish Krone | | | MSCO | | | | Sell | | | | 11,570,000 | | | | 1,756,001 | | | | 4/11/19 | | | | — | | | | (14,594 | ) |
Danish Krone | | | MSCO | | | | Sell | | | | 112,244,157 | | | | 17,368,669 | | | | 4/11/19 | | | | 191,579 | | | | — | |
Danish Krone | | | UBSW | | | | Buy | | | | 4,024,804 | | | | 614,060 | | | | 4/11/19 | | | | 1,869 | | | | — | |
Danish Krone | | | UBSW | | | | Buy | | | | 7,052,854 | | | | 1,079,952 | | | | 4/11/19 | | | | — | | | | (631 | ) |
Danish Krone | | | UBSW | | | | Sell | | | | 11,570,000 | | | | 1,755,866 | | | | 4/11/19 | | | | — | | | | (14,729 | ) |
Danish Krone | | | UBSW | | | | Sell | | | | 112,285,762 | | | | 17,370,484 | | | | 4/11/19 | | | | 187,027 | | | | — | |
Euro | | | BOFA | | | | Sell | | | | 129,734,649 | | | | 149,799,409 | | | | 4/11/19 | | | | 1,689,265 | | | | — | |
Euro | | | GSCO | | | | Sell | | | | 129,744,618 | | | | 149,819,354 | | | | 4/11/19 | | | | 1,697,829 | | | | — | |
Euro | | | HSBK | | | | Sell | | | | 129,727,472 | | | | 149,784,377 | | | | 4/11/19 | | | | 1,682,426 | | | | — | |
Euro | | | MSCO | | | | Sell | | | | 129,722,016 | | | | 149,796,497 | | | | 4/11/19 | | | | 1,700,776 | | | | — | |
Euro | | | UBSW | | | | Sell | | | | 129,723,268 | | | | 149,774,594 | | | | 4/11/19 | | | | 1,677,442 | | | | — | |
Hong Kong Dollar | | | BOFA | | | | Sell | | | | 367,262,890 | | | | 46,980,617 | | | | 4/11/19 | | | | 126,418 | | | | — | |
Hong Kong Dollar | | | GSCO | | | | Sell | | | | 367,257,023 | | | | 46,978,790 | | | | 4/11/19 | | | | 125,340 | | | | — | |
Hong Kong Dollar | | | HSBK | | | | Sell | | | | 367,240,941 | | | | 46,977,960 | | | | 4/11/19 | | | | 126,561 | | | | — | |
Hong Kong Dollar | | | MSCO | | | | Sell | | | | 367,273,846 | | | | 46,979,894 | | | | 4/11/19 | | | | 124,298 | | | | — | |
Hong Kong Dollar | | | UBSW | | | | Sell | | | | 367,251,387 | | | | 46,978,416 | | | | 4/11/19 | | | | 125,685 | | | | — | |
Japanese Yen | | | BOFA | | | | Sell | | | | 5,501,806,325 | | | | 50,925,109 | | | | 4/11/19 | | | | 1,383,049 | | | | — | |
Japanese Yen | | | GSCO | | | | Sell | | | | 5,501,964,355 | | | | 50,932,993 | | | | 4/11/19 | | | | 1,389,510 | | | | — | |
Japanese Yen | | | HSBK | | | | Sell | | | | 5,501,592,184 | | | | 50,925,991 | | | | 4/11/19 | | | | 1,385,859 | | | | — | |
Japanese Yen | | | MSCO | | | | Sell | | | | 5,501,478,055 | | | | 50,926,087 | | | | 4/11/19 | | | | 1,386,982 | | | | — | |
Japanese Yen | | | UBSW | | | | Sell | | | | 5,501,277,192 | | | | 50,908,188 | | | | 4/11/19 | | | | 1,370,893 | | | | — | |
Singapore Dollar | | | BOFA | | | | Sell | | | | 20,248,142 | | | | 14,963,598 | | | | 4/11/19 | | | | — | | | | (22,960 | ) |
Singapore Dollar | | | GSCO | | | | Sell | | | | 20,251,961 | | | | 14,965,978 | | | | 4/11/19 | | | | — | | | | (23,407 | ) |
Singapore Dollar | | | HSBK | | | | Sell | | | | 20,244,902 | | | | 14,962,973 | | | | 4/11/19 | | | | — | | | | (21,187 | ) |
| | | | |
| | | |
| franklintempleton.com | | Semiannual Report | | 17 |
TEMPLETON FUNDS
STATEMENT OF INVESTMENTS (UNAUDITED)
Templeton World Fund(continued)
Forward Exchange Contracts(continued)
| | | | | | | | | | | | | | | | | | | | | | | | | | | | |
| Currency | | Counterpartya | | | Type | | | Quantity | | | Contract
Amount | | | Settlement
Date | | | Unrealized
Appreciation | | Unrealized
Depreciation | |
| |
OTC Forward Exchange Contracts(continued) | | | | | | | | | | | | | | | | | | | | | | | | | | | | |
Singapore Dollar | | | MSCO | | | | Sell | | | | 20,249,649 | | | $ | 14,964,822 | | | | 4/11/19 | | | $ | — | | | $ | (22,851 | ) |
Singapore Dollar | | | UBSW | | | | Sell | | | | 20,248,093 | | | | 14,963,451 | | | | 4/11/19 | | | | — | | | | (23,071 | ) |
Swiss Franc | | | BOFA | | | | Sell | | | | 2,691,121 | | | | 2,701,370 | | | | 4/11/19 | | | | — | | | | (5,875 | ) |
Swiss Franc | | | BOFA | | | | Sell | | | | 28,713,016 | | | | 29,548,043 | | | | 4/11/19 | | | | 662,988 | | | | — | |
Swiss Franc | | | GSCO | | | | Sell | | | | 2,691,240 | | | | 2,701,370 | | | | 4/11/19 | | | | — | | | | (5,995 | ) |
Swiss Franc | | | GSCO | | | | Sell | | | | 28,730,188 | | | | 29,585,809 | | | | 4/11/19 | | | | 683,479 | | | | — | |
Swiss Franc | | | HSBK | | | | Sell | | | | 2,691,145 | | | | 2,701,370 | | | | 4/11/19 | | | | — | | | | (5,900 | ) |
Swiss Franc | | �� | HSBK | | | | Sell | | | | 28,706,959 | | | | 29,546,372 | | | | 4/11/19 | | | | 667,409 | | | | — | |
Swiss Franc | | | MSCO | | | | Sell | | | | 2,691,208 | | | | 2,701,370 | | | | 4/11/19 | | | | — | | | | (5,963 | ) |
Swiss Franc | | | MSCO | | | | Sell | | | | 28,706,114 | | | | 29,549,455 | | | | 4/11/19 | | | | 671,343 | | | | — | |
Swiss Franc | | | UBSW | | | | Sell | | | | 2,691,137 | | | | 2,701,370 | | | | 4/11/19 | | | | — | | | | (5,892 | ) |
Swiss Franc | | | UBSW | | | | Sell | | | | 28,711,988 | | | | 29,538,779 | | | | 4/11/19 | | | | 654,757 | | | | — | |
Thailand Baht | | | BOFA | | | | Sell | | | | 348,600,140 | | | | 10,927,904 | | | | 4/11/19 | | | | — | | | | (105,136 | ) |
Thailand Baht | | | GSCO | | | | Sell | | | | 348,716,782 | | | | 10,930,704 | | | | 4/11/19 | | | | — | | | | (106,027 | ) |
Thailand Baht | | | HSBK | | | | Sell | | | | 348,616,508 | | | | 10,927,732 | | | | 4/11/19 | | | | — | | | | (105,826 | ) |
Thailand Baht | | | MSCO | | | | Sell | | | | 348,545,781 | | | | 10,916,276 | | | | 4/11/19 | | | | — | | | | (115,043 | ) |
Thailand Baht | | | UBSW | | | | Sell | | | | 348,627,731 | | | | 10,927,399 | | | | 4/11/19 | | | | — | | | | (106,514 | ) |
South Korean Won | | | BOFA | | | | Sell | | | | 43,789,070,571 | | | | 39,068,290 | | | | 4/15/19 | | | | 109,465 | | | | — | |
South Korean Won | | | GSCO | | | | Sell | | | | 35,478,888,442 | | | | 31,648,832 | | | | 4/15/19 | | | | 83,516 | | | | — | |
South Korean Won | | | HSBK | | | | Sell | | | | 33,255,143,077 | | | | 29,692,281 | | | | 4/15/19 | | | | 105,416 | | | | — | |
South Korean Won | | | MSCO | | | | Sell | | | | 27,777,774,230 | | | | 24,788,370 | | | | 4/15/19 | | | | 74,681 | | | | — | |
South Korean Won | | | UBSW | | | | Sell | | | | 27,805,722,252 | | | | 24,813,797 | | | | 4/15/19 | | | | 75,243 | | | | — | |
| | | | | | | | | | | | | | | | | | | | | | | | |
Total Forward Exchange Contracts | | | | | | | | | | | | | | | | | | | | | | $ | 20,737,787 | | | $ | (15,017,819 | ) |
| | | | | | | | | | | | | | | | | | | | | | | | |
Net unrealized appreciation (depreciation) | | | | | | | | | | | | | | | | | | | $ | 5,719,968 | | | | | |
aMay be comprised of multiple contracts with the same counterparty, currency and settlement date.
See Abbreviations on page 32.
| | | | |
| | | |
18 | | Semiannual Report | The accompanying notes are an integral part of these financial statements. | | franklintempleton.com |
TEMPLETON FUNDS
Financial Statements
Statement of Assets and Liabilities
February 28, 2019 (unaudited)
Templeton World Fund
| | | | |
Assets: | | | | |
Investments in securities: | | | | |
Cost - Unaffiliated issuers | | | $3,588,587,359 | |
| | | | |
Value - Unaffiliated issuers | | | $3,707,288,211 | |
Cash | | | 218,479 | |
Restricted cash for OTC derivative contracts (Note 1d) | | | 1,030,000 | |
Foreign currency, at value (cost $477,174) | | | 477,174 | |
Receivables: | | | | |
Investment securities sold | | | 77,313,638 | |
Capital shares sold | | | 1,101,001 | |
Dividends | | | 15,432,659 | |
European Union tax reclaims | | | 238,733 | |
Unrealized appreciation on OTC forward exchange contracts | | | 20,737,787 | |
Other assets | | | 4,078 | |
| | | | |
Total assets | | | 3,823,841,760 | |
| | | | |
| |
Liabilities: | | | | |
Payables: | | | | |
Investment securities purchased | | | 15,434,408 | |
Capital shares redeemed | | | 3,173,358 | |
Management fees | | | 2,009,734 | |
Distribution fees | | | 694,622 | |
Transfer agent fees | | | 244,729 | |
Deposits from brokers for: | | | | |
OTC derivative contracts | | | 1,030,000 | |
Unrealized depreciation on OTC forward exchange contracts | | | 15,017,819 | |
Accrued expenses and other liabilities | | | 285,113 | |
| | | | |
Total liabilities | | | 37,889,783 | |
| | | | |
Net assets, at value | | | $3,785,951,977 | |
| | | | |
| |
Net assets consist of: | | | | |
Paid-in capital | | | $3,618,239,525 | |
Total distributable earnings (loss) | | | 167,712,452 | |
| | | | |
Net assets, at value | | | $3,785,951,977 | |
| | | | |
| | | | |
| | | |
| franklintempleton.com | | The accompanying notes are an integral part of these financial statements. | Semiannual Report | | 19 |
TEMPLETON FUNDS
FINANCIAL STATEMENTS
Statement of Assets and Liabilities(continued)
February 28, 2019 (unaudited)
Templeton World Fund
| | | | |
Class A: | | | | |
Net assets, at value | | | $3,563,475,555 | |
Shares outstanding | | | 262,428,455 | |
Net asset value per sharea | | | $13.58 | |
Maximum offering price per share (net asset value per share ÷ 94.50%) | | | $14.37 | |
Class C: | | | | |
Net assets, at value | | | $ 38,669,217 | |
Shares outstanding | | | 2,952,992 | |
Net asset value and maximum offering price per sharea | | | $13.09 | |
Class R6: | | | | |
Net assets, at value | | | $ 52,605,979 | |
Shares outstanding | | | 3,891,899 | |
Net asset value and maximum offering price per share | | | $13.52 | |
Advisor Class: | | | | |
Net assets, at value | | | $ 131,201,226 | |
Shares outstanding | | | 9,693,071 | |
Net asset value and maximum offering price per share | | | $13.54 | |
aRedemption price is equal to net asset value less contingent deferred sales charges, if applicable.
| | | | |
| | | |
20 | | Semiannual Report | The accompanying notes are an integral part of these financial statements. | | franklintempleton.com |
TEMPLETON FUNDS
FINANCIAL STATEMENTS
Statement of Operations
for the six months ended February 28, 2019 (unaudited)
Templeton World Fund
| | | | |
Investment income: | | | | |
Dividends: (net of foreign taxes)* | | | | |
Unaffiliated issuers | | $ | 35,610,431 | |
Interest: | | | | |
Unaffiliated issuers | | | 2,007,290 | |
Income from securities loaned: | | | | |
Unaffiliated issuers (net of fees and rebates) | | | 65,278 | |
Non-controlled affiliates (Note 3f) | | | 20,560 | |
Total investment income | | | 37,703,559 | |
Expenses: | | | | |
Management fees (Note 3a) | | | 13,452,323 | |
Distribution fees: (Note 3c) | | | | |
Class A | | | 4,375,291 | |
Class C | | | 302,069 | |
Transfer agent fees: (Note 3e) | | | | |
Class A | | | 1,364,755 | |
Class C | | | 22,687 | |
Class R6 | | | 12,382 | |
Advisor Class | | | 51,077 | |
Custodian fees (Note 4) | | | 157,822 | |
Reports to shareholders | | | 100,317 | |
Registration and filing fees | | | 56,163 | |
Professional fees | | | 71,385 | |
Trustees’ fees and expenses | | | 62,905 | |
Other | | | 50,150 | |
Total expenses | | | 20,079,326 | |
Expenses waived/paid by affiliates (Note 3f) | | | (10,230 | ) |
Net expenses | | | 20,069,096 | |
Net investment income | | | 17,634,463 | |
Realized and unrealized gains (losses): | | | | |
Net realized gain (loss) from: | | | | |
Investments: | | | | |
Unaffiliated issuers | | | 83,456,180 | |
Written options | | | 291,651 | |
Foreign currency transactions | | | (331,064 | ) |
Forward exchange contracts | | | 59,548,061 | |
Net realized gain (loss) | | | 142,964,828 | |
Net change in unrealized appreciation (depreciation) on: | | | | |
Investments: | | | | |
Unaffiliated issuers | | | (344,583,503 | ) |
Translation of other assets and liabilities denominated in foreign currencies | | | (117,958 | ) |
Forward exchange contracts | | | (21,217,282 | ) |
Written options | | | 1,827 | |
Net change in unrealized appreciation (depreciation) | | | (365,916,916 | ) |
Net realized and unrealized gain (loss) | | | (222,952,088 | ) |
Net increase (decrease) in net assets resulting from operations | | $ | (205,317,625 | ) |
| |
*Foreign taxes withheld on dividends | | $ | 1,932,349 | |
| | | | |
| | | |
| franklintempleton.com | | The accompanying notes are an integral part of these financial statements. | Semiannual Report | | 21 |
TEMPLETON FUNDS
FINANCIAL STATEMENTS
Statements of Changes in Net Assets
Templeton World Fund
| | | | | | | | |
| | | Six Months Ended
February 28, 2019
(unaudited) | | | Year Ended
August 31, 2018 | |
Increase (decrease) in net assets: | | | | | | | | |
Operations: | | | | | | | | |
Net investment income | | $ | 17,634,463 | | | $ | 73,481,792 | |
Net realized gain (loss) | | | 142,964,828 | | | | 482,663,769 | |
Net change in unrealized appreciation (depreciation) | | | (365,916,916 | ) | | | (215,400,246 | ) |
| | | | |
Net increase (decrease) in net assets resulting from operations | | | (205,317,625 | ) | | | 340,745,315 | |
| | | | |
Distributions to shareholders: (Note 1g) | | | | | | | | |
Class A | | | (588,075,824 | ) | | | (243,844,040 | ) |
Class C | | | (5,799,688 | ) | | | (7,980,686 | ) |
Class R6 | | | (8,222,620 | ) | | | (3,221,522 | ) |
Advisor Class | | | (22,790,327 | ) | | | (8,284,946 | ) |
| | | | |
Total distributions to shareholders | | | (624,888,459 | ) | | | (263,331,194 | ) |
| | | | |
Capital share transactions: (Note 2) | | | | | | | | |
Class A | | | 368,658,880 | | | | (338,750,270 | ) |
Class C | | | (68,632,799 | ) | | | (21,767,393 | ) |
Class R6 | | | 11,594,377 | | | | (5,089,145 | ) |
Advisor Class | | | 14,696,707 | | | | (13,357,466 | ) |
| | | | |
Total capital share transactions | | | 326,317,165 | | | | (378,964,274 | ) |
| | | | |
Net increase (decrease) in net assets | | | (503,888,919 | ) | | | (301,550,153 | ) |
Net assets: | | | | | | | | |
Beginning of period | | | 4,289,840,896 | | | | 4,591,391,049 | |
| | | | |
End of period (Note 1g) | | $ | 3,785,951,977 | | | $ | 4,289,840,896 | |
| | | | |
| | | | |
| | | |
22 | | Semiannual Report | The accompanying notes are an integral part of these financial statements. | | franklintempleton.com |
TEMPLETON FUNDS
Notes to Financial Statements (unaudited)
Templeton World Fund
1. Organization and Significant Accounting Policies
Templeton Funds (Trust) is registered under the Investment Company Act of 1940 (1940 Act) as anopen-end management investment company, consisting of three separate funds and applies the specialized accounting and reporting guidance in U.S. Generally Accepted Accounting Principles (U.S. GAAP). Templeton World Fund (Fund) is included in this report. The Fund offers four classes of shares: Class A, Class C, Class R6, and Advisor Class. Beginning on October 19, 2018, Class C shares automatically convert to Class A shares after they have been held for 10 years. Each class of shares may differ by its initial sales load, contingent deferred sales charges, voting rights on matters affecting a single class, its exchange privilege and fees due to differing arrangements for distribution and transfer agent fees.
The following summarizes the Fund’s significant accounting policies.
a. Financial Instrument Valuation
The Fund’s investments in financial instruments are carried at fair value daily. Fair value is the price that would be received to sell an asset or paid to transfer a liability in an orderly transaction between market participants on the measurement date. The Fund calculates the net asset value (NAV) per share each business day as of 4 p.m. Eastern time or the regularly scheduled close of the New York Stock Exchange (NYSE), whichever is earlier. Under compliance policies and procedures approved by the Trust’s Board of Trustees (the Board), the Fund’s administrator has responsibility for oversight of valuation, including leading the cross-functional Valuation Committee (VC). The Fund may utilize independent pricing services, quotations from securities and financial instrument dealers, and other market sources to determine fair value.
Equity securities and derivative financial instruments listed on an exchange or on the NASDAQ National Market System are valued at the last quoted sale price or the official closing price of the day, respectively. Foreign equity securities are valued as of the close of trading on the foreign stock exchange on which the security is primarily traded, or as of 4 p.m. Eastern time. The value is then converted into its U.S. dollar equivalent at the foreign exchange rate in effect at 4 p.m. Eastern time on the day that the value of the security is determined.Over-the-counter (OTC) securities are valued within the range of the most recent quoted bid and ask prices. Securities that trade in multiple
markets or on multiple exchanges are valued according to the broadest and most representative market. Certain equity securities are valued based upon fundamental characteristics or relationships to similar securities.
Investments inopen-end mutual funds are valued at closing NAV. Investments in time deposits are valued at cost, which approximates fair value.
Certain derivative financial instruments trade in the OTC market. The Fund’s pricing services use various techniques including industry standard option pricing models and proprietary discounted cash flow models to determine the fair value of those instruments. The Fund’s net benefit or obligation under the derivative contract, as measured by the fair value of the contract, is included in net assets.
The Fund has procedures to determine the fair value of financial instruments for which market prices are not reliable or readily available. Under these procedures, the Fund primarily employs a market-based approach which may use related or comparable assets or liabilities, recent transactions, market multiples, book values, and other relevant information for the investment to determine the fair value of the investment. An income-based valuation approach may also be used in which the anticipated future cash flows of the investment are discounted to calculate fair value. Discounts may also be applied due to the nature or duration of any restrictions on the disposition of the investments. Due to the inherent uncertainty of valuations of such investments, the fair values may differ significantly from the values that would have been used had an active market existed.
Trading in securities on foreign securities stock exchanges and OTC markets may be completed before 4 p.m. Eastern time. In addition, trading in certain foreign markets may not take place on every Fund’s business day. Occasionally, events occur between the time at which trading in a foreign security is completed and 4 p.m. Eastern time that might call into question the reliability of the value of a portfolio security held by the Fund. As a result, differences may arise between the value of the Fund’s portfolio securities as determined at the foreign market close and the latest indications of value at 4 p.m. Eastern time. In order to minimize the potential for these differences, the VC monitors price movements following the close of trading in foreign stock markets through a series of country specific market proxies (such as baskets of American Depositary Receipts, futures contracts and exchange traded
| | | | |
| | | |
| franklintempleton.com | | Semiannual Report | | 23 |
TEMPLETON FUNDS
NOTES TO FINANCIAL STATEMENTS (UNAUDITED)
Templeton World Fund(continued)
1. Organization and Significant Accounting
Policies(continued)
a. Financial Instrument Valuation(continued)
funds). These price movements are measured against established trigger thresholds for each specific market proxy to assist in determining if an event has occurred that may call into question the reliability of the values of the foreign securities held by the Fund. If such an event occurs, the securities may be valued using fair value procedures, which may include the use of independent pricing services.
When the last day of the reporting period is anon-business day, certain foreign markets may be open on those days that the Fund’s NAV is not calculated, which could result in differences between the value of the Fund’s portfolio securities on the last business day and the last calendar day of the reporting period. Any significant security valuation changes due to an open foreign market are adjusted and reflected by the Fund for financial reporting purposes.
b. Foreign Currency Translation
Portfolio securities and other assets and liabilities denominated in foreign currencies are translated into U.S. dollars based on the exchange rate of such currencies against U.S. dollars on the date of valuation. The Fund may enter into foreign currency exchange contracts to facilitate transactions denominated in a foreign currency. Purchases and sales of securities, income and expense items denominated in foreign currencies are translated into U.S. dollars at the exchange rate in effect on the transaction date. Portfolio securities and assets and liabilities denominated in foreign currencies contain risks that those currencies will decline in value relative to the U.S. dollar. Occasionally, events may impact the availability or reliability of foreign exchange rates used to convert the U.S. dollar equivalent value. If such an event occurs, the foreign exchange rate will be valued at fair value using procedures established and approved by the Board.
The Fund does not separately report the effect of changes in foreign exchange rates from changes in market prices on securities held. Such changes are included in net realized and unrealized gain or loss from investments in the Statement of Operations.
Realized foreign exchange gains or losses arise from sales of foreign currencies, currency gains or losses realized between the trade and settlement dates on securities transactions and the difference between the recorded amounts of dividends, interest,
and foreign withholding taxes and the U.S. dollar equivalent of the amounts actually received or paid. Net unrealized foreign exchange gains and losses arise from changes in foreign exchange rates on foreign denominated assets and liabilities other than investments in securities held at the end of the reporting period.
c. Derivative Financial Instruments
The Fund invested in derivative financial instruments in order to manage risk or gain exposure to various other investments or markets. Derivatives are financial contracts based on an underlying or notional amount, require no initial investment or an initial net investment that is smaller than would normally be required to have a similar response to changes in market factors, and require or permit net settlement. Derivatives contain various risks including the potential inability of the counterparty to fulfill their obligations under the terms of the contract, the potential for an illiquid secondary market, and/or the potential for market movements which expose the Fund to gains or losses in excess of the amounts shown in the Statement of Assets and Liabilities. Realized gain and loss and unrealized appreciation and depreciation on these contracts for the period are included in the Statement of Operations.
Derivative counterparty credit risk is managed through a formal evaluation of the creditworthiness of all potential counter-parties. The Fund attempts to reduce its exposure to counterparty credit risk on OTC derivatives, whenever possible, by entering into International Swaps and Derivatives Association (ISDA) master agreements with certain counterparties. These agreements contain various provisions, including but not limited to collateral requirements, events of default, or early termination. Termination events applicable to the counterparty include certain deteriorations in the credit quality of the counterparty. Termination events applicable to the Fund include failure of the Fund to maintain certain net asset levels and/or limit the decline in net assets over various periods of time. In the event of default or early termination, the ISDA master agreement gives thenon-defaulting party the right to net andclose-out all transactions traded, whether or not arising under the ISDA agreement, to one net amount payable by one counterparty to the other. However, absent an event of default or early termination, OTC derivative assets and liabilities are presented gross and not offset in the Statement of Assets and Liabilities. Early termination by the counterparty may result in an immediate payment by the Fund of any net liability owed to that counterparty under the ISDA agreement.
| | | | |
| | | |
24 | | Semiannual Report | | franklintempleton.com |
TEMPLETON FUNDS
NOTES TO FINANCIAL STATEMENTS (UNAUDITED)
Templeton World Fund(continued)
At February 28, 2019, the Fund had no OTC derivatives in a net liability position for such contracts.
Collateral requirements differ by type of derivative. Collateral terms are contract specific for OTC derivatives. For OTC derivatives traded under an ISDA master agreement, posting of collateral is required by either the Fund or the applicable counterparty if the total net exposure of all OTC derivatives with the applicable counterparty exceeds the minimum transfer amount, which typically ranges from $100,000 to $250,000, and can vary depending on the counterparty and the type of the agreement. Generally, collateral is determined at the close of Fund business each day and any additional collateral required due to changes in derivative values may be delivered by the Fund or the counterparty the next business day, or within a few business days. Collateral pledged and/or received by the Fund, if any, is held in segregated accounts with the Fund’s custodian/counterparty broker and can be in the form of cash and/or securities. Unrestricted cash may be invested according to the Fund’s investment objectives. To the extent that the amounts due to the Fund from its counterparties are not subject to collateralization or are not fully collateralized, the Fund bears the risk of loss from counterpartynon-performance.
At February 28, 2019, the Fund received $1,400,027 in United Kingdom Treasury Bonds and U.S. Treasury Bills and Notes as collateral for derivatives.
The Fund entered into OTC forward exchange contracts primarily to manage and/or gain exposure to certain foreign currencies. A forward exchange contract is an agreement between the Fund and a counterparty to buy or sell a foreign currency at a specific exchange rate on a future date.
The Fund purchased or wrote exchange traded option contracts primarily to manage exposure to equity price risk. An option is a contract entitling the holder to purchase or sell a specific amount of shares or units of an asset or notional amount of a swap (swaption), at a specified price. When an option is purchased or written, an amount equal to the premium paid or received is recorded as an asset or liability, respectively. Upon exercise of an option, the acquisition cost or sales proceeds of the underlying investment is adjusted by any premium received or paid. Upon expiration of an option, any premium received or paid is recorded as a realized gain or loss. Upon closing an
option other than through expiration or exercise, the difference between the premium received or paid and the cost to close the position is recorded as a realized gain or loss.
See Note 8 regarding other derivative information.
d. Restricted Cash
At February 28, 2019, the Fund held restricted cash in connection with investments in certain derivative securities. Restricted cash is held in a segregated account with the Fund’s custodian and is reflected in the Statement of Assets and Liabilities.
e. Securities Lending
The Fund participates in an agency based securities lending program to earn additional income. The Fund receives cash collateral against the loaned securities in an amount equal to at least 102% of the fair value of the loaned securities. Collateral is maintained over the life of the loan in an amount not less than 100% of the fair value of loaned securities, as determined at the close of Fund business each day; any additional collateral required due to changes in security values is delivered to the Fund on the next business day. The collateral is deposited into a joint cash account with other funds and is used to invest in a money market fund managed by Franklin Advisers, Inc., an affiliate of the Fund. The Fund may receive income from the investment of cash collateral, in addition to lending fees and rebates paid by the borrower. Income from securities loaned, net of fees paid to the securities lending agent and/or third-party vendor, is reported separately in the Statement of Operations. The Fund bears the market risk with respect to the collateral investment, securities loaned, and the risk that the agent may default on its obligations to the Fund. If the borrower defaults on its obligation to return the securities loaned, the Fund has the right to repurchase the securities in the open market using the collateral received. The securities lending agent has agreed to indemnify the Fund in the event of default by a third party borrower. At February 28, 2019, the Fund had no securities on loan.
f. Income and Deferred Taxes
It is the Fund’s policy to qualify as a regulated investment company under the Internal Revenue Code. The Fund intends to distribute to shareholders substantially all of its taxable income and net realized gains to relieve it from federal income and excise taxes. As a result, no provision for U.S. federal income taxes is required.
| | | | |
| | | |
| franklintempleton.com | | Semiannual Report | | 25 |
TEMPLETON FUNDS
NOTES TO FINANCIAL STATEMENTS (UNAUDITED)
Templeton World Fund(continued)
1. Organization and Significant Accounting
Policies(continued)
f. Income and Deferred Taxes(continued)
The Fund may be subject to foreign taxation related to income received, capital gains on the sale of securities and certain foreign currency transactions in the foreign jurisdictions in which it invests. Foreign taxes, if any, are recorded based on the tax regulations and rates that exist in the foreign markets in which the Fund invests. When a capital gain tax is determined to apply, the Fund records an estimated deferred tax liability in an amount that would be payable if the securities were disposed of on the valuation date.
As a result of several court cases, in certain countries across the European Union, the Fund filed additional tax reclaims for previously withheld taxes on dividends earned in those countries (EU reclaims). These additional filings are subject to various administrative proceedings by the local jurisdictions’ tax authorities within the European Union, as well as a number of related judicial proceedings. Income recognized, if any, for EU reclaims is reflected as other income in the Statement of Operations and any related receivable, if any, is reflected as European Union tax reclaims in the Statement of Assets and Liabilities. When uncertainty exists as to the ultimate resolution of these proceedings, the likelihood of receipt of these EU reclaims, and the potential timing of payment, no amounts are reflected in the financial statements. For U.S. income tax purposes, EU reclaims received by the Fund, if any, reduce the amounts of foreign taxes Fund shareholders can use as tax credits in their individual income tax returns.
The Fund may recognize an income tax liability related to its uncertain tax positions under U.S. GAAP when the uncertain tax position has a less than 50% probability that it will be sustained upon examination by the tax authorities based on its technical merits. As of February 28, 2019, the Fund has determined that no tax liability is required in its financial statements related to uncertain tax positions for any open tax years (or expected to be taken in future tax years). Open tax years are those that remain subject to examination and are based on the statute of limitations in each jurisdiction in which the Fund invests.
g. Security Transactions, Investment Income, Expenses and Distributions
Security transactions are accounted for on trade date. Realized gains and losses on security transactions are determined on a specific identification basis. Interest income and estimated expenses are accrued daily. Amortization of premium and accretion of discount on debt securities are included in interest income. Paydown gains and losses are recorded as an adjustment to interest income. Dividend income is recorded on theex-dividend date except for certain dividends from securities where the dividend rate is not available. In such cases, the dividend is recorded as soon as the information is received by the Fund. Distributions to shareholders are recorded on theex-dividend date. Distributable earnings are determined according to income tax regulations (tax basis) and may differ from earnings recorded in accordance with U.S. GAAP. These differences may be permanent or temporary. Permanent differences are reclassified among capital accounts to reflect their tax character. These reclassifications have no impact on net assets or the results of operations. Temporary differences are not reclassified, as they may reverse in subsequent periods.*
Common expenses incurred by the Trust are allocated among the Funds based on the ratio of net assets of each Fund to the combined net assets of the Trust or based on the ratio of number of shareholders of each Fund to the combined number of shareholders of the Trust. Fund specific expenses are charged directly to the Fund that incurred the expense.
Realized and unrealized gains and losses and net investment income, excluding class specific expenses, are allocated daily to each class of shares based upon the relative proportion of net assets of each class. Differences in per share distributions by class are generally due to differences in class specific expenses.
h. Accounting Estimates
The preparation of financial statements in accordance with U.S. GAAP requires management to make estimates and assumptions that affect the reported amounts of assets and liabilities at the date of the financial statements and the amounts of income and expenses during the reporting period. Actual results could differ from those estimates.
i. Guarantees and Indemnifications
Under the Trust’s organizational documents, its officers and trustees are indemnified by the Trust against certain liabilities arising out of the performance of their duties to the Trust.
| | | | |
| | | |
26 | | Semiannual Report | | franklintempleton.com |
TEMPLETON FUNDS
NOTES TO FINANCIAL STATEMENTS (UNAUDITED)
Templeton World Fund(continued)
Additionally, in the normal course of business, the Trust, on behalf of the Fund, enters into contracts with service providers that contain general indemnification clauses. The Trust’s maximum exposure under these arrangements is unknown as
this would involve future claims that may be made against the Trust that have not yet occurred. Currently, the Trust expects the risk of loss to be remote.
*Effective during the current reporting period, it is no longer required to present certain line items in the Statements of Changes in Net Assets. The below prior period amounts affected by this change are shown as they were in the prior year Statements of Changes in Net Assets.
For the year ended August 31, 2018, distributions to shareholders were as follows:
| | | | |
Distributions from net investment income: | | | | |
Class A | | $ | (4,937,007 | ) |
Class R6 | | | (243,447 | ) |
Advisor Class | | | (502,930 | ) |
Distributions from net realized gains: | | | | |
Class A | | | (238,907,033 | ) |
Class C | | | (7,980,686 | ) |
Class R6 | | | (2,978,075 | ) |
Advisor Class | | | (7,782,016 | ) |
For the year ended August 31, 2018, undistributed net investment income included in net assets was $70,503,712.
2. Shares of Beneficial Interest
At February 28, 2019, there were an unlimited number of shares authorized (without par value). Transactions in the Fund’s shares were as follows:
| | | | | | | | | | | | | | | | |
| | | Six Months Ended February 28, 2019 | | | Year Ended August 31, 2018 | |
| | | Shares | | | Amount | | | Shares | | | Amount | |
| | | | |
Class A Shares: | | | | | | | | | | | | | | | | |
Shares solda | | | 11,030,355 | | | $ | 168,560,290 | | | | 10,715,421 | | | $ | 183,525,967 | |
Shares issued in reinvestment of distributions | | | 44,873,627 | | | | 547,458,254 | | | | 13,445,122 | | | | 228,298,168 | |
Shares redeemed | | | (23,931,963 | ) | | | (347,359,664 | ) | | | (43,934,274 | ) | | | (750,574,405 | ) |
| | | | |
Net increase (decrease) | | | 31,972,019 | | | $ | 368,658,880 | | | | (19,773,731 | ) | | $ | (338,750,270 | ) |
| | | | |
Class C Shares: | | | | | | | | | | | | | | | | |
Shares sold | | | 269,796 | | | $ | 3,672,468 | | | | 353,066 | | | $ | 5,773,148 | |
Shares issued in reinvestment of distributions | | | 461,706 | | | | 5,438,899 | | | | 477,955 | | | | 7,738,087 | |
Shares redeemeda | | | (4,989,011 | ) | | | (77,744,166 | ) | | | (2,165,072 | ) | | | (35,278,628 | ) |
Net increase (decrease) | | | (4,257,509 | ) | | $ | (68,632,799) | | | | (1,334,051 | ) | | $ | (21,767,393 | ) |
| | | | |
Class R6 Shares: | | | | | | | | | | | | | | | | |
Shares sold | | | 854,038 | | | $ | 11,840,559 | | | | 1,911,395 | | | $ | 33,094,112 | |
Shares issued in reinvestment of distributions | | | 353,599 | | | | 4,292,695 | | | | 98,261 | | | | 1,662,581 | |
Shares redeemed | | | (303,688 | ) | | | (4,538,877) | | | | (2,301,480 | ) | | | (39,845,838 | ) |
| | | | |
Net increase (decrease) | | | 903,949 | | | $ | 11,594,377 | | | | (291,824 | ) | | $ | (5,089,145 | ) |
| | | | |
| | | |
| franklintempleton.com | | Semiannual Report | | 27 |
TEMPLETON FUNDS
NOTES TO FINANCIAL STATEMENTS (UNAUDITED)
Templeton World Fund(continued)
2. Shares of Beneficial Interest(continued)
| | | | | | | | | | | | | | | | |
| | | Six Months Ended
February 28, 2019 | | | Year Ended
August 31, 2018 | |
| | | Shares | | | Amount | | | Shares | | | Amount | |
| | | | |
Advisor Class Shares: | | | | | | | | | | | | | | | | |
| | | | |
Shares sold | | | 1,585,914 | | | $ | 23,423,854 | | | | 3,275,702 | | | $ | 56,104,176 | |
| | | | |
Shares issued in reinvestment of distributions | | | 1,566,811 | | | | 19,052,419 | | | | 401,452 | | | | 6,800,595 | |
| | | | |
Shares redeemed | | | (1,985,745 | ) | | | (27,779,566 | ) | | | (4,437,189 | ) | | | (76,262,237 | ) |
| | | | |
Net increase (decrease) | | | 1,166,980 | | | $ | 14,696,707 | | | | (760,035 | ) | | $ | (13,357,466 | ) |
aMay include a portion of Class C shares that were automatically converted to Class A.
3. Transactions with Affiliates
Franklin Resources, Inc. is the holding company for various subsidiaries that together are referred to as Franklin Templeton. Certain officers and trustees of the Trust are also officers and/or directors of the following subsidiaries:
| | |
| Subsidiary | | Affiliation |
| |
| Templeton Global Advisors Limited (TGAL) | | Investment manager |
| |
| Franklin Templeton Services, LLC (FT Services) | | Administrative manager |
| |
| Franklin Templeton Distributors, Inc. (Distributors) | | Principal underwriter |
| |
| Franklin Templeton Investor Services, LLC (Investor Services) | | Transfer agent |
a. Management Fees
The Fund pays an investment management fee to TGAL based on the average daily net assets of the Fund as follows:
| | |
| Annualized Fee Rate | | Net Assets |
| |
| 0.705% | | Up to and including $1 billion |
| |
| 0.690% | | Over $1 billion, up to and including $5 billion |
| |
| 0.675% | | Over $5 billion, up to and including $10 billion |
| |
| 0.655% | | Over $10 billion, up to and including $15 billion |
| |
| 0.635% | | Over $15 billion, up to and including $20 billion |
| |
| 0.615% | | In excess of $20 billion |
For the period ended February 28, 2019, the annualized gross effective investment management fee rate was 0.694% of the Fund’s average daily net assets.
b. Administrative Fees
Under an agreement with TGAL, FT Services provides administrative services to the Fund. The fee is paid by TGAL based on the Fund’s average daily net assets, and is not an additional expense of the Fund.
c. Distribution Fees
The Board has adopted distribution plans for each share class, with the exception of Class R6 and Advisor Class shares, pursuant to Rule12b-1 under the 1940 Act. Under the Fund’s Class A reimbursement distribution plan, the Fund reimburses Distributors for costs incurred in connection with the servicing, sale and distribution of the Fund’s shares up to the maximum annual plan rate. Under the Class A reimbursement distribution plan, costs exceeding the maximum for the current plan year cannot be reimbursed in
| | | | |
| | | |
28 | | Semiannual Report | | franklintempleton.com |
TEMPLETON FUNDS
NOTES TO FINANCIAL STATEMENTS (UNAUDITED)
Templeton World Fund(continued)
subsequent periods. In addition, under the Fund’s Class C compensation distribution plan, the Fund pays Distributors for costs incurred in connection with the servicing, sale and distribution of the Fund’s shares up to the maximum annual plan rate. The plan year, for purposes of monitoring compliance with the maximum annual plan rates, is February 1 through January 31.
The maximum annual plan rates, based on the average daily net assets, for each class, are as follows:
| | |
Class A | | 0.25% |
Class C | | 1.00% |
d. Sales Charges/Underwriting Agreements
Front-end sales charges and contingent deferred sales charges (CDSC) do not represent expenses of the Fund. These charges are deducted from the proceeds of sales of Fund shares prior to investment or from redemption proceeds prior to remittance, as applicable. Distributors has advised the Fund of the following commission transactions related to the sales and redemptions of the Fund’s shares for the period:
| | |
Sales charges retained net of commissions paid to unaffiliated brokers/dealers | | $29,642 |
CDSC retained | | $ 2,780 |
Effective September 10, 2018, the Board approved changes to certainfront-end sales charges and dealer commissions on Class A shares. Further details are disclosed in the Fund’s Prospectus.
e. Transfer Agent Fees
Each class of shares pays transfer agent fees to Investor Services for its performance of shareholder servicing obligations. The fees are based on an annualized asset based fee of 0.02% plus a transaction based fee. In addition, each class reimburses Investor Services for out of pocket expenses incurred and, except for Class R6, reimburses shareholder servicing fees paid to third parties. These fees are allocated daily based upon their relative proportion of such classes’ aggregate net assets. Class R6 pays Investor Services transfer agent fees specific to that class.
For the period ended February 28, 2019, the Fund paid transfer agent fees of $1,450,901, of which $1,170,937 was retained by Investor Services.
f. Investments in Affiliated Management Investment Companies
The Fund invests in one or more affiliated management investment companies for purposes other than exercising a controlling influence over the management or policies. Management fees paid by the Fund are waived on assets invested in the affiliated management investment companies, as noted in the Statement of Operations, in an amount not to exceed the management and administrative fees paid directly or indirectly by each affiliate. During the period ended February 28, 2019, the Fund held investments in affiliated management investment companies as follows:
| | | | | | | | | | | | | | | | | | | | | | | | | | | | | | | | |
| | | Number of
Shares Held
at Beginning
of Period | | | Gross
Additions | | | Gross
Reductions | | | Number of
Shares
Held at End
of Period | | | Value
at End
of
Period | | | Income
from
securities
loaned | | | Realized
Gain
(Loss) | | | Net Change in
Unrealized
Appreciation
(Depreciation) | |
Non-Controlled Affiliates | | | | | | | | | | | | | | | | | | | | | | | | | | | | | | | | |
Institutional Fiduciary Trust Money Market Portfolio, 2.06% | | | — | | | | 43,736,619 | | | | (43,736,619 | ) | | | — | | | | $ — | | | | $20,560 | | | | $ — | | | | $ — | |
| | | | | | | | | | | | | | | | | | | | |
g. Waiver and Expense Reimbursements
Investor Services has contractually agreed in advance to waive or limit its fees so that the Class R6 transfer agent fees do not exceed 0.03% based on the average net assets of the class until December 31, 2019.
| | | | |
| | | |
| franklintempleton.com | | Semiannual Report | | 29 |
TEMPLETON FUNDS
NOTES TO FINANCIAL STATEMENTS (UNAUDITED)
Templeton World Fund(continued)
4. Expense Offset Arrangement
The Fund has entered into an arrangement with its custodian whereby credits realized as a result of uninvested cash balances are used to reduce a portion of the Fund’s custodian expenses. During the period ended February 28, 2019, there were no credits earned.
5. Income Taxes
At February 28, 2019, the cost of investments and net unrealized appreciation (depreciation) for income tax purposes were as follows:
| | | | |
Cost of investments | | $ | 3,621,736,955 | |
| |
Unrealized appreciation | | $ | 517,886,314 | |
Unrealized depreciation | | | (426,615,090 | ) |
| |
Net unrealized appreciation (depreciation) | | $ | 91,271,224 | |
Differences between income and/or capital gains as determined on a book basis and a tax basis are primarily due to differing treatment of foreign currency transactions.
6. Investment Transactions
Purchases and sales of investments (excluding short term securities) for the period ended February 28, 2019, aggregated $423,897,684 and $540,095,068, respectively.
7. Concentration of Risk
Investing in foreign securities may include certain risks and considerations not typically associated with investing in U.S. securities, such as fluctuating currency values and changing local and regional economic, political and social conditions, which may result in greater market volatility. Current political and financial uncertainty surrounding the European Union may increase market volatility and the economic risk of investing in securities in Europe. In addition, certain foreign securities may not be as liquid as U.S. securities.
8. Other Derivative Information
At February 28, 2019, the Fund’s investments in derivative contracts are reflected in the Statement of Assets and Liabilities as follows:
| | | | | | | | | | | | | | | | |
| | Asset Derivatives | | | | | | | Liability Derivatives | |
| | | | | |
Derivative Contracts
Not Accounted for as
Hedging Instruments | | Statement of
Assets and Liabilities
Location | | Fair Value | | | | | | Statement of
Assets and Liabilities
Location | | Fair Value | |
| | | | | |
| Foreign exchange contracts | | Unrealized appreciation on OTC
forward exchange contracts | | | $20,737,787 | | | | | | | Unrealized depreciation on OTC
forward exchange contracts | | | $15,017,819 | |
| | | | | | | | | | | | | | | | |
| | | | |
| | | |
30 | | Semiannual Report | | franklintempleton.com |
TEMPLETON FUNDS
NOTES TO FINANCIAL STATEMENTS (UNAUDITED)
Templeton World Fund(continued)
For the period ended February 28, 2019, the effect of derivative contracts in the Fund’s Statement of Operations was as follows:
| | | | | | | | | | | | |
Derivative Contracts
Not Accounted for as
Hedging Instruments | | Statement of Operations Location | | Net Realized
Gain (Loss) for
the Period | | | Statement of
Operations Location | | Net Change in
Unrealized
Appreciation
(Depreciation)
for the Period | |
| | Net realized gain (loss) from: | | | | | | Net change in unrealized appreciation (depreciation) on: | | | | |
Foreign exchange contracts | | Forward exchange contracts | | | $59,548,061 | | | Forward exchange contracts | | | $(21,217,282) | |
Equity contracts | | Written options | | | 291,651 | | | Written options | | | 1,827 | |
| | | | | | | | | | | | |
Totals | | | | | $59,839,712 | | | | | | $(21,215,455) | |
| | | | | | | | | | | | |
For the period ended February 28, 2019, the average month end notional amount of options contracts represented 45,500 shares. The average month end contract value of forward exchange contracts was $2,461,717,575.
See Note 1(c) regarding derivative financial instruments.
See Abbreviations on page 32.
9. Credit Facility
The Fund, together with other U.S. registered and foreign investment funds (collectively, Borrowers), managed by Franklin Templeton, are borrowers in a joint syndicated senior unsecured credit facility totaling $2 billion (Global Credit Facility) which matures on February 7, 2020. This Global Credit Facility provides a source of funds to the Borrowers for temporary and emergency purposes, including the ability to meet future unanticipated or unusually large redemption requests.
Under the terms of the Global Credit Facility, the Fund shall, in addition to interest charged on any borrowings made by the Fund and other costs incurred by the Fund, pay its share of fees and expenses incurred in connection with the implementation and maintenance of the Global Credit Facility, based upon its relative share of the aggregate net assets of all of the Borrowers, including an annual commitment fee of 0.15% based upon the unused portion of the Global Credit Facility. These fees are reflected in other expenses in the Statement of Operations. During the period ended February 28, 2019, the Fund did not use the Global Credit Facility.
10. Fair Value Measurements
The Fund follows a fair value hierarchy that distinguishes between market data obtained from independent sources (observable inputs) and the Fund’s own market assumptions (unobservable inputs). These inputs are used in determining the value of the Fund’s financial instruments and are summarized in the following fair value hierarchy:
| | • | | Level 1 – quoted prices in active markets for identical financial instruments |
| | • | | Level 2 – other significant observable inputs (including quoted prices for similar financial instruments, interest rates, prepayment speed, credit risk, etc.) |
| | • | | Level 3 – significant unobservable inputs (including the Fund’s own assumptions in determining the fair value of financial instruments) |
The input levels are not necessarily an indication of the risk or liquidity associated with financial instruments at that level.
| | | | |
| | | |
| franklintempleton.com | | Semiannual Report | | 31 |
TEMPLETON FUNDS
NOTES TO FINANCIAL STATEMENTS (UNAUDITED)
Templeton World Fund(continued)
10. Fair Value Measurements(continued)
A summary of inputs used as of February 28, 2019, in valuing the Fund’s assets and liabilities carried at fair value, is as follows:
| | | | | | | | | | | | | | | | |
| | | Level 1 | | | Level 2 | | | Level 3 | | | Total | |
Assets: | | | | | | | | | | | | | | | | |
Investments in Securities:a | | | | | | | | | | | | | | | | |
Equity Investments | | $ | 3,678,288,211 | | | $ | — | | | $ | — | | | $ | 3,678,288,211 | |
Short Term Investments | | | — | | | | 29,000,000 | | | | — | | | | 29,000,000 | |
| | | | |
Total Investments in Securities | | $ | 3,678,288,211 | | | $ | 29,000,000 | | | $ | — | | | $ | 3,707,288,211 | |
| | | | |
Other Financial Instruments: | | | | | | | | | | | | | | | | |
Forward Exchange Contracts | | $ | — | | | $ | 20,737,787 | | | $ | — | | | $ | 20,737,787 | |
| | | | |
Liabilities: | | | | | | | | | | | | | | | | |
Other Financial Instruments: | | | | | | | | | | | | | | | | |
Forward Exchange Contracts | | $ | — | | | $ | 15,017,819 | | | $ | — | | | $ | 15,017,819 | |
aFor detailed categories, see the accompanying Statement of Investments.
11. Subsequent Events
The Fund has evaluated subsequent events through the issuance of the financial statements and determined that no events have occurred that require disclosure.
Abbreviations
| | | | | | | | | | |
| Counterparty | | Selected Portfolio |
| | | | | |
BOFA | | | | Bank of America Corp. | | ADR | | | | American Depositary Receipt |
GSCO | | | | The Goldman Sachs Group, Inc. | | IDR | | | | International Depositary Receipt |
HSBK | | | | HSBC Bank PLC | | | | | | |
MSCO | | | | Morgan Stanley | | | | | | |
UBSW | | | | UBS AG | | | | | | |
| | | | |
| | | |
32 | | Semiannual Report | | franklintempleton.com |
TEMPLETON FUNDS
Tax Information (unaudited)
At August 31, 2018, more than 50% of the Fund’s total assets were invested in securities of foreign issuers. In most instances, foreign taxes were withheld from income paid to the Fund on these investments. As shown in the table below, the Fund hereby reports to shareholders the foreign source income and foreign taxes paid, pursuant to Section 853 of the Internal Revenue Code. This written statement will allow shareholders of record on December 20, 2018, to treat their proportionate share of foreign taxes paid by the Fund as having been paid directly by them. The shareholder shall consider these amounts as foreign taxes paid in the tax year in which they receive the Fund distribution.
The following table provides a detailed analysis of foreign tax paid, foreign source income, and foreign source qualified dividends as reported by the Fund, to shareholders of record.
| | | | | | | | | | | | |
| Class | | Foreign Tax Paid
Per Share | | | Foreign Source
Income Per Share | | | Foreign Source Qualified
Dividends Per Share | |
| | | |
Class A | | | $0.0385 | | | | $0.3316 | | | | $0.2663 | |
Class C | | | $0.0385 | | | | $0.1052 | | | | $0.0846 | |
Class R6 | | | $0.0385 | | | | $0.3584 | | | | $0.2879 | |
Advisor Class | | | $0.0385 | | | | $0.3534 | | | | $0.2839 | |
Foreign Tax Paid Per Share is the amount per share available to you, as a tax credit (assuming you held your shares in the Fund for a minimum of 16 days during the31-day period beginning 15 days before theex-dividend date of the Fund’s distribution to which the foreign taxes relate), or, as a tax deduction.
Foreign Source Income Per Share is the amount per share of income dividends attributable to foreign securities held by the Fund, plus any foreign taxes withheld on these dividends. The amounts reported include foreign source qualified dividends that have not been adjusted for the rate differential applicable to such dividend income.1
Foreign Source Qualified Dividends Per Share is the amount per share of foreign source qualified dividends, plus any foreign taxes withheld on these dividends. These amounts represent the portion of the Foreign Source Income Per Share that were derived from qualified foreign securities held by the Fund.1
In February 2019, shareholders received Form1099-DIV which included their share of taxes paid and foreign source income distributed during the calendar year 2018. The Foreign Source Income reported on Form1099-DIV was not adjusted for the rate differential on foreign source qualified dividend income. Shareholders are advised to check with their tax advisors for information on the treatment of these amounts on their 2018 individual income tax returns.
1.Qualified dividends are taxed at reduced long term capital gains tax rates. In determining the amount of foreign tax credit that may be applied against the U.S. tax liability of individuals receiving foreign source qualified dividends, adjustments may be required to the foreign tax credit limitation calculation to reflect the rate differential applicable to such dividend income. The rules however permit certain individuals to elect not to apply the rate differential adjustments for capital gains and/or dividends for any taxable year. Please consult your tax advisor and the instructions to Form 1116 for more information.
| | | | |
| | | |
| franklintempleton.com | | Semiannual Report | | 33 |
TEMPLETON FUNDS
TEMPLETON WORLD FUND
Shareholder Information
Proxy Voting Policies and Procedures
The Fund’s investment manager has established Proxy Voting Policies and Procedures (Policies) that the Fund uses to determine how to vote proxies relating to portfolio securities. Shareholders may view the Fund’s complete Policies online at franklintempleton.com. Alternatively, shareholders may request copies of the Policies free of charge by calling the Proxy Group collect at (954)527-7678 or by sending a written request to: Franklin Templeton Companies, LLC, 300 S.E. 2nd Street, Fort Lauderdale, FL 33301, Attention: Proxy Group. Copies of the Fund’s proxy voting records are also made available online at franklintempleton.com and posted on the U.S. Securities and Exchange Commission’s website at sec.gov and reflect the most recent12-month period ended June 30.
Quarterly Statement of Investments
The Trust, on behalf of the Fund, files a complete statement of investments with the U.S. Securities and Exchange Commission for the first and third quarters for each fiscal year as an exhibit to its report on FormN-PORT. Shareholders may view the filed FormN-PORT by visiting the Commission’s website at sec.gov. The filed form may also be viewed and copied at the Commission’s Public Reference Room in Washington, DC. Information regarding the operations of the Public Reference Room may be obtained by calling(800) SEC-0330.
| | | | |
| | | |
34 | | Semiannual Report | | franklintempleton.com |
This page intentionally left blank.
This page intentionally left blank.
| | | | |
| | Semiannual Report and Shareholder Letter Templeton World Fund Investment Manager Templeton Global Advisors Limited Distributor Franklin Templeton Distributors, Inc. (800) DIAL BEN® /342-5236 franklintempleton.com Shareholder Services (800)632-2301 | | |
Authorized for distribution only when accompanied or preceded by a summary prospectus and/or prospectus. Investors should carefully consider a fund’s investment goals, risks, charges and expenses before investing. A prospectus contains this and other information; please read it carefully before investing.
To help ensure we provide you with quality service, all calls to and from our service areas are monitored and/or recorded.
| | | | |
| |
© 2019 Franklin Templeton Investments. All rights reserved. | | 102 S 04/19 |
Semiannual Report
Templeton International Climate Change Fund
This semiannual report for Templeton International Climate Change Fund covers the period ended February 28, 2019.
Your Fund’s Goal and Main Investments
The Fund seeks total return over the longer term by investing in the equity securities of companies we believe are both undervalued and meet the Fund’s standards for transitioning to a lower carbon economy. Under normal market conditions, the Fund invests at least 80% of its net assets in“non-U.S. securities,” as defined in the prospectus. These securities are predominantly equity securities of companies located outside the U.S., including developing markets.
Performance Overview
The Fund’s Advisor Class shares had a-4.86% cumulative total return for the six months under review. In comparison, the Fund’s benchmark, the MSCI All Country World Index (ACWI) ex USA Index, which measures stock performance in global developed and emerging markets excluding the U.S., had a-2.34% total return.1 Please note index performance information is provided for reference and we do not attempt to track the index but rather undertake investments on the basis of fundamental research. You can find more performance data in the Performance Summary beginning on page 6.
Performance data represent past performance, which does not guarantee future results. Investment return and principal value will fluctuate, and you may have a gain or loss when you sell your shares. Current performance may differ from figures shown.
Economic and Market Overview
The global economy expanded during the six months under review, despite weakness in certain regions. Global developed and emerging market stocks were aided at certain points during the period by upbeat economic data in some regions, encouraging corporate earnings reports, the U.S. Federal Reserve’s (Fed’s) indications of a cautious approach to its
Geographic Composition
Based on Total Net Assets as of 2/28/19

monetary policy decisions and optimism about a potential U.S.-China trade deal.
However, various factors weighed on global markets at certain points during the period, including concerns about tighter regulation of technology companies, political uncertainties in the U.S. and the European Union, the Fed’s interest-rate path and the European Central Bank’s (ECB’s) unwinding of its bond purchase program. Markets were further pressured by U.S. trade disputes with China and other trading partners, and their impact on global growth and corporate earnings. In this environment, global stocks, as measured by the MSCI ACWI, had a-2.70% total return for the six months ended February 28, 2019.1
The U.S. economy grew in 2018’s fourth quarter, though at a slower pace from the previous quarter partly due to a decline in housing investment. The unemployment rate was 3.8% in August 2018, and though it varied during the period, it remained unchanged atperiod-end.2 The annual inflation rate, as measured by the Consumer Price Index, decreased from 2.7% in August 2018 to 1.5% atperiod-end.2 The Fed raised its target range for the federal funds rate twice during the period, to 2.25%–2.50%, and continued reducing its balance sheet as part of its plan to normalize monetary policy. At its January meeting, the Fed held its target range for the federal funds rate unchanged and mentioned it would be patient in deciding further rate adjustments. Furthermore, the Fed’s January
1. Source: Morningstar.
The index is unmanaged and includes reinvestment of any income or distributions. It does not reflect any fees, expenses or sales charges. One cannot invest directly in an index, and an index is not representative of the Fund’s portfolio.
2. Source: U.S. Bureau of Labor Statistics.
The dollar value, number of shares or principal amount, and names of all portfolio holdings are listed in the Fund’s Statement of Investments (SOI). The SOI begins on page 10.
TEMPLETON INTERNATIONAL CLIMATE CHANGE FUND
meeting minutes indicated that most policymakers favored announcing the end of balance sheet normalization by the end of 2019.
In Europe, the U.K.’s quarterly gross domestic product (GDP) growth accelerated in 2018’s third quarter but moderated in the fourth quarter. The Bank of England kept its key policy rate unchanged during the period. After moderating in 2018’s third quarter, the eurozone’s quarterly GDP grew in the fourth quarter. The bloc’s annual inflation rate ended the period lower than in August 2018. The ECB kept its benchmark interest rate unchanged during the period and concluded its bond purchase program at the end of 2018. In January 2019, the ECB reiterated that it expected key interest rates to remain unchanged through at least the summer of 2019 and intended to reinvest principal payments from maturing bonds for an extended period of time.
In Asia, Japan’s quarterly GDP contracted in 2018’s third quarter but grew in the fourth quarter. The Bank of Japan left its benchmark interest rate unchanged during the period and continued its monetary stimulus measures.
In emerging markets, Brazil’s quarterly GDP growth accelerated in 2018’s third quarter but moderated in the fourth quarter. The Central Bank of Brazil kept its benchmark interest rate unchanged during the period. Russia’s annual GDP growth stabilized in 2018’s third quarter and accelerated in the fourth quarter. The Bank of Russia increased its key rate twice during the period to curtail inflation risks. China’s annual GDP growth moderated in 2018’s third and fourth quarters. The People’s Bank of China left its benchmark interest rate unchanged during the period, but it took measures to improve financial liquidity to mitigate the negative effects of the U.S.-China trade dispute and support economic growth. Overall, emerging market stocks, as measured by the MSCI Emerging Markets Index, posted a +0.46% total return during thesix-month period.1
Investment Strategy
Our investment strategy employs abottom-up, value-oriented, long-term approach to select attractively valued companies preparing for a transition to a lower carbon economy and that meet our climate change criteria. We focus on the market price of the company’s securities relative to our evaluation of the company’s long-term earnings, asset value and cash flow potential. Our analysis includes an assessment of the potential
Top 10 Sectors/Industries
2/28/19
| | | | |
| | | % of Total
Net Assets | |
Electrical Equipment | | | 14.0% | |
Banks | | | 8.7% | |
Pharmaceuticals | | | 8.6% | |
Chemicals | | | 5.2% | |
Multi-Utilities | | | 5.0% | |
Electronic Equipment, Instruments & Components | | | 4.8% | |
Wireless Telecommunication Services | | | 4.6% | |
Semiconductors & Semiconductor Equipment | | | 4.4% | |
Electric Utilities | | | 3.3% | |
Industrial Conglomerates | | | 2.8% | |
impacts of material environmental, social and governance (ESG) factors on the long-term risk and return profile of a company. We also consider a company’s price/earnings ratio, price/cash flow ratio, profit margins and liquidation value.
Manager’s Discussion
During the six months under review, key detractors from the Fund’s performance relative to its benchmark, the MSCI ACWI ex USA Index, included stock selection and an underweighting in financials as well as an overweighting and stock selection in information technology (IT).3 In the financials sector, Swiss investment bank UBS Group was the sector’s biggest detractor. Along with its regional banking peers, its stock was impacted by weak European economic data and subdued projections for ECB interest-rate hikes. Although the macro backdrop has delayed our investment thesis on UBS, we do not believe the thesis is broken. Our analysis indicates UBS has the ability to improve profitability by stabilizing wealth management margins, bolstering net interest income and achieving cost efficiencies. We are also pleased to see management guiding toward greater capital returns for shareholders as regulatory risk diminishes. From an ESG standpoint, UBS holds capital in excess of regulatory requirements and has won accolades recently for the firm’s commitments to responsible investing and labor management.
In the IT sector, relative performance was pressured by anoff-benchmark position in Swiss smart-meter manufacturer Landis+Gyr Group. Its shares declined due to concerns about profit margin pressures in the firm’s core European market. We remain positive on Landis+Gyr’s long-term prospects, as the services they provide—selling and monitoring power meters
3. The financials sector comprises banks, capital markets and insurance in the SOI. The IT sector comprises electronic equipment, instruments and components; semiconductors and semiconductor equipment; and technology hardware, storage and peripherals in the SOI.
TEMPLETON INTERNATIONAL CLIMATE CHANGE FUND
for electric utilities—help utilities run their businesses and allocate resources more efficiently. We also like the role the company plays in helping society lower its carbon footprint and improve the management and implementation of renewable energy sources.
Top 10 Holdings
2/28/19
| | | | |
| |
Company Sector/Industry, Country | | % of Total
Net Assets | |
| |
Signify NV Electrical Equipment, Netherlands | | | 3.5% | |
| |
Siemens Gamesa Renewable Energy SA Electrical Equipment, Spain | | | 3.5% | |
| |
Orsted AS Electric Utilities, Denmark | | | 3.3% | |
| |
Vestas Wind Systems AS Electrical Equipment, Denmark | | | 3.1% | |
| |
E.ON SE Multi-Utilities, Germany | | | 2.9% | |
| |
China Mobile Ltd. Wireless Telecommunication Services, China | | | 2.9% | |
| |
Johnson Matthey PLC Chemicals, U.K. | | | 2.9% | |
| |
Landis+Gyr Group AG Electronic Equipment, Instruments & Components,Switzerland | | | 2.9% | |
| |
Prysmian SpA Electrical Equipment, Italy | | | 2.8% | |
| |
Siemens AG Industrial Conglomerates, Germany | | | 2.8% | |
Stock selection in materials and an overweighting in industrials also detracted from relative results.4 The industrials sector included the Fund’s biggest detractor: Italian industrial cable producer Prysmian. Its shares declined due to reduced high voltage orders and a legacy project delay. Economic cyclicality and industrial complexity are both high for Prysmian, but at recent prices we believe the shares more than reflect these issues and offer compelling value. From an ESG standpoint, Prysmian products support lower emission and greater use of alternative clean energy by efficiently linking renewable energy production sites with power grids. The firm has certified the bulk of its operations to the leading environmental management standard and reports a decreasing trend in emissions. Conversely, the industrials sector also delivered the Fund’s top
Top 10 Countries
2/28/19
| | | | |
| | | % of Total
Net Assets | |
France | | | 15.0% | |
Japan | | | 11.9% | |
U.K. | | | 11.7% | |
Netherlands | | | 9.3% | |
Germany | | | 8.5% | |
Denmark | | | 7.8% | |
Switzerland | | | 5.7% | |
Taiwan | | | 3.6% | |
Spain | | | 3.5% | |
China | | | 2.9% | |
contributor during the period: Danish wind-turbine manufacturer Vestas Wind Systems. Its shares surged after the firm maintained full-year 2018 guidance in the face of tougher competition, signaling to analysts that management expects a strong finish to 2018. We were encouraged by the stabilization in pricing and strength in new orders, and we believe Vestas is well-positioned to participate in the long-term growth of the wind manufacturing industry.
A favorable overweighting in utilities was the Fund’s primary sector-level contributor during the period.5 Shares of Danish offshore wind energy firm Orsted rallied after its earnings exceeded even the highest analyst estimates. Orsted has 25 years of experience in offshore wind and a solid track record of internally funded growth. It also remains a global clean energy leader with an expanding pipeline of projects in a rapidly growing segment of power generation.
A slightly overweighted position in communication services had a modest impact on performance, but the sector delivered one of the Fund’s top contributors: Chinese telecommunication services firm China Mobile.6 Its shares rallied amid expectations of increased investments in 5G network development. We continue to like the story of falling capital expenditures and increasing dividends at China Mobile, and we believe that current low valuations adequately discount concerns about regulatory pricing pressures.
From a regional standpoint, stock selection in Asia, particularly in Japan and India, detracted from the Fund’s relative
4. The materials sector comprises chemicals and containers and packaging in the SOI. The industrials sector comprises building products, construction and engineering, electrical equipment, industrial conglomerates, and trading companies and distributors in the SOI.
5. The utilities sector comprises electric utilities, independent power and renewable electricity producers, and multi-utilities and in the SOI.
6. The communication services sector comprises diversified telecommunication services and wireless telecommunication services in the SOI.
See www.franklintempletondatasources.com for additional data provider information.
TEMPLETON INTERNATIONAL CLIMATE CHANGE FUND
performance. An overweighting in Europe also detracted, with negative returns in Switzerland and Italy offsetting positive returns in Sweden and Denmark.
It is important to recognize the effect of currency movements on the Fund’s performance. In general, if the value of the U.S. dollar goes up compared with a foreign currency, an investment traded in that foreign currency will go down in value because it will be worth fewer U.S. dollars. This can have a negative effect on Fund performance. Conversely, when the U.S. dollar weakens in relation to a foreign currency, an investment traded in that foreign currency will increase in value, which can contribute to Fund performance. For the six months ended February 28, 2019, the U.S. dollar rose in value relative to many currencies in which the Fund’s investments were traded. As a result, the Fund’s performance was negatively affected by the portfolio’s investment predominantly in securities withnon-U.S. currency exposure.
Atperiod-end, we continued to find what we consider attractive opportunities at the intersection of climate solutions and value investing. In our view, lowly valued companies prepared for the transition to alow-carbon future are well positioned for both resilience and growth over a long-term investment horizon.
Maarten Bloemen
Portfolio Manager
The foregoing information reflects our analysis, opinions and portfolio holdings as of February 28, 2019, the end of the reporting period. The way we implement our main investment strategies and the resulting portfolio holdings may change depending on factors such as market and economic conditions. These opinions may not be relied upon as investment advice or an offer for a particular security. The information is not a complete analysis of every aspect of any market, country, industry, security or the Fund. Statements of fact are from sources considered reliable, but the investment manager makes no representation or warranty as to their completeness or accuracy. Although historical performance is no guarantee of future results, these insights may help you understand our investment management philosophy.
TEMPLETON INTERNATIONAL CLIMATE CHANGE FUND
Performance Summary as of February 28, 2019
The performance table does not reflect any taxes that a shareholder would pay on Fund dividends, capital gain distributions, if any, or any realized gains on the sale of Fund shares. Total return reflects reinvestment of the Fund’s dividends and capital gain distributions, if any, and any unrealized gains or losses. Your dividend income will vary depending on dividends or interest paid by securities in the Fund’s portfolio, adjusted for operating expenses. Capital gain distributions are net profits realized from the sale of portfolio securities.
Performance as of 2/28/191
Cumulative total return excludes sales charges. Average annual total return includes maximum sales charges. Sales charges will vary depending on the size of the investment and the class of share purchased. Advisor Class shares are offered without sales charges.
| | | | | | | | |
| Share Class | | Cumulative
Total Return2 | | | Average Annual
Total Return3 | |
| | |
Advisor | | | | | | | | |
| | |
6-Month | | | -4.86% | | | | -4.86% | |
| | |
Since Inception (6/1/18) | | | -8.29% | | | | -8.29% | |
Performance data represent past performance, which does not guarantee future results. Investment return and principal value will fluctuate, and you may have a gain or loss when you sell your shares. Current performance may differ from figures shown.
See page 7 for Performance Summary footnotes.
TEMPLETON INTERNATIONAL CLIMATE CHANGE FUND
PERFORMANCE SUMMARY
Distributions(9/1/18–2/28/19)
| | | | | | | | | | | | | | | | | | | | |
Share Class | | Net Investment
Income | | | | | | Short-Term
Capital Gain | | | | | | Total | |
Advisor | | | $0.0526 | | | | | | | | $0.0214 | | | | | | | | $0.0740 | |
Total Annual Operating Expenses4
| | | | | | | | | | | | |
Share Class | | With Fee
Waiver | | | | | | Without Fee
Waiver | |
Advisor | | | 0.98% | | | | | | | | 7.92% | |
All investments involve risks, including possible loss of principal. Special risks are associated with foreign investing, including currency fluctuations, economic instability and political developments; investments in developing markets involve heightened risks related to the same factors. Currency rates may fluctuate significantly over short periods of time, and can reduce returns. Because the Fund may invest its assets in companies in a specific region, including Europe, it is subject to greater risks of adverse developments in that region and/or the surrounding regions than a fund that is more broadly diversified geographically. Current political and financial uncertainty surrounding the European Union may increase market volatility and the economic risk of investing in companies in Europe. Derivatives, including currency management strategies, involve costs and can create economic leverage in the portfolio, which may result in significant volatility and cause the Fund to participate in losses (as well as enable gains) on an amount that exceeds the Fund’s initial investment. The Fund may not achieve the anticipated benefits, and may realize losses when a counterparty fails to perform as promised. The Fund is actively managed but there is no guarantee that the manager’s investment decisions will produce the desired results. The Fund’s prospectus also includes a description of the main investment risks.
1. The Fund has an expense reduction and a fee waiver associated with any investments it makes in a Franklin Templeton money fund and/or other Franklin Templeton fund, contractually guaranteed through 12/31/19. Fund investment results reflect the expense reduction and fee waiver; without these reductions, the results would have been lower.
2. Cumulative total return represents the change in value of an investment over the periods indicated.
3. Average annual total return represents the average annual change in value of an investment over the periods indicated. Return for less than one year, if any, has not been annualized.
4. Figures are as stated in the Fund’s current prospectus and may differ from the expense ratios disclosed in the Your Fund’s Expenses and Financial Highlights sections in this report. In periods of market volatility, assets may decline significantly, causing total annual Fund operating expenses to become higher than the figures shown.
TEMPLETON INTERNATIONAL CLIMATE CHANGE FUND
Your Fund’s Expenses
As a Fund shareholder, you can incur two types of costs: (1) transaction costs, including sales charges (loads) on Fund purchases and redemptions; and (2) ongoing Fund costs, including management fees, distribution and service(12b-1) fees, and other Fund expenses. All mutual funds have ongoing costs, sometimes referred to as operating expenses. The table below shows ongoing costs of investing in the Fund and can help you understand these costs and compare them with those of other mutual funds. The table assumes a $1,000 investment held for the six months indicated.
Actual Fund Expenses
The table below provides information about actual account values and actual expenses in the columns under the heading “Actual.” In these columns the Fund’s actual return, which includes the effect of Fund expenses, is used to calculate the “Ending Account Value.” You can estimate the expenses you paid during the period by following these steps (of course, your account value and expenses will differ from those in this illustration): Divide your account value by $1,000 (if your account had an $8,600 value, then $8,600÷ $1,000 = 8.6). Then multiply the result by the number in the row for your class of shares under the headings “Actual” and “Expenses Paid During Period” (if Actual Expenses Paid During Period were $7.50, then 8.6 x $7.50 = $64.50). In this illustration, the actual expenses paid this period are $64.50.
Hypothetical Example for Comparison with Other Funds
Under the heading “Hypothetical” in the table, information is provided about hypothetical account values and hypothetical expenses based on the Fund’s actual expense ratio and an assumed rate of return of 5% per year before expenses, which is not the Fund’s actual return. This information may not be used to estimate the actual ending account balance or expenses you paid for the period, but it can help you compare ongoing costs of investing in the Fund with those of other funds. To do so, compare this 5% hypothetical example for the class of shares you hold with the 5% hypothetical examples that appear in the shareholder reports of other funds.
Please note that expenses shown in the table are meant to highlight ongoing costs and do not reflect any transactional costs. Therefore, information under the heading “Hypothetical” is useful in comparing ongoing costs only, and will not help you compare total costs of owning different funds. In addition, if transactional costs were included, your total costs would have been higher.
| | | | | | | | | | | | |
| | | | | Actual (actual return after expenses) | | Hypothetical
(5% annual return before expenses) | | |
| | | | | | | | |
Share Class | | Beginning
Account
Value 9/1/18 | | Ending
Account
Value 2/28/19 | | Expenses
Paid During
Period
9/1/18–2/28/191,2 | | Ending
Account
Value 2/28/19 | | Expenses
Paid During
Period
9/1/18–2/28/191,2 | | Net Annualized
Expense
Ratio2 |
| | | | | | |
| Advisor | | $1,000 | | $951.40 | | $4.69 | | $1,019.98 | | $4.86 | | 0.97% |
1. Expenses are equal to the annualized expense ratio for thesix-month period as indicated above—in the far right column—multiplied by the simple average account value over the period indicated, and then multiplied by 181/365 to reflect theone-half year period.
2. Reflects expenses after fee waivers and expense reimbursements. Does not include acquired fund fees and expenses.
TEMPLETON FUNDS
Financial Highlights
Templeton International Climate Change Fund
| | | | | | | | |
| | | Six Months Ended
February 28, 2019
(unaudited) | | | Year Ended
August 31,
2018a | |
| | |
Advisor Class | | | | | | | | |
| | |
Per share operating performance | | | | | | | | |
(for a share outstanding throughout the period) | | | | | | | | |
Net asset value, beginning of period | | | $ 9.64 | | | | $10.00 | |
| | |
Income from investment operationsb: | | | | | | | | |
Net investment incomec | | | 0.11 | | | | 0.04 | |
Net realized and unrealized gains (losses) | | | (0.59) | | | | (0.40) | |
| | |
Total from investment operations | | | (0.48) | | | | (0.36) | |
Less distributions from: | | | | | | | | |
Net investment income | | | (0.05) | | | | — | |
Net realized gains | | | (0.02) | | | | — | |
| | |
Total distributions | | | (0.07) | | | | — | |
| | |
Net asset value, end of period | | | $ 9.09 | | | | $ 9.64 | |
| | |
Total returnd | | | (4.86)% | | | | (3.60)% | |
| | |
Ratios to average net assetse | | | | | | | | |
Expenses before waiver and payments by affiliates | | | 6.90% | | | | 13.30% | |
Expenses net of waiver and payments by affiliates | | | 0.97% | | | | 0.97% | |
Net investment income | | | 2.47% | | | | 1.51% | |
| | |
Supplemental data | | | | | | | | |
Net assets, end of period (000’s) | | | $1,818 | | | | $1,929 | |
Portfolio turnover rate | | | 1.55% | | | | 7.95% | |
aFor the period June 1, 2018 (commencement of operations) to August 31, 2018.
bThe amount shown for a share outstanding throughout the period may not correlate with the Statement of Operations for the period due to the timing of sales and repurchases of the Fund’s shares in relation to income earned and/or fluctuating fair value of the investments of the Fund.
cBased on average daily shares outstanding.
dTotal return is not annualized for periods less than one year.
eRatios are annualized for periods less than one year, except fornon-recurring expenses, if any.
| | | | |
| | | |
| | | The accompanying notes are an integral part of these financial statements. | Semiannual Report | | 9 |
TEMPLETON FUNDS
Statement of Investments, February 28, 2019 (unaudited)
Templeton International Climate Change Fund
| | | | | | | | | | | | |
| | | Industry | | | Shares | | | Value | |
| | | |
Common Stocks 92.6% | | | | | | | | | | | | |
| | | |
China 2.9% | | | | | | | | | | | | |
China Mobile Ltd. | | | Wireless Telecommunication Services | | | | 5,000 | | | $ | 52,613 | |
Denmark 7.8% | | | | | | | | | | | | |
Novozymes AS | | | Chemicals | | | | 516 | | | | 23,423 | |
Orsted AS | | | Electric Utilities | | | | 833 | | | | 60,441 | |
Vestas Wind Systems AS | | | Electrical Equipment | | | | 687 | | | | 57,178 | |
| | | |
| | | | | | | | | | | 141,042 | |
France 15.0% | | | | | | | | | | | | |
AXA SA | | | Insurance | | | | 1,608 | | | | 40,778 | |
BNP Paribas SA | | | Banks | | | | 950 | | | | 48,685 | |
Cie Generale des Etablissements Michelin SCA | | | Auto Components | | | | 348 | | | | 41,760 | |
Compagnie de Saint-Gobain | | | Building Products | | | | 755 | | | | 27,189 | |
Sanofi | | | Pharmaceuticals | | | | 587 | | | | 49,075 | |
Sodexo SA | | | Hotels, Restaurants & Leisure | | | | 253 | | | | 27,793 | |
Veolia Environnement SA | | | Multi-Utilities | | | | 1,721 | | | | 37,781 | |
| | | |
| | | | | | | | | | | 273,061 | |
Germany 8.5% | | | | | | | | | | | | |
E.ON SE | | | Multi-Utilities | | | | 4,821 | | | | 53,109 | |
Infineon Technologies AG | | | Semiconductors & Semiconductor Equipment | | | | 1,493 | | | | 32,784 | |
Merck KGaA | | | Pharmaceuticals | | | | 186 | | | | 19,206 | |
Siemens AG | | | Industrial Conglomerates | | | | 461 | | | | 50,407 | |
| | | | | | | | | | | 155,506 | |
India 1.6% | | | | | | | | | | | | |
aAzure Power Global Ltd. | |
| Independent Power & Renewable
Electricity Producers |
| | | 2,600 | | | | 28,600 | |
Israel 1.3% | | | | | | | | | | | | |
aTeva Pharmaceutical Industries Ltd., ADR | | | Pharmaceuticals | | | | 1,400 | | | | 23,562 | |
Italy 2.8% | | | | | | | | | | | | |
Prysmian SpA | | | Electrical Equipment | | | | 2,496 | | | | 50,961 | |
Japan 11.9% | | | | | | | | | | | | |
Ajinomoto Co. Inc. | | | Food Products | | | | 1,500 | | | | 22,666 | |
Asics Corp. | | | Textiles, Apparel & Luxury Goods | | | | 1,800 | | | | 23,936 | |
Astellas Pharma Inc. | | | Pharmaceuticals | | | | 1,700 | | | | 26,214 | |
Murata Manufacturing Co. Ltd. | |
| Electronic Equipment, Instruments
& Components |
| | | 200 | | | | 31,092 | |
Omron Corp. | |
| Electronic Equipment, Instruments
& Components |
| | | 100 | | | | 4,311 | |
Panasonic Corp. | | | Household Durables | | | | 4,600 | | | | 42,308 | |
Suntory Beverage & Food Ltd. | | | Beverages | | | | 600 | | | | 26,435 | |
Takeda Pharmaceutical Co. Ltd. | | | Pharmaceuticals | | | | 991 | | | | 39,740 | |
| | | |
| | | | | | | | | | | 216,702 | |
Netherlands 9.3% | | | | | | | | | | | | |
Akzo Nobel NV | | | Chemicals | | | | 202 | | | | 18,319 | |
Arcadis NV | | | Construction & Engineering | | | | 2,607 | | | | 43,828 | |
ING Groep NV | | | Banks | | | | 3,299 | | | | 43,648 | |
Signify NV | | | Electrical Equipment | | | | 2,407 | | | | 63,929 | |
| | | |
| | | | | | | | | | | 169,724 | |
Singapore 2.0% | | | | | | | | | | | | |
Singapore Telecommunications Ltd. | | | Diversified Telecommunication Services | | | | 16,300 | | | | 36,408 | |
TEMPLETON FUNDS
STATEMENT OF INVESTMENTS ( UNAUDITED)
Templeton International Climate Change Fund(continued)
| | | | | | | | | | | | |
| | | Industry | | | Shares | | | Value | |
| | | |
Common Stocks(continued) | | | | | | | | | | | | |
| | | |
South Korea 2.2% | | | | | | | | | | | | |
| | | |
bSamsung Electronics Co. Ltd., GDR, 144A | | | Technology Hardware, Storage & Peripherals | | | | 40 | | | $ | 39,900 | |
| | | |
Spain 3.5% | | | | | | | | | | | | |
| | | |
aSiemens Gamesa Renewable Energy SA | | | Electrical Equipment | | | | 4,112 | | | | 62,932 | |
| | | |
Sweden 2.8% | | | | | | | | | | | | |
| | | |
Billerudkorsnas AB | | | Containers & Packaging | | | | 2,351 | | | | 30,614 | |
Scandi Standard AB | | | Food Products | | | | 2,890 | | | | 20,458 | |
| | | |
| | | | | | | | | | | 51,072 | |
| | | |
Switzerland 5.7% | | | | | | | | | | | | |
ABB Ltd. | | | Electrical Equipment | | | | 886 | | | | 17,544 | |
Landis+Gyr Group AG | |
| Electronic Equipment, Instruments
& Components |
| | | 823 | | | | 52,234 | |
UBS Group AG | | | Capital Markets | | | | 2,661 | | | | 33,857 | |
| | | |
| | | | | | | | | | | 103,635 | |
| | | |
Taiwan 3.6% | | | | | | | | | | | | |
| | | |
Giant Manufacturing Co. Ltd. | | | Leisure Products | | | | 3,500 | | | | 19,245 | |
Taiwan Semiconductor Manufacturing Co. Ltd., ADR | | | Semiconductors & Semiconductor Equipment | | | | 1,200 | | | | 46,860 | |
| | | |
| | | | | | | | | | | 66,105 | |
| | | |
United Kingdom 11.7% | | | | | | | | | | | | |
| | | |
HSBC Holdings PLC | | | Banks | | | | 3,600 | | | | 29,420 | |
Johnson Matthey PLC | | | Chemicals | | | | 1,281 | | | | 52,546 | |
Kingfisher PLC | | | Specialty Retail | | | | 12,291 | | | | 39,463 | |
SIG PLC | | | Trading Companies & Distributors | | | | 14,028 | | | | 23,292 | |
Standard Chartered PLC | | | Banks | | | | 4,522 | | | | 36,079 | |
Vodafone Group PLC | | | Wireless Telecommunication Services | | | | 17,669 | | | | 31,465 | |
| | | | | | | | | | | 212,265 | |
| | |
Total Common Stocks (Cost $1,858,389) | | | | | | | | 1,684,088 | |
| | |
Short Term Investments (Cost $55,662) 3.1% | | | | | | | | | |
| | | |
Money Market Funds 3.1% | | | | | | | | | | | | |
| | | |
United States 3.1% | | | | | | | | | | | | |
| | | |
c,dInstitutional Fiduciary Trust Money Market Portfolio, 2.06% | | | | | | | 55,662 | | | | 55,662 | |
| | |
Total Investments (Cost $1,914,051) 95.7% | | | | | | | | 1,739,750 | |
Other Assets, less Liabilities 4.3% | | | | | | | | | | | 77,843 | |
| | | |
Net Assets 100.0% | | | | | | | | | | $ | 1,817,593 | |
See Abbreviations on page 21.
aNon-income producing.
bSecurity was purchased pursuant to Rule 144A under the Securities Act of 1933 and may be sold in transactions exempt from registration only to qualified institutional buyers or in a public offering registered under the Securities Act of 1933. This security has been deemed liquid under guidelines approved by the Trust’s Board of Trustees.
cSee Note 3(e) regarding investments in affiliated management investment companies.
dThe rate shown is the annualizedseven-day effective yield at period end.
| | | | |
| | | |
| | The accompanying notes are an integral part of these financial statements. | Semiannual Report | | 11 |
TEMPLETON FUNDS
Financial Statements
Statement of Assets and Liabilities
February 28, 2019 (unaudited)
Templeton International Climate Change Fund
| | | | |
| |
Assets: | | | | |
Investments in securities: | | | | |
Cost - Unaffiliated issuers | | | $1,858,389 | |
Cost -Non-controlled affiliates (Note 3e) | | | 55,662 | |
| | | | |
| |
Value - Unaffiliated issuers | | | $1,684,088 | |
Value -Non-controlled affiliates (Note 3e) | | | 55,662 | |
Receivables: | | | | |
Dividends | | | 1,944 | |
Affiliates | | | 71,791 | |
Offering costs | | | 24,664 | |
Other assets | | | 2 | |
| | | | |
| |
Total assets | | | 1,838,151 | |
| | | | |
| |
Liabilities: | | | | |
Payables: | | | | |
Professional fees | | | 20,476 | |
Accrued expenses and other liabilities | | | 82 | |
| | | | |
| |
Total liabilities | | | 20,558 | |
| | | | |
| |
Net assets, at value | | | $1,817,593 | |
| | | | |
| |
Net assets consist of: | | | | |
Paid-in capital | | | $1,998,856 | |
Total distributable earnings (loss) | | | (181,263 | ) |
| | | | |
| |
Net assets, at value | | | $1,817,593 | |
| | | | |
| |
Shares outstanding | | | 200,000 | |
| | | | |
Net asset value per share | | | $9.09 | |
| | | | |
| | | | |
| | | |
12 | | Semiannual Report | The accompanying notes are an integral part of these financial statements. | | |
TEMPLETON FUNDS
FINANCIAL STATEMENTS
Statement of Operations
for the six months ended February 28, 2019 (unaudited)
Templeton International Climate Change Fund
| | | | |
Investment income: | | | | |
Dividends: (net of foreign taxes)* | | | | |
Unaffiliated issuers | | | $ 30,077 | |
Non-controlled affiliates (Note 3e) | | | 300 | |
| | | | |
| |
Total investment income | | | 30,377 | |
| | | | |
| |
Expenses: | | | | |
Management fees (Note 3a) | | | 6,227 | |
Transfer agent fees (Note 3d) | | | 177 | |
Custodian fees (Note 4) | | | 123 | |
Reports to shareholders | | | 1,644 | |
Registration and filing fees | | | 227 | |
Professional fees | | | 25,488 | |
Amortization of offering costs (Note 1e) | | | 50,878 | |
Other | | | 1,820 | |
| | | | |
| |
Total expenses | | | 86,584 | |
Expenses waived/paid by affiliates (Note 3f) | | | (78,018 | ) |
| | | | |
| |
Net expenses | | | 8,566 | |
| | | | |
| |
Net investment income | | | 21,811 | |
| | | | |
Realized and unrealized gains (losses): | | | | |
Net realized gain (loss) from: | | | | |
Investments: | | | | |
Unaffiliated issuers | | | (17,941 | ) |
Foreign currency transactions | | | 347 | |
| | | | |
| |
Net realized gain (loss) | | | (17,594 | ) |
| | | | |
Net change in unrealized appreciation (depreciation) on: | | | | |
Investments: | | | | |
Unaffiliated issuers | | | (100,341 | ) |
Translation of other assets and liabilities denominated in foreign currencies | | | (7 | ) |
| | | | |
| |
Net change in unrealized appreciation (depreciation) | | | (100,348 | ) |
| | | | |
Net realized and unrealized gain (loss) | | | (117,942 | ) |
| | | | |
Net increase (decrease) in net assets resulting from operations | | $ | (96,131 | ) |
| | | | |
| |
*Foreign taxes withheld on dividends | | $ | 1,563 | |
| | | | |
| | | |
| | | The accompanying notes are an integral part of these financial statements. | Semiannual Report | | 13 |
TEMPLETON FUNDS
FINANCIAL STATEMENTS
Statements of Changes in Net Assets
Templeton International Climate Change Fund
| | | | | | | | |
| | | Six Months Ended
February 28, 2019
(unaudited) | | | Year Ended
August 31, 2018a | |
Increase (decrease) in net assets: | | | | | | | | |
Operations: | | | | | | | | |
Net investment income | | | $ 21,811 | | | | $ 7,277 | |
Net realized gain (loss) | | | (17,594 | ) | | | (4,793 | ) |
Net change in unrealized appreciation (depreciation) | | | (100,348 | ) | | | (73,960 | ) |
| | | | |
| | |
Net increase (decrease) in net assets resulting from operations | | | (96,131 | ) | | | (71,476 | ) |
| | | | |
| | |
Distributions to shareholders (Note 1d) | | | (14,800 | ) | | | — | |
| | | | |
| | |
Capital share transactions (Note 2) | | | — | | | | 2,000,000 | |
| | | | |
| | |
Net increase (decrease) in net assets. | | | (110,931 | ) | | | 1,928,524 | |
Net assets: | | | | | | | | |
Beginning of period | | | 1,928,524 | | | | — | |
| | | | |
| | |
End of period (Note 1d) | | | $1,817,593 | | | | $1,928,524 | |
| | | | |
aFor the period June 1, 2018 (commencement of operations) to August 31, 2018.
| | | | |
| | | |
14 | | Semiannual Report | The accompanying notes are an integral part of these financial statements. | | |
TEMPLETON FUNDS
Notes to Financial Statements (unaudited)
Templeton International Climate Change Fund
1. Organization and Significant Accounting Policies
Templeton Funds (Trust) is registered under the Investment Company Act of 1940 (1940 Act) as anopen-end management investment company, consisting of three separate funds and applies the specialized accounting and reporting guidance in U.S. Generally Accepted Accounting Principles (U.S. GAAP). Templeton International Climate Change Fund (Fund) is included in this report. The Fund has five classes of shares: Class A, Class C, Class R, Class R6 and Advisor Class. Each class of shares may differ by its initial sales load, contingent deferred sales charges, voting rights on matters affecting a single class, its exchange privilege and fees due to differing arrangements for distribution and transfer agent fees.
The Fund currently operates with one class of shares, Advisor Class.
The following summarizes the Fund’s significant accounting policies.
a. Financial Instrument Valuation
The Fund’s investments in financial instruments are carried at fair value daily. Fair value is the price that would be received to sell an asset or paid to transfer a liability in an orderly transaction between market participants on the measurement date. The Fund calculates the net asset value (NAV) per share each business day as of 4 p.m. Eastern time or the regularly scheduled close of the New York Stock Exchange (NYSE), whichever is earlier. Under compliance policies and procedures approved by the Trust’s Board of Trustees (the Board), the Fund’s administrator has responsibility for oversight of valuation, including leading the cross-functional Valuation Committee (VC). The Fund may utilize independent pricing services, quotations from securities and financial instrument dealers, and other market sources to determine fair value.
Equity securities listed on an exchange or on the NASDAQ National Market System are valued at the last quoted sale price or the official closing price of the day, respectively. Foreign equity securities are valued as of the close of trading on the foreign stock exchange on which the security is primarily traded, or as of 4 p.m. Eastern time. The value is then converted into its U.S. dollar equivalent at the foreign exchange rate in effect at 4 p.m. Eastern time on the day that the value of the security is determined.Over-the-counter (OTC) securities are valued within the range of the most recent quoted bid and ask
prices. Securities that trade in multiple markets or on multiple exchanges are valued according to the broadest and most representative market. Certain equity securities are valued based upon fundamental characteristics or relationships to similar securities.
Investments inopen-end mutual funds are valued at the closing NAV.
The Fund has procedures to determine the fair value of financial instruments for which market prices are not reliable or readily available. Under these procedures, the Fund primarily employs a market-based approach which may use related or comparable assets or liabilities, recent transactions, market multiples, book values, and other relevant information for the investment to determine the fair value of the investment. An income-based valuation approach may also be used in which the anticipated future cash flows of the investment are discounted to calculate fair value. Discounts may also be applied due to the nature or duration of any restrictions on the disposition of the investments. Due to the inherent uncertainty of valuations of such investments, the fair values may differ significantly from the values that would have been used had an active market existed.
Trading in securities on foreign securities stock exchanges and OTC markets may be completed before 4 p.m. Eastern time. In addition, trading in certain foreign markets may not take place on every Fund’s business day. Occasionally, events occur between the time at which trading in a foreign security is completed and 4 p.m. Eastern time that might call into question the reliability of the value of a portfolio security held by the Fund. As a result, differences may arise between the value of the Fund’s portfolio securities as determined at the foreign market close and the latest indications of value at 4 p.m. Eastern time. In order to minimize the potential for these differences, the VC monitors price movements following the close of trading in foreign stock markets through a series of country specific market proxies (such as baskets of American Depositary Receipts, futures contracts and exchange traded funds). These price movements are measured against established trigger thresholds for each specific market proxy to assist in determining if an event has occurred that may call into question the reliability of the values of the foreign securities held by the Fund. If such an event occurs, the securities may be valued using fair value procedures, which may include the use of independent pricing services.
TEMPLETON FUNDS
NOTES TO FINANCIAL STATEMENTS (UNAUDITED)
Templeton International Climate Change Fund(continued)
1. Organization and Significant Accounting Policies(continued)
a. Financial Instrument Valuation(continued)
When the last day of the reporting period is anon-business day, certain foreign markets may be open on those days that the Fund’s NAV is not calculated, which could result in differences between the value of the Fund’s portfolio securities on the last business day and the last calendar day of the reporting period. Any significant security valuation changes due to an open foreign market are adjusted and reflected by the Fund for financial reporting purposes.
b. Foreign Currency Translation
Portfolio securities and other assets and liabilities denominated in foreign currencies are translated into U.S. dollars based on the exchange rate of such currencies against U.S. dollars on the date of valuation. The Fund may enter into foreign currency exchange contracts to facilitate transactions denominated in a foreign currency. Purchases and sales of securities, income and expense items denominated in foreign currencies are translated into U.S. dollars at the exchange rate in effect on the transaction date. Portfolio securities and assets and liabilities denominated in foreign currencies contain risks that those currencies will decline in value relative to the U.S. dollar. Occasionally, events may impact the availability or reliability of foreign exchange rates used to convert the U.S. dollar equivalent value. If such an event occurs, the foreign exchange rate will be valued at fair value using procedures established and approved by the Board.
The Fund does not separately report the effect of changes in foreign exchange rates from changes in market prices on securities held. Such changes are included in net realized and unrealized gain or loss from investments in the Statement of Operations.
Realized foreign exchange gains or losses arise from sales of foreign currencies, currency gains or losses realized between the trade and settlement dates on securities transactions and the difference between the recorded amounts of dividends, interest, and foreign withholding taxes and the U.S. dollar equivalent of the amounts actually received or paid. Net unrealized foreign exchange gains and losses arise from changes in foreign exchange rates on foreign denominated assets and liabilities other than investments in securities held at the end of the reporting period.
c. Income and Deferred Taxes
It is the Fund’s policy to qualify as a regulated investment company under the Internal Revenue Code. The Fund intends to distribute to shareholders substantially all of its taxable income and net realized gains to relieve it from federal income and excise taxes. As a result, no provision for U.S. federal income taxes is required.
The Fund may be subject to foreign taxation related to income received, capital gains on the sale of securities and certain foreign currency transactions in the foreign jurisdictions in which it invests. Foreign taxes, if any, are recorded based on the tax regulations and rates that exist in the foreign markets in which the Fund invests. When a capital gain tax is determined to apply, the Fund records an estimated deferred tax liability in an amount that would be payable if the securities were disposed of on the valuation date.
The Fund may recognize an income tax liability related to its uncertain tax positions under U.S. GAAP when the uncertain tax position has a less than 50% probability that it will be sustained upon examination by the tax authorities based on its technical merits. As of February 28, 2019, the Fund has determined that no tax liability is required in its financial statements related to uncertain tax positions for any open tax years (or expected to be taken in future tax years). Open tax years are those that remain subject to examination and are based on the statute of limitations in each jurisdiction in which the Fund invests.
d. Security Transactions, Investment Income, Expenses and Distributions
Security transactions are accounted for on trade date. Realized gains and losses on security transactions are determined on a specific identification basis. Estimated expenses are accrued daily. Dividend income is recorded on theex-dividend date except for certain dividends from securities where the dividend rate is not available. In such cases, the dividend is recorded as soon as the information is received by the Fund. Distributions to shareholders are recorded on theex-dividend date. Distributable earnings are determined according to income tax regulations (tax basis) and may differ from earnings recorded in accordance with U.S. GAAP. These differences may be permanent or temporary. Permanent differences are reclassified among capital accounts to reflect their tax character. These reclassifications
TEMPLETON FUNDS
NOTES TO FINANCIAL STATEMENTS (UNAUDITED)
Templeton International Climate Change Fund(continued)
have no impact on net assets or the results of operations. Temporary differences are not reclassified, as they may reverse in subsequent periods.*
Common expenses incurred by the Trust are allocated among the Funds based on the ratio of net assets of each Fund to the combined net assets of the Trust or based on the ratio of number of shareholders of each Fund to the combined number of shareholders of the Trust. Fund specific expenses are charged directly to the Fund that incurred the expense.
Realized and unrealized gains and losses and net investment income, excluding class specific expenses, are allocated daily to each class of shares based upon the relative proportion of net assets of each class. Differences in per share distributions by class are generally due to differences in class specific expenses.
e. Offering Costs
Offering costs are amortized on a straight line basis over the first twelve months of operations.
f. Accounting Estimates
The preparation of financial statements in accordance with U.S. GAAP requires management to make estimates and assumptions that affect the reported amounts of assets and liabilities at the date of the financial statements and the amounts of income and expenses during the reporting period. Actual results could differ from those estimates.
g. Guarantees and Indemnifications
Under the Trust’s organizational documents, its officers and trustees are indemnified by the Trust against certain liabilities arising out of the performance of their duties to the Trust. Additionally, in the normal course of business, the Trust, on behalf of the Fund, enters into contracts with service providers that contain general indemnification clauses. The Trust’s maximum exposure under these arrangements is unknown as this would involve future claims that may be made against the Trust that have not yet occurred. Currently, the Trust expects the risk of loss to be remote.
*Effective during the current reporting period, it is no longer required to present certain line items in the Statements of Changes in Net Assets. The below prior period amounts affected by this change are shown as they were in the prior year Statements of Changes in Net Assets.
For the year ended August 31, 2018, undistributed net investment income included in net assets was $6,370.
2. Shares of Beneficial Interest
At February 28, 2019, there were an unlimited number of shares authorized (without par value). Transactions in the Fund’s shares were as follows:
| | | | | | | | | | | | | | | | |
| | | Six Months Ended
February 28, 2019 | | | Year Ended
August 31, 2018a | |
| | | Shares | | | Amount | | | Shares | | | Amount | |
Shares sold | | | — | | | | $— | | | | 200,001 | | | | $2,000,010 | |
Shares redeemed | | | — | | | | — | | | | (1 | ) | | | (10 | ) |
Net increase (decrease) | | | — | | | | $— | | | | 200,000 | | | | $2,000,000 | |
aFor the period June 1, 2018 (commencement of operations) to August 31, 2018.
TEMPLETON FUNDS
NOTES TO FINANCIAL STATEMENTS (UNAUDITED)
Templeton International Climate Change Fund(continued)
3. Transactions with Affiliates
Franklin Resources, Inc. is the holding company for various subsidiaries that together are referred to as Franklin Templeton. Certain officers and trustees of the Fund are also officers and/or directors of the following subsidiaries:
| | |
| Subsidiary | | Affiliation |
| Franklin Templeton Investment Corporation (FTIC) | | Investment manager |
| Franklin Templeton Services, LLC (FT Services) | | Administrative manager |
| Franklin Templeton Distributors, Inc. (Distributors) | | Principal underwriter |
| Franklin Templeton Investor Services, LLC (Investor Services) | | Transfer agent |
a. Management Fees
The Fund pays an investment management fee to FTIC based on the average daily net assets of the Fund as follows:
| | |
| Annualized Fee Rate | | Net Assets |
| |
0.705% | | Up to and including $1 billion |
| |
0.690% | | Over $1 billion, up to and including $5 billion |
| |
0.675% | | Over $5 billion, up to and including $10 billion |
| |
0.655% | | Over $10 billion, up to and including $15 billion |
| |
0.635% | | Over $15 billion, up to and including $20 billion |
| |
0.615% | | Over $20 billion, up to and including $25 billion |
| |
0.605% | | Over $25 billion, up to and including $30 billion |
| |
0.595% | | Over $30 billion, up to and including $35 billion |
| |
0.585% | | In excess of $35 billion |
b. Administrative Fees
Under an agreement with FTIC, FT Services provides administrative services to the Fund. The fee is paid by FTIC based on the Fund’s average daily net assets, and is not an additional expense of the Fund.
c. Distribution Fees
The Board has adopted distribution plans for each share class, with the exception of Class R6 and Advisor Class shares, pursuant to Rule12b-1 under the 1940 Act. Under the Fund’s Class A reimbursement distribution plan, the Fund reimburses Distributors for costs incurred in connection with the servicing, sale and distribution of the Fund’s shares up to the maximum annual plan rate. Under the Class A reimbursement distribution plan, costs exceeding the maximum for the current plan year cannot be reimbursed in subsequent periods. In addition, under the Fund’s Class C and R compensation distribution plans, the Fund pays Distributors for costs incurred in connection with the servicing, sale and distribution of the Fund’s shares up to the maximum annual plan rate for each class. The plan year, for purposes of monitoring compliance with the maximum annual plan rates, is February 1 through January 31.
The maximum annual plan rates, based on the average daily net assets, for each class, are as follows:
| | | | |
Class A | | | 0.25 | % |
Class C | | | 1.00 | % |
Class R | | | 0.50 | % |
TEMPLETON FUNDS
NOTES TO FINANCIAL STATEMENTS (UNAUDITED)
Templeton International Climate Change Fund(continued)
d. Transfer Agent Fees
Each class of shares pays transfer agent fees to Investor Services for its performance of shareholder servicing obligations. The fees are based on an annualized asset based fee of 0.02% plus a transaction based fee. In addition, each class reimburses Investor Services for out of pocket expenses incurred and, except for Class R6, reimburses shareholder servicing fees paid to third parties. These fees are allocated daily based upon their relative proportion of such classes’ aggregate net assets. Class R6 pays Investor Services transfer agent fees specific to that class.
For the period ended February 28, 2019, the Fund paid transfer agent fees of $177, which were retained by Investor Services.
e. Investments in Affiliated Management Investment Companies
The Fund invests in one or more affiliated management investment companies for purposes other than exercising a controlling influence over the management or policies. Management fees paid by the Fund are waived on assets invested in the affiliated management investment companies, as noted in the Statement of Operations, in an amount not to exceed the management and administrative fees paid directly or indirectly by each affiliate. During the period ended February 28, 2019, the Fund held investments in affiliated management investment companies as follows:
| | | | | | | | | | | | | | | | | | | | | | | | | | | | | | | | |
| | | Number of
Shares Held
at Beginning
of Period | | | Gross
Additions | | | Gross
Reductions | | | Number of
Shares
Held at End
of Period | | | Value
at End
of
Period | | | Dividend
Income | | | Realized
Gain
(Loss) | | | Net Change in
Unrealized
Appreciation
(Depreciation) | |
| | | | | | | | |
Non-Controlled Affiliates | | | | | | | | | | | | | | | | | | | | | | | | | | | | | | | | |
Institutional Fiduciary Trust Money Market Portfolio, 2.06% | | | 41 | | | | 213,430 | | | | (157,809 | ) | | | 55,662 | | | | $55,662 | | | | $300 | | | | $ — | | | | $ — | |
f. Waiver and Expense Reimbursements
FTIC has contractually agreed in advance to waive or limit its fees and to assume as its own expense certain expenses otherwise payable by the Fund so that the expenses (excluding distribution fees and acquired fund fees and expenses and certainnon-routine expenses or costs, including those relating to litigation, indemnification, reorganizations, and liquidations) of the Fund does not exceed 0.97%, based on the average net assets of each class until December 31, 2019. Total expenses waived or paid are not subject to recapture subsequent to the Fund’s fiscal year end.
g. Other Affiliated Transactions
At February 28, 2019, Franklin Resources, Inc., owned 100% of the Fund’s outstanding shares. Investment activities of this shareholder could have a material impact on the Fund.
4. Expense Offset Arrangement
The Fund has entered into an arrangement with its custodian whereby credits realized as a result of uninvested cash balances are used to reduce a portion of the Fund’s custodian expenses. During the period ended February 28, 2019, there were no credits earned.
5. Income Taxes
For tax purposes, capital losses may be carried over to offset future capital gains.
At August 31, 2018, the capital loss carryforwards were as follows:
| | | | | | |
Capital loss carryforwards not subject to expiration: | | | | | | |
Short Term | | $ | 2,742 | | | |
TEMPLETON FUNDS
NOTES TO FINANCIAL STATEMENTS (UNAUDITED)
Templeton International Climate Change Fund(continued)
5. Income Taxes(continued)
At February 28, 2019, the cost of investments and net unrealized appreciation (depreciation) for income tax purposes were as follows:
| | | | |
Cost of investments | | $ | 1,914,051 | |
| | | | |
| |
Unrealized appreciation | | $ | 44,117 | |
| |
Unrealized depreciation | | | (218,418) | |
| | | | |
| |
Net unrealized appreciation (depreciation) | | $ | (174,301) | |
| | | | |
Differences between income and/or capital gains as determined on a book basis and a tax basis are primarily due to differing treatments of foreign currency transactions and offering costs.
6. Investment Transactions
Purchases and sales of investments (excluding short term securities) for the period ended February 28, 2019, aggregated $108,803 and $189,702, respectively.
7. Concentration of Risk
Investing in foreign securities may include certain risks and considerations not typically associated with investing in U.S. securities, such as fluctuating currency values and changing local and regional economic, political and social conditions, which may result in greater market volatility. Current political and financial uncertainty surrounding the European Union may increase market volatility and the economic risk of investing in securities in Europe. In addition, certain foreign securities may not be as liquid as U.S. securities.
8. Credit Facility
The Fund, together with other U.S. registered and foreign investment funds (collectively, Borrowers), managed by Franklin Templeton, are borrowers in a joint syndicated senior unsecured credit facility totaling $2 billion (Global Credit Facility) which matures on February 7, 2020. This Global Credit Facility provides a source of funds to the Borrowers for temporary and emergency purposes, including the ability to meet future unanticipated or unusually large redemption requests. The Fund began participating in the Global Credit Facility on February 8, 2019.
Under the terms of the Global Credit Facility, the Fund shall, in addition to interest charged on any borrowings made by the Fund and other costs incurred by the Fund, pay its share of fees and expenses incurred in connection with the implementation and maintenance of the Global Credit Facility, based upon its relative share of the aggregate net assets of all of the Borrowers, including an annual commitment fee of 0.15% based upon the unused portion of the Global Credit Facility. These fees are reflected in other expenses in the Statement of Operations. During the period ended February 28, 2019, the Fund did not use the Global Credit Facility.
9. Fair Value Measurements
The Fund follows a fair value hierarchy that distinguishes between market data obtained from independent sources (observable inputs) and the Fund’s own market assumptions (unobservable inputs). These inputs are used in determining the value of the Fund’s financial instruments and are summarized in the following fair value hierarchy:
| | • | | Level 1 – quoted prices in active markets for identical financial instruments |
TEMPLETON FUNDS
NOTES TO FINANCIAL STATEMENTS (UNAUDITED)
Templeton International Climate Change Fund(continued)
| | • | | Level 2 – other significant observable inputs (including quoted prices for similar financial instruments, interest rates, prepayment speed, credit risk, etc.) |
| | • | | Level 3 – significant unobservable inputs (including the Fund’s own assumptions in determining the fair value of financial instruments) |
The input levels are not necessarily an indication of the risk or liquidity associated with financial instruments at that level.
At February 28, 2019, all of the Fund’s investments in financial instruments carried at fair value were valued using Level 1 inputs. For detailed categories, see the accompanying Statement of Investments.
10. Subsequent Events
The Fund has evaluated subsequent events through the issuance of the financial statements and determined that no events have occurred that require disclosure.
Abbreviations
| | |
Selected Portfolio |
| |
ADR | | American Depositary Receipt |
GDR | | Global Depositary Receipt |
TEMPLETON FUNDS
Tax Information (unaudited)
Templeton International Climate Change Fund
At August 31, 2018, more than 50% of the Fund’s total assets were invested in securities of foreign issuers. In most instances, foreign taxes were withheld from income paid to the Fund on these investments. As shown in the table below, the Fund hereby reports to shareholders the foreign source income and foreign taxes paid, pursuant to Section 853 of the Internal Revenue Code. This written statement will allow shareholders of record on December 20, 2018, to treat their proportionate share of foreign taxes paid by the Fund as having been paid directly by them. The shareholder shall consider these amounts as foreign taxes paid in the tax year in which they receive the Fund distribution.
The following table provides a detailed analysis of foreign tax paid, foreign source income, and foreign source qualified dividends as reported by the Fund to shareholders of record.
| | | | | | | | | | | | |
| | | Foreign Tax Paid
Per Share | | | Foreign Source
Income Per Share | | | Foreign Source Qualified
Dividends Per Share | |
| | | |
| | | $0.0037 | | | | $0.0480 | | | | $0.0373 | |
Foreign Tax Paid Per Share is the amount per share available to you, as a tax credit (assuming you held your shares in the Fund for a minimum of 16 days during the31-day period beginning 15 days before theex-dividend date of the Fund’s distribution to which the foreign taxes relate), or, as a tax deduction.
Foreign Source Income Per Share is the amount per share of income dividends attributable to foreign securities held by the Fund, plus any foreign taxes withheld on these dividends. The amounts reported include foreign source qualified dividends that have not been adjusted for the rate differential applicable to such dividend income.1
Foreign Source Qualified Dividends Per Share is the amount per share of foreign source qualified dividends plus any foreign taxes withheld on these dividends. These amounts represent the portion of the Foreign Source Income Per Share that were derived from qualified foreign securities held by the Fund.1
In February 2019, shareholders received Form1099-DIV which included their share of taxes paid and foreign source income distributed during the calendar year 2018. The Foreign Source Income reported on Form1099-DIV was not adjusted for the rate differential on foreign source qualified dividend income. Shareholders are advised to check with their tax advisors for information on the treatment of these amounts on their 2018 individual income tax returns.
1Qualified dividends are taxed at reduced long term capital gains tax rates. In determining the amount of foreign tax credit that may be applied against the U.S. tax liability of individuals receiving foreign source qualified dividends, adjustments may be required to the foreign tax credit limitation calculation to reflect the rate differential applicable to such dividend income. The rules however permit certain individuals to elect not to apply the rate differential adjustments for capital gains and/or dividends for any taxable year. Please consult your tax advisor and the instructions to Form 1116 for more information.
TEMPLETON FUNDS
TEMPLETON INTERNATIONAL CLIMATE CHANGE FUND
Shareholder Information
Proxy Voting Policies and Procedures
The Fund’s investment manager has established Proxy Voting Policies and Procedures (Policies) that the Fund uses to determine how to vote proxies relating to portfolio securities. Shareholders may view the Fund’s complete Policies online at franklintempleton.com. Alternatively, shareholders may request copies of the Policies free of charge by calling the Proxy Group collect at (954)527-7678 or by sending a written request to: Franklin Templeton Companies, LLC, 300 S.E. 2nd Street, Fort Lauderdale, FL 33301, Attention: Proxy Group. Copies of the Fund’s proxy voting records are also made available online at franklintempleton.com and posted on the U.S. Securities and Exchange Commission’s website at sec.gov and reflect the most recent12-month period ended June 30.
Quarterly Statement of Investments
The Trust, on behalf of the Fund, files a complete statement of investments with the U.S. Securities and Exchange Commission for the first and third quarters for each fiscal year as an exhibit to its report on FormN-PORT. Shareholders may view the filed FormN-PORT by visiting the Commission’s website at sec.gov. The filed form may also be viewed and copied at the Commission’s Public Reference Room in Washington, DC. Information regarding the operations of the Public Reference Room may be obtained by calling(800) SEC-0330.
| (a) | The Registrant has adopted a code of ethics that applies to its principal executive officers and principal financial and accounting officer. |
| (f) | Pursuant to Item 12(a)(1), the Registrant is attaching as an exhibit a copy of its code of ethics that applies to its principal executive officers and principal financial and accounting officer. |
| Item 3. | Audit Committee Financial Expert. |
| (a) | (1) The Registrant has an audit committee financial expert serving on its audit committee. |
| | (2) | The audit committee financial expert is David W. Niemiec and he is “independent” as defined under the relevant Securities and Exchange Commission Rules and Releases. |
| Item 4. | Principal Accountant Fees and Services. N/A |
| Item 5. | Audit Committee of Listed Registrants. N/A |
| Item 6. | Schedule of Investments. N/A |
| Item 7. | Disclosure of Proxy Voting Policies and Procedures forClosed-End Management Investment Companies. N/A |
| Item 8. | Portfolio Managers ofClosed-End Management Investment Companies. N/A |
| Item 9. | Purchases of Equity Securities byClosed-End Management Investment Company and Affiliated Purchasers. N/A |
| Item 10. | Submission of Matters to a Vote of Security Holders. |
There have been no changes to the procedures by which shareholders may recommend nominees to the Registrant’s Board of Trustees that would require disclosure herein.
| Item 11. | Controls and Procedures. |
(a) Evaluation of Disclosure Controls and Procedures. The Registrant maintains disclosure controls and procedures that are designed to provide reasonable assurance that information required to be disclosed in the Registrant’s filings under the Securities Exchange Act of 1934, as amended, and the Investment
Company Act of 1940 is recorded, processed, summarized and reported within the periods specified in the rules and forms of the Securities and Exchange Commission. Such information is accumulated and communicated to the Registrant’s management, including its principal executive officer and principal financial officer, as appropriate, to allow timely decisions regarding required disclosure. The Registrant’s management, including the principal executive officer and the principal financial officer, recognizes that any set of controls and procedures, no matter how well designed and operated, can provide only reasonable assurance of achieving the desired control objectives.
Within 90 days prior to the filing date of this Shareholder Report on FormN-CSRS, the Registrant had carried out an evaluation, under the supervision and with the participation of the Registrant’s management, including the Registrant’s principal executive officer and the Registrant’s principal financial officer, of the effectiveness of the design and operation of the Registrant’s disclosure controls and procedures. Based on such evaluation, the Registrant’s principal executive officer and principal financial officer concluded that the Registrant’s disclosure controls and procedures are effective.
(b) Changes in Internal Controls: Effective November 1, 2018, the Registrant’s controls were enhanced through the implementation of a daily secondary review of market events following the close of trading on foreign stock markets to ensure the appropriate application of market level fair value.
| Item 12. | Disclosure of Securities Lending Activities forClosed-End Management Investment Company. N/A |
(a) (1)Code of Ethics
(a) (2) Certifications pursuant to Section 302 of the Sarbanes-Oxley Act of 2002 of Matthew T. Hinkle, Chief Executive Officer – Finance and Administration, and Robert G. Kubilis, Chief Financial Officer and Chief Accounting Officer
(b) Certifications pursuant to Section 906 of the Sarbanes-Oxley Act of 2002 of Matthew T. Hinkle, Chief Executive Officer – Finance and Administration, and Robert G. Kubilis, Chief Financial Officer and Chief Accounting Officer
SIGNATURES
Pursuant to the requirements of the Securities Exchange Act of 1934 and the Investment Company Act of 1940, the registrant has duly caused this report to be signed on its behalf by the undersigned, thereunto duly authorized.
TEMPLETON FUNDS
| | |
| By | | /s/ MATTHEW T. HINKLE |
| | Matthew T. Hinkle |
| | Chief Executive Officer – Finance and Administration |
Date April 26, 2019
Pursuant to the requirements of the Securities Exchange Act of 1934 and the Investment Company Act of 1940, this report has been signed below by the following persons on behalf of the registrant and in the capacities and on the dates indicated.
| | |
| By | | /s/ MATTHEW T. HINKLE |
| | Matthew T. Hinkle |
| | Chief Executive Officer – Finance and Administration |
Date April 26, 2019
| | |
| By | | /s/ ROBERT G. KUBILIS |
| | Robert G. Kubilis |
| | Chief Financial Officer and Chief Accounting Officer |
Date April 26, 2019