UNITED STATES
SECURITIES AND EXCHANGE COMMISSION
Washington, D.C. 20549
FORM N-CSR
CERTIFIED SHAREHOLDER REPORT OF REGISTERED
MANAGEMENT INVESTMENT COMPANIES
Investment Company Act file number 811- 2485
John Hancock Current Interest
(Exact name of registrant as specified in charter)
601 Congress Street, Boston, Massachusetts 02210
(Address of principal executive offices) (Zip code)
Brian E. Langenfeld, Attorney and Assistant Secretary
601 Congress Street
Boston, Massachusetts 02210
(Name and address of agent for service)
Registrant's telephone number, including area code: 617-663-4320
Date of fiscal year end: March 31
Date of reporting period: September 30, 2005
ITEM 1. REPORT TO SHAREHOLDERS.
|

| Table of contents |
|
| Your fund at a glance |
| page 1 |
|
| Managers’ report |
| page 2 |
|
| Your expenses |
| page 5 |
|
| Fund’s investments |
| page 7 |
|
| Financial statements |
| page 9 |
|
| For more information |
| page 21 |
|
To Our Shareholders,
I am pleased to be writing to you as the new President and Chief Executive Officer of John Hancock Funds, LLC, following the departure of James A. Shepherdson to pursue other opportunities. In addition, on July 25, 2005, your fund’s Board of Trustees appointed me to the roles of President and Chief Executive Officer of your fund.
As a means of introduction, I have been involved in the mutual fund industry since 1985. I have been with John Hancock Funds for the last 15 years, most recently as executive vice president of retail sales and marketing and a member of the company’s executive and investment committees. In my former capacity, I was responsible for all aspects of the distribution and marketing of John Hancock Funds’ open-end and closed-end funds. Outside of John Hancock, I have served as Chairman of the Investment Company Institute (ICI) Sales Force Marketing Committee since September 2003.
It is an exciting time to be at John Hancock Funds, and I am grateful for the opportunity to lead and shape its future growth. With the acquisition of John Hancock by Manulife Financial Corporation in April 2004, we are receiving broad support toward the goal of providing our shareholders with excellent investment opportunities and a more complete lineup of choices for the discerning investor.
For one example, we have recently added five “Lifestyle Portfolio” funds-of-funds that blend multiple fund offerings from internal and external money managers to create a broadly diversified asset allocation portfolio. Look for more information about these exciting additions to the John Hancock family of funds in the near future.
Although there has been a change in executive-level management, rest assured that the one thing that never wavers is John Hancock Funds’ commitment to placing the needs of shareholders above all else. We are all dedicated to the task of working with you and your financial advisors to help you reach your long-term financial goals.
Sincerely,

Keith F. Hartstein,
President and Chief Executive Officer
This commentary reflects the CEO’s views as of September 30, 2005. They are subject to change at any time.
YOUR FUND
AT A GLANCE
The Fund seeks
the maximum
current income
that is consistent
with maintaining
liquidity and
preserving capital.
The Fund intends to
maintain a stable
$1 share price.
Over the last six months
* The economy grew at a strong pace, prompting the Federal Reserve to continue raising short-term interest rates.
* Money market yields rose along with interest rates.
* The Fund used floating rate securities as one way to react quickly to higher rates.
The total return for the Fund is at net asset value with all distributions reinvested. Past performance is no guarantee of future results.
1
BY DAVID A. BEES AND DAVID P. LYNCH FOR THE PORTFOLIO MANAGEMENT TEAM
JOHN HANCOCK
U.S. Government Cash Reserve
The six-month period ending September 30, 2005 was marked by rising money market yields that came as a result of the Federal Reserve’s continued increases in short-term interest rates. The period began with data showing that overall economic growth was solid, despite increasing energy prices. Gross Domestic Product growth for the first quarter of 2005 came in at 3.8%, while the unemployment rate declined to 5.2% and price indicators showed inflation was within acceptable limits. In a highly anticipated move, the Fed responded by increasing the federal funds rates that banks charge each other for overnight loans from 2.75% to 3.00% at its May meeting, and to 3.25% at its June meeting. In its accompanying statements, the Fed expressed optimism at the strength of the economy and overall labor market, and indicated that, while energy prices have taken a toll in the short term on the economy and inflation, it believed long-term inflation expectations remained “contained.” The Fed also noted that as long as the economy remained strong, it believed it was possible to maintain its stance of “measured” rate hikes that would serve to bring unsustainably low rates back to a more reasonable level without derailing the economy.
“The six-month period ending
September 30, 2005 was
marked by rising money
market yields...”
|
As the period progressed and energy prices remained high, there was speculation that the Fed might wait a couple of meetings before continuing to raise rates so it could get a better sense of what effect energy prices were having on the economy. Instead, the Fed continued to increase the federal funds rates to 3.50% during its August meeting and signaled confidence in the strength of the overall economy, at the same time acknowledging that high energy prices had made short-term inflation a concern. In addition to inflation concerns, Fed chairman Alan Greenspan and others at the Fed expressed concern about accelerating housing prices and their potential to affect the stability of the economy.2

The end of the period was dominated by news of two of the most damaging natural disasters to occur in this country. Hurricanes Katrina and Rita devastated areas along the Gulf Coast, causing massive personal and economic loss. Energy prices, already high, spiked on news that much of the energy infrastructure was damaged by the hurricanes. Many questioned if the Fed should hold off increasing rates at its September meeting to see what effect the hurricanes would have on the economy. Instead the Fed again voted to increase the fed funds rate for the 11th straight time to 3.75% at its September meeting. While acknowledging the hurricanes’ devastating short-term impact on economic conditions and short-term inflation, it did not see it as a persistent threat.
Fund yield and performance
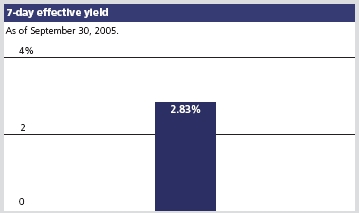
On September 30, 2005, John Hancock U.S. Government Cash Reserve had a 7-day effective yield of 2.83% . By comparison, the average taxable government money market fund had a 7-day effective yield of 2.95%, according to Lipper, Inc.
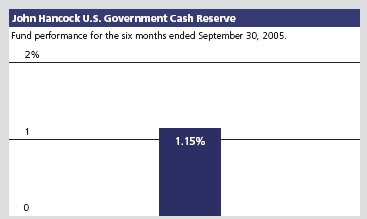
For the six months ended September 30, 2005, the Fund posted a total return of 1.15% at net asset value, compared with the 1.20% return of the average U.S. government money market fund, according to Lipper, Inc. Keep in mind that your net asset value return will be different from the Fund’s performance if you were not invested in the Fund for the entire period and did not reinvest all distributions.
Fund moves
“We believe the Federal Reserve
will continue to raise short-term
interest rates...” |
The structure of the portfolio has remained relatively stable throughout the last six months. With all signs indicating higher short-term interest rates, the Fund was structured to take advantage of such a scenario. We used floating-rate securities extensively as their rate-reset feature allows the Fund to benefit from increasing rates. The Fund also continued to maintain a weighted average maturity that was shorter than our peers. This allowed the Fund to take advantage of the increasing rates quicker than our peers. In addition to floating-rate securities, the Fund continued to use short-term agency coupon bonds, and agency discount notes.
3
Outlook
We believe the Federal Reserve will continue to raise short-term interest rates, but the pace of the increases will depend on the continued strength of the economy, inflationary concerns and the status of energy prices. The Fed has made it clear that maintaining a stable inflationary environment is a major priority. The Fed has also addressed the issue of increased asset prices, namely housing, and said that higher interest rates could slowly relieve some of the price pressures seen in many markets. As long as economic growth remains steady in the face of current high energy prices and events like Hurricanes Katrina and Rita, we believe the Fed is likely to continue to raise the federal funds rate in the near future.
With this outlook, we will continue to position the Fund to take advantage of higher interest rates. We will continue to use floating-rate-securities and we’ll also continue to keep the Fund’s weighted-average maturity shorter than its peers to reinvest funds at higher rates. At the same time that we remain focused on capturing additional yield, we will strive, as always, to maintain liquidity and preserve stability of principal.
This commentary reflects the views of the portfolio management team through the end of the Fund’s period discussed in this report. The team’s statements reflect their own opinions. As such, they are in no way guarantees of future events, and are not intended to be used as investment advice or a recommendation regarding any specific security. They are also subject to change at any time as market and other conditions warrant.
The Fund is neither insured nor guaranteed by the U.S. government. Although the Fund seeks to maintain a net asset value of $1.00 per share, it is possible to lose money by investing in the Fund.
4
YOUR
EXPENSES
These examples are intended to help you understand your ongoing
operating expenses.
Understanding fund expenses
As a shareholder of the Fund, you incur two types of costs:
* Transaction costs which include minimum account fee charge, etc.
* Ongoing operating expenses including management fees, distribution and service fees (if applicable) and other fund expenses.
We are going to present only your ongoing operating expenses here.
Actual expenses/actual returns
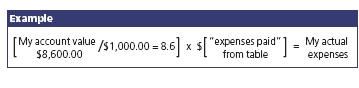
This example is intended to provide information about your fund’s actual ongoing operating expenses, and is based on your fund’s actual return. It assumes an account value of $1,000.00 on March 31, 2005, with the same investment held until September 30, 2005.
| Account value | | Expenses paid |
| $1,000.00 | Ending value | during period |
| on 3-31-05 | on 9-30-05 | ended 9-30-051 |
|
| U.S. Government Cash Reserve | $1,011.50 | $4.73 |
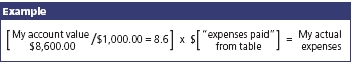
Together with the value of your account, you may use this information to estimate the operating expenses that you paid over the period. Simply divide your account value at September 30, 2005 by $1,000.00, then multiply it by the “expenses paid” for your share class from the table above. For example, for an account value of $8,600.00, the operating expenses should be calculated as follows:
5
Hypothetical example for comparison purposes
This table allows you to compare your fund’s ongoing operating expenses with those of any other fund. It provides an example of the Fund’s hypothetical account values and hypothetical expenses based on the Fund’s actual expense ratio and an assumed 5% annual return before expenses (which is not your fund’s actual return). It assumes an account value of $1,000.00 on March 31, 2005, with the same investment held until September 30, 2005. Look in any other fund shareholder report to find its hypothetical example and you will be able to compare these expenses.
| Account value | | Expenses paid |
| $1,000.00 | Ending value | during period |
| on 3-31-05 | on 9-30-05 | ended 9-30-051 |
|
| |
| U.S. Government Cash Reserve | $1,020.40 | $4.75 |
Remember, these examples do not include any transaction costs, such as minimum account fee charges; therefore, these examples will not help you determine the relative total costs of owning different funds. If transaction costs were included, your expenses would have been higher. See the prospectus for details regarding transaction costs.
1 Expenses are equal to the Fund’s annualized expense ratio of 0.93%, multiplied by the average account value over the period, multiplied by number of days in most recent fiscal half-year/365 or 366 (to reflect the one-half year period).
6
F I N A N C I A L S TAT E M E N T S
FUND’S
INVESTMENTS
Securities owned
by the Fund on
September 30, 2005
(unaudited)
|
This schedule is a complete list of all securities owned by the Fund. It’s divided into two categories: U.S. government obligations and joint repurchase agreement.
| | | Interest | Maturity | Credit | Par value | |
| Issuer | | rate | date | rating (A) | (000) | Value |
|
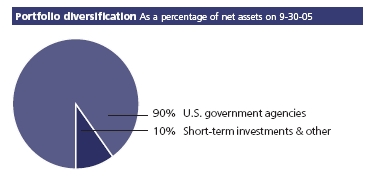
| U.S. government obligations 89.75% | | | | $39,268,254 |
| (Cost $39,268,254) | | | | | | |
| | | | |
| Government -- U.S. Agencies 89.75% | | | | 39,268,254 |
|
| Federal Home Loan Bank (P) | | 3.885% | 03-28-06 | AAA | $1,650 | 1,649,401 |
|
| Federal Home Loan Bank | | 3.751 | 11-14-05 | AAA | 900 | 895,894 |
|
| Federal Home Loan Bank | | 3.697 | 11-09-05 | AAA | 2,126 | 2,117,524 |
|
| Federal Home Loan Bank (P) | | 3.411 | 10-05-05 | AAA | 1,900 | 1,899,981 |
|
| Federal Home Loan Mortgage Corp. | 3.731 | 11-15-05 | AAA | 5,000 | 4,976,813 |
|
| Federal Home Loan Mortgage Corp. (P) | 3.702 | 11-07-05 | AAA | 3,500 | 3,499,959 |
|
| Federal Home Loan Mortgage Corp. (P) | 3.510 | 10-07-05 | AAA | 3,600 | 3,599,981 |
|
| Federal National Mortgage Assn. | | 3.738 | 11-16-05 | AAA | 2,500 | 2,488,117 |
|
| Federal National Mortgage Assn. (P) | 3.715 | 05-22-06 | AAA | 3,250 | 3,249,555 |
|
| Federal National Mortgage Assn. | | 3.702 | 11-02-05 | AAA | 2,000 | 1,993,442 |
|
| Federal National Mortgage Assn. (P) | 3.697 | 10-21-05 | AAA | 2,200 | 2,199,931 |
|
| Federal National Mortgage Assn. (P) | 3.687 | 02-17-06 | AAA | 2,000 | 1,999,898 |
|
| Federal National Mortgage Assn. (P) | 3.678 | 12-09-05 | AAA | 3,000 | 2,999,514 |
|
| Federal National Mortgage Assn. (P) | 3.576 | 01-09-06 | AAA | 3,150 | 3,149,638 |
|
| Federal National Mortgage Assn. (P) | 3.386 | 10-03-05 | AAA | 1,750 | 1,749,991 |
|
| Federal National Mortgage Assn. | | 2.270 | 11-17-05 | AAA | 800 | 798,615 |
| |
| | | | | Interest | Par value | |
| Issuer, description, maturity date | | | | rate | (000) | Value |
|
| Joint repurchase agreement 10.03% | | | | | $4,386,000 |
| (Cost $4,386,000) | | | | | | |
| Investment in a joint repurchase agreement transaction | | | | |
| with Morgan Stanley -- Dated 9-30-05 due 10-3-05 | | | | |
| (secured by U.S. Treasury Inflation Indexed Bond 3.875% | | | |
| due 4-15-32) | | | | 3.250% | $4,386 | 4,386,000 |
| |
| |
| |
| |
| | | | | | See notes to |
| | | | | | financial statements. |
| |
| | | | | | | 7 |
F I N A N C I A L S TAT E M E N T S
| Total investments 99.78% | $43,654,254 |
|
| Other assets and liabilities, net 0.22% | $97,836 |
|
| Total net assets 100.00% | $43,752,090 |
(A) Credit ratings are unaudited and are rated by Moody’s Investors Service, where Standard & Poor’s ratings are not available.
(P) Represents rate in effect on September 30, 2005.
The percentage shown for each investment category is the total value of that category as a percentage of the net assets of the Fund.
See notes to financial statements.
8
F I N A N C I A L S TAT E M E N T S
ASSETS AND
LIABILITIES
September 30, 2005
(unaudited)
This Statement
of Assets and
Liabilities is the
Fund’s balance
sheet. It shows
the value of
what the Fund
owns, is due
and owes. You’ll
also find the net
asset value for
each share.
|
| Assets | |
| Investments at value (cost $39,268,254) | $39,268,254 |
| Joint repurchase agreement (cost $4,386,000) | 4,386,000 |
| Cash | 212 |
| Interest receivable | 127,474 |
| Other assets | 55,001 |
| Total assets | 43,836,941 |
|
| Liabilities | |
| Dividends payable | 4,273 |
| Payable to affiliates | |
| Management fees | 17,911 |
| Other | 12,590 |
| Other payables and accrued expenses | 50,077 |
| Total liabilities | 84,851 |
|
| Net assets | |
| Capital paid-in | 43,751,382 |
| Accumulated net investment income | 708 |
| Net assets | $43,752,090 |
|
| Net asset value per share | |
| Based on net asset value and shares outstanding-- | |
| the Fund has an unlimited number of shares | |
| authorized with no par value | |
| ($43,752,090 ÷ 43,770,134 shares) | $1.00 |
See notes to financial statements.
9
F I N A N C I A L S TAT E M E N T S
OPERATIONS
For the period ended
September 30, 2005
(unaudited)1
This Statement
of Operations
summarizes the
Fund’s investment
income earned and
expenses incurred in
operating the Fund.
|
| Investment income | |
| Interest | $710,372 |
| Total investment income | 710,372 |
|
| Expenses | |
| Investment management fees | 110,834 |
| Transfer agent fees | 34,472 |
| Distribution and service fees | 33,250 |
| Registration and filing fees | 15,626 |
| Custodian fees | 14,905 |
| Professional fees | 11,112 |
| Printing | 8,987 |
| Accounting and legal services fees | 5,542 |
| Miscellaneous | 3,028 |
| Trustees’ fees | 2,020 |
| Interest | 121 |
| Total expenses | 239,897 |
| Less expense reductions | (33,250) |
| Net expenses | 206,647 |
| Net investment income | 503,725 |
| Increase in net assets from operations | $503,725 |
| |
| 1 Semiannual period from 4-1-05 through 9-30-05. | |
See notes to financial statements.
10
F I N A N C I A L S TAT E M E N T S
CHANGES IN
NET ASSETS
These Statements
of Changes in Net
Assets show how
the value of the
Fund’s net assets
has changed
during the last
two periods. The
difference reflects
earnings less
expenses, distribu-
tions, if any, paid to
shareholders and
the net of Fund
share transactions.
|
| | Year | Period |
| | ended | ended |
| | 3-31-05 | 9-30-051 |
|
| Increase (decrease) in net assets | | |
| From operations | | |
| Net investment income | $405,139 | $503,725 |
| Increase in net assets resulting | | |
| from operations | 405,139 | 503,725 |
| Distributions to shareholders | | |
| From net investment income | (405,139) | (503,725) |
| From Fund share transactions | (11,646,570) | (1,736,319) |
|
| Net assets | | |
| Beginning of period | 57,134,979 | 45,488,409 |
| End of period2 | $45,488,409 | $43,752,090 |
| |
| 1 Semiannual period from 4-1-05 through 9-30-05. Unaudited. | |
| 2 Includes accumulated net investment income of $708 and $708, respectively. |
See notes to financial statements.
11
F I N A N C I A L H I G H L I G H T S
COMMON SHARES
The Financial Highlights show how the Fund’s net asset value for a
share has changed since the end of the previous period.
| Period ended | 3-31-011 | 3-31-021 | 3-31-03 | 3-31-04 | 3-31-05 | 9-30-052 |
|
| Per share operating performance | | | | | | |
| Net asset value, | | | | | | |
| beginning of period | $1.00 | $1.00 | $1.00 | $1.00 | $1.00 | $1.00 |
| Net investment income3 | 0.06 | 0.03 | 0.01 | --4 | 0.01 | 0.01 |
| Less distributions | | | | | | |
| From net investment income | (0.06) | (0.03) | (0.01) | --4 | (0.01) | (0.01) |
| Net asset value, end of period | $1.00 | $1.00 | $1.00 | $1.00 | $1.00 | $1.00 |
| Total return5,6 (%) | 5.82 | 2.60 | 0.91 | 0.34 | 0.80 | 1.157 |
|
| Ratios and supplemental data | | | | | | |
| Net assets, end of period | | | | | | |
| (in millions) | $92 | $95 | $73 | $57 | $45 | $44 |
| Ratio of expenses | | | | | | |
| to average net assets (%) | 0.64 | 0.72 | 0.73 | 0.77 | 0.84 | 0.938 |
| Ratio of adjusted expenses | | | | | | |
| to average net assets9 (%) | 0.91 | 0.87 | 0.88 | 0.92 | 0.99 | 1.088 |
| Ratio of net investment income | | | | | | |
| to average net assets (%) | 5.71 | 2.55 | 0.92 | 0.34 | 0.77 | 2.278 |
| 1 | Audited by previous auditor. |
| 2 | Semiannual period from 4-1-05 through 9-30-05. Unaudited. |
| 3 | Based on the average of the shares outstanding. |
| 4 | Less than $0.01 per share. |
| 5 | Assumes dividend reinvestment. |
| 6 | Total returns would have been lower had certain expenses not been reduced during the periods shown. |
| 7 | Annualized. |
| 8 | Not annualized. |
| 9 | Does not take into consideration expense reductions during the periods shown. |
| |
See notes to financial statements.
12
NOTES TO
STATEMENTS
Unaudited
Note A
Accounting policies
John Hancock U.S. Government Cash Reserve (the “Fund”) is a diversified series of John Hancock Current Interest, an open-end management investment company registered under the Investment Company Act of 1940. The investment objective of the Fund is to provide maximum current income consistent with maintaining liquidity and preserving capital.
Significant accounting policies
of the Fund are as follows:
Valuation of investments
Securities in the Fund’s portfolio are valued at amortized cost, in accordance with Rule 2a-7 of the Investment Company Act of 1940, which approximates market value. The amortized cost method involves valuing a security at its cost on the date of purchase and thereafter assuming a constant amortization to maturity of the difference between the principal amount due at maturity and the cost of the security to the Fund.
Joint repurchase agreement
Pursuant to an exemptive order issued by the Securities and Exchange Commission, the Fund, along with other registered investment companies having a management contract with John Hancock Advisers, LLC (the “Adviser”), a wholly owned subsidiary of John Hancock Financial Services, Inc., may participate in a joint repurchase agreement transaction. Aggregate cash balances are invested in one or more large repurchase agreements, whose underlying securities are obligations of the U.S. government and/or its agencies. The Fund’s custodian bank receives delivery of the underlying securities for the joint account on the Fund’s behalf. The Adviser is responsible for ensuring that the agreement is fully collateralized at all times.
Investment transactions
Investment transactions are recorded as of the date of purchase, sale or maturity. Net realized gains and losses on sales of investments are determined on the identified cost basis.
Expenses
The majority of expenses are directly identifiable to an individual fund. Expenses that are not readily identifiable to a specific fund are allocated in such a manner as deemed equitable, taking into consideration, among other things, the nature and type of expense and the relative sizes of the funds.
Federal income taxes
The Fund qualifies as a “regulated investment company” by complying with the applicable provisions of the Internal Revenue Code and will not be subject to federal income tax on taxable income that is distributed to shareholders. Therefore, no federal income tax provision is required.
Distributions
The Fund’s net investment income is declared daily as dividends to shareholders of record as of the
13
close of business on the preceding day and distributed monthly.
During the year ended March 31, 2005, the tax character of distributions paid was as follows: ordinary income $405,139.
Such distributions, on a tax basis, are determined in conformity with income tax regulations, which may differ from accounting principles generally accepted in the United States of America. Distributions in excess of tax basis earnings and profits, if any, are reported in the Fund’s financial statements as a return of capital.
Use of estimates
The preparation of these financial statements, in accordance with accounting principles generally accepted in the United States of America, incorporates estimates made by management in determining the reported amount of assets, liabilities, revenues and expenses of the Fund. Actual results could differ from these estimates.
Note B
Management fee and
transactions with
affiliates and others
The Fund has an investment management contract with the Adviser. Under the investment management contract, the Fund pays a monthly management fee to the Adviser equivalent, on an annual basis, to the sum of: (a) 0.50% of the first $500,000,000 of the Fund’s average daily net asset value, (b) 0.425% of the next $250,000,000, (c) 0.375% of the next $250,000,000, (d) 0.35% of the next $500,000,000, (e) 0.325% of the next $500,000,000, (f) 0.30% of the next $500,000,000 and (g) 0.275% of the average daily net asset value in excess of $2,500,000,000.
The Fund has a Distribution Plan with John Hancock Funds, LLC (“JH Funds”), a wholly owned subsidiary of the Adviser. The Fund has adopted a Distribution Plan pursuant to Rule 12b-1 under the Investment Company Act of 1940 to reimburse JH Funds for the services it provides as distributor of shares of the Fund at an annual rate not to exceed 0.15% of the Fund’s average daily net asset value. JH Funds has agreed to suspend the distribution and service (“12b-1 fee”), at least until July 31, 2006. Accordingly, the reduction in the 12b-1 fee amounted to $33,250 for the period ended September 30, 2005. JH Funds reserves the right to terminate this limitation in the future.
The Fund has a transfer agent agreement with John Hancock Signature Services, Inc. (“Signature Services”), an indirect subsidiary of John Hancock Life Insurance Company. The Fund pays a monthly transfer agent fee at an annual rate of 0.015% of the average daily net asset value, plus a fee based on the number of shareholder accounts and reimbursement for certain out-of-pocket expenses. Signature Services agreed to voluntarily reduce the Fund’s asset-based portion of the transfer agent fee if the total transfer agent fee exceeds the Lipper, Inc. median transfer agency fee for comparable mutual funds by 0.05% . There were no transfer agent fee reductions during the period ended September 30, 2005. Signature Services reserves the right to terminate this limitation at any time.
The Fund has an agreement with the Adviser to perform necessary tax, accounting and legal services for the Fund. The compensation for the period amounted to $5,542. The Fund also paid the Adviser the amount of $80 for certain publishing services, included in the printing fees, and the amount of $727 for certain compliance costs included in miscellaneous expenses.
Mr. James R. Boyle is an offi-cer of certain affiliates of the Adviser, as well as an affiliated Trustee of the Fund and is compensated by the Adviser and/or its affiliates. The compensation of other unaffiliated Trustees is borne by the Fund. The unaffiliated Trustees may elect to defer, for tax purposes, their receipt of this compensation
14
under the John Hancock Group of Funds Deferred Compensation Plan. The Fund makes investments into other John Hancock funds, as applicable, to cover its liability for the deferred compensation. Investments to cover the Fund’s deferred compensation liability are recorded on the Fund’s books as an other asset. The deferred compensation liability and the related other asset are always equal and are marked to market on a periodic basis to reflect any income earned by the investments, as well as any unrealized gains or losses. The Deferred Compensation Plan investments had no impact on the operations of the Fund.
Note C
Fund share transactions
This listing illustrates the number of Fund shares sold, reinvested and repurchased during the last two periods, along with the corresponding dollar value.
| | Year ended 3-31-05 | | Period ended 9-30-051 | |
| | Shares | Amount | Shares | Amount |
| Sold | 23,573,220 | $23,573,220 | 9,759,094 | $9,759,094 |
| Distributions reinvested | 385,964 | 385,964 | 480,372 | 480,372 |
| Repurchased | (35,605,754) | (35,605,754) | (11,975,785) | (11,975,785) |
| Net decrease | (11,646,570) | ($11,646,570) | (1,736,319) | ($1,736,319) |
| |
| 1 Semiannual period from 4-1-05 through 9-30-05. Unaudited. | | |
Note D
Investment
transactions
Purchases and proceeds from
sales or maturities of securi-
ties, including discount
earned on investment securi-
ties, during the period ended
September 30, 2005, aggre-
gated $847,087,195 and
$849,084,000, respectively.
The cost of investments
owned on September 30,
2005, including short-term
investments, for federal
income tax purposes,
was $43,654,254.
|
15
Board Consideration
of and Continuation
of Investment Advisory Agreement:
John Hancock
U.S. Government
Cash Reserve
Section 15(c) of the Investment Company Act of 1940 (the “1940 Act”) requires the Board of Trustees (the “Board”) of John Hancock Current Interest (the “Trust”), including a majority of the Trustees who have no direct or indirect interest in the investment advisory agreement and are not “interested persons” of the Trust, as defined in the 1940 Act (the “Independent Trustees”), annually to review and consider the continuation of the investment advisory agreement (the “Advisory Agreement”) with John Hancock Advisers, LLC (the “Adviser”) for the John Hancock U.S. Government Cash Reserve (the “Fund”).
At meetings held on May 19-20 and June 6-7, 2005, the Board, including the Independent Trustees, considered the factors and reached the conclusions described below relating to the selection of the Adviser and the continuation of the Advisory Agreement. During such meetings, the Board’s Contracts/Operations Committee and the Independent Trustees also met in executive sessions with their independent legal counsel. In evaluating the Advisory Agreement, the Board, including the Contracts/Operations Committee and the Independent Trustees, reviewed a broad range of information requested for this purpose by the Independent Trustees, including but not limited to the following: (i) the investment performance of the Fund and a broader universe of relevant funds (the “Universe”) selected by Lipper Inc. (“Lipper”), an independent provider of investment company data, for a range of periods, (ii) advisory and other fees incurred by, and the expense ratios of, the Fund and a peer group of comparable funds selected by Lipper (the “Peer Group”), (iii) the advisory fees of comparable portfolios of other clients of the Adviser, (iv) the Adviser’s financial results and condition, including its and certain of its affiliates’ profitability from services performed for the Fund, (v) breakpoints in the Fund’s and the Peer Group’s fees and a study undertaken at the direction of the Independent Trustees as to the allocation of the benefits of economies of scale between the Fund and the Adviser, (vi) the Adviser’s record of compliance with applicable laws and regulations, with the Fund’s investment policies and restrictions, and with the Fund’s Code of Ethics and the structure and responsibilities of the Adviser’s compliance department, (vii) the background and experience of senior management and investment professionals, and (viii) the nature, cost and character of advisory and non-investment management services provided by the Adviser and its affiliates.
Nature, extent and quality
of services
The Board considered the ability of the Adviser, based on its resources, reputation and other attributes, to attract and retain qualified investment professionals, including research, advisory and supervisory personnel. The Board further considered the compliance programs and compliance records of the Adviser. In addition, the Board took into account the administrative services provided to the Fund by the Adviser and its affiliates.
Based on the above factors, together with those referenced below, the Board concluded that, within the context of its full deliberations, the nature, extent and quality of the investment advisory services provided to the Fund by the Adviser were sufficient to support renewal of the Advisory Agreement.
Fund performance
The Board considered the performance results for the Fund over various time periods. The Board also considered these results in
16
comparison to the performance of the Universe, as well as the Fund’s benchmark indexes. Lipper determined the Universe for the Fund. The Board reviewed with a representative of Lipper the methodology used by Lipper to select the funds in the Universe and the Peer Group.
The Board noted that the performance of the Fund was higher than or not appreciably below the median and average performance of its Universe and the performance of one of its benchmark indexes, the Lipper U.S. Government Money Market Funds Index, for the time periods under review. The Board also noted that the Fund’s performance was below that of its other benchmark index, the Average/Total of iMoneyNet Universe, as was the Universe, for the time periods under review.
Investment advisory fee
rates and expenses
The Board reviewed and considered the contractual investment advisory fee rate payable by the Fund to the Adviser for investment advisory services (the “Advisory Agreement Rate”). The Board received and considered information comparing the Advisory Agreement Rate with the advisory fees for the Peer Group. The Board noted that the Advisory Agreement Rate was equal to the median rate of the Peer Group. The Board concluded that the Advisory Agreement Rate was reasonable in relation to the services provided.
The Board received and considered information regarding the Fund’s total operating expense ratio and its various components, including contractual advisory fees, actual advisory fees, non-management fees, Rule 12b-1 and non-Rule 12b-1 service fees, transfer agent fees and custodian fees, including and excluding Rule 12b-1 and non-Rule 12b-1 service fees. The Board also considered comparisons of these expenses to the expense information for the Peer Group and the Universe. The Board noted that the total operating expense ratio of the Fund was higher than the median total operating expense ratio of the Peer Group and the Universe. It also noted that the most significant contributors to such differences were the Fund’s actual management fee, the custodian fee and the transfer agency expense. The Board favorably considered the Adviser’s and transfer agent’s commitment to developing initiatives designed to reduce their overall fees and expenses.
The Adviser also discussed the Lipper data and rankings, and other relevant information, for the Fund. Based on the above-referenced considerations and other factors, the Board concluded that the Fund’s performance and plans to reduce the Fund’s overall fees and expenses supported the re-approval of the Advisory Agreements.
Profitability
The Board received and considered a detailed profitability analysis of the Adviser based on the Advisory Agreement, as well as on other relationships between the Fund and the Adviser and its affiliates. The Board concluded that, in light of the costs of providing investment management and other services to the Fund, the profits and other ancillary benefits reported by the Adviser were not unreasonable.
Economies of scale
The Board received and considered general information regarding economies of scale with respect to the management of the Fund, including the Fund’s ability to appropriately benefit from economies of scale under the Fund’s fee structure. The Board recognized the inherent limitations of any analysis of economies of scale, stemming largely from the Board’s understanding that most of the Adviser’s costs are not specific to individual Funds, but rather are incurred across a variety of products and services.
To the extent the Board and the Adviser were able to identify actual or potential economies of scale from Fund-specific or allocated expenses, in order to ensure that any such economies
17
continue to be reasonably shared with the Fund as its assets increase, the Adviser and the Board agreed to continue the existing breakpoints.
Information about
services to other clients
The Board also received information about the nature, extent and quality of services and fee rates offered by the Adviser to its other clients, including other registered investment companies, institutional investors and separate accounts. The Board concluded that the Advisory Agreement Rate was not unreasonable, taking into account fee rates offered to others by the Adviser and giving effect to differences in services covered by such fee rates.
Other benefits to
the Adviser
The Board received information regarding potential “fall-out” or ancillary bene-fits received by the Adviser and its affiliates as a result of the Adviser’s relationship with the Fund. Such benefits could include, among others, benefits directly attributable to the relationship of the Adviser with the Fund and benefits potentially derived from an increase in the business of the Adviser as a result of its relationship with the Fund (such as the ability to market to shareholders other finan-cial products offered by the Adviser and its affiliates).
The Board also considered the effectiveness of the Adviser’s and the Fund’s policies and procedures for complying with the requirements of the federal securities laws, including those relating to best execution of portfolio transactions and brokerage allocation.
Other factors and
broader review
As discussed above, the Board reviewed detailed materials received from the Adviser as part of the annual re-approval process under Section 15(c) of the 1940 Act. The Board also regularly reviews and assesses the quality of the services that the Fund receives throughout the year. In this regard, the Board reviews reports of the Adviser at least quarterly, which include, among other things, a detailed portfolio review, detailed fund performance reports and compliance reports. In addition, the Board meets with portfolio managers and senior investment officers at various times throughout the year.
After considering the above-described factors and based on its deliberations and its evaluation of the information described above, the Board concluded that approval of the continuation of the Advisory Agreement for the Fund was in the best interest of the Fund and its shareholders. Accordingly, the Board unanimously approved the continuation of the Advisory Agreement.
18
OUR FAMILY
OF FUNDS
| Equity | Balanced Fund |
| | Classic Value Fund |
| | Core Equity Fund |
| | Focused Equity Fund |
| | Greater China Opportunities Fund |
| | Growth Trends Fund |
| | International Fund |
| | Large Cap Equity Fund |
| | Large Cap Select Fund |
| | Mid Cap Growth Fund |
| | Multi Cap Growth Fund |
| | Small Cap Equity Fund |
| | Small Cap Fund |
| | Small Cap Growth Fund |
| | Sovereign Investors Fund |
| | U.S. Global Leaders Growth Fund |
|
| Allocation | Allocation Growth + Value Portfolio |
| | Allocation Core Portfolio |
|
| Sector | Financial Industries Fund |
| | Health Sciences Fund |
| | Real Estate Fund |
| | Regional Bank Fund |
| | Technology Fund |
| | Technology Leaders Fund |
|
| Income | Bond Fund |
| | Government Income Fund |
| | High Income Fund |
| | High Yield Fund |
| | Investment Grade Bond Fund |
| | Strategic Income Fund |
|
| Tax-Free Income | California Tax-Free Income Fund |
| | High Yield Municipal Bond Fund |
| | Massachusetts Tax-Free Income Fund |
| | New York Tax-Free Income Fund |
| | Tax-Free Bond Fund |
|
| Money Market | Money Market Fund |
| | U.S. Government Cash Reserve |
For more complete information on any John Hancock Fund and a prospectus, which includes charges and expenses, call your financial professional, or John Hancock Funds at 1-800-225-5291. Please read the prospectus carefully before investing or sending money.
19
ELECTRONIC
DELIVERY
Now available from John Hancock Funds
Instead of sending annual and semiannual reports and prospectuses through the U.S. mail, we’ll notify you by e-mail when these documents are available for online viewing.
How does electronic delivery benefit you?
| * | No more waiting for the mail to arrive; you’ll receive an |
| | e-mail notification as soon as the document is ready for |
| | online viewing. |
| |
| * | Reduces the amount of paper mail you receive from |
| | John Hancock Funds. |
| |
| * | Reduces costs associated with printing and mailing. |
Sign up for electronic delivery today at
www.jhfunds.com/edelivery
20


www.jhfunds. com
Now available: electronic delivery
www.jhfunds. com/edelivery
| This report is for the information of | |
| the shareholders of John Hancock | 430SA 9/05 |
| U.S. Government Cash Reserve. | 11/05 |


| Table of contents |
|
| Your fund at a glance |
| page 1 |
|
| Managers’ report |
| page 2 |
|
| Your expenses |
| page 5 |
|
| Fund’s investments |
| page 7 |
|
| Financial statements |
| page 11 |
|
| For more information |
| page 25 |
|
To Our Shareholders,
I am pleased to be writing to you as the new President and Chief Executive Officer of John Hancock Funds, LLC, following the departure of James A. Shepherdson to pursue other opportunities. In addition, on July 25, 2005, your fund’s Board of Trustees appointed me to the roles of President and Chief Executive Officer of your fund.
As a means of introduction, I have been involved in the mutual fund industry since 1985. I have been with John Hancock Funds for the last 15 years, most recently as executive vice president of retail sales and marketing and a member of the company’s executive and investment committees. In my former capacity, I was responsible for all aspects of the distribution and marketing of John Hancock Funds’ open-end and closed-end funds. Outside of John Hancock, I have served as Chairman of the Investment Company Institute (ICI) Sales Force Marketing Committee since September 2003.
It is an exciting time to be at John Hancock Funds, and I am grateful for the opportunity to lead and shape its future growth. With the acquisition of John Hancock by Manulife Financial Corporation in April 2004, we are receiving broad support toward the goal of providing our shareholders with excellent investment opportunities and a more complete lineup of choices for the discerning investor.
For one example, we have recently added five “Lifestyle Portfolio” funds-of-funds that blend multiple fund offerings from internal and external money managers to create a broadly diversified asset allocation portfolio. Look for more information about these exciting additions to the John Hancock family of funds in the near future.
Although there has been a change in executive-level management, rest assured that the one thing that never wavers is John Hancock Funds’ commitment to placing the needs of shareholders above all else. We are all dedicated to the task of working with you and your financial advisors to help you reach your long-term financial goals.
Sincerely,

Keith F. Hartstein,
President and Chief Executive Officer
This commentary reflects the CEO’s views as of September 30, 2005. They are
subject to change at any time.
|
YOUR FUND
AT A GLANCE
The Funds seeks
the maximum
current income
that is consistent
with maintaining
liquidity and
preserving capital.
The Fund intends to
maintain a stable
$1 share price.
|
| | Over the last six months |
| * | The economy grew at a strong pace, prompting the Federal Reserve |
| | to continue raising short-term interest rates. |
| * | Money market yields rose along with interest rates. |
| * | The Fund used floating rate securities as one way to react quickly to |
| | higher rates. |
Total returns for the Fund are at net asset value with all distributions reinvested. Past performance is no guarantee of future results. These returns do not reflect the deduction of the maximum sales charge, which would reduce the performance shown above.
1
BY DAVID A. BEES AND DAVID P. LYNCH FOR THE PORTFOLIO MANAGEMENT TEAM
MANAGERS’
REPORT
JOHN HANCOCK
Money Market Fund
The six-month period ending September 30, 2005 was marked by rising money market yields that came as a result of the Federal Reserve’s continued increases in short-term interest rates. The period began with data showing that overall economic growth was solid, despite increasing energy prices. Gross Domestic Product growth for the first quarter of 2005 came in at 3.8%, while the unemployment rate declined to 5.2% and price indicators showed inflation was within acceptable limits. In a highly anticipated move, the Federal Reserve responded by increasing the federal funds rates that banks charge each other for overnight loans from 2.75% to 3.00% at its May meeting, and to 3.25% at its June meeting. In its accompanying statements, the Fed expressed optimism at the strength of the economy and overall labor market, and indicated that, while energy prices have taken a toll in the short term on the economy and inflation, it believed long-term inflation expectations remained “contained.” The Fed also noted that as long as the economy remained strong, it believed it was possible to maintain its stance of “measured” rate hikes that would serve to bring unsustainably low rates back to a more reasonable level without derailing the economy.
“The six-month period ending
September 30, 2005 was marked
by rising money market yields...” |
As the period progressed and energy prices remained high, there was speculation that the Fed might wait a couple of meetings before continuing to raise rates so it could get a better sense of what effect energy prices were having on the economy. Instead, the Fed continued to increase the federal funds rates to 3.50% during its August meeting and signaled confidence in the strength of the overall economy, at the same time acknowledging that high energy prices had made short-term inflation a concern. In addition to inflation concerns, Fed chairman Alan Greenspan and others at the Fed expressed concern about accelerating housing prices and their potential to affect the stability of the economy.
The end of the period was dominated by news of two of the most damaging natural disasters to occur in this country. Hurricanes Katrina and Rita devastated areas along the Gulf Coast, causing
2

massive personal and economic loss. Energy prices, already high, spiked on news that much of the energy infrastructure was damaged by the hurricanes. Many questioned if the Fed should hold off increasing rates at its September meeting to see what effect the hurricanes would have on the economy. Instead the Fed again voted to increase the fed funds rate for the 11th straight time to 3.75% at its September meeting. While acknowledging the hurricanes’ devastating short-term impact on economic conditions and short-term inflation, they did not see it as a persistent threat.
Fund yield and performance
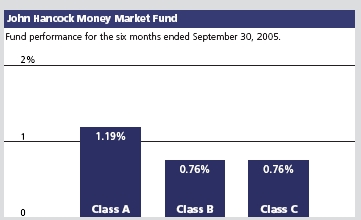
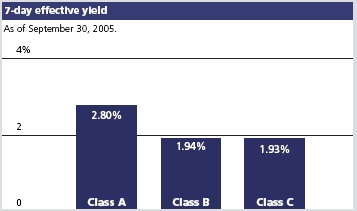
On September 30, 2005, John Hancock Money Market Fund’s Class A, Class B and Class C shares had 7-day effective yields of 2.80%, 1.94%, and 1.93%, respectively. By comparison, the average taxable money market fund had a 7-day effective yield of 2.85%, according to Lipper, Inc.
For the six months ended September 30, 2005, the Fund’s Class A, Class B and Class C shares posted total returns of 1.19%, 0.76% and 0.76%, respectively, at net asset value, compared with the 1.17% return of the average taxable money market fund, according to Lipper, Inc.1 Keep in mind that your net asset value return will be different from the Fund’s performance if you were not invested in the Fund for the entire period and did not reinvest all distributions.
“We believe the Federal Reserve
will continue to raise short-term
interest rates...”
|
Fund moves
The structure of the portfolio has remained relatively stable throughout the last six months. With all signs indicating higher short-term interest rates, we had structured the Fund to take advantage of such a scenario. We used floating-rate securities extensively as their rate-reset feature allows the Fund to benefit from increasing rates. The Fund also continued to maintain a weighted-average maturity that was shorter than our peers. This allowed the Fund to take advantage of the increasing rates quicker than our peers. In addition to floating-rate securities, the Fund continued to own short-term corporate bonds, asset-backed commercial paper, commercial paper and carefully selected tier-two securities to balance out the Fund’s portfolio and improve the yield.
3
Outlook
We believe the Federal Reserve will continue to raise short-term interest rates, but the pace of the increases will depend on the continued strength of the economy, inflationary concerns and the status of energy prices. The Fed has made it clear that maintaining a stable inflationary environment is a major priority. The Fed has also addressed the issue of increased asset prices, namely housing, and said that higher interest rates could slowly relieve some of the price pressures seen in many markets. As long as economic growth remains steady in the face of current high energy prices and events like Hurricanes Katrina and Rita, we believe the Fed is likely to continue to raise the federal funds rate in the near future.
With this outlook, we will continue to position the Fund to take advantage of higher interest rates. We will continue to use floating rate securities and we’ll also continue to keep the Fund’s weighted-average maturity shorter than its peers to reinvest funds at higher rates. At the same time that we remain focused on capturing additional yield, we will strive, as always, to maintain liquidity and preserve stability of principal.
This commentary reflects the views of the portfolio management team through the end of the Fund’s period discussed in this report. The team’s statements reflect their own opinions. As such, they are in no way guarantees of future events, and are not intended to be used as investment advice or a recommendation regarding any specific security. They are also subject to change at any time as market and other conditions warrant.
The Fund is neither insured nor guaranteed by the U.S. government. Although the Fund seeks to maintain a net asset value of $1.00 per share, it is possible to lose money by investing in the Fund.
1 Figures from Lipper, Inc. include reinvested dividends and do not take into account sales charges. Actual load-adjusted performance is lower.
2 As a percentage of net assets on 9-30-05.
4
YOUR
EXPENSES
These examples are intended to help you understand your ongoing
operating expenses.
Understanding fund expenses
As a shareholder of the Fund, you incur two types of costs:
* Transaction costs which include sales charges (loads) on purchases or redemptions (varies by share class), minimum account fee charge, etc.
* Ongoing operating expenses including management fees, distribution and service fees (if applicable) and other fund expenses.
We are going to present only your ongoing operating expenses here.
Actual expenses/actual returns
This example is intended to provide information about your fund’s actual ongoing operating expenses, and is based on your fund’s actual return. It assumes an account value of $1,000.00 on March 31, 2005, with the same investment held until September 30, 2005.
| Account value | | Expenses paid |
| $1,000.00 | Ending value | during period |
| on 3-31-05 | on 9-30-05 | ended 9-30-051 |
|
| Class A | $1,011.90 | $4.63 |
| Class B | 1,007.60 | 8.83 |
| Class C | 1,007.60 | 8.73 |
Together with the value of your account, you may use this information to estimate the operating expenses that you paid over the period. Simply divide your account value at September 30, 2005 by $1,000.00, then multiply it by the “expenses paid” for your share class from the table above. For example, for an account value of $8,600.00, the operating expenses should be calculated as follows:
5
Hypothetical example for comparison purposes
This table allows you to compare your fund’s ongoing operating expenses with those of any other fund. It provides an example of the Fund’s hypothetical account values and hypothetical expenses based on each class’s actual expense ratio and an assumed 5% annual return before expenses (which is not your fund’s actual return). It assumes an account value of $1,000.00 on March 31, 2005, with the same investment held until September 30, 2005. Look in any other fund shareholder report to find its hypothetical example and you will be able to compare these expenses.
| Account value | | Expenses paid |
| $1,000.00 | Ending value | during period |
| on 3-31-05 | on 9-30-05 | ended 9-30-051 |
|
| Class A | $1,020.50 | $4.65 |
| Class B | 1,016.30 | 8.87 |
| Class C | 1,016.40 | 8.77 |
Remember, these examples do not include any transaction costs, such as sales charges; therefore, these examples will not help you to determine the relative total costs of owning different funds. If transaction costs were included, your expenses would have been higher. See the prospectus for details regarding transaction costs.
1 Expenses are equal to the Fund's annualized expense ratio of 0.91%, 1.76% and 1.74% for Class A, Class B and Class C shares, respectively, multiplied by the average account value over the period, multiplied by number of days in most recent fiscal half-year/365 or 366 (to reflect the one-half year period).
6
F I N A N C I A L S TAT E M E N T S
FUND’S
INVESTMENTS
Securities owned
by the Fund on
September 30, 2005
(unaudited)
|
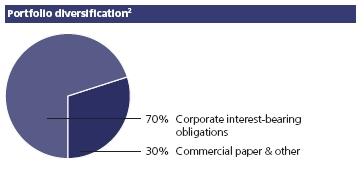
This schedule is divided into three categories: commercial paper, corporate interest-bearing obligations and joint repurchase agreement. Commercial paper and corporate interest-bearing obligations are further broken down by industry group.| | Interest | Maturity | Quality | Par value | |
| Issuer | rate | date | rating (A) | (000) | Value |
|
| Commercial paper 32.18% | | | | | $83,438,522 |
| (Cost $83,438,522) | | | | | |
| | | | | |
| Aerospace & Defense 1.93% | | | | | 4,996,850 |
|
| United Technologies Corp. | 3.780% | 10-07-05 | Tier 1 | $5,000 | 4,996,850 |
| | | | | |
| Asset Backed Auto Loan 4.63% | | | | | 11,997,433 |
|
| Galleon Capital, LLC (K) | 3.850 | 10-03-05 | Tier 1 | 12,000 | 11,997,433 |
| | | | | |
| Asset Backed Trade Receivables 4.63% | | | | | 11,997,487 |
|
| Clipper Receivables Co., LLC (K) | 3.770 | 10-03-05 | Tier 1 | 12,000 | 11,997,487 |
Asset Backed Financial Assets 3.66% | | | | 9,484,209 |
|
| Falcon Asset Securitization Corp. (K) | 3.740 | 10-17-05 | Tier 1 | 9,500 | 9,484,209 |
Automobiles & Trucks 1.92% | | | | | 4,986,462 |
|
| DaimlerChrysler NA Corp. | 3.880 | 11-01-05 | Tier 2 | 2,600 | 2,591,313 |
|
| Volkswagen AG | 3.830 | 10-20-05 | Tier 2 | 2,400 | 2,395,149 |
| | | | | |
| Banks Foreign 9.25% | | | | | 23,991,177 |
|
| Societe Generale N.A., Inc. | 3.750 | 10-06-05 | Tier 1 | 12,000 | 11,993,750 |
|
| UBS Finance Delaware LLC | 3.860 | 10-03-05 | Tier 1 | 12,000 | 11,997,427 |
| | | | | |
| Financial Commercial 0.92% | | | | | 2,396,968 |
|
| Textron Financial Corp. | 3.790 | 10-13-05 | Tier 2 | 2,400 | 2,396,968 |
| | | |
| Medical Health Maintenance Organization 0.96% | | | 2,495,744 |
|
| Wellpoint, Inc. | 3.830 | 10-17-05 | Tier 2 | 2,500 | 2,495,744 |
| Retail Drug Stores 1.00% | | | | | 2,596,413 |
|
| CVS Corp. | 3.820 | 10-14-05 | Tier 2 | 2,600 | 2,596,413 |
| | | | | |
| Telephone Integrated 3.28% | | | | | 8,495,779 |
|
| SBC Communications, Inc. | 3.760 | 10-17-05 | Tier 1 | 8,510 | 8,495,779 |
See notes to financial statements.
7
F I N A N C I A L S TAT E M E N T S
|
| | Interest | Maturity | Quality | Par value | |
| Issuer | rate | date | rating (A) | (000) | Value |
|
| Corporate interest-bearing obligations 69.70% | | | | $180,744,655 |
| (Cost $180,744,655) | | | | | |
| | | | | |
| | | | | |
| Banks Foreign 12.21% | | | | | 31,663,828 |
|
| Abbey National Plc (United Kingdom) | 6.690% | 10-17-05 | Tier 1 | $9,100 | 9,111,515 |
|
| Abbey National Treasury Services Plc | | | | | |
| (United Kingdom) (P)(S) | 3.649 | 01-13-06 | Tier 1 | 3,300 | 3,300,686 |
|
| Barclays Bank Plc (New York) (P) | 3.771 | 10-31-05 | Tier 1 | 5,000 | 4,999,886 |
|
| BNP Paribas (New York) (P) | 3.608 | 10-03-05 | Tier 1 | 4,250 | 4,249,988 |
|
| HBOS Treasury Services Plc (P)(S) | 3.690 | 01-26-06 | Tier 1 | 10,000 | 10,001,753 |
| | | | | |
| | | | | |
| Banks U.S. 12.70% | | | | | 32,942,688 |
|
| Bank of America N.A. (P) | 3.805 | 12-09-05 | Tier 1 | 6,150 | 6,149,939 |
|
| Bank One Corp. (P) | 4.036 | 02-27-06 | Tier 1 | 9,515 | 9,523,994 |
|
| Keycorp (P) | 4.043 | 05-23-06 | Tier 1 | 12,000 | 12,018,745 |
|
| U.S. Bank N.A. (P) | 3.761 | 12-05-05 | Tier 1 | 5,250 | 5,250,010 |
| | | | | |
| | | | | |
| Diversified Financial Services 4.61% | | | | | 11,943,581 |
|
| Citigroup, Inc. (P) | 4.015 | 03-20-06 | Tier 1 | 5,000 | 5,003,046 |
|
| GE Capital Australia Funding | | | | | |
| Proprietary Ltd. (Australia) | 4.000 | 11-15-05 | Tier 1 | 2,440 | 2,440,366 |
|
| General Electric Co. (P) | 3.700 | 10-24-05 | Tier 1 | 4,500 | 4,500,169 |
| | | | | |
| | | | | |
| Drug Retail 1.73% | | | | | 4,499,860 |
|
| Pfizer, Inc. (P) | 3.660 | 11-04-05 | Tier 1 | 4,500 | 4,499,860 |
| | | | | |
| | | | | |
| Finance Auto Loans 4.63% | | | | | 12,004,367 |
|
| American Honda Finance Corp. (P)(S) | 3.970 | 05-15-06 | Tier 1 | 5,000 | 5,006,432 |
|
| American Honda Finance Corp. (P)(S) | 3.736 | 03-07-06 | Tier 1 | 7,000 | 6,997,935 |
| | | | | |
| | | | | |
| Finance Consumer Loans 8.07% | | | | | 20,923,176 |
|
| AIG SunAmerica Global Financing IV (S) | 5.850 | 02-01-06 | Tier 1 | 6,500 | 6,538,385 |
|
| American International Group, Inc. | 2.850 | 12-01-05 | Tier 1 | 2,550 | 2,546,395 |
|
| Household Finance Corp. | 6.500 | 01-24-06 | Tier 1 | 11,750 | 11,838,396 |
| | | | | |
| | | | | |
| Finance Credit Card 4.49% | | | | | 11,652,743 |
|
| American Express Credit Corp. (P) | 3.870 | 01-23-06 | Tier 1 | 4,000 | 4,001,076 |
|
| American Express Credit Corp. (P) | 3.871 | 03-30-06 | Tier 1 | 2,650 | 2,650,793 |
|
| American Express Credit Corp. (P) | 3.829 | 12-19-05 | Tier 1 | 5,000 | 5,000,874 |
| | | | | |
| | | | | |
| Finance SBIC & Commercial 3.34% | | | | | 8,659,294 |
|
| CIT Group, Inc. (P) | 4.106 | 06-19-06 | Tier 1 | 5,000 | 5,007,462 |
|
| CIT Group, Inc. (P) | 3.714 | 04-19-06 | Tier 1 | 3,650 | 3,651,832 |
| |
| |
| |
| See notes to | | | | | |
| financial statements. | | | | | |
8
F I N A N C I A L S TAT E M E N T S
|
| | | Interest | Maturity | Quality | Par value | |
| Issuer | | rate | date | rating (A) | (000) | Value |
| | | | | | |
| Financial Life Health Insurance 2.95% | | | | $7,641,958 |
|
| Principal Life Global Funding I (S) | | 6.125% | 03-01-06 | Tier 1 | $4,400 | 4,441,935 |
|
| Principal Life Income Funding Trust (P) | | 3.609 | 10-14-05 | Tier 1 | 3,200 | 3,200,023 |
| | | | | | |
| Investment Banking & Brokerage 8.31% | | | | 21,538,578 |
|
| Credit Suisse First Boston (USA), Inc. | | 6.875 | 11-01-05 | Tier 1 | 7,026 | 7,044,307 |
|
| Credit Suisse First Boston (USA), Inc. (P) | 3.930 | 12-21-05 | Tier 1 | 3,500 | 3,500,208 |
|
| Merrill Lynch & Co., Inc. | | 7.000 | 03-15-06 | Tier 1 | 1,660 | 1,682,156 |
|
| Merrill Lynch & Co., Inc. (P) | | 4.020 | 01-13-06 | Tier 1 | 9,300 | 9,311,907 |
| | | | | | |
| Mortgages 4.72% | | | | | | 12,251,511 |
|
| Countrywide Financial Corp. (P) | | 3.990 | 03-21-06 | Tier 1 | 5,000 | 4,999,526 |
|
| Countrywide Home Loans, Inc. (P) | | 4.130 | 03-29-06 | Tier 1 | 2,500 | 2,500,400 |
|
| Countrywide Home Loans, Inc. (P) | | 3.947 | 02-17-06 | Tier 1 | 4,750 | 4,751,585 |
| | | | | | |
| Telephone Integrated 1.94% | | | | | | 5,023,071 |
|
| Verizon Global Funding Corp. | | 6.750 | 12-01-05 | Tier 1 | 5,000 | 5,023,071 |
| |
| | | | | Interest | Par value | |
| Issuer, description, maturity date | | | | rate | (000) | Value |
|
| Joint repurchase agreement 0.66% | | | | | $1,706,000 |
| (Cost $1,706,000) | | | | | | |
| Investment in a joint repurchase agreement | | | | |
| transaction with Morgan Stanley | | | | | | |
| Dated 9-30-05 due 10-3-05 (secured | | | | | |
| by U.S. Treasury Inflation Indexed Bond | | | | |
| 3.875% due 4-15-32) | | | | 3.250% | $1,706 | 1,706,000 |
|
| |
| Total investments 102.54% | | | | | | $265,889,177 |
|
| |
| Other assets and liabilities, net (2.54%) | | | | ($6,590,515) |
|
| |
| Total net assets 100.00% | | | | | | $259,298,662 |
See notes to
financial statements.
|
9
F I N A N C I A L S TAT E M E N T S
|
Notes to Schedule of Investments
|
| (A) | Quality ratings are unaudited and indicate the categories of eligible securities, as defined by Rule 2a-7 of the Investment Company Act of 1940, owned by the Fund. |
| |
| (K) | Direct placement securities are restricted to resale. They have been fair valued in accordance with procedures approved by the Trustees after consideration of restrictions as to resale, financial condition and prospects of the issuer, general market conditions and pertinent information in accordance with the Fund’s by-laws and the Investment Company Act of 1940, as amended. The Fund has limited rights to registration under the Securities Act of 1933 with respect to these restricted securities. Additional information on these securities is shown on the direct placement table following these footnotes. |
| |
| | | | Value as a | |
| | | | percentage | |
| | Acquisition | Acquisition | of Fund’s | Value as of |
| Issuer, description | date | cost | net assets | September 30, 2005 |
|
| Clipper Receivables Co., LLC | | | | |
| – Commercial paper | 09-28-05 | $11,993,717 | 4.63% | $11,997,487 |
| |
| Falcon Asset Securitization Corp. | | | | |
| – Commercial paper | 09-16-05 | 9,469,405 | 3.66 | 9,484,209 |
| |
| Galleon Capital, LLC | | | | |
| – Commercial paper | 09-30-05 | 11,996,150 | 4.63 | 11,997,433 |
| (P) | Represents rate in effect on September 30, 2005. |
| |
| (S) | These securities are exempt from registration under Rule 144A of the Securities Act of 1933. Such securities may be resold, normally to qualified institutional buyers, in transactions exempt from registration. Rule 144A securities amounted to $36,287,126 or 13.99% the Fund’s net assets as of September 30, 2005. |
| |
| | Parenthetical disclosure of a foreign country in the security description represents country of a foreign issurer, however, the security is U.S. dollar-denominated. |
| |
| | The percentage shown for each investment category is the total value of that category as a percentage of the net assets of the Fund. |
| |
See notes to
financial statements.
|
10
F I N A N C I A L S TAT E M E N T S
ASSETS AND
LIABILITIES
September 30, 2005
(unaudited)
This Statement
of Assets and
Liabilities is the
Fund’s balance
sheet. It shows
the value of
what the Fund
owns, is due
and owes. You’ll
also find the net
asset value
per share.
|
| Assets | |
| Investments at value (cost $265,889,177) | $265,889,177 |
| Cash | 1,000,178 |
| Interest receivable | 1,457,673 |
| Other assets | 74,969 |
| Total assets | 268,421,997 |
|
| Liabilities | |
| Payable for investments purchased | 7,949,965 |
| Payable for shares repurchased | 851,327 |
| Dividends payable | 21,668 |
| Payable to affiliates | |
| Management fees | 81,924 |
| Distribution and service fees | 6,702 |
| Other | 96,974 |
| Other payables and accrued expenses | 114,775 |
| Total liabilities | 9,123,335 |
|
| Net assets | |
| Capital paid-in | 259,288,945 |
| Accumulated net realized loss on investments | (1,191) |
| Accumulated net investment income | 10,908 |
| Net assets | $259,298,662 |
|
| Net asset value per share | |
| Based on net asset values and shares outstanding | |
| the Fund has an unlimited number of shares | |
| authorized with no par value | |
| Class A ($197,517,772 ÷ 197,599,933 shares) | $1.00 |
| Class B ($50,575,186 ÷ 50,595,475 shares) | $1.00 |
| Class C ($11,205,704 ÷ 11,205,964 shares) | $1.00 |
See notes to financial statements.
11
F I N A N C I A L S TAT E M E N T S
OPERATIONS
For the period ended
September 30, 2005
(unaudited)1
This Statement
of Operations
summarizes the
Fund’s investment
income earned and
expenses incurred
in operating the
Fund.
|
| Investment income | |
| Interest | $4,333,041 |
| Total investment income | 4,333,041 |
|
| Expenses | |
| Investment management fees | 664,982 |
| Class A distribution and service fees | 253,577 |
| Class B distribution and service fees | 269,479 |
| Class C distribution and service fees | 46,177 |
| Transfer agent fees | 334,241 |
| Custodian fees | 35,767 |
| Accounting and legal services fees | 33,249 |
| Registration and filing fees | 30,856 |
| Professional fees | 17,326 |
| Printing | 17,083 |
| Miscellaneous | 10,397 |
| Trustees’ fees | 8,614 |
| Interest | 628 |
| Total expenses | 1,722,376 |
| Less expense reductions | (242,490) |
| Net expenses | 1,479,886 |
| Net investment income | 2,853,155 |
| Increase in net assets from operations | $2,853,155 |
| |
| 1 Semiannual period from 4-1-05 through 9-30-05. | |
See notes to financial statements.
12
F I N A N C I A L S TAT E M E N T S
CHANGES IN
NET ASSETS
These Statements
of Changes in Net
Assets show how
the value of the
Fund’s net assets
has changed
during the last
two periods. The
difference reflects
earnings less
expenses, distribu-
tions, if any, paid
to shareholders
and the net of
Fund share
transactions.
|
| | Year | Period |
| | ended | ended |
| | 3-31-05 | 9-30-051 |
|
| Increase (decrease) in net assets | | |
| From operations | | |
| Net investment income | $2,237,275 | $2,853,155 |
| Increase in net assets resulting | | |
| from operations | 2,237,275 | 2,853,155 |
| Distributions to shareholders | | |
| From net investment income | | |
| Class A | (1,807,542) | (2,384,071) |
| Class B | (375,710) | (401,342) |
| Class C | (54,023) | (67,742) |
| | (2,237,275) | (2,853,155) |
| From Fund share transactions | (12,675,936) | (40,271,103) |
|
| Net assets | | |
| Beginning of period | 312,245,701 | 299,569,765 |
| End of period2 | $299,569,765 | $259,298,662 |
| |
| 1 Semiannual period from 4-1-05 through 9-30-05. Unaudited. | |
| 2 Includes accumulated net investment income of $10,908 and $10,908, respectively. |
See notes to financial statements.
13
F I N A N C I A L H I G H L I G H T S
FINANCIAL
HIGHLIGHTS
CLASS A SHARES
The Financial Highlights show how the Fund’s net asset value for a
share has changed since the end of the previous period.
| Period ended | 3-31-011 | 3-31-021 | 3-31-03 | 3-31-04 | 3-31-05 | 9-30-052 |
|
| Per share operating performance | | | | | | |
| Net asset value, | | | | | | |
| beginning of period | $1.00 | $1.00 | $1.00 | $1.00 | $1.00 | $1.00 |
| Net investment income3 | 0.05 | 0.02 | 0.01 | --4 | 0.01 | 0.01 |
| Less distributions | | | | | | |
| From net investment income | (0.05) | (0.02) | (0.01) | --4 | (0.01) | (0.01) |
| Net asset value, end of period | $1.00 | $1.00 | $1.00 | $1.00 | $1.00 | $1.00 |
| Total return5,6 (%) | 5.51 | 2.41 | 0.75 | 0.21 | 0.86 | 1.197 |
|
| Ratios and supplemental data | | | | | | |
| Net assets, end of period | | | | | | |
| (in millions) | $295 | $264 | $271 | $211 | $224 | $198 |
| Ratio of expenses | | | | | | |
| to average net assets (%) | 0.95 | 0.90 | 0.94 | 0.94 | 0.88 | 0.918 |
| Ratio of adjusted expenses | | | | | | |
| to average net assets9 (%) | 1.15 | 1.10 | 1.14 | 1.14 | 1.09 | 1.128 |
| Ratio of net investment income | | | | | | |
| to average net assets (%) | 5.43 | 2.40 | 0.75 | 0.21 | 0.83 | 2.358 |
See notes to financial statements.
14
| F I N A N C I A L H I G H L I G H T S |
| Period ended | 3-31-011 | 3-31-021 | 3-31-03 | 3-31-04 | 3-31-05 | 9-30-052 |
|
| Per share operating performance | | | | | | |
| Net asset value, | | | | | | |
| beginning of period | $1.00 | $1.00 | $1.00 | $1.00 | $1.00 | $1.00 |
| Net investment income3 | 0.05 | 0.02 | --4 | --4 | --4 | 0.01 |
| Less distributions | | | | | | |
| From net investment income | (0.05) | (0.02) | --4 | --4 | --4 | (0.01) |
| Net asset value, end of period | $1.00 | $1.00 | $1.00 | $1.00 | $1.00 | $1.00 |
| Total return5,6 (%) | 4.63 | 1.55 | 0.10 | 0.12 | 0.50 | 0.767 |
|
| Ratios and supplemental data | | | | | | |
| Net assets, end of period | | | | | | |
| (in millions) | $162 | $142 | $166 | $89 | $63 | $51 |
| Ratio of expenses | | | | | | |
| to average net assets (%) | 1.79 | 1.75 | 1.59 | 1.04 | 1.20 | 1.768 |
| Ratio of adjusted expenses | | | | | | |
| to average net assets9 (%) | 1.89 | 1.85 | 1.89 | 1.89 | 1.85 | 1.878 |
| Ratio of net investment income | | | | | | |
| to average net assets (%) | 4.54 | 1.52 | 0.10 | 0.12 | 0.46 | 1.498 |
See notes to
financial statements.
|
15
| F I N A N C I A L H I G H L I G H T S | | | | | | |
| |
| CLASS C SHARES | | | | | | |
| |
| Period ended | 3-31-011 | 3-31-021 | 3-31-03 | 3-31-04 | 3-31-05 | 9-30-052 |
|
| Per share operating performance | | | | | | |
| Net asset value, | | | | | | |
| beginning of period | $1.00 | $1.00 | $1.00 | $1.00 | $1.00 | $1.00 |
| Net investment income3 | 0.05 | 0.02 | --4 | --4 | --4 | 0.01 |
| Less distributions | | | | | | |
| From net investment income | (0.05) | (0.02) | --4 | --4 | --4 | (0.01) |
| Net asset value, end of period | $1.00 | $1.00 | $1.00 | $1.00 | $1.00 | $1.00 |
| Total return5,6 (%) | 4.63 | 1.55 | 0.11 | 0.12 | 0.50 | 0.767 |
|
| Ratios and supplemental data | | | | | | |
| Net assets, end of period | | | | | | |
| (in millions) | $13 | $16 | $18 | $12 | $13 | $11 |
| Ratio of expenses | | | | | | |
| to average net assets (%) | 1.79 | 1.75 | 1.61 | 1.04 | 1.19 | 1.748 |
| Ratio of adjusted expenses | | | | | | |
| to average net assets9 (%) | 1.89 | 1.85 | 1.88 | 1.89 | 1.84 | 1.858 |
| Ratio of net investment income | | | | | | |
| to average net assets (%) | 4.59 | 1.46 | 0.10 | 0.12 | 0.46 | 1.478 |
| 1 | Audited by previous auditor. |
| 2 | Semiannual period from 4-1-05 through 9-30-05. Unaudited. |
| 3 | Based on the average of the shares outstanding. |
| 4 | Less than $0.01 per share. |
| 5 | Assumes dividend reinvestment and does not reflect the effect of sales charges. |
| 6 | Total returns would have been lower had certain expenses not been reduced during the periods shown. |
| 7 | Not annualized. |
| 8 | Annualized. |
| 9 | Does not take into consideration expense reductions during the periods shown. |
| |
See notes to financial statements.
16
NOTES TO
STATEMENTS
Unaudited
|
Note A
Accounting policiesJohn Hancock Money Market Fund (the “Fund”) is a diversified series of John Hancock Current Interest, an open-end management investment company registered under the Investment Company Act of 1940. The investment objective of the Fund is to seek the maximum current income that is consistent with maintaining liquidity and preserving capital.
The Trustees have authorized the issuance of multiple classes of shares of the Fund, designated as Class A, Class B and Class C shares. The shares of each class represent an interest in the same portfolio of investments of the Fund and have equal rights as to voting, redemptions, dividends and liquidation, except that certain expenses, subject to the approval of the Trustees, may be applied differently to each class of shares in accordance with current regulations of the Securities and Exchange Commission and the Internal Revenue Service. Shareholders of a class that bears distribution and service expenses under the terms of a distribution plan have exclusive voting rights to that distribution plan.
Significant accounting policies
of the Fund are as follows:
Valuation of investments
Securities in the Fund’s portfolio are valued at amortized cost, in accordance with Rule 2a-7 of the Investment Company Act of 1940, which approximates market value. The amortized cost method involves valuing a security at its cost on the date of purchase and thereafter assuming a constant amortization to maturity of the difference between the principal amount due at maturity and the cost of the security to the Fund. Interest income on certain portfolio securities such as negotiable bank certificates of deposit and interest-bearing notes is accrued daily and included in interest receivable.
Joint repurchase agreement
Pursuant to an exemptive order issued by the Securities and Exchange Commission, the Fund, along with other registered investment companies having a management contract with John Hancock Advisers, LLC (the “Adviser”), a wholly owned subsidiary of John Hancock Financial Services, Inc., may participate in a joint repurchase agreement transaction. Aggregate cash balances are invested in one or more large repurchase agreements, whose underlying securities are obligations of the U.S. government and/or its agencies. The Fund’s custodian bank receives delivery of the underlying securities for the joint account on the Fund’s behalf. The Adviser is responsible for ensuring that the agreement is fully collateralized at all times.
Investment transactions
Investment transactions are recorded as of the date of purchase, sale or maturity. Net realized gains and losses on sales
17
of investments are determined on the identified cost basis.
Class allocations
Income, common expenses and realized and unrealized gains (losses) are determined at the fund level and allocated daily to each class of shares based on the appropriate net asset value of the respective classes. Distribution and service fees, if any, are calculated daily at the class level based on the appropriate net asset value of each class and the specific expense rate(s) applicable to each class.
Expenses
The majority of expenses are directly identifiable to an individual fund. Expenses that are not readily identifi-able to a specific fund are allocated in such a manner as deemed equitable, taking into consideration, among other things, the nature and type of expense and the relative size of the funds.
Federal income taxes
The Fund qualifies as a “regulated investment company” by complying with the applicable provisions of the Internal Revenue Code and will not be subject to federal income tax on taxable income that is distributed to shareholders. Therefore, no federal income tax provision is required. For federal income tax purposes, the Fund has $1,191 of a capital loss carryforward available, to the extent provided by regulations, to offset future net realized capital gains. To the extent that such carry-forward is used by the Fund, no capital gain distributions will be made. The entire loss carryforward expires on March 31, 2012.
Distributions
The Fund’s net investment income is declared daily as dividends to shareholders of record as of the close of business on the preceding day, and distributed monthly.
During the year ended March 31, 2005, the tax character of distributions paid was as follows: ordinary income $2,237,275.
Distributions paid by the Fund with respect to each class of shares are calculated in the same manner, at the same time and are in the same amount, except for the effect of expenses that may be applied differently to each class.
Such distributions, on a tax basis, are determined in conformity with income tax regulations, which may differ from accounting principles generally accepted in the United States of America. Distributions in excess of tax basis earnings and profits, if any, are reported in the Fund’s financial statements as a return of capital.
Use of estimates
The preparation of these financial statements, in accordance with accounting principles generally accepted in the United States of America, incorporates estimates made by management in determining the reported amount of assets, liabilities, revenues and expenses of the Fund. Actual results could differ from these estimates.
Note B
Management fee and
transactions with
affiliates and others
The Fund has an investment management contract with the Adviser. Under the investment management contract, the Fund pays a monthly management fee to the Adviser equivalent, on an annual basis, to the sum of: (a) 0.50% of the first $500,000,000 of the Fund’s average daily net asset value, (b) 0.425% of the next $250,000,000, (c) 0.375% of the next $250,000,000, (d) 0.35% of the next $500,000,000, (e) 0.325% of the next $500,000,000, (f) 0.30% of the next $500,000,000 and (g) 0.275% of the Fund’s average daily net asset value in excess of $2,500,000,000.
The Adviser has agreed to limit the Fund’s management fee to 0.40% of the Fund’s first $750,000,000 average daily net asset value, at least until July 31, 2006. The management fee cannot be restated to the original contracted amounts without the Trustees’ consent. Accordingly, the expense reductions related to management fee limitation amounted to $132,997
18
for the period ended September 30, 2005.
The Fund has Distribution Plans with John Hancock Funds, LLC (“JH Funds”), a wholly owned subsidiary of the Adviser. The Fund has adopted Distribution Plans with respect to Class A, Class B and Class C, pursuant to Rule 12b-1 under the Investment Company Act of 1940, to reimburse JH Funds for the services it provides as distributor of shares of the Fund. Accordingly, the Fund makes monthly payments to JH Funds at an annual rate not to exceed 0.25% of Class A average daily net asset value and 1.00% of Class B and Class C average daily net asset value. JH Funds has agreed to contractually limit the distribution and service fees (“12b-1 fee”) for Class A to 0.15% of the Class A average daily net asset value, at least until July 31, 2006. Accordingly, the expense reductions related to the reduction in the 12b-1 fees amounted to $101,431 for Class A, for the period ended September 30, 2005. A maximum of 0.25% of such payments may be service fees, as defined by the Conduct Rules of the National Association of Securities Dealers. Under the Conduct Rules, curtailment of a portion of the Fund’s 12b-1 payments could occur under certain circumstances.
Class B shares that are redeemed within six years of purchase are subject to a contingent deferred sales charge (“CDSC”) at declining rates, beginning at 5.00% of the lesser of the current market value at the time of redemption or the original purchase cost of the shares being redeemed. Class C shares that are redeemed within one year of purchase are subject to a CDSC at a rate of 1.00% of the lesser of the current market value at the time of redemption or the original purchase cost of the shares being redeemed. Proceeds from the CDSCs are paid to JH Funds and are used, in whole or in part, to defray its expenses for providing distribution-related services to the Fund in connection with the sale of Class B and Class C shares. During the period ended September 30, 2005, CDSCs received by JH Funds amounted to $161,420 for Class B shares and $2,712 for Class C shares.
The Fund has a transfer agent agreement with John Hancock Signature Services, Inc. (“Signature Services”), an indirect subsidiary of John Hancock Life Insurance Company. The Fund pays a monthly transfer agent fee at an annual rate of 0.015% of the Fund’s average daily net asset value, plus a fee based on the number of shareholder accounts and reimbursement for certain out-of-pocket expenses, aggregated and allocated to each class on the basis of its relative net asset value. Signature Services agreed to voluntarily reduce the Fund’s asset-based portion of the transfer agent fee if the total transfer agent fee exceeds the Lipper, Inc. median transfer agency fee for comparable mutual funds by 0.05% . Accordingly, the transfer agent expense for Class A, Class B and Class C shares was reduced by $8,062 during the period ended September 30, 2005. Signature Services reserves the right to terminate this limitation at any time.
The Fund has an agreement with the Adviser to perform necessary tax, accounting and legal services for the Fund. The compensation for the period amounted to $33,249. The Fund also paid the Adviser the amount of $80 for certain publishing services, included in the printing fees and the amount of $3,481 for certain compliance costs, included in the miscellaneous expenses.
Mr. James R. Boyle is an offi-cer of certain affiliates of the Adviser, as well as an affili-ated Trustee of the Fund, and is compensated by the Adviser and/or its affiliates. The compensation of other unaffiliated Trustees is borne by the Fund. The unaffiliated Trustees may elect to defer, for tax purposes, their receipt of this compensation under the John Hancock Group of Funds Deferred Compensation Plan. The Fund makes investments into other John Hancock funds, as applicable, to cover
19
its liability for the deferred compensation. Investments to cover the Fund’s deferred compensation liability are recorded on the Fund’s books as an other asset.
The deferred compensation liability and the related other asset are always equal and are marked to market on a periodic basis to reflect any income earned by the investments, as well as any unrealized gains or losses. The Deferred Compensation Plan investments had no impact on the operations of the Fund.
Note C
Fund share transactions
This listing illustrates the number of Fund shares sold, reinvested and repurchased during the last two periods, along with the corresponding dollar value. Analysis of Fund share transactions is reported at $1 per share.
| | Year ended | Period ended |
| | 3-31-05 | 9-30-051 |
|
| |
| Class A shares | | |
| Sold | $199,402,275 | $64,246,344 |
| Distributions reinvested | 1,694,489 | 2,256,497 |
| Repurchased | (188,642,570) | (92,846,393) |
| Net increase (decrease) | $12,454,194 | ($26,343,552) |
|
| |
| Class B shares | | |
| Sold | $65,409,173 | $18,117,614 |
| Distributions reinvested | 332,180 | 348,551 |
| Repurchased | (91,837,267) | (30,884,411) |
| Net decrease | ($26,095,914) | ($12,418,246) |
|
| |
| Class C shares | | |
| Sold | $25,954,084 | $11,294,092 |
| Distributions reinvested | 46,772 | 57,706 |
| Repurchased | (25,035,072) | (12,861,103) |
| Net increase (decrease) | $965,784 | ($1,509,305) |
|
| Net decrease | ($12,675,936) | ($40,271,103) |
| |
| 1 Semiannual period from 4-1-05 through 9-30-05. Unaudited. | | |
Note D
Investment
transactions
Purchases and proceeds from sales or maturities of securities, including discount earned on investment securities during the period ended September 30, 2005, aggregated $4,720,717,234 and $4,761,832,000, respectively.
The cost of investments owned on September 30, 2005, for federal income tax purposes, was $265,889,177.
20
Board Consideration
of and Continuation
of Investment
Advisory Agreement:
John Hancock
Money Market Fund
Section 15(c) of the Investment Company Act of 1940 (the “1940 Act”) requires the Board of Trustees (the “Board”) of John Hancock Current Interest (the “Trust”), including a majority of the Trustees who have no direct or indirect interest in the investment advisory agreement and are not “interested persons” of the Trust, as defined in the 1940 Act (the “Independent Trustees”), annually to review and consider the continuation of the investment advisory agreement (the “Advisory Agreement”) with John Hancock Advisers, LLC (the “Adviser”) for the John Hancock Money Market Fund (the “Fund”).
At meetings held on May 19–20 and June 6–7, 2005, the Board, including the Independent Trustees, considered the factors and reached the conclusions described below relating to the selection of the Adviser and the continuation of the Advisory Agreement. During such meetings, the Board’s Contracts/Operations Committee and the Independent Trustees also met in executive sessions with their independent legal counsel. In evaluating the Advisory Agreement, the Board, including the Contracts/Operations Committee and the Independent Trustees, reviewed a broad range of information requested for this purpose by the Independent Trustees, including but not limited to the following: (i) the investment performance of the Fund and a broader universe of relevant funds (the “Universe”) selected by Lipper Inc. (“Lipper”), an independent provider of investment company data, for a range of periods, (ii) advisory and other fees incurred by, and the expense ratios of, the Fund and a peer group of comparable funds selected by Lipper (the “Peer Group”), (iii) the advisory fees of comparable portfolios of other clients of the Adviser, (iv) the Adviser’s financial results and condition, including its and certain of its affiliates’ profitability from services performed for the Fund, (v) breakpoints in the Fund’s and the Peer Group’s fees and a study undertaken at the direction of the Independent Trustees as to the allocation of the benefits of economies of scale between the Fund and the Adviser, (vi) the Adviser’s record of compliance with applicable laws and regulations, with the Fund’s investment policies and restrictions, and with the Fund’s Code of Ethics and the structure and responsibilities of the Adviser’s compliance department, (vii) the background and experience of senior management and investment professionals, and (viii) the nature, cost and character of advisory and non-investment management services provided by the Adviser and its affiliates.
Nature, extent and quality
of services
The Board considered the ability of the Adviser, based on its resources, reputation and other attributes, to attract and retain qualified investment professionals, including research, advisory, and supervisory personnel. The Board further considered the compliance programs and compliance records of the Adviser. In addition, the Board took into account the administrative services provided to the Fund by the Adviser and its affiliates.
Based on the above factors, together with those referenced below, the Board concluded that, within the context of its full deliberations, the nature, extent and quality of the investment advisory services provided to the Fund by the Adviser were sufficient to support renewal of the Advisory Agreement.
Fund performance
The Board considered the performance results for the Fund over various time periods. The Board also considered these results in comparison to the performance of the Universe, as well as the Fund’s benchmark
21
indexes. Lipper determined the Universe for the Fund. The Board reviewed with a representative of Lipper the methodology used by Lipper to select the funds in the Universe and the Peer Group.
The Board noted that the performance of the Fund was below the median and average performance of its Universe and the performance of its benchmark indexes, the Lipper Money Market Funds Index and the Average/Total of iMoneyNet Universe, for the time periods under review. The Adviser discussed with the Board factors that contributed to the Fund’s under-performance and described changes in investment personnel and additional measures that may be taken in the future with the objective of improving performance. The Board intends to continue to monitor the Fund’s performance trends to assess the effectiveness of these changes and whether other remedial changes are warranted.
Investment advisory fee
rates and expenses
The Board reviewed and considered the contractual investment advisory fee rate payable by the Fund to the Adviser for investment advisory services (the “Advisory Agreement Rate”). The Board noted the fee waiver arrangement applicable to the Advisory Agreement Rate and considered the Advisory Agreement Rate after taking the waivers into account (the “Net Advisory Rate”). The Board received and considered information comparing the Advisory Agreement Rate and Net Advisory Rate with the advisory fees for the Peer Group. The Board noted that the Advisory Agreement Rate and Net Advisory Rate were not appreciably higher than the median rate of the Peer Group. The Board concluded that the Advisory Agreement Rate and the Net Advisory Rate were reasonable in relation to the services provided.
The Board received and considered information regarding the Fund’s total operating expense ratio and its various components, including contractual advisory fees, actual advisory fees, non-management fees, Rule 12b-1 and non-Rule 12b-1 service fees, transfer agent fees and custodian fees, including and excluding Rule 12b-1 and non-Rule 12b-1 service fees. The Board also considered comparisons of these expenses to the expense information for the Peer Group and the Universe. The Board noted that the total operating expense ratio of the Fund was higher than the median total operating expense ratio of the Peer Group and the Universe. It also noted that the most significant contributor to such difference was the Fund’s transfer agency expense, which the transfer agent has taken steps to reduce.
The Adviser also discussed the Lipper data and rankings, and other relevant information, for the Fund. Based on the above-referenced considerations and other factors, the Board concluded that plans to reduce the Fund’s overall fees and expenses and actions taken with the intention of improving the Fund’s performance supported the re-approval of the Advisory Agreement.
Profitability
The Board received and considered a detailed profitability analysis of the Adviser based on the Advisory Agreement, as well as on other relationships between the Fund and the Adviser and its affiliates. The Board concluded that, in light of the costs of providing investment management and other services to the Fund, the profits and other ancillary benefits reported by the Adviser were not unreasonable.
Economies of scale
The Board received and considered general information regarding economies of scale with respect to the management of the Fund, including the Fund’s ability to appropriately benefit from economies of scale under the Fund’s fee structure. The Board recognized the
22
inherent limitations of any analysis of economies of scale, stemming largely from the Board’s understanding that most of the Adviser’s costs are not specific to individual Funds, but rather are incurred across a variety of products and services.
To the extent the Board and the Adviser were able to identify actual or potential economies of scale from Fund-specific or allocated expenses, in order to ensure that any such economies continue to be reasonably shared with the Fund as its assets increase, the Adviser and the Board agreed to continue the existing breakpoints.
Information about
services to other clients
The Board also received information about the nature, extent and quality of services and fee rates offered by the Adviser to its other clients, including other registered investment companies, institutional investors and separate accounts. The Board concluded that the Advisory Agreement Rate was not unreasonable, taking into account fee rates offered to others by the Adviser and giving effect to differences in services covered by such fee rates.
Other benefits to
the Adviser
The Board received information regarding potential “fall-out” or ancillary benefits received by the Adviser and its affiliates as a result of the Adviser’s relationship with the Fund. Such benefits could include, among others, benefits directly attributable to the relationship of the Adviser with the Fund and benefits potentially derived from an increase in the business of the Adviser as a result of its relationship with the Fund (such as the ability to market to shareholders other financial products offered by the Adviser and its affiliates).
The Board also considered the effectiveness of the Adviser’s and the Fund’s policies and procedures for complying with the requirements of the federal securities laws, including those relating to best execution of portfolio transactions and brokerage allocation.
Other factors and
broader review
As discussed above, the Board reviewed detailed materials received from the Adviser as part of the annual re-approval process under Section 15(c) of the 1940 Act. The Board also regularly reviews and assesses the quality of the services that the Fund receives throughout the year. In this regard, the Board reviews reports of the Adviser at least quarterly, which include, among other things, a detailed portfolio review, detailed fund performance reports and compliance reports. In addition, the Board meets with portfolio managers and senior investment offi-cers at various times throughout the year.
After considering the above-described factors and based on its deliberations and its evaluation of the information described above, the Board concluded that approval of the continuation of the Advisory Agreement for the Fund was in the best interest of the Fund and its shareholders. Accordingly, the Board unanimously approved the continuation of the Advisory Agreement.
23
| Equity | Balanced Fund |
| | Classic Value Fund |
| | Core Equity Fund |
| | Focused Equity Fund |
| | Greater China Opportunities Fund |
| | Growth Trends Fund |
| | International Fund |
| | Large Cap Equity Fund |
| | Large Cap Select Fund |
| | Mid Cap Growth Fund |
| | Multi Cap Growth Fund |
| | Small Cap Equity Fund |
| | Small Cap Fund |
| | Small Cap Growth Fund |
| | Sovereign Investors Fund |
| | U.S. Global Leaders Growth Fund |
|
| |
| Allocation | Allocation Growth + Value Portfolio |
| | Allocation Core Portfolio |
|
| |
| Sector | Financial Industries Fund |
| | Health Sciences Fund |
| | Real Estate Fund |
| | Regional Bank Fund |
| | Technology Fund |
| | Technology Leaders Fund |
|
| |
| Income | Bond Fund |
| | Government Income Fund |
| | High Income Fund |
| | High Yield Fund |
| | Investment Grade Bond Fund |
| | Strategic Income Fund |
|
| |
| Tax-Free Income | California Tax-Free Income Fund |
| | High Yield Municipal Bond Fund |
| | Massachusetts Tax-Free Income Fund |
| | New York Tax-Free Income Fund |
| | Tax-Free Bond Fund |
|
| |
| Money Market | Money Market Fund |
| | U.S. Government Cash Reserve |
For more complete information on any John Hancock Fund and a prospectus, which includes charges and expenses, call your financial professional, or John Hancock Funds at 1-800-225-5291. Please read the prospectus carefully before investing or sending money.
24


www.jhfunds. com
Now available: electronic delivery
www.jhfunds. com/edelivery
| This report is for the information of | |
| the shareholders of John Hancock | 440SA 9/05 |
| Money Market Fund. | 11/05 |
ITEM 2. CODE OF ETHICS.
As of the end of the period, September 30, 2005, the registrant has adopted a code of ethics, as defined in Item 2 of Form N-CSR, that applies to its Chief Executive Officer, Chief Financial Officer and Treasurer (respectively, the principal executive officer, the principal financial officer and the principal accounting officer, the “Senior Financial Officers”). A copy of the code of ethics is filed as an exhibit to this Form N-CSR.
The code of ethics was amended effective February 1, 2005 to address new Rule 204A-1 under the Investment Advisers Act of 1940 and to make other related changes.
The most significant amendments were:
(a) Broadening of the General Principles of the code to cover compliance with all federal securities laws.
(b) Eliminating the interim requirements (since the first quarter of 2004) for access persons to preclear their personal trades of John Hancock mutual funds. This was replaced by post-trade reporting and a 30 day hold requirement for all employees.
(c) A new requirement for “heightened preclearance” with investment supervisors by any access person trading in a personal position worth $100,000 or more.
ITEM 3. AUDIT COMMITTEE FINANCIAL EXPERT.
Not applicable at this time.
ITEM 4. PRINCIPAL ACCOUNTANT FEES AND SERVICES.
Not applicable at this time.
ITEM 5. AUDIT COMMITTEE OF LISTED REGISTRANTS.
Not applicable at this time.
ITEM 6. SCHEDULE OF INVESTMENTS.
Not applicable.
ITEM 7. DISCLOSURE OF PROXY VOTING POLICIES AND PROCEDURES FOR CLOSED-END MANAGEMENT INVESTMENT COMPANIES.
Not applicable.
ITEM 8. PORTFOLIO MANAGERS OF CLOSED-END MANAGEMENT INVESTMENT COMPANIES.
Not applicable.
ITEM 9. PURCHASES OF EQUITY SECURITIES BY CLOSED-END MANAGEMENT INVESTMENT COMPANY AND AFFILIATED PURCHASERS.
Not applicable.
ITEM 10. SUBMISSION OF MATTERS TO A VOTE OF SECURITY HOLDERS.
The registrant has adopted procedures by which shareholders may recommend nominees to the registrant's Board of Trustees. A copy of the procedures is filed as an exhibit to this Form
N-CSR. See attached "John Hancock Funds - Administration Committee Charter" and “John Hancock Funds – Governance Committee Charter”.
ITEM 11. CONTROLS AND PROCEDURES.
(a) Based upon their evaluation of the registrant's disclosure controls and procedures as conducted within 90 days of the filing date of this Form N-CSR, the registrant's principal executive officer and principal financial officer have concluded that those disclosure controls and procedures provide reasonable assurance that the material information required to be disclosed by the registrant on this report is recorded, processed, summarized and reported within the time periods specified in the Securities and Exchange Commission's rules and forms.
(b) There were no changes in the registrant's internal control over financial reporting that occurred during the registrant's most recent fiscal half-year (the registrant's second fiscal half-year in the case of an annual report) that have materially affected, or are reasonably likely to materially affect, the registrant's internal control over financial reporting.
ITEM 12. EXHIBITS.
(a)(1) Code of Ethics for Senior Financial Officers is attached.
(a)(2) Separate certifications for the registrant's principal executive officer and principal financial officer, as required by Section 302 of the Sarbanes-Oxley Act of 2002 and Rule 30a-2(a) under the Investment Company Act of 1940, are attached.
(b) Separate certifications for the registrant's principal executive officer and principal financial officer, as required by 18 U.S.C. Section 1350, as adopted pursuant to Section 906 of the Sarbanes-Oxley Act of 2002, and Rule 30a-2(b) under the Investment Company Act of 1940, are attached. The certifications furnished pursuant to this paragraph are not deemed to be "filed" for purposes of Section 18 of the Securities Exchange Act of 1934, or otherwise subject to the liability of that section. Such certifications are not deemed to be incorporated by reference into any filing under the Securities Act of 1933 or the Securities Exchange Act of 1934, except to the extent that the Registrant specifically incorporates them by reference.
(c)(1) Submission of Matters to a Vote of Security Holders is attached. See attached "John Hancock Funds - Administration Committee Charter" and “John Hancock Funds – Governance Committee Charter”.
(c)(2) Contact person at the registrant.
SIGNATURES
Pursuant to the requirements of the Securities Exchange Act of 1934 and the Investment Company Act of 1940, the registrant has duly caused this report to be signed on its behalf by the undersigned, thereunto duly authorized.
John Hancock Current Interest
By: /s/ Keith F. Hartstein
-------------------------------------
Keith F. Hartstein
President and Chief Executive Officer
Date: November 28, 2005 |
Pursuant to the requirements of the Securities Exchange Act of 1934 and the Investment Company Act of 1940, this report has been signed below by the following persons on behalf of the registrant and in the capacities and on the dates indicated.
By: /s/ Keith F. Hartstein
-------------------------------------
Keith F. Hartstein
President and Chief Executive Officer
Date: November 28, 2005
By: /s/ John G. Vrysen
-------------------------------------
John G. Vrysen
Executive Vice President and Chief Financial Officer
Date: November 28, 2005
|