UNITED STATES
SECURITIES AND EXCHANGE COMMISSION
Washington, D.C. 20549
FORM N-CSR
CERTIFIED SHAREHOLDER REPORT OF REGISTERED
MANAGEMENT INVESTMENT COMPANIES
Investment Company Act file number 811- 2485
John Hancock Current Interest
(Exact name of registrant as specified in charter)
601 Congress Street, Boston, Massachusetts 02210
(Address of principal executive offices) (Zip code)
Alfred P. Ouellette
Senior Counsel and Assistant Secretary
601 Congress Street
Boston, Massachusetts 02210
(Name and address of agent for service)
Registrant's telephone number, including area code: 617-663-4324
| Date of fiscal year end: | March 31 |
| Date of reporting period: | March 31, 2007 |
ITEM 1. REPORT TO SHAREHOLDERS.

CEO corner

| TABLE OF CONTENTS |
|
| |
| Your fund at a glance |
| page 1 |
|
| |
| Managers’ report |
| page 2 |
|
| |
| Your expenses |
| page 6 |
|
| |
| Fund’s investments |
| page 8 |
|
| |
| Financial statements |
| page 10 |
|
| |
| Notes to financial |
| statements |
| page 14 |
|
| |
| Trustees and officers |
| page 22 |
|
| |
| For more information |
| page 28 |
|
To Our Shareholders,
The U.S. financial markets turned in strong results over the last 12 months, as earlier concerns of rising inflation, a housing slowdown and high energy prices gave way to news of slower, but still resilient, economic growth, stronger than expected corporate earnings and dampened inflation fears and energy costs. This environment also led the Federal Reserve Board to hold short-term interest rates steady. Even with a sharp decline toward the end of the period, the broad stock market returned 11.83% for the year ended March 31, 2007, as measured by the S&P 500 Index. With interest rates remaining relatively steady, fixed-income securities also produced positive results.
But after a remarkably long period of calm, the financial markets were rocked near the end of the period by a dramatic sell-off in China’s stock market, which had ripple effects on financial markets worldwide. In the United States, for example, the Dow Jones Industrial Average had its steepest one-day percentage decline in nearly four years on February 27, 2007. The event served to jog investors out of their seemingly casual attitude toward risk and remind them of the simple fact that stock markets move in two directions — down as well as up.
It was also a good occasion to bring to mind several important investment principles that we believe are at the foundation of successful investing. First, keep a long-term approach to investing, avoiding emotional reactions to daily market moves. Second, maintain a well-diversified portfolio that is appropriate for your goals, risk profile and time horizons.
After the market’s moves of the last year, we encourage investors to sit back, take stock and set some realistic expectations. While history bodes well for the U.S. market in 2007 (since 1939, the S&P 500 Index has always produced positive results in the third year of a presidential term), there are no guarantees, and opinions are divided on the future of this more-than-four-year-old bull market. The recent downturn, which lasted for a month before positive news stopped the fall, bolsters this uncertainty, although we believe it was a healthy correction for which we were overdue.
The recent volatility could also be a wake-up call to contact your financial professional to determine whether changes are in order to your investment mix. Some asset groups have had long runs of outperformance. Others had truly outsized returns in 2006. These trends argue for a look to determine if these categories now represent a larger stake in your portfolios than prudent diversification would suggest they should. After all, we believe investors with a well-balanced portfolio and a marathon — not a sprint — approach to investing, stand a better chance of weathering the market’s short-term twists and turns, and reaching their long-term goals.
Sincerely,

Keith F. Hartstein,
President and Chief Executive Officer
This commentary reflects the CEO’s views as of March 31, 2007. They are subject to change at any time.
Your fund at a glance
The Funds seeks the maximum current income that is consistent with maintaining liquidity and preserving capital by investing in short-term U.S. government securities. The Fund seeks to maintain a stable $1 share price.
Over the last twelve months
► The Federal Reserve Board made two last increases in short-term interest rates, ending a two-year cycle of rate hikes.
► Money market yields held steady.
► The Fund adjusted to the new environment by extending its average maturity by increasing its weighting in fixed-rate, longer-term securities.
1
Managers’ report
John Hancock
U.S. Government Cash Reserve
Money market yields held steady in the 12-month period ending March 31, 2007, as the Federal Reserve Board concluded its short-term interest rate tightening cycle. Over the period, the federal funds rate that banks charge each other for overnight loans increased from 4.75% to 5.25% . The last rate increase occurred June 29, 2006, and marked the 17th consecutive 25 basis point (0.25%) hike since June 2004.
At the August 2006 Federal Open Market Committee (FOMC) meeting, the Fed cited slowing growth concerns, a “cooling” housing market and the delayed effect of previous interest rate hikes yet to filter through the economy as the main reasons for deciding to hold interest rates steady at 5.25% . As the period progressed, the housing market continued to slow and concerns mounted that this slowdown could move the economy towards recession. The National Association of Home Builders Market Index hit a recent historical low of 30 in September 2006, off from its recent high of 72 on June 30, 2005. A reading above 50 signifies more home builders are seeing favorable economic conditions than poor economic conditions.
As 2007 began, the market was hit with concerns about the subprime mortgage market. Subprime mortgages comprise roughly 20% of the mortgage market and are loans made to borrowers with shaky credit. As loans that had originated with low short-term “teaser” rates began resetting and housing prices failed to rise, borrowers with shaky credit were unable to refinance out of the current loans. This caused delinquencies and foreclosures to increase, further fueling the housing slowdown.
2
By Portfolio Managers, MFC Global Investment Management (U.S.), LLC David A. Bees and Michael V. Lorizio
Despite all the turmoil in the housing market, the economy remained strong on other fronts. Initial jobless claims declined in recent weeks, ending the period at 321,000 jobless claims, just slightly higher than the 12-month period average of 317,800. The unemployment rate has continued to baffle the market, decreasing from 4.7% in April of 2006 to 4.4% at the end of March 2007. Throughout the period, this mixed economic data led to uncertainty about the future of the economy and as a result the Fed has held rates steady at 5.25% .
| “Money market yields held |
| steady in the 12-month period |
| ending March 31, 2007, as the |
| Federal Reserve Board concluded |
| its short-term interest rate |
| tightening cycle.” |
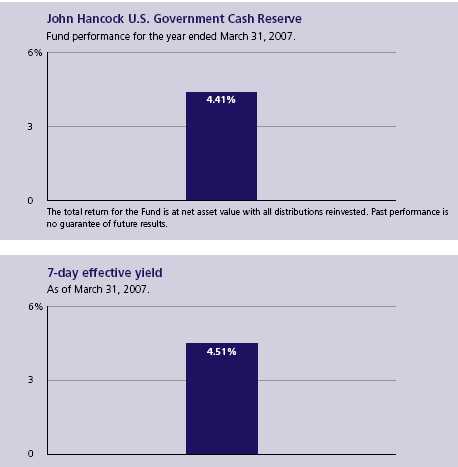
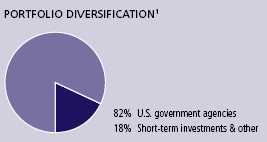
Fund yield and performance
On March 31, 2007, John Hancock U.S. Government Cash Reserve had a 7-day effective yield of 4.51% . By comparison, the average U.S. government money market fund had a 7-day effective yield of 4.61%, according to Lipper, Inc.
For the year ended March 31, 2007, the Fund posted a total return of 4.41% at net asset value, compared with the 4.48% return of the average U.S. government money market fund, according to Lipper, Inc. Keep in mind that your net asset value return will be different from the Fund’s performance if you were not invested in the Fund for the entire period or did not reinvest all distributions.
Fund moves
The portfolio structure changed significantly in the past 12 months. At the start of the period, the Fund was set up for a continued rising-rate environment. We kept our weighted average days to maturity in line with our peers, giving us an opportunity to quickly reinvest assets at higher rates. The Fund
U.S. Government Cash Reserve
3
had an equal exposure to floating-rate securities, which allowed the portfolio to capture rising rates in a timely manner due to the one-month and three-month rate-reset feature on these securities and fixed-rate securities.
As we approached the middle of 2006, further rate increases became less likely. We found value in callable securities that had passed their final callable date and we ceased purchasing any floating-rate securities with resets remaining. As it became apparent in mid summer that the rate hikes had come to an end, we began to extend our days to maturity To do so, we added to our fixed-rate weighting by purchasing a greater amount of longer-term fixed-rate securities.
By the end of the period, the overnight lending rate held steady at 5.25% for the seventh consecutive FOMC meeting. Fed funds futures pointed to a rate cut in mid to late 2007 being more likely than a rate hike. As a result, we are extended farther out on the money market curve, ending the period with a longer weighted average maturity than our peers. This enables us to lock in favorable rates ahead of any rate cuts that may occur.
| “The portfolio structure changed |
| significantly in the past 12 months.” |
Outlook
In its March 21, 2007 FOMC policy statement, the Federal Reserve stated that it is confident in the economy’s ability to continue to expand. However, it does have some serious concerns remaining. Most notably, the Fed views recent inflation measures as slightly elevated and is closely watching the ongoing adjustment that the housing sector is facing. It will rely on future incoming data to decide on its outlook for both growth and inflation; any policy adjustments will be dictated by this outlook.
U.S. Government Cash Reserve
4
We continue to monitor economic indicators and market factors that may impact interest rate policy. However, we do believe that interest rates will remain stable, but with some bias towards a rate cut occurring later in 2007. This belief has led us to our current position on the money market curve with a days-to-maturity level greater than that of our peer group. With stable short-term interest rates, outperformance will come from investing in longer-dated securities. In addition to our focus on capturing additional yield, we will strive, as always, to maintain liquidity and preserve stability of principal.
This commentary reflects the views of the portfolio management team through the end of the Fund’s period discussed in this report. The team’s statements reflect its own opinions. As such, they are in no way guarantees of future events and are not intended to be used as investment advice or a recommendation regarding any specific security. They are also subject to change at any time as market and other conditions warrant.
The Fund is neither insured nor guaranteed by the U.S. government. Although the Fund seeks to maintain a net asset value of $1.00 per share, it is possible to lose money by investing in the Fund.
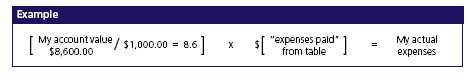
1 As a percentage of net assets on March 31, 2007.
U.S. Government Cash Reserve
5
Your expenses
These examples are intended to help you understand your ongoing operating expenses.
Understanding fund expenses
As a shareholder of the Fund, you incur two types of costs:
■ Transaction costs which include sales charges (loads) on purchases or redemptions (varies by share class), minimum account fee charge, etc.
■ Ongoing operating expenses including management fees, distribution and service fees (if applicable) and other fund expenses.
We are going to present only your ongoing operating expenses here.
Actual expenses/actual returns
This example is intended to provide information about your Fund’s actual ongoing operating expenses, and is based on your Fund’s actual return. It assumes an account value of $1,000.00 on October 1, 2006, with the same investment held until March 31, 2007.
| Account value | | Expenses paid |
| $1,000.00 | Ending value | during period |
| on 10-1-06 | on 3-31-07 | ended 3-31-071 |
|
| U.S. Government Cash Reserve | $1,022.30 | $4.35 |
|
Together with the value of your account, you may use this information to estimate the operating expenses that you paid over the period. Simply divide your account value at March 31, 2007, by $1,000.00, then multiply it by the “expenses paid” for your share class from the table above. For example, for an account value of $8,600.00, the operating expenses should be calculated as follows:
U.S. Government Cash Reserve
6
Hypothetical example for comparison purposes
This table allows you to compare your Fund’s ongoing operating expenses with those of any other fund. It provides an example of the Fund’s hypothetical account values and hypothetical expenses based on each class’s actual expense ratio and an assumed 5% annual return before expenses (which is not your Fund’s actual return). It assumes an account value of $1,000.00 on October 1, 2006, with the same investment held until March 31, 2007. Look in any other fund shareholder report to find its hypothetical example and you will be able to compare these expenses.
| Account value | | Expenses paid |
| $1,000.00 | Ending value | during period |
| on 10-1-06 | on 3-31-07 | ended 3-31-071 |
|
| U.S. Government Cash Reserve | $1,020.60 | $4.34 |
|
Remember, these examples do not include any transaction costs, such as sales charges; therefore, these examples will not help you to determine the relative total costs of owning different funds. If transaction costs were included, your expenses would have been higher. See the prospectus for details regarding transaction costs.
1 Expenses are equal to the Fund’s annualized expense ratio of 0.85%, multiplied by the average account value over the period, multiplied by number of days in most recent fiscal half-year/365 or 366 (to reflect the one-half year period).
U.S. Government Cash Reserve
7
F I N A N C I A L S T A T E M E N T S
Fund’s investments
Securities owned by the Fund on 3-31-07
This schedule is a complete list of all securities owned by the Fund. It’s divided into two types of short-term investments: U.S. government obligations and joint repurchase agreements.
| | Interest | | Maturity | Credit | Par value | |
| Issuer, description | rate | | date | rating (A) | (000) | Value |
|
| U.S. government obligations 81.70% | | | | | $27,921,444 |
| (Cost $27,921,444) | | | | | | |
| Government — U.S. Agencies 81.70% | | | | | | 27,921,444 |
|
| Federal Home Loan Bank | 5.400% | | 04-09-08 | AAA | $750 | 750,000 |
|
| Federal Home Loan Bank | 5.250 | | 10-22-07 | AAA | 750 | 750,000 |
|
| Federal Home Loan Bank | 5.045 | | 04-26-07 | AAA | 500 | 499,866 |
|
| Federal Home Loan Bank | 4.625 | | 07-11-07 | AAA | 495 | 494,106 |
|
| Federal Home Loan Bank | 4.625 | | 07-16-07 | AAA | 175 | 174,621 |
|
| Federal Home Loan Bank | 4.500 | | 05-11-07 | AAA | 900 | 899,230 |
|
| Federal Home Loan Bank | 4.250 | | 04-16-07 | AAA | 815 | 814,652 |
|
| Federal Home Loan Bank | 4.250 | | 05-08-07 | AAA | 200 | 199,765 |
|
| Federal Home Loan Bank | 4.090 | | 04-27-07 | AAA | 415 | 414,650 |
|
| Federal Home Loan Bank | 4.000 | | 04-25-07 | AAA | 425 | 424,631 |
|
| Federal Home Loan Bank | 3.875 | | 06-08-07 | AAA | 1,500 | 1,495,898 |
|
| Federal Home Loan Bank | 3.750 | | 08-15-07 | AAA | 350 | 348,033 |
|
| Federal Home Loan Bank | 3.500 | | 05-15-07 | AAA | 350 | 349,240 |
|
| Federal Home Loan Bank | 2.875 | | 04-19-07 | AAA | 450 | 449,444 |
|
| Federal Home Loan Bank | 2.625 | | 05-15-07 | AAA | 190 | 189,359 |
|
| Federal Home Loan Bank | 2.600 | | 04-13-07 | AAA | 1,000 | 999,126 |
|
| Federal Home Loan Mortgage Corp. | 5.350 | | 03-26-08 | AAA | 1,000 | 1,000,000 |
|
| Federal Home Loan Mortgage Corp. | 5.250 | | 05-16-07 | AAA | 500 | 500,000 |
|
| Federal Home Loan Mortgage Corp. | 4.500 | | 04-18-07 | AAA | 2,250 | 2,248,975 |
|
| Federal Home Loan Mortgage Corp. | 4.375 | | 11-16-07 | AAA | 500 | 497,207 |
|
| Federal Home Loan Mortgage Corp. | 4.250 | | 04-05-07 | AAA | 1,160 | 1,159,866 |
|
| Federal Home Loan Mortgage Corp. | 4.125 | | 04-12-07 | AAA | 1,000 | 999,666 |
|
| Federal Home Loan Mortgage Corp. | 4.000 | | 07-13-07 | AAA | 925 | 921,769 |
|
| Federal Home Loan Mortgage Corp. | 4.000 | | 08-17-07 | AAA | 710 | 706,541 |
|
| Federal Home Loan Mortgage Corp. | 3.010 | | 04-19-07 | AAA | 500 | 499,442 |
|
| Federal Home Loan Mortgage Corp. | 2.875 | | 05-15-07 | AAA | 1,175 | 1,171,543 |
|
| Federal Home Loan Mortgage Corp. | 2.850 | | 04-06-07 | AAA | 500 | 499,828 |
|
| Federal Home Loan Mortgage Corp. | Zero | | 04-12-07 | AAA | 285 | 284,521 |
|
| Federal Home Loan Mortgage Corp. | Zero | | 05-11-07 | AAA | 900 | 894,820 |
|
| Federal National Mortgage Assn. | 4.750 | | 08-03-07 | AAA | 1,700 | 1,696,941 |
|
| Federal National Mortgage Assn. | 4.125 | | 06-22-07 | AAA | 1,000 | 997,396 |
|
| Federal National Mortgage Assn. | 4.000 | | 06-29-07 | AAA | 280 | 279,134 |
See notes to financial statements
U.S. Government Cash Reserve
8
F I N A N C I A L S T A T E M E N T S
| | Interest | | Maturity | Credit | Par value | |
| Issuer, description | rate | | date | rating (A) | (000) | Value |
| Government — U.S. Agencies | (continued) | | | | | |
|
| Federal National Mortgage Assn. | 3.875% | | 05-15-07 | AAA | $100 | $99,812 |
|
| Federal National Mortgage Assn. | 3.750 | | 05-17-07 | AAA | 1,228 | 1,225,652 |
|
| Federal National Mortgage Assn. | 3.375 | | 05-11-07 | AAA | 350 | 349,263 |
|
| Federal National Mortgage Assn. | 3.375 | | 05-15-07 | AAA | 500 | 498,809 |
|
| Federal National Mortgage Assn. | 2.880 | | 04-12-07 | AAA | 890 | 889,361 |
|
| Federal National Mortgage Assn. | 2.875 | | 04-26-07 | AAA | 250 | 249,583 |
|
| Federal National Mortgage Assn. | 2.720 | | 04-19-07 | AAA | 1,000 | 998,694 |
| |
| | | | | Interest | Par value | |
| Issuer, description, maturity date | | | | rate | (000) | Value |
|
| Short-term investments 17.39% | | | | | $5,941,000 |
| (Cost $5,941,000) | | | | | | |
| Joint Repurchase Agreement 17.39% | | | | | 5,941,000 |
|
| Investment in a joint repurchase agreement transaction with | | | |
| Morgan Stanley — Dated 3-30-07, due 4-02-07 (secured by | | | |
| U.S. Treasury Inflation Indexed Note 1.625% due 1-15-15). | | | |
| Maturity value: $5,943,550 | | | | 5.150% | $5,941 | 5,941,000 |
|
| Total investments (Cost $33,862,444) 99.09% | | | | | $33,862,444 |
|
| |
| Other assets and liabilities, net 0.91% | | | | | $312,183 |
|
| |
| Total net assets 100.00% | | | | | | $34,174,627 |
(A) Credit ratings are unaudited and are rated by Moody’s Investors Service where Standard & Poor’s ratings are not available.
The percentage shown for each investment category is the total value of that category as a percentage of the net assets of the Fund.
See notes to financial statements
U.S. Government Cash Reserve
9
F I N A N C I A L S T A T E M E N T S
Financial statements
Statement of assets and liabilities 3-31-07
This Statement of Assets and Liabilities is the Fund’s balance sheet. It shows the value of what the Fund owns, is due and owes. You’ll also find the net asset value per share.
| Assets | |
|
| Investments at value (Cost $27,921,444) | $27,921,444 |
| Joint repurchase agreement (Cost $5,941,000) | 5,941,000 |
| Cash | 739 |
| Receivable for shares sold | 40,981 |
| Interest receivable | 335,857 |
| Other assets | 55,000 |
| Total assets | 34,295,021 |
| |
| Liabilities | |
|
| Payable for shares repurchased | 16,079 |
| Dividends payable | 9,331 |
| Payable to affiliates | |
| Management fees | 15,668 |
| Other | 5,298 |
| Other payables and accrued expenses | 74,018 |
| Total liabilities | 120,394 |
| |
| Net assets | |
|
| Capital paid-in | 34,174,415 |
| Accumulated net investment income | 212 |
| Net assets | $34,174,627 |
| |
| Net asset value per share | |
|
| Based on net asset value and shares outstanding — | |
| the Fund has an unlimited number of shares | |
| authorized with no par value | |
| ($34,174,627 ÷ 34,192,672 shares) | $1.00 |
See notes to financial statements
U.S. Government Cash Reserve
10
F I N A N C I A L S T A T E M E N T S
Statement of operations For the year ended 3-31-07
This Statement of Operations summarizes the Fund’s investment income earned and expenses incurred in operating the Fund.
| Investment income | |
|
| Interest | $1,926,724 |
| Total investment income | 1,926,724 |
| |
| Expenses | |
|
| Investment management fees (Note 2) | 186,392 |
| Distribution and service fees (Note 2) | 55,918 |
| Transfer agent fees (Note 2) | 38,682 |
| Accounting and legal services fees (Note 2) | 5,046 |
| Compliance fees | 1,000 |
| Blue sky fees | 26,676 |
| Custodian fees | 20,866 |
| Professional fees | 17,530 |
| Printing fees | 11,887 |
| Trustees’ fees | 1,929 |
| Interest | 511 |
| Miscellaneous | 5,991 |
| Total expenses | 372,428 |
| Less expense reductions (Note 2) | (55,918) |
| Net expenses | 316,510 |
| Net investment income | 1,610,214 |
| Increase in net assets from operations | $1,610,214 |
See notes to financial statements
U.S. Government Cash Reserve
11
F I N A N C I A L S T A T E M E N T S
Statement of changes in net assets
These Statements of Changes in Net Assets show how the value of the Fund’s net assets has changed during the last two periods. The difference reflects earnings less expenses, any investment gains and losses, distributions, if any, paid to shareholders and the net of Fund share transactions.
| | Year | Year |
| | ended | ended |
| | 3-31-06 | 3-31-07 |
|
| Increase (decrease) in net assets | | |
|
| From operations | | |
| Net investment income | $1,214,400 | $1,610,214 |
| Increase in net assets resulting from operations | 1,214,400 | 1,610,214 |
| Distributions to shareholders | | |
| From net investment income | (1,214,400) | (1,610,214) |
| From Fund share transactions | (4,950,260) | (6,363,522) |
| |
| Net assets | | |
|
| Beginning of period | 45,488,409 | 40,538,149 |
| End of period1 | $40,538,149 | $34,174,627 |
1 Includes accumulated net investment income of $212 and $212, respectively.
See notes to financial statements
U.S. Government Cash Reserve
12
F I N A N C I A L S T A T E M E N T S
Financial highlights
The Financial Highlights show how the Fund’s net asset value for a share has changed since the end of the previous period.
| Period ended | 3-31-031 | 3-31-041 | 3-31-051 | 3-31-06 | 3-31-07 |
|
| Per share operating performance | | | | | |
|
| Net asset value, beginning of period | $1.00 | $1.00 | $1.00 | $1.00 | $1.00 |
| Net investment income2 | 0.01 | —3 | 0.01 | 0.03 | 0.04 |
| Less distributions | | | | | |
| From net investment income | (0.01) | —3 | (0.01) | (0.03) | (0.04) |
| Net asset value, end of period | $1.00 | $1.00 | $1.00 | $1.00 | $1.00 |
| Total return4,5 (%) | 0.91 | 0.34 | 0.80 | 2.89 | 4.41 |
| |
| Ratios and supplemental data | | | | | |
|
| Net assets, end of period | | | | | |
| (in millions) | $73 | $57 | $45 | $41 | $34 |
| Ratio of net expenses to average | | | | | |
| net assets (%) | 0.73 | 0.77 | 0.84 | 0.87 | 0.85 |
| Ratio of gross expenses | | | | | |
| to average net assets6 (%) | 0.88 | 0.92 | 0.99 | 1.02 | 1.00 |
| Ratio of net investment income | | | | | |
| to average net assets (%) | 0.92 | 0.34 | 0.77 | 2.83 | 4.32 |
1 Audited by previous auditor.
2 Based on the average of the shares outstanding.
3 Less than $0.01 per share.
4 Assumes dividend reinvestment.
5 Total returns would have been lower had certain expenses not been reduced during the periods shown.
6 Does not take into consideration expense reductions during the periods shown.
See notes to financial statements
U.S. Government Cash Reserve
13
Notes to financial statements
Note 1 Accounting policies
John Hancock U.S. Government Cash Reserve (the “Fund”) is a diversified series of John Hancock Current Interest (the “trust”), an open-end management investment company registered under the Investment Company Act of 1940 (the “1940 Act”), as amended. The investment objective of the Fund is to provide maximum current income consistent with maintaining liquidity and preserving capital.
Significant accounting policies of the Fund are as follows:
Valuation of investments
Securities in the Fund’s portfolio are valued at amortized cost, in accordance with Rule 2a-7 of the 1940 Act, as amended, which approximates market value. The amortized cost method involves valuing a security at its cost on the date of purchase and thereafter assuming a constant amortization to maturity of the difference between the principal amount due at maturity and the cost of the security to the Fund.
Joint repurchase agreement
Pursuant to an exemptive order issued by the Securities and Exchange Commission, the Fund, along with other registered investment companies having a management contract with John Hancock Advisers, LLC (the “Adviser”), a wholly owned subsidiary of John Hancock Financial Services, Inc., a subsidiary of Manulife Financial Corporation (“MFC”), may participate in a joint repurchase agreement transaction. Aggregate cash balances are invested in one or more large repurchase agreements, whose underlying securities are obligations of the U.S. government and/or its agencies. The Fund’s custodian bank receives delivery of the underlying securities for the joint account on the Fund’s behalf. The Adviser is responsible for ensuring that the agreement is fully collateralized at all times.
Investment transactions
Investment transactions are recorded as of the date of purchase, sale or maturity. Net realized gains and losses on sales of investments are determined on the identified costs basis.
Investment transactions are accounted for on a trade date plus one basis for daily net asset value calculations. However, for financial reporting purposes, investment transactions are reported on trade date. Net realized gains and losses on sales of investments are determined on the identified cost basis.
Expenses
The majority of expenses are directly identifiable to an individual fund. Expenses that are not readily identifiable to a specific fund are allocated in such a manner as deemed equitable, taking into consideration, among other things, the nature and type of expense and the relative size of the funds.
Federal income taxes
The Fund qualifies as a “regulated investment company” by complying with the applicable provisions of the Internal Revenue Code and will not be subject to federal income tax on taxable income that is distributed to shareholders. Therefore, no federal income tax provision is required.
New accounting pronouncements
In June 2006, Financial Accounting Standards Board (“FASB”) Interpretation No. 48, Accounting for Uncertainty in Income Taxes (the “Interpretation”) was issued, and is effective for fiscal years beginning after December 15, 2006, and is to be applied to all open tax years as of the effective date. This Interpretation prescribes a minimum threshold for financial statement recognition of the benefit of a tax position taken or expected to be taken in a tax return, and requires certain expanded disclosures.
U.S. Government Cash Reserve
14
Management is currently evaluating the application of the Interpretation to the Fund and has not at this time quantified the impact, if any, resulting from the adoption of this Interpretation on the Fund’s financial statements. The Fund will implement this pronouncement no later than September 30, 2007.
In September 2006, FASB Standard No. 157, Fair Value Measurements (“FAS 157”), was issued and is effective for fiscal years beginning after November 15, 2007. FAS 157 defines fair value, establishing a framework for measuring fair value and expands disclosure about fair value measurements. Management is currently evaluating the application of FAS 157 to the Fund and its impact, if any, resulting from the adoption of FAS 157 on the Fund’s financial statements.
Distributions
The Fund’s net investment income is declared daily as dividends to shareholders of record as of the close of business on the preceding day, and distributed monthly.
During the year ended March 31, 2006, the tax character of distributions paid was as follows: ordinary income $1,214,400. During the year ended March 31, 2007, the tax character of distributions paid was as follows: ordinary income $1,610,214.
As of March 31, 2007, the components of distributable earnings on a tax basis included $18,905 of undistributed ordinary income.
Such distributions and distributable earnings, on a tax basis, are determined in conformity with income tax regulations, which may differ from accounting principles generally accepted in the United States of America. Distributions in excess of tax basis earnings and profits, if any, are reported in the Fund’s financial statements as a return of capital.
Use of estimates
The preparation of these financial statements, in accordance with accounting principles generally accepted in the United States of America, incorporates estimates made by management in determining the reported amount of assets, liabilities, revenues and expenses of the Fund. Actual results could differ from these estimates.
Note 2
Management fee and transactions with affiliates and others
The Fund has an investment management contract with the Adviser. Under the investment management contract, the Fund pays a monthly management fee to the Adviser equivalent, on an annual basis, to the sum of:
(a) 0.50% of the first $500,000,000 of the Fund’s average daily net asset value,
(b) 0.425% of the next $250,000,000,
(c) 0.375% of the next $250,000,000,
(d) 0.35% of the next $500,000,000,
(e) 0.325% of the next $500,000,000,
(f) 0.30% of the next $500,000,000 and
(g) 0.275% of the average daily net asset value in excess of $2,500,000,000.
Effective December 31, 2005, the investment management teams of the Adviser were reorganized into Sovereign Asset Management LLC (“Sovereign”), a wholly owned indirect subsidiary of John Hancock Life Insurance Company (“JHLICO”), a subsidiary of MFC. The Adviser remains the principal advisor on the Fund and Sovereign acts as subadviser under the supervision of the Adviser. The restructuring did not have an impact on the Fund, which continues to be managed using the same investment philosophy and process. The Fund is not responsible for payment of the subadvisory fees.
Effective October 1, 2006, Sovereign changed its name to MFC Global Investment Management (U.S.), LLC.
The Fund has a Distribution Agreement with John Hancock Funds, LLC (“JH Funds”), a wholly owned subsidiary of the Adviser. The Fund has adopted Distribution Plans, pursuant to Rule 12b-1 under the 1940 Act, as amended, to reimburse JH Funds for the services it provides as distributor of shares of the Fund at an annual rate not to exceed 0.15% of the Fund’s average daily net asset value. JH Funds has agreed to suspend the distribution and service (“12b-1”) fee, at least until July 31, 2007. Accordingly, the reduction in the 12b-1 fee amounted to $55,918 for the year ended March 31, 2007. JH Funds reserves the right to terminate this limitation in the future.
U.S. Government Cash Reserve
15
The Fund has a transfer agent agreement with John Hancock Signature Services, Inc. (“Signature Services”), an indirect subsidiary of JHLICO. The Fund pays a monthly transfer agent fee at an annual rate of 0.01% of the average daily net asset value, plus a fee based on the number of shareholder accounts and reimbursement for certain out-of-pocket expenses. Signature Services agreed to voluntarily reduce the Fund’s asset-based portion of the transfer agent fee if the total transfer agent fee exceeded the median transfer agency fee for comparable mutual funds by greater than 0.05% . There were no transfer agent fee reductions during the year ended March 31, 2007. Signature Services terminated this reimbursement agreement June 30, 2006.
The Fund has an agreement with the Adviser and affiliates to perform necessary tax, accounting and legal services for the Fund. The compensation for the year amounted to $5,046. The Fund also paid the Adviser the amount of $66 for certain publishing services, included in the printing fees. The Fund reimbursed JHLICO for certain compliance costs, included in the Fund’s Statement of Operations.
Mr. James R. Boyle is Chairman of the Adviser, as well as affiliated Trustee of the Fund, and is compensated by the Adviser and/or its affiliates. The compensation of unaffiliated Trustees is borne by the Fund. The unaffiliated Trustees may elect to defer, for tax purposes, their receipt of this compensation under the John Hancock Group of Funds Deferred Compensation Plan. The Fund makes investments into other John Hancock funds, as applicable, to cover its liability for the deferred compensation. Investments to cover the Fund’s deferred compensation liability are recorded on the Fund’s books as an other asset. The deferred compensation liability and the related other asset are always equal and are marked to market on a periodic basis to reflect any income earned by the investments, as well as any unrealized gains or losses. The Deferred Compensation Plan investments had no impact on the operations of the Fund.
Note 3
Fund share transactions
This listing illustrates the number of Fund shares sold, reinvested and repurchased during the last two periods, along with the corresponding dollar value. Analysis of Fund share transactions is reported at $1 per share.
| | Year ended 3-31-06 | Year ended 3-31-07 |
| | Amount | Amount |
| Sold | $16,985,735 | $11,667,946 |
| Distributions reinvested | 1,157,185 | 1,526,613 |
| Repurchased | (23,093,180) | (19,558,081) |
| Net decrease | ($4,950,260) | ($6,363,522) |
Note 4
Investment transactions
Purchases and proceeds from sales or maturities of securities, including discount earned on investment securities other than short-term securities and obligations of the U.S. government, during the year ended March 31, 2007, aggregated $1,800,478,255 and $1,807,303,000, respectively.
The cost of investments owned on March 31, 2007, for federal income tax purposes, was $33,862,444.
U.S. Government Cash Reserve
16
Auditors’ report
Report of Independent Registered Public Accounting Firm
To the Board of Trustees of the John Hancock Current Interest and Shareholders of John Hancock U.S. Government Cash Reserve Fund,
In our opinion, the accompanying statement of assets and liabilities, including the schedule of investments, and the related statements of operations and of changes in net assets and the financial highlights present fairly, in all material respects, the financial position of John Hancock U.S. Government Cash Reserve (the “Fund”) at March 31, 2007, the results of its operations, the changes in its net assets and the financial highlights for the periods indicated, in conformity with accounting principles generally accepted in the United States of America. These financial statements and financial highlights (hereafter referred to as “financial statements”) are the responsibility of the Fund’s management; our responsibility is to express an opinion on these financial statements based on our audits. We conducted our audits of these financial statements in accordance with the standards of the Public Company Accounting Oversight Board (United States). T hose standards require that we plan and perform the audit to obtain reasonable assurance about whether the financial statements are free of material misstatement. An audit includes examining, on a test basis, evidence supporting the amounts and disclosures in the financial statements, assessing the accounting principles used and significant estimates made by management and evaluating the overall financial statement presentation. We believe that our audits, which included confirmation of securities at March 31, 2007 by correspondence with the custodian and brokers, provide a reasonable basis for our opinion. The financial highlights for each of the three years ended on or before March 31, 2005 were audited by another independent registered public accounting firm, whose report dated May 5, 2005 expressed an unqualified opinion thereon.
PricewaterhouseCoopers LLP
Boston, Massachusetts
April 30, 2007
17
Tax information
(unaudited)
For federal income tax purposes, the following information is furnished with respect to the distributions of the Fund, if any, paid during its taxable year ended March 31, 2007.
The Fund hereby designates the maximum amount allowable of its net taxable income as qualified dividend income as provided in the Jobs and Growth Tax Relief Reconciliation Act of 2003. This amount will be reflected on Form 1099-DIV for the calendar year 2007.
Shareholders will be mailed a 2007 U.S. Treasury Department Form 1099-DIV in January 2008. This will reflect the total of all distributions that are taxable for calendar year 2007.
18
Board Consideration of and Continuation of Investment Advisory Agreement and Subadvisory Agreement: John Hancock U.S. Government Cash Reserve
The Investment Company Act of 1940 (the “1940 Act”) requires the Board of Trustees (the “Board”) of John Hancock Current Interest (the “Trust”), including a majority of the Trustees who have no direct or indirect interest in the investment advisory agreement and are not “interested persons” of the Trust, as defined in the 1940 Act (the “Independent Trustees”), annually to review and consider the continuation of: (i) the investment advisory agreement (the “Advisory Agreement”) with John Hancock Advisers, LLC (the “Adviser”) and (ii) the investment subadvisory agreement (the “Subadvisory Agreement”) with Sovereign Asset Management LLC (the “Subadviser”) for the John Hancock U.S. Government Cash Reserve (the “Fund”). The Advisory Agreement and the Subadvisory Agreement are collectively referred to as the “Advisory Agreements.”
At meetings held on May 1–2 and June 5–6, 2006,1 the Board considered the factors and reached the conclusions described below relating to the selection of the Adviser and Subadviser and the continuation of the Advisory Agreements. During such meetings, the Board’s Contracts/Operations Committee and the Independent Trustees also met in executive sessions with their independent legal counsel.
In evaluating the Advisory Agreements, the Board, including the Contracts/Operations Committee and the Independent Trustees, reviewed a broad range of information requested for this purpose by the Independent Trustees, including: (i) the investment performance of the Fund relative to a category of relevant funds (the “Category”) and a peer group of comparable funds (the “Peer Group”) each selected by Morningstar Inc. (“Morningstar”), an independent provider of investment company data, for a range of periods ended December 31, 2005, (ii) advisory and other fees incurred by, and the expense ratios of, the Fund relative to a Category and a Peer Group, (iii) the advisory fees of comparable portfolios of other clients of the Adviser and the Subadviser, (iv) the Adviser’s financial results and condition, including its and certain of its affiliates’ profitability from services performed for the Fund, ( v) breakpoints in the Fund’s and the Peer Group’s fees, and information about economies of scale, (vi) the Adviser’s and Subadviser’s record of compliance with applicable laws and regulations, with the Fund’s investment policies and restrictions, and with the applicable Code of Ethics, and the structure and responsibilities of the Adviser’s and Subadviser’s compliance department, (vii) the background and experience of senior management and investment professionals, and (viii) the nature, cost and character of advisory and non-investment management services provided by the Adviser and its affiliates and by the Subadviser.
The Board’s review and conclusions were based on a comprehensive consideration of all information presented to the Board and not the result of any single controlling factor. It was based on performance and other information as of December 31, 2005; facts may have changed between that date and the date of this shareholders report. The key factors considered by the Board and the conclusions reached are described below.
Nature, extent and quality of services
The Board considered the ability of the Adviser and the Subadviser, based on their resources, reputation and other attributes, to attract and retain qualified investment professionals, including research, advisory, and supervisory personnel. The Board further considered the compliance programs and compliance records of the Adviser and Subadviser. In addition, the Board took into account the administrative services provided to the Fund by the Adviser and its affiliates.
Based on the above factors, together with those referenced below, the Board concluded that, within the context of its full deliberations, the nature, extent and quality of the investment advisory services provided to the Fund by the Adviser and Subadviser were sufficient to support renewal of the Advisory Agreements.
Fund performance
The Board considered the performance results for the Fund over various time periods ended December 31, 2005. The Board also considered
19
these results in comparison to the performance of the Category, as well as the Fund’s benchmark index. Morningstar determined the Category and Peer Group for the Fund. The Board reviewed with a representative of Morningstar the methodology used by Morningstar to select the funds in the Category and the Peer Group.
The Board noted that the Fund’s performance during the review periods ended December 31, 2005 was generally competitive with the performance of the Peer Group and Category medians, and its benchmark index, the 3 Month T-Bill. The Board also noted that the Fund’s more recent performance for the 1-, 3- and 5-year periods was lower than the performance of the Peer Group and Category medians and benchmark index. The Board indicated its intent to continue to monitor the Fund’s performance trends.
Investment advisory fee and subadvisory fee rates and expenses
The Board reviewed and considered the contractual investment advisory fee rate payable by the Fund to the Adviser for investment advisory services (the “Advisory Agreement Rate”). The Board received and considered information comparing the Advisory Agreement Rate with the advisory fees for the Peer Group. The Board noted that the Advisory Agreement Rate was higher than the median rate of the Peer Group and Category.
The Board received and considered expense information regarding the Fund’s various components, including advisory fees, distribution and fees other than advisory and distribution fees, including transfer agent fees, custodian fees, and other miscellaneous fees (e.g., fees for accounting and legal services). The Board considered comparisons of these expenses to the Peer Group median. The Board also received and considered expense information regarding the Fund’s total operating expense ratio (“Gross Expense Ratio”) and total operating expense ratio after taking the fee waiver arrangement applicable to the Advisory Agreement Rate into account (“Net Expense Ratio”). The Board received and considered information comparing the Gross Expense Ratio and Net Expense Ratio of the Fund to that of the Peer Group and Category medians. The Board noted that the Fund’s Gross and Net Expense Ratios were higher than medians of the Peer Group and Category. The Board favorably considered the impact of continuing fee waivers towards ultimately lowering the Fund’s total operating expense ratio.
The Adviser also discussed the Morningstar data and rankings, and other relevant information, for the Fund. Based on the above-referenced considerations and other factors, the Board concluded that the Fund’s overall performance and expenses supported the re-approval of the Advisory Agreements.
The Board also received information about the investment subadvisory fee rate (the “Subadvisory Agreement Rate”) payable by the Adviser to the Subadviser for investment sub-advisory services. The Board concluded that the Subadvisory Agreement Rate was fair and equitable, based on its consideration of the factors described here.
Profitability
The Board received and considered a detailed profitability analysis of the Adviser based on the Advisory Agreements, as well as on other relationships between the Fund and the Adviser and its affiliates, including the Subadviser. The Board concluded that, in light of the costs of providing investment management and other services to the Fund, the profits and other ancillary benefits reported by the Adviser were not unreasonable.
Economies of scale
The Board received and considered general information regarding economies of scale with respect to the management of the Fund, including the Fund’s ability to appropriately benefit from economies of scale under the Fund’s fee structure. The Board recognized the inherent limitations of any analysis of economies of scale, stemming largely from the Board’s understanding that most of the Adviser’s costs are not specific to individual Funds, but rather are incurred across a variety of products and services.
To the extent the Board and the Adviser were able to identify actual or potential economies of scale from Fund-specific or allocated expenses, in order to ensure that any such economies
20
continue to be reasonably shared with the Fund as its assets increase, the Adviser and the Board agreed to continue the existing breakpoints to the Advisory Agreement Rate.
Information about services to other clients
The Board also received information about the nature, extent and quality of services and fee rates offered by the Adviser and Subadviser to their other clients, including other registered investment companies, institutional investors and separate accounts. The Board concluded that the Advisory Agreement Rate and the Subadvisory Agreement Rate were not unreasonable, taking into account fee rates offered to others by the Adviser and Subadviser, respectively, after giving effect to differences in services.
Other benefits to the Adviser
The Board received information regarding potential “fall-out” or ancillary benefits received by the Adviser and its affiliates as a result of the Adviser’s relationship with the Fund. Such benefits could include, among others, benefits directly attributable to the relationship of the Adviser with the Fund and benefits potentially derived from an increase in the business of the Adviser as a result of its relationship with the Fund (such as the ability to market to shareholders other financial products offered by the Adviser and its affiliates).
The Board also considered the effectiveness of the Adviser’s, Subadviser’s and Fund’s policies and procedures for complying with the requirements of the federal securities laws, including those relating to best execution of portfolio transactions and brokerage allocation.
Other factors and broader review
As discussed above, the Board reviewed detailed materials received from the Adviser and Subadviser as part of the annual re-approval process. The Board also regularly reviews and assesses the quality of the services that the Fund receives throughout the year. In this regard, the Board reviews reports of the Adviser at least quarterly, which include, among other things, a detailed portfolio review, detailed fund performance reports and compliance reports. In addition, the Board meets with portfolio managers and senior investment officers at various times throughout the year.
After considering the above-described factors and based on its deliberations and its evaluation of the information described above, the Board concluded that approval of the continuation of the Advisory Agreements for the Fund was in the best interest of the Fund and its shareholders. Accordingly, the Board unanimously approved the continuation of the Advisory Agreements.
1 The Board previously considered information about the Subadvisory Agreement at the September and December 2005 Board meetings in connection with the Adviser’s reorganization.
21
Trustees and Officers
This chart provides information about the Trustees and Officers who oversee your John Hancock fund. Officers elected by the Trustees manage the day-to-day operations of the Fund and execute policies formulated by the Trustees.
| Independent Trustees | | |
| |
| Name, Year of Birth | | Number of |
| Position(s) held with Fund | Trustee | John Hancock |
| Principal occupation(s) and other | of Fund | funds overseen |
| directorships during past 5 years | since1 | by Trustee |
|
| Ronald R. Dion, Born: 1946 | 1998 | 66 |
| Independent Chairman (since 2005); Chairman and Chief Executive Officer, | | |
| R.M. Bradley & Co., Inc.; Director, The New England Council and Massachusetts | |
| Roundtable; Trustee, North Shore Medical Center; Director, Boston Stock | | |
| Exchange; Director, BJ’s Wholesale Club, Inc. and a corporator of the Eastern | | |
| Bank; Trustee, Emmanuel College; Director, Boston Municipal Research Bureau; | |
| Member of the Advisory Board, Carroll Graduate School of Management at | | |
| Boston College. | | |
|
| |
| James F. Carlin, Born: 1940 | 1994 | 66 |
| Director and Treasurer, Alpha Analytical Laboratories Inc. (chemical analysis) | | |
| (since 1985); Part Owner and Treasurer, Lawrence Carlin Insurance Agency, | | |
| Inc. (since 1995); Part Owner and Vice President, Mone Lawrence Carlin | | |
| Insurance Agency, Inc. (until 2005); Chairman and Chief Executive Officer, | | |
| Carlin Consolidated, Inc. (management/investments) (since 1987); Trustee, | | |
| Massachusetts Health and Education Tax Exempt Trust (1993–2003). | | |
|
| |
| William H. Cunningham, Born: 1944 | 1987 | 66 |
| Former Chancellor, University of Texas System and former President of the | | |
| University of Texas, Austin, Texas; Chairman and Chief Executive Officer, | | |
| IBT Technologies (until 2001); Director of the following: Hire.com (until 2004), | | |
| STC Broadcasting, Inc. and Sunrise Television Corp. (until 2001), Symtx, Inc. | | |
| (electronic manufacturing) (since 2001), Adorno/Rogers Technology, Inc. (until | | |
| 2004), Pinnacle Foods Corporation (until 2003), rateGenius (until 2003), Lincoln | |
| National Corporation (insurance) (since 2006), Jefferson-Pilot Corporation | | |
| (diversified life insurance company) (until 2006), New Century Equity Holdings | | |
| (formerly Billing Concepts) (until 2001), eCertain (until 2001), ClassMap.com | | |
| (until 2001), Agile Ventures (until 2001), AskRed.com (until 2001), Southwest | | |
| Airlines (since 2000), Introgen (since 2000) and Viasystems Group, Inc. (electronic | |
| manufacturer) (until 2003); Advisory Director, Interactive Bridge, Inc. (college | | |
| fundraising) (until 2001); Advisory Director, Q Investments (until 2003); | | |
| Advisory Director, JPMorgan Chase Bank (formerly Texas Commerce Bank – | | |
| Austin), LIN Television (since 2002), WilTel Communications (until 2003) and | | |
| Hayes Lemmerz International, Inc. (diversified automotive parts supply company) | |
| (since 2003). | | |
22
| Independent Trustees (continued) | | |
| |
| Name, Year of Birth | | Number of |
| Position(s) held with Fund | Trustee | John Hancock |
| Principal occupation(s) and other | of Fund | funds overseen |
| directorships during past 5 years | since1 | by Trustee |
|
| Charles L. Ladner,2 Born: 1938 | 1994 | 66 |
| Chairman and Trustee, Dunwoody Village, Inc. (retirement services) (until 2003); | |
| Senior Vice President and Chief Financial Officer, UGI Corporation (public utility | |
| holding company) (retired 1998); Vice President and Director, AmeriGas, Inc. | | |
| (retired 1998); Director, AmeriGas Partners, L.P. (gas distribution) (until 1997); | | |
| Director, EnergyNorth, Inc. (until 1995); Director, Parks and History Association | |
| (until 2005). | | |
|
| |
| John A. Moore,2 Born: 1939 | 2005 | 66 |
| President and Chief Executive Officer, Institute for Evaluating Health Risks, | | |
| (nonprofit institution) (until 2001); Senior Scientist, Sciences International | | |
| (health research) (until 2003); Former Assistant Administrator and Deputy | | |
| Administrator, Environmental Protection Agency; Principal, Hollyhouse | | |
| (consulting) (since 2000); Director, CIIT Center for Health Science Research | | |
| (nonprofit research) (2002–2006). | | |
|
| |
| Patti McGill Peterson,2 Born: 1943 | 2005 | 66 |
| Executive Director, Council for International Exchange of Scholars and Vice | | |
| President, Institute of International Education (since 1998); Senior Fellow, Cornell | |
| Institute of Public Affairs, Cornell University (until 1998); Former President of | | |
| Wells College and St. Lawrence University; Director, Niagara Mohawk Power | | |
| Corporation (until 2003); Director, Ford Foundation, International Fellowships | | |
| Program (since 2002); Director, Lois Roth Endowment (since 2002); Director, | | |
| Council for International Educational Exchange (since 2003). | | |
|
| |
| Steven R. Pruchansky, Born: 1944 | 1994 | 66 |
| Chairman and Chief Executive Officer, Greenscapes of Southwest Florida, Inc. | | |
| (since 2000); Director and President, Greenscapes of Southwest Florida, Inc. | | |
| (until 2000); Managing Director, JonJames, LLC (real estate) (since 2001); | | |
| Director, First Signature Bank & Trust Company (until 1991); Director, Mast | | |
| Realty Trust (until 1994); President, Maxwell Building Corp. (until 1991). | | |
| |
| Non-Independent Trustee3 | | |
| |
| Name, Year of Birth | | Number of |
| Position(s) held with Fund | Trustee | John Hancock |
| Principal occupation(s) and other | of Fund | funds overseen |
| directorships during past 5 years | since1 | by Trustee |
|
| James R. Boyle, Born: 1959 | 2005 | 272 |
| President, John Hancock Insurance Group; Executive Vice President, John | | |
| Hancock Life Insurance Company (since June 2004); Chairman and Director, | | |
| John Hancock Advisers, LLC (the “Adviser”), John Hancock Funds, LLC and | | |
| The Berkeley Financial Group, LLC (“The Berkeley Group”) (holding company) | | |
| (since 2005); Senior Vice President, The Manufacturers Life Insurance Company | |
| (U.S.A.) (until 2004). | | |
23
| Principal officers who are not Trustees | |
| |
| Name, Year of Birth | |
| Position(s) held with Fund | Officer |
| Principal occupation(s) and | of Fund |
| directorships during past 5 years | since |
|
| Keith F. Hartstein, Born: 1956 | 2005 |
| President and Chief Executive Officer | |
| Senior Vice President, Manulife Financial Corporation (since 2004); Director, | |
| President and Chief Executive Officer, the Adviser, The Berkeley Group, John | |
| Hancock Funds, LLC (since 2005); Director, MFC Global Investment Management | |
| (U.S.), LLC (“MFC Global (U.S.)”) (since 2005); Director, John Hancock Signature | |
| Services, Inc. (since 2005); President and Chief Executive Officer, John Hancock | |
| Investment Management Services, LLC (since 2006); President and Chief Executive | |
| Officer, John Hancock Funds II, John Hancock Funds III and John Hancock Trust; | |
| Director, Chairman and President, NM Capital Management, Inc. (since 2005); | |
| Chairman, Investment Company Institute Sales Force Marketing Committee | |
| (since 2003); Director, President and Chief Executive Officer, MFC Global (U.S.) | |
| (2005–2006); Executive Vice President, John Hancock Funds, LLC (until 2005). | |
|
| |
| Thomas M. Kinzler, Born: 1955 | 2006 |
| Secretary and Chief Legal Officer | |
| Vice President and Counsel, John Hancock Life Insurance Company (U.S.A.) | |
| (since 2006); Secretary and Chief Legal Officer, John Hancock Funds, John | |
| Hancock Funds II, John Hancock Funds III and John Hancock Trust (since 2006); | |
| Vice President and Associate General Counsel, Massachusetts Mutual Life | |
| Insurance Company (1999–2006); Secretary and Chief Legal Counsel, MML | |
| Series Investment Fund (2000–2006); Secretary and Chief Legal Counsel, | |
| MassMutual Institutional Funds (2000–2004); Secretary and Chief Legal Counsel, | |
| MassMutual Select Funds and MassMutual Premier Funds (2004–2006). | |
|
| |
| Francis V. Knox, Jr., Born: 1947 | 2005 |
| Chief Compliance Officer | |
| Vice President and Chief Compliance Officer, John Hancock Investment | |
| Management Services, LLC, the Adviser and MFC Global (U.S.) (since 2005); | |
| Vice President and Chief Compliance Officer, John Hancock Funds II, John | |
| Hancock Funds III and John Hancock Trust (since 2005); Vice President and | |
| Assistant Treasurer, Fidelity Group of Funds (until 2004); Vice President and | |
| Ethics & Compliance Officer, Fidelity Investments (until 2001). | |
|
| |
| Gordon M. Shone, Born: 1956 | 2006 |
| Treasurer | |
| Treasurer, John Hancock Funds (since 2006), John Hancock Funds II, John | |
| Hancock Funds III and John Hancock Trust (since 2005); Vice President and | |
| Chief Financial Officer, John Hancock Trust (2003–2005); Senior Vice President, | |
| John Hancock Life Insurance Company (U.S.A.) (since 2001); Vice President, | |
| John Hancock Investment Management Services, Inc., John Hancock Advisers, | |
| LLC (since 2006) and The Manufacturers Life Insurance Company (U.S.A.) | |
| (1998–2000). | |
24
| Principal officers who are not Trustees (continued) | |
| |
| Name, Year of Birth | |
| Position(s) held with Fund | Officer |
| Principal occupation(s) and | of Fund |
| directorships during past 5 years | since |
|
| John G. Vrysen, Born: 1955 | 2005 |
| Chief Financial Officer | |
| Senior Vice President, Manulife Financial Corporation (since 2006); Director, | |
| Executive Vice President and Chief Financial Officer, the Adviser, The Berkeley | |
| Group and John Hancock Funds, LLC (since 2005); Executive Vice President and | |
| Chief Financial Officer, John Hancock Investment Management Services, LLC | |
| (since 2005); Vice President and Chief Financial Officer, MFC Global (U.S.) | |
| (since 2005); Director, John Hancock Signature Services, Inc. (since 2005); | |
| Chief Financial Officer, John Hancock Funds II, John Hancock Funds III and John | |
| Hancock Trust (since 2005); Vice President and General Manager, Fixed Annuities, | |
| U.S. Wealth Management (until 2005); Vice President, Operations, Manulife | |
| Wood Logan (2000–2004). | |
The business address for all Trustees and Officers is 601 Congress Street, Boston, Massachusetts 02210-2805.
The Statement of Additional Information of the Fund includes additional information about members of the Board of Trustees of the Fund and is available, without charge, upon request, by calling 1-800-225-5291.
1Each Trustee serves until resignation, retirement age or until his or her successor is elected.
2Member of Audit Committee.
3Non-Independent Trustee holds positions with the Fund’s investment adviser, underwriter and certain other affiliates.
25
For more information
The Fund’s proxy voting policies, procedures and records are available without charge, upon request:
| By phone | On the Fund’s Web site | On the SEC’s Web site |
| 1-800-225-5291 | www.jhfunds.com/proxy | www.sec.gov |
|
| |
| Investment adviser | Custodian | Legal counsel |
| John Hancock Advisers, LLC | The Bank of New York | Kirkpatrick & Lockhart |
| 601 Congress Street | One Wall Street | Preston Gates Ellis LLP |
| Boston, MA 02210-2805 | New York, NY 10286 | 1 Lincoln Street |
| | Boston, MA 02111-2950 |
| Subadviser | Transfer agent | |
| MFC Global Investment | John Hancock Signature | Independent registered |
| Management (U.S.), LLC | Services, Inc. | public accounting firm |
| 101 Huntington Avenue | 1 John Hancock Way, | PricewaterhouseCoopers LLP |
| Boston, MA 02199 | Suite 1000 | 125 High Street |
| | Boston, MA 02217-1000 | Boston, MA 02110 |
| Principal distributor | | |
| John Hancock Funds, LLC | | |
| 601 Congress Street | | |
| Boston, MA 02210-2805 | | |
The Fund’s investment objective, risks, charges and expenses are included in the prospectus and should be considered carefully before investing. For a prospectus, call your financial professional, call John Hancock Funds at 1-800-225-5291 or visit the Fund’s Web site at www.jhfunds.com. Please read the prospectus carefully before investing or sending money.
| How to contact us | |
|
| |
| Internet | www.jhfunds.com | |
|
| |
| Mail | Regular mail: | Express mail: |
| | John Hancock | John Hancock |
| | Signature Services, Inc. | Signature Services, Inc. |
| | 1 John Hancock Way, Suite 1000 | Mutual Fund Image Operations |
| | Boston, MA 02217-1000 | 380 Stuart Street |
| | | Boston, MA 02116 |
|
| |
| Phone | Customer service representatives | 1-800-225-5291 |
| | EASI-Line | 1-800-338-8080 |
| | TDD line | 1-800-554-6713 |
|
A listing of month-end portfolio holdings is available on our Web site, www.jhfunds.com. A more detailed portfolio holdings summary is available on a quarterly basis 60 days after the fiscal quarter on our Web site or upon request by calling 1-800-225-5291, or on the Securities and Exchange Commission’s Web site, www.sec.gov.
28
J O H N H A N C O C K F A M I L Y O F F U N D S
| EQUITY | INTERNATIONAL |
| Balanced Fund | Greater China Opportunities Fund |
| Classic Value Fund | International Allocation Portfolio |
| Classic Value Fund II | International Classic Value Fund |
| Classic Value Mega Cap Fund | International Core Fund |
| Core Equity Fund | International Fund |
| Focused Equity Fund | International Growth Fund |
| Global Shareholder Yield Fund | |
| Growth Fund | INCOME |
| Growth Opportunities Fund | Bond Fund |
| Growth Trends Fund | Government Income Fund |
| Intrinsic Value Fund | High Yield Fund |
| Large Cap Equity Fund | Investment Grade Bond Fund |
| Large Cap Select Fund | Strategic Income Fund |
| Mid Cap Equity Fund | |
| Mid Cap Growth Fund | TAX-FREE INCOME |
| Multi Cap Growth Fund | California Tax-Free Income Fund |
| Small Cap Equity Fund | High Yield Municipal Bond Fund |
| Small Cap Fund | Massachusetts Tax-Free Income Fund |
| Small Cap Intrinsic Value Fund | New York Tax-Free Income Fund |
| Sovereign Investors Fund | Tax-Free Bond Fund |
| U.S. Core Fund | |
| U.S. Global Leaders Growth Fund | MONEY MARKET |
| Value Opportunities Fund | Money Market Fund |
| | U.S. Government Cash Reserve |
| ASSET ALLOCATION | |
| Allocation Core Portfolio | CLOSED-END |
| Allocation Growth + Value Portfolio | Bank and Thrift Opportunity Fund |
| Lifecycle 2010 Portfolio | Financial Trends Fund, Inc. |
| Lifecycle 2015 Portfolio | Income Securities Trust |
| Lifecycle 2020 Portfolio | Investors Trust |
| Lifecycle 2025 Portfolio | Patriot Global Dividend Fund |
| Lifecycle 2030 Portfolio | Patriot Preferred Dividend Fund |
| Lifecycle 2035 Portfolio | Patriot Premium Dividend Fund I |
| Lifecycle 2040 Portfolio | Patriot Premium Dividend Fund II |
| Lifecycle 2045 Portfolio | Patriot Select Dividend Trust |
| Lifecycle Retirement Portfolio | Preferred Income Fund |
| Lifestyle Aggressive Portfolio | Preferred Income II Fund |
| Lifestyle Balanced Portfolio | Preferred Income III Fund |
| Lifestyle Conservative Portfolio | Tax-Advantaged Dividend Income Fund |
| Lifestyle Growth Portfolio | |
| Lifestyle Moderate Portfolio | |
| |
| SECTOR | |
| Financial Industries Fund | |
| Health Sciences Fund | |
| Real Estate Fund | |
| Regional Bank Fund | |
| Technology Fund | |
| Technology Leaders Fund | |
For more complete information on any John Hancock Fund and an Open-End fund prospectus, which includes charges and expenses, call your financial professional, or John Hancock Funds at 1-800-225-5291 for Open-End fund information and 1-800-852-0218 for Closed-End fund information. Please read the Open-End fund prospectus carefully before investing or sending money.

1-800-225-5291
1-800-554-6713 TDD
1-800-338-8080 EASI-Line
www.jhfunds.com
Now available: electronic delivery
www.jhfunds.com/edelivery
This report is for the information of the shareholders of John Hancock U.S. Government Cash Reserve.
4300A 3/07
5/07


| TABLE OF CONTENTS |
|
| Your fund at a glance |
| page 1 |
|
| |
| Managers’ report |
| page 2 |
|
| |
| Your expenses |
| page 6 |
|
| |
| Fund’s investments |
| page 8 |
|
| |
| Financial statements |
| page 12 |
|
| |
| Notes to financial |
| statements |
| page 18 |
|
| |
| Trustees and officers |
| page 28 |
|
| |
| For more information |
| page 32 |
|
CEO corner
To Our Shareholders,
The U.S. financial markets turned in strong results over the last 12 months, as earlier concerns of rising inflation, a housing slowdown and high energy prices gave way to news of slower, but still resilient, economic growth, stronger than expected corporate earnings and dampened inflation fears and energy costs. This environment also led the Federal Reserve Board to hold short-term interest rates steady. Even with a sharp decline toward the end of the period, the broad stock market returned 11.83% for the year ended March 31, 2007, as measured by the S&P 500 Index. With interest rates remaining relatively steady, fixed-income securities also produced positive results.
But after a remarkably long period of calm, the financial markets were rocked near the end of the period by a dramatic sell-off in China’s stock market, which had ripple effects on financial markets worldwide. In the United States, for example, the Dow Jones Industrial Average had its steepest one-day percentage decline in nearly four years on February 27, 2007. The event served to jog investors out of their seemingly casual attitude toward risk and remind them of the simple fact that stock markets move in two directions — down as well as up.
It was also a good occasion to bring to mind several important investment principles that we believe are at the foundation of successful investing. First, keep a long-term approach to investing, avoiding emotional reactions to daily market moves. Second, maintain a well-diversified portfolio that is appropriate for your goals, risk profile and time horizons.
After the market’s moves of the last year, we encourage investors to sit back, take stock and set some realistic expectations. While history bodes well for the U.S. market in 2007 (since 1939, the S&P 500 Index has always produced positive results in the third year of a presidential term), there are no guarantees, and opinions are divided on the future of this more-than-four-year-old bull market. The recent downturn, which lasted for a month before positive news stopped the fall, bolsters this uncertainty, although we believe it was a healthy correction for which we were overdue.
The recent volatility could also be a wake-up call to contact your financial professional to determine whether changes are in order to your investment mix. Some asset groups have had long runs of outperformance. Others had truly outsized returns in 2006. These trends argue for a look to determine if these categories now represent a larger stake in your portfolios than prudent diversification would suggest they should. After all, we believe investors with a well-balanced portfolio and a marathon — not a sprint — approach to investing, stand a better chance of weathering the market’s short-term twists and turns, and reaching their long-term goals.
Sincerely,

Keith F. Hartstein,
President and Chief Executive Officer
This commentary reflects the CEO’s views as of March 31, 2007. They are subject to change at any time.
Your fund at a glance
The Fund seeks the maximum current income that is consistent with maintaining liquidity and preserving capital by investing in U.S. dollar-denominated securities rated within the two highest short-term credit categories and their unrated equivalents. The Fund intends to maintain a stable $1 share price.
Over the last twelve months
► The Federal Reserve Board made two last increases in short-term interest rates, ending a two-year cycle of rate hikes.
► Money market yields held steady.
► The Fund adjusted to the new environment by extending its average maturity by increasing its weighting in fixed-rate, longer-term securities.
1
Managers’ report
John Hancock
Money Market Fund
Money market yields held steady in the 12-month period ended March 31, 2007, as the Federal Reserve Board concluded its short-term interest rate tightening cycle. Over the period, the federal funds rate that banks charge each other for overnight loans increased from 4.75% to 5.25% . The last rate increase occurred June 29, 2006, and marked the 17th consecutive 25 basis point (0.25%) hike since June 2004.
At the August 2006 Federal Open Market Committee (FOMC) meeting the Fed cited slowing growth concerns, a “cooling” housing market and the delayed effect of previous interest rate hikes yet to filter through the economy as the main reasons for deciding to hold interest rates steady at 5.25% . As the period progressed, the housing market continued to slow and concerns mounted that this slowdown could move the economy towards recession. The National Association of Home Builders Market Index hit a recent historical low of 30 in September 2006, off from its recent high of 72 on June 30, 2005. A reading above 50 signifies more home builders are seeing favorable economic conditions than poor economic conditions.
As 2007 began, the market was hit with concerns about the subprime mortgage market. Subprime mortgages comprise roughly 20% of the mortgage market and are loans made to borrowers with shaky credit. As loans that had originated with low short-term “teaser” rates began resetting and housing prices failed to rise, borrowers with shaky credit were unable to refinance out of the current loans. This caused delinquencies and foreclosures to increase, further fueling the housing slowdown.
2
By Portfolio Managers, MFC Global Investment Management (U.S.), LLC
David A. Bees and Michael V. Lorizio
Despite all the turmoil in the housing market, the economy remained strong on other fronts. Initial jobless claims declined in recent weeks, ending the period at 321,000 jobless claims, just slightly higher than the 12-month period average of 317,800. The unemployment rate has continued to baffle the market, decreasing from 4.7% in April 2006 to 4.4% at the end of March 2007. Throughout the period this mixed economic data led to uncertainty about the future of the economy and, as a result, the Fed has held rates steady at 5.25% .
“Money market yields held
steady in the 12-month period
ended March 31, 2007, as the
Federal Reserve Board concluded
its short-term interest rate
tightening cycle.”
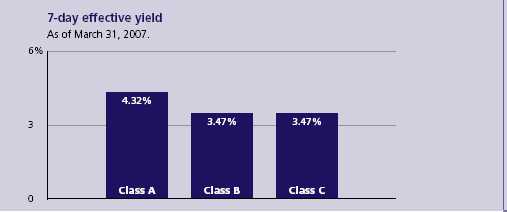
Fund yield and performance
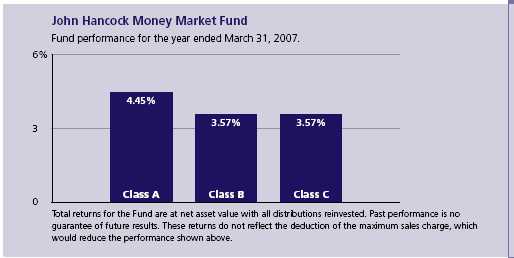
On March 31, 2007, John Hancock Money Market Fund’s Class A, Class B and Class C shares had 7-day effective yields of 4.32%, 3.47% and 3.47%, respectively. By comparison, the average taxable money market fund had a 7-day effective yield of 4.58%, according to Lipper, Inc.
For the year ended March 31, 2007, the Fund’s Class A, Class B and Class C shares posted total returns of 4.45%, 3.57% and 3.57%, respectively, at net asset value, compared with the 4.43% return of the average taxable money market fund, according to Lipper, Inc. 1 Keep in mind that your net asset value return will be different from the Fund’s performance if you were not invested in the Fund for the entire period or did not reinvest all distributions.
Money Market Fund
3
“The portfolio structure
changed significantly in the
past 12 months.”
Fund moves
The portfolio structure changed significantly in the past 12 months. At the start of the period, the Fund was set up for a continued rising-rate environment. We kept our weighted average days to maturity in line with our peers, giving us an opportunity to quickly reinvest assets at higher rates. The largest exposure was to floating-rate securities, which allowed the portfolio to capture rising rates in a timely manner due to the one-month and three-month rate-reset feature on these securities.
As we approached the middle of 2006, further rate increases became less likely. We found value in floating-rate securities that had reached their final rate reset and we ceased purchasing any floating-rate securities with resets remaining. As it became apparent in mid summer that the rate hikes had come to an end, we began to extend our days to maturity. To do so, we added to our fixed-rate weighting by purchasing a greater amount of longer-term fixed-rate securities.
By the end of the period, the overnight lending rate held steady at 5.25% for the seventh consecutive FOMC meeting. Fed funds futures pointed to a rate cut in mid to late 2007 being more likely than a rate hike. As a result, we are extended farther out on the money market curve, ending the period with a longer weighted average maturity than our peers. This enables us to lock in favorable rates ahead of any rate cuts that may occur. Throughout the term we continued to use short tier-two securities and asset-backed commercial paper to manage cash levels and contribute to performance.
| SECTOR DISTRIBUTION2 |
| Financial | 83% |
| Consumer staple | 7% |
| Telecommunication | |
| service | 5% |
| Materials | 4% |
| Government agencies | 3% |
| Health care | 1% |
Outlook
In its March 21, 2007 FOMC policy statement, the Federal Reserve stated that it is confident in the economy’s ability to continue to expand. However, it does have some serious concerns remaining. Most notably, the Fed views recent inflation measures as slightly elevated and is closely watching the ongoing adjustment that the housing sector is facing. It will rely on future incoming data to decide on its outlook for both growth and inflation; any policy adjustments will be dictated by this outlook.
Money Market Fund
4
We continue to monitor economic indicators and market factors that may impact interest rate policy. However, we do believe that interest rates will remain stable, but with some bias towards a rate cut occurring later in 2007. This belief has led us to our current position on the money market curve with a days-to-maturity level greater than that of our peer group. With stable short-term interest rates, outperformance will be derived by investing in longer-dated securities. In addition to our focus on capturing additional yield, we will strive, as always, to maintain liquidity and preserve stability of principal.
This commentary reflects the views of the portfolio management team through the end of the Fund’s period discussed in this report. The team’s statements reflect its own opinions. As such, they are in no way guarantees of future events and are not intended to be used as investment advice or a recommendation regarding any specific security. They are also subject to change at any time as market and other conditions warrant.
The Fund is neither insured nor guaranteed by the U.S. government. Although the Fund seeks to maintain a net asset value of $1.00 per share, it is possible to lose money by investing in the Fund.
1 Figures from Lipper, Inc. include reinvested dividends and do not take into account sales charges. Actual load-adjusted performance is lower.
2 As a percentage of net assets on March 31, 2007.

Money Market Fund
5
Your expenses
These examples are intended to help you understand your ongoing operating expenses.
Understanding fund expenses
As a shareholder of the Fund, you incur two types of costs:
■ Transaction costs which include sales charges (loads) on purchases or redemptions (varies by share class), minimum account fee charge, etc.
■ Ongoing operating expenses including management fees, distribution and service fees (if applicable) and other fund expenses.
We are going to present only your ongoing operating expenses here.
Actual expenses/actual returns
This example is intended to provide information about your Fund’s actual ongoing operating expenses, and is based on your Fund’s actual return. It assumes an account value of $1,000.00 on October 1, 2006, with the same investment held until March 31, 2007.
| | Account value | Ending value | Expenses paid during period |
| | on 10-1-06 | on 3-31-07 | ended 3-31-071 |
|
| Class A | $1,000.00 | $1,022.20 | $4.75 |
|
| Class B | 1,000.00 | 1,017.90 | 8.98 |
|
| Class C | 1,000.00 | 1,017.80 | 8.98 |
|
Together with the value of your account, you may use this information to estimate the operating expenses that you paid over the period. Simply divide your account value at March 31, 2007, by $1,000.00, then multiply it by the “expenses paid” for your share class from the table above. For example, for an account value of $8,600.00, the operating expenses should be calculated as follows:
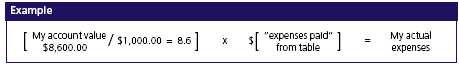
Money Market Fund
6
Hypothetical example for comparison purposes
This table allows you to compare your Fund’s ongoing operating expenses with those of any other fund. It provides an example of the Fund’s hypothetical account values and hypothetical expenses based on each class’ actual expense ratio and an assumed 5% annualized return before expenses (which is not your fund’s actual return). It assumes an account value of $1,000.00 on October 1, 2006, with the same investment held until March 31, 2007. Look in any other fund shareholder report to find its hypothetical example and you will be able to compare these expenses.
| | Account value | Ending value | Expenses paid during period |
| | on 10-1-06 | on 3-31-07 | ended 3-31-071 |
|
| Class A | $1,000.00 | $1,020.20 | $4.75 |
|
| Class B | 1,000.00 | 1,016.00 | 8.97 |
|
| Class C | 1,000.00 | 1,016.00 | 8.97 |
|
Remember, these examples do not include any transaction costs, such as sales charges; therefore, these examples will not help you to determine the relative total costs of owning different funds. If transaction costs were included, your expenses would have been higher. See the prospectus for details regarding transaction costs.
1 Expenses are equal to the Fund’s annualized expense ratio of 0.94%, 1.79% and 1.79% for Class A, Class B and Class C, respectively, multiplied by the average account value over the period, multiplied by number of days in most recent fiscal half-year/365 or 366 (to reflect the one-half year period).
Money Market Fund
7
F I N A N C I A L S T A T E M E N T S
Fund’s investments
Securities owned by the Fund on 3-31-07
This schedule is divided into four categories: commercial paper, corporate interest-bearing obligations, U.S. government obligations and joint repurchase agreement. Commercial paper, corporate interest-bearing obligations and U.S. government obligations are further broken down by industry group.
| | Interest | | Maturity | Credit | Par value | |
| Issuer | rate | | date | rating (A) | (000) | Value |
|
| Commercial paper 39.76% | | | | | | $91,742,589 |
| (Cost $91,742,589) | | | | | | |
| Asset Backed — Auto Loan 5.20% | | | | | | 11,994,730 |
|
| Galleon Capital Corp. LLC (K) | 5.270% | | 04-04-07 | Tier 1 | $12,000 | 11,994,730 |
| Asset Backed — Finance 4.32% | | | | | | 9,966,267 |
|
| Falcon Asset Securitization (K) | 5.280 | | 04-24-07 | Tier 1 | 10,000 | 9,966,267 |
| Asset Backed — Others 4.97% | | | | | | 11,479,875 |
|
| Old Line Funding, LLC (K) | 5.250 | | 04-13-07 | Tier 1 | 11,500 | 11,479,875 |
| Asset Backed — Receivables 5.24% | | | | | | 12,092,928 |
|
| Thunder Bay Funding, Inc. LLC (K) | 5.260 | | 04-05-07 | Tier 1 | 12,100 | 12,092,928 |
| Banks — Foreign 4.98% | | | | | | 11,498,269 |
|
| Dresdner Bank AG | 5.420 | | 04-02-07 | Tier 1 | 11,500 | 11,498,269 |
| Diversified Financial Services 1.00% | | | | | | 2,299,663 |
|
| Textron Financial Corp. | 5.280 | | 04-02-07 | Tier 2 | 2,300 | 2,299,663 |
| Finance — Auto Loans 1.00% | | | | | | 2,299,649 |
|
| Volkswagen AG (K) | 5.490 | | 04-02-07 | Tier 2 | 2,300 | 2,299,649 |
| Finance — Mortgages 4.93% | | | | | | 11,383,280 |
|
| Countrywide Financial Corp. | 5.280 | | 04-11-07 | Tier 1 | 11,400 | 11,383,280 |
| Food 6.17% | | | | | | 14,235,744 |
|
| Cargill, Inc. (K) | 5.260 | | 04-09-07 | Tier 1 | 11,900 | 11,886,090 |
|
| Kraft Foods, Inc. | 5.300 | | 04-02-07 | Tier 2 | 2,350 | 2,349,654 |
| Medical — Health Maintenance Organization 1.04% | | | 2,397,168 |
|
| WellPoint, Inc. (K) | 5.310 | | 04-09-07 | Tier 2 | 2,400 | 2,397,168 |
| Retail Stores 0.91% | | | | | | 2,095,016 |
|
| CVS Corp. (K) | 5.340 | | 04-17-07 | Tier 2 | 2,100 | 2,095,016 |
See notes to financial statements
Money Market Fund
8
F I N A N C I A L S T A T E M E N T S
| | Interest | | Maturity | Credit | Par value | |
| Issuer, description | rate | | date | rating (A) | (000) | Value |
|
| Corporate interest-bearing obligations 59.93% | | | | | $138,286,119 |
| (Cost $138,286,119) | | | | | | |
Banks — Foreign 17.12% | | | | | | 39,500,008 |
|
| ABN AMRO Bank NV Chicago | 7.125% | | 06-18-07 | Tier 1 | $6,800 | 6,824,821 |
|
| ABN AMRO Bank NV (P) | 5.420 | | 05-11-07 | Tier 1 | 1,750 | 1,750,206 |
|
| Credit Suisse USA, Inc. (P) | 5.460 | | 04-05-07 | Tier 1 | 10,765 | 10,765,170 |
|
| Deutsche Bank AG | 5.345 | | 08-06-07 | Tier 1 | 8,915 | 8,915,853 |
|
| HBOS Plc. (S) | 3.600 | | 08-15-07 | Tier 1 | 2,545 | 2,528,541 |
|
| HSBC Bank USA NA | 3.870 | | 06-07-07 | Tier 1 | 8,740 | 8,715,417 |
| Banks — U.S. 6.16% | | | | | | 14,218,536 |
|
| Bank of America Corp. | 6.625 | | 08-01-07 | Tier 1 | 4,465 | 4,483,486 |
|
| Wachovia Bank NA | 4.850 | | 07-30-07 | Tier 1 | 9,750 | 9,735,050 |
| Chemicals 4.00% | | | | | | 9,238,552 |
|
| E.I. du Pont de Nemours & Co. | 3.375 | | 11-15-07 | Tier 1 | 9,350 | 9,238,552 |
| Diversified Financial Services 5.74% | | | | | | 13,230,504 |
|
| Citicorp Mortgage Loan Trust | 7.200 | | 06-15-07 | Tier 1 | 2,300 | 2,308,559 |
|
| Citigroup, Inc. (P) | 5.407 | | 06-04-07 | Tier 1 | 2,700 | 2,700,527 |
|
| General Electric Capital Corp. | 3.500 | | 08-15-07 | Tier 1 | 1,175 | 1,166,674 |
|
| Principal Life Global Funding (S) | 5.125 | | 06-28-07 | Tier 1 | 7,060 | 7,054,744 |
| Finance — Auto Loans 1.53% | | | | | | 3,535,527 |
|
| American Honda Finance Corp. (P) (S) | 5.460 | | 05-11-07 | Tier 1 | 3,535 | 3,535,527 |
| Finance — Commercial 4.75% | | | | | | 10,950,577 |
|
| CIT Group, Inc. | 7.375 | | 04-02-07 | Tier 1 | 10,950 | 10,950,577 |
| Finance — Consumer Loans 3.24% | | | | | | 7,486,436 |
|
| American General Finance Corp. | 4.500 | | 11-15-07 | Tier 1 | 4,500 | 4,476,129 |
|
| HSBC Finance Corp. (P) | 5.400 | | 05-10-07 | Tier 1 | 3,010 | 3,010,307 |
| Insurance 1.34% | | | | | | 3,089,723 |
|
| AIG Sunamerica Corp. (S) | 5.300 | | 05-30-07 | Tier 1 | 3,090 | 3,089,723 |
| Investment Banking & Brokerage 11.10% | | | | | 25,620,018 |
|
| Goldman Sachs Group, Inc. (P) | 5.485 | | 07-02-07 | Tier 1 | 1,000 | 1,000,461 |
|
| JPMorgan Chase & Co. | 5.250 | | 05-30-07 | Tier 1 | 11,453 | 11,451,477 |
|
| Lehman Brothers Holdings, Inc. | 8.250 | | 06-15-07 | Tier 1 | 5,425 | 5,455,594 |
|
| Lehman Brothers Holdings, Inc. | 8.500 | | 05-01-07 | Tier 1 | 1,900 | 1,904,802 |
|
| Lehman Brothers Holdings, Inc. (P) | 5.480 | | 04-20-07 | Tier 1 | 4,100 | 4,100,332 |
|
| Merrill Lynch & Co., Inc. | 8.000 | | 06-01-07 | Tier 1 | 1,700 | 1,707,352 |
| Telephone — Integrated 4.95% | | | | | | 11,416,238 |
|
| Verizon Communications, Inc. | 6.125 | | 06-15-07 | Tier 1 | 11,400 | 11,416,238 |
See notes to financial statements
Money Market Fund
9
F I N A N C I A L S T A T E M E N T S
| | Interest | | Maturity | Credit | Par value | |
| Issuer, description | rate | | date | rating (A) | (000) | Value |
|
| U.S. government obligations 2.92% | | | | | $6,750,000 |
| (Cost $6,750,000) | | | | | | |
| Government U.S. Agency 2.92% | | | | | 6,750,000 |
|
| Federal Home Loan Bank | 5.400% | | 04-09-08 | Tier 1 | $3,250 | 3,250,000 |
|
| Federal Home Loan Bank | 5.250 | | 10-22-07 | Tier 1 | 3,500 | 3,500,000 |
| |
| | | | Interest | Par value | |
| Issuer, description, maturity date | | | rate | (000) | Value |
|
| Joint repurchase agreement 0.93% | | | | | $2,153,000 |
| (Cost $2,153,000) | | | | | | |
| Joint Repurchase Agreement 0.93% | | | | | 2,153,000 |
|
| Investment in a joint repurchase agreement transaction with | | | |
| Morgan Stanley — Dated 3-30-07, due 4-02-07 (Secured by | | | |
| U.S. Treasury Inflation Indexed Note1.625% due 1-15-15). | | | |
| Maturity value: $2,153,924 | | | | 5.150% | $2,153 | 2,153,000 |
|
| Total investments (Cost $238,931,708) 103.54% | | | | | $238,931,708 |
|
| |
| Other assets and liabilities, net (3.54%) | | | | | ($8,171,632) |
|
| |
| Total net assets 100.00% | | | | | | $230,760,076 |
See notes to financial statements
Money Market Fund
10
F I N A N C I A L S T A T E M E N T S
Notes to Schedule of Investments
(A) Quality ratings are unaudited and indicate the categories of eligible securities, as defined by Rule 2a-7 of the Investment Company Act of 1940, owned by the Fund.
(K) Direct placement securities are restricted to resale. They have been fair valued in accordance with procedures approved by the Trustees after consideration of restrictions as to resale, financial condition and prospects of the issuer, general market conditions and pertinent information in accordance with the Fund’s bylaws and the Investment Company Act of 1940, as amended. The Fund has limited rights to registration under the Securities Act of 1933 with respect to these restricted securities. Additional information on these securities is as follows:
| | | | Value as a | |
| | | | percentage | |
| | Acquisition | Acquisition | of Fund's | Value as of |
| Issuer, description | date | cost | net assets | March 31, 2007 |
|
| Cargill, Inc. — | | | | |
| Commercial paper | 03-16-07 | $11,858,271 | 5.15% | $11,886,090 |
| CVS Corp. — | | | | |
| Commercial paper | 03-28-07 | 2,093,770 | 0.91 | 2,095,016 |
| Falcon Asset Securitization — | | | | |
| Commercial paper | 03-26-07 | 9,957,467 | 4.32 | 9,966,267 |
| Galleon Capital Corp. LLC — | | | | |
| Commercial paper | 03-19-07 | 11,971,893 | 5.20 | 11,994,730 |
| Old Line Funding, LLC — | | | | |
| Commercial paper | 03-06-07 | 11,436,271 | 4.97 | 11,479,875 |
| Thunder Bay Funding, Inc. LLC — | | | | |
| Commercial paper | 03-07-07 | 12,048,730 | 5.24 | 12,092,928 |
| Volkswagen AG — | | | | |
| Commercial paper | 03-30-07 | 2,298,948 | 1.00 | 2,299,649 |
| WellPoint, Inc. — | | | | |
| Commercial paper | 03-09-07 | 2,389,026 | 1.04 | 2,397,168 |
(P) Represents rate in effect on March 31, 2007.
(S) These securities are exempt from registration under Rule 144A of the Securities Act of 1933. Such securities may be resold, normally to qualified institutional buyers, in transactions exempt from registration. Rule 144A securities amounted to $16,208,535 or 7.02% of the Fund’s net assets as of March 31, 2007.
The percentage shown for each investment category is the total value of that category as a percentage of the net assets of the Fund.
See notes to financial statements
Money Market Fund
11
F I N A N C I A L S T A T E M E N T S
Financial statements
Statement of assets and liabilities 3-31-07
This Statement of Assets and Liabilities is the Fund’s balance sheet. It shows the value of what the Fund owns, is due and owes. You’ll also find the net asset value per share.
| Assets | |
|
| Investments at value (cost $238,931,708) | $238,931,708 |
| Cash | 985 |
| Receivable for shares sold | 471,035 |
| Interest receivable | 2,175,902 |
| Other assets | 74,969 |
| Total assets | 241,654,599 |
| |
| Liabilities | |
|
| Payable for investments purchased | 10,055,977 |
| Payable for shares repurchased | 481,533 |
| Dividends payable | 58,040 |
| Payable to affiliates | |
| Management fees | 86,067 |
| Distribution and service fees | 8,855 |
| Other | 51,330 |
| Other payables and accrued expenses | 152,721 |
| Total liabilities | 10,894,523 |
| |
| Net assets | |
|
| Capital paid-in | 230,749,826 |
| Accumulated net realized loss on investments | (1,238) |
| Accumulated net investment income | 11,488 |
| Net assets | $230,760,076 |
| |
| Net asset value per share | |
|
| Based on net asset values and shares outstanding — the Fund has an | |
| unlimited number of shares authorized with no par value | |
| Class A ($194,739,799 ÷ 194,821,993 shares) | $1.00 |
| Class B ($28,023,174 ÷ 28,043,479 shares) | $1.00 |
| Class C ($7,997,103 ÷ 7,997,364 shares) | $1.00 |
See notes to financial statements
Money Market Fund
12
F I N A N C I A L S T A T E M E N T S
Statement of operations For the year ended 3-31-07
This Statement of Operations summarizes the Fund’s investment income earned and expenses incurred in operating the Fund. It also shows net gains (losses) for the period stated.
| Investment income | |
|
| Interest | $12,292,478 |
| Total investment income | 12,292,478 |
| |
Expenses | |
|
| Investment management fees (Note 2) | 1,169,234 |
| Distribution and service fees (Note 2) | 879,752 |
| Transfer agent fees (Note 2) | 554,848 |
| Accounting and legal services fees (Note 2) | 32,537 |
| Compliance fees | 5,540 |
| Blue sky fees | 64,008 |
| Custodian fees | 45,284 |
| Printing fees | 38,049 |
| Professional fees | 29,622 |
| Trustees’ fees | 9,613 |
| Interest | 772 |
| Miscellaneous | 5,767 |
| Total expenses | 2,835,026 |
| Less expense reductions (Note 2) | (434,748) |
| Net expenses | 2,400,278 |
| Net investment income | 9,892,200 |
| Net realized loss on investments | (45) |
| Increase in net assets from operations | $9,892,155 |
See notes to financial statements
Money Market Fund
13
F I N A N C I A L S T A T E M E N T S
Statement of changes in net assets
These Statements of Changes in Net Assets show how the value of the Fund’s net assets has changed during the last two periods. The difference reflects earnings less expenses, any investment gains and losses, distributions, if any, paid to shareholders and the net of Fund share transactions.
| | Year | Year |
| | ended | ended |
| | 3-31-06 | 3-31-07 |
|
| Increase (decrease) in net assets | | |
| From operations | | |
| Net investment income | $6,650,432 | $9,892,200 |
| Net realized loss | (2) | (45) |
Increase in net assets resulting from operations | 6,650,430 | 9,892,155 |
| Distributions to shareholders | | |
| From net investment income | | |
| Class A | (5,575,570) | (8,506,162) |
| Class B | (928,523) | (1,110,601) |
| Class C | (146,339) | (275,437) |
| | (6,650,432) | (9,892,200) |
| From Fund share transactions | (74,863,392) | 6,053,750 |
|
| Net assets | | |
| Beginning of period | 299,569,765 | 224,706,371 |
| End of period1 | $224,706,371 | $230,760,076 |
| |
1 Includes accumulated net investment income of $11,488 and $11,488, respectively. | |
See notes to financial statements
Money Market Fund
14
F I N A N C I A L S T A T E M E N T S
Financial highlights
The Financial Highlights show how the Fund’s net asset value for a share has changed since the end of the previous period.
| CLASS A SHARES | | | | | |
| |
| Period ended | 3-31-031 | 3-31-041 | 3-31-051 | 3-31-06 | 3-31-072 |
|
| Per share operating performance | | | | | |
|
| Net asset value, beginning of period | $1.00 | $1.00 | $1.00 | $1.00 | $1.00 |
| Net investment income2 | 0.01 | —3 | 0.01 | 0.03 | 0.04 |
| Less distributions | | | | | |
| From net investment income | (0.01) | —3 | (0.01) | (0.03) | (0.04) |
| Net asset value, end of period | $1.00 | $1.00 | $1.00 | $1.00 | $1.00 |
| Total return4,5 (%) | 0.75 | 0.21 | 0.86 | 2.92 | 4.45 |
|
Ratios and supplemental data | | | | | |
|
| Net assets, end of period | | | | | |
| (in millions) | $271 | $211 | $224 | $185 | $195 |
| Ratio of net expenses to average | | | | | |
| net assets (%) | 0.94 | 0.94 | 0.88 | 0.91 | 0.88 |
| Ratio of gross expenses to average | | | | | |
| net assets6 (%) | 1.14 | 1.14 | 1.09 | 1.11 | 1.09 |
| Ratio of net investment income | | | | | |
| to average net assets (%) | 0.75 | 0.21 | 0.83 | 2.85 | 4.37 |
See notes to financial statements
Money Market Fund
15
F I N A N C I A L S T A T E M E N T S
Financial highlights
| CLASS B SHARES | | | | | |
| |
| Period ended | 3-31-031 | 3-31-041 | 3-31-051 | 3-31-06 | 3-31-07 |
|
| Per share operating performance | | | | | |
|
| Net asset value, beginning of period | $1.00 | $1.00 | $1.00 | $1.00 | $1.00 |
| Net investment income2 | —3 | —3 | —3 | 0.02 | 0.04 |
| Less distributions | | | | | |
| From net investment income | —3 | —3 | —3 | (0.02) | (0.04) |
| Net asset value, end of period | $1.00 | $1.00 | $1.00 | $1.00 | $1.00 |
| Total return4,5 (%) | 0.10 | 0.12 | 0.50 | 2.05 | 3.57 |
| | | | | |
| Ratios and supplemental data | | | | | |
|
| Net assets, end of period | | | | | |
| (in millions) | $166 | $89 | $63 | $36 | $28 |
| Ratio of net expenses to average | | | | | |
| net assets (%) | 1.59 | 1.04 | 1.20 | 1.76 | 1.73 |
| Ratio of gross expenses to average | | | | | |
| net assets6 (%) | 1.89 | 1.89 | 1.85 | 1.86 | 1.83 |
| Ratio of net investment income | | | | | |
| to average net assets (%) | 0.10 | 0.12 | 0.46 | 1.94 | 3.52 |
See notes to financial statements
Money Market Fund
16
F I N A N C I A L S T A T E M E N T S
Financial highlights
| CLASS C SHARES | | | | | |
| |
| Period ended | 3-31-031 | 3-31-041 | 3-31-051 | 3-31-06 | 3-31-07 |
|
| Per share operating performance | | | | | |
|
| Net asset value, beginning of period | $1.00 | $1.00 | $1.00 | $1.00 | $1.00 |
| Net investment income2 | —3 | —3 | —3 | 0.02 | 0.04 |
| Less distributions | | | | | |
| From net investment income | —3 | —3 | —3 | (0.02) | (0.04) |
| Net asset value, end of period | $1.00 | $1.00 | $1.00 | $1.00 | $1.00 |
| Total return4,5 (%) | 0.11 | 0.12 | 0.50 | 2.04 | 3.57 |
|
Ratios and supplemental data | | | | | |
|
| Net assets, end of period | | | | | |
| (in millions) | $18 | $12 | $13 | $4 | $8 |
| Ratio of net expenses to average | | | | | |
| net assets (%) | 1.61 | 1.04 | 1.19 | 1.75 | 1.73 |
| Ratio of gross expenses to average | | | | | |
| net assets6 (%) | 1.88 | 1.89 | 1.84 | 1.85 | 1.83 |
| Ratio of net investment income | | | | | |
| to average net assets (%) | 0.10 | 0.12 | 0.46 | 1.86 | 3.54 |
1 Audited by previous auditor.
2 Based on the average of the shares outstanding.
3 Less than $0.01 per share.
4 Assumes dividend reinvestment and does not reflect the effect of sales charges.
5 Total returns would have been lower had certain expenses not been reduced during the periods shown.
6 Does not take into consideration expense reductions during the periods shown.
See notes to financial statements
Money Market Fund
17
Notes to financial statements
Note 1
Accounting policies
John Hancock Money Market Fund (the “Fund”) is a diversified series of John Hancock Current Interest (the “Trust”), an open-end management investment company registered under the Investment Company Act of 1940 (the “1940 Act”), as amended. The investment objective of the Fund is to seek the maximum current income that is consistent with maintaining liquidity and preserving capital.
The Trustees have authorized the issuance of multiple classes of shares of the Fund, designated as Class A, Class B and Class C shares. The shares of each class represent an interest in the same portfolio of investments of the Fund and have equal rights as to voting, redemptions, dividends and liquidation, except that certain expenses, subject to the approval of the Trustees, may be applied differently to each class of shares in accordance with current regulations of the Securities and Exchange Commission (“SEC”) and the Internal Revenue Service. Shareholders of a class that bears distribution and service expenses under the terms of a distribution plan have exclusive voting rights to that distribution plan. Class B shares will convert to Class A shares eight years after purchase.
Significant accounting policies of the Fund are as follows:
Valuation of investments
Securities in the Fund’s portfolio are valued at amortized cost, in accordance with Rule 2a-7 of the 1940 Act, as amended, which approximates market value. The amortized cost method involves valuing a security at its cost on the date of purchase and thereafter assuming a constant amortization to maturity of the difference between the principal amount due at maturity and the cost of the security to the Fund. Interest income on certain portfolio securities such as negotiable bank certificates of deposit and interest-bearing notes is accrued daily and included in interest receivable.
Joint repurchase agreement
Pursuant to an exemptive order issued by the SEC, the Fund, along with other registered investment companies having a management contract with John Hancock Advisers, LLC (the “Adviser”), a wholly owned subsidiary of John Hancock Financial Services, Inc., a subsidiary of Manulife Financial Corporation (“MFC”), may participate in a joint repurchase agreement transaction. Aggregate cash balances are invested in one or more large repurchase agreements, whose underlying securities are obligations of the U.S. government and/or its agencies. The Fund’s custodian bank receives delivery of the underlying securities for the joint account on the Fund’s behalf. The Adviser is responsible for ensuring that the agreement is fully collateralized at all times.
Investment transactions
Investment transactions are recorded as of the date of purchase, sale or maturity. Net realized gains and losses on sales of investments are determined on the identified cost basis.
Class allocations
Income, common expenses, and realized and unrealized gains (losses) are determined at the fund level and allocated daily to each class of shares based on the appropriate net asset value of the respective classes. Distribution and service fees, if any, are calculated daily at the class level based on the appropriate net asset value of each class and the specific expense rate(s) applicable to each class.
Expenses
The majority of expenses are directly identifiable to an individual fund. Expenses that are not readily identifiable to a specific fund are allocated in such a manner as deemed equitable, taking into consideration, among
Money Market Fund
18
other things, the nature and type of expense and the relative size of the funds.
Federal income taxes
The Fund qualifies as a “regulated investment company” by complying with the applicable provisions of the Internal Revenue Code and will not be subject to federal income tax on taxable income that is distributed to shareholders. Therefore, no federal income tax provision is required. For federal income tax purposes, the Fund has $1,238 of a capital loss carryforward available, to the extent provided by regulations, to offset future net realized capital gains. To the extent that such carryforward is used by the Fund, no capital gain distributions will be made. The loss car-ryforward expires as follows: March 31, 2012 — $1,191 and March 31, 2015 —$47.
New accounting pronouncements
In June 2006, Financial Accounting Standards Board (“FASB”) Interpretation No. 48, Accounting for Uncertainty in Income Taxes (the “Interpretation”), was issued and is effective for fiscal years beginning after December 15, 2006, and is to be applied to all open tax years as of the effective date. This Interpretation prescribes a minimum threshold for financial statement recognition of the benefit of a tax position taken or expected to be taken in a tax return and requires certain expanded disclosures. Management is currently evaluating the application of the Interpretation to the Fund and has not at this time quantified the impact, if any, resulting from the adoption of this Interpretation on the Fund’s financial statements. The Fund will implement this pronouncement no later than September 30, 2007.
In September 2006, FASB Standard No. 157, Fair Value Measurements (“FAS 157”), was issued and is effective for fiscal years beginning after November 15, 2007. FAS 157 defines fair value, establishing a framework for measuring fair value and expands disclosure about fair value measurements. Management is currently evaluating the application of FAS 157 to the Fund and its impact, if any, resulting from the adoption of FAS 157 on the Fund’s financial statements.
Distributions
The Fund’s net investment income is declared daily as dividends to shareholders of record as of the close of business on the preceding day, and distributed monthly.
During the year ended March 31, 2006, the tax character of distributions paid was as follows: ordinary income $6,650,432. During the year ended March 31, 2007, the tax character of distributions paid was as follows: ordinary income $9,892,200. Distributions paid by the Fund with respect to each class of shares are calculated in the same manner, at the same time and are in the same amount, except for the effect of expenses that may be applied differently to each class.
As of March 31, 2007, the components of distributable earnings on a tax basis included $125,592 of undistributed ordinary income.
Such distributions and distributable earnings, on a tax basis, are determined in conformity with income tax regulations, which may differ from accounting principles generally accepted in the United States of America. Distributions in excess of tax basis earnings and profits, if any, are reported in the Fund’s financial statements as a return of capital.
Use of estimates
The preparation of these financial statements, in accordance with accounting principles generally accepted in the United States of America, incorporates estimates made by management in determining the reported amount of assets, liabilities, revenues and expenses of the Fund. Actual results could differ from these estimates.
Note 2
Management fee and transactions with
affiliates and others
The Fund has an investment management contract with the Adviser. Under the investment management contract, the Fund pays a monthly management fee to the Adviser equivalent, on an annual basis, to the sum of: (a) 0.50% of the first $500,000,000 of the Fund’s average daily net asset value, (b) 0.425% of the next $250,000,000, (c) 0.375% of the next $250,000,000, (d) 0.35% of the next $500,000,000, (e) 0.325% of the
Money Market Fund
19
next $500,000,000, (f) 0.30% of the next $500,000,000 and (g) 0.275% of the Fund’s average daily net asset value in excess of $2,500,000,000.
The Adviser has agreed to limit the Fund’s management fee to 0.40% of the Fund’s first $750,000,000 average daily net asset value, at least until July 31, 2007. The management fee cannot be restated to the original contracted amounts without the Trustees’ consent. Accordingly, the expense reductions related to management fee limitations amounted to $233,847 for the year ended March 31, 2007.
Effective December 31, 2005, the investment management teams of the Adviser were reorganized into Sovereign Asset Management LLC (“Sovereign”), a wholly owned indirect subsidiary of John Hancock Life Insurance Company (“JHLICO”), a subsidiary of MFC. The Adviser remains the principal advisor on the Fund and Sovereign acts as subadvisor under the supervision of the Adviser. The restructuring did not have an impact on the Fund, which continues to be managed using the same investment philosophy and process. The Fund will not be responsible for payment of the subadvisory fees.
Effective October 1, 2006, Sovereign changed its name to MFC Global Investment Management (U.S.), LLC.
The Fund has a Distribution Agreement with John Hancock Funds, LLC (“JH Funds”), a wholly owned subsidiary of the Adviser. The Fund has adopted Distribution Plans with respect to Class A, Class B and Class C, pursuant to Rule 12b-1 under the 1940 Act, as amended, to reimburse JH Funds for the services it provides as distributor of shares of the Fund. Accordingly, the Fund makes monthly payments to JH Funds at an annual rate not to exceed 0.25% of Class A average daily net asset value and 1.00% of Class B and Class C average daily net asset value. JH Funds has agreed to contractually limit the distribution and service fees (“12b-1”) for Class A to 0.15% of the Class A average daily net asset value, at least until July 31, 2007. Accordingly, the expense reductions related to the reduction in the 12b-1 fees amounted to $194,495 for Class A, for the year ended March 31, 2007.
A maximum of 0.25% of such payments may be service fees, as defined by the Conduct Rules of the National Association of Securities Dealers. Under the Conduct Rules, curtailment of a portion of the Fund’s 12b-1 payments could occur under certain circumstances.
Expenses under the agreement described above for the period ended March 31, 2007, were as follows:
| | Distribution and |
| Share class | service fees |
|
| |
| Class A | $486,238 |
| Class B | 315,801 |
| Class C | 77,713 |
| Total | $879,752 |
Class A shares are assessed up-front sales charges. During the year ended March 31, 2007, JH Funds received net up-front sales charges of $1,755 with regard to sales of Class A shares. Of this amount, $228 was retained and used for printing prospectuses, advertising, sales literature and other purposes, $5 was paid as sales commissions to unrelated broker-dealers and $1,522 was paid as sales commissions to sales personnel of Signator Investors, Inc. (“Signator Investors”), a related broker-dealer. The Adviser’s indirect parent, JHLICO, is the indirect sole shareholder of Signator Investors.
Class B shares that are redeemed within six years of purchase are subject to a contingent deferred sales charge (“CDSC”) at declining rates, beginning at 5.00% of the lesser of the current market value at the time of redemption or the original purchase cost of the shares being redeemed. Class C shares that are redeemed within one year of purchase are subject to a CDSC at a rate of 1.00% of the lesser of the current market value at the time of redemption or the original purchase cost of the shares being redeemed. Proceeds from the CDSCs are paid to JH Funds and are used, in whole or in part, to defray its expenses for providing distribution-related services to the Fund in connection with the sale of Class B and Class C shares. During the year ended March 31, 2007, CDSCs received by JH Funds amounted to $141,569 for Class B shares and $2,730 for Class C shares.
Money Market Fund
20
The Fund has a transfer agent agreement with John Hancock Signature Services, Inc. (“Signature Services”), an indirect subsidiary of JHLICO. The Fund pays a monthly transfer agent fee at an annual rate of 0.01% of each class’ average daily net asset value, plus a fee based on the number of shareholder accounts and reimbursement for certain out-of-pocket expenses, aggregated and allocated to each class on the basis of its relative net asset value. Accordingly, the transfer agent expense for Class A, Class B and Class C shares was reduced by $6,406 during the year ended March 31, 2007. Signature Services terminated this agreement June 30, 2006.
The Fund has an agreement with the Adviser and affiliates to perform necessary tax, accounting and legal services for the Fund. The compensation for the year amounted to $32,537. The Fund also paid the Adviser the amount of $66 for certain publishing services, included in the printing fees. The Fund reimbursed JHLICO for certain compliance costs, included in the Fund’s Statement of Operations.
Mr. James R. Boyle is Chairman of the Adviser, as well as an affiliated Trustee of the Fund, and is compensated by the Adviser and/or its affiliates. The compensation of unaffiliated Trustees is borne by the Fund. The unaffiliated Trustees may elect to defer, for tax purposes, their receipt of this compensation under the John Hancock Group of Funds Deferred Compensation Plan. The Fund makes investments into other John Hancock funds, as applicable, to cover its liability for the deferred compensation. Investments to cover the Fund’s deferred compensation liability are recorded on the Fund’s books as an other asset. The deferred compensation liability and the related other asset are always equal and are marked to market on a periodic basis to reflect any income earned by the investments, as well as any unrealized gains or losses. The Deferred Compensation Plan investments had no impact on the operations of the Fund.
Note 3
Fund share transactions
This listing illustrates the number of Fund shares sold, reinvested and repurchased during the last two years, along with the corresponding dollar value. Analysis of Fund share transactions is reported at $1 per share.
| | Year ended | Year ended |
| | 3-31-06 | 3-31-07 |
|
| Class A shares | | |
|
| Sold | $127,681,502 | $165,842,268 |
| Distributions reinvested | 5,328,508 | 7,947,354 |
| Repurchased | (172,041,882) | (163,879,236) |
| Net increase (decrease) | ($39,031,872) | $9,910,386 |
| |
| Class B shares | | |
|
| Sold | $27,389,350 | $22,754,271 |
| Distributions reinvested | 815,743 | 1,010,307 |
| Repurchased | (55,432,211) | (31,507,711) |
| Net decrease | ($27,227,118) | ($7,743,133) |
| |
| Class C shares | | |
|
| Sold | $13,974,382 | $17,979,513 |
| Distributions reinvested | 124,618 | 258,408 |
| Repurchased | (22,703,402) | (14,351,424) |
| Net increase (decrease) | ($8,604,402) | $3,886,497 |
|
| |
| Net increase (decrease) | ($74,863,392) | $6,053,750 |
|
Money Market Fund
21
Note 4
Investment transactions
Purchases and proceeds from sales or maturities of securities, including discount earned on investment securities, during the year ended March 31, 2007, aggregated $6,441,804,462 and $6,432,759,653, respectively.
The cost of investments owned on March 31, 2007, for federal income tax purposes, was $238,931,708.
Money Market Fund
22
Auditors’ report
Report of Independent Registered Public Accounting Firm
To the Board of Trustees of the John Hancock Current Interest and Shareholders of John Hancock Money Market Fund,
In our opinion, the accompanying statement of assets and liabilities, including the schedule of investments, and the related statements of operations and of changes in net assets and the financial highlights present fairly, in all material respects, the financial position of John Hancock Money Market Fund (the “Fund”) at March 31, 2007, the results of its operations, the changes in its net assets and the financial highlights for the periods indicated, in conformity with accounting principles generally accepted in the United States of America. These financial statements and financial highlights (hereafter referred to as “financial statements”) are the responsibility of the Fund’s management; our responsibility is to express an opinion on these financial statements based on our audits. We conducted our audits of these financial statements in accordance with the standards of the Public Company Accounting Oversight Board (United States). Those standards require that we plan and perform the audit to obtain reasonable assurance about whether the financial statements are free of material misstatement. An audit includes examining, on a test basis, evidence supporting the amounts and disclosures in the financial statements, assessing the accounting principles used and significant estimates made by management, and evaluating the overall financial statement presentation. We believe that our audits, which included confirmation of securities at March 31, 2007 by correspondence with the custodian and brokers, provide a reasonable basis for our opinion. The financial highlights for each of the three years ended on or before March 31, 2005 were audited by another independent registered public accounting firm, whose report dated May 5, 2005 expressed and unqualified opinion thereon.
PricewaterhouseCoopers LLP
Boston, Massachusetts
April 30, 2007
23
Tax information
Unaudited
For federal income tax purposes, the following information is furnished with respect to the distributions of the Fund, if any, paid during its taxable year ended March 31, 2007.
The Fund hereby designates the maximum amount allowable of its net taxable income as qualified dividend income as provided in the Jobs and Growth Tax Relief Reconciliation Act of 2003. This amount will be reflected on Form 1099-DIV for the calendar year 2007.
Shareholders will be mailed a 2007 U.S. Treasury Department Form 1099-DIV in January 2008. This will reflect the total of all distributions that are taxable for calendar year 2007.
24
Board Consideration of and
Continuation of Investment Advisory
Agreement and Subadvisory
Agreement: John Hancock Money
Market Fund
The Investment Company Act of 1940 (the “1940 Act”) requires the Board of Trustees (the “Board”) of John Hancock Current Interest (the “Trust”), including a majority of the Trustees who have no direct or indirect interest in the investment advisory agreement and are not “interested persons” of the Trust, as defined in the 1940 Act (the “Independent Trustees”), annually to review and consider the continuation of: (i) the investment advisory agreement (the “Advisory Agreement”) with John Hancock Advisers, LLC (the “Adviser”) and (ii) the investment subadvisory agreement (the “Subadvisory Agreement”) with Sovereign Asset Management LLC (the “Subadviser”) for the John Hancock Money Market Fund (the “Fund”). The Advisory Agreement and the Subadvisory Agreement are collectively referred to as the “Advisory Agreements.”
At meetings held on May 1–2 and June 5–6, 2006,1 the Board considered the factors and reached the conclusions described below relating to the selection of the Adviser and Subadviser and the continuation of the Advisory Agreements. During such meetings, the Board’s Contracts/Operations Committee and the Independent Trustees also met in executive sessions with their independent legal counsel.
In evaluating the Advisory Agreements, the Board, including the Contracts/Operations Committee and the Independent Trustees, reviewed a broad range of information requested for this purpose by the Independent Trustees, including: (i) the investment performance of the Fund relative to a category of relevant funds (the “Category”) and a peer group of comparable funds (the “Peer Group”) each selected by Morningstar, Inc. (“Morningstar”), an independent provider of investment company data, for a range of periods ended December 31, 2005; (ii) advisory and other fees incurred by, and the expense ratios of, the Fund relative to a Category and a Peer Group; (iii) the advisory fees of comparable portfolios of other clients of the
Adviser and the Subadviser; (iv) the Adviser’s financial results and condition, including its and certain of its affiliates’ profitability from services performed for the Fund; (v) breakpoints in the Fund’s and the Peer Group’s fees and information about economies of scale; (vi) the Adviser’s and Subadviser’s record of compliance with applicable laws and regulations, with the Fund’s investment policies and restrictions and with the applicable Code of Ethics, and the structure and responsibilities of the Adviser’s and Subadviser’s compliance department; (vii) the background and experience of senior management and investment professionals and (viii) the nature, cost and character of advisory and non-investment management services provided by the Adviser and its affiliates and by the Subadviser.
The Board’s review and conclusions were based on a comprehensive consideration of all information presented to the Board and not the result of any single controlling factor. It was based on performance and other information as of December 31, 2005; facts may have changed between that date and the date of this shareholders report. The key factors considered by the Board and the conclusions reached are described below.
Nature, extent and quality of services
The Board considered the ability of the Adviser and the Subadviser, based on their resources, reputation and other attributes, to attract and retain qualified investment professionals, including research, advisory and supervisory personnel. The Board further considered the compliance programs and compliance records of the Adviser and Subadviser. In addition, the Board took into account the administrative services provided to the Fund by the Adviser and its affiliates.
Based on the above factors, together with those referenced below, the Board concluded that, within the context of its full deliberations, the nature, extent and quality of the investment advisory services provided to the Fund by the Adviser and Subadviser were sufficient to support renewal of the Advisory Agreements.
Fund performance
The Board considered the performance results for the Fund over various time periods
25
ended December 31, 2005. The Board also considered these results in comparison to the performance of the Category, as well as the Fund’s benchmark index. Morningstar determined the Category and Peer Group for the Fund. The Board reviewed with a representative of Morningstar the methodology used by Morningstar to select the funds in the Category and the Peer Group. The Board noted the imperfect comparability of the Peer Group.
The Board noted that the Fund’s performance during the review periods ended December 31, 2005, was lower than the performance of the Peer Group and Category medians, and its benchmark index, the 3-Month T-Bill. The Adviser provided information to the Board regarding factors contributing to the Fund’s performance results, as well as the Adviser’s outlook and investment strategy for the near future. The Board indicated its intent to continue to monitor the Fund’s performance trends.
Investment advisory fee and subadvisory fee rates and expenses
The Board reviewed and considered the contractual investment advisory fee rate payable by the Fund to the Adviser for investment advisory services (the “Advisory Agreement Rate”). The Board received and considered information comparing the Advisory Agreement Rate with the advisory fees for the Peer Group. The Board noted that the Advisory Agreement Rate was higher than the median rate of the Peer Group and the Category.
The Board received and considered expense information regarding the Fund’s various components, including advisory fees, distribution and fees other than advisory and distribution fees, including transfer agent fees, custodian fees and other miscellaneous fees (e.g., fees for accounting and legal services). The Board also considered peer-adjusted comparisons for the transfer agent fees. The Board considered comparisons of these expenses to the Peer Group median. The Board also received and considered expense information regarding the Fund’s total operating expense ratio (“Gross Expense Ratio”) and total operating expense ratio after taking the fee waiver arrangement applicable to the Advisory Agreement Rate into account (“Net Expense Ratio”). The Board received and considered information comparing the Gross Expense Ratio and Net Expense Ratio of the Fund to that of the Peer Group and Category medians. The Board noted that the Fund’s Gross and Net Expense Ratios were higher than medians of the Peer Group and Category. The Board favorably considered the impact of continuing fee waivers towards ultimately lowering the Fund’s total operating expense ratio.
The Adviser also discussed the Morningstar data and rankings, and other relevant information, for the Fund. Based on the above-referenced considerations and other factors, the Board concluded that the Fund’s expenses and plans to improve overall performance supported the re-approval of the Advisory Agreements.
The Board also received information about the investment subadvisory fee rate (the “Subadvisory Agreement Rate”) payable by the Adviser to the Subadviser for investment sub-advisory services. The Board concluded that the Subadvisory Agreement Rate was fair and equitable, based on its consideration of the factors described here.
Profitability
The Board received and considered a detailed profitability analysis of the Adviser based on the Advisory Agreements, as well as on other relationships between the Fund and the Adviser and its affiliates, including the Subadviser. The Board concluded that, in light of the costs of providing investment management and other services to the Fund, the profits and other ancillary benefits reported by the Adviser were not unreasonable.
Economies of scale
The Board received and considered general information regarding economies of scale with respect to the management of the Fund, including the Fund’s ability to appropriately benefit from economies of scale under the Fund’s fee structure. The Board recognized the inherent limitations of any analysis of economies of scale, stemming largely from the Board’s understanding that most of the Adviser’s costs are not specific to individual Funds, but rather are incurred across a variety of products and services.
26
To the extent the Board and the Adviser were able to identify actual or potential economies of scale from Fund-specific or allocated expenses, in order to ensure that any such economies continue to be reasonably shared with the Fund as its assets increase, the Adviser and the Board agreed to continue the existing breakpoints to the Advisory Agreement Rate.
Information about services to other clients
The Board also received information about the nature, extent and quality of services and fee rates offered by the Adviser and Subadviser to their other clients, including other registered investment companies, institutional investors and separate accounts. The Board concluded that the Advisory Agreement Rate and the Subadvisory Agreement Rate were not unreasonable, taking into account fee rates offered to others by the Adviser and Subadviser, respectively, after giving effect to differences in services.
Other benefits to the Adviser
The Board received information regarding potential “fall-out” or ancillary benefits received by the Adviser and its affiliates as a result of the Adviser’s relationship with the Fund. Such benefits could include, among others, benefits directly attributable to the relationship of the Adviser with the Fund and benefits potentially derived from an increase in the business of the Adviser as a result of its relationship with the Fund (such as the ability to market to shareholders other financial products offered by the Adviser and its affiliates).
The Board also considered the effectiveness of the Adviser’s, Subadviser’s and Fund’s policies and procedures for complying with the requirements of the federal securities laws, including those relating to best execution of portfolio transactions and brokerage allocation.
Other factors and broader review
As discussed above, the Board reviewed detailed materials received from the Adviser and Subadviser as part of the annual re-approval process. The Board also regularly reviews and assesses the quality of the services that the Fund receives throughout the year. In this regard, the Board reviews reports of the Adviser at least quarterly, which include, among other things, a detailed portfolio review, detailed fund performance reports and compliance reports. In addition, the Board meets with portfolio managers and senior investment officers at various times throughout the year.
After considering the above-described factors and based on its deliberations and its evaluation of the information described above, the Board concluded that approval of the continuation of the Advisory Agreements for the Fund was in the best interest of the Fund and its shareholders. Accordingly, the Board unanimously approved the continuation of the Advisory Agreements.
1 The Board previously considered information about the Subadvisory Agreement at the September and December 2005 Board meetings in connection with the Adviser’s reorganization.
27
Trustees and Officers
This chart provides information about the Trustees and Officers who oversee your John Hancock fund. Officers elected by the Trustees manage the day-to-day operations of the Fund and execute policies formulated by the Trustees.
| Independent Trustees | | |
| |
| Name, Year of Birth | | Number of |
| Position(s) held with Fund | Trustee | John Hancock |
| Principal occupation(s) and other | of Fund | funds overseen |
| directorships during past 5 years | since1 | by Trustee |
|
| Ronald R. Dion, Born: 1946 | 1998 | 66 |
|
| Independent Chairman (since 2005); Chairman and Chief Executive Officer, | | |
| R.M. Bradley & Co., Inc.; Director, The New England Council and Massachusetts | |
| Roundtable; Trustee, North Shore Medical Center; Director, Boston Stock | | |
| Exchange; Director, BJ’s Wholesale Club, Inc. and a corporator of the Eastern | | |
| Bank; Trustee, Emmanuel College; Director, Boston Municipal Research Bureau; | |
| Member of the Advisory Board, Carroll Graduate School of Management at | | |
| Boston College. | | |
|
| |
| James F. Carlin, Born: 1940 | 1994 | 66 |
|
| Director and Treasurer, Alpha Analytical Laboratories Inc. (chemical analysis) | | |
| (since 1985); Part Owner and Treasurer, Lawrence Carlin Insurance Agency, | | |
| Inc. (since 1995); Part Owner and Vice President, Mone Lawrence Carlin | | |
| Insurance Agency, Inc. (until 2005); Chairman and Chief Executive Officer, | | |
| Carlin Consolidated, Inc. (management/investments) (since 1987); Trustee, | | |
| Massachusetts Health and Education Tax Exempt Trust (1993–2003). | | |
|
| |
| William H. Cunningham, Born: 1944 | 1987 | 66 |
|
| Former Chancellor, University of Texas System and former President of the | | |
| University of Texas, Austin, Texas; Chairman and Chief Executive Officer, | | |
| IBT Technologies (until 2001); Director of the following: Hire.com (until 2004), | | |
| STC Broadcasting, Inc. and Sunrise Television Corp. (until 2001), Symtx, Inc. | | |
| (electronic manufacturing) (since 2001), Adorno/Rogers Technology, Inc. (until | | |
| 2004), Pinnacle Foods Corporation (until 2003), rateGenius (until 2003), Lincoln | |
| National Corporation (insurance) (since 2006), Jefferson-Pilot Corporation | | |
| (diversified life insurance company) (until 2006), New Century Equity Holdings | | |
| (formerly Billing Concepts) (until 2001), eCertain (until 2001), ClassMap.com | | |
| (until 2001), Agile Ventures (until 2001), AskRed.com (until 2001), Southwest | | |
| Airlines (since 2000), Introgen (since 2000) and Viasystems Group, Inc. (electronic | |
| manufacturer) (until 2003); Advisory Director, Interactive Bridge, Inc. (college | | |
| fundraising) (until 2001); Advisory Director, Q Investments (until 2003); | | |
| Advisory Director, JPMorgan Chase Bank (formerly Texas Commerce Bank – | | |
| Austin), LIN Television (since 2002), WilTel Communications (until 2003) and | | |
| Hayes Lemmerz International, Inc. (diversified automotive parts supply company) | |
| (since 2003). | | |
28
| Independent Trustees (continued) | | |
| |
| Name, Year of Birth | | Number of |
| Position(s) held with Fund | Trustee | John Hancock |
| Principal occupation(s) and other | of Fund | funds overseen |
| directorships during past 5 years | since1�� | by Trustee |
|
| Charles L. Ladner,2 Born: 1938 | 1994 | 66 |
|
| Chairman and Trustee, Dunwoody Village, Inc. (retirement services) (until 2003); | |
| Senior Vice President and Chief Financial Officer, UGI Corporation (public utility | |
| holding company) (retired 1998); Vice President and Director, AmeriGas, Inc. | | |
| (retired 1998); Director, AmeriGas Partners, L.P. (gas distribution) (until 1997); | | |
| Director, EnergyNorth, Inc. (until 1995); Director, Parks and History Association | |
| (until 2005). | | |
|
| |
| John A. Moore,2 Born: 1939 | 2005 | 66 |
| President and Chief Executive Officer, Institute for Evaluating Health Risks, | | |
| (nonprofit institution) (until 2001); Senior Scientist, Sciences International | | |
| (health research) (until 2003); Former Assistant Administrator and Deputy | | |
| Administrator, Environmental Protection Agency; Principal, Hollyhouse | | |
| (consulting) (since 2000); Director, CIIT Center for Health Science Research | | |
| (nonprofit research) (2002–2006). | | |
|
| |
| Patti McGill Peterson,2 Born: 1943 | 2005 | 66 |
|
| Executive Director, Council for International Exchange of Scholars and Vice | | |
| President, Institute of International Education (since 1998); Senior Fellow, Cornell | |
| Institute of Public Affairs, Cornell University (until 1998); Former President of | | |
| Wells College and St. Lawrence University; Director, Niagara Mohawk Power | | |
| Corporation (until 2003); Director, Ford Foundation, International Fellowships | | |
| Program (since 2002); Director, Lois Roth Endowment (since 2002); Director, | | |
| Council for International Educational Exchange (since 2003). | | |
|
| |
| Steven R. Pruchansky, Born: 1944 | 1994 | 66 |
|
| Chairman and Chief Executive Officer, Greenscapes of Southwest Florida, Inc. | | |
| (since 2000); Director and President, Greenscapes of Southwest Florida, Inc. | | |
| (until 2000); Managing Director, JonJames, LLC (real estate) (since 2001); | | |
| Director, First Signature Bank & Trust Company (until 1991); Director, Mast | | |
| Realty Trust (until 1994); President, Maxwell Building Corp. (until 1991). | | |
| |
| Non-Independent Trustee3 | | |
| |
| Name, Year of Birth | | Number of |
| Position(s) held with Fund | Trustee | John Hancock |
| Principal occupation(s) and other | of Fund | funds overseen |
| directorships during past 5 years | since1 | by Trustee |
|
| James R. Boyle, Born: 1959 | 2005 | 272 |
|
| President, John Hancock Insurance Group; Executive Vice President, John | | |
| Hancock Life Insurance Company (since June 2004); Chairman and Director, | | |
| John Hancock Advisers, LLC (the “Adviser”), John Hancock Funds, LLC and | | |
| The Berkeley Financial Group, LLC (“The Berkeley Group”) (holding company) | | |
| (since 2005); Senior Vice President, The Manufacturers Life Insurance Company | |
| (U.S.A.) (until 2004). | | |
29
| Principal officers who are not Trustees | |
| |
| Name, Year of Birth | |
| Position(s) held with Fund | Officer |
| Principal occupation(s) and | of Fund |
| directorships during past 5 years | since |
|
| Keith F. Hartstein, Born: 1956 | 2005 |
|
| President and Chief Executive Officer | |
| Senior Vice President, Manulife Financial Corporation (since 2004); Director, | |
| President and Chief Executive Officer, the Adviser, The Berkeley Group, John | |
| Hancock Funds, LLC (since 2005); Director, MFC Global Investment Management | |
| (U.S.), LLC (“MFC Global (U.S.)”) (since 2005); Director, John Hancock Signature | |
| Services, Inc. (since 2005); President and Chief Executive Officer, John Hancock | |
| Investment Management Services, LLC (since 2006); President and Chief Executive | |
| Officer, John Hancock Funds II, John Hancock Funds III and John Hancock Trust; | |
| Director, Chairman and President, NM Capital Management, Inc. (since 2005); | |
| Chairman, Investment Company Institute Sales Force Marketing Committee | |
| (since 2003); Director, President and Chief Executive Officer, MFC Global (U.S.) | |
| (2005–2006); Executive Vice President, John Hancock Funds, LLC (until 2005). | |
|
| |
| Thomas M. Kinzler, Born: 1955 | 2006 |
|
| Secretary and Chief Legal Officer | |
| Vice President and Counsel, John Hancock Life Insurance Company (U.S.A.) | |
| (since 2006); Secretary and Chief Legal Officer, John Hancock Funds, John | |
| Hancock Funds II, John Hancock Funds III and John Hancock Trust (since 2006); | |
| Vice President and Associate General Counsel, Massachusetts Mutual Life | |
| Insurance Company (1999–2006); Secretary and Chief Legal Counsel, MML | |
| Series Investment Fund (2000–2006); Secretary and Chief Legal Counsel, | |
| MassMutual Institutional Funds (2000–2004); Secretary and Chief Legal Counsel, | |
| MassMutual Select Funds and MassMutual Premier Funds (2004–2006). | |
|
| |
| Francis V. Knox, Jr., Born: 1947 | 2005 |
|
| Chief Compliance Officer | |
| Vice President and Chief Compliance Officer, John Hancock Investment | |
| Management Services, LLC, the Adviser and MFC Global (U.S.) (since 2005); | |
| Vice President and Chief Compliance Officer, John Hancock Funds II, John | |
| Hancock Funds III and John Hancock Trust (since 2005); Vice President and | |
| Assistant Treasurer, Fidelity Group of Funds (until 2004); Vice President and | |
| Ethics & Compliance Officer, Fidelity Investments (until 2001). | |
|
| |
| Gordon M. Shone, Born: 1956 | 2006 |
|
| Treasurer | |
| Treasurer, John Hancock Funds (since 2006), John Hancock Funds II, John | |
| Hancock Funds III and John Hancock Trust (since 2005); Vice President and | |
| Chief Financial Officer, John Hancock Trust (2003–2005); Senior Vice President, | |
| John Hancock Life Insurance Company (U.S.A.) (since 2001); Vice President, | |
| John Hancock Investment Management Services, Inc., John Hancock Advisers, | |
| LLC (since 2006) and The Manufacturers Life Insurance Company (U.S.A.) | |
| (1998–2000). | |
30
| Principal officers who are not Trustees (continued) | |
| |
| Name, Year of Birth | |
| Position(s) held with Fund | Officer |
| Principal occupation(s) and | of Fund |
| directorships during past 5 years | since |
|
| John G. Vrysen, Born: 1955 | 2005 |
|
| Chief Financial Officer | |
| Senior Vice President, Manulife Financial Corporation (since 2006); Director, | |
| Executive Vice President and Chief Financial Officer, the Adviser, The Berkeley | |
| Group and John Hancock Funds, LLC (since 2005); Executive Vice President and | |
| Chief Financial Officer, John Hancock Investment Management Services, LLC | |
| (since 2005); Vice President and Chief Financial Officer, MFC Global (U.S.) | |
| (since 2005); Director, John Hancock Signature Services, Inc. (since 2005); | |
| Chief Financial Officer, John Hancock Funds II, John Hancock Funds III and John | |
| Hancock Trust (since 2005); Vice President and General Manager, Fixed Annuities, | |
| U.S. Wealth Management (until 2005); Vice President, Operations, Manulife | |
| Wood Logan (2000–2004). | |
The business address for all Trustees and Officers is 601 Congress Street, Boston, Massachusetts 02210-2805. The Statement of Additional Information of the Fund includes additional information about members of the Board of Trustees of the Fund and is available, without charge, upon request, by calling 1-800-225-5291.
1Each Trustee serves until resignation, retirement age or until his or her successor is elected.
2Member of Audit Committee.
3Non-Independent Trustee holds positions with the Fund’s investment adviser, underwriter and certain other affiliates.
31
For more information
The Fund’s proxy voting policies, procedures and records are available without charge, upon request:
| By phone | On the Fund’s Web site | On the SEC’s Web site |
| 1-800-225-5291 | www.jhfunds.com/proxy | www.sec.gov |
|
| |
| Investment adviser | Custodian | Legal counsel |
| John Hancock Advisers, LLC | The Bank of New York | Kirkpatrick & Lockhart |
| 601 Congress Street | One Wall Street | Preston Gates Ellis LLP |
| Boston, MA 02210-2805 | New York, NY 10286 | 1 Lincoln Street |
| | Boston, MA 02111-2950 |
| Subadviser | Transfer agent | |
| MFC Global Investment | John Hancock Signature | Independent registered |
| Management (U.S.), LLC | Services, Inc. | public accounting firm |
| 101 Huntington Avenue | 1 John Hancock Way, | PricewaterhouseCoopers LLP |
| Boston, MA 02199 | Suite 1000 | 125 High Street |
| Boston, MA 02217-1000 | Boston, MA 02110 |
| Principal distributor | | |
| John Hancock Funds, LLC | | |
| 601 Congress Street | | |
| Boston, MA 02210-2805 | | |
The Fund’s investment objective, risks, charges and expenses are included in the prospectus and should be considered carefully before investing. For a prospectus, call your financial professional, call John Hancock Funds at 1-800-225-5291 or visit the Fund’s Web site at www.jhfunds.com. Please read the prospectus carefully before investing or sending money.
| How to contact us | |
|
| |
| Internet | www.jhfunds.com | |
|
| |
| Mail | Regular mail: | Express mail: |
| | John Hancock | John Hancock |
| | Signature Services, Inc. | Signature Services, Inc. |
| | 1 John Hancock Way, Suite 1000 | Mutual Fund Image Operations |
| | Boston, MA 02217-1000 | 380 Stuart Street |
| | | Boston, MA 02116 |
|
| |
| Phone | Customer service representatives | 1-800-225-5291 |
| | EASI-Line | 1-800-338-8080 |
| | TDD line | 1-800-554-6713 |
|
A listing of month-end portfolio holdings is available on our Web site, www.jhfunds.com. A more detailed portfolio holdings summary is available on a quarterly basis 60 days after the fiscal quarter on our Web site or upon request by calling 1-800-225-5291, or on the Securities and Exchange Commission’s Web site, www.sec.gov.
32
J O H N H A N C O C K F A M I L Y O F F U N D S
EQUITY
Balanced Fund
Classic Value Fund
Classic Value Fund II
Classic Value Mega Cap Fund
Core Equity Fund
Focused Equity Fund
Global Shareholder Yield Fund
Growth Fund
Growth Opportunities Fund
Growth Trends Fund
Intrinsic Value Fund
Large Cap Equity Fund
Large Cap Select Fund
Mid Cap Equity Fund
Mid Cap Growth Fund
Multi Cap Growth Fund
Small Cap Equity Fund
Small Cap Fund
Small Cap Intrinsic Value Fund
Sovereign Investors Fund
U.S. Core Fund
U.S. Global Leaders Growth Fund
Value Opportunities Fund
ASSET ALLOCATION
Allocation Core Portfolio
Allocation Growth + Value Portfolio
Lifecycle 2010 Portfolio
Lifecycle 2015 Portfolio
Lifecycle 2020 Portfolio
Lifecycle 2025 Portfolio
Lifecycle 2030 Portfolio
Lifecycle 2035 Portfolio
Lifecycle 2040 Portfolio
Lifecycle 2045 Portfolio
Lifecycle Retirement Portfolio
Lifestyle Aggressive Portfolio
Lifestyle Balanced Portfolio
Lifestyle Conservative Portfolio
Lifestyle Growth Portfolio
Lifestyle Moderate Portfolio
SECTOR
Financial Industries Fund
Health Sciences Fund
Real Estate Fund
Regional Bank Fund
Technology Fund
Technology Leaders Fund
INTERNATIONAL
Greater China Opportunities Fund
International Allocation Portfolio
International Classic Value Fund
International Core Fund
International Fund
International Growth Fund
INCOME
Bond Fund
Government Income Fund
High Yield Fund
Investment Grade Bond Fund
Strategic Income Fund
TAX-FREE INCOME
California Tax-Free Income Fund
High Yield Municipal Bond Fund
Massachusetts Tax-Free Income Fund
New York Tax-Free Income Fund
Tax-Free Bond Fund
MONEY MARKET
Money Market Fund
U.S. Government Cash Reserve
CLOSED-END
Bank and Thrift Opportunity Fund
Financial Trends Fund, Inc.
Income Securities Trust
Investors Trust
Patriot Global Dividend Fund
Patriot Preferred Dividend Fund
Patriot Premium Dividend Fund I
Patriot Premium Dividend Fund II
Patriot Select Dividend Trust
Preferred Income Fund
Preferred Income II Fund
Preferred Income III Fund
Tax-Advantaged Dividend Income Fund
For more complete information on any John Hancock Fund and an Open-End fund prospectus, which includes charges and expenses, call your financial professional, or John Hancock Funds at 1-800-225-5291 for Open-End fund information and 1-800-852-0218 for Closed-End fund information. Please read the Open-End fund prospectus carefully before investing or sending money.

1-800-225-5291
1-800-554-6713 TDD
1-800-338-8080 EASI-Line
www.jhfunds. com
Now available: electronic delivery
www.jhfunds. com/edelivery
This report is for the information of the shareholders of John Hancock Money Market Fund. 4400A 3/07
. . . . &nb sp; 5/07
ITEM 2. CODE OF ETHICS.
As of the end of the period, March 31, 2007, the registrant has adopted a code of ethics, as defined in Item 2 of Form N-CSR, that applies to its Chief Executive Officer, Chief Financial Officer and Treasurer (respectively, the principal executive officer, the principal financial officer and the principal accounting officer, the “Senior Financial Officers”). A copy of the code of ethics is filed as an exhibit to this Form N-CSR.
ITEM 3. AUDIT COMMITTEE FINANCIAL EXPERT.
Charles L. Ladner is the audit committee financial expert and is “independent”, pursuant to general instructions on Form N-CSR Item 3.
ITEM 4. PRINCIPAL ACCOUNTANT FEES AND SERVICES.
(a) Audit Fees
The aggregate fees billed for professional services rendered by the principal accountant(s) for the audit of the registrant’s annual financial statements or services that are normally provided by the accountant(s) in connection with statutory and regulatory filings or engagements amounted to $38,800 for the fiscal year ended March 31, 2006 (broken out as follows: John Hancock Money Market Fund $23,900 and John Hancock U.S. Government Cash Reserve - $14,900) and $38,800 for the fiscal year ended March 31, 2007 (broken out as follows: John Hancock Money Market Fund $23,900 and John Hancock U.S. Government Cash Reserve - $14,900). These fees were billed to the registrant and were approved by the registrant’s audit committee.
(b) Audit-Related Services
There were no audit-related fees during the fiscal year ended March 31, 2006 and fiscal year ended March 31, 2007 billed to the registrant or to the registrant's investment adviser (not including any sub-adviser whose role is primarily portfolio management and is subcontracted with or overseen by another investment adviser), and any entity controlling, controlled by, or under common control with the adviser that provides ongoing services to the registrant ("control affiliates").
(c) Tax Fees
The aggregate fees billed for professional services rendered by the principal accountant(s) for the tax compliance, tax advice and tax planning (“tax fees”) amounted to $4,900 for the fiscal year ended March 31, 2006 (broken out as follows: John Hancock Money Market Fund $3,000 and John Hancock U.S. Government Cash Reserve - $1,900) and $4,900 (broken out as follows: John Hancock Money Market Fund $3,000 and John Hancock U.S. Government Cash Reserve - $1,900) for the fiscal year ended March 31, 2007. The nature of the services comprising the tax fees was the review of the registrant’s income tax returns and tax distribution requirements. These fees were billed to the registrant and were approved by the registrant’s audit committee. There were no tax fees billed to the control affiliates.
(d) All Other Fees
There were no other fees during the fiscal year ended March 31, 2006 and fiscal year ended March 31, 2007 billed to the registrant or to the control affiliates.
(e)(1) See attachment "Approval of Audit, Audit-related, Tax and Other Services", with the audit committee pre-approval policies and procedures.
(e)(2) There were no fees that were approved by the audit committee pursuant to the de minimis exception for the fiscal years ended March 31, 2006 and March 31, 2007 on behalf of the registrant or on behalf of the control affiliates that relate directly to the operations and financial reporting of the registrant.
(f) According to the registrant’s principal accountant, for the fiscal year ended March 31, 2006, the percentage of hours spent on the audit of the registrant's financial statements for the most recent fiscal year that were attributed to work performed by persons who were not full-time, permanent employees of principal accountant was less than 50%.
(g) The aggregate non-audit fees billed by the registrant's accountant(s) for services rendered to the registrant and rendered to the registrant's control affiliates for each of the last two fiscal years of the registrant were $23,400 for the fiscal year ended March 31, 2006 and $872,192 for the fiscal year ended March 31, 2007.
(h) The audit committee of the registrant has considered the non-audit services provided by the registrant’s principal accountant(s) to the control affiliates and has determined that the services that were not pre-approved are compatible with maintaining the principal accountant(s)' independence.
ITEM 5. AUDIT COMMITTEE OF LISTED REGISTRANTS.
The registrant has a separately-designated standing audit committee comprised of independent trustees. The members of the audit committee are as follows:
Dr. John A. Moore - Chairman
Charles L. Ladner
Patti McGill Peterson
ITEM 6. SCHEDULE OF INVESTMENTS.
Not applicable.
ITEM 7. DISCLOSURE OF PROXY VOTING POLICIES AND PROCEDURES FOR CLOSED-END MANAGEMENT INVESTMENT COMPANIES.
Not applicable.
ITEM 8. PORTFOLIO MANAGERS OF CLOSED-END MANAGEMENT INVESTMENT COMPANIES.
Not applicable.
ITEM 9. PURCHASES OF EQUITY SECURITIES BY CLOSED-END MANAGEMENT INVESTMENT COMPANY AND AFFILIATED PURCHASERS.
Not applicable.
ITEM 10. SUBMISSION OF MATTERS TO A VOTE OF SECURITY HOLDERS.
There were no material changes to previously disclosed John Hancock Funds – Governance Committee Charter.
ITEM 11. CONTROLS AND PROCEDURES.
(a) Based upon their evaluation of the registrant's disclosure controls and procedures as conducted within 90 days of the filing date of this Form N-CSR, the registrant's principal executive officer and principal financial officer have concluded that those disclosure controls and procedures provide reasonable assurance that the material information required to be disclosed by the registrant on this report is recorded, processed, summarized and reported within the time periods specified in the Securities and Exchange Commission's rules and forms.
(b) There were no changes in the registrant's internal control over financial reporting that occurred during the registrant's most recent fiscal half-year (the registrant's second fiscal half-year in the case of an annual report) that have materially affected, or are reasonably likely to materially affect, the registrant's internal control over financial reporting.
ITEM 12. EXHIBITS.
(a)(1) Code of Ethics for Senior Financial Officers is attached.
(a)(2) Separate certifications for the registrant's principal executive officer and principal financial officer, as required by Section 302 of the Sarbanes-Oxley Act of 2002 and Rule 30a-2(a) under the Investment Company Act of 1940, are attached.
(b) Separate certifications for the registrant's principal executive officer and principal financial officer, as required by 18 U.S.C. Section 1350, as adopted pursuant to Section 906 of the Sarbanes-Oxley Act of 2002, and Rule 30a-2(b) under the Investment Company Act of 1940, are attached. The certifications furnished pursuant to this paragraph are not deemed to be "filed" for purposes of Section 18 of the Securities Exchange Act of 1934, or otherwise subject to the liability of that section. Such certifications are not deemed to be incorporated by reference into any filing under the Securities Act of 1933 or the Securities Exchange Act of 1934, except to the extent that the Registrant specifically incorporates them by reference.
(c)(1) Approval of Audit, Audit-related, Tax and Other Services is attached.
(c)(2) Submission of Matters to a Vote of Security Holders is attached. See attached “John Hancock Funds – Governance Committee Charter”.
(c)(3) Proxy Voting Policies and Procedures are attached.
(c)(2) Contact person at the registrant.
SIGNATURES
Pursuant to the requirements of the Securities Exchange Act of 1934 and the Investment Company Act of 1940, the registrant has duly caused this report to be signed on its behalf by the undersigned, thereunto duly authorized.
John Hancock Current Interest
By: /s/ Keith F. Hartstein
-------------------------------------
Keith F. Hartstein
President and Chief Executive Officer
Date: May 24, 2007
Pursuant to the requirements of the Securities Exchange Act of 1934 and the Investment Company Act of 1940, this report has been signed below by the following persons on behalf of the registrant and in the capacities and on the dates indicated.
By: /s/ Keith F. Hartstein
-------------------------------------
Keith F. Hartstein
President and Chief Executive Officer
Date: May 24, 2007
By: /s/ John G. Vrysen
-------------------------------------
John G. Vrysen
Chief Financial Officer
Date: May 24, 2007