| |
| UNITED STATES |
| SECURITIES AND EXCHANGE COMMISSION |
| Washington, D.C. 20549 |
| |
| FORM N-CSR |
| |
| CERTIFIED SHAREHOLDER REPORT OF REGISTERED |
| MANAGEMENT INVESTMENT COMPANIES |
| |
| Investment Company Act file number 811- 2485 |
| |
| John Hancock Current Interest |
| (Exact name of registrant as specified in charter) |
| |
| 601 Congress Street, Boston, Massachusetts 02210 |
| (Address of principal executive offices) (Zip code) |
| |
| Alfred P. Ouellete, Senior Counsel and Assistant Secretary |
| |
| 601 Congress Street |
| |
| Boston, Massachusetts 02210 |
| (Name and address of agent for service) |
| |
| Registrant's telephone number, including area code: 617-663-4324 |
| | |
| Date of fiscal year end: | March 31 |
| |
| |
| Date of reporting period: | September 30, 2008 |
ITEM 1. REPORT TO SHAREHOLDERS.

Your expenses
These examples are intended to help you understand your ongoing operating expenses.
Understanding fund expenses
As a shareholder of the Fund, you incur two types of costs:
▪ Transaction costs which include sales charges (loads) on purchases or redemptions (varies by share class), minimum account fee charge, etc.
▪ Ongoing operating expenses including management fees, distribution and service fees (if applicable), and other fund expenses.
We are going to present only your ongoing operating expenses here.
Actual expenses/actual returns
This example is intended to provide information about your fund’s actual ongoing operating expenses, and is based on your fund’s actual return. It assumes an account value of $1,000.00 on April 1, 2008 with the same investment held until September 30, 2008.
| | | |
| | Account value | Ending value | Expenses paid during |
| | on 4-1-08 | on 9-30-08 | period ended 9-30-081 |
|
| Class A | $1,000.00 | $1,009.40 | $4.13 |
|
| Class B | 1,000.00 | 1,005.10 | 8.39 |
|
| Class C | 1,000.00 | 1,005.10 | 8.39 |
|
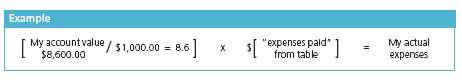
Together with the value of your account, you may use this information to estimate the operating expenses that you paid over the period. Simply divide your account value at September 30, 2008, by $1,000.00, then multiply it by the “expenses paid” for your share class from the table above. For example, for an account value of $8,600.00, the operating expenses should be calculated as follows:
| |
| 6 | Money Market Fund | Semiannual report |
Hypothetical example for comparison purposes
This table allows you to compare your fund’s ongoing operating expenses with those of any other fund. It provides an example of the Fund’s hypothetical account values and hypothetical expenses based on each class’s actual expense ratio and an assumed 5% annualized return before expenses (which is not your fund’s actual return). It assumes an account value of $1,000.00 on April 1, 2008, with the same investment held until September 30, 2008. Look in any other fund shareholder report to find its hypothetical example and you will be able to compare these expenses.
| | | |
| | Account value | Ending value | Expenses paid during |
| | on 4-1-08 | on 9-30-08 | period ended 9-30-081 |
|
| Class A | $1,000.00 | $1,021.00 | $4.15 |
|
| Class B | 1,000.00 | 1,016.70 | 8.44 |
|
| Class C | 1,000.00 | 1,016.70 | 8.44 |
|
Remember, these examples do not include any transaction costs, such as sales charges; therefore, these examples will not help you to determine the relative total costs of owning different funds. If transaction costs were included, your expenses would have been higher. See the prospectus for details regarding transaction costs.
1 Expenses are equal to the Fund’s annualized expense ratio of 0.82%, 1.67% and 1.67% for Class A, Class B and Class C, respectively, multiplied by the average account value over the period, multiplied by number of days in most recent fiscal half-year/365 (to reflect the one-half year period).
| |
| Semiannual report | Money Market Fund | 7 |
Portfolio summary
| | | | |
| Sector distribution1 | | | | |
|
| Financials | 78% | | Information technology | 3% |
| |
|
| Government agencies | 11% | | Mortgage bonds | 1% |
| |
|
| Consumer discretionary | 3% | | Health care | 1% |
| |
|
| Industrials | 3% | | | |
| | |
|
1As a percentage of net assets on September 30, 2008.
| |
| 8 | Money Market Fund | Semiannual report |
F I N A N C I A L S T A T E M E N T S
Fund’s investments
Securities owned by the Fund on 9-30-08 (unaudited)
This schedule is divided into four categories: commercial paper, corporate interest-bearing obligations, U.S. government obligations and short-term investments. Commercial paper, corporate interest-bearing obligations and U.S. government obligations are further broken down by industry group. Short-term investments, which represent the Fund’s cash position, are listed last.
| | | | | | |
| | Interest | | Maturity | Quality | Par value | |
| Issuer | rate | | date | rating (A) | (000) | Value |
|
| Commercial Paper 39.96% | | | | | | $165,668,549 |
| (Cost $165,668,549) | | | | | | |
| | | | | | | |
| Asset Backed — Auto Loan 0.84% | | | | | | 3,497,993 |
|
| VolkswagenAG | 2.950% | | 10-08-08 | Tier 2 | $3,500 | 3,497,993 |
| | | | | | | |
| Banks — Foreign 13.52% | | | | | | 56,042,720 |
|
| AbbeyNational N.A., LLC | 2.590 | | 11-12-08 | Tier 1 | 2,500 | 2,492,460 |
|
| AbbeyNational N.A., LLC | 2.610 | | 11-04-08 | Tier 1 | 1,200 | 1,197,042 |
|
| Banque Nationale De Paris | 2.730 | | 10-02-08 | Tier 1 | 2,570 | 2,569,805 |
|
| Deutsche Bank AG | 1.500 | | 10-01-08 | Tier 1 | 15,000 | 15,000,000 |
|
| Royal Bank of Canada | 2.530 | | 10-21-08 | Tier 1 | 6,000 | 5,991,567 |
|
| Royal Bank of Canada | 2.450 | | 10-08-08 | Tier 1 | 6,000 | 5,997,142 |
|
| Societe Generale New York | 3.000 | | 10-01-08 | Tier 1 | 13,500 | 13,500,000 |
|
| Societe Generale New York | 2.400 | | 10-10-08 | Tier 1 | 7,000 | 6,995,800 |
|
| UBS Finance Delaware, LLC | 2.450 | | 10-08-08 | Tier 1 | 2,300 | 2,298,904 |
| | | | | | | |
| Banks — U.S. 5.06% | | | | | | 20,972,474 |
|
| State Street Boston Corp. | 2.550 | | 10-27-08 | Tier 1 | 10,000 | 9,981,583 |
|
| Wells Fargo & Co. | 2.420 | | 10-07-08 | Tier 1 | 4,000 | 3,998,387 |
|
| Wells Fargo & Co. | 2.570 | | 10-16-08 | Tier 1 | 7,000 | 6,992,504 |
| | | | | | | |
| Diversified Financial Services 5.18% | | | | | | 2,149,046 |
|
| Principal Financial Services, Inc. (S) | 2.350 | | 10-20-08 | Tier 1 | 7,000 | 6,991,318 |
|
| Principal Financial Services, Inc. (S) | 4.200 | | 10-01-08 | Tier 1 | 11,000 | 11,000,000 |
|
| Textron Financial Corp. | 2.800 | | 10-02-08 | Tier 2 | 3,500 | 3,499,728 |
| | | | | | | |
| Food 7.04% | | | | | | 29,188,315 |
|
| Cargill Global Fund, PLC (S) | 2.440 | | 10-03-08 | Tier 1 | 2,183 | 2,182,704 |
|
| Cargill, Inc. (S) | 2.530 | | 10-29-08 | Tier 1 | 3,022 | 3,016,053 |
|
| Cargill, Inc. (S) | 2.540 | | 11-07-08 | Tier 1 | 4,000 | 3,989,558 |
|
| Nestle Capital Corp. (S) | 0.500 | | 10-01-08 | Tier 1 | 20,000 | 20,000,000 |
| | | | | | | |
| Investment Banking & Brokerage 4.82% | | | | | 19,987,135 |
|
| Goldman Sachs Group, Inc. | 1.750 | | 10-01-08 | Tier 1 | 9,000 | 9,000,000 |
|
| JPMorgan Chase & Co. | 2.500 | | 10-21-08 | Tier 1 | 6,000 | 5,991,667 |
|
| JPMorgan Chase & Co. | 2.510 | | 10-14-08 | Tier 1 | 5,000 | 4,995,468 |
| | | | | | | |
| Pharmaceuticals 1.21% | | | | | | 5,000,000 |
|
| Pfizer, Inc. (S) | 1.900 | | 10-01-08 | Tier 1 | 5,000 | 5,000,000 |
See notes to financial statements
| |
| Semiannual report | Money Market Fund | 9 |
F I N A N C I A L S T A T E M E N T S
| | | | | | |
| | Interest | | Maturity | Quality | Par value | |
| Issuer | rate | | date | rating (A) | (000) | Value |
| Retail — Drug Stores 0.84% | | | | | | $3,497,861 |
|
| CVS Corp. (S) | 2.750% | | 10-09-08 | Tier 2 | $3,500 | 3,497,861 |
| | | | | | | |
| Telecommunications 1.45% | | | | | | 5,991,005 |
|
| Verizon Global Funding Corp. | 2.570 | | 10-22-08 | Tier 1 | 6,000 | 5,991,005 |
| |
| | Interest | | Maturity | Quality | Par value | |
| Issuer | rate | | date | rating (A) | (000) | Value |
|
| Corporate Interest-Bearing Obligations 31.63% | | | | | $131,164,200 |
|
| (Cost $131,164,200) | | | | | | |
| | | | | | | |
| Asset Backed — Auto Loan 1.11% | | | | | | 4,615,674 |
|
| Capital Auto Receivables Asset Trust (S) | 3.386% | | 02-17-09 | Tier 1 | $405 | 404,612 |
|
| Ford Credit Auto Owner Trust | 2.766 | | 05-15-09 | Tier 1 | 628 | 628,203 |
|
| Honda Auto Receivables Owner Trust | 2.917 | | 07-20-09 | Tier 1 | 1,846 | 1,845,516 |
|
| Hyundai Auto Receivables Trust | 2.849 | | 07-15-09 | Tier 1 | 1,717 | 1,716,942 |
|
| Nissan Auto Receivables Owner Trust | 3.998 | | 01-15-09 | Tier 1 | 20 | 20,401 |
| | | | | | | |
| Banks — U.S. 5.38% | | | | | | 22,298,903 |
|
| Bank of America Corp. | 5.875 | | 02-15-09 | Tier 1 | 2,183 | 2,203,356 |
|
| Bank of America Corp. (P) | 2.810 | | 02-27-09 | Tier 1 | 1,500 | 1,498,560 |
|
| Fleet National Bank | 5.750 | | 01-15-09 | Tier 1 | 1,645 | 1,657,175 |
|
| Toronto Dominion Bank N.Y. | 6.150 | | 10-15-08 | Tier 1 | 2,000 | 2,002,561 |
|
| U.S. Bancorp. (P) | 3.739 | | 04-28-09 | Tier 1 | 6,100 | 6,094,054 |
|
| U.S. Bank N.A. | 5.700 | | 12-15-08 | Tier 1 | 6,805 | 6,839,394 |
|
| U.S. Bank N.A. | 3.400 | | 03-02-09 | Tier 1 | 2,000 | 2,003,803 |
| | | | | | | |
| Diversified Financial Services 4.67% | | | | | | 19,365,324 |
|
| General Electric Co. (P) | 2.854 | | 12-09-08 | Tier 1 | 5,962 | 5,963,469 |
|
| General Electric Capital Corp. (P) | 2.831 | | 01-05-09 | Tier 1 | 5,000 | 5,000,512 |
|
| General Electric Capital Corp. (P) | 2.859 | | 12-12-08 | Tier 1 | 1,000 | 1,000,081 |
|
| IBM InternationalGroup Capital (P) | 2.854 | | 02-13-09 | Tier 1 | 7,400 | 7,401,262 |
| | | | | | | |
| Finance — Auto Loans 3.87% | | | | | | 16,025,747 |
|
| American Honda Finance Corp. (S) | 4.500 | | 05-26-09 | Tier 1 | 2,000 | 2,018,191 |
|
| American Honda Finance Corp. (S) | 3.850 | | 11-06-08 | Tier 1 | 8,000 | 8,007,556 |
|
| Toyota Motor Credit Corp. (P) | 3.040 | | 06-19-09 | Tier 1 | 6,000 | 6,000,000 |
| | | | | | | |
| Finance — Consumer Loans 4.26% | | | | | | 17,679,438 |
|
| John Deere Capital Corp. | 4.875 | | 03-16-09 | Tier 1 | 13,860 | 13,978,612 |
|
| John Deere Capital Corp. (P) | 2.871 | | 12-12-08 | Tier 1 | 3,700 | 3,700,826 |
| Health Care Supplies 1.12% | | | | | | 4,650,310 |
|
| Procter & Gamble Co. (P) | 2.879 | | 02-19-09 | Tier 1 | 1,650 | 1,650,000 |
|
| Procter & Gamble Co. (P) (S) | 2.801 | | 07-06-09 | Tier 1 | 3,000 | 3,000,310 |
| | | | | | | |
| Investment Banking & Brokerage 2.75% | | | | | 11,392,503 |
|
| Goldman Sachs Group, Inc. | 3.875 | | 01-15-09 | Tier 1 | 3,315 | 3,318,199 |
|
| Goldman Sachs Group, Inc. | 6.650 | | 05-15-09 | Tier 1 | 4,000 | 4,075,726 |
|
| Goldman Sachs Group, Inc. (P) | 2.893 | | 11-10-08 | Tier 1 | 4,000 | 3,998,578 |
See notes to financial statements
| |
| 10 | Money Market Fund | Semiannual report |
F I N A N C I A L S T A T E M E N T S
| | | | | | |
| | Interest | | Maturity | Quality | Par value | |
| Issuer | rate | | date | rating (A) | (000) | Value |
| Machinery — Construction & Mining 3.81% | | | | | $15,816,775 |
|
| Caterpillar Financial Services Corp. | 5.000% | | 11-15-08 | Tier 1 | $2,000 | 2,004,554 |
|
| Caterpillar Financial Services Corp. | 4.350 | | 03-04-09 | Tier 1 | 3,675 | 3,696,897 |
|
| Caterpillar Financial Services Corp. | 3.450 | | 01-15-09 | Tier 1 | 1,865 | 1,866,251 |
|
| Caterpillar Financial Services Corp. (P) | 2.887 | | 03-10-09 | Tier 1 | 3,700 | 3,699,706 |
|
| Caterpillar Financial Services Corp. (P) | 2.864 | | 10-28-08 | Tier 1 | 3,000 | 3,000,267 |
|
| Caterpillar Financial Services Corp. (P) | 2.867 | | 05-18-09 | Tier 1 | 1,550 | 1,549,100 |
| | | | | | | |
| Pharmaceuticals 1.47% | | | | | | 6,083,627 |
|
| Pfizer, Inc. | 5.625 | | 04-15-09 | Tier 1 | 6,000 | 6,083,627 |
| | | | | | | |
| Retail 1.69% | | | | | | 7,000,000 |
|
| Wal-Mart Stores, Inc. | 3.375 | | 10-01-08 | Tier 1 | 7,000 | 7,000,000 |
| | | | | | | |
| Telecommunications 1.50% | | | | | | 6,235,899 |
|
| AT&T, Inc. (P) | 3.014 | | 11-14-08 | Tier 1 | 6,235 | 6,235,899 |
| |
| | Interest | | Maturity | Quality | Par value | |
| Issuer | rate | | date | rating (A) | (000) | Value |
|
| U.S. government obligations 10.90% | | | | | $45,201,034 |
| (Cost $45,201,034) | | | | | | |
| | | | | | | |
| U.S. Government Agency 10.90% | | | | | | 45,201,034 |
|
| Federal Home Loan Bank | 2.800% | | 02-06-09 | Tier 1 | $3,630 | 3,630,000 |
|
| Federal Home Loan Bank | 2.375 | | 04-07-09 | Tier 1 | 4,180 | 4,179,957 |
|
| Federal Home Loan Bank | 2.625 | | 04-30-09 | Tier 1 | 6,065 | 6,065,000 |
|
| Federal Home Loan Bank | Zero | | 10-02-08 | Tier 1 | 12,200 | 12,199,966 |
|
| Federal Home Loan Mortgage Corp. | 2.400 | | 04-02-09 | Tier 1 | 10,500 | 10,500,000 |
|
| Federal Home Loan Mortgage Corp. | 2.400 | | 04-07-09 | Tier 1 | 3,640 | 3,640,000 |
|
| Federal Home Loan Mortgage Corp. | Zero | | 11-10-08 | Tier 1 | 5,000 | 4,986,111 |
See notes to financial statements
| |
| Semiannual report | Money Market Fund | 11 |
F I N A N C I A L S T A T E M E N T S
| | |
| | Par value | |
| Issuer, description, maturity date | (000) | Value |
|
| Short-term investments 17.20% | | $71,333,000 |
| (Cost $71,333,000) | | |
| | | |
| Joint Repurchase Agreement 17.20% | | 71,333,000 |
|
| Joint Repurchase Agreemeent with Barclays Bank PLC | | |
| dated 9-30-08 at 0.10% to be repurchased at $71,333,198 on | | |
| 10-1-08, collateralized by $43,102,031 U.S. Treasury Inflation | | |
| Index Bond, 3.875%, due 4-14-29 (valued at $72,759,660, | | |
| including interest). | $71,333 | 71,333,000 |
| | | |
|
| Total investments (Cost $413,366,783)† 99.69% | | $413,366,783 |
|
|
| Other assets and liabilities, net 0.31% | | $1,268,450 |
|
|
| Total net assets 100.00% | | $414,635,233 |
|
The percentage shown for each investment category is the total value of that category as a percentage of the net assets of the Fund.
(A) Quality ratings are unaudited and indicate the categories of eligible securities, as defined by Rule 2a-7 or the Investment Company Act of 1940, owned by the Fund.
(P) Variable rate obligation. The coupon rate shown represents the rate at period end.
(S) These securities are exempt from registration under Rule 144A of the Securities Act of 1933. Such securities may be resold, normally to qualified institutional buyers, in transactions exempt from registration. Rule 144A securities amounted to $69,111,163 or 16.670% of the net assets of the Fund as of September 30, 2008.
† At September 30, 2008, the aggregate cost of investment securities for federal income tax purposes was $413,366,783.
See notes to financial statements
| |
| 12 | Money Market Fund | Semiannual report |
F I N A N C I A L S T A T E M E N T S
Financial statements
Statement of assets and liabilities 9-30-08 (unaudited)
This Statement of Assets and Liabilities is the Fund’s balance sheet. It shows the value of what the Fund owns, is due and owes. You’ll also find the net asset value per share.
| |
| Assets | |
|
| Investments at value (Cost $342,033,783) | $342,033,783 |
| Repurchase agreement, at value (Cost $71,333,000) | 71,333,000 |
| | |
| Total investments, at value (Cost $413,366,783) | 413,366,783 |
| Receivable for shares sold | 3,564,333 |
| Interest receivable | 1,351,320 |
| Receivable from affiliates | 75,597 |
| Other assets | 76,647 |
| | |
| Total assets | 418,434,680 |
|
| Liabilities | |
| Due to custodian | 23,702 |
| Payable for shares repurchased | 3,409,190 |
| Dividends payable | 8,556 |
| Payable to affiliates | |
| Management fees | 130,042 |
| Distribution and service fees | 97,040 |
| Other | 130,917 |
| | |
| Total liabilities | 3,799,447 |
| |
| Net assets | |
|
| Capital paid-in | 414,624,983 |
| Accumulated net realized loss on investments | (1,238) |
| Accumulated net investment income | 11,488 |
| | |
| Net assets | $414,635,233 |
| |
| Net asset value per share | |
|
| Based on net asset values and shares outstanding — the Fund has an | |
| unlimited number of shares authorized with no par value | |
| Class A ($337,226,643 ÷ 337,334,983 shares) | $1.00 |
| Class B ($35,411,484 ÷ 35,431,798 shares)1 | $1.00 |
| Class C ($41,997,106 ÷ 41,997,364 shares)1 | $1.00 |
1 Redemption price is equal to net asset value less any applicable contingent deferred sales charge.
See notes to financial statements
| |
| Semiannual report | Money Market Fund | 13 |
F I N A N C I A L S T A T E M E N T S
Statement of operations For the period ended 9-30-08 (unaudited)1
This Statement of Operations summarizes the Fund’s investment income earned and expenses incurred in operating the Fund. It also shows net gains (losses) for the period stated.
| |
| Investment income | |
|
| Interest | $4,834,550 |
| | |
| Total investment income | 4,834,550 |
| |
| Expenses | |
|
| Investment management fees (Note 3) | 901,086 |
| Distribution and service fees (Note 3) | 666,025 |
| Transfer agent fees (Note 3) | 307,150 |
| Accounting and legal services fees (Note 3) | 23,759 |
| Blue sky fees | 63,500 |
| Custodian fees | 42,090 |
| Printing fees | 24,156 |
| Professional fees | 20,730 |
| Trustees’ fees | 6,405 |
| Interest | 213 |
| Miscellaneous | 3,660 |
| | |
| Total expenses | 2,058,774 |
| Less expense reductions (Note 3) | (332,390) |
| | |
| Net expenses | 1,726,384 |
| | |
| Net investment income | 3,108,166 |
| | |
| Increase in net assets from operations | $3,108,166 |
1 Semiannual period from 4-1-08 to 9-30-08.
See notes to financial statements
| |
| 14 | Money Market Fund | Semiannual report |
F I N A N C I A L S T A T E M E N T S
Statements of changes in net assets
These Statements of Changes in Net Assets show how the value of the Fund’s net assets has changed during the last two periods. The difference reflects earnings less expenses, any investment gains and losses, distributions, if any, paid to shareholders and the net of Fund share transactions.
| | |
| | Year | Period |
| | ended | ended |
| | 3-31-08 | 9-30-081 |
|
| Increase (decrease) in net assets | | |
|
| From operations | | |
| Net investment income | $11,424,632 | $3,108,166 |
| | | |
| Increase in net assets resulting from operations | 11,424,632 | 3,108,166 |
| Distributions to shareholders | | |
| From net investment income | | |
| Class A | (9,930,919) | (2,820,113) |
| Class B | (996,894) | (162,323) |
| Class C | (496,819) | (125,730) |
| | (11,424,632) | (3,108,166) |
| From Fund share transactions (Note 4) | 152,072,048 | 31,803,109 |
| | | |
| Total increase | 152,072,048 | 31,803,109 |
| |
| Net assets | | |
|
| Beginning of period | 230,760,076 | 382,832,124 |
| | |
| End of period2 | $382,832,124 | $414,635,233 |
1 Semiannual period from 4-1-08 to 9-30-08. Unaudited.
2 Includes accumulated net investment income of $11,488 and $11,488, respectively.
See notes to financial statements
| |
| Semiannual report | Money Market Fund | 15 |
F I N A N C I A L S T A T E M E N T S
Financial highlights
The Financial Highlights show how the Fund’s net asset value for a share has changed since the end of the previous period.
CLASS A SHARES
| | | | | | |
| Period ended | 3-31-041 | 3-31-051 | 3-31-06 | 3-31-07 | 3-31-08 | 9-30-082 |
|
| Per share operating performance | | | | | | |
|
| Net asset value, beginning of period | $1.00 | $1.00 | $1.00 | $1.00 | $1.00 | $1.00 |
| Net investment income3 | —4 | 0.01 | 0.03 | 0.04 | 0.04 | 0.01 |
| | | | | | | |
| Less distributions | | | | | | |
| From net investment income | —4 | (0.01) | (0.03) | (0.04) | (0.04) | (0.01) |
| | | | | | | |
| Net asset value, end of period | $1.00 | $1.00 | $1.00 | $1.00 | $1.00 | $1.00 |
| Total return (%)5,6 | 0.21 | 0.86 | 2.92 | 4.45 | 4.24 | 0.947 |
| |
| Ratios and supplemental data | | | | | | |
|
| Net assets, end of period | | | | | | |
| (in millions) | $211 | $224 | $185 | $195 | $317 | $337 |
| Ratios (as a percentage of average | | | | | | |
| net assets): | | | | | | |
| Expenses before reductions | 1.14 | 1.09 | 1.11 | 1.09 | 1.01 | 1.028 |
| Expenses net of all fee waivers | 0.94 | 0.88 | 0.91 | 0.88 | 0.81 | 0.828 |
| Expenses net of all fee waivers | | | | | | |
| and credits | 0.94 | 0.88 | 0.91 | 0.88 | 0.81 | 0.828 |
| Net investment income | 0.21 | 0.83 | 2.85 | 4.37 | 4.08 | 1.868 |
1 Audited by previous Independent Registered Public Accounting Firm.
2 Semiannual period from 4-1-08 to 9-30-08. Unaudited.
3 Based on the average of the shares outstanding.
4 Less than $0.01 per share.
5 Assumes dividend reinvestment and does not reflect the effect of sales charges.
6 Total returns would have been lower had certain expenses not been reduced during the periods shown.
7 Not annualized.
8 Annualized.
See notes to financial statements
| |
| 16 | Money Market Fund | Semiannual report |
F I N A N C I A L S T A T E M E N T S
Financial highlights
CLASS B SHARES
| | | | | | |
| Period ended | 3-31-041 | 3-31-051 | 3-31-06 | 3-31-07 | 3-31-08 | 9-30-082 |
|
| Per share operating performance | | | | | | |
|
| Net asset value, beginning of period | $1.00 | $1.00 | $1.00 | $1.00 | $1.00 | $1.00 |
| Net investment income3 | —4 | —4 | 0.02 | 0.04 | 0.03 | 0.01 |
| | | | | | | |
| Less distributions | | | | | | |
| From net investment income | —4 | —4 | (0.02) | (0.04) | (0.03) | (0.01) |
| | | | | | | |
| Net asset value, end of period | $1.00 | $1.00 | $1.00 | $1.00 | $1.00 | $1.00 |
| Total return (%)5,6 | 0.12 | 0.50 | 2.05 | 3.57 | 3.36 | 0.517 |
| |
| Ratios and supplemental data | | | | | | |
|
| Net assets, end of period | | | | | | |
| (in millions) | $89 | $63 | $36 | $28 | $34 | $35 |
| Ratios (as a percentage of average | | | | | | |
| net assets): | | | | | | |
| Expenses before reductions | 1.89 | 1.85 | 1.86 | 1.83 | 1.77 | 1.778 |
| Expenses net of all fee waivers | 1.04 | 1.20 | 1.76 | 1.73 | 1.67 | 1.678 |
| Expenses net of all fee waivers | | | | | | |
| and credits | 1.04 | 1.20 | 1.76 | 1.73 | 1.66 | 1.678 |
| Net investment income | 0.12 | 0.46 | 1.94 | 3.52 | 3.29 | 1.018 |
1 Audited by previous Independent Registered Public Accounting Firm.
2 Semiannual period from 4-1-08 to 9-30-08. Unaudited.
3 Based on the average of the shares outstanding.
4 Less than $0.01 per share.
5 Assumes dividend reinvestment and does not reflect the effect of sales charges.
6 Total returns would have been lower had certain expenses not been reduced during the periods shown.
7 Not annualized.
8 Annualized.
See notes to financial statements
| |
| Semiannual report | Money Market Fund | 17 |
F I N A N C I A L S T A T E M E N T S
Financial highlights
CLASS C SHARES
| | | | | | |
| Period ended | 3-31-041 | 3-31-051 | 3-31-06 | 3-31-07 | 3-31-08 | 9-30-082 |
|
| Per share operating performance | | | | | | |
|
| Net asset value, beginning of period | $1.00 | $1.00 | $1.00 | $1.00 | $1.00 | $1.00 |
| Net investment income4 | —3 | —3 | 0.02 | 0.04 | 0.03 | 0.01 |
| | | | | | | |
| Less distributions | | | | | | |
| From net investment income | —3 | —3 | (0.02) | (0.04) | (0.03) | (0.01) |
| | | | | | | |
| Net asset value, end of period | $1.00 | $1.00 | $1.00 | $1.00 | $1.00 | $1.00 |
| Total return (%)5,6 | 0.12 | 0.50 | 2.04 | 3.57 | 3.35 | 0.517 |
| |
| Ratios and supplemental data | | | | | | |
|
| Net assets, end of period | | | | | | |
| (in millions) | $12 | $13 | $4 | $8 | $31 | $42 |
| Ratios (as a percentage of average | | | | | | |
| net assets): | | | | | | |
| Expenses before reductions | 1.89 | 1.84 | 1.85 | 1.83 | 1.76 | 1.778 |
| Expenses net of all fee waivers | 1.04 | 1.19 | 1.75 | 1.73 | 1.66 | 1.678 |
| Expenses net of all fee waivers | | | | | | |
| and credits | 1.04 | 1.19 | 1.75 | 1.73 | 1.66 | 1.678 |
| Net investment income | 0.12 | 0.46 | 1.86 | 3.54 | 3.10 | 0.998 |
1 Audited by previous Independent Registered Public Accounting Firm.
2 Semiannual period from 4-1-08 to 9-30-08. Unaudited.
3 Less than $0.01 per share.
4 Based on the average of the shares outstanding.
5 Assumes dividend reinvestment and does not reflect the effect of sales charges.
6 Total returns would have been lower had certain expenses not been reduced during the periods shown.
7 Not annualized.
8 Annualized.
See notes to financial statements
| |
| 18 | Money Market Fund | Semiannual report |
Notes to financial statements (unaudited)
Note 1 Organization
John Hancock Money Market Fund (the Fund) is a diversified series of John Hancock Current Interest (the Trust), an open-end management investment company registered under the Investment Company Act of 1940, as amended (the 1940 Act). The investment objective of the Fund is to seek the maximum current income that is consistent with maintaining liquidity and preserving capital.
The Trustees have authorized the issuance of multiple classes of shares of the Fund, designated as Class A, Class B and Class C shares. The shares of each class represent an interest in the same portfolio of investments of the Fund and have equal rights as to voting, redemptions, dividends and liquidation, except that certain expenses, subject to the approval of the Trustees, may be applied differently to each class of shares in accordance with current regulations of the Securities and Exchange Commission (SEC) and the Internal Revenue Service. Shareholders of a class that bears distribution and service expenses under the terms of a distribution plan have exclusive voting rights to that distribution plan. Class B shares will convert to Class A shares eight years after purchase.
Note 2
Significant accounting policies
The financial statements have been prepared in conformity with accounting principles generally accepted in the United States of America, which require management to make certain estimates and assumptions at the date of the financial statements. Actual results could differ from those estimates. The following summarizes the significant accounting policies of the Fund:
Security valuation
Securities in the Fund’s portfolio are valued at amortized cost, in accordance with Rule 2a-7 of the 1940 Act, as amended, which approximates market value. The amortized cost method involves valuing a security at its cost on the date of purchase and thereafter assuming a constant amortization to maturity of the difference between the principal amount due at maturity and the cost of the security to the Fund. Interest income on certain portfolio securities such as negotiable bank certificates of deposit and interest-bearing notes is accrued daily and included in interest receivable.
The Fund adopted Statement of Financial Accounting Standards No. 157 (FAS 157),
Fair Value Measurements, effective with the beginning of the Fund’s fiscal year. FAS 157 established a three-tier hierarchy to prioritize the assumptions, referred to as inputs, used in valuation techniques to measure fair value. The three-tier hierarchy of inputs is summarized in the three broad levels listed below:
Level 1 — Quoted prices in active markets for identical securities.
Level 2 — Prices determined using other significant observable inputs. Observable inputs are inputs that other market participants would use in pricing a security. These may include quoted prices for similar securities, interest rates, prepayment speeds, credit risk and others.
Level 3 — Prices determined using significant unobservable inputs. In situations where quoted prices or observable inputs are unavailable, such as when there is little or no market activity for an investment, unobservable inputs may be used. Unobservable inputs reflect the Fund’s own assumptions about the factors that market participants would use in pricing an investment and would be based on the best information available.
The inputs or methodology used for valuing securities are not necessarily an indication of the risk associated with investing in those securities.
| |
| Semiannual report | Money Market Fund | 19 |
The following is a summary of the inputs used to value the Fund’s net assets as of September 30, 2008:
| | |
| | INVESTMENTS IN | OTHER FINANCIAL |
| VALUATION INPUTS | SECURITIES | INSTRUMENTS* |
|
| Level 1 — Quoted Prices | $— | $— |
|
| Level 2 — Other Significant Observable Inputs | 413,366,783 | — |
|
| Level 3 — Significant Unobservable Inputs | — | — |
| Total | $413,366,783 | $— |
| | | |
| *Other financial instruments are derivative instruments not reflected in the Portfolio of Investments, |
| such as futures, forwards and swap contracts, which are valued at the unrealized appreciation/ |
| depreciation on the instrument. | | |
Joint repurchase agreement
Pursuant to an exemptive order issued by the SEC, the Fund, along with other registered investment companies having a management contract with John Hancock Advisers, LLC (the Adviser), a wholly owned subsidiary of John Hancock Financial Services, Inc., a subsidiary of Manulife Financial Corporation (MFC), may participate in a joint repurchase agreement transaction. Aggregate cash balances are invested in one or more large repurchase agreements, whose underlying securities are obligations of the U.S. government and/or its agencies. The Fund’s custodian bank receives delivery of the underlying securities for the joint account on the Fund’s behalf. When a Fund enters into a repurchase agreement, it receives delivery of collateral, the amount of which at the time of purchase and each subsequent business day is required to be maintained at such a level that the value is generally 102% of the repurchase amount.
Investment transactions
Investment transactions are accounted for on a trade date plus one basis for daily net asset value calculations. However, for financial reporting purposes, investment security transactions are reported on trade date. Interest income is recorded on the accrual basis. Dividend income is recorded on the ex-dividend date net of foreign withholding taxes. Discounts/premiums are accreted/amortized for financial reporting purposes. Realized gains and losses from investment transactions are recorded on an identified cost basis.
Class allocations
Income, common expenses and realized and unrealized gains (losses) are determined at the fund level and allocated daily to each class of shares based on the appropriate net asset value of the respective classes. Distribution and service fees, if any, and transfer agent fees for Class A, Class B and Class C shares are calculated daily at the class level based on the appropriate net asset value of each class and the specific expense rate(s) applicable to each class.
Guarantees and indemnifications
Under the Fund’s organizational documents, its Officers and Trustees are indemnified against certain liability arising out of the performance of their duties to the Fund. Additionally, in the normal course of business, the Fund enters into contracts with service providers that contain general indemnification clauses. The Fund’s maximum exposure under these arrangements is unknown, as this would involve future claims that may be made against the Fund that have not yet occurred.
Expenses
The majority of expenses are directly identifiable to an individual fund. Trust expenses that are not readily identifiable to a specific fund are allocated in such a manner as deemed equitable, taking into consideration, among other things, the nature and type of expense and the relative size of the funds.
Federal income taxes
The Fund qualifies as a regulated investment company by complying with the applicable provisions of the Internal Revenue Code and will not be subject to federal income tax on taxable income that is distributed to shareholders. Therefore, no federal income tax provision is required. For federal income tax purposes, the Fund has $1,238 of a capital loss carryforward available, to the extent provided
| |
| 20 | Money Market Fund | Semiannual report |
by regulations, to offset future net realized capital gains. To the extent that such carryforward is used by the Fund, no capital gain distributions will be made. The loss carryforwards expire as follows: March 31, 2012 — $1,191, March 31, 2015 — $47.
The Fund has adopted the provisions of Financial Accounting Standards Board (FASB) Interpretation No. 48, Accounting for Uncertainty in Income Taxes, an interpretation of FASB Statement 109 (FIN 48), at the beginning of the Fund’s fiscal year. FIN 48 prescribes a minimum threshold for financial statement recognition of the benefit of a tax position taken or expected to be taken in a tax return. The implementation of FIN 48 did not have a material impact on the Fund’s financial statements. Each of the Fund’s federal tax returns for the prior three fiscal years remain subject to examination by the Internal Revenue Service.
Distribution of income and gains
The Fund records distributions to shareholders from net investment income and net realized gains, if any, on the ex-dividend date. The Fund’s net investment income is declared daily as dividends to shareholders of record as of the close of business on the preceding day, and distributed monthly. During the year ended March 31, 2008, the tax character of distributions paid was as follows: ordinary income $11,424,632. Distributions paid by the Fund with respect to each class of shares are calculated in the same manner, at the same time and are in the same amount, except for the effect of expenses that may be applied differently to each class.
Such distributions, on a tax basis, are determined in conformity with income tax regulations, which may differ from accounting principles generally accepted in the United States of America. Distributions in excess of tax basis earnings and profits, if any, are reported in the Fund’s financial statements as a return of capital.
Note 3
Risks and uncertainties
Fixed income risk
Fixed income securities are subject to credit and interest rate risk and involve some risk of in connection with principal and interest payments.
Concentration risk
The Funds may concentrate investments in a particular industry, sector of the economy or invest in a limited number of companies. Accordingly, the concentration may make the Fund’s value more volatile and investment values may rise and fall more rapidly. In addition, a fund with a concentration is particularly susceptible to the impact of market, economic, regulatory and other factors affecting the specific concentration.
Note 4
Management fee and transactions
with affiliates and others
The Fund has an investment management contract with the Adviser. Under the investment management contract, the Fund pays a monthly management fee to the Adviser equivalent, on an annual basis, to the sum of: (a) 0.50% of the first $500,000,000 of the Fund’s average daily net asset value, (b) 0.425% of the next $250,000,000, (c) 0.375% of the next $250,000,000, (d) 0.35% of the next $500,000,000, (e) 0.325% of the next $500,000,000, (f) 0.30% of the next $500,000,000 and (g) 0.275% of the Fund’s average daily net asset value in excess of $2,500,000,000. The Adviser has a subadvisory agreement with MFC Global Investment Management (U.S.), LLC, a subsidiary of John Hancock Financial Services, Inc. The Fund is not responsible for payment of subadvisory fees.
The Adviser has agreed to limit the Fund’s management fee to 0.40% of the Fund’s average daily net asset value, at least until July 31, 2009. Accordingly, the expense reductions related to management fee limitations amounted to $180,217 for the period ended September 30, 2008. The effective rate of management fee was 0.40% of the Fund’s average daily net asset value for the period ended September 30, 2008.
| |
| Semiannual report | Money Market Fund | 21 |
The Fund has a Distribution Agreement with John Hancock Funds, LLC (JH Funds), a wholly owned subsidiary of the Adviser. The Fund has adopted Distribution Plans with respect to Class A, Class B and Class C, pursuant to Rule 12b-1 under the 1940 Act, to pay JH Funds for the services it provides as distributor of shares of the Fund. Accordingly, the Fund makes monthly payments to JH Funds at an annual rate not to exceed 0.25%, 1.00% and 1.00% of average daily net asset value of Class A, Class B and Class C, respectively. JH Funds has agreed to limit the distribution and service (12b-1) fee pursuant to Class A to 0.15% of the Class’s average net asset value, at least until July 31, 2009. Accordingly, the expense reductions related to reduction in the 12b-1 fee amounted to $151,486 for the period ended September 30, 2008. A maximum of 0.25% of such payments may be service fees, as defined by the Conduct Rules of the Financial Industry Regulatory Authority (formerly the National Association of Securities Dealers). Under the Conduct Rules, curtailment of a portion of the Fund’s 12b-1 payments could occur under certain circumstances.
Class B shares that are redeemed within six years of purchase are subject to a contingent deferred sales charge (CDSC) at declining rates, beginning at 5.00% of the lesser of the current market value at the time of redemption or the original purchase cost of the shares being redeemed. Class C shares that are redeemed within one year of purchase are subject to a CDSC at a rate of 1.00% of the lesser of the current market value at the time of redemption or the original purchase cost of the shares being redeemed. Proceeds from the CDSCs are paid to JH Funds and are used in whole or in part to defray its expenses for providing distribution-related services to the Fund in connection with the sale of Class B and Class C shares. During the period ended September 30, 2008, CDSCs received by JH Funds amounted to $67,070 for Class B shares and $9,413 for Class C shares.
The Fund has a transfer agent agreement with John Hancock Signature Services, Inc. (Signature Services), an indirect subsidiary of JHLICO. For Class A, Class B and Class C shares, the Fund pays a monthly transfer agent fee at an annual rate of 0.01% of each class’s average daily net asset value, plus a fee based on the number of shareholder accounts and reimbursement for certain out-of-pocket expenses, aggregated and allocated to each class on the basis of its relative net asset value. The Fund pays a monthly fee which is based on an annual rate of $17.50 for each shareholder account. There were no transfer agent fee reductions during the period ended September 30, 2008.
The Fund receives earnings credits from its transfer agent as a result of uninvested cash balances. These credits are used to reduce a portion of the Fund’s transfer agent fees and out-of-pocket expenses. During the period ended September 30, 2008, the Fund’s transfer agent fees and out-of-pocket expenses were reduced by $687 for transfer agent credits earned.
Class level expenses for the period ended September 30, 2008 were as follows:
| | |
| | Transfer | Distribution |
| Share class | agent fees | and service fees |
|
| Class A | $258,107 | $378,715 |
| Class B | 27,512 | 160,227 |
| Class C | 21,531 | 127,083 |
| Total | $307,150 | $666,025 |
The Fund has an agreement with the Adviser and affiliates to perform necessary tax, accounting, compliance, legal and other administrative services for the Fund. The compensation for the period amounted to $23,759 with an effective rate of 0.01% of the Fund’s average daily net asset value.
Mr. James R. Boyle is Chairman of the Adviser, as well as affiliated Trustee of the Fund, and is compensated by the Adviser and/or its affiliates. The compensation of unaffiliated Trustees is borne by the Fund. The unaffiliated Trustees may elect to defer, for tax purposes, their receipt of this compensation under the John Hancock Group of Funds Deferred Compensation Plan. The Fund makes investments into other John Hancock funds, as applicable, to cover its liability for the deferred compensation. Investments to cover the Fund’s deferred compensation liability are recorded on the Fund’s books as an other asset. The deferred compensation liability and the related other asset are always equal and are
| |
| 22 | Money Market Fund | Semiannual report |
marked to market on a periodic basis to reflect any income earned by the investments, as well as any unrealized gains or losses. The Deferred Compensation Plan investments had no impact on the operations of the Fund.
Note 5
Fund share transactions
This listing illustrates the number of Fund shares sold, reinvested and repurchased during the year ended March 31, 2008, and the period ended September 30, 2008, along with the corresponding dollar value.
| | | | |
| | Year ended 3-31-08 | Period ended 9-30-081 |
| | Shares | Amount | Shares | Amount |
| Class A shares | | | | |
|
| Sold | 288,363,612 | $288,363,615 | 188,266,848 | $188,266,848 |
| Issued in reorganization | 33,151,672 | 33,125,522 | — | — |
| Distributions reinvested | 9,179,922 | 9,179,922 | 2,620,031 | 2,620,031 |
| Repurchased | (208,260,620) | (208,260,620) | (170,808,475) | (170,808,475) |
| Net increase | 122,434,586 | $122,408,439 | 20,078,404 | $20,078,404 |
| |
| Class B shares | | | | |
|
| Sold | 36,262,653 | $36,262,653 | 16,150,271 | $16,150,271 |
| Distributions reinvested | 916,832 | 916,832 | 146,993 | 146,993 |
| Repurchased | (30,778,622) | (30,778,625) | (15,309,808) | (15,309,810) |
| Net increase | 6,400,863 | $6,400,860 | 987,456 | $987,454 |
| |
| Class C shares | | | | |
|
| Sold | 54,878,312 | $54,878,312 | 41,412,773 | $41,412,773 |
| Distributions reinvested | 442,171 | 442,171 | 108,654 | 108,654 |
| Repurchased | (32,057,733) | (32,057,734) | (30,784,177) | (30,784,176) |
| Net increase | 23,262,750 | $23,262,749 | 10,737,250 | $10,737,251 |
| |
| Net increase | 152,098,199 | $152,072,048 | 31,803,110 | $31,803,109 |
|
1Semiannual period from 4-1-08 to 9-30-08. Unaudited.
Note 6 Reorganization
On September 12, 2007, the shareholders of John Hancock U.S. Government Cash Reserve (Cash Reserve Fund) approved an Agreement and Plan of Reorganization, which provided for the transfer of substantially all of the assets and liabilities of the Cash Reserve Fund in exchange for Class A shares of the Fund. The acquisition was accounted for as a tax-free exchange of 33,151,672 Class A shares of the Fund for the net assets of the Cash Reserve Fund, which amounted to $33,125,522 for the shares of the Cash Reserve Fund after the close of business on September 14, 2007.
Note 7
U.S. Department of Treasury
temporary guarantee program for
money market funds
The Trustees have approved the participation of the Fund in the U.S. Department of Treasury (the “Treasury”) Temporary Guarantee Program for Money Market Funds (the “Program”), under which the Treasury will guarantee that shareholders of the Fund will receive $1.00 for each share of the Fund held by them as of the close of business on September 19, 2008, in the event that the Fund liquidates and the per share value at the time of liquidation is less than $1.00 (a “Guarantee Event”).
| |
| Semiannual report | Money Market Fund | 23 |
Recovery under the Program is subject to certain conditions and limitations, including the following:
• For investors who held shares of the Fund on September 19, 2008, the Program provides a guarantee for the lesser of: (a) the number of shares owned by the shareholder at the close of September 19 2008; or (b) the number of shares owned by the shareholder on the date of a Guarantee Event.
• The guarantee is not available to investors who were not Fund shareholders on September 19, 2008. In addition, this guarantee is not available to investors who were Fund shareholders on September 19, 2008 but who sold all their Fund shares prior to the date of a Guarantee Event.
• The total amount of coverage available for all participants in the Program is limited to the amount of funds available under the Federal Exchange Stabilization Fund at the time of a Guarantee Event (currently approximately $50 billion).
• In order to recover, a Guarantee Event must occur during the term of the Program. Recovery under the Program requires the Fund to liquidate.
The Program will be in effect until December 18, 2008. Participation in the Program requires a payment to the U.S. Treasury in the amount of 0.01% of the net asset value of the Fund as of September 19, 2008. The Secretary of the Treasury may extend the Program beyond its initial three-month term through the close of business on September 19, 2009. If the Program is extended, the Trustees will consider whether the Fund should continue to participate in the Program. Participation in any extension of the Program will require payment of an additional fee, although there can be no assurance that the Fund will elect to participate, or be eligible to participate, in any extension of the Program. The cost of participating in the Program and any extension will be borne by the Fund, and will not be subject to any expense limitation or reimbursement agreement.
| |
| 24 | Money Market Fund | Semiannual report |
Board Consideration of and
Continuation of Investment Advisory
Agreement and Subadvisory
Agreement: John Hancock
Money Market Fund
The Investment Company Act of 1940 (the 1940 Act) requires the Board of Trustees (the Board) of John Hancock Current Interest (the Trust), including a majority of the Trustees who have no direct or indirect interest in the investment advisory agreement and are not “interested persons” of the Trust, as defined in the 1940 Act (the Independent Trustees), annually to meet in person to review and consider the continuation of: (i) the investment advisory agreement (the Advisory Agreement) with John Hancock Advisers, LLC (the Adviser) and (ii) the investment subadvisory agreement (the Subadvisory Agreement) with MFC Global Investment Management (U.S.), LLC (the Subadviser) for the John Hancock Money Market Fund (the Fund). The Advisory Agreement and the Subadvisory Agreement are collectively referred to as the Advisory Agreements.
At meetings held on May 5–6 and June 9–10, 2008, the Board considered the factors and reached the conclusions described below relating to the selection of the Adviser and Subadviser and the continuation of the Advisory Agreements. During such meetings, the Board’s Contracts/Operations Committee and the Independent Trustees also met in executive sessions with their independent legal counsel.
In evaluating the Advisory Agreements, the Board, including the Contracts/Operations Committee and its Independent Trustees, reviewed a broad range of information requested for this purpose. This information included:
(i) the investment performance of the Fund relative to a category of relevant funds (the Category) and a peer group of comparable funds (the Peer Group). The funds within each Category and Peer Group were selected by Morningstar Inc. (Morningstar), an independent provider of investment company data. Data covered a range of periods ended December 31, 2007,
(ii) advisory and other fees incurred by, and the expense ratios of, the Fund relative to a Category and a Peer Group,
(iii) the advisory fees of comparable portfolios of other clients of the Adviser and the Subadviser,
(iv) the Adviser’s financial results and condition, including its and certain of its affiliates’ profitability from services performed for the Fund,
(v) breakpoints in the Fund’s and the Peer Group’s fees, and information about economies of scale,
(vi) the Adviser’s and Subadviser’s record of compliance with applicable laws and regulations, with the Fund’s investment policies and restrictions, and with the applicable Code of Ethics, and the structure and responsibilities of the Adviser’s and Subadviser’s compliance department,
(vii) the background and experience of senior management and investment professionals, and
(viii) the nature, cost and character of advisory and non-investment management services provided by the Adviser and its affiliates and by the Subadviser.
The Independent Trustees considered the legal advice of independent legal counsel and relied on their own business judgment in determining the factors to be considered in evaluating the materials that were presented to them and the weight to be given to each such factor. The Board’s review and conclusions were based on a comprehensive consideration of all information presented to the Board and not the result of any single controlling factor. The Board principally considered data on performance and other information provided by Morningstar as of December 31, 2007. The Board also considered updated performance information provided to it by the Adviser or Subadviser at its May and June 2008 meetings. Performance and other information may be quite different as of the date of this shareholders report. The key factors considered by the Board and the conclusions reached are described below.
| |
| Semiannual report | Money Market Fund | 25 |
Nature, extent and quality of services
The Board considered the ability of the Adviser and the Subadviser, based on their resources, reputation and other attributes, to attract and retain qualified investment professionals, including research, advisory, and supervisory personnel. The Board considered the investment philosophy, research and investment decision-making processes of the Adviser and Subadviser. The Board considered the Adviser’s execution of its oversight responsibilities. The Board further considered the culture of compliance, resources dedicated to compliance, compliance programs and compliance records of the Adviser and Subadviser. In addition, the Board took into account the administrative and other non-advisory services provided to the Fund by the Adviser and its affiliates.
Based on the above factors, together with those referenced below, the Board concluded that, within the context of its full deliberations, the nature, extent and quality of the investment advisory services provided to the Fund by the Adviser and Subadviser supported renewal of the Advisory Agreements.
Fund performance
The Board considered the performance results for the Fund over various time periods ended December 31, 2007. The Board also considered these results in comparison to the performance of the Category, as well as the Fund’s Peer Group and benchmark index. The Board reviewed with representatives of Morningstar the methodology used by Morningstar to select the funds in the Category and the Peer Group.
The Board noted that the Fund’s performance during all periods under review was lower than its benchmark index, the US Treasury T-Bill Auction Ave. — 3 Month, as was the Peer Group and Category medians. The Board also noted that the Fund’s performance during all periods under review was generally in line with the Peer Group and Category medians.
Investment advisory fee and subadvisory fee
rates and expenses
The Board reviewed and considered the contractual investment advisory fee rate payable by the Fund to the Adviser for investment advisory services (the Advisory Agreement Rate). The Board received and considered information comparing the Advisory Agreement Rate with the advisory fees for the Peer Group and Category. The Board noted that the Advisory Agreement Rate was higher than the Category and Peer Group median rates. The Board favorably considered the impact of fee waivers towards ultimately lowering the Advisory Agreement Rate.
The Board received and considered expense information regarding the Fund’s various components, including advisory fees, distribution and fees other than advisory and distribution fees, including transfer agent fees, custodian fees, and other miscellaneous fees (e.g., fees for accounting and legal services). The Board considered comparisons of these expenses to the Peer Group median. The Board also received and considered expense information regarding the Fund’s total operating expense ratio (Gross Expense Ratio) and total operating expense ratio after taking the fee waiver arrangement applicable to the Advisory Agreement Rate into account (Net Expense Ratio). The Board received and considered information comparing the Gross Expense Ratio and Net Expense Ratio of the Fund to that of the Peer Group and Category medians. The Board noted that the Fund’s Gross and Net Expense Ratios were higher than the median of the Peer Group and Category. The Board also note d that the most significant contributor to the difference was the Fund’s transfer agency expense, and noted factors contributing to such transfer agency expense.
The Adviser also discussed the Morningstar data and rankings, and other relevant information, for the Fund. Based on the above-referenced considerations and other factors, the Board concluded that the Fund’s overall performance and expenses supported the re-approval of the Advisory Agreements.
The Board also received information about the investment subadvisory fee rate (the Subadvisory Agreement Rate) payable by the Adviser to the Subadviser for investment sub-advisory services. The Board concluded that the Subadvisory Agreement Rate was fair and equitable, based on its consideration of the factors described here.
| |
| 26 | Money Market Fund | Semiannual report |
Profitability
The Board received and considered a detailed profitability analysis of the Adviser based on the Advisory Agreements, as well as on other relationships between the Fund and the Adviser and its affiliates, including the Subadviser. The Board also considered a comparison of the Adviser’s profitability to that of other similar investment advisers whose profitability information is publicly available. The Board concluded that, in light of the costs of providing investment management and other services to the Fund, the profits and other ancillary benefits reported by the Adviser were not unreasonable.
Economies of scale
The Board received and considered general information regarding economies of scale with respect to the management of the Fund, including the Fund’s ability to appropriately benefit from economies of scale under the Fund’s fee structure. The Board recognized the inherent limitations of any analysis of economies of scale, stemming largely from the Board’s understanding that most of the Adviser’s costs are not specific to individual Funds, but rather are incurred across a variety of products and services.
To the extent the Board and the Adviser were able to identify actual or potential economies of scale from Fund-specific or allocated expenses, in order to ensure that any such economies continue to be reasonably shared with the Fund as its assets increase, the Adviser and the Board agreed to continue the existing breakpoints to the Advisory Agreement Rate.
Information about services to other clients
The Board also received information about the nature, extent and quality of services and fee rates offered by the Adviser and Subadviser to their other clients, including other registered investment companies, institutional investors and separate accounts. The Board concluded that the Advisory Agreement Rate and the Subadvisory Agreement Rate were not unreasonable, taking into account fee rates offered to others by the Adviser and Subadviser, respectively, after giving effect to differences in services.
Other benefits to the Adviser
The Board received information regarding potential “fall-out” or ancillary benefits received by the Adviser and its affiliates, including the Subadviser, as a result of their relationship with the Fund. Such benefits could include, among others, benefits directly attributable to the relationship of the Adviser and Subadviser with the Fund and benefits potentially derived from an increase in business as a result of their relationship with the Fund (such as the ability to market to shareholders other financial products offered by the Adviser and its affiliates).
The Board also considered the effectiveness of the Adviser’s, Subadviser’s and Fund’s policies and procedures for complying with the requirements of the federal securities laws, including those relating to best execution of portfolio transactions and brokerage allocation.
Other factors and broader review
As discussed above, the Board reviewed detailed materials received from the Adviser and Subadviser as part of the annual re-approval process. The Board also regularly reviews and assesses the quality of the services that the Fund receives throughout the year. In this regard, the Board reviews reports of the Adviser at least quarterly, which include, among other things, fund performance reports and compliance reports. In addition, the Board meets with portfolio managers and senior investment officers at various times throughout the year.
After considering the above-described factors and based on its deliberations and its evaluation of the information described above, the Board concluded that approval of the continuation of the Advisory Agreements for the Fund was in the best interest of the Fund and its shareholders. Accordingly, the Board unanimously approved the continuation of the Advisory Agreements.
| |
| Semiannual report | Money Market Fund | 27 |
More information
| |
| Trustees | Investment adviser |
| James F. Carlin, Chairman | John Hancock Advisers, LLC |
| James R. Boyle† | |
| William H. Cunningham | Subadviser |
| Deborah C. Jackson | MFC Global Investment |
| Charles L. Ladner* | Management (U.S.), LLC |
| Stanley Martin* | |
| Dr. John A. Moore* | Principal distributor |
| Patti McGill Peterson* | John Hancock Funds, LLC |
| Steven R. Pruchansky | |
| *Members of the Audit Committee | Custodian |
| †Non-Independent Trustee | The Bank of New York Mellon |
| |
| Officers | Transfer agent |
| Keith F. Hartstein | John Hancock Signature Services, Inc. |
| President and Chief Executive Officer | |
| | Legal counsel |
| Thomas M. Kinzler | K&L Gates LLP |
| Secretary and Chief Legal Officer | |
| | |
| Francis V. Knox, Jr. | |
| Chief Compliance Officer | |
| | |
| Charles A. Rizzo | |
| Chief Financial Officer | |
| | |
| Gordon M. Shone | |
| Treasurer | |
| | |
| John G. Vrysen | |
| Chief Operating Officer | |
Additional information about your fund is available without charge in several ways. As required by the SEC, you can access proxy voting information and quarterly portfolio information on your fund. The proxy voting information includes a description of proxy voting policies, procedures and information regarding how the fund voted proxies relating to portfolio securities during the most recent twelve-month period ended June 30. The quarterly portfolio information that includes a complete list of the fund’s holdings for the first and third quarters of the fund’s fiscal period is filed on Form N-Q. You have access to this information:
| | | |
| By phone | On the fund’s Website | At the SEC |
| 1-800-225-5291 | www.jhfunds.com | www.sec.gov |
| | | | 1-800-SEC-0330 |
| | | | SEC Public Reference Room |
|
|
| You can also contact us: | | | |
| | | | |
| Regular mail | | Express mail | |
| John Hancock Signature Services, Inc. | John Hancock Signature Services, Inc. |
| P.O. Box 9510 | | Mutual Fund Image Operations |
| Portsmouth, NH 03802-9510 | | 164 Corporate Drive | |
| | | Portsmouth, NH 03801 | |
Month-end portfolio holdings are available at www.jhfunds.com.
| |
| 28 | Money Market Fund | Semiannual report |

1-800-225-5291
1-800-554-6713 TDD
1-800-338-8080 EASI-Line
www.jhfunds.com
Now available: electronic delivery
www.jhfunds.com/edelivery
| |
| | 440SA 9/08 |
| This report is for the information of the shareholders of John Hancock Money Market Fund. | 11/08 |
| It is not authorized for distribution to prospective investors unless preceded or accompanied by a prospectus. | |
ITEM 2. CODE OF ETHICS.
Not applicable at this time.
ITEM 3. AUDIT COMMITTEE FINANCIAL EXPERT.
Not applicable at this time.
ITEM 4. PRINCIPAL ACCOUNTANT FEES AND SERVICES.
Not applicable at this time.
ITEM 5. AUDIT COMMITTEE OF LISTED REGISTRANTS.
Not applicable at this time.
ITEM 6. SCHEDULE OF INVESTMENTS.
Not applicable.
ITEM 7. DISCLOSURE OF PROXY VOTING POLICIES AND PROCEDURES FOR CLOSED-END MANAGEMENT INVESTMENT COMPANIES.
Not applicable.
ITEM 8. PORTFOLIO MANAGERS OF CLOSED-END MANAGEMENT INVESTMENT COMPANIES.
Not applicable.
ITEM 9. PURCHASES OF EQUITY SECURITIES BY CLOSED-END MANAGEMENT INVESTMENT COMPANY AND AFFILIATED PURCHASERS.
Not applicable.
ITEM 10. SUBMISSION OF MATTERS TO A VOTE OF SECURITY HOLDERS.
The registrant has adopted procedures by which shareholders may recommend nominees to the registrant's Board of Trustees. A copy of the procedures is filed as an exhibit to this Form N-CSR. See attached "John Hancock Funds - Governance Committee Charter”.
ITEM 11. CONTROLS AND PROCEDURES.
(a) Based upon their evaluation of the registrant's disclosure controls and procedures as conducted within 90 days of the filing date of this Form N-CSR, the registrant's principal executive officer and principal financial officer have concluded that those disclosure controls and procedures provide reasonable assurance that the material information required to be disclosed by the registrant on this report is recorded, processed, summarized and reported within the time periods specified in the Securities and Exchange Commission's rules and forms.
(b) There were no changes in the registrant's internal control over financial reporting that occurred during the registrant's most recent fiscal half-year (the registrant's second fiscal half-year in the case of an annual report) that have materially affected, or are reasonably likely to materially affect, the registrant's internal control over financial reporting.
ITEM 12. EXHIBITS.
(a)(1) Separate certifications for the registrant's principal executive officer and principal financial officer, as required by Section 302 of the Sarbanes-Oxley Act of 2002 and Rule 30a-2(a) under the Investment Company Act of 1940, are attached.
(b)(1) Separate certifications for the registrant's principal executive officer and principal financial officer, as required by 18 U.S.C. Section 1350, as adopted pursuant to Section 906 of the Sarbanes-Oxley Act of 2002, and Rule 30a-2(b) under the Investment Company Act of 1940, are attached. The certifications furnished pursuant to this paragraph are not deemed to be "filed" for purposes of Section 18 of the Securities Exchange Act of 1934, or otherwise subject to the liability of that section. Such certifications are not deemed to be incorporated by reference into any filing under the Securities Act of 1933 or the Securities Exchange Act of 1934, except to the extent that the Registrant specifically incorporates them by reference.
(c)(1) Submission of Matters to a Vote of Security Holders is attached. See attached "John Hancock Funds - Governance Committee Charter”.
(c)(2) Contact person at the registrant.
Pursuant to the requirements of the Securities Exchange Act of 1934 and the Investment Company Act of 1940, the registrant has duly caused this report to be signed on its behalf by the undersigned, thereunto duly authorized.
John Hancock Current Interest
By: /s/ Keith F. Hartstein
-------------------------------------
Keith F. Hartstein
President and Chief Executive Officer
Date: November 24, 2008
Pursuant to the requirements of the Securities Exchange Act of 1934 and the Investment Company Act of 1940, this report has been signed below by the following persons on behalf of the registrant and in the capacities and on the dates indicated.
By: /s/ Keith F. Hartstein
-------------------------------------
Keith F. Hartstein
President and Chief Executive Officer
Date: November 24, 2008
By: /s/ Charles A. Rizzo
-------------------------------------
Charles A. Rizzo
Chief Financial Officer
Date: November 24, 2008