| |
| UNITED STATES |
| SECURITIES AND EXCHANGE COMMISSION |
| Washington, D.C. 20549 |
| |
| FORM N-CSR |
| |
| CERTIFIED SHAREHOLDER REPORT OF REGISTERED |
| MANAGEMENT INVESTMENT COMPANIES |
|
| Investment Company Act file number 811- 2485 |
|
| John Hancock Current Interest |
| (Exact name of registrant as specified in charter) |
|
| 601 Congress Street, Boston, Massachusetts 02210 |
|
| (Address of principal executive offices) (Zip code) |
|
| Michael J. Leary |
| Treasurer |
|
| 601 Congress Street |
|
| Boston, Massachusetts 02210 |
|
| (Name and address of agent for service) |
| |
| Registrant's telephone number, including area code: 617-663-4490 |
| |
| Date of fiscal year end: | March 31 |
| |
| |
| Date of reporting period: | March 31, 2009 |
ITEM 1. REPORT TO SHAREHOLDERS.

Discussion of Fund performance
By MFC Global Investment Management (U.S.), LLC
Money market yields continued to decline in an extremely volatile 12-month period ended March 31, 2009. In response to a severe tightening of credit conditions, the Federal Reserve Board kept on lowering its federal funds rate that banks charge each other for overnight loans, from 2.0% to a floating range of 0% to 0.25%. As the period progressed, financials institutions came under increasing pressure due to the toxic assets held on their books and illiquidity in the market. Money market funds were not immune to the collapse of the financial markets, which caused an extreme liquidity crunch and a freeze-up of inter-bank lending. As a result, London Inter-bank Offered Rate (LIBOR), from which many money market securities are priced, rose to historic levels — from an already elevated 2.68% to more than 4%. The combination of extremely elevated LIBOR rates with wide spreads, and the uncertain future prospects of the economy, made for an ex tremely difficult trading environment in money markets.
“Money market yields continued
to decline in an extremely
volatile 12-month period ended
March 31, 2009.”
On March 31, 2009, John Hancock Money Market Fund’s Class A shares had a 7-day effective yield of 0.09%. By comparison, the average taxable money market fund had a 7-day effective yield of 0.25%, according to Lipper, Inc. For the year ended March 31, 2009, the Fund’s Class A shares posted a total return of 1.16%, compared with the 1.36% return of the average taxable money market fund, according to Lipper, Inc.
The Fund benefited from reducing its exposure to asset-backed commercial paper (ABCP) products, as well as financials, when the liquidity crunch hit the market. We replaced ABCP with floating rate securities to take advantage of the elevated LIBOR curve and increase the yield in the Fund. We also took a very conservative stance in anticipation of the market’s distress. Our dedication to strict standards of creditworthiness also served us well.
This commentary reflects the views of the portfolio management team through the end of the Fund’s period discussed in this report. The team’s statements reflect its own opinions. As such, they are in no way guarantees of future events and are not intended to be used as investment advice or a recommendation regarding any specific security. They are also subject to change at any time as market and other conditions warrant.
Past performance is no guarantee of future results.
| |
| 6 | Money Market Fund | Annual report |
Your expenses
These examples are intended to help you understand your ongoing operating expenses.
Understanding fund expenses
As a shareholder of the Fund, you incur two types of costs:
■ Transaction costs which include sales charges (loads) on purchases or redemptions (varies by share class), minimum account fee charge, etc.
■ Ongoing operating expenses including management fees, distribution and service fees (if applicable), and other fund expenses.
We are going to present only your ongoing operating expenses here.
Actual expenses/actual returns
This example is intended to provide information about your fund’s actual ongoing operating expenses, and is based on your fund’s actual return. It assumes an account value of $1,000.00 on October 1, 2008 with the same investment held until March 31, 2009.
| | | |
| | Account value | Ending value | Expenses paid during |
| | on 10-1-08 | on 3-31-09 | period ended 3-31-091 |
|
| Class A | $1,000.00 | $1,002.20 | $4.74 |
|
| Class B | 1,000.00 | 1,000.50 | 6.38 |
|
| Class C | 1,000.00 | 1,000.50 | 6.53 |
|
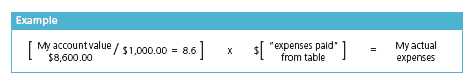
Together with the value of your account, you may use this information to estimate the operating expenses that you paid over the period. Simply divide your account value at March 31, 2009, by $1,000.00, then multiply it by the “expenses paid” for your share class from the table above. For example, for an account value of $8,600.00, the operating expenses should be calculated as follows:
| |
| Annual report | Money Market Fund | 7 |
Your expenses
Hypothetical example for comparison purposes
This table allows you to compare your fund’s ongoing operating expenses with those of any other fund. It provides an example of the Fund’s hypothetical account values and hypothetical expenses based on each class’s actual expense ratio and an assumed 5% annualized return before expenses (which is not your fund’s actual return). It assumes an account value of $1,000.00 on October 1, 2008, with the same investment held until March 31, 2009. Look in any other fund shareholder report to find its hypothetical example and you will be able to compare these expenses.
| | | |
| | Account value | Ending value | Expenses paid during |
| | on 10-1-08 | on 3-31-09 | period ended 3-31-091 |
|
| Class A | $1,000.00 | $1,020.10 | $4.78 |
|
| Class B | 1,000.00 | 1,018.50 | 6.44 |
|
| Class C | 1,000.00 | 1,018.40 | 6.59 |
|
Remember, these examples do not include any transaction costs, such as sales charges; therefore, these examples will not help you to determine the relative total costs of owning different funds. If transaction costs were included, your expenses would have been higher. See the prospectus for details regarding transaction costs.
1 Expenses are equal to the Fund’s annualized expense ratio of 0.95%, 1.28% and 1.31% for Class A, Class B and Class C respectively, multiplied by the average account value over the period, multiplied by 182/365 (to reflect the one-half year period).
| |
| 8 | Money Market Fund | Annual report |
Portfolio summary
| | | | |
| Sector distribution1 | | | | |
|
| Financials | 79% | | Consumer discretionary | 3% |
| |
|
| U.S. Government agency | 5% | | Industrials | 2% |
| |
|
| Telecommunication services | 5% | | Other | 2% |
| |
|
| Consumer staples | 4% | | | |
| | |
1 As a percentage of net assets on March 31, 2009.
| |
| Annual report | Money Market Fund | 9 |
F I N A N C I A L S T A T E M E N T S
Fund’s investments
Securities owned by the Fund on 3-31-09
| | | | | | | |
| | Interest | | Maturity | | Quality | Par value | |
| Issuer | rate | | date | | rating (A) | (000) | Value |
|
| Commercial Paper 49.81% | | | | | | | $242,163,910 |
|
| (Cost $242,163,910) | | | | | | | |
| | | | | | | | |
| Asset Backed — Finance 17.24% | | | | | | | 83,801,930 |
|
| CAFCO, LLC | Zero | | 04-02-09 | | Tier 1 | $10,000 | 9,999,820 |
|
| CAFCO, LLC | Zero | | 04-08-09 | | Tier 1 | 6,000 | 5,999,218 |
|
| Govco, LLC | Zero | | 04-14-09 | | Tier 1 | 5,000 | 4,999,006 |
|
| Govco, LLC | Zero | | 04-08-09 | | Tier 1 | 15,000 | 14,998,396 |
|
| Old Line Funding, LCC | Zero | | 04-17-09 | | Tier 1 | 8,000 | 7,998,400 |
|
| Old Line Funding, LCC | Zero | | 04-20-09 | | Tier 1 | 4,000 | 3,999,113 |
|
| Old Line Funding, LCC | Zero | | 04-03-09 | | Tier 1 | 8,000 | 7,999,836 |
|
| Old Line Funding, LCC | Zero | | 04-13-09 | | Tier 1 | 5,000 | 4,999,250 |
|
| Ranger Funding Co., LLC | Zero | | 04-07-09 | | Tier 1 | 10,000 | 9,999,333 |
|
| Ranger Funding Co., LLC | Zero | | 04-14-09 | | Tier 1 | 4,812 | 4,811,183 |
|
| Ranger Funding Co., LLC | Zero | | 04-15-09 | | Tier 1 | 6,000 | 5,998,950 |
|
| Ranger Funding Co., LLC | Zero | | 04-24-09 | | Tier 1 | 2,000 | 1,999,425 |
| | | | | | | |
| Asset Backed — Loan Receivables 7.82% | | | | | | 37,994,458 |
|
| Falcon Asset Securitization Co. | Zero | | 04-28-09 | | Tier 1 | 6,000 | 5,997,750 |
|
| Jupiter Securitization | Zero | | 04-15-09 | | Tier 1 | 6,000 | 5,998,950 |
|
| Jupiter Securitization | Zero | | 04-16-09 | | Tier 1 | 7,000 | 6,998,833 |
|
| Park Avenue Receivables Corp. | Zero | | 04-03-09 | | Tier 1 | 9,000 | 8,999,775 |
|
| Park Avenue Receivables Corp. | Zero | | 04-06-09 | | Tier 1 | 8,000 | 7,999,500 |
|
| Park Avenue Receivables Corp. | Zero | | 04-15-09 | | Tier 1 | 2,000 | 1,999,650 |
| | | | | | | | |
| Banks — Foreign 8.02% | | | | | | | 38,998,439 |
|
| Abbey National, PLC | Zero | | 04-02-09 | | Tier 1 | 5,000 | 4,999,982 |
|
| BNP Paribas Canada | Zero | | 04-01-09 | | Tier 1 | 10,000 | 10,000,000 |
|
| Societe Generale New York | Zero | | 04-01-09 | | Tier 1 | 5,000 | 5,000,000 |
|
| Societe Generale New York | Zero | | 04-13-09 | | Tier 1 | 7,000 | 6,999,253 |
|
| Societe Generale New York | Zero | | 04-14-09 | | Tier 1 | 7,000 | 6,999,242 |
|
| Societe Generale New York | Zero | | 04-02-09 | | Tier 1 | 5,000 | 4,999,962 |
| | | | | | | | |
| Beverages 1.03% | | | | | | | 4,999,332 |
|
| Coca-Cola Co. | Zero | | 04-14-09 | | Tier 1 | 5,000 | 4,999,332 |
| | | | | | | | |
| Chemicals 1.03% | | | | | | | 4,998,510 |
|
| BASF SE | Zero | | 04-30-09 | | Tier 1 | 5,000 | 4,998,510 |
| | | | | | | | |
| Finance — Auto Loans 4.62% | | | | | | | 22,484,850 |
|
| American Honda Finance Corp. | Zero | | 04-07-09 | | Tier 1 | 7,492 | 7,491,189 |
|
| American Honda Finance Corp. | Zero | | 04-21-09 | | Tier 1 | 11,000 | 10,996,333 |
|
| American Honda Finance Corp. | Zero | | 05-08-09 | | Tier 1 | 4,000 | 3,997,328 |
See notes to financial statements
| |
| 10 | Money Market Fund | Annual report |
F I N A N C I A L S T A T E M E N T S
| | | | | | | |
| | Interest | | Maturity | | Quality | Par value | |
| Issuer | rate | | date | | rating (A) | (000) | Value |
| Finance — Consumer Loans 5.14% | | | | | | | $24,992,630 |
|
| John Deere Capital Corp. | Zero | | 04-27-09 | | Tier 1 | $7,000 | 6,998,079 |
|
| John Deere Capital Corp. | Zero | | 05-14-09 | | Tier 1 | 5,000 | 4,997,133 |
|
| John Deere Capital Corp. | Zero | | 04-22-09 | | Tier 1 | 11,000 | 10,997,562 |
|
| John Deere Capital Corp. | Zero | | 04-08-09 | | Tier 1 | 2,000 | 1,999,856 |
| | | | | | | | |
| Food 1.89% | | | | | | | 9,200,000 |
|
| Nestle SA | Zero | | 04-01-09 | | Tier 1 | 9,200 | 9,200,000 |
| | | | | | | | |
| Telecommunications 3.02% | | | | | | | 14,693,761 |
|
| Verizon Communications, Inc. | Zero | | 05-07-09 | | Tier 1 | 1,700 | 1,699,065 |
|
| Verizon Communications, Inc. | Zero | | 04-20-09 | | Tier 1 | 6,000 | 5,997,467 |
|
| Verizon Global Funding Corp. | Zero | | 04-20-09 | | Tier 1 | 7,000 | 6,997,229 |
| |
| | | | | | | |
| | Interest | | Maturity | | Quality | Par value | |
| Issuer | rate | | date | | rating (A) | (000) | Value |
|
| Corporate Interest-Bearing Obligations 45.21% | | | | | | $219,768,924 |
|
| (Cost $219,768,924) | | | | | | | |
| | | | | | | | |
| Asset Backed — Finance 2.26% | | | | | | | 11,003,039 |
|
| Citigroup Funding, Inc. (C)(P) | 1.532% | | 03-30-12 | | Tier 1 | $2,000 | 2,000,000 |
|
| Citigroup Funding, Inc. (C)(P) | 1.274 | | 07-30-10 | | Tier 1 | 9,000 | 9,003,039 |
| | | | | | | | |
| Banks — Foreign 1.03% | | | | | | | 4,999,424 |
|
| Bank of Montreal Chicago (P) | 1.248 | | 05-14-09 | | Tier 1 | 3,000 | 2,999,424 |
|
| Union Bank NA (C) | 1.520 | | 03-16-12 | | Tier 1 | 2,000 | 2,000,000 |
| | | | | | | | |
| Banks — U.S. 15.01% | | | | | | | 72,985,454 |
|
| Bank of America Corp. (C)(P) | 1.474 | | 04-30-12 | | Tier 1 | 10,000 | 10,000,000 |
|
| Bank of America Corp. (C) | 1.427 | | 06-22-12 | | Tier 1 | 4,000 | 4,000,000 |
|
| Bank of America Corp. (P) | 1.374 | | 07-30-09 | | Tier 1 | 16,000 | 15,967,415 |
|
| Bank of America Corp. (C) | 1.361 | | 09-13-10 | | Tier 1 | 6,000 | 6,000,000 |
|
| Bank of America Corp. | 1.331 | | 06-12-09 | | Tier 1 | 6,000 | 5,999,081 |
|
| Bank of America Corp. (P) | 0.574 | | 06-12-09 | | Tier 1 | 2,000 | 1,995,293 |
|
| Huntington National Bank (C)(P) | 1.661 | | 06-01-12 | | Tier 1 | 7,000 | 7,000,000 |
|
| U.S. Bancorp (P) | 0.553 | | 04-28-09 | | Tier 1 | 6,100 | 6,099,232 |
|
| Wachovia Bank NA (P) | 0.453 | | 08-10-09 | | Tier 1 | 10,000 | 9,950,389 |
|
| Wells Fargo & Co. (P) | 1.420 | | 09-15-09 | | Tier 1 | 5,984 | 5,974,044 |
| | | | | | | | |
| Diversified Financial Services 7.00% | | | | | | | 34,020,431 |
|
| General Electric Capital Corp. | 3.125 | | 04-01-09 | | Tier 1 | 15,000 | 15,000,000 |
|
| General Electric Capital Corp. (C) | 1.531 | | 03-12-12 | | Tier 1 | 5,000 | 5,000,000 |
|
| General Electric Capital Corp. (C) | 1.411 | | 03-11-11 | | Tier 1 | 2,000 | 2,000,000 |
|
| IBM International Group Capital, LLC (P) | 1.524 | | 07-29-09 | | Tier 1 | 7,000 | 7,013,095 |
|
| IBM International Group Capital, LLC | | | | | | | |
| (S)(P) | 1.470 | | 09-25-09 | | Tier 1 | 5,000 | 5,007,336 |
| | | | | | | | |
| Finance — Auto Loans 1.65% | | | | | | | 8,004,222 |
|
| American Honda Finance Corp. (S) | 4.500 | | 05-26-09 | | Tier 1 | 2,000 | 2,004,222 |
|
| Toyota Motor Credit Corp. (P) | 0.566 | | 06-19-09 | | Tier 1 | 6,000 | 6,000,000 |
| | | | | | | | |
| Finance — Credit Card 2.09% | | | | | | | 10,171,406 |
|
| American Express Bank FSB (P) | 0.583 | | 06-22-09 | | Tier 1 | 2,000 | 1,988,940 |
|
| American Express Centurion Bank (P) | 0.584 | | 06-12-09 | | Tier 1 | 6,200 | 6,175,256 |
|
| American Express Co. | 4.750 | | 06-17-09 | | Tier 1 | 2,000 | 2,007,210 |
See notes to financial statements
| |
| Annual report | Money Market Fund | 11 |
F I N A N C I A L S T A T E M E N T S
| | | | | | | |
| | Interest | | Maturity | | Quality | Par value | |
| Issuer | rate | | date | | rating (A) | (000) | Value |
| Health Care Supplies 3.33% | | | | | | | $16,171,520 |
|
| Procter & Gamble Co. (P) | 1.314% | | 09-09-09 | | Tier 1 | $2,000 | 2,001,742 |
|
| Procter & Gamble International Finance (P) | 1.486 | | 02-08-10 | | Tier 1 | 3,000 | 3,000,000 |
|
| Procter & Gamble International | | | | | | | |
| Finance (S) | 1.423 | | 07-06-09 | | Tier 1 | 11,165 | 11,169,778 |
| | | | | | | |
| Investment Banking & Brokerage 9.29% | | | | | | 45,162,386 |
|
| Goldman Sachs Group, Inc. | 6.650 | | 05-15-09 | | Tier 1 | 4,000 | 4,014,743 |
|
| Goldman Sachs Group, Inc. (C) | 1.499 | | 03-15-12 | | Tier 1 | 3,000 | 3,000,000 |
|
| Goldman Sachs Group, Inc. (C)(P) | 1.491 | | 11-09-11 | | Tier 1 | 9,000 | 9,027,540 |
|
| JPMorgan Chase & Co. (C)(P) | 1.550 | | 06-15-12 | | Tier 1 | 8,000 | 8,022,249 |
|
| JPMorgan Chase & Co. (P) | 1.381 | | 06-02-09 | | Tier 1 | 3,100 | 3,097,854 |
|
| JPMorgan Chase & Co. (C)(P) | 1.331 | | 02-23-11 | | Tier 1 | 3,000 | 3,000,000 |
|
| Morgan Stanley (C)(P) | 1.638 | | 06-20-12 | | Tier 1 | 5,000 | 5,000,000 |
|
| Morgan Stanley (C)(P) | 1.526 | | 03-13-12 | | Tier 1 | 3,000 | 3,000,000 |
|
| Morgan Stanley (C)(P) | 1.508 | | 02-10-12 | | Tier 1 | 7,000 | 7,000,000 |
| | | | | | | |
| Machinery — Construction & Mining 0.32% | | | | | | 1,549,815 |
|
| Caterpillar Financial Services Corp. (P) | 1.306 | | 05-18-09 | | Tier 1 | 1,550 | 1,549,815 |
| | | | | | | | |
| Pharmaceuticals 1.24% | | | | | | | 6,005,973 |
|
| Pfizer, Inc. | 5.625 | | 04-15-09 | | Tier 1 | 6,000 | 6,005,973 |
| | | | | | | | |
| Telecommunications 1.99% | | | | | | | 9,695,254 |
|
| AT&T, Inc. | 4.125 | | 09-15-09 | | Tier 1 | 9,600 | 9,695,254 |
| |
| | | | | | | |
| | Interest | | Maturity | | Quality | Par value | |
| Issuer | rate | | date | | rating (A) | (000) | Value |
|
| U.S. government obligations 4.99% | | | | | | | $24,245,000 |
|
| (Cost $24,245,000) | | | | | | | |
| | | | | | | | |
| U.S. Government Agency 4.99% | | | | | | | 24,245,000 |
|
| Federal Home Loan Bank | 2.375% | | 04-07-09 | | Tier 1 | $4,180 | 4,180,000 |
|
| Federal Home Loan Bank | 2.625 | | 04-30-09 | | Tier 1 | 6,065 | 6,065,000 |
|
| Federal Home Loan Mortgage Corp | 1.100 | | 02-26-10 | | Tier 1 | 5,000 | 5,000,000 |
|
| Federal Home Loan Mortgage Corp. | 1.250 | | 03-12-10 | | Tier 1 | 5,000 | 5,000,000 |
|
| Federal Home Loan Mortgage Corp. | 1.300 | | 03-30-10 | | Tier 1 | 4,000 | 4,000,000 |
|
| Total investments (Cost $486,177,834)† 100.01% | | | | $486,177,834 |
|
| |
| Other assets and liabilities, net (0.01%) | | | | | | ($33,463) |
|
| |
| Total net assets 100.00% | | | | | | | $486,144,371 |
|
The percentage shown for each investment category is the total value of that category as a percentage of the net assets of the Fund.
(A) Quality ratings are unaudited and indicate the categories of eligible securities, as defined by Rule 2a-7 of the Investment Company Act of 1940, that are owned by the Fund.
(C) These securities are issued under the Temporary Liquidity Guarantee Program and are insured by Federal Deposit Insurance Corporation. These securities amounted to $85,052,828 or 17.50% of net assets of the Fund as of March 31, 2009.
(P) Variable rate obligation. The coupon rate shown represents the rate at period end.
(S) These securities are exempt from registration under Rule 144A of the Securities Act of 1933. Such securities may be resold, normally to qualified institutional buyers, in transactions exempt from registration.
† At March 31, 2009, the aggregate cost of investment securities for federal income tax purposes was $486,177,834.
See notes to financial statements
| |
| 12 | Money Market Fund | Annual report |
F I N A N C I A L S T A T E M E N T S
Financial statements
Statement of assets and liabilities 3-31-09
This Statement of Assets and Liabilities is the Fund’s balance sheet. It shows the value of what the Fund owns, is due and owes. You’ll also find the net asset value per share.
| |
| Assets | |
|
| Investments at value (Cost $486,177,834) | $486,177,834 |
| Cash | 207,613 |
| Receivable for shares sold | 1,668,768 |
| Interest receivable | 1,125,431 |
| Receivable from affiliates | 62,726 |
| Other receivables and prepaid assets | 89,134 |
| | |
| Total assets | 489,331,506 |
| |
| Liabilities | |
|
| Payable for shares repurchased | 2,733,979 |
| Dividends payable | 7,110 |
| Payable to affiliates | |
| Management fees | 171,368 |
| Transfer agent fees | 36,676 |
| Trustee fees | 45,430 |
| Fund administration fees | 11,171 |
| Distribution and service fees | 135,848 |
| Other payables and accrued expenses | 45,553 |
| | |
| Total liabilities | 3,187,135 |
| |
| Net assets | |
|
| Capital paid-in | 486,180,525 |
| Accumulated net realized loss on investments | (1,238) |
| Accumulated distributions in excess of net investment income | (34,916) |
| | |
| Net assets | $486,144,371 |
| |
| Net asset value per share | |
|
| Based on net asset values and shares outstanding — the Fund has an | |
| unlimited number of shares authorized with no par value | |
| Class A ($395,996,463 ÷ 396,142,046 shares) | $1.00 |
| Class B ($43,078,504 ÷ 43,102,968 shares)1 | $1.00 |
| Class C ($47,069,404 ÷ 47,074,672 shares)1 | $1.00 |
1 Redemption price is equal to net asset value less any applicable contingent deferred sales charge.
See notes to financial statements
| |
| Annual report | Money Market Fund | 13 |
F I N A N C I A L S T A T E M E N T S
Statement of operations For the year ended 3-31-09
This Statement of Operations summarizes the Fund’s investment income earned and expenses incurred in operating the Fund.
| |
| Investment income | |
|
| Interest | $8,025,282 |
| | |
| Total investment income | 8,025,282 |
| |
| Expenses | |
|
| Investment management fees (Note 5) | 2,070,198 |
| Distribution and service fees (Note 5) | 1,579,915 |
| Transfer agent fees (Note 5) | 762,074 |
| Accounting and legal services fees (Note 5) | 69,534 |
| Blue sky fees | 167,191 |
| Professional fees | 142,268 |
| Custodian fees | 86,832 |
| Printing fees | 56,695 |
| Trustees’ fees (Note 6) | 12,513 |
| Treasury guarantee program fees (Note 9) | 89,164 |
| Miscellaneous | 59,773 |
| | |
| Total expenses | 5,096,157 |
| | |
| Less expense reduction (Note 5) | (993,117) |
| | |
| Net expenses | 4,103,040 |
| | |
| Net investment income | 3,922,242 |
| | |
| Increase in net assets from operations | $3,922,242 |
See notes to financial statements
| |
| 14 | Money Market Fund | Annual report |
F I N A N C I A L S T A T E M E N T S
Statements of changes in net assets
These Statements of Changes in Net Assets show how the value of the Fund’s net assets has changed during the last two periods. The difference reflects earnings less expenses, distributions, if any, paid to shareholders and the net of Fund share transactions.
| | |
| | Year | Year |
| | ended | ended |
| | 3-31-09 | 3-31-08 |
|
| Increase (decrease) in net assets | | |
|
| From operations | | |
| Net investment income | $3,922,242 | $11,424,632 |
| | | |
| Increase in net assets resulting from operations | 3,922,242 | 11,424,632 |
| | | |
| Distributions to shareholders | | |
| From net investment income | | |
| Class A | (3,635,004) | (9,930,919) |
| Class B | (182,836) | (996,894) |
| Class C | (150,806) | (496,819) |
| | (3,968,646) | (11,424,632) |
| From Fund share transactions (Note 7) | 103,358,651 | 152,072,048 |
| | | |
| Total increase (decrease) | 103,312,247 | 152,072,048 |
| |
| Net assets | | |
|
| Beginning of year | 382,832,124 | 230,760,076 |
| | | |
| End of year1 | $486,144,371 | $382,832,124 |
1 Includes undistributed/(distributions in excess) of net investment income (loss) of ($34,916) and $11,488, respectively.
See notes to financial statements
| |
| Annual report | Money Market Fund | 15 |
F I N A N C I A L S T A T E M E N T S
Financial highlights
The Financial Highlights show how the Fund’s net asset value for a share has changed since the end of the previous period.
| | | | | |
| CLASS A SHARES Period ended | 3-31-09 | 3-31-08 | 3-31-07 | 3-31-06 | 3-31-051 |
|
| Per share operating performance | | | | | |
|
| Net asset value, beginning of year | $1.00 | $1.00 | $1.00 | $1.00 | $1.00 |
| Net investment income2 | 0.01 | 0.04 | 0.04 | 0.03 | 0.01 |
| Less distributions | | | | | |
| From net investment income | (0.01) | (0.04) | (0.04) | (0.03) | (0.01) |
| Net asset value, end of year | $1.00 | $1.00 | $1.00 | $1.00 | $1.00 |
| Total return (%)3,4 | 1.16 | 4.24 | 4.45 | 2.92 | 0.86 |
| |
| Ratios and supplemental data | | | | | |
|
| Net assets, end of year (in millions) | $396 | $317 | $195 | $185 | $224 |
| Ratios (as a percentage of average net assets): | | | | | |
| Expenses before reductions | 1.10 | 1.01 | 1.09 | 1.11 | 1.09 |
| Expenses net of all fee waivers | 0.89 | 0.81 | 0.88 | 0.91 | 0.88 |
| Expenses net of all fee waivers and credits | 0.89 | 0.81 | 0.88 | 0.91 | 0.88 |
| Net investment income | 1.05 | 4.08 | 4.37 | 2.85 | 0.83 |
| |
1 Audited by previous Independent Registered Public Accounting Firm.
2 Based on the average of the shares outstanding.
3 Assumes dividend reinvestment and does not reflect the effect of sales charges
4 Total returns would have been lower had certain expenses not been reduced during the periods shown.
| | | | | |
| CLASS B SHARES Period ended | 3-31-09 | 3-31-08 | 3-31-07 | 3-31-06 | 3-31-051 |
|
| Per share operating performance | | | | | |
|
| Net asset value, beginning of year | $1.00 | $1.00 | $1.00 | $1.00 | $1.00 |
| Net investment income2 | —3 | 0.03 | 0.04 | 0.02 | —3 |
| Less distributions | | | | | |
| From net investment income | —3 | (0.03) | (0.04) | (0.02) | —3 |
| Net asset value, end of year | $1.00 | $1.00 | $1.00 | $1.00 | $1.00 |
| Total return (%)4,5 | 0.56 | 3.36 | 3.57 | 2.05 | 0.50 |
| |
| Ratios and supplemental data | | | | | |
|
| Net assets, end of year (in millions) | $43 | $34 | $28 | $36 | $63 |
| Ratios (as a percentage of average net assets): | | | | | |
| Expenses before reductions | 1.85 | 1.77 | 1.83 | 1.86 | 1.85 |
| Expenses net of all fee waivers | 1.45 | 1.67 | 1.73 | 1.76 | 1.20 |
| Expenses net of all fee waivers and credits | 1.45 | 1.66 | 1.73 | 1.76 | 1.20 |
| Net investment income | 0.48 | 3.29 | 3.52 | 1.94 | 0.46 |
| |
1 Audited by previous Independent Registered Public Accounting Firm.
2 Based on the average of the shares outstanding.
3 Less than $0.01 per share.
4 Assumes dividend reinvestment and does not reflect the effect of sales charges
5 Total returns would have been lower had certain expenses not been reduced during the periods shown.
See notes to financial statements
| |
| 16 | Money Market Fund | Annual report |
F I N A N C I A L S T A T E M E N T S
| | | | | |
| CLASS C SHARES Period ended | 3-31-09 | 3-31-08 | 3-31-07 | 3-31-06 | 3-31-051 |
|
| Per share operating performance | | | | | |
|
| Net asset value, beginning of year | $1.00 | $1.00 | $1.00 | $1.00 | $1.00 |
| Net investment income2 | —3 | 0.03 | 0.04 | 0.02 | —3 |
| Less distributions | | | | | |
| From net investment income | —3 | (0.03) | (0.04) | (0.02) | —3 |
| Net asset value, end of year | $1.00 | $1.00 | $1.00 | $1.00 | $1.00 |
| Total return (%)4,5 | 0.56 | 3.35 | 3.57 | 2.04 | 0.50 |
| |
| Ratios and supplemental data | | | | | |
|
| Net assets, end of year (in millions) | $47 | $31 | $8 | $4 | $13 |
| Ratios (as a percentage of average net assets): | | | | | |
| Expenses before reductions | 1.86 | 1.76 | 1.83 | 1.85 | 1.84 |
| Expenses net of all fee waivers | 1.44 | 1.66 | 1.73 | 1.75 | 1.19 |
| Expenses net of all fee waivers and credits | 1.44 | 1.66 | 1.73 | 1.75 | 1.19 |
| Net investment income | 0.41 | 3.10 | 3.54 | 1.86 | 0.46 |
| |
1 Audited by previous Independent Registered Public Accounting Firm.
2 Based on the average of the shares outstanding.
3 Less than $0.01 per share.
4 Assumes dividend reinvestment and does not reflect the effect of sales charges
5 Total returns would have been lower had certain expenses not been reduced during the periods shown.
See notes to financial statements
| |
| Annual report | Money Market Fund | 17 |
Notes to financial statements
Note 1
Organization
John Hancock Money Market Fund (the Fund) is a diversified series of John Hancock Current Interest (the Trust), an open-end management investment company registered under the Investment Company Act of 1940, as amended (the 1940 Act). The investment objective of the Fund is to seek the maximum current income that is consistent with maintaining liquidity and preserving capital.
The Board of Trustees has authorized the issuance of multiple classes of shares of the Fund, designated as Class A, Class B and Class C shares. The shares of each class represent an interest in the same portfolio of investments of the Fund and have equal rights as to voting, redemptions, dividends and liquidation, except that certain expenses, subject to the approval of the Trustees, may be applied differently to each class of shares in accordance with current regulations of the Securities and Exchange Commission and the Internal Revenue Service. Shareholders of a class that bears distribution and service expenses under the terms of a distribution plan have exclusive voting rights to that distribution plan. Class B shares will convert to Class A shares eight years after purchase.
Note 2
Significant accounting policies
The financial statements have been prepared in conformity with accounting principles generally accepted in the United States of America, which require management to make certain estimates and assumptions at the date of the financial statements. Actual results could differ from those estimates. The following summarizes the significant accounting policies of the Fund:
Security valuation
Securities in the Fund’s portfolio are valued at amortized cost, in accordance with Rule 2a-7 of the 1940 Act, as amended, which approximates market value. The amortized cost method involves valuing a security at its cost on the date of purchase and thereafter assuming a constant amortization to maturity of the difference between the principal amount due at maturity and the cost of the security to the Fund. Interest income on certain portfolio securities such as negotiable bank certificates of deposit and interest-bearing notes is accrued daily and included in interest receivable.
The Fund adopted Statement of Financial Accounting Standards No. 157 (FAS 157), Fair Value Measurements, effective with the beginning of the Fund’s fiscal year. FAS 157 established a three-tier hierarchy to prioritize the assumptions, referred to as inputs, used in valuation techniques to measure fair value. The three-tier hierarchy of inputs is summarized in the three broad levels listed below:
Level 1 – Quoted prices in active markets for identical securities.
Level 2 – Prices determined using other significant observable inputs. Observable inputs are inputs that other market participants would use in pricing a security. These may include quoted prices for similar securities, interest rates, prepayment speeds, credit risk and others.
Level 3 – Prices determined using significant unobservable inputs. In situations where quoted prices or observable inputs are unavailable, such as when there is little or no market activity for an investment, unobservable inputs may be used. Unobservable inputs reflect the Fund’s own assumptions about the factors that market participants would use in pricing an investment and would be based on the best information available.
The inputs or methodology used for valuing securities are not necessarily an indication of the risk associated with investing in those securities.
| |
| 18 | Money Market Fund | Annual report |
The following is a summary of the inputs used to value the Fund’s net assets as of March 31, 2009:
| | |
| | INVESTMENTS IN | OTHER FINANCIAL |
| VALUATION INPUTS | SECURITIES | INSTRUMENTS* |
|
| Level 1 — Quoted Prices | $— | $— |
|
| Level 2 — Other Significant Observable Inputs | 486,177,834 | — |
|
| Level 3 — Significant Unobservable Inputs | — | — |
| Total | $486,177,834 | $— |
*Other financial instruments are derivative instruments not reflected in the Portfolio of Investments, such as futures, forwards and swap contracts, which are valued at the unrealized appreciation/ depreciation on the instrument.
Security transactions and related
investment income
Investment transactions are recorded as of the date of purchase, sale or maturity. Interest income is accrued as earned. Discounts/ premiums are accreted/amortized for financial reporting purposes. Debt obligations may be placed in a non-accrual status and related interest income may be reduced by ceasing current accruals and writing off interest receivables when the collection of all or a portion of interest has become doubtful, based upon consistently applied procedures. The Fund uses identified cost method for determining realized gain or loss on investments for both financial statement and federal income tax reporting purposes.
Expenses
The majority of expenses are directly identifi-able to an individual fund. Trust expenses that are not readily identifiable to a specific fund are allocated in such a manner as deemed equitable, taking into consideration, among other things, the nature and type of expense and the relative size of the funds. Expense estimates are accrued in the period to which they relate and adjustments are made when actual amounts are known.
Class allocations
Income, common expenses and realized and unrealized gains (losses) are determined at the fund level and allocated daily to each class of shares based on the appropriate net asset value of the respective classes. Distribution and service fees, if any, and transfer agent fees for Class A, Class B and Class C shares are calculated daily at the class level based on the appropriate net asset value of each class and the specific expense rate(s) applicable to each class.
Federal income taxes
The Fund qualifies as a regulated investment company by complying with the applicable provisions of the Internal Revenue Code and will not be subject to federal income tax on taxable income that is distributed to shareholders. Therefore, no federal income tax provision is required.
For federal income tax purposes, the Fund has $1,238 of a capital loss carryforward available, to the extent provided by regulations, to offset future net realized capital gains. To the extent that such carryforward is used by the Fund, no capital gain distributions will be made. The loss carryforwards expire as follows: March 31, 2012 — $1,191 and March 31, 2015 — $47.
As of March 31, 2009, the Fund had no uncertain tax positions that would require financial statement recognition, de-recognition, or disclosure. Each of the Fund’s federal tax returns filed in the 3-year period ended March 31, 2009 remains subject to examination by the Internal Revenue Service.
Distribution of income and gains
The Fund records distributions to shareholders from net investment income and net realized gains, if any, on the ex-dividend date. The Fund’s net investment income is declared daily as dividends to shareholders of record as of the close of business on the preceding day, and distributed monthly. During the year ended March 31, 2008, the tax character of distributions paid to ordinary income was $11,424,632. During the year ended March 31, 2009, the tax character
| |
| Annual report | Money Market Fund | 19 |
of distributions paid to ordinary income was $3,968,646. Distributions paid by the Fund with respect to each class of shares are calculated in the same manner, at the same time and are in the same amount, except for the effect of expenses that may be applied differently to each class.
As of March 31, 2009, the components of distributable earnings on a tax basis included $78,089 of undistributed ordinary income.
Such distributions, on a tax basis, are determined in conformity with income tax regulations, which may differ from accounting principles generally accepted in the United States of America. Distributions in excess of tax basis earnings and profits, if any, are reported in the Fund’s financial statements as a return of capital.
Capital accounts within financial statements are adjusted for permanent book-tax differences. These adjustments have no impact on net assets or the results of operations. Temporary book-tax differences will reverse in a subsequent period. For the year ended March 31, 2009, there were no permanent book/tax differences.
Note 3
Risks and uncertainties
Concentration risk
The Fund may concentrate investments in a particular industry, sector of the economy or invest in a limited number of companies. Accordingly, the concentration may make the Fund’s value more volatile and investment values may rise and fall more rapidly. In addition, a fund with a concentration is particularly susceptible to the impact of market, economic, regulatory and other factors affecting the specific concentration.
Fixed income risk
Fixed income securities are subject to credit and interest rate risk and involve some risk of default in connection with principal and interest payments.
Note 4
Guarantees and indemnifications
Under the Fund’s organizational documents, its Officers and Trustees are indemnified against certain liability arising out of the performance of their duties to the Fund. Additionally, in the normal course of business, the Fund enters into contracts with service providers that contain general indemnification clauses. The Fund’s maximum exposure under these arrangements is unknown, as this would involve future claims that may be made against the Fund that have not yet occurred.
Note 5
Management fee and transactions with
affiliates and others
The Fund has an investment management contract with John Hancock Advisers, LLC (the Adviser). Under the investment management contract, the Fund pays a monthly management fee to the Adviser equivalent, on an annual basis, to the sum of: (a) 0.50% of the first $500,000,000 of the Fund’s average daily net asset value, (b) 0.425% of the next $250,000,000, (c) 0.375% of the next $250,000,000, (d) 0.35% of the next $500,000,000, (e) 0.325% of the next $500,000,000, (f) 0.30% of the next $500,000,000 and (g) 0.275% of the Fund’s average daily net asset value in excess of $2,500,000,000. The Adviser has a subadvisory agreement with MFC Global Investment Management (U.S.), LLC, a subsidiary of John Hancock Financial Services, Inc. The Fund is not responsible for payment of subadvisory fees.
The Adviser has agreed to limit the Fund’s management fee to 0.40% of the Fund’s average daily net asset value, at least until July 31, 2009. Accordingly, the expense reductions related to management fee limitations amounted to $414,040 for the year ended March 31, 2009. The effective rate of the management fee, including the expense limitation, was 0.40% of the Fund’s average daily net asset value for the year ended March 31, 2009.
The Fund has a Distribution Agreement with John Hancock Funds, LLC (JH Funds), a wholly owned subsidiary of the Adviser. The Fund has adopted Distribution Plans with
| |
| 20 | Money Market Fund | Annual report |
respect to Class A, Class B and Class C, pursuant to Rule 12b-1 under the 1940 Act, to pay JH Funds for the services it provides as distributor of shares of the Fund. Accordingly, the Fund makes monthly payments to JH Funds at an annual rate not to exceed 0.25%, 1.00% and 1.00% of average daily net asset value of Class A, Class B and Class C, respectively. JH Funds has agreed to limit the distribution and service (12b-1) fee pursuant to Class A to 0.15% of the Class’s average net asset value, at least until July 31, 2009. Accordingly, the expense reductions related to reduction in the 12b-1 fee amounted to $341,397 for the year ended March 31, 2009. In addition, the Adviser has voluntarily agreed to reimburse certain distribution and service fees for the year ended March 31, 2009. The voluntary reimbursement amounted to $12,392, $110,030 and $114,456 for Classes A, B and C, respectively for the year ended March 31, 2009. A maximum of 0 .25% of such payments may be service fees, as defined by the Conduct Rules of the Financial Industry Regulatory Authority (formerly the National Association of Securities Dealers). Under the Conduct Rules, curtailment of a portion of the Fund’s 12b-1 payments could occur under certain circumstances. Effective March 31, 2009, sales charges for Class A, Class B and Class C are suspended voluntarily.
Class A CDSC may be charged for certain transfers between the Fund and affiliate John Hancock Funds. Class B shares that are redeemed within six years of purchase are subject to a contingent deferred sales charge (CDSC) at declining rates, beginning at 5.00% of the lesser of the current market value at the time of redemption or the original purchase cost of the shares being redeemed. Class C shares that are redeemed within one year of purchase are subject to a CDSC at a rate of 1.00% of the lesser of the current market value at the time of redemption or the original purchase cost of the shares being redeemed. Proceeds from the CDSCs are paid to JH Funds and are used in whole or in part to defray its expenses for providing distribution-related services to the Fund in connection with the sale of Class B and Class C shares. During the year ended March 31, 2009, CDSCs received by JH Funds amounted to $37,479 for Class A shares, $206,286 for Cla ss B shares and $49,726 for Class C shares.
The Fund has a transfer agent agreement with John Hancock Signature Services, Inc. (Signature Services), an indirect subsidiary of JHLICO. For Class A, Class B and Class C shares, the Fund pays a monthly transfer agent fee at an annual rate of 0.01% of each class’s average daily net asset value, plus a fee based on the number of shareholder accounts and reimbursement for certain out-of-pocket expenses, aggregated and allocated to each class on the basis of its relative net asset value. The Fund pays a monthly fee which is based on an annual rate of $17.50 for each shareholder account. There were no transfer agent fee reductions during the year ended March 31, 2009.
The Fund receives earnings credits from its transfer agent as a result of uninvested cash balances. These credits are used to reduce a portion of the Fund’s transfer agent fees and out-of-pocket expenses. During the year ended March 31, 2009, the Fund’s transfer agent fees and out-of-pocket expenses were reduced by $802 for transfer agent credits earned.
Class level expenses for the year ended March 31, 2009 were as follows:
| | |
| | Transfer | Distribution and |
| Share class | agent fees | service fees |
|
| |
| Class A | $627,693 | $853,494 |
| Class B | 68,058 | 368,479 |
| Class C | 66,323 | 357,942 |
| Total | $762,074 | $1,579,915 |
The Fund has an agreement with the Adviser and affiliates to perform necessary tax, accounting, compliance, legal and other administrative services for the Fund. The compensation for the period amounted to $69,534 with an effective rate of 0.02% of the Fund’s average daily net asset value.
Mr. James R. Boyle is Chairman of the Adviser, as well as affiliated Trustee of the Fund, and is compensated by the Adviser and/or its affiliates. The compensation of unaffiliated Trustees is borne by the Fund. The unaffiliated Trustees may elect to defer, for tax purposes,
| |
| Annual report | Money Market Fund | 21 |
their receipt of this compensation under the John Hancock Group of Funds Deferred Compensation Plan. The Fund makes investments into other John Hancock funds, as applicable, to cover its liability for the deferred compensation. Investments to cover the Fund’s deferred compensation liability are recorded on the Fund’s books as an other asset. The deferred compensation liability and the related other asset are always equal and are marked to market on a periodic basis to reflect any income earned by the investments, as well as any unrealized gains or losses. The Deferred Compensation Plan investments had no impact on the operations of the Fund.
Note 6
Trustees’ fees
The Trust compensates each Trustee who is not an employee of the Adviser or its affiliates. Total Trustees’ expenses are allocated to the Fund based on its average daily net asset value.
Note 7
Fund share transactions
This listing illustrates the number of Fund shares sold, reinvested and repurchased during the years ended March 31, 2009, and March 31, 2008, along with the corresponding dollar value.
| | | | |
| | Year ended 3-31-09 | Year ended 3-31-08 |
| | Shares | Amount | Shares | Amount |
| Class A shares | | | | |
|
| Sold | 431,073,623 | 431,073,623 | 288,363,612 | $288,363,615 |
| Issued in reorganization | — | — | 33,151,672 | 33,125,522 |
| Distributions reinvested | 3,382,398 | 3,382,398 | 9,179,922 | 9,179,922 |
| Repurchased | (355,570,554) | (355,570,554) | (208,260,620) | (208,260,620) |
| Net increase | 78,885,467 | 78,885,467 | 122,434,586 | $122,408,439 |
| |
| Class B shares | | | | |
|
| Sold | 44,008,600 | 44,008,600 | 36,262,653 | $36,262,653 |
| Distributions reinvested | 165,206 | 165,206 | 916,832 | 916,832 |
| Repurchased | (35,515,180) | (35,515,180) | (30,778,622) | (30,778,625) |
| Net increase | 8,658,626 | 8,658,626 | 6,400,863 | $6,400,860 |
| |
| Class C shares | | | | |
|
| Sold | 100,074,666 | 100,074,666 | 54,878,312 | $54,878,312 |
| Distributions reinvested | 130,158 | 130,158 | 442,171 | 442,171 |
| Repurchased | (84,390,266) | (84,390,266) | (32,057,733) | (32,057,734) |
| Net increase | 15,814,558 | 15,814,558 | 23,262,750 | $23,262,749 |
| |
| Net increase | 103,358,651 | 103,358,651 | 152,098,199 | $152,072,048 |
|
Effective March 31, 2009, Class B and Class C are closed to new investors.
Note 8
Reorganization
On September 12, 2007, the shareholders of John Hancock U.S. Government Cash Reserve (Cash Reserve Fund) approved an Agreement and Plan of Reorganization, which provided for the transfer of substantially all of the assets and liabilities of the Cash Reserve Fund in exchange for Class A shares of the Fund. The acquisition was accounted for as a tax-free exchange of 33,151,672 Class A shares of the Fund for the net assets of the Cash Reserve Fund, which amounted to $33,125,522 for the shares of the Cash Reserve Fund after the close of business on September 14, 2007.
Note 9
U.S. Department of Treasury
temporary guarantee program
for money market funds
The Trustees have approved the participation of the Fund in the U.S. Department of Treasury
| |
| 22 | Money Market Fund | Annual report |
(the Treasury) Temporary Guarantee Program for Money Market Funds (the Program), under which the Treasury will guarantee that shareholders of the Fund will receive $1.00 for each share of the Fund held by them as of the close of business on September 19, 2008, in the event that the Fund liquidates and the per share value at the time of liquidation is less than $1.00 (a Guarantee Event). Recovery under the Program is subject to certain conditions and limitations, including the following:
• For investors who held shares of the Fund on September 19, 2008, the Program provides a guarantee for the lesser of: (a) the number of shares owned by the shareholder at the close of September 19 2008; or (b) the number of shares owned by the shareholder on the date of a Guarantee Event.
• The guarantee is not available to investors who were not Fund shareholders on September 19, 2008. In addition, this guarantee is not available to investors who were Fund shareholders on September 19, 2008 but who sold all their Fund shares prior to the date of a Guarantee Event.
• The total amount of coverage available for all participants in the Program is limited to the amount of funds available under the Federal Exchange Stabilization Fund at the time of a Guarantee Event (currently approximately $50 billion).
• In order to recover, a Guarantee Event must occur during the term of the Program. Recovery under the Program requires the Fund to liquidate.
The Program was set to terminate on December 18, 2008, however, the U.S. Treasury announced an extension of the Program until September 18, 2009. Participation in the Program requires a payment to the U.S. Treasury in the amount of 0.04% (including the extension) of the net asset value of the Fund as of September 19, 2008. The Board of Trustees have approved continued participation in the program until Septewmber 18, 2009. The cost of participating in the Program and any extension will be borne by the Fund, and will not be subject to any expense limitation or reimbursement agreement.
| |
| Annual report | Money Market Fund | 23 |
Auditors’ report
Report of Independent Registered Public Accounting Firm
To the Board of Trustees of the John Hancock Current Interest and Shareholders of John Hancock Money Market Fund:
In our opinion, the accompanying statement of assets and liabilities, including the schedule of investments, and the related statements of operations and of changes in net assets and the financial highlights present fairly, in all material respects, the financial position of John Hancock Money Market Fund (the “Fund”) at March 31, 2009, and the results of its operations, the changes in its net assets and the financial highlights for each of the periods indicated, in conformity with accounting principles generally accepted in the United States of America. These financial statements and financial highlights (hereafter referred to as “financial statements”) are the responsibility of the Fund’s management; our responsibility is to express an opinion on these financial statements based on our audits. We conducted our audits of these financial statements in accordance with the standards of the Public Company Accounting Oversight Board (United States). Those standards require that we plan and perform the audit to obtain reasonable assurance about whether the financial statements are free of material misstatement. An audit includes examining, on a test basis, evidence supporting the amounts and disclosures in the financial statements, assessing the accounting principles used and significant estimates made by management, and evaluating the overall financial statement presentation. We believe that our audits, which included confirmation of securities at March 31, 2009 by correspondence with the custodian, provide a reasonable basis for our opinion. The financial highlights for the year ended on March 31, 2005 were audited by another independent registered public accounting firm, whose report expressed an unqualified opinion thereon.
PricewaterhouseCoopers LLP
Boston, Massachusetts
May 15, 2009
| |
| 24 | Money Market Fund | Annual report |
Tax information
Unaudited
For federal income tax purposes, the following information is furnished with respect to the distributions of the Fund, if any, paid during its taxable year ended March 31, 2009.
The Fund hereby designates the maximum amount allowable of its net taxable income as qualified dividend income as provided in the Jobs and Growth Tax Relief Reconciliation Act of 2003. This amount will be reflected on Form 1099-DIV for the calendar year 2009.
Shareholders will be mailed a 2009 U.S. Treasury Department Form 1099-DIV in January 2010. This will reflect the total of all distributions that are taxable for calendar year 2009.
| |
| Annual report | Money Market Fund | 25 |
Board Consideration of and
Continuation of Investment Advisory
Agreement and Subadvisory
Agreement: John Hancock
Money Market Fund
The Investment Company Act of 1940 (the 1940 Act) requires the Board of Trustees (the Board) of John Hancock Current Interest (the Trust), including a majority of the Trustees who have no direct or indirect interest in the investment advisory agreement and are not “interested persons” of the Trust, as defined in the 1940 Act (the Independent Trustees), annually to meet in person to review and consider the continuation of: (i) the investment advisory agreement (the Advisory Agreement) with John Hancock Advisers, LLC (the Adviser) and (ii) the investment subadvisory agreement (the Subadvisory Agreement) with MFC Global Investment Management (U.S.), LLC (the Subadviser) for the John Hancock Money Market Fund (the Fund). The Advisory Agreement and the Subadvisory Agreement are collectively referred to as the Advisory Agreements.
At meetings held on May 5–6 and June 9–10, 2008, the Board considered the factors and reached the conclusions described below relating to the selection of the Adviser and Subadviser and the continuation of the Advisory Agreements. During such meetings, the Board’s Contracts/Operations Committee and the Independent Trustees also met in executive sessions with their independent legal counsel.
In evaluating the Advisory Agreements, the Board, including the Contracts/Operations Committee and its Independent Trustees, reviewed a broad range of information requested for this purpose. This information included:
(i) the investment performance of the Fund relative to a category of relevant funds (the Category) and a peer group of comparable funds (the Peer Group). The funds within each Category and Peer Group were selected by Morningstar Inc. (Morningstar), an independent provider of investment company data. Data covered a range of periods ended December 31, 2007,
(ii) advisory and other fees incurred by, and the expense ratios of, the Fund relative to a Category and a Peer Group,
(iii) the advisory fees of comparable portfolios of other clients of the Adviser and the Subadviser,
(iv) the Adviser’s financial results and condition, including its and certain of its affiliates’ profitability from services performed for the Fund,
(v) breakpoints in the Fund’s and the Peer Group’s fees, and information about economies of scale,
(vi) the Adviser’s and Subadviser’s record of compliance with applicable laws and regulations, with the Fund’s investment policies and restrictions, and with the applicable Code of Ethics, and the structure and responsibilities of the Adviser’s and Subadviser’s compliance department,
(vii) the background and experience of senior management and investment professionals, and
(viii) the nature, cost and character of advisory and non-investment management services provided by the Adviser and its affiliates and by the Subadviser.
The Independent Trustees considered the legal advice of independent legal counsel and relied on their own business judgment in determining the factors to be considered in evaluating the materials that were presented to them and the weight to be given to each such factor. The Board’s review and conclusions were based on a comprehensive consideration of all information presented to the Board and not the result of any single controlling factor. The Board principally considered data on performance and other information provided by Morningstar as of December 31, 2007. The Board also considered updated performance information provided to it by the Adviser or Subadviser at its May and June 2008 meetings. Performance and other information may be quite different as of the date of this shareholders report. The key factors considered by the Board and the conclusions reached are described below.
| |
| 26 | Money Market Fund | Annual report |
Nature, extent and quality of services
The Board considered the ability of the Adviser and the Subadviser, based on their resources, reputation and other attributes, to attract and retain qualified investment professionals, including research, advisory, and supervisory personnel. The Board considered the investment philosophy, research and investment decision-making processes of the Adviser and Subadviser. The Board considered the Adviser’s execution of its oversight responsibilities. The Board further considered the culture of compliance, resources dedicated to compliance, compliance programs and compliance records of the Adviser and Subadviser. In addition, the Board took into account the administrative and other non-advisory services provided to the Fund by the Adviser and its affiliates.
Based on the above factors, together with those referenced below, the Board concluded that, within the context of its full deliberations, the nature, extent and quality of the investment advisory services provided to the Fund by the Adviser and Subadviser supported renewal of the Advisory Agreements.
Fund performance
The Board considered the performance results for the Fund over various time periods ended December 31, 2007. The Board also considered these results in comparison to the performance of the Category, as well as the Fund’s Peer Group and benchmark index. The Board reviewed with representatives of Morningstar the methodology used by Morningstar to select the funds in the Category and the Peer Group.
The Board noted that the Fund’s performance during all periods under review was lower than its benchmark index, the US Treasury T-Bill Auction Ave. — 3 Month, as was the Peer Group and Category medians. The Board also noted that the Fund’s performance during all periods under review was generally in line with the Peer Group and Category medians.
Investment advisory fee and subadvisory fee
rates and expenses
The Board reviewed and considered the contractual investment advisory fee rate payable by the Fund to the Adviser for investment advisory services (the Advisory Agreement Rate). The Board received and considered information comparing the Advisory Agreement Rate with the advisory fees for the Peer Group and Category. The Board noted that the Advisory Agreement Rate was higher than the Category and Peer Group median rates. The Board favorably considered the impact of fee waivers towards ultimately lowering the Advisory Agreement Rate.
The Board received and considered expense information regarding the Fund’s various components, including advisory fees, distribution and fees other than advisory and distribution fees, including transfer agent fees, custodian fees, and other miscellaneous fees (e.g., fees for accounting and legal services). The Board considered comparisons of these expenses to the Peer Group median. The Board also received and considered expense information regarding the Fund’s total operating expense ratio (Gross Expense Ratio) and total operating expense ratio after taking the fee waiver arrangement applicable to the Advisory Agreement Rate into account (Net Expense Ratio). The Board received and considered information comparing the Gross Expense Ratio and Net Expense Ratio of the Fund to that of the Peer Group and Category medians. The Board noted that the Fund’s Gross and Net Expense Ratios were higher than the median of the Peer Group and Category. The Board also note d that the most significant contributor to the difference was the Fund’s transfer agency expense, and noted factors contributing to such transfer agency expense.
The Adviser also discussed the Morningstar data and rankings, and other relevant information, for the Fund. Based on the above-referenced considerations and other factors, the Board concluded that the Fund’s overall performance and expenses supported the re-approval of the Advisory Agreements.
The Board also received information about the investment subadvisory fee rate (the Subadvisory Agreement Rate) payable by the Adviser to the Subadviser for investment sub-advisory services. The Board concluded that the Subadvisory Agreement Rate was fair and equitable, based on its consideration of the factors described here.
| |
| Annual report | Money Market Fund | 27 |
Profitability
The Board received and considered a detailed profitability analysis of the Adviser based on the Advisory Agreements, as well as on other relationships between the Fund and the Adviser and its affiliates, including the Subadviser. The Board also considered a comparison of the Adviser’s profitability to that of other similar investment advisers whose profit-ability information is publicly available. The Board concluded that, in light of the costs of providing investment management and other services to the Fund, the profits and other ancillary benefits reported by the Adviser were not unreasonable.
Economies of scale
The Board received and considered general information regarding economies of scale with respect to the management of the Fund, including the Fund’s ability to appropriately benefit from economies of scale under the Fund’s fee structure. The Board recognized the inherent limitations of any analysis of economies of scale, stemming largely from the Board’s understanding that most of the Adviser’s costs are not specific to individual Funds, but rather are incurred across a variety of products and services.
To the extent the Board and the Adviser were able to identify actual or potential economies of scale from Fund-specific or allocated expenses, in order to ensure that any such economies continue to be reasonably shared with the Fund as its assets increase, the Adviser and the Board agreed to continue the existing breakpoints to the Advisory Agreement Rate.
Information about services to other clients
The Board also received information about the nature, extent and quality of services and fee rates offered by the Adviser and Subadviser to their other clients, including other registered investment companies, institutional investors and separate accounts. The Board concluded that the Advisory Agreement Rate and the Subadvisory Agreement Rate were not unreasonable, taking into account fee rates offered to others by the Adviser and Subadviser, respectively, after giving effect to differences in services.
Other benefits to the Adviser
The Board received information regarding potential “fall-out” or ancillary benefits received by the Adviser and its affiliates, including the Subadviser, as a result of their relationship with the Fund. Such benefits could include, among others, benefits directly attributable to the relationship of the Adviser and Subadviser with the Fund and benefits potentially derived from an increase in business as a result of their relationship with the Fund (such as the ability to market to shareholders other financial products offered by the Adviser and its affiliates).
The Board also considered the effectiveness of the Adviser’s, Subadviser’s and Fund’s policies and procedures for complying with the requirements of the federal securities laws, including those relating to best execution of portfolio transactions and brokerage allocation.
Other factors and broader review
As discussed above, the Board reviewed detailed materials received from the Adviser and Subadviser as part of the annual re-approval process. The Board also regularly reviews and assesses the quality of the services that the Fund receives throughout the year. In this regard, the Board reviews reports of the Adviser at least quarterly, which include, among other things, fund performance reports and compliance reports. In addition, the Board meets with portfolio managers and senior investment officers at various times throughout the year.
After considering the above-described factors and based on its deliberations and its evaluation of the information described above, the Board concluded that approval of the continuation of the Advisory Agreements for the Fund was in the best interest of the Fund and its shareholders. Accordingly, the Board unanimously approved the continuation of the Advisory Agreements.
| |
| 28 | Money Market Fund | Annual report |
Trustees and Officers
This chart provides information about the Trustees and Officers who oversee your John Hancock fund. Officers elected by the Trustees manage the day-to-day operations of the Fund and execute policies formulated by the Trustees.
Independent Trustees
| | |
| Name, Year of Birth | | Number of John |
| Position(s) held with Fund | Trustee | Hancock funds |
| Principal occupation(s) and other | of Fund | overseen by |
| directorships during past 5 years | since1 | Trustee |
| |
| Patti McGill Peterson, Born: 1943 | 2005 | 50 |
|
| Chairperson (since December 2008); Principal, PMP Globalinc (consulting) (since 2007); Senior |
| Associate, Institute for Higher Education Policy (since 2007); Executive Director, CIES (international |
| education agency) (until 2007); Vice President, Institute of International Education (until 2007); Senior |
| Fellow, Cornell University Institute of Public Affairs, Cornell University (until 1998); Former President |
| Wells College, St. Lawrence University and the Association of Colleges and Universities of the State |
| of New York. Director of the following: Niagara Mohawk Power Corporation (until 2003); Security |
| Mutual Life (insurance) (until 1997); ONBANK (until 1993). Trustee of the following: Board of Visitors, |
| The University of Wisconsin, Madison (since 2007); Ford Foundation, International Fellowships Program |
| (until 2007); UNCF, International Development Partnerships (until 2005); Roth Endowment (since 2002); |
| Council for International Educational Exchange (since 2003). | | |
|
| |
| James F. Carlin, Born: 1940 | 1995 | 50 |
|
| Director and Treasurer, Alpha Analytical Laboratories, Inc. (chemical analysis) (since 1985); Part Owner |
| and Treasurer, Lawrence Carlin Insurance Agency, Inc. (since 1995); Part Owner and Vice President, |
| Mone Lawrence Carlin Insurance Agency, Inc. (until 2005); Chairman and Chief Executive Officer, |
| Carlin Consolidated, Inc. (management/investments) (since 1987); Trustee, Massachusetts Health and |
| Education Tax Exempt Trust (1993–2003). | | |
|
| |
| William H. Cunningham,2 Born: 1944 | 1995 | 50 |
|
| Professor, University of Texas at Austin (since 1971); former Chancellor, University of Texas System and |
| former President, University of Texas at Austin (until 2001); Chairman and Chief Executive Officer, IBT |
| Technologies (until 2001); Director of the following: Hicks Acquisition Company I, Inc. (since 2007); |
| Hire.com (until 2004), STC Broadcasting, Inc. and Sunrise Television Corp. (until 2001), Symtx, Inc. |
| (electronic manufacturing) (since 2001), Adorno/Rogers Technology, Inc. (until 2004), Pinnacle Foods |
| Corporation (until 2003), rateGenius (until 2003), Lincoln National Corporation (insurance) (since 2006), |
| Jefferson-Pilot Corporation (diversified life insurance company) (until 2006), New Century Equity |
| Holdings (formerly Billing Concepts) (until 2001), eCertain (until 2001), ClassMap.com (until 2001), Agile |
| Ventures (until 2001), AskRed.com (until 2001), Southwest Airlines (since 2000), Introgen (manufacturer |
| of biopharmaceuticals) (since 2000) and Viasystems Group, Inc. (electronic manufacturer) (until |
| 2003); Advisory Director, Interactive Bridge, Inc. (college fundraising) (until 2001); Advisory Director, |
| Q Investments (until 2003); Advisory Director, JPMorgan Chase Bank (formerly Texas Commerce |
| Bank–Austin), LIN Television (until 2008), WilTel Communications (until 2003) and Hayes Lemmerz |
| International, Inc. (diversified automotive parts supply company) (since 2003). | |
|
| |
| Deborah C. Jackson,2,4 Born: 1952 | 2008 | 50 |
|
| Chief Executive Officer, American Red Cross of Massachusetts Bay (since 2002); Board of Directors of |
| Eastern Bank Corporation (since 2001); Board of Directors of Eastern Bank Charitable Foundation (since |
| 2001); Board of Directors of American Student Association Corp. (since 1996); Board of Directors of |
| Boston Stock Exchange (2002–2008); Board of Directors of Harvard Pilgrim Healthcare (since 2007). |
| |
| Annual report | Money Market Fund | 29 |
Independent Trustees (continued)
| | |
| Name, Year of Birth | | Number of John |
| Position(s) held with Fund | Trustee | Hancock funds |
| Principal occupation(s) and other | of Fund | overseen by |
| directorships during past 5 years | since1 | Trustee |
| |
| Charles L. Ladner, Born: 1938 | 1995 | 50 |
|
| Chairman and Trustee, Dunwoody Village, Inc. (retirement services); Senior Vice President and Chief |
| Financial Officer, UGI Corporation (public utility holding company) (retired 1998); Vice President and |
| Director, AmeriGas, Inc. (retired 1998); Director, AmeriGas Partners, L.P. (gas distribution) (until 1997); |
| Director, EnergyNorth, Inc. (until 1997); Director, Parks and History Association (until 2005). |
|
| |
| Stanley Martin,2,4 Born: 1947 | 2008 | 50 |
|
| Senior Vice President/Audit Executive, Federal Home Loan Mortgage Corporation (2004–2006); |
| Executive Vice President/Consultant, HSBC Bank USA (2000–2003); Chief Financial Officer/Executive |
| Vice President, Republic New York Corporation and Republic National Bank of New York (1998–2000); |
| Partner, KPMG LLP (1971–1998). | | |
|
| |
| Dr. John A. Moore, Born: 1939 | 2005 | 50 |
|
| President and Chief Executive Officer, Institute for Evaluating Health Risks (nonprofit institution) |
| (until 2001); Senior Scientist, Sciences International (health research) (until 2003); Former Assistant |
| Administrator and Deputy Administrator, Environmental Protection Agency; Principal, Hollyhouse |
| (consulting) (since 2000); Director, CIIT Center for Health Science Research (nonprofit research) (until |
| 2007). | | |
|
| |
| Steven R. Pruchansky, Born: 1944 | 1995 | 50 |
|
| Chairman and Chief Executive Officer, Greenscapes of Southwest Florida, Inc. (since 2000); Director |
| and President, Greenscapes of Southwest Florida, Inc. (until 2000); Member, Board of Advisors, First |
| American Bank (since 2008); Managing Director, JonJames, LLC (real estate) (since 2000); Director, |
| First Signature Bank & Trust Company (until 1991); Director, Mast Realty Trust (until 1994); President, |
| Maxwell Building Corp. (until 1991). | | |
|
| |
| Gregory A. Russo,4 Born: 1949 | 2009 | 50 |
|
| Vice Chairman, Risk & Regulatory Matters, KPMG LLP (KPMG) (2002–2006); Vice Chairman, Industrial |
| Markets, KPMG (1998–2002). | | |
| |
| | | |
| Non-Independent Trustees3 | | |
| Name, Year of Birth | | Number of John |
| Position(s) held with Fund | Trustee | Hancock funds |
| Principal occupation(s) and other | of Fund | overseen by |
| directorships during past 5 years | since1 | Trustee |
| |
| James R. Boyle, Born: 1959 | 2005 | 268 |
|
| Executive Vice President, Manulife Financial Corporation (since 1999); Director and President, John |
| Hancock Variable Life Insurance Company (since 2007); Director and Executive Vice President, John |
| Hancock Life Insurance Company (since 2004); Chairman and Director, John Hancock Advisers, LLC (the |
| Adviser), John Hancock Funds, LLC (John Hancock Funds) and The Berkeley Financial Group, LLC (The |
| Berkeley Group) (holding company) (since 2005); Chairman and Director, John Hancock Investment |
| Management Services, LLC (since 2006); Senior Vice President, The Manufacturers Life Insurance |
| Company (U.S.A.) (until 2004). | | |
| |
| 30 | Money Market Fund | Annual report |
Non-Independent Trustees3 (continued)
| | |
| Name, Year of Birth | | Number of John |
| Position(s) held with Fund | Trustee | Hancock funds |
| Principal occupation(s) and other | of Fund | overseen by |
| directorships during past 5 years | since1 | Trustee |
| |
| John G. Vrysen,4 Born: 1955 | 2009 | 268 |
|
| Chief Operating Officer (since 2005) | | |
| Senior Vice President, Manulife Financial Corporation (since 2006); Director, Executive Vice President |
| and Chief Operating Officer, the Adviser, The Berkeley Group, John Hancock Investment Management |
| Services, LLC and John Hancock Funds, LLC (since 2007); Chief Operating Officer, John Hancock Funds, |
| John Hancock Funds II, John Hancock Funds III and John Hancock Trust (since 2007); Director, John |
| Hancock Signature Services, Inc. (since 2005); Chief Financial Officer, the Adviser, The Berkeley Group, |
| Manulife Financial Corporation Global Investment Management (U.S.), LLC, John Hancock Investment |
| Management Services, LLC, John Hancock Funds, LLC, John Hancock Funds, John Hancock Funds |
| II, John Hancock Funds III and John Hancock Trust (2005–2007); Vice President, Manulife Financial |
| Corporation (until 2006). | | |
Principal officers who are not Trustees
| |
| Name, Year of Birth | |
| Position(s) held with Fund | Officer |
| Principal occupation(s) and other | of Fund |
| directorships during past 5 years | since |
| |
| Keith F. Hartstein, Born: 1956 | 2005 |
|
| President and Chief Executive Officer | |
| Senior Vice President, Manulife Financial Corporation (since 2004); Director, President and Chief | |
| Executive Officer, the Adviser, The Berkeley Group and John Hancock Funds, LLC (since 2005); Director, |
| MFC Global Investment Management (U.S.), LLC (MFC Global (U.S.)) (since 2005); Chairman and | |
| Director, John Hancock Signature Services, Inc. (since 2005); Director, President and Chief Executive |
| Officer, John Hancock Investment Management Services, LLC (since 2006); President and Chief | |
| Executive Officer, John Hancock Funds, John Hancock Funds II, John Hancock Funds III and John | |
| Hancock Trust (since 2005); Director, Chairman and President, NM Capital Management, Inc. (since |
| 2005); Member and former Chairman, Investment Company Institute Sales Force Marketing Committee |
| (since 2003); Director, President and Chief Executive Officer, MFC Global (U.S.) (2005–2006); Executive |
| Vice President, John Hancock Funds, LLC (until 2005). | |
|
| |
| Thomas M. Kinzler, Born: 1955 | 2006 |
|
| Secretary and Chief Legal Officer | |
| Vice President and Counsel, John Hancock Life Insurance Company (U.S.A.) (since 2006); Secretary |
| and Chief Legal Officer, John Hancock Funds, John Hancock Funds II and John Hancock Trust (since |
| 2006); Vice President and Associate General Counsel, Massachusetts Mutual Life Insurance Company |
| (1999–2006); Secretary and Chief Legal Counsel, MML Series Investment Fund (2000–2006); Secretary |
| and Chief Legal Counsel, MassMutual Institutional Funds (2000–2004); Secretary and Chief Legal | |
| Counsel, MassMutual Select Funds and MassMutual Premier Funds (2004–2006). | |
|
| |
| Francis V. Knox, Jr., Born: 1947 | 2005 |
|
| Chief Compliance Officer | |
| Vice President and Chief Compliance Officer, John Hancock Investment Management Services, LLC, |
| the Adviser and MFC Global (U.S.) (since 2005); Chief Compliance Officer, John Hancock Funds, John |
| Hancock Funds II, John Hancock Funds III and John Hancock Trust (since 2005); Vice President and |
| Assistant Treasurer, Fidelity Group of Funds (until 2004); Vice President and Ethics & Compliance Officer, |
| Fidelity Investments (until 2001). | |
| |
| Annual report | Money Market Fund | 31 |
Principal officers who are not Trustees (continued)
| |
| Name, Year of Birth | |
| Position(s) held with Fund | Officer |
| Principal occupation(s) and other | of Fund |
| directorships during past 5 years | since |
| |
| Michael J. Leary, Born: 1965 | 2009 |
|
| Treasurer | |
| Vice President, John Hancock Life Insurance Company (U.S.A.) and Assistant Treasurer for John Hancock |
| Funds, John Hancock Funds II, John Hancock Funds III and John Hancock Trust (since 2007); Vice | |
| President and Director of Fund Administration, JP Morgan (2004–2007); Vice President and Senior |
| Manager of Fund Administration, JP Morgan (1993–2004); Manager, Ernst & Young, LLC (1988–1993). |
|
| |
| Charles A. Rizzo, Born: 1957 | 2007 |
|
| Chief Financial Officer | |
| Chief Financial Officer, John Hancock Funds, John Hancock Funds II, John Hancock Funds III and John |
| Hancock Trust (since 2007); Assistant Treasurer, Goldman Sachs Mutual Fund Complex (registered |
| investment companies) (2005–2007); Vice President, Goldman Sachs (2005–2007); Managing Director |
| and Treasurer of Scudder Funds, Deutsche Asset Management (2003–2005); Director, Tax and Financial |
| Reporting, Deutsche Asset Management (2002–2003); Vice President and Treasurer, Deutsche Global |
| Fund Services (1999–2002). | |
The business address for all Trustees and Officers is 601 Congress Street, Boston, Massachusetts 02210-2805.
The Statement of Additional Information of the Fund includes additional information about members of the Board of Trustees of the Fund and is available without charge, upon request, by calling 1-800-225-5291.
1 Each Trustee serves until resignation, retirement age or until his or her successor is elected.
2 Member of Audit Committee.
3 Non-Independent Trustees hold positions with the Fund’s investment adviser, underwriter and certain other affiliates.
4 Mr. Martin was appointed by the Board as Trustee on September 8, 2008 and Ms. Jackson was appointed effective October 1, 2008. Mr. Russo and Mr. Vrysen were elected by the shareholders at a special meeting on April 16, 2009.
| |
| 32 | Money Market Fund | Annual report |
More information
| |
| Trustees | Investment adviser |
| Patti McGill Peterson, Chairperson | John Hancock Advisers, LLC |
| James R. Boyle† | |
| James F. Carlin | Subadviser |
| William H. Cunningham* | MFC Global Investment |
| Deborah C. Jackson* | Management (U.S.), LLC |
| Charles L. Ladner | |
| Stanley Martin* | Principal distributor |
| Dr. John A. Moore | John Hancock Funds, LLC |
| Steven R. Pruchansky | |
| Gregory A. Russo | Custodian |
| John G. Vrysen† | The Bank of New York Mellon |
| |
| *Member of the Audit Committee | Transfer agent |
| †Non-Independent Trustee | John Hancock Signature Services, Inc. |
| |
| Officers | Legal counsel |
| Keith F. Hartstein | K&L Gates LLP |
| President and Chief Executive Officer | |
| Independent registered |
| Thomas M. Kinzler | public accounting firm |
| Secretary and Chief Legal Officer | PricewaterhouseCoopers LLP |
| | |
| Francis V. Knox, Jr. | |
| Chief Compliance Officer | |
| | |
| Michael J. Leary | |
| Treasurer | |
| | |
| Charles A. Rizzo | |
| Chief Financial Officer | |
| | |
| John G. Vrysen | |
| Chief Operating Officer | |
Additional information about your fund is available without charge in several ways. As required by the SEC, you can access proxy voting information and quarterly portfolio information on your fund. The proxy voting information includes a description of proxy voting policies, procedures and information regarding how the fund voted proxies relating to portfolio securities during the most recent twelve-month period ended June 30. The quarterly portfolio information that includes a complete list of the fund’s holdings for the first and third quarters of the fund’s fiscal period is filed on Form N-Q. You have access to this information:
| | | |
| By phone | On the fund’s Website | At the SEC |
| 1-800-225-5291 | www.jhfunds.com | www.sec.gov |
| | | | 1-800-SEC-0330 |
| | | | SEC Public Reference Room |
|
| |
| You can also contact us: | | | |
| Regular mail: | | Express mail: | |
| John Hancock Signature Services, Inc. | John Hancock Signature Services, Inc. |
| P.O. Box 9510 | | Mutual Fund Image Operations |
| Portsmouth, NH 03802-9510 | | 164 Corporate Drive | |
| | | Portsmouth, NH 03801 | |
| | |
Month-end portfolio holdings are available at www.jhfunds.com.
| |
| Annual report | Money Market Fund | 33 |

1-800-225-5291
1-800-554-6713 TDD
1-800-338-8080 EASI-Line
www.jhfunds.com
Now available: electronic delivery
www.jhfunds.com/edelivery
| |
| This report is for the information of the shareholders of John Hancock Money Market Fund. | 4400A 3/09 |
| It is not authorized for distribution to prospective investors unless preceded or accompanied by a prospectus. | 5/09 |
ITEM 2. CODE OF ETHICS.
As of the end of the period, March 31, 2009, the registrant has adopted a code of ethics, as defined in Item 2 of Form N-CSR, that applies to its Chief Executive Officer, Chief Financial Officer and Treasurer (respectively, the principal executive officer, the principal financial officer and the principal accounting officer, the “Senior Financial Officers”). A copy of the code of ethics is filed as an exhibit to this Form N-CSR.
ITEM 3. AUDIT COMMITTEE FINANCIAL EXPERT.
Stanley Martin is the audit committee financial expert and is “independent”, pursuant to general instructions on Form N-CSR Item 3.
ITEM 4. PRINCIPAL ACCOUNTANT FEES AND SERVICES.
(a) Audit Fees
The aggregate fees billed for professional services rendered by the principal accountant(s) for the audit of the registrant’s annual financial statements or services that are normally provided by the accountant(s) in connection with statutory and regulatory filings or engagements amounted to $33,558 for the fiscal year ended March 31, 2009 for the John Hancock Money Market Fund and $23,900 for the fiscal year ended March 31, 2008 for John Hancock Money Market Fund (John Hancock U.S. Government Cash Reserve merged into John Hancock Money Market Fund on September 14, 2007). These fees were billed to the registrant and were approved by the registrant’s audit committee.
(b) Audit-Related Services
There were no audit-related fees during the fiscal year ended March 31, 2009 and fiscal year ended March 31, 2008 billed to the registrant or to the registrant's investment adviser (not including any sub-adviser whose role is primarily portfolio management and is subcontracted with or overseen by another investment adviser), and any entity controlling, controlled by, or under common control with the adviser that provides ongoing services to the registrant ("control affiliates").
(c) Tax Fees
The aggregate fees billed for professional services rendered by the principal accountant(s) for the tax compliance, tax advice and tax planning (“tax fees”) amounted to $3,000 for the fiscal year ended March 31, 2009 for the John Hancock Money Market Fund and $3,000 for the fiscal year ended March 31, 2008 for the John Hancock Money Market Fund. The nature of the services comprising the tax fees was the review of the registrant’s income tax returns and tax distribution requirements. These fees were billed to the registrant and were approved by the registrant’s audit committee. There were no tax fees billed to the control affiliates.
(d) All Other Fees
Other fees billed for professional services rendered by the principal accountant(s) for discussions on income distributions amounted to $3,333 for the fiscal year ended March 31, 2009 for the John Hancock Money Market Fund and $0 for fiscal year ended March 31, 2008 billed to the registrant or to the control affiliates.
(e)(1) Audit Committee Pre-Approval Policies and Procedures:
The trust’s Audit Committee must pre-approve all audit and non-audit services provided by the independent registered public accounting firm (the “Auditor”) relating to the operations or financial reporting of the funds. Prior to the commencement of any audit or non-audit services to a fund, the Audit Committee reviews the services to determine whether they are appropriate and permissible under applicable law.
The trust’s Audit Committee has adopted policies and procedures to, among other purposes, provide a framework for the Committee’s consideration of audit-related and non-audit services by the Auditor. The policies and procedures require that any audit-related and non-audit service provided by the Auditor and any non-audit service provided by the Auditor to a fund service provider that relates directly to the operations and financial reporting of a fund are subject to approval by the Audit Committee before such service is provided. Audit-related services provided by the Auditor that are expected to exceed $25,000 per instance/per fund are subject to specific pre-approval by the Audit Committee. Tax services provided by the Auditor that are expected to exceed $30,000 per instance/per fund are subject to specific pre-approval by the Audit Committee.
All audit services, as well as the audit-related and non-audit services that are expected to exceed the amounts stated above, must be approved in advance of provision of the service by formal resolution of the Audit Committee. At the regularly scheduled Audit Committee meetings, the Committee reviews a report summarizing the services, including fees, provided by the Auditor.
(e)(2) Services approved pursuant to paragraph (c)(7)(i)(C) of Rule 2-01 of Regulation S-X:
Audit-Related Fees, Tax Fees and All Other Fees:
There were no amounts that were approved by the Audit Committee pursuant to the de minimis exception under Rule 2-01 of Regulation S-X.
(f) According to the registrant’s principal accountant, for the fiscal year ended March 31, 2009, the percentage of hours spent on the audit of the registrant's financial statements for the most recent fiscal year that were attributed to work performed by persons who were not full-time, permanent employees of principal accountant was less than 50%.
(g) The aggregate non-audit fees billed by the registrant's accountant(s) for services rendered to the registrant and rendered to the registrant's control affiliates for each of the last two fiscal years of the registrant were $8, 554,582 for the fiscal year ended March 31, 2009 and $1,354,936 for the fiscal year ended March 31, 2008.
(h) The audit committee of the registrant has considered the non-audit services provided by the registrant’s principal accountant(s) to the control affiliates and has determined that the services that were not pre-approved are compatible with maintaining the principal accountant(s)' independence.
ITEM 5. AUDIT COMMITTEE OF LISTED REGISTRANTS.
The registrant has a separately-designated standing audit committee comprised of independent trustees. The members of the audit committee are as follows:
Stanley Martin - Chairman
William H. Cunningham
Deborah C. Jackson
ITEM 6. SCHEDULE OF INVESTMENTS.
(a) Not applicable.
(b) Not applicable.
ITEM 7. DISCLOSURE OF PROXY VOTING POLICIES AND PROCEDURES FOR CLOSED-END MANAGEMENT INVESTMENT COMPANIES.
Not applicable.
ITEM 8. PORTFOLIO MANAGERS OF CLOSED-END MANAGEMENT INVESTMENT COMPANIES.
Not applicable.
ITEM 9. PURCHASES OF EQUITY SECURITIES BY CLOSED-END MANAGEMENT INVESTMENT COMPANY AND AFFILIATED PURCHASERS.
Not applicable.
ITEM 10. SUBMISSION OF MATTERS TO A VOTE OF SECURITY HOLDERS.
There were no material changes to previously disclosed John Hancock Funds – Governance Committee Charter.
ITEM 11. CONTROLS AND PROCEDURES.
(a) Based upon their evaluation of the registrant's disclosure controls and procedures as conducted within 90 days of the filing date of this Form N-CSR, the registrant's principal executive officer and principal financial officer have concluded that those disclosure controls and procedures provide reasonable assurance that the material information required to be disclosed by the registrant on this report is recorded, processed, summarized and reported within the time periods specified in the Securities and Exchange Commission's rules and forms.
(b) There were no changes in the registrant's internal control over financial reporting that occurred during the registrant's most recent fiscal half-year (the registrant's second fiscal half-year in the case of an annual report) that have materially affected, or are reasonably likely to materially affect, the registrant's internal control over financial reporting.
ITEM 12. EXHIBITS.
(a)(1) Code of Ethics for Senior Financial Officers is attached.
(a)(2) Separate certifications for the registrant's principal executive officer and principal financial officer, as required by Section 302 of the Sarbanes-Oxley Act of 2002 and Rule 30a-2(a) under the Investment Company Act of 1940, are attached.
(b) Separate certifications for the registrant's principal executive officer and principal financial officer, as required by 18 U.S.C. Section 1350, as adopted pursuant to Section 906 of the Sarbanes-Oxley Act of 2002, and Rule 30a-2(b) under the Investment Company Act of 1940, are attached. The certifications furnished pursuant to this paragraph are not deemed to be "filed" for purposes of Section 18 of the Securities Exchange Act of 1934, or otherwise subject to the liability of that section. Such certifications are not deemed to be incorporated by reference into any filing under the Securities Act of 1933 or the Securities Exchange Act of 1934, except to the extent that the Registrant specifically incorporates them by reference.
(c)(1) Submission of Matters to a Vote of Security Holders is attached. See attached “John Hancock Funds – Governance Committee Charter”.
(c)(2) Contact person at the registrant.
Pursuant to the requirements of the Securities Exchange Act of 1934 and the Investment Company Act of 1940, the registrant has duly caused this report to be signed on its behalf by the undersigned, thereunto duly authorized.
John Hancock Current Interest
By: /s/ Keith F. Hartstein
-------------------------------------
Keith F. Hartstein
President and Chief Executive Officer
Date: May 15, 2009
Pursuant to the requirements of the Securities Exchange Act of 1934 and the Investment Company Act of 1940, this report has been signed below by the following persons on behalf of the registrant and in the capacities and on the dates indicated.
By: /s/ Keith F. Hartstein
-------------------------------------
Keith F. Hartstein
President and Chief Executive Officer
Date: May 15, 2009
By: /s/ Charles A. Rizzo
-------------------------------------
Charles A. Rizzo
Chief Financial Officer
Date: May 15, 2009