| |
| UNITED STATES |
| SECURITIES AND EXCHANGE COMMISSION |
| Washington, D.C. 20549 |
| |
| FORM N-CSR |
| |
| CERTIFIED SHAREHOLDER REPORT OF REGISTERED |
| |
| MANAGEMENT INVESTMENT COMPANIES |
| |
| Investment Company Act file number 811- 2485 |
| |
| John Hancock Current Interest |
| (Exact name of registrant as specified in charter) |
| |
| 601 Congress Street, Boston, Massachusetts 02210 |
| (Address of principal executive offices) (Zip code) |
| |
| Salvatore Schiavone |
| Treasurer |
| |
| 601 Congress Street |
| |
| Boston, Massachusetts 02210 |
| |
| (Name and address of agent for service) |
| |
| Registrant's telephone number, including area code: 617-663-4497 |
| |
| Date of fiscal year end: | March 31 |
| |
| Date of reporting period: | March 31, 2011 |

Management’s discussion of
Fund performance
By John Hancock Asset Management (formerly MFC Global Investment Management (U.S.), LLC)1
During the 12 months ended March 31, 2011, money market yields remained at rock-bottom lows, as the Federal Reserve Board kept its key federal funds rate (the rate banks charge each other for overnight loans) at a range of 0.00% to 0.25%. The Fed has kept its stance since December 2008 in reaction to weak economic conditions that, while showing signs of improvement, still suffer from steep unemployment and an ongoing housing crisis.
On March 31, 2011, John Hancock Money Market Fund’s Class A, Class B and Class C shares all had 7-day effective yields of 0.00%. By comparison, the average taxable money market fund had a 7-day effective yield of 0.02%, according to Lipper, Inc. For the year ended March 31, 2011, the Fund’s Class A, Class B and Class C shares each posted a total return of 0.01%, compared with the 0.03% return of the average taxable money market fund, according to Lipper. The Fund’s yield remained at 0.00% during the period since the level of income the Fund collects from the securities it holds was not sufficient to cover the costs of running the Fund. In addition to existing contractual agreements regarding fee waivers and/or expense reimbursements, the Fund’s adviser and its affiliates are currently voluntarily reimbursing expenses and/or waiving fees to the extent necessary to assist the Fund in attempting to avoid a negative yield.
Based on the economic conditions that continued to affect the market, it was clear that the Federal Reserve would keep the fed funds rate unchanged through the end of the period. Our strategy throughout the year was to continue to extend out the money market curve in order to pick up additional yield for the Fund. Earlier in the year we primarily focused on adding fixed-rate debt to the Fund’s portfolio, picking up incremental yield over floating-rate debt. However, as the year progressed we began to slowly integrate both floating- and fixed-rate paper into the Fund.
An investment in the Fund is not a bank deposit and is not insured or guaranteed by the Federal Deposit Insurance Corporation or any other government agency. Although the Fund seeks to maintain a stable $1.00 per share price, the value of the Fund’s shares could go down in price, meaning that you could lose money by investing in the Fund.
This commentary reflects the views of the portfolio management team through the end of the Fund’s period discussed in this report. The team’s statements reflect its own opinions. As such, they are in no way guarantees of future events and are not intended to be used as investment advice or a recommendation regarding any specific security. They are also subject to change at any time as market and other conditions warrant.
Past performance is no guarantee of future results.
1 Manulife Asset Management (US) LLC is doing business as John Hancock Asset Management.
| |
| Annual report | Money Market Fund | 5 |
Your expenses
These examples are intended to help you understand your ongoing operating expenses.
Understanding fund expenses
As a shareholder of the Fund, you incur two types of costs:
▪ Transaction costs which include sales charges (loads) on purchases or redemptions (varies by share class), minimum account fee charge, etc.
▪ Ongoing operating expenses including management fees, distribution and service fees (if applicable), and other fund expenses.
We are going to present only your ongoing operating expenses here.
Actual expenses/actual returns
This example is intended to provide information about the Fund’s actual ongoing operating expenses, and is based on the Fund’s actual return. It assumes an account value of $1,000.00 on October 1, 2010 with the same investment held until March 31, 2011.
| | | |
| | Account value | Ending value | Expenses paid during |
| | on 10-1-10 | on 3-31-11 | period ended 3-31-111 |
|
| Class A | $1,000.00 | $1,000.10 | $1.45 |
|
| Class B | 1,000.00 | 1,000.10 | 1.45 |
|
| Class C | 1,000.00 | 1,000.10 | 1.45 |
|
Together with the value of your account, you may use this information to estimate the operating expenses that you paid over the period. Simply divide your account value at March 31, 2011, by $1,000.00, then multiply it by the “expenses paid” for your share class from the table above. For example, for an account value of $8,600.00, the operating expenses should be calculated as follows:
| |
| 6 | Money Market Fund | Annual report |
Hypothetical example for comparison purposes
This table allows you to compare the Fund’s ongoing operating expenses with those of any other fund. It provides an example of the Fund’s hypothetical account values and hypothetical expenses based on each class’s actual expense ratio and an assumed 5% annualized return before expenses (which is not the Fund’s actual return). It assumes an account value of $1,000.00 on October 1, 2010, with the same investment held until March 31, 2011. Look in any other fund shareholder report to find its hypothetical example and you will be able to compare these expenses.
| | | |
| | Account value | Ending value | Expenses paid during |
| | on 10-1-10 | on 3-31-11 | period ended 3-31-111 |
|
| Class A | $1,000.00 | $1,023.50 | $1.46 |
|
| Class B | 1,000.00 | 1,023.50 | 1.46 |
|
| Class C | 1,000.00 | 1,023.50 | 1.46 |
|
Remember, these examples do not include any transaction costs, therefore, these examples will not help you to determine the relative total costs of owning different funds. If transaction costs were included, your expenses would have been higher. See the prospectus for details regarding transaction costs.
1 Expenses are equal to the Fund’s annualized expense ratio of 0.29%, 0.29% and 0.29% for Class A, Class B and Class C shares, respectively, multiplied by the average account value over the period, multiplied by 182/365 (to reflect the one-half year period).
| |
| Annual report | Money Market Fund | 7 |
Portfolio summary
| |
| Maturity Composition1 | |
|
| Maturity (days) | |
|
| 0 – 30 | 66% |
|
| 31 – 60 | 9% |
|
| 61 – 90 | 20% |
|
| Over 90 | 5% |
|
| Average maturity: 34 days |
1 As a percentage of net assets on 3-31-11.
| |
| 8 | Money Market Fund | Annual report |
Fund’s investments
As of 3-31-11
| | | | |
| | Maturity Date | Yield* (%) | Par value | Value |
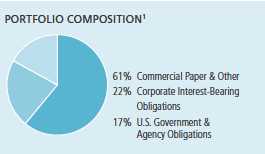
| Commercial Paper 60.59% | | | $254,136,563 |
|
| (Cost $254,136,563) | | | | |
| | | | | |
| Bank of America Corp. | 4-1-11 | 0.190 | $20,000,000 | 20,000,000 |
|
| Bank of Nova Scotia | 4-1-11 | 0.090 | 20,000,000 | 20,000,000 |
|
| Barclays U.S. Funding LLC | 4-5-11 | 0.100 | 20,000,00 | 19,999,778 |
|
| BNP Paribas Finance, Inc. | 4-4-11 | 0.230 | 13,000,000 | 12,999,751 |
|
| CAFCO LLC | 4-11-11 | 0.200 | 17,000,000 | 16,999,056 |
|
| Caterpillar Financial Services Corp. | 4-1-11 | 0.160 | 17,000,000 | 17,000,000 |
|
| Falcon Asset Securitization Company LLC | 4-7-11 | 0.140 | 20,000,000 | 19,999,533 |
|
| Govco LLC | 4-12-11 to 5-31-11 | 0.210 to 0.270 | 20,500,000 | 20,496,755 |
|
| International Business Machines Corp. | 4-6-11 | 0.110 | 15,000,000 | 14,999,771 |
|
| John Deere Credit, Ltd. | 4-4-11 | 0.190 | 14,000,000 | 13,999,778 |
|
| Jupiter Securitization Company LLC | 4-11-11 | 0.160 | 18,000,000 | 17,999,200 |
|
| Nestle Capital Corp. | 4-1-11 to 4-6-11 | 0.020 | 19,000,000 | 18,999,972 |
|
| Societe Generale North America, Inc. | 4-1-11 to 4-11-11 | 0.130 to 0.170 | 20,644,000 | 20,643,386 |
|
| The Coca-Cola Company | 4-6-11 | 0.150 | 20,000,000 | 19,999,583 |
| |
| Corporate Interest-Bearing Obligations 22.13% | | $92,827,763 |
|
| (Cost $92,827,763) | | | | |
| | | | | |
| American Honda Finance Corp. (P)(S) | 6-29-11 | 2.658 | 17,100,000 | 17,199,908 |
|
| Australia & New Zealand Banking Group, Ltd. | 11-14-11 | 5.125 | 3,000,000 | 3,085,081 |
|
| Australia & New Zealand Banking Group, Ltd. (P)(S) | 10-21-11 | 0.603 | 10,000,000 | 10,014,685 |
|
| Caterpillar Financial Services Corp. (P) | 6-24-11 | 1.059 | 3,450,000 | 3,456,475 |
|
| Credit Suisse USA, Inc. | 11-15-11 | 6.125 | 2,070,000 | 2,139,420 |
|
| John Deere Capital Corp. | 10-17-11 | 5.400 | 6,500,000 | 6,675,641 |
|
| JPMorgan Chase & Company (P) | 2-22-12 | 0.403 | 3,500,000 | 3,502,662 |
|
| Morgan Stanley | 4-15-11 | 6.750 | 4,575,000 | 4,586,160 |
|
| Procter & Gamble International Funding SCA | 8-26-11 | 1.350 | 800,000 | 803,482 |
|
| Sanofi-Aventis SA (P) | 3-28-12 | 0.358 | 15,000,000 | 15,000,000 |
|
| Toyota Motor Credit Corp. | 5-18-11 | 5.450 | 5,215,000 | 5,249,149 |
|
| UBS AG (P) | 2-23-12 | 1.413 | 15,025,000 | 15,145,538 |
|
| Wells Fargo & Company | 8-26-11 | 5.300 | 5,855,000 | 5,969,562 |
| | |
| See notes to financial statements | Annual report | Money Market Fund | 9 |
| | | | |
| | Maturity Date | Yield* (%) | Par value | Value |
| U.S. Government & Agency Obligations 16.69% | | $70,014,801 |
|
| (Cost $70,014,801) | | | | |
| | | | | |
| Bank of America Corp. (J)(P) | 4-30-12 to 6-22-12 | 0.509 to 0.604 | $14,000,000 | 14,000,000 |
|
| Citigroup Funding, Inc. (J)(P) | 3-30-12 | 0.607 | 2,000,000 | 2,000,000 |
|
| General Electric Capital Corp. (J)(P) | 3-12-12 | 0.510 | 5,000,000 | 5,000,000 |
|
| JPMorgan Chase & Company (J)(P) | 6-15-12 to 12-26-12 | 0.540 to 0.559 | 13,000,000 | 13,008,379 |
|
| Morgan Stanley (J)(P) | 2-10-12 to 6-20-12 | 0.510 to 0.659 | 15,000,000 | 15,000,000 |
|
| The Goldman Sachs Group, Inc. (J)(P) | 11-9-11 to 3-15-12 | 0.510 to 0.562 | 12,000,000 | 12,006,422 |
|
| The Huntington National Bank (J)(P) | 6-1-12 | 0.711 | 7,000,000 | 7,000,000 |
|
| Union Bank NA (J)(P) | 3-16-12 | 0.509 | 2,000,000 | 2,000,000 |
| |
| | | | Par value | Value |
| Repurchase Agreement 0.14% | | | | $600,000 |
|
| (Cost $600,000) | | | | |
| | | | | |
| Repurchase Agreement with State Street Corp. dated 3-31-11 at 0.010% | | |
| to be repurchased at $600,000 on 4-1-11, collateralized by $610,000 | | |
| Federal National Mortgage Association, 2.000% due 8-5-15 | | | |
| (valued at $609,610, including interest) | | | $600,000 | 600,000 |
| |
| Total investments (Cost $417,579,127)† 99.55% | | $417,579,127 |
|
| |
| Other assets and liabilities, net 0.45% | | $1,871,831 |
|
| |
| Total net assets 100.00% | | | $419,450,958 |
|
The percentage shown for each investment category is the total value of that category as a percentage of the net assets of the Fund.
(J) These securities are issued under the Temporary Liquidity Guarantee and are insured by the Federal Deposit Insurance Corporation until the earlier of the maturity date or 6-30-12. These securities amounted to $70,014,801 or 16.69% of the Fund’s net assets as of 3-31-11.
(P) Variable rate obligation. Securities reset coupon rates periodically. The coupon rate shown represents the rate at period end.
(S) These securities are exempt from registration under Rule 144A of the Securities Act of 1933. Such securities may be resold, normally to qualified institutional buyers, in transactions exempt from registration.
* Yield represents either the annualized yield at the date of purchase, the stated coupon rate or, for floating rate securities, the rate at period end.
† At 3-31-11, the aggregate cost of investment securities for federal income tax purposes was $417,579,127.
| | |
| 10 | Money Market Fund | Annual report | See notes to financial statements |
F I N A N C I A L S T A T E M E N T S
Financial statements
Statement of assets and liabilities 3-31-11
This Statement of Assets and Liabilities is the Fund’s balance sheet. It shows the value of what the Fund owns, is due and owes. You’ll also find the net asset value per share.
| |
| Assets | |
|
| Investments, at value (Cost $417,579,127) | $417,579,127 |
| Cash | 4,623 |
| Receivable for fund shares sold | 2,973,149 |
| Interest receivable | 618,291 |
| Receivable due from adviser | 8,365 |
| Other receivables and prepaid expenses | 86,122 |
| | |
| Total assets | 421,269,677 |
| |
| Liabilities | |
|
| Payable for fund shares repurchased | 1,543,869 |
| Payable to affiliates | |
| Accounting and legal services fees | 10,644 |
| Transfer agent fees | 126,666 |
| Trustees’ fees | 35,395 |
| Other liabilities and accrued expenses | 102,145 |
| | |
| Total liabilities | 1,818,719 |
| |
| Net assets | |
|
| Capital paid-in | $419,474,966 |
| Accumulated distributions in excess of net investment income | (24,963) |
| Accumulated net realized gain on investments | 955 |
| | |
| Net assets | $419,450,958 |
| |
| Net asset value per share | |
|
| Based on net asset values and shares outstanding — the Fund has an | |
| unlimited number of shares authorized with no par value | |
| Class A ($381,388,735 ÷ 381,534,791 shares) | $1.00 |
| Class B ($18,770,696 ÷ 18,793,338 shares)1 | $1.00 |
| Class C ($19,291,527 ÷ 19,295,628 shares)1 | $1.00 |
1 Redemption price per share is equal to the net asset value less any applicable contingent deferred sales charge.
| | |
| See notes to financial statements | Annual report | Money Market Fund | 11 |
F I N A N C I A L S T A T E M E N T S
Statement of operations For the year ended 3-31-11
This Statement of Operations summarizes the Fund’s investment income earned and expenses incurred in operating the Fund. It also shows net gains (losses) for the period stated.
| |
| Investment income | |
|
| Interest | $1,266,387 |
| |
| Expenses | |
|
| Investment management fees (Note 4) | 2,114,018 |
| Distribution and service fees (Note 4) | 1,434,726 |
| Accounting and legal services fees (Note 4) | 58,163 |
| Transfer agent fees (Note 4) | 745,214 |
| Trustees’ fees (Note 4) | 36,027 |
| State registration fees | 51,668 |
| Printing and postage | 39,736 |
| Professional fees | 165,299 |
| Custodian fees | 69,579 |
| Registration and filing fees | 25,170 |
| Other | 18,969 |
| | |
| Total expenses | 4,758,569 |
| Less expense reductions (Note 4) | (3,492,182) |
| | |
| Net expenses | 1,266,387 |
| | |
| Net investment income | — |
| |
| Realized gain | |
|
| Net realized gain on | |
| Investments | 31,636 |
| | |
| Net realized gain | 31,636 |
| | |
| Increase in net assets from operations | $31,636 |
| | |
| 12 | Money Market Fund | Annual report | See notes to financial statements |
F I N A N C I A L S T A T E M E N T S
Statements of changes in net assets
These Statements of Changes in Net Assets show how the value of the Fund’s net assets has changed during the last two periods. The difference reflects earnings less expenses, any investment gains and losses, distributions, if any, paid to shareholders and the net of Fund share transactions.
| | | | |
| | | | Year | Year |
| | | | ended | ended |
| | | | 3-31-11 | 3-31-10 |
| |
| Increase (decrease) in net assets | | | | |
|
| From operations | | | | |
| Net investment income | | | — | $56,802 |
| Net realized gain | | | $31,636 | — |
| | | | | |
| Increase in net assets resulting from operations | | | 31,636 | 56,802 |
| | | | | |
| Distributions to shareholders | | | | |
| From net investment income | | | | |
| Class A | | | — | (51,653) |
| Class C | | | — | (5,149) |
| From net realized gain | | | | |
| Class A | | | (26,098) | — |
| Class B | | | (1,466) | — |
| Class C | | | (1,547) | — |
| | | | | |
| Total distributions | | | (29,111) | (56,802) |
| | | | | |
| From Fund share transactions (Note 5) | | | (417,793) | (66,278,145) |
| | | | | |
| Total decrease | | | (415,268) | (66,278,145) |
| |
| Net assets | | | | |
|
| Beginning of year | | | 419,866,226 | 486,144,371 |
| | | | | |
| End of year | | | $419,450,958 | $419,866,226 |
| | | | | |
| Accumulated distributions in excess of net investment income | | | ($24,963) | ($25,295) |
| | |
| See notes to financial statements | Annual report | Money Market Fund | 13 |
Financial highlights
The Financial Highlights show how the Fund’s net asset value for a share has changed since the end of the previous period.
| | | | | |
| CLASS A SHARES Period ended | 3-31-11 | 3-31-10 | 3-31-09 | 3-31-08 | 3-31-07 |
| |
| Per share operating performance | | | | | |
|
| Net asset value, beginning of year | $1.00 | $1.00 | $1.00 | $1.00 | $1.00 |
| Net investment income | 0.000 | 0.0001 | 0.0122 | 0.0422 | 0.0442 |
| Net realized and unrealized gain on investments | 0.0001 | 0.000 | 0.000 | 0.000 | 0.000 |
| Total from investment operations | 0.0001 | 0.0001 | 0.012 | 0.042 | 0.044 |
| Less distributions | | | | | |
| From net investment income | — | (0.000)1 | (0.012) | (0.042) | (0.044) |
| From net realized gain | (0.000)1 | — | — | — | — |
| Total distributions | (0.000)1 | (0.000)1 | (0.012) | (0.042) | (0.044) |
| Net asset value, end of year | $1.00 | $1.00 | $1.00 | $1.00 | $1.00 |
| Total return (%)3 | 0.014 | 0.014 | 1.16 | 4.24 | 4.45 |
| |
| Ratios and supplemental data | | | | | |
|
| Net assets, end of year (in millions) | $381 | $360 | $396 | $317 | $195 |
| Ratios (as a percentage of average net assets): | | | | |
| Expenses before reductions | 1.04 | 1.16 | 1.10 | 1.01 | 1.09 |
| Expenses net of fee waivers | 0.304 | 0.594 | 0.89 | 0.81 | 0.88 |
| Expenses net of fee waivers and credits | 0.304 | 0.584 | 0.89 | 0.81 | 0.88 |
| Net investment income | 0.004 | 0.014 | 1.05 | 4.08 | 4.37 |
1 Less than $0.0005 per share.
2 Based on the average daily shares outstanding.
3 Total returns would have been lower had certain expenses not been reduced during the periods shown.
4 Includes the impact of waivers and/or reimbursements in order to avoid a negative yield. See Note 4.
| | | | | |
| CLASS B SHARES Period ended | 3-31-11 | 3-31-10 | 3-31-09 | 3-31-08 | 3-31-07 |
| |
| Per share operating performance | | | | | |
|
| Net asset value, beginning of year | $1.00 | $1.00 | $1.00 | $1.00 | $1.00 |
| Net investment income | 0.000 | 0.000 | 0.0061 | 0.0331 | 0.0351 |
| Net realized and unrealized gain on investments | 0.0002 | 0.000 | 0.000 | 0.000 | 0.000 |
| Total from investment operations | 0.0002 | 0.000 | 0.006 | 0.033 | 0.035 |
| Less distributions | | | | | |
| From net investment income | — | — | (0.006) | (0.033) | (0.035) |
| From net realized gain | (0.000)2 | — | — | — | — |
| Total distributions | (0.000)2 | — | (0.006) | (0.033) | (0.035) |
| Net asset value, end of year | $1.00 | $1.00 | $1.00 | $1.00 | $1.00 |
| Total return (%)3 | 0.014 | 0.004 | 0.56 | 3.36 | 3.57 |
| |
| Ratios and supplemental data | | | | | |
|
| Net assets, end of year (in millions) | $19 | $27 | $43 | $34 | $28 |
| Ratios (as a percentage of average net assets): | | | | |
| Expenses before reductions | 1.78 | 1.92 | 1.85 | 1.77 | 1.83 |
| Expenses net of fee waivers | 0.304 | 0.634 | 1.45 | 1.67 | 1.73 |
| Expenses net of fee waivers and credits | 0.304 | 0.624 | 1.45 | 1.66 | 1.73 |
| Net investment income | 0.004 | 0.004 | 0.48 | 3.29 | 3.52 |
1 Based on the average daily shares outstanding.
2 Less than $0.0005 per share.
3 Total returns would have been lower had certain expenses not been reduced during the periods shown.
4 Includes the impact of waivers and/or reimbursements in order to avoid a negative yield. See Note 4.
| | |
| 14 | Money Market Fund | Annual report | See notes to financial statements |
| | | | | |
| CLASS C SHARES Period ended | 3-31-11 | 3-31-10 | 3-31-09 | 3-31-08 | 3-31-07 |
| |
| Per share operating performance | | | | | |
|
| Net asset value, beginning of year | $1.00 | $1.00 | $1.00 | $1.00 | $1.00 |
| Net investment income | 0.000 | 0.0001 | 0.0062 | 0.0332 | 0.0352 |
| Net realized and unrealized gain on investments | 0.0001 | 0.000 | 0.000 | 0.000 | 0.000 |
| Total from investment operations | 0.0001 | 0.0001 | 0.006 | 0.033 | 0.035 |
| Less distributions | | | | | |
| From net investment income | — | (0.000)1 | (0.006) | (0.033) | (0.035) |
| From net realized gain | (0.000)1 | — | — | — | — |
| Total distributions | (0.000)1 | (0.000)1 | (0.006) | (0.033) | (0.035) |
| Net asset value, end of year | $1.00 | $1.00 | $1.00 | $1.00 | $1.00 |
| Total return (%)3 | 0.014 | 0.014 | 0.56 | 3.35 | 3.57 |
| |
| Ratios and supplemental data | | | | | |
|
| Net assets, end of year (in millions) | $19 | $33 | $47 | $31 | $8 |
| Ratios (as a percentage of average net assets): | | | | | |
| Expenses before reductions | 1.78 | 1.93 | 1.86 | 1.76 | 1.83 |
| Expenses net of fee waivers | 0.304 | 0.614 | 1.44 | 1.66 | 1.73 |
| Expenses net of fee waivers and credits | 0.304 | 0.604 | 1.44 | 1.66 | 1.73 |
| Net investment income | 0.004 | 0.024 | 0.41 | 3.10 | 3.54 |
1 Less than $0.0005 per share.
2 Based on the average daily shares outstanding.
3 Total returns would have been lower had certain expenses not been reduced during the periods shown.
4 Includes the impact of waivers and/or reimbursements in order to avoid a negative yield. See Note 4.
| | |
| See notes to financial statements | Annual report | Money Market Fund | 15 |
Notes to financial statements
Note 1 — Organization
John Hancock Money Market Fund (the Fund) is a diversified series of John Hancock Current Interest (the Trust), an open-end management investment company organized as a Massachusetts business trust and registered under the Investment Company Act of 1940, as amended (the 1940 Act). The investment objective of the Fund is to seek the maximum current income that is consistent with maintaining liquidity and preserving capital. The Fund intends to maintain a stable $1.00 share price.
The Fund may offer multiple classes of shares. The shares currently offered are detailed in the Statement of Assets and Liabilities. Class A, Class B and Class C shares are offered to all investors. Shareholders of each class have exclusive voting rights to matters that affect that class. The distribution and service fees, if any, and transfer agent fees for each class may differ. Class B shares convert to Class A shares eight years after purchase. Effective March 31, 2009, Class B and Class C shares were closed to new investors.
Note 2 — Significant accounting policies
The financial statements have been prepared in conformity with accounting principles generally accepted in the United States of America, which require management to make certain estimates and assumptions at the date of the financial statements. Actual results could differ from those estimates. Events or transactions occurring after the end of the fiscal period through the date that the financial statements were issued have been evaluated in the preparation of the financial statements. The following summarizes the significant accounting policies of the Fund:
Security valuation. Securities in the Fund’s portfolio are valued at amortized cost, in accordance with Rule 2a-7 under the 1940 Act, which approximates market value. The amortized cost method involves valuing a security at its cost on the date of purchase and thereafter assuming a constant amortization to maturity of the difference between the principal amount due at maturity and the cost of the security to the Fund.
The Fund uses a three-tier hierarchy to prioritize the pricing assumptions, referred to as inputs, used in valuation techniques to measure fair value. Level 1 includes securities valued using quoted prices in active markets for identical securities. Level 2 includes securities valued using significant observable inputs. Observable inputs may include quoted prices for similar securities, interest rates, prepayment speeds and credit risk. Prices for securities valued using these inputs are received from independent pricing vendors and brokers and are based on an evaluation of the inputs described. Level 3 includes securities valued using significant unobservable inputs when market prices are not readily available or reliable, including the Fund’s own assumptions in determining the fair value of investments. Factors used in determining value may include market or issuer specific events, changes in interest rates and credit quality. The inputs or methodology used for valuing securities are not necessarily an indication of the risk associated with investing in those securities.
As of March 31, 2011, all investments are categorized as Level 2 under the hierarchy described above.
Changes in valuation techniques may result in transfers in or out of an assigned level within the disclosure hierarchy. During the year ended March 31, 2011, there were no significant transfers in or out of Level 2 assets.
| |
| 16 | Money Market Fund | Annual report |
Repurchase agreements. The Fund may enter into repurchase agreements. When the Fund enters into a repurchase agreement, it receives collateral which is held in a segregated account by the Fund’s custodian. The collateral amount is marked-to-market and monitored on a daily basis to ensure that the collateral held is in an amount not less than the principal amount of the repurchase agreement plus any accrued interest. In the event of a default by the counterparty, realization of the collateral proceeds could be delayed, during which time the value may decline.
Security transactions and related investment income. Investment security transactions are recorded as of the date of purchase, sale or maturity. Interest income is accrued as earned. Interest income includes coupon interest and amortization/accretion of premiums/discounts on debt securities.
Line of credit. The Fund may borrow from banks for temporary or emergency purposes, including meeting redemption requests that otherwise might require the untimely sale of securities. Pursuant to the custodian agreement, the custodian may loan money to the Fund to make properly authorized payments. The Fund is obligated to repay the custodian for any overdraft, including any related costs or expenses. The custodian has a lien, security interest or security entitlement in any Fund property that is not segregated, to the maximum extent permitted by law for any overdraft.
In addition, effective March 30, 2011, the Fund and other affiliated funds have entered into an agreement with Citibank N.A. which enables them to participate in a $100 million unsecured committed line of credit. Prior to March 30, 2011, the Fund had a similar arrangement with State Street Bank and Trust Company. A commitment fee, payable at the end of each calendar quarter, based on the average daily unused portion of the line of credit, is charged to each participating fund on a pro rata basis and is reflected in other expenses on the Statement of Operations. For the year ended March 31, 2011, the Fund had no borrowings under the line of credit.
Expenses. The majority of expenses are directly attributable to an individual fund. Expenses that are not readily attributable to a specific fund are allocated among all funds in an equitable manner, taking into consideration, among other things, the nature and type of expense and the fund’s relative assets. Expense estimates are accrued in the period to which they relate and adjustments are made when actual amounts are known.
Class allocations. Income, common expenses, and realized and unrealized gains (losses) are determined at the fund level and allocated daily to each class of shares based on the net asset value of the class. Class-specific expenses, such as distribution and service fees, if any, and transfer agent fees, are calculated daily for each class, based on the net asset value of the class and the applicable specific expense rates.
Federal income taxes. The Fund intends to continue to qualify as a regulated investment company by complying with the applicable provisions of the Internal Revenue Code and will not be subject to federal income tax on taxable income that is distributed to shareholders. Therefore, no federal income tax provision is required.
As of March 31, 2011, the Fund had no uncertain tax positions that would require financial statement recognition, de-recognition or disclosure. The Fund’s federal tax return is subject to examination by the Internal Revenue Service for a period of three years.
Distribution of income and gains. Distributions to shareholders from net investment income and net realized gains, if any, are recorded on the ex-date. The Fund generally declares dividends from net investment income daily and pays them monthly, if any. Capital gain distributions, if any, are paid annually.
| |
| Annual report | Money Market Fund | 17 |
The tax character of distributions for the years ended March 31, 2011 and March 31, 2010 was as follows:
| | | | |
| | MARCH 31, 2011 | MARCH 31, 2010 | | |
| | |
| Ordinary Income | $19,034 | $56,802 | | |
| Long-Term Capital Gain | 10,077 | — | | |
Distributions paid by the Fund with respect to each class of shares are calculated in the same manner, at the same time and are in the same amount, except for the effect of expenses that may be applied differently to each class. As of March 31, 2011, the components of distributable earnings on a tax basis included $955 of undistributed long-term capital gains.
Such distributions and distributable earnings, on a tax basis, are determined in conformity with income tax regulations, which may differ from accounting principles generally accepted in the United States of America. Material distributions in excess of tax basis earnings and profits, if any, are reported in the Fund’s financial statements as a return of capital.
Capital accounts within financial statements are adjusted for permanent book-tax differences. These adjustments have no impact on net assets or the results of operations. Temporary book-tax differences, if any, will reverse in a subsequent period. The Fund had no material book-tax differences at March 31, 2011.
Note 3 — Guarantees and indemnifications
Under the Fund’s organizational documents, its Officers and Trustees are indemnified against certain liabilities arising out of the performance of their duties to the Fund. Additionally, in the normal course of business, the Fund enters into contracts with service providers that contain general indemnification clauses. The Fund’s maximum exposure under these arrangements is unknown, as this would involve future claims that may be made against the Fund that have not yet occurred. The risk of material loss from such claims is considered remote.
Note 4 — Fees and transactions with affiliates
John Hancock Advisers, LLC (the Adviser) serves as investment adviser for the Fund. John Hancock Funds, LLC (the Distributor), an affiliate of the Adviser, serves as principal underwriter of the Fund. The Adviser and the Distributor are indirect wholly owned subsidiaries of Manulife Financial Corporation (MFC).
Management fee. The Fund has an investment management contract with the Adviser under which the Fund pays a daily management fee to the Adviser equivalent, on an annual basis, to the sum of: (a) 0.500% of the first $500,000,000 of the Fund’s average daily net assets; (b) 0.425% of the next $250,000,000; (c) 0.375% of the next $250,000,000; (d) 0.350% of the next $500,000,000; (e) 0.325% of the next $500,000,000; (f) 0.300% of the next $500,000,000; and (g) 0.275% of the Fund’s average daily net assets in excess of $2,500,000,000. The Adviser has a subadvisory agreement with John Hancock Asset Management a division of Manulife Asset Management (US) LLC (formerly, MFC Global Investment Management (U.S.), LLC), an indirect owned subsidiary of MFC and an affiliate of the Adviser. The Fund is not responsible for payment of the subadvisory fees.
The Adviser has contractually agreed to limit the maximum annual rate of management fee to 0.40% of the Fund’s average daily net assets, until at least July 31, 2011. Accordingly, the expense reductions related to management fee limitations were $422,804 for the year ended March 31, 2011. In addition, the Adviser has voluntarily agreed to reimburse advisory fees to avoid a negative yield in the amount of $1,634,652 for the year ended March 31, 2011. The voluntary fee waiver and/or reimbursement may be amended or terminated at any time by the Adviser.
| |
| 18 | Money Market Fund | Annual report |
The investment management fees, including the impact of the waivers and reimbursements described above, incurred for the year ended March 31, 2011 were equivalent to an annual effective rate of 0.01% of the Fund’s average daily net assets.
Accounting and legal services. Pursuant to a service agreement, the Fund reimburses the Adviser for all expenses associated with providing the administrative, financial, legal, accounting and recordkeeping services of the Fund, including the preparation of all tax returns, periodic reports to shareholders and regulatory reports, among other services. These expenses are allocated to each share class based on its relative net assets at the time the expense was incurred. These accounting and legal services fees incurred for the year ended March 31, 2011 amounted to an annual rate of 0.01% of the Fund’s average daily net assets.
Distribution and service plans. The Fund has a distribution agreement with the Distributor. The Fund has adopted distribution and service plans with respect to Class A, Class B and Class C shares pursuant to Rule 12b-1 under the 1940 Act, to pay the Distributor for services provided as the distributor of shares of the Fund. The Fund may pay up to the following contractual rates of distribution and service fees under these arrangements, expressed as an annual percentage of average daily net assets for each class of the Fund’s shares.
| | | | |
| CLASS | 12b–1 FEE | | | |
| | | |
| Class A | 0.25% | | | |
| Class B | 1.00% | | | |
| Class C | 1.00% | | | |
The Distributor has contractually agreed, until at least July 31, 2011, to waive the distribution fee on Class A shares, so that distribution expenses will not exceed 0.15% of Class A shares’ average daily net assets. Reimbursements related to this contractual waiver amounted to $372,441 for the year ended March 31, 2011. In addition, the Distributor has voluntarily agreed to waive distribution expenses on Class A, Class B and Class C shares amounting to $558,662, $57,756 and $272,599, respectively, for the year ended March 31, 2011. In order to avoid a negative yield, the Distributor has voluntarily agreed to waive distribution expenses on Class B shares amounting to $173,268 for the year ended March 31, 2011. The voluntary waivers and/or reimbursements may be amended or terminated at any time by the distributor.
Sales charges. Class B and Class C shares are subject to contingent deferred sales charges (CDSC). Class B shares that are redeemed within six years of purchase are subject to CDSC, at declining rates, beginning at 5.00% of the lesser of the current market value at the time of redemption or the original purchase cost of the shares being redeemed. Class C shares that are redeemed within one year of purchase are subject to a 1.00% CDSC on the lesser of the current market value at the time of redemption or the original purchase cost of the shares being redeemed. Proceeds from CDSCs are used to compensate the Distributor for providing distribution-related services in connection with the sale of these shares. During the year ended March 31, 2011, CDSCs received by the Distributor amounted to $80,347 and $21,618 for Class B and Class C shares, respectively.
Transfer agent fees. The Fund has a transfer agent agreement with John Hancock Signature Services, Inc. (Signature Services or Transfer Agent), an affiliate of the Adviser. The transfer agent fees paid to Signature Services are determined based on the cost to Signature Services (Signature Services Cost) of providing recordkeeping services. The Signature Services Cost is comprised of a component of allocated John Hancock corporate overhead for providing transfer agent services to the Fund and to all other John Hancock affiliated funds. It also includes out-of-pocket expenses that are comprised of payments made to third-parties for recordkeeping services provided to their clients who invest in one or more John Hancock funds. In addition, Signature Services Cost may be reduced by certain revenues that Signature Services receive in connection with the service it provides to the funds. Signature Services Cost is calculated monthly and allocated, as applicable,
| |
| Annual report | Money Market Fund | 19 |
to four categories of share classes: Institutional Share Classes, Retirement Share Classes, Municipal Bond Classes and all other Retail Share Classes. Within each of these categories, the applicable costs are allocated to the affected John Hancock affiliated funds and/or classes, based on the relative average daily net assets.
Prior to July 1, 2010, the transfer agent fees were made up of three components:
• The Fund paid a monthly transfer agent fee at an annual rate of 0.01% for Class A, Class B and Class C shares, based on each class’s average daily net assets.
• The Fund paid a monthly fee based on an annual rate of $17.50 per shareholder account for all share classes.
• In addition, Signature Services was reimbursed for certain out-of-pocket expenses.
Class level expenses. Class level expenses for the year ended March 31, 2011 were:
| | | | |
| | DISTRIBUTION AND | TRANSFER | | |
| CLASS | SERVICE FEES | AGENT FEES | | |
| | |
| Class A | $931,103 | $657,016 | | |
| Class B | 231,024 | 40,495 | | |
| Class C | 272,599 | 47,703 | | |
| Total | $1,434,726 | $745,214 | | |
Trustee expenses. The Trust compensates each Trustee who is not an employee of the Adviser or its affiliates. These Trustees may, for tax purposes, elect to defer receipt of this compensation under the John Hancock Group of Funds Deferred Compensation Plan (the Plan). Deferred amounts are invested in various John Hancock funds and remain in the funds until distributed in accordance with the Plan. The investment of deferred amounts and the offsetting liability are included within Other receivables and prepaid expenses and Payable to affiliates — Trustees’ fees, respectively, in the accompanying Statement of Assets and Liabilities.
Note 5 — Fund share transactions
Transactions in Fund shares for the years ended March 31, 2011 and March 31, 2010 were as follows:
| | | | |
| | Year ended 3-31-11 | Year ended 3-31-10 |
| | Shares | Amount | Shares | Amount |
| Class A shares | | | | |
|
| Sold | 327,269,068 | $327,269,069 | 241,341,433 | $241,341,433 |
| Distributions reinvested | 25,637 | 25,637 | 48,712 | 48,712 |
| Repurchased | (305,822,157) | (305,822,157) | (277,469,948) | (277,469,949) |
| | | | | |
| Net increase (decrease) | 21,472,548 | $21,472,549 | (36,079,803) | ($36,079,804) |
| |
| Class B shares | | | | |
|
| Sold | 11,930,258 | $11,930,257 | 10,712,200 | $10,712,200 |
| Distributions reinvested | 1,392 | 1,392 | — | — |
| Repurchased | (19,961,915) | (19,961,918) | (26,991,565) | (26,991,569) |
| | | | | |
| Net decrease | (8,030,265) | ($8,030,269) | (16,279,365) | ($16,279,369) |
| |
| Class C shares | | | | |
|
| Sold | 40,245,146 | $40,245,145 | 30,033,980 | $30,033,980 |
| Distributions reinvested | 1,491 | 1,491 | 4,481 | 4,481 |
| Repurchased | (54,106,709) | (54,106,709) | (43,957,433) | (43,957,433) |
| | | | | |
| Net decrease | (13,860,072) | ($13,860,073) | (13,918,972) | ($13,918,972) |
| |
| Net decrease | (417,789) | ($417,793) | (66,278,140) | ($66,278,145) |
|
| |
| 20 | Money Market Fund | Annual report |
Auditors’ report
Report of Independent Registered Public Accounting Firm
To the Board of Trustees of John Hancock Current Interest and Shareholders of John Hancock Money Market Fund:
In our opinion, the accompanying statement of assets and liabilities, including the portfolio of investments, and the related statements of operations and of changes in net assets and the financial highlights present fairly, in all material respects, the financial position of John Hancock Money Market Fund (the “Fund”) at March 31, 2011, and the results of its operations, the changes in its net assets and the financial highlights for each of the periods indicated, in conformity with accounting principles generally accepted in the United States of America. These financial statements and financial highlights (hereafter referred to as “financial statements”) are the responsibility of the Fund’s management; our responsibility is to express an opinion on these financial statements based on our audits. We conducted our audits of these financial statements in accordance with the standards of the Public Company Accounting Oversight Board (United States). Those standards require that we plan and perform the audit to obtain reasonable assurance about whether the financial statements are free of material misstatement. An audit includes examining, on a test basis, evidence supporting the amounts and disclosures in the financial statements, assessing the accounting principles used and significant estimates made by management, and evaluating the overall financial statement presentation. We believe that our audits, which included confirmation of securities at March 31, 2011 by correspondence with the custodian, provide a reasonable basis for our opinion.
PricewaterhouseCoopers LLP
Boston, Massachusetts
May 20, 2011
| |
| Annual report | Money Market Fund | 21 |
Tax information
Unaudited
For federal income tax purposes, the following information is furnished with respect to the distributions of the Fund, if any, paid during its taxable year ended March 31, 2011.
The Fund designates distributions to shareholders of $10,077 as a long-term capital gain dividends for the fiscal year ended March 31, 2011.
Shareholders will be mailed a 2011 Form 1099-DIV in January 2012. This will reflect the total of all distributions for calendar year 2011.
| |
| 22 | Money Market Fund | Annual report |
Trustees and Officers
This chart provides information about the Trustees and Officers who oversee your John Hancock fund. Officers elected by the Trustees manage the day-to-day operations of the Fund and execute policies formulated by the Trustees.
| | |
| Independent Trustees | | |
| | | |
| Name, Year of Birth | Trustee | Number of John |
| Position(s) held with Fund | of the | Hancock funds |
| Principal occupation(s) and other | Trust | overseen by |
| directorships during past 5 years | since1 | Trustee |
| |
| Steven R. Pruchansky, Born: 1944 | 1994 | 47 |
|
| Chairperson (since January 2011); Chairman and Chief Executive Officer, Greenscapes of Southwest |
| Florida, Inc. (since 2000); Director and President, Greenscapes of Southwest Florida, Inc. (until 2000); |
| Member, Board of Advisors, First American Bank (since 2008); Managing Director, Jon James, LLC (real |
| estate) (since 2000); Director, First Signature Bank & Trust Company (until 1991); Director, Mast Realty |
| Trust (until 1994); President, Maxwell Building Corp. (until 1991). | | |
| |
| James F. Carlin, Born: 1940 | 1994 | 47 |
|
| Chief Executive Officer, Director and Treasurer, Alpha Analytical Laboratories (environmental, chemical |
| and pharmaceutical analysis) (since 1985); Part Owner and Treasurer, Lawrence Carlin Insurance |
| Agency, Inc. (since 1995); Chairman and Chief Executive Officer, CIMCO, LLC (management/ |
| investments) (since 1987). | | |
| |
| William H. Cunningham, Born: 1944 | 1987 | 47 |
|
| Professor, University of Texas, Austin, Texas (since 1971); former Chancellor, University of Texas System |
| and former President of the University of Texas, Austin, Texas; Director of the following: LIN Television |
| (since 2009); Lincoln National Corporation (insurance) (Chairman since 2009 and Director since 2006); |
| Resolute Energy Corporation (since 2009); Nanomedical Systems, Inc. (biotechnology company) |
| (Chairman since 2008); Yorktown Technologies, LP (tropical fish) (Chairman since 2007); Greater Austin |
| Crime Commission (since 2001); Southwest Airlines (since 2000); former Director of the following: |
| Introgen (manufacturer of biopharmaceuticals) (until 2008); Hicks Acquisition Company I, Inc. (until |
| 2007); Jefferson-Pilot Corporation (diversified life insurance company) (until 2006); and former Advisory |
| Director, JP Morgan Chase Bank (formerly Texas Commerce Bank–Austin) (until 2009). | |
| |
| Deborah C. Jackson,2 Born: 1952 | 2008 | 47 |
|
| Chief Executive Officer, American Red Cross of Massachusetts Bay (since 2002); Board of Directors of |
| Eastern Bank Corporation (since 2001); Board of Directors of Eastern Bank Charitable Foundation (since |
| 2001); Board of Directors of American Student Assistance Corp. (1996–2009); Board of Directors of |
| Boston Stock Exchange (2002–2008); Board of Directors of Harvard Pilgrim Healthcare (health benefits |
| company) (since 2007). | | |
| |
| Charles L. Ladner,2 Born: 1938 | 1994 | 47 |
|
| Vice Chairperson (since March 2011); Chairman and Trustee, Dunwoody Village, Inc. (retirement |
| services) (since 2008); Director, Philadelphia Archdiocesan Educational Fund (since 2009); Senior Vice |
| President and Chief Financial Officer, UGI Corporation (public utility holding company) (retired 1998); |
| Vice President and Director for AmeriGas, Inc. (retired 1998); Director of AmeriGas Partners, L.P. (gas |
| distribution) (until 1997); Director, EnergyNorth, Inc. (until 1995); Director, Parks and History Association |
| (Cooperating Association, National Park Service) (until 2005). | | |
| |
| Annual report | Money Market Fund | 23 |
| | |
| Independent Trustees (continued) | | |
| |
| Name, Year of Birth | Trustee | Number of John |
| Position(s) held with Fund | of the | Hancock funds |
| Principal occupation(s) and other | Trust | overseen by |
| directorships during past 5 years | since1 | Trustee |
| |
| Stanley Martin,2 Born: 1947 | 2008 | 47 |
|
| Senior Vice President/Audit Executive, Federal Home Loan Mortgage Corporation (2004–2006); |
| Executive Vice President/Consultant, HSBC Bank USA (2000–2003); Chief Financial Officer/Executive |
| Vice President, Republic New York Corporation & Republic National Bank of New York (1998–2000); |
| Partner, KPMG LLP (1971–1998). | | |
| |
| Dr. John A. Moore, Born: 1939 | 2005 | 47 |
|
| President and Chief Executive Officer, Institute for Evaluating Health Risks, (nonprofit institution) |
| (until 2001); Senior Scientist, Sciences International (health research) (until 2003); Former | |
| Assistant Administrator & Deputy Administrator, Environmental Protection Agency; Principal, |
| Hollyhouse (consulting) (since 2000); Director, CIIT Center for Health Science Research (nonprofit |
| research) (until 2007). | | |
| |
| Patti McGill Peterson,2 Born: 1943 | 2005 | 47 |
|
| Principal, PMP Globalinc (consulting) (since 2007); Senior Associate, Institute for Higher Education Policy |
| (since 2007); Executive Director, CIES (international education agency) (until 2007); Vice President, |
| Institute of International Education (until 2007); Senior Fellow, Cornell University Institute of Public |
| Affairs, Cornell University (1997–1998); Former President Wells College, St. Lawrence University and the |
| Association of Colleges and Universities of the State of New York. Director of the following: Niagara |
| Mohawk Power Corporation (until 2003); Security Mutual Life (insurance) (until 1997); ONBANK (until |
| 1993). Trustee of the following: Board of Visitors, The University of Wisconsin, Madison (since 2007); |
| Ford Foundation, International Fellowships Program (until 2007); UNCF, International Development |
| Partnerships (until 2005); Roth Endowment (since 2002); Council for International Educational |
| Exchange (since 2003). | | |
| |
| Gregory A. Russo, Born: 1949 | 2008 | 47 |
|
| Vice Chairman, Risk & Regulatory Matters, KPMG LLP (“KPMG”) (2002–2006); Vice Chairman, Industrial |
| Markets, KPMG (1998–2002). | | |
| |
| Non-Independent Trustees3 | | |
| | | |
| Name, Year of Birth | Trustee | Number of John |
| Position(s) held with Fund | of the | Hancock funds |
| Principal occupation(s) and other | Trust | overseen by |
| directorships during past 5 years | since1 | Trustee |
| |
| Hugh McHaffie, Born: 1959 | 2010 | 47 |
|
| Executive Vice President, John Hancock Financial Services (since 2006, including prior positions); |
| President of John Hancock Trust and John Hancock Funds II (since 2009); Trustee, John Hancock retail |
| funds (since 2010); Chairman and Director, John Hancock Advisers, LLC, John Hancock Investment |
| Management Services, LLC and John Hancock Funds, LLC (since 2010); Senior Vice President, Individual |
| Business Product Management, MetLife, Inc. (1999–2006). | | |
| |
| 24 | Money Market Fund | Annual report |
| | |
| Non-Independent Trustees3 (continued) | | |
| |
| Name, Year of Birth | Trustee | Number of John |
| Position(s) held with Fund | of the | Hancock funds |
| Principal occupation(s) and other | Trust | overseen by |
| directorships during past 5 years | since1 | Trustee |
| |
| John G. Vrysen, Born: 1955 | 2009 | 47 |
|
| Senior Vice President, John Hancock Financial Services (since 2006); Director, Executive Vice President |
| and Chief Operating Officer, John Hancock Advisers, LLC, John Hancock Investment Management |
| Services, LLC and John Hancock Funds, LLC (since 2005); Chief Operating Officer, John Hancock Funds II |
| and John Hancock Trust (since 2007); Chief Operating Officer, John Hancock retail funds (until 2009); |
| Trustee, John Hancock retail funds (since 2009). | | |
| |
| Principal officers who are not Trustees | | |
| | | |
| Name, Year of Birth | | Officer |
| Position(s) held with Fund | | of the |
| Principal occupation(s) and other | | Trust |
| directorships during past 5 years | | since |
| |
| Keith F. Hartstein, Born: 1956 | | 2005 |
|
| President and Chief Executive Officer | | |
| Senior Vice President, John Hancock Financial Services (since 2004); Director, President and Chief |
| Executive Officer, John Hancock Advisers, LLC and John Hancock Funds, LLC (since 2005); Director, |
| John Hancock Asset Management a division of Manulife Asset Management (US) LLC (since 2005); |
| Director, John Hancock Investment Management Services, LLC (since 2006); President and Chief |
| Executive Officer, John Hancock retail funds (since 2005); Member, Investment Company Institute Sales |
| Force Marketing Committee (since 2003). | | |
| |
| Andrew G. Arnott, Born: 1971 | | 2009 |
|
| Senior Vice President and Chief Operating Officer | | |
| Senior Vice President, John Hancock Financial Services (since 2009); Executive Vice President, |
| John Hancock Advisers, LLC (since 2005); Executive Vice President, John Hancock Investment |
| Management Services, LLC (since 2006); Executive Vice President, John Hancock Funds, LLC (since |
| 2004); Chief Operating Officer, John Hancock retail funds (since 2009); Senior Vice President, |
| John Hancock retail funds (since 2010); Vice President, John Hancock Funds II and John Hancock Trust |
| (since 2006); Senior Vice President, Product Management and Development, John Hancock Funds, |
| LLC (until 2009). | | |
| |
| Thomas M. Kinzler, Born: 1955 | | 2006 |
|
| Secretary and Chief Legal Officer | | |
| Vice President, John Hancock Financial Services (since 2006); Secretary and Chief Legal Counsel, |
| John Hancock Advisers, LLC, John Hancock Investment Management Services, LLC and John Hancock |
| Funds, LLC (since 2007); Secretary and Chief Legal Officer, John Hancock retail funds, John Hancock |
| Funds II and John Hancock Trust (since 2006); Vice President and Associate General Counsel, |
| Massachusetts Mutual Life Insurance Company (1999–2006); Secretary and Chief Legal Counsel, MML |
| Series Investment Fund (2000–2006); Secretary and Chief Legal Counsel, MassMutual Select Funds and |
| MassMutual Premier Funds (2004–2006). | | |
| |
| Annual report | Money Market Fund | 25 |
| |
| Principal officers who are not Trustees (continued) | |
| |
| Name, Year of Birth | Officer |
| Position(s) held with Fund | of the |
| Principal occupation(s) and other | Trust |
| directorships during past 5 years | since |
| |
| Francis V. Knox, Jr., Born: 1947 | 2005 |
|
| Chief Compliance Officer | |
| Vice President, John Hancock Financial Services (since 2005); Chief Compliance Officer, John Hancock |
| retail funds, John Hancock Funds II, John Hancock Trust, John Hancock Advisers, LLC and John Hancock |
| Investment Management Services, LLC (since 2005); Vice President and Chief Compliance Officer, | |
| John Hancock Asset Management a division of Manulife Asset Management (US) LLC (2005–2008). |
| |
| Charles A. Rizzo, Born: 1957 | 2007 |
|
| Chief Financial Officer | |
| Vice President, John Hancock Financial Services (since 2008); Senior Vice President, John Hancock | |
| Advisers, LLC and John Hancock Investment Management Services, LLC (since 2008); Chief Financial |
| Officer, John Hancock retail funds, John Hancock Funds II and John Hancock Trust (since 2007); | |
| Assistant Treasurer, Goldman Sachs Mutual Fund Complex (2005–2007); Vice President, Goldman | |
| Sachs (2005–2007). | |
| |
| Salvatore Schiavone, Born: 1965 | 2010 |
|
| Treasurer | |
| Assistant Vice President, John Hancock Financial Services (since 2007); Vice President, John Hancock |
| Advisers, LLC and John Hancock Investment Management Services, LLC (since 2007); Treasurer, | |
| John Hancock retail funds (since 2010); Treasurer, John Hancock Closed-End Funds (since 2009); | |
| Assistant Treasurer, John Hancock Funds II and John Hancock Trust (since 2007); Assistant Treasurer, |
| John Hancock retail funds, John Hancock Funds II and John Hancock Trust (2007–2009); Assistant | |
| Treasurer, Fidelity Group of Funds (2005–2007); Vice President, Fidelity Management Research | |
| Company (2005–2007). | |
The business address for all Trustees and Officers is 601 Congress Street, Boston, Massachusetts 02210-2805.
The Statement of Additional Information of the Fund includes additional information about members of the Board of Trustees of the Fund and is available without charge, upon request, by calling 1-800-225-5291.
1 Each Trustee holds office until his or her successor is elected and qualified, or until the Trustee’s death, retirement, resignation or removal.
2 Member of Audit Committee.
3 Because Messrs. McHaffie and Vrysen are senior executives or directors with the Adviser and/or its affiliates, each of them is considered an “interested person,” as defined in the Investment Company Act of 1940, of the Fund.
| |
| 26 | Money Market Fund | Annual report |
More information
| | |
| Trustees | Investment adviser | |
| Steven R. Pruchansky, Chairperson | John Hancock Advisers, LLC | |
| James F. Carlin | | |
| William H. Cunningham | Subadviser | |
| Deborah C. Jackson* | John Hancock Asset Management | |
| Charles L. Ladner, Vice Chairperson* | (formerly MFC Global Investment | |
| Stanley Martin* | Management (U.S.), LLC) | |
| Hugh McHaffie† | | |
| Dr. John A. Moore | Principal distributor | |
| Patti McGill Peterson* | John Hancock Funds, LLC | |
| Gregory A. Russo | | |
| John G. Vrysen† | Custodian | |
| State Street Bank and Trust Company | |
| Officers | |
| Keith F. Hartstein | Transfer agent | |
| President and Chief Executive Officer | John Hancock Signature Services, Inc. | |
| | | |
| Andrew G. Arnott | Legal counsel | |
| Senior Vice President and Chief Operating Officer | K&L Gates LLP | |
| | |
| Thomas M. Kinzler | Independent registered | |
| Secretary and Chief Legal Officer | public accounting firm | |
| PricewaterhouseCoopers LLP | |
| Francis V. Knox, Jr. | | |
| Chief Compliance Officer | | |
| | |
| Charles A. Rizzo | | |
| Chief Financial Officer | | |
| | |
| Salvatore Schiavone | | |
| Treasurer | | |
| | |
| *Member of the Audit Committee | |
| †Non-Independent Trustee | | |
| | |
The Fund’s proxy voting policies and procedures, as well as the Fund’s proxy voting record for the most recent twelve-month period ended June 30, are available free of charge on the Securities and Exchange Commission (SEC) Web site at www.sec.gov or on our Web site.
The Fund’s complete list of portfolio holdings, for the first and third fiscal quarters, is filed with the SEC on Form N-Q. The Fund’s Form N-Q is available on our Web site and the SEC’s Web site, www.sec.gov, and can be reviewed and copied (for a fee) at the SEC’s Public Reference Room in Washington, DC. Call 1-800-SEC-0330 to receive information on the operation of the SEC’s Public Reference Room.
We make this information on your fund, as well as monthly portfolio holdings, and other fund details available on our Web site www.jhfunds.com or by calling 1-800-225-5291.
| | |
| You can also contact us: | | |
| 1-800-225-5291 | Regular mail: | Express mail: |
| jhfunds.com | John Hancock Signature Services, Inc. | John Hancock Signature Services, Inc. |
| | P.O. Box 55913 | Mutual Fund Image Operations |
| | Boston, MA 02205-5913 | 30 Dan Road |
| | | Canton, MA 02021 |
| |
| Annual report | Money Market Fund | 27 |

1-800-225-5291
1-800-554-6713 TDD
1-800-338-8080 EASI-Line
www.jhfunds.com
Now available: electronic delivery
www.jhfunds.com/edelivery
| |
| This report is for the information of the shareholders of John Hancock Money Market Fund. | 4400A 3/11 |
| It is not authorized for distribution to prospective investors unless preceded or accompanied by a prospectus. | 5/11 |
ITEM 2. CODE OF ETHICS.
As of the end of the period, March 31, 2011, the registrant has adopted a code of ethics, as defined in Item 2 of Form N-CSR, that applies to its Chief Executive Officer, Chief Financial Officer and Treasurer (respectively, the principal executive officer, the principal financial officer and the principal accounting officer, the “Senior Financial Officers”). A copy of the code of ethics is filed as an exhibit to this Form N-CSR.
ITEM 3. AUDIT COMMITTEE FINANCIAL EXPERT.
Stanley Martin is the audit committee financial expert and is “independent”, pursuant to general instructions on Form N-CSR Item 3.
ITEM 4. PRINCIPAL ACCOUNTANT FEES AND SERVICES.
(a) Audit Fees
The aggregate fees billed for professional services rendered by the principal accountant(s) for the audit of the registrant’s annual financial statements or services that are normally provided by the accountant(s) in connection with statutory and regulatory filings or engagements amounted to $25,017 for the fiscal year ended March 31, 2011 for John Hancock Money Market Fund and $24,604 for the fiscal year ended March 31, 2010 for John Hancock Money Market Fund. These fees were billed to the registrant and were approved by the registrant’s audit committee.
(b) Audit-Related Services
The aggregate fees billed for professional services rendered by the principal accountant(s) amounted to $347 for the fiscal year ended March 31, 2011 and $1,184 for the fiscal year ended March 31, 2010 billed to the registrant or to the registrant's investment adviser (not including any sub-adviser whose role is primarily portfolio management and is subcontracted with or overseen by another investment adviser), and any entity controlling, controlled by, or under common control with the adviser that provides ongoing services to the registrant ("control affiliates"). The nature of the services provided was service provider internal controls review.
(c) Tax Fees
The aggregate fees billed for professional services rendered by the principal accountant(s) for the tax compliance, tax advice and tax planning (“tax fees”) amounted to $1,607 for the fiscal year ended March 31, 2011 and $1,560 for the fiscal year ended March 31, 2010. The nature of the services comprising the tax fees was the review of the registrant’s tax returns and tax distribution requirements. These fees were billed to the registrant and were approved by the registrant’s audit committee.
(d) All Other Fees
Other fees billed for professional services rendered by the principal accountant(s) for discussions on income distributions amounted to $19 for the fiscal year ended March 31, 2011 for the John Hancock Money Market Fund and $55 for fiscal year ended March 31, 2010 billed to the registrant or to the control affiliates.
(e)(1) Audit Committee Pre-Approval Policies and Procedures:
The trust’s Audit Committee must pre-approve all audit and non-audit services provided by the independent registered public accounting firm (the “Auditor”) relating to the operations or financial reporting of the funds. Prior to the commencement of any audit or non-audit services to a fund, the Audit Committee reviews the services to determine whether they are appropriate and permissible under applicable law.
The trust’s Audit Committee has adopted policies and procedures to, among other purposes, provide a framework for the Committee’s consideration of audit-related and non-audit services by the Auditor. The policies and procedures require that any audit-related and non-audit service
provided by the Auditor and any non-audit service provided by the Auditor to a fund service provider that relates directly to the operations and financial reporting of a fund are subject to approval by the Audit Committee before such service is provided. Audit-related services provided by the Auditor that are expected to exceed $25,000 per instance/per fund are subject to specific pre-approval by the Audit Committee. Tax services provided by the Auditor that are expected to exceed $30,000 per instance/per fund are subject to specific pre-approval by the Audit Committee.
All audit services, as well as the audit-related and non-audit services that are expected to exceed the amounts stated above, must be approved in advance of provision of the service by formal resolution of the Audit Committee. At the regularly scheduled Audit Committee meetings, the Committee reviews a report summarizing the services, including fees, provided by the Auditor. (e)(2) Services approved pursuant to paragraph (c)(7)(i)(C) of Rule 2-01 of Regulation S-X:
Audit-Related Fees, Tax Fees and All Other Fees:
There were no amounts that were approved by the Audit Committee pursuant to the de minimis exception under Rule 2-01 of Regulation S-X.
(f) According to the registrant’s principal accountant, for the fiscal year ended March 31, 2011, the percentage of hours spent on the audit of the registrant's financial statements for the most recent fiscal year that were attributed to work performed by persons who were not full-time, permanent employees of principal accountant was less than 50%.
(g) The aggregate non-audit fees billed by the registrant's accountant(s) for services rendered to the registrant and rendered to the registrant's control affiliates for each of the last two fiscal years of the registrant were $1,966,988 for the fiscal year ended March 31, 2011 and $5,403,506 for the fiscal year ended March 31, 2010.
(h) The audit committee of the registrant has considered the non-audit services provided by the registrant’s principal accountant(s) to the control affiliates and has determined that the services that were not pre-approved are compatible with maintaining the principal accountant(s)' independence.
ITEM 5. AUDIT COMMITTEE OF LISTED REGISTRANTS.
The registrant has a separately-designated standing audit committee comprised of independent trustees. The members of the audit committee are as follows:
Stanley Martin - Chairman
Deborah C. Jackson
Charles L. Ladner
Patti McGill Peterson
ITEM 6. SCHEDULE OF INVESTMENTS.
(a) Not applicable.
(b) Not applicable.
ITEM 7. DISCLOSURE OF PROXY VOTING POLICIES AND PROCEDURES FOR CLOSED-END MANAGEMENT INVESTMENT COMPANIES.
Not applicable.
ITEM 8. PORTFOLIO MANAGERS OF CLOSED-END MANAGEMENT INVESTMENT COMPANIES.
Not applicable.
ITEM 9. PURCHASES OF EQUITY SECURITIES BY CLOSED-END MANAGEMENT INVESTMENT COMPANY AND AFFILIATED PURCHASERS.
Not applicable.
ITEM 10. SUBMISSION OF MATTERS TO A VOTE OF SECURITY HOLDERS.
There were no material changes to previously disclosed John Hancock Funds – Governance Committee Charter.
ITEM 11. CONTROLS AND PROCEDURES.
(a) Based upon their evaluation of the registrant's disclosure controls and procedures as conducted within 90 days of the filing date of this Form N-CSR, the registrant's principal executive officer and principal financial officer have concluded that those disclosure controls and procedures provide reasonable assurance that the material information required to be disclosed by the registrant on this report is recorded, processed, summarized and reported within the time periods specified in the Securities and Exchange Commission's rules and forms.
(b) There were no changes in the registrant's internal control over financial reporting that occurred during the registrant's most recent fiscal half-year (the registrant's second fiscal half-year in the case of an annual report) that have materially affected, or are reasonably likely to materially affect, the registrant's internal control over financial reporting.
ITEM 12. EXHIBITS.
(a)(1) Code of Ethics for Senior Financial Officers is attached.
(a)(2) Separate certifications for the registrant's principal executive officer and principal financial officer, as required by Section 302 of the Sarbanes-Oxley Act of 2002 and Rule 30a-2(a) under the Investment Company Act of 1940, are attached.
(b) Separate certifications for the registrant's principal executive officer and principal financial officer, as required by 18 U.S.C. Section 1350, as adopted pursuant to Section 906 of the Sarbanes-Oxley Act of 2002, and Rule 30a-2(b) under the Investment Company Act of 1940, are attached. The certifications furnished pursuant to this paragraph are not deemed to be "filed" for purposes of Section 18 of the Securities Exchange Act of 1934, or otherwise subject to the liability of that section. Such certifications are not deemed to be incorporated by reference into any filing under the Securities Act of 1933 or the Securities Exchange Act of 1934, except to the extent that the Registrant specifically incorporates them by reference.
(c)(1) Submission of Matters to a Vote of Security Holders is attached. See attached “John Hancock Funds – Governance Committee Charter”.
(c)(2) Contact person at the registrant.
Pursuant to the requirements of the Securities Exchange Act of 1934 and the Investment Company Act of 1940, the registrant has duly caused this report to be signed on its behalf by the undersigned, thereunto duly authorized.
John Hancock Current Interest
| |
| By: | /s/ Keith F. Hartstein |
| | ------------------------------ |
| | Keith F. Hartstein |
| President and |
| | Chief Executive Officer |
| |
| |
| Date: | May 20, 2011 |
Pursuant to the requirements of the Securities Exchange Act of 1934 and the Investment Company Act of 1940, this report has been signed below by the following persons on behalf of the registrant and in the capacities and on the dates indicated.
| |
| By: | /s/ Keith F. Hartstein |
| | ------------------------------- |
| Keith F. Hartstein |
| President and |
| | Chief Executive Officer |
| |
| |
| Date: | May 20, 2011 |
| |
| |
| By: | /s/ Charles A. Rizzo |
| | ------------------------------ |
| Charles A. Rizzo |
| | Chief Financial Officer |
| |
| |
| Date: | May 20, 2011 |