UNITED STATES
SECURITIES AND EXCHANGE COMMISSION
Washington, D.C. 20549
|
FORM N-CSR
CERTIFIED SHAREHOLDER REPORT OF REGISTERED
MANAGEMENT INVESTMENT COMPANIES
Investment Company Act file number 811- 2485
John Hancock Current Interest
(Exact name of registrant as specified in charter)
|
601 Congress Street, Boston, Massachusetts 02210
(Address of principal executive offices) (Zip code)
|
Alfred P. Ouellette
Senior Attorney and Assistant Secretary
601 Congress Street
Boston, Massachusetts 02210
(Name and address of agent for service)
Registrant's telephone number, including area code: 617-663-4324
| Date of fiscal year end: | March 31 |
| | | |
| | | |
| Date of reporting period: | March 31, 2006 |
ITEM 1. REPORT TO SHAREHOLDERS.

| Table of contents |
|
| Your fund at a glance |
| page 1 |
|
| Managers’ report |
| page 2 |
|
| Your expenses |
| page 5 |
|
| Fund’s investments |
| page 7 |
|
| Financial statements |
| page 9 |
|
| Trustees & officers |
| page 22 |
|
| For more information |
| page 29 |
|
To Our Shareholders,
After producing modest returns in 2005, the stock market started off strong in the first quarter of 2006. The major indexes all advanced and produced three-month returns that equaled the market’s returns for all of 2005. For example, the Standard & Poor’s 500 Index returned 4.21% through March 2006, versus 4.91% last year in total. Investors were encouraged by solid corporate earnings, a slower-growing economy and stable inflation, which suggested the Federal Reserve could be coming close to the end of their 18-month campaign of rising interest rates.
Although a solid yearly beginning has typically augured well for the rest of the year, it is anyone’s guess where the market will end 2006, especially given the wild cards of interest rate moves and record-high energy prices and their impact on corporate profits and the economy.
One thing we do know, however, is that the stock market’s pattern is one of extremes. Consider the last 10 years. From 1995 through 1999, we saw double-digit returns in excess of 20% per year, only to have 2000 through 2002 produce ever-increasing negative results, followed by another 20%-plus up year in 2004 and a less than 5% advance in 2005. Since 1926, the market, as measured by the Standard & Poor’s 500 Index, has produced average annual results of 10.4% . However, that “normal” return is rarely produced in any given year. In fact, calendar-year returns of 8% to 12% have occurred only five times in the 80 years since 1926.
Although the past in no way predicts the future, we have learned at least one lesson from history: Expect highs and lows in the short term, but always invest for the long term. Equally important: Work with your financial professional to maintain a diversified portfolio, spread out among not only different asset classes — stocks, bonds and cash — but also among various investment styles. It’s the best way we know of to benefit from, and weather, the market’s extremes.
Sincerely,

Keith F. Hartstein,
President and Chief Executive Officer
|
This commentary reflects the CEO’s views as of March 31, 2006. They are subject to change at any time.
YOUR FUND
AT A GLANCE
The Funds seeks
the maximum
current income
that is consistent
with maintaining
liquidity and
preserving capital.
The Fund intends to
maintain a stable
$1 share price.
|
| | Over the last twelve months |
| |
| * | The economy showed continued strength for the most part, causing |
| | the Federal Reserve to maintain its 18-month rate-hike program. |
| |
| * | Money market yields rose steadily, as the Federal Reserve kept raising |
| | short-term interest rates. |
| |
| * | The Fund was positioned for rate hikes for much of the year, but |
| | ended the year positioned for the end of the tightening cycle. |

The total return for the Fund is at net asset value with all distributions reinvested. Past performance is no guarantee of future results.
1
BY DAVID A. BEES AND DAVID P. LYNCH FOR THE SOVEREIGN ASSET MANAGEMENT LLC PORTFOLIO MANAGEMENT TEAM
JOHN HANCOCK
U.S. Government
Cash Reserve
|
Money market yields rose steadily during the 12-month period ended March 31, 2006, as the Federal Reserve Board continued its policy of short-term interest rate hikes. Over the period, the federal funds rate that banks charge each other for overnight loans went from 3.00% to 4.75% . The latest rate increase occurred March 28, 2006 and marked the 15th consecutive 25 basis point (0.25%) hike since June 2004.
At the beginning of the period, increasing energy prices had begun to weigh on the market, and many felt the Fed might pause to gauge the full impact on the economy. Instead, the Fed affirmed the strength of the economy and warned that the high energy prices had made short-term inflation a concern. In September, the Gulf Coast suffered with Katrina and Rita, two of the most devastating hurricanes to hit this country. However, the massive destruction to infrastructure and personal property, and already high energy prices, still did not deter the Federal Reserve from raising rates.
“Money market yields rose
steadily during the
12-month period ended
March 31, 2006...”
|
Despite these short-term speed bumps, the economy continued to show signs of growth. The unemployment rate decreased from 5.1% in April 2005 to 4.7% in March 2006, as the economy continued to add jobs at a solid pace — 174,000 jobs per month on average over the period. The housing market, which had been red hot for the past few years, started to show signs of a pullback. While the housing market continues to remain strong, the monthly existing home sales number has moderated slightly, declining from a peak of 7.27 million existing homes in June to 6.91 million homes in February.
It was in this environment that long-standing Fed Chairman Alan Greenspan stepped down in January and was replaced by former Chairman of the President’s Council of Economic Advisers,
2

Ben Bernanke. Chairman Bernanke has been one of the more outspoken economic advisers in the past and has declared that the Federal Reserve will be more transparent regarding future Federal Open Market Committee (FOMC) rate decisions during his tenure. Just how transparent remains to be seen, but in the latest policy statement, the FOMC declared that “further policy firming may be needed.”
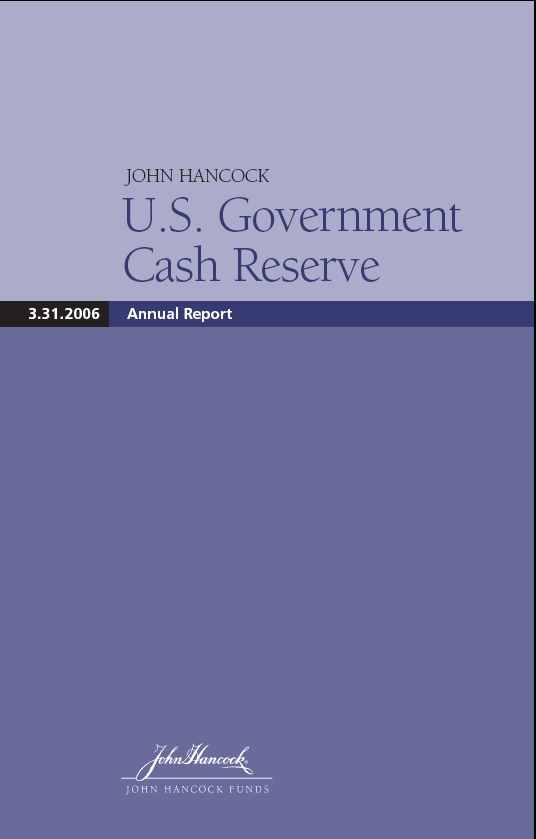
Fund yield and performance
On March 31, 2006, John Hancock U.S. Government Cash Reserve had a 7-day effective yield of 3.92% . By comparison, the average U.S. government money market fund had a 7-day effective yield of 3.84%, according to Lipper, Inc.
For the year ended March 31, 2006, the Fund posted a total return of 2.89% at net asset value, compared with the 2.94% return of the average U.S. government money market fund, according to Lipper, Inc. Keep in mind that your net asset value return will be different from the Fund’s performance if you were not invested in the Fund for the entire period and did not reinvest all distributions.
Fund moves
The portfolio structure has changed significantly in the past 12 months. At the start of the period, the Fund was set up for a continued rising-rate environment. We kept our weighted average days to maturity shorter than our peers, giving us a greater opportunity to quickly reinvest assets at higher rates. The largest exposure was to floating-rate securities, which allowed the portfolio to capture rising rates in a timely manner due to the one-month and three-month rate-reset feature on these securities.
“...we believe the Federal Reserve
is nearing the end of this
rate-tightening cycle.”
|
As we approached the end of 2005, further rate increases became less certain, and we scaled back our term to maturity in floating-rate securities. We also increased our weighted average maturity until we were in line with our peers.
By the end of the period, with the overnight lending rate at 4.75% and the chances of further rate hikes decreasing, we began to extend further out the money market curve, ending the period
3
with a longer weighted average maturity than our peers. Longer-term fixed-rate securities began to look attractive, so we used this opportunity to reduce our floating rate exposure and add to our fixed-rate weighting.
Outlook
Taking clues from Chairman Bernanke’s first FOMC policy statement, it is clear to us that the Federal Reserve will be closely monitoring all future economic releases to help attain the correct balance between growth and inflation. GDP growth, housing prices and energy commodity prices will all be in the Federal Reserve’s crosshairs. After having raised short-term interest rates by 3.75% in a long and orderly tightening, we believe the Federal Reserve is nearing the end of this rate-tightening cycle.
While we still remain cautious about future rate hikes, we are nonetheless beginning to extend further out the money market curve, as we mentioned, in anticipation of the end of this tightening cycle. With stable short-term interest rates, we believe longer-dated securities will produce higher yields. In addition to our focus on capturing additional yield, we will strive, as always, to maintain liquidity and preserve stability of principal.
This commentary reflects the views of the portfolio management team through the end of the Fund’s period discussed in this report. The team’s statements reflect its own opinions. As such, they are in no way guarantees of future events, and are not intended to be used as investment advice or a recommendation regarding any specific security. They are also subject to change at any time as market and other conditions warrant.
The Fund is neither insured nor guaranteed by the U.S. government. Although the Fund seeks to maintain a net asset value of $1.00 per share, it is possible to lose money by investing in the Fund.
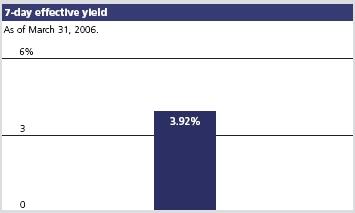
1 As a percentage of net assets on March 31, 2006.
4
These examples are intended to help you understand your ongoing operating expenses.
Understanding fund expenses
As a shareholder of the Fund, you incur two types of costs: |
| * | Transaction costs such as a minimum account fee charge. |
| * | Ongoing operating expenses including management |
| fees, distribution and service fees (if applicable) and other |
| fund expenses. |
We are going to present only your ongoing operating expenses here.
Actual expenses/actual returns
This example is intended to provide information about your fund’s actual ongoing operating expenses, and is based on your fund’s actual return. It assumes an account value of $1,000.00 on September 30, 2005, with the same investment held until March 31, 2006.
| Account value | | Expenses paid |
| $1,000.00 | Ending value | during period |
| on 9-30-05 | on 3-31-06 | ended 3-31-061 |
|
| |
| U.S. Government Cash Reserve | $1,017.30 | $4.03 |
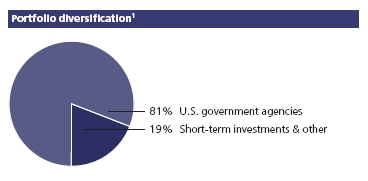
Together with the value of your account, you may use this information to estimate the operating expenses that you paid over the period. Simply divide your account value at March 31, 2006 by $1,000.00, then multiply it by the “expenses paid” for your share class from the table above. For example, for an account value of $8,600.00, the operating expenses should be calculated as follows:
5
Hypothetical example for comparison purposes
This table allows you to compare your fund’s ongoing operating expenses with those of any other fund. It provides an example of the Fund’s hypothetical account values and hypothetical expenses based on the Fund’s actual expense ratio and an assumed 5% annual return before expenses (which is not your fund’s actual return). It assumes an account value of $1,000.00 on September 30, 2005, with the same investment held until March 31, 2006. Look in any other fund shareholder report to find its hypothetical example and you will be able to compare these expenses.
| Account value | | Expenses paid |
| $1,000.00 | Ending value | during period |
| on 9-30-05 | on 3-31-06 | ended 3-31-061 |
|
| |
| U.S. Government Cash Reserve | $1,020.90 | $4.04 |
Remember, these examples do not include any transaction costs, such as the minimum account fee charge; therefore, these examples will not help you to determine the relative total costs of owning different funds. If transaction costs were included, your expenses would have been higher. See the prospectus for details regarding transaction costs.
1 Expenses are equal to the Fund’s annualized expense ratio of 0.80%, multiplied by the average account value over the period, multiplied by number of days in most recent fiscal half-year/365 or 366 (to reflect the one-half year period).
6
F I N A N C I A L S TAT E M E N T S
FUND’S
INVESTMENTS
Securities owned
by the Fund on
March 31, 2006
|
This schedule is a complete list of all securities owned by the Fund. It’s divided into two types of short-term investments: U.S. government obligations and joint repurchase agreement.
| | | Interest | Maturity | Credit | Par value | |
| Issuer | | rate | date | rating (A) | (000) | Value |
|
| U.S. government obligations 80.96% | | | | | $32,820,356 |
| (Cost $32,820,356) | | | | | | |
| Government — U.S. Agencies 80.96% | | | | | 32,820,356 |
|
| Federal Farm Credit Bank (P) | | 4.565% | 01-03-07 | AAA | $500 | 499,961 |
|
| Federal Home Loan Bank (P) | | 4.770 | 06-12-06 | AAA | 2,700 | 2,699,651 |
|
| Federal Home Loan Bank (P) | | 4.770 | 12-13-06 | AAA | 1,000 | 999,816 |
|
| Federal Home Loan Bank (P) | | 4.670 | 08-21-06 | AAA | 3,000 | 3,000,084 |
|
| Federal Home Loan Bank | | 4.625 | 01-17-07 | AAA | 1,250 | 1,248,161 |
|
| Federal Home Loan Bank (P) | | 4.570 | 08-02-06 | AAA | 2,500 | 2,499,782 |
|
| Federal Home Loan Bank | | 4.554 | 04-28-06 | AAA | 2,500 | 2,491,525 |
|
| Federal Home Loan Bank (P) | | 4.523 | 06-02-06 | AAA | 600 | 599,996 |
|
| Federal Home Loan Bank | | 3.250 | 07-21-06 | AAA | 1,000 | 994,943 |
|
| Federal Home Loan Bank | | 2.500 | 04-11-06 | AAA | 1,425 | 1,424,212 |
|
| Federal Home Loan Bank | | 2.300 | 08-30-06 | AAA | 2,000 | 1,981,236 |
|
| Federal Home Loan Mortgage Corp. | 2.375 | 04-15-06 | AAA | 2,055 | 2,053,001 |
|
| Federal Home Loan Mortgage Corp. | 2.000 | 07-07-06 | AAA | 2,000 | 1,985,803 |
|
| Federal National Mortgage Assn. | | 5.250 | 06-15-06 | AAA | 1,500 | 1,501,068 |
|
| Federal National Mortgage Assn. (P) | 4.810 | 09-22-06 | AAA | 1,000 | 999,869 |
|
| Federal National Mortgage Assn. (P) | 4.725 | 09-07-06 | AAA | 3,500 | 3,499,100 |
|
| Federal National Mortgage Assn. (P) | 4.665 | 05-22-06 | AAA | 3,250 | 3,249,903 |
|
| Federal National Mortgage Assn. | | 2.500 | 05-12-06 | AAA | 1,095 | 1,092,245 |
| |
| | | | | Interest | Par value | |
| Issuer, description, maturity date | | | | rate | (000) | Value |
|
| Joint repurchase agreement 18.49% | | | | | $7,496,000 |
| (Cost $7,496,000) | | | | | | |
| Investment in a joint repurchase agreement transaction | | | | |
| with Morgan Stanley — Dated 3-31-06 due 4-3-06 | | | | |
| (secured by U.S. Treasury Inflation Indexed Note 3.875% | | | |
| due 1-15-09) | | | | 4.470% | $7,496 | 7,496,000 |
See notes to
financial statements.
|
7
F I N A N C I A L S TAT E M E N T S
| Total investments 99.45% | $40,316,356 |
|
| Other assets and liabilities, net 0.55% | $221,793 |
|
| Total net assets 100.00% | $40,538,149 |
(A) Credit ratings are unaudited and are rated by Moody’s Investors Service where Standard & Poor’s ratings are not available.
(P) Represents rate in effect on March 31, 2006.
The percentage shown for each investment category is the total value of that category as a percentage of the net assets of the Fund.
See notes to
financial statements.
|
8
F I N A N C I A L S TAT E M E N T S
ASSETS AND
LIABILITIES
March 31, 2006
This Statement
of Assets and
Liabilities is the
Fund’s balance
sheet. It shows
the value of
what the Fund
owns, is due
and owes. You’ll
also find the net
asset value for
each share.
|
| Assets | |
| Investments at value (cost $32,820,356) | $32,820,356 |
| Joint repurchase agreement (cost $7,496,000) | 7,496,000 |
| Cash | 486 |
| Receivable for shares sold | 118,903 |
| Interest receivable | 178,497 |
| Other assets | 55,001 |
| Total assets | 40,669,243 |
|
| Liabilities | |
| Payable for shares repurchased | 42,779 |
| Dividends payable | 4,850 |
| Payable to affiliates | |
| Management fees | 18,509 |
| Other | 10,267 |
| Other payables and accrued expenses | 54,689 |
| Total liabilities | 131,094 |
|
| Net assets | |
| Capital paid-in | 40,537,937 |
| Accumulated net investment income | 212 |
| Net assets | $40,538,149 |
|
| Net asset value per share | |
| Based on net asset value and shares outstanding — | |
| the Fund has an unlimited number of shares | |
| authorized with no par value | |
| ($40,538,149 ÷ 40,556,193 shares) | $1.00 |
See notes to
financial statements.
|
9
F I N A N C I A L S TAT E M E N T S
OPERATIONS
For the year ended
March 31, 2006
This Statement
of Operations
summarizes the
Fund’s investment
income earned and
expenses incurred in
operating the Fund.
|
| Investment income | |
| Interest | $1,587,499 |
| Total investment income | 1,587,499 |
|
Expenses | |
| Investment management fees | 214,400 |
| Distribution and service fees | 64,320 |
| Transfer agent fees | 56,826 |
| Registration and filing fees | 25,936 |
| Custodian fees | 19,733 |
| Professional fees | 18,613 |
| Printing | 16,811 |
| Accounting and legal services fees | 10,720 |
| Miscellaneous | 5,272 |
| Trustees’ fees | 3,194 |
| Compliance fees | 1,473 |
| Interest | 121 |
Total expenses | 437,419 |
| Less expense reductions | (64,320) |
Net expenses | 373,099 |
Net investment income | 1,214,400 |
Increase in net assets from operations | $1,214,400 |
See notes to
financial statements.
|
10
F I N A N C I A L S TAT E M E N T S
CHANGES IN
NET ASSETS
These Statements
of Changes in Net
Assets show how
the value of the
Fund’s net assets
has changed
during the last
two periods. The
difference reflects
earnings less
expenses, distribu-
tions, if any, paid to
shareholders and
the net of Fund
share transactions.
|
| | Year | Year |
| | ended | ended |
| | 3-31-051 | 3-31-06 |
|
| Increase (decrease) in net assets | | |
| From operations | | |
| Net investment income | $405,139 | $1,214,400 |
Increase in net assets resulting | | |
| from operations | 405,139 | 1,214,400 |
Distributions to shareholders | | |
| From net investment income | (405,139) | (1,214,400) |
From Fund share transactions | (11,646,570) | (4,950,260) |
|
| Net assets | | |
| Beginning of period | 57,134,979 | 45,488,409 |
End of period2 | $45,488,409 | $40,538,149 |
1 Audited by previous auditor.
2 Includes accumulated net investment income of $708 and $212, respectively.
|
See notes to
financial statements.
|
11
F I N A N C I A L H I G H L I G H T S
COMMON SHARES
The Financial Highlights show how the Fund’s net asset value for a
share has changed since the end of the previous period.
|
| Period ended | 3-31-021 | 3-31-031 | 3-31-041 | 3-31-051 | 3-31-06 |
|
| Per share operating performance | | | | | |
| Net asset value, | | | | | |
| beginning of period | $1.00 | $1.00 | $1.00 | $1.00 | $1.00 |
| Net investment income2 | 0.03 | 0.01 | —3 | 0.01 | 0.03 |
| Less distributions | | | | | |
| From net investment income | (0.03) | (0.01) | —3 | (0.01) | (0.03) |
| Net asset value, end of period | $1.00 | $1.00 | $1.00 | $1.00 | $1.00 |
| Total return4,5 (%) | 2.60 | 0.91 | 0.34 | 0.80 | 2.89 |
|
| Ratios and supplemental data | | | | | |
| Net assets, end of period | | | | | |
| (in millions) | $95 | $73 | $57 | $45 | $41 |
| Ratio of expenses | | | | | |
| to average net assets (%) | 0.72 | 0.73 | 0.77 | 0.84 | 0.87 |
| Ratio of gross expenses | | | | | |
| to average net assets6 (%) | 0.87 | 0.88 | 0.92 | 0.99 | 1.02 |
| Ratio of net investment income | | | | | |
| to average net assets (%) | 2.55 | 0.92 | 0.34 | 0.77 | 2.83 |
1 Audited by previous auditor.
2 Based on the average of the shares outstanding.
3 Less than $0.01 per share.
4 Assumes dividend reinvestment.
5 Total returns would have been lower had certain expenses not been reduced during the periods shown.
6 Does not take into consideration expense reductions during the periods shown.
See notes to
financial statements.
|
12
Note A
Accounting policies
John Hancock U.S. Government Cash Reserve (the “Fund”) is a diversified series of John Hancock Current Interest (the “Trust”), an open-end management investment company registered under the Investment Company Act of 1940. The investment objective of the Fund is to provide maximum current income consistent with maintaining liquidity and preserving capital.
Significant accounting policies
of the Fund are as follows:
Valuation of investments
Securities in the Fund’s portfolio are valued at amortized cost, in accordance with Rule 2a-7 of the Investment Company Act of 1940, which approximates market value. The amortized cost method involves valuing a security at its cost on the date of purchase and thereafter assuming a constant amortization to maturity of the difference between the principal amount due at maturity and the cost of the security to the Fund.
Joint repurchase agreement
Pursuant to an exemptive order issued by the Securities and Exchange Commission, the Fund, along with other registered investment companies having a management contract with John Hancock Advisers, LLC (the “Adviser”), a wholly owned subsidiary of John Hancock Financial Services, Inc., a subsidiary of Manulife Financial Corporation (“MFC”), may participate in a joint repurchase agreement transaction. Aggregate cash balances are invested in one or more large repurchase agreements, whose underlying securities are obligations of the U.S. government and/or its agencies. The Fund’s custodian bank receives delivery of the underlying securities for the joint account on the Fund’s behalf. The Adviser is responsible for ensuring that the agreement is fully collateralized at all times.
Investment transactions
Investment transactions are recorded as of the date of purchase, sale or maturity. Net realized gains and losses on sales of investments are determined on the identified cost basis.
Expenses
The majority of expenses are directly identifiable to an individual fund. Expenses that are not readily identifiable to a specific fund are allocated in such a manner as deemed equitable, taking into consideration, among other things, the nature and type of expense and the relative sizes of the funds.
Federal income taxes
The Fund qualifies as a “regulated investment company” by complying with the applicable provisions of the Internal Revenue Code and will not be subject to federal income tax on taxable income that is distributed to shareholders. Therefore, no federal income tax provision is required.
Distributions
The Fund’s net investment income is declared daily as
13
dividends to shareholders of record as of the close of business on the preceding day and distributed monthly.
During the year ended March 31, 2005, the tax character of distributions paid was as follows: ordinary income $405,139. During the year ended March 31, 2006, the tax character of distributions paid was as follows: ordinary income $1,214,400.
As of March 31, 2006, the components of distributable earnings on a tax basis included $14,424 of undistributed ordinary income.
Such distributions and distributable earnings, on a tax basis, are determined in conformity with income tax regulations, which may differ from accounting principles generally accepted in the United States of America. Distributions in excess of tax basis earnings and profits, if any, are reported in the Fund’s financial statements as a return of capital.
Use of estimates
The preparation of these financial statements, in accordance with accounting principles generally accepted in the United States of America, incorporates estimates made by management in determining the reported amount of assets, liabilities, revenues and expenses of the Fund. Actual results could differ from these estimates.
Note B
Management fee and
transactions with
affiliates and others
The Fund has an investment management contract with the Adviser. Under the investment management contract, the Fund pays a monthly management fee to the Adviser equivalent, on an annual basis, to the sum of: (a) 0.50% of the first $500,000,000 of the Fund’s average daily net asset value, (b) 0.425% of the next $250,000,000, (c) 0.375% of the next $250,000,000, (d) 0.35% of the next $500,000,000, (e) 0.325% of the next $500,000,000, (f) 0.30% of the next $500,000,000 and (g) 0.275% of the average daily net asset value in excess of $2,500,000,000.
Effective December 31, 2005, the investment management teams of the Adviser were reorganized into Sovereign Asset Management LLC (“Sovereign”), a wholly owned indirect subsidiary of John Hancock Life Insurance Company (“JHLICo”), a subsidiary of MFC. The Adviser remains the principal advisor on the Fund, and Sovereign acts as subadviser under the supervision of the Adviser. The restructuring did not have an impact on the Fund, which continues to be managed using the same investment philosophy and process. The Fund is not responsible for payment of the subadvisory fees.
The Trust has a Distribution Agreement with John Hancock Funds, LLC (“JH Funds”), a wholly owned subsidiary of the Adviser. The Fund has adopted a Distribution Plan pursuant to Rule 12b-1 under the Investment Company Act of 1940, to reimburse JH Funds for the services it provides as distributor of shares of the Fund. Accordingly, the Fund makes monthly payments to JH Funds at an annual rate not to exceed 0.15% of average daily net asset value of the Fund. JH Funds has agreed to suspend the distribution and service (“12b-1”) fee, at least until July 31, 2006. Accordingly, the reduction in the 12b-1 fee amounted to $64,320 for the year ended March 31, 2006. JH Funds reserves the right to terminate this limitation in the future.
The Fund has a transfer agent agreement with John Hancock Signature Services, Inc. (“Signature Services”), an indirect subsidiary of JHLICo, a subsidiary of MFC. The Fund paid a monthly transfer agent fee at an annual rate of 0.015% of the Fund’s average daily net asset value until December 31, 2005. Effective January 1, 2006, the Fund pays a monthly transfer agent fee at an annual rate of 0.01% of the Fund’s average daily net asset value, plus a fee based on the number of shareholder accounts and reimbursement for certain
14
out-of-pocket expenses. Signature Services agreed to voluntarily reduce the Fund’s asset-based portion of the transfer agent fee if the total transfer agent fee exceeds the Lipper, Inc. median transfer agency fee for comparable mutual funds by greater than 0.05% . There were no transfer agent fee reductions during the year ended March 31, 2006. Signature Services reserves the right to terminate this limitation at any time.
The Fund has an agreement with the Adviser to perform necessary tax, accounting and legal services for the Fund. The compensation for the year amounted to $10,720. The Fund also paid the Adviser the amount of $516 for certain publishing services, included in the printing fees. The Fund reimbursed JHLICo for certain compliance costs, included in the Fund’s Statement of Operations.
Mr. James R. Boyle is Chairman of the Adviser, as well as an affiliated Trustee of the Fund, and is compensated by the Adviser and/or its affiliates. The compensation of unaffiliated Trustees is borne by the Fund. The unaffiliated Trustees may elect to defer, for tax purposes, their receipt of this compensation under the John Hancock Group of Funds Deferred Compensation Plan. The Fund makes investments into other John Hancock funds, as applicable, to cover its liability for the deferred compensation. Investments to cover the Fund’s deferred compensation liability are recorded on the Fund’s books as an other asset. The deferred compensation liability and the related other asset are always equal and are marked to market on a periodic basis to reflect any income earned by the investments, as well as any unrealized gains or losses. The Deferred Compensation Plan investments had no impact on the operations of the Fund.
Note C
Fund share transactions
This listing illustrates the number of Fund shares sold, reinvested and repurchased during the last two periods, along with the corresponding dollar value. Analysis of Fund share transactions is reported at $1 per share.
| | Year ended | Year ended |
| | 3-31-051 | 3-31-06 |
| |
| Sold | $23,573,220 | $16,985,735 |
| Distributions reinvested | 385,964 | 1,157,185 |
| Repurchased | (35,605,754) | (23,093,180) |
| Net decrease | ($11,646,570) | ($4,950,260) |
1 Audited by previous auditor.
Note D
Investment
transactions
Purchases and proceeds from sales or maturities of securities, including discount earned on investment securities other than short-term securities and obligations of the U.S. government, during the year ended March 31, 2006, aggregated $1,582,970,853 and $1,588,454,000, respectively.
The cost of investments owned on March 31, 2006, for federal income tax purposes, was $40,316,356.
Note E
Reclassification
of accounts
During the year ended March 31, 2006, the Fund reclassified amounts to reflect a decrease in accumulated net investment loss of $496 and an increase in capital paid-in of $496. This represents the amounts necessary to report these balances on a tax basis, excluding certain temporary differences, as of March 31, 2006. Additional adjustments may be
15
needed in subsequent reporting periods. These reclassifications, which have no impact on the net asset value of the Fund, are primarily attributable to certain differences in the computation of distributable income and capital gains under federal tax rules versus accounting principles generally accepted in the United States of America, and book and tax differences in accounting for deferred compensation. The calculation of net investment income per share in the Fund’s Financial Highlights excludes these adjustments.
16
AUDITORS’
REPORT
Report of
Independent
Registered Public
Accounting Firm
|
To the Board of Trustees of the John Hancock
Current Interest and Shareholders of John Hancock
U.S. Government Cash Reserve,
|
In our opinion, the accompanying statement of assets and liabilities, including the schedule of investments, and the related statements of operations and of changes in net assets and the financial highlights present fairly, in all material respects, the financial position of John Hancock U.S. Government Cash Reserve (the “Fund”) as of March 31, 2006, the results of its operations, the changes in its net assets and the financial highlights for the year then ended, in conformity with accounting principles generally accepted in the United States of America. These financial statements and financial highlights (hereafter referred to as “financial statements”) are the responsibility of the Fund’s management; our responsibility is to express an opinion on these financial statements based on our audits. We conducted our audits of these financial statements in accordance with the standards of the Public Company Accounting Oversight Board (United States). Those standards require that we plan and perform the audit to obtain reasonable assurance about whether the financial statements are free of material misstatement. An audit includes examining, on a test basis, evidence supporting the amounts and disclosures in the financial statements, assessing the accounting principles used and significant estimates made by management and evaluating the overall financial statement presentation. We believe that our audits, which included confirmation of securities as of March 31, 2006 by correspondence with the custodian and brokers, provide a reasonable basis for our opinion. The statement of changes in net assets of the Fund for the year ended March 31, 2005, and the financial highlights for each of the four years ended on or before March 31, 2005 were audited by another independent registered public accounting firm, whose report dated May 5, 2005 expressed an unqualified opinion thereon.
PricewaterhouseCoopers LLP
Boston, Massachusetts
May 11, 2006
|
17
For federal income tax purposes, the following information is furnished with respect to the distributions of the Fund, if any, paid during its taxable year ended March 31, 2006.
The Fund hereby designates the maximum amount allowable of its net taxable income as qualified dividend income as provided in the Jobs and Growth Tax Relief Reconciliation Act of 2003. This amount will be reflected on Form 1099-DIV for the calendar year 2006.
Shareholders will be mailed a 2006 U.S. Treasury Department Form 1099-DIV in January 2007. This will reflect the total of all distributions that are taxable for calendar year 2006.
18
Board Consideration
of and Continuation
of Investment
Advisory Agreement:
John Hancock
U.S. Government
Cash Reserve
Section 15(c) of the Investment Company Act of 1940 (the “1940 Act”) requires the Board of Trustees (the “Board”) of John Hancock Current Interest (the “Trust”), including a majority of the Trustees who have no direct or indirect interest in the investment advisory agreement and are not “interested persons” of the Trust, as defined in the 1940 Act (the “Independent Trustees”), annually to review and consider the continuation of the investment advisory agreement (the “Advisory Agreement”) with John Hancock Advisers, LLC (the “Adviser”) for the John Hancock U.S. Government Cash Reserve (the “Fund”).
At meetings held on May 19–20 and June 6–7, 2005, the Board, including the Independent Trustees, considered the factors and reached the conclusions described below relating to the selection of the Adviser and the continuation of the Advisory Agreement. During such meetings, the Board’s Contracts/Operations Committee and the Independent Trustees also met in executive sessions with their independent legal counsel. In evaluating the Advisory Agreement, the Board, including the Contracts/Operations Committee and the Independent Trustees, reviewed a broad range of information requested for this purpose by the Independent Trustees, including but not limited to the following: (i) the investment performance of the Fund and a broader universe of relevant funds (the “Universe”) selected by Lipper, Inc. (“Lipper”), an independent provider of investment company data, for a range of periods, (ii) advisory and other fees incurred by, and the expense ratios of, the Fund and a peer group of comparable funds selected by Lipper (the “Peer Group”), (iii) the advisory fees of comparable portfolios of other clients of the Adviser, (iv) the Adviser’s financial results and condition, including its and certain of its affiliates’ profitability from services performed for the Fund, (v) breakpoints in the Fund’s and the Peer Group’s fees and a study undertaken at the direction of the Independent Trustees as to the allocation of the benefits of economies of scale between the Fund and the Adviser, (vi) the Adviser’s record of compliance with applicable laws and regulations, with the Fund’s investment policies and restrictions, and with the Fund’s Code of Ethics and the structure and responsibilities of the Adviser’s compliance department, (vii) the background and experience of senior management and investment professionals and (viii) the nature, cost and character of advisory and non-investment management services provided by the Adviser and its affiliates.
Nature, extent and quality
of services
The Board considered the ability of the Adviser, based on its resources, reputation and other attributes, to attract and retain qualified investment professionals, including research, advisory and supervisory personnel. The Board further considered the compliance programs and compliance records of the Adviser. In addition, the Board took into account the administrative services provided to the Fund by the Adviser and its affiliates.
Based on the above factors, together with those referenced below, the Board concluded that, within the context of its full deliberations, the nature, extent and quality of the investment advisory services provided to the Fund by the Adviser were sufficient to support renewal of the Advisory Agreement.
Fund performance
The Board considered the performance results for the Fund over various time periods. The Board also considered these results in
19
comparison to the performance of the Universe, as well as the Fund’s benchmark indexes. Lipper determined the Universe for the Fund. The Board reviewed with a representative of Lipper the methodology used by Lipper to select the funds in the Universe and the Peer Group.
The Board noted that the performance of the Fund was higher than or not appreciably below the median and average performance of its Universe and the performance of one of its benchmark indexes, the Lipper U.S. Government Money Market Funds Index, for the time periods under review. The Board also noted that the Fund’s performance was below that of its other benchmark index, the Average/Total of iMoneyNet Universe, as was the Universe, for the time periods under review.
Investment advisory fee
rates and expenses
The Board reviewed and considered the contractual investment advisory fee rate payable by the Fund to the Adviser for investment advisory services (the “Advisory Agreement Rate”). The Board received and considered information comparing the Advisory Agreement Rate with the advisory fees for the Peer Group. The Board noted that the Advisory Agreement Rate was equal to the median rate of the Peer Group. The Board concluded that the Advisory Agreement Rate was reasonable in relation to the services provided.
The Board received and considered information regarding the Fund’s total operating expense ratio and its various components, including contractual advisory fees, actual advisory fees, non-management fees, Rule 12b-1 and non-Rule 12b-1 service fees, transfer agent fees and custodian fees, including and excluding Rule 12b-1 and non-Rule 12b-1 service fees. The Board also considered comparisons of these expenses to the expense information for the Peer Group and the Universe. The Board noted that the total operating expense ratio of the Fund was higher than the median total operating expense ratio of the Peer Group and the Universe. It also noted that the most significant contributors to such differences were the Fund’s actual management fee, the custodian fee and the transfer agency expense. The Board favorably considered the Adviser’s and transfer agent’s commitment to developing initiatives designed to reduce their overall fees and expenses.
The Adviser also discussed the Lipper data and rankings, and other relevant information, for the Fund. Based on the above-referenced considerations and other factors, the Board concluded that the Fund’s performance and plans to reduce the Fund’s overall fees and expenses supported the reapproval of the Advisory Agreements.
Profitability
The Board received and considered a detailed profitability analysis of the Adviser based on the Advisory Agreement, as well as on other relationships between the Fund and the Adviser and its affiliates. The Board concluded that, in light of the costs of providing investment management and other services to the Fund, the profits and other ancillary benefits reported by the Adviser were not unreasonable.
Economies of scale
The Board received and considered general information regarding economies of scale with respect to the management of the Fund, including the Fund’s ability to appropriately benefit from economies of scale under the Fund’s fee structure. The Board recognized the inherent limitations of any analysis of economies of scale, stemming largely from the Board’s understanding that most of the Adviser’s costs are not specific to individual Funds, but rather are incurred across a variety of products and services.
To the extent the Board and the Adviser were able to identify actual or potential
20
economies of scale from Fund-specific or allocated expenses, in order to ensure that any such economies continue to be reasonably shared with the Fund as its assets increase, the Adviser and the Board agreed to continue the existing breakpoints.
Information about
services to other clients
The Board also received information about the nature, extent and quality of services and fee rates offered by the Adviser to its other clients, including other registered investment companies, institutional investors and separate accounts. The Board concluded that the Advisory Agreement Rate was not unreasonable, taking into account fee rates offered to others by the Adviser and giving effect to differences in services covered by such fee rates.
Other benefits to
the Adviser
The Board received information regarding potential “fall-out” or ancillary bene-fits received by the Adviser and its affiliates as a result of the Adviser’s relationship with the Fund. Such benefits could include, among others, benefits directly attributable to the relationship of the Adviser with the Fund and benefits potentially derived from an increase in the business of the Adviser as a result of its relationship with the Fund (such as the ability to market to shareholders other finan-cial products offered by the Adviser and its affiliates).
The Board also considered the effectiveness of the Adviser’s and the Fund’s policies and procedures for complying with the requirements of the federal securities laws, including those relating to best execution of portfolio transactions and brokerage allocation.
Other factors and
broader review
As discussed above, the Board reviewed detailed materials received from the Adviser as part of the annual reapproval process under Section 15(c) of the 1940 Act. The Board also regularly reviews and assesses the quality of the services that the Fund receives throughout the year. In this regard, the Board reviews reports of the Adviser at least quarterly, which include, among other things, a detailed portfolio review, detailed fund performance reports and compliance reports. In addition, the Board meets with portfolio managers and senior investment officers at various times throughout the year.
After considering the above-described factors and based on its deliberations and its evaluation of the information described above, the Board concluded that approval of the continuation of the Advisory Agreement for the Fund was in the best interest of the Fund and its shareholders. Accordingly, the Board unanimously approved the continuation of the Advisory Agreement.
21
This chart provides information about the Trustees and Officers who oversee your John Hancock fund. Officers elected by the Trustees manage the day-to-day operations of the Fund and execute policies formulated by the Trustees.
| Independent Trustees | | |
| Name, age | | Number of |
| Position(s) held with Fund | Trustee | John Hancock |
| Principal occupation(s) and other | of Fund | funds overseen |
| directorships during past 5 years | since1 | by Trustee |
|
|
| Ronald R. Dion, Born: 1946 | 1998 | 52 |
| Independent Chairman (since 2005); Chairman and Chief Executive Officer, | | |
| R.M. Bradley & Co., Inc.; Director, The New England Council and Massachusetts | |
| Roundtable; Trustee, North Shore Medical Center; Director, Boston Stock | | |
| Exchange; Director, BJ’s Wholesale Club, Inc. and a corporator of the Eastern | | |
| Bank; Trustee, Emmanuel College; Director, Boston Municipal Research Bureau; | |
| Member of the Advisory Board, Carroll Graduate School of Management at | | |
| Boston College. | | |
|
| |
| James F. Carlin, Born: 1940 | 1994 | 52 |
| Director and Treasurer, Alpha Analytical Inc. (analytical laboratory) (since 1985); | |
| Part Owner and Treasurer, Lawrence Carlin Insurance Agency, Inc. (since 1995); | |
| Part Owner and Vice President, Mone Lawrence Carlin Insurance Agency, Inc. | | |
| (until 2005); Director and Treasurer, Rizzo Associates (engineering) (until 2000); | |
| Chairman and CEO, Carlin Consolidated, Inc. (management/investments) (since | |
| 1987); Director and Partner, Proctor Carlin & Co., Inc. (until 1999); Trustee, | | |
| Massachusetts Health and Education Tax Exempt Trust (since 1993); Director of | |
| the following: Uno Restaurant Corp. (until 2001), Arbella Mutual (insurance) | | |
| (until 2000), HealthPlan Services, Inc. (until 1999), Flagship Healthcare, Inc. (until | |
| 1999), Carlin Insurance Agency, Inc. (until 1999); Chairman, Massachusetts | | |
| Board of Higher Education (until 1999). | | |
|
| |
| Richard P. Chapman, Jr.,2 Born: 1935 | 2005 | 52 |
| President and Chief Executive Officer, Brookline Bancorp Inc. (lending) | | |
| (since 1972); Chairman and Director, Lumber Insurance Co. (insurance) | | |
| (until 2000); Chairman and Director, Northeast Retirement Services, Inc. | | |
| (retirement administration) (since 1998). | | |
|
| |
| William H. Cunningham, Born: 1944 | 1987 | 149 |
| Former Chancellor, University of Texas System and former President of the | | |
| University of Texas, Austin, Texas; Chairman and CEO, IBT Technologies (until | | |
| 2001); Director of the following: Hire.com (until 2004), STC Broadcasting, Inc. | | |
| and Sunrise Television Corp. (until 2001), Symtx, Inc. (electronic manufacturing) | |
| (since 2001), Adorno/Rogers Technology, Inc. (until 2004), Pinnacle Foods | | |
| Corporation (until 2003), rateGenius (until 2003), Lincoln National Corporation | |
| (insurance) (since 2006), Jefferson-Pilot Corporation (diversified life insurance | | |
22
| Independent Trustees (continued) | | |
| Name, age | | Number of |
| Position(s) held with Fund | Trustee | John Hancock |
| Principal occupation(s) and other | of Fund | funds overseen |
| directorships during past 5 years | since1 | by Trustee |
|
| | |
| William H. Cunningham, Born: 1944 (continued) | 1987 | 149 |
| company) (until 2006), New Century Equity Holdings (formerly Billing Concepts) | |
| (until 2001), eCertain (until 2001), ClassMap.com (until 2001), Agile Ventures | | |
| (until 2001), AskRed.com (until 2001), Southwest Airlines, Introgen and | | |
| Viasystems Group, Inc. (electronic manufacturer) (until 2003); Advisory | | |
| Director, Interactive Bridge, Inc. (college fundraising) (until 2001); Advisory | | |
| Director, Q Investments (until 2003); Advisory Director, JP Morgan Chase Bank | | |
| (formerly Texas Commerce Bank – Austin), LIN Television (since 2002), WilTel | | |
| Communications (until 2003) and Hayes Lemmerz International, Inc. | | |
| (diversified automotive parts supply company) (since 2003). | | |
|
| |
| Charles L. Ladner,2 Born: 1938 | 1994 | 149 |
| Chairman and Trustee, Dunwoody Village, Inc. (retirement services) (until 2003); | |
| Senior Vice President and Chief Financial Officer, UGI Corporation (public utility | |
| holding company) (retired 1998); Vice President and Director for AmeriGas, Inc. | |
| (retired 1998); Director of AmeriGas Partners, L.P. (until 1997) (gas distribution); | |
| Director, EnergyNorth, Inc. (until 1995); Director, Parks and History Association | | |
| (since 2001). | | |
|
| |
| John A. Moore,2 Born: 1939 | 2005 | 52 |
| President and Chief Executive Officer, Institute for Evaluating Health Risks, | | |
| (nonprofit institution) (until 2001); Chief Scientist, Sciences International (health | |
| research) (until 2003); Principal, Hollyhouse (consulting) (since 2000); Director, | | |
| CIIT (nonprofit research) (since 2002). | | |
|
| |
| Patti McGill Peterson,2 Born: 1943 | 2005 | 52 |
| Executive Director, Council for International Exchange of Scholars and Vice | | |
| President, Institute of International Education (since 1998); Senior Fellow, Cornell | |
| Institute of Public Affairs, Cornell University (until 1998); Former President of | | |
| Wells College and St. Lawrence University; Director, Niagara Mohawk Power | | |
| Corporation (until 2003); Director, Ford Foundation, International Fellowships | | |
| Program (since 2002); Director, Lois Roth Endowment (since 2002); Director, | | |
| Council for International Educational Exchange (since 2003). | | |
|
| |
| Steven R. Pruchansky, Born: 1944 | 1994 | 52 |
| Chairman and Chief Executive Officer, Greenscapes of Southwest Florida, Inc. | | |
| (since 2000); Director and President, Greenscapes of Southwest Florida, Inc. | | |
| (until 2000); Managing Director, JonJames, LLC (real estate) (since 2001); | | |
| Director, First Signature Bank & Trust Company (until 1991); Director, Mast | | |
| Realty Trust (until 1994); President, Maxwell Building Corp. (until 1991). | | |
23
| Non-Independent Trustee3 | | |
| Name, age | | Number of |
| Position(s) held with Fund | Trustee | John Hancock |
| Principal occupation(s) and other | of Fund | funds overseen |
| directorships during past 5 years | since1 | by Trustee |
|
| | |
| James R. Boyle, Born: 1959 | 2005 | 250 |
| President, John Hancock Annuities; Executive Vice President, John Hancock | | |
| Life Insurance Company (since June, 2004); Chairman and Director, John | | |
| Hancock Advisers, LLC (the “Adviser”); John Hancock Funds, LLC (“John | | |
| Hancock Funds”) and The Berkeley Financial Group, LLC (“The Berkeley | | |
| Group”) (holding company) (since 2005); President, U.S. Annuities; Senior | | |
| Vice President, The Manufacturers Life Insurance Company (U.S.A.) (prior | | |
| to 2004). | | |
|
| Principal officers who are not Trustees | | |
| Name, age | | |
| Position(s) held with Fund | | Officer |
| Principal occupation(s) and | | of Fund |
| directorships during past 5 years | | since |
|
| Keith F. Hartstein, Born: 1956 | | 2005 |
| President and Chief Executive Officer | | |
| Senior Vice President, Manulife Financial Corporation (since 2004); Director, | | |
| President and Chief Executive Officer, the Adviser and The Berkeley Group; | | |
| Director, President and Chief Executive Officer, John Hancock Funds; Director, | | |
| President and Chief Executive Officer, Sovereign Asset Management LLC | | |
| (“Sovereign”); Director, John Hancock Signature Services, Inc.; President, John | | |
| Hancock Trust; Director, Chairman and President, NM Capital Management, | | |
| Inc. (NM Capital) (since 2005); Chairman, Investment Company Institute Sales | | |
| Force Marketing Committee (since 2003); Executive Vice President, John | | |
| Hancock Funds (until 2005). | | |
|
| |
| William H. King, Born: 1952 | | 1994 |
| Vice President and Treasurer | | |
| Vice President and Assistant Treasurer, the Adviser; Vice President and Treasurer | |
| of each of the John Hancock funds advised by the Adviser; Assistant Treasurer | | |
| of each of the John Hancock funds advised by the Adviser (until 2001). | | |
|
| |
| Francis V. Knox, Jr., Born: 1947 | | 2005 |
| Vice President and Chief Compliance Officer | | |
| Vice President and Chief Compliance Officer for John Hancock Investment | | |
| Company, John Hancock Life Insurance Company (U.S.A.), John Hancock Life | | |
| Insurance Company and John Hancock Funds (since 2005); Vice President and | | |
| Assistant Treasurer, Fidelity Group of Funds (until 2004); Vice President and | | |
| Ethics & Compliance Officer, Fidelity Investments (until 2001). | | |
|
| |
| John G. Vrysen, Born: 1955 | | 2005 |
| Executive Vice President and Chief Financial Officer | | |
| Director, Executive Vice President and Chief Financial Officer, the Adviser, | | |
| Sovereign, The Berkeley Group and John Hancock Funds (since 2005); Vice | | |
| President and General Manager, Fixed Annuities, U.S. Wealth Management | | |
| (until 2005); Vice President, Operations, Manulife Wood Logan (July 2000 thru | | |
| September 2004). | | |
24
Notes to Trustees and Officers pages
The business address for all Trustees and Officers is 601 Congress Street, Boston, Massachusetts 02210-2805.
The Statement of Additional Information of the Fund includes additional information about members of the Board of Trustees of the Fund and is available, without charge, upon request, by calling 1-800-225-5291.
1 Each Trustee serves until resignation, retirement age or until his or her successor is elected.
2 Member of Audit Committee.
3 Non-independent Trustee holds positions with the Fund’s investment adviser, underwriter and certain other affiliates.
25
|
| Equity | Balanced Fund |
| | Classic Value Fund |
| | Core Equity Fund |
| | Focused Equity Fund |
| | Growth Trends Fund |
| | Large Cap Equity Fund |
| | Large Cap Select Fund |
| | Mid Cap Equity Fund |
| | Mid Cap Growth Fund |
| | Multi Cap Growth Fund |
| | Small Cap Fund |
| | Small Cap Equity Fund |
| | Small Cap Intrinsic Value Fund |
| | Sovereign Investors Fund |
| | U.S. Global Leaders Growth Fund |
|
| |
| Asset Allocation and | Allocation Growth + Value Portfolio |
| Lifestyle Portfolios | Allocation Core Portfolio |
| | Lifestyle Aggressive Portfolio |
| | Lifestyle Growth Portfolio |
| | Lifestyle Balanced Portfolio |
| | Lifestyle Moderate Portfolio |
| | Lifestyle Conservative Portfolio |
|
| |
| Sector | Financial Industries Fund |
| | Health Sciences Fund |
| | Real Estate Fund |
| | Regional Bank Fund |
| | Technology Fund |
| | Technology Leaders Fund |
|
| |
| International | Greater China Opportunities Fund |
| | International Fund |
| | International Classic Value Fund |
|
| |
| Income | Bond Fund |
| | Government Income Fund |
| | High Yield Fund |
| | Investment Grade Bond Fund |
| | Strategic Income Fund |
|
| |
| Tax-Free Income | California Tax-Free Income Fund |
| | High Yield Municipal Bond Fund |
| | Massachusetts Tax-Free Income Fund |
| | New York Tax-Free Income Fund |
| | Tax-Free Bond Fund |
|
| |
| Money Market | Money Market Fund |
| | U.S. Government Cash Reserve |
|
For more complete information on any John Hancock Fund and a prospectus, which includes charges and expenses, call your financial professional, or John Hancock Funds at 1-800-225-5291. Please read the prospectus carefully before investing or sending money.
26
ELECTRONIC
DELIVERY
Now available from
John Hancock Funds
|
Instead of sending annual and semiannual reports
and prospectuses through the U.S. mail, we’ll notify
you by e-mail when these documents are available
for online viewing.
How does electronic delivery benefit you?
| * | No more waiting for the mail to arrive; you’ll receive an |
| | e-mail notification as soon as the document is ready for |
| | online viewing. |
| |
| * | Reduces the amount of paper mail you receive from |
| | John Hancock Funds. |
| |
| * | Reduces costs associated with printing and mailing. |
Sign up for electronic delivery today at
www.jhfunds.com/edelivery
|
27
OUR WEB SITE
A wealth of information —
www.jhfunds.com
|
| View the latest information for your account. |
|
| Transfer money from one account to another. |
|
| Get current quotes for major market indexes. |
|
| Use our online calculators to help you with your |
| financial goals. |
|
| Get up-to-date commentary from John Hancock |
| Funds investment experts. |
|
| Access forms, applications and tax information. |
|
28
For more information
The Fund’s proxy voting policies, procedures and records are available without charge, upon request:
| By phone | On the Fund’s Web site | On the SEC’s Web site |
| 1-800-225-5291 | www.jhfunds.com/proxy | www.sec.gov |
|
| Investment adviser | Custodian | Independent registered |
| John Hancock Advisers, LLC | The Bank of New York | public accounting firm |
| 601 Congress Street | One Wall Street | PricewaterhouseCoopers LLP |
| Boston, MA 02210-2805 | New York, NY 10286 | 125 High Street |
| | Boston, MA 02110 |
| Subadviser | Transfer agent | |
| Sovereign Asset | John Hancock Signature | |
| Management LLC | Services, Inc. | |
| 101 Huntington Avenue | 1 John Hancock Way, | |
| Boston, MA 02199 | Suite 1000 | |
| | Boston, MA 02217-1000 | |
| Principal distributor | | |
| John Hancock Funds, LLC | Legal counsel | |
| 601 Congress Street | Wilmer Cutler Pickering | |
| Boston, MA 02210-2805 | Hale and Dorr LLP | |
| | 60 State Street | |
| | Boston, MA 02109-1803 | |
The Fund’s investment objective, risks, charges and expenses are included in the prospectus and should be considered carefully before investing. For a prospectus, call your financial professional, call John Hancock Funds at 1-800-225-5291, or visit the Fund’s Web site at www.jhfunds.com. Please read the prospectus carefully before investing or sending money.
| How to contact us | |
|
| |
| Internet | www.jhfunds.com | |
|
| |
| Mail | Regular mail: | Express mail: |
| | John Hancock | John Hancock |
| | Signature Services, Inc. | Signature Services, Inc. |
| | 1 John Hancock Way, Suite 1000 | Mutual Fund Image Operations |
| | Boston, MA 02217-1000 | 380 Stuart Street |
| | | Boston, MA 02116 |
|
| |
| Phone | Customer service representatives | 1-800-225-5291 |
| | 24-hour automated information | 1-800-338-8080 |
| | TDD line | 1-800-554-6713 |
A listing of month-end portfolio holdings is available on our Web site, www.jhfunds.com. A more detailed portfolio holdings summary is available on a quarterly basis 60 days after the fiscal quarter on our Web site or upon request by calling 1-800-225-5291, or on the Securities and Exchange Commission’s Web site, www.sec.gov.
29

1-800-225-5291
1-800-554-6713 (TDD)
1-800-338-8080 EASI-Line
www.jhfunds. com
|
Now available: electronic delivery
www.jhfunds. com/edelivery
|
This report is for the information of
the shareholders of John Hancock
U.S. Government Cash Reserve.
|

| Table of contents |
|
| Your fund at a glance |
| page 1 |
|
| Managers’ report |
| page 2 |
|
| Your expenses |
| page 5 |
|
| Fund’s investments |
| page 7 |
|
| Financial statements |
| page 10 |
|
| Trustees & officers |
| page 26 |
|
| For more information |
| page 33 |
|
To Our Shareholders,
After producing modest returns in 2005, the stock market started off strong in the first quarter of 2006. The major indexes all advanced and produced three-month returns that equaled the market’s returns for all of 2005. For example, the Standard & Poor’s 500 Index returned 4.21% through March 2006, versus 4.91% last year in total. Investors were encouraged by solid corporate earnings, a slower-growing economy and stable inflation, which suggested the Federal Reserve could be coming close to the end of their 18-month campaign of rising interest rates.
Although a solid yearly beginning has typically augured well for the rest of the year, it is anyone’s guess where the market will end 2006, especially given the wild cards of interest rate moves and record-high energy prices and their impact on corporate profits and the economy.
One thing we do know, however, is that the stock market’s pattern is one of extremes. Consider the last 10 years. From 1995 through 1999, we saw double-digit returns in excess of 20% per year, only to have 2000 through 2002 produce ever-increasing negative results, followed by another 20%-plus up year in 2004 and a less than 5% advance in 2005. Since 1926, the market, as measured by the Standard & Poor’s 500 Index, has produced average annual results of 10.4% . However, that “normal” return is rarely produced in any given year. In fact, calendar-year returns of 8% to 12% have occurred only five times in the 80 years since 1926.
Although the past in no way predicts the future, we have learned at least one lesson from history: Expect highs and lows in the short term, but always invest for the long term. Equally important: Work with your financial professional to maintain a diversified portfolio, spread out among not only different asset classes — stocks, bonds and cash — but also among various investment styles. It’s the best way we know of to benefit from, and weather, the market’s extremes.
Sincerely,

Keith F. Hartstein,
President and Chief Executive Officer
|
This commentary reflects the CEO’s views as of March 31, 2006. They are subject to change at any time.
YOUR FUND AT A GLANCE
The Funds seeks the maximum current income that is consistent with maintaining liquidity and preserving capital. The Fund intends to maintain a stable $1 share price.
Over the last twelve months
| * | The economy showed continued strength for the most part, causing |
| | the Federal Reserve to maintain its 18-month rate-hike program. |
| |
| * | Money market yields rose steadily, as the Federal Reserve kept raising |
| | short-term interest rates. |
| |
| * | The Fund was positioned for rate hikes for much of the year, but |
| | ended the year positioned for the end of the tightening cycle. |
Total returns for the Fund are at net asset value with all distributions reinvested. Past performance is no guarantee of future results. These returns do not reflect the deduction of the maximum sales charge, which would reduce the performance shown above.
1
BY DAVID A. BEES AND DAVID P. LYNCH FOR THE SOVEREIGN ASSET MANAGEMENT LLC PORTFOLIO MANAGEMENT TEAM
JOHN HANCOCK
Money Market Fund
|
Money market yields rose steadily during the 12 months ended March 31, 2006, as the Federal Reserve Board continued its policy of short-term interest rate hikes. Over the period, the federal funds rate that banks charge each other for overnight loans went from 3.00% to 4.75% . The latest rate increase occurred March 28, 2006 and marked the 15th consecutive 25 basis point (0.25%) hike since June 2004.
At the beginning of the period, increasing energy prices had begun to weigh on the market, and many felt the Fed might pause to gauge the full impact on the economy. Instead, the Fed affirmed the strength of the economy and warned that the high energy prices had made short-term inflation a concern. In September, the Gulf Coast suffered with Katrina and Rita, two of the most devastating hurricanes to hit this country. However, the massive destruction to infrastructure and personal property, and already high energy prices, still did not deter the Federal Reserve from raising rates.
Despite these short-term speed bumps, the economy continued to show signs of growth. The unemployment rate decreased from 5.1% in April 2005 to 4.7% in March 2006, and the economy continued to add jobs at a solid pace —174,000 jobs per month on average over the period. The housing market, which had been red-hot for the past few years, started to show signs of a pullback. While the housing market continues to remain strong, the monthly existing home sales number has moderated slightly, declining from a peak of 7.27 million homes in June to 6.91 million homes in February.
“Money market yields rose
steadily during the 12 months
ended March 31, 2006...”
|
It was in this environment that long-standing Fed Chairman Alan Greenspan stepped down in January and was replaced by former Chairman of the President’s Council of Economic Advisers, Ben Bernanke. Chairman Bernanke has been one of the more outspoken economic advisers in the past and has declared that the Federal Reserve will be more transparent regarding future Federal Open Market Committee (FOMC) rate decisions during his tenure. Just
2

how transparent remains to be seen, but in the latest policy statement the FOMC declared that “further policy firming may be needed.”
Fund yield and performance
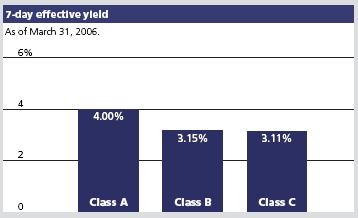
On March 31, 2006, John Hancock Money Market Fund’s Class A, Class B and Class C shares had 7-day effective yields of 4.00%, 3.15% and 3.11%, respectively. By comparison, the average taxable money market fund had a 7-day effective yield of 3.76%, according to Lipper, Inc.
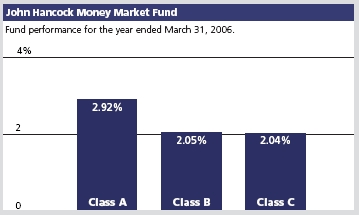
For the year ended March 31, 2006, the Fund’s Class A, Class B and Class C shares posted total returns of 2.92%, 2.05% and 2.04%, respectively, at net asset value, compared with the 2.86% return of the average taxable money market fund, according to Lipper, Inc.1 Keep in mind that your net asset value return will be different from the Fund’s performance if you were not invested in the Fund for the entire period and did not reinvest all distributions.
Fund moves
The portfolio structure has changed significantly in the past 12 months. At the start of the period, the Fund was set up for a continued rising-rate environment. We kept our weighted average days to maturity shorter than our peers, giving us a greater opportunity to quickly reinvest assets at higher rates. The largest exposure was to floating-rate securities, which allowed the portfolio to capture rising rates in a timely manner due to the one-month and three-month rate-reset feature on these securities.
As we approached the end of 2005, further rate increases became less certain, and we scaled back our term to maturity in floating-rate securities. We found value in floating-rate securities that had reached their final rate reset. We also increased our weighted average maturity until we were in line with our peers.
“...we believe the Federal Reserve
is nearing the end of this
rate-tightening cycle.”
|
By the end of the period, with the overnight lending rate at 4.75% and the chances of further rate hikes decreasing, we began to extend further out the money market curve, ending the period with a longer weighted average maturity than our peers. Longer-term fixed-rate securities began to look attractive, so we used this opportunity to reduce our floating-rate exposure and add to our fixed-rate weighting. Throughout the term we continued to
3
| Sector | |
| distribution2 | |
|
| Financials | 74% |
|
| Telecommunication |
| service | 10% |
|
| Government | |
| agencies | 4% |
|
| Consumer | |
| discretionary | 3% |
|
| Utilities | 1% |
|
| Health care | 1% |
use short tier-two securities and asset-backed commercial paper to manage cash levels and contribute to performance.
Outlook
Taking clues from Chairman Bernanke’s first FOMC policy statement, it seems clear to us that the Federal Reserve will be closely monitoring all future economic releases to help attain the correct balance between growth and inflation. GDP growth, housing prices and energy commodity prices will all be in the Federal Reserve’s crosshairs. After having raised short-term interest rates by 3.75% in a long and orderly tightening, we believe the Federal Reserve is nearing the end of this rate-tightening cycle.
While we still remain cautious about future rate hikes, we are nonetheless beginning to extend further out the money market curve, as we mentioned, in anticipation of the end of this tightening cycle. With stable short-term interest rates, we believe longer-dated securities will produce higher yields. In addition to our focus on capturing additional yield, we will strive, as always, to maintain liquidity and preserve stability of principal.

This commentary reflects the views of the portfolio management team through the end of the Fund’s period discussed in this report. The team’s statements reflect its own opinions. As such, they are in no way guarantees of future events, and are not intended to be used as investment advice or a recommendation regarding any specific security. They are also subject to change at any time as market and other conditions warrant.
The Fund is neither insured nor guaranteed by the U.S. government. Although the Fund seeks to maintain a net asset value of $1.00 per share, it is possible to lose money by investing in the Fund.
1 Figures from Lipper, Inc. include reinvested dividends and do not take into account sales charges. Actual load-adjusted performance is lower.
2 As a percentage of net assets on March 31, 2006.
4
YOUR EXPENSES
These examples are intended to help you understand your ongoing
operating expenses.
Understanding fund expenses
As a shareholder of the Fund, you incur two types of costs:
| * | Transaction costs which include sales charges (loads) on |
| purchases or redemptions (varies by share class), minimum |
| account fee charge, etc. |
* | Ongoing operating expenses including management |
| fees, distribution and service fees (if applicable) and other |
| fund expenses. |
We are going to present only your ongoing operating expenses here.
Actual expenses/actual returns
This example is intended to provide information about your fund’s actual ongoing operating expenses, and is based on your fund’s actual return. It assumes an account value of $1,000.00 on September 30, 2005, with the same investment held until March 31, 2006.
| Account value | | Expenses paid |
| $1,000.00 | Ending value | during period |
| on 9-30-05 | on 3-31-06 | ended 3-31-061 |
|
| Class A | $1,017.10 | $4.54 |
| Class B | 1,012.80 | 8.86 |
| Class C | 1,012.80 | 8.96 |
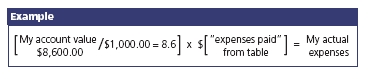
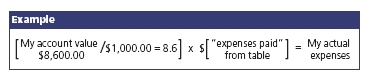
Together with the value of your account, you may use this information to estimate the operating expenses that you paid over the period. Simply divide your account value at March 31, 2006 by $1,000.00, then multiply it by the “expenses paid” for your share class from the table above. For example, for an account value of $8,600.00, the operating expenses should be calculated as follows:
5
Hypothetical example for comparison purposes
This table allows you to compare your fund’s ongoing operating expenses with those of any other fund. It provides an example of the Fund’s hypothetical account values and hypothetical expenses based on each class’s actual expense ratio and an assumed 5% annual return before expenses (which is not your fund’s actual return). It assumes an account value of $1,000.00 on September 30, 2005, with the same investment held until March 31, 2006. Look in any other fund shareholder report to find its hypothetical example and you will be able to compare these expenses.
| Account value | | Expenses paid |
| $1,000.00 | Ending value | during period |
| on 9-30-05 | on 3-31-06 | ended 3-31-061 |
|
| Class A | $1,020.40 | $4.55 |
| Class B | 1,016.10 | 8.87 |
| Class C | 1,016.00 | 8.97 |
Remember, these examples do not include any transaction costs, such as sales charges; therefore, these examples will not help you to determine the relative total costs of owning different funds. If transaction costs were included, your expenses would have been higher. See the prospectus for details regarding transaction costs.
1 Expenses are equal to the Fund’s annualized expense ratio of 0.90%, 1.76% and 1.78% for Class A, Class B and Class C shares, respectively, multiplied by the average account value over the period, multiplied by number of days in most recent fiscal half-year/365 or 366 (to reflect the one-half year period).
6
F I N A N C I A L S TAT E M E N T S
FUND’S
INVESTMENTS
Securities owned
by the Fund on
March 31, 2006
|
This schedule is divided into four categories: commercial paper, corporate interest-bearing obligations, U.S. government obligations and joint repurchase agreement. Commercial paper, corporate interest-bearing obligations and U.S. government obligations are further broken down by industry group.
| | | Interest | Maturity | Quality | Par value | |
| Issuer | | rate | date | rating (A) | (000) | Value |
|
| Commercial paper 31.10% | | | | | | $69,898,687 |
| (Cost $69,898,687) | | | | | | |
Asset-Backed — Auto Loan 5.00% | | | | 11,233,775 |
|
| Galleon Capital LLC (K) | | 4.720% | 04-12-06 | Tier 1 | $11,250 | 11,233,775 |
Asset-Backed — Others 4.81% | | | | 10,813,743 |
|
| Yorktown Capital LLC (K) | | 4.780 | 04-13-06 | Tier 1 | 10,831 | 10,813,743 |
Asset-Backed — Receivables 2.22% | | | | 4,996,167 |
|
| Jupiter Securitization Corp. (K) | | 4.600 | 04-07-06 | Tier 1 | 5,000 | 4,996,167 |
Asset-Backed — Trade & Term Receivables 5.00% | | | | 11,221,738 |
|
| Barton Capital Corp. (K) | | 4.760 | 04-20-06 | Tier 1 | 11,250 | 11,221,738 |
Automobiles & Trucks 1.95% | | | | | | 4,387,420 |
|
| DaimlerChrysler North America Holding Corp. | 4.800 | 04-17-06 | Tier 2 | 2,200 | 2,195,307 |
|
| Volkswagen AG | | 4.780 | 04-28-06 | Tier 2 | 2,200 | 2,192,113 |
Electric Utilities 1.02% | | | | | | 2,298,156 |
|
| Dominion Resources, Inc. | | 4.810 | 04-07-06 | Tier 2 | 2,300 | 2,298,156 |
Medical — Health Maintenance Organization 1.02% | | | 2,292,317 |
|
| WellPoint, Inc. | | 4.810 | 04-26-06 | Tier 2 | 2,300 | 2,292,317 |
Money Center Banks 4.44% | | | | | | 9,979,667 |
|
| UBS Financial Service, Inc. | | 4.575 | 04-17-06 | Tier 1 | 10,000 | 9,979,667 |
Multimedia 0.98% | | | | | | 2,197,404 |
|
| Walt Disney Co. | | 4.720 | 04-10-06 | Tier 2 | 2,200 | 2,197,404 |
Telephone — Integrated 4.66% | | | | 10,478,300 |
|
| Verizon Global Funding Corp. | | 4.650 | 04-17-06 | Tier 1 | 10,500 | 10,478,300 |
See notes to
financial statements.
|
7
F I N A N C I A L S TAT E M E N T S
| Interest | Maturity | Credit | Par value | |
| Issuer | rate | date | rating (A) | (000) | Value |
|
| Corporate interest-bearing obligations 57.85% | | | | $129,987,832 |
| (Cost $129,987,832) | | | | | |
Banks — U.S. 9.68% | | | | | 21,744,871 |
|
| American Express Bank FSB (P) | 4.824% | 11-22-06 | Tier 1 | $4,000 | 4,001,715 |
|
| FleetBoston Financial Corp. | 8.625 | 01-15-07 | Tier 1 | 5,580 | 5,738,991 |
|
| KeyCorp (P) | 4.994 | 05-23-06 | Tier 1 | 12,000 | 12,004,165 |
Diversified Financial Services 5.03% | | | | | 11,303,496 |
|
| General Electric Capital Corp. (P) | 4.860 | 12-08-06 | Tier 1 | 11,300 | 11,303,496 |
| | | | | |
| | | | | | |
| Finance — Auto Loans 4.45% | | | | | 10,002,334 |
|
| American Honda Finance Corp. (P)(S) | 4.960 | 09-21-06 | Tier 1 | 5,000 | 5,001,082 |
|
| American Honda Finance Corp. (P)(S) | 4.929 | 05-15-06 | Tier 1 | 5,000 | 5,001,252 |
Finance — Commercial 5.63% | | | | | 12,652,662 |
|
| CIT Group, Inc. (P) | 5.150 | 06-19-06 | Tier 1 | 5,000 | 5,002,259 |
|
| CIT Group, Inc. (P) | 4.702 | 04-19-06 | Tier 1 | 7,650 | 7,650,403 |
Finance — Consumer Loans 7.67% | | | | | 17,237,560 |
|
| American General Finance Corp. | 3.000 | 11-15-06 | Tier 1 | 9,305 | 9,197,241 |
|
| HSBC Finance Corp. | 5.750 | 01-30-07 | Tier 1 | 7,993 | 8,040,319 |
Finance — Credit Card 2.00% | | | | | 4,503,865 |
|
| American Express Credit Corp. (P) | 4.916 | 09-19-06 | Tier 1 | 4,500 | 4,503,865 |
Finance — Mortgages 4.74% | | | | | 10,643,364 |
|
| Countrywide Financial Corp. (P) | 4.747 | 07-31-06 | Tier 1 | 3,800 | 3,800,262 |
|
| Countrywide Home Loans, Inc. (P) | 4.970 | 08-25-06 | Tier 1 | 6,840 | 6,843,102 |
Investment Banking & Brokerage 13.32% | | | | 29,923,173 |
|
| Bear Stearns Cos., Inc. | 6.500 | 05-01-06 | Tier 1 | 4,000 | 4,006,359 |
|
| Credit Suisse First Boston (USA), Inc. | 5.875 | 08-01-06 | Tier 1 | 5,000 | 5,015,636 |
|
| Credit Suisse First Boston (USA), Inc. | 4.710 | 05-08-06 | Tier 1 | 6,000 | 6,000,057 |
|
| Goldman Sachs Group, Inc. (The) (P) | 4.781 | 04-20-06 | Tier 1 | 5,900 | 5,900,353 |
|
| Merrill Lynch & Co., Inc. (P) | 4.711 | 05-05-06 | Tier 1 | 9,000 | 9,000,768 |
Telephone — Integrated 5.33% | | | | | 11,976,507 |
|
| SBC Communications, Inc. | 5.750 | 05-02-06 | Tier 1 | 11,964 | 11,976,507 |
|
| |
U.S. government obligations 4.01% | | | | | 9,008,682 |
| (Cost $9,008,682) | | | | | |
Government — U.S. Agency 4.01% | | | | | 9,008,682 |
|
| Federal Home Loan Bank | 4.630 | 04-03-06 | Tier 1 | 9,011 | 9,008,682 |
See notes to
financial statements.
|
8
F I N A N C I A L S TAT E M E N T S
| | | Interest | Par value | |
| Issuer, description, maturity date | | rate | (000) | Value |
|
| Joint repurchase agreement 7.59% | | | $17,057,000 |
| (Cost $17,057,000) | | | | |
| Investment in a joint repurchase agreement transaction | | | |
| with Morgan Stanley — Dated 3-31-06 due 4-3-06 | | | |
| (secured by U.S. Treasury Inflation Indexed Note 3.875% | | | |
| due 1-15-09) | | 4.470% | $17,057 | 17,057,000 |
|
| Total investments 100.55% | | | | $225,952,201 |
|
| Other assets and liabilities, net (0.55%) | | | ($1,245,830) |
|
| Total net assets 100.00% | | | | $224,706,371 |
(A) Quality ratings are unaudited and indicate the categories of eligible securities, as defined by Rule 2a-7 of the Investment Company Act of 1940, owned by the Fund.
(K) Direct placement securities are restricted to resale. They have been fair valued in accordance with procedures approved by the Trustees after consideration of restrictions as to resale, financial condition and prospects of the issuer, general market conditions and pertinent information in accordance with the Fund’s bylaws and the Investment Company Act of 1940, as amended. The Fund has limited rights to registration under the Securities Act of 1933 with respect to these restricted securities. Additional information on these securities is as follows:
| | | | Value as a | |
| | | | percentage | |
| | Acquisition | Acquisition | of Fund’s | Value as of |
| Issuer, description | date | cost | net assets | March 31, 2006 |
|
| Barton Capital Corp. | | | | |
| – Commercial paper | 03-30-06 | $11,218,763 | 5.00% | $11,221,738 |
| |
| Galleon Capital LLC | | | | |
| – Commercial paper | 03-21-06 | 11,217,550 | 5.00 | 11,233,775 |
| |
| Jupiter Securitization Corp. | | | | |
| – Commercial paper | 03-08-06 | 4,980,833 | 2.22 | 4,996,167 |
| |
| Yorktown Capital LLC | | | | |
| – Commercial paper | 03-31-06 | 10,812,304 | 4.81 | 10,813,743 |
(P) Represents rate in effect on March 31, 2006.
(S) These securities are exempt from registration under Rule 144A of the Securities Act of 1933. Such securities may be resold, normally to qualified institutional buyers, in transactions exempt from registration. Rule 144A securities amounted to $10,002,344 or 4.45% of the Fund’s net assets as of March 31, 2006.
The percentage shown for each investment category is the total value of that category as a percentage of the net assets of the Fund.
See notes to financial statements
9
F I N A N C I A L S TAT E M E N T S
ASSETS AND
LIABILITIES
March 31, 2006
This Statement
of Assets and
Liabilities is the
Fund’s balance
sheet. It shows
the value of
what the Fund
owns, is due
and owes. You’ll
also find the net
asset value
per share.
|
| Assets | |
| Investments at value (cost $225,952,201) | $225,952,201 |
| Cash | 871 |
| Receivable for shares sold | 554,799 |
| Interest receivable | 1,128,430 |
| Other assets | 74,968 |
| Total assets | 227,711,269 |
|
| Liabilities | |
Payable for investments purchased | 2,101,328 |
| Payable for shares repurchased | 573,843 |
| Dividends payable | 26,785 |
| Payable to affiliates | |
| Management fees | 82,001 |
| Distribution and service fees | 7,402 |
| Other | 68,158 |
| Other payables and accrued expenses | 145,381 |
| Total liabilities | 3,004,898 |
|
| Net assets | |
| Capital paid-in | 224,696,076 |
| Accumulated net realized loss on investments | (1,193) |
| Accumulated net investment income | 11,488 |
| Net assets | $224,706,371 |
|
Net asset value per share | |
| Based on net asset values and shares outstanding — | |
| the Fund has an unlimited number of shares | |
| authorized with no par value | |
| Class A ($184,829,451 ÷ 184,911,613 shares) | $1.00 |
| Class B ($35,766,313 ÷ 35,786,603 shares) | $1.00 |
| Class C ($4,110,607 ÷ 4,110,867 shares) | $1.00 |
See notes to
financial statements.
|
10
F I N A N C I A L S TAT E M E N T S
OPERATIONS
For the year ended
March 31, 2006
This Statement
of Operations
summarizes the
Fund’s investment
income earned,
expenses incurred in
operating the Fund
and realized gain
(losses), if any.
|
| Investment income | |
| Interest | $9,403,615 |
| Total investment income | 9,403,615 |
|
Expenses | |
| Investment management fees | 1,255,576 |
| Class A distribution and service fees | 488,373 |
| Class B distribution and service fees | 478,903 |
| Class C distribution and service fees | 78,758 |
| Transfer agent fees | 593,370 |
| Registration and filing fees | 77,382 |
| Custodian fees | 64,262 |
| Accounting and legal services fees | 62,779 |
| Printing | 37,442 |
| Professional fees | 33,580 |
| Trustees’ fees | 15,673 |
| Miscellaneous | 14,668 |
| Compliance fees | 8,317 |
| Federal excise tax | 2,093 |
| Interest | 951 |
Total expenses | 3,212,127 |
| Less expense reductions | (458,944) |
Net expenses | 2,753,183 |
Net investment income | 6,650,432 |
| Net realized loss on investments | (2) |
Increase in net assets from operations | $6,650,430 |
See notes to
financial statements.
|
11
F I N A N C I A L S TAT E M E N T S
CHANGES IN
NET ASSETS
These Statements
of Changes in Net
Assets show how
the value of the
Fund’s net assets
has changed
during the last
two periods. The
difference reflects
earnings less
expenses, distribu-
tions, if any, paid to
shareholders and
the net of Fund
share transactions.
|
| | Year | Year |
| | ended | ended |
| | 3-31-051 | 3-31-06 |
|
| |
| Increase (decrease) in net assets | | |
From operations | | |
| Net investment income | $2,237,275 | $6,650,432 |
| Net realized loss | — | (2) |
Increase in net assets resulting | | |
| from operations | 2,237,275 | 6,650,430 |
Distributions to shareholders | | |
| From net investment income | | |
| Class A | (1,807,542) | (5,575,570) |
| Class B | (375,710) | (928,523) |
| Class C | (54,023) | (146,339) |
| | (2,237,275) | (6,650,432) |
From Fund share transactions | (12,675,936) | (74,863,392) |
|
| |
Net assets | | |
| Beginning of period | 312,245,701 | 299,569,765 |
End of period 2 | $299,569,765 | $224,706,371 |
1 Audited by previous auditor.
2 Includes accumulated net investment income of $10,908 and $11,488, respectively.
See notes to financial statements.
12
F I N A N C I A L H I G H L I G H T S
CLASS A SHARES
The Financial Highlights show how the Fund’s net asset value for a
share has changed since the end of the previous period.
| Period ended | 3-31-021 | 3-31-031 | 3-31-041 | 3-31-051 | 3-31-06 |
|
| Per share operating performance | | | | | |
Net asset value, | | | | | |
| beginning of period | $1.00 | $1.00 | $1.00 | $1.00 | $1.00 |
| Net investment income2 | 0.02 | 0.01 | —3 | 0.01 | 0.03 |
Less distributions | | | | | |
| From net investment income | (0.02) | (0.01) | —3 | (0.01) | (0.03) |
Net asset value, end of period | $1.00 | $1.00 | $1.00 | $1.00 | $1.00 |
| Total return4,5 (%) | 2.41 | 0.75 | 0.21 | 0.86 | 2.92 |
|
Ratios and supplemental data | | | | | |
| Net assets, end of period | | | | | |
| (in millions) | $264 | $271 | $211 | $224 | $185 |
| Ratio of expenses | | | | | |
| to average net assets (%) | 0.90 | 0.94 | 0.94 | 0.88 | 0.91 |
| Ratio of gross expenses | | | | | |
| to average net assets6 (%) | 1.10 | 1.14 | 1.14 | 1.09 | 1.11 |
| Ratio of net investment income | | | | | |
| to average net assets (%) | 2.40 | 0.75 | 0.21 | 0.83 | 2.85 |
See notes to
financial statements.
|
13
F I N A N C I A L H I G H L I G H T S
CLASS B SHARES
| Period ended | 3-31-021 | 3-31-031 | 3-31-041 | 3-31-051 | 3-31-06 |
|
| Per share operating performance | | | | | |
Net asset value, | | | | | |
| beginning of period | $1.00 | $1.00 | $1.00 | $1.00 | $1.00 |
| Net investment income2 | 0.02 | —3 | —3 | —3 | 0.02 |
Less distributions | | | | | |
| From net investment income | (0.02) | —3 | —3 | —3 | (0.02) |
Net asset value, end of period | $1.00 | $1.00 | $1.00 | $1.00 | $1.00 |
| Total return4,5 (%) | 1.55 | 0.10 | 0.12 | 0.50 | 2.05 |
|
Ratios and supplemental data | | | | | |
| Net assets, end of period | | | | | |
| (in millions) | $142 | $166 | $89 | $63 | $36 |
| Ratio of expenses | | | | | |
| to average net assets (%) | 1.75 | 1.59 | 1.04 | 1.20 | 1.76 |
| Ratio of gross expenses | | | | | |
| to average net assets6 (%) | 1.85 | 1.89 | 1.89 | 1.85 | 1.86 |
| Ratio of net investment income | | | | | |
| to average net assets (%) | 1.52 | 0.10 | 0.12 | 0.46 | 1.94 |
See notes to
financial statements.
|
14
F I N A N C I A L H I G H L I G H T S
|
| Period ended | 3-31-021 | 3-31-031 | 3-31-041 | 3-31-051 | 3-31-06 |
|
| Per share operating performance | | | | | |
| Net asset value, | | | | | |
| beginning of period | $1.00 | $1.00 | $1.00 | $1.00 | $1.00 |
| Net investment income2 | 0.02 | —3 | —3 | —3 | 0.02 |
Less distributions | | | | | |
| From net investment income | (0.02) | —3 | —3 | —3 | (0.02) |
Net asset value, end of period | $1.00 | $1.00 | $1.00 | $1.00 | $1.00 |
| Total return4,5 (%) | 1.55 | 0.11 | 0.12 | 0.50 | 2.04 |
|
Ratios and supplemental data | | | | | |
| Net assets, end of period | | | | | |
| (in millions) | $16 | $18 | $12 | $13 | $4 |
| Ratio of expenses | | | | | |
| to average net assets (%) | 1.75 | 1.61 | 1.04 | 1.19 | 1.75 |
| Ratio of gross expenses | | | | | |
| to average net assets6 (%) | 1.85 | 1.88 | 1.89 | 1.84 | 1.85 |
| Ratio of net investment income | | | | | |
| to average net assets (%) | 1.46 | 0.10 | 0.12 | 0.46 | 1.86 |
1 Audited by previous auditor.
2 Based on the average of the shares outstanding.
3 Less than $0.01 per share.
4 Assumes dividend reinvestment and does not reflect the effect of sales charges.
5 Total returns would have been lower had certain expenses not been reduced during the periods shown.
6 Does not take into consideration expense reductions during the periods shown.
See notes to
financial statements.
|
15
Note A
Accounting policies
John Hancock Money Market Fund (the “Fund”) is a diversified series of John Hancock Current Interest (the “Trust”), an open-end management investment company registered under the Investment Company Act of 1940. The investment objective of the Fund is to seek the maximum current income that is consistent with maintaining liquidity and preserving capital.
The Trustees have authorized the issuance of multiple classes of shares of the Fund, designated as Class A, Class B and Class C shares. The shares of each class represent an interest in the same portfolio of investments of the Fund and have equal rights as to voting, redemptions, dividends and liquidation, except that certain expenses, subject to the approval of the Trustees, may be applied differently to each class of shares in accordance with current regulations of the Securities and Exchange Commission and the Internal Revenue Service. Shareholders of a class that bears distribution and service expenses under the terms of a distribution plan have exclusive voting rights to that distribution plan.
Significant accounting policies
of the Fund are as follows:
Valuation of investments
Securities in the Fund’s portfolio are valued at amortized cost, in accordance with Rule 2a-7 of the Investment Company Act of 1940, which approximates market value. The amortized cost method involves valuing a security at its cost on the date of purchase and thereafter assuming a constant amortization to maturity of the difference between the principal amount due at maturity and the cost of the security to the Fund. Interest income on certain portfolio securities such as negotiable bank certificates of deposit and interest-bearing notes is accrued daily and included in interest receivable.
Joint repurchase agreement
Pursuant to an exemptive order issued by the Securities and Exchange Commission, the Fund, along with other registered investment companies having a management contract with John Hancock Advisers, LLC (the “Adviser”), a wholly owned subsidiary of John Hancock Financial Services, Inc., a subsidiary of Manulife Financial Corporation (“MFC”), may participate in a joint repurchase agreement transaction. Aggregate cash balances are invested in one or more large repurchase agreements, whose underlying securities are obligations of the U.S. government and/or its agencies. The Fund’s custodian bank receives delivery of the underlying securities for the joint account on the Fund’s behalf. The Adviser is responsible for ensuring that the agreement is fully collateralized at all times.
16
Investment transactions
Investment transactions are recorded as of the date of purchase, sale or maturity. Net realized gains and losses on sales of investments are determined on the identified cost basis.
Class allocations
Income, common expenses and realized and unrealized gains (losses) are determined at the fund level and allocated daily to each class of shares based on the appropriate net asset value of the respective classes.
Distribution and service fees, if any, are calculated daily at the class level based on the appropriate net asset value of each class and the specific expense rate(s) applicable to each class.
Expenses
The majority of expenses are directly identifiable to an individual fund. Expenses that are not readily identifi-able to a specific fund are allocated in such a manner as deemed equitable, taking into consideration, among other things, the nature and type of expense and the relative size of the funds.
Federal income taxes
The Fund qualifies as a “regulated investment company” by complying with the applicable provisions of the Internal Revenue Code and will not be subject to federal income tax on taxable income that is distributed to shareholders. Therefore, no federal income tax provision is required. For federal income tax purposes, the Fund has $1,191 of a capital loss carryforward available, to the extent provided by regulations, to offset future net realized capital gains. To the extent that such carryfor-ward is used by the Fund, no capital gain distributions will be made. The entire loss carryforward expires on March 31, 2012. Net capital losses of $2, which are attributable to security transactions incurred after October 31, 2005, are treated as arising on April 1, 2006, the first day of the Fund’s next taxable year.
Distributions
The Fund’s net investment income is declared daily as dividends to shareholders of record as of the close of business on the preceding day and distributed monthly.
During the year ended March 31, 2005, the tax character of distributions paid was as follows: ordinary income $2,237,275. During the year ended March 31, 2006, the tax character of distributions paid was as follows: ordinary income $6,650,432. Distributions paid by the Fund with respect to each class of shares are calculated in the same manner, at the same time and are in the same amount, except for the effect of expenses that may be applied differently to each class.
As of March 31, 2006, the components of distributable earnings on a tax basis included $94,337 of undistributed ordinary income.
Such distributions, and distributable earnings, on a tax basis, are determined in conformity with income tax regulations, which may differ from accounting principles generally accepted in the United States of America. Distributions in excess of tax basis earnings and profits, if any, are reported in the Fund’s financial statements as a return of capital.
Use of estimates
The preparation of these financial statements, in accordance with accounting principles generally accepted in the United States of America, incorporates estimates made by management in determining the reported amount of assets, liabilities, revenues and expenses of the Fund. Actual results could differ from these estimates.
Note B
Management fee and
transactions with
affiliates and others
The Fund has an investment management contract with the Adviser. Under the investment management contract, the Fund pays a monthly management fee to the Adviser equivalent, on an annual basis, to the sum of: (a) 0.50% of the first $500,000,000 of the Fund’s
17
average daily net asset value, (b) 0.425% of the next $250,000,000, (c) 0.375% of the next $250,000,000, (d) 0.35% of the next $500,000,000, (e) 0.325% of the next $500,000,000, (f) 0.30% of the next $500,000,000 and (g) 0.275% of the Fund’s average daily net asset value in excess of $2,500,000,000.
The Adviser has agreed to limit the Fund’s management fee to 0.40% of the Fund’s first $750,000,000 average daily net asset value, at least until July 31, 2006. The management fee cannot be restated to the original contracted amounts without the Trustees’ consent. Accordingly, the expense reductions related to management fee limitation amounted to $251,116 for the year ended March 31, 2006.
Effective December 31, 2005, the investment management teams of the Adviser were reorganized into Sovereign Asset Management LLC (“Sovereign”), a wholly owned indirect subsidiary of John Hancock Life Insurance Company (“JHLICo”), a subsidiary of MFC. The Adviser remains the principal advisor on the Fund, and Sovereign acts as subadviser under the supervision of the Adviser. The restructuring did not have an impact on the Fund, which continues to be managed using the same investment philosophy and process. The Fund is not responsible for payment of the subadvisory fees.
The Trust has a Distribution Agreement with John Hancock Funds, LLC (“JH Funds”), a wholly owned subsidiary of the Adviser. The Fund has adopted Distribution Plans with respect to Class A, Class B and Class C, pursuant to Rule 12b-1 under the Investment Company Act of 1940, to reimburse JH Funds for the services it provides as distributor of shares of the Fund. Accordingly, the Fund makes monthly payments to JH Funds at an annual rate not to exceed 0.25% of Class A average daily net asset value and 1.00% of Class B and Class C average daily net asset value. JH Funds has agreed to contractually limit the distribution and service fees (“12b-1”) for Class A to 0.15% of the Class A average daily net asset value, at least until July 31, 2006. Accordingly, the expense reductions related to the reduction in the 12b-1 fees amounted to $195,349 for Class A for the year ended March 31, 2006. A maximum of 0.25% of such payments may be service fees, as defined by the Conduct Rules of the National Association of Securities Dealers. Under the Conduct Rules, curtailment of a portion of the Fund’s 12b-1 payments could occur under certain circumstances.
Class B shares that are redeemed within six years of purchase are subject to a contingent deferred sales charge (“CDSC”) at declining rates, beginning at 5.00% of the lesser of the current market value at the time of redemption or the original purchase cost of the shares being redeemed. Class C shares that are redeemed within one year of purchase are subject to a CDSC at a rate of 1.00% of the lesser of the current market value at the time of redemption or the original purchase cost of the shares being redeemed. Proceeds from the CDSCs are paid to JH Funds and are used, in whole or in part, to defray its expenses for providing distribution-related services to the Fund in connection with the sale of Class B and Class C shares. During the year ended March 31, 2006, CDSCs received by JH Funds amounted to $328,548 for Class B shares and $7,340 for Class C shares.
The Fund has a transfer agent agreement with John Hancock Signature Services, Inc. (“Signature Services”), an indirect subsidiary of JHLICo, a subsidiary of MFC. The Fund paid a monthly transfer agent fee at an annual rate of 0.015% of the Fund’s average daily net asset value until December 31, 2005. Effective January 1, 2006, the Fund pays a monthly transfer agent fee at an annual rate of 0.01% of
18
the Fund’s average daily net asset value. The Fund also pays a fee based on the number of shareholder accounts and reimbursement for certain out-of-pocket expenses, aggregated and allocated to each class on the basis of its relative net asset value. Signature Services agreed to voluntarily reduce the Fund’s asset-based portion of the transfer agent fee if the total transfer agent fee exceeds the Lipper, Inc. median transfer agency fee for comparable mutual funds by greater than 0.05% . Accordingly, the transfer agent expense for Class A, Class B and Class C shares was reduced by $12,479 during the year ended March 31, 2006. Signature Services reserves the right to terminate this limitation at any time.
The Fund has an agreement with the Adviser to perform necessary tax, accounting and legal services for the Fund. The compensation for the year amounted to $62,779. The Fund also paid the Adviser the amount of $792 for certain publishing services, included in the printing fees. The Fund reimbursed JHLICo for certain compliance costs, included in the Fund’s Statement of Operations.
Mr. James R. Boyle is Chairman of the Adviser, as well as an affiliated Trustee of the Fund, and is compensated by the Adviser and/or its affiliates. The compensation of unaffiliated Trustees is borne by the Fund. The unaffiliated Trustees may elect to defer, for tax purposes, their receipt of this compensation under the John Hancock Group of Funds Deferred Compensation Plan. The Fund makes investments into other John Hancock funds, as applicable, to cover its liability for the deferred compensation. Investments to cover the Fund’s deferred compensation liability are recorded on the Fund’s books as an other asset. The deferred compensation liability and the related other asset are always equal and are marked to market on a periodic basis to reflect any income earned by the investments, as well as any unrealized gains or losses. The Deferred Compensation Plan investments had no impact on the operations of the Fund.
19
Note C
Fund share transactions
|
This listing illustrates the number of Fund shares sold, reinvested and repurchased during the last two periods, along with the corresponding dollar value. Analysis of Fund share transactions is reported at $1 per share.
| | Year ended | Year ended |
| | 3-31-051 | 3-31-06 |
|
| |
| Class A shares | | |
| Sold | $199,402,275 | $127,681,502 |
| Distributions reinvested | 1,694,489 | 5,328,508 |
| Repurchased | (188,642,570) | (172,041,882) |
| Net increase (decrease) | $12,454,194 | ($39,031,872) |
|
| |
| Class B shares | | |
| Sold | $65,409,173 | $27,389,350 |
| Distributions reinvested | 332,180 | 815,743 |
| Repurchased | (91,837,267) | (55,432,211) |
| Net decrease | ($26,095,914) | ($27,227,118) |
|
| |
| Class C shares | | |
| Sold | $25,954,084 | $13,974,382 |
| Distributions reinvested | 46,772 | 124,618 |
| Repurchased | (25,035,072) | (22,703,402) |
| Net increase (decrease) | $965,784 | ($8,604,402) |
|
| |
| Net decrease | ($12,675,936) | ($74,863,392) |
1 Audited by previous auditor.
Note D
Investment
transactions
Purchases and proceeds from sales or maturities of securities, including discount earned on investment securities, during the year ended March 31, 2006, aggregated $8,764,032,100 and $8,845,516,016, respectively.
The cost of investments owned on March 31, 2006, for federal income tax purposes, was $225,952,201.
Note E
Reclassification
of accounts
During the year ended March 31, 2006, the Fund reclassified amounts to reflect an increase in accumulated net investment income of $580 and a decrease in capital paid-in of $580. This represents the amounts necessary to report these balances on a tax basis, excluding certain temporary differences, as of March 31, 2006. Additional adjustments may be needed in subsequent reporting periods. These reclassifications, which have no impact on the net asset value of the Fund, are primarily attributable to certain differences in the computation of distributable income and capital gains under federal tax rules versus accounting principles generally accepted in the United States of America, book and tax differences in accounting for deferred compensation and federal excise tax. The calculation of net investment income per share in the Fund’s Financial Highlights excludes these adjustments.
20
AUDITORS’
REPORT
Report of
Independent
Registered Public
Accounting Firm
|
To the Board of Trustees of the John Hancock Current Interest
and Shareholders of John Hancock Money Market Fund,
In our opinion, the accompanying statement of assets and liabilities, including the schedule of investments, and the related statements of operations and of changes in net assets and the financial highlights present fairly, in all material respects, the financial position of John Hancock Money Market Fund (the “Fund”) as of March 31, 2006, the results of its operations, the changes in its net assets and the financial highlights for the year then ended, in conformity with accounting principles generally accepted in the United States of America. These financial statements and financial highlights (hereafter referred to as “financial statements”) are the responsibility of the Fund’s management; our responsibility is to express an opinion on these financial statements based on our audits. We conducted our audits of these financial statements in accordance with the standards of the Public Company Accounting Oversight Board (United States). Those standards require that we plan and perform the audit to obtain reasonable assurance about whether the financial statements are free of material misstatement. An audit includes examining, on a test basis, evidence supporting the amounts and disclosures in the financial statements, assessing the accounting principles used and significant estimates made by management, and evaluating the overall financial statement presentation. We believe that our audits, which included confirmation of securities as of March 31, 2006 by correspondence with the custodian and brokers, provide a reasonable basis for our opinion. The statement of changes in net assets of the Fund for the year ended March 31, 2005 and the financial highlights for each of the four years ended on or before March 31, 2005 were audited by another independent registered public accounting firm, whose report dated May 5, 2005 expressed an unqualified opinion thereon.
PricewaterhouseCoopers LLP
Boston, Massachusetts
May 11, 2006
|
21
For federal income tax purposes, the following information is furnished with respect to the distributions of the Fund, if any, paid during its taxable year ended March 31, 2006.
The Fund hereby designates the maximum amount allowable of its net taxable income as qualified dividend income as provided in the Jobs and Growth Tax Relief Reconciliation Act of 2003. This amount will be reflected on Form 1099-DIV for the calendar year 2006.
Shareholders will be mailed a 2006 U.S. Treasury Department Form 1099-DIV in January 2007. This will reflect the total of all distributions that are taxable for calendar year 2006.
22
Board Consideration
of and Continuation
of Investment
Advisory Agreement:
John Hancock Money
Market Fund
Section 15(c) of the Investment Company Act of 1940 (the “1940 Act”) requires the Board of Trustees (the “Board”) of John Hancock Current Interest (the “Trust”), including a majority of the Trustees who have no direct or indirect interest in the investment advisory agreement and are not “interested persons” of the Trust, as defined in the 1940 Act (the “Independent Trustees”), annually to review and consider the continuation of the investment advisory agreement (the “Advisory Agreement”) with John Hancock Advisers, LLC (the “Adviser”) for the John Hancock Money Market Fund (the “Fund”).
At meetings held on May 19–20 and June 6–7, 2005, the Board, including the Independent Trustees, considered the factors and reached the conclusions described below relating to the selection of the Adviser and the continuation of the Advisory Agreement. During such meetings, the Board’s Contracts/Operations Committee and the Independent Trustees also met in executive sessions with their independent legal counsel. In evaluating the Advisory Agreement, the Board, including the Contracts/Operations Committee and the Independent Trustees, reviewed a broad range of information requested for this purpose by the Independent Trustees, including but not limited to the following: (i) the investment performance of the Fund and a broader universe of relevant funds (the “Universe”) selected by Lipper, Inc. (“Lipper”), an independent provider of investment company data, for a range of periods, (ii) advisory and other fees incurred by, and the expense ratios of, the Fund and a peer group of comparable funds selected by Lipper (the “Peer Group”), (iii) the advisory fees of comparable portfolios of other clients of the Adviser, (iv) the Adviser’s financial results and condition, including its and certain of its affiliates’ profitability from services performed for the Fund, (v) breakpoints in the Fund’s and the Peer Group’s fees and a study undertaken at the direction of the Independent Trustees as to the allocation of the benefits of economies of scale between the Fund and the Adviser, (vi) the Adviser’s record of compliance with applicable laws and regulations, with the Fund’s investment policies and restrictions, and with the Fund’s Code of Ethics and the structure and responsibilities of the Adviser’s compliance department, (vii) the background and experience of senior management and investment professionals, and (viii) the nature, cost and character of advisory and non-investment management services provided by the Adviser and its affiliates.
Nature, extent and quality
of services
The Board considered the ability of the Adviser, based on its resources, reputation and other attributes, to attract and retain qualified investment professionals, including research, advisory, and supervisory personnel. The Board further considered the compliance programs and compliance records of the Adviser. In addition, the Board took into account the administrative services provided to the Fund by the Adviser and its affiliates.
Based on the above factors, together with those referenced below, the Board concluded that, within the context of its full deliberations, the nature, extent and quality of the investment advisory services provided to the Fund by the Adviser were sufficient to support renewal of the Advisory Agreement.
Fund performance
The Board considered the performance results for the Fund over various time periods. The Board also considered these results in comparison to the performance of the Universe, as well as the Fund’s benchmark
23
indexes. Lipper determined the Universe for the Fund. The Board reviewed with a representative of Lipper the methodology used by Lipper to select the funds in the Universe and the Peer Group.
The Board noted that the performance of the Fund was below the median and average performance of its Universe and the performance of its benchmark indexes, the Lipper Money Market Funds Index and the Average/Total of iMoneyNet Universe, for the time periods under review. The Adviser discussed with the Board factors that contributed to the Fund’s underperformance and described changes in investment personnel and additional measures that may be taken in the future with the objective of improving performance. The Board intends to continue to monitor the Fund’s performance trends to assess the effectiveness of these changes and whether other remedial changes are warranted.
Investment advisory
fee rates and expenses
The Board reviewed and considered the contractual investment advisory fee rate payable by the Fund to the Adviser for investment advisory services (the “Advisory Agreement Rate”). The Board noted the fee waiver arrangement applicable to the Advisory Agreement Rate and considered the Advisory Agreement Rate after taking the waivers into account (the “Net Advisory Rate”). The Board received and considered information comparing the Advisory Agreement Rate and Net Advisory Rate with the advisory fees for the Peer Group. The Board noted that the Advisory Agreement Rate and Net Advisory Rate were not appreciably higher than the median rate of the Peer Group. The Board concluded that the Advisory Agreement Rate and the Net Advisory Rate were reasonable in relation to the services provided.
The Board received and considered information regarding the Fund’s total operating expense ratio and its various components, including contractual advisory fees, actual advisory fees, non-management fees, Rule 12b-1 and non-Rule 12b-1 service fees, transfer agent fees and custodian fees, including and excluding Rule 12b-1 and non-Rule 12b-1 service fees. The Board also considered comparisons of these expenses to the expense information for the Peer Group and the Universe. The Board noted that the total operating expense ratio of the Fund was higher than the median total operating expense ratio of the Peer Group and the Universe. It also noted that the most significant contributor to such difference was the Fund’s transfer agency expense, which the transfer agent has taken steps to reduce.
The Adviser also discussed the Lipper data and rankings, and other relevant information, for the Fund. Based on the above-referenced considerations and other factors, the Board concluded that plans to reduce the Fund’s overall fees and expenses and actions taken with the intention of improving the Fund’s performance supported the re-approval of the Advisory Agreement.
Profitability
The Board received and considered a detailed profitability analysis of the Adviser based on the Advisory Agreement, as well as on other relationships between the Fund and the Adviser and its affiliates. The Board concluded that, in light of the costs of providing investment management and other services to the Fund, the profits and other ancillary benefits reported by the Adviser were not unreasonable.
Economies of scale
The Board received and considered general information regarding economies of scale with respect to the management of the Fund, including the Fund’s ability to appropriately benefit from economies of scale under the Fund’s fee structure. The Board recognized the
24
inherent limitations of any analysis of economies of scale, stemming largely from the Board’s understanding that most of the Adviser’s costs are not specific to individual Funds, but rather are incurred across a variety of products and services.
To the extent the Board and the Adviser were able to identify actual or potential economies of scale from Fund-specific or allocated expenses, in order to ensure that any such economies continue to be reasonably shared with the Fund as its assets increase, the Adviser and the Board agreed to continue the existing breakpoints.
Information about
services to other clients
The Board also received information about the nature, extent and quality of services and fee rates offered by the Adviser to its other clients, including other registered investment companies, institutional investors and separate accounts. The Board concluded that the Advisory Agreement Rate was not unreasonable, taking into account fee rates offered to others by the Adviser and giving effect to differences in services covered by such fee rates.
Other benefits to
the Adviser
The Board received information regarding potential “fall-out” or ancillary benefits received by the Adviser and its affiliates as a result of the Adviser’s relationship with the Fund. Such benefits could include, among others, benefits directly attributable to the relationship of the Adviser with the Fund and benefits potentially derived from an increase in the business of the Adviser as a result of its relationship with the Fund (such as the ability to market to shareholders other financial products offered by the Adviser and its affiliates).
The Board also considered the effectiveness of the Adviser’s and the Fund’s policies and procedures for complying with the requirements of the federal securities laws, including those relating to best execution of portfolio transactions and brokerage allocation.
Other factors and
broader review
As discussed above, the Board reviewed detailed materials received from the Adviser as part of the annual reapproval process under Section 15(c) of the 1940 Act. The Board also regularly reviews and assesses the quality of the services that the Fund receives throughout the year. In this regard, the Board reviews reports of the Adviser at least quarterly, which include, among other things, a detailed portfolio review, detailed fund performance reports and compliance reports. In addition, the Board meets with portfolio managers and senior investment officers at various times throughout the year.
After considering the above-described factors and based on its deliberations and its evaluation of the information described above, the Board concluded that approval of the continuation of the Advisory Agreement for the Fund was in the best interest of the Fund and its shareholders. Accordingly, the Board unanimously approved the continuation of the Advisory Agreement.
25
This chart provides information about the Trustees and Officers who oversee your John Hancock fund. Officers elected by the Trustees manage the day-to-day operations of the Fund and execute policies formulated by the Trustees.
| Independent Trustees | | |
| Name, age | | Number of |
| Position(s) held with Fund | Trustee | John Hancock |
| Principal occupation(s) and other | of Fund | funds overseen |
| directorships during past 5 years | since1 | by Trustee |
|
| | |
| Ronald R. Dion, Born: 1946 | 1998 | 52 |
| Independent Chairman (since 2005); Chairman and Chief Executive Officer, | | |
| R.M. Bradley & Co., Inc.; Director, The New England Council and Massachusetts | |
| Roundtable; Trustee, North Shore Medical Center; Director, Boston Stock | | |
| Exchange; Director, BJ’s Wholesale Club, Inc. and a corporator of the Eastern | | |
| Bank; Trustee, Emmanuel College; Director, Boston Municipal Research Bureau; | |
| Member of the Advisory Board, Carroll Graduate School of Management at | | |
| Boston College. | | |
|
| |
| James F. Carlin, Born: 1940 | 1994 | 52 |
| Director and Treasurer, Alpha Analytical Inc. (analytical laboratory) (since 1985); | |
| Part Owner and Treasurer, Lawrence Carlin Insurance Agency, Inc. (since 1995); | |
| Part Owner and Vice President, Mone Lawrence Carlin Insurance Agency, Inc. | | |
| (until 2005); Director and Treasurer, Rizzo Associates (engineering) (until 2000); | |
| Chairman and CEO, Carlin Consolidated, Inc. (management/investments) (since | |
| 1987); Director and Partner, Proctor Carlin & Co., Inc. (until 1999); Trustee, | | |
| Massachusetts Health and Education Tax Exempt Trust (since 1993); Director of | |
| the following: Uno Restaurant Corp. (until 2001), Arbella Mutual (insurance) | | |
| (until 2000), HealthPlan Services, Inc. (until 1999), Flagship Healthcare, Inc. (until | |
| 1999), Carlin Insurance Agency, Inc. (until 1999); Chairman, Massachusetts | | |
| Board of Higher Education (until 1999). | | |
|
| |
| Richard P. Chapman, Jr.,2 Born: 1935 | 2005 | 52 |
| President and Chief Executive Officer, Brookline Bancorp Inc. (lending) | | |
| (since 1972); Chairman and Director, Lumber Insurance Co. (insurance) | | |
| (until 2000); Chairman and Director, Northeast Retirement Services, Inc. | | |
| (retirement administration) (since 1998). | | |
|
| |
| William H. Cunningham, Born: 1944 | 1987 | 149 |
| Former Chancellor, University of Texas System and former President of the | | |
| University of Texas, Austin, Texas; Chairman and CEO, IBT Technologies (until | | |
| 2001); Director of the following: Hire.com (until 2004), STC Broadcasting, Inc. | | |
| and Sunrise Television Corp. (until 2001), Symtx, Inc. (electronic manufacturing) | |
| (since 2001), Adorno/Rogers Technology, Inc. (until 2004), Pinnacle Foods | | |
| Corporation (until 2003), rateGenius (until 2003), Lincoln National Corporation | |
| (insurance) (since 2006), Jefferson-Pilot Corporation (diversified life insurance | | |
26
| Independent Trustees (continued) | | |
| Name, age | | Number of |
| Position(s) held with Fund | Trustee | John Hancock |
| Principal occupation(s) and other | of Fund | funds overseen |
| directorships during past 5 years | since1 | by Trustee |
|
| | |
| William H. Cunningham, Born: 1944 (continued) | 1987 | 149 |
| company) (until 2006), New Century Equity Holdings (formerly Billing Concepts) | |
| (until 2001), eCertain (until 2001), ClassMap.com (until 2001), Agile Ventures | | |
| (until 2001), AskRed.com (until 2001), Southwest Airlines, Introgen and | | |
| Viasystems Group, Inc. (electronic manufacturer) (until 2003); Advisory | | |
| Director, Interactive Bridge, Inc. (college fundraising) (until 2001); Advisory | | |
| Director, Q Investments (until 2003); Advisory Director, JP Morgan Chase Bank | | |
| (formerly Texas Commerce Bank – Austin), LIN Television (since 2002), WilTel | | |
| Communications (until 2003) and Hayes Lemmerz International, Inc. | | |
| (diversified automotive parts supply company) (since 2003). | | |
|
| |
| Charles L. Ladner,2 Born: 1938 | 1994 | 149 |
| Chairman and Trustee, Dunwoody Village, Inc. (retirement services) (until 2003); | |
| Senior Vice President and Chief Financial Officer, UGI Corporation (public utility | |
| holding company) (retired 1998); Vice President and Director for AmeriGas, Inc. | |
| (retired 1998); Director of AmeriGas Partners, L.P. (until 1997) (gas distribution); | |
| Director, EnergyNorth, Inc. (until 1995); Director, Parks and History Association | | |
| (since 2001). | | |
|
| |
| John A. Moore,2 Born: 1939 | 2005 | 52 |
| President and Chief Executive Officer, Institute for Evaluating Health Risks, | | |
| (nonprofit institution) (until 2001); Chief Scientist, Sciences International (health | |
| research) (until 2003); Principal, Hollyhouse (consulting) (since 2000); Director, | | |
| CIIT (nonprofit research) (since 2002). | | |
|
| |
| Patti McGill Peterson,2 Born: 1943 | 2005 | 52 |
| Executive Director, Council for International Exchange of Scholars and Vice | | |
| President, Institute of International Education (since 1998); Senior Fellow, Cornell | |
| Institute of Public Affairs, Cornell University (until 1998); Former President of | | |
| Wells College and St. Lawrence University; Director, Niagara Mohawk Power | | |
| Corporation (until 2003); Director, Ford Foundation, International Fellowships | | |
| Program (since 2002); Director, Lois Roth Endowment (since 2002); Director, | | |
| Council for International Educational Exchange (since 2003). | | |
|
| |
| Steven R. Pruchansky, Born: 1944 | 1994 | 52 |
| Chairman and Chief Executive Officer, Greenscapes of Southwest Florida, Inc. | | |
| (since 2000); Director and President, Greenscapes of Southwest Florida, Inc. | | |
| (until 2000); Managing Director, JonJames, LLC (real estate) (since 2001); | | |
| Director, First Signature Bank & Trust Company (until 1991); Director, Mast | | |
| Realty Trust (until 1994); President, Maxwell Building Corp. (until 1991). | | |
27
| Non-Independent Trustee3 | | |
| Name, age | | Number of |
| Position(s) held with Fund | Trustee | John Hancock |
| Principal occupation(s) and other | of Fund | funds overseen |
| directorships during past 5 years | since1 | by Trustee |
|
| | |
| James R. Boyle, Born: 1959 | 2005 | 250 |
| President, John Hancock Annuities; Executive Vice President, John Hancock | | |
| Life Insurance Company (since June, 2004); Chairman and Director, John | | |
| Hancock Advisers, LLC (the “Adviser”); John Hancock Funds, LLC (“John | | |
| Hancock Funds”) and The Berkeley Financial Group, LLC (“The Berkeley | | |
| Group”) (holding company) (since 2005); President, U.S. Annuities; Senior | | |
| Vice President, The Manufacturers Life Insurance Company (U.S.A.) (prior | | |
| to 2004). | | |
| |
Principal officers who are not Trustees | | |
| Name, age | | |
| Position(s) held with Fund | | Officer |
| Principal occupation(s) and | | of Fund |
| directorships during past 5 years | | since |
|
| | |
| Keith F. Hartstein, Born: 1956 | | 2005 |
| President and Chief Executive Officer | | |
| Senior Vice President, Manulife Financial Corporation (since 2004); Director, | | |
| President and Chief Executive Officer, the Adviser and The Berkeley Group; | | |
| Director, President and Chief Executive Officer, John Hancock Funds; Director, | | |
| President and Chief Executive Officer, Sovereign Asset Management LLC | | |
| (“Sovereign”); Director, John Hancock Signature Services, Inc.; President, John | | |
| Hancock Trust; Director, Chairman and President, NM Capital Management, | | |
| Inc. (NM Capital) (since 2005); Chairman, Investment Company Institute Sales | | |
| Force Marketing Committee (since 2003); Executive Vice President, John | | |
| Hancock Funds (until 2005). | | |
|
| |
| William H. King, Born: 1952 | | 1994 |
| Vice President and Treasurer | | |
| Vice President and Assistant Treasurer, the Adviser; Vice President and Treasurer | |
| of each of the John Hancock funds advised by the Adviser; Assistant Treasurer | | |
| of each of the John Hancock funds advised by the Adviser (until 2001). | | |
|
| |
| Francis V. Knox, Jr., Born: 1947 | | 2005 |
| Vice President and Chief Compliance Officer | | |
| Vice President and Chief Compliance Officer for John Hancock Investment | | |
| Company, John Hancock Life Insurance Company (U.S.A.), John Hancock Life | | |
| Insurance Company and John Hancock Funds (since 2005); Vice President and | | |
| Assistant Treasurer, Fidelity Group of Funds (until 2004); Vice President and | | |
| Ethics & Compliance Officer, Fidelity Investments (until 2001). | | |
|
| |
| John G. Vrysen, Born: 1955 | | 2005 |
| Executive Vice President and Chief Financial Officer | | |
| Director, Executive Vice President and Chief Financial Officer, the Adviser, | | |
| Sovereign, The Berkeley Group and John Hancock Funds (since 2005); Vice | | |
| President and General Manager, Fixed Annuities, U.S. Wealth Management | | |
| (until 2005); Vice President, Operations, Manulife Wood Logan (July 2000 thru | | |
| September 2004). | | |
28
Notes to Trustees and Officers pages
The business address for all Trustees and Officers is 601 Congress Street, Boston, Massachusetts 02210-2805.
The Statement of Additional Information of the Fund includes additional information about members of the Board of Trustees of the Fund and is available, without charge, upon request, by calling 1-800-225-5291.
1 Each Trustee serves until resignation, retirement age or until his or her successor is elected.
2 Member of Audit Committee.
3 Non-independent Trustee holds positions with the Fund’s investment adviser, underwriter and certain other affiliates.
29
|
| Equity | Balanced Fund |
| | Classic Value Fund |
| | Core Equity Fund |
| | Focused Equity Fund |
| | Growth Trends Fund |
| | Large Cap Equity Fund |
| | Large Cap Select Fund |
| | Mid Cap Equity Fund |
| | Mid Cap Growth Fund |
| | Multi Cap Growth Fund |
| | Small Cap Fund |
| | Small Cap Equity Fund |
| | Small Cap Intrinsic Value Fund |
| | Sovereign Investors Fund |
| | U.S. Global Leaders Growth Fund |
|
| |
| Asset Allocation and | Allocation Growth + Value Portfolio |
| Lifestyle Portfolios | Allocation Core Portfolio |
| | Lifestyle Aggressive Portfolio |
| | Lifestyle Growth Portfolio |
| | Lifestyle Balanced Portfolio |
| | Lifestyle Moderate Portfolio |
| | Lifestyle Conservative Portfolio |
|
| |
| Sector | Financial Industries Fund |
| | Health Sciences Fund |
| | Real Estate Fund |
| | Regional Bank Fund |
| | Technology Fund |
| | Technology Leaders Fund |
|
| |
| International | Greater China Opportunities Fund |
| | International Fund |
| | International Classic Value Fund |
|
| |
| Income | Bond Fund |
| | Government Income Fund |
| | High Yield Fund |
| | Investment Grade Bond Fund |
| | Strategic Income Fund |
|
| |
| Tax-Free Income | California Tax-Free Income Fund |
| | High Yield Municipal Bond Fund |
| | Massachusetts Tax-Free Income Fund |
| | New York Tax-Free Income Fund |
| | Tax-Free Bond Fund |
|
| |
| Money Market | Money Market Fund |
| | U.S. Government Cash Reserve |
|
For more complete information on any John Hancock Fund and a prospectus, which includes charges and expenses, call your financial professional, or John Hancock Funds at 1-800-225-5291. Please read the prospectus carefully before investing or sending money.
30
ELECTRONIC
DELIVERY
Now available from
John Hancock Funds
|
Instead of sending annual and semiannual reports
and prospectuses through the U.S. mail, we’ll notify
you by e-mail when these documents are available
for online viewing.
How does electronic delivery benefit you?
| * | No more waiting for the mail to arrive; you’ll receive an |
| | e-mail notification as soon as the document is ready for |
| | online viewing. |
| |
| * | Reduces the amount of paper mail you receive from |
| | John Hancock Funds. |
| |
| * | Reduces costs associated with printing and mailing. |
Sign up for electronic delivery today at
www.jhfunds.com/edelivery
|
31
OUR WEB SITE
A wealth of information —
www.jhfunds.com
|
| View the latest information for your account. |
|
| Transfer money from one account to another. |
|
| Get current quotes for major market indexes. |
|
| Use our online calculators to help you with your |
| financial goals. |
|
| Get up-to-date commentary from John Hancock |
| Funds investment experts. |
|
| Access forms, applications and tax information. |
32
For more information
The Fund’s proxy voting policies, procedures and records are available without charge, upon request:
| By phone | On the Fund’s Web site | On the SEC’s Web site |
| 1-800-225-5291 | www.jhfunds.com/proxy | www.sec.gov |
|
| |
| |
| Investment adviser | Custodian | Independent registered |
| John Hancock Advisers, LLC | The Bank of New York | public accounting firm |
| 601 Congress Street | One Wall Street | PricewaterhouseCoopers LLP |
| Boston, MA 02210-2805 | New York, NY 10286 | 125 High Street |
| | Boston, MA 02110 |
| Subadviser | Transfer agent | |
| Sovereign Asset | John Hancock Signature | |
| Management LLC | Services, Inc. | |
| 101 Huntington Avenue | 1 John Hancock Way, | |
| Boston, MA 02199 | Suite 1000 | |
| | Boston, MA 02217-1000 | |
| Principal distributor | | |
| John Hancock Funds, LLC | Legal counsel | |
| 601 Congress Street | Wilmer Cutler Pickering | |
| Boston, MA 02210-2805 | Hale and Dorr LLP | |
| | 60 State Street | |
| | Boston, MA 02109-1803 | |
The Fund’s investment objective, risks, charges and expenses are included in the prospectus and should be considered carefully before investing. For a prospectus, call your financial professional, call John Hancock Funds at 1-800-225-5291, or visit the Fund’s Web site at www.jhfunds.com. Please read the prospectus carefully before investing or sending money.
| How to contact us | |
|
| |
| Internet | www.jhfunds.com | |
|
| |
| Mail | Regular mail: | Express mail: |
| | John Hancock | John Hancock |
| | Signature Services, Inc. | Signature Services, Inc. |
| | 1 John Hancock Way, Suite 1000 | Mutual Fund Image Operations |
| | Boston, MA 02217-1000 | 380 Stuart Street |
| | | Boston, MA 02116 |
|
| |
| Phone | Customer service representatives | 1-800-225-5291 |
| | 24-hour automated information | 1-800-338-8080 |
| | TDD line | 1-800-554-6713 |
A listing of month-end portfolio holdings is available on our Web site, www.jhfunds.com. A more detailed portfolio holdings summary is available on a quarterly basis 60 days after the fiscal quarter on our Web site or upon request by calling 1-800-225-5291, or on the Securities and Exchange Commission’s Web site, www.sec.gov.
33

1-800-225-5291
1-800-554-6713 (TDD)
1-800-338-8080 EASI-Line
www.jhfunds. com
|
Now available: electronic delivery
www.jhfunds. com/edelivery
|
This report is for the information of
the shareholders of John Hancock
Money Market Fund.
|
ITEM 2. CODE OF ETHICS.
As of the end of the period, March 31, 2006, the registrant has adopted a code of ethics, as defined in Item 2 of Form N-CSR, that applies to its Chief Executive Officer, Chief Financial Officer and Treasurer (respectively, the principal executive officer, the principal financial officer and the principal accounting officer, the “Senior Financial Officers”). A copy of the code of ethics is filed as an exhibit to this Form N-CSR.
The code of ethics was amended effective May 1, 2005 to address new Rule 204A-1 under the Investment Advisers Act of 1940 and to make other related changes.
The most significant amendments were:
(a) Broadening of the General Principles of the code to cover compliance with all federal securities laws.
(b) Eliminating the interim requirements (since the first quarter of 2004) for access persons to preclear their personal trades of John Hancock mutual funds. This was replaced by post-trade reporting and a 30 day hold requirement for all employees.
(c) A new requirement for “heightened preclearance” with investment supervisors by any access person trading in a personal position worth $100,000 or more.
ITEM 3. AUDIT COMMITTEE FINANCIAL EXPERT.
Charles L. Ladner is the audit committee financial expert and is “independent”, pursuant to general instructions on Form N-CSR Item 3.
ITEM 4. PRINCIPAL ACCOUNTANT FEES AND SERVICES.
(a) Audit Fees
The aggregate fees billed for professional services rendered by the principal accountant(s) for the audit of the registrant’s annual financial statements or services that are normally provided by the accountant(s) in connection with statutory and regulatory filings or engagements amounted to $49,500 for the fiscal year ended March 31, 2005 (broken out as follows: John Hancock Money Market Fund $31,000 and John Hancock U.S. Government Cash Reserve - $18,500) and $48,800 for the fiscal year ended March 31, 2006 (broken out as follows: John Hancock Money Market Fund $23,900 and John Hancock U.S. Government Cash Reserve - $14,900). These fees were billed to the registrant and were approved by the registrant’s audit committee.
(b) Audit-Related Services
There were no audit-related fees during the fiscal year ended March 31, 2005 and fiscal year ended March 31, 2006 billed to the registrant or to the registrant's investment adviser (not including any sub-adviser whose role is primarily portfolio management and is subcontracted with or overseen by another investment adviser), and any entity controlling, controlled by, or under common control with the adviser that provides ongoing services to the registrant ("control affiliates").
(c) Tax Fees
The aggregate fees billed for professional services rendered by the principal accountant(s) for the tax compliance, tax advice and tax planning (“tax fees”) amounted to $4,800 for the fiscal year
ended March 31, 2005 (broken out as follows: John Hancock Money Market Fund $2,400 and John Hancock U.S. Government Cash Reserve - $2,400) and $4,900 (broken out as follows: John Hancock Money Market Fund $3,000 and John Hancock U.S. Government Cash Reserve - $1,900) for the fiscal year ended March 31, 2006. The nature of the services comprising the tax fees was the review of the registrant’s income tax returns and tax distribution requirements. These fees were billed to the registrant and were approved by the registrant’s audit committee. There were no tax fees billed to the control affiliates.
(d) All Other Fees
There were no other fees during the fiscal year ended March 31, 2005 and fiscal year ended March 31, 2006 billed to the registrant or to the control affiliates.
(e)(1) See attachment "Approval of Audit, Audit-related, Tax and Other Services", with the audit committee pre-approval policies and procedures.
(e)(2) There were no fees that were approved by the audit committee pursuant to the de minimis exception for the fiscal years ended March 31, 2005 and March 31, 2006 on behalf of the registrant or on behalf of the control affiliates that relate directly to the operations and financial reporting of the registrant.
(f) According to the registrant’s principal accountant, for the fiscal year ended March 31, 2006, the percentage of hours spent on the audit of the registrant's financial statements for the most recent fiscal year that were attributed to work performed by persons who were not full-time, permanent employees of principal accountant was less than 50%.
(g) The aggregate non-audit fees billed by the registrant's accountant(s) for services rendered to the registrant and rendered to the registrant's control affiliates for each of the last two fiscal years of the registrant were $69,800 for the fiscal year ended March 31, 2005 and $23,400 for the fiscal year ended March 31, 2006.
(h) The audit committee of the registrant has considered the non-audit services provided by the registrant’s principal accountant(s) to the control affiliates and has determined that the services that were not pre-approved are compatible with maintaining the principal accountant(s)' independence.
ITEM 5. AUDIT COMMITTEE OF LISTED REGISTRANTS.
The registrant has a separately-designated standing audit committee comprised of independent trustees. The members of the audit committee are as follows:
Dr. John A. Moore - Chairman
Richard P. Chapman, Jr.
Charles L. Ladner
Patti McGill Peterson
ITEM 6. SCHEDULE OF INVESTMENTS.
|
ITEM 7. DISCLOSURE OF PROXY VOTING POLICIES AND PROCEDURES FOR CLOSED-END
MANAGEMENT INVESTMENT COMPANIES.
|
ITEM 8. PORTFOLIO MANAGERS OF CLOSED-END MANAGEMENT INVESTMENT COMPANIES.
ITEM 9. PURCHASES OF EQUITY SECURITIES BY CLOSED-END MANAGEMENT
INVESTMENT COMPANY AND AFFILIATED PURCHASERS.
|
ITEM 10. SUBMISSION OF MATTERS TO A VOTE OF SECURITY HOLDERS.
There were no material changes to previously disclosed John Hancock Funds - Administration Committee Charter and John Hancock Funds – Governance Committee Charter.
ITEM 11. CONTROLS AND PROCEDURES.
|
(a) Based upon their evaluation of the registrant's disclosure controls and procedures as conducted within 90 days of the filing date of this Form N-CSR, the registrant's principal executive officer and principal financial officer have concluded that those disclosure controls and procedures provide reasonable assurance that the material information required to be disclosed by the registrant on this report is recorded, processed, summarized and reported within the time periods specified in the Securities and Exchange Commission's rules and forms.
(b) There were no changes in the registrant's internal control over financial reporting that occurred during the registrant's most recent fiscal half-year (the registrant's second fiscal half-year in the case of an annual report) that have materially affected, or are reasonably likely to materially affect, the registrant's internal control over financial reporting.
(a)(1) Code of Ethics for Senior Financial Officers is attached.
(a)(2) Separate certifications for the registrant's principal executive officer and principal financial officer, as required by Section 302 of the Sarbanes-Oxley Act of 2002 and Rule 30a-2(a) under the Investment Company Act of 1940, are attached.
(b) Separate certifications for the registrant's principal executive officer and principal financial officer, as required by 18 U.S.C. Section 1350, as adopted pursuant to Section 906 of the Sarbanes-Oxley Act of 2002, and Rule 30a-2(b) under the Investment Company Act of 1940, are attached. The certifications furnished pursuant to this paragraph are not deemed to be "filed" for purposes of Section 18 of the Securities Exchange Act of 1934, or otherwise subject to the liability of that section. Such certifications are not deemed to be incorporated by reference into
any filing under the Securities Act of 1933 or the Securities Exchange Act of 1934, except to the extent that the Registrant specifically incorporates them by reference.
(c)(1) Approval of Audit, Audit-related, Tax and Other Services is attached.
(c)(2) Contact person at the registrant.
|
Pursuant to the requirements of the Securities Exchange Act of 1934 and the Investment Company Act of 1940, the registrant has duly caused this report to be signed on its behalf by the undersigned, thereunto duly authorized.
John Hancock Current Interest
|
By: /s/ Keith F. Hartstein
-------------------------------------
Keith F. Hartstein
President and Chief Executive Officer
Date: May 25,2006
|
Pursuant to the requirements of the Securities Exchange Act of 1934 and the Investment Company Act of 1940, this report has been signed below by the following persons on behalf of the registrant and in the capacities and on the dates indicated.
By: /s/ Keith F. Hartstein
-------------------------------------
Keith F. Hartstein
President and Chief Executive Officer
Date: May 25,2006
|
By: /s/ John G. Vrysen
-------------------------------------
John G. Vrysen
Executive Vice President and Chief Financial Officer