UNITED STATES
SECURITIES AND EXCHANGE COMMISSION
Washington, D.C. 20549
FORM N-CSR
CERTIFIED SHAREHOLDER REPORT OF REGISTERED
MANAGEMENT INVESTMENT COMPANIES
Investment Company Act file number 811- 2485
John Hancock Current Interest
(Exact name of registrant as specified in charter)
601 Congress Street, Boston, Massachusetts 02210
(Address of principal executive offices) (Zip code)
Alfred P. Ouellete, Senior Attorney and Assistant Secretary
601 Congress Street
Boston, Massachusetts 02210
(Name and address of agent for service)
Registrant's telephone number, including area code: 617-663-4324
| Date of fiscal year end: | March 31 |
| | |
| Date of reporting period: | September 30, 2006 |
ITEM 1. REPORT TO SHAREHOLDERS.


CEO corner
| TABLE OF CONTENTS |
|
| |
| Your fund at a glance |
| page 1 |
|
| |
| Managers’ report |
| page 2 |
|
| |
| Your expenses |
| page 6 |
|
| |
| Fund’s investments |
| page 8 |
|
| |
| Financial statements |
| page 1 0 |
|
| |
| For more information |
| page 2 0 |
|
To Our Shareholders,
The future has arrived at John Hancock Funds.
We have always been firm believers in the powerful role the Internet can play in providing fund information to our shareholders and prospective investors. Recently, we launched a redesigned, completely overhauled Web site that is more visually pleasing, easier to navigate and, most importantly, provides more fund information and learning tools without overwhelming the user.
Not long after we embarked on this major project, a study was released by the Investment Company Institute, the mutual fund industry’s main trade group, which found that an overwhelming majority of shareholders consider the Internet the “wave of the future” for accessing fund information.
Our new site sports fresher and faster ways to access account information. New innovations allow investors to view funds by risk level, track the performance of the John Hancock funds of their choice or sort funds by Morningstar, Inc.’s star ratings. Investors who own a John Hancock fund through a qualified retirement plan and don’t pay sales charges when making a purchase have the option of sorting by a “Load Waived” Morningstar Rating, thereby creating an apples-to-apples comparison with no-load funds that may also be available in their retirement plan.
The new site also has more educational tools and interactive modules to educate and assist investors with their financial goals, from college savings to retirement planning. A new “I want to…” feature allows investors to check performance, invest more money, update personal information or download prospectuses and forms quickly and easily.
In another of our ongoing efforts to provide our shareholders with top-notch service, we also redesigned our shareholder reports, as you may have noticed with this report. We hope the larger size, more colorful cover and redesigned presentation of the commentary and data tables will draw you in and make them easier to read.
After you’ve read your shareholder report, we encourage you to visit our new Web site — www.jhfunds.com — and take a tour. It’s easy, fast and fun and allows you to be in control of what you see and do. In short, it’s the wave of the future!
Sincerely,

Keith F. Hartstein,
President and Chief Executive Officer
This commentary reflects the CEO’s views as of September 30, 2006. They are subject to change at any time.
Your fund at a glance
The Funds seeks the maximum current income that is consistent with maintaining liquidity and preserving capital. The Fund intends to maintain a stable $1 share price.
Over the last six months
►The Federal Reserve Board stopped raising interest rates after making 17 hikes since June 2004.
►Money market yields still managed to rise due to the two last hikes in May and June.
►The Fund adjusted to the new environment by lengthening its weighted average maturity and cutting back on floating rate securities.
1
Managers’ report
John Hancock
U.S. Government Cash Reserve
Money market yields rose over the last six months ending September 30, 2006, but the period marked a significant milestone, as the Federal Reserve Board stopped raising interest rates after a two-year cycle of rate hikes. Many investors believed it marked the end of the tightening cycle. The Fed made two rate hikes at the Federal Open Market Committee (FOMC) meetings on May 10 and June 29, each time raising short-term rates 0.25%, as they had 15 other times since June 2004. At the end of June, the federal funds rate that banks charge each other for overnight loans stood at 5.25%, up from 1.00% when the Fed began its tightening cycle.
In a statement issued at the May FOMC meeting, the Fed signaled that the growth of the economy had been strong early on in the year, with first quarter gross domestic product (GDP) growth of 5.6% . The economy was buoyed by strong manufacturing productivity and solid job growth. Although rising energy prices such as gasoline, natural gas and crude oil had only a minor effect on core inflation, the Fed believed the potential for increased inflation loomed. By June, GDP growth had begun to moderate, with second quarter growth slowing to 2.6% . The Fed felt that this moderation in growth was due to a gradual slowdown in the housing market, which should help to keep inflation in check. As the period progressed and more economic data filtered into the market, it became evident that the economy was indeed moderating. The FOMC acknowledged this by leaving rates unchanged at the August and September FOMC meetings and signaled that a “cooling” housing market and the � 47;lagged” effects of past interest rate hikes still had to work their way through the market.
U.S. Government Cash Reserve
2
Portfolio Managers, MFC Global Investment Management (U.S.), LLC David A. Bees and Michael V. Lorizio
“…the period marked a
significant milestone, as
the Federal Reserve Board
stopped raising interest
rates after a two-year cycle
of rate hikes.”
Fund yield and performance
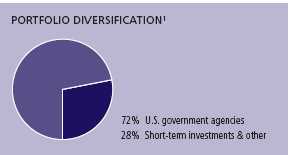
On September 30, 2006, John Hancock U.S. Government Cash Reserve had a 7-day effective yield of 4.42% . By comparison, the average U.S. government money market fund had a 7-day effective yield of 4.63%, according to Lipper, Inc.
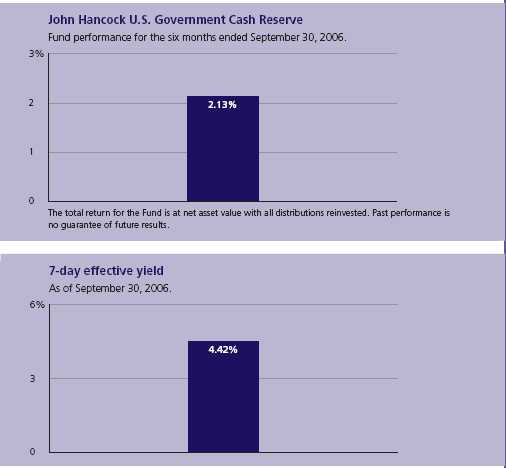
For the six months ended September 30, 2006, the Fund posted a total return of 2.13% at net asset value, compared with the 2.16% return of the average U.S. government money market fund, according to Lipper, Inc. Keep in mind that your net asset value return will be different from the Fund’s performance if you were not invested in the Fund for the entire period and did not reinvest all distributions.
Fund moves
As the semiannual period began in April, we began extending the weighted average maturity of the Fund in anticipation of the conclusion of the rate-tightening cycle. In April, the Fund’s weighted average maturity was significantly longer than the peer average. After it became apparent that the Fed planned on holding rates steady, we continued to extend the weighted average maturity of the Fund to lock in higher rates for a longer period of time. By the end of the period, the Fund’s weighted average maturity remained longer than its peers.
In another key change to the structure of the portfolio, we reduced our allocation to floating rate securities with multiple resets left, since the potential for their reset rates to be higher had diminished. At the beginning of the period, 30% of the Fund’s assets were invested in floating rate
U.S. Government Cash Reserve
3
“We believe the Fed will keep rates
stable for the foreseeable future. “
securities. By the end of the period, our allocation to floating rate securities stood at 7%. All matured floating rate securities were invested in fixed-rate, short-term agency coupon bonds or remained in joint repurchase agreements, as these out-yielded other cash surrogate products.
Outlook
We believe the Fed will keep rates stable for the foreseeable future. Future interest rate moves will largely depend on upcoming economic data. We believe the housing market will play an integral role in determining how stable the economy remains over the next year. For now, the data suggests a weakening in this tremendously large asset class. Existing home sales have declined 12.6% year over year through August and the national median home price has declined 1.7% year over year through August, according to the National Association of Realtors. This could have major implications for the strength of the economy, since this is the first time national median home prices have declined since April 1995.
Energy commodity prices will also be a key driver of the economy. We have already started to see energy prices moderate, with crude oil declining about $10 per barrel over the course of September. This price decline should help alleviate some of the pain consumers have been feeling at the gas pump and should also help keep inflation concerns in check.
U.S. Government Cash Reserve
4
We will continue to monitor all economic data releases to help forecast the future state of the economy. With continued elevated energy costs and housing moderating nationally, we believe there is a possibility that GDP growth could remain weak, with growth somewhere between 1.5% and 3.0% through 2007. In fact, if the declining housing market spills over into other facets of the economy, we may even see interest rates reverse course and come down in order to alleviate strains on the economy.
This commentary reflects the views of the portfolio management team through the end of the Fund’s period discussed in this report. The team’s statements reflect their own opinions. As such, they are in no way guarantees of future events and are not intended to be used as investment advice or a recommendation regarding any specific security. They are also subject to change at any time as market and other conditions warrant.
The Fund is neither insured nor guaranteed by the U.S. government. Although the Fund seeks to maintain a net asset value of $1.00 per share, it is possible to lose money by investing in the Fund.
1 As a percentage of net assets on 9-30-06
U.S. Government Cash Reserve
5
Your expenses
These examples are intended to help you understand your ongoing operating expenses.
Understanding fund expenses
As a shareholder of the Fund, you incur two types of costs:
■ Transaction costs which include sales charges (loads) on purchases or redemptions (varies by share class), minimum account fee charge, etc.
■ Ongoing operating expenses including management fees, distribution and service fees (if applicable) and other fund expenses.
We are going to present only your ongoing operating expenses here.
Actual expenses/actual returns
This example is intended to provide information about your fund’s actual ongoing operating expenses, and is based on your fund’s actual return. It assumes an account value of $1,000.00 on April 1, 2006, with the same investment held until September 30, 2006.
| Account value | | Expenses paid |
| $1,000.00 | Ending value | during period |
| on 4-1-06 | on 9-30-06 | ended 9-30-061 |
|
| U.S. Government Cash Reserve | $1,021.30 | $4.24 |
|
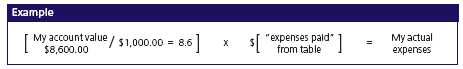
Together with the value of your account, you may use this information to estimate the operating expenses that you paid over the period. Simply divide your account value at September 30, 2006 by $1,000.00, then multiply it by the “expenses paid” for your share class from the table above. For example, for an account value of $8,600.00, the operating expenses should be calculated as follows:
U.S. Government Cash Reserve
6
Hypothetical example for comparison purposes
This table allows you to compare your fund’s ongoing operating expenses with those of any other fund. It provides an example of the Fund’s hypothetical account values and hypothetical expenses based on each class’s actual expense ratio and an assumed 5% annual return before expenses (which is not your fund’s actual return). It assumes an account value of $1,000.00 on April 1, 2006, with the same investment held until September 30, 2006. Look in any other fund shareholder report to find its hypothetical example and you will be able to compare these expenses.
| Account value | | Expenses paid |
| $1,000.00 | Ending value | during period |
| on 4-1-06 | on 9-30-06 | ended 9-30-061 |
|
| U.S. Government Cash Reserve | $1,020.90 | $4.24 |
|
Remember, these examples do not include any transaction costs, such as sales charges; therefore, these examples will not help you to determine the relative total costs of owning different funds. If transaction costs were included, your expenses would have been higher. See the prospectus for details regarding transaction costs.
1 Expenses are equal to the Fund's annualized expense ratio of 0.85%, multiplied by the average account value over the period, multiplied by number of days in most recent fiscal half-year/365 or 366 (to reflect the one-half year period).
U.S. Government Cash Reserve
7
F I N A N C I A L S T A T E M E N T S
Fund’s investments
Securities owned by the Fund on 9-30-06 (unaudited)
This schedule is a complete list of all securities owned by the Fund. It’s divided into two types of short-term investments: U.S. government obligations and joint repurchase agreements.
| | Interest | Maturity | Credit | Par value | |
| Issuer, description | rate | date | rating (A) | (000) | Value |
|
| U.S. government obligations 72.42% | | | | $26,347,356 |
| (Cost $26,347,356) | | | | | |
| | | | | | |
| | | | | | |
| Government — U.S. Agencies 72.42% | | | | | 26,347,356 |
|
| Federal Farm Credit Bank (P) | 5.240% | 10-04-06 | AAA | $200 | 199,996 |
|
| Federal Home Loan Bank | 5.580 | 08-14-07 | AAA | 1,225 | 1,225,000 |
|
| Federal Home Loan Bank | 5.550 | 08-21-07 | AAA | 235 | 235,055 |
|
| Federal Home Loan Bank (P) | 5.270 | 12-13-06 | AAA | 1,000 | 999,947 |
|
| Federal Home Loan Bank (P) | 5.255 | 01-03-07 | AAA | 2,500 | 2,500,221 |
|
| Federal Home Loan Bank | 5.250 | 10-22-07 | AAA | 750 | 750,000 |
|
| Federal Home Loan Bank | 5.000 | 10-20-06 | AAA | 500 | 499,862 |
|
| Federal Home Loan Bank (P) | 5.000 | 03-14-07 | AAA | 100 | 100,000 |
|
| Federal Home Loan Bank | 4.625 | 01-17-07 | AAA | 1,250 | 1,249,317 |
|
| Federal Home Loan Bank | 4.500 | 05-11-07 | AAA | 500 | 497,712 |
|
| Federal Home Loan Bank | 3.875 | 12-20-06 | AAA | 200 | 199,337 |
|
| Federal Home Loan Bank | 3.625 | 02-09-07 | AAA | 750 | 745,318 |
|
| Federal Home Loan Bank | 3.125 | 11-15-06 | AAA | 1,195 | 1,191,729 |
|
| Federal Home Loan Bank | 3.100 | 11-28-06 | AAA | 1,000 | 996,390 |
|
| Federal Home Loan Bank | 3.000 | 11-15-06 | AAA | 1,000 | 997,092 |
|
| Federal Home Loan Bank | 2.625 | 10-16-06 | AAA | 2,280 | 2,277,438 |
|
| Federal Home Loan Mortgage Corp. | 5.250 | 05-16-07 | AAA | 500 | 500,000 |
|
| Federal Home Loan Mortgage Corp. | 4.875 | 03-15-07 | AAA | 103 | 102,789 |
|
| Federal Home Loan Mortgage Corp. | 4.350 | 11-21-06 | AAA | 1,700 | 1,697,541 |
|
| Federal Home Loan Mortgage Corp. | 3.750 | 11-15-06 | AAA | 100 | 99,797 |
|
| Federal Home Loan Mortgage Corp. | 3.500 | 11-17-06 | AAA | 2,500 | 2,494,023 |
|
| Federal Home Loan Mortgage Corp. | 3.000 | 11-09-06 | AAA | 450 | 448,856 |
|
| Federal Home Loan Mortgage Corp. | 2.875 | 12-15-06 | AAA | 995 | 990,011 |
|
| Federal Home Loan Mortgage Corp. | 2.850 | 02-23-07 | AAA | 1,000 | 990,410 |
|
| Federal Home Loan Mortgage Corp. | 2.500 | 12-04-06 | AAA | 1,500 | 1,492,539 |
|
| Federal Home Loan Mortgage Corp. | 2.050 | 01-02-07 | AAA | 600 | 594,973 |
|
| Federal National Mortgage Assn. | 7.125 | 03-15-07 | AAA | 1,000 | 1,008,327 |
|
| Federal National Mortgage Assn. | 4.000 | 10-16-06 | AAA | 525 | 524,712 |
|
| Federal National Mortgage Assn. | 2.625 | 01-19-07 | AAA | 745 | 738,964 |
See notes to financial statements
U.S. Government Cash Reserve
8
F I N A N C I A L S T A T E M E N T S
| | Interest | Par value | |
| Issuer, description, maturity date | rate | (000) | Value |
|
| Short-term investments 31.33% | | | $11,399,000 |
| (Cost $11,399,000) | | | |
| Joint Repurchase Agreement 31.33% | | | 11,399,000 |
|
| Investment in a joint repurchase agreement transaction with | | | |
| Cantor Fitzgerald, LP — Dated 9-29-06 due 10-02-06 (secured | | | |
| by U.S. Treasury Bond 8.125% due 8-15-19, U.S. Treasury | | | |
| Inflation Indexed Bond 2.000% due 1-15-26 and U.S. Treasury | | | |
| Inflation Indexed Notes 1.875% due 7-15-13, 2.000% due | | | |
| 1-15-16 and 3.000% due 7-15-12) | 5.100% | $11,399 | 11,399,000 |
|
| |
| Total investments (cost $37,746,356) 103.75% | | | $37,746,356 |
|
| |
| Other assets and liabilities, net (3.75%) | | | ($1,362,993) |
|
| |
| Total net assets 100.00% | | | $36,383,363 |
(A) Credit ratings are unaudited and are rated by Moody’s Investors Service where Standard & Poor’s ratings are not available.
(P) Represents rate in effect on September 30, 2006.
The percentage shown for each investment category is the total value of that category as a percentage of the net assets of the Fund.
See notes to financial statements
U.S. Government Cash Reserve
9
F I N A N C I A L S T A T E M E N T SFinancial statements
Statement of assets and liabilities 9-30-06 (unaudited)
This Statement of Assets and Liabilities is the Fund’s balance sheet. It shows the value of what the Fund owns, is due and owes. You’ll also find the net asset value per share.
| Assets | |
|
| Investments, at value (cost $26,347,356) | $26,347,356 |
| Joint repurchase agreement (cost $11,399,000) | 11,399,000 |
| Cash | 410 |
| Receivable for shares sold | 8,340 |
| Interest receivable | 227,005 |
| Other assets | 55,001 |
| Total assets | 38,037,112 |
| |
| Liabilities | |
|
| Payable for investments purchased | 1,447,679 |
| Payable for shares repurchased | 116,667 |
| Dividends payable | 9,372 |
| Payable to affiliates | |
| Management fees | 16,201 |
| Other | 9,879 |
| Other payables and accrued expenses | 53,951 |
| Total liabilities | 1,653,749 |
| |
| Net assets | |
|
| Capital paid-in | 36,383,151 |
| Accumulated net investment income | 212 |
| Net assets | $36,383,363 |
| |
| Net asset value per share | |
|
| Based on net asset value and shares outstanding — | |
| the Fund has an unlimited number of shares | |
| authorized with no par value | |
| ($36,383,363/36,401,407 shares) | $1.00 |
See notes to financial statements
U.S. Government Cash Reserve
10
F I N A N C I A L S T A T E M E N T S
Statement of operations For the six months ended 9-30-061 (unaudited)
This Statement of Operations summarizes the Fund’s investment income earned and expenses incurred in operating the Fund.
| Investment income | |
|
| Interest | $1,001,782 |
| Total investment income | 1,001,782 |
| |
| Expenses | |
|
| Investment management fees (Note 2) | 98,971 |
| Distribution and service fees (Note 2) | 29,961 |
| Transfer agent fees (Note 2) | 23,867 |
| Accounting and legal services fees (Note 2) | 2,685 |
| Compliance fees | 520 |
| Registration and filing fees | 13,009 |
| Professional fees | 9,044 |
| Custodian fees | 8,929 |
| Printing fees | 7,088 |
| Trustees’ fees | 1,722 |
| Miscellaneous | 1,505 |
| Total expenses | 197,301 |
| Less expense reductions (Note 2) | (29,961) |
| Net expenses | 167,340 |
| Net investment income | 834,442 |
| Increase in net assets from operations | $834,442 |
1 Semiannual period 4-1-06 through 9-30-06.
See notes to financial statements
U.S. Government Cash Reserve
11
F I N A N C I A L S T A T E M E N T SStatement of changes in net assets
These Statements of Changes in Net Assets show how the value of the Fund’s net assets has changed during the last two periods. The difference reflects earnings less expenses, any investment gains and losses, distributions, if any, paid to shareholders and the net of Fund share transactions.
| | Year | Period |
| | ended | ended |
| | 3-31-06 | 9-30-061 |
|
| Increase (decrease) in net assets | | |
|
| From operations | | |
| Net investment income | $1,214,400 | $834,442 |
| Increase in net assets resulting from operations | 1,214,400 | 834,442 |
| Distributions to shareholders | | |
| From net investment income | (1,214,400) | (834,442) |
| From Fund share transactions | (4,950,260) | (4,154,786) |
| |
| Net assets | | |
|
| Beginning of period | 45,488,409 | 40,538,149 |
| End of period | $40,538,149 | $36,383,363 |
1 Semiannual period 4-1-06 through 9-30-06. Unaudited.
2 Includes accumulated net investment income of $212 and $212, respectively.
See notes to financial statements
U.S. Government Cash Reserve
12
F I N A N C I A L S T A T E M E N T S
Financial highlights
The Financial highlights show how the Fund’s net asset value for a share has changed since the end of the previous period.
| Period ended | 3-31-021 | 3-31-031 | 3-31-041 | 3-31-051 | 3-31-06 | 9-30-062 |
|
| Per share operating performance | | | | | | |
|
| Net asset value, beginning of period | $1.00 | $1.00 | $1.00 | $1.00 | $1.00 | $1.00 |
| Net investment income3 | 0.03 | 0.01 | —4 | 0.01 | 0.03 | 0.02 |
| Less distributions | | | | | | |
| From net investment income | (0.03) | (0.01) | —4 | (0.01) | (0.03) | (0.02) |
| Net asset value, end of period | $1.00 | $1.00 | $1.00 | $1.00 | $1.00 | $1.00 |
| Total return5,6 (%) | 2.60 | 0.91 | 0.34 | 0.80 | 2.89 | 2.137 |
| |
| Ratios and supplemental data | | | | | | |
|
| Net assets, end of period | | | | | | |
| (in millions) | $95 | $73 | $57 | $45 | $41 | $36 |
| Ratio of net expenses to average | | | | | | |
| net assets (%) | 0.72 | 0.73 | 0.77 | 0.84 | 0.87 | 0.858 |
| Ratio of gross expenses to average | | | | | | |
| net assets9 (%) | 0.87 | 0.88 | 0.92 | 0.99 | 1.02 | 1.008 |
| Ratio of net investment income | | | | | | |
| to average net assets (%) | 2.55 | 0.92 | 0.34 | 0.77 | 2.83 | 4.228 |
1 Audited by previous auditor.
2 Semiannual period from 4-1-06 through 9-30-06. Unaudited.
3 Based on the average of the shares outstanding.
4 Less than $0.01 per share.
5 Assumes dividend reinvestment.
6 Total returns would have been lower had certain expenses not been reduced during the periods shown.
7 Not annualized.
8 Annualized.
9 Does not take into consideration expense reductions during the periods shown.
See notes to financial statements
U.S. Government Cash Reserve
13
Notes to financial statements (unaudited)
Note 1 Accounting policies
John Hancock U.S. Government Cash Reserve (the “Fund”) is a diversified series of John Hancock Current Interest, an open-end management investment company registered under the Investment Company Act of 1940, as amended. The investment objective of the Fund is to provide maximum current income consistent with maintaining liquidity and preserving capital.
Significant accounting policies of the Fund are as follows:
Valuation of investments
Securities in the Fund’s portfolio are valued at amortized cost, in accordance with Rule 2a-7 of the Investment Company Act of 1940, as amended, which approximates market value. The amortized cost method involves valuing a security at its cost on the date of purchase and thereafter assuming a constant amortization to maturity of the difference between the principal amount due at maturity and the cost of the security to the Fund.
Joint repurchase agreement
Pursuant to an exemptive order issued by the Securities and Exchange Commission, the Fund, along with other registered investment companies having a management contract with John Hancock Advisers, LLC (the “Adviser”), a wholly owned subsidiary of John Hancock Financial Services, Inc., a subsidiary of Manulife Financial Corporation (“MFC”), may participate in a joint repurchase agreement transaction. Aggregate cash balances are invested in one or more large repurchase agreements, whose underlying securities are obligations of the U.S. government and/or its agencies. The Fund’s custodian bank receives delivery of the underlying securities for the joint account on the Fund’s behalf. The Adviser is responsible for ensuring that the agreement is fully collateralized at all times.
Investment transactions
Investment transactions are recorded as of the date of purchase, sale or maturity. Net realized gains and losses on sales of investments are determined on the identified cost basis.
Expenses
The majority of expenses are directly identifiable to an individual fund. Expenses that are not readily identifiable to a specific fund are allocated in such a manner as deemed equitable, taking into consideration, among other things, the nature and type of expense and the relative sizes of the funds.
Federal income taxes
The Fund qualifies as a “regulated investment company” by complying with the applicable provisions of the Internal Revenue Code and will not be subject to federal income tax on taxable income that is distributed to shareholders. Therefore, no federal income tax provision is required.
New accounting pronouncements
In June 2006, Financial Accounting Standards Board (“FASB”) Interpretation No. 48, Accounting for Uncertainty in Income Taxes (the “Interpretation”) was issued, and is effective for fiscal years beginning after December 15, 2006 and is to be applied to all open tax years as of the effective date. The Interpretation prescribes a minimum threshold for financial statement recognition of the benefit of a tax position taken or expected to be taken in a tax return, and requires certain expanded disclosures. Management is currently evaluating the application of the Interpretation to the Fund, and has not at this time quantified the impact, if any, resulting from the adoption of the Interpretation on the Fund’s financial statements.
In September 2006, FASB Standard No. 157, Fair Value Measurements (“FAS 157”) was issued, and is effective for fiscal years
U.S. Government Cash Reserve
14
beginning after November 15, 2007. FAS 157 defines fair value, establishing a framework for measuring fair value and expands thorough disclosure about fair value measurements. Management is currently evaluating the application of the FAS 157 to the Fund, and its impact, if any, resulting from the adoption of the FAS 157 on the Fund’s financial statements.
Distributions
The Fund’s net investment income is declared daily as dividends to shareholders of record as of the close of business on the preceding day and distributed monthly.
During the year ended March 31, 2006, the tax character of distributions paid was as follows: ordinary income $1,214,400.
Such distributions, on a tax basis, are determined in conformity with income tax regulations, which may differ from accounting principles generally accepted in the United States of America. Distributions in excess of tax basis earnings and profits, if any, are reported in the Fund’s financial statements as a return of capital.
Use of estimates
The preparation of these financial statements, in accordance with accounting principles generally accepted in the United States of America, incorporates estimates made by management in determining the reported amount of assets, liabilities, revenues and expenses of the Fund. Actual results could differ from these estimates.
Note 2
Management fee and transactions with affiliates and others
The Fund has an investment management contract with the Adviser. Under the investment management contract, the Fund pays a monthly management fee to the Adviser equivalent, on an annual basis, to the sum of: (a) 0.50% of the first $500,000,000 of the Fund’s average daily net asset value, (b) 0.425% of the next $250,000,000, (c) 0.375% of the next $250,000,000, (d) 0.35% of the next $500,000,000, (e) 0.325% of the next $500,000,000, (f) 0.30% of the next $500,000,000 and (g) 0.275% of the average daily net asset value in excess of $2,500,000,000.
Effective December 31, 2005, the investment management teams of the Adviser were reorganized into Sovereign Asset Management LLC (“Sovereign”), a wholly owned indirect subsidiary of John Hancock Life Insurance Company (“JHLICO”), a subsidiary of MFC. The Adviser remains the principal advisor on the Fund and Sovereign acts as subadviser under the supervision of the Adviser. The restructuring did not have an impact on the Fund, which continues to be managed using the same investment philosophy and process. The Fund is not responsible for payment of the subadvisory fees.
Effective October 1, 2006, Sovereign changed its name to MFC Global Investment Management (U.S.), LLC.
The Fund has a Distribution Agreement with John Hancock Funds, LLC (“JH Funds”), a wholly owned subsidiary of the Adviser. The Fund has adopted a Distribution Plan pursuant to Rule 12b-1 under the Investment Company Act of 1940 to reimburse JH Funds for the services it provides as distributor of shares of the Fund at an annual rate not to exceed 0.15% of the Fund’s average daily net asset value. JH Funds has agreed to suspend the distribution and service (“12b-1”) fee, at least until July 31, 2007. Accordingly, the reduction in the 12b-1 fee amounted to $29,961 for the period ended September 30, 2006. JH Funds reserves the right to terminate this limitation in the future.
The Fund has a transfer agent agreement with John Hancock Signature Services, Inc. (“Signature Services”), an indirect subsidiary of JHLICO. The Fund pays a monthly transfer agent fee at an annual rate of 0.01% of the average daily net asset value, plus a fee based on the number of shareholder accounts and reimbursement for certain out-of-pocket expenses, aggregated and allocated to each class on the basis of its relative net asset value. Signature Services agreed to voluntarily reduce the Fund’s asset-based portion of the transfer agent fee if the total transfer agent fee exceeded the median transfer agency fee for comparable
U.S. Government Cash Reserve
15
mutual funds by 0.05% . There were no transfer agent fee reductions during the period ended September 30, 2006. Signature Services terminated this agreement on June 30, 2006.
The Fund has an agreement with the Adviser and affiliates to perform necessary tax, accounting and legal services for the Fund. The compensation for the period amounted to $2,685. The Fund also paid the Adviser the amount of $66 for certain publishing services, included in the printing fees. The Fund reimbursed JHLICO for certain compliance costs, included in the Fund’s Statement of Operations.
Mr. James R. Boyle is Chairman of the Adviser, as well as affiliated Trustee of the Fund, and is compensated by the Adviser and/or its affiliates. The compensation of unaffiliated Trustees is borne by the Fund. The unaffiliated Trustees may elect to defer, for tax purposes, their receipt of this compensation under the John Hancock Group of Funds Deferred Compensation Plan. The Fund makes investments into other John Hancock funds, as applicable, to cover its liability for the deferred compensation. Investments to cover the Fund’s deferred compensation liability are recorded on the Fund’s books as an other asset. The deferred compensation liability and the related other asset are always equal and are marked to market on a periodic basis to reflect any income earned by the investments, as well as any unrealized gains or losses. The Deferred Compensation Plan investments had no impact on the operations of the Fund.
Note 3
Fund share transactions
This listing illustrates the number of Fund shares sold, reinvested and repurchased during the last two periods, along with the corresponding dollar value. Analysis of Fund share transactions is reported at $1 per share.
| | Year ended 3-31-06 | Period ended 9-30-06 1 |
| | Amount | Amount |
| Sold | $16,985,735 | $7,820,824 |
| Distributions reinvested | 1,157,185 | 534,432 |
| Repurchased | (23,093,180) | (12,510,042) |
| Net decrease | ($4,950,260) | ($4,154,786) |
| |
| 1Semiannual period 4-1-06 through 9-30-06. Unaudited. | |
Note 4
Investment transactions
Purchases and proceeds from sales or maturities of securities, including discount earned on investment securities, during the period ended September 30, 2006, aggregated $1,023,165,547 and $1,025,903,000, respectively
The cost of investments owned on September 30, 2006, including short-term investments, for federal income tax purposes, was $37,746,356.
U.S. Government Cash Reserve
16
Board Consideration of and Continuation of Investment Advisory Agreement and Sub-Advisory Agreement: John Hancock U.S. Government Cash Reserve
The Investment Company Act of 1940 (the “1940 Act”) requires the Board of Trustees (the “Board”) of John Hancock Current Interest (the “Trust”), including a majority of the Trustees who have no direct or indirect interest in the investment advisory agreement and are not “interested persons” of the Trust, as defined in the 1940 Act (the “Independent Trustees”), annually to review and consider the continuation of: (i) the investment advisory agreement (the “Advisory Agreement”) with John Hancock Advisers, LLC (the “Adviser”) and (ii) the investment sub-advisory agreement (the “Sub-Advisory Agreement”) with Sovereign Asset Management LLC (the “Sub-Adviser”) for the John Hancock U.S. Government Cash Reserve (the “Fund”). The Advisory Agreement and the Sub-Advisory Agreement are collectively referred to as the “Advisory Agreements.”
At meetings held on May 1-2 and June 5-6, 2006,1 the Board considered the factors and reached the conclusions described below relating to the selection of the Adviser and Sub-Adviser and the continuation of the Advisory Agreements. During such meetings, the Board’s Contracts/Operations Committee and the Independent Trustees also met in executive sessions with their independent legal counsel.
In evaluating the Advisory Agreements, the Board, including the Contracts/Operations Committee and the Independent Trustees, reviewed a broad range of information requested for this purpose by the Independent Trustees, including: (i) the investment performance of the Fund relative to a category of relevant funds (the “Category”) and a peer group of comparable funds (the “Peer Group”) each selected by Morningstar Inc. (“Morningstar”), an independent provider of investment company data, for a range of periods ended December 31, 2005, (ii) advisory and other fees incurred by, and the expense ratios of, the Fund relative to a Category and a Peer Group, (iii) the advisory fees of comparable portfolios of other clients of the Adviser and the Sub-Adviser, (iv) the Adviser’s financial results and condition, including its and certain of its affiliates’ profitability from services performed for the Fund, (v) br eakpoints in the Fund’s and the Peer Group’s fees, and information about economies of scale, (vi) the Adviser’s and Sub-Adviser’s record of compliance with applicable laws and regulations, with the Fund’s investment policies and restrictions, and with the applicable Code of Ethics, and the structure and responsibilities of the Adviser’s and Sub-Adviser’s compliance department, (vii) the background and experience of senior management and investment professionals, and (viii) the nature, cost and character of advisory and non-investment management services provided by the Adviser and its affiliates and by the Sub-Adviser.
The Board’s review and conclusions were based on a comprehensive consideration of all information presented to the Board and not the result of any single controlling factor. It was based on performance and other information as of December 31, 2005; facts may have changed between that date and the date of this shareholders report. The key factors considered by the Board and the conclusions reached are described below.
Nature, extent and quality of services
The Board considered the ability of the Adviser and the Sub-Adviser, based on their resources, reputation and other attributes, to attract and retain qualified investment professionals, including research, advisory, and supervisory personnel. The Board further considered the compliance programs and compliance records of the Adviser and Sub-Adviser. In addition, the Board took into account the administrative services provided to the Fund by the Adviser and its affiliates.
Based on the above factors, together with those referenced below, the Board concluded that, within the context of its full deliberations, the nature, extent and quality of the investment advisory services provided to the Fund by the Adviser and Sub-Adviser were sufficient to support renewal of the Advisory Agreements.
Fund performance
The Board considered the performance results for the Fund over various time periods ended December 31, 2005. The Board also considered these results in comparison to the performance
17
of the Category, as well as the Fund’s benchmark index. Morningstar determined the Category and Peer Group for the Fund. The Board reviewed with a representative of Morningstar the methodology used by Morningstar to select the funds in the Category and the Peer Group.
The Board noted that the Fund’s performance during the review periods ended December 31, 2005 was generally competitive with the performance of the Peer Group and Category medians, and its benchmark index, the 3 Month T-Bill. The Board also noted that the Fund’s more recent performance for the 1-, 3- and 5-year periods was lower than the performance of the Peer Group and Category medians and benchmark index. The Board indicated its intent to continue to monitor the Fund’s performance trends.
Investment advisory fee and sub-advisory fee rates and expenses
The Board reviewed and considered the contractual investment advisory fee rate payable by the Fund to the Adviser for investment advisory services (the “Advisory Agreement Rate”). The Board received and considered information comparing the Advisory Agreement Rate with the advisory fees for the Peer Group. The Board noted that the Advisory Agreement Rate was higher than the median rate of the Peer Group and Category.
The Board received and considered expense information regarding the Fund’s various components, including advisory fees, distribution and fees other than advisory and distribution fees, including transfer agent fees, custodian fees, and other miscellaneous fees (e.g., fees for accounting and legal services). The Board considered comparisons of these expenses to the Peer Group median. The Board also received and considered expense information regarding the Fund’s total operating expense ratio (“Gross Expense Ratio”) and total operating expense ratio after taking the fee waiver arrangement applicable to the Advisory Agreement Rate into account (“Net Expense Ratio”). The Board received and considered information comparing the Gross Expense Ratio and Net Expense Ratio of the Fund to that of the Peer Group and Category medians. The Board noted that the Fund’s Gross and Net Expense Ratios were higher than medians of the Peer Group and Category. The Board favorably considered the impact of continuing fee waivers towards ultimately lowering the Fund’s total operating expense ratio.
The Adviser also discussed the Morningstar data and rankings, and other relevant information, for the Fund. Based on the above-referenced considerations and other factors, the Board concluded that the Fund’s overall performance and expenses supported the re-approval of the Advisory Agreements.
The Board also received information about the investment sub-advisory fee rate (the “Sub-Advisory Agreement Rate”) payable by the Adviser to the Sub-Adviser for investment sub-advisory services. The Board concluded that the Sub-Advisory Agreement Rate was fair and equitable, based on its consideration of the factors described here.
Profitability
The Board received and considered a detailed profitability analysis of the Adviser based on the Advisory Agreements, as well as on other relationships between the Fund and the Adviser and its affiliates, including the Sub-Adviser. The Board concluded that, in light of the costs of providing investment management and other services to the Fund, the profits and other ancillary benefits reported by the Adviser were not unreasonable.
Economies of scale
The Board received and considered general information regarding economies of scale with respect to the management of the Fund, including the Fund’s ability to appropriately benefit from economies of scale under the Fund’s fee structure. The Board recognized the inherent limitations of any analysis of economies of scale, stemming largely from the Board’s understanding that most of the Adviser’s costs are not specific to individual Funds, but rather are incurred across a variety of products and services.
To the extent the Board and the Adviser were able to identify actual or potential economies of scale from Fund-specific or allocated expenses, in order to ensure that any such economies continue to be reasonably shared with the Fund
18
as its assets increase, the Adviser and the Board agreed to continue the existing breakpoints to the Advisory Agreement Rate.
Information about services to other clients
The Board also received information about the nature, extent and quality of services and fee rates offered by the Adviser and Sub-Adviser to their other clients, including other registered investment companies, institutional investors and separate accounts. The Board concluded that the Advisory Agreement Rate and the Sub-Advisory Agreement Rate were not unreasonable, taking into account fee rates offered to others by the Adviser and Sub-Adviser, respectively, after giving effect to differences in services.
Other benefits to the Adviser
The Board received information regarding potential “fall-out” or ancillary benefits received by the Adviser and its affiliates as a result of the Adviser’s relationship with the Fund. Such benefits could include, among others, benefits directly attributable to the relationship of the Adviser with the Fund and benefits potentially derived from an increase in the business of the Adviser as a result of its relationship with the Fund (such as the ability to market to shareholders other financial products offered by the Adviser and its affiliates).
The Board also considered the effectiveness of the Adviser’s, Sub-Adviser’s and Fund’s policies and procedures for complying with the requirements of the federal securities laws, including those relating to best execution of portfolio transactions and brokerage allocation.
Other factors and broader review
As discussed above, the Board reviewed detailed materials received from the Adviser and Sub-Adviser as part of the annual re-approval process. The Board also regularly reviews and assesses the quality of the services that the Fund receives throughout the year. In this regard, the Board reviews reports of the Adviser at least quarterly, which include, among other things, a detailed portfolio review, detailed fund performance reports and compliance reports. In addition, the Board meets with portfolio managers and senior investment officers at various times throughout the year.
After considering the above-described factors and based on its deliberations and its evaluation of the information described above, the Board concluded that approval of the continuation of the Advisory Agreements for the Fund was in the best interest of the Fund and its shareholders. Accordingly, the Board unanimously approved the continuation of the Advisory Agreements.
1 The Board previously considered information about the Sub-Advisory Agreement at the September and December 2005 Board meetings in connection with the Adviser’s reorganization.
19
For more information
The Fund’s proxy voting policies, procedures and records are available without charge, upon request:
| By phone | On the Fund’s Web site | On the SEC’s Web site |
| 1-800-225-5291 | www.jhfunds.com/proxy | www.sec.gov |
|
| |
| Trustees | Francis V. Knox, Jr. | Principal distributor |
| Ronald R. Dion, Chairman | Chief Compliance Officer | John Hancock Funds, LLC |
| James R. Boyle† | Gordon M. Shone | 601 Congress Street |
| James F. Carlin | Treasurer | Boston, MA 02210-2805 |
| Richard P. Chapman, Jr.* | John G. Vrysen | |
| William H. Cunningham | Chief Financial Officer | Custodian |
| Charles L. Ladner* | | The Bank of New York |
| Dr. John A. Moore* | | One Wall Street |
| Patti McGill Peterson* | Investment adviser | New York, NY 10286 |
| Steven R. Pruchansky | John Hancock Advisers, LLC | |
| 601 Congress Street | Transfer agent |
| *Members of the Audit Committee | Boston, MA 02210-2805 | John Hancock Signature |
| †Non-Independent Trustee | | Services, Inc. |
| | 1 John Hancock Way, |
| | Subadviser | Suite 1000 |
| Officers | MFC Global Investment | Boston, MA 02217-1000 |
| Keith F. Hartstein | Management (U.S.), LLC | |
| President and | 101 Huntington Avenue | |
| Chief Executive Officer | Boston, MA 02199 | Legal counsel |
| Thomas M. Kinzler | | Kirkpatrick & Lockhart |
| Secretary and | | Nicholson Graham LLP |
| Chief Legal Officer | | 1 Lincoln Street |
| | Boston, MA 02111-2950 |
The Fund’s investment objective, risks, charges and expenses are included in the prospectus and should be considered carefully before investing. For a prospectus, call your financial professional, call John Hancock Funds at 1-800-225-5291 or visit the Fund’s Web site at www.jhfunds.com. Please read the prospectus carefully before investing or sending money.
| How to contact us | |
|
| |
| Internet | www.jhfunds.com | |
|
| |
| Mail | Regular mail: | Express mail: |
| | John Hancock | John Hancock |
| | Signature Services, Inc. | Signature Services, Inc. |
| | 1 John Hancock Way, Suite 1000 | Mutual Fund Image Operations |
| | Boston, MA 02217-1000 | 380 Stuart Street |
| | | Boston, MA 02116 |
|
| |
| Phone | Customer service representatives | 1-800-225-5291 |
| | 24-hour automated information | 1-800-338-8080 |
| | TDD line | 1-800-554-6713 |
A listing of month-end portfolio holdings is available on our Web site, www.jhfunds.com. A more detailed portfolio holdings summary is available on a quarterly basis 60 days after the fiscal quarter on our Web site or upon request by calling 1-800-225-5291, or on the Securities and Exchange Commission’s Web site, www.sec.gov.
20
J O H N H A N C O C K F A M I L Y O F F U N D S
| EQUITY | INERNATIONAL |
| Balanced Fund | Greater China Opportunities Fund |
| Classic Value Fund | International Classic Value Fund |
| Classic Value Fund II | International Core Fund |
| Core Equity Fund | International Fund |
| Focused Equity Fund | International Growth Fund |
| Growth Fund | |
| Growth Opportunities Fund | INCOME |
| Growth Trends Fund | Bond Fund |
| Intrinsic Value Fund | Government Income Fund |
| Large Cap Equity Fund | High Yield Fund |
| Large Cap Select Fund | Investment Grade Bond Fund |
| Mid Cap Equity Fund | Strategic Income Fund |
| Mid Cap Growth Fund | |
| Multi Cap Growth Fund | TAX-FREE INCOME |
| Small Cap Equity Fund | California Tax-Free Income Fund |
| Small Cap Fund | High Yield Municipal Bond Fund |
| Small Cap Intrinsic Value Fund | Massachusetts Tax-Free Income Fund |
| Sovereign Investors Fund | New York Tax-Free Income Fund |
| U.S. Core Fund | Tax-Free Bond Fund |
| U.S. Global Leaders Growth Fund | |
| Value Opportunities Fund | MONEY MARKET |
| | Money Market Fund |
| ASSET ALLOCATION & LIFESTYLE | U.S. Government Cash Reserve |
| Allocation Core Portfolio | |
| Allocation Growth + Value Portfolio | CLOSED-END |
| Lifestyle Aggressive Portfolio | Bank & Thrift Opportunity |
| Lifestyle Balanced Portfolio | Financial Trends |
| Lifestyle Conservative Portfolio | Income Securities |
| Lifestyle Growth Portfolio | Investors Trust |
| Lifestyle Moderate Portfolio | Patriot Global Dividend |
| | Patriot Preferred Dividend |
| SECTOR | Patriot Premium Dividend I |
| Financial Industries Fund | Patriot Premium Dividend II |
| Health Sciences Fund | Patriot Select Dividend |
| Real Estate Fund | Preferred Income |
| Regional Bank Fund | Preferred Income II |
| Technology Fund | Preferred Income III |
| Technology Leaders Fund | Tax-Advantaged Dividend |
For more complete information on any John Hancock Fund and a prospectus, which includes charges and expenses, call your financial professional, or John Hancock Funds at 1-800-225-5291. Please read the prospectus carefully before investing or sending money.
PRESORTED
STANDARD
U.S. POSTAGE
PAID
MIS

1-800-225-5291
1-800-554-6713 (TDD)
1-800-338-8080 EASI-Line
www.jhfunds.com
Now available: electronic delivery
www.jhfunds.com/edelivery
This report is for the information of the shareholders of John Hancock U.S. Government Cash Reserve.
430SA 9/06
11/06


| TABLE OF CONTENTS |
|
| Your fund at a glance |
| page 1 |
|
| Managers’ report |
| page 2 |
|
| Your expensess |
| page 6 |
|
| Fund’s investments |
| page 8 |
|
| Financial statements |
| page 1 1 |
|
| For more information |
| page 2 4 |
|
CEO corner
To Our Shareholders,
The future has arrived at John Hancock Funds.
We have always been firm believers in the powerful role the Internet can play in providing fund information to our shareholders and prospective investors. Recently, we launched a redesigned, completely overhauled Web site that is more visually pleasing, easier to navigate and, most importantly, provides more fund information and learning tools without overwhelming the user.
Not long after we embarked on this major project, a study was released by the Investment Company Institute, the mutual fund industry’s main trade group, which found that an overwhelming majority of shareholders consider the Internet the “wave of the future” for accessing fund information.
Our new site sports fresher and faster ways to access account information. New innovations allow investors to view funds by risk level, track the performance of the John Hancock funds of their choice or sort funds by Morningstar, Inc.’s star ratings. Investors who own a John Hancock fund through a qualified retirement plan and don’t pay sales charges when making a purchase have the option of sorting by a “Load Waived” Morningstar Rating, thereby creating an apples-to-apples comparison with no-load funds that may also be available in their retirement plan.
The new site also has more educational tools and interactive modules to educate and assist investors with their financial goals, from college savings to retirement planning. A new “I want to…” feature allows investors to check performance, invest more money, update personal information or download prospectuses and forms quickly and easily.
In another of our ongoing efforts to provide our shareholders with top-notch service, we also redesigned our shareholder reports, as you may have noticed with this report. We hope the larger size, more colorful cover and redesigned presentation of the commentary and data tables will draw you in and make them easier to read.
After you’ve read your shareholder report, we encourage you to visit our new Web site — www.jhfunds.com — and take a tour. It’s easy, fast and fun and allows you to be in control of what you see and do. In short, it’s the wave of the future!
Sincerely,

Keith F. Hartstein,
President and Chief Executive Officer |
This commentary reflects the CEO’s views as of September 30, 2006. They are subject to change at any time.
Your fund at a glance
The Funds seeks the maximum current income that is consistent with maintaining liquidity and preserving capital. The Fund intends to maintain a stable $1 share price.
Over the last six months
► The Federal Reserve Board stopped raising interest rates after making 17 hikes since
June 2004.
► Money market yields still managed to rise, due to the two last hikes in May and June.
► The Fund adjusted to the new environment by lengthening its weighted average
maturity and cutting back on floating rate securities. |
1
Managers’ report
John Hancock
Money Market Fund |
Money market yields rose over the last six months ending September 30, 2006, but the period marked a significant milestone, as the Federal Reserve Board stopped raising interest rates after a two-year cycle of rate hikes. Many investors believed it marked the end of the tightening cycle. The Fed made two rate hikes at the Federal Open Market Committee (FOMC) meetings on May 10 and June 29, each time raising short-term rates 0.25%, as they had 15 other times since June 2004. At the end of June, the federal funds rate that banks charge each other for overnight loans stood at 5.25%, up from 1.00% when the Fed began its tightening cycle.
In a statement issued at the May FOMC meeting, the Fed signaled that the growth of the economy had been strong early on in the year, with first quarter gross domestic product (GDP) growth of 5.6% . The economy was buoyed by strong manufacturing productivity and solid job growth. Although rising energy prices such as gasoline, natural gas and crude oil had only a minor effect on core inflation, the Fed believed the potential for increased inflation loomed. By June, GDP growth had begun to moderate, with second quarter growth slowing to 2.6% . The Fed felt that this moderation in growth was due to a gradual slowdown in the housing market, which should help to keep inflation in check. As the period progressed and more economic data filtered into the market, it became evident that the economy was indeed moderating. The FOMC acknowledged this by leaving rates unchanged at the August and September FOMC meetings and signaled that a “cooling” housing market and the � 47;lagged” effects of past interest rate hikes still had to work their way through the market.
2
Portfolio Managers, MFC Global Investment Management (U.S.), LLC
David A. Bees and Michael V. Lorizio |
Fund yield and performance
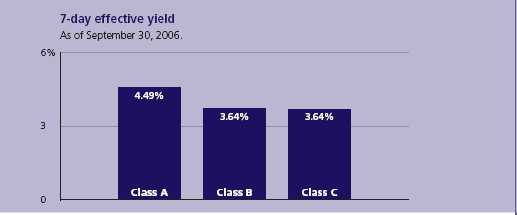
On September 30, 2006, John Hancock Money Market Fund’s Class A, Class B and Class C shares had 7-day effective yields of 4.49%, 3.64% and 3.64%, respectively. By comparison, the average taxable money market fund had a 7-day effective yield of 4.53%, according to Lipper, Inc.
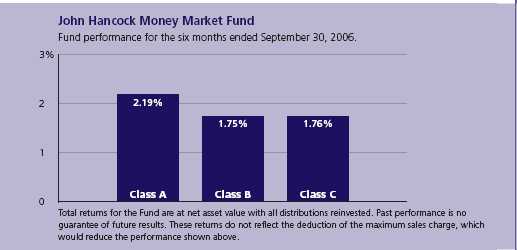
For the six months ended September 30, 2006, the Fund’s Class A, Class B and Class C shares posted total returns of 2.19%, 1.75% and 1.76%, respectively, at net asset value, compared with the 2.13% return of the average taxable money market fund, according to Lipper, Inc.1 Keep in mind that your net asset value return will be different from the Fund’s performance if you were not invested in the Fund for the entire period and did not reinvest all distributions.
“…the period marked a
significant milestone, as
the Federal Reserve Board
stopped raising interest
rates after a two-year cycle
of rate hikes.” |
Fund moves
As the semiannual period began in April, we began extending the weighted average maturity of the Fund in anticipation of the conclusion of the rate-tightening cycle. In April, the Fund’s weighted average maturity was significantly longer than the peer average. After it became apparent that the Fed planned on holding rates steady, we continued to extend the weighted average maturity of the Fund to lock in higher rates for a longer period of time. By the end of the period, the Fund’s weighted-average maturity remained longer than its peers.
Money Market Fund
3
In another key change to the structure of the portfolio, we reduced our allocation to floating rate securities with multiple resets left, since the potential for their reset rates to be higher had diminished. At the beginning of the period, 20% of the Fund’s assets were invested in floating rate securities. By the end of the period, our allocation to floating rate securities stood at 11%. All matured floating rate securities were invested in fixed-rate short-term corporate bonds. As cash surrogates, we invested in asset-backed commercial paper, commercial paper and carefully selected tier-two securities to provide additional yield for the Fund.
“We believe the Fed will
keep rates stable for the
foreseeable future. “ |
Outlook
We believe the Fed will keep rates stable for the foreseeable future. Future interest rate moves will largely depend on upcoming economic data. We believe the housing market will play an integral role in determining how stable the economy remains over the next year. For now, the data suggests a weakening in this tremendously large asset class. Existing home sales have declined 12.6% year over year through August and the national median home price has declined 1.7% year over year through August, according to the National Association of Realtors. This could have major implications for the strength of the economy, since this is the first time national median home prices have declined since April 1995.
| SECTOR DISTRIBUTION2 |
| |
| Financials | 83% |
| Government agencies | 6% |
| Consumer staples | 5% |
| Consumer discretionary | 2% |
| Information technology | 2% |
| Health care | 1% |
Energy commodity prices will also be a key driver of the economy. We have already started to see energy prices moderate, with crude oil declining about $10 per barrel over the course of September. This price decline should help alleviate some of the pain consumers have been feeling at the gas pump and should also help keep inflation concerns in check.
Money Market Fund
4
We will continue to monitor all economic data releases to help forecast the future state of the economy. With continued elevated energy costs and housing moderating nationally, we believe there is a possibility that GDP growth could remain weak, with growth somewhere between 1.5% and 3.0% through 2007. In fact, if the declining housing market spills over into other facets of the economy, we may even see interest rates reverse course and come down in order to alleviate strains on the economy.
This commentary reflects the views of the portfolio management team through the end of the Fund’s period discussed in this report. The team’s statements reflect their own opinions. As such, they are in no way guarantees of future events and are not intended to be used as investment advice or a recommendation regarding any specific security. They are also subject to change at any time as market and other conditions warrant.
The Fund is neither insured nor guaranteed by the U.S. government. Although the Fund seeks to maintain a net asset value of $1.00 per share, it is possible to lose money by investing in the Fund.
1 Figures from Lipper, Inc. include reinvested dividends and do not take into account sales charges. Actual load-adjusted performance is lower.
2 As a percentage of net assets on September 30, 2006.

Money Market Fund
5
Your expenses
These examples are intended to help you understand your ongoing operating expenses.
Understanding fund expenses
As a shareholder of the Fund, you incur two types of costs:
▪ Transaction costs which include sales charges (loads) on purchases or redemptions (varies by share class), minimum account fee charge, etc.
▪ Ongoing operating expenses including management fees, distribution and service fees (if applicable) and other fund expenses.
We are going to present only your ongoing operating expenses here.
Actual expenses/actual returns
This example is intended to provide information about your fund’s actual ongoing operating expenses, and is based on your fund’s actual return. It assumes an account value of $1,000.00 on April 1, 2006, with the same investment held until September 30, 2006.
| | Account value | Ending value | Expenses paid during period |
| | on 4-1-06 | on 9-30-06 | ended 9-30-061 |
|
| Class A | $1,000.00 | $1,021.90 | $4.14 |
|
| Class B | 1,000.00 | 1,017.50 | 8.47 |
|
| Class C | 1,000.00 | 1,017.60 | 8.47 |
|
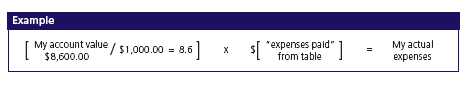
Together with the value of your account, you may use this information to estimate the operating expenses that you paid over the period. Simply divide your account value at September 30, 2006 by $1,000.00, then multiply it by the “expenses paid” for your share class from the table above. For example, for an account value of $8,600.00, the operating expenses should be calculated as follows:
Money Market Fund
6
Hypothetical example for comparison purposes
This table allows you to compare your fund’s ongoing operating expenses with those of any other fund. It provides an example of the Fund’s hypothetical account values and hypothetical expenses based on each class’s actual expense ratio and an assumed 5% annual return before expenses (which is not your fund’s actual return). It assumes an account value of $1,000.00 on April 1, 2006, with the same investment held until September 30, 2006. Look in any other fund shareholder report to find its hypothetical example and you will be able to compare these expenses.
| | Account value | Ending value | Expenses paid during period |
| | on 4-1-06 | on 9-30-06 | ended 9-30-061 |
|
| Class A | $1,000.00 | $1,021.00 | $4.14 |
|
| Class B | 1,000.00 | 1,016.70 | 8.47 |
|
| Class C | 1,000.00 | 1,016.70 | 8.47 |
|
Remember, these examples do not include any transaction costs, such as sales charges; therefore, these examples will not help you to determine the relative total costs of owning different funds. If transaction costs were included, your expenses would have been higher. See the prospectus for details regarding transaction costs.
1 Expenses are equal to the Fund's annualized expense ratio of 0.83%, 1.68% and 1.68% for Class A, Class B and Class C, respectively, multiplied by the average account value over the period, multiplied by number of days in most recent fiscal half-year/365 or 366 (to reflect the one-half year period).
Money Market Fund
7
F I N A N C I A L S T A T E M E N T S
Fund’s investments
Securities owned by the Fund on 9-30-06 (unaudited)
This schedule is divided into four categories: commercial paper, corporate interest-
bearing obligations, U.S. government obligations and joint repurchase agreement.
Commercial paper, corporate interest-bearing obligations and U.S. government
obligations are further broken down by industry group.
| | Interest | Maturity | Credit | Par value | |
| Issuer | rate | date | rating (A) | (000) | Value |
|
| Commercial paper 38.45% | | | | | $88,557,969 |
| (Cost $88,557,969) | | | | | |
Asset Backed — Auto Loan 4.98% | | | | 11,463,034 |
|
| Galleon Capital LLC (K) | 5.260% | 10-23-06 | Tier 1 | $11,500 | 11,463,034 |
Asset Backed — Finance 5.02% | | | | 11,571,187 |
|
| Falcon Asset Securitization (K) | 5.260 | 10-18-06 | Tier 1 | 11,600 | 11,571,187 |
Asset Backed — Others 4.98% | | | | 11,474,844 |
|
| Old Line Funding LLC (K) | 5.250 | 10-16-06 | Tier 1 | 11,500 | 11,474,844 |
Asset Backed — Trade Receivables 4.97% | | | | 11,457,993 |
|
| Clipper Receivables Corp. (K) | 5.260 | 10-26-06 | Tier 1 | 11,500 | 11,457,993 |
Automobiles & Trucks 1.95% | | | | 4,496,251 |
|
| DaimlerChrysler North America | | | | | |
| Holdings Corp. | 5.350 | 10-11-06 | Tier 2 | 2,300 | 2,296,582 |
|
| Volkswagen AG | 5.420 | 10-02-06 | Tier 2 | 2,200 | 2,199,669 |
Banks — Foreign 5.03% | | | | | 11,594,925 |
|
| Deutsche Bank AG | 5.250 | 10-04-06 | Tier 1 | 11,600 | 11,594,925 |
Food 4.77% | | | | | 10,995,169 |
|
| Cargill, Inc. | 5.270 | 10-04-06 | Tier 1 | 11,000 | 10,995,169 |
Medical — Health Maintenance Organization 1.00% | | | 2,296,941 |
|
| Wellpoint Health Networks | 5.320 | 10-10-06 | Tier 2 | 2,300 | 2,296,941 |
Money Center Banks 4.78% | | | | 10,998,368 |
|
| Swiss Bank Corp. | 5.340 | 10-02-06 | Tier 1 | 11,000 | 10,998,368 |
Multimedia 0.33% | | | | | 747,460 |
|
| Walt Disney Co. (The) | 5.300 | 10-24-06 | Tier 2 | 750 | 747,460 |
Retail Stores 0.64% | | | | | 1,461,797 |
|
| CVS Corp. | 5.320 | 10-25-06 | Tier 2 | 1,467 | 1,461,797 |
See notes to financial statements
Money Market Fund
8
F I N A N C I A L S T A T E M E N T S
| | Interest | Maturity | Credit | Par value | |
| Issuer | rate | date | rating (A) | (000) | Value |
|
| Corporate interest-bearing obligations 54.57% | | | | $125,702,581 |
| (Cost $125,702,581) | | | | | |
Banks — U.S. 6.61% | | | | | 15,222,194 |
|
| FleetBoston Financial Corp. | 8.625% | 01-15-07 | Tier 1 | $5,580 | 5,638,315 |
|
| FleetBoston Financial Corp. | 4.875 | 12-01-06 | Tier 1 | 3,000 | 2,997,673 |
|
| HSBC Bank USA (P) | 5.410 | 12-14-06 | Tier 1 | 1,100 | 1,100,017 |
|
| KeyCorp | 2.750 | 02-27-07 | Tier 1 | 3,500 | 3,461,778 |
|
| US Bank NA | 2.850 | 11-15-06 | Tier 1 | 2,031 | 2,024,411 |
Computers 1.08% | | | | | 2,494,051 |
|
| IBM Corp. | 2.375 | 11-01-06 | Tier 1 | 2,500 | 2,494,051 |
Diversified Financial Services 6.15% | | | | | 14,175,779 |
|
| Citigroup Global Markets | | | | | |
| Holdings, Inc. (P) | 5.500 | 12-12-06 | Tier 1 | 1,350 | 1,350,387 |
|
| Citigroup, Inc. (S) | 5.000 | 03-06-07 | Tier 1 | 1,527 | 1,524,445 |
|
| General Electric Capital Corp. (P) | 5.390 | 12-08-06 | Tier 1 | 11,300 | 11,300,947 |
Finance 4.52% | | | | | 10,401,295 |
|
| CoreStates Capital Corp. | 6.750 | 11-15-06 | Tier 1 | 7,390 | 7,400,642 |
|
| Principal Life Global Funding (P) | 5.542 | 11-13-06 | Tier 1 | 3,000 | 3,000,653 |
Finance — Auto Loans 4.89% | | | | | 11,254,906 |
|
| American Honda Finance Corp. (P) (S) | 5.510 | 03-08-07 | Tier 1 | 6,250 | 6,254,136 |
|
| American Honda Finance Corp. (P) (S) | 5.439 | 11-22-06 | Tier 1 | 5,000 | 5,000,770 |
Finance — Commercial 2.30% | | | | | 5,300,424 |
|
| CIT Group, Inc. | 7.375 | 04-02-07 | Tier 1 | 5,250 | 5,300,424 |
Finance — Consumer Loans 8.81% | | | | | 20,299,728 |
|
| American General Finance Corp. | 3.000 | 11-15-06 | Tier 1 | 9,305 | 9,283,732 |
|
| HSBC Finance Corp. | 5.750 | 01-30-07 | Tier 1 | 10,993 | 11,015,996 |
Finance — Credit Card 2.82% | | | | | 6,500,652 |
|
| American Express Bank FSB (P) | 5.360 | 11-22-06 | Tier 1 | 6,500 | 6,500,652 |
Finance — Mortgages 5.01% | | | | | 11,546,311 |
|
| Countrywide Financial Corp. (P) | 5.471 | 12-05-06 | Tier 1 | 1,300 | 1,300,144 |
|
| Countrywide Home Loan, Inc. | 5.500 | 02-01-07 | Tier 1 | 10,250 | 10,246,167 |
Insurance 0.87% | | | | | 1,997,542 |
|
| AIG, Inc. (S) | 5.100 | 01-17-07 | Tier 1 | 2,000 | 1,997,542 |
Investment Banking & Brokerage 11.51% | | | | 26,509,699 |
|
| Bear Stearns Cos., Inc. (P) | 5.667 | 01-16-07 | Tier 1 | 5,000 | 5,002,571 |
|
| Goldman Sachs Group, Inc. (P) | 5.660 | 10-27-06 | Tier 1 | 12,500 | 12,501,408 |
|
| Merrill Lynch & Co., Inc. (P) | 5.525 | 02-27-07 | Tier 1 | 9,000 | 9,005,720 |
See notes to financial statements
Money Market Fund
9
F I N A N C I A L S T A T E M E N T S
| | Interest | Maturity | Credit | Par value | |
| Issuer | rate | date | rating (A) | (000) | Value |
|
| U.S. government obligations 5.50% | | | | | $12,670,360 |
| (Cost $12,670,360) | | | | | |
Government U.S. Agency 5.50% | | | | | 12,670,360 |
|
| Federal Home Loan Bank | 5.580% | 08-14-07 | Tier 1 | $7,625 | 7,625,000 |
|
| Federal Home Loan Bank | 5.550 | 08-21-07 | Tier 1 | 1,545 | 1,545,360 |
|
| Federal Home Loan Bank | 5.250 | 10-22-07 | Tier 1 | 3,500 | 3,500,000 |
| |
| | | | Interest | Par value | |
| Issuer, description, maturity date | | | rate | (000) | Value |
|
| Joint repurchase agreement 0.93% | | | | | $2,138,000 |
| (Cost $2,138,000) | | | | | |
|
| Investment in a joint repurchase agreement transaction with | | | |
| Cantor Fitzgerald, LP — Dated 9-29-06 due 10-2-06 (secured | | | |
| by U.S. Treasury Bond 8.125% due 8-15-19, U.S. Treasury | | | |
| Inflation Indexed Bond 2.000% due 1-15-26 and U.S. Treasury | | | |
| Inflation Indexed Notes 1.875% due 7-15-13, 2.000% due | | | |
| 1-15-16 and 3.000% due 7-15-12) | | | 5.100% | $2,138 | 2,138,000 |
|
| Total investments (cost $229,068,910) 99.45% | | | | $229,068,910 |
|
| Other assets and liabilities, net 0.55% | | | | $1,261,130 |
|
| Total net assets 100.00% | | | | | $230,330,040 |
(A) Quality ratings are unaudited and indicate the categories of eligible securities, as defined by Rule 2a-7 of the Investment Company Act of 1940, owned by the Fund.
(K) Direct placement securities are restricted to resale. They have been fair valued in accordance with procedures approved by the Trustees after consideration of restrictions as to resale, financial condition and prospects of the issuer, general market conditions and pertinent information in accordance with the Fund’s bylaws and the Investment Company Act of 1940, as amended. The Fund has limited rights to registration under the Securities Act of 1933 with respect to these restricted securities. Additional information on these securities is as follows:
| | | | Value as a | |
| | | | percentage | |
| | Acquisition | Acquisition | of Fund's | Value as of |
| Issuer, description | date | cost | net assets | September 30, 2006 |
|
| Clipper Receivables Corp. | | | | |
| – Commercial paper | 09-25-06 | $11,447,911 | 4.97% | $11,457,993 |
| Falcon Asset Securitization | | | | |
| – Commercial paper | 09-20-06 | 11,552,543 | 5.02 | 11,571,187 |
| Galleon Capital LLC | | | | |
| – Commercial paper | 09-22-06 | 11,447,911 | 4.98 | 11,463,034 |
| Old Line Funding LLC | | | | |
| – Commercial paper | 09-11-06 | 11,441,302 | 4.98 | 11,474,844 |
(P) Represents rate in effect on September 30, 2006.
(S) These securities are exempt from registration under Rule 144A of the Securities Act of 1933. Such securities may be resold, normally to qualified institutional buyers, in transactions exempt from registration. Rule 144A securities amounted to $14,776,893 or 6.42% of the Fund’s net assets as of September 30, 2006.
The percentage shown for each investment category is the total value of that category as a percentage of the net assets of the Fund.
See notes to financial statements
Money Market Fund
10
F I N A N C I A L S T A T E M E N T S
Financial statements
Statement of assets and liabilities 9-30-06 (unaudited)
This Statement of Assets and Liabilities is the Fund’s balance sheet. It shows the value of what the Fund owns, is due and owes. You’ll also find the net asset value per share.
| Assets | |
|
| Investments at value (cost $229,068,910) | $229,068,910 |
| Cash | 50 |
| Receivable for shares sold | 600,416 |
| Interest receivable | 1,358,033 |
| Other assets | 74,969 |
| Total assets | 231,102,378 |
|
| Liabilities | |
|
| Payable for shares repurchased | 482,507 |
| Dividends payable | 58,383 |
| Payable to affiliates | |
| Management fees | 82,001 |
| Distribution and service fees | 9,268 |
| Other | 19,134 |
| Other payables and accrued expenses | 121,045 |
| Total liabilities | 772,338 |
|
| Net assets | |
|
| Capital paid-in | 230,319,790 |
| Accumulated net realized loss on investments | (1,238) |
| Accumulated net investment income | 11,488 |
| Net assets | $230,330,040 |
|
| Net asset value per share | |
|
| Based on net asset values and shares outstanding — the Fund has an | |
| unlimited number of shares authorized with no par value | |
| Class A ($191,014,187 ÷ 191,096,381 shares) | $1.00 |
| Class B ($31,647,369 ÷ 31,667,671 shares) | $1.00 |
| Class C ($7,668,484 ÷ 7,668,745 shares) | $1.00 |
See notes to financial statements
Money Market Fund
11
F I N A N C I A L S T A T E M E N T S
Statement of operations For the period ended 9-30-061 (unaudited).
This Statement of Operations summarizes the Fund’s investment income earned
and expenses incurred in operating the Fund. It also shows net gains (losses) for
the period stated.
| Investment income | |
|
| Interest | $6,099,363 |
| Dividends | 5,840 |
| Total investment income | 6,105,203 |
|
| Expenses | |
|
| Investment management fees (Note 2) | 591,309 |
| Class A distribution and service fees (Note 2) | 241,775 |
| Class B distribution and service fees (Note 2) | 175,162 |
| Class C distribution and service fees (Note 2) | 40,357 |
| Transfer agent fees (Note 2) | 233,236 |
| Accounting and legal services fees (Note 2) | 16,967 |
| Compliance fees | 2,433 |
| Registration and filing fees | 28,115 |
| Custodian fees | 18,689 |
| Printing | 14,425 |
| Professional fees | 9,861 |
| Trustees’ fees | 5,972 |
| Interest | 307 |
| Miscellaneous | 3,767 |
Total expenses | 1,382,375 |
| Less expense reductions (Note 2) | (221,378) |
Net expenses | 1,160,997 |
Net investment income | 4,944,206 |
| Net realized loss on investments | (45) |
Increase in net assets from operations | $4,944,161 |
1 Semiannual period from 4-1-06 through 9-30-06.
See notes to financial statements
Money Market Fund
12
F I N A N C I A L S T A T E M E N T S
Statement of changes in net assets
These Statements of Changes in Net Assets show how the value of the Fund’s net assets
has changed during the last two periods. The difference reflects earnings less expenses,
any investment gains and losses, distributions, if any, paid to shareholders and the net of
Fund share transactions.
| | Year | Period |
| | ended | ended |
| | 3-31-06 | 9-30-061 |
|
| Increase (decrease) in net assets | | |
|
| From operations | | |
| Net investment income | $6,650,432 | $4,944,206 |
| Net realized loss | (2) | (45) |
Increase in net assets resulting from operations | 6,650,430 | 4,944,161 |
Distributions to shareholders | | |
| From net investment income | | |
| Class A | (5,575,570) | (4,192,417) |
| Class B | (928,523) | (609,412) |
| Class C | (146,339) | (142,377) |
| | (6,650,432) | (4,944,206) |
| From Fund share transactions | (74,863,392) | 5,623,714 |
|
| Net assets | | |
|
| Beginning of period | 299,569,765 | 224,706,371 |
| End of period2 | $224,706,371 | $230,330,040 |
1 Semiannual period from 4-1-06 through 9-30-06. Unaudited.
2 Includes accumulated net investment income of $11,488 and $11,488, respectively.
See notes to financial statements
Money Market Fund
13
F I N A N C I A L S T A T E M E N T S
Financial highlights
The Financial highlights show how the Fund’s net asset value for a share has changed since the end of the previous period.
| CLASS A SHARES | | | | | | |
| |
| Period ended | 3-31-021 | 3-31-031 | 3-31-041 | 3-31-051 | 3-31-06 | 9-30-062 |
|
| Per share operating performance | | | | | | |
|
| Net asset value, | | | | | | |
| beginning of period | $1.00 | $1.00 | $1.00 | $1.00 | $1.00 | $1.00 |
| Net investment income3 | 0.02 | 0.01 | —4 | 0.01 | 0.03 | 0.02 |
| Less distributions | | | | | | |
| From net investment income | (0.02) | (0.01) | —4 | (0.01) | (0.03) | (0.02) |
| Net asset value, end of period | $1.00 | $1.00 | $1.00 | $1.00 | $1.00 | $1.00 |
| Total return5,6 (%) | 2.41 | 0.75 | 0.21 | 0.86 | 2.92 | 2.197 |
|
| Ratios and supplemental data | | | | | | |
|
| Net assets, end of period | | | | | | |
| (in millions) | $264 | $271 | $211 | $224 | $185 | $191 |
| Ratio of net expenses | | | | | | |
| to average net assets (%) | 0.90 | 0.94 | 0.94 | 0.88 | 0.91 | 0.838 |
| Ratio of gross expenses | | | | | | |
| to average net assets9 (%) | 1.10 | 1.14 | 1.14 | 1.09 | 1.11 | 1.038 |
| Ratio of net investment income | | | | | | |
| to average net assets (%) | 2.40 | 0.75 | 0.21 | 0.83 | 2.85 | 4.348 |
See notes to financial statements
Money Market Fund
14
F I N A N C I A L S T A T E M E N T S
Financial highlights
| CLASS B SHARES | | | | | | |
| |
| Period ended | 3-31-021 | 3-31-031 | 3-31-041 | 3-31-051 | 3-31-06 | 9-30-062 |
|
| Per share operating performance | | | | | | |
|
| Net asset value, | | | | | | |
| beginning of period | $1.00 | $1.00 | $1.00 | $1.00 | $1.00 | $1.00 |
| Net investment income3 | 0.02 | —4 | —4 | —4 | 0.02 | 0.02 |
| Less distributions | | | | | | |
| From net investment income | (0.02) | —4 | —4 | —4 | (0.02) | (0.02) |
| Net asset value, end of period | $1.00 | $1.00 | $1.00 | $1.00 | $1.00 | $1.00 |
| Total return5,6 (%) | 1.55 | 0.10 | 0.12 | 0.50 | 2.05 | 1.757 |
|
| Ratios and supplemental data | | | | | | |
|
| Net assets, end of period | | | | | | |
| (in millions) | $142 | $166 | $89 | $63 | $36 | $32 |
| Ratio of net expenses | | | | | | |
| to average net assets (%) | 1.75 | 1.59 | 1.04 | 1.20 | 1.76 | 1.688 |
| Ratio of gross expenses | | | | | | |
| to average net assets9 (%) | 1.85 | 1.89 | 1.89 | 1.85 | 1.86 | 1.788 |
| Ratio of net investment income | | | | | | |
| to average net assets (%) | 1.52 | 0.10 | 0.12 | 0.46 | 1.94 | 3.488 |
See notes to financial statements
Money Market Fund
15
F I N A N C I A L S T A T E M E N T S
Financial highlights
| CLASS C SHARES | | | | | | |
| |
| Period ended | 3-31-021 | 3-31-031 | 3-31-041 | 3-31-051 | 3-31-06 | 9-30-062 |
|
| Per share operating performance | | | | | | |
|
| Net asset value, | | | | | | |
| beginning of period | $1.00 | $1.00 | $1.00 | $1.00 | $1.00 | $1.00 |
| Net investment income3 | 0.02 | —4 | —4 | —4 | 0.02 | 0.02 |
| Less distributions | | | | | | |
| From net investment income | (0.02) | —4 | —4 | —4 | (0.02) | (0.02) |
| Net asset value, end of period | $1.00 | $1.00 | $1.00 | $1.00 | $1.00 | $1.00 |
| Total return5,6 (%) | 1.55 | 0.11 | 0.12 | 0.50 | 2.04 | 1.767 |
|
| Ratios and supplemental data | | | | | | |
| Net assets, end of period | | | | | | |
| (in millions) | $16 | $18 | $12 | $13 | $4 | $8 |
| Ratio of net expenses | | | | | | |
| to average net assets (%) | 1.75 | 1.61 | 1.04 | 1.19 | 1.75 | 1.688 |
| Ratio of gross expenses | | | | | | |
| to average net assets9 (%) | 1.85 | 1.88 | 1.89 | 1.84 | 1.85 | 1.788 |
| Ratio of net investment income | | | | | | |
| to average net assets (%) | 1.46 | 0.10 | 0.12 | 0.46 | 1.86 | 3.538 |
1 Audited by previous auditor.
2 Semiannual period from 4-1-06 through 9-30-06. Unaudited. 3 Based on the average of the shares outstanding.
4 Less than $0.01 per share.
5 Assumes dividend reinvestment and does not reflect the effect of sales charges.
6 Total returns would have been lower had certain expenses not been reduced during the periods shown.
7 Not annualized.
8 Annualized.
9 Does not take into consideration expense reductions during the periods shown.
See notes to financial statements
Money Market Fund
16
Notes to financial statements (unaudited)
Note 1
Accounting policies |
John Hancock Money Market Fund (the “Fund”) is a diversified series of John Hancock Current Interest (the “Trust”), an open-end management investment company registered under the Investment Company Act of 1940, as amended. The investment objective of the Fund is to seek the maximum current income that is consistent with maintaining liquidity and preserving capital.
The Trustees have authorized the issuance of multiple classes of shares of the Fund, designated as Class A, Class B and Class C shares. The shares of each class represent an interest in the same portfolio of investments of the Fund and have equal rights as to voting, redemptions, dividends and liquidation, except that certain expenses, subject to the approval of the Trustees, may be applied differently to each class of shares in accordance with current regulations of the Securities and Exchange Commission and the Internal Revenue Service. Shareholders of a class that bears distribution and service expenses under the terms of a distribution plan have exclusive voting rights to that distribution plan. Class B shares will convert to Class A shares eight years after purchase.
Significant accounting policies of the Fund
are as follows: |
Valuation of investments
Securities in the Fund’s portfolio are valued at amortized cost, in accordance with Rule 2a-7 of the Investment Company Act of 1940, as amended (the “1940 Act”), which approximates market value. The amortized cost method involves valuing a security at its cost on the date of purchase and thereafter assuming a constant amortization to maturity of the difference between the principal amount due at maturity and the cost of the security to the Fund. Interest income on certain portfolio securities such as negotiable bank certificates of deposit and interest-bearing notes is accrued daily and included in interest receivable.
Joint repurchase agreement
Pursuant to an exemptive order issued by the Securities and Exchange Commission, the Fund, along with other registered investment companies having a management contract with John Hancock Advisers, LLC (the “Adviser”), a wholly owned subsidiary of John Hancock Financial Services, Inc., a subsidiary of Manulife Financial Corporation (“MFC”), may participate in a joint repurchase agreement transaction. Aggregate cash balances are invested in one or more large repurchase agreements, whose underlying securities are obligations of the U.S. government and/or its agencies. The Fund’s custodian bank receives delivery of the underlying securities for the joint account on the Fund’s behalf. The Adviser is responsible for ensuring that the agreement is fully collateralized at all times.
Investment transactions
Investment transactions are recorded as of the date of purchase, sale or maturity. Net realized gains and losses on sales of investments are determined on the identified cost basis.
Class allocations
Income, common expenses and realized and unrealized gains (losses) are determined at the fund level and allocated daily to each class of shares based on the appropriate net asset value of the respective classes. Distribution and service fees, if any, are calculated daily at the class level based on the appropriate net asset value of each class and the specific expense rate(s) applicable to each class.
Expenses
The majority of expenses are directly identifiable to an individual fund. Expenses that are not readily identifiable to a specific fund are allocated in such a manner as deemed equitable, taking into consideration, among
Money Market Fund
17
other things, the nature and type of expense and the relative size of the funds.
Federal income taxes
The Fund qualifies as a “regulated investment company” by complying with the applicable provisions of the Internal Revenue Code and will not be subject to federal income tax on taxable income that is distributed to shareholders. Therefore, no federal income tax provision is required. For federal income tax purposes, the Fund has $1,191 of a capital loss carryforward available, to the extent provided by regulations, to offset future net realized capital gains. To the extent that such carryforward is used by the Fund, no capital gain distributions will be made. The entire loss carryforward expires on March 31, 2012.
New accounting pronouncements
In June 2006, Financial Accounting Standards Board (FASB) Interpretation No. 48, Accounting for Uncertainty in Income Taxes (the “Interpretation”) was issued, and is effective for fiscal years beginning after December 15, 2006 and is to be applied to all open tax years as of the effective date. The Interpretation prescribes a minimum threshold for financial statement recognition of the benefit of a tax position taken or expected to be taken in a tax return, and requires certain expanded disclosures. Management is currently evaluating the application of the Interpretation to the Fund, and has not at this time quantified the impact, if any, resulting from the adoption of the Interpretation on the Fund’s financial statements.
In September 2006, FASB Standard No. 157, Fair Value Measurements (the “FAS 157”) was issued, and is effective for fiscal years beginning after November 15, 2007. FAS 157 defines fair value, establishing a framework for measuring fair value and expands disclosure about fair value measurements. Management is currently evaluating the application of FAS 157 to the Fund, and its impact, if any, resulting from the adoption of FAS 157 on the Fund’s financial statements.
Distributions
The Fund’s net investment income is declared daily as dividends to shareholders of record as of the close of business on the preceding day, and distributed monthly.
During the year ended March 31, 2006, the tax character of distributions paid was as follows: ordinary income $6,650,432. Distributions paid by the Fund with respect to each class of shares are calculated in the same manner, at the same time and are in the same amount, except for the effect of expenses that may be applied differently to each class.
Such distributions, on a tax basis, are determined in conformity with income tax regulations, which may differ from accounting principles generally accepted in the United States of America. Distributions in excess of tax basis earnings and profits, if any, are reported in the Fund’s financial statements as a return of capital.
Use of estimates
The preparation of these financial statements, in accordance with accounting principles generally accepted in the United States of America, incorporates estimates made by management in determining the reported amount of assets, liabilities, revenues and expenses of the Fund. Actual results could differ from these estimates.
Note 2
Management fee and transactions with
affiliates and others |
The Fund has an investment management contract with the Adviser. Under the investment management contract, the Fund pays a monthly management fee to the Adviser equivalent, on an annual basis, to the sum of: (a) 0.50% of the first $500,000,000 of the Fund’s average daily net asset value, (b) 0.425% of the next $250,000,000, (c) 0.375% of the next $250,000,000, (d) 0.35% of the next $500,000,000, (e) 0.325% of the next $500,000,000, (f) 0.30% of the next $500,000,000 and (g) 0.275% of the Fund’s average daily net asset value in excess of $2,500,000,000.
Money Market Fund
18
The Adviser has agreed to limit the Fund’s management fee to 0.40% of the Fund’s first $750,000,000 average daily net asset value, at least until July 31, 2007. The management fee cannot be restated to the original contracted amounts without the Trustees’ consent. Accordingly, the expense reductions related to management fee limitation amounted to $118,262 for the period ended September 30, 2006.
Effective December 31, 2005, the investment management teams of the Adviser were reorganized into Sovereign Asset Management LLC (“Sovereign”), a wholly owned indirect subsidiary of John Hancock Life Insurance Company (“JHLICO”), a subsidiary of MFC. The Adviser remains the principal advisor on the Fund and Sovereign acts as sub-adviser under the supervision of the Adviser. The restructuring did not have an impact on the Fund, which continues to be managed using the same investment philosophy and process. The Fund will not be responsible for payment of the subadvisory fees.
Effective October 1, 2006 the Sovereign changed its name to MFC Global Investment Management (U.S.), LLC.
The Fund has a Distribution Agreement with John Hancock Funds, LLC (“JH Funds”), a wholly owned subsidiary of the Adviser. The Fund has adopted Distribution Plans with respect to Class A, Class B and Class C, pursuant to Rule 12b-1 under the 1940 Act, as amended, to reimburse JH Funds for the services it provides as distributor of shares of the Fund. Accordingly, the Fund makes monthly payments to JH Funds at an annual rate not to exceed 0.25% of Class A average daily net asset value and 1.00% of Class B and Class C average daily net asset value. JH Funds has agreed to contractually limit the distribution and service fees (“12b-1”) for Class A to 0.15% of the Class A average daily net asset value, at least until July 31, 2007. Accordingly, the expense reductions related to the reduction in the 12b-1 fees amounted to $96,710 for Class A, for the period ended September 30, 2006. A maximum of 0.25% of such payments may be service fees, as defined by the Conduct Rules of the National Association of Securities Dealers.
Under the Conduct Rules, curtailment of a portion of the Fund’s 12b-1 payments could occur under certain circumstances.
Class A shares are assessed up-front sales charges. During the period ended September 30, 2006, JH Funds received net up-front sales charges of $5 with regard to sales of Class A shares. This amount was paid as sales commissions to unrelated broker-dealers.
Class B shares that are redeemed within six years of purchase are subject to a contingent deferred sales charge (“CDSC”) at declining rates, beginning at 5.00% of the lesser of the current market value at the time of redemption or the original purchase cost of the shares being redeemed. Class C shares that are redeemed within one year of purchase are subject to a CDSC at a rate of 1.00% of the lesser of the current market value at the time of redemption or the original purchase cost of the shares being redeemed. Proceeds from the CDSCs are paid to JH Funds and are used, in whole or in part, to defray its expenses for providing distribution-related services to the Fund in connection with the sale of Class B and Class C shares. During the period ended September 30, 2006, CDSCs received by JH Funds amounted to $77,327 for Class B shares. JH Funds received no CDSCs with regard to Class C shares.
The Fund has a transfer agent agreement with John Hancock Signature Services, Inc. (“Signature Services”), an indirect subsidiary of (JHLICO). The Fund pays a monthly transfer agent fee at an annual rate of 0.01% of each class’s average daily net asset value, plus a fee based on the number of shareholder accounts and reimbursement for certain out-of-pocket expenses, aggregated and allocated to each class on the basis of its relative net asset value. Signature Services agreed to voluntarily reduce the Fund’s asset-based portion of the transfer agent fee if the total transfer agent fee exceeded the median transfer agency fee for comparable mutual funds by greater than 0.05% . Accordingly, the transfer agent expense for Class A, Class B and Class C shares was reduced by $6,406 during the period ended September 30, 2006. Signature Services terminated this agreement June 30, 2006.
Money Market Fund
19
The Fund has an agreement with the Adviser and affiliates to perform necessary tax, accounting and legal services for the Fund. The compensation for the period amounted to $16,967. The Fund also paid the Adviser the amount of $66 for certain publishing services, included in the printing fees. The Fund reimbursed JHLICO for certain compliance costs, included in the Fund’s Statement of Operations.
Mr. James R. Boyle is Chairman of the Adviser, as well as an affiliated Trustee of the Fund, and is compensated by the Adviser and/or its affiliates. The compensation of unaffiliated Trustees is borne by the Fund. The unaffiliated Trustees may elect to defer, for tax purposes, their receipt of this compensation under the John Hancock Group of Funds Deferred Compensation Plan. The Fund makes investments into other John Hancock funds, as applicable, to cover its liability for the deferred compensation. Investments to cover the Fund’s deferred compensation liability are recorded on the Fund’s books as an other asset. The deferred compensation liability and the related other asset are always equal and are marked to market on a periodic basis to reflect any income earned by the investments, as well as any unrealized gains or losses. The Deferred Compensation Plan investments had no impact on the operations of the Fund.
Note 3
Fund share transactions |
This listing illustrates the number of Fund shares sold, reinvested and repurchased during the last two periods, along with the corresponding dollar value. Analysis of Fund share transactions is reported at $1 per share.
| | Year ended | Period ended |
| | 3-31-06 | 9-30-061 |
|
| Class A shares | | |
|
| Sold | $127,681,502 | $87,944,971 |
| Distributions reinvested | 5,328,508 | 3,929,898 |
| Repurchased | (172,041,882) | (85,690,096) |
| Net increase (decrease) | ($39,031,872) | $6,184,773 |
|
|
| Class B shares | | |
|
| Sold | $27,389,350 | $15,022,030 |
| Distributions reinvested | 815,743 | 547,383 |
| Repurchased | (55,432,211) | (19,688,350) |
| Net decrease | ($27,227,118) | ($4,118,937) |
|
| |
| Class C shares | | |
|
| Sold | $13,974,382 | $11,076,973 |
| Distributions reinvested | 124,618 | 131,576 |
| Repurchased | (22,703,402) | (7,650,671) |
| Net increase (decrease) | ($8,604,402) | $3,557,878 |
|
| |
| Net increase (decrease) | ($74,863,392) | $5,623,714 |
|
1 Semiannual period from 4-1-06 through 9-30-06. Unaudited.
Note 4
Investment transactions |
Purchases and proceeds from sales or maturities of securities, including discount earned on investment securities, during the period ended September 30, 2006, aggregated $3,787,581,176 and $3,786,676,653, respectively.
The cost of investments owned on September 30, 2006, for federal income tax purposes, was $229,068,910.
Money Market Fund
20
Board Consideration of and
Continuation of Investment Advisory
Agreement and Sub-Advisory
Agreement: John Hancock Money
Market Fund |
The Investment Company Act of 1940 (the “1940 Act”) requires the Board of Trustees (the “Board”) of John Hancock Current Interest (the “Trust”), including a majority of the Trustees who have no direct or indirect interest in the investment advisory agreement and are not “interested persons” of the Trust, as defined in the 1940 Act (the “Independent Trustees”), annually to review and consider the continuation of: (i) the investment advisory agreement (the “Advisory Agreement”) with John Hancock Advisers, LLC (the “Adviser”) and (ii) the investment sub-advisory agreement (the “Sub-Advisory Agreement”) with Sovereign Asset Management LLC (the “Sub-Adviser”) for the John Hancock Money Market Fund (the “Fund”). The Advisory Agreement and the Sub-Advisory Agreement are collectively referred to as the “Advisory Agreements.”
At meetings held on May 1-2 and June 5-6, 2006,1 the Board considered the factors and reached the conclusions described below relating to the selection of the Adviser and Sub-Adviser and the continuation of the Advisory Agreements. During such meetings, the Board’s Contracts/Operations Committee and the Independent Trustees also met in executive sessions with their independent legal counsel.
In evaluating the Advisory Agreements, the Board, including the Contracts/Operations Committee and the Independent Trustees, reviewed a broad range of information requested for this purpose by the Independent Trustees, including: (i) the investment performance of the Fund relative to a category of relevant funds (the “Category”) and a peer group of comparable funds (the “Peer Group”) each selected by Morningstar Inc. (“Morningstar”), an independent provider of investment company data, for a range of periods ended December 31, 2005; (ii) advisory and other fees incurred by, and the expense ratios of, the Fund relative to a Category and a Peer Group; (iii) the advisory fees of comparable portfolios of other clients of the Adviser and the Sub-Adviser; (iv) the Adviser’s financial results and condition, including its and certain of its affiliates’ profitability from services performed for the Fund; (v) br eakpoints in the Fund’s and the Peer Group’s fees, and information about economies of scale; (vi) the Adviser’s and Sub-Adviser’s record of compliance with applicable laws and regulations, with the Fund’s investment policies and restrictions and with the applicable Code of Ethics, and the structure and responsibilities of the Adviser’s and Sub-Adviser’s compliance department; (vii) the background and experience of senior management and investment professionals and (viii) the nature, cost and character of advisory and non-investment management services provided by the Adviser and its affiliates and by the Sub-Adviser.
The Board’s review and conclusions were based on a comprehensive consideration of all information presented to the Board and not the result of any single controlling factor. It was based on performance and other information as of December 31, 2005; facts may have changed between that date and the date of this shareholders report. The key factors considered by the Board and the conclusions reached are described below.
Nature, extent and quality of services
The Board considered the ability of the Adviser and the Sub-Adviser, based on their resources, reputation and other attributes, to attract and retain qualified investment professionals, including research, advisory and supervisory personnel. The Board further considered the compliance programs and compliance records of the Adviser and Sub-Adviser. In addition, the Board took into account the administrative services provided to the Fund by the Adviser and its affiliates.
Based on the above factors, together with those referenced below, the Board concluded that, within the context of its full deliberations, the nature, extent and quality of the investment advisory services provided to the Fund by the Adviser and Sub-Adviser were sufficient to support renewal of the Advisory Agreements.
Fund performance
The Board considered the performance results for the Fund over various time periods ended December 31, 2005. The Board also
21
considered these results in comparison to the performance of the Category, as well as the Fund’s benchmark index. Morningstar determined the Category and Peer Group for the Fund. The Board reviewed with a representative of Morningstar the methodology used by Morningstar to select the funds in the Category and the Peer Group. The Board noted the imperfect comparability of the Peer Group.
The Board noted that the Fund’s performance during the review periods ended December 31, 2005 was lower than the performance of the Peer Group and Category medians, and its benchmark index, the 3 Month T-Bill. The Adviser provided information to the Board regarding factors contributing to the Fund’s performance results, as well as the Adviser’s outlook and investment strategy for the near future. The Board indicated its intent to continue to monitor the Fund’s performance trends.
Investment advisory fee and sub-advisory
fee rates and expenses |
The Board reviewed and considered the contractual investment advisory fee rate payable by the Fund to the Adviser for investment advisory services (the “Advisory Agreement Rate”). The Board received and considered information comparing the Advisory Agreement Rate with the advisory fees for the Peer Group. The Board noted that the Advisory Agreement Rate was higher than the median rate of the Peer Group and the Category.
The Board received and considered expense information regarding the Fund’s various components, including advisory fees, distribution and fees other than advisory and distribution fees, including transfer agent fees, custodian fees and other miscellaneous fees (e.g., fees for accounting and legal services). The Board also considered peer-adjusted comparisons for the transfer agent fees. The Board considered comparisons of these expenses to the Peer Group median. The Board also received and considered expense information regarding the Fund’s total operating expense ratio (“Gross Expense Ratio”) and total operating expense ratio after taking the fee waiver arrangement applicable to the Advisory Agreement Rate into account (“Net Expense Ratio”). The Board received and considered information comparing the Gross Expense Ratio and Net Expense Ratio of the Fund to that of the Peer Group and Category medians. The Board noted that the Fund’s Gross and Net Expense Ratios were higher than medians of the Peer Group and Category. The Board favorably considered the impact of continuing fee waivers towards ultimately lowering the Fund’s total operating expense ratio.
The Adviser also discussed the Morningstar data and rankings, and other relevant information, for the Fund. Based on the above-referenced considerations and other factors, the Board concluded that the Fund’s expenses and plans to improve overall performance supported the re-approval of the Advisory Agreements.
The Board also received information about the investment sub-advisory fee rate (the “Sub-Advisory Agreement Rate”) payable by the Adviser to the Sub-Adviser for investment sub-advisory services. The Board concluded that the Sub-Advisory Agreement Rate was fair and equitable, based on its consideration of the factors described here.
Profitability
The Board received and considered a detailed profitability analysis of the Adviser based on the Advisory Agreements, as well as on other relationships between the Fund and the Adviser and its affiliates, including the Sub-Adviser. The Board concluded that, in light of the costs of providing investment management and other services to the Fund, the profits and other ancillary benefits reported by the Adviser were not unreasonable.
Economies of scale
The Board received and considered general information regarding economies of scale with respect to the management of the Fund, including the Fund’s ability to appropriately benefit from economies of scale under the Fund’s fee structure. The Board recognized the inherent limitations of any analysis of economies of scale, stemming largely from the Board’s understanding that most of the Adviser’s costs are not specific to individual Funds, but rather are incurred across a variety of products and services.
See notes to financial statements
22
To the extent the Board and the Adviser were able to identify actual or potential economies of scale from Fund-specific or allocated expenses, in order to ensure that any such economies continue to be reasonably shared with the Fund as its assets increase, the Adviser and the Board agreed to continue the existing breakpoints to the Advisory Agreement Rate.
Information about services to other clients
The Board also received information about the nature, extent and quality of services and fee rates offered by the Adviser and Sub-Adviser to their other clients, including other registered investment companies, institutional investors and separate accounts. The Board concluded that the Advisory Agreement Rate and the Sub-Advisory Agreement Rate were not unreasonable, taking into account fee rates offered to others by the Adviser and Sub-Adviser, respectively, after giving effect to differences in services.
Other benefits to the Adviser
The Board received information regarding potential “fall-out” or ancillary benefits received by the Adviser and its affiliates as a result of the Adviser’s relationship with the Fund. Such benefits could include, among others, benefits directly attributable to the relationship of the Adviser with the Fund and benefits potentially derived from an increase in the business of the Adviser as a result of its relationship with the Fund (such as the ability to market to shareholders other financial products offered by the Adviser and its affiliates).
The Board also considered the effectiveness of the Adviser’s, Sub-Adviser’s and Fund’s policies and procedures for complying with the requirements of the federal securities laws, including those relating to best execution of portfolio transactions and brokerage allocation.
Other factors and broader review
As discussed above, the Board reviewed detailed materials received from the Adviser and Sub-Adviser as part of the annual re-approval process. The Board also regularly reviews and assesses the quality of the services that the Fund receives throughout the year. In this regard, the Board reviews reports of the Adviser at least quarterly, which include, among other things, a detailed portfolio review, detailed fund performance reports and compliance reports. In addition, the Board meets with portfolio managers and senior investment officers at various times throughout the year.
After considering the above-described factors and based on its deliberations and its evaluation of the information described above, the Board concluded that approval of the continuation of the Advisory Agreements for the Fund was in the best interest of the Fund and its shareholders. Accordingly, the Board unanimously approved the continuation of the Advisory Agreements.
1 The Board previously considered information about the Sub-Advisory Agreement at the September and December 2005 Board meetings in connection with the Adviser’s reorganization.
23
For more information
The Fund’s proxy voting policies, procedures and records are available without charge, upon request:
| By phone | On the Fund’s Web site | On the SEC’s Web site |
| 1-800-225-5291 | www.jhfunds.com/proxy | www.sec.gov |
|
| |
| Trustees | Francis V. Knox, Jr. | Principal distributor |
| Ronald R. Dion, Chairman | Chief Compliance Officer | John Hancock Funds, LLC |
| James R. Boyle† | Gordon M. Shone | 601 Congress Street |
| James F. Carlin | Treasurer | Boston, MA 02210-2805 |
| Richard P. Chapman, Jr.* | John G. Vrysen | |
| William H. Cunningham | Chief Financial Officer | Custodian |
| Charles L. Ladner* | | The Bank of New York |
| Dr. John A. Moore* | Investment adviser | One Wall Street |
| Patti McGill Peterson* | John Hancock Advisers, LLC | New York, NY 10286 |
| Steven R. Pruchansky | 601 Congress Street | |
| Boston, MA 02210-2805 | Transfer agent |
| *Members of the Audit Committee | | John Hancock Signature |
| †Non-Independent Trustee | Subadviser | Services, Inc. |
| MFC Global Investment | 1 John Hancock Way, |
| Officers | Management (U.S.), LLC | Suite 1000 |
| Keith F. Hartstein | 101 Huntington Avenue | Boston, MA 02217-1000 |
| President and | Boston, MA 02199 | |
| Chief Executive Officer | | Legal counsel |
| Thomas M. Kinzler | | Kirkpatrick & Lockhart |
| Secretary and | | Nicholson Graham LLP |
| Chief Legal Officer | | 1 Lincoln Street |
| | Boston, MA 02111-2950 |
| | |
The Fund’s investment objective, risks, charges and expenses are included in the prospectus and should be considered carefully before investing. For a prospectus, call your financial professional, call John Hancock Funds at 1-800-225-5291 or visit the Fund’s Web site at www.jhfunds.com. Please read the prospectus carefully before investing or sending money.
| How to contact us | |
|
| |
| Internet | www.jhfunds.com | |
|
| |
| Mail | Regular mail: | Express mail: |
| | John Hancock | John Hancock |
| | Signature Services, Inc. | Signature Services, Inc. |
| | 1 John Hancock Way, Suite 1000 | Mutual Fund Image Operations |
| | Boston, MA 02217-1000 | 380 Stuart Street |
| | | Boston, MA 02116 |
|
| |
| Phone | Customer service representatives | 1-800-225-5291 |
| | 24-hour automated information | 1-800-338-8080 |
| | TDD line | 1-800-554-6713 |
A listing of month-end portfolio holdings is available on our Web site, www.jhfunds.com. A more detailed portfolio holdings summary is available on a quarterly basis 60 days after the fiscal quarter on our Web site or upon request by calling 1-800-225-5291, or on the Securities and Exchange Commission’s Web site, www.sec.gov.
24
J O H N H A N C O C K F A M I L Y O F F U N D S
| EQUTIY | INTERNATIONAL |
| Balanced Fund | Greater China Opportunities Fund |
| Classic Value Fund | International Classic Value Fund |
| Classic Value Fund II | International Core Fund |
| Core Equity Fund | International Fund |
| Focused Equity Fund | International Growth Fund |
| Growth Fund | |
| Growth Opportunities Fund | INCOME |
| Growth Trends Fund | Bond Fund |
| Intrinsic Value Fund | Government Income Fund |
| Large Cap Equity Fund | High Yield Fund |
| Large Cap Select Fund | Investment Grade Bond Fund |
| Mid Cap Equity Fund | Strategic Income Fund |
| Mid Cap Growth Fund | |
| Multi Cap Growth Fund | TAX-FREE INCOME |
| Small Cap Equity Fund | California Tax-Free Income Fund |
| Small Cap Fund | High Yield Municipal Bond Fund |
| Small Cap Intrinsic Value Fund | Massachusetts Tax-Free Income Fund |
| Sovereign Investors Fund | New York Tax-Free Income Fund |
| U.S. Core Fund | Tax-Free Bond Fund |
| U.S. Global Leaders Growth Fund | |
| Value Opportunities Fund | MONEY MARKET |
| | Money Market Fund |
| ASSET ALLOCATION & LIFESTYLE | U.S. Government Cash Reserve |
| Allocation Core Portfolio | |
| Allocation Growth + Value Portfolio | CLOSED-END |
| Lifestyle Aggressive Portfolio | Bank & Thrift Opportunity |
| Lifestyle Balanced Portfolio | Financial Trends |
| Lifestyle Conservative Portfolio | Income Securities |
| Lifestyle Growth Portfolio | Investors Trust |
| Lifestyle Moderate Portfolio | Patriot Global Dividend |
| | Patriot Preferred Dividend |
| SECTOR | Patriot Premium Dividend I |
| Financial Industries Fund | Patriot Premium Dividend II |
| Health Sciences Fund | Patriot Select Dividend |
| Real Estate Fund | Preferred Income |
| Regional Bank Fund | Preferred Income II |
| Technology Fund | Preferred Income III |
| Technology Leaders Fund | Tax-Advantaged Dividend |
For more complete information on any John Hancock Fund and a prospectus, which includes charges and expenses, call your financial professional, or John Hancock Funds at 1-800-225-5291. Please read the prospectus carefully before investing or sending money.

1-800-225-5291
1-800-554-6713 (TDD)
1-800-338-8080 EASI-Line
www.jhfunds. com |
Now available: electronic delivery
www.jhfunds. com/edelivery |
This report is for the information of the shareholders of John Hancock Money Market Fund.
ITEM 2. CODE OF ETHICS.
As of the end of the period, September 30, 2006, the registrant has adopted a code of ethics, as defined in Item 2 of Form N-CSR, that applies to its Chief Executive Officer, Chief Financial Officer and Treasurer (respectively, the principal executive officer, the principal financial officer and the principal accounting officer, the “Senior Financial Officers”). A copy of the code of ethics is filed as an exhibit to this Form N-CSR.
The code of ethics was amended effective February 1, 2005 to address new Rule 204A-1 under the Investment Advisers Act of 1940 and to make other related changes.
ITEM 3. AUDIT COMMITTEE FINANCIAL EXPERT.
Not applicable at this time.
ITEM 4. PRINCIPAL ACCOUNTANT FEES AND SERVICES.
Not applicable at this time.
ITEM 5. AUDIT COMMITTEE OF LISTED REGISTRANTS.
Not applicable at this time.
ITEM 6. SCHEDULE OF INVESTMENTS.
Not applicable.
ITEM 7. DISCLOSURE OF PROXY VOTING POLICIES AND PROCEDURES FOR CLOSED-
END MANAGEMENT INVESTMENT COMPANIES.
Not applicable.
ITEM 8. PORTFOLIO MANAGERS OF CLOSED-END MANAGEMENT INVESTMENT
COMPANIES.
Not applicable.
ITEM 9. PURCHASES OF EQUITY SECURITIES BY CLOSED-END MANAGEMENT
INVESTMENT COMPANY AND AFFILIATED PURCHASERS.
Not applicable.
ITEM 10. SUBMISSION OF MATTERS TO A VOTE OF SECURITY HOLDERS.
The registrant has adopted procedures by which shareholders may recommend nominees to the registrant's Board of Trustees. A copy of the procedures is filed as an exhibit to this Form N-CSR. See attached "John Hancock Funds - Governance Committee Charter”.
ITEM 11. CONTROLS AND PROCEDURES.
(a) Based upon their evaluation of the registrant's disclosure controls and procedures as conducted within 90 days of the filing date of this Form N-CSR, the registrant's principal executive officer and principal financial officer have concluded that those disclosure controls and procedures provide reasonable assurance that the material information required to be disclosed by the registrant on this report is recorded, processed, summarized and reported within the time periods specified in the Securities and Exchange Commission's rules and forms.
(b) There were no changes in the registrant's internal control over financial reporting that occurred during the registrant's most recent fiscal half-year (the registrant's second fiscal half-year in the case of an annual report) that have materially affected, or are reasonably likely to materially affect, the registrant's internal control over financial reporting.
ITEM 12. EXHIBITS.
(a)(1) Code of Ethics for Senior Financial Officers is attached.
(a)(2) Separate certifications for the registrant's principal executive officer and principal financial officer, as required by Section 302 of the Sarbanes-Oxley Act of 2002 and Rule 30a-2(a) under the Investment Company Act of 1940, are attached.
(b) Separate certifications for the registrant's principal executive officer and principal financial officer, as required by 18 U.S.C. Section 1350, as adopted pursuant to Section 906 of the Sarbanes-Oxley Act of 2002, and Rule 30a-2(b) under the Investment Company Act of 1940, are attached. The certifications furnished pursuant to this paragraph are not deemed to be "filed" for purposes of Section 18 of the Securities Exchange Act of 1934, or otherwise subject to the liability of that section. Such certifications are not deemed to be incorporated by reference into any filing under the Securities Act of 1933 or the Securities Exchange Act of 1934, except to the extent that the Registrant specifically incorporates them by reference.
(c)(1) Submission of Matters to a Vote of Security Holders is attached. See attached "John Hancock Funds - Governance Committee Charter”.
(c)(2) Contact person at the registrant.
(c)(3) Proxy Voting Policies and Procedures are attached.
SIGNATURES
Pursuant to the requirements of the Securities Exchange Act of 1934 and the Investment Company Act of 1940, the registrant has duly caused this report to be signed on its behalf by the undersigned, thereunto duly authorized.
John Hancock Current Interest
By: /s/ Keith F. Hartstein
-------------------------------------
Keith F. Hartstein
President and Chief Executive Officer
Date: November 29, 2006
Pursuant to the requirements of the Securities Exchange Act of 1934 and the Investment Company Act of 1940, this report has been signed below by the following persons on behalf of the registrant and in the capacities and on the dates indicated.
By: /s/ Keith F. Hartstein
-------------------------------------
Keith F. Hartstein
President and Chief Executive Officer
Date: November 29, 2006
By: /s/ John G. Vrysen
- -------------------------------------
John G. Vrysen
Executive Vice President and Chief Financial Officer
Date: November 29, 2006