| | |
| UNITED STATES |
| SECURITIES AND EXCHANGE COMMISSION |
| Washington, D.C. 20549 |
| |
| FORM N-CSR |
| |
| CERTIFIED SHAREHOLDER REPORT OF REGISTERED |
| |
| MANAGEMENT INVESTMENT COMPANIES |
| |
| Investment Company Act file number 811- 2485 |
| |
| John Hancock Current Interest |
| (Exact name of registrant as specified in charter) |
| |
| 601 Congress Street, Boston, Massachusetts 02210 |
| (Address of principal executive offices) (Zip code) |
| |
| Michael J. Leary, Treasurer |
| |
| 601 Congress Street |
| |
| Boston, Massachusetts 02210 |
| (Name and address of agent for service) |
| |
| Registrant's telephone number, including area code: 617-663-4490 |
| | |
| Date of fiscal year end: | March 31 |
| |
| |
| Date of reporting period: | September 30, 2009 |
ITEM 1. REPORT TO SHAREHOLDERS.

Your expenses
These examples are intended to help you understand your ongoing operating expenses.
Understanding fund expenses
As a shareholder of the Fund, you incur two types of costs:
■ Transaction costs which include sales charges (loads) on purchases or redemptions (varies by share class), minimum account fee charge, etc.
■ Ongoing operating expenses including management fees, distribution and service fees (if applicable), and other fund expenses.
We are going to present only your ongoing operating expenses here.
Actual expenses/actual returns
This example is intended to provide information about your fund’s actual ongoing operating expenses, and is based on your fund’s actual return. It assumes an account value of $1,000.00 on April 1, 2009, with the same investment held until September 30, 2009.
| | | |
| | Account value | Ending value | Expenses paid during |
| | on 4-1-09 | on 9-30-09 | period ended 9-30-091 |
|
| Class A | $1,000.00 | $1,000.10 | $3.61 |
|
| Class B | 1,000.00 | 1,000.00 | 3.76 |
|
| Class C | 1,000.00 | 1,000.10 | 3.61 |
|
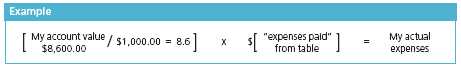
Together with the value of your account, you may use this information to estimate the operating expenses that you paid over the period. Simply divide your account value at September 30, 2009, by $1,000.00, then multiply it by the “expenses paid” for your share class from the table above. For example, for an account value of $8,600.00, the operating expenses should be calculated as follows:
| |
| 6 | Money Market Fund | Semiannual report |
Hypothetical example for comparison purposes
This table allows you to compare your fund’s ongoing operating expenses with those of any other fund. It provides an example of the Fund’s hypothetical account values and hypothetical expenses based on each class’s actual expense ratio and an assumed 5% annualized return before expenses (which is not your fund’s actual return). It assumes an account value of $1,000.00 on April 1, 2009, with the same investment held until September 30, 2009. Look in any other fund shareholder report to find its hypothetical example and you will be able to compare these expenses.
| | | |
| | Account value | Ending value | Expenses paid during |
| | on 4-1-09 | on 9-30-09 | period ended 9-30-091 |
|
| Class A | $1,000.00 | $1,021.50 | $3.65 |
|
| Class B | 1,000.00 | 1,021.30 | 3.80 |
|
| Class C | 1,000.00 | 1,021.50 | 3.65 |
|
Remember, these examples do not include any transaction costs, therefore, these examples will not help you to determine the relative total costs of owning different funds. If transaction costs were included, your expenses would have been higher. See the prospectus for details regarding transaction costs.
1 Expenses are equal to the Fund’s annualized expense ratio of 0.72%, 0.76% and 0.71% for Class A, Class B and Class C shares respectively, multiplied by the average account value over the period, multiplied by 183/365 (to reflect the one-half year period). Fund proxy expenses have been excluded from the expenses shown above.
| |
| Semiannual report | Money Market Fund | 7 |
Portfolio summary
Maturity diversification
| |
| Maturity (days) | As a percentage of net assets on 9-30-09 |
|
| 0 – 30* | 46% |
|
| 31 – 60 | 22% |
|
| 61 – 90 | 22% |
|
| over 90 | 10% |
|
* Includes 11% of securities maturing within seven days.
Average maturity: 63 days
Average quality: A1
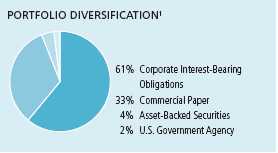
1 As a percentage of net assets on September 30, 2009.
| |
| 8 | Money Market Fund | Semiannual report |
F I N A N C I A L S T A T E M E N T S
Fund’s investments
Securities owned by the Fund on 9-30-09 (unaudited)
| | | | | |
| | | | Maturity | | |
| | Yield* | | date | Par value | Value |
|
| Asset Backed Securities 3.98% | | | | | $16,256,242 |
|
| (Cost $16,256,242) | | | | | |
| | | | | | |
| Asset Backed Securities 3.98% | | | | | 16,256,242 |
|
| Bank of America Auto Trust, | | | | | |
| Series 2009-1A, Class A1 (S) | 0.668% | | 07-15-10 | $2,294,973 | 2,294,973 |
|
| BMW Vehicle Lease Trust, | | | | | |
| Series 2009-01 | 0.792 | | 01-15-10 | 1,749,251 | 1,749,251 |
|
| Honda Auto Receivables Owner Trust, | | | | | |
| Series 2009-3, Class A1 | 0.754 | | 07-15-10 | 4,660,802 | 4,660,802 |
|
| John Deere Owner Trust, | | | | | |
| Series 2009-A | 1.132 | | 07-02-10 | 1,264,802 | 1,264,802 |
|
| Nissan Auto Lease Trust, | | | | | |
| Series 2009-A | 1.043 | | 06-15-10 | 1,286,414 | 1,286,414 |
|
| Nissan Auto Lease Trust, | | | | | |
| Series 2009-B, Class A1 | 0.410 | | 09-15-10 | 5,000,000 | 5,000,000 |
| |
| | | | Maturity | | |
| | Yield* | | date | Par value | Value |
|
| Commercial Paper 33.60% | | | | | $137,149,134 |
|
| (Cost $137,149,134) | | | | | |
| | | | | | |
| Asset Backed — Finance 11.57% | | | | | 47,198,651 |
|
| CAFCO, LLC | 0.270% | | 10-21-09 | $5,000,000 | 4,999,250 |
|
| CAFCO, LLC | 0.220 | | 10-13-09 | 2,000,000 | 1,999,853 |
|
| CAFCO, LLC | 0.200 | | 10-28-09 | 5,000,000 | 4,999,250 |
|
| Govco, LLC | 0.250 | | 11-24-09 | 6,068,000 | 6,065,725 |
|
| Govco, LLC | 0.220 | | 11-25-09 | 5,000,000 | 4,998,319 |
|
| Old Line Funding, LLC | 0.170 | | 10-19-09 | 5,000,000 | 4,999,575 |
|
| Park Avenue Receivables Corp. | 0.190 | | 10-14-09 | 6,500,000 | 6,499,554 |
|
| Ranger Funding Co., LLC | 0.200 | | 10-07-09 | 6,000,000 | 5,999,800 |
|
| Ranger Funding Co., LLC | 0.180 | | 10-15-09 | 2,615,000 | 2,614,817 |
|
| Yorktown Capital, LLC | 0.200 | | 10-23-09 | 4,023,000 | 4,022,508 |
| | | | | | |
| Asset Backed — Loan Receivables 2.28% | | | | | 9,299,308 |
|
| Falcon Asset Securitization Co., LLC | 0.180 | | 10-23-09 | 2,200,000 | 2,199,758 |
|
| Jupiter Securitization Co., LLC | 0.190 | | 10-13-09 | 7,100,000 | 7,099,550 |
| | | | | | |
| Banks — Foreign 8.62% | | | | | 35,198,361 |
|
| BNP Paribas Canada | 0.120 | | 10-07-09 | 6,200,000 | 6,199,876 |
|
| BNP Paribas Finance, Inc. | 0.300 | | 10-20-09 | 4,000,000 | 3,999,367 |
|
| BNP Paribas Finance, Inc. | 0.150 | | 10-02-09 | 7,000,000 | 6,999,971 |
|
| Societe Generale North America, Inc. | 0.190 | | 10-16-09 | 5,000,000 | 4,999,622 |
See notes to financial statements
| |
| Semiannual report | Money Market Fund | 9 |
F I N A N C I A L S T A T E M E N T S
| | | | | |
| | | | Maturity | | |
| | Yield* | | date | Par value | Value |
| Banks — Foreign (continued) | | | | | |
|
| Societe Generale North America, Inc. | 0.190% | | 10-19-09 | $5,000,000 | $4,999,525 |
|
| Societe Generale North America, Inc. | 0.100 | | 10-01-09 | 8,000,000 | 8,000,000 |
| | | | | | |
| Finance — Auto Loans 5.02% | | | | | 20,498,717 |
|
| BMW US Capital, LLC | 0.300 | | 10-05-09 | 7,000,000 | 6,999,767 |
|
| BMW US Capital, LLC | 0.300 | | 10-06-09 | 2,000,000 | 1,999,917 |
|
| BMW US Capital, LLC | 0.300 | | 10-09-09 | 7,500,000 | 7,499,500 |
|
| BMW US Capital, LLC | 0.300 | | 10-15-09 | 4,000,000 | 3,999,533 |
| | | | | | |
| Food 1.96% | | | | | 8,000,000 |
|
| Nestle SA | 0.030 | | 10-01-09 | 8,000,000 | 8,000,000 |
| | | | | | |
| Pharmaceuticals 2.93% | | | | | 11,954,319 |
|
| Pfizer, Inc. | 0.800 | | 07-14-10 | 5,000,000 | 4,968,222 |
|
| Pfizer, Inc. | 0.550 | | 02-08-10 | 7,000,000 | 6,986,097 |
| | | | | | |
| Telecommunications 1.22% | | | | | 4,999,778 |
|
| Verizon Communications, Inc., | 0.200 | | 10-09-09 | 5,000,000 | 4,999,778 |
| |
| | | | Maturity | | |
| | Yield* | | date | Par value | Value |
|
| Corporate Interest-Bearing Obligations 61.28% | | | | $250,085,692 |
|
| (Cost $250,085,692) | | | | | |
| | | | | | |
| Banks — U.S. 14.53% | | | | | 59,286,109 |
|
| Bank of America Corp. (C) | 0.791% | | 04-30-12 | $10,000,000 | 10,000,000 |
|
| Bank of America Corp. | 0.590 | | 11-06-09 | 2,400,000 | 2,400,328 |
|
| Bank of America Corp. (C) | 0.489 | | 06-22-12 | 4,000,000 | 4,000,000 |
|
| Bank of America Corp. (C) | 0.329 | | 09-13-10 | 6,000,000 | 6,000,000 |
|
| Bank of New York Mellon | 0.595 | | 10-14-09 | 10,280,000 | 10,280,461 |
|
| Citibank NA, (C) | 0.498 | | 05-07-12 | 4,000,000 | 4,000,000 |
|
| Deutsche Bank New York | 0.940 | | 02-16-10 | 2,000,000 | 2,004,666 |
|
| Huntington National Bank (C) | 0.760 | | 06-01-12 | 7,000,000 | 7,000,000 |
|
| Union Bank NA (C) | 0.495 | | 03-16-12 | 2,000,000 | 2,000,000 |
|
| Wachovia Corp. | 0.410 | | 12-01-09 | 11,600,000 | 11,600,654 |
| | | | | | |
| Chemicals 2.62% | | | | | 10,673,862 |
|
| E.I. Du Pont de Nemours & Co. | 6.875 | | 10-15-09 | 6,070,000 | 6,086,533 |
|
| E.I. Du Pont de Nemours & Co. | 4.125 | | 04-30-10 | 4,500,000 | 4,587,329 |
| | | | | | |
| Diversified Financial Services 6.03% | | | | | 24,624,344 |
|
| General Electric Capital Corp. | 3.750 | | 12-15-09 | 5,800,000 | 5,840,151 |
|
| General Electric Capital Corp. | 0.533 | | 10-26-09 | 5,000,000 | 5,000,000 |
|
| General Electric Capital Corp. (C) | 0.499 | | 03-12-12 | 5,000,000 | 5,000,000 |
|
| General Electric Capital Corp. | 0.419 | | 12-15-09 | 3,805,000 | 3,803,837 |
|
| General Electric Capital Corp. (C) | 0.378 | | 03-11-11 | 2,000,000 | 2,000,000 |
|
| General Electric Capital Corp. | 0.329 | | 03-12-10 | 3,000,000 | 2,980,356 |
| | | | | | |
| Finance — Auto Loans 0.87% | | | | | 3,551,131 |
|
| American Honda Finance Corp. (S) | 0.514 | | 02-09-10 | 1,058,000 | 1,053,876 |
|
| Toyota Motor Credit Corp. | 0.345 | | 06-06-10 | 2,500,000 | 2,497,255 |
| | | | | | |
| Finance — Consumer Loans 1.86% | | | | | 7,601,222 |
|
| John Deere Capital Corp. | 0.803 | | 10-16-09 | 7,600,000 | 7,601,222 |
See notes to financial statements
| |
| 10 | Money Market Fund | Semiannual report |
F I N A N C I A L S T A T E M E N T S
| | | | | |
| | | | Maturity | | |
| | Yield* | | date | Par value | Value |
| Health Care Supplies 2.21% | | | | | $9,005,895 |
|
| Procter & Gamble International Funding | 0.714% | | 02-08-10 | $6,000,000 | 6,005,895 |
|
| Procter & Gamble International Funding | 0.478 | | 05-07-10 | 3,000,000 | 3,000,000 |
| | | | | | |
| Investment Banking & Brokerage 25.70% | | | | | 104,906,039 |
|
| Bear Stearns Cos., LLC | 0.496 | | 02-23-10 | 9,500,000 | 9,500,810 |
|
| Citigroup Funding, Inc. (C) | 0.729 | | 07-12-12 | 5,000,000 | 5,000,000 |
|
| Citigroup Funding, Inc. (C) | 0.591 | | 07-30-10 | 9,000,000 | 9,001,892 |
|
| Citigroup Funding, Inc. (C) | 0.582 | | 03-30-12 | 2,000,000 | 2,000,000 |
|
| Credit Suisse USA, Inc. | 0.749 | | 01-15-10 | 2,875,000 | 2,877,307 |
|
| Goldman Sachs Group, Inc. (C) | 0.714 | | 11-09-11 | 9,000,000 | 9,022,246 |
|
| Goldman Sachs Group, Inc. | 0.547 | | 03-02-10 | 4,000,000 | 3,977,179 |
|
| Goldman Sachs Group, Inc. | 0.520 | | 11-16-09 | 8,900,000 | 8,901,073 |
|
| Goldman Sachs Group, Inc. (C) | 0.499 | | 03-15-12 | 3,000,000 | 3,000,000 |
|
| Goldman Sachs Group, Inc. | 0.369 | | 12-23-09 | 8,600,000 | 8,597,805 |
|
| JPMorgan Chase & Co. | 1.005 | | 01-22-10 | 4,000,000 | 4,005,240 |
|
| JPMorgan Chase & Co. | 0.781 | | 11-19-09 | 8,000,000 | 8,003,715 |
|
| JPMorgan Chase & Co. (C) | 0.533 | | 12-26-12 | 5,000,000 | 5,000,000 |
|
| JPMorgan Chase & Co. (C) | 0.529 | | 06-15-12 | 8,000,000 | 8,018,772 |
|
| JPMorgan Chase & Co. (C) | 0.486 | | 02-23-11 | 3,000,000 | 3,000,000 |
|
| Morgan Stanley (C) | 0.744 | | 02-10-12 | 7,000,000 | 7,000,000 |
|
| Morgan Stanley (C) | 0.641 | | 06-20-12 | 5,000,000 | 5,000,000 |
|
| Morgan Stanley (C) | 0.499 | | 03-13-12 | 3,000,000 | 3,000,000 |
| | | | | |
| Machinery — Construction & Mining 2.95% | | | | 12,021,934 |
|
| Caterpillar Financial Services Corp. | 4.150 | | 01-15-10 | 2,000,000 | 2,017,968 |
|
| Caterpillar Financial Services Corp. | 0.914 | | 02-08-10 | 2,000,000 | 2,003,554 |
|
| Caterpillar Financial Services Corp. | 0.587 | | 10-09-09 | 8,000,000 | 8,000,412 |
| | | | | | |
| Retail 0.75% | | | | | 3,079,629 |
|
| Wal-Mart Stores, Inc. | 4.125 | | 07-01-10 | 3,000,000 | 3,079,629 |
| | | | | | |
| Telecommunications 3.00% | | | | | 12,253,682 |
|
| AT&T, Inc. | 0.571 | | 02-05-10 | 10,000,000 | 12,253,682 |
| | | | | | |
| Telephone Integrated 0.76% | | | | | 3,081,845 |
|
| Bellsouth Capital Funding | 7.750 | | 02-15-10 | 3,000,000 | 3,081,845 |
| |
| | Interest | | Maturity | | |
| | rate | | date | Par value | Value |
|
| U.S. Government Agency 2.45% | | | | | $10,000,000 |
|
| (Cost $10,000,000) | | | | | |
| | | | | | |
| U.S. Government Agency 2.45% | | | | | 10,000,000 |
|
| Federal Home Loan Bank | 0.650% | | 07-28-10 | $10,000,000 | 10,000,000 |
| |
| Total investments (Cost $413,491,068)† 101.31% | | | | $413,491,068 |
|
| |
| Other assets and liabilities, net (1.31%) | | | | | ($5,351,299) |
|
| |
| Total net assets 100.00% | | | | | $408,139,769 |
|
The percentage shown for each investment category is the total value of that category as a percentage of the net assets applicable to common shareholders.
See notes to financial statements
| |
| Semiannual report | Money Market Fund | 11 |
F I N A N C I A L S T A T E M E N T S
* Yield represents either the annualized yield at the date of purchase, or the stated coupon rate or, for floating rate securities, the rate at period end.
(C) These securities were issued under the Temporary Liquidity Gurantee Program and are insured by Federal Deposit Insurance Corporation. These securities amounted to $99,042,910, or 24.27% of net assets of the Fund, as of September 30, 2009.
(S) These securities are exempt from registration under Rule 144A of the Securities Act of 1933. Such securities may be resold, normally to qualified institutional buyers, in transactions exempt from registration.
† At September 30, 2009, the aggregate cost of investment securities for federal income tax purposes was $413,491,068.
See notes to financial statements
| |
| 12 | Money Market Fund | Semiannual report |
F I N A N C I A L S T A T E M E N T S
Financial statements
Statement of assets and liabilities 9-30-09 (unaudited)
This Statement of Assets and Liabilities is the Fund’s balance sheet. It shows the value of what the Fund owns, is due and owes. You’ll also find the net asset value per share.
| |
| Assets | |
|
| Investments, at value (Cost $413,491,068) | $413,491,068 |
| Cash | 11,810 |
| Receivable for fund shares sold | 16,642 |
| Interest receivable | 585,842 |
| Receivable due from adviser | 84,066 |
| Prepaid Trustee expenses | 18,556 |
| Other receivables and prepaid assets | 61,849 |
| | |
| Total assets | 414,269,833 |
|
| Liabilities | |
|
| Payable for investments purchased | 5,603,596 |
| Payable for fund shares repurchased | 276,641 |
| Distributions payable | 7,824 |
| Payable to affiliates | |
| Accounting and legal services fees | 15,018 |
| Transfer agent fees | 149,220 |
| Other liabilities and accrued expenses | 77,765 |
| |
| Total liabilities | 6,130,064 |
|
| Net assets | |
|
| Capital paid-in | $408,175,923 |
| Accumulated distributions in excess of net investment income | (34,916) |
| Accumulated net realized loss on investments | (1,238) |
| | |
| Net assets | $408,139,769 |
|
| Net asset value per share | |
|
| Based on net asset values and shares outstanding — the Fund has an | |
| unlimited number of shares authorized with no par value. | |
| Class A ($349,393,235 ÷ 349,538,810 shares) | $1.00 |
| Class B ($31,495,921 ÷ 31,520,387 shares)1 | $1.00 |
| Class C ($27,250,613 ÷ 27,255,887 shares)1 | $1.00 |
1 Redemption price is equal to net asset value less any applicable contingent deferred sales charge.
See notes to financial statements
| |
| Semiannual report | Money Market Fund | 13 |
F I N A N C I A L S T A T E M E N T S
Statement of operations For the period ended 9-30-09 (unaudited)1
This Statement of Operations summarizes the Fund’s investment income earned and expenses incurred in operating the Fund. It also shows net gains (losses) for the period stated.
| |
| Investment income | |
|
| Interest | $1,800,457 |
| | |
| Total investment income | 1,800,457 |
|
| Expenses | |
|
| Investment management fees (Note 4) | 1,114,735 |
| Distribution and service fees (Note 4) | 825,578 |
| Transfer agent fees (Note 4) | 580,922 |
| Accounting and legal services fees (Note 4) | 47,959 |
| Trustees’ fees (Note 5) | 21,810 |
| State registration fees | 37,250 |
| Printing and postage fees | 44,705 |
| Professional fees | 132,400 |
| Custodian fees | 78,966 |
| Registration and filing fees | 8,950 |
| Proxy fees | 133,668 |
| Treasury guarantee program fee (Note 7) | 81,348 |
| Other | 8,994 |
| | |
| Total expenses | 3,117,285 |
| Less expense reductions (Note 4) | (1,373,630) |
| | |
| Net expenses | 1,743,655 |
| | |
| Net investment income | 56,802 |
| | |
| Increase in net assets from operations | 56,802 |
1 Semiannual period from 4-1-09 to 9-30-09.
See notes to financial statements
| |
14 | Money Market Fund | Semiannual report |
F I N A N C I A L S T A T E M E N T S
Statements of changes in net assets
These Statements of Changes in Net Assets show how the value of the Fund’s net assets has changed during the last two periods. The difference reflects earnings less expenses, any investment gains and losses, distributions, if any, paid to shareholders and the net of Fund share transactions.
| | |
| | Period | |
| | ended | Year |
| | 9-30-09 | ended |
| | (Unaudited)1 | 3-31-09 |
|
| Increase (decrease) in net assets | | |
|
| From operations | | |
| Net investment income | 56,802 | $3,922,242 |
| | | |
| Increase in net assets resulting from operations | 56,802 | 3,922,242 |
| | | |
| Distributions to shareholders | | |
| From net investment income | | |
| Class A | (51,653) | (3,635,004) |
| Class B | — | (182,836) |
| Class C | (5,149) | (150,806) |
| | | |
| From Fund share transactions (Note 6) | (78,004,602) | 103,358,651 |
| | | |
| Total increase (decrease) | (78,004,602) | 103,312,247 |
|
| Net assets | | |
|
| Beginning of period | 486,144,371 | 382,832,124 |
| | | |
| End of period | $408,139,769 | $486,144,371 |
| | | |
| Accumulated distributions in excess of net investment income | ($34,916) | ($34,916) |
1 Semiannual period from 4-1-09 to 9-30-09.
See notes to financial statements
| |
| Semiannual report | Money Market Fund | 15 |
F I N A N C I A L S T A T E M E N T S
Financial highlights
The Financial Highlights show how the Fund’s net asset value for a share has changed since the end of the previous period.
| | | | | | |
| CLASS A SHARES Period ended | 9-30-091 | 3-31-09 | 3-31-08 | 3-31-07 | 3-31-06 | 3-31-052 |
|
| Per share operating performance | | | | | | |
|
| Net asset value, beginning of period | $1.00 | $1.00 | $1.00 | $1.00 | $1.00 | $1.00 |
| Net investment income3 | —4 | 0.01 | 0.04 | 0.04 | 0.03 | 0.01 |
| Less distributions | | | | | | |
| From net investment income | —4 | (0.01) | (0.04) | (0.04) | (0.03) | (0.01) |
| Net asset value, end of period | $1.00 | $1.00 | $1.00 | $1.00 | $1.00 | $1.00 |
| Total return (%)5,6 | 0.017 | 1.16 | 4.24 | 4.45 | 2.92 | 0.86 |
| |
| Ratios and supplemental data | | | | | | |
|
| Net assets, end of period (in millions) | $349 | $396 | $317 | $195 | $185 | $224 |
| Ratios (as a percentage of average net assets): | | | | | | |
| Expenses before reductions | 1.258 | 1.10 | 1.01 | 1.09 | 1.11 | 1.09 |
| Expenses net of all fee waivers and credits | 0.778 | 0.89 | 0.81 | 0.88 | 0.91 | 0.88 |
| Expenses net of all fee waivers | 0.778 | 0.89 | 0.81 | 0.88 | 0.91 | 0.88 |
| Net investment income | 0.039 | 1.05 | 4.08 | 4.37 | 2.85 | 0.83 |
| |
1 Semiannual period from 4-1-09 to 9-30-09. Unaudited.
2 Audited by previous independent registered public accounting firm.
3 Based on the average daily shares outstanding.
4 Less than $0.005 per share.
5 Assumes dividend reinvestment and does not reflect the effect of sales charges.
6 Total returns would have been lower had certain expenses not been reduced during the periods shown.
7 Not annualized.
8 Includes the impact of proxy expenses, which amounted to 0.03% of average net assets.
9 Annualized.
| | | | | | |
| CLASS B SHARES Period ended | 9-30-091 | 3-31-09 | 3-31-08 | 3-31-07 | 3-31-06 | 3-31-052 |
|
| Per share operating performance | | | | | | |
|
| Net asset value, beginning of period | $1.00 | $1.00 | $1.00 | $1.00 | $1.00 | $1.00 |
| Net investment income3 | — | —4 | 0.03 | 0.04 | 0.02 | —4 |
| Less distributions | | | | | | |
| From net investment income | — | —4 | (0.03) | (0.04) | (0.02) | —4 |
| Net asset value, end of period | $1.00 | $1.00 | $1.00 | $1.00 | $1.00 | $1.00 |
| Total return (%)5,6 | 0.007 | 0.56 | 3.36 | 3.57 | 2.05 | 0.50 |
| |
| Ratios and supplemental data | | | | | | |
|
| Net assets, end of period (in millions) | $31 | $43 | $34 | $28 | $36 | $63 |
| Ratios (as a percentage of average net assets): | | | | | | |
| Expenses before reductions | 2.008 | 1.85 | 1.77 | 1.83 | 1.86 | 1.85 |
| Expenses net of fee waivers | 0.818 | 1.45 | 1.67 | 1.73 | 1.76 | 1.20 |
| Expenses net of all fee waivers and credits | 0.818 | 1.45 | 1.66 | 1.73 | 1.76 | 1.20 |
| Net investment income (loss) | 0.009 | 0.48 | 3.29 | 3.52 | 1.94 | 0.46 |
| |
1 Semiannual period from 4-1-09 to 9-30-09. Unaudited.
2 Audited by previous independent registered public accounting firm.
3 Based on the average daily shares outstanding.
4 Less than $0.005 per share.
5 Assumes dividend reinvestment and does not reflect the effect of sales charges.
6 Total returns would have been lower had certain expenses not been reduced during the periods shown.
7 Not annualized.
8 Includes the impact of proxy expenses, which amounted to 0.03% of average net assets.
9 Annualized.
See notes to financial statements
| |
| 16 | Money Market Fund | Semiannual report |
F I N A N C I A L S T A T E M E N T S
| | | | | | |
| CLASS C SHARES Period ended | 9-30-091 | 3-31-09 | 3-31-08 | 3-31-07 | 3-31-06 | 3-31-052 |
|
| Per share operating performance | | | | | | |
|
| Net asset value, beginning of period | $1.00 | $1.00 | $1.00 | $1.00 | $1.00 | $1.00 |
| Net investment income3 | —4 | —4 | 0.03 | 0.04 | 0.02 | —4 |
| Less distributions | | | | | | |
| From net investment income | —4 | —4 | (0.03) | (0.04) | (0.02) | —4 |
| Net asset value, end of period | $1.00 | $1.00 | $1.00 | $1.00 | $1.00 | $1.00 |
| Total return (%)5,6 | 0.017 | 0.56 | 3.35 | 3.57 | 2.04 | 0.50 |
| |
| Ratios and supplemental data | | | | | | |
|
| Net assets, end of period (in millions) | $27 | $47 | $31 | $8 | $4 | $13 |
| Ratios (as a percentage of average net assets): | | | | | | |
| Expenses before reductions | 2.008 | 1.86 | 1.76 | 1.83 | 1.85 | 1.84 |
| Expenses net of fee waivers | 0.788 | 1.44 | 1.66 | 1.73 | 1.75 | 1.19 |
| Expenses net of all fee waivers and credits | 0.788 | 1.44 | 1.66 | 1.73 | 1.75 | 1.19 |
| Net investment income | 0.039 | 0.41 | 3.10 | 3.54 | 1.86 | 0.46 |
| |
1 Semiannual period from 4-1-09 to 9-30-09. Unaudited.
2 Audited by previous independent registered public accounting firm.
3 Based on the average daily shares outstanding.
4 Less than $0.005 per share.
5 Total returns would have been lower had certain expenses not been reduced during the periods shown.
6 Assumes dividend reinvestment and does not reflect the effect of sales charges.
7 Not annualized.
8 Includes the impact of proxy expenses, which amounted to 0.04% of average net assets.
9 Annualized.
See notes to financial statements
| |
| Semiannual report | Money Market Fund | 17 |
Notes to financial statements (unaudited)
Note 1
Organization
John Hancock Money Market Fund (the Fund) is a diversified series of John Hancock Current Interest (the Trust), an open-end management investment company registered under the Investment Company Act of 1940, as amended (the 1940 Act). The investment objective of the Fund is to seek the maximum current income that is consistent with maintaining liquidity and preserving capital. The Fund intends to maintain a stable $1.00 per share price.
John Hancock Advisers, LLC (the Adviser) serves as investment adviser for the Fund. John Hancock Funds, LLC (the Distributor), an affiliate of the Adviser, serves as principal underwriter of the Fund. The Adviser and the Distributor are indirect wholly owned subsidiaries of Manulife Financial Corporation (MFC).
The Board of Trustees has authorized the issuance of multiple classes of shares of the Fund, designated as Class A, Class B and Class C shares. The shares of each class represent an interest in the same portfolio of investments of the Fund and have equal rights as to voting, redemptions, dividends and liquidation, except that certain expenses, subject to the approval of the Trustees, may be applied differently to each class of shares in accordance with current regulations of the Securities and Exchange Commission and the Internal Revenue Service. Shareholders of a class that bears distribution and service expenses under the terms of a distribution plan have exclusive voting rights to that distribution plan. Class B shares will convert to Class A shares eight years after purchase. Effective March 31, 2009, Class B and Class C shares are closed to new investors.
Note 2
Significant accounting policies
The financial statements have been prepared in conformity with accounting principles generally accepted in the United States of America, which require management to make certain estimates and assumptions at the date of the financial statements. Actual results could differ from those estimates. Events or transactions occurring after period end and through the date that the financial statements were issued, November 23, 2009, have been evaluated in the preparation of the financial statements. The following summarizes the significant accounting policies of the Fund:
Security valuation
Securities in the Fund’s portfolio are valued at amortized cost, in accordance with Rule 2a-7 of the 1940 Act, which approximates market value. The amortized cost method involves valuing a security at its cost on the date of purchase and thereafter assuming a constant amortization to maturity of the difference between the principal amount due at maturity and the cost of the security to the Fund.
Fair value measurements
The Fund uses a three-tier hierarchy to prioritize the assumptions, referred to as inputs, used in valuation techniques to measure fair value. The three-tier hierarchy of inputs and the valuation techniques used are summarized below:
Level 1 — Exchange traded prices in active markets for identical securities.
Level 2 — Prices determined using significant observable inputs. Observable inputs may include quoted prices for similar securities, interest rates, prepayment speeds and credit risk. Prices for securities valued using these techniques are received from independent pricing vendors and are based on an evaluation of the inputs described. These techniques are used for certain domestic preferred equities, certain foreign equities, unlisted rights and warrants, and fixed income securities.
Level 3 — Prices determined using significant unobservable inputs. In situations where quoted prices or observable inputs are unavailable, such as when there is little or no market activity for an investment, unobservable inputs may be used. Unobservable inputs reflect the
| |
| 18 | Money Market Fund | Semiannual report |
Fund’s Pricing Committee’s own assumptions about the factors that market participants would use in pricing an investment and would be based on the best information available. Securities using this technique are generally thinly traded or privately placed and may be valued using broker quotes, which may not only use observable or unobservable inputs but may also include the use of the brokers’ own judgments about the assumptions that market participants would use.
The inputs or methodology used for valuing securities are not necessarily an indication of the risk associated with investing in those securities.
All investments as listed in the Portfolio of Investments at September 30, 2009 are Level 2 under the hierarchy discussed above.
Security transactions and related
investment income
Investment transactions are recorded as of the date of purchase, sale or maturity. Interest income is accrued as earned. Discounts/ premiums are accreted/amortized for financial reporting purposes. Debt obligations may be placed in a non-accrual status and related interest income may be reduced by ceasing current accruals and writing off interest receivables when the collection of all or a portion of interest has become doubtful, based upon consistently applied procedures. Interest income on certain portfolio securities such as negotiable bank certificates of deposit and interest bearing notes is accrued daily and included in interest receivable. The Fund uses identified cost method for determining realized gain or loss on investments for both financial statement and federal income tax reporting purposes.
Expenses
The majority of expenses are directly identifiable to an individual fund. Trust expenses that are not readily identifiable to a specific fund are allocated in such a manner as deemed equitable, taking into consideration, among other things, the nature and type of expense and the relative size of the funds. Expense estimates are accrued in the period to which they relate and adjustments are made when actual amounts are known.
Class allocations
Income, common expenses and realized and unrealized gains (losses) are determined at the fund level and allocated daily to each class of shares based on the appropriate net asset value of the respective classes. Distribution and service fees, if any, transfer agent fees for all classes are calculated daily at the class level based on the appropriate net asset value of each class and the specific expense rate(s) applicable to each class.
Line of credit
The Fund and other affiliated funds have entered into an agreement which enables them to participate in a $150 million unsecured committed line of credit with State Street Corporation (the Custodian). The Fund is permitted to have bank borrowings for temporary or emergency purposes, including the meeting of redemption requests that otherwise might require the untimely disposition of securities. Interest is charged to each participating fund based on its borrowings at a rate per annum equal to the Federal Funds rate plus 0.50%. In addition, a commitment fee of 0.08% per annum, payable at the end of each calendar quarter, based on the average daily unused portion of the line of credit, is charged to each participating fund on a prorated basis based on average net assets. Prior to February 19, 2009, the commitment fee was 0.05% per annum. For the period ended September 30, 2009, there were no borrowings under the line of credit by the Fund.
Pursuant to the custodian agreement, the Custodian may, in its discretion, advance funds to the Fund to make properly authorized payments. When such payments result in an overdraft, the Fund is obligated to repay the Custodian for any overdraft, including any costs or expenses associated with the overdraft. The Custodian has a lien and security interest in any Fund property, that is not segregated, to the maximum extent permitted by law, to the extent of any overdraft.
| |
| Semiannual report | Money Market Fund | 19 |
Federal income taxes
The Fund intends to qualify as a regulated investment company by complying with the applicable provisions of the Internal Revenue Code and will not be subject to federal income tax on taxable income that is distributed to shareholders. Therefore, no federal income tax provision is required.
For federal income tax purposes, the Fund has $1,238 of a capital loss carryforward available, to the extent provided by regulations, to offset future net realized capital gains. To the extent that such carryforward is used by the Fund, it will reduce the amount of capital gain distribution to be paid. The loss carryforwards expire as follows: March 31, 2012 — $1,191 and March 31, 2015 — $47.
As of September 30, 2009, the Fund had no uncertain tax positions that would require financial statement recognition, de-recognition, or disclosure. The Fund’s federal tax returns filed in the 3-year period ended March 31, 2009 remains subject to examination by the Internal Revenue Service.
Distribution of income and gains
The Fund records distributions to shareholders from net investment income and net realized gains, if any, on the ex-dividend date. The Fund’s net investment income generally is declared daily as dividends to shareholders of record as of the close of business on the preceding day, and distributed monthly. During the year ended March 31, 2009, the tax character of distributions paid was as follows: ordinary income — $3,968,646. Distributions paid by the Fund with respect to each class of shares are calculated in the same manner, at the same time and are in the same amount, except for the effect of expenses that may be applied differently to each class.
Such distributions, on a tax basis, are determined in conformity with income tax regulations, which may differ from accounting principles generally accepted in the United States of America. Distributions in excess of tax basis earnings and profits, if any, are reported in the Fund’s financial statements as a return of capital.
Note 3
Guarantees and indemnifications
Under the Fund’s organizational documents, its Officers and Trustees are indemnified against certain liability arising out of the performance of their duties to the Fund. Additionally, in the normal course of business, the Fund enters into contracts with service providers that contain general indemnification clauses. The Fund’s maximum exposure under these arrangements is unknown, as this would involve future claims that may be made against the Fund that have not yet occurred.
Note 4
Management fee and transactions with
affiliates and others
The Fund has an investment management contract with the Adviser. Under the investment management contract, the Fund pays a daily management fee to the Adviser equivalent, on an annual basis, to the sum of: (a) 0.50% of the first $500,000,000 of the Fund’s average daily net asset value, (b) 0.425% of the next $250,000,000, (c) 0.375% of the next $250,000,000, (d) 0.35% of the next $500,000,000, (e) 0.325% of the next $500,000,000, (f) 0.30% of the next $500,000,000 and (g) 0.275% of the Fund’s average daily net asset value in excess of $2,500,000,000. The Adviser has a subadvisory agreement with MFC Global Investment Management (U.S.), LLC, an affiliate of the Adviser. The Fund is not responsible for payment of subadvisory fees.
The Adviser has contractually agreed to limit the Fund’s management fee to 0.40% of the Fund’s average daily net asset value, at least until July 31, 2010. Accordingly, the expense reductions related to management fee limitations amounted to $222,950 for the period ended September 30, 2009. In addition, the Adviser has voluntarily agreed to reimburse advisory fees to support a minimum yield in the amount of $330,848 for the period ended September 30, 2009. The effective rate of the management fee, including the expense limitation, was 0.25% of the Fund’s average daily net asset value for the period ended September 30, 2009.
| |
| 20 | Money Market Fund | Semiannual report |
The Fund administration fees incurred for the period ended September 30, 2009, were equivalent to an annual effective rate of 0.02% of the Fund’s average daily net assets.
The Fund has a Distribution Agreement with the Distributor. The Fund has adopted Distribution Plans with respect to Class A, Class B and Class C shares, pursuant to Rule 12b-1 under the 1940 Act, to pay the Distributor for the services it provides as distributor of shares of the Fund. Accordingly, the Fund makes payments to the Distributor at an annual rate not to exceed 0.25%, 1.00% and 1.00% of average daily net asset value of Class A, Class B and Class C shares, respectively. The Distributor contractually agreed to limit the distribution and service (12b-1) fees on Class A shares to 0.15% of Class A shares’ average daily net asset value, until July 31, 2010. In addition, the Distributor has voluntarily agreed to waive and/or reimburse certain distribution and service fees for the period ended September 30, 2009. Accordingly, the expense reductions related to reduction in the 12b-1 fee amounted to $468,001, $179,816 and $172,015 for Class A, Class B and Class C shares, respectively, for the period ended September 30, 2009. A maximum of 0.25% of such payments may be service fees, as defined by the Conduct Rules of the Financial Industry Regulatory Authority (formerly the National Association of Securities Dealers). Under the Conduct Rules, curtailment of a portion of the Fund’s 12b-1 payments could occur under certain circumstances. Effective March 31, 2009, sales charges for Class A, Class B and Class C shares were suspended voluntarily.
Class A contingent deferred sales charge (CDSC) may be charged for certain transfers between the Fund and affiliate John Hancock Funds. Class B shares that are redeemed within six years of purchase are subject to a CDSC at declining rates, beginning at 5.00% of the lesser of the current market value at the time of redemption or the original purchase cost of the shares being redeemed. Class C shares that are redeemed within one year of purchase are subject to a CDSC at a rate of 1.00% of the lesser of the current market value at the time of redemption or the original purchase cost of the shares being redeemed. Proceeds from the CDSCs are paid to JH Funds and are used in whole or in part to defray its expenses for providing distribution-related services to the Fund in connection with the sale of Class B and Class C shares. During the period ended September 30, 2009, CDSCs received by JH Funds amounted to $3,458 for Class A share s, $70,586 for Class B shares and $14,777 for Class C shares.
The Fund has a transfer agent agreement with John Hancock Signature Services, Inc. (Signature Services), an indirect subsidiary of MFC. The transfer agent fees are made up of three components:
• The Fund pays a monthly transfer agent fee at an annual rate of 0.01% for Classes A, B and C shares based on each class’s average daily net assets.
• The Fund pays Signature Services a monthly fee which is based on an annual rate of $17.50 per shareholder accounts for all classes.
• In addition, Signature Services is reimbursed for certain out-of-pocket expenses.
The Fund may receive earnings credits from its transfer agent as a result of uninvested cash balances. These credits are used to reduce a portion of the Fund’s transfer agent fees and out-of-pocket expenses. During the period ended September 30, 2009, the Fund did not receive earning credits.
Class level expenses for the period ended
September 30, 2009, were as follows:
| | |
| | Distribution | Transfer |
| Share class | and service fees | agent fees |
|
| Class A | $467,974 | $487,634 |
| Class B | 185,610 | 48,457 |
| Class C | 171,994 | 44,831 |
| Total | $825,578 | $580,922 |
Note 5
Trustees’ fees
The compensation of unaffiliated Trustees is borne by the Fund. The unaffiliated Trustees may elect to defer, for tax purposes, their receipt of this compensation under the
| |
| Semiannual report | Money Market Fund | 21 |
John Hancock Group of Funds Deferred Compensation Plan. The Fund makes investments into other John Hancock Funds, as applicable, to cover its liability for the deferred compensation. Investments to cover the Fund’s deferred compensation liability are recorded on the Fund’s books as an other asset. The deferred compensation liability and the related other asset are always equal and are marked to market on a periodic basis to reflect any income earned by the investments, as well as any unrealized gains or losses. The Deferred Compensation Plan investments had no impact on the operations of the Fund.
Note 6
Fund share transactions
This listing illustrates the number of Fund shares sold, reinvested and repurchased during the period ended September 30, 2009, and year ended March 31, 2009, along with the corresponding dollar value.
| | | | |
| | Period ended 9-30-091 | Year ended 3-31-09 |
| | | |
| | Shares | Amount | Shares | Amount |
| Class A shares | | | | |
|
| Sold | 99,645,806 | $99,645,806 | 431,073,623 | $431,073,623 |
| Distributions reinvested | 49,059 | 49,059 | 3,382,398 | 3,382,398 |
| Repurchased | (146,298,101) | (146,298,101) | (355,570,554) | (355,570,554) |
| Net increase (decrease) | (46,603,236) | ($46,603,236) | 78,885,467 | $78,885,467 |
| |
| Class B shares | | | | |
|
| Sold | 4,570,994 | $4,570,994 | 44,008,600 | $44,008,600 |
| Distributions reinvested | — | — | 165,206 | 165,206 |
| Repurchased | (16,153,575) | (16,153,575) | (35,515,180) | (35,515,180) |
| Net increase (decrease) | (11,582,581) | ($11,582,581) | 8,658,626 | $8,658,626 |
| |
| Class C shares | | | | |
|
| Sold | 8,139,219 | $8,139,219 | 100,074,666 | $100,074,666 |
| Distributions reinvested | 4,481 | 4,481 | 130,158 | 130,158 |
| Repurchased | (27,962,485) | (27,962,485) | (84,390,266) | (84,390,266) |
| Net increase (decrease) | (19,818,785) | ($19,818,785) | 15,814,558 | $15,814,558 |
| |
| Net increase (decrease) | (78,004,602) | ($78,004,602) | 103,358,651 | $103,358,651 |
|
1 Semiannual period from 4-1-09 to 9-30-09. Unaudited.
Note 7
U.S. Department of Treasury
Temporary Guarantee Program for
money market funds
The Trustees approved the participation of the Fund in the U.S. Department of Treasury (the Treasury) Temporary Guarantee Program for Money Market Funds (the Program), under which the Treasury guaranteed that shareholders of the Fund would receive $1.00 for each share of the Fund held by them as of the close of business on September 19, 2008, in the event that the Fund liquidates and the per share value at the time of liquidation is less than $1.00 (a Guarantee Event). Recovery under the Program was subject to certain conditions and limitations, including the following:
• For investors who held shares of the Fund on September 19, 2008, the Program provided a guarantee for the lesser of: (a) the number of shares owned by the shareholder at the close of September 19 2008; or (b) the number of shares owned by the shareholder on the date of a Guarantee Event.
• The guarantee was not available to investors who were not Fund shareholders on September 19, 2008. In addition, this guarantee was not available to investors who were Fund shareholders on September 19, 2008
| |
| 22 | Money Market Fund | Semiannual report |
but who sold all their Fund shares prior to the date of a Guarantee Event.
• The total amount of coverage available for all participants in the Program was limited to the amount of funds available under the Federal Exchange Stabilization Fund at the time of a Guarantee Event (approximately $50 billion).
• In order to recover, a Guarantee Event must have occured during the term of the Program. Recovery under the Program required the Fund to liquidate.
The Program, originally scheduled to terminate on December 18, 2008, was initially extended until April 30, 2009. However, the Treasury announced on March 31, 2009 that the Program was again extended through September 18, 2009. Participation in the Program required a payment to the U.S. Treasury in the amount of 0.04% (including the extensions) of the net asset value of the Fund as of September 19, 2008. The Board of Trustees approved continued participation in the program until September 18, 2009. The cost of participating in the Program and the extensions was borne by the Fund, and was not subject to any expense limitation or reimbursement agreement.
The U.S. Department of Treasury’s Temporary Guarantee Program for Money Market Funds (the Program) expired on September 18, 2009 and will not be further extended.
| |
| Semiannual report | Money Market Fund | 23 |
Board Consideration of and
Continuation of Investment Advisory
Agreement and Subadvisory
Agreement: John Hancock Money
Market Fund
The Investment Company Act of 1940 (the 1940 Act) requires the Board of Trustees (the Board) of John Hancock Current Interest (the Trust), including a majority of the Trustees who have no direct or indirect interest in the investment advisory agreement and are not “interested persons” of the Trust, as defined in the 1940 Act (the Independent Trustees), annually to meet in person to review and consider the continuation of existing advisory and sub-advisory agreements. At meetings held on May 6–7 and June 8–9, 2009, the Board considered the renewal of:
(i) the investment advisory agreement (the Advisory Agreement) with John Hancock Advisers, LLC (the Adviser) and
(ii) the investment subadvisory agreement (the Subadvisory Agreement) with MFC Global Investment Management (U.S.), LLC (the Subadviser) for the John Hancock Money Market Fund (the Fund).
The Advisory Agreement and the Subadvisory Agreement are collectively referred to as the Advisory Agreements. The Board considered the factors and reached the conclusions described below relating to the selection of the Adviser and Subadviser and the continuation of the Advisory Agreements. During such meetings, the Board’s Contracts/Operations Committee and the Independent Trustees also met in executive sessions with their independent legal counsel.
In evaluating the Advisory Agreements, the Board, including the Contracts/Operations Committee and its Independent Trustees, reviewed a broad range of information requested for this purpose. The Independent Trustees considered the legal advice of independent legal counsel and relied on their own business judgment in determining the factors to be considered in evaluating the materials that were presented to them and the weight to be given to each such factor. The Board’s review and conclusions were based on a comprehensive consideration of all information presented to the Board and not the result of any single controlling factor. The key factors considered by the Board and the conclusions reached are described below.
Nature, extent and quality of services
The Board considered the ability of the Adviser and the Subadviser, based on their resources, reputation and other attributes, to attract and retain qualified investment professionals, including research, advisory, and supervisory personnel. It considered the background and experience of senior management and investment professionals responsible for managing the Fund. The Board considered the investment philosophy, research and investment decision-making processes of the Adviser and the Subadviser responsible for the daily investment activities of the Fund. The Board considered the Subadviser’s history and experience with the Fund. The Board considered the Adviser’s execution of its oversight responsibilities. The Board further considered the culture of compliance, resources dedicated to compliance, compliance programs, record of compliance with applicable laws and regulation, with the Fund’s investment policies and restrictions and with the applicable Code of Ethics, and the responsibilities of the Adviser’s and Subadviser’s compliance department. In addition, the Board took into account the administrative and other non-advisory services provided to the Fund by the Adviser and its affiliates.
Based on the above factors, together with those referenced below, the Board concluded that, within the context of its full deliberations, the nature, extent and quality of the investment advisory services provided to the Fund by the Adviser and Subadviser supported renewal of the Advisory Agreements.
Fund performance
The Board considered the performance results for the Fund over various time periods ended December 31, 2008. The Board also considered these results in comparison to the performance of a category of relevant funds (the Category), a peer group of comparable funds (the Peer Group) and a benchmark index. The funds within each Category and Peer Group were
| |
| 24 | Money Market Fund | Semiannual report |
selected by Morningstar Inc. (Morningstar), an independent provider of investment company data. The Board reviewed the methodology used by Morningstar to select the funds in the Category and the Peer Group. The Board also considered updated performance information at its May and June 2009 meetings. Performance and other information may be quite different as of the date of this shareholders report.
The Board noted that the Fund’s performance for the 3-, 5- and 10-year period was lower than its benchmark index, the US Treasury T-Bill Auction Ave. — 3 Month Index, as was the Peer Group and Category medians. The Board noted that the Fund’s performance was higher than the performance of its benchmark for the 1-year period. The Board also noted that the Fund’s performance was lower than the Category median for the 10-year period, but inline with the Category median for the 1-, 3- and 5-year periods. The Board also noted that the Fund’s performance was lower than the performance of the Peer Group median for the 1-, 5- and 10-year periods, and inline with the performance of the Peer Group median for the 3-year period.
Investment advisory fee and subadvisory
fee rates and expenses
The Board reviewed and considered the contractual investment advisory fee rate payable by the Fund to the Adviser for investment advisory services (the Advisory Agreement Rate). The Board received and considered information comparing the Advisory Agreement Rate with the advisory fees for the Category and Peer Group. The Board noted that the Advisory Agreement Rate was higher than the Category and Peer Group median rates. The Board viewed favorably the Adviser’s contractual agreement to limit the Advisory Agreement Rate to 0.40% for at least another year.
The Board received and considered expense information regarding the Fund’s various components, including advisory fees, distribution and fees other than advisory and distribution fees, including transfer agent fees, custodian fees, and other miscellaneous fees (e.g., fees for accounting and legal services). The Board considered comparisons of these expenses to the Peer Group median. The Board also received and considered expense information regarding the Fund’s total operating expense ratio (Gross Expense Ratio) and total operating expense ratio after taking the fee waiver arrangement applicable to the Advisory Agreement Rate into account (Net Expense Ratio). The Board received and considered information comparing the Gross Expense Ratio and Net Expense Ratio of the Fund to that of the Peer Group and Category medians. The Board noted that the Fund&# 146;s Net Expense Ratio was inline with the Peer Group median and was not appreciably higher than the Category median. The Board also noted that the Fund’s Gross Expense Ratio was higher than the Category and Peer Group medians.
The Adviser also discussed the Morningstar data and rankings, and other relevant information, for the Fund. Based on the above-referenced considerations and other factors, the Board concluded that the Fund’s overall performance and expense results supported the re-approval of the Advisory Agreements.
The Board also received information about the investment subadvisory fee rate (the Subadvisory Agreement Rate) payable by the Adviser to the Subadviser for investment sub-advisory services. The Board concluded that the Subadvisory Agreement Rate was fair and equitable, based on its consideration of the factors described here.
Profitability
The Board received and considered a detailed profitability analysis of the Adviser based on the Advisory Agreements, as well as on other relationships between the Fund and the Adviser and its affiliates, including the Subadviser. The Board also considered a comparison of the Adviser’s profitability to that of other similar investment advisers whose profitability information is publicly available. The Board concluded that, in light of the costs of providing investment management and other services to the Fund, the profits and other ancillary benefits reported by the Adviser were not unreasonable.
Economies of scale
The Board received and considered general information regarding economies of scale with
| |
| Semiannual report | Money Market Fund | 25 |
respect to the management of the Fund, including the Fund’s ability to appropriately benefit from economies of scale under the Fund’s fee structure. The Board recognized the inherent limitations of any analysis of economies of scale, stemming largely from the Board’s understanding that most of the Adviser’s and Subadviser’s costs are not specific to individual Funds, but rather are incurred across a variety of products and services. To ensure that any economies are reasonably shared with the Fund as its assets increase, the Adviser and the Board agreed to continue the existing breakpoints to the Advisory Agreement Rate.
Information about services to other clients
The Board also received information about the nature, extent and quality of services and fee rates offered by the Adviser and Subadviser to their other clients, including other registered investment companies, institutional investors and separate accounts. The Board concluded that the Advisory Agreement Rate and the Subadvisory Agreement Rate were not unreasonable, taking into account fee rates offered to others by the Adviser and Subadviser, respectively, after giving effect to differences in services.
Other benefits to the Adviser
The Board received information regarding potential “fall-out” or ancillary benefits received by the Adviser and its affiliates, including the Subadviser, as a result of their relationship with the Fund. Such benefits could include, among others, benefits directly attributable to the relationship of the Adviser and Subadviser with the Fund and benefits potentially derived from an increase in business as a result of their relationship with the Fund (such as the ability to market to shareholders other financial products offered by the Adviser and its affiliates).
Other factors and broader review
As discussed above, the Board reviewed detailed materials received from the Adviser and Subadviser as part of the annual re-approval process. The Board also regularly reviews and assesses the quality of the services that the Fund receives throughout the year. In this regard, the Board reviews reports of the Adviser and Subadviser at least quarterly, which include, among other things, fund performance reports and compliance reports. In addition, the Board meets with portfolio managers and senior investment officers at various times throughout the year.
After considering the above-described factors and based on its deliberations and its evaluation of the information described above, the Board concluded that approval of the continuation of the Advisory Agreements for the Fund was in the best interest of the Fund and its shareholders. Accordingly, the Board unanimously approved the continuation of the Advisory Agreements.
| |
| 26 | Money Market Fund | Semiannual report |
Special Shareholder Meeting (Unaudited)
On April 16, 2009, a Special Meeting of the Shareholders of John Hancock Current Interest and its series, John Hancock Money Market Fund, was held at 601 Congress Street, Boston, Massachusetts for the purpose of considering and voting on:
Proposal 1: Election of eleven Trustees as members of the Board of Trustees of John Hancock Current Interest (the “Trust”).
PROPOSAL 1 PASSED FOR ALL TRUSTEES ON APRIL 16, 2009.
1. Election of eleven Trustees as members of the Board of Trustees of the Trust:
| | | | | | |
| | | |
| | | | % of Outstanding | | % of Shares |
| | | No. of Shares | | Shares | | Present |
|
| |
| James R. Boyle | | | |
| Affirmative | 267,204,870.8023 | 57.868% | 94.715% |
| Withhold | 14,910,876.3277 | 3.229% | 5.285% |
| TOTAL | 282,115,747.1300 | 61.097% | 100.000% |
| |
| John G. Vrysen | | | |
| Affirmative | 267,917,644.7062 | 58.022% | 94.967% |
| Withhold | 14,198,102.4238 | 3.075% | 5.033% |
| TOTAL | 282,115,747.1300 | 61.097% | 100.000% |
| |
| James F. Carlin | | | |
| Affirmative | 261,670,989.5460 | 56.669% | 92.753% |
| Withhold | 20,444,757.5840 | 4.428% | 7.247% |
| TOTAL | 282,115,747.1300 | 61.097% | 100.000% |
| |
| William H. Cunningham | | | |
| Affirmative | 267,980,751.8962 | 58.036% | 94.990% |
| Withhold | 14,134,995.2338 | 3.061% | 5.010% |
| TOTAL | 282,115,747.1300 | 61.097% | 100.000% |
| |
| Deborah Jackson | | | |
| Affirmative | 266,884,407.7241 | 57.798% | 94.601% |
| Withhold | 15,231,339.4059 | 3.299% | 5.399% |
| TOTAL | 282,115,747.1300 | 61.097% | 100.000% |
| |
| Charles L. Ladner | | | |
| Affirmative | 263,099,221.9629 | 56.979% | 93.259% |
| Withhold | 19,016,525.1671 | 4.118% | 6.741% |
| TOTAL | 282,115,747.1300 | 61.097% | 100.000% |
| |
| Stanley Martin | | | |
| Affirmative | 267,227,799.0241 | 57.873% | 94.723% |
| Withhold | 14,887,948.1059 | 3.224% | 5.277% |
| TOTAL | 282,115,747.1300 | 61.097% | 100.000% |
| |
| Patti McGill Peterson | | | |
| Affirmative | 267,810,175.6467 | 57.999% | 94.929% |
| Withhold | 14,305,571.4833 | 3.098% | 5.071% |
| TOTAL | 282,115,747.1300 | 61.097% | 100.000% |
| |
| Semiannual report | Money Market Fund | 27 |
| | | | | | |
| | | |
| | | | % of Outstanding | | % of Shares |
| | | No. of Shares | | Shares | | Present |
|
| |
| John A. Moore | | | |
| Affirmative | 261,549,973.2450 | 56.643% | 92.710% |
| Withhold | 20,565,773.8850 | 4.454% | 7.290% |
| TOTAL | 282,115,747.1300 | 61.097% | 100.000% |
| |
| Steven R. Pruchansky | | | |
| Affirmative | 266,162,606.8354 | 57.642% | 94.345% |
| Withhold | 15,953,140.2946 | 3.455% | 5.655% |
| TOTAL | 282,115,747.1300 | 61.097% | 100.000% |
| |
| Gregory A. Russo | | | |
| Affirmative | 267,919,873.4567 | 58.023% | 94.968% |
| Withhold | 14,195,873.6733 | 3.074% | 5.032% |
| TOTAL | 282,115,747.1300 | 61.097% | 100.000% |
Proposal 6: Revision to the Trust’s merger approval requirements
PROPOSAL 6 PASSED ON APRIL 16, 2009.
6. Revision to merger approval requirements for the Trust.
| | | | | | |
| | | |
| | | | % of Outstanding | | % of Shares |
| | | No. of Shares | | Shares | | Present |
|
| |
| Affirmative | 208,035,042.4598 | 45.053% | 73.741% |
| Against | 17,813,496.7927 | 3.858% | 6.314% |
| Abstain | 11,834,614.8775 | 2.563% | 4.195% |
| Broker Non-Votes | 44,432,593.0000 | 9.623% | 5.750% |
| TOTAL | 282,115,747.1300 | 61.097% | 100.000% |
On May 5, 2009, an adjourned session of a Special Meeting of the Shareholders of John Hancock Current Interest and its series, John Hancock Money Market Fund, was held at 601 Congress Street, Boston, Massachusetts for the purpose of considering and voting on:
Proposal 2: Approval of a new form of Advisory Agreement between the Trust and John Hancock Advisers, LLC.
PROPOSAL 2 PASSED ON MAY 5, 2009.
2. Approval of a new form of Advisory Agreement between the Trust and John Hancock Advisers, LLC.
| | | | | | |
| | | |
| | | | % of Outstanding | | % of Shares |
| | | No. of Shares | | Shares | | Present |
|
| |
| Affirmative | 210,430,748.8041 | 45.572% | 74.590% |
| Against | 15,132,043.9223 | 3.277% | 5.364% |
| Abstain | 12,120,362.4036 | 2.625% | 4.296% |
| Broker Non-Votes | 44,432,592.0000 | 9.623% | 15.750% |
| TOTAL | 282,115,747.1300 | 61.097% | 100.000% |
| |
| 28 | Money Market Fund | Semiannual report |
Proposal 3: Approval of the following changes to the Fund’s fundamental investment restrictions:
PROPOSALS 3A-3K PASSED ON MAY 5, 2009.
3. Approval of the following changes to fundamental investment restrictions:
| | | | | | |
| | | |
| | | | % of Outstanding | | % of Shares |
| | | No. of Shares | | Shares | | Present |
|
| |
| 3A. Revise: Concentration | | | |
| |
| Affirmative | 213,151,233.7501 | 46.162% | 75.554% |
| Against | 10,792,995.4100 | 2.337% | 3.826% |
| Abstain | 13,738,925.9699 | 2.975% | 4.870% |
| Broker Non-Votes | 44,432,592.0000 | 9.623% | 15.750% |
| TOTAL | 282,115,747.1300 | 61.097% | 100.000% |
| |
| 3B. Revise: Diversification | | | |
| |
| Affirmative | 214,067,957.2367 | 46.360% | 75.880% |
| Against | 11,373,391.2726 | 2.463% | 4.031% |
| Abstain | 12,241,809.6207 | 2.651% | 4.339% |
| Broker Non-Votes | 44,432,589.0000 | 9.623% | 15.750% |
| TOTAL | 282,115,747.1300 | 61.097% | 100.000% |
| |
| 3C. Revise: Underwriting | | | |
| |
| Affirmative | 208,310,897.8396 | 45.113% | 73.839% |
| Against | 16,675,672.8151 | 3.611% | 5.911% |
| Abstain | 12,696,585.4753 | 2.750% | 4.500% |
| Broker Non-Votes | 44,432,591.0000 | 9.623% | 15.750% |
| TOTAL | 282,115,747.1300 | 61.097% | 100.000% |
| |
| 3D. Revise: Real Estate | | | |
| |
| Affirmative | 211,584,924.8074 | 45.822% | 74.999% |
| Against | 13,231,317.0630 | 2.865% | 4.690% |
| Abstain | 12,866,913.2596 | 2.787% | 4.561% |
| Broker Non-Votes | 4,432,592.0000 | 9.623% | 15.750% |
| TOTAL | 282,115,747.1300 | 61.097% | 100.000% |
| |
| 3E. Revise: Loans | | | |
| |
| Affirmative | 204,385,398.5373 | 44.263% | 72.447% |
| Against | 18,211,355.0740 | 3.944% | 6.455% |
| Abstain | 15,086,399.5187 | 3.267% | 5.348% |
| Broker Non-Votes | 4,432,594.0000 | 9.623% | 15.750% |
| TOTAL | 282,115,747.1300 | 61.097% | 100.000% |
| |
| 3F. Revise: Senior Securities | | | |
| |
| Affirmative | 207,135,062.8514 | 44.858% | 73.421% |
| Against | 17,802,926.8608 | 3.856% | 6.311% |
| Abstain | 12,745,165.4178 | 2.760% | 4.518% |
| Broker Non-Votes | 44,432,592.0000 | 9.623% | 15.750% |
| TOTAL | 282,115,747.1300 | 61.097% | 100.000% |
| |
| Semiannual report | Money Market Fund | 29 |
| | | | | | |
| | | |
| | | | % of Outstanding | | % of Shares |
| | | No. of Shares | | Shares | | Present |
|
| |
| 3G. Eliminate: Oil, Gas & Mineral Programs | | |
| |
| Affirmative | 205,969,401.3669 | 44.606% | 73.008% |
| Against | 18,668,998.3459 | 4.043% | 6.618% |
| Abstain | 13,044,759.4172 | 2.825% | 4.624% |
| Broker Non-Votes | 44,432,588.0000 | 9.623% | 15.750% |
| TOTAL | 282,115,747.1300 | 61.097% | 100.000% |
| |
| 3H. Eliminate: Investment to Exercise Control | | |
| |
| Affirmative | 208,344,122.3683 | 45.120% | 73.850% |
| Against | 15,445,377.5789 | 3.345% | 5.475% |
| Abstain | 13,893,655.1828 | 3.009% | 4.925% |
| Broker Non-Votes | 44,432,592.0000 | 9.623% | 15.750% |
| TOTAL | 282,115,747.1300 | 61.097% | 100.000% |
| |
| 3I. Eliminate: Trustee and Officer Ownership | | |
| |
| Affirmative | 205,848,128.3750 | 44.579% | 72.966% |
| Against | 16,902,856.4260 | 3.661% | 5.991% |
| Abstain | 14,932,168.3290 | 3.234% | 5.293% |
| Broker Non-Votes | 44,432,594.0000 | 9.623% | 15.750% |
| TOTAL | 282,115,747.1300 | 61.097% | 100.000% |
| |
| 3J. Eliminate: Margin Investment; Short Selling | | |
| |
| Affirmative | 202,786,242.7381 | 43.916% | 71.881% |
| Against | 22,776,096.2289 | 4.933% | 8.073% |
| Abstain | 12,120,819.1630 | 2.625% | 4.296% |
| Broker Non-Votes | 44,432,589.0000 | 9.623% | 15.750% |
| TOTAL | 282,115,747.1300 | 61.097% | 100.000% |
| |
| 3K. Eliminate: Restricted Securities | | |
| |
| Affirmative | 204,728,152.5790 | 44.337% | 72.568% |
| Against | 20,371,214.0257 | 4.412% | 7.221% |
| Abstain | 12,583,789.5253 | 2.725% | 4.461% |
| Broker Non-Votes | 4,432,591.0000 | 9.623% | 15.750% |
| TOTAL | 282,115,747.1300 | 61.097% | 100.000% |
Proposal 4: Approval of amendments changing Rule 12b-1 Plans for certain classes of the Fund from “reimbursement” to “compensation” plans.
PROPOSAL 4 CLASSES A AND B PASSED ON MAY 5, 2009.
4. Approval of amendments changing Rule 12b-1 Plans for certain classes of the Fund from “reimbursement” to “compensation” Plans.
| | | | | | |
| Class A | | | |
| | | | % of Outstanding | | % of Shares |
| | | No. of Shares | | Shares | | Present |
|
| |
| Affirmative | 168,488,059.4442 | 44.078% | 75.269% |
| Against | 13,107,490.2095 | 3.429% | 5.856% |
| Abstain | 9,870,604.2763 | 2.582% | 4.410% |
| Broker Non-Votes | 32,379,230.0000 | 8.471% | 14.465% |
| TOTAL | 223,845,383.9300 | 58.560% | 100.000% |
| |
| 30 | Money Market Fund | Semiannual report |
Class B
| | | | | | |
| | | |
| | | | % of Outstanding | | % of Shares |
| | | No. of Shares | | Shares | | Present |
|
| |
| Affirmative | 21,869,431.3024 | 52.048% | 68.710% |
| Against | 2,085,760.1502 | 4.964% | 6.553% |
| Abstain | 878,851.8384 | 2.092% | 2.761% |
| Broker Non-Votes | 6,994,879.0000 | 16.648% | 21.976% |
| TOTAL | 31,828,922.2910 | 75.752% | 100.000% |
| |
| Class C | | | |
| |
| Affirmative | 15,065,845.5384 | 40.191% | 56.978% |
| Against | 3,864,911.5965 | 10.311% | 14.617% |
| Abstain | 2,452,199.7741 | 6.542% | 9.274% |
| Broker Non-Votes | 5,058,484.0000 | 13.495% | 19.131% |
| TOTAL | 26,441,440.9090 | 70.539% | 100.000% |
Proposal 5: Approval of adopting a manager of manager structure.
PROPOSAL 5 PASSED ON MAY 5, 2009.
5. Approval of the Fund adopting a manager of manager structure.
| | | | | | |
| | | |
| | | | % of Outstanding | | % of Shares |
| | | No. of Shares | | Shares | | Present |
|
| |
| Affirmative | 205,531,089.2346 | 44.511% | 72.854% |
| Against | 20,107,571.6657 | 4.355% | 7.127% |
| Abstain | 12,044,492.2297 | 2.608% | 4.269% |
| Broker Non-Votes | 4,432,594.0000 | 9.623% | 15.750% |
| TOTAL | 282,115,747.1300 | 61.097% | 100.000% |
| |
| Semiannual report | Money Market Fund | 31 |
More information
| |
| Trustees | Investment adviser |
| Patti McGill Peterson, Chairperson | John Hancock Advisers, LLC |
| James R. Boyle† | |
| James F. Carlin | Subadviser |
| William H. Cunningham | MFC Global Investment |
| Deborah C. Jackson* | Management (U.S.), LLC |
| Charles L. Ladner | |
| Stanley Martin* | Principal distributor |
| Dr. John A. Moore | John Hancock Funds, LLC |
| Steven R. Pruchansky†† | |
| Gregory A. Russo | Custodian |
| John G. Vrysen† | State Street Bank and Trust Company |
| |
| Officers | Transfer agent |
| Keith F. Hartstein | John Hancock Signature Services, Inc. |
| President and Chief Executive Officer | |
| Legal counsel |
| Andrew G. Arnott‡ | K&L Gates LLP |
| Chief Operating Officer | |
| | |
| Thomas M. Kinzler | |
| Secretary and Chief Legal Officer | |
| | |
| Francis V. Knox, Jr. | |
| Chief Compliance Officer | |
| | |
| Michael J. Leary | |
| Treasurer | |
| | |
| Charles A. Rizzo | |
| Chief Financial Officer | |
*Member of the Audit Committee
††Member of the Audit Committee effective 9-1-09
†Non-Independent Trustee
‡Effective 9-1-09
The Fund’s proxy voting policies and procedures, as well as the Fund’s proxy voting record for the most recent twelve-month period ended June 30, are available free of charge on the Securities and Exchange Commission (SEC) Web site at www.sec.gov or on our Web site.
The Fund’s complete list of portfolio holdings, for the first and third fiscal quarters, is filed with the SEC on Form N-Q. The Fund’s Form N-Q is available on our Web site and the SEC’s Web site, www.sec.gov, and can be reviewed and copied (for a fee) at the SEC’s Public Reference Room in Washington, DC. Call 1-800-SEC-0330 to receive information on the operation of the SEC’s Public Reference Room.
We make this information on your fund, as well as monthly portfolio holdings, and other fund details available on our Web site www.jhfunds.com or by calling 1-800-225-5291.
| | |
| You can also contact us: | | |
| 1-800-225-5291 | Regular mail: | Express mail: |
| jhfunds.com | John Hancock Signature Services, Inc. | John Hancock Signature Services, Inc. |
| | P.O. Box 9510 | Mutual Fund Image Operations |
| | Portsmouth, NH 03802-9510 | 164 Corporate Drive |
| | | Portsmouth, NH 03801 |
|
| |
| 32 | Money Market Fund | Semiannual report |

1-800-225-5291
1-800-554-6713 TDD
1-800-338-8080 EASI-Line
www.jhfunds. com
Now available:electronic delivery
www.jhfunds.com/edelivery
| |
| This report is for the information of the shareholders of John Hancock Money Market Fund. | 440SA 9/09 |
| It is not authorized for distribution to prospective investors unless preceded or accompanied by a prospectus. | 11/09 |
ITEM 2. CODE OF ETHICS.
Not applicable at this time.
ITEM 3. AUDIT COMMITTEE FINANCIAL EXPERT.
Not applicable at this time.
ITEM 4. PRINCIPAL ACCOUNTANT FEES AND SERVICES.
Not applicable at this time.
ITEM 5. AUDIT COMMITTEE OF LISTED REGISTRANTS.
Not applicable at this time.
ITEM 6. SCHEDULE OF INVESTMENTS.
Not applicable.
ITEM 7. DISCLOSURE OF PROXY VOTING POLICIES AND PROCEDURES FOR CLOSED-END MANAGEMENT INVESTMENT COMPANIES.
Not applicable.
ITEM 8. PORTFOLIO MANAGERS OF CLOSED-END MANAGEMENT INVESTMENT COMPANIES.
Not applicable.
ITEM 9. PURCHASES OF EQUITY SECURITIES BY CLOSED-END MANAGEMENT INVESTMENT COMPANY AND AFFILIATED PURCHASERS.
Not applicable.
ITEM 10. SUBMISSION OF MATTERS TO A VOTE OF SECURITY HOLDERS.
Not applicable.
ITEM 11. CONTROLS AND PROCEDURES.
(a) Based upon their evaluation of the registrant's disclosure controls and procedures as conducted within 90 days of the filing date of this Form N-CSR, the registrant's principal executive officer and principal financial officer have concluded that those disclosure controls and procedures provide reasonable assurance that the material information required to be disclosed by the registrant on this report is recorded, processed, summarized and reported within the time periods specified in the Securities and Exchange Commission's rules and forms.
(b) There were no changes in the registrant's internal control over financial reporting that occurred during the registrant's most recent fiscal half-year (the registrant's second fiscal half-year in the case of an annual report) that have materially affected, or are reasonably likely to materially affect, the registrant's internal control over financial reporting.
ITEM 12. EXHIBITS.
(a)(1) Separate certifications for the registrant's principal executive officer and principal financial officer, as required by Section 302 of the Sarbanes-Oxley Act of 2002 and Rule 30a-2(a) under the Investment Company Act of 1940, are attached.
(b)(1) Separate certifications for the registrant's principal executive officer and principal financial officer, as required by 18 U.S.C. Section 1350, as adopted pursuant to Section 906 of the Sarbanes-Oxley Act of 2002, and Rule 30a-2(b) under the Investment Company Act of 1940, are attached. The certifications furnished pursuant to this paragraph are not deemed to be "filed" for purposes of Section 18 of the Securities Exchange Act of 1934, or otherwise subject to the liability of that section. Such certifications are not deemed to be incorporated by reference into any filing under the Securities Act of 1933 or the Securities Exchange Act of 1934, except to the extent that the Registrant specifically incorporates them by reference.
(c)(1) Contact person at the registrant.
Pursuant to the requirements of the Securities Exchange Act of 1934 and the Investment Company Act of 1940, the registrant has duly caused this report to be signed on its behalf by the undersigned, thereunto duly authorized.
John Hancock Current Interest
By: /s/ Keith F. Hartstein
-------------------------------------
Keith F. Hartstein
President and Chief Executive Officer
Date: November 23, 2009
Pursuant to the requirements of the Securities Exchange Act of 1934 and the Investment Company Act of 1940, this report has been signed below by the following persons on behalf of the registrant and in the capacities and on the dates indicated.
By: /s/ Keith F. Hartstein
-------------------------------------
Keith F. Hartstein
President and Chief Executive Officer
Date: November 23, 2009
By: /s/ Charles A. Rizzo
-------------------------------------
Charles A. Rizzo
Chief Financial Officer
Date: November 23, 2009