UNITED STATES
SECURITIES AND EXCHANGE COMMISSION
Washington, D.C. 20549
FORM N-CSR
CERTIFIED SHAREHOLDER REPORT OF REGISTERED
MANAGEMENT INVESTMENT COMPANIES
Investment Company Act file number 811- 2485
John Hancock Current Interest
(Exact name of registrant as specified in charter)
601 Congress Street, Boston, Massachusetts 02210
(Address of principal executive offices) (Zip code)
Alfred P. Ouellete, Senior Counsel and Assistant Secretary
601 Congress Street
Boston, Massachusetts 02210
(Name and address of agent for service)
Registrant's telephone number, including area code: 617-663-4324
| |
| Date of fiscal year end: | March 31 |
| | |
| | |
| Date of reporting period: | September 30, 2007 |
ITEM 1. REPORT TO SHAREHOLDERS.


|
| TABLE OF CONTENTS |
|
| Your fund at a glance |
| page 1 |
|
| Managers’ report |
| page 2 |
|
| Your expenses |
| page 6 |
|
| Fund’s investments |
| page 8 |
|
| Financial statements |
| page 12 |
|
| Notes to financial |
| statements |
| page 18 |
|
| For more information |
| page 28 |
|
CEO corner
To Our Shareholders,
Volatility returned to the U.S. stock market in the six-month period ended September 30, 2007; however, stocks still posted a strong gain of 8.44%, as measured by the Standard & Poor’s 500 Index. The market experienced a particularly sharp downturn in late July and mid-August, as the sub-prime mortgage market’s woes took center stage. Subprime mortgages are loans made to home buyers with shaky credit histories. Rising defaults and an ensuing credit crunch caused heightened fears about their potential impact on U.S. economic growth. But investors took comfort in subsequent interest rate cuts by the Federal Reserve and the market rebounded through September. Year-to-date, the S&P 500 Index is up 9.13% .
In this six-month period, subprime mortgage turmoil even sent ripples across the typically calm waters of money market funds. At the same time that many investors flocked to money market funds as a safe haven, others defected, worried that their funds were exposed to subprime debt through investments in asset-backed commercial paper. That said, money market funds are known for their safety of principal and that remained the case in this period.
The results were not so positive for a small number of ultra-short- and short-term bond funds, which have long been touted as money-market substitutes with higher yields. These funds sometimes provide higher yields, yet are still supposed to be the most conservative, low risk bond funds around.
What occurred, however, was that a relative handful of these funds were stretching for higher income by taking on greater credit risk than money market funds through investments in subprime mortgages. While much of what these funds owned was high-quality subprime debt rated AA or AAA, panicked investors fled them, forcing the funds to sell into an abysmal market in which any subprime issue was shunned. As a result, a few of these funds actually posted negative returns during the height of the subprime crisis.
The lesson is clear to us. Stretching for yield can, and often does, bear added risk that may only become apparent in extreme circumstances. Russell Kinnell, of Morningstar, Inc., an independent mutual fund rating agency, recently wrote that ultra-short- and short-term bond funds “make lousy money market substitutes. If what you really need is a money market where the principal value never wavers, then reintroduce yourself to money markets.”
We agree with Morningstar. Especially in an increasingly volatile environment, money market funds can be a valuable asset in a diversified portfolio, serving as ballast to offset the short-term gyrations that may be occurring in other parts of your portfolio.
Sincerely,

Keith F. Hartstein,
President and Chief Executive Officer
This commentary reflects the CEO’s views as of September 30, 2007. They are subject to change at any time.
Your fund at a glance
The Fund seeks the maximum current income that is consistent with maintaining liquidity and preserving capital by investing in U.S. dollar-denominated securities rated within the two highest short-term credit categories and their unrated equivalents. The Fund intends to maintain a stable $1 share price.
Over the last six months
► Money market fund yields began to fall at the end of the period after the Federal Reserve cut a key short-term interest rate.
► Turmoil in the subprime mortgage market rocked financial markets in the summer. The Fund had no direct exposure to subprime mortgages.
► The Fund anticipated the Fed’s interest rate cut and extended the Fund’s average maturity in advance to lock in higher rates for a longer period.
1
Managers’ report
John Hancock
Money Market Fund
Recently, shareholders of U.S. Government Cash Reserve voted to merge their fund into John Hancock Money Market Fund. The merger occurred at the end of the business day September 14, 2007.
Money market yields began to fall toward the end of the six months ended September 30, 2007, as the period was marked by major changes in the future outlook for the U.S. economy. Back in May, the Federal Reserve Board signaled that economic growth in the first part of the year had slowed, but that they were still more concerned about core inflation remaining elevated.
Fast forward to the end of July, and the start of a major credit crunch, and the focus had shifted to the deteriorating financial market conditions and the increasing losses stemming from the subprime mortgage market, which provides loans to borrowers with shaky credit histories. Sales of new and existing single-family homes continued to decline to levels unseen since 2001. The credit crunch, combined with lower home prices, had reduced availability of financing to mortgage borrowers even with relatively good credit ratings. This touched off fears that asset-backed commercial paper programs that invest in bundled mortgage products could start incurring losses. Indeed, some of the riskier asset-backed commercial paper programs did run into trouble, as it became more difficult for them to find investors for their maturing commercial paper positions. This caused some programs to extend and/or default.
In this environment of tightening credit, the Federal Reserve in September cut its important short-term federal funds rate, which banks charge each other for overnight loans, by 0.50%, to 4.75% — its first fed funds rate cut since June 2003. Money market securities, whose pricing
2
Portfolio Managers, MFC Global Investment Management (U.S.), LLC
David A. Bees and Michael V. Lorizio
is pegged to the fed funds rate, reacted, and their yields began to move down as well.
Fund yield and performance
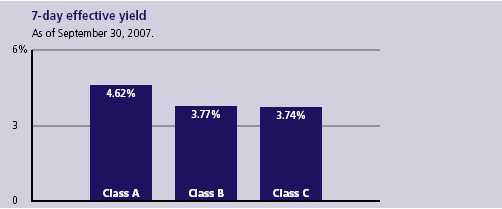
On September 30, 2007, John Hancock Money Market Fund’s Class A, Class B and Class C shares had 7-day effective yields of 4.62%, 3.77% and 3.74%, respectively. By comparison, the average taxable money market fund had a 7-day effective yield of 4.55%, according to Lipper, Inc.
“Money market yields began to
fall toward the end of the six
months ended September 30,
2007, as the period was marked
by major changes in the future
outlook for the U.S. economy.”
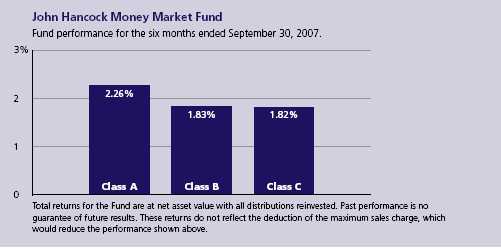
For the six months ended September 30, 2007, the Fund’s Class A, Class B and Class C shares posted total returns of 2.26%, 1.83% and 1.82%, respectively, at net asset value, compared with the 2.26% return of the average taxable money market fund, according to Lipper, Inc.1 Keep in mind that your net asset value return will be different from the Fund’s performance if you were not invested in the Fund for the entire period or did not reinvest all distributions.
Portfolio review
After a very stable first half of the period, the second half, which encompassed the third quarter of 2007, proved to be a very volatile period for money market funds. Bearish economic data and an extreme credit crunch in the asset-backed commercial paper sector made for difficult trading in an unsettled market. The Fund weathered the storm well, as its third quarter performance was positively impacted by the use of short, fixed-rate corporate securities, floating-rate corporate securities, asset-backed commercial paper and select tier–2 commercial paper.
Money Market Fund
3
“We also benefited from having anticipated the rate cut by the Federal Reserve.”
The Fund did have some short-term exposure to asset-backed commercial paper programs, which are typically a staple investment for money market funds because of their relatively higher yields and high credit quality. However, we invested only in securities that had full liquidity support provided by large, Aa2-rated banks and the Fund had no direct exposure to the subprime mortgage market. That said, we cut our asset-backed exposure in half over the period to give the market time to normalize before we moved back into the sector. All of the programs in which we invest continue to maintain their stellar credit ratings and performance records.
We also benefited from having anticipated the rate cut by the Federal Reserve. As a result, we had extended our average days-to-maturity out significantly longer than our peers. Thus, we locked in the pre rate-cut levels for a large portion of the portfolio for a longer time.
Outlook
As the fourth quarter begins, we believe that, while credit conditions have improved since mid-August, many risks remain for the economy and financial markets. To take advantage of this expected flat-to-decreasing interest rate environment, we continue to have the Fund positioned with a longer-than-average weighted-average maturity.
| |
| SECTOR DISTRIBUTION2 |
| Financial | 71% |
| Telecommunication | |
| services | 8% |
| Government agencies | 8% |
| Materials | 6% |
| Consumer staples | 4% |
| Consumer discretionary | 2% |
| Health care | 1% |
The commercial paper markets and, more specifically, the asset-backed commercial paper market, continue to slowly normalize. As always, we will continue to implement the same processes that served the Fund so well during the recent credit crunch. That means we will continue to thoroughly review the credit quality and market liquidity conditions for all future investments opportunities.
In cutting interest rates recently, the Fed put the difficult credit conditions ahead of its inflation concerns, although it has pledged to continue to monitor inflation risks along with economic growth, which may be negatively affected by poor credit conditions and the ongoing housing correction. Fed funds
Money Market Fund
4
futures are pointing toward further rate cuts toward the end of 2007 and, with our average days-to-maturity where they are, we believe that the portfolio is well positioned for the upcoming quarters. In addition to our focus on capturing additional yield, we will strive, as always, to maintain liquidity and preserve stability of principal.
An investment in the Fund is not insured or guaranteed by the Federal Deposit Insurance Corporation or any other government agency. Although the Fund seeks to preserve the value of your investment at $1.00 per share, it is possible to lose money by investing in the Fund.
This commentary reflects the views of the portfolio management team through the end of the Fund’s period discussed in this report. The team’s statements reflect its own opinions. As such, they are in no way guarantees of future events and are not intended to be used as investment advice or a recommendation regarding any specific security. They are also subject to change at any time as market and other conditions warrant.
1 Figures from Lipper, Inc. include reinvested dividends and do not take into account sales charges. Actual load-adjusted performance is lower.
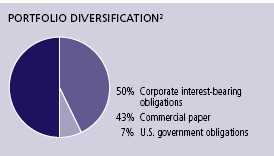
2 As a percentage of net assets on September 30, 2007.
Money Market Fund
5
Your expenses
These examples are intended to help you understand your ongoing operating expenses.
Understanding fund expenses
As a shareholder of the Fund, you incur two types of costs:
▪ Transaction costs which include sales charges (loads) on purchases or redemptions (varies by share class), minimum account fee charge, etc.
▪ Ongoing operating expenses including management fees, distribution and service fees (if applicable), and other fund expenses.
We are going to present only your ongoing operating expenses here.
Actual expenses/actual returns
This example is intended to provide information about your fund’s actual ongoing operating expenses, and is based on your fund’s actual return. It assumes an account value of $1,000.00 on April 1, 2007, with the same investment held until September 30, 2007.
| | | |
| | Account value | Ending value | Expenses paid during period |
| | on 4-1-07 | on 9-30-07 | ended 9-30-071 |
|
| Class A | $1,000.00 | $1,022.60 | $4.55 |
|
| Class B | 1,000.00 | 1,018.30 | 8.78 |
|
| Class C | 1,000.00 | 1,018.20 | 8.78 |
|
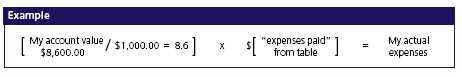
Together with the value of your account, you may use this information to estimate the operating expenses that you paid over the period. Simply divide your account value at September 30, 2007, by $1,000.00, then multiply it by the “expenses paid” for your share class from the table above. For example, for an account value of $8,600.00, the operating expenses should be calculated as follows:
Money Market Fund
6
Hypothetical example for comparison purposes
This table allows you to compare your fund’s ongoing operating expenses with those of any other fund. It provides an example of the Fund’s hypothetical account values and hypothetical expenses based on each class’s actual expense ratio and an assumed 5% annualized return before expenses (which is not your fund’s actual return). It assumes an account value of $1,000.00 on April 1, 2007, with the same investment held until September 30, 2007. Look in any other fund shareholder report to find its hypothetical example and you will be able to compare these expenses.
| | | |
| | Account value | Ending value | Expenses paid during period |
| | on 4-1-07 | on 9-30-07 | ended 9-30-07 1 |
|
| Class A | $1,000.00 | $1,020.50 | $4.55 |
|
| Class B | 1,000.00 | 1,016.30 | 8.77 |
|
| Class C | 1,000.00 | 1,016.30 | 8.77 |
|
Remember, these examples do not include any transaction costs, such as sales charges; therefore, these examples will not help you to determine the relative total costs of owning different funds. If transaction costs were included, your expenses would have been higher. See the prospectus for details regarding transaction costs.
1 Expenses are equal to the Fund’s annualized expense ratio of 0.90%, 1.75% and 1.75% for Class A, Class B and Class C, respectively, multiplied by the average account value over the period, multiplied by number of days in most recent fiscal half-year/365 or 366 (to reflect the one-half year period).
Money Market Fund
7
F I N A N C I A L S T A T E M E N T S
Fund’s investments
Securities owned by the Fund on 9-30-07 (unaudited)
This schedule is divided into four categories: commercial paper, corporate interest-
bearing obligations, U.S. government obligations and short-term investments.
Commercial paper, corporate interest-bearing obligations and U.S. government
obligations are further broken down by industry group. Short-term investments, which
represent the Fund’s cash position, are listed last.
| | | | | | | |
| | | Interest | | Maturity | Credit | Par value | |
| Issuer | | rate | | date | rating (A) | (000) | Value |
|
| Commercial paper 43.59% | | | | | | | $120,387,498 |
| (Cost $120,387,498) | | | | | | | |
| | | | | | | | |
| Asset Backed — Others 6.18% | | | | | | | 17,076,950 |
|
| Old Line Funding, LLC | | 5.650% | | 10-02-07 | Tier 1 | $10,000 | 9,998,431 |
|
| Old Line Funding, LLC | | 5.350 | | 10-04-07 | Tier 1 | 1,079 | 1,078,519 |
|
| Yorktown Capital, LLC | | 5.290 | | 10-01-07 | Tier 1 | 6,000 | 6,000,000 |
| | | | | | | | |
| Asset Backed — Receivables 4.34% | | | | | | | 11,996,222 |
|
| Park Avenue Receivables Corp. | | 5.150 | | 10-03-07 | Tier 1 | 10,000 | 9,997,139 |
|
| Thunder Bay Funding, Inc. LLC | | 5.500 | | 10-04-07 | Tier 1 | 2,000 | 1,999,083 |
| | | | | | |
| Asset Backed — Trade Receivables 1.74% | | | | | 4,800,000 |
|
| Eureka Securitization Plc | | 5.200 | | 10-01-07 | Tier 1 | 4,800 | 4,800,000 |
| | | | | | | | |
| Automobiles and Trucks 0.69% | | | | | | | 1,907,215 |
|
| BMW AG | | 5.250 | | 10-11-07 | Tier 1 | 1,910 | 1,907,215 |
| | | | | | | | |
| Banks — Foreign 10.83% | | | | | | | 29,918,329 |
|
| Bank of Nova Scotia | | 5.620 | | 11-14-07 | Tier 1 | 5,000 | 4,965,656 |
|
| Bankers Trust Corp. | | 5.000 | | 10-01-07 | Tier 1 | 10,000 | 10,000,000 |
|
| Barclays Plc | | 5.100 | | 11-02-07 | Tier 1 | 3,050 | 3,036,173 |
|
| Societe General Group N.A., Inc. | | 5.010 | | 11-20-07 | Tier 1 | 12,000 | 11,916,500 |
| | | | | | | | |
| Banks — U.S. 2.35% | | | | | | | 6,487,656 |
|
| Bank of America Corp. | | 5.280 | | 10-10-07 | Tier 1 | 1,500 | 1,498,020 |
|
| Bank of America Corp. | | 5.330 | | 10-15-07 | Tier 1 | 5,000 | 4,989,636 |
| | | | | | | | |
| Chemicals 2.88% | | | | | | | 7,938,615 |
|
| BASF AG | | 5.380 | | 01-10-08 | Tier 1 | 3,000 | 2,954,718 |
|
| BASF AG | | 5.270 | | 10-23-07 | Tier 1 | 5,000 | 4,983,897 |
| | | | | | | | |
| Diversified Financial Services 0.94% | | | | | | | 2,599,606 |
|
| Textron Financial Corp. | | 5.450 | | 10-02-07 | Tier 2 | 2,600 | 2,599,606 |
| | | | | | | | |
| Finance — Auto Loans 2.22% | | | | | | | 6,138,764 |
|
| American Honda Finance Corp. | | 5.270 | | 10-18-07 | Tier 1 | 2,000 | 1,995,023 |
|
| American Honda Finance Corp. | | 5.290 | | 11-19-07 | Tier 1 | 1,661 | 1,649,040 |
|
| Volkswagen AG | | 5.450 | | 10-15-07 | Tier 2 | 2,500 | 2,494,701 |
| | | | | | | | |
| Finance — Consumer Loans 2.53% | | | | | | | 6,984,445 |
|
| John Deere Capital Corp. | | 5.000 | | 10-17-07 | Tier 1 | 7,000 | 6,984,445 |
See notes to financial statements
Money Market Fund
8
F I N A N C I A L S T A T E M E N T S
| | | | | | | |
| | | Interest | | Maturity | Credit | Par value | |
| Issuer | | rate | | date | rating (A) | (000) | Value |
| | | | | | | | |
| Food 2.79% | | | | | | | $7,708,664 |
|
| Kraft Foods, Inc. | | 5.450% | | 10-09-07 | Tier 2 | $2,000 | 1,997,578 |
|
| Nestle SA | | 5.300 | | 10-09-07 | Tier 1 | 2,212 | 2,209,395 |
|
| Nestle SA | | 5.300 | | 11-13-07 | Tier 1 | 3,524 | 3,501,691 |
| | | | | | | | |
| Household Products 1.54% | | | | | | | 4,262,632 |
|
| Proctor & Gamble, Inc. | | 5.220 | | 11-06-07 | Tier 1 | 4,285 | 4,262,632 |
| | | | | | |
| Investment Banking & Brokerage 2.53% | | | | | 6,991,771 |
|
| Merrill Lynch & Co., Inc. | | 5.290 | | 10-09-07 | Tier 1 | 7,000 | 6,991,771 |
| | | | |
| Medical — Health Maintenance Organization 0.94% | | | 2,600,000 |
|
| Wellpoint, Inc. | | 5.500 | | 10-01-07 | Tier 2 | 2,600 | 2,600,000 |
| | | | | | | | |
| Multimedia 0.73% | | | | | | | 1,999,167 |
|
| Walt Disney Co. (The) | | 5.000 | | 10-04-07 | Tier 2 | 2,000 | 1,999,167 |
| | | | | | |
| Oil and Gas Exploration & Production 0.36% | | | | | 977,462 |
|
| Chevron Corp. | | 5.200 | | 11-09-07 | Tier 1 | 983 | 977,462 |
| | | | | | | | |
| | | Interest | | Maturity | Credit | Par value | |
| Issuer | | rate | | date | rating (A) | (000) | Value |
| Corporate interest-bearing obligations 49.84% | | | | | $137,647,854 |
|
| (Cost $137,647,854) | | | | | | | |
| | | | | | | | |
| Asset Backed — Auto Loan 2.54% | | | | | | | 7,023,376 |
|
| Capital Auto Receivables Asset Trust (S) | | 5.605% | | 08-15-08 | Tier 1 | $2,069 | 2,068,971 |
|
| Capital Auto Receivables Asset Trust (S) | | 5.264 | | 09-15-08 | Tier 1 | 2,870 | 2,870,000 |
|
| Honda Auto Receivables Owners Trust | | 5.565 | | 04-15-08 | Tier 1 | 469 | 469,405 |
|
| Hyundai Auto Receivables Trust | | 5.290 | | 10-15-08 | Tier 1 | 1,615 | 1,615,000 |
| | | | | | | | |
| Banks — Foreign 0.54% | | | | | | | 1,496,290 |
|
| Credit Suisse USA, Inc. | | 4.625 | | 01-15-08 | Tier 1 | 1,500 | 1,496,290 |
| | | | | | | | |
| Banks — U.S. 2.05% | | | | | | | 5,650,472 |
|
| Bank of America Corp. | | 6.625 | | 10-15-07 | Tier 1 | 500 | 500,127 |
|
| Bankers Trust Corp. | | 6.700 | | 10-01-07 | Tier 1 | 1,500 | 1,500,000 |
|
| FleetBoston Financial Corp. | | 4.200 | | 11-30-07 | Tier 1 | 2,660 | 2,654,835 |
|
| Wells Fargo & Company | | 4.125 | | 03-10-08 | Tier 1 | 1,000 | 995,510 |
| | | | | | | | |
| Chemicals 3.38% | | | | | | | 9,327,952 |
|
| E. I. du Pont de Nemours & Co. | | 3.375 | | 11-15-07 | Tier 1 | 9,350 | 9,327,952 |
| | | | | | | | |
| Diversified Financial Services 9.54% | | | | | | | 26,353,904 |
|
| Citigroup, Inc. (P) | | 5.409 | | 05-02-08 | Tier 1 | 1,200 | 1,200,019 |
|
| Citigroup, Inc. | | 3.500 | | 02-01-08 | Tier 1 | 3,000 | 2,982,351 |
|
| Citigroup, Inc. (P) | | 5.416 | | 11-01-07 | Tier 1 | 2,000 | 2,000,401 |
|
| Citigroup, Inc. | | 4.200 | | 12-20-07 | Tier 1 | 1,000 | 997,312 |
|
| Citigroup Global Markets, Inc. (P) | | 5.760 | | 03-07-08 | Tier 1 | 5,000 | 4,999,644 |
|
| General Electric Capital Corp. (P) | | 5.563 | | 05-19-08 | Tier 1 | 450 | 449,806 |
|
| General Electric Capital Corp. | | 4.250 | | 01-15-08 | Tier 1 | 750 | 747,451 |
|
| General Electric Capital Corp. | | 6.500 | | 12-10-07 | Tier 1 | 4,745 | 4,753,166 |
|
| Principle Life Insurance (S) | | 3.625 | | 04-30-08 | Tier 1 | 3,250 | 3,223,530 |
|
| Principle Life Insurance (P) | | 5.390 | | 12-07-07 | Tier 1 | 5,000 | 5,000,224 |
See notes to financial statements
Money Market Fund
9
F I N A N C I A L S T A T E M E N T S
| | | | | | | |
| | | Interest | | Maturity | Credit | Par value | |
| Issuer | | rate | | date | rating (A) | (000) | Value |
| | | | | | | |
| Finance — Commercial 3.33% | | | | | | | $9,197,314 |
|
| CIT Group, Inc. | | 5.500% | | 11-30-07 | Tier 1 | $9,196 | 9,197,314 |
| | | | | | | | |
| Finance — Consumer Loans 6.38% | | | | | | | 17,619,555 |
|
| American General Finance Corp. | | 4.500 | | 11-15-07 | Tier 1 | 10,150 | 10,138,963 |
|
| HBSC Finance Corp. (P) | | 5.400 | | 10-04-07 | Tier 1 | 2,000 | 2,000,012 |
|
| John Deere Capital Corp. | | 4.500 | | 08-25-08 | Tier 1 | 3,000 | 2,980,580 |
|
| John Deere Capital Corp. | | 3.375 | | 10-01-07 | Tier 1 | 2,500 | 2,500,000 |
| | | | | | | | |
| Finance — Credit Card 4.92% | | | | | | | 13,596,411 |
|
| American Express Co. (P) | | 5.614 | | 10-18-07 | Tier 1 | 5,000 | 5,000,008 |
|
| American Express Co. | | 3.750 | | 11-20-07 | Tier 1 | 2,602 | 2,596,225 |
|
| American Express Co. (P) | | 6.002 | | 09-17-08 | Tier 1 | 4,500 | 4,500,000 |
|
| American Express Co. (P) | | 5.833 | | 11-16-07 | Tier 1 | 1,500 | 1,500,178 |
| | | | | | |
| Investment Banking & Brokerage 8.41% | | | | | 23,218,948 |
|
| Bear Stearns Co., Inc. | | 4.000 | | 01-31-08 | Tier 1 | 2,666 | 2,653,207 |
|
| Goldman Sachs Group, Inc. (P) | | 5.485 | | 10-05-07 | Tier 1 | 7,250 | 7,250,115 |
|
| JPMorgan Chase & Co. (P) | | 5.430 | | 01-25-08 | Tier 1 | 5,000 | 5,001,686 |
|
| JPMorgan Chase & Co. | | 4.000 | | 02-01-08 | Tier 1 | 1,000 | 996,461 |
|
| Lehman Brothers Holdins, Inc. | | 4.000 | | 01-22-08 | Tier 1 | 4,340 | 4,321,050 |
|
| Merrill Lynch & Co., Inc. | | 4.000 | | 11-15-07 | Tier 1 | 2,000 | 1,996,355 |
|
| Merrill Lynch & Co., Inc. (P) | | 5.485 | | 10-19-07 | Tier 1 | 1,000 | 1,000,074 |
| | | | | | |
| Machinery — Construction & Mining 0.82% | | | | | 2,252,134 |
|
| Caterpillar, Inc. | | 2.700 | | 07-15-08 | Tier 1 | 1,494 | 1,467,134 |
|
| Caterpillar Financial Asset Trust | | 5.672 | | 09-25-08 | Tier 1 | 785 | 785,000 |
| | | | | | | | |
| Telecommunication Services 7.93% | | | | | | | 21,911,498 |
|
| AT&T, Inc. (P) | | 5.647 | | 05-15-08 | Tier 1 | 4,298 | 4,299,758 |
|
| BellSouth Corp. (P) | | 5.682 | | 11-15-07 | Tier 1 | 8,000 | 8,001,409 |
|
| Verizon Communications, Inc. | | 4.000 | | 01-15-08 | Tier 1 | 9,650 | 9,610,331 |
| |
| | | Interest | | Maturity | Credit | Par value | |
| Issuer | | rate | | date | rating (A) | (000) | Value |
| U.S. government obligations 7.46% | | | | | | | $20,607,589 |
| (Cost $20,607,589) | | | | | | | |
|
| Government U.S. Agency 7.46% | | | | | | | 20,607,589 |
|
| Federal Home Loan Bank | | 5.400% | | 04-09-08 | Tier 1 | $4,000 | 4,000,000 |
|
| Federal Home Loan Bank | | 5.375 | | 08-20-08 | Tier 1 | 7,090 | 7,090,000 |
|
| Federal Home Loan Bank | | 5.280 | | 08-28-08 | Tier 1 | 1,325 | 1,325,000 |
|
| Federal Home Loan Bank | | 5.270 | | 11-21-07 | Tier 1 | 1,115 | 1,114,887 |
|
| Federal Home Loan Bank | | 5.250 | | 10-22-07 | Tier 1 | 4,250 | 4,250,000 |
|
| Federal Home Loan Bank | | 4.125 | | 10-19-07 | Tier 1 | 1,170 | 1,169,271 |
|
| Federal Home Loan Mortgage Corp. | | 4.375 | | 11-16-07 | Tier 1 | 500 | 499,439 |
|
| Federal National Mortgage Association | | 6.625 | | 10-15-07 | Tier 1 | 725 | 725,324 |
|
| Federal National Mortgage Association | | Zero | | 10-22-07 | Tier 1 | 435 | 433,668 |
See notes to financial statements
Money Market Fund
10
F I N A N C I A L S T A T E M E N T S
| | | | | | | |
| | | | | | Interest | Par value | |
| Issuer, description, maturity date | | | | | rate | (000) | Value |
|
| Short-term investments 0.04% | | | | | | | $112,000 |
|
| (Cost $112,000) | | | | | | | |
| | | | | | | | |
| Joint Repurchase Agreement 0.04% | | | | | | | 112,000 |
|
| Joint Repurchase Agreement with Barclays Plc dated 9-28-07 at | | | | | | | |
| 3.950% to be repurchased at $112,037 on 10-01-07, collateralized | | | | | | | |
| by $71,959 of U.S. Treasury Inflation Indexed Bond, 3.625%, due | | | | | | | |
| 4-15-28 (valued at $114,240, including interest) | | | | | 3.950% | $112 | 112,000 |
|
| Total investments (Cost $278,754,941) 100.93% | | | | | | | $278,754,941 |
|
| Other assets and liabilities, net (0.93%) | | | | | | | ($2,576,680) |
|
| |
| Total net assets 100.00% | | | | | | | $276,178,261 |
|
The percentage shown for each investment category is the total value of that category as a percentage of the net assets of the Fund.
(A) Quality ratings are unaudited and indicate the categories of eligible securities, as defined by Rule 2a-7 of the Investment Company Act of 1940, owned by the Fund.
(P) Represents rate in effect on September 30, 2007.
(S) This security is exempt from registration under Rule 144A of the Securities Act of 1933. Such securities may be resold, normally to qualified institutional buyers, in transactions exempt from registration. Rule 144A securities amounted to $8,162,501 or 2.96% of the Fund’s net assets as of September 30, 2007.
See notes to financial statements
Money Market Fund
11
Financial statements
F I N A N C I A L S T A T E M E N T S
Statement of assets and liabilities 9-30-07 (unaudited)
This Statement of Assets and Liabilities is the Fund’s balance sheet. It shows the value of what the Fund owns, is due and owes. You’ll also find the net asset value per share.
| |
| Assets | |
|
| Investments at value (cost $278,754,941) | $278,754,941 |
| Cash | 242 |
| Receivable for shares sold | 618,643 |
| Interest receivable | 1,653,332 |
| Other assets | 133,251 |
| Total assets | 281,160,409 |
| |
| Liabilities | |
|
| Payable for investments purchased | 3,509,127 |
| Payable for shares repurchased | 926,486 |
| Dividends payable | 108,474 |
| Payable to affiliates | |
| Management fees | 106,005 |
| Distribution and service fees | 11,816 |
| Other | 122,218 |
| Other payables and accrued expenses | 198,022 |
| Total liabilities | 4,982,148 |
| |
| Net assets | |
|
| Capital paid-in | 276,168,011 |
| Accumulated net realized loss on investments | (1,238) |
| Accumulated net investment income | 11,488 |
| Net assets | $276,178,261 |
| |
| Net asset value per share | |
|
| Based on net asset values and shares outstanding — the Fund has an | |
| unlimited number of shares authorized with no par value | |
| Class A ($237,007,442 ÷ 237,115,785 shares) | $1.00 |
| Class B ($28,705,984 ÷ 28,726,290 shares) | $1.00 |
| Class C ($10,464,835 ÷ 10,465,096 shares) | $1.00 |
See notes to financial statements
Money Market Fund
12
F I N A N C I A L S T A T E M E N T S
Statement of operations For the period ended 9-30-07 (unaudited)1
This Statement of Operations summarizes the Fund’s investment income earned and expenses incurred in operating the Fund.
| |
| Investment income | |
|
| Interest | $6,695,161 |
| | |
| Total investment income | 6,695,161 |
| |
| Expenses | |
|
| Investment management fees (Note 2) | 621,060 |
| Distribution and service fees (Note 2) | 465,236 |
| Transfer agent fees (Note 2) | 299,478 |
| Accounting and legal services fees (Note 2) | 12,422 |
| Compliance fees | 2,783 |
| Blue sky fees | 30,412 |
| Printing fees | 27,469 |
| Custodian fees | 27,075 |
| Professional fees | 16,952 |
| Trustees’ fees | 7,551 |
| Miscellaneous | 8,436 |
| Total expenses | 1,518,874 |
| Less expense reductions (Note 2) | (228,119) |
| Net expenses | 1,290,755 |
| Net investment income | 5,404,406 |
| Increase in net assets from operations | $5,404,406 |
| |
| 1 Semiannual period from 4-1-07 to 9-30-07. | |
See notes to financial statements
Money Market Fund
13
F I N A N C I A L S T A T E M E N T S
Statement of changes in net assets
These Statements of Changes in Net Assets show how the value of the Fund’s net assets
has changed during the last two periods. The difference reflects earnings less expenses,
any investment gains and losses, distributions, if any, paid to shareholders and the net of
Fund share transactions.
| | |
| | Year | Period |
| | ended | ended |
| | 3-31-07 | 9-30-071 |
| |
| Increase in net assets | | |
|
| From operations | | |
| Net investment income | $9,892,200 | $5,404,406 |
| Net realized loss | (45) | — |
| | | |
| Increase in net assets resulting from operations | 9,892,155 | 5,404,406 |
| | | |
| Distributions to shareholders | | |
| From net investment income | | |
| Class A | (8,506,162) | (4,653,790) |
| Class B | (1,110,601) | (531,532) |
| Class C | (275,437) | (219,084) |
| | (9,892,200) | (5,404,406) |
| From Fund share transactions (Note 4) | 6,053,750 | 45,418,185 |
| | | |
| Total increase | 6,053,705 | 45,418,185 |
| |
| Net assets | | |
|
| Beginning of period | 224,706,371 | 230,760,076 |
| End of period2 | $230,760,076 | $276,178,261 |
1 Semiannual period from 4-1-07 to 9-30-07. Unaudited.
2 Includes accumulated net investment income of $11,488 and $11,488, respectively.
See notes to financial statements
Money Market Fund
14
F I N A N C I A L S T A T E M E N T S
Financial highlights
The Financial Highlights show how the Fund’s net asset value for a share has changed
since the end of the previous period.
| | | | | | |
| CLASS A SHARES | | | | | | |
| |
| Period ended | 3-31-031 | 3-31-041 | 3-31-051 | 3-31-06 | 3-31-07 | 9-30-072 |
|
| Per share operating performance | | | | | | |
| Net asset value, beginning of period | $1.00 | $1.00 | $1.00 | $1.00 | $1.00 | $1.00 |
| Net investment income3 | 0.01 | —4 | 0.01 | 0.03 | 0.04 | 0.02 |
| Less distributions | | | | | | |
| From net investment income | (0.01) | —4 | (0.01) | (0.03) | (0.04) | (0.02) |
| Net asset value, end of period | $1.00 | $1.00 | $1.00 | $1.00 | $1.00 | $1.00 |
| Total return5,6 (%) | 0.75 | 0.21 | 0.86 | 2.92 | 4.45 | 2.267 |
| |
| Ratios and supplemental data | | | | | | |
|
| Net assets, end of period | | | | | | |
| (in millions) | $271 | $211 | $224 | $185 | $195 | $237 |
| Ratio of net expenses to average | | | | | | |
| net assets (%) | 0.94 | 0.94 | 0.88 | 0.91 | 0.88 | 0.908 |
| Ratio of gross expenses to average | | | | | | |
| net assets9 (%) | 1.14 | 1.14 | 1.09 | 1.11 | 1.09 | 1.108 |
| Ratio of net investment income | | | | | | |
| to average net assets (%) | 0.75 | 0.21 | 0.83 | 2.85 | 4.37 | 4.49 |
1 Audited by previous auditor.
2 Semiannual period from 4-1-07 to 9-30-07. Unaudited.
3 Based on the average of the shares outstanding.
4 Less than $0.01 per share.
5 Assumes dividend reinvestment.
6 Total returns would have been lower had certain expenses not been reduced during the periods shown.
7 Not annualized.
8 Annualized.
9 Does not take into consideration expense reductions during the periods shown.
See notes to financial statements
Money Market Fund
15
F I N A N C I A L S T A T E M E N T S
Financial highlights
| | | | | | |
| CLASS B SHARES | | | | | | |
| |
| Period ended | 3-31-031 | 3-31-041 | 3-31-051 | 3-31-06 | 3-31-072 | 9-30-072 |
|
| Per share operating performance | | | | | | |
| Net asset value, beginning of period | $1.00 | $1.00 | $1.00 | $1.00 | $1.00 | $1.00 |
| Net investment income3 | —4 | —4 | —4 | 0.02 | 0.04 | 0.02 |
| Less distributions | | | | | | |
| From net investment income | —4 | —4 | —4 | (0.02) | (0.04) | (0.02) |
| Net asset value, end of period | $1.00 | $1.00 | $1.00 | $1.00 | $1.00 | $1.00 |
| Total return5,6 (%) | 0.10 | 0.12 | 0.50 | 2.05 | 3.57 | 1.837 |
| |
| Ratios and supplemental data | | | | | | |
|
| Net assets, end of period | | | | | | |
| (in millions) | $166 | $89 | $63 | $36 | $28 | $29 |
| Ratio of net expenses to average | | | | | | |
| net assets (%) | 1.59 | 1.04 | 1.20 | 1.76 | 1.73 | 1.758 |
| Ratio of gross expenses to average | | | | | | |
| net assets9 (%) | 1.89 | 1.89 | 1.85 | 1.86 | 1.83 | 1.858 |
| Ratio of net investment income | | | | | | |
| to average net assets (%) | 0.10 | 0.12 | 0.46 | 1.94 | 3.52 | 3.64 |
1 Audited by previous auditor.
2 Semiannual period from 4-1-07 to 9-30-07. Unaudited.
3 Based on the average of the shares outstanding.
4 Less than $0.01 per share.
5 Assumes dividend reinvestment and does not reflect the effect of sales charges.
6 Total returns would have been lower had certain expenses not been reduced during the periods shown.
7 Not annualized.
8 Annualized.
9 Does not take into consideration expense reductions during the periods shown.
See notes to financial statements
Money Market Fund
16
Financial highlights
F I N A N C I A L S T A T E M E N T S
| | | | | | |
| CLASS C SHARES | | | | | | |
| |
| Period ended | 3-31-031 | 3-31-041 | 3-31-051 | 3-31-06 | 3-31-07 | 9-30-072 |
|
| Per share operating performance | | | | | | |
| Net asset value, beginning of period | $1.00 | $1.00 | $1.00 | $1.00 | $1.00 | $1.00 |
| Net investment income3 | —4 | —4 | —4 | 0.02 | 0.04 | 0.02 |
| Less distributions | | | | | | |
| From net investment income | —4 | —4 | —4 | (0.02) | (0.04) | (0.02) |
| | | | | | | |
| Net asset value, end of period | $1.00 | $1.00 | $1.00 | $1.00 | $1.00 | $1.00 |
| Total return5,6 (%) | 0.11 | 0.12 | 0.50 | 2.04 | 3.57 | 1.827 |
| |
| Ratios and supplemental data | | | | | | |
|
| Net assets, end of period | | | | | | |
| (in millions) | $18 | $12 | $13 | $4 | $8 | $10 |
| Ratio of net expenses to average | | | | | | |
| net assets (%) | 1.61 | 1.04 | 1.19 | 1.75 | 1.73 | 1.758 |
| Ratio of gross expenses to average | | | | | | |
| net assets9 (%) | 1.88 | 1.89 | 1.84 | 1.85 | 1.83 | 1.858 |
| Ratio of net investment income | | | | | | |
| to average net assets (%) | 0.10 | 0.12 | 0.46 | 1.86 | 3.54 | 3.65 |
1 Audited by previous auditor.
2 Semiannual period from 4-1-07 to 9-30-07. Unaudited.
3 Based on the average of the shares outstanding.
4 Less than $0.01 per share.
5 Assumes dividend reinvestment and does not reflect the effect of sales charges.
6 Total returns would have been lower had certain expenses not been reduced during the periods shown.
7 Not annualized.
8 Annualized.
9 Does not take into consideration expense reductions during the periods shown.
See notes to financial statements
Money Market Fund
17
Notes to financial statements (unaudited)
Note 1
Accounting policies
John Hancock Money Market Fund (the Fund) is a diversified series of John Hancock Current Interest (the Trust), an open-end management investment company registered under the Investment Company Act of 1940, as amended (the 1940 Act). The investment objective of the Fund is to seek the maximum current income that is consistent with maintaining liquidity and preserving capital.
The Trustees have authorized the issuance of multiple classes of shares of the Fund, designated as Class A, Class B and Class C shares. The shares of each class represent an interest in the same portfolio of investments of the Fund and have equal rights as to voting, redemptions, dividends and liquidation, except that certain expenses, subject to the approval of the Trustees, may be applied differently to each class of shares in accordance with current regulations of the Securities and Exchange Commission (SEC) and the Internal Revenue Service. Shareholders of a class that bears distribution and service expenses under the terms of a distribution plan have exclusive voting rights to that distribution plan. Class B shares will convert to Class A shares eight years after purchase.
Significant accounting policies of the Fund
are as follows:
Valuation
Securities in the Fund’s portfolio are valued at amortized cost, in accordance with Rule 2a-7 of the Investment Company Act of 1940 which approximates market value. The amortized cost method involves valuing a security at its cost on the date of purchase and thereafter assuming a constant amortization to maturity of the difference between the principal amount due at maturity and the cost of the security to the Fund. Interest income on certain portfolio securities such as negotiable bank certificates of deposit and interest-bearing notes is accrued daily and included in interest receivable.
Joint repurchase agreement
Pursuant to an exemptive order issued by the SEC, the Fund, along with other registered investment companies having a management contract with John Hancock Advisers, LLC (the Adviser), a wholly owned subsidiary of John Hancock Financial Services, Inc., a subsidiary of Manulife Financial Corporation (MFC), may participate in a joint repurchase agreement transaction. Aggregate cash balances are invested in one or more large repurchase agreements, whose underlying securities are obligations of the U.S. government and/ or its agencies. The Fund’s custodian bank receives delivery of the underlying securities for the joint account on the Fund’s behalf.
The Adviser is responsible for ensuring that the agreement is fully collateralized at all times.
Investment transactions
Investment transactions are recorded as of the date of purchase, sale or maturity. Net realized gains and losses on sales of investments are determined on the identified cost basis.
Class allocations
Income, common expenses, and realized and unrealized gains (losses) are determined at the fund level and allocated daily to each class of shares based on the appropriate net asset value of the respective classes. Distribution and service fees, if any, are calculated daily at the class level based on the appropriate net asset value of each class and the specific expense rate(s) applicable to each class.
Expenses
The majority of expenses are directly identifiable to an individual fund. Expenses that are not readily identifiable to a specific fund are allocated in such a manner as deemed equitable, taking into consideration, among other things, the nature and type of expense and the relative sizes of the funds.
Money Market Fund
18
Federal income taxes
The Fund qualifies as a “regulated investment company” by complying with the applicable provisions of the Internal Revenue Code and will not be subject to federal income tax on taxable income that is distributed to shareholders. Therefore, no federal income tax provision is required. For federal income tax purposes, the Fund has $1,238 of a capital loss carryforward available, to the extent provided by regulations, to offset future net realized capital gains. To the extent that such carryforward is used by the Fund, no capital gain distributions will be made. The loss carryforwards expire as follows: March 31, 2012 — $1,191 and March 31, 2015 — $47.
New accounting pronouncements
In June 2006, Financial Accounting Standards Board (FASB) Interpretation No. 48, Accounting for Uncertainty in Income Taxes (the Interpretation), an interpretation of FASB Statement 109 (FIN 48), was issued and is effective for fiscal years beginning after December 15, 2006, and is to be applied to all open tax years as of the effective date. On December 22, 2006, the SEC delayed the implementation of FIN 48 for regulated investment companies for an additional six months. FIN 48 prescribes a minimum threshold for financial statement recognition of the benefit of a tax position taken or expected to be taken in a tax return, and requires certain expanded disclosures. Management has evaluated the application of FIN 48 to the Fund and does not believe there is a material impact resulting from the adoption of FIN 48 on the Fun d’s financial statements.
In September 2006, FASB Standard No. 157,
Fair Value Measurements (FAS 157), was issued and is effective for fiscal years beginning after November 15, 2007. FAS 157 defines fair value, establishing a framework for measuring fair value and expands disclosure about fair value measurements. Management is currently evaluating the application of FAS 157 to the Fund and its impact, if any, resulting from the adoption of FAS 157 on the Fund’s financial statements.
Distributions
The Fund’s net investment income is declared daily as dividends to shareholders of record as of the close of business on the preceding day, and distributed monthly.
During the year ended March 31, 2007, the tax character of distributions paid was as follows: ordinary income $9,892,200. Distributions paid by the Fund with respect to each class of shares are calculated in the same manner, at the same time and are in the same amount, except for the effect of expenses that may be applied differently to each class.
Such distributions, on a tax basis, are determined in conformity with income tax regulations, which may differ from accounting principles generally accepted in the United States of America. Distributions in excess of tax basis earnings and profits, if any, are reported in the Fund’s financial statements as a return of capital.
Use of estimates
The preparation of these financial statements, in accordance with accounting principles generally accepted in the United States of America, incorporates estimates made by management in determining the reported amount of assets, liabilities, revenues and expenses of the Fund. Actual results could differ from these estimates.
Note 2
Management fee and transactions with
affiliates and others
The Fund has an investment management contract with the Adviser. Under the investment management contract, the Fund pays a monthly management fee to the Adviser equivalent, on an annual basis, to the sum of: (a) 0.50% of the first $500,000,000 of the Fund’s average daily net asset value, (b) 0.425% of the next $250,000,000, (c) 0.375% of the next $250,000,000, (d) 0.35% of the next $500,000,000, (e) 0.325% of the next $500,000,000, (f) 0.30% of the next $500,000,000 and (g) 0.275% of the Fund’s average daily net asset value in excess of $2,500,000,000.
The Adviser has agreed to limit the Fund’s management fee to 0.40% of the Fund’s first $750,000,000 average daily net asset value, at least until July 31, 2008. Accordingly, the expense reductions related to management
Money Market Fund
19
fee limitations amounted to $124,212 for the period ended September 30, 2007. The effective rate of management fee was 0.40% of the Fund’s average daily net asset value for the period ended September 30, 2007.
The Fund has a Distribution Agreement with John Hancock Funds, LLC (JH Funds), a wholly owned subsidiary of the Adviser. The Fund has adopted Distribution Plans with respect to Class A, Class B and Class C, pursuant to Rule 12b-1 under the 1940 Act to reimburse JH Funds for the services it provides as distributor of shares of the Fund. Accordingly, the Fund makes monthly payments to JH Funds at an annual rate not to exceed 0.25% of Class A average daily net asset value and 1.00% of Class B and Class C average daily net asset value. JH Funds has agreed to limit the distribution and service (12b-1) fee pursuant to Class A to 0.15% of the Class’s average net asset value, at least until July 31, 2008. Accordingly, the expense reductions related to reduction in the 12b-1 fee amounted to $103,907 for the period ended September 30, 2007. A maximum of 0.25% of such payments may be service fees, as defined by the Conduct Rules of the Financial Industry Regulatory Authority ( formerly the National Association of Securities Dealers). Under the Conduct Rules, curtailment of a portion of the Fund’s 12b-1 payments could occur under certain circumstances.
Expenses under the agreement described above for the period ended September 30, 2007, were as follows:
| | |
| | Distribution and | |
| Share class | service fees | |
| |
| Class A | $259,341 | |
| Class B | 146,002 | |
| Class C | 59,893 | |
| Total | $465,236 | |
Class A shares are assessed up-front sales charges. During the period ended September 30, 2007, JH Funds received no net up-front charges with regard to sales of Class A shares.
Class B shares that are redeemed within six years of purchase are subject to a contingent deferred sales charge (CDSC) at declining rates, beginning at 5.00% of the lesser of the current market value at the time of redemption or the original purchase cost of the shares being redeemed. Class C shares that are redeemed within one year of purchase are subject to a CDSC at a rate of 1.00% of the lesser of the current market value at the time of redemption or the original purchase cost of the shares being redeemed. Proceeds from the CDSCs are paid to JH Funds and are used in whole or in part to defray its expenses for providing distribution-related services to the Fund in connection with the sale of Class B and Class C shares. During the period ended September 30, 2007, CDSCs received by JH Funds amounted to $67,332 for Class B shares and $6,445 for Class C shares.
The Fund has a transfer agent agreement with John Hancock Signature Services, Inc. (Signature Services), an indirect subsidiary of John Hancock Life Insurance Company (JHLICO). The Fund pays a monthly transfer agent fee at an annual rate of 0.01% of each class’s average daily net asset value, plus a fee based on the number of shareholder accounts and reimbursement for certain out-of-pocket expenses, aggregated and allocated to each class on the basis of its relative net asset value.
The Fund has an agreement with the Adviser and affiliates to perform necessary tax, accounting and legal services for the Fund. The compensation for the period amounted to $12,422 with an effective rate of 0.01% of the Fund’s average daily net asset value. The Fund also reimbursed JHLICO for certain compliance costs, included in the Fund’s Statement of Operations.
Mr. James R. Boyle is Chairman of the Adviser, as well as affiliated Trustee of the Fund, and is compensated by the Adviser and/or its affiliates. The compensation of unaffiliated Trustees is borne by the Fund. The unaffiliated Trustees may elect to defer, for tax purposes, their receipt of this compensation under the John Hancock Group of Funds Deferred Compensation Plan. The Fund makes investments into other John Hancock funds, as applicable, to cover its liability for the deferred compensation. Investments to cover the Fund’s deferred compensation
Money Market Fund
20
liability are recorded on the Fund’s books as an other asset. The deferred compensation liability and the related other asset are always equal and are marked to market on a periodic basis to reflect any income earned by the investments, as well as any unrealized gains or losses. The Deferred Compensation Plan investments had no impact on the operations of the Fund.
Note 3
Guarantees and indemnifications
Under the Fund’s organizational documents, its Officers and Trustees are indemnified against certain liability arising out of the performance of their duties to the Fund. Additionally, in the normal course of business, the Fund enters into contracts with service providers that contain general indemnification clauses. The Fund’s maximum exposure under these arrangements is unknown, as this would involve future claims that may be made against the Fund that have not yet occurred. However, based on experience, the Fund believes the risk of loss to be remote.
Note 4
Fund share transactions
This listing illustrates the number of Fund shares sold, reinvested and repurchased during the year ended March 31, 2007 and the period ended September 30, 2007, along with the corresponding dollar value.
| | | | |
| | Year ended 3-31-07 | Period ended 9-30-071 |
| | Shares | Amount | Shares | Amount |
| Class A shares | | | | |
|
| Sold | 165,842,265 | $165,842,268 | 98,748,968 | $98,748,970 |
| Issued in reorganization | — | — | 33,151,672 | 33,125,522 |
| Distributions reinvested | 7,947,354 | 7,947,354 | 4,316,539 | 4,316,539 |
| Repurchased | (163,879,236) | (163,879,236) | (93,923,387) | (93,923,388) |
| Net increase | 9,910,383 | $9,910,386 | 42,293,792 | $42,267,643 |
| |
| Class B shares | | | | |
|
| Sold | 22,754,271 | $22,754,271 | 16,103,679 | $16,103,679 |
| Distributions reinvested | 1,010,307 | 1,010,307 | 480,851 | 480,851 |
| Repurchased | (31,507,708) | (31,507,711) | (15,901,719) | (15,901,720) |
| Net increase (decrease) | (7,743,130) | ($7,743,133) | 682,811 | $682,810 |
| |
| Class C shares | | | | |
|
| Sold | 17,979,513 | $17,979,513 | 17,624,966 | $17,624,966 |
| Distributions reinvested | 258,408 | 258,408 | 190,740 | 190,740 |
| Repurchased | (14,351,424) | (14,351,424) | (15,347,974) | (15,347,974) |
| Net increase | 3,886,497 | $3,886,497 | 2,467,732 | $2,467,732 |
| |
| Net increase | 6,053,750 | $6,053,750 | 45,444,335 | $45,418,185 |
1Semiannual period from 4-1-07 to 9-30-07. Unaudited.
Money Market Fund
21
Note 5 Tax cost
The cost of investments owned on September 30, 2007, including short-term investments, for federal income tax purposes, was $278,754,941.
Note 6 Reorganization
On September 12, 2007, the shareholders of John Hancock U.S. Government Cash Reserve (Cash Reserve Fund) approved an Agreement and Plan of Reorganization, which provided for the transfer of substantially all of the assets and liabilities of the Cash Reserve Fund in exchange for Class A shares of the Fund. The acquisition was accounted for as a tax-free exchange of 33,151,672 Class A shares of the Fund for the net assets of the Cash Reserve Fund, which amounted to $33,125,522 for the shares of the Cash Reserve Fund after the close of business on September 14, 2007.
Money Market Fund
22
Board Consideration of and
Continuation of Investment Advisory
Agreement and Subadvisory
Agreement: John Hancock Money
Market Fund
The Investment Company Act of 1940 (the 1940 Act) requires the Board of Trustees (the Board) of John Hancock Current Interest (the Trust), including a majority of the Trustees who have no direct or indirect interest in the investment advisory agreement and are not “interested persons” of the Trust, as defined in the 1940 Act (the Independent Trustees), annually to meet in person to review and consider the continuation of: (i) the investment advisory agreement (the Advisory Agreement) with John Hancock Advisers, LLC (the Adviser) and (ii) the investment subadvisory agreement (the Subadvisory Agreement) with MFC Global Investment Management (U.S.), LLC (the Subadviser) for the John Hancock Money Market Fund (the Fund). The Advisory Agreement and the Subadvisory Agreement are collectively referred to as the Advisory Agreements.
At meetings held on May 7 and June 4–5, 2007, the Board considered the factors and reached the conclusions described below relating to the selection of the Adviser and Subadviser and the continuation of the Advisory Agreements. During such meetings, the Board’s Contracts/ Operations Committee and the Independent Trustees also met in executive sessions with their independent legal counsel.
In evaluating the Advisory Agreements, the Board, including the Contracts/Operations Committee and the Independent Trustees, reviewed a broad range of information requested for this purpose by the Independent Trustees, including: (i) the investment performance of the Fund relative to a category of relevant funds (the Category) and a peer group of comparable funds (the Peer Group) each selected by Morningstar, Inc. (Morningstar), an independent provider of investment company data, for a range of periods ended December 31, 2006, (ii) advisory and other fees incurred by, and the expense ratios of, the Fund relative to a Category and a Peer Group, (iii) the advisory fees of comparable portfolios of other clients of the Adviser and the Subadviser, (iv) the Adviser’s financial results and condition, including its and certain of its affiliates’ profitability from services performed for the Fund, (v) breakpoints in the Fund’s and the Peer Group’s fees, and information about economies of scale, (vi) the Adviser’s and Subadviser’s record of compliance with applicable laws and regulations, with the Fund’s investment policies and restrictions, and with the applicable Code of Ethics, and the structure and responsibilities of the Adviser’s and Subadviser’s compliance department, (vii) the background and experience of senior management and investment professionals, and (viii) the nature, cost and character of advisory and non-investment management services provided by the Adviser and its affiliates and by the Subadviser.
The Independent Trustees considered the legal advice of independent legal counsel and relied on their own business judgment in determining the factors to be considered in evaluating the materials that were presented to them and the weight to be given to each such factor. The Board’s review and conclusions were based on a comprehensive consideration of all information presented to the Board and not the result of any single controlling factor. They principally considered performance and other information from Morningstar as of December 31, 2006. The Board also considered updated performance information provided to it by the Adviser or Subadviser at the May and June 2007 meetings. Performance and other information may be quite different as of the date of this shareholders report. The key factors considered by the Board and the conclusions reached are described below.
Nature, extent and quality of services
The Board considered the ability of the Adviser and the Subadviser, based on their resources, reputation and other attributes, to attract and retain qualified investment professionals, including research, advisory and supervisory personnel. The Board considered the investment philosophy, research and investment decision-making processes of the Adviser and Subadviser. The Board further considered the culture of compliance, resources dedicated to compliance, compliance programs and
23
compliance records of the Adviser and Subadviser. In addition, the Board took into account the administrative and other non-advisory services provided to the Fund by the Adviser and its affiliates.
Based on the above factors, together with those referenced below, the Board concluded that, within the context of its full deliberations, the nature, extent and quality of the investment advisory services provided to the Fund by the Adviser and Subadviser supported renewal of the Advisory Agreements.
Fund performance
The Board considered the performance results for the Fund over various time periods ended December 31, 2006. The Board also considered these results in comparison to the performance of the Category, as well as the Fund’s benchmark index. Morningstar determined the Category and Peer Group for the Fund. The Board reviewed with a representative of Morningstar the methodology used by Morningstar to select the funds in the Category and the Peer Group.
The Board noted that the Fund’s performance during the 3-, 5- and 10-year periods ended December 31, 2006, was lower than the performance of the Peer Group and Category medians, and its benchmark index, the 3-Month T-Bill. The Board also noted that the Fund’s performance for the more recent 1-year period was lower than the performance of the Category median and benchmark index, but higher than the performance of the Peer Group median. The Adviser provided information to the Board regarding factors contributing to the Fund’s performance results, as well as the Adviser’s outlook and investment strategy for the near future. The Board indicated its intent to continue to monitor the Fund’s performance trends.
Investment advisory fee and subadvisory fee
rates and expenses
The Board reviewed and considered the contractual investment advisory fee rate payable by the Fund to the Adviser for investment advisory services (the Advisory Agreement Rate). The Board received and considered information comparing the Advisory Agreement Rate with the advisory fees for the Peer Group. The Board noted that the Advisory Agreement Rate was higher than the median rate of the Category, but not appreciably higher than the Peer Group median.
The Board received and considered expense information regarding the Fund’s various components, including advisory fees, distribution and fees other than advisory and distribution fees, including transfer agent fees, custodian fees and other miscellaneous fees (e.g., fees for accounting and legal services). The Board considered comparisons of these expenses to the Peer Group median. The Board also received and considered expense information regarding the Fund’s total operating expense ratio (Expense Ratio). The Board noted that, unlike the Fund, several funds in the Peer Group employed fee waivers or reimbursements. The Board received and considered information comparing the Expense Ratio of the Fund to that of the Peer Group and Category medians before the application of fee waivers and reimbursements (Gross Expense Ratio) and after the application of such waivers and reimbursement (Net Expens e Ratio). The Board noted that the Fund’s Gross and Net Expense Ratios were equal to or higher than the medians of the Peer Group and Category. The Board noted the differences in the funds included in the Peer Group and Category, including differences in the employment of fee waivers. The Board also noted that the most significant contributor to the difference was the Fund’s transfer agency expense, which the transfer agent has taken steps to reduce.
The Adviser also discussed the Morningstar data and rankings, and other relevant information, for the Fund. Based on the above-referenced considerations and other factors, the Board concluded that the Fund’s overall performance and expenses supported the re-approval of the Advisory Agreements.
The Board also received information about the investment subadvisory fee rate (the Subadvisory Agreement Rate) payable by the Adviser to the Subadviser for investment sub-advisory services. The Board concluded that the Subadvisory Agreement Rate was fair and equitable, based on its consideration of the factors described here.
24
Profitability
The Board received and considered a detailed profitability analysis of the Adviser based on the Advisory Agreements, as well as on other relationships between the Fund and the Adviser and its affiliates, including the Subadviser. The Board also considered a comparison of the Adviser’s profitability to that of other similar investment advisers whose profitability information is publicly available. The Board concluded that, in light of the costs of providing investment management and other services to the Fund, the profits and other ancillary benefits reported by the Adviser were not unreasonable.
Economies of scale
The Board received and considered general information regarding economies of scale with respect to the management of the Fund, including the Fund’s ability to appropriately benefit from economies of scale under the Fund’s fee structure. The Board recognized the inherent limitations of any analysis of economies of scale, stemming largely from the Board’s understanding that most of the Adviser’s costs are not specific to individual Funds, but rather are incurred across a variety of products and services.
To the extent the Board and the Adviser were able to identify actual or potential economies of scale from Fund-specific or allocated expenses, in order to ensure that any such economies continue to be reasonably shared with the Fund as its assets increase, the Adviser and the Board agreed to continue the existing breakpoints to the Advisory Agreement Rate.
Information about services to other clients
The Board also received information about the nature, extent and quality of services and fee rates offered by the Adviser and Subadviser to their other clients, including other registered investment companies, institutional investors and separate accounts. The Board concluded that the Advisory Agreement Rate and the Subadvisory Agreement Rate were not unreasonable, taking into account fee rates offered to others by the Adviser and Subadviser, respectively, after giving effect to differences in services.
Other benefits to the Adviser
The Board received information regarding potential “fall-out” or ancillary benefits received by the Adviser and its affiliates as a result of the Adviser’s relationship with the Fund. Such benefits could include, among others, benefits directly attributable to the relationship of the Adviser with the Fund and benefits potentially derived from an increase in the business of the Adviser as a result of its relationship with the Fund (such as the ability to market to shareholders other financial products offered by the Adviser and its affiliates).
The Board also considered the effectiveness of the Adviser’s, Subadviser’s and Fund’s policies and procedures for complying with the requirements of the federal securities laws, including those relating to best execution of portfolio transactions and brokerage allocation.
Other factors and broader review
As discussed above, the Board reviewed detailed materials received from the Adviser and Subadviser as part of the annual re-approval process. The Board also regularly reviews and assesses the quality of the services that the Fund receives throughout the year. In this regard, the Board reviews reports of the Adviser at least quarterly, which include, among other things, a detailed portfolio review, detailed fund performance reports and compliance reports. In addition, the Board meets with portfolio managers and senior investment officers at various times throughout the year.
After considering the above-described factors and based on its deliberations and its evaluation of the information described above, the Board concluded that approval of the continuation of the Advisory Agreements for the Fund was in the best interest of the Fund and its shareholders. Accordingly, the Board unanimously approved the continuation of the Advisory Agreements.
25
Why John Hancock Funds?
For more than three decades, John Hancock Funds has been helping individual, corporate and institutional clients reach their most important financial goals. With so many fund companies to choose from, why should you invest with us?
► A name you know and trust
When you invest with John Hancock Funds, you are investing with one of the most recognized and respected names in the financial services industry. Our parent company has been helping individuals and institutions increase and protect wealth since 1862.
► Solutions across the investing spectrum
We offer equity, income, international, sector and asset allocation investment solutions managed by leading institutional money managers. Each of our funds utilizes a disciplined, team approach to portfolio management and research, leveraging the expertise of seasoned investment professionals.
► Committed to you
Our shareholders come first. We work hard to provide you with the products you need to build a solid financial foundation. We’re proud to offer you award-winning services and tools, like the www.jhfunds.com Web site, to help you every step of the way.
For immediate insight and answers,
turn to www.jhfunds.com
Discover the new and improved www.jhfunds.com.
▪ View accounts, statements and
fund information.
▪ Access college and retirement
planning calculators and investment
education.
▪ Gain investment ideas, expand your
knowledge and become a more
informed investor.

This is just the beginning of how much you can do.
Now is the ideal time to experience our Web site that received the following recognition in 2006:
 “Best Innovation: Redesigned Web Site” by the Mutual Fund Education Alliance.
 “Outstanding Web Site” by the Web Marketing Association.
 “Creative excellence on the Web, Silver Award winner” by W3.
Discover convenience and comprehensive resources at one
easy-to-access location. Your financial professional can steer you to the tools that
will help you the most and enable you to transform your knowledge into action.
See how far www.jhfunds.com can take you!
For more information
The Fund’s proxy voting policies, procedures and records are available without charge, upon request:
| | |
| By phone | On the Fund’s Web site | On the SEC’s Web site |
| 1-800-225-5291 | www.jhfunds.com/proxy | www.sec.gov |
|
| |
| Trustees | Charles A. Rizzo | Custodian |
| Ronald R. Dion, Chairman | Chief Financial Officer | The Bank of New York |
| James R. Boyle† | Gordon M. Shone | One Wall Street |
| James F. Carlin | | New York, NY 10286 |
| William H. Cunningham | Treasurer | |
| Charles L. Ladner* | John G. Vrysen | Transfer agent |
| Dr. John A. Moore* | Chief Operating Officer | John Hancock Signature |
| Patti McGill Peterson* | | Services, Inc. |
| Steven R. Pruchansky | Investment adviser | P.O. Box 9510 |
| *Members of the Audit Committee | John Hancock Advisers, LLC | Portsmouth, NH 03802-9510 |
| †Non-Independent Trustee | 601 Congress Street | |
| Boston, MA 02210-2805 | Legal counsel |
| Officers | | Kirkpatrick & Lockhart |
| Keith F. Hartstein | Subadviser | Preston Gates Ellis LLP |
| President and | MFC Global Investment | One Lincoln Street |
| Chief Executive Officer | Management (U.S.), LLC | Boston, MA 02111-2950 |
| Thomas M. Kinzler | 101 Huntington Avenue | |
| Secretary and Chief Legal Officer | Boston, MA 02199 | |
| Francis V. Knox, Jr. | | |
| Chief Compliance Officer | Principal distributor | |
| John Hancock Funds, LLC | |
| 601 Congress Street | |
| | Boston, MA 02210-2805 | |
| | |
| How to contact us | |
|
| |
| Internet | www.jhfunds.com | |
|
| |
| Mail | Regular mail: | Express mail: |
| | John Hancock | John Hancock |
| | Signature Services, Inc. | Signature Services, Inc. |
| | P.O. Box 9510 | Mutual Fund Image Operations |
| | Portsmouth, NH 03802-9510 | 164 Corporate Drive |
| | | Portsmouth, NH 03801 |
|
| |
| Phone | Customer service representatives | 1-800-225-5291 |
| | EASI-Line | 1-800-338-8080 |
| | TDD line | 1-800-554-6713 |
|
A listing of month-end portfolio holdings is available on our Web site, www.jhfunds.com. A more detailed portfolio holdings summary is available on a quarterly basis 60 days after the fiscal quarter on our Web site or upon request by calling 1-800-225-5291, or on the SEC’s Web site, www.sec.gov.
28
JOHN HANCOCK FAMILY OF FUNDS
| |
| EQUITY | INTERNATIONAL/GLOBAL |
| Balanced Fund | Global Opportunities Fund |
| Classic Value Fund | Global Shareholder Yield Fund |
| Classic Value Fund II | Greater China Opportunities Fund |
| Classic Value Mega Cap Fund | International Allocation Portfolio |
| Core Equity Fund | International Classic Value Fund |
| Growth Fund | International Core Fund |
| Growth Opportunities Fund | International Growth Fund |
| Growth Trends Fund | |
| Intrinsic Value Fund | INCOME |
| Large Cap Equity Fund | Bond Fund |
| Large Cap Select Fund | Government Income Fund |
| Mid Cap Equity Fund | High Yield Fund |
| Multi Cap Growth Fund | Investment Grade Bond Fund |
| Small Cap Equity Fund | Strategic Income Fund |
| Small Cap Fund | |
| Small Cap Intrinsic Value Fund | TAX-FREE INCOME |
| Sovereign Investors Fund | California Tax-Free Income Fund |
| U.S. Core Fund | High Yield Municipal Bond Fund |
| U.S. Global Leaders Growth Fund | Massachusetts Tax-Free Income Fund |
| Value Opportunities Fund | New York Tax-Free Income Fund |
| | Tax-Free Bond Fund |
| ASSET ALLOCATION | |
| Lifecycle 2010 Portfolio | MONEY MARKET |
| Lifecycle 2015 Portfolio | Money Market Fund |
| Lifecycle 2020 Portfolio | |
| Lifecycle 2025 Portfolio | CLOSED-END |
| Lifecycle 2030 Portfolio | Bank and Thrift Opportunity Fund |
| Lifecycle 2035 Portfolio | Financial Trends Fund, Inc. |
| Lifecycle 2040 Portfolio | Income Securities Trust |
| Lifecycle 2045 Portfolio | Investors Trust |
| Lifecycle Retirement Portfolio | Patriot Premium Dividend Fund II |
| Lifestyle Aggressive Portfolio | Preferred Income Fund |
| Lifestyle Balanced Portfolio | Preferred Income II Fund |
| Lifestyle Conservative Portfolio | Preferred Income III Fund |
| Lifestyle Growth Portfolio | Tax-Advantaged Dividend Income Fund |
| Lifestyle Moderate Portfolio | Tax-Advantaged Global Shareholder Yield Fund |
| |
| SECTOR | |
| Financial Industries Fund | |
| Health Sciences Fund | |
| Real Estate Fund | |
| Regional Bank Fund | |
| Technology Fund | |
| Technology Leaders Fund | |
The Fund’s investment objectives, risks, charges and expenses are included in the prospectus and should be considered carefully before investing. For a prospectus, contact your financial professional, call John Hancock Funds at 1-800-225-5291 or visit the Fund’s Web site at www.jhfunds.com. Please read the prospectus carefully before investing or sending money.

1-800-225-5291
1-800-554-6713 TDD
1-800-338-8080 EASI-Line
www.jhfunds. com
Now available: electronic delivery
www.jhfunds. com/edelivery
This report is for the information of the shareholders of John Hancock Money Market Fund.
It is not authorized for distribution to prospective investors unless preceded or accompanied by a prospectus.
440SA 9/07
11/07
ITEM 2. CODE OF ETHICS.
As of the end of the period, September 30, 2007, the registrant has adopted a code of ethics, as defined in Item 2 of Form N-CSR, that applies to its Chief Executive Officer, Chief Financial Officer and Treasurer (respectively, the principal executive officer, the principal financial officer and the principal accounting officer, the “Senior Financial Officers”). A copy of the code of ethics is filed as an exhibit to this Form N-CSR.
ITEM 3. AUDIT COMMITTEE FINANCIAL EXPERT.
Not applicable at this time.
ITEM 4. PRINCIPAL ACCOUNTANT FEES AND SERVICES.
Not applicable at this time.
ITEM 5. AUDIT COMMITTEE OF LISTED REGISTRANTS.
Not applicable at this time.
ITEM 6. SCHEDULE OF INVESTMENTS.
Not applicable.
ITEM 7. DISCLOSURE OF PROXY VOTING POLICIES AND PROCEDURES FOR CLOSED-END MANAGEMENT INVESTMENT COMPANIES.
Not applicable.
ITEM 8. PORTFOLIO MANAGERS OF CLOSED-END MANAGEMENT INVESTMENT COMPANIES.
Not applicable.
ITEM 9. PURCHASES OF EQUITY SECURITIES BY CLOSED-END MANAGEMENT INVESTMENT COMPANY AND AFFILIATED PURCHASERS.
Not applicable.
ITEM 10. SUBMISSION OF MATTERS TO A VOTE OF SECURITY HOLDERS.
The registrant has adopted procedures by which shareholders may recommend nominees to the registrant's Board of Trustees. A copy of the procedures is filed as an exhibit to this Form N-CSR. See attached "John Hancock Funds - Governance Committee Charter”.
ITEM 11. CONTROLS AND PROCEDURES.
(a) Based upon their evaluation of the registrant's disclosure controls and procedures as conducted within 90 days of the filing date of this Form N-CSR, the registrant's principal executive officer and principal financial officer have concluded that those disclosure controls and procedures provide reasonable assurance that the material information required to be disclosed by the registrant on this report is recorded, processed, summarized and reported within the time periods specified in the Securities and Exchange Commission's rules and forms.
(b) There were no changes in the registrant's internal control over financial reporting that occurred during the registrant's most recent fiscal half-year (the registrant's second fiscal half-
year in the case of an annual report) that have materially affected, or are reasonably likely to materially affect, the registrant's internal control over financial reporting.
ITEM 12. EXHIBITS.
(a)(1) Code of Ethics for Senior Financial Officers is attached.
(a)(2) Separate certifications for the registrant's principal executive officer and principal financial officer, as required by Section 302 of the Sarbanes-Oxley Act of 2002 and Rule 30a-2(a) under the Investment Company Act of 1940, are attached.
(b) Separate certifications for the registrant's principal executive officer and principal financial officer, as required by 18 U.S.C. Section 1350, as adopted pursuant to Section 906 of the Sarbanes-Oxley Act of 2002, and Rule 30a-2(b) under the Investment Company Act of 1940, are attached. The certifications furnished pursuant to this paragraph are not deemed to be "filed" for purposes of Section 18 of the Securities Exchange Act of 1934, or otherwise subject to the liability of that section. Such certifications are not deemed to be incorporated by reference into any filing under the Securities Act of 1933 or the Securities Exchange Act of 1934, except to the extent that the Registrant specifically incorporates them by reference.
(c)(1) Submission of Matters to a Vote of Security Holders is attached. See attached "John Hancock Funds - Governance Committee Charter”.
(c)(2) Contact person at the registrant.
SIGNATURES
Pursuant to the requirements of the Securities Exchange Act of 1934 and the Investment Company Act of 1940, the registrant has duly caused this report to be signed on its behalf by the undersigned, thereunto duly authorized.
John Hancock Current Interest
By: /s/ Keith F. Hartstein
-------------------------------------
Keith F. Hartstein
President and Chief Executive Officer
Date: November 19, 2007
Pursuant to the requirements of the Securities Exchange Act of 1934 and the Investment Company Act of 1940, this report has been signed below by the following persons on behalf of the registrant and in the capacities and on the dates indicated.
By: /s/ Keith F. Hartstein
-------------------------------------
Keith F. Hartstein
President and Chief Executive Officer
Date: November 19, 2007
By: /s/ Charles A. Rizzo
-------------------------------------
Charles A. Rizzo
Chief Financial Officer
Date: November 19, 2007