| | OMB APPROVAL |
| | OMB Number: | 3235-0570 |
| | Expires: | October 31, 2006 |
| UNITED STATES | Estimated average burden hours per response. . . . . . . . . . . . . . . . .19.3 |
| SECURITIES AND EXCHANGE COMMISSION | |
| Washington, D.C. 20549 | |
| | | | |
FORM N-CSR
CERTIFIED SHAREHOLDER REPORT OF REGISTERED
MANAGEMENT INVESTMENT COMPANIES
Investment Company Act file number | 811-2514 |
|
ING Variable Funds |
(Exact name of registrant as specified in charter) |
|
7337 E. Doubletree Ranch Rd., Scottsdale, AZ | | 85258 |
(Address of principal executive offices) | | (Zip code) |
|
CT Corporation System, 101 Federal Street, Boston, MA 02110 |
(Name and address of agent for service) |
|
Registrant’s telephone number, including area code: | 1-800-992-0180 | |
|
Date of fiscal year end: | December 31 | |
|
Date of reporting period: | January 1, 2006 to June 30, 2006 | |
| | | | | | | | | |
ITEM 1. REPORTS TO STOCKHOLDERS.
The following is a copy of the report transmitted to stockholders pursuant to Rule 30e-1 under the Act (17 CFR 270.30e-1):
Funds

Semi-Annual Report
June 30, 2006
Classes I and S
ING Variable Product Funds | |
| |
Domestic Equity and Income Portfolios | Fixed Income Portfolios |
• ING VP Balanced Portfolio | • ING VP Intermediate Bond Portfolio |
• ING VP Growth and Income Portfolio | • ING VP Money Market Portfolio |
| |
Domestic Equity Growth Portfolios | Global and International Equity Portfolios |
• ING VP Growth Portfolio | • ING VP Global Science and Technology Portfolio |
• ING VP Small Company Portfolio | • ING VP International Equity Portfolio |
| |
Domestic Equity Value Portfolio | |
• ING VP Value Opportunity Portfolio | |
This report is submitted for general information to shareholders of the ING Funds. It is not authorized for distribution to prospective shareholders unless accompanied or preceded by a prospectus which includes details regarding the funds’ investment objectives, risks, charges, expenses and other information. This information should be read carefully. | | 
|
TABLE OF CONTENTS
PROXY VOTING INFORMATION
A description of the policies and procedures that the Portfolios use to determine how to vote proxies related to portfolio securities is available (1) without charge, upon request, by calling Shareholder Services toll-free at 1-800-992-0180; (2) on the ING Funds website at www.ingfunds.com; and (3) on the Securities and Exchange Commission’s (“SEC”) website at www.sec.gov. Information regarding how the Portfolios voted proxies related to portfolio securities during the most recent 12-month period ended June 30 is available without charge on the ING Funds website at www.ingfunds.com and on the SEC’s website at www.sec.gov.
QUARTERLY PORTFOLIO HOLDINGS
The Registrants file their complete schedule of portfolio holdings with the SEC for the first and third quarters of each fiscal year on Form N-Q. The Registrants’ Forms N-Q are available on the SEC’s website at www.sec.gov. The Registrants’ Forms N-Q may be reviewed and copied at the SEC’s Public Reference Room in Washington, DC, and information on the operation of the Public Reference Room may be obtained by calling 1-800-SEC-0330; and is available upon request from the Registrants by calling Shareholder Services toll-free at 1-800-992-0180.
(THIS PAGE INTENTIONALLY LEFT BLANK)

JAMES M. HENNESSY
Dear Shareholder,
As you may recall, in my last letter I described the enthusiasm that we were experiencing here at ING Funds as we worked to bring more of the world’s investment opportunities to you, the investor.
I am happy to report that enthusiasm is continuing to thrive. Since the beginning of the year, we have launched a series of new international mutual funds, each created to bring more of the world’s opportunities to you.
Meanwhile, we have also heard you loud and clear. Our research tells us that many investors report that they find investing an intimidating and overly-complex endeavor. That is why ING is committed to helping investors across the country cut through the confusion and clutter. “Your future. Made easier.SM” is more than words; they represent our promise to you.
Those two objectives — bringing you more of the world’s opportunities and doing it in a way that is easier for you — are behind the development of the new funds.
According to a recent finding, 58 percent of the world market capitalization now lies outside of the United States.1 In other words, the majority of investments are now beyond our borders and we think that the ING VP Index Plus International Portfolio — a broad-based international portfolio — is an easy, single-step method to gain exposure to international investment opportunities.
Meanwhile, the ING VP Global Real Estate Portfolio was developed as an easy way to bring global — international and domestic — real estate opportunities to the variable portfolio investor. Real Estate Investment Trusts (REITs) are becoming more and more popular around the world, and this new portfolio seeks to capitalize on that popularity. But again, we’ve made it easy. With just one investment, investors bring the diversification of global real estate to their investment strategy.
One of our goals at ING Funds is to find tomorrow’s opportunities today, and we believe these two portfolios are just the latest examples of that plan in action.
On behalf of everyone at ING Funds, I thank you for your continued support and loyalty. We look forward to serving you in the future.
Sincerely,

James M. Hennessy
President
ING Funds
August 11, 2006
The views expressed in the President’s Letter reflect those of the President as of the date of the letter. Any such views are subject to change at any time based upon market or other conditions and ING Funds disclaims any responsibility to update such views. These views may not be relied on as investment advice and because investment decisions for an ING Fund are based on numerous factors, may not be relied on as an indication of investment intent on behalf of any ING Fund. Reference to specific company securities should not be construed as recommendations or investment advice.
International investing does pose special risks including currency fluctuation, economic and political risks not found in investments that are solely domestic. Investments in issuers that are principally engaged in real estate, including REITs, may subject the Fund to risks similar to those associated with the direct ownership of real estate, including terrorist attacks, war or other acts that destroy real property (in addition to market risks). These companies are sensitive to factors such as changes in real estate values and property taxes, interest rates, cash flow of underlying real estate assets, supply and demand, and the management skill and creditworthiness of the issuer. REITs may also be affected by tax and regulatory requirements.
1 MSCI December, 2005
1
MARKET PERSPECTIVE: SIX MONTHS ENDED JUNE 30, 2006 |
|
Global equities markets as a whole started 2006 with their best first quarter since 1998. Much of the buying interest swelled from the busiest quarter for merger and acquisition activity since 2000. However, by mid way through the second quarter, reality set in as investors were gripped by fears that zealous, inflation fighting central bankers would raise interest rates by more than enough to choke off the global growth enjoyed in recent years. For the first six months of 2006, the Morgan Stanley Capital International (“MSCI”) World® Index1 in dollars, including net reinvested dividends, gained 6.1%, but more than half of this was due to U.S. dollar weakness. An initially slow retreat gathered pace, spurred by communication from the G7 Finance Ministers and Central Bank of Governors that seemed to sanction a lower dollar. The currency slid 7.4%, 6.8% and 2.8%, respectively, against the euro, pound and yen for the six months ended June 30, 2006.
Alan Greenspan may have retired in January 2006, after 18 years as Chairman of the Federal Reserve Board (“Fed”), but the issue didn’t change for most investors, not just those in U.S. fixed income securities: when would the Federal Open Market Committee (“FOMC”) stop raising interest rates? By April 2006, Greenspan’s successor, Ben Bernanke seemed to be hinting that after a sixteenth increase on May 10, the FOMC might pause. Stock markets took heart, but with commodities prices making new records, the combination of inflationary pressures and a Fed apparently about to go on hold led commentators to wonder if Mr. Bernanke was just a little bit soft on inflation. In fact, he had never meant to signal a pause. The respected academic who espoused plain-speaking openness to make policy clear had instead succeeded in achieving the opposite. He needed to reestablish his inflation fighting credentials by going on the offensive.
Over the next few weeks, every one of his FOMC colleagues would stress publicly that inflation was the prime concern. By June 13, the yield curve inverted for the second time this year, investors fearing that the FOMC had tough-talked themselves into protracted rate increases, even as the economy was obviously cooling. This was evidenced by a shockingly weak employment report on June 2 and a slumping housing market that had been the source of much of the consumer spending in the last few years. So the seventeenth interest rate increase to 5.25% on June 29 surprised no one, but at least it was couched in balanced language that raised hopes the FOMC might at last be done. Then again, the quarter ended with every yield on the Treasury curve lower than the federal funds rate: the market’s vote that the FOMC had already gone too far. For the half-year, the 10-year U.S. Treasury yield rose by 74 basis points to 5.14%, the three-month U.S. Treasury Bill by 88 basis points to 4.86%, while the Lehman Brothers Aggregate Bond Index2 of investment grade bonds lost 72 basis points for the six months ended June 30, 2006.
U.S. equities in the form of the Standard & Poor’s 500® Composite Stock Price (“S&P 500®”) Index3, rose 2.7% including dividends, in the first half of 2006 and traded at a price-to-earnings (“P/E”) ratio of 14.8 for the current fiscal year. Stocks had actually become cheaper in the last 12 months as prices had only reflected about half of the increase in corporate profits in that time. Indeed, first quarter profits registered double-digit year-over-year growth for the eleventh straight quarter. Nevertheless, investors seemed only to have eyes for interest rates. After the best first quarter for the market since 1999, investors were encouraged through early May 2006 as the events described above suggested an imminent end to the tightening cycle. The S&P 500® Index even reached a five-year high at its best level on May 5, 2006. In spite of this, these hopes were soon dashed by the hawkish rhetoric from the FOMC and from there stocks fell nearly 4% to the end of the quarter. Only the less uncompromising language in the FOMC’s June 29, 2006 statement prevented the loss from being 2% worse.
In international markets, the pattern of results resembled that of the U.S.: strong through early May 2006, a sharp drop to mid-June 2006, partially reversed in the last two weeks. Because of significant currency movements, returns are based on MSCI indices in local currencies including net dividends. Japan continued where it left off in 2005 and by May 8, 2006 the market was up 8.9% on bullish news about rising wages, an end to deflation and an evidently sustainable gross domestic product (“GDP”) growth path. Unfortunately, over the next month stocks plunged 15.3% as U.S. interest rate fears combined with signals from the Bank of Japan that local interest rates were about to rise for the first time in six years. The market closed the six months ended June 30, 2006 down 1.3% based on the MSCI Japan® Index4 after a late rebound. European ex UK markets were initially supported by widespread merger and acquisition activity amid clear signs of improving growth, business confidence and falling
2
MARKET PERSPECTIVE: SIX MONTHS ENDED JUNE 30, 2006 |
|
unemployment, and despite a 25 basis point rate increase in March. At their May 9, 2006 high, stocks had returned 12.2% for the year. But events in the U.S. and another 25 basis points increase in euro interest rates, as inflation remained stubbornly above the 2% target, sent stocks into negative territory by mid-June, before recovering to a 4.8% gain for the half year based on MSCI Europe ex UK® Index5. By May 9, 2006, UK equities were up 9.8% boosted by acquisition-prone financials and the large energy and materials sectors, as commodity prices surged. The reversal in these prices and interest rate concerns dragged the market down 9.3% by mid-June. Rebounding energy prices and improved economic data allowed more than half of this loss to be retraced and stocks closed the six months ended June 30, 2006 ahead by 5.5% based on the MSCI UK® Index6.
(1) The MSCI World® Index is an unmanaged index that measures the performance of over 1,400 securities listed on exchanges in the U.S., Europe, Canada, Australia, New Zealand and the Far East.
(2) The Lehman Brothers Aggregate Bond Index is a widely recognized, unmanaged index of publicly issued investment grade U.S. Government, mortgage-backed, asset-backed and corporate debt securities.
(3) The Standard & Poor’s 500® Composite Stock Price Index is an unmanaged index that measures the performance of securities of approximately 500 large-capitalization companies whose securities are traded on major U.S. stock markets.
(4) The MSCI Japan® Index is a free float-adjusted market capitalization index that is designed to measure developed market equity performance in Japan.
(5) The MSCI Europe ex UK® Index is a free float-adjusted market capitalization index that is designed to measure developed market equity performance in Europe, excluding the UK.
(6) The MSCI UK® Index is a free float-adjusted market capitalization index that is designed to measure developed market equity performance in the UK.
All indices are unmanaged and investors cannot invest directly in an index.
Past performance does not guarantee future results. The performance quoted represents past performance. Investment return and principal value of an investment will fluctuate, and shares, when redeemed, may be worth more or less than their original cost. The Funds’ performance is subject to change since the period’s end and may be lower or higher than the performance data shown. Please call (800) 992-0180 or log on to www.ingfunds.com to obtain performance data current to the most recent month end.
Market Perspective reflects the views of the ING Chief Investment Risk Officer only through the end of the period, and is subject to change based on market and other conditions.
3
SHAREHOLDER EXPENSE EXAMPLES (UNAUDITED) |
|
As a shareholder of a Fund, you incur two types of costs: (1) transaction costs, including sales charges (loads) on purchase payments, redemption fees, and exchange fees; and (2) ongoing costs including management fees, distribution [and/or service] (12b–1) fees, and other Fund expenses. These Examples are intended to help you understand your ongoing costs (in dollars) of investing in a Fund and to compare these costs with the ongoing costs of investing in other mutual funds.
The Examples are based on an investment of $1,000 invested at the beginning of the period and held for the entire period from January 1, 2006 to June 30, 2006.
Actual Expenses
The first section of the table shown, “Actual Fund Return,” provides information about actual account values and actual expenses. You may use the information in this section, together with the amount you invested, to estimate the expenses that you paid over the period. Simply divide your account value by $1,000 (for example, an $8,600 account value divided by $1,000 = 8.6), then multiply the result by the number in the first section under the heading entitled “Expenses Paid During Period” to estimate the expenses you paid on your account during this period.
Hypothetical Example for Comparison Purposes
The second section of the table shown, “Hypothetical 5% Return,” provides information about hypothetical account values and hypothetical expenses based on the Fund’s actual expense ratio and an assumed rate of return of 5% per year before expenses, which is not the Fund’s actual return. The hypothetical account values and expenses may not be used to estimate the actual ending account balance or expenses you paid for the period. You may use this information to compare the ongoing costs of investing in the Fund and other funds. To do so, compare this 5% hypothetical example with the 5% hypothetical examples that appear in the shareholder reports of the other funds.
Please note that the expenses shown in the table are meant to highlight your ongoing costs only and do not reflect any transactional costs, such as sales charges (loads), redemption fees, or exchange fees. Therefore, the hypothetical lines of the table are useful in comparing ongoing costs only, and will not help you determine the relative total costs of owning different funds. In addition, if these transactional costs were included, your costs would have been higher.
| | | | | | | | | | |
| | | Beginning
Account
Value
January 1, 2006 | | Ending
Account
Value
June 30, 2006 | | Annualized
Expense
Ratio | | Expenses Paid
During the
Six Months Ended
June 30, 2006* | |
| ING VP Balanced Portfolio | | | | | | | | | |
| Actual Fund Return | | | | | | | | | |
| Class I | | $1,000.00 | | | $1,015.80 | | | 0.59 | % | | $2.95 | | |
| Class S | | 1,000.00 | | | 1,013.50 | | | 0.84 | | | 4.19 | | |
| Hypothetical (5% return before expenses) | | | | | | | | | | | | | |
| Class I | | $1,000.00 | | | $1,021.87 | | | 0.59 | % | | $2.96 | | |
| Class S | | 1,000.00 | | | 1,020.63 | | | 0.84 | | | 4.21 | | |
| | | | | | | | | | | | | | |
| ING VP Growth and Income Portfolio | | | | | | | | | | | | | |
| Actual Fund Return | | | | | | | | | | | | | |
| Class I | | $1,000.00 | | | $1,023.30 | | | 0.59 | % | | $2.96 | | |
| Class S | | 1,000.00 | | | 1,021.30 | | | 0.84 | | | 4.21 | | |
| Hypothetical (5% return before expenses) | | | | | | | | | | | | | |
| Class I | | $1,000.00 | | | $1,021.87 | | | 0.59 | % | | $2.96 | | |
| Class S | | 1,000.00 | | | 1,020.63 | | | 0.84 | | | 4.21 | | |
| | | | | | | | | | | | | | |
* Expenses are equal to each Portfolio’s respective annualized expense ratios multiplied by the average account value over the period, multiplied by 181/365 to reflect the most recent fiscal half-year.
4
SHAREHOLDER EXPENSE EXAMPLES (UNAUDITED) (CONTINUED)
| | | | | | | | | | |
| | | Beginning
Account
Value
January 1, 2006 | | Ending
Account
Value
June 30, 2006 | | Annualized
Expense
Ratio | | Expenses Paid
During the
Six Months Ended
June 30, 2006* | |
| ING VP Growth Portfolio | | | | | | | | | |
| Actual Fund Return | | | | | | | | | |
| Class I | | $1,000.00 | | | $ 962.90 | | | 0.69 | % | | $3.36 | | |
| Class S | | 1,000.00 | | | 962.20 | | | 0.94 | | | 4.57 | | |
| Hypothetical (5% return before expenses) | | | | | | | | | | | | | |
| Class I | | $1,000.00 | | | $1,021.37 | | | 0.69 | % | | $3.46 | | |
| Class S | | 1,000.00 | | | 1,020.13 | | | 0.94 | | | 4.71 | | |
| | | | | | | | | | | | | | |
| ING VP Small Company Portfolio | | | | | | | | | | | | | |
| Actual Fund Return | | | | | | | | | | | | | |
| Class I | | $1,000.00 | | | $1,087.60 | | | 0.85 | % | | $4.40 | | |
| Class S | | 1,000.00 | | | 1,085.60 | | | 1.10 | | | 5.69 | | |
| Hypothetical (5% return before expenses) | | | | | | | | | | | | | |
| Class I | | $1,000.00 | | | $1,020.58 | | | 0.85 | % | | $4.26 | | |
| Class S | | 1,000.00 | | | 1,019.34 | | | 1.10 | | | 5.51 | | |
| | | | | | | | | | | | | | |
| ING VP Value Opportunity Portfolio | | | | | | | | | | | | | |
| Actual Fund Return | | | | | | | | | | | | | |
| Class I | | $1,000.00 | | | $1,039.30 | | | 0.69 | % | | $3.49 | | |
| Class S | | 1,000.00 | | | 1,038.40 | | | 0.94 | | | 4.75 | | |
| Hypothetical (5% return before expenses) | | | | | | | | | | | | | |
| Class I | | $1,000.00 | | | $1,021.37 | | | 0.69 | % | | $3.46 | | |
| Class S | | 1,000.00 | | | 1,020.13 | | | 0.94 | | | 4.71 | | |
| | | | | | | | | | | | | | |
| ING VP Intermediate Bond Portfolio | | | | | | | | | | | | | |
| Actual Fund Return | | | | | | | | | | | | | |
| Class I | | $1,000.00 | | | $ 995.00 | | | 0.50 | % | | $2.47 | | |
| Class S | | 1,000.00 | | | 993.40 | | | 0.75 | | | 3.71 | | |
| Hypothetical (5% return before expenses) | | | | | | | | | | | | | |
| Class I | | $1,000.00 | | | $1,022.32 | | | 0.50 | % | | $2.51 | | |
| Class S | | 1,000.00 | | | 1,021.08 | | | 0.75 | | | 3.76 | | |
| | | | | | | | | | | | | | |
| ING VP Money Market Portfolio | | | | | | | | | | | | | |
| Actual Fund Return | | | | | | | | | | | | | |
| Class I | | $1,000.00 | | | $1,022.40 | | | 0.34 | % | | $1.70 | | |
| Hypothetical (5% return before expenses) | | | | | | | | | | | | | |
| Class I | | $1,000.00 | | | $1,023.11 | | | 0.34 | % | | $1.71 | | |
| | | | | | | | | | | | | | |
* Expenses are equal to each Portfolio’s respective annualized expense ratios multiplied by the average account value over the period, multiplied by 181/365 to reflect the most recent fiscal half-year.
5
SHAREHOLDER EXPENSE EXAMPLES (UNAUDITED) (CONTINUED) |
|
| | | | | | | | | | |
| | | Beginning
Account
Value
January 1, 2006 | | Ending
Account
Value
June 30, 2006 | | Annualized
Expense
Ratio | | Expenses Paid
During the
Six Months Ended
June 30, 2006* | |
| ING VP Global Science and Technology Portfolio | | | | | | | | | |
| Actual Fund Return | | | | | | | | | |
| Class I | | $1,000.00 | | | $ 993.00 | | | 1.07 | % | | $5.29 | | |
| Class S | | 1,000.00 | | | 990.60 | | | 1.32 | | | 6.51 | | |
| Hypothetical (5% return before expenses) | | | | | | | | | | | | | |
| Class I | | $1,000.00 | | | $1,019.49 | | | 1.07 | % | | $5.36 | | |
| Class S | | 1,000.00 | | | 1,018.25 | | | 1.32 | | | 6.61 | | |
| | | | | | | | | | | | | | |
| ING VP International Equity Portfolio | | | | | | | | | | | | | |
| Actual Fund Return | | | | | | | | | | | | | |
| Class I | | $1,000.00 | | | $1,087.10 | | | 0.95 | % | | $4.92 | | |
| Class S | | 1,000.00 | | | 1,085.10 | | | 1.20 | | | 6.20 | | |
| Hypothetical (5% return before expenses) | | | | | | | | | | | | | |
| Class I | | $1,000.00 | | | $1,020.08 | | | 0.95 | % | | $4.76 | | |
| Class S | | 1,000.00 | | | 1,018.84 | | | 1.20 | | | 6.01 | | |
| | | | | | | | | | | | | | |
* Expenses are equal to each Portfolio’s respective annualized expense ratios multiplied by the average account value over the period, multiplied by 181/365 to reflect the most recent fiscal half-year.
6
STATEMENTS OF ASSETS AND LIABILITIES AS OF JUNE 30, 2006 (UNAUDITED) |
|
| | ING
VP Balanced
Portfolio | | ING
VP Growth
and Income
Portfolio | | ING
VP Growth
Portfolio | | ING
VP Small
Company
Portfolio | | ING
VP Value
Opportunity
Portfolio | |
ASSETS: | | | | | | | | | | | |
Investments in securities at value+* | | $ | 1,124,611,643 | | $ | 2,904,634,580 | | $ | 191,902,049 | | $ | 466,142,412 | | $ | 194,383,813 | |
Short-term investments at amortized cost | | 155,084,116 | | 317,507,403 | | 19,246,134 | | 127,077,337 | | 34,671,470 | |
Repurchase agreement | | 124,007,000 | | 32,841,000 | | 5,648,000 | | 23,287,000 | | 1,269,000 | |
Cash | | 178,209 | | 24,057,138 | | 941 | | 900 | | 861 | |
Cash collateral for futures | | 194,129 | | 929,250 | | — | | — | | — | |
Receivables: | | | | | | | | | | | |
Investment securities sold | | 24,067,434 | | 51,314,211 | | — | | 4,993,113 | | 2,090,419 | |
Fund shares sold | | 5,053 | | — | | 145,715 | | 69,123 | | 6,614 | |
Dividends and interest | | 3,798,383 | | 3,451,008 | | 142,125 | | 406,410 | | 269,569 | |
Variation margin receivable | | 92,504 | | — | | — | | — | | — | |
Upfront payments paid on swap agreements | | 61,086 | | — | | — | | — | | — | |
Unrealized appreciation on swap agreements | | 175,933 | | — | | — | | — | | — | |
Prepaid expenses | | 25,385 | | 63,613 | | 3,162 | | 8,948 | | 3,673 | |
Total assets | | 1,432,300,875 | | 3,334,798,203 | | 217,088,126 | | 621,985,243 | | 232,695,419 | |
LIABILITIES: | | | | | | | | | | | |
Payable for investment securities purchased | | 38,423,188 | | 23,156,384 | | 2,620,715 | | 1,403,104 | | 966,032 | |
Payable for fund shares redeemed | | 1,959,660 | | 4,125,381 | | 372,671 | | 121,595 | | 637,374 | |
Payable for futures variation margin | | 106,421 | | 57,880 | | — | | — | | — | |
Payable upon receipt of securities loaned | | 140,144,328 | | 302,518,757 | | 19,246,134 | | 127,077,337 | | 34,671,470 | |
Payable to affiliates | | 570,484 | | 1,360,447 | | 104,132 | | 317,149 | | 110,010 | |
Payable for director/trustee fees | | 13,031 | | 87,733 | | 3,530 | | 8,923 | | 5,417 | |
Other accrued expenses and liabilities | | 144,383 | | 166,162 | | 29,983 | | 39,777 | | 51,822 | |
Unrealized depreciation on swap agreements | | 57,000 | | — | | — | | — | | — | |
Total liabilities | | 181,418,495 | | 331,472,744 | | 22,377,165 | | 128,967,885 | | 36,442,125 | |
NET ASSETS | | $ | 1,250,882,380 | | $ | 3,003,325,459 | | $ | 194,710,961 | | $ | 493,017,358 | | $ | 196,253,294 | |
NET ASSETS WERE COMPRISED OF: | | | | | | | | | | | |
Paid-in capital | | $ | 1,209,610,885 | | $ | 4,993,463,931 | | $ | 368,041,578 | | $ | 389,617,194 | | $ | 191,778,345 | |
Undistributed net investment income | | 14,934,631 | | 16,141,637 | | 82,073 | | 453,071 | | 1,338,348 | |
Accumulated net realized gain (loss) on investments, foreign currency related transactions, futures, options and swaps | | 3,819,258 | | (2,242,878,169 | ) | (178,221,903 | ) | 44,963,006 | | (11,212,639 | ) |
Net unrealized appreciation on investments foreign currency related transactions, futures, options and swaps | | 22,517,606 | | 236,598,060 | | 4,809,213 | | 57,984,087 | | 14,349,240 | |
NET ASSETS | | $ | 1,250,882,380 | | $ | 3,003,325,459 | | $ | 194,710,961 | | $ | 493,017,358 | | $ | 196,253,294 | |
| |
+ Including securities loaned at value | | $ | 136,902,611 | | $ | 296,393,361 | | $ | 18,843,333 | | $ | 123,912,778 | | $ | 34,073,693 | |
* Cost of investments in securities | | $ | 1,101,985,930 | | $ | 2,668,286,772 | | $ | 187,092,836 | | $ | 408,158,324 | | $ | 180,034,573 | |
Class I: | | | | | | | | | | | |
Net assets | | $ | 1,240,289,386 | | $ | 2,999,975,592 | | $ | 194,442,936 | | $ | 491,307,607 | | $ | 168,123,998 | |
Shares authorized | | 500,000,000 | | unlimited | | 100,000,000 | | 100,000,000 | | 100,000,000 | |
Par value | | $ | 0.001 | | $ | 1.000 | | $ | 0.001 | | $ | 0.001 | | $ | 0.001 | |
Shares outstanding | | 91,683,801 | | 141,561,883 | | 19,459,635 | | 24,306,542 | | 11,845,812 | |
Net asset value and redemption price per share | | $ | 13.53 | | $ | 21.19 | | $ | 9.99 | | $ | 20.21 | | $ | 14.19 | |
Class S: | | | | | | | | | | | |
Net assets | | $ | 10,592,994 | | $ | 3,349,867 | | $ | 268,025 | | $ | 1,709,751 | | $ | 28,129,296 | |
Shares authorized | | 500,000,000 | | unlimited | | 100,000,000 | | 100,000,000 | | 100,000,000 | |
Par value | | $ | 0.001 | | $ | 1.000 | | $ | 0.001 | | $ | 0.001 | | $ | 0.001 | |
Shares outstanding | | 786,309 | | 158,540 | | 27,019 | | 84,842 | | 1,994,737 | |
Net asset value and redemption price per share | | $ | 13.47 | | $ | 21.13 | | $ | 9.92 | | $ | 20.15 | | $ | 14.10 | |
See Accompanying Notes to Financial Statements
7
STATEMENTS OF ASSETS AND LIABILITIES AS OF JUNE 30, 2006 (UNAUDITED) |
|
| | ING
VP Intermediate
Bond
Portfolio | | ING
VP Money
Market
Portfolio | | ING
VP Global Science
and Technology
Portfolio | | ING
VP International
Equity
Portfolio | |
ASSETS: | | | | | | | | | |
Investments in securities at value+* | | $ | 2,107,554,517 | | $ | — | | $ | 79,580,314 | | $ | 69,954,711 | |
Short-term investments at amortized cost | | 243,756,229 | | 1,119,459,807 | | 16,466,781 | | 3,077,059 | |
Repurchase agreement | | 132,675,000 | | 67,459,000 | | — | | 501,000 | |
Cash | | — | | 129,455 | | 645,222 | | 5,601 | |
Cash collateral for futures | | 1,304,986 | | — | | — | | — | |
Foreign currencies at value** | | — | | — | | 421,521 | | 36,964 | |
Receivables: | | | | | | | | | |
Investment securities sold | | 24,627,126 | | — | | 1,267,905 | | — | |
Fund shares sold | | 1,393,462 | | 924 | | 3,335 | | — | |
Dividends and interest | | 14,973,613 | | 3,452,964 | | 53,618 | | 181,857 | |
Prepaid expenses | | 63,817 | | 20,958 | | 1,438 | | 1,075 | |
Upfront payments made on swap agreements | | 328,939 | | — | | — | | — | |
Unrealized appreciation on swap agreements | | 909,427 | | — | | — | | — | |
Total assets | | 2,527,587,116 | | 1,190,523,108 | | 98,440,134 | | 73,758,267 | |
LIABILITIES: | | | | | | | | | |
Payable for investment securities purchased | | 290,197,733 | | — | | 427,459 | | — | |
Payable for fund shares redeemed | | 1,607,850 | | 10,367,519 | | 11,431 | | 46,798 | |
Payable for futures variation margin | | 50,589 | | — | | — | | — | |
Payable upon receipt of securities loaned | | 222,577,281 | | 867,863 | | 15,269,180 | | 3,077,059 | |
Payable to custodian due to foreign currency overdraft*** | | 20,495 | | — | | — | | — | |
Payable to affiliates | | 818,988 | | 290,094 | | 67,741 | | 51,760 | |
Payable to custodian due to bank overdraft | | 14,197,708 | | — | | — | | — | |
Payable for director/trustee fees | | 18,650 | | 18,619 | | 3,158 | | 1,027 | |
Other accrued expenses and liabilities | | 102,448 | | 119,391 | | 19,518 | | 26,236 | |
Unrealized depreciation on swap agreements | | 293,822 | | — | | — | | — | |
Total liabilities | | 529,885,564 | | 11,663,486 | | 15,798,487 | | 3,202,880 | |
NET ASSETS | | $ | 1,997,701,552 | | $ | 1,178,859,622 | | $ | 82,641,647 | | $ | 70,555,387 | |
NET ASSETS WERE COMPRISED OF: | | | | | | | | | |
Paid-in capital | | $ | 2,025,077,161 | | $ | 1,159,666,014 | | $ | 122,097,326 | | $ | 75,630,064 | |
Undistributed net investment income (accumulated net investment loss) | | 45,970,568 | | 23,853,927 | | (128,756 | ) | 1,317,309 | |
Accumulated net realized loss on investments, foreign currency related transactions, futures, options and swaps | | (31,491,849 | ) | (4,660,319 | ) | (43,466,667 | ) | (15,876,743 | ) |
Net unrealized appreciation (depreciation) on investments, foreign currency related transactions, futures, options and swaps | | (41,854,328 | ) | — | | 4,139,744 | | 9,484,757 | |
NET ASSETS | | $ | 1,997,701,552 | | $ | 1,178,859,622 | | $ | 82,641,647 | | $ | 70,555,387 | |
+ Including securities loaned at value | | $ | 218,710,119 | | $ | 850,765 | | $ | 14,929,062 | | $ | 3,016,472 | |
* Cost of investments in securities | | $ | 2,148,665,980 | | $ | — | | $ | 75,435,049 | | $ | 60,475,513 | |
** Cost of foreign currencies | | $ | (20,609 | ) | $ | — | | $ | 427,863 | | $ | 37,691 | |
Class I: | | | | | | | | | |
Net assets | | $ | 1,597,988,176 | | $ | 1,178,859,622 | | $ | 82,191,966 | | $ | 69,859,259 | |
Shares authorized | | unlimited | | unlimited | | 100,000,000 | | 100,000,000 | |
Par value | | $ | 1.000 | | $ | 1.000 | | $ | 0.001 | | $ | 0.001 | |
Shares outstanding | | 123,866,661 | | 90,271,248 | | 19,379,385 | | 6,459,205 | |
Net asset value and redemption price per share | | $ | 12.90 | | $ | 13.06 | | $ | 4.24 | | $ | 10.82 | |
Class S: | | | | | | | | | |
Net assets | | $ | 399,713,376 | | n/a | | $ | 449,681 | | $ | 696,128 | |
Shares authorized | | unlimited | | unlimited | | 100,000,000 | | 100,000,000 | |
Par value | | $ | 1.000 | | $ | 1.000 | | $ | 0.001 | | $ | 0.001 | |
Shares outstanding | | 31,190,110 | | n/a | | 106,279 | | 64,738 | |
Net asset value and redemption price per share | | $ | 12.82 | | n/a | | $ | 4.23 | | $ | 10.75 | |
See Accompanying Notes to Financial Statements
8
STATEMENTS OF OPERATIONS FOR THE SIX MONTHS ENDED JUNE 30, 2006 (UNAUDITED) |
|
| | ING
VP Balanced
Portfolio | | ING
VP Growth and
Income
Portfolio | | ING
VP Growth
Portfolio | | ING
VP Small
Company
Portfolio | | ING
VP Value
Opportunity
Portfolio | |
INVESTMENT INCOME: | | | | | | | | | | | |
Dividends, net of foreign taxes withheld* | | $ | 7,069,142 | | $ | 23,184,326 | | $ | 654,920 | | $ | 2,054,588 | | $ | 1,980,851 | |
Interest | | 10,616,816 | | 1,899,005 | | 81,255 | | 357,745 | | 53,207 | |
Securities lending income | | 173,237 | | 207,564 | | 4,629 | | 80,624 | | 43,767 | |
Other | | 717,394 | | 3,685 | | — | | — | | — | |
Total investment income | | 18,576,589 | | 25,294,580 | | 740,804 | | 2,492,957 | | 2,077,825 | |
EXPENSES: | | | | | | | | | | | |
Investment management fees | | 3,090,246 | | 7,811,322 | | 570,189 | | 1,847,351 | | 610,610 | |
Distribution and service fees: | | | | | | | | | | | |
Class S | | 7,357 | | 3,520 | | 352 | | 68,170 | | 36,598 | |
Transfer agent fees | | 181 | | 4,416 | | 91 | | 181 | | 119 | |
Administrative service fees | | 339,917 | | 859,219 | | 52,265 | | 135,468 | | 55,971 | |
Shareholder reporting expense | | 13,982 | | 6,965 | | 3,216 | | 14,915 | | 2,227 | |
Registration fees | | 599 | | 4,333 | | 485 | | 1,502 | | 627 | |
Professional fees | | 40,848 | | 100,996 | | 8,345 | | 23,050 | | 3,823 | |
Custody and accounting expense | | 80,144 | | 175,444 | | 10,880 | | 28,960 | | 11,950 | |
Director/Trustee fees | | 26,677 | | 81,309 | | 3,395 | | 12,480 | | 7,135 | |
Interest expense | | — | | — | | — | | — | | 969 | |
Miscellaneous expense | | 44,187 | | 104,525 | | 7,164 | | 19,526 | | 6,461 | |
Total expenses | | 3,644,138 | | 9,152,049 | | 656,382 | | 2,151,603 | | 736,490 | |
Net investment income | | 14,932,451 | | 16,142,531 | | 84,422 | | 341,354 | | 1,341,335 | |
REALIZED AND UNREALIZED GAIN (LOSS) ON INVESTMENTS, FOREIGN CURRENCY RELATED TRANSACTIONS, FUTURES, OPTIONS AND SWAPS: | | | | | | | | | | | |
Net realized gain (loss) on: | | | | | | | | | | | |
Investments | | 32,661,257 | | 181,400,388 | | 10,202,494 | | 45,142,814 | | 12,559,060 | |
Foreign currency related transactions | | 10,838 | | — | | — | | (2,683 | ) | — | |
Futures and swaps | | 97,142 | | (2,045,060 | ) | — | | — | | — | |
Net realized gain on investments, foreign currency related transactions, futures and swaps | | 32,769,237 | | 179,355,328 | | 10,202,494 | | 45,140,131 | | 12,559,060 | |
Net change in unrealized appreciation or depreciation on: | | | | | | | | | | | |
Investments | | (28,938,328 | ) | (120,127,639 | ) | (18,586,681 | ) | (4,965,004 | ) | (5,665,840 | ) |
Foreign currency related transactions | | 402 | | 6,686 | | — | | — | | — | |
Futures, options and swaps | | (584,795 | ) | 573,831 | | — | | — | | — | |
Net change in unrealized appreciation or depreciation on investments, foreign currency related transactions, futures options and swaps | | (29,522,721 | ) | (119,547,122 | ) | (18,586,681 | ) | (4,965,004 | ) | (5,665,840 | ) |
Net realized and unrealized gain (loss) on investments, foreign currency related transactions, futures, options and swaps | | 3,246,516 | | 59,808,206 | | (8,384,187 | ) | 40,175,127 | | 6,893,220 | |
Increase (decrease) in net assets resulting from operations | | $ | 18,178,967 | | $ | 75,950,737 | | $ | (8,299,765 | ) | $ | 40,516,481 | | $ | 8,234,555 | |
* Foreign taxes withheld | | $ | 220 | | $ | 347,290 | | $ | 2,811 | | $ | 19,135 | | $ | 18,645 | |
See Accompanying Notes to Financial Statements
9
STATEMENTS OF OPERATIONS FOR THE SIX MONTHS ENDED JUNE 30, 2006 (UNAUDITED) |
|
| | ING
VP Intermediate
Bond
Portfolio | | ING
VP Money
Market
Portfolio | | ING
VP Global Science
and Technology
Portfolio | | ING
VP International
Equity
Portfolio | |
INVESTMENT INCOME: | | | | | | | | | |
Dividends, net of foreign taxes withheld* | | $ | 1,256,790 | | $ | — | | $ | 272,647 | | $ | 1,504,737 | |
Interest | | 49,356,160 | | 25,694,292 | | 58,996 | | 111,724 | |
Securities lending income | | 652,654 | | 489 | | 22,043 | | 34,156 | |
Total investment income | | 51,265,604 | | 25,694,781 | | 353,686 | | 1,650,617 | |
EXPENSES: | | | | | | | | | |
Investment management fees | | 3,705,684 | | 1,338,046 | | 428,866 | | 295,838 | |
Distribution and service fees: | | | | | | | | | |
Class S | | 708,201 | | — | | 416 | | 780 | |
Transfer agent fees | | 3,950 | | 481 | | 58 | | 118 | |
Administrative service fees | | 509,515 | | 294,361 | | 24,827 | | 19,142 | |
Shareholder reporting expense | | 40,610 | | 10,168 | | 4,495 | | 181 | |
Registration fees | | 16,659 | | 400 | | 215 | | 128 | |
Professional fees | | 99,874 | | 39,118 | | 1,552 | | 5,365 | |
Custody and accounting expense | | 98,450 | | 72,270 | | 14,713 | | 5,082 | |
Director/Trustee fees | | 45,250 | | 26,182 | | 3,604 | | 1,810 | |
Interest expense | | 552 | | — | | 213 | | — | |
Miscellaneous expense | | 61,876 | | 44,977 | | 3,483 | | 1,948 | |
Total expenses | | 5,290,621 | | 1,826,003 | | 482,442 | | 330,392 | |
Net investment income (loss) | | 45,974,983 | | 23,868,778 | | (128,756 | ) | 1,320,225 | |
REALIZED AND UNREALIZED GAIN (LOSS) ON INVESTMENTS, FOREIGN CURRENCY RELATED TRANSACTIONS, FUTURES AND SWAPS: | | | | | | | | | |
Net realized gain (loss) on: | | | | | | | | | |
Investments | | (17,641,024 | ) | 35,908 | | 10,471,838 | | 3,842,352 | |
Foreign currency related transactions | | 25,769 | | — | | (22,959 | ) | (2,984 | ) |
Futures and swaps | | (2,367,755 | ) | — | | — | | — | |
Net realized gain (loss) on investments, foreign currency related transactions, futures and swaps | | (19,983,010 | ) | 35,908 | | 10,448,879 | | 3,839,368 | |
Net change in unrealized appreciation or depreciation on: | | | | | | | | | |
Investments | | (33,011,615 | ) | — | | (10,877,146 | ) | 69,579 | |
Foreign currency related transactions | | 6,276 | | — | | (12,239 | ) | 4,347 | |
Futures and swaps | | (3,162,000 | ) | — | | — | | — | |
Net change in unrealized appreciation or depreciation on investments, foreign currency related transactions, futures and swaps | | (36,167,339 | ) | — | | (10,889,385 | ) | 73,926 | |
Net realized and unrealized gain (loss) on investments, foreign currency related transactions, futures and swaps | | (56,150,349 | ) | 35,908 | | (440,506 | ) | 3,913,294 | |
Increase (decrease) in net assets resulting from operations | | $ | (10,175,366 | ) | $ | 23,904,686 | | $ | (569,262 | ) | $ | 5,233,519 | |
* Foreign taxes withheld | | $ | 7,887 | | $ | — | | $ | 14,791 | | $ | 109,386 | |
See Accompanying Notes to Financial Statements
10
STATEMENTS OF CHANGES IN NET ASSETS (UNAUDITED) |
|
| | ING VP Balanced Portfolio | | ING VP Growth and
Income Portfolio | |
| | Six
Months Ended
June 30,
2006 | | Year
Ended
December 31,
2005 | | Six
Months Ended
June 30,
2006 | | Year
Ended
December 31,
2005 | |
FROM OPERATIONS: | | | | | | | | | |
Net investment income | | $ | 14,932,451 | | $ | 28,286,963 | | $ | 16,142,531 | | $ | 33,375,077 | |
Net realized gain on investments, foreign currency related transactions, futures, options and swaps | | 32,769,237 | | 64,223,820 | | 179,355,328 | | 286,834,181 | |
Net change in unrealized appreciation or depreciation on investments, foreign currency related transactions, futures, options and swaps | | (29,522,721 | ) | (39,149,630 | ) | (119,547,122 | ) | (73,755,824 | ) |
Net increase in net assets resulting from operations | | 18,178,967 | | 53,361,153 | | 75,950,737 | | 246,453,434 | |
FROM DISTRIBUTIONS TO SHAREHOLDERS: | | | | | | | | | |
Net investment income: | | | | | | | | | |
Class I | | (28,870,646 | ) | (30,561,067 | ) | (394,643 | ) | (32,953,759 | ) |
Class S | | (70,509 | ) | (64,964 | ) | (104 | ) | (22,610 | ) |
Total distributions | | (28,941,155 | ) | (30,626,031 | ) | (394,747 | ) | (32,976,369 | ) |
FROM CAPITAL SHARE TRANSACTIONS: | | | | | | | | | |
Net proceeds from sale of shares | | 63,687,715 | | 13,329,999 | | 3,443,892 | | 3,779,349 | |
Net proceeds from shares issued in merger | | 21,745,814 | | — | | — | | — | |
Dividends reinvested | | 28,941,155 | | 30,626,031 | | 394,747 | | 32,951,640 | |
| | 114,374,684 | | 43,956,030 | | 3,838,639 | | 36,730,989 | |
Cost of shares redeemed | | (92,226,999 | ) | (188,164,420 | ) | (224,524,808 | ) | (634,951,531 | ) |
Net increase (decrease) in net assets resulting from capital share transactions | | 22,147,685 | | (144,208,390 | ) | (220,686,169 | ) | (598,220,542 | ) |
Net increase (decrease) in net assets | | 11,385,497 | | (121,473,268 | ) | (145,130,179 | ) | (384,743,477 | ) |
NET ASSETS: | | | | | | | | | |
Beginning of period | | 1,239,496,883 | | 1,360,970,151 | | 3,148,455,638 | | 3,533,199,115 | |
End of period | | $ | 1,250,882,380 | | $ | 1,239,496,883 | | $ | 3,003,325,459 | | $ | 3,148,455,638 | |
Undistributed net investment income at end of period | | $ | 14,934,631 | | $ | 28,943,335 | | $ | 16,141,637 | | $ | 393,853 | |
See Accompanying Notes to Financial Statements
11
STATEMENTS OF CHANGES IN NET ASSETS (UNAUDITED) |
|
| | ING VP Growth Portfolio | | ING VP Small Company Portfolio | |
| | Six
Months Ended
June 30,
2006 | | Year
Ended
December 31,
2005 | | Six
Months Ended
June 30,
2006 | | Year
Ended
December 31,
2005 | |
FROM OPERATIONS: | | | | | | | | | |
Net investment income | | $ | 84,422 | | $ | 113,812 | | $ | 341,354 | | $ | 1,933,631 | |
Net realized gain on investments, foreign currency related transactions and futures | | 10,202,494 | | 16,612,464 | | 45,140,131 | | 70,563,656 | |
Net change in unrealized appreciation or depreciation on investments, foreign currency related transactions and futures | | (18,586,681 | ) | (2,095,958 | ) | (4,965,004 | ) | (35,161,610 | ) |
Net increase (decrease) in net assets resulting from operations | | (8,299,765 | ) | 14,630,318 | | 40,516,481 | | 37,335,677 | |
FROM DISTRIBUTIONS TO SHAREHOLDERS: | | | | | | | | | |
Net investment income: | | | | | | | | | |
Class I | | (113,349 | ) | (1,254,943 | ) | (1,542,257 | ) | (629,139 | ) |
Class S | | — | | (1,478 | ) | (154,077 | ) | (11,731 | ) |
Net realized gains: | | | | | | | | | |
Class I | | — | | — | | (58,551,880 | ) | (5,638,130 | ) |
Class S | | — | | — | | (12,122,762 | ) | (645,187 | ) |
Total distributions | | (113,349 | ) | (1,256,421 | ) | (72,370,976 | ) | (6,924,187 | ) |
FROM CAPITAL SHARE TRANSACTIONS: | | | | | | | | | |
Net proceeds from sale of shares | | 49,468,060 | | 5,010,821 | | 134,858,451 | | 84,826,927 | |
Dividends reinvested | | 113,349 | | 1,256,421 | | 72,370,976 | | 6,924,187 | |
| | 49,581,409 | | 6,267,242 | | 207,229,427 | | 91,751,114 | |
Cost of shares redeemed | | (22,039,349 | ) | (37,695,610 | ) | (144,825,674 | ) | (192,925,770 | ) |
Net increase (decrease) in net assets resulting from capital share transactions | | 27,542,060 | | (31,428,368 | ) | 62,403,753 | | (101,174,656 | ) |
Net increase (decrease) in net assets | | 19,128,946 | | (18,054,471 | ) | 30,549,258 | | (70,763,166 | ) |
NET ASSETS: | | | | | | | | | |
Beginning of period | | 175,582,015 | | 193,636,486 | | 462,468,100 | | 533,231,266 | |
End of period | | $ | 194,710,961 | | $ | 175,582,015 | | $ | 493,017,358 | | $ | 462,468,100 | |
Undistributed net investment income at end of period | | $ | 82,073 | | $ | 111,000 | | $ | 453,071 | | $ | 1,808,051 | |
| | | | | | | | | | | | | | |
See Accompanying Notes to Financial Statements.
12
STATEMENTS OF CHANGES IN NET ASSETS (UNAUDITED) |
|
| | ING VP Value
Opportunity Portfolio | | ING VP Intermediate
Bond Portfolio | |
| | Six
Months Ended
June 30,
2006 | | Year
Ended
December 31,
2005 | | Six
Months Ended
June 30,
2006 | | Year
Ended
December 31,
2005 | |
FROM OPERATIONS: | | | | | | | | | |
Net investment income | | $ | 1,341,335 | | $ | 2,925,042 | | $ | 45,974,983 | | $ | 63,355,329 | |
Net realized gain (loss) on investments, foreign currency related transactions, futures and swaps | | 12,559,060 | | 16,880,743 | | (19,983,010 | ) | (5,401,705 | ) |
Net change in unrealized appreciation or depreciation on investments, foreign currency related transactions, futures and swaps | | (5,665,840 | ) | (7,743,251 | ) | (36,167,339 | ) | (11,601,726 | ) |
Net increase (decrease) in net assets resulting from operations | | 8,234,555 | | 12,062,534 | | (10,175,366 | ) | 46,351,898 | |
FROM DISTRIBUTIONS TO SHAREHOLDERS: | | | | | | | | | |
Net investment income: | | | | | | | | | |
Class I | | (2,514,028 | ) | (3,812,050 | ) | (503,093 | ) | (43,350,584 | ) |
Class S | | (411,247 | ) | (58,891 | ) | (237,124 | ) | (21,220,005 | ) |
Net realized gains: | | | | | | | | | |
Class I | | — | | — | | — | | (5,820,859 | ) |
Class S | | — | | — | | — | | (2,592,551 | ) |
Total distributions | | (2,925,275 | ) | (3,870,941 | ) | (740,217 | ) | (72,983,999 | ) |
FROM CAPITAL SHARE TRANSACTIONS: | | | | | | | | | |
Net proceeds from sale of shares | | 1,272,638 | | 7,777,950 | | 731,630,647 | | 506,231,158 | |
Net proceeds from shares issued in merger | | — | | 35,824,021 | | 2,981,925 | | — | |
Dividends reinvested | | 2,925,275 | | 3,870,941 | | 740,217 | | 72,952,456 | |
| | 4,197,913 | | 47,472,912 | | 735,352,789 | | 579,183,614 | |
Cost of shares redeemed | | (22,206,898 | ) | (70,105,800 | ) | (492,079,745 | ) | (181,491,451 | ) |
Net increase (decrease) in net assets resulting from capital share transactions | | (18,008,985 | ) | (22,632,888 | ) | 243,273,044 | | 397,692,163 | |
Net increase (decrease) in net assets | | (12,699,705 | ) | (14,441,295 | ) | 232,357,461 | | 371,060,062 | |
NET ASSETS: | | | | | | | | | |
Beginning of period | | 208,952,999 | | 223,394,294 | | 1,765,344,091 | | 1,394,284,029 | |
End of period | | $ | 196,253,294 | | $ | 208,952,999 | | $ | 1,997,701,552 | | $ | 1,765,344,091 | |
Undistributed net investment income at end of period | | $ | 1,338,348 | | $ | 2,922,288 | | $ | 45,970,568 | | $ | 735,802 | |
See Accompanying Notes to Financial Statements
13
STATEMENTS OF CHANGES IN NET ASSETS (UNAUDITED) |
|
| | ING VP Money Market Portfolio | | ING VP Global Science and
Technology Portfolio | |
| | Six
Months Ended
June 30,
2006 | | Year
Ended
December 31,
2005 | | Six
Months Ended
June 30,
2006 | | Year
Ended
December 31,
2005 | |
FROM OPERATIONS: | | | | | | | | | |
Net investment income (loss) | | $ | 23,868,778 | | $ | 31,890,380 | | $ | (128,756 | ) | $ | (370,605 | ) |
Net realized gain on investments, foreign currency related transactions | | 35,908 | | 16,292 | | 10,448,879 | | 870,559 | |
Net change in unrealized appreciation or depreciation on investments and foreign currency related transactions | | — | | 232,026 | | (10,889,385 | ) | 7,222,993 | |
Net increase (decrease) in net assets resulting from operations | | 23,904,686 | | 32,138,698 | | (569,262 | ) | 7,722,947 | |
FROM DISTRIBUTIONS TO SHAREHOLDERS: | | | | | | | | | |
Net investment income: | | | | | | | | | |
Class I | | (31,895,864 | ) | (12,797,898 | ) | — | | — | |
Total distributions | | (31,895,864 | ) | (12,797,898 | ) | — | | — | |
FROM CAPITAL SHARE TRANSACTIONS: | | | | | | | | | |
Net proceeds from sale of shares | | 196,342,980 | | 229,751,452 | | 10,874,435 | | 14,070,092 | |
Dividends reinvested | | 31,895,864 | | 12,797,898 | | — | | — | |
| | 228,238,844 | | 242,549,350 | | 10,874,435 | | 14,070,092 | |
Cost of shares redeemed | | (114,405,962 | ) | (290,343,446 | ) | (12,264,383 | ) | (23,483,463 | ) |
Net increase (decrease) in net assets resulting from capital share transactions | | 113,832,882 | | (47,794,096 | ) | (1,389,948 | ) | (9,413,371 | ) |
Net increase (decrease) in net assets | | 105,841,704 | | (28,453,296 | ) | (1,959,210 | ) | (1,690,424 | ) |
NET ASSETS: | | | | | | | | | |
Beginning of period | | 1,073,017,918 | | 1,101,471,214 | | 84,600,857 | | 86,291,281 | |
End of period | | $ | 1,178,859,622 | | $ | 1,073,017,918 | | $ | 82,641,647 | | $ | 84,600,857 | |
Undistributed net investment income (accumulated net investment loss) at end of period | | $ | 23,853,927 | | $ | 31,881,013 | | $ | (128,756 | ) | $ | — | |
See Accompanying Notes to Financial Statements
14
STATEMENTS OF CHANGES IN NET ASSETS (UNAUDITED) |
|
| | ING VP International
Equity Portfolio | |
| | Six
Months Ended
June 30,
2006 | | Year
Ended
December 31,
2005 | |
FROM OPERATIONS: | | | | | |
Net investment income | | $ | 1,320,225 | | $ | 840,310 | |
Net realized gain on investments, foreign currency related transactions and futures | | 3,839,368 | | 6,874,664 | |
Net change in unrealized appreciation or depreciation on investments, foreign currency related transactions and futures | | 73,926 | | 1,165,804 | |
Net increase in net assets resulting from operations | | 5,233,519 | | 8,880,778 | |
FROM DISTRIBUTIONS TO SHAREHOLDERS: | | | | | |
Net investment income: | | | | | |
Class I | | (1,095,926 | ) | (539,401 | ) |
Class S | | (7,085 | ) | (2,439 | ) |
Total distributions | | (1,103,011 | ) | (541,840 | ) |
FROM CAPITAL SHARE TRANSACTIONS: | | | | | |
Net proceeds from sale of shares | | 11,812,677 | | 19,109,104 | |
Dividends reinvested | | 1,103,011 | | 541,840 | |
| | 12,915,688 | | 19,650,944 | |
Cost of shares redeemed | | (8,307,147 | ) | (18,943,392 | ) |
Net increase in net assets resulting from capital share transactions | | 4,608,541 | | 707,552 | |
Net increase in net assets | | 8,739,049 | | 9,046,490 | |
NET ASSETS: | | | | | |
Beginning of period | | 61,816,338 | | 52,769,848 | |
End of period | | $ | 70,555,387 | | $ | 61,816,338 | |
Undistributed net investment income at end of period | | $ | 1,317,309 | | $ | 1,100,095 | |
See Accompanying Notes to Financial Statements
15
ING VP BALANCED PORTFOLIO (UNAUDITED) | FINANCIAL HIGHLIGHTS |
| |
Selected data for a share of beneficial interest outstanding throughout each period.
| | Class I | |
| | Six Months Ended
June 30, | | Year Ended December 31, | |
| | 2006 | | 2005 | | 2004 | | 2003 | | 2002 | | 2001 | |
Per Share Operating Performance: | | | | | | | | | | | | | | |
Net asset value, beginning of period | $ | | 13.64 | | | 13.40 | | | 12.50 | | | 10.73 | | | 12.09 | | | 13.40 | | |
Income (loss) from investment operations: | | | | | | | | | | | | | | | | | | | | |
Net investment income | $ | | 0.17 | | | 0.29 | * | | 0.29 | | | 0.25 | | | 0.25 | | | 0.31 | | |
Net realized and unrealized gain (loss) on investments | $ | | 0.05 | | | 0.27 | | | 0.87 | | | 1.76 | | | (1.49 | ) | | (0.87 | ) | |
Total from investment operations | $ | | 0.22 | | | 0.56 | | | 1.16 | | | 2.01 | | | (1.24 | ) | | (0.56 | ) | |
Less distributions from: | | | | | | | | | | | | | | | | | | | | |
Net investment income | $ | | 0.33 | | | 0.32 | | | 0.26 | | | 0.24 | | | 0.12 | | | 0.28 | | |
Net realized gains on investments | $ | | — | | | — | | | — | | | — | | | — | | | 0.47 | | |
Total distributions | $ | | 0.33 | | | 0.32 | | | 0.26 | | | 0.24 | | | 0.12 | | | 0.75 | | |
Net asset value, end of period | $ | | 13.53 | | | 13.64 | | | 13.40 | | | 12.50 | | | 10.73 | | | 12.09 | | |
Total Return(1) | % | | 1.58 | | | 4.24 | | | 9.42 | | | 18.87 | | | (10.31 | ) | | (4.21 | ) | |
| | | | | | | | | | | | | | | | | | | | |
Ratios and Supplemental Data: | | | | | | | | | | | | | | | | | | | | |
Net assets, end of period (millions) | $ | | 1,240 | | | 1,236 | | | 1,358 | | | 1,375 | | | 1,223 | | | 1,591 | | |
Ratios to average net assets: | | | | | | | | | | | | | | | | | | | | |
Expenses(2) | % | | 0.59 | | | 0.60 | | | 0.59 | | | 0.60 | | | 0.60 | | | 0.59 | | |
Net investment income(2) | % | | 2.42 | | | 2.30 | | | 2.15 | | | 2.04 | | | 2.00 | | | 2.46 | | |
Portfolio turnover rate | % | | 127 | | | 308 | | | 272 | | | 333 | | | 345 | | | 167 | | |
| | Class S | |
| | Six Months
Ended
June 30, | | Year Ended December 31, | | May 29,
2003(3) to
December 31, | |
| | 2006 | | 2005 | | 2004 | | 2003 | |
Per Share Operating Performance: | | | | | | | | | | |
Net asset value, beginning of period | $ | | 13.58 | | | 13.35 | | | 12.49 | | | 11.53 | | |
Income from investment operations: | | | | | | | | | | | | | | |
Net investment income | $ | | 0.16 | | | 0.27 | | | 0.22 | | | 0.34 | | |
Net realized and unrealized gain on investments | $ | | 0.03 | | | 0.25 | | | 0.89 | | | 0.85 | | |
Total from investment operations | $ | | 0.19 | | | 0.52 | | | 1.11 | | | 1.19 | | |
Less distributions from: | | | | | | | | | | | | | | |
Net investment income | $ | | 0.30 | | | 0.29 | | | 0.25 | | | 0.23 | | |
Total distributions | $ | | 0.30 | | | 0.29 | | | 0.25 | | | 0.23 | | |
Net asset value, end of period | $ | | 13.47 | | | 13.58 | | | 13.35 | | | 12.49 | | |
Total Return(1) | % | | 1.35 | | | 3.99 | | | 9.06 | | | 10.51 | | |
| | | | | | | | | | | | | | |
Ratios and Supplemental Data: | | | | | | | | | | | | | | |
Net assets, end of period (millions) | $ | | 11 | | | 3 | | | 3 | | | 1 | | |
Ratios to average net assets: | | | | | | | | | | | | | | |
Expenses(2) | % | | 0.84 | | | 0.85 | | | 0.84 | | | 0.83 | | |
Net investment income(2) | % | | 2.33 | | | 2.06 | | | 1.98 | | | 3.06 | | |
Portfolio turnover rate | % | | 127 | | | 308 | | | 272 | | | 333 | | |
(1) Total return is calculated assuming reinvestment of all dividends and capital gain distributions at net asset value and does not reflect the effect of insurance contract charges. Total return for periods less than one year is not annualized.
(2) Annualized for periods less than one year.
(3) Commencement of operations.
* Per share data calculated using average number of shares outstanding throughout the period.
See Accompanying Notes to Financial Statements.
16
ING VP GROWTH AND INCOME PORTFOLIO (UNAUDITED) | FINANCIAL HIGHLIGHTS |
| |
Selected data for a share of beneficial interest outstanding throughout each period.
| | Class I | |
| | Six Months
Ended
June 30, | | Year Ended December 31, | |
| | 2006 | | 2005 | | 2004 | | 2003 | | 2002 | | 2001 | |
Per Share Operating Performance: | | | | | | | | | | | | | | |
Net asset value, beginning of period | $ | | 20.71 | | | 19.35 | | | 18.28 | | | 14.50 | | | 19.54 | | | 24.12 | | |
Income (loss) from investment operations: | | | | | | | | | | | | | | | | | | | | |
Net investment income | $ | | 0.11 | | | 0.23 | | | 0.28 | | | 0.16 | | | 0.16 | | | 0.14 | | |
Net realized and unrealized gain (loss) on investments | $ | | 0.37 | | | 1.35 | | | 1.24 | | | 3.62 | | | (5.04 | ) | | (4.58 | ) | |
Total from investment operations | $ | | 0.48 | | | 1.58 | | | 1.52 | | | 3.78 | | | (4.88 | ) | | (4.44 | ) | |
Less distributions from: | | | | | | | | | | | | | | | | | | | | |
Net investment income | $ | | 0.00 | * | | 0.22 | | | 0.45 | | | — | | | 0.16 | | | 0.14 | | |
Total distributions | $ | | 0.00 | * | | 0.22 | | | 0.45 | | | — | | | 0.16 | | | 0.14 | | |
Net asset value, end of period | $ | | 21.19 | | | 20.71 | | | 19.35 | | | 18.28 | | | 14.50 | | | 19.54 | | |
Total Return(1) | % | | 2.33 | | | 8.13 | | | 8.39 | | | 26.07 | | | (24.99 | ) | | (18.40 | ) | |
| | | | | | | | | | | | | | | | | | | | |
Ratios and Supplemental Data: | | | | | | | | | | | | | | | | | | | | |
Net assets, end of period (millions) | $ | | 3,000 | | | 3,146 | | | 3,531 | | | 3,795 | | | 3,525 | | | 5,639 | | |
Ratios to average net assets: | | | | | | | | | | | | | | | | | | | | |
Expenses(2) | % | | 0.59 | | | 0.59 | | | 0.58 | | | 0.60 | | | 0.59 | | | 0.59 | | |
Net investment income(2) | % | | 1.03 | | | 1.03 | | | 1.41 | | | 0.95 | | | 0.83 | | | 0.62 | | |
Portfolio turnover rate | % | | 46 | | | 80 | | | 139 | | | 150 | | | 246 | | | 185 | | |
| | Class S | |
| | Six Months
Ended
June 30, | | Year Ended December 31, | | June 11,
2003(3) to
December 31, | |
| | 2006 | | 2005 | | 2004 | | 2003 | |
Per Share Operating Performance: | | | | | | | | | | |
Net asset value, beginning of period | $ | | 20.69 | | | 19.34 | | | 18.26 | | | 16.32 | | |
Income from investment operations: | | | | | | | | | | | | | | |
Net investment income | $ | | 0.08 | | | 0.14 | | | 0.21 | | | 0.04 | | |
Net realized and unrealized gain on investments | $ | | 0.36 | | | 1.41 | | | 1.26 | | | 1.90 | | |
Total from investment operations | $ | | 0.44 | | | 1.55 | | | 1.47 | | | 1.94 | | |
Less distributions from: | | | | | | | | | | | | | | |
Net investment income | $ | | 0.00 | * | | 0.20 | | | 0.39 | | | — | | |
Total distributions | $ | | 0.00 | * | | 0.20 | | | 0.39 | | | — | | |
Net asset value, end of period | $ | | 21.13 | | | 20.69 | | | 19.34 | | | 18.26 | | |
Total Return(1) | % | | 2.13 | | | 7.98 | | | 8.10 | | | 11.89 | | |
| | | | | | | | | | | | | | |
Ratios and Supplemental Data: | | | | | | | | | | | | | | |
Net assets, end of period (millions) | $ | | 3 | | | 2 | | | 2 | | | 2 | | |
Ratios to average net assets: | | | | | | | | | | | | | | |
Expenses(2) | % | | 0.84 | | | 0.84 | | | 0.83 | | | 0.84 | | |
Net investment income(2) | % | | 0.80 | | | 0.78 | | | 1.18 | | | 0.57 | | |
Portfolio turnover rate | % | | 46 | | | 80 | | | 139 | | | 150 | | |
(1) Total return is calculated assuming reinvestment of all dividends and capital gain distributions at net asset value and does not reflect the effect of insurance contract charges. Total return for periods less than one year is not annualized.
(2) Annualized for periods less than one year.
(3) Commencement of operations.
* Amount is less than $0.005.
See Accompanying Notes to Financial Statements.
17
ING VP GROWTH PORTFOLIO (UNAUDITED) | FINANCIAL HIGHLIGHTS |
| |
Selected data for a share of beneficial interest outstanding throughout each period.
| | Class I | |
| | Six Months
Ended
June 30, | | Year Ended December 31, | |
| | 2006 | | 2005 | | 2004 | | 2003 | | 2002 | | 2001 | |
Per Share Operating Performance: | | | | | | | | | | | | | | |
Net asset value, beginning of period | $ | | 10.38 | | | 9.56 | | | 8.93 | | | 6.85 | | | 9.64 | | | 14.99 | | |
Income (loss) from investment operations: | | | | | | | | | | | | | | | | | | | | |
Net investment income (loss) | $ | | 0.00 | * | | 0.02 | | | 0.06 | | | 0.01 | | | (0.01 | ) | | (0.01 | ) | |
Net realized and unrealized gain (loss) on investments | $ | | (0.38 | ) | | 0.87 | | | 0.58 | | | 2.07 | | | (2.78 | ) | | (3.87 | ) | |
Total from investment operations | $ | | (0.38 | ) | | 0.89 | | | 0.64 | | | 2.08 | | | (2.79 | ) | | (3.88 | ) | |
Less distributions from: | | | | | | | | | | | | | | | | | | | | |
Net investment income | $ | | 0.01 | | | 0.07 | | | 0.01 | | | — | | | — | | | 0.01 | | |
Net realized gains on investments | $ | | — | | | — | | | — | | | — | | | — | | | 1.46 | | |
Total distributions | $ | | 0.01 | | | 0.07 | | | 0.01 | | | — | | | — | | | 1.47 | | |
Net asset value, end of period | $ | | 9.99 | | | 10.38 | | | 9.56 | | | 8.93 | | | 6.85 | | | 9.64 | | |
Total Return(1) | % | | (3.71 | ) | | 9.38 | † | | 7.19 | | | 30.36 | | | (28.94 | ) | | (27.06 | ) | |
| | | | | | | | | | | | | | | | | | | | |
Ratios and Supplemental Data: | | | | | | | | | | | | | | | | | | | | |
Net assets, end of period (000’s) | $ | | 194,443 | | | 175,297 | | | 193,280 | | | 224,330 | | | 181,029 | | | 305,624 | | |
Ratios to average net assets: | | | | | | | | | | | | | | | | | | | | |
Expenses(2) | % | | 0.69 | | | 0.69 | | | 0.69 | | | 0.71 | | | 0.72 | | | 0.70 | | |
Net investment income (loss)(2) | % | | 0.09 | | | 0.08 | | | 0.61 | | | 0.13 | | | (0.06 | ) | | (0.08 | ) | |
Portfolio turnover rate | % | | 78 | | | 119 | | | 123 | | | 162 | | | 241 | | | 216 | | |
| | Class S | |
| | Six Months
Ended
June 30, | | Year Ended December 31, | | November 1,
2001(3) to
December 31, | |
| | 2006 | | 2005 | | 2004 | | 2003 | | 2002 | | 2001 | |
Per Share Operating Performance: | | | | | | | | | | | | | | |
Net asset value, beginning of period | $ | | 10.31 | | | 9.50 | | | 8.88 | | | 6.83 | | | 9.63 | | | 8.96 | | |
Income (loss) from investment operations: | | | | | | | | | | | | | | | | | | | | |
Net investment income (loss) | $ | | (0.01 | ) | | (0.00 | )* | | 0.04 | | | 0.00 | * | | (0.01 | ) | | 0.00 | * | |
Net realized and unrealized gain (loss) on investments | $ | | (0.38 | ) | | 0.85 | | | 0.58 | | | 2.05 | | | (2.79 | ) | | 0.67 | | |
Total from investment operations | $ | | (0.39 | ) | | 0.85 | | | 0.62 | | | 2.05 | | | (2.80 | ) | | 0.67 | | |
Less distributions from: | | | | | | | | | | | | | | | | | | | | |
Net investment income | $ | | — | | | 0.04 | | | — | | | — | | | — | | | — | | |
Total distributions | $ | | — | | | 0.04 | | | — | | | — | | | — | | | — | | |
Net asset value, end of period | $ | | 9.92 | | | 10.31 | | | 9.50 | | | 8.88 | | | 6.83 | | | 9.63 | | |
Total Return(1) | % | | (3.78 | ) | | 9.05 | † | | 6.98 | | | 30.01 | | | (29.08 | ) | | 7.48 | | |
| | | | | | | | | | | | | | | | | | | | |
Ratios and Supplemental Data: | | | | | | | | | | | | | | | | | | | | |
Net assets, end of period (000’s) | $ | | 268 | | | 285 | | | 356 | | | 292 | | | 53 | | | 11 | | |
Ratios to average net assets: | | | | | | | | | | | | | | | | | | | | |
Expenses(2) | % | | 0.94 | | | 0.94 | | | 0.94 | | | 0.96 | | | 0.97 | | | 0.94 | | |
Net investment income (loss)(2) | % | | (0.17 | ) | | (0.17 | ) | | 0.44 | | | (0.10 | ) | | (0.31 | ) | | (0.32 | ) | |
Portfolio turnover rate | % | | 78 | | | 119 | | | 123 | | | 162 | | | 241 | | | 216 | | |
(1) Total return is calculated assuming reinvestment of all dividends and capital gain distributions at net asset value and does not reflect the effect of insurance contract charges. Total return for periods less than one year is not annualized.
(2) Annualized for periods less than one year.
(3) Commencement of operations.
* Amount is less than $0.005 or $(0.005) per share.
† In 2005, the Investment Manager fully reimbursed the Portfolio for a loss incurred from a transaction not meeting the Portfolio’s investment’s guidelines. There was no impact on total return.
See Accompanying Notes to Financial Statements.
18
ING VP SMALL COMPANY PORTFOLIO (UNAUDITED) | FINANCIAL HIGHLIGHTS |
| |
Selected data for a share of beneficial interest outstanding throughout each period.
| | Class I | |
| | Six Months
Ended
June 30, | | Year Ended December 31, | |
| | 2006 | | 2005 | | 2004 | | 2003 | | 2002 | | 2001 | |
Per Share Operating Performance: | | | | | | | | | | | | | | |
Net asset value, beginning of period | $ | | 21.65 | | | 19.94 | | | 17.48 | | | 12.75 | | | 16.68 | | | 16.65 | | |
Income (loss) from investment operations: | | | | | | | | | | | | | | | | | | | | |
Net investment income | $ | | 0.02 | | | 0.10 | | | 0.04 | | | 0.06 | | | 0.05 | | | 0.06 | | |
Net realized and unrealized gain (loss) on investments | $ | | 2.00 | | | 1.92 | | | 2.47 | | | 4.71 | | | (3.91 | ) | | 0.58 | | |
Total from investment operations | $ | | 2.02 | | | 2.02 | | | 2.51 | | | 4.77 | | | (3.86 | ) | | 0.64 | | |
Less distributions from: | | | | | | | | | | | | | | | | | | | | |
Net investment income | $ | | 0.09 | | | 0.03 | | | 0.05 | | | 0.04 | | | 0.07 | | | 0.10 | | |
Net realized gains on investments | $ | | 3.37 | | | 0.28 | | | — | | | — | | | — | | | 0.51 | | |
Total distributions | $ | | 3.46 | | | 0.31 | | | 0.05 | | | 0.04 | | | 0.07 | | | 0.61 | | |
Net asset value, end of period | $ | | 20.21 | | | 21.65 | | | 19.94 | | | 17.48 | | | 12.75 | | | 16.68 | | |
Total Return(1) | % | | 8.76 | | | 10.27 | † | | 14.39 | | | 37.47 | | | (23.23 | ) | | 4.00 | | |
| | | | | | | | | | | | | | | | | | | | |
Ratios and Supplemental Data: | | | | | | | | | | | | | | | | | | | | |
Net assets, end of period (000’s) | $ | | 491,308 | | | 393,700 | | | 461,014 | | | 464,228 | | | 288,890 | | | 341,332 | | |
Ratios to average net assets: | | | | | | | | | | | | | | | | | | | | |
Expenses(2) | % | | 0.85 | | | 0.85 | | | 0.84 | | | 0.85 | | | 0.87 | | | 0.86 | | |
Net investment income(2) | % | | 0.18 | | | 0.43 | | | 0.21 | | | 0.47 | | | 0.39 | | | 0.50 | | |
Portfolio turnover rate | % | | 37 | | | 72 | | | 93 | | | 178 | | | 371 | | | 240 | | |
| | Class S | |
| | Six Months
Ended
June 30, | | Year Ended December 31, | | November 1,
2001(3) to
December 31, | |
| | 2006 | | 2005 | | 2004 | | 2003 | | 2002 | | 2001 | |
Per Share Operating Performance: | | | | | | | | | | | | | | |
Net asset value, beginning of period | $ | | 21.59 | | | 19.90 | | | 17.49 | | | 12.72 | | | 16.68 | | | 14.90 | | |
Income (loss) from investment operations: | | | | | | | | | | | | | | | | | | | | |
Net investment income (loss) | $ | | (0.02 | ) | | 0.06 | | | 0.03 | * | | 0.01 | | | (0.04 | ) | | 0.00 | ** | |
Net realized and unrealized gain (loss) on investments | $ | | 1.99 | | | 1.92 | | | 2.43 | | | 4.79 | | | (3.86 | ) | | 1.78 | | |
Total from investment operations | $ | | 1.97 | | | 1.98 | | | 2.46 | | | 4.80 | | | (3.90 | ) | | 1.78 | | |
Less distribution from: | | | | | | | | | | | | | | | | | | | | |
Net investment income | $ | | 0.04 | | | 0.01 | | | 0.05 | | | 0.03 | | | 0.06 | | | — | | |
Net realized gains on investments | $ | | 3.37 | | | 0.28 | | | — | | | — | | | — | | | — | | |
Total distribution | $ | | 3.41 | | | 0.29 | | | 0.05 | | | 0.03 | | | 0.06 | | | — | | |
Net asset value, end of period | $ | | 20.15 | | | 21.59 | | | 19.90 | | | 17.49 | | | 12.72 | | | 16.68 | | |
Total Return(1) | % | | 8.56 | | | 10.05 | † | | 14.09 | | | 37.76 | | | (23.45 | ) | | 11.95 | | |
| | | | | | | | | | | | | | | | | | | | |
Ratios and Supplemental Data: | | | | | | | | | | | | | | | | | | | | |
Net assets, end of period (000’s) | $ | | 1,710 | | | 68,768 | | | 72,225 | | | 840 | | | 184 | | | 11 | | |
Ratios to average net assets: | | | | | | | | | | | | | | | | | | | | |
Expenses(2) | % | | 1.10 | | | 1.10 | | | 1.09 | | | 1.10 | | | 1.12 | | | 1.10 | | |
Net investment income (loss)(2) | % | | (0.21 | ) | | 0.26 | | | 0.19 | | | 0.22 | | | 0.14 | | | 0.29 | | |
Portfolio turnover rate | % | | 37 | | | 72 | | | 93 | | | 178 | | | 371 | | | 240 | | |
(1) Total return is calculated assuming reinvestment of all dividends and capital gain distributions at net asset value and does not reflect the effect of insurance contract charges. Total return for periods less than one year is not annualized.
(2) Annualized for periods less than one year.
(3) Commencement of operations.
* Per share data calculated using average number of shares outstanding throughout the period.
** Amount is less than $0.005 per share.
† In 2005, the Investment Manager fully reimbursed the Portfolio for a loss incurred from a transaction not meeting the Portfolio’s investment guidelines. There was no impact on total return.
See Accompanying Notes to Financial Statements.
19
ING VP VALUE OPPORTUNITY PORTFOLIO (UNAUDITED) | FINANCIAL HIGHLIGHTS |
| |
Selected data for a share of beneficial interest outstanding throughout each period.
| | Class I | |
| | Six Months
Ended
June 30, | | Year Ended December 31, | |
| | 2006 | | 2005 | | 2004 | | 2003 | | 2002 | | 2001 | |
Per Share Operating Performance: | | | | | | | | | | | | | | |
Net asset value, beginning of period | $ | | 13.84 | | | 13.19 | | | 12.08 | | | 9.77 | | | 13.25 | | | 15.34 | | |
Income (loss) from investment operations: | | | | | | | | | | | | | | | | | | | | |
Net investment income | $ | | 0.10 | * | | 0.19 | * | | 0.24 | | | 0.10 | | | 0.04 | | | 0.03 | | |
Net realized and unrealized gain (loss) on investments | $ | | 0.46 | | | 0.71 | | | 0.98 | | | 2.29 | | | (3.47 | ) | | (1.43 | ) | |
Total from investment operations | $ | | 0.56 | | | 0.90 | | | 1.22 | | | 2.39 | | | (3.43 | ) | | (1.40 | ) | |
Less distributions from: | | | | | | | | | | | | | | | | | | | | |
Net investment income | $ | | 0.21 | | | 0.25 | | | 0.11 | | | 0.08 | | | 0.05 | | | 0.05 | | |
Net realized gains on investments | $ | | — | | | — | | | — | | | — | | | — | | | 0.64 | | |
Total distributions | $ | | 0.21 | | | 0.25 | | | 0.11 | | | 0.08 | | | 0.05 | | | 0.69 | | |
Net asset value, end of period | $ | | 14.19 | | | 13.84 | | | 13.19 | | | 12.08 | | | 9.77 | | | 13.25 | | |
Total Return(1) | % | | 3.93 | | | 6.95 | | | 10.15 | | | 24.59 | | | (25.96 | ) | | (9.62 | ) | |
| | | | | | | | | | | | | | | | | | | | |
Ratios and Supplemental Data: | | | | | | | | | | | | | | | | | | | | |
Net assets, end of period (000’s) | $ | | 168,124 | | | 178,828 | | | 219,889 | | | 257,448 | | | 211,470 | | | 219,287 | | |
Ratios to average net assets: | | | | | | | | | | | | | | | | | | | | |
Expenses(2) | % | | 0.69 | | | 0.70 | | | 0.69 | | | 0.70 | | | 0.72 | | | 0.71 | | |
Net investment income(2) | % | | 1.35 | | | 1.47 | | | 1.61 | | | 0.91 | | | 0.51 | | | 0.54 | | |
Portfolio turnover rate | % | | 41 | | | 94 | | | 16 | | | 251 | | | 304 | | | 185 | | |
| | Class S | |
| | Six Months
Ended
June 30, | | Year Ended December 31, | | July 16,
2001(3) to
December 31, | |
| | 2006 | | 2005 | | 2004 | | 2003 | | 2002 | | 2001 | |
Per Share Operating Performance: | | | | | | | | | | | | | | |
Net asset value, beginning of period | $ | | 13.77 | | | 13.12 | | | 12.03 | | | 9.75 | | | 13.24 | | | 14.58 | | |
Income (loss) from investment operations: | | | | | | | | | | | | | | | | | | | | |
Net investment income | $ | | 0.08 | | | 0.16 | * | | 0.13 | | | 0.04 | | | 0.01 | | | 0.00 | ** | |
Net realized and unrealized gain (loss) on investments | $ | | 0.45 | | | 0.71 | | | 1.05 | | | 2.31 | | | (3.46 | ) | | (1.34 | ) | |
Total from investment operations | $ | | 0.53 | | | 0.87 | | | 1.18 | | | 2.35 | | | (3.45 | ) | | (1.34 | ) | |
Less distributions from: | | | | | | | | | | | | | | | | | | | | |
Net investment income | $ | | 0.20 | | | 0.22 | | | 0.09 | | | 0.07 | | | 0.04 | | | — | | |
Total distributions | $ | | 0.20 | | | 0.22 | | | 0.09 | | | 0.07 | | | 0.04 | | | — | | |
Net asset value, end of period | $ | | 14.10 | | | 13.77 | | | 13.12 | | | 12.03 | | | 9.75 | | | 13.24 | | |
Total Return(1) | % | | 3.84 | | | 6.76 | | | 9.88 | | | 24.21 | | | (26.12 | ) | | (9.19 | ) | |
| | | | | | | | | | | | | | | | | | | | |
Ratios and Supplemental Data: | | | | | | | | | | | | | | | | | | | | |
Net assets, end of period (000’s) | $ | | 28,129 | | | 30,125 | | | 3,505 | | | 2,277 | | | 1,092 | | | 307 | | |
Ratios to average net assets: | | | | | | | | | | | | | | | | | | | | |
Expenses(2) | % | | 0.94 | | | 0.95 | | | 0.94 | | | 0.95 | | | 0.97 | | | 0.96 | | |
Net investment income(2) | % | | 1.10 | | | 1.18 | | | 1.36 | | | 0.64 | | | 0.26 | | | 0.29 | | |
Portfolio turnover rate | % | | 41 | | | 94 | | | 16 | | | 251 | | | 304 | | | 185 | | |
(1) Total return is calculated assuming reinvestment of all dividends and capital gain distributions at net asset value and does not reflect the effect of insurance contract charges. Total return for periods less than one year is not annualized.
(2) Annualized for periods less than one year.
(3) Commencement of operations.
* Per share data calculated using average number of shares outstanding throughout the period.
** Amount is less than $0.005 per share.
See Accompanying Notes to Financial Statements.
20
ING VP INTERMEDIATE BOND PORTFOLIO (UNAUDITED) | FINANCIAL HIGHLIGHTS |
| |
Selected data for a share of beneficial interest outstanding throughout each period.
| | Class I | |
| | Six Months
Ended
June 30, | | Year Ended December 31, | |
| | 2006 | | 2005 | | 2004 | | 2003 | | 2002 | | 2001 | |
Per Share Operating Performance: | | | | | | | | | | | | | | |
Net asset value, beginning of period | $ | | 12.97 | | | 13.14 | | | 14.15 | | | 13.53 | | | 12.95 | | | 12.61 | | |
Income (loss) from investment operations: | | | | | | | | | | | | | | | | | | | | |
Net investment income | $ | | 0.32 | * | | 0.54 | | | 0.53 | | | 0.56 | | | 0.45 | | | 0.59 | | |
Net realized and unrealized gain (loss) on investments | $ | | (0.38 | ) | | (0.13 | ) | | 0.13 | | | 0.29 | | | 0.63 | | | 0.51 | | |
Total from investment operations | $ | | (0.06 | ) | | 0.41 | | | 0.66 | | | 0.85 | | | 1.08 | | | 1.10 | | |
Less distributions from: | | | | | | | | | | | | | | | | | | | | |
Net investment income | $ | | 0.01 | | | 0.51 | | | 1.11 | | | 0.11 | | | 0.43 | | | 0.65 | | |
Net realized gains on investments | $ | | — | | | 0.07 | | | 0.56 | | | 0.12 | | | 0.07 | | | 0.11 | | |
Total distributions | $ | | 0.01 | | | 0.58 | | | 1.67 | | | 0.23 | | | 0.50 | | | 0.76 | | |
Net asset value, end of period | $ | | 12.90 | | | 12.97 | | | 13.14 | | | 14.15 | | | 13.53 | | | 12.95 | | |
Total Return(1) | % | | (0.50 | ) | | 3.14 | | | 4.88 | | | 6.30 | | | 8.33 | | | 8.75 | | |
| | | | | | | | | | | | | | | | | | | | |
Ratios and Supplemental Data: | | | | | | | | | | | | | | | | | | | | |
Net assets, end of period (millions) | $ | | 1,598 | | | 1,148 | | | 1,093 | | | 1,126 | | | 1,206 | | | 1,024 | | |
Ratios to average net assets: | | | | | | | | | | | | | | | | | | | | |
Expenses(2) | % | | 0.50 | | | 0.49 | | | 0.48 | | | 0.50 | | | 0.49 | | | 0.50 | | |
Net investment income(2) | % | | 5.05 | | | 4.14 | | | 3.79 | | | 3.77 | | | 3.50 | | | 5.06 | | |
Portfolio turnover rate | % | | 212 | | | 589 | | | 407 | | | 521 | | | 565 | | | 219 | | |
| | Class S | |
| | Six Months
Ended
June 30, | | Year Ended December 31, | | May 3,
2002(3) to
December 31, | |
| | 2006 | | 2005 | | 2004 | | 2003 | | 2002 | |
Per Share Operating Performance: | | | | | | | | | | | | |
Net asset value, beginning of period | $ | | 12.91 | | | 13.09 | | | 14.13 | | | 13.53 | | | 13.05 | | |
Income (loss) from investment operations: | | | | | | | | | | | | | | | | | |
Net investment income | $ | | 0.30 | * | | 0.41 | | | 0.40 | | | 0.49 | | | 0.16 | | |
Net realized and unrealized gain (loss) on investments | $ | | (0.39 | ) | | (0.03 | ) | | 0.22 | | | 0.32 | | | 0.81 | | |
Total from investment operations | $ | | (0.09 | ) | | 0.38 | | | 0.62 | | | 0.81 | | | 0.97 | | |
Less distributions from: | | | | | | | | | | | | | | | | | |
Net investment income | $ | | 0.00 | ** | | 0.49 | | | 1.10 | | | 0.09 | | | 0.42 | | |
Net realized gains on investments | $ | | — | | | 0.07 | | | 0.56 | | | 0.12 | | | 0.07 | | |
Total distributions | $ | | 0.00 | ** | | 0.56 | | | 1.66 | | | 0.21 | | | 0.49 | | |
Net asset value, end of period | $ | | 12.82 | | | 12.91 | | | 13.09 | | | 14.13 | | | 13.53 | | |
Total Return(1) | % | | (0.66 | ) | | 2.94 | | | 4.58 | | | 6.04 | | | 7.45 | | |
| | | | | | | | | | | | | | | | | |
Ratios and Supplemental Data: | | | | | | | | | | | | | | | | | |
Net assets, end of period (millions) | $ | | 400 | | | 617 | | | 301 | | | 71 | | | 50 | | |
Ratios to average net assets: | | | | | | | | | | | | | | | | | |
Expenses(2) | % | | 0.75 | | | 0.74 | | | 0.73 | | | 0.75 | | | 0.74 | | |
Net investment income(2) | % | | 4.75 | | | 3.94 | | | 3.52 | | | 3.52 | | | 3.25 | | |
Portfolio turnover rate | % | | 212 | | | 589 | | | 407 | | | 521 | | | 565 | | |
(1) Total return is calculated assuming reinvestment of all dividends and capital gain distributions at net asset value and does not reflect the effect of insurance contract charges. Total return for periods less than one year is not annualized.
(2) Annualized for periods less than one year.
(3) Commencement of operations.
* Per share data calculated using average number of shares outstanding throughout the period.
** Amount is less than $0.005.
See Accompanying Notes to Financial Statements.
21
ING VP MONEY MARKET PORTFOLIO (UNAUDITED) | FINANCIAL HIGHLIGHTS |
| |
Selected data for a share of beneficial interest outstanding throughout each period.
| | Class I | |
| | Six Months
Ended
June 30, | | Year Ended December 31, | |
| | 2006 | | 2005 | | 2004 | | 2003 | | 2002 | | 2001 | |
Per Share Operating Performance: | | | | | | | | | | | | | | |
Net asset value, beginning of period | $ | | 13.17 | | | 12.94 | | | 12.94 | | | 13.03 | | | 13.33 | | | 13.61 | | |
Income (loss) from investment operations: | | | | | | | | | | | | | | | | | | | | |
Net investment income | $ | | 0.29 | * | | 0.39 | | | 0.15 | | | 0.08 | | | 0.21 | | | 0.50 | | |
Net realized and unrealized gain (loss) on investments | $ | | 0.00 | ** | | (0.01 | ) | | (0.01 | ) | | 0.03 | | | — | | | 0.01 | | |
Total from investment operations | $ | | 0.29 | | | 0.38 | | | 0.14 | | | 0.11 | | | 0.21 | | | 0.51 | | |
Less distributions from: | | | | | | | | | | | | | | | | | | | | |
Net investment income | $ | | 0.40 | | | 0.15 | | | 0.14 | | | 0.20 | | | 0.51 | | | 0.79 | | |
Total distributions | $ | | 0.40 | | | 0.15 | | | 0.14 | | | 0.20 | | | 0.51 | | | 0.79 | | |
Net asset value, end of period | $ | | 13.06 | | | 13.17 | | | 12.94 | | | 12.94 | | | 13.03 | | | 13.33 | | |
Total Return(1) | % | | 2.24 | | | 2.98 | | | 1.06 | | | 0.92 | | | 1.66 | | | 3.94 | | |
| | | | | | | | | | | | | | | | | | | | |
Ratios and Supplemental Data: | | | | | | | | | | | | | | | | | | | | |
Net assets, end of period (millions) | $ | | 1,179 | | | 1,073 | | | 1,101 | | | 1,238 | | | 1,552 | | | 1,519 | | |
Ratios to average net assets: | | | | | | | | | | | | | | | | | | | | |
Expenses(2) | % | | 0.34 | | | 0.35 | | | 0.34 | | | 0.35 | | | 0.34 | | | 0.34 | | |
Net investment income(2) | % | | 4.46 | | | 2.93 | | | 1.11 | | | 0.91 | | | 1.63 | | | 4.07 | | |
(1) Total return is calculated assuming reinvestment of all dividends and capital gain distributions at net asset value and does not reflect the effect of insurance contract charges.
(2) Annualized for periods less than one year.
* Per share data calculated using average number of shares outstanding throughout the period.
** Amount represents less than $0.005 per share.
See Accompanying Notes to Financial Statements.
22
ING VP GLOBAL SCIENCE AND TECHNOLOGY PORTFOLIO (UNAUDITED) | FINANCIAL HIGHLIGHTS |
| |
Selected data for a share of beneficial interest outstanding throughout each period.
| | Class I | |
| | Six Months
Ended
June 30, | | Year Ended December 31, | |
| | 2006 | | 2005 | | 2004 | | 2003 | | 2002 | | 2001 | |
Per Share Operating Performance: | | | | | | | | | | | | | | |
Net asset value, beginning of period | $ | | 4.27 | | | 3.82 | | | 3.87 | | | 2.66 | | | 4.53 | | | 5.88 | | |
Income (loss) from investment operations: | | | | | | | | | | | | | | | | | | | | |
Net investment loss | $ | | (0.01 | ) | | (0.02 | ) | | (0.03 | ) | | (0.02 | ) | | (0.03 | ) | | (0.02 | ) | |
Net realized and unrealized gain (loss) on investments | $ | | (0.02 | ) | | 0.47 | | | (0.02 | ) | | 1.23 | | | (1.84 | ) | | (1.33 | ) | |
Total from investment operations | $ | | (0.03 | ) | | 0.45 | | | (0.05 | ) | | 1.21 | | | (1.87 | ) | | (1.35 | ) | |
Net asset value, end of period | $ | | 4.24 | | | 4.27 | | | 3.82 | | | 3.87 | | | 2.66 | | | 4.53 | | |
Total Return(1) | % | | (0.70 | ) | | 11.78 | | | (1.29 | ) | | 45.49 | | | (41.28 | ) | | (22.96 | ) | |
| | | | | | | | | | | | | | | | | | | | |
Ratios and Supplemental Data: | | | | | | | | | | | | | | | | | | | | |
Net assets, end of period (000’s) | $ | | 82,192 | | | 84,523 | | | 86,291 | | | 97,742 | | | 45,559 | | | 62,878 | | |
Ratios to average net assets: | | | | | | | | | | | | | | | | | | | | |
Net expenses after expense(2)(3) | | | | | | | | | | | | | | | | | | | | |
reimbursement/recoupment | % | | 1.07 | | | 1.06 | | | 1.05 | | | 1.11 | | | 1.11 | | | 1.11 | | |
Gross expenses prior to expense | | | | | | | | | | | | | | | | | | | | |
reimbursement/recoupment(3) | % | | 1.07 | | | 1.06 | | | 1.05 | | | 1.10 | | | 1.12 | | | 1.11 | | |
Net investment loss after expense | | | | | | | | | | | | | | | | | | | | |
reimbursement/recoupment(2)(3) | % | | (0.28 | ) | | (0.48 | ) | | (0.67 | ) | | (0.88 | ) | | (0.89 | ) | | (0.49 | ) | |
Portfolio turnover rate | % | | 76 | | | 118 | | | 163 | | | 15 | | | 61 | | | 129 | | |
| | Class S | |
| | Six Months
Ended
June 30,
2006 | | July 20,
2005(4) to
December 31,
2005 | |
Per Share Operating Performance: | | | | | | |
Net asset value, beginning of period | $ | | 4.27 | | | 3.90 | | |
Income (loss) from investment operations: | | | | | | | | |
Net investment loss | $ | | (0.01 | ) | | (0.01 | ) | |
Net realized and unrealized gain (loss) on investments | $ | | (0.03 | ) | | 0.38 | | |
Total from investment operations | $ | | (0.04 | ) | | 0.37 | | |
Net asset value, end of period | $ | | 4.23 | | | 4.27 | | |
Total Return(1) | % | | (0.94 | ) | | 9.49 | | |
| | | | | | | | |
Ratios and Supplemental Data: | | | | | | | | |
Net assets, end of period (000’s) | $ | | 450 | | | 78 | | |
Ratios to average net assets: | | | | | | | | |
Net expenses after expense | | | | | | | | |
reimbursement(2)(3) | % | | 1.32 | | | 1.31 | | |
Gross expenses prior to expense | | | | | | | | |
reimbursement(3) | % | | 1.32 | | | 1.31 | | |
Net investment loss after expense | | | | | | | | |
reimbursement(2)(3) | % | | (0.46 | ) | | (0.73 | ) | |
Portfolio turnover rate | % | | 76 | | | 118 | | |
(1) Total return is calculated assuming reinvestment of all dividends and capital gain distributions at net asset value and does not reflect the effect of insurance contract charges. Total return for periods less than one year is not annualized.
(2) The Investment Manager has agreed to limit expenses, (excluding interest, taxes, brokerage and extraordinary expenses) subject to possible recoupment by ING Investments, LLC within three years of being incurred.
(3) Annualized for periods less than one year.
(4) Commencement of operations.
See Accompanying Notes to Financial Statements.
23
ING VP INTERNATIONAL EQUITY PORTFOLIO (UNAUDITED) | FINANCIAL HIGHLIGHTS |
| |
Selected data for a share of beneficial interest outstanding throughout each period.
| | Class I | |
| | Six Months
Ended
June 30, | | Year Ended December 31, | |
| | 2006 | | 2005 | | 2004 | | 2003 | | 2002 | | 2001 | |
Per Share Operating Performance: | | | | | | | | | | | | | | |
Net asset value, beginning of period | $ | | 10.11 | | | 8.74 | | | 7.55 | | | 5.78 | | | 7.90 | | | 10.40 | | |
Income (loss) from investment operations: | | | | | | | | | | | | | | | | | | | | |
Net investment income | $ | | 0.20 | | | 0.14 | | | 0.07 | | | 0.06 | | | 0.03 | | | 0.02 | | |
Net realized and unrealized gain (loss) on investments | $ | | 0.68 | | | 1.32 | | | 1.21 | | | 1.78 | | | (2.13 | ) | | (2.51 | ) | |
Total from investment operations | $ | | 0.88 | | | 1.46 | | | 1.28 | | | 1.84 | | | (2.10 | ) | | (2.49 | ) | |
Less distributions from: | | | | | | | | | | | | | | | | | | | | |
Net investment income | $ | | 0.17 | | | 0.09 | | | 0.09 | | | 0.07 | | | 0.02 | | | 0.01 | | |
Total distributions | $ | | 0.17 | | | 0.09 | | | 0.09 | | | 0.07 | | | 0.02 | | | 0.01 | | |
Net asset value, end of period | $ | | 10.82 | | | 10.11 | | | 8.74 | | | 7.55 | | | 5.78 | | | 7.90 | | |
Total Return(1) | % | | 8.71 | | | 16.87 | | | 17.17 | | | 32.05 | | | (26.68 | ) | | (23.88 | ) | |
| | | | | | | | | | | | | | | | | | | | |
Ratios and Supplemental Data: | | | | | | | | | | | | | | | | | | | | |
Net assets, end of period (000’s) | $ | | 69,859 | | | 61,464 | | | 52,505 | | | 40,537 | | | 28,917 | | | 48,652 | | |
Ratios to average net assets: | | | | | | | | | | | | | | | | | | | | |
Net expenses after expense | | | | | | | | | | | | | | | | | | | | |
reimbursement/recoupment(2)(3) | % | | 0.95 | | | 1.14 | | | 1.15 | | | 1.15 | | | 1.15 | | | 1.15 | | |
Gross expenses prior to expense reimbursement/recoupment(3) | % | | 0.95 | | | 1.00 | | | 0.95 | | | 1.38 | | | 1.46 | | | 1.26 | | |
Net investment income after expense | | | | | | | | | | | | | | | | | | | | |
reimbursement/recoupment(2)(3) | % | | 3.80 | | | 1.51 | | | 1.00 | | | 1.04 | | | 0.40 | | | 0.23 | | |
Portfolio turnover rates | % | | 32 | | | 97 | | | 137 | | | 85 | | | 266 | | | 229 | | |
| | Class S | |
| | Six Months
Ended
June 30, | | Year Ended December 31, | | November 1,
2001(4) to
December 31, | |
| | 2006 | | 2005 | | 2004 | | 2003 | | 2002 | | 2001 | |
Per Share Operating Performance: | | | | | | | | | | | | | | |
Net asset value, beginning of period | $ | | 10.05 | | | 8.70 | | | 7.53 | | | 5.78 | | | 7.90 | | | 7.38 | | |
Income (loss) from investment operations: | | | | | | | | | | | | | | | | | | | | |
Net investment income (loss) | $ | | 0.17 | | | 0.09 | | | 0.05 | | | (0.01 | ) | | 0.01 | | | — | | |
Net realized and unrealized gain (loss) on investments | $ | | 0.69 | | | 1.33 | | | 1.21 | | | 1.82 | | | (2.13 | ) | | 0.52 | | |
Total from investment operations | $ | | 0.86 | | | 1.42 | | | 1.26 | | | 1.81 | | | (2.12 | ) | | 0.52 | | |
Less distributions from: | | | | | | | | | | | | | | | | | | | | |
Net investment income | $ | | 0.16 | | | 0.07 | | | 0.09 | | | 0.06 | | | — | | | — | | |
Total distributions | $ | | 0.16 | | | 0.07 | | | 0.09 | | | 0.06 | | | — | | | — | | |
Net asset value, end of period | $ | | 10.75 | | | 10.05 | | | 8.70 | | | 7.53 | | | 5.78 | | | 7.90 | | |
Total Return(1) | % | | 8.51 | | | 16.53 | | | 16.87 | | | 31.62 | | | (26.84 | ) | | 7.05 | | |
| | | | | | | | | | | | | | | | | | | | |
Ratios and Supplemental Data: | | | | | | | | | | | | | | | | | | | | |
Net assets, end of period (000’s) | $ | | 696 | | | 353 | | | 265 | | | 197 | | | 8 | | | 11 | | |
Ratios to average net assets: | | | | | | | | | | | | | | | | | | | | |
Net expenses after expense | | | | | | | | | | | | | | | | | | | | |
reimbursement/recoupment(2)(3) | % | | 1.20 | | | 1.39 | | | 1.40 | | | 1.40 | | | 1.40 | | | 1.39 | | |
Gross expenses prior to expense | | | | | | | | | | | | | | | | | | | | |
reimbursement/recoupment(3) | % | | 1.20 | | | 1.25 | | | 1.20 | | | 1.63 | | | 1.71 | | | 1.49 | | |
Net investment income after expense | | | | | | | | | | | | | | | | | | | | |
reimbursement/recoupment(2)(3) | % | | 3.13 | | | 1.16 | | | 0.68 | | | 0.79 | | | 0.15 | | | 0.01 | | |
Portfolio turnover rate | % | | 32 | | | 97 | | | 137 | | | 85 | | | 266 | | | 229 | | |
(1) Total return is calculated assuming reinvestment of all dividends and capital gain distributions at net asset value and does not reflect the effect of insurance contract charges. Total return for periods less than one year is not annualized.
(2) The Investment Manager has agreed to limit expenses, (excluding interest, taxes, brokerage and extraordinary expenses) subject to possible recoupment by ING Investments, LLC within three years of being incurred.
(3) Annualized for periods less than one year.
(4) Commencement of operations.
See Accompanying Notes to Financial Statements.
24
NOTES TO FINANCIAL STATEMENTS AS OF JUNE 30, 2006 (UNAUDITED) |
|
NOTE 1 — ORGANIZATION
Organization. The ING Variable Product Funds are comprised of ING VP Balanced Portfolio, Inc., ING Variable Funds, ING Variable Portfolios, Inc., ING VP Intermediate Bond Portfolio and ING VP Money Market Portfolio, all of which are open-end investment management companies registered under the Investment Company Act of 1940, as amended.
ING VP Balanced Portfolio, Inc. is a company incorporated under the laws of Maryland on December 14, 1988 with one portfolio, ING VP Balanced Portfolio (“Balanced”). ING Variable Funds is a business trust formed under the laws of Massachusetts on January 25, 1984 with one portfolio, ING VP Growth and Income Portfolio (“Growth and Income”). ING Variable Portfolios, Inc. is a company incorporated under the laws of Maryland on June 4, 1996 and has eight separate portfolios. The five portfolios that are in this report are: ING VP Growth Portfolio (“Growth”), ING VP Small Company Portfolio (“Small Company”), ING VP Value Opportunity Portfolio (“Value Opportunity”), ING VP Global Science and Technology Portfolio (“Global Science and Technology”) and ING VP International Equity Portfolio (“International Equity”). ING VP Intermediate Bond Portfolio is a business trust formed under the laws of Massachusetts on January 25, 1984 with one portfolio, ING VP Intermediate Bond Portfolio (“Intermediate Bond”). ING VP Money Market Portfolio is a business trust under the laws of Massachusetts on January 25, 1984 with one portfolio, ING VP Money Market Portfolio (“Money Market”). Each of the portfolios is a “Portfolio” and collectively, they are the “Portfolios”.
The following is a brief description of each Portfolio’s investment objective:
• Balanced seeks to maximize investment return consistent with reasonable safety of principal, by investing in a diversified portfolio of one or more of the following asset classes: stocks, bonds, and cash equivalents;
• Growth and Income seeks to maximize total return through investments in a diversified portfolio of common stocks and securities convertible into common stock;
• Growth seeks growth of capital through investment in a diversified portfolio consisting primarily of common stocks and securities convertible into common stock;
• Small Company seeks growth of capital primarily through investment in a diversified portfolio of common stocks and securities of companies with smaller market capitalizations;
• Value Opportunity seeks growth of capital primarily through investment in a diversified portfolio of common stocks;
• Intermediate Bond seeks to maximize total return consistent with reasonable risk by investing in a diversified portfolio consisting primarily of debt securities;
• Money Market seeks to provide high current return, consistent with preservation of capital and liquidity, through investment in high-quality money market instruments;
• Global Science and Technology seeks long-term capital appreciation; and
• International Equity seeks long-term capital growth primarily through investment in a diversified portfolio of common stocks principally traded in countries outside of the United States.
Each Portfolio offers Class I and Class S shares. The two classes differ principally in applicable distribution and service fees. Shareholders of each class also bear certain expenses that pertain to that particular class. All shareholders bear the common expenses of the Portfolios and earn income and realized gains/losses from the Portfolio pro rata based on the average daily net assets of each class, without discrimination between share classes. Differences in per share dividend rates generally result from differences in separate class expenses, including distribution, and shareholder servicing fees.
Shares of the Portfolios may be offered to segregated asset accounts of insurance companies as investment options under variable annuity contracts and variable life insurance policies. Shares may also be offered to qualified pension and retirement plans outside the variable contract and to certain investment advisers and their affiliates. Class I shares may be made available to other investment companies, including series of the Trust under fund-of-funds arrangements.
Participating insurance companies and other designated organizations are authorized to receive purchase orders on the Portfolio’s behalf.
ING Investments, LLC (“ING Investments’’ or the “Investment Manager”), an Arizona limited liability company, serves as the Investment Manager to the Portfolios. ING Investments has engaged ING Investment Management Co. (“ING IM’’), a Connecticut corporation, to serve as the Sub-Adviser to each Portfolio, with the exception of Global Science and Technology. ING Funds Distributor, LLC (“Distributor”) is the principal underwriter of the Portfolios. ING Investments, ING IM and the Distributor are indirect, wholly-owned
25
NOTES TO FINANCIAL STATEMENTS AS OF JUNE 30, 2006 (UNAUDITED) (CONTINUED) |
|
NOTE 1 — ORGANIZATION (continued)
subsidiaries of ING Groep N.V. (“ING Groep”). ING Groep is one of the largest financial services organizations in the world, and offers an array of banking, insurance and asset management services to both individuals and institutional investors.
NOTE 2 — SIGNIFICANT ACCOUNTING POLICIES
The following significant accounting policies are consistently followed by the Portfolios in the preparation of their financial statements. Such policies are in conformity with U.S. generally accepted accounting principles for investment companies.
A. Security Valuation. Investments in equity securities traded on a national securities exchange are valued at the last reported sale price. Securities reported by NASDAQ are valued at the NASDAQ official closing prices. Securities traded on an exchange or NASDAQ for which there has been no sale and securities traded in the over-the-counter-market are valued at the mean between the last reported bid and ask prices. All investments quoted in foreign currencies will be valued daily in U.S. dollars on the basis of the foreign currency exchange rates prevailing at that time. Debt securities are valued at prices obtained from independent services or from one or more dealers making markets in the securities and may be adjusted based on the Portfolios’ valuation procedures. U.S. government obligations are valued by using market quotations or independent pricing services that use prices provided by market-makers or estimates of market values obtained from yield data relating to instruments or securities with similar characteristics.
Securities and assets for which market quotations are not readily available (which may include certain restricted securities, which are subject to limitations as to their sale) are valued at their fair values as determined in good faith by or under the supervision of the Portfolios’ Board of Directors/Trustees (“Board”), in accordance with methods that are specifically authorized by the Board. Securities traded on exchanges, including foreign exchanges, which close earlier than the time that a Portfolio calculates its net asset value (“NAV”) may also be valued at their fair values as determined in good faith by or under the supervision of a Portfolio’s Board, in accordance with methods that are specifically authorized by the Board. The value of a foreign security traded on an exchange outside the United States is generally based on its price on the principal foreign exchange where it trades as of the time the Portfolio determines its NAV or if the foreign exchange closes prior to the time the Portfolio determines its NAV, the most recent closing price of the foreign security on its principal exchange. Trading in certain non-U.S. securities may not take place on all days on which the New York Stock Exchange (“NYSE”) is open. Further, trading takes place in various foreign markets on days on which the NYSE is not open. Consequently, the calculation of the Portfolio’s NAV may not take place contemporaneously with the determination of the prices of securities held by the Portfolio in foreign securities markets. Further, the value of the Portfolio’s assets may be significantly affected by foreign trading on days when a shareholder cannot purchase or redeem shares of the Portfolio. In calculating the Portfolio’s NAV, foreign securities denominated in foreign currency are converted to U.S. dollar equivalents. If an event occurs after the time at which the market for foreign securities held by the Portfolio closes but before the time that a Portfolio’s NAV is calculated, such event may cause the closing price on the foreign exchange to not represent a readily available reliable market value quotation for such securities at the time a Portfolio determines its NAV. In such a case, the Portfolio will use the fair value of such securities as determined under a Portfolio’s valuation procedures. Events after the close of trading on a foreign market that could require the Portfolio to fair value some or all of its foreign securities include, among others, securities trading in the U.S. and other markets, corporate announcements, natural and other disasters, and political and other events. Among other elements of analysis in the determination of a security’s fair value, the Board has authorized the use of one or more independent research services to assist with such determinations. An independent research service may use statistical analyses and quantitative models to help determine fair value as of the time a Portfolio calculates its NAV. There can be no assurance that such models accurately reflect the behavior of the applicable markets or the effect of the behavior of such markets on the fair value of securities, or that such markets will continue to behave in a fashion that is consistent with such models. Unlike the closing price of a security on an exchange, fair value determinations employ elements of judgment. Consequently, the fair value assigned to a security may not represent the actual value that a Portfolio could obtain if it were to sell the security at the time of the close of
26
NOTES TO FINANCIAL STATEMENTS AS OF JUNE 30, 2006 (UNAUDITED) (CONTINUED) |
|
NOTE 2 — SIGNIFICANT ACCOUNTING POLICIES (continued)
the NYSE. Pursuant to procedures adopted by the Board, the Portfolio is not obligated to use the fair valuations suggested by any research service, and valuation recommendations provided by such research services may be overridden if other events have occurred or if other fair valuations are determined in good faith to be more accurate. Unless an event is such that it causes a Portfolio to determine that the closing prices for one or more securities do not represent readily available reliable market value quotations at the time the Portfolio determines its NAV, events that occur between the time of the close of the foreign market on which they are traded and the close of regular trading on the NYSE will not be reflected in the Portfolio’s NAV. Investments in securities maturing in 60 days or less at the date of valuation are valued at amortized cost, which, when combined with accrued interest, approximates market value.
Money Market uses the amortized cost method to value its portfolio securities and seeks to maintain a constant NAV of $1.00 per share, although there may be circumstances under which this goal cannot be achieved. The amortized cost method involves valuing a security at its cost and amortizing any discount or premium over the period until maturity, regardless of the impact of fluctuating interest rates or the market value of the security. Although the Board has established procedures designed to stabilize, to the extent reasonably possible, the share price of the Money Market, there can be no assurance that the Money Market’s NAV can be maintained at $1.00 per share.
B. Security Transactions and Revenue Recognition. Securities transactions are accounted for on the trade date. Realized gains and losses are reported on the basis of identified cost of securities sold. Interest income is recorded on an accrual basis. Dividend income is recorded on the ex-dividend date, or for certain foreign securities, when the information becomes available to the Portfolios. Premium amortization and discount accretion are determined by the effective yield method.
C. Foreign Currency Translation. The books and records of the Portfolios are maintained in U.S. dollars. Any foreign currency amounts are translated into U.S. dollars on the following basis:
(1) Market value of investment securities, other assets and liabilities — at the exchange rates prevailing at the end of the day.
(2) Purchases and sales of investment securities, income and expenses — at the rates of exchange prevailing on the respective dates of such transactions.
Although the net assets and the market values are presented at the foreign exchange rates at the end of the day, the Portfolios do not isolate the portion of the results of operations resulting from changes in foreign exchange rates on investments from the fluctuations arising from changes in market prices of securities held. Such fluctuations are included with the net realized and unrealized gains or losses from investments. For securities, which are subject to foreign withholding tax upon disposition, liabilities are recorded on the Statements of Assets and Liabilities for the estimated tax withholding based on the securities’ current market value. Upon disposition, realized gains or losses on such securities are recorded net of foreign withholding tax.
Reported net realized foreign exchange gains or losses arise from sales of foreign currencies, currency gains or losses realized between the trade and settlement dates on securities transactions, the difference between the amounts of dividends, interest, and foreign withholding taxes recorded on a Portfolio’s books, and the U.S. dollar equivalent of the amounts actually received or paid. Net unrealized foreign exchange gains and losses arise from changes in the value of assets and liabilities other than investments in securities at fiscal year end, resulting from changes in the exchange rate. Foreign security and currency transactions may involve certain considerations and risks not typically associated with investing in U.S. companies and U.S. government securities. These risks include, but are not limited to, revaluation of currencies and future adverse political and economic developments, which could cause securities and their markets to be less liquid and prices more volatile than those of comparable U.S. companies and U.S. government securities.
D. Foreign Currency Transactions and Futures Contracts. Certain Portfolios may enter into foreign currency exchange transactions to convert to and from different foreign currencies and to and from the U.S. dollar in connection with the planned purchases or sales of securities. When entering into a currency forward contract, a Portfolio agrees to receive or deliver a fixed quantity of foreign currency for an agreed-upon price on an agreed future date. The Portfolios either enter into these transactions on a spot basis at the spot rate prevailing in the foreign currency exchange market or use forward foreign currency
27
NOTES TO FINANCIAL STATEMENTS AS OF JUNE 30, 2006 (UNAUDITED) (CONTINUED) |
|
NOTE 2 — SIGNIFICANT ACCOUNTING POLICIES (continued)
contracts to purchase or sell foreign currencies. When the contract is fulfilled or closed, gains or losses are realized. Until then, the gain or loss is included in unrealized appreciation or depreciation. Risks may arise upon entering into forward contracts from the potential inability of counterparties to meet the terms of their forward contracts and from unanticipated movements in the value of foreign currencies relative to the U.S. dollar.
Each Portfolio, with the exception of Money Market, may enter into futures contracts involving foreign currency, interest rates, securities and securities indices. A futures contract obligates the seller of the contract to deliver and the purchaser of the contract to take delivery of the type of foreign currency, financial instrument or security called for in the contract at a specified future time for a specified price. Upon entering into such a contract, a Portfolio is required to deposit and maintain as collateral such initial margin as required by the exchange on which the contract is traded. Pursuant to the contract, a Portfolio agrees to receive from or pay to the broker an amount equal to the daily fluctuations in the value of the contract. Such receipts or payments are known as variation margins and are recorded as unrealized gains or losses by the Portfolio. When the contract is closed, the Portfolio records a realized gain or loss equal to the difference between the value of the contract at the time it was opened and the value at the time it was closed.
E. Distributions to Shareholders. The Portfolios record distributions to their shareholders on the ex-dividend date. Balanced, Growth, Small Company, Value Opportunity, Money Market and Global Science and Technology Portfolios declare and pay dividends annually. Growth and Income and Intermediate Bond Portfolios declare and pay dividends semi-annually. The Portfolios may make distributions on a more frequent basis to comply with the distribution requirements of the Internal Revenue Code. The characteristics of income and gains to be distributed are determined in accordance with income tax regulations, which may differ from U.S. generally accepted accounting principles for investment companies.
F. Federal Income Taxes. It is the policy of the Portfolios to comply with subchapter M of the Internal Revenue Code and related excise tax provisions applicable to requlated investment companies and to distribute substantially all of their net investment income and any net realized capital gains to their shareholders. Therefore, no federal income tax provision is required. No capital gain distributions shall be made until any capital loss carryforwards have been fully utilized or expired.
G. Use of Estimates. Management of the Portfolios has made certain estimates and assumptions relating to the reporting of assets, liabilities, income, and expenses to prepare these financial statements in conformity with U.S. generally accepted accounting principles for investment companies. Actual results could differ from these estimates.
H. Repurchase Agreements. Each Portfolio may invest in repurchase agreements only with government securities dealers recognized by the Board of Governors of the Federal Reserve System. Under such agreements, the seller of the security agrees to repurchase it at a mutually agreed upon time and price. The resale price is in excess of the purchase price and reflects an agreed upon interest rate for the period of time the agreement is outstanding. The period of the repurchase agreements is usually short, from overnight to one week, while the underlying securities generally have longer maturities. Each Portfolio will receive as collateral securities acceptable to it whose market value is equal to at least 100% of the carrying amount of the repurchase agreements, plus accrued interest, being invested by the Portfolio. The underlying collateral is valued daily on a mark-to-market basis to assure that the value, including accrued interest is at least equal to the repurchase price. There would be potential loss to the Portfolio in the event the Portfolio is delayed or prevented from exercising its right to dispose of the collateral, and it might incur disposition costs in liquidating the collateral.
I. Securities Lending. Each Portfolio has the option to temporarily loan up to 30% of its total assets to brokers, dealers or other financial institutions in exchange for a negotiated lender’s fee. The borrower is required to fully collateralize the loans with cash or U.S. government securities. Generally, in the event of counterparty default, a Portfolio has the right to use collateral to offset losses incurred. There would be potential loss to the Portfolio in the event the Portfolio is delayed or prevented from exercising its right to dispose of the collateral. A Portfolio bears the risk of loss with respect to the investment of collateral. Engaging in securities lending could have a leveraging effect, which may intensify the credit, market and other risks associated with investing in a Portfolio.
28
NOTES TO FINANCIAL STATEMENTS AS OF JUNE 30, 2006 (UNAUDITED) (CONTINUED) |
|
NOTE 2 — SIGNIFICANT ACCOUNTING POLICIES (continued)
J. Illiquid and Restricted Securities. The Portfolios may not invest more than 15% (10% for Money Market) of their net assets in illiquid securities. Illiquid securities are not readily marketable. Disposing of illiquid investments may involve time-consuming negotiation and legal expenses, and it may be difficult or impossible for the Portfolios to sell them promptly at an acceptable price. The Portfolios may also invest in restricted securities, which include those sold under Rule 144A of the Securities Act of 1933 (“1933 Act”) or securities offered pursuant to Section 4(2) of the 1933 Act, and/or are subject to legal or contractual restrictions on resale and may not be publicly sold without registration under the 1933 Act. Certain restricted securities may be considered liquid pursuant to guidelines approved by the Board or may be deemed to be illiquid because they may not be readily marketable. Illiquid and restricted securities are valued using market quotations when readily available. In the absence of market quotations, the securities are valued based upon their fair value determined under procedures approved by the Board.
K. Delayed Delivery Transactions. Each Portfolio may purchase or sell securities on a when-issued or forward commitment basis. The price of the underlying securities and date when the securities will be delivered and paid for are fixed at the time the transaction is negotiated. The market value of such is identified in the Portfolios’ Portfolio of Investments. Losses may arise due to changes in the market value of the securities or from the inability of counterparties to meet the terms of the contract. In connection with such purchases, the Portfolios are required to hold liquid assets as collateral with the Portfolios’ custodian sufficient to cover the purchase price.
L. Mortgage Dollar Roll Transactions. Balanced, Growth and Income, and Money Market Portfolios may engage in dollar roll transactions with respect to mortgage-backed securities issued by Government National Mortgage Association, Federal National Mortgage Association and Federal Home Loan Mortgage Corp. In a dollar roll transaction, a Portfolio sells a mortgage-backed security to a financial institution, such as a bank or broker/dealer, and simultaneously agrees to repurchase a substantially similar (i.e., same type, coupon, and maturity) security from the institution on a delayed delivery basis at an agreed upon price. The mortgage-backed securities that are repurchased will bear the same interest rate as those sold, but generally will be collateralized by different pools of mortgages with different prepayment histories. The Portfolios account for dollar roll transactions as purchases and sales.
M. Options Contracts. Each Portfolio, with the exception of Money Market, may purchase put and call options and may write (sell) put options and covered call options. The Portfolios may engage in option transactions as a hedge against adverse movements in the value of portfolio holdings or to increase market exposure. Option contracts are valued daily and unrealized gains or losses are recorded based upon the last sales price on the principal exchange on which the options are traded. The Portfolios will realize a gain or loss upon the expiration or closing of the option contract. When an option is exercised, the proceeds on sales of the underlying security for a written call option, the purchase cost of the security for a written put option, or the cost of the security for a purchased put or call option is adjusted by the amount of premium received or paid. Realized and unrealized gains or losses on option contracts are reflected in the accompanying financial statements. The risk in writing a call option is that the Portfolios give up the opportunity for profit if the market price of the security increases and the option is exercised. The risk in writing a put option is that the Portfolios may incur a loss if the market price of the security decreases and the option is exercised. The risk in buying an option is that the Portfolios pay a premium whether or not the option is exercised. Risks may also arise from an illiquid secondary market or from the inability of counterparties to meet the terms of the contract.
N. Swap Contracts. Each Portfolio, with the exception of Money Market, may enter into interest rate swaps, currency swaps and other types of swap agreements, including swaps on securities and indices. A swap is an agreement between two parties pursuant to which each party agrees to make one or more payments to the other on regularly scheduled dates over a stated term, based on different interest rates, currency exchange rates, security prices, the prices or rates of other types of financial instruments or assets or the levels of specified indices. During the term of the swap, changes in the value of the swap are recognized as unrealized appreciation or depreciation.
29
NOTES TO FINANCIAL STATEMENTS AS OF JUNE 30, 2006 (UNAUDITED) (CONTINUED) |
|
NOTE 3 — INVESTMENT TRANSACTIONS
For the six months ended June 30, 2006, the cost of purchases and proceeds from the sales of securities, excluding short-term securities, were as follows:
| | Purchases | | Sales | |
Balanced | | $ | 1,039,505,133 | | $ | 1,064,943,366 | |
Growth and Income | | 1,411,886,715 | | 1,642,970,976 | |
Growth | | 173,884,927 | | 147,353,474 | |
Small Company | | 178,360,949 | | 201,870,171 | |
Value Opportunity | | 82,342,012 | | 102,350,333 | |
Intermediate Bond | | 940,111,825 | | 570,555,594 | |
Global Science and Technology | | 65,567,133 | | 65,348,124 | |
International Equity | | 27,096,779 | | 22,078,235 | |
| | | | | | | |
U.S. Government securities not included above were as follows:
| | Purchases | | Sales | |
Balanced | | $ | 476,715,796 | | $ | 548,053,793 | |
Intermediate Bond | | 3,577,799,922 | | 3,624,165,494 | |
| | | | | | | |
NOTE 4 — INVESTMENT MANAGEMENT AND ADMINISTRATIVE FEES
The Portfolios entered into Investment Management Agreements with the Investment Manager. The Investment Management Agreements compensate the Investment Manager with a fee, computed daily and payable monthly, based on the average daily net assets of each Portfolio, at the following annual rates:
Balanced | | 0.500 | % | | |
Growth and Income | | 0.500 | % | on first $10 billion; | |
| | 0.450 | % | on next $5 billion; | |
| | 0.425 | % | over $15 billion | |
Growth | | 0.600 | % | | |
Small Company | | 0.750 | % | | |
Value Opportunity | | 0.600 | % | | |
Intermediate Bond | | 0.400 | % | | |
Money Market | | 0.250 | % | | |
Global Science and Technology | | 0.950 | % | | |
International Equity | | 0.850 | % | | |
The Investment Manager entered into Sub-Advisory Agreements with ING IM. ING IM acts as Sub-Adviser to all Portfolios except for Global Science and Technology. Subject to such policies as the Board or the Investment Manager may determine, ING IM manages the Portfolios’ assets in accordance with the Portfolios’ investment objectives, policies, and limitations.
BlackRock Advisors, Inc., (“BlackRock”), a Delaware Corporation, serves as Sub-Adviser to Global Science and Technology pursuant to a Sub-Advisory Agreement effective April 1, 2004 between the Investment Manager and BlackRock.
Pursuant to Administration Agreements, ING Funds Services, LLC (“IFS”), an indirect, wholly-owned subsidiary of ING Groep, acts as administrator and provides certain administrative and shareholder services necessary for Portfolio operations and is responsible for the supervision of other service providers.
IFS is entitled to receive from each Portfolio a fee at an annual rate of 0.055% on the first $5 billion of daily net assets and 0.03% thereafter.
NOTE 5 — DISTRIBUTION AND SERVICE FEES
Class S shares of the Portfolios have adopted Distribution Plans pursuant to Rule 12b-1 under the 1940 Act (the “12b-1 Plans”), whereby the Distributor is reimbursed or compensated by the Portfolios for expenses incurred in the distribution of each Portfolio’s shares (“Distribution Fees”). Pursuant to the 12b-1 Plans, the Distributor is entitled to a payment each month to reimburse or compensate for expenses incurred in the distribution and promotion of each Portfolio’s shares, including expenses incurred in printing prospectuses and reports used for sales purposes, expenses incurred in preparing and printing sales literature and other such distribution related expenses, including any distribution or shareholder servicing fees (“Service Fees”) paid to securities dealers who have executed a distribution agreement with the Distributor. Under the 12b-1 Plans, Class S shares of the Portfolios pay the Distributor a fee calculated at an annual rate of 0.25% of average daily net assets.
NOTE 6 — OTHER TRANSACTIONS WITH AFFILIATED AND RELATED PARTIES
At June 30, 2006, the Portfolios had the following amounts recorded in payable to affiliates on the accompanying Statements of Assets and Liabilities (see Notes 4 and 5):
| | Accrued
Investment
Management
Fees | | Accrued
Administrative
Fees | | Accrued
Shareholder
Services and
Distribution
Fees | | Total | |
Balanced | | $ | 511,968 | | | $ | 56,315 | | | $ | 2,201 | | | $ | 570,484 | | |
Growth and Income | | 1,225,038 | | | 134,750 | | | 659 | | | 1,360,447 | | |
Growth | | 95,338 | | | 8,739 | | | 55 | | | 104,132 | | |
Small Company | | 295,167 | | | 21,645 | | | 337 | | | 317,149 | | |
Value Opportunity | | 95,554 | | | 14,456 | | | — | | | 110,010 | | |
Intermediate Bond | | 649,777 | | | 89,341 | | | 79,870 | | | 818,988 | | |
Money Market | | 237,783 | | | 52,311 | | | — | | | 290,094 | | |
Global Science and Technology | | 63,948 | | | 3,702 | | | 91 | | | 67,741 | | |
International Equity | | 48,478 | | | 3,137 | | | 145 | | | 51,760 | | |
The Portfolios have adopted a Deferred Compensation Plan (the “Plan”), which allows eligible non-affiliated directors as described in the Plan to defer the receipt of all or a portion of the directors’ fees payable. Deferred fees are invested in various funds advised by ING Investments, LLC until distribution in accordance with the Plan.
30
NOTES TO FINANCIAL STATEMENTS AS OF JUNE 30, 2006 (UNAUDITED) (CONTINUED) |
|
NOTE 6 — OTHER TRANSACTIONS WITH AFFILIATED AND RELATED PARTIES (continued)
At June 30, 2006, the following indirect, wholly owned subsidiaries of ING Groep owned the following Portfolios:
ING Life Insurance and Annuity Company — Balanced (92.75%); Growth and Income (96.71%); Growth (78.08%); Small Company (81.35%); Value Opportunity (82.65%); Intermediate Bond (55.22%); Money Market (98.02%); Global Science and Technology (97.30%); and International Equity (99.00%);
ING USA Annuity and Life Insurance Company — Value Opportunity (13.68%); and Intermediate Bond (20.03%);
ING Lifestyle Aggressive Growth Portfolio — Small Company (5.65%);
ING Lifestyle Growth Portfolio — Small Company (12.23%); Intermediate Bond (5.82%);
ING Lifestyle Moderate Growth Portfolio — Intermediate Bond (9.66%);
ING Lifestyle Moderate Portfolio — Intermediate Bond (5.62%);
ING National Trust — Growth (21.78%).
NOTE 7 — EXPENSE LIMITATIONS
ING Investments entered into written Expense Limitation Agreements with each of the following Portfolios whereby the Investment Manager has agreed to limit expenses, excluding interest, taxes, brokerage and extraordinary expenses to the levels listed below:
| | Class I | | Class S | |
Growth | | 0.80 | % | | 1.05 | % | |
Small Company | | 0.95 | % | | 1.20 | % | |
Value Opportunity | | 0.80 | % | | 1.05 | % | |
Global Science and Technology | | 1.15 | % | | 1.40 | % | |
International Equity | | 1.15 | % | | 1.40 | % | |
The Investment Manager may at a later date recoup from a Portfolio management fees waived and other expenses assured by the Investment Manager during the previous 36 months, but only if, after such recoupment, the Portfolio’s expense ratio does not exceed the percentage described above. Waived and reimbursed fees net of any recoupment by the Investment Manager of such waived and reimbursed fees are reflected on the accompanying Statements of Operations. Amounts payable by the Investment Manager are reflected on the accompanying Statements of Assets and Liabilities for each Portfolio.
As of June 30, 2006, the Portfolios have no reimbursed fees that are subject to possible recoupment by the Investment Manager.
The Expense Limitation Agreements are contractual and shall renew automatically for one-year terms unless ING Investments provides written notice of the termination of an Expense Limitation Agreement within 90 days of the end of the then current term.
NOTE 8 — LINE OF CREDIT
The Portfolios, in addition to certain other funds managed by the Investment Manager, have entered into an unsecured committed revolving line of credit agreement (the “Credit Agreement “) with a syndicate of banks led by Citibank, N.A. for an aggregate amount of $100,000,000. The proceeds may be used only to: (1) temporarily finance the purchase and sale of securities; (2) finance the redemption of shares of an investor in the funds; and (3) enable the funds to meet other emergency expenses as defined in the Credit Agreement. The funds to which the line of credit is available pay a commitment fee equal to 0.09% per annum on the daily unused portion of the committed line amount. Each of the Portfolios will pay its pro rata share of both the agent and commitment fee. Generally, borrowings under the Credit Agreement accrue interest at the Federal Funds Rate plus a specified margin. Repayments generally must be made within 30 days after the date of a revolving credit advance. The following Portfolios utilized the line of credit during the six months ended June 30, 2006:
Fund | | Days
Utilized | | Approximate
Average Daily
Balance | | Approximate
Weighted
Average
Interest Rate | |
Value Opportunity | | 4 | | | $1,870,000 | | | 4.73 | % | |
Intermediate Bond | | 1 | | | 4,020,000 | | | 5.01 | | |
Global Science and Technology | | 2 | | | 775,000 | | | 5.01 | | |
31
NOTES TO FINANCIAL STATEMENTS AS OF JUNE 30, 2006 (UNAUDITED) (CONTINUED) |
|
NOTE 9 — CAPITAL SHARES
Transactions in capital shares and dollars were as follows:
| | Class I | | Class S | |
| | Six Months
Ended
June 30,
2006 | | Year
Ended
December 31,
2005 | | Six Months
Ended
June 30,
2006 | | Year
Ended
December 31,
2005 | |
Balanced (Number of Shares) | | | | | | | | | |
Shares sold | | 4,558,352 | | 936,888 | | 48,436 | | 59,464 | |
Shares issued in a merger | | 974,709 | | — | | 599,724 | | — | |
Dividends reinvested | | 2,095,112 | | 2,304,743 | | 5,132 | | 4,914 | |
Shares redeemed | | (6,589,068 | ) | (13,966,864 | ) | (100,382 | ) | (64,454 | ) |
Net increase (decrease) in shares outstanding | | 1,039,105 | | (10,725,233 | ) | 552,910 | | (76 | ) |
| | | | | | | | | |
Balanced ($) | | | | | | | | | |
Shares sold | | $ | 63,020,718 | | $ | 12,534,653 | | $ | 666,997 | | $ | 795,346 | |
Shares issued in a merger | | 13,476,644 | | — | | 8,269,170 | | — | |
Dividends reinvested | | 28,870,646 | | 30,561,067 | | 70,509 | | 64,964 | |
Shares redeemed | | (90,863,356 | ) | (187,304,754 | ) | (1,363,643 | ) | (859,666 | ) |
Net increase (decrease) | | $ | 14,504,652 | | $ | (144,209,034 | ) | $ | 7,643,033 | | $ | (644 | ) |
| | | | | | | | | |
| | Class I | | Class S | |
| | Six Months
Ended
June 30,
2006 | | Year
Ended
December 31,
2005 | | Six Months
Ended
June 30,
2006 | | Year
Ended
December 31,
2005 | |
Growth and Income (Number of Shares) | | | | | | | | | |
Shares sold | | 100,560 | | 138,694 | | 59,320 | | 50,301 | |
Dividends reinvested | | 18,039 | | 1,566,557 | | 5 | | 1,077 | |
Shares redeemed | | (10,439,710 | ) | (32,345,085 | ) | (18,267 | ) | (25,742 | ) |
Net increase (decrease) in shares outstanding | | (10,321,111 | ) | (30,639,834 | ) | 41,058 | | 25,636 | |
| | | | | | | | | |
Growth and Income ($) | | | | | | | | | |
Shares sold | | $ | 2,178,143 | | $ | 2,773,031 | | $ | 1,265,749 | | $ | 1,006,318 | |
Dividends reinvested | | 394,643 | | 32,929,030 | | 104 | | 22,610 | |
Shares redeemed | | (224,132,725 | ) | (634,438,393 | ) | (392,083 | ) | (513,138 | ) |
Net increase (decrease) | | $ | (221,559,939 | ) | $ | (598,736,332 | ) | $ | 873,770 | | $ | 515,790 | |
| | | | | | | | | |
| | Class I | | Class S | |
| | Six Months
Ended
June 30,
2006 | | Year
Ended
December 31,
2005 | | Six Months
Ended
June 30,
2006 | | Year
Ended
December 31,
2005 | |
Growth (Number of Shares) | | | | | | | | | |
Shares sold | | 4,645,523 | | 489,244 | | 2,575 | | 3,047 | |
Dividends reinvested | | 10,584 | | 133,505 | | — | | 158 | |
Shares redeemed | | (2,088,483 | ) | (3,948,289 | ) | (3,219 | ) | (13,059 | ) |
Net increase (decrease) in shares outstanding | | 2,567,624 | | (3,325,540 | ) | (644 | ) | (9,854 | ) |
| | | | | | | | | |
Growth ($) | | | | | | | | | |
Shares sold | | $ | 49,440,456 | | $ | 4,980,562 | | $ | 27,604 | | $ | 30,259 | |
Dividends reinvested | | 113,349 | | 1,254,943 | | — | | 1,478 | |
Shares redeemed | | (22,005,939 | ) | (37,571,404 | ) | (33,410 | ) | (124,206 | ) |
Net increase (decrease) | | $ | 27,547,866 | | $ | (31,335,899 | ) | $ | (5,806 | ) | $ | (92,469 | ) |
32
NOTES TO FINANCIAL STATEMENTS AS OF JUNE 30, 2006 (UNAUDITED) (CONTINUED) |
|
NOTE 9 — CAPITAL SHARES (continued)
| | Class I | | Class S | |
| | Six Months
Ended
June 30,
2006 | | Year
Ended
December 31,
2005 | | Six Months
Ended
June 30,
2006 | | Year
Ended
December 31,
2005 | |
Small Company (Number of Shares) | | | | | | | | | |
Shares sold | | 5,455,236 | | 556,621 | | 799,249 | | 3,729,805 | |
Dividends reinvested | | 2,869,825 | | 313,991 | | 587,409 | | 32,961 | |
Shares redeemed | | (2,201,169 | ) | (5,812,740 | ) | (4,487,153 | ) | (4,206,439 | ) |
Net increase (decrease) in shares outstanding | | 6,123,892 | | (4,942,128 | ) | (3,100,495 | ) | (443,673 | ) |
| | | | | | | | | |
Small Company ($) | | | | | | | | | |
Shares sold | | $ | 116,723,326 | | $ | 11,336,135 | | $ | 18,135,125 | | $ | 73,490,792 | |
Dividends reinvested | | 60,094,138 | | 6,267,269 | | 12,276,838 | | 656,918 | |
Shares redeemed | | (48,689,650 | ) | (116,180,823 | ) | (96,136,024 | ) | (76,744,947 | ) |
Net increase (decrease) | | $ | 128,127,814 | | $ | (98,577,419 | ) | $ | (65,724,061 | ) | $ | (2,597,237 | ) |
| | | | | | | | | |
| | Class I | | Class S | |
| | Six Months
Ended
June 30,
2006 | | Year
Ended
December 31,
2005 | | Six Months
Ended
June 30,
2006 | | Year
Ended
December 31,
2005 | |
Value Opportunity (Number of Shares) | | | | | | | | | |
Shares sold | | 80,893 | | 553,896 | | 9,663 | | 37,795 | |
Shares issued in merger | | — | | 622,495 | | — | | 1,963,304 | |
Dividends reinvested | | 176,547 | | 296,197 | | 29,063 | | 4,597 | |
Shares redeemed | | (1,329,968 | ) | (5,223,923 | ) | (231,869 | ) | (84,894 | ) |
Net increase (decrease) in shares outstanding | | (1,072,528 | ) | (3,751,335 | ) | (193,143 | ) | 1,920,802 | |
| | | | | | | | | |
Value Opportunity ($) | | | | | | | | | |
Shares sold | | $ | 1,135,966 | | $ | 7,477,383 | | $ | 136,672 | | $ | 300,567 | |
Shares issued in merger | | — | | 8,659,509 | | — | | 27,164,512 | |
Dividends reinvested | | 2,514,028 | | 3,812,050 | | 411,247 | | 58,891 | |
Shares redeemed | | (18,917,985 | ) | (68,980,076 | ) | (3,288,913 | ) | (1,125,724 | ) |
Net increase (decrease) | | $ | (15,267,991 | ) | $ | (49,031,134 | ) | $ | (2,740,994 | ) | $ | 26,398,246 | |
| | | | | | | | | |
| | Class I | | Class S | |
| | Six Months
Ended
June 30,
2006 | | Year
Ended
December 31,
2005 | | Six Months
Ended
June 30,
2006 | | Year
Ended
December 31,
2005 | |
Intermediate Bond (Number of Shares) | | | | | | | | | |
Shares sold | | 40,872,454 | | 10,413,516 | | 15,899,343 | | 27,761,044 | |
Shares issued in merger | | 222,036 | | — | | — | | — | |
Dividends reinvested | | 38,921 | | 3,789,704 | | 18,468 | | 1,847,547 | |
Shares redeemed | | (5,762,647 | ) | (8,854,326 | ) | (32,556,727 | ) | (4,792,299 | ) |
Net increase (decrease) in shares outstanding | | 35,370,764 | | 5,348,894 | | (16,638,916 | ) | 24,816,292 | |
| | | | | | | | | |
Intermediate Bond ($) | | | | | | | | | |
Shares sold | | $ | 527,054,920 | | $ | 138,846,419 | | $ | 204,575,727 | | $ | 367,384,739 | |
Shares issued in merger | | 2,981,925 | | — | | — | | — | |
Dividends reinvested | | 502,471 | | 49,139,900 | | 237,746 | | 23,812,556 | |
Shares redeemed | | (74,464,860 | ) | (117,871,564 | ) | (417,614,885 | ) | (63,619,887 | ) |
Net increase (decrease) | | $ | 456,074,456 | | $ | 70,114,755 | | $ | (212,801,412 | ) | $ | 327,577,408 | |
33
NOTES TO FINANCIAL STATEMENTS AS OF JUNE 30, 2006 (UNAUDITED) (CONTINUED) |
|
NOTE 9 — CAPITAL SHARES (continued)
| | Class I | | | | | |
| | Six Months
Ended
June 30,
2006 | | Year
Ended
December 31,
2005 | | | | | |
Money Market (Number of Shares) | | | | | | | | | |
Shares sold | | 15,118,574 | | 17,729,883 | | | | | |
Dividends reinvested | | 2,488,618 | | 999,103 | | | | | |
Shares redeemed | | (8,808,500 | ) | (22,391,210 | ) | | | | |
Net increase (decrease) in shares outstanding | | 8,798,692 | | (3,662,224 | ) | | | | |
| | | | | | | | | |
Money Market ($) | | | | | | | | | |
Shares sold | | $ | 196,342,980 | | $ | 229,751,452 | | | | | |
Dividends reinvested | | 31,895,864 | | 12,797,898 | | | | | |
Shares redeemed | | (114,405,962 | ) | (290,343,446 | ) | | | | |
Net increase (decrease) | | $ | 113,832,882 | | $ | (47,794,096 | ) | | | | |
| | | | | | | | | |
| | Class I | | Class S | |
| | Six Months
Ended
June 30,
2006 | | Year
Ended
December 31,
2005 | | Six Months
Ended
June 30,
2006 | | Year
Ended
December 31,
2005 | |
Global Science and Technology (Number of Shares) | | | | | | | | | |
Shares sold | | 2,334,368 | | 3,651,130 | | 98,041 | | 19,401 | |
Shares redeemed | | (2,754,028 | ) | (6,412,052 | ) | (10,119 | ) | (1,044 | ) |
Net increase (decrease) in shares outstanding | | (419,660 | ) | (2,760,922 | ) | 87,922 | | 18,357 | |
| | | | | | | | | |
Global Science and Technology ($) | | | | | | | | | |
Shares sold | | $ | 10,429,670 | | $ | 13,994,023 | | $ | 444,765 | | $ | 76,069 | |
Shares redeemed | | (12,220,133 | ) | (23,479,231 | ) | (44,250 | ) | (4,232 | ) |
Net increase (decrease) | | $ | (1,790,463 | ) | $ | (9,485,208 | ) | $ | 400,515 | | $ | 71,837 | |
| | | | | | | | | |
| | Class I | | Class S | |
| | Six Months
Ended
June 30,
2006 | | Year
Ended
December 31,
2005 | | Six Months
Ended
June 30,
2006 | | Year
Ended
December 31,
2005 | |
International Equity (Number of Shares) | | | | | | | | | |
Shares sold | | 1,032,191 | | 2,069,109 | | 39,907 | | 57,552 | |
Dividends reinvested | | 100,359 | | 63,014 | | 652 | | 286 | |
Shares redeemed | | (754,893 | ) | (2,060,158 | ) | (10,907 | ) | (53,252 | ) |
Net increase in shares outstanding | | 377,657 | | 71,965 | | 29,652 | | 4,586 | |
| | | | | | | | | |
International Equity ($) | | | | | | | | | |
Shares sold | | $ | 11,197,368 | | $ | 18,609,378 | | $ | 615,309 | | $ | 499,726 | |
Dividends reinvested | | 1,095,926 | | 539,401 | | 7,085 | | 2,439 | |
Shares redeemed | | (8,192,586 | ) | (18,481,796 | ) | (114,561 | ) | (461,596 | ) |
Net increase | | $ | 4,100,708 | | $ | 666,983 | | $ | 507,833 | | $ | 40,569 | |
34
NOTES TO FINANCIAL STATEMENTS AS OF JUNE 30, 2006 (UNAUDITED) (CONTINUED) |
|
NOTE 10 — ILLIQUID SECURITIES
Pursuant to guidelines adopted by the Portfolios’ Board, the following securities have been deemed to be illiquid. Each Portfolio may invest up to 15% (10% for Money Market) of its net assets, in illiquid securities. Fair value for these securities was determined by ING Funds Valuation Committee appointed by the Portfolios’ Board of Directors/Trustees.
Portfolio | | Security | | Principal
Amount | | Initial
Acquision
Date | | Cost | | Value | | Percent
of Net
Assets | | |
Balanced | | Alpine III, 5.290%, due 08/16/14 | | $ | 218,000 | | 08/04/04 | | $ | 218,097 | | $ | 218,484 | | 0.0 | % | |
| | Alpine III, 6.120%, due 08/16/14 | | 218,000 | | 08/04/04 | | 218,097 | | 218,630 | | 0.0 | % | |
| | Alpine III, 7.920%, due 08/16/14 | | 328,000 | | 08/04/04 | | 331,482 | | 329,797 | | 0.0 | % | |
| | Alpine III, 11.170%, due 08/16/14 | | 560,000 | | 08/17/04 | | 561,077 | | 575,035 | | 0.1 | % | |
| | Cameron Highway Oil Pipeline, 5.860%, due 12/15/17 | | 2,075,000 | | 12/05/05 | | 2,075,000 | | 1,969,175 | | 0.2 | % | |
| | FNMA, 7.125%, due 07/01/27 | | 4,289 | | 04/30/06 | | 4,336 | | 4,365 | | 0.0 | % | |
| | FNMA, 7.180%, due 07/01/27 | | 28,336 | | 04/30/06 | | 28,687 | | 28,999 | | 0.0 | % | |
| | | | | | | | $ | 3,436,776 | | $ | 3,344,485 | | 0.3 | % | |
Intermediate Bond | | Alpine III, 5.290%, due 08/16/14 | | $ | 1,006,000 | | 08/04/04 | | $ | 1,006,426 | | $ | 1,008,231 | | 0.0 | % | |
| | Alpine III, 6.120%, due 08/16/14 | | 1,006,000 | | 08/04/04 | | 1,006,426 | | 1,008,907 | | 0.1 | % | |
| | Alpine III, 7.920%, due 08/16/14 | | 1,507,000 | | 08/04/04 | | 1,525,370 | | 1,515,258 | | 0.1 | % | |
| | Alpine III, 11.170%, due 08/16/14 | | 2,576,000 | | 08/17/04 | | 2,611,402 | | 2,645,160 | | 0.1 | % | |
| | Cameron Highway Oil Pipeline, 5.860%, due 12/15/17 | | 7,988,000 | | 12/05/05 | | 7,988,000 | | 7,580,612 | | 0.4 | % | |
| | FNMA, 5.625%, due 08/13/35 | | 858 | | 04/30/06 | | 869 | | 873 | | 0.0 | % | |
| | FNMA, 5.680%, due 08/13/36 | | 10,653 | | 04/30/06 | | 10,811 | | 10,902 | | 0.0 | % | |
| | | | | | | | $ | 14,149,304 | | $ | 13,769,943 | | 0.7 | % | |
Money Market | | Goldman Sachs Inc., 4.610%, due 02/14/07 | | $ | 11,000,000 | | 02/13/06 | | $ | 11,000,000 | | $ | 11,000,000 | | 0.9 | % | |
| | Goldman Sachs Inc., 5.190%, due 05/11/07 | | 10,500,000 | | 04/11/06 | | 10,500,000 | | 10,500,000 | | 0.9 | % | |
| | Money Market Trust, 5.444%, due 07/10/07 | | 31,400,000 | | 07/30/04 | | 31,400,000 | | 31,400,000 | | 2.6 | % | |
| | Newcastle CDO I Ltd., 5.353%, due 09/24/38 | | 13,900,000 | | 10/23/03 | | 13,900,000 | | 13,900,000 | | 1.2 | % | |
| | Newcastle CDO III Corp., 5.353%, due 09/24/38 | | 13,900,000 | | 09/22/05 | | 13,900,000 | | 13,900,000 | | 1.2 | % | |
| | | | | | | | $ | 80,700,000 | | $ | 80,700,000 | | 6.8 | % | |
NOTE 11 — SECURITIES LENDING
Under an agreement with The Bank of New York (“BNY”), the Portfolios can lend their securities to approved brokers, dealers and other financial institutions. Loans are collateralized by cash and U.S. Government securities. The collateral must be in an amount equal to at least 105% of the market value of non-U.S. securities loaned and 102% of the market value of U.S. securities loaned. The cash collateral received is invested in approved investments as defined in the Securities Lending Agreement with BNY (the “Agreement”). The securities purchased with cash collateral received are reflected in the Portfolio of Investments. Generally, in the event of counterparty default, the Portfolios have the right to use the collateral to offset losses incurred. The Agreement contains certain guarantees by BNY in the event of counterparty default and/or a borrower’s failure to return a loaned security, however there would be a potential loss to the Portfolios in the event the Portfolios are delayed or prevented from exercising their right to dispose of the collateral. The Portfolios bear the risk of loss with respect to the investment of collateral. Engaging in securities lending could have a leveraging effect, which may intensify the credit, market and other risks associated with investing in a Portfolio. At June 30, 2006, the Portfolios had securities on loan with the following market values:
| | Value of
Securities
Loaned | | Value of
Collateral | |
Balanced | | $ 136,902,611 | | $ 140,144,328 | |
Growth and Income | | 296,393,361 | | 302,518,757 | |
Growth | | 18,843,333 | | 19,246,134 | |
Small Company | | 123,912,778 | | 127,077,337 | |
Value Opportunity | | 34,073,693 | | 34,671,470 | |
Intermediate Bond | | 218,710,119 | | 222,577,281 | |
Money Market | | 850,765 | | 867,863 | |
Global Science and Technology | | 14,929,062 | | 15,269,180 | |
International Equity | | 3,016,472 | | 3,077,059 | |
35
NOTES TO FINANCIAL STATEMENTS AS OF JUNE 30, 2006 (UNAUDITED) (CONTINUED) |
|
NOTE 12 — FEDERAL INCOME TAXES
The amount of distributions from net investment income and net realized capital gains are determined in accordance with federal income tax regulations, which may differ from U.S. generally accepted accounting principles for investment companies. These book/tax differences may be either temporary or permanent. Permanent differences are reclassified within the capital accounts based on their federal tax-basis treatment; temporary differences are not reclassified. Key differences include the treatment of short-term capital gains, foreign currency transactions, and wash sale deferrals. Distributions in excess of net investment income and/or net realized capital gains for tax purposes are reported as distributions of paid-in capital.
Dividends paid by the Portfolios from net investment income and distributions of net realized short-term capital gains are, for federal income tax purposes, taxable as ordinary income to shareholders.
The tax composition of dividends and distributions to shareholders was as follows:
| | Six Months Ended
June 30, 2006 | | Year Ended
December 31, 2005 | |
| | Ordinary
Income | | Long-Term
Capital Gains | | Ordinary
Income | | Long-Term
Capital Gains | |
Balanced | | $28,941,155 | | $ | — | | $30,626,031 | | $ | — | |
Growth and Income | | 394,747 | | — | | 32,976,369 | | — | |
Growth | | 113,349 | | — | | 1,256,421 | | — | |
Small Company | | 6,386,989 | | 65,983,987 | | 640,870 | | 6,283,317 | |
Value Opportunity | | 2,925,275 | | — | | 3,870,941 | | — | |
Intermediate Bond | | 740,217 | | — | | 71,996,067 | | 987,932 | |
Money Market | | 31,895,864 | | — | | 12,797,898 | | — | |
International Equity | | 1,103,011 | | — | | 541,840 | | — | |
| | | | | | | | | | | |
The tax-basis components of distributable earnings and the expiration dates of the capital loss carryforwards which may be used to offset future realized capital gains for federal income tax purposes as of December 31, 2005 were:
| | Undistributed
Ordinary
Income | | Undistributed
Long Term
Capital Gains | | Unrealized
Appreciation/
Depreciation | | Post-October
Capital
Losses
Deferred | | Post-October
Currency
Losses
Deferred | | Capital
Loss
Carryforwards | | Expiration
Dates | |
Balanced | | $ | 28,937,305 | | $ | — | | $ | 33,206,400 | | $ | — | | $— | | $ | (10,973,009 | ) | 2010 | |
Growth and Income | | 393,853 | | — | | 335,781,383 | | — | | — | | $ | (2,338,787,124 | ) | 2010 | |
| | | | | | | | | | | | (63,082,574 | ) | 2011 | |
| | | | | | | | | | | | $ | (2,401,869,698 | ) | | |
Growth | | 111,000 | | — | | 23,032,281 | | — | | — | | $ | (124,853,110 | ) | 2009 | |
| | | | | | | | | | | | (63,207,672 | ) | 2010 | |
| | | | | | | | | | | | $ | (188,060,782 | ) | | |
Small Company | | 6,391,050 | | 66,072,902 | | 62,790,707 | | — | | — | | — | | — | |
Value Opportunity | | 2,922,288 | | — | | 18,923,363 | | — | | — | | $ | (22,679,982 | ) | 2010 | |
Intermediate Bond | | 735,809 | | — | | (10,249,543 | ) | (6,886,626 | ) | (7 | ) | — | | — | |
Money Market | | 31,881,014 | | — | | — | | — | | — | | $ | (735,570 | ) | 2008 | |
| | | | | | | | | | | | (3,715,968 | ) | 2009 | |
| | | | | | | | | | | | (169 | ) | 2011 | |
| | | | | | | | | | | | (244,520 | ) | 2012 | |
| | | | | | | | | | | | $ | (4,696,227 | ) | | |
Global Science and Technology | | — | | — | | 14,912,593 | | — | | — | | $ | (33,352,083 | ) | 2009 | |
| | | | | | | | | | | | (15,534,432 | ) | 2010 | |
| | | | | | | | | | | | (4,912,495 | ) | 2011 | |
| | | | | | | | | | | | $ | (53,799,010 | ) | | |
International Equity | | 1,100,095 | | — | | 9,233,744 | | — | | — | | $ | (10,317,413 | ) | 2009 | |
| | | | | | | | | | | | (9,221,611 | ) | 2010 | |
| | | | | | | | | | | | $ | (19,539,024 | ) | | |
| | | | | | | | | | | | | | | | | | | | |
NOTE 13 — REORGANIZATIONS
On April 29, 2006, Balanced and Intermediate Bond as listed below (each “Acquiring Portfolio” and collectively, “Acquiring Portfolios”), acquired the assets and certain liabilities of the ING VP Convertible Portfolio, the ING USLICO Asset Allocation Portfolio and the ING USLICO Bond Portfolio, also listed below (each “Acquired Portfolio”
36
NOTES TO FINANCIAL STATEMENTS AS OF JUNE 30, 2006 (UNAUDITED) (CONTINUED) |
|
NOTE 13 — REORGANIZATIONS (continued)
and collectively, “Acquired Portfolios”), in a tax-free reorganization in exchange for shares of the Acquiring Portfolios, pursuant to a plan or reorganization approved by the Acquired Portfolios’ shareholders. The number and value of shares issued by the Acquiring Portfolios are presented in Note 9 — Capital Share Transactions. Net assets and unrealized appreciation as of the reorganization date were as follows:
Acquiring
Portfolio | | Acquired
Portfolio | | Total Net Assets of
Acquired Portfolio (000’s) | | Total Net Assets of
Acquiring Portfolio (000’s) | | Acquired Portfolio
Unrealized
Appreciation (000’s) | | Conversion
Ratio | |
Balanced | | ING VP
Convertible Portfolio | | $8,269 | | $1,224,744 | | $231 | | 0.81 | |
Balanced | | ING USLICO | | | | | | | | | |
| | Asset Allocation Portfolio | | 13,477 | | 1,224,744 | | 632 | | 0.72 | |
Intermediate Bond | | ING USLICO | | | | | | | | | |
| | Bond Portfolio | | 2,863 | | 1,890,564 | | 60 | | 0.74 | |
The net assets of Balanced and Intermediate Bond after the acquisition were approximately $1,246,490,241 and $1,893,426,244, respectively.
NOTE 14 — INFORMATION REGARDING TRADING OF ING’S U.S. MUTUAL FUNDS
In 2004 ING Investments reported to the Boards of Directors/Trustees (the “Boards”) of the ING Funds that, like many U.S. financial services companies, ING Investments and certain of its U.S. affiliates have received informal and formal requests for information since September 2003 from various governmental and self-regulatory agencies in connection with investigations related to mutual funds and variable insurance products. ING Investments has advised the Boards that it and its affiliates have cooperated fully with each request.
In addition to responding to regulatory and governmental requests, ING Investments reported that management of U.S. affiliates of ING Groep N.V., including ING Investments (collectively, “ING”), on their own initiative, have conducted, through independent special counsel and a national accounting firm, an extensive internal review of trading in ING insurance, retirement, and mutual fund products. The goal of this review was to identify any instances of inappropriate trading in those products by third parties or by ING investment professionals and other ING personnel. ING’s internal review related to mutual fund trading is now substantially completed. ING has reported that, of the millions of customer relationships that ING maintains, the internal review identified several isolated arrangements allowing third parties to engage in frequent trading of mutual funds within ING’s variable insurance and mutual fund products, and identified other circumstances where frequent trading occurred, despite measures taken by ING intended to combat market timing. ING further reported that each of these arrangements has been terminated and fully disclosed to regulators. The results of the internal review were also reported to the independent members of the Board.
ING Investments has advised the Board that most of the identified arrangements were initiated prior to ING’s acquisition of the businesses in question in the U.S. ING Investments further reported that the companies in question did not receive special benefits in return for any of these arrangements, which have all been terminated.
Based on the internal review, ING Investments has advised the Board that the identified arrangements do not represent a systemic problem in any of the companies that were involved.
In September 2005, ING Funds Distributor, LLC (“IFD”), the distributor of certain ING Funds, settled an administrative proceeding with the NASD regarding three arrangements, dating from 1995, 1996 and 1998, under which the administrator to the then-Pilgrim Funds, which subsequently became part of the ING Funds, entered into formal and informal arrangements that permitted frequent trading. Under the terms of the Letter of Acceptance, Waiver and Consent (“AWC”) with the NASD, under which IFD neither admitted nor denied the allegations or findings, IFD consented to the following sanctions: (i) a censure; (ii) a fine of $1.5 million; (iii) restitution of approximately $1.44 million to certain ING Funds for losses attributable to excessive trading described in the AWC; and (iv) agreement to make certification to NASD regarding the review and establishment of certain procedures.
In addition to the arrangements discussed above, in 2004 ING Investments reported to the Board that, at that time, these instances include the following, in
37
NOTES TO FINANCIAL STATEMENTS AS OF JUNE 30, 2006 (UNAUDITED) (CONTINUED) |
|
NOTE 14 — INFORMATION REGARDING TRADING OF ING’S U.S. MUTUAL FUNDS (continued)
addition to the arrangements subject to the AWC discussed above:
• Aeltus Investment Management, Inc. (a predecessor entity to ING Investment Management Co.) has identified two investment professionals who engaged in extensive frequent trading in certain ING Funds. One was subsequently terminated for cause and incurred substantial financial penalties in connection with this conduct and the second has been disciplined.
• ReliaStar Life Insurance Company (“ReliaStar”) entered into agreements seven years ago permitting the owner of policies issued by the insurer to engage in frequent trading and to submit orders until 4pm Central Time. In 2001 ReliaStar also entered into a selling agreement with a broker-dealer that engaged in frequent trading. Employees of ING affiliates were terminated and/or disciplined in connection with these matters.
• In 1998, Golden American Life Insurance Company entered into arrangements permitting a broker-dealer to frequently trade up to certain specific limits in a fund available in an ING variable annuity product. No employee responsible for this arrangement remains at the company.
For additional information regarding these matters, you may consult the Form 8-K and Form 8-K/A for each of four life insurance companies, ING USA Annuity and Life Insurance Company, ING Life Insurance and Annuity Company, ING Insurance Company of America, and ReliaStar Life Insurance Company of New York, each filed with the Securities and Exchange Commission (the “SEC”) on October 29, 2004 and September 8, 2004. These Forms 8-K and Forms 8-K/A can be accessed through the SEC’s Web site at http://www.sec.gov. Despite the extensive internal review conducted through independent special counsel and a national accounting firm, there can be no assurance that the instances of inappropriate trading reported to the Board are the only instances of such trading respecting the ING Funds.
ING Investments reported to the Board that ING is committed to conducting its business with the highest standards of ethical conduct with zero tolerance for noncompliance. Accordingly, ING Investments advised the Board that ING management was disappointed that its voluntary internal review identified these situations. Viewed in the context of the breadth and magnitude of its U.S. business as a whole, ING management does not believe that ING’s acquired companies had systemic ethical or compliance issues in these areas. Nonetheless, ING Investments reported that given ING’s refusal to tolerate any lapses, it has taken the steps noted below, and will continue to seek opportunities to further strengthen the internal controls of its affiliates.
• ING has agreed with the ING Funds to indemnify and hold harmless the ING Funds from all damages resulting from wrongful conduct by ING or its employees or from ING’s internal investigation, any investigations conducted by any governmental or self-regulatory agencies, litigation or other formal proceedings, including any proceedings by the Securities and Exchange Commission. ING Investments reported to the Board that ING management believes that the total amount of any indemnification obligations will not be material to ING or its U.S. business.
• ING updated its Code of Conduct for employees reinforcing its employees’ obligation to conduct personal trading activity consistent with the law, disclosed limits, and other requirements.
• The ING Funds, upon a recommendation from ING, updated their respective Codes of Ethics applicable to investment professionals with ING entities and certain other fund personnel, requiring such personnel to pre-clear any purchases or sales of ING Funds that are not systematic in nature (i.e., dividend reinvestment), and imposing minimum holding periods for shares of ING Funds.
• ING instituted excessive trading policies for all customers in its variable insurance and retirement products and for shareholders of the ING Funds sold to the public through financial intermediaries. ING does not make exceptions to these policies.
• ING reorganized and expanded its U.S. Compliance Department, and created an Enterprise Compliance team to enhance controls and consistency in regulatory compliance.
The New York Attorney General and other federal and state regulators are also conducting broad inquiries and investigations involving the insurance industry. These initiatives currently focus on, among other things, compensation and other sales incentives; potential conflicts of interest; potential anti-competitive activity; reinsurance; marketing practices (including suitability); specific product types (including group annuities and
38
NOTES TO FINANCIAL STATEMENTS AS OF JUNE 30, 2006 (UNAUDITED) (CONTINUED) |
|
NOTE 14 — INFORMATION REGARDING TRADING OF ING’S U.S. MUTUAL FUNDS (continued)
indexed annuities); fund selection for investment products and brokerage sales; and disclosure. It is likely that the scope of these industry investigations will further broaden before they conclude. ING has received formal and informal requests in connection with such investigations, and is cooperating fully with each request. In connection with one such investigation, affiliates of Investments have been named in a petition for relief and cease and desist order filed by the New Hampshire Bureau of Securities Regulation concerning ING’s administration of the New Hampshire state employees deferred compensation plan. ING is cooperating with this regulator to resolve the matter. Other federal and state regulators could initiate similar actions in this or other areas of ING’s businesses.
These regulatory initiatives may result in new legislation and regulation that could significantly affect the financial services industry, including businesses in which ING is engaged.
In light of these and other developments, ING continuously reviews whether modifications to its business practices are appropriate.
At this time, in light of the current regulatory factors, ING U.S. is actively engaged in reviewing whether any modifications in our practices are appropriate for the future.
There can be no assurance that these matters, or the adverse publicity associated with them, will not result in increased fund redemptions, reduced sale of fund shares, or other adverse consequences to ING Funds.
NOTE 15 — LITIGATION
On December 12, 2003, ING IM (formerly, Aeltus Investment Management, Inc.,) received a copy of a complaint (the “Complaint”) filed in the United States Bankruptcy Court for the Southern District of New York styled Enron Corp. v. Mass Mutual Life Insurance Co., et al. Among other defendants named in the Complaint are defendants ING VP Balanced Portfolio, and ING VP Intermediate Bond Portfolio (the “Subject Portfolios”). The Complaint alleges that Enron Corp. (“Enron”) transferred to the defendants, including the Subject Portfolios, over $1 billion in the aggregate for the purpose of prepaying certain commercial paper issued by Enron (the “Notes”) and held by the defendants prior to the filing by Enron for bankruptcy protection under Chapter 11 of Title 11 of the Bankruptcy Code (the “Bankruptcy Code”). The Complaint seeks to hold the defendants, including the Subject Portfolios, liable for these transfers as preferential transfers or as fraudulent transfers under the Bankruptcy Code. Although the Complaint does not specify the amount of each transfer in dispute, it appears that the sale by ING VP Balanced Portfolio, Inc. of $23,181,757 of the Notes on or about October 29, 2001 and the sale by ING VP Bond Portfolio, Inc. of $24,963,125 of the Notes on or about October 29, 2001 are in dispute. The Complaint seeks to require the Subject Portfolios to repay to Enron the full amounts of these transfers, in which event the Subject Portfolios would be granted unsecured claims against the Enron bankruptcy estate in the amounts of the repayments.
The Subject Portfolios moved to dismiss all counts of the Complaint, contending, among other things, that section 546(e) of the Bankruptcy Code provides a complete defense. The Bankruptcy Court denied the motion on July 1, 2005. Accordingly, the Subject Portfolios filed an answer to the Complaint on July 29, 2005. In addition, the Subject Portfolios have moved for leave to pursue an immediate appeal of the Bankruptcy Court’s decision to the district court. The district court has not yet ruled, and there can be no assurance that leave will be granted to pursue the appeal now. The Bankruptcy Court has set a discovery calendar indicating that discovery is to proceed through 2006. The Subject Portfolios and their counsel have reviewed the Subject Portfolios’ records concerning the factual background of the allegations in the Complaint, and have considered remaining potential defenses to the allegations in the Complaint. Because only limited discovery has taken place, the Subject Portfolios are unable to predict whether Enron will prevail, in whole or in part, in its claims against the Subject Portfolios, and therefore have not recorded a liability in the financial statements for any potential loss. Defendants continue to contend there is an affirmative defense for the claims presented.
39
| | PORTFOLIO OF INVESTMENTS |
ING VP BALANCED PORTFOLIO | | AS OF JUNE 30, 2006 (UNAUDITED) |
|
Investment Type Allocation
as of June 30, 2006
(as a percent of net assets)
Common Stock | | 60.6 | % |
Repurchase Agreements | | 9.9 | % |
U.S. Government Agency Obligations | | 9.2 | % |
Corporate Bonds/Notes | | 9.1 | % |
Collateralized Mortgage Obligations | | 5.4 | % |
U.S. Treasury Obligations | | 3.0 | % |
Asset-Backed Securities | | 1.7 | % |
Commercial Paper | | 1.2 | % |
Preferred Stock | | 0.6 | % |
Municipal Bonds | | 0.2 | % |
Convertible Bonds | | 0.1 | % |
Other Bonds | | 0.1 | % |
Other Assets and Liabilities, Net* | | (1.1 | )% |
Total | | 100.0 | % |
*Includes short-term investments related to securities lending collateral.
Portfolio holdings are subject to change daily.
Shares | | | | | | Value | | |
COMMON STOCK: 60.6% | | | | |
| | | | Advertising: 0.3% | | | | |
36,300 | | | | Omnicom Group | | $ | 3,233,967 | | |
| | | | | | 3,233,967 | | |
| | | | Aerospace/Defense: 1.3% | | | | |
5,700 | | @,L | | Armor Holdings, Inc. | | 312,531 | | |
99,250 | | | | Boeing Co. | | 8,129,568 | | |
91,740 | | | | Raytheon Co. | | 4,088,852 | | |
7,630 | | @ | | Teledyne Technologies, Inc. | | 249,959 | | |
55,110 | | | | United Technologies Corp. | | 3,495,076 | | |
| | | | | | 16,275,986 | | |
| | | | Agriculture: 1.0% | | | | |
110,705 | | | | Altria Group, Inc. | | 8,129,068 | | |
118,750 | | | | Archer-Daniels-Midland Co. | | 4,902,000 | | |
| | | | | | 13,031,068 | | |
| | | | Airlines: 0.3% | | | | |
11,926 | | @,L | | Mesa Air Group, Inc. | | 117,471 | | |
12,395 | | | | Skywest, Inc. | | 307,396 | | |
183,000 | | | | Southwest Airlines Co. | | 2,995,710 | | |
| | | | | | 3,420,577 | | |
| | | | Apparel: 0.4% | | | | |
96,500 | | @ | | Coach, Inc. | | 2,885,350 | | |
8,200 | | @ | | Gymboree Corp. | | 285,032 | | |
7,380 | | | | K-Swiss, Inc. | | 197,046 | | |
7,100 | | L | | Kellwood Co. | | 207,817 | | |
3,100 | | | | Phillips-Van Heusen | | 118,296 | | |
11,000 | | | | Polo Ralph Lauren Corp. | | 603,900 | | |
8,200 | | @ | | Quiksilver, Inc. | | 99,876 | | |
7,900 | | @,L | | Skechers USA, Inc. | | 190,469 | | |
13,100 | | | | Wolverine World Wide, Inc. | | 305,623 | | |
| | | | | | 4,893,409 | | |
| | | | Auto Parts & Equipment: 0.0% | | | | |
20,700 | | L | | ArvinMeritor, Inc. | | $ | 355,833 | |
| | | | | | 355,833 | | |
| | | | Banks: 2.9% | | | | |
245,235 | | | | Bank of America Corp. | | 11,795,804 | | |
103,700 | | | | BB&T Corp. | | 4,312,883 | | |
7,500 | | | | Central Pacific Financial Corp. | | 290,250 | | |
4,292 | | L | | East-West Bancorp., Inc. | | 162,710 | | |
3,500 | | | | First Midwest Bancorp., Inc. | | 129,780 | | |
15,745 | | | | Fremont General Corp. | | 292,227 | | |
15,400 | | | | Greater Bay Bancorp. | | 442,750 | | |
8,700 | | | | Mercantile Bankshares Corp. | | 310,329 | | |
112,600 | | L | | National City Corp. | | 4,074,994 | | |
5,400 | | | | South Financial Group, Inc. | | 142,614 | | |
12,900 | | L | | Susquehanna Bancshares, Inc. | | 308,310 | | |
97,370 | | | | US Bancorp. | | 3,006,786 | | |
87,750 | | | | Wachovia Corp. | | 4,745,520 | | |
90,600 | | | | Wells Fargo & Co. | | 6,077,448 | | |
11,800 | | | | Whitney Holding Corp. | | 417,366 | | |
| | | | | | 36,509,771 | | |
| | | | Beverages: 1.7% | | | | |
222,950 | | | | Coca-Cola Co. | | 9,591,309 | | |
1,200 | | @,L | | Hansen Natural Corp. | | 228,444 | | |
35,800 | | L | | Pepsi Bottling Group, Inc. | | 1,150,970 | | |
173,525 | | | | PepsiCo, Inc. | | 10,418,441 | | |
| | | | | | 21,389,164 | | |
| | | | Biotechnology: 0.4% | | | | |
63,195 | | @ | | Amgen, Inc. | | 4,122,210 | | |
11,500 | | @ | | Invitrogen Corp. | | 759,805 | | |
| | | | | | 4,882,015 | | |
| | | | Building Materials: 0.3% | | | | |
10,500 | | | | Florida Rock Industries, Inc. | | 521,535 | | |
2,900 | | | | Martin Marietta Materials, Inc. | | 264,335 | | |
108,400 | | | | Masco Corp. | | 3,212,976 | | |
4,700 | | @,L | | NCI Building Systems, Inc. | | 249,899 | | |
| | | | | | 4,248,745 | | |
| | | | Chemicals: 1.0% | | | | |
14,400 | | | | Airgas, Inc. | | 536,400 | | |
49,500 | | | | Dow Chemical Co. | | 1,931,985 | | |
47,600 | | L | | EI DuPont de Nemours & Co. | | 1,980,160 | | |
6,500 | | | | HB Fuller Co. | | 283,205 | | |
13,387 | | L | | Lyondell Chemical Co. | | 303,349 | | |
21,600 | | | | Olin Corp. | | 387,288 | | |
3,000 | | | | Penford Corp. | | 50,700 | | |
25,500 | | @,L | | PolyOne Corp. | | 223,890 | | |
42,700 | | | | PPG Industries, Inc. | | 2,818,200 | | |
37,300 | | L | | Rohm & Haas Co. | | 1,869,476 | | |
29,000 | | | | Sherwin-Williams Co. | | 1,376,920 | | |
20,900 | | | | Valspar Corp. | | 551,969 | | |
| | | | | | 12,313,542 | | |
| | | | Coal: 0.1% | | | | |
18,800 | | | | Peabody Energy Corp. | | 1,048,100 | | |
| | | | | | 1,048,100 | | |
| | | | | | | | | | |
See Accompanying Notes to Financial Statements
40
| | PORTFOLIO OF INVESTMENTS |
ING VP BALANCED PORTFOLIO | | AS OF JUNE 30, 2006 (UNAUDITED) (CONTINUED) |
|
Shares | | | | | | Value | |
| | | | Commercial Services: 0.8% | | | |
6,500 | | | | Administaff, Inc. | | $ | 232,765 | |
18,200 | | @ | | Career Education Corp. | | 543,998 | |
3,690 | | @ | | Consolidated Graphics, Inc. | | 192,101 | |
25,700 | | @ | | Corinthian Colleges, Inc. | | 369,052 | |
7,700 | | | | Corporate Executive Board Co. | | 771,540 | |
1,700 | | | | CPI Corp. | | 52,190 | |
35,350 | | | | Equifax, Inc. | | 1,213,919 | |
5,500 | | @ | | Heidrick & Struggles International, Inc. | | 186,120 | |
4,500 | | @ | | Kendle Intl., Inc. | | 165,285 | |
15,000 | | @ | | Korn/Ferry Intl. | | 293,850 | |
11,900 | | @ | | Labor Ready, Inc. | | 269,535 | |
4,400 | | @,L | | Live Nation, Inc. | | 89,584 | |
14,600 | | | | Manpower, Inc. | | 943,160 | |
74,800 | | | | McKesson Corp. | | 3,536,544 | |
10,200 | | | | Robert Half International, Inc. | | 428,400 | |
18,200 | | @ | | Spherion Corp. | | 165,984 | |
18,400 | | @ | | United Rentals, Inc. | | 588,432 | |
3,110 | | @,L | | Vertrue, Inc. | | 133,823 | |
| | | | | | 10,176,282 | |
| | | | Computers: 2.7% | | | |
46,100 | | @ | | Apple Computer, Inc. | | 2,633,232 | |
2,090 | | @ | | CACI International, Inc. | | 121,910 | |
19,300 | | @,L | | Cadence Design Systems, Inc. | | 330,995 | |
30,200 | | @,L | | Ceridian Corp. | | 738,088 | |
9,930 | | @ | | Cognizant Technology Solutions Corp. | | 668,984 | |
121,650 | | @,L | | Dell, Inc. | | 2,969,477 | |
7,300 | | L | | Factset Research Systems, Inc. | | 345,290 | |
311,100 | | | | Hewlett-Packard Co. | | 9,855,648 | |
152,950 | | | | International Business Machines Corp. | | 11,749,619 | |
7,000 | | @,L | | Komag, Inc. | | 323,260 | |
28,300 | | @ | | Lexmark International, Inc. | | 1,579,989 | |
8,537 | | @ | | Micros Systems, Inc. | | 372,896 | |
6,020 | | | | MTS Systems Corp. | | 237,850 | |
26,400 | | @ | | Palm, Inc. | | 425,040 | |
7,400 | | @ | | Radisys Corp. | | 162,504 | |
15,700 | | | | Reynolds & Reynolds Co. | | 481,519 | |
8,400 | | @,L | | Synaptics, Inc. | | 179,760 | |
14,966 | | @,L | | Western Digital Corp. | | 296,476 | |
| | | | | | 33,472,537 | |
| | | | Cosmetics/Personal Care: 1.3% | | | |
284,092 | | | | Procter & Gamble Co. | | 15,795,515 | |
| | | | | | 15,795,515 | |
| | | | Distribution/Wholesale: 0.1% | | | |
8,190 | | L | | Building Materials Holding Corp. | | 228,255 | |
3,350 | | | | Pool Corp. | | 146,161 | |
6,200 | | @,L | | United Stationers, Inc. | | 305,784 | |
| | | | | | 680,200 | |
| | | | Diversified Financial Services: 5.5% | | | |
66,900 | | | | American Express Co. | | 3,560,418 | |
26,200 | | @,L | | AmeriCredit Corp. | | 731,504 | |
55,600 | | L | | Capital One Financial Corp. | | 4,751,020 | |
232,600 | | | | Charles Schwab Corp. | | 3,716,948 | |
263,665 | | | | Citigroup, Inc. | | 12,719,200 | |
109,000 | | @ | | E*Trade Financial Corp. | | 2,487,380 | |
52,300 | | L | | Fannie Mae | | 2,515,630 | |
52,950 | | | | Goldman Sachs Group, Inc. | | $ | 7,965,269 | |
8,300 | | @ | | Investment Technology Group, Inc. | | 422,138 | |
185,300 | | | | JPMorgan Chase & Co. | | 7,782,600 | |
84,000 | | | | Lehman Brothers Holdings, Inc. | | 5,472,600 | |
48,310 | | | | Merrill Lynch & Co., Inc. | | 3,360,444 | |
130,800 | | | | Morgan Stanley | | 8,267,868 | |
20,400 | | | | Raymond James Financial, Inc. | | 617,508 | |
27,200 | | | | The Bear Stearns Cos., Inc. | | 3,810,176 | |
24,400 | | | | Waddell & Reed Financial, Inc. | | 501,664 | |
6,400 | | @,L | | World Acceptance Corp. | | 227,328 | |
| | | | | | 68,909,695 | |
| | | | Electric: 1.4% | | | |
85,300 | | L | | Duke Energy Corp. | | 2,505,261 | |
30,700 | | | | OGE Energy Corp. | | 1,075,421 | |
21,100 | | | | Pepco Holdings, Inc. | | 497,538 | |
150,500 | | L | | PPL Corp. | | 4,861,150 | |
12,810 | | | | SCANA Corp. | | 494,210 | |
134,600 | | L | | TXU Corp. | | 8,047,734 | |
13,000 | | | | Wisconsin Energy Corp. | | 523,900 | |
| | | | | | 18,005,214 | |
| | | | Electrical Components & Equipment: 0.5% | | | |
65,100 | | | | Emerson Electric Co. | | 5,456,031 | |
3,700 | | @ | | Energizer Holdings, Inc. | | 216,709 | |
| | | | | | 5,672,740 | |
| | | | Electronics: 0.8% | | | |
101,000 | | @ | | Agilent Technologies, Inc. | | 3,187,560 | |
6,100 | | | | Amphenol Corp. | | 341,356 | |
48,400 | | | | Applera Corp.-Applied Biosystems Group | | 1,565,740 | |
8,591 | | @ | | Arrow Electronics, Inc. | | 276,630 | |
3,400 | | | | Brady Corp. | | 125,256 | |
8,290 | | @,L | | Coherent, Inc. | | 279,622 | |
7,900 | | @,L | | Cymer, Inc. | | 367,034 | |
4,690 | | @,L | | Flir Systems, Inc. | | 103,461 | |
1,800 | | @,L | | Itron, Inc. | | 106,668 | |
6,900 | | L | | Park Electrochemical Corp. | | 177,675 | |
5,000 | | @,L | | Planar Systems, Inc. | | 60,200 | |
14,000 | | @,L | | Plexus Corp. | | 478,940 | |
225,100 | | @,L | | Solectron Corp. | | 769,842 | |
12,500 | | @ | | Thomas & Betts Corp. | | 641,250 | |
3,690 | | @,L | | Trimble Navigation Ltd. | | 164,722 | |
27,200 | | @ | | Waters Corp. | | 1,207,680 | |
| | | | | | 9,853,636 | |
| | | | Engineering & Construction: 0.1% | | | |
6,200 | | @ | | EMCOR Group, Inc. | | 301,754 | |
10,400 | | | | Granite Construction, Inc. | | 470,808 | |
4,100 | | @ | | Jacobs Engineering Group, Inc. | | 326,524 | |
5,100 | | @ | | Shaw Group, Inc. | | 141,780 | |
3,000 | | @ | | URS Corp. | | 126,000 | |
| | | | | | 1,366,866 | |
| | | | Entertainment: 0.1% | | | |
20,600 | | L | | GTECH Holdings Corp. | | 716,468 | |
3,400 | | @ | | Pinnacle Entertainment, Inc. | | 104,210 | |
| | | | | | 820,678 | |
See Accompanying Notes to Financial Statements
41
| | PORTFOLIO OF INVESTMENTS |
ING VP BALANCED PORTFOLIO | | AS OF JUNE 30, 2006 (UNAUDITED) (CONTINUED) |
|
Shares | | | | | | Value | |
| | | | Environmental Control: 0.0% | | | |
8,520 | | | | Republic Services, Inc. | | $ | 343,697 | |
3,100 | | @ | | Waste Connections, Inc. | | 112,840 | |
| | | | | | 456,537 | |
| | | | Food: 0.6% | | | |
8,800 | | @,L | | American Italian Pasta Co. | | 75,328 | |
48,100 | | | | Campbell Soup Co. | | 1,784,991 | |
7,090 | | | | Corn Products International, Inc. | | 216,954 | |
4,950 | | | | Flowers Foods, Inc. | | 141,768 | |
79,617 | | | | General Mills, Inc. | | 4,113,014 | |
14,379 | | | | Hormel Foods Corp. | | 534,036 | |
12,090 | | @ | | Performance Food Group Co. | | 367,294 | |
7,800 | | | | Tootsie Roll Industries, Inc. | | 227,214 | |
| | | | | | 7,460,599 | |
| | | | Forest Products & Paper: 0.2% | | | |
31,000 | | L | | Louisiana-Pacific Corp. | | 678,900 | |
11,100 | | | | Rock-Tenn Co. | | 177,045 | |
27,900 | | | | Temple-Inland, Inc. | | 1,196,073 | |
| | | | | | 2,052,018 | |
| | | | Gas: 0.1% | | | |
13,446 | | | | Energen Corp. | | 516,461 | |
18,000 | | | | Southern Union Co. | | 487,080 | |
19,630 | | | | UGI Corp. | | 483,291 | |
| | | | | | 1,486,832 | |
| | | | Healthcare-Products: 1.1% | | | |
13,800 | | | | Beckman Coulter, Inc. | | 766,590 | |
27,100 | | @,L | | Cytyc Corp. | | 687,256 | |
5,872 | | | | Dentsply International, Inc. | | 355,843 | |
8,834 | | @ | | Hologic, Inc. | | 436,046 | |
2,386 | | @,L | | Idexx Laboratories, Inc. | | 179,260 | |
16,900 | | @ | | Immucor, Inc. | | 324,987 | |
155,115 | | | | Johnson & Johnson | | 9,294,491 | |
5,800 | | @ | | Osteotech, Inc. | | 23,432 | |
5,620 | | @ | | Resmed, Inc. | | 263,859 | |
5,357 | | @ | | Respironics, Inc. | | 183,317 | |
21,600 | | | | Steris Corp. | | 493,776 | |
11,100 | | @ | | Techne Corp. | | 565,212 | |
9,800 | | @,L | | Varian Medical Systems, Inc. | | 464,030 | |
| | | | | | 14,038,099 | |
| | | | Healthcare-Services: 2.0% | | | |
106,600 | | | | Aetna, Inc. | | 4,256,538 | |
43,350 | | @ | | Coventry Health Care, Inc. | | 2,381,649 | |
20,900 | | @ | | Health Net, Inc. | | 944,053 | |
7,300 | | @,L | | Healthways, Inc. | | 384,272 | |
44,200 | | @ | | Humana, Inc. | | 2,373,540 | |
12,846 | | @,L | | Odyssey HealthCare, Inc. | | 225,704 | |
9,900 | | @ | | Pediatrix Medical Group, Inc. | | 448,470 | |
9,620 | | @,L | | Sierra Health Services | | 433,189 | |
165,000 | | | | UnitedHealth Group, Inc. | | 7,388,700 | |
89,440 | | @ | | WellPoint, Inc. | | 6,508,549 | |
| | | | | | 25,344,664 | |
| | | | Holding Companies-Diversified: 0.1% | | | |
29,800 | | L | | Leucadia National Corp. | | 869,862 | |
| | | | | | 869,862 | |
| | | | Home Builders: 0.1% | | | |
840 | | @,L | | NVR, Inc. | | $ | 412,650 | |
9,000 | | L | | Thor Industries, Inc. | | 436,050 | |
| | | | | | 848,700 | |
| | | | Home Furnishings: 0.1% | | | |
16,600 | | L | | Harman International Industries, Inc. | | 1,417,142 | |
| | | | | | 1,417,142 | |
| | | | Household Products/Wares: 0.1% | | | |
15,800 | | | | American Greetings | | 331,958 | |
13,600 | | L | | Church & Dwight, Inc. | | 495,312 | |
5,900 | | | | Harland John H. Co. | | 256,650 | |
| | | | | | 1,083,920 | |
| | | | Housewares: 0.0% | | | |
7,390 | | | | Toro Co. | | 345,113 | |
| | | | | | 345,113 | |
| | | | Insurance: 4.0% | | | |
100,700 | | | | Allstate Corp. | | 5,511,311 | |
12,550 | | L | | American Financial Group, Inc. | | 538,395 | |
135,300 | | | | American International Group, Inc. | | 7,989,465 | |
10,100 | | | | AmerUs Group Co. | | 591,355 | |
81,800 | | | | Chubb Corp. | | 4,081,820 | |
11,918 | | | | Fidelity National Financial, Inc. | | 464,206 | |
12,100 | | | | Hanover Insurance Group, Inc. | | 574,266 | |
55,400 | | | | Hartford Financial Services Group, Inc. | | 4,686,840 | |
23,600 | | | | HCC Insurance Holdings, Inc. | | 694,784 | |
6,200 | | L | | Infinity Property & Casualty Corp. | | 254,200 | |
4,270 | | | | Landamerica Financial Group, Inc. | | 275,842 | |
65,900 | | | | Lincoln National Corp. | | 3,719,396 | |
111,850 | | L | | Metlife, Inc. | | 5,727,839 | |
23,100 | | L | | MGIC Investment Corp. | | 1,501,500 | |
15,906 | | | | Old Republic International Corp. | | 339,911 | |
11,490 | | @,L | | Philadelphia Consolidated Holding Co. | | 348,836 | |
17,400 | | | | PMI Group, Inc. | | 775,692 | |
66,900 | | L | | Principal Financial Group | | 3,722,985 | |
74,136 | | | | Prudential Financial, Inc. | | 5,760,367 | |
14,300 | | | | Radian Group, Inc. | | 883,454 | |
4,600 | | | | Safety Insurance Group, Inc. | | 218,730 | |
6,030 | | | | Selective Insurance Group | | 336,896 | |
28,450 | | | | WR Berkley Corp. | | 970,999 | |
8,120 | | L | | Zenith National Insurance Corp. | | 322,120 | |
| | | | | | 50,291,209 | |
| | | | Internet: 0.5% | | | |
6,300 | | @,L | | Checkfree Corp. | | 312,228 | |
10,800 | | @ | | Google, Inc. | | 4,528,764 | |
9,000 | | @,L | | Infospace, Inc. | | 204,030 | |
3,500 | | @ | | j2 Global Communications, Inc. | | 109,270 | |
31,475 | | @ | | McAfee, Inc. | | 763,898 | |
19,600 | | L | | United Online, Inc. | | 235,200 | |
12,200 | | @,L | | Websense, Inc. | | 250,588 | |
| | | | | | 6,403,978 | |
See Accompanying Notes to Financial Statements
42
| | PORTFOLIO OF INVESTMENTS |
ING VP BALANCED PORTFOLIO | | AS OF JUNE 30, 2006 (UNAUDITED) (CONTINUED) |
|
Shares | | | | | | Value | |
| | | | Iron/Steel: 0.5% | | | |
1,500 | | | | Carpenter Technology | | $ | 173,250 | |
1,600 | | @ | | Chaparral Steel Co. | | 115,232 | |
4,700 | | L | | Cleveland-Cliffs, Inc. | | 372,663 | |
70,200 | | | | Nucor Corp. | | 3,808,350 | |
6,900 | | | | Reliance Steel & Aluminum Co. | | 572,355 | |
9,100 | | | | Steel Dynamics, Inc. | | 598,234 | |
3,700 | | | | Steel Technologies, Inc. | | 71,928 | |
| | | | | | 5,712,012 | |
| | | | Leisure Time: 0.0% | | | |
8,765 | | @,L | | Multimedia Games, Inc. | | 88,789 | |
2,650 | | L | | Polaris Industries, Inc. | | 114,745 | |
| | | | | | 203,534 | |
| | | | Lodging: 0.0% | | | |
2,300 | | @,L | | Aztar Corp. | | 119,508 | |
| | | | | | 119,508 | |
| | | | Machinery-Construction & Mining: 0.3% | | | |
34,600 | | | | Caterpillar, Inc. | | 2,577,008 | |
6,700 | | | | JLG Industries, Inc. | | 150,750 | |
8,600 | | | | Joy Global, Inc. | | 447,974 | |
| | | | | | 3,175,732 | |
| | | | Machinery-Diversified: 0.2% | | | |
9,452 | | L | | Applied Industrial Technologies, Inc. | | 229,778 | |
9,400 | | @ | | Gardner Denver, Inc. | | 361,900 | |
14,900 | | | | Graco, Inc. | | 685,102 | |
3,489 | | | | IDEX Corp. | | 164,681 | |
10,000 | | L | | Manitowoc Co. | | 445,000 | |
10,200 | | | | Nordson Corp. | | 501,636 | |
| | | | | | 2,388,097 | |
| | | | Media: 1.4% | | | |
141,800 | | | | CBS Corp. - Class B | | 3,835,690 | |
69,500 | | | | McGraw-Hill Cos, Inc. | | 3,490,985 | |
306,500 | | L | | News Corp., Inc. | | 5,878,670 | |
100 | | | | Time Warner, Inc. | | 1,730 | |
38,995 | | @ | | Viacom, Inc. - Class B | | 1,397,581 | |
105,600 | | | | Walt Disney Co. | | 3,168,000 | |
330 | | | | Washington Post | | 257,403 | |
| | | | | | 18,030,059 | |
| | | | Metal Fabricate/Hardware: 0.1% | | | |
3,300 | | L | | AM Castle & Co. | | 106,425 | |
6,900 | | L | | Kaydon Corp. | | 257,439 | |
9,350 | | | | Precision Castparts Corp. | | 558,756 | |
2,636 | | L | | Quanex Corp. | | 113,533 | |
4,600 | | | | Valmont Industries, Inc. | | 213,854 | |
| | | | | | 1,250,007 | |
| | | | Mining: 0.1% | | | |
46,000 | | | | Alcoa, Inc. | | 1,488,560 | |
| | | | | | 1,488,560 | |
| | | | Miscellaneous Manufacturing: 2.2% | | | |
40,850 | | | | 3M Co. | | 3,299,455 | |
8,300 | | | | Acuity Brands, Inc. | | 322,953 | |
5,000 | | | | AO Smith Corp. | | 231,800 | |
6,872 | | | | Aptargroup, Inc. | | 340,920 | |
5,700 | | @,L | | Ceradyne, Inc. | | 282,093 | |
24,800 | | @ | | Cooper Industries Ltd. | | $ | 2,304,416 | |
13,400 | | | | Crane Co. | | 557,440 | |
5,900 | | @,L | | EnPro Industries, Inc. | | 198,240 | |
550,515 | | | | General Electric Co. | | 18,144,974 | |
10,800 | | | | Myers Industries, Inc. | | 185,652 | |
17,000 | | | | Roper Industries, Inc. | | 794,750 | |
10,267 | | | | Teleflex, Inc. | | 554,623 | |
| | | | | | 27,217,316 | |
| | | | Office Furnishings: 0.0% | | | |
18,002 | | | | Herman Miller, Inc. | | 463,912 | |
| | | | | | 463,912 | |
| | | | Oil & Gas: 5.9% | | | |
190,286 | | | | ChevronTexaco Corp. | | 11,809,149 | |
13,060 | | L | | Cimarex Energy Co. | | 561,580 | |
154,100 | | | | ConocoPhillips | | 10,098,173 | |
52,200 | | | | EOG Resources, Inc. | | 3,619,548 | |
406,240 | | | | ExxonMobil Corp. | | 24,922,824 | |
18,000 | | | | Frontier Oil Corp. | | 583,200 | |
11,300 | | | | Helmerich & Payne, Inc. | | 680,938 | |
58,300 | | | | Marathon Oil Corp. | | 4,856,390 | |
26,800 | | | | Noble Energy, Inc. | | 1,255,848 | |
56,200 | | L | | Occidental Petroleum Corp. | | 5,763,310 | |
13,600 | | | | Pogo Producing Co. | | 626,960 | |
6,400 | | @ | | Stone Energy Corp. | | 297,920 | |
34,900 | | | | Sunoco, Inc. | | 2,418,221 | |
7,350 | | @,L | | Swift Energy Co. | | 315,536 | |
8,100 | | @ | | Unit Corp. | | 460,809 | |
86,100 | | | | Valero Energy Corp. | | 5,727,372 | |
| | | | | | 73,997,778 | |
| | | | Oil & Gas Services: 1.0% | | | |
20,000 | | @,L | | Cameron International Corp. | | 955,400 | |
71,000 | | L | | Halliburton Co. | | 5,268,910 | |
5,500 | | @,L | | Helix Energy Solutions | | 221,980 | |
6,500 | | @ | | Lone Star Technologies | | 351,130 | |
2,600 | | @,L | | Maverick Tube Corp. | | 164,294 | |
58,360 | | L | | Schlumberger Ltd. | | 3,799,820 | |
4,500 | | @ | | Seacor Smit, Inc. | | 369,450 | |
13,800 | | L | | Tidewater, Inc. | | 678,960 | |
| | | | | | 11,809,944 | |
| | | | Packaging & Containers: 0.0% | | | |
6,800 | | L | | Sonoco Products Co. | | 215,220 | |
| | | | | | 215,220 | |
| | | | Pharmaceuticals: 2.7% | | | |
80,500 | | | | Abbott Laboratories | | 3,510,605 | |
11,900 | | | | Alpharma, Inc. | | 286,076 | |
56,500 | | L | | AmerisourceBergen Corp. | | 2,368,480 | |
12,400 | | @ | | Connetics Corp. | | 145,824 | |
38,900 | | @,L | | Express Scripts, Inc. | | 2,790,686 | |
41,300 | | @ | | Hospira, Inc. | | 1,773,422 | |
65,800 | | @ | | King Pharmaceuticals, Inc. | | 1,118,600 | |
254,000 | | | | Merck & Co., Inc. | | 9,253,220 | |
5,800 | | @ | | MGI Pharma, Inc. | | 124,700 | |
9,000 | | L | | Omnicare, Inc. | | 426,780 | |
383,590 | | | | Pfizer, Inc. | | 9,002,857 | |
10,900 | | @ | | Theragenics Corp. | | 37,169 | |
4,900 | | @ | | USANA Health Sciences, Inc. | | 185,710 | |
71,210 | | | | Wyeth | | 3,162,436 | |
| | | | | | 34,186,565 | |
See Accompanying Notes to Financial Statements
43
| | PORTFOLIO OF INVESTMENTS |
ING VP BALANCED PORTFOLIO | | AS OF JUNE 30, 2006 (UNAUDITED) (CONTINUED) |
|
Shares | | | | | | Value | |
| | | | Pipelines: 0.1% | | | |
21,250 | | L | | Questar Corp. | | $ | 1,710,413 | |
| | | | | | 1,710,413 | |
| | | | Real Estate Investment Trusts: 0.1% | | | |
7,450 | | | | Developers Diversified Realty Corp. | | 388,741 | |
1,680 | | | | Essex Property Trust, Inc. | | 187,589 | |
2,100 | | | | Kilroy Realty Corp. | | 151,725 | |
4,900 | | L | | Macerich Co. | | 343,980 | |
9,600 | | | | New Century Financial Corp. | | 439,200 | |
| | | | | | 1,511,235 | |
| | | | Retail: 6.0% | | | |
14,200 | | @,L | | 99 Cents Only Stores | | 148,532 | |
5,150 | | | | Abercrombie & Fitch Co. | | 285,465 | |
6,850 | | | | Advance Auto Parts | | 197,965 | |
15,300 | | @,L | | Aeropostale, Inc. | | 442,017 | |
21,670 | | | | American Eagle Outfitters | | 737,647 | |
14,200 | | @ | | AnnTaylor Stores Corp. | | 615,996 | |
12,090 | | | | Barnes & Noble, Inc. | | 441,285 | |
72,725 | | | | Best Buy Co., Inc. | | 3,988,239 | |
16,100 | | | | Brinker International, Inc. | | 584,430 | |
7,550 | | | | Brown Shoe Co., Inc. | | 257,304 | |
11,300 | | @,L | | Chico’s FAS, Inc. | | 304,874 | |
1,577 | | @ | | Childrens Place | | 94,699 | |
9,300 | | | | Christopher & Banks Corp. | | 269,700 | |
36,500 | | | | Circuit City Stores, Inc. | | 993,530 | |
20,860 | | | | Claire’s Stores, Inc. | | 532,139 | |
86,400 | | | | Costco Wholesale Corp. | | 4,936,032 | |
33,100 | | | | Darden Restaurants, Inc. | | 1,304,140 | |
21,400 | | @,L | | Dollar Tree Stores, Inc. | | 567,100 | |
10,900 | | @,L | | Dress Barn, Inc. | | 276,315 | |
9,600 | | | | Foot Locker, Inc. | | 235,104 | |
6,900 | | @ | | Genesco, Inc. | | 233,703 | |
4,900 | | L | | Group 1 Automotive, Inc. | | 276,066 | |
101,810 | | | | Home Depot, Inc. | | 3,643,780 | |
4,900 | | L | | IHOP Corp. | | 235,592 | |
7,900 | | @ | | Jack in the Box, Inc. | | 309,680 | |
50,150 | | | | JC Penney Co., Inc. | | 3,385,627 | |
5,300 | | L | | Landry’s Restaurants, Inc. | | 171,985 | |
92,000 | | | | Limited Brands | | 2,354,280 | |
39,400 | | | | Lowe’s Cos., Inc. | | 2,390,398 | |
167,100 | | | | McDonald’s Corp. | | 5,614,560 | |
3,700 | | L | | Men’s Wearhouse, Inc. | | 112,110 | |
7,840 | | | | Michaels Stores, Inc. | | 323,322 | |
58,100 | | L | | Nordstrom, Inc. | | 2,120,650 | |
19,700 | | @ | | O’Reilly Automotive, Inc. | | 614,443 | |
74,400 | | @,L | | Office Depot, Inc. | | 2,827,200 | |
2,180 | | @,L | | Panera Bread Co. | | 146,583 | |
6,734 | | @,L | | Papa John’s International, Inc. | | 223,569 | |
16,875 | | @,L | | Payless Shoesource, Inc. | | 458,494 | |
23,800 | | | | Ross Stores, Inc. | | 667,590 | |
21,000 | | @,L | | Sears Holding Corp. | | 3,251,640 | |
12,307 | | @,L | | Select Comfort Corp. | | 282,692 | |
5,760 | | @,L | | Sonic Corp. | | 119,750 | |
152,600 | | | | Staples, Inc. | | 3,711,232 | |
121,500 | | @,L | | Starbucks Corp. | | 4,587,840 | |
43,300 | | | | Target Corp. | | 2,116,071 | |
7,310 | | @,L | | Too, Inc. | | 280,631 | |
2,200 | | @ | | Tractor Supply Co. | | 121,594 | |
132,545 | | | | Wal-Mart Stores, Inc. | | 6,384,693 | |
142,100 | | | | Walgreen Co. | | 6,371,764 | |
28,000 | | L | | Wendy’s International, Inc. | | $ | 1,632,120 | |
6,700 | | L | | Williams-Sonoma, Inc. | | 228,135 | |
61,200 | | | | Yum! Brands, Inc. | | 3,076,524 | |
| | | | | | 75,486,831 | |
| | | | Savings & Loans: 0.1% | | | |
8,698 | | | | Bankunited Financial Corp. | | 265,463 | |
33,600 | | L | | First Niagara Financial Group, Inc. | | 471,072 | |
4,700 | | @,L | | FirstFed Financial Corp. | | 271,049 | |
23,100 | | | | Washington Federal, Inc. | | 535,689 | |
| | | | | | 1,543,273 | |
| | | | Semiconductors: 1.7% | | | |
125,400 | | @ | | Advanced Micro Devices, Inc. | | 3,062,268 | |
5,700 | | @ | | Diodes, Inc. | | 236,208 | |
12,000 | | @ | | Exar Corp. | | 159,240 | |
105,200 | | @,L | | Freescale Semiconductor, Inc. | | 3,092,880 | |
312,750 | | | | Intel Corp. | | 5,926,613 | |
22,700 | | @,L | | Lam Research Corp. | | 1,058,274 | |
96,700 | | @ | | LSI Logic Corp. | | 865,465 | |
27,900 | | @ | | MEMC Electronic Materials, Inc. | | 1,046,250 | |
15,210 | | @,L | | Microchip Technology, Inc. | | 510,296 | |
181,700 | | L | | Micron Technology, Inc. | | 2,736,402 | |
5,000 | | @ | | Microsemi Corp. | | 121,900 | |
91,200 | | | | National Semiconductor Corp. | | 2,175,120 | |
9,000 | | @ | | Pericom Semiconductor Corp. | | 74,700 | |
3,870 | | @,L | | Varian Semiconductor Equipment Associates, Inc. | | 126,201 | |
| | | | | | 21,191,817 | |
| | | | Software: 1.8% | | | |
5,216 | | @,L | | Advent Software, Inc. | | 188,141 | |
8,400 | | @ | | Altiris, Inc. | | 151,536 | |
7,800 | | @ | | Ansys, Inc. | | 372,996 | |
60,200 | | @ | | Autodesk, Inc. | | 2,074,492 | |
61,200 | | @,L | | BMC Software, Inc. | | 1,462,680 | |
4,760 | | @,L | | Cerner Corp. | | 176,644 | |
100,350 | | @,L | | Compuware Corp. | | 672,345 | |
16,200 | | @ | | CSG Systems International | | 400,788 | |
4,729 | | @ | | D&B Corp. | | 329,517 | |
10,660 | | | | Global Payments, Inc. | | 517,543 | |
12,472 | | @ | | Hyperion Solutions Corp. | | 344,227 | |
469,375 | | L | | Microsoft Corp. | | 10,936,438 | |
19,000 | | | | MoneyGram International, Inc. | | 645,050 | |
7,400 | | @,L | | MRO Software, Inc. | | 148,518 | |
199,000 | | @ | | Oracle Corp. | | 2,883,510 | |
8,900 | | @ | | Phoenix Technologies Ltd. | | 42,809 | |
5,973 | | @ | | SPSS, Inc. | | 191,972 | |
25,100 | | @,L | | Sybase, Inc. | | 486,940 | |
11,500 | | @ | | Transaction Systems Architects, Inc. | | 479,435 | |
| | | | | | 22,505,581 | |
| | | | Telecommunications: 3.5% | | | |
249,900 | | L | | AT&T, Inc. | | 6,969,711 | |
278,830 | | | | BellSouth Corp. | | 10,093,646 | |
605,860 | | @ | | Cisco Systems, Inc. | | 11,832,446 | |
2,925 | | L | | Commonwealth Telephone Enterprises, Inc. | | 96,993 | |
11,400 | | @ | | Ditech Communications Corp. | | 99,408 | |
| | | | | | | | | |
See Accompanying Notes to Financial Statements
44
| | PORTFOLIO OF INVESTMENTS |
ING VP BALANCED PORTFOLIO | | AS OF JUNE 30, 2006 (UNAUDITED) (CONTINUED) |
|
Shares | | | | | | Value | |
| | | | Telecommunications (continued) | | | |
58,700 | | @ | | Embarq Corp. | | $ | 2,406,113 | |
23,383 | | L | | Harris Corp. | | 970,628 | |
336,850 | | | | Motorola, Inc. | | 6,787,528 | |
89,500 | | | | Qualcomm, Inc. | | 3,586,265 | |
4,375 | | | | Telephone & Data Systems, Inc. | | 181,125 | |
4,500 | | @ | | Tollgrade Communications, Inc. | | 43,650 | |
| | | | | | 43,067,513 | |
| | | | Toys/Games/Hobbies: 0.0% | | | |
8,800 | | @,L | | Jakks Pacific, Inc. | | 176,792 | |
4,500 | | @ | | Lenox Group, Inc. | | 31,905 | |
| | | | | | 208,697 | |
| | | | Transportation: 1.0% | | | |
5,500 | | L | | Arkansas Best Corp. | | 276,155 | |
12,350 | | | | CH Robinson Worldwide, Inc. | | 658,255 | |
6,400 | | @ | | EGL, Inc. | | 321,280 | |
14,800 | | L | | Expeditors International Washington, Inc. | | 828,948 | |
14,033 | | | | Heartland Express, Inc. | | 251,050 | |
3,600 | | @ | | Kirby Corp. | | 142,200 | |
3,927 | | | | Landstar System, Inc. | | 185,472 | |
82,575 | | | | Norfolk Southern Corp. | | 4,394,633 | |
8,405 | | | | Overseas Shipholding Group | | 497,156 | |
59,000 | | | | United Parcel Service, Inc. | | 4,857,470 | |
| | | | | | 12,412,619 | |
| | | | Total Common Stock
(Cost $726,583,205) | | 758,350,436 | |
| | | | | | | |
PREFERRED STOCK: 0.6% | | | |
| | | | Banks: 0.2% | | | |
189 | | C | | DG Funding Trust | | 1,995,130 | |
| | | | | | 1,995,130 | |
| | | | Diversified Financial Services: 0.1% | | | |
53,175 | | C | | Merrill Lynch & Co., Inc. | | 1,317,145 | |
15,775 | | C | | National Rural Utilities Cooperative Finance Corp. | | 344,211 | |
| | | | | | 1,661,356 | |
| | | | Insurance: 0.2% | | | |
48,903 | | @@,C | | Aegon NV | | 1,146,286 | |
18,271 | | @@,C | | Aegon NV | | 461,343 | |
51,650 | | C | | Metlife, Inc. | | 1,272,140 | |
| | | | | | 2,879,769 | |
| | | | Real Estate Investment Trusts: 0.1% | | | |
43,041 | | C | | Duke Realty Corp. | | 1,056,657 | |
| | | | | | 1,056,657 | |
| | | | Total Preferred Stock
(Cost $7,840,176) | | 7,592,912 | |
| | | | | | | |
WARRANTS: 0.0% | | | |
| | | | Aerospace/Defense: 0.0% | | | |
2,978 | | | | Timco Aviation Services, 0.000%, due 12/31/07 | | — | |
| | | | Total Warrants
(Cost $0) | | — | |
| | | | | | | |
Principal
Amount | | | | | | Value | |
CONVERTIBLE BONDS: 0.1% | | | |
| | | | Biotechnology: 0.1% | | | |
$ | 215,000 | | C | | Millennium Pharmaceuticals, Inc., 5.500%, due 01/15/07 | | $ | 215,000 | |
| | | | | | 215,000 | |
| | | | Healthcare-Products: 0.0% | | | |
50,000 | | C | | St Jude Medical, Inc., 2.800%, due 12/15/35 | | 49,500 | |
| | | | | | 49,500 | |
| | | | Retail: 0.0% | | | |
40,000 | | | | Rite Aid Corp., 4.750%, due 12/01/06 | | 39,850 | |
| | | | | | 39,850 | |
| | | | Software: 0.0% | | | |
130,000 | | C | | BEA Systems, Inc., 4.000%, due 12/15/06 | | 129,188 | |
| | | | | | 129,188 | |
| | | | Total Convertible Bonds (Cost $434,944) | | 433,538 | |
| | | | | | | |
CORPORATE BONDS/NOTES: 9.1% | | | |
| | | | Airlines: 0.0% | | | |
184,956 | | C | | Continental Airlines, Inc., 8.312%, due 04/02/11 | | 175,423 | |
212,297 | | L | | United Airlines, Inc., 6.602%, due 09/01/13 | | 213,185 | |
| | | | | | 388,608 | |
| | | | Banks: 2.3% | | | |
1,475,000 | | | | American Express Centurion Bank, 5.460%, due 07/19/07 | | 1,477,128 | |
1,100,000 | | @@,C,L | | Australia & New Zealand Banking Group Ltd., 5.400%, due 10/29/49 | | 960,731 | |
289,000 | | @@,#,C | | Banco do Brasil Cayman, 7.950%, due 12/31/49 | | 267,325 | |
647,069 | | @@,# | | Banco Itau SA/Cayman Islands, 5.356%, due 09/20/08 | | 644,481 | |
703,000 | | @@ | | Banco Santander Chile SA, 7.375%, due 07/18/12 | | 752,810 | |
400,000 | | @@,C | | Bank of Ireland, 5.674%, due 12/29/49 | | 353,860 | |
440,000 | | @@,C | | Bank of Nova Scotia, 5.125%, due 08/21/85 | | 375,225 | |
210,000 | | @@ | | Bank of Scotland, 4.813%, due 11/30/49 | | 182,700 | |
66,000 | | C | | BankAmerica Capital II, 8.000%, due 12/15/26 | | 69,130 | |
270,000 | | @@,C | | Barclays Bank PLC, 5.798%, due 12/31/49 | | 241,631 | |
1,682,000 | | @@,C | | Barclays Bank PLC, 6.278%, due 12/15/49 | | 1,468,420 | |
770,000 | | @@,C | | BNP Paribas, 5.185%, due 09/29/49 | | 669,623 | |
350,000 | | C | | Chase Capital I, 7.670%, due 12/01/26 | | 365,153 | |
| | | | | | | | | | |
See Accompanying Notes to Financial Statements
45
| | PORTFOLIO OF INVESTMENTS |
ING VP BALANCED PORTFOLIO | | AS OF JUNE 30, 2006 (UNAUDITED) (CONTINUED) |
|
Principal
Amount | | | | | | Value | |
| | | | Banks (continued) | | | |
$ | 716,000 | | @@,#,C | | Chuo Mitsui Trust & Banking Co., Ltd., 5.506%, due 04/15/49 | | $ | 654,050 | |
377,000 | | @@,#,C | | Danske Bank A/S, 5.914%, due 12/29/49 | | 363,987 | |
570,000 | | @@,C | | Den Norske Bank ASA, 5.125%, due 08/29/49 | | 478,800 | |
80,000 | | @@,C | | Den Norske Creditbank, 5.500%, due 11/29/49 | | 72,025 | |
623,000 | | #,C | | Dresdner Funding Trust I, 8.151%, due 06/30/31 | | 696,348 | |
356,000 | | #,C | | First Chicago NBD Institutional Capital A, 7.950%, due 12/01/26 | | 371,657 | |
1,000 | | C | | Fleet Capital Trust II, 7.920%, due 12/11/26 | | 1,047 | |
1,468,000 | | @@,#,C | | HBOS PLC, 5.375%, due 11/29/49 | | 1,392,372 | |
1,160,000 | | @@,C | | HSBC Bank PLC, 5.663%, due 06/29/49 | | 983,100 | |
920,000 | | @@,L | | HSBC Bank PLC, 5.875%, due 06/29/49 | | 786,600 | |
910,000 | | @@,C | | Lloyds TSB Bank PLC, 5.080%, due 08/29/49 | | 791,872 | |
80,000 | | @@,C | | Lloyds TSB Bank PLC, 5.438%, due 11/29/49 | | 71,139 | |
23,000 | | C | | M&I Capital Trust A, 7.650%, due 12/01/26 | | 23,966 | |
648,000 | | C | | Mellon Capital I, 7.720%, due 12/01/26 | | 676,876 | |
545,000 | | @@,C | | Mizuho Financial Group Cayman Ltd., 8.375%, due 12/31/49 | | 571,555 | |
430,000 | | @@,C | | National Australia Bank Ltd., 5.400%, due 10/29/49 | | 374,499 | |
120,000 | | @@,C | | National Westminster Bank PLC, 5.375%, due 11/29/49 | | 102,313 | |
708,000 | | #,C | | Rabobank Capital Funding II, 5.260%, due 12/29/49 | | 665,297 | |
342,000 | | #,C | | Rabobank Capital Funding Trust, 5.254%, due 12/31/49 | | 313,907 | |
596,000 | | C | | RBS Capital Trust I, 5.512%, due 09/30/49 | | 556,540 | |
741,000 | | @@,#,C | | Resona Bank Ltd., 5.850%, due 09/29/49 | | 690,656 | |
1,750,000 | | @@,L,C | | Royal Bank of Scotland Group PLC, 5.750%, due 12/29/49 | | 1,523,751 | |
420,000 | | @@,C | | Societe Generale, 5.395%, due 11/29/49 | | 364,188 | |
1,980,000 | | @@,L,C | | Standard Chartered PLC, 5.550%, due 11/29/49 | | 1,668,150 | |
1,240,000 | | @@,L,C | | Standard Chartered PLC, 5.688%, due 07/29/49 | | 1,029,200 | |
200,000 | | @@,C | | Standard Chartered PLC, 5.730%, due 01/29/49 | | 166,000 | |
769,000 | | @@,C | | Sumitomo Mitsui Banking Corp., 8.150%, due 08/01/49 | | 796,736 | |
770,000 | | | | Suntrust Bank, 5.304%, due 09/14/07 | | 769,938 | |
$ | 1,548,000 | | C | | Wachovia Capital Trust III, 5.800%, due 12/31/49 | | $ | 1,503,699 | |
470,000 | | @@,C | | Westpac Banking Corp., 5.275%, due 09/30/49 | | 403,681 | |
415,000 | | @@,#,C | | Westpac Capital Trust IV, 5.256%, due 12/29/49 | | 386,218 | |
1,366,000 | | @@,#,C | | Woori Bank, 6.125%, due 05/03/16 | | 1,349,519 | |
| | | | | | 28,427,903 | |
| | | | Beverages: 0.1% | | | |
691,000 | | @@ | | Cia Brasileira de Bebidas, 8.750%, due 09/15/13 | | 764,419 | |
443,000 | | @@ | | Diageo Capital PLC, 5.590%, due 04/20/07 | | 443,425 | |
| | | | | | 1,207,844 | |
| | | | Chemicals: 0.2% | | | |
260,000 | | | | Stauffer Chemical, 6.020%, due 04/15/10 | | 208,299 | |
450,000 | | | | Stauffer Chemical, 6.360%, due 04/15/18 | | 217,395 | |
570,000 | | | | Stauffer Chemical, 8.620%, due 04/15/17 | | 293,225 | |
1,394,000 | | | | Union Carbide Corp., 7.750%, due 10/01/96 | | 1,397,308 | |
| | | | | | 2,116,227 | |
| | | | Commercial Services: 0.1% | | | |
1,700,000 | | C | | Tulane University of Louisiana, 5.970%, due 11/15/12 | | 1,708,500 | |
| | | | | | 1,708,500 | |
| | | | Diversified Financial Services: 2.7% | | | |
218,000 | | @@,#,I | | Alpine III, 5.720%, due 08/16/14 | | 218,484 | |
218,000 | | @@,#,I | | Alpine III, 6.120%, due 08/16/14 | | 218,630 | |
328,000 | | @@,#,I | | Alpine III, 7.920%, due 08/16/14 | | 329,797 | |
560,000 | | @@,#,I | | Alpine III, 11.170%, due 08/16/14 | | 575,035 | |
169,000 | | #,C | | Army Hawaii Family Housing Trust Certificates, 5.524%, due 06/15/50 | | 156,026 | |
125,000 | | #,C | | Army Hawaii Family Housing Trust Certificates, 5.624%, due 06/15/50 | | 115,679 | |
1,252,125 | | # | | Astoria Depositor Corp., 7.902%, due 05/01/21 | | 1,279,891 | |
2,289,000 | | # | | Astoria Depositor Corp., 8.144%, due 05/01/21 | | 2,400,944 | |
927,907 | | @@,# | | Brazilian Merchant Voucher Receivables Ltd., 5.911%, due 06/15/11 | | 916,309 | |
1,125,000 | | @@,#,C | | BTM Curacao Holdings NV, 4.760%, due 07/21/15 | | 1,080,848 | |
643,000 | | C | | Citigroup Capital II, 7.750%, due 12/01/36 | | 667,988 | |
1,131,000 | | #,C | | Corestates Capital Trust I, 8.000%, due 12/15/26 | | 1,182,217 | |
439,000 | | @@ | | Corp. Andina de Fomento CAF, 5.125%, due 05/05/15 | | 410,383 | |
1,480,000 | | | | Countrywide Financial Corp., 5.566%, due 12/19/07 | | 1,481,561 | |
See Accompanying Notes to Financial Statements
46
| | PORTFOLIO OF INVESTMENTS |
ING VP BALANCED PORTFOLIO | | AS OF JUNE 30, 2006 (UNAUDITED) (CONTINUED) |
|
Principal
Amount | | | | | | Value | |
| | | | Diversified Financial Services (continued) | | | |
$ | 1,480,000 | | | | Countrywide Financial Corp., 5.670%, due 04/11/07 | | $ | 1,481,555 | |
1,529,000 | | # | | Farmer Mac Guaranteed Notes Trust 2006-1, 4.875%, due 01/14/11 | | 1,487,807 | |
480,000 | | @@,C | | Financiere CSFB NV, 5.625%, due 03/29/49 | | 409,200 | |
694,000 | | C | | Fund American Cos., Inc., 5.875%, due 05/15/13 | | 666,813 | |
337,000 | | | | GMAC Mortgage Corp. Loan Trust, 8.000%, due 11/01/31 | | 862,462 | |
658,000 | | #,C | | HVB Funding Trust III, 9.000%, due 10/22/31 | | 797,191 | |
515,000 | | C | | JPM Capital Trust I, 7.540%, due 01/15/27 | | 535,275 | |
569,000 | | C | | JPM Capital Trust II, 7.950%, due 02/01/27 | | 596,647 | |
1,310,000 | | #,C | | Mangrove Bay Pass-Through Trust, 6.102%, due 07/15/33 | | 1,253,063 | |
749,000 | | @@,# | | Mantis Reef Ltd., 4.799%, due 11/03/09 | | 719,683 | |
2,240,000 | | | | Merrill Lynch & Co., Inc., 5.238%, due 08/24/07 | | 2,240,437 | |
485,000 | | @@,C | | Paribas, 5.563%, due 12/31/49 | | 427,676 | |
308,444 | | @@,C | | Petroleum Export Ltd., 4.623%, due 06/15/10 | | 301,794 | |
447,549 | | @@,#,C | | Petroleum Export Ltd./ Cayman SPV, 5.265%, due 06/15/11 | | 434,263 | |
1,208,457 | | @@,#,C | | PF Export Receivables Master Trust, 6.436%, due 06/01/15 | | 1,209,007 | |
1,842,678 | | # | | Piper Jaffray Equipment Trust Securities, 7.000%, due 09/10/13 | | 1,824,252 | |
361,000 | | #,C | | Southern Star Central Corp., 6.750%, due 03/01/16 | | 348,365 | |
600,000,000 | | @@ | | Takefuji Corp., 1.000%, due 03/01/34 | | 2,648,724 | |
4,397,577 | | # | | Toll Road Investment, 18.600%, due 02/15/45 | | 530,559 | |
430,000 | | #,C | | Twin Reefs Pass-Through Trust, 6.345%, due 12/10/49 | | 430,019 | |
807,000 | | @@,C | | UFJ Finance Aruba AEC, 8.750%, due 12/31/49 | | 851,192 | |
446,000 | | #,C | | Wachovia Capital Trust V, 7.965%, due 06/01/27 | | 469,509 | |
1,563,000 | | #,C | | ZFS Finance USA Trust I, 6.150%, due 12/15/65 | | 1,498,889 | |
1,799,000 | | @@,#,C | | ZFS Finance USA Trust I, 6.450%, due 12/15/65 | | 1,648,841 | |
| | | | | | 34,707,015 | |
| | | | Electric: 0.9% | | | |
943,110 | | C | | CE Generation, LLC, 7.416%, due 12/15/18 | | 967,379 | |
1,476,000 | | @@,L | | Empresa Nacional de Electricidad SA, 8.625%, due 08/01/15 | | 1,627,733 | |
$ | 685,000 | | C | | Entergy Gulf States, Inc., 5.120%, due 08/01/10 | | $ | 657,906 | |
907,000 | | C | | FirstEnergy Corp., 6.450%, due 11/15/11 | | 923,928 | |
1,071,000 | | C | | FirstEnergy Corp., 7.375%, due 11/15/31 | | 1,152,436 | |
677,250 | | #,C | | Juniper Generation, 6.790%, due 12/31/14 | | 644,814 | |
565,000 | | @@,+ | | Korea Electric Power Corp., 0.610%, due 04/01/96 | | 327,700 | |
558,000 | | #,C | | Nevada Power Co., 5.950%, due 03/15/16 | | 531,660 | |
736,000 | | C | | NorthWestern Corp., 5.875%, due 11/01/14 | | 724,752 | |
601,000 | | C | | Potomac Edison Co., 5.000%, due 11/01/06 | | 601,659 | |
321,000 | | # | | Power Contract Financing LLC, 6.256%, due 02/01/10 | | 321,170 | |
146,425 | | | | PPL Montana, LLC, 8.903%, due 07/02/20 | | 160,528 | |
1,133,000 | | #,C | | Sierra Pacific Power Co., 6.000%, due 05/15/16 | | 1,082,856 | |
194,000 | | C | | Sierra Pacific Power Co., 6.250%, due 04/15/12 | | 191,637 | |
1,015,000 | | C | | Southern Co. CAP Trust I, 8.190%, due 02/01/37 | | 1,065,542 | |
| | | | | | 10,981,700 | |
| | | | Energy-Alternate Sources: 0.1% | | | |
860,919 | | | | Salton SEA Funding, 7.840%, due 05/30/10 | | 886,829 | |
| | | | | | 886,829 | |
| | | | Food: 0.0% | | | |
221,000 | | C | | Delhaize America, Inc., 8.050%, due 04/15/27 | | 216,654 | |
282,000 | | C | | Delhaize America, Inc., 8.125%, due 04/15/11 | | 297,985 | |
| | | | | | 514,639 | |
| | | | Foreign Government Bonds: 0.2% | | | |
3,000,000 | | @@ | | Kaup Bank, 6.600%, due 12/28/15 | | 2,778,600 | |
| | | | | | 2,778,600 | |
| | | | Gas: 0.1% | | | |
993,000 | | #,C | | Southern Star Central Gas Pipeline, Inc., 6.000%, due 06/01/16 | | 969,416 | |
| | | | | | 969,416 | |
| | | | Home Builders: 0.1% | | | |
878,000 | | | | D.R. Horton, Inc., 5.625%, due 09/15/14 | | 805,902 | |
350,000 | | C | | K Hovnanian Enterprises, Inc., 6.250%, due 01/15/16 | | 305,375 | |
344,000 | | #,L,C | | Technical Olympic USA, Inc., 8.250%, due 04/01/11 | | 322,500 | |
| | | | | | 1,433,777 | |
| | | | Insurance: 0.3% | | | |
1,355,000 | | @@,L, C | | Aegon NV, 5.798%, due 12/31/49 | | 1,135,236 | |
842,000 | | L | | AON Capital Trust, 8.205%, due 01/01/27 | | 910,664 | |
See Accompanying Notes to Financial Statements
47
| | PORTFOLIO OF INVESTMENTS |
ING VP BALANCED PORTFOLIO | | AS OF JUNE 30, 2006 (UNAUDITED) (CONTINUED) |
|
Principal
Amount | | | | | | Value | |
| | | | Insurance (continued) | | | |
$ | 368,000 | | #,C | | North Front Pass - Thru, 5.810%, due 12/15/24 | | $ | 350,445 | |
1,189,000 | | #,C | | Zurich Capital Trust I, 8.376%, due 06/01/37 | | 1,257,192 | |
| | | | | | 3,653,537 | |
| | | | Leisure Time: 0.2% | | | |
1,387,000 | | @@ | | Royal Caribbean Cruises, 7.000%, due 06/15/13 | | 1,381,352 | |
1,028,000 | | @@ | | Royal Caribbean Cruises, 7.250%, due 06/15/16 | | 1,023,132 | |
| | | | | | 2,404,484 | |
| | | | Media: 0.2% | | | |
527,000 | | L, C | | Comcast Corp., 5.650%, due 06/15/35 | | 448,728 | |
466,000 | | #,C | | Viacom, Inc., 5.750%, due 04/30/11 | | 458,188 | |
1,150,000 | | #,C | | Viacom, Inc., 6.250%, due 04/30/16 | | 1,118,374 | |
| | | | | | 2,025,290 | |
| | | | Mining: 0.1% | | | |
689,000 | | C | | Southern Copper Corp., 7.500%, due 07/27/35 | | 661,254 | |
955,000 | | @@ | | Vale Overseas Ltd., 8.250%, due 01/17/34 | | 1,034,981 | |
| | | | | | 1,696,235 | |
| | | | Oil & Gas: 0.3% | | | |
729,000 | | C | | Amerada Hess Corp., 7.300%, due 08/15/31 | | 774,811 | |
459,000 | | @@,# | | Empresa Nacional de Petroleo ENAP, 4.875%, due 03/15/14 | | 420,380 | |
331,000 | | @@,# | | Empresa Nacional de Petroleo ENAP, 6.750%, due 11/15/12 | | 342,166 | |
359,000 | | @@,#,C | | Pemex Project Funding Master Trust, 6.625%, due 06/15/35 | | 325,344 | |
519,000 | | C,L | | Pemex Project Funding Master Trust, 6.625%, due 06/15/35 | | 470,344 | |
1,003,000 | | @@,# | | Pemex Project Funding Master Trust, 6.629%, due 06/15/10 | | 1,026,571 | |
817,000 | | @@,#,C | | Ras Laffan Liquefied Natural Gas Co., Ltd. II, 5.298%, due 09/30/20 | | 763,134 | |
| | | | | | 4,122,750 | |
| | | | Pharmaceuticals: 0.1% | | | |
718,000 | | C | | AmerisourceBergen Corp., 5.625%, due 09/15/12 | | 689,280 | |
192,000 | | #,C | | AmerisourceBergen Corp., 5.875%, due 09/15/15 | | 181,920 | |
| | | | | | 871,200 | |
| | | | Pipelines: 0.3% | | | |
2,075,000 | | #,C,I | | Cameron Highway Oil Pipeline, 5.860%, due 12/15/17 | | 1,969,175 | |
$ | 710,000 | | C | | Kinder Morgan Finance Co. ULC, 5.350%, due 01/05/11 | | $ | 654,786 | |
345,000 | | #,C | | Northwest Pipeline Corp., 7.000%, due 06/15/16 | | 344,569 | |
460,000 | | #,C | | Transcontinental Gas Pipe Line Corp., 6.400%, due 04/15/16 | | 442,750 | |
346,000 | | #,C | | Williams Partners LP/Williams Partners Finance Corp., 7.500%, due 06/15/11 | | 348,595 | |
| | | | | | 3,759,875 | |
| | | | Real Estate: 0.0% | | | |
618,000 | | C | | EOP Operating LP, 7.750%, due 11/15/07 | | 633,499 | |
| | | | | | 633,499 | |
| | | | Real Estate Investment Trusts: 0.2% | | | |
148,000 | | C | | Liberty Property LP, 6.375%, due 08/15/12 | | 150,796 | |
606,000 | | C | | Liberty Property LP, 7.750%, due 04/15/09 | | 633,406 | |
535,000 | | C | | Simon Property Group LP, 4.875%, due 03/18/10 | | 516,438 | |
818,000 | | C | | Simon Property Group LP, 6.375%, due 11/15/07 | | 821,669 | |
| | | | | | 2,122,309 | |
| | | | Retail: 0.1% | | | |
698,000 | | C | | May Department Stores Co., 3.950%, due 07/15/07 | | 684,522 | |
| | | | | | 684,522 | |
| | | | Savings & Loans: 0.0% | | | |
465,000 | | C | | Great Western Financial, 8.206%, due 02/01/27 | | 488,755 | |
| | | | | | 488,755 | |
| | | | Telecommunications: 0.4% | | | |
641,000 | | C | | AT&T Corp., 8.000%, due 11/15/31 | | 738,088 | |
1,279,000 | | @@,C | | Telefonica Emisones SAU, 6.421%, due 06/20/16 | | 1,278,669 | |
931,000 | | @@,C,L | | Telefonica Emisones SAU, 7.045%, due 06/20/36 | | 933,386 | |
1,808,000 | | C,L | | Verizon Global Funding Corp., 5.850%, due 09/15/35 | | 1,577,941 | |
| | | | | | 4,528,084 | |
| | | | Transportation: 0.1% | | | |
1,158,000 | | C | | BNSF Funding Trust I, 6.613%, due 12/15/55 | | 1,090,772 | |
| | | | | | 1,090,772 | |
| | | | Total Corporate Bonds/Notes
(Cost $117,366,375) | | 114,202,370 | |
| | | |
U.S. GOVERNMENT AGENCY OBLIGATIONS: 9.2% | | | |
| | | | Federal Home Loan Bank: 0.7% | | | |
3,420,000 | | | | 4.750%, due 08/17/07 | | 3,392,476 | |
1,770,000 | | C | | 5.100%, due 03/06/08 | | 1,759,192 | |
See Accompanying Notes to Financial Statements
48
| | PORTFOLIO OF INVESTMENTS |
ING VP BALANCED PORTFOLIO | | AS OF JUNE 30, 2006 (UNAUDITED) (CONTINUED) |
|
Principal
Amount | | | | | | Value | |
| | | | Federal Home Loan Bank (continued) | | | |
$ | 1,704,000 | | L | | 5.375%, due 07/18/11 | | $ | 1,697,426 | |
1,786,000 | | | | 5.625%, due 06/13/16 | | 1,767,324 | |
| | | | | | 8,616,418 | |
| | | | Federal Home Loan Mortgage Corporation: 3.9% | | | |
1,894,000 | | | | 4.000%, due 08/17/07 | | 1,863,448 | |
213,832 | | C | | 4.500%, due 12/15/16 | | 208,249 | |
2,072,000 | | C,S | | 4.500%, due 02/15/20 | | 1,863,615 | |
3,622,000 | | L | | 4.875%, due 02/17/09 | | 3,576,522 | |
2,358,308 | | C,S | | 5.000%, due 08/15/16 | | 2,287,233 | |
948,000 | | C | | 5.000%, due 05/15/20 | | 890,911 | |
2,543,428 | | C,S | | 5.000%, due 08/15/21 | | 2,489,346 | |
2,410,000 | | C,S | | 5.000%, due 04/15/23 | | 2,249,162 | |
388,625 | | | | 5.042%, due 04/01/35 | | 374,466 | |
1,813,000 | | | | 5.125%, due 04/18/08 | | 1,802,686 | |
26,000 | | C | | 5.150%, due 01/24/11 | | 25,535 | |
1,393,677 | | S | | 5.220%, due 06/01/35 | | 1,341,841 | |
2,184,000 | | | | 5.250%, due 04/18/16 | | 2,140,434 | |
3,598,000 | | C | | 5.500%, due 04/24/09 | | 3,583,032 | |
2,168,068 | | C,S | | 5.500%, due 11/15/18 | | 2,156,005 | |
4,173,553 | | C,S | | 5.500%, due 08/15/20 | | 3,864,700 | |
378 | | | | 5.500%, due 05/01/23 | | 368 | |
1,820,000 | | W | | 5.500%, due 07/15/34 | | 1,748,338 | |
2,535,000 | | C | | 5.750%, due 05/11/11 | | 2,525,466 | |
1,506,000 | | S | | 5.750%, due 06/27/16 | | 1,508,852 | |
1,428,000 | | | | 5.875%, due 03/21/11 | | 1,440,868 | |
8,358,987 | | C,S | | 6.000%, due 01/15/29 | | 8,353,298 | |
57,000 | | W | | 6.000%, due 07/15/34 | | 56,127 | |
1,464,000 | | W | | 6.000%, due 08/15/34 | | 1,440,210 | |
350,381 | | | | 6.500%, due 11/01/28 | | 354,283 | |
73,770 | | | | 6.500%, due 12/01/31 | | 74,511 | |
717,000 | | W | | 6.500%, due 08/15/34 | | 720,137 | |
| | | | | | 48,939,643 | |
| | | | Federal National Mortgage Association: 4.3% | | | |
3,814,000 | | | | 3.875%, due 07/15/08 | | 3,700,259 | |
1,137,000 | | L | | 4.250%, due 09/15/07 | | 1,120,731 | |
676,000 | | W | | 4.500%, due 07/15/19 | | 639,031 | |
137,000 | | W | | 4.500%, due 07/15/35 | | 124,156 | |
835,302 | | | | 4.605%, due 08/01/35 | | 807,353 | |
1,803,000 | | | | 4.750%, due 08/10/07 | | 1,788,652 | |
1,758,839 | | S | | 4.750%, due 12/25/42 | | 1,741,196 | |
2,183,677 | | S | | 4.802%, due 08/01/35 | | 2,109,940 | |
749,000 | | W | | 5.000%, due 08/15/19 | | 720,913 | |
781,000 | | W | | 5.000%, due 07/18/21 | | 752,201 | |
1,532,311 | | S | | 5.000%, due 02/25/29 | | 1,494,719 | |
4,628,000 | | W | | 5.000%, due 08/15/34 | | 4,324,288 | |
3,615,000 | | | | 5.250%, due 08/01/12 | | 3,536,612 | |
415,000 | | W | | 5.500%, due 07/15/19 | | 407,348 | |
1,591,518 | | S | | 5.500%, due 11/01/32 | | 1,536,059 | |
8,350,907 | | S | | 5.500%, due 11/01/33 | | 8,059,314 | |
2,141,000 | | W | | 5.500%, due 08/13/34 | | 2,055,360 | |
111,912 | | | | 6.000%, due 06/01/16 | | 112,353 | |
519,402 | | | | 6.000%, due 07/01/16 | | 521,448 | |
194,488 | | | | 6.000%, due 08/01/16 | | 195,254 | |
127,014 | | | | 6.000%, due 10/01/16 | | 127,514 | |
549,909 | | | | 6.000%, due 03/01/17 | | 552,183 | |
256,411 | | | | 6.000%, due 04/01/17 | | 257,472 | |
350,133 | | | | 6.000%, due 06/01/17 | | 351,580 | |
74,769 | | | | 6.000%, due 09/01/17 | | 75,078 | |
$ | 81,529 | | | | 6.000%, due 10/01/17 | | $ | 81,866 | |
348,823 | | | | 6.000%, due 11/01/17 | | 350,197 | |
388,781 | | | | 6.000%, due 12/01/17 | | 390,389 | |
320,681 | | | | 6.000%, due 12/01/18 | | 322,048 | |
720,000 | | W | | 6.000%, due 08/15/20 | | 722,025 | |
4,523,642 | | S | | 6.000%, due 07/25/29 | | 4,527,384 | |
2,474,854 | | S | | 6.000%, due 04/25/31 | | 2,487,979 | |
1,017,000 | | W | | 6.000%, due 07/15/34 | | 1,001,109 | |
2,674,421 | | S | | 6.500%, due 04/01/30 | | 2,702,478 | |
893,000 | | W | | 6.500%, due 07/15/33 | | 897,744 | |
129,659 | | | | 7.000%, due 06/01/29 | | 132,982 | |
830 | | | | 7.000%, due 08/01/29 | | 851 | |
7,005 | | | | 7.000%, due 10/01/29 | | 7,184 | |
196,438 | | | | 7.000%, due 11/01/29 | | 201,453 | |
101,432 | | | | 7.000%, due 01/01/30 | | 104,022 | |
167,759 | | | | 7.000%, due 03/01/30 | | 172,043 | |
92,481 | | | | 7.000%, due 01/01/31 | | 94,833 | |
1,375,030 | | S | | 7.000%, due 06/01/31 | | 1,410,176 | |
237,241 | | | | 7.000%, due 08/01/31 | | 243,153 | |
12,305 | | | | 7.000%, due 10/01/31 | | 12,611 | |
55,558 | | | | 7.000%, due 01/01/32 | | 56,943 | |
9,155 | | | | 7.000%, due 04/01/32 | | 9,382 | |
18,268 | | | | 7.000%, due 05/01/32 | | 18,720 | |
54,973 | | | | 7.000%, due 07/01/32 | | 56,335 | |
4,289 | | I | | 7.125%, due 07/01/27 | | 4,365 | |
28,336 | | I | | 7.180%, due 07/01/27 | | 28,999 | |
16,832 | | | | 7.500%, due 11/01/29 | | 17,456 | |
170,982 | | | | 7.500%, due 10/01/30 | | 177,195 | |
112,386 | | | | 7.500%, due 11/01/30 | | 116,469 | |
837,223 | | C | | 7.500%, due 01/25/48 | | 861,161 | |
| | | | | | 54,320,566 | |
| | | | Government National Mortgage Association: 0.3% | | | |
163,799 | | | | 4.375%, due 04/20/28 | | 164,034 | |
42,277 | | | | 5.125%, due 12/20/29 | | 42,007 | |
184,616 | | | | 6.500%, due 10/15/31 | | 187,233 | |
537,867 | | | | 7.000%, due 09/15/24 | | 554,907 | |
938,358 | | | | 7.000%, due 10/15/24 | | 968,164 | |
163,690 | | | | 7.000%, due 11/15/24 | | 168,870 | |
1,482,556 | | S | | 7.500%, due 12/15/23 | | 1,549,375 | |
| | | | | | 3,634,590 | |
| | | | Total U.S. Government Agency Obligations
(Cost $118,353,533) | | 115,511,217 | |
| | | |
U.S. TREASURY OBLIGATIONS: 3.0% | | | |
| | | | U.S. Treasury Inflation-Indexed Bond: 0.7% | | | |
3,600,000 | | L | | 2.000%, due 01/15/16 | | 3,491,362 | |
5,493,000 | | | | 2.375%, due 04/15/11 | | 5,556,130 | |
| | | | | | 9,047,492 | |
| | | | U.S. Treasury Bond: 1.6% | | | |
205,000 | | L | | 4.750%, due 03/31/11 | | 201,981 | |
9,098,000 | | L | | 5.125%, due 05/15/16 | | 9,090,185 | |
3,592,000 | | L | | 5.375%, due 02/15/31 | | 3,655,144 | |
3,277,000 | | L | | 6.000%, due 02/15/26 | | 3,550,682 | |
3,212,000 | | L | | 6.250%, due 08/15/23 | | 3,543,491 | |
| | | | | | 20,041,483 | |
See Accompanying Notes to Financial Statements
49
| | PORTFOLIO OF INVESTMENTS |
ING VP BALANCED PORTFOLIO | | AS OF JUNE 30, 2006 (UNAUDITED) (CONTINUED) |
|
Principal
Amount | | | | | | Value | |
| | | | U.S. Treasury Note: 0.7% | | | |
$ | 676,000 | | L | | 4.875%, due 04/30/08 | | $ | 672,541 | |
1,821,000 | | L | | 4.875%, due 05/15/09 | | 1,809,193 | |
2,831,000 | | | | 5.125%, due 06/30/08 | | 2,830,117 | |
3,376,000 | | | | 5.125%, due 06/30/11 | | 3,381,013 | |
43,000 | | | | 5.310%, due 05/15/16 | | 25,787 | |
| | | | | | 8,718,651 | |
| | | | Total U.S. Treasury Obligations
(Cost $38,321,517) | | 37,807,626 | |
| | | |
ASSET-BACKED SECURITIES: 1.7% | | | |
| | | |
| | | | Automobile Asset-Backed Securities: 0.3% | | | |
34,224 | | C | | Capital Auto Receivables Asset Trust, 2.750%, due 04/16/07 | | 34,154 | |
721,000 | | C | | Capital Auto Receivables Asset Trust, 5.030%, due 10/15/09 | | 714,768 | |
420,000 | | C | | Capital One Prime Auto Receivables Trust, 5.010%, due 11/15/11 | | 413,821 | |
11,000 | | C | | Carmax Auto Owner Trust, 4.210%, due 01/15/10 | | 10,815 | |
1,838 | | C | | Honda Auto Receivables Owner Trust, 2.790%, due 03/16/09 | | 1,807 | |
5,000 | | C | | Honda Auto Receivables Owner Trust, 3.820%, due 05/21/10 | | 4,840 | |
30,944 | | C | | Household Automotive Trust, 2.310%, due 04/17/08 | | 30,922 | |
1,110,770 | | S,C | | Nissan Auto Receivables Owner Trust, 2.050%, due 03/16/09 | | 1,089,121 | |
893,594 | | C | | Nissan Auto Receivables Owner Trust, 2.610%, due 07/15/08 | | 882,473 | |
9,000 | | C | | Nissan Auto Receivables Owner Trust, 4.190%, due 07/15/09 | | 8,849 | |
252,000 | | C | | Nissan Auto Receivables Owner Trust, 4.740%, due 09/15/09 | | 248,964 | |
23,003 | | C | | USAA Auto Owner Trust, 2.040%, due 02/16/10 | | 22,830 | |
253,000 | | C | | USAA Auto Owner Trust, 5.010%, due 09/15/10 | | 251,002 | |
| | | | | | 3,714,366 | |
| | | | Credit Card Asset-Backed Securities: 0.3% | | | |
12,000 | | C | | Bank One Issuance Trust, 4.540%, due 09/15/10 | | 11,786 | |
11,000 | | C | | Capital One Master Trust, 4.900%, due 03/15/10 | | 10,944 | |
285,000 | | C | | Citibank Credit Card Issuance Trust, 3.100%, due 03/10/10 | | 273,836 | |
$ | 1,222,000 | | C,S | | Citibank Credit Card Issuance Trust, 4.850%, due 02/10/11 | | $ | 1,201,109 | |
3,000 | | C | | Citibank Credit Card Master Trust I, 5.875%, due 03/10/11 | | 3,025 | |
414,000 | | C | | Citibank Credit Card Master Trust I, 6.050%, due 01/15/10 | | 417,706 | |
1,683,000 | | C,S | | MBNA Credit Card Master Note Trust, 4.900%, due 07/15/11 | | 1,659,708 | |
12,000 | | C | | MBNA Credit Card Master Note Trust, 4.950%, due 06/15/09 | | 11,983 | |
3,000 | | C | | MBNA Master Credit Card Trust USA, 5.900%, due 08/15/11 | | 3,033 | |
| | | | | | 3,593,130 | |
| | | | Home Equity Asset-Backed Securities: 0.6% | | | |
1,277,916 | | C | | Bayview Financial Acquisition Trust, 5.841%, due 09/28/43 | | 1,279,314 | |
64,881 | | C | | GMAC Mortgage Corp. Loan Trust, 5.553%, due 12/25/20 | | 64,932 | |
4,707,000 | | C,S | | GSAA Trust, 5.242%, due 06/25/34 | | 4,619,066 | |
308,224 | | C | | Merrill Lynch Mortgage Investors, Inc., 5.683%, due 07/25/34 | | 309,095 | |
1,000 | | +,C | | Renaissance Home Equity Loan Trust, 4.456%, due 05/25/35 | | 986 | |
796,000 | | +,C | | Renaissance Home Equity Loan Trust, 5.608%, due 05/25/36 | | 790,138 | |
| | | | | | 7,063,531 | |
| | | | Other Asset-Backed Securities: 0.5% | | | |
220,960 | | C | | Amortizing Residential Collateral Trust, 5.823%, due 05/25/32 | | 221,409 | |
79,000 | | C | | Caterpillar Financial Asset Trust, 5.590%, due 02/25/09 | | 78,997 | |
363 | | C | | Chase Funding Mortgage Loan, 2.734%, due 09/25/24 | | 361 | |
5,000 | | C | | Chase Funding Mortgage Loan, 4.045%, due 05/25/33 | | 4,904 | |
205,972 | | C | | Chase Funding Mortgage Loan, 5.623%, due 07/25/33 | | 206,607 | |
4,000 | | C | | Countrywide Asset-Backed Certificates, 4.493%, due 02/25/36 | | 3,931 | |
1,583,000 | | +,C,S | | Credit-Based Asset Servicing and Securitization, 5.501%, due 12/25/36 | | 1,570,548 | |
748,000 | | C | | Equity One ABS, Inc., 5.050%, due 09/25/33 | | 731,424 | |
See Accompanying Notes to Financial Statements
50
| | PORTFOLIO OF INVESTMENTS |
ING VP BALANCED PORTFOLIO | | AS OF JUNE 30, 2006 (UNAUDITED) (CONTINUED) |
|
Principal
Amount | | | | | | Value | |
| | | | Other Asset-Backed Securities (continued) | | | |
$ | 365,452 | | C | | Fannie Mae Grantor Trust, 5.463%, due 04/25/35 | | $ | 366,070 | |
719,000 | | +,C,S | | Merrill Lynch Mortgage Investors, Inc., 5.609%, due 03/25/37 | | 714,248 | |
8,000 | | C | | Popular ABS Mortgage Pass-Through Trust, 3.735%, due 12/25/34 | | 7,939 | |
8,000 | | C | | Popular ABS Mortgage Pass-Through Trust, 4.000%, due 12/25/34 | | 7,849 | |
3,000 | | C | | Popular ABS Mortgage Pass-Through Trust, 4.596%, due 11/25/35 | | 2,954 | |
164,552 | | C | | Residential Asset Mortgage Products, Inc., 5.633%, due 06/25/33 | | 164,873 | |
2,292,987 | | +,S | | Structured Asset Securities Corp., 6.000%, due 03/25/34 | | 2,286,426 | |
| | | | | | 6,368,540 | |
| | | | Total Asset-Backed Securities
(Cost $21,032,518) | | 20,739,567 | |
| | | |
COLLATERALIZED MORTGAGE OBLIGATIONS: 5.4% | | | |
| | | |
| | | | Commercial Mortgage-Backed Securities: 1.8% | | | |
60,000 | | C | | Banc of America Commercial Mortgage, Inc., 4.429%, due 11/10/39 | | 56,328 | |
10,000 | | C | | Banc of America Commercial Mortgage, Inc., 4.502%, due 07/10/42 | | 9,450 | |
10,000 | | C | | Banc of America Commercial Mortgage, Inc., 4.772%, due 07/11/43 | | 9,760 | |
10,000 | | C | | Banc of America Commercial Mortgage, Inc., 4.877%, due 11/10/42 | | 9,737 | |
10,000 | | C | | Banc of America Commercial Mortgage, Inc., 4.891%, due 07/10/45 | | 9,531 | |
160,000 | | C | | Banc of America Commercial Mortgage, Inc., 6.186%, due 06/11/35 | | 162,993 | |
7,000 | | C | | Bear Stearns Commercial Mortgage Securities, 3.880%, due 08/13/39 | | 6,689 | |
1,000 | | C | | Bear Stearns Commercial Mortgage Securities, 4.030%, due 02/13/46 | | 948 | |
1,427,000 | | C,S | | Bear Stearns Commercial Mortgage Securities, 4.170%, due 01/12/41 | | 1,377,820 | |
1,000 | | C | | Capco America Securitization Corp., 6.460%, due 10/15/30 | | 1,018 | |
2,060,000 | | C,S | | Chase Manhattan Bank-First Union National Bank, 7.439%, due 08/15/31 | | 2,153,442 | |
380,000 | | C | | Citigroup Commercial Mortgage Trust, 5.721%, due 03/15/49 | | 381,271 | |
$ | 15,000 | | C | | Commercial Mortgage Pass Through Certificates, 3.600%, due 03/10/39 | | $ | 14,302 | |
370,000 | | C | | Credit Suisse Mortgage Capital Certificates, 4.991%, due 06/15/38 | | 362,600 | |
1,167,597 | | C,S | | CS First Boston Mortgage Securities Corp., 3.727%, due 03/15/35 | | 1,109,880 | |
32,000 | | C | | CS First Boston Mortgage Securities Corp., 3.861%, due 03/15/36 | | 30,998 | |
10,000 | | C | | CS First Boston Mortgage Securities Corp., 4.321%, due 01/15/37 | | 9,420 | |
10,000 | | C | | CS First Boston Mortgage Securities Corp., 4.801%, due 03/15/36 | | 9,444 | |
8,000 | | C | | CS First Boston Mortgage Securities Corp., 7.544%, due 04/15/62 | | 8,552 | |
41,000 | | C | | DLJ Commercial Mortgage Corp., 6.240%, due 11/12/31 | | 41,447 | |
115,000 | | C | | DLJ Commercial Mortgage Corp., 7.300%, due 06/10/32 | | 119,433 | |
1,500,000 | | C,S | | First Union National Bank Commercial Mortgage, 6.663%, due 01/12/43 | | 1,552,339 | |
1,045,495 | | C | | GE Capital Commercial Mortgage Corp., 3.752%, due 07/10/39 | | 1,015,637 | |
1,000 | | C | | GE Capital Commercial Mortgage Corp., 4.865%, due 07/10/39 | | 960 | |
489,307 | | C | | GE Capital Commercial Mortgage Corp., 5.560%, due 06/10/38 | | 488,441 | |
300,000 | | C | | Greenwich Capital Commercial Funding Corp., 6.032%, due 11/10/11 | | 302,156 | |
15,000 | | C | | JP Morgan Chase Commercial Mortgage Securities Corp., 4.223%, due 01/15/42 | | 14,319 | |
1,000,000 | | C | | JP Morgan Chase Commercial Mortgage Securities Corp., 4.262%, due 08/12/40 | | 969,018 | |
528,612 | | C | | JP Morgan Chase Commercial Mortgage Securities Corp., 4.275%, due 01/12/37 | | 508,146 | |
180,000 | | C | | JP Morgan Chase Commercial Mortgage Securities Corp., 5.834%, due 04/15/45 | | 180,652 | |
360,000 | | C | | JP Morgan Chase Commercial Mortgage Securities Corp., 5.862%, due 04/15/45 | | 361,548 | |
See Accompanying Notes to Financial Statements
51
| | PORTFOLIO OF INVESTMENTS |
ING VP BALANCED PORTFOLIO | | AS OF JUNE 30, 2006 (UNAUDITED) (CONTINUED) |
|
Principal
Amount | | | | | | Value | |
| | | | Commercial Mortgage-Backed Securities (continued) | | | |
$ | 1,000 | | C | | LB-UBS Commercial Mortgage Trust, 4.567%, due 06/15/29 | | $ | 974 | |
10,000 | | C | | LB-UBS Commercial Mortgage Trust, 4.998%, due 04/15/30 | | 9,627 | |
370,000 | | C | | LB-UBS Commercial Mortgage Trust, 5.741%, due 06/15/32 | | 371,098 | |
3,150,000 | | C,S | | LB-UBS Commercial Mortgage Trust, 6.226%, due 03/15/26 | | 3,193,869 | |
3,000,000 | | C,S | | LB-UBS Commercial Mortgage Trust, 7.370%, due 08/15/26 | | 3,159,816 | |
375,000 | | C | | Merrill Lynch/Countrywide Commercial Mortgage Trust, 5.439%, due 02/12/39 | | 370,177 | |
360,000 | | C | | Morgan Stanley Capital I, 4.827%, due 06/12/47 | | 343,840 | |
2,117,163 | | C,S | | Mortgage Capital Funding, Inc., 6.663%, due 03/18/30 | | 2,134,650 | |
173,618 | | C | | Prudential Commercial Mortgage Trust, 3.669%, due 02/11/36 | | 163,820 | |
600,000 | | C | | Prudential Securities Secured Financing Corp., 6.649%, due 07/15/08 | | 610,459 | |
370,000 | | C | | Wachovia Bank Commercial Mortgage Trust, 5.726%, due 06/15/45 | | 369,986 | |
370,000 | | C | | Wachovia Bank Commercial Mortgage Trust, 5.935%, due 06/15/45 | | 371,749 | |
| | | | | | 22,378,344 | |
| | | | Whole Loan Collateral CMO: 3.4% | | | |
1,873,493 | | C,S | | Banc of America Funding Corp., 5.277%, due 09/20/35 | | 1,807,189 | |
2,920,822 | | C,S | | Banc of America Funding Corp., 5.750%, due 09/20/34 | | 2,811,986 | |
946,851 | | C | | Banc of America Mortgage Securities, 5.250%, due 11/25/19 | | 919,084 | |
2,097,363 | | C,S | | Banc of America Mortgage Securities, 5.500%, due 06/25/35 | | 2,074,476 | |
239,171 | | C | | Bank of America Alternative Loan Trust, 5.500%, due 11/25/35 | | 237,807 | |
181,014 | | C | | Bank of America Alternative Loan Trust, 6.500%, due 04/25/36 | | 180,305 | |
2,644,422 | | C,S | | Bank of America Alternative Loan Trust, 6.500%, due 05/25/36 | | 2,637,817 | |
380,828 | | C | | Bear Stearns Alt-A Trust, 5.643%, due 07/25/34 | | 381,462 | |
377,964 | | C | | Citigroup Mortgage Loan Trust, Inc., 5.443%, due 02/25/35 | | 378,312 | |
$ | 3,099,170 | | C,S | | Citigroup Mortgage Loan Trust, Inc., 6.000%, due 11/25/35 | | $ | 3,069,889 | |
29,479 | | C | | Countrywide Alternative Loan Trust, 5.408%, due 10/25/35 | | 28,577 | |
2,387,966 | | C,S | | Countrywide Alternative Loan Trust, 5.500%, due 02/25/25 | | 2,363,456 | |
315,081 | | C | | Countrywide Alternative Loan Trust, 5.623%, due 02/25/35 | | 315,398 | |
114,128 | | C | | Countrywide Alternative Loan Trust, 6.000%, due 05/25/36 | | 114,141 | |
1,232,757 | | C,S | | First Horizon Alternative Mortgage Securities, 5.500%, due 08/25/35 | | 1,196,958 | |
665,332 | | C | | First Horizon Asset Securities, Inc., 5.396%, due 10/25/35 | | 651,512 | |
1,739,849 | | C,S | | GMAC Mortgage Corp. Loan Trust, 4.598%, due 10/19/33 | | 1,675,433 | |
2,023,414 | | C,S | | GMAC Mortgage Corp. Loan Trust, 5.259%, due 03/18/35 | | 1,951,804 | |
621,411 | | # | | GSMPS Mortgage Loan Trust, 5.673%, due 01/25/35 | | 624,463 | |
576,632 | | C | | Harborview Mortgage Loan Trust, 5.720%, due 01/19/35 | | 579,052 | |
758,706 | | C | | Homebanc Mortgage Trust, 5.753%, due 08/25/29 | | 760,616 | |
359,533 | | | | JP Morgan Alternative Loan Trust, 5.518%, due 01/25/36 | | 355,575 | |
3,034,368 | | C,S | | MASTR Adjustable Rate Mortgages Trust, 5.366%, due 06/25/35 | | 2,908,269 | |
2,484,899 | | C,S | | MASTR Alternative Loans Trust, 5.500%, due 01/25/20 | | 2,452,367 | |
260,205 | | C | | MASTR Alternative Loans Trust, 6.500%, due 05/25/33 | | 260,947 | |
303,902 | | C | | MLCC Mortgage Investors, Inc., 5.643%, due 01/25/29 | | 304,347 | |
222,130 | | C | | MortgageIT Trust, 5.693%, due 11/25/35 | | 222,146 | |
274,420 | | C | | Sequoia Mortgage Trust, 5.648%, due 01/20/35 | | 274,924 | |
9,061 | | C | | Structured Adjustable Rate Mortgage Loan Trust, 5.633%, due 07/25/35 | | 9,106 | |
547,099 | | C | | Structured Asset Mortgage Investments, Inc., 5.610%, due 04/19/35 | | 548,210 | |
97,383 | | C | | Wamu Alternative Mortgage Pass-Through Certs, 5.252%, due 05/25/46 | | 97,227 | |
788,669 | | C | | Wamu Alternative Mortgage Pass-Through Certs, 5.750%, due 02/25/36 | | 781,597 | |
160,875 | | C | | Washington Mutual, Inc., 5.545%, due 06/25/44 | | 161,369 | |
See Accompanying Notes to Financial Statements
52
| | PORTFOLIO OF INVESTMENTS |
ING VP BALANCED PORTFOLIO | | AS OF JUNE 30, 2006 (UNAUDITED) (CONTINUED) |
|
Principal
Amount | | | | | | Value | |
| | | | Whole Loan Collateral CMO (continued) | | | |
$ | 448,612 | | C | | Washington Mutual, Inc., 5.573%, due 01/25/45 | | $ | 449,331 | |
1,808,554 | | C,S | | Washington Mutual, Inc., 5.627%, due 01/25/36 | | 1,753,742 | |
866,062 | | C | | Washington Mutual, Inc., 5.633%, due 01/25/45 | | 870,727 | |
1,972,523 | | C,S | | Washington Mutual, Inc., 6.000%, due 06/25/34 | | 1,928,759 | |
2,225,000 | | C,S | | Wells Fargo Mortgage Backed Securities Trust, 4.500%, due 08/25/18 | | 2,057,661 | |
2,773,147 | | C,S | | Wells Fargo Mortgage Backed Securities Trust, 5.387%, due 08/25/35 | | 2,684,368 | |
| | | | | | 42,880,409 | |
| | | | Whole Loan Collateral PAC: 0.1% | | | |
721,266 | | C | | MASTR Alternative Loans Trust, 8.500%, due 05/25/33 | | 731,333 | |
| | | | | | 731,333 | |
| | | | Whole Loan Collateral Support CMO: 0.1% | | | |
888,238 | | C | | Banc of America Mortgage Securities, 5.500%, due 11/25/33 | | 862,801 | |
| | | | | | 862,801 | |
| | | | Total Collateralized Mortgage Obligations
(Cost $68,876,946) | | 66,852,887 | |
| | | | | | | |
MUNICIPAL BONDS: 0.2% | | | |
| | | | | | | |
| | | | Municipal: 0.2% | | | |
220,000 | | C | | City of New York, 5.000%, due 04/01/35 | | 222,781 | |
730,000 | | C | | City of San Diego, 7.125%, due 06/01/32 | | 728,000 | |
1,725,000 | | C | | Michigan Tobacco Settlement Finance Authority, 7.309%, due 06/01/34 | | 1,719,859 | |
| | | | Total Municipal Bonds
(Cost $2,680,402) | | 2,670,640 | |
| | | | | | | |
OTHER BONDS: 0.1% | | | |
| | | | | | | |
| | | | Foreign Government Bonds: 0.0% | | | |
462,000 | | @@,L | | Mexico Government International Bond, 6.750%, due 09/27/34 | | 450,450 | |
| | | | Total Other Bonds
(Cost $496,314) | | 450,450 | |
| | | | Total Long-Term Investments
(Cost $1,101,985,930) | | 1,124,611,643 | |
| | | | | | | |
SHORT-TERM INVESTMENTS: 22.3% | | | |
| | | | | | | |
| | | | Commercial Paper: 1.2% | | | |
3,450,000 | | | | Cadbury Schweppes, 5.430%, due 07/03/06 | | 3,448,448 | |
| | | | Commercial Paper (continued) | | | |
$ | 11,500,000 | | | | Volkswagon of America, 5.430%, due 07/05/06 | | $ | 11,491,340 | |
| | | | Total Commercial Paper
(Cost $14,939,788) | | 14,939,788 | |
| | | | Repurchase Agreement: 9.9% | | | |
124,007,000 | | | | Morgan Stanley Repurchase Agreement dated, 06/30/06, 5.200%,
due 07/03/06, $124,060,736 to be received upon repurchase
(Collaterallized by $126,793,000 Federal Home Loan Bank,
1.000%, Market Value $126,501,208, due 07/05/06-07/28/06 | | 124,007,000 | |
| | | | Total Repurchase Agreement
(Cost $124,007,000) | | 124,007,000 | |
| | | | Securities Lending CollateralCC: 11.2% | | | |
140,144,328 | | | | The Bank of New York Institutional Cash Reserves Fund | | 140,144,328 | |
| | | | Total Securities Lending Collateral
(Cost $140,144,328) | | 140,144,328 | |
| | | | Total Short-Term Investments
(Cost $279,091,116) | | 279,091,116 | |
| | | | Total Investments In Securities
(Cost $1,381,077,046)* | | 112.2 | % | $ | 1,403,702,759 | |
| | | | Other Assets and Liabilities-Net | | (12.2 | ) | (152,820,379 | ) |
| | | | Net Assets | | 100.0 | % | $ | 1,250,882,380 | |
@ Non-income producing security
@@ Foreign Issuer
+ Step-up basis bonds. Interest rates shown reflect current coupon rates.
# Securities with purchases pursuant to Rule 144A, under the Securities Act of 1933 and may not be resold subject to that rule except to qualified institutional buyers. These securities have been determined to be liquid under the guidelines established by the Funds’ Board of Directors/Trustees.
C Bond may be called prior to maturity date.
cc Securities purchased with cash collateral for securities loaned.
W When-issued or delayed delivery security.
S Segregated securities for certain derivatives, when-issued or delayed delivery securities and forward currency exchange contracts.
I Illiquid security
L Loaned security, a portion or all of the security is on loan at June 30, 2006.
* Cost for federal income tax purposes is $1,393,828,882.
Net unrealized appreciation consists of:
| | | | Gross Unrealized Appreciation | | $ | 40,940,847 | |
| | | | Gross Unrealized Depreciation | | (31,066,970 | ) |
| | | | Net Unrealized Appreciation | | $ | 9,873,877 | |
See Accompanying Notes to Financial Statements
53
| | PORTFOLIO OF INVESTMENTS |
ING VP BALANCED PORTFOLIO | | AS OF JUNE 30, 2006 (UNAUDITED) (CONTINUED) |
|
Information concerning open future contracts at June 30, 2006 is shown below:
Long Contracts | | No. of
Contracts | | Notional
Market Value | | Expiration
Date | | Unrealized
Depreciation | |
U.S. 2 Year Note | | 260 | | $ | 52,723,128 | | 09/29/06 | | $ | (200,360 | ) |
U.S. 5 Year Note | | 216 | | 22,335,750 | | 09/29/06 | | (136,713 | ) |
| | | | | | | | $ | (337,073 | ) |
| | | | | | | | | |
Short Contracts | | No. of
Contracts | | Notional
Market Value | | Expiration
Date | | Unrealized
Appreciation | |
U.S. 20 Year Long Bond | | 40 | | $ | (4,266,250 | ) | 09/20/06 | | $ | 12,300 | |
U.S. 10 Year Note | | 143 | | (14,994,891 | ) | 09/20/06 | | 97,597 | |
| | | | | | | | $ | 109,897 | |
Information concerning the Interest Rate Swap Agreements outstanding for the ING VP Balanced Portfolio at June 30, 2006, is shown below:
| | Termination
Date | | Unrealized
Appreciation | |
Receive a floating rate based on 6-month USD-LIBOR plus 2.255% on $2,773,722 and pay a floating rate equal to 1.0% on ¥600,000,000. | | | | | |
Upon termination of the contract, receive $2,773,722 and pay ¥600,000,000.
Counterparty: UBS AG | | 03/01/34 | | $ | 173,711 | |
| | | | $ | 173,711 | |
Information concerning the credit default swap agreements outstanding for the ING VP Balanced Portfolio at June 30, 2006 is shown below:
Counterparty | | Reference
Entity/Obligation | | Buy/Sell
Protection | | (Pay)/Receive
Fixed Rate | | Expiration
Date | | Notional
Amount | | Unrealized
Appreciation/
(Depreciation) | |
Citibank N.A. | | Georgia Pacific 8.125% due 5/15/2011 | | Buy | | (3.55 | )% | | 12/20/10 | | $ | 263,000 | | $ | (10,849 | ) |
UBS AG | | CDX.NA.IG.6 | | Buy | | (0.40 | )% | | 6/20/11 | | $ | 10,157,000 | | (13,675 | ) |
Morgan Stanley | | CDX.NA.HY.6 | | Buy | | (3.45 | )% | | 6/20/11 | | $ | 1,025,000 | | 2,222 | |
Morgan Stanley | | CDX.NA.HY.6 | | Buy | | (3.45 | )% | | 6/20/11 | | $ | 1,025,000 | | (4,800 | ) |
UBS AG | | CDX.NA.HY.6 | | Buy | | (3.45 | )% | | 6/20/11 | | $ | 1,025,000 | | (18,083 | ) |
Morgan Stanley | | CDX.NA.HY.6 | | Buy | | (3.45 | )% | | 6/20/11 | | $ | 1,025,000 | | (4,061 | ) |
Citibank N.A. | | Windstream 8.125% due 8/1/2013 | | Buy | | (1.60 | )% | | 9/20/11 | | $ | 446,000 | | (2,449 | ) |
UBS AG | | Windstream 8.125% due 8/1/2013 | | Buy | | (1.63 | )% | | 9/20/11 | | $ | 512,500 | | (3,083 | ) |
| | | | | | | | | | | | $ | (54,778 | ) |
See Accompanying Notes to Financial Statements
54
| | PORTFOLIO OF INVESTMENTS |
ING VP GROWTH AND INCOME PORTFOLIO | | AS OF JUNE 30, 2006 (UNAUDITED) |
|
Industry Allocation
as of June 30, 2006
(as a percent of net assets)
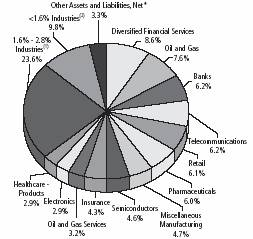
* Includes short-term investments related to repurchase agreement, commercial paper and securities lending collateral.
(1) Includes eleven industries, which each represents 1.6% - 2.8% of net assets.
(2) Includes ten industries, which each represents < 1.6% of net assets.
Portfolio holdings are subject to change daily.
Shares | | | | | | Value | |
COMMON STOCK: 96.7% | | | |
| | | | Advertising: 0.3% | | | |
95,600 | | L | | Omnicom Group | | $ | 8,517,004 | |
| | | | | | 8,517,004 | |
| | | | Aerospace/Defense: 2.4% | | | |
115,900 | | | | L-3 Communications Holdings, Inc. | | 8,741,178 | |
987,550 | | | | United Technologies Corp. | | 62,630,421 | |
| | | | | | 71,371,599 | |
| | | | Agriculture: 2.8% | | | |
1,138,750 | | L | | Altria Group, Inc. | | 83,618,413 | |
| | | | | | 83,618,413 | |
| | | | Apparel: 1.4% | | | |
531,700 | | | | Nike, Inc. | | 43,067,700 | |
| | | | | | 43,067,700 | |
| | | | Banks: 6.2% | | | |
1,808,650 | | | | Bank of America Corp. | | 86,996,065 | |
939,550 | | | | Bank of New York | | 30,253,510 | |
1,025,150 | | | | Wells Fargo & Co. | | 68,767,062 | |
| | | | | | 186,016,637 | |
| | | | Beverages: 0.6% | | | |
282,655 | | | | PepsiCo, Inc. | | 16,970,606 | |
| | | | | | 16,970,606 | |
| | | | Biotechnology: 2.6% | | | |
738,300 | | @,L | | Amgen, Inc. | | $ | 48,159,309 | |
479,400 | | @,L | | Genzyme Corp. | | 29,267,370 | |
| | | | | | 77,426,679 | |
| | | | Chemicals: 1.4% | | | |
282,000 | | | | Air Products & Chemicals, Inc. | | 18,025,440 | |
1,181,200 | | L | | Celanese Corp. | | 24,120,104 | |
| | | | | | 42,145,544 | |
| | | | Computers: 2.3% | | | |
3,484,700 | | | | EMC Corp. | | 38,227,159 | |
1,424,300 | | @,L | | Seagate Technology, Inc. | | 32,246,152 | |
| | | | | | 70,473,311 | |
| | | | Cosmetics/Personal Care: 2.5% | | | |
1,364,997 | | | | Procter & Gamble Co. | | 75,893,833 | |
| | | | | | 75,893,833 | |
| | | | Distribution/Wholesale: 1.0% | | | |
436,350 | | @,L | | Wesco International, Inc. | | 30,108,150 | |
| | | | | | 30,108,150 | |
| | | | Diversified Financial Services: 8.6% | | | |
460,850 | | L | | Capital One Financial Corp. | | 39,379,633 | |
1,804,300 | | | | Citigroup, Inc. | | 87,039,432 | |
1,218,106 | | L | | Countrywide Financial Corp. | | 46,385,476 | |
308,350 | | | | Franklin Resources, Inc. | | 26,767,864 | |
52,700 | | | | Goldman Sachs Group, Inc. | | 7,927,661 | |
362,700 | | L | | Merrill Lynch & Co., Inc. | | 25,229,412 | |
408,200 | | | | Morgan Stanley | | 25,802,322 | |
| | | | | | 258,531,800 | |
| | | | Electric: 2.1% | | | |
249,600 | | L | | Exelon Corp. | | 14,184,768 | |
1,453,477 | | @,L | | Mirant Corp. | | 38,953,184 | |
141,900 | | | | Public Service Enterprise Group, Inc. | | 9,382,428 | |
| | | | | | 62,520,380 | |
| | | | Electronics: 2.9% | | | |
2,975,200 | | @,@@,L | | Flextronics International Ltd. | | 31,596,624 | |
607,000 | | | | Jabil Circuit, Inc. | | 15,539,200 | |
2,420,400 | | | | Symbol Technologies, Inc. | | 26,116,116 | |
300,000 | | @ | | Thomas & Betts Corp. | | 15,390,000 | |
| | | | | | 88,641,940 | |
| | | | Energy-Alternate Sources: 0.5% | | | |
946,300 | | @,L | | KFX, Inc. | | 14,459,464 | |
| | | | | | 14,459,464 | |
| | | | Engineering & Construction: 1.3% | | | |
3,045,250 | | @@ | | ABB Ltd. ADR | | 39,466,440 | |
| | | | | | 39,466,440 | |
| | | | Food: 1.1% | | | |
597,900 | | L | | Hershey Foods Corp. | | 32,926,353 | |
| | | | | | 32,926,353 | |
| | | | Healthcare-Products: 2.9% | | | |
500,300 | | | | Baxter International, Inc. | | 18,391,028 | |
1,157,500 | | | | Johnson & Johnson | | 69,357,400 | |
| | | | | | 87,748,428 | |
See Accompanying Notes to Financial Statements
55
| | PORTFOLIO OF INVESTMENTS |
ING VP GROWTH AND INCOME PORTFOLIO | | AS OF JUNE 30, 2006 (UNAUDITED) (CONTINUED) |
|
Shares | | | | | | Value | |
| | | | Healthcare-Services: 1.9% | | | |
600,500 | | @ | | Health Net, Inc. | | $ | 27,124,585 | |
738,550 | | @,L | | Triad Hospitals, Inc. | | 29,231,809 | |
| | | | | | 56,356,394 | |
| | | | Insurance: 4.3% | | | |
476,100 | | @@ | | ACE Ltd. | | 24,085,899 | |
427,700 | | | | American International Group, Inc. | | 25,255,685 | |
1,026,150 | | @@ | | Axis Capital Holdings Ltd. | | 29,358,152 | |
458,900 | | | | Genworth Financial, Inc. | | 15,988,076 | |
235,000 | | | | Metlife, Inc. | | 12,034,350 | |
487,650 | | | | St. Paul Cos. | | 21,739,437 | |
| | | | | | 128,461,599 | |
| | | | Internet: 1.2% | | | |
1,099,500 | | @,L | | Yahoo!, Inc. | | 36,283,500 | |
| | | | | | 36,283,500 | |
| | | | Investment Companies: 1.6% | | | |
2,207,600 | | @ | | KKR Private Equity Investors LP | | 48,346,440 | |
| | | | | | 48,346,440 | |
| | | | Iron/Steel: 1.0% | | | |
419,900 | | L | | Allegheny Technologies, Inc. | | 29,073,876 | |
| | | | | | 29,073,876 | |
| | | | Lodging: 2.1% | | | |
555,600 | | L | | Harrah’s Entertainment, Inc. | | 39,547,608 | |
791,973 | | L | | Hilton Hotels Corp. | | 22,396,996 | |
| | | | | | 61,944,604 | |
| | | | Media: 1.6% | | | |
1,998,350 | | L | | Time Warner, Inc. | | 34,571,455 | |
369,807 | | @,L | | Viacom, Inc.-Class B | | 13,253,883 | |
| | | | | | 47,825,338 | |
| | | | Miscellaneous Manufacturing: 4.7% | | | |
438,100 | | @ | | Cooper Industries Ltd. | | 40,708,252 | |
2,344,326 | | | | General Electric Co. | | 77,268,985 | |
512,200 | | | | Roper Industries, Inc. | | 23,945,350 | |
| | | | | | 141,922,587 | |
| | | | Oil & Gas: 7.6% | | | |
416,100 | | | | ChevronTexaco Corp. | | 25,823,166 | |
1,818,900 | | | | ExxonMobil Corp. | | 111,589,512 | |
426,700 | | @,L | | Newfield Exploration Co. | | 20,882,698 | |
738,100 | | @,L | | Plains Exploration & Production Co. | | 29,922,574 | |
575,600 | | L | | Rowan Cos., Inc. | | 20,485,604 | |
591,400 | | @,L | | Southwestern Energy Co. | | 18,428,024 | |
| | | | | | 227,131,578 | |
| | | | Oil & Gas Services: 3.2% | | | |
369,500 | | @,L | | Dresser-Rand Group, Inc. | | 8,675,860 | |
775,400 | | | | Schlumberger Ltd. | | 50,486,294 | |
741,000 | | @,L | | Weatherford International Ltd. | | 36,768,420 | |
| | | | | | 95,930,574 | |
| | | | Pharmaceuticals: 6.0% | | | |
590,050 | | | | Abbott Laboratories | | 25,732,081 | |
161,399 | | @ | | Gilead Sciences, Inc. | | 9,548,365 | |
960,900 | | @,L | | Medco Health Solutions, Inc. | | 55,040,352 | |
2,445,224 | | | | Pfizer, Inc. | | $ | 57,389,407 | |
649,200 | | @@,L | | Teva Pharmaceutical Industries Ltd. ADR | | 20,508,228 | |
261,600 | | | | Wyeth | | 11,617,656 | |
| | | | | | 179,836,089 | |
| | | | Retail: 6.1% | | | |
354,150 | | | | Abercrombie & Fitch Co. | | 19,630,535 | |
1,607,100 | | | | CVS Corp. | | 49,337,970 | |
183,800 | | | | Home Depot, Inc. | | 6,578,202 | |
1,275,600 | | L | | Staples, Inc. | | 31,022,592 | |
475,000 | | | | Target Corp. | | 23,213,250 | |
1,734,200 | | @,L | | Urban Outfitters, Inc. | | 30,331,158 | |
459,400 | | L | | Wal-Mart Stores, Inc. | | 22,129,298 | |
| | | | | | 182,243,005 | |
| | | | Semiconductors: 4.6% | | | |
2,260,500 | | | | Intel Corp. | | 42,836,475 | |
763,300 | | @,@@,L | | Marvell Technology Group Ltd. | | 33,837,089 | |
922,800 | | L | | Maxim Integrated Products | | 29,631,108 | |
3,542,986 | | @@ | | Taiwan Semiconductor Manufacturing Co., Ltd. ADR | | 32,524,611 | |
| | | | | | 138,829,283 | |
| | | | Software: 1.7% | | | |
2,264,300 | | | | Microsoft Corp. | | 52,758,190 | |
| | | | | | 52,758,190 | |
| | | | Telecommunications: 6.2% | | | |
737,150 | | @,L | | Arris Group, Inc. | | 9,671,408 | |
3,260,250 | | L | | AT&T, Inc. | | 90,928,373 | |
2,245,087 | | @ | | Cisco Systems, Inc. | | 43,846,549 | |
334,150 | | @,L | | Corning, Inc. | | 8,083,089 | |
316,000 | | | | Qualcomm, Inc. | | 12,662,120 | |
674,700 | | | | Verizon Communications, Inc. | | 22,595,703 | |
| | | | | | 187,787,242 | |
| | | | Total Common Stock
(Cost $2,668,286,772) | | 2,904,634,580 | |
Principal
Amount | | | | | | Value | |
SHORT-TERM INVESTMENTS: 11.7% | | | |
| | | |
| | Commercial Paper: 0.5% | | | | | |
$ | 14,990,917 | | Volkswagon, 5.450%, due 07/05/06 | | | | 14,988,646 | |
| | Total Commercial Paper
(Cost $14,988,646) | | | | 14,988,646 | |
| | Repurchase Agreement: 1.1% | | | | | |
32,841,000 | | Goldman Sachs Repurchase Agreement dated 06/30/06, 5.230%, due 07/03/06, $32,855,313 to be received upon repurchase (Collateralized by $33,599,000, Federal Home Loan Bank, Discount Note, Market Value $33,498,203, due 07/21/06) | | | | 32,841,000 | |
| | Total Repurchase Agreement
(Cost $32,841,000) | | | | 32,841,000 | |
| | | | | | | | |
See Accompanying Notes to Financial Statements
56
| | PORTFOLIO OF INVESTMENTS |
ING VP GROWTH AND INCOME PORTFOLIO | | AS OF JUNE 30, 2006 (UNAUDITED) (CONTINUED) |
|
Principal
Amount | | | | | | Value | |
| | Securities Lending CollateralCC: 10.1% | | | | | |
$ | 302,518,757 | | The Bank of New York Institutional Cash Reserves Fund | | | | $ | 302,518,757 | |
| | Total Securities Lending Collateral
(Cost $302,518,757) | | | | 302,518,757 | |
| | Total Short-Term Investments
(Cost $350,348,403) | | | | 350,348,403 | |
| | Total Investments In Securities
(Cost $3,018,635,175)* | | 108.4 | % | $ | 3,254,982,983 | |
| | Other Assets and Liabilities-Net | | (8.4 | ) | (251,657,524 | ) |
| | Net Assets | | 100.0 | % | $ | 3,003,325,459 | |
| | | | | | | | | |
@ Non-income producing security
@@ Foreign Issuer
ADR American Depositary Receipt
cc Securities purchased with cash collateral for securities loaned.
L Loaned security, a portion or all of the security is on loan at June 30, 2006.
* Cost for federal income tax purposes is $3,040,918,416.
Net unrealized appreciation consists of:
Gross Unrealized Appreciation | | $ | 300,840,453 | |
Gross Unrealized Depreciation | | (86,775,886 | ) |
Net Unrealized Appreciation | | $ | 214,064,567 | |
Information concerning open futures contracts at June 30, 2006 is shown below:
Long Contracts | | No. of
Contracts | | Notional
Market Value | | Expiration
Date | | Unrealized
Gain (Loss) | |
S&P 500 Future | | 79 | | $25,268,150 | | 09/14/06 | | | $239,939 | | |
| | | | | | | | | | | |
See Accompanying Notes to Financial Statements
57
| | PORTFOLIO OF INVESTMENTS |
ING VP GROWTH PORTFOLIO | | AS OF JUNE 30, 2006 (UNAUDITED) |
|
Industry Allocation
as of June 30, 2006
(as a percent of net assets)
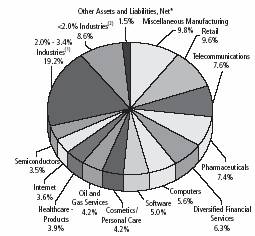
* Includes short-term investments related to securities lending collateral and repurchase agreement.
(1) Includes seven industries, which each represents 2.0% - 3.4% of net assets.
(2) Includes six industries, which each represents < 2.0% of net assets.
Portfolio holdings are subject to change daily
Shares | | | | | | Value | |
COMMON STOCK: 98.5% | | | |
| | | | Aerospace/Defense: 3.4% | | | |
62,000 | | | | Boeing Co. | | $ | 5,078,420 | |
20,500 | | L | | Lockheed Martin Corp. | | 1,470,670 | |
| | | | | | 6,549,090 | |
| | | | Agriculture: 2.5% | | | |
57,220 | | | | Monsanto Co. | | 4,817,352 | |
| | | | | | 4,817,352 | |
| | | | Apparel: 2.0% | | | |
130,200 | | @ | | Coach, Inc. | | 3,892,980 | |
| | | | | | 3,892,980 | |
| | | | Beverages: 3.0% | | | |
97,600 | | | | PepsiCo, Inc. | | 5,859,904 | |
| | | | | | 5,859,904 | |
| | | | Biotechnology: 2.0% | | | |
37,300 | | @ | | Amgen, Inc. | | 2,433,079 | |
18,300 | | | | Genentech, Inc. | | 1,509,856 | |
| | | | | | 3,942,935 | |
| | | | Computers: 5.6% | | | |
122,200 | | | | Hewlett-Packard Co. | | 3,871,296 | |
62,000 | | | | International Business Machines Corp. | | 4,762,840 | |
45,400 | | @,L | | Sandisk Corp. | | 2,314,492 | |
| | | | | | 10,948,628 | |
| | | | Cosmetics/Personal Care: 4.2% | | | |
146,265 | | | | Procter & Gamble Co. | | 8,132,334 | |
| | | | | | 8,132,334 | |
| | | | Diversified Financial Services: 6.3% | | | |
75,600 | | | | American Express Co. | | $ | 4,023,432 | |
15,000 | | | | Goldman Sachs Group, Inc. | | 2,256,450 | |
27,900 | | | | Legg Mason, Inc. | | 2,776,608 | |
45,100 | | | | Merrill Lynch & Co., Inc. | | 3,137,156 | |
| | | | | | 12,193,646 | |
| | | | Entertainment: 1.9% | | | |
95,100 | | | | International Game Technology | | 3,608,094 | |
| | | | | | 3,608,094 | |
| | | | Healthcare-Products: 3.9% | | | |
68,000 | | | | Baxter International, Inc. | | 2,499,680 | |
27,700 | | | | CR Bard, Inc. | | 2,029,302 | |
57,900 | | @ | | Gen-Probe, Inc. | | 3,125,442 | |
| | | | | | 7,654,424 | |
| | | | Healthcare-Services: 3.3% | | | |
30,270 | | @ | | Coventry Health Care, Inc. | | 1,663,034 | |
26,000 | | @ | | Laboratory Corp. of America Holdings | | 1,617,980 | |
42,500 | | @ | | WellPoint, Inc. | | 3,092,725 | |
| | | | | | 6,373,739 | |
| | | | Insurance: 3.0% | | | |
33,500 | | | | Hartford Financial Services Group, Inc. | | 2,834,100 | |
39,700 | | L | | Prudential Financial, Inc. | | 3,084,690 | |
| | | | | | 5,918,790 | |
| | | | Internet: 3.6% | | | |
10,800 | | @ | | Google, Inc. | | 4,528,764 | |
77,000 | | @,L | | Yahoo!, Inc. | | 2,541,000 | |
| | | | | | 7,069,764 | |
| | | | Lodging: 1.2% | | | |
32,900 | | L | | Harrah’s Entertainment, Inc. | | 2,341,822 | |
| | | | | | 2,341,822 | |
| | | | Machinery-Diversified: 1.0% | | | |
27,300 | | | | Rockwell Automation, Inc. | | 1,965,873 | |
| | | | | | 1,965,873 | |
| | | | Media: 1.3% | | | |
52,000 | | | | McGraw-Hill Cos., Inc. | | 2,611,960 | |
| | | | | | 2,611,960 | |
| | | | Miscellaneous Manufacturing: 9.8% | | | |
45,100 | | @ | | Cooper Industries Ltd. | | 4,190,692 | |
56,794 | | | | Danaher Corp. | | 3,652,990 | |
281,860 | | | | General Electric Co. | | 9,290,105 | |
43,400 | | | | Roper Industries, Inc. | | 2,028,950 | |
| | | | | | 19,162,737 | |
| | | | Oil & Gas: 1.7% | | | |
40,452 | | @ | | Transocean, Inc. | | 3,249,105 | |
| | | | | | 3,249,105 | |
| | | | Oil & Gas Services: 4.2% | | | |
22,800 | | L | | Halliburton Co. | | 1,691,988 | |
70,700 | | | | Schlumberger Ltd. | | 4,603,277 | |
39,100 | | @ | | Weatherford International Ltd. | | 1,940,142 | |
| | | | | | 8,235,407 | |
See Accompanying Notes to Financial Statements
58
| | PORTFOLIO OF INVESTMENTS |
ING VP GROWTH PORTFOLIO | | AS OF JUNE 30, 2006 (UNAUDITED) (CONTINUED) |
|
Shares | | | | | | Value | |
| | | | Pharmaceuticals: 7.4% | | | |
112,300 | | @,L | | Gilead Sciences, Inc. | | $ | 6,643,668 | |
63,300 | | @ | | Hospira, Inc. | | 2,718,102 | |
86,800 | | @ | | Medco Health Solutions, Inc. | | 4,971,904 | |
| | | | | | 14,333,674 | |
| | | | Retail: 9.6% | | | |
49,800 | | | | Abercrombie & Fitch Co. | | 2,760,414 | |
130,100 | | | | CVS Corp. | | 3,994,070 | |
78,000 | | @ | | Office Depot, Inc. | | 2,964,000 | |
132,900 | | @,L | | Starbucks Corp. | | 5,018,304 | |
83,500 | | | | Wal-Mart Stores, Inc. | | 4,022,195 | |
| | | | | | 18,758,983 | |
| | | | Semiconductors: 3.5% | | | |
102,600 | | @,@@,L | | ASML Holding NV | | 2,074,572 | |
44,700 | | @,@@ | | Marvell Technology Group Ltd. | | 1,981,551 | |
114,100 | | | | National Semiconductor Corp. | | 2,721,285 | |
| | | | | | 6,777,408 | |
| | | | Software: 5.0% | | | |
83,600 | | @,L | | Adobe Systems, Inc. | | 2,538,096 | |
54,500 | | @,L | | Autodesk, Inc. | | 1,878,070 | |
76,900 | | @ | | Citrix Systems, Inc. | | 3,086,766 | |
38,500 | | @ | | Intuit, Inc. | | 2,325,015 | |
| | | | | | 9,827,947 | |
| | | | Telecommunications: 7.6% | | | |
463,000 | | @ | | Cisco Systems, Inc. | | 9,042,390 | |
43,700 | | @,L | | NII Holdings, Inc. | | 2,463,806 | |
46,400 | | | | Qualcomm, Inc. | | 1,859,248 | |
103,900 | | @ | | Tellabs, Inc. | | 1,382,909 | |
| | | | | | 14,748,353 | |
| | | | Transportation: 1.5% | | | |
55,000 | | | | Norfolk Southern Corp. | | 2,927,100 | |
| | | | | | 2,927,100 | |
| | | | Total Common Stock
(Cost $187,092,836) | | 191,902,049 | |
| | | | | | | | |
Principal
Amount | | | | | | Value | |
| | | | | | | |
SHORT-TERM INVESTMENTS: 12.8% | | | | | |
| | | | | |
| | Repurchase Agreement: 2.9% | | | | | |
$ | 5,648,000 | | Morgan Stanley Repurchase Agreement dated 06/30/06, 5.200%, due 07/03/06, $5,650,447 to be received upon repurchase (Collateralized by $5,785,000 Federal Home Loan Bank Discount Note, Market Value $5,761,860 due 07/28/06) | | | | 5,648,000 | |
| | Total Repurchase Agreement
(Cost $5,648,000) | | | | 5,648,000 | |
| | Securities Lending CollateralCC: 9.9% | | | | | |
$ | 19,246,134 | | The Bank of New York Institutional Cash Reserve Fund | | | | $ | 19,246,134 | |
| | Total Securities Lending Collateral
(Cost $19,246,134) | | | | 19,246,134 | |
| | Total Short-Term Investments
(Cost $24,894,134) | | | | 24,894,134 | |
| | Total Investments In Securities
(Cost $211,986,970)* | | 111.3 | % | $ | 216,796,183 | |
| | Other Assets and Liabilities-Net | | (11.3 | ) | (22,085,222 | ) |
| | Net Assets | | 100.0 | % | $ | 194,710,961 | |
@ Non-income producing security
@@ Foreign Issuer
cc Securities purchased with cash collateral for securities loaned.
L Loaned security, a portion or all of the security is on loan at June 30, 2006.
* Cost for federal income tax purposes is $212,889,292.
Net unrealized appreciation consists of:
Gross Unrealized Appreciation | | $ | 10,424,116 | |
Gross Unrealized Depreciation | | (6,517,225 | ) |
Net Unrealized Appreciation | | $ | 3,906,891 | |
See Accompanying Notes to Financial Statements
59
| | PORTFOLIO OF INVESTMENTS |
ING VP SMALL COMPANY PORTFOLIO | | AS OF JUNE 30, 2006 (UNAUDITED) |
|
Industry Allocation
as of June 30, 2006
(as a percent of net assets)
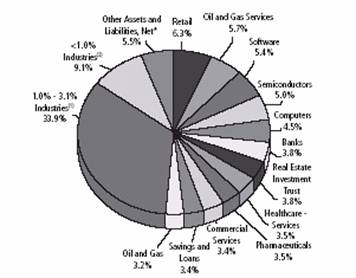
* Includes short-term investments related to securities lending collateral and repurchase agreement.
(1) Includes eighteen industries, which each represents 1.0% - 3.4% of net assets.
(2) Includes fifteen industries, which each represents < 1.0% of net assets.
Portfolio holdings are subject to change daily.
Shares | | | | | | Value | |
COMMON STOCK: 94.5% | | | |
| | | | Aerospace/Defense: 2.9% | | | |
107,212 | | L | | DRS Technologies, Inc. | | $ | 5,226,585 | |
62,775 | | @,L | | Innovative Solutions & Support, Inc. | | 882,617 | |
34,400 | | @ | | Moog, Inc. | | 1,177,168 | |
33,900 | | @ | | MTC Technologies, Inc. | | 801,057 | |
147,650 | | @ | | Teledyne Technologies, Inc. | | 4,837,014 | |
51,300 | | @ | | TransDigm Group, Inc. | | 1,228,635 | |
| | | | | | 14,153,076 | |
| | | | Apparel: 1.7% | | | |
95,300 | | @,@@,L | | Gildan Activewear, Inc. | | 4,479,100 | |
199,800 | | @,L | | Warnaco Group, Inc. | | 3,732,264 | |
| | | | | | 8,211,364 | |
| | | | Banks: 3.8% | | | |
339,200 | | L | | Bank Mutual Corp. | | 4,145,024 | |
68,000 | | L | | Chemical Financial Corp. | | 2,080,800 | |
60,975 | | | | Iberiabank Corp. | | 3,508,502 | |
143,000 | | | | Texas Regional Bancshares, Inc. | | 5,422,560 | |
105,210 | | | | UMB Financial Corp. | | 3,507,701 | |
| | | | | | 18,664,587 | |
| | | | Biotechnology: 0.6% | | | |
49,900 | | @,L | | Integra LifeSciences Holdings Corp. | | 1,936,619 | |
37,700 | | @,L | | Myogen, Inc. | | 1,093,300 | |
| | | | | | 3,029,919 | |
| | | | Building Materials: 1.1% | | | |
17,000 | | L | | Eagle Materials, Inc. | | 807,500 | |
19,200 | | @ | | Genlyte Group, Inc. | | 1,390,656 | |
146,400 | | @,L | | Goodman Global, Inc. | | $ | 2,222,352 | |
75,000 | | @,L | | US Concrete, Inc. | | 828,750 | |
| | | | | | 5,249,258 | |
| | | | Chemicals: 2.6% | | | |
77,600 | | | | Albemarle Corp. | | 3,715,488 | |
152,500 | | | | Olin Corp. | | 2,734,325 | |
150,000 | | @,L | | Terra Industries, Inc. | | 955,500 | |
251,500 | | L | | UAP Holding Corp. | | 5,485,215 | |
| | | | | | 12,890,528 | |
| | | | Commercial Services: 3.4% | | | |
35,000 | | @,L | | Advisory Board Co. | | 1,683,150 | |
61,000 | | L | | Arbitron, Inc. | | 2,338,130 | |
96,400 | | @,L | | Bright Horizons Family Solutions, Inc. | | 3,633,316 | |
54,100 | | L | | Chemed Corp. | | 2,950,073 | |
169,398 | | @,L | | DiamondCluster International, Inc. | | 1,341,632 | |
127,500 | | @ | | Exponent, Inc. | | 2,154,750 | |
60,800 | | @,L | | Huron Consulting Group, Inc. | | 2,133,472 | |
17,100 | | @,L | | Resources Connection, Inc. | | 427,842 | |
| | | | | | 16,662,365 | |
| | | | Computers: 4.5% | | | |
46,500 | | L | | Agilysys, Inc. | | 837,000 | |
216,900 | | @,L | | Electronics for Imaging | | 4,528,872 | |
196,050 | | @,L | | InterVoice, Inc. | | 1,395,876 | |
115,500 | | @,L | | Kronos, Inc. | | 4,182,255 | |
109,900 | | @ | | Micros Systems, Inc. | | 4,800,432 | |
74,436 | | | | MTS Systems Corp. | | 2,940,966 | |
232,200 | | @,L | | Palm, Inc. | | 3,738,420 | |
| | | | | | 22,423,821 | |
| | | | Distribution/Wholesale: 1.3% | | | |
113,160 | | @ | | Brightpoint, Inc. | | 1,531,055 | |
70,000 | | @ | | Wesco International, Inc. | | 4,830,000 | |
| | | | | | 6,361,055 | |
| | | | Diversified Financial Services: 1.8% | | | |
72,300 | | | | International Securities Exchange, Inc. | | 2,752,461 | |
85,400 | | L | | Jefferies Group, Inc. | | 2,530,402 | |
77,900 | | L | | Nuveen Investments, Inc. | | 3,353,595 | |
| | | | | | 8,636,458 | |
| | | | Electric: 0.8% | | | |
145,200 | | L | | ITC Holdings Corp. | | 3,859,416 | |
| | | | | | 3,859,416 | |
| | | | Electrical Components & Equipment: 0.7% | | | |
70,600 | | | | Ametek, Inc. | | 3,345,028 | |
| | | | | | 3,345,028 | |
| | | | Electronics: 1.9% | | | |
150,000 | | | | CTS Corp. | | 2,233,500 | |
90,700 | | @ | | Thomas & Betts Corp. | | 4,652,910 | |
50,350 | | @,L | | Trimble Navigation Ltd. | | 2,247,624 | |
| | | | | | 9,134,034 | |
| | | | Energy-Alternate Sources: 0.2% | | | |
72,400 | | @,L | | KFX, Inc. | | 1,106,272 | |
| | | | | | 1,106,272 | |
See Accompanying Notes to Financial Statements
60
| | PORTFOLIO OF INVESTMENTS |
ING VP SMALL COMPANY PORTFOLIO | | AS OF JUNE 30, 2006 (UNAUDITED) (CONTINUED) |
|
Shares | | | | | | Value | |
| | | | Engineering & Construction: 0.5% | | | |
41,800 | | @ | | Washington Group International, Inc. | | $ | 2,229,612 | |
| | | | | | 2,229,612 | |
| | | | Entertainment: 0.5% | | | |
123,700 | | @,L | | Macrovision Corp. | | 2,662,024 | |
| | | | | | 2,662,024 | |
| | | | Environmental Control: 0.6% | | | |
101,500 | | | | Metal Management, Inc. | | 3,107,930 | |
| | | | | | 3,107,930 | |
| | | | Food: 0.9% | | | |
92,800 | | | | Corn Products International, Inc. | | 2,839,680 | |
1,330 | | | | Seaboard Corp. | | 1,702,400 | |
| | | | | | 4,542,080 | |
| | | | Gas: 1.9% | | | |
105,000 | | L | | New Jersey Resources Corp. | | 4,911,900 | |
66,300 | | L | | Peoples Energy Corp. | | 2,380,833 | |
71,000 | | | | WGL Holdings, Inc. | | 2,055,450 | |
| | | | | | 9,348,183 | |
| | | | Healthcare-Products: 3.1% | | | |
78,200 | | @,L | | Arthrocare Corp. | | 3,285,182 | |
86,700 | | @ | | DJ Orthopedics, Inc. | | 3,193,161 | |
37,300 | | @ | | Gen-Probe, Inc. | | 2,013,454 | |
38,300 | | @ | | Haemonetics Corp. | | 1,781,333 | |
62,500 | | @,L | | Kyphon, Inc. | | 2,397,500 | |
48,500 | | | | LCA-Vision, Inc. | | 2,566,135 | |
| | | | | | 15,236,765 | |
| | | | Healthcare-Services: 3.5% | | | |
70,700 | | @,L | | Amedisys, Inc. | | 2,679,530 | |
41,400 | | @ | | Magellan Health Services, Inc. | | 1,875,834 | |
170,700 | | @,L | | Psychiatric Solutions, Inc. | | 4,892,262 | |
82,400 | | @,L | | Sierra Health Services | | 3,710,472 | |
43,100 | | @,L | | United Surgical Partners International, Inc. | | 1,296,016 | |
59,200 | | @,L | | WellCare Health Plans, Inc. | | 2,903,760 | |
| | | | | | 17,357,874 | |
| | | | Household Products/Wares: 0.8% | | | |
70,820 | | @ | | Central Garden & Pet Co. | | 3,048,801 | |
48,200 | | @,L | | Fossil, Inc. | | 868,082 | |
| | | | | | 3,916,883 | |
| | | | Housewares: 0.9% | | | |
99,900 | | | | Toro Co. | | 4,665,330 | |
| | | | | | 4,665,330 | |
| | | | Insurance: 2.0% | | | |
80,200 | | | | Commerce Group, Inc. | | 2,369,108 | |
40,400 | | @,L | | Darwin Professional Underwriters, Inc. | | 713,464 | |
126,800 | | | | Horace Mann Educators Corp. | | 2,149,260 | |
85,100 | | | | Ohio Casualty Corp. | | 2,530,023 | |
182,500 | | @,@@ | | RAM Holdings Ltd. | | 2,294,025 | |
| | | | | | 10,055,880 | |
| | | | Internet: 1.7% | | | |
42,000 | | @,L | | F5 Networks, Inc. | | $ | 2,246,160 | |
172,000 | | @,L | | Openwave Systems, Inc. | | 1,984,880 | |
268,000 | | @,L | | Sapient Corp. | | 1,420,400 | |
186,000 | | @,L | | Valueclick, Inc. | | 2,855,100 | |
| | | | | | 8,506,540 | |
| | | | Investment Companies: 1.0% | | | |
123,700 | | | | Apollo Investment Corp. | | 2,285,976 | |
34,500 | | L | | iShares Russell 2000 Index Fund | | 2,480,550 | |
| | | | | | 4,766,526 | |
| | | | Iron/Steel: 2.7% | | | |
48,200 | | | | Allegheny Technologies, Inc. | | 3,337,368 | |
30,000 | | | | Carpenter Technology | | 3,465,000 | |
39,300 | | L | | Cleveland-Cliffs, Inc. | | 3,116,097 | |
332,000 | | @@ | | Gerdau AmeriSteel Corp. | | 3,333,280 | |
| | | | | | 13,251,745 | |
| | | | Leisure Time: 0.4% | | | |
189,000 | | @ | | K2, Inc. | | 2,067,660 | |
| | | | | | 2,067,660 | |
| | | | Machinery-Diversified: 1.3% | | | |
16,500 | | @,L | | Middleby Corp. | | 1,428,240 | |
133,700 | | | | Wabtec Corp. | | 5,000,380 | |
| | | | | | 6,428,620 | |
| | | | Media: 0.4% | | | |
68,500 | | L | | Entercom Communications Corp. | | 1,791,960 | |
| | | | | | 1,791,960 | |
| | | | Mining: 0.7% | | | |
92,200 | | @@ | | Inmet Mining Corp. | | 3,444,182 | |
| | | | | | 3,444,182 | |
| | | | Miscellaneous Manufacturing: 1.2% | | | |
132,400 | | L | | Barnes Group, Inc. | | 2,641,380 | |
30,000 | | @,L | | Ceradyne, Inc. | | 1,484,700 | |
66,700 | | | | Pall Corp. | | 1,867,600 | |
| | | | | | 5,993,680 | |
| | | | Oil & Gas: 3.2% | | | |
31,000 | | @ | | Carrizo Oil & Gas, Inc. | | 970,610 | |
199,500 | | @ | | Denbury Resources, Inc. | | 6,318,165 | |
170,400 | | @,L | | EXCO Resources, Inc. | | 1,942,560 | |
31,000 | | @ | | Giant Industries, Inc. | | 2,063,050 | |
20,300 | | | | Holly Corp. | | 978,460 | |
110,000 | | @,L | | Southwestern Energy Co. | | 3,427,600 | |
| | | | | | 15,700,445 | |
| | | | Oil & Gas Services: 5.7% | | | |
82,000 | | @ | | Core Laboratories N.V | | 5,005,280 | |
79,700 | | @ | | FMC Technologies, Inc. | | 5,376,562 | |
192,000 | | @,L | | Global Industries Ltd. | | 3,206,400 | |
58,100 | | @,L | | Helix Energy Solutions | | 2,344,916 | |
75,000 | | @ | | Hydril | | 5,889,000 | |
74,200 | | @,L | | Oil States International, Inc. | | 2,543,576 | |
103,200 | | @ | | Superior Energy Services | | 3,498,480 | |
| | | | | | 27,864,214 | |
| | | | Pharmaceuticals: 3.5% | | | |
151,000 | | @,L | | Alkermes, Inc. | | 2,856,920 | |
46,550 | | @,L | | Amylin Pharmaceuticals, Inc. | | 2,298,174 | |
45,800 | | @,L | | Cubist Pharmaceuticals, Inc. | | 1,153,244 | |
See Accompanying Notes to Financial Statements
61
| | PORTFOLIO OF INVESTMENTS |
ING VP SMALL COMPANY PORTFOLIO | | AS OF JUNE 30, 2006 (UNAUDITED) (CONTINUED) |
|
Shares | | | | | | Value | |
| | | | Pharmaceuticals (continued) | | | |
120,400 | | @,L | | HealthExtras, Inc. | | $ | 3,638,488 | |
96,700 | | @ | | MGI Pharma, Inc. | | 2,079,050 | |
122,100 | | @,L | | Sciele Pharma, Inc. | | 2,831,499 | |
41,300 | | @,L | | United Therapeutics Corp. | | 2,385,901 | |
| | | | | | 17,243,276 | |
| | | | Real Estate Investment Trusts: 3.8% | | | |
63,900 | | | | Acadia Realty Trust | | 1,511,235 | |
31,700 | | | | Alexandria Real Estate Equities, Inc. | | 2,811,156 | |
253,600 | | | | Innkeepers USA Trust | | 4,382,208 | |
33,400 | | | | LaSalle Hotel Properties | | 1,546,420 | |
159,200 | | L | | Lexington Corporate Properties Trust | | 3,438,720 | |
147,181 | | | | National Health Investors, Inc. | | 3,957,697 | |
44,000 | | | | Sunstone Hotel Investors, Inc. | | 1,278,640 | |
| | | | | | 18,926,076 | |
| | | | Retail: 6.3% | | | |
88,800 | | @,L | | Aeropostale, Inc. | | 2,565,432 | |
110,900 | | @,L | | Burger King Holdings, Inc. | | 1,746,675 | |
159,600 | | L | | Casey’s General Stores, Inc. | | 3,991,596 | |
100,000 | | | | Cash America International, Inc. | | 3,200,000 | |
86,200 | | | | Claire’s Stores, Inc. | | 2,198,962 | |
100,729 | | @,L | | GameStop Corp. | | 4,230,618 | |
75,500 | | | | Lone Star Steakhouse & Saloon | | 1,980,365 | |
40,000 | | @,L | | Pantry, Inc. | | 2,301,600 | |
64,600 | | L | | Regis Corp. | | 2,300,406 | |
132,500 | | | | Stage Stores, Inc. | | 4,372,500 | |
40,900 | | @,L | | Tractor Supply Co. | | 2,260,543 | |
| | | | | | 31,148,697 | |
| | | | Savings & Loans: 3.4% | | | |
267,800 | | L | | Brookline Bancorp., Inc. | | 3,687,606 | |
370,000 | | | | First Niagara Financial Group, Inc. | | 5,187,400 | |
379,100 | | L | | NewAlliance Bancshares, Inc. | | 5,424,921 | |
42,500 | | | | WSFS Financial Corp. | | 2,611,625 | |
| | | | | | 16,911,552 | |
| | | | Semiconductors: 5.0% | | | |
180,000 | | @,L | | Actel Corp. | | 2,583,000 | |
70,100 | | @,L | | ADE Corp. | | 2,277,549 | |
313,000 | | @,L | | Axcelis Technologies, Inc. | | 1,846,700 | |
290,700 | | @ | | Entegris, Inc. | | 2,770,371 | |
62,101 | | @,L | | Formfactor, Inc. | | 2,771,568 | |
277,000 | | @,L | | Integrated Device Technology, Inc. | | 3,927,860 | |
206,600 | | @,L | | Micrel, Inc. | | 2,068,066 | |
98,200 | | @,L | | Power Integrations, Inc. | | 1,716,536 | |
150,000 | | @,L | | Varian Semiconductor Equipment Associates, Inc. | | 4,891,500 | |
| | | | | | 24,853,150 | |
| | | | Software: 5.4% | | | |
234,300 | | @,L | | Activision, Inc. | | 2,666,334 | |
111,100 | | @ | | Ansys, Inc. | | 5,312,802 | |
107,100 | | @ | | Filenet Corp. | | 2,884,203 | |
291,900 | | @,L | | Informatica Corp. | | 3,841,403 | |
145,500 | | | | MoneyGram International, Inc. | | 4,939,725 | |
141,500 | | @,L | | Progress Software Corp. | | 3,312,515 | |
169,050 | | @,L | | THQ, Inc. | | 3,651,480 | |
| | | | | | 26,608,462 | |
| | | | Storage/Warehousing: 0.5% | | | |
78,100 | | @,L | | Mobile Mini, Inc. | | $ | 2,285,206 | |
| | | | | | 2,285,206 | |
| | | | Telecommunications: 2.9% | | | |
109,000 | | L | | Adtran, Inc. | | 2,444,870 | |
200,000 | | @ | | Arris Group, Inc. | | 2,624,000 | |
83,100 | | @,L | | Netgear, Inc. | | 1,799,115 | |
71,000 | | | | Otelco, Inc. | | 1,281,550 | |
152,500 | | @,L | | Powerwave Technologies, Inc. | | 1,390,800 | |
102,500 | | @,L | | RCN Corp. | | 2,555,325 | |
85,000 | | @ | | SBA Communications Corp. | | 2,221,900 | |
| | | | | | 14,317,560 | |
| | | | Textiles: 0.6% | | | |
91,500 | | | | G&K Services, Inc. | | 3,138,450 | |
| | | | | | 3,138,450 | |
| | | | Transportation: 1.8% | | | |
78,250 | | | | Forward Air Corp. | | 3,187,123 | |
232,200 | | @ | | HUB Group, Inc. | | 5,695,866 | |
| | | | | | 8,882,989 | |
| | | | Trucking & Leasing: 1.0% | | | |
96,800 | | | | GATX Corp. | | 4,114,000 | |
32,000 | | | | Greenbrier Cos., Inc. | | 1,047,680 | |
| | | | | | 5,161,680 | |
| | | | Total Common Stock
(Cost $408,158,324) | | 466,142,412 | |
Principal
Amount | | | | | | Value | |
SHORT-TERM INVESTMENTS: 30.5% | | | | | |
| | Repurchase Agreement: 4.7% | | | | | |
$ | 23,287,000 | | Morgan Stanley Repurchase Agreement dated 06/30/06, 5.200%, due 07/03/06, $23,297,091 to be received upon repurchase (Collateralized by $23,850,000 Federal Home Loan Bank Discount Note, Market Value $23,754,600 due 07/28/06) | | | | 23,287,000 | |
| | Total Repurchase Agreement
(Cost $23,287,000) | | | | 23,287,000 | |
| | Securities Lending CollateralCC: 25.8% | | | | | |
127,077,337 | | The Bank of New York Institutional Cash Reserves Fund | | | | 127,077,337 | |
| | Total Securities Lending Collateral
(Cost $127,077,337) | | | | 127,077,337 | |
| | Total Short-Term Investments
(Cost $150,364,337) | | | | 150,364,337 | |
| | | | | | | | |
See Accompanying Notes to Financial Statements
62
| | PORTFOLIO OF INVESTMENTS |
ING VP SMALL COMPANY PORTFOLIO | | AS OF JUNE 30, 2006 (UNAUDITED) (CONTINUED) |
|
| | | | | | Value | |
| | Total Investments In Securities
(Cost $558,522,661)* | | 125.0 | % | $ | 616,506,749 | |
| | Other Assets and Liabilities-Net | | (25.0 | ) | (123,489,391 | ) |
| | Net Assets | | 100.0 | % | $ | 493,017,358 | |
@ Non-income producing security
@@ Foreign Issuer
cc Securities purchased with cash collateral for securities loaned.
L Loaned security, a portion or all of the security is on loan at June 30, 2006.
* Cost for federal income tax purposes is $558,871,975.
Net unrealized appreciation consists of:
Gross Unrealized Appreciation | | $ | 74,445,562 | |
Gross Unrealized Depreciation | | (16,810,788 | ) |
Net Unrealized Appreciation | | $ | 57,634,774 | |
See Accompanying Notes to Financial Statements
63
| | PORTFOLIO OF INVESTMENTS |
ING VP VALUE OPPORTUNITY PORTFOLIO | | AS OF JUNE 30, 2006 (UNAUDITED) |
|
Industry Allocation*
as of June 30, 2006
(as a percent of net assets)
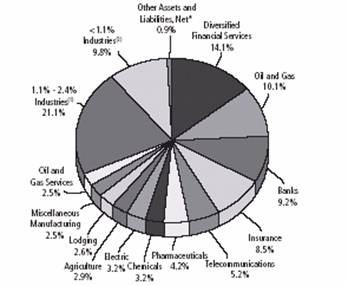
(1) Includes thirteen industries, which each represents 1.1% - 2.4% of net assets.
(2) Includes eleven industries, which each represents < 1.1% of net assets.
* Includes short-term investments related to securities lending collateral and repurchase agreement.
Portfolio holdings are subject to change daily.
Shares | | | | | | Value | |
COMMON STOCK: 99.1% | | | |
| | | | Aerospace/Defense: 2.3% | | | |
30,000 | | | | L-3 Communications Holdings, Inc. | | $ | 2,262,600 | |
36,100 | | | | United Technologies Corp. | | 2,289,462 | |
| | | | | | 4,552,062 | |
| | | | Agriculture: 2.9% | | | |
78,000 | | | | Altria Group, Inc. | | 5,727,540 | |
| | | | | | 5,727,540 | |
| | | | Apparel: 1.0% | | | |
25,400 | | L | | Nike, Inc. | | 2,057,400 | |
| | | | | | 2,057,400 | |
| | | | Banks: 9.2% | | | |
202,100 | | | | Bank of America Corp. | | 9,721,010 | |
102,600 | | | | Bank of New York | | 3,303,720 | |
75,000 | | | | Wells Fargo & Co. | | 5,031,000 | |
| | | | | | 18,055,730 | |
| | | | Beverages: 2.3% | | | |
62,100 | | | | Coca-Cola Co. | | 2,671,542 | |
26,000 | | | | Molson Coors Brewing Co. | | 1,764,880 | |
| | | | | | 4,436,422 | |
| | | | Biotechnology: 0.7% | | | |
35,600 | | @ | | Charles River Laboratories International, Inc. | | 1,310,080 | |
| | | | | | 1,310,080 | |
| | | | Building Materials: 1.9% | | | |
22,700 | | | | Florida Rock Industries, Inc. | | $ | 1,127,509 | |
176,700 | | @ | | Goodman Global, Inc. | | 2,682,306 | |
| | | | | | 3,809,815 | |
| | | | Chemicals: 3.2% | | | |
31,700 | | | | Air Products & Chemicals, Inc. | | 2,026,264 | |
39,100 | | | | Ashland, Inc. | | 2,607,970 | |
76,300 | | | | Celanese Corp. | | 1,558,046 | |
| | | | | | 6,192,280 | |
| | | | Coal: 1.6% | | | |
55,400 | | | | Peabody Energy Corp. | | 3,088,550 | |
| | | | | | 3,088,550 | |
| | | | Computers: 2.4% | | | |
25,900 | | | | International Business Machines Corp. | | 1,989,638 | |
122,700 | | @,L | | Seagate Technology, Inc. | | 2,777,928 | |
| | | | | | 4,767,566 | |
| | | | Cosmetics/Personal Care: 1.3% | | | |
44,400 | | | | Procter & Gamble Co. | | 2,468,640 | |
| | | | | | 2,468,640 | |
| | | | Distribution/Wholesale: 0.7% | | | |
20,900 | | @ | | Wesco International, Inc. | | 1,442,100 | |
| | | | | | 1,442,100 | |
| | | | Diversified Financial Services: 14.1% | | | |
16,600 | | @,L | | Affiliated Managers Group | | 1,442,374 | |
50,025 | | L | | Capital One Financial Corp. | | 4,274,636 | |
152,200 | | | | Citigroup, Inc. | | 7,342,128 | |
85,500 | | | | Countrywide Financial Corp. | | 3,255,840 | |
15,900 | | | | Freddie Mac | | 906,459 | |
104,900 | | | | JPMorgan Chase & Co. | | 4,405,800 | |
57,700 | | | | Merrill Lynch & Co., Inc. | | 4,013,612 | |
32,500 | | | | Morgan Stanley | | 2,054,325 | |
| | | | | | 27,695,174 | |
| | | | Electric: 3.2% | | | |
137,900 | | @ | | Mirant Corp. | | 3,695,720 | |
63,500 | | | | Pacific Gas & Electric Co. | | 2,494,280 | |
| | | | | | 6,190,000 | |
| | | | Electronics: 1.3% | | | |
249,000 | | @,@@ | | Flextronics International Ltd. | | 2,644,380 | |
| | | | | | 2,644,380 | |
| | | | Energy-Alternate Sources: 1.3% | | | |
169,500 | | @,L | | KFX, Inc. | | 2,589,960 | |
| | | | | | 2,589,960 | |
| | | | Engineering & Construction: 0.9% | | | |
140,500 | | @@ | | ABB Ltd. ADR | | 1,820,880 | |
| | | | | | 1,820,880 | |
| | | | Entertainment: 1.0% | | | |
97,700 | | L | | Regal Entertainment Group | | 1,985,264 | |
| | | | | | 1,985,264 | |
| | | | Environmental Control: 1.0% | | | |
111,400 | | @ | | Nalco Holding Co. | | 1,963,982 | |
| | | | | | 1,963,982 | |
See Accompanying Notes to Financial Statements
64
| | PORTFOLIO OF INVESTMENTS |
ING VP VALUE OPPORTUNITY PORTFOLIO | | AS OF JUNE 30, 2006 (UNAUDITED)(CONTINUED) |
|
Shares | | | | | | Value | |
| | | | Food: 1.1% | | | |
73,696 | | @ | | Smithfield Foods, Inc. | | $ | 2,124,656 | |
| | | | | | 2,124,656 | |
| | | | Gas: 1.1% | | | |
45,900 | | | | Sempra Energy | | 2,087,532 | |
| | | | | | 2,087,532 | |
| | | | Healthcare-Services: 1.1% | | | |
67,900 | | @ | | LifePoint Hospitals, Inc. | | 2,181,627 | |
| | | | | | 2,181,627 | |
| | | | Insurance: 8.5% | | | |
37,100 | | @@ | | ACE Ltd. | | 1,876,889 | |
49,000 | | | | American International Group, Inc. | | 2,893,450 | |
77,000 | | @@ | | Axis Capital Holdings Ltd. | | 2,202,970 | |
102,900 | | @,L | | Conseco, Inc. | | 2,376,990 | |
70,600 | | | | Genworth Financial, Inc. | | 2,459,704 | |
53,400 | | L | | Metlife, Inc. | | 2,734,614 | |
46,200 | | | | St. Paul Cos. | | 2,059,596 | |
| | | | | | 16,604,213 | |
| | | | Lodging: 2.6% | | | |
36,000 | | L | | Harrah’s Entertainment, Inc. | | 2,562,480 | |
32,600 | | @,@@,L | | Kerzner International Ltd. | | 2,584,528 | |
| | | | | | 5,147,008 | |
| | | | Media: 1.9% | | | |
82,800 | | | | CBS Corp. - Class B | | 2,239,740 | |
83,900 | | | | Time Warner, Inc. | | 1,451,470 | |
| | | | | | 3,691,210 | |
| | | | Mining: 1.5% | | | |
55,600 | | | | Alcoa, Inc. | | 1,799,216 | |
12,700 | | | | Phelps Dodge Corp. | | 1,043,432 | |
| | | | | | 2,842,648 | |
| | | | Miscellaneous Manufacturing: 2.5% | | | |
87,700 | | | | General Electric Co. | | 2,890,592 | |
40,400 | | | | Illinois Tool Works, Inc. | | 1,919,000 | |
| | | | | | 4,809,592 | |
| | | | Oil & Gas: 10.1% | | | |
124,900 | | | | ExxonMobil Corp. | | 7,662,615 | |
30,900 | | L | | Hess Corp. | | 1,633,065 | |
82,500 | | @ | | Newfield Exploration Co. | | 4,037,550 | |
117,400 | | @,L | | Plains Exploration & Production Co. | | 4,759,396 | |
50,000 | | L | | Rowan Cos., Inc. | | 1,779,500 | |
| | | | | | 19,872,126 | |
| | | | Oil & Gas Services: 2.5% | | | |
100,000 | | @ | | Dresser-Rand Group, Inc. | | 2,348,000 | |
51,900 | | @ | | Weatherford International Ltd. | | 2,575,278 | |
| | | | | | 4,923,278 | |
| | | | Pharmaceuticals: 4.2% | | | |
287,200 | | | | Pfizer, Inc. | | 6,740,584 | |
35,200 | | | | Wyeth | | 1,563,232 | |
| | | | | | 8,303,816 | |
| | | | Real Estate Investment Trust: 0.7% | | | |
67,800 | | | | KKR Financial Corp. | | $ | 1,410,918 | |
| | | | | | 1,410,918 | |
| | | | Retail: 1.0% | | | |
60,600 | | | | McDonald’s Corp. | | 2,036,160 | |
| | | | | | 2,036,160 | |
| | | | Savings & Loans: 1.0% | | | |
143,200 | | | | Hudson City Bancorp., Inc. | | 1,908,856 | |
| | | | | | 1,908,856 | |
| | | | Semiconductors: 1.0% | | | |
220,418 | | @@ | | Taiwan Semiconductor Manufacturing Co., Ltd. ADR | | 2,023,437 | |
| | | | | | 2,023,437 | |
| | | | Software: 0.8% | | | |
63,600 | | | | Microsoft Corp. | | 1,481,880 | |
| | | | | | 1,481,880 | |
| | | | Telecommunications: 5.2% | | | |
170,700 | | L | | AT&T, Inc. | | 4,760,823 | |
44,700 | | | | BellSouth Corp. | | 1,618,140 | |
265,000 | | @,L | | Qwest Communications International, Inc. | | 2,143,850 | |
48,200 | | | | Verizon Communications, Inc. | | 1,614,218 | |
| | | | | | 10,137,031 | |
| | | | Total Common Stock
(Cost $180,034,573) | | 194,383,813 | |
Principal
Amount | | | | | | Value | |
SHORT-TERM INVESTMENTS: 18.3% | | | | | |
| | Repurchase Agreement: 0.6% | | | | | |
$ | 1,269,0005 | | Morgan Stanley Repurchase Agreement dated 06/30/06, .200%, due 07/03/06, $1,269,550 to be received upon repurchase (Collateralized by $1,300,000 Federal Home Loan Bank Discount Note; Federal Credit Savings Bureau, 2.700% Market Value plus accrued interest $1,295,314, due 07/21/06) | | | | 1,269,000 | |
| | Total Repurchase Agreement
(Cost $1,269,000) | | | | 1,269,000 | |
| | Securities Lending CollateralCC: 17.7% | | | | | |
34,671,470 | | The Bank of New York Institutional Cash Reserves Fund | | | | 34,671,470 | |
| | Total Securities Lending Collateral
(Cost $34,671,470) | | | | 34,671,470 | |
| | Total Short-Term Investments
(Cost $35,940,470) | | | | 35,940,470 | |
| | | | | | | | |
See Accompanying Notes to Financial Statements
65
| | PORTFOLIO OF INVESTMENTS |
ING VP VALUE OPPORTUNITY PORTFOLIO | | AS OF JUNE 30, 2006 (UNAUDITED) (CONTINUED) |
|
| | | | | | Value | |
| | Total Investments In Securities
(Cost $215,975,043)* | | 117.4 | % | $ | 230,324,283 | |
| | Other Assets and Liabilities-Net | | (17.4 | ) | (34,070,989 | ) |
| | Net Assets | | 100.0 | % | $ | 196,253,294 | |
@ Non-income producing security
@@ Foreign Issuer
ADR American Depositary Receipt
cc Securities purchased with cash collateral for securities loaned.
L Loaned security, a portion or all of the security is on loan at June 30, 2006.
* Cost for federal income tax purposes is $216,923,360.
Net unrealized appreciation consists of:
Gross Unrealized Appreciation | | $ | 18,820,250 | |
Gross Unrealized Depreciation | | (5,419,327 | ) |
Net Unrealized Appreciation | | $ | 13,400,923 | |
See Accompanying Notes to Financial Statements
66
| �� | PORTFOLIO OF INVESTMENTS |
ING VP INTERMEDIATE BOND PORTFOLIO | | AS OF JUNE 30, 2006 (UNAUDITED) |
|
Investment Type Allocation
as of June 30, 2006
(as a percent of net assets)
U.S. Government Agency Obligations | | 33.7 | % |
Corporate Bonds/Notes | | 28.8 | % |
Collateralized Mortgage Obligations | | 26.0 | % |
U.S. Treasury Obligations | | 9.7 | % |
Repurchase Agreement | | 6.6 | % |
Asset-Backed Securities | | 4.5 | % |
Preferred Stock | | 1.9 | % |
Commercial Paper | | 1.1 | % |
Municipal Bonds | | 0.7 | % |
Other Bonds | | 0.2 | % |
Other Assets and Liabilities, Net* | | (13.2 | )% |
Total | | 100.0 | % |
* Includes short-term investments related to securities lending collateral.
Portfolio holdings are subject to change daily.
Principal
Amount | | | | | | Value | |
CORPORATE BONDS/NOTES: 28.8% | | | |
| | | | Airlines: 0.1% | | | |
$ | 976,629 | | | | Continental Airlines, Inc., 8.312%, due 04/02/11 | | $ | 926,290 | |
811,163 | | L,** | | United Airlines, Inc., 6.602%, due 09/01/13 | | 814,558 | |
| | | | | | 1,740,848 | |
| | | | Banks: 7.5% | | | |
5,665,000 | | L | | American Express Centurion Bank, 5.460%, due 07/19/07 | | 5,673,175 | |
6,070,000 | | @@,L | | Australia & New Zealand Banking Group Ltd., 5.400%, due 10/29/49 | | 5,301,489 | |
1,570,000 | | @@,# | | Banco do Brasil Cayman, 7.950%, due 12/31/49 | | 1,452,250 | |
2,534,276 | | @@,# | | Banco Itau SA/Cayman Islands, 5.356%, due 09/20/08 | | 2,524,139 | |
3,700,000 | | @@ | | Banco Santander Chile SA, 7.375%, due 07/18/12 | | 3,962,160 | |
2,100,000 | | @@ | | Bank of Ireland, 5.674%, due 12/29/49 | | 1,857,763 | |
2,330,000 | | @@ | | Bank of Nova Scotia, 5.125%, due 08/21/85 | | 1,986,989 | |
1,110,000 | | @@ | | Bank of Scotland, 4.813%, due 11/30/49 | | 965,700 | |
343,000 | | | | BankAmerica Capital II, 8.000%, due 12/15/26 | | 359,264 | |
1,460,000 | | @@ | | Barclays Bank PLC, 5.798%, due 12/31/49 | | 1,306,598 | |
9,679,000 | | @@,L | | Barclays Bank PLC, 6.278%, due 12/15/49 | | 8,449,961 | |
4,120,000 | | @@ | | BNP Paribas, 5.185%, due 09/29/49 | | 3,582,917 | |
1,664,000 | | | | Chase Capital I, 7.670%, due 12/01/26 | | 1,736,043 | |
3,868,000 | | @@,# | | Chuo Mitsui Trust & Banking Co., Ltd., 5.506%, due 04/15/49 | | 3,533,329 | |
$ | 2,106,000 | | @@,#,L | | Danske Bank A/S, 5.914%, due 12/29/49 | | $ | 2,033,309 | |
3,080,000 | | @@,L | | Den Norske Bank ASA, 5.125%, due 08/29/49 | | 2,587,200 | |
460,000 | | @@ | | Den Norske Creditbank, 5.500%, due 11/29/49 | | 414,141 | |
3,355,000 | | # | | Dresdner Funding Trust I, 8.151%, due 06/30/31 | | 3,749,998 | |
1,669,000 | | # | | First Chicago NBD Institutional Capital A, 7.950%, due 12/01/26 | | 1,742,404 | |
2,000 | | | | Fleet Capital Trust II, 7.920%, due 12/11/26 | | 2,093 | |
7,934,000 | | @@,# | | HBOS PLC, 5.375%, due 11/29/49 | | 7,525,256 | |
6,210,000 | | @@ | | HSBC Bank PLC, 5.663%, due 06/29/49 | | 5,262,975 | |
4,940,000 | | @@,L | | HSBC Bank PLC, 5.875%, due 06/29/49 | | 4,223,700 | |
1,250,000 | | | | Keycorp, 5.720%, due 07/23/07 | | 1,253,025 | |
4,890,000 | | @@ | | Lloyds TSB Bank PLC, 5.080%, due 08/29/49 | | 4,255,224 | |
470,000 | | @@ | | Lloyds TSB Bank PLC, 5.438%, due 11/29/49 | | 417,942 | |
126,000 | | | | M&I Capital Trust A, 7.650%, due 12/01/26 | | 131,290 | |
3,490,000 | | | | Mellon Capital I, 7.720%, due 12/01/26 | | 3,645,521 | |
2,950,000 | | @@ | | Mizuho Financial Group Cayman Ltd., 8.375%, due 12/31/49 | | 3,093,739 | |
2,250,000 | | @@,L | | National Australia Bank Ltd., 5.400%, due 10/29/49 | | 1,959,590 | |
670,000 | | @@ | | National Westminster Bank PLC, 5.375%, due 11/29/49 | | 571,247 | |
3,972,000 | | # | | Rabobank Capital Funding II, 5.260%, due 12/29/49 | | 3,732,429 | |
1,934,000 | | #,L | | Rabobank Capital Funding Trust, 5.254%, due 12/31/49 | | 1,775,137 | |
3,264,000 | | | | RBS Capital Trust I, 5.512%, due 09/30/49 | | 3,047,897 | |
4,002,000 | | @@,# | | Resona Bank Ltd., 5.850%, due 09/29/49 | | 3,730,100 | |
9,400,000 | | @@,L | | Royal Bank of Scotland Group PLC, 5.750%, due 12/29/49 | | 8,184,721 | |
2,250,000 | | @@ | | Societe Generale, 5.395%, due 11/29/49 | | 1,951,007 | |
10,650,000 | | @@,L | | Standard Chartered PLC, 5.550%, due 11/29/49 | | 8,972,625 | |
6,620,000 | | @@,L | | Standard Chartered PLC, 5.688%, due 07/29/49 | | 5,494,600 | |
1,080,000 | | @@,L | | Standard Chartered PLC, 5.730%, due 01/29/49 | | 896,400 | |
4,148,000 | | @@ | | Sumitomo Mitsui Banking Corp., 8.150%, due 08/01/49 | | 4,297,606 | |
2,990,000 | | | | Suntrust Bank, 5.304%, due 09/14/07 | | 2,989,761 | |
See Accompanying Notes to Financial Statements
67
| | PORTFOLIO OF INVESTMENTS |
ING VP INTERMEDIATE BOND PORTFOLIO | | AS OF JUNE 30, 2006 (UNAUDITED) (CONTINUED) |
|
Principal
Amount | | | | | | Value | |
| | | | Banks (continued) | | | |
$ | 8,586,000 | | | | Wachovia Capital Trust III, 5.800%, due 12/31/49 | | $ | 8,340,286 | |
2,470,000 | | @@ | | Westpac Banking Corp., 5.275%, due 09/30/49 | | 2,121,473 | |
2,325,000 | | @@,# | | Westpac Capital Trust IV, 5.256%, due 12/29/49 | | 2,163,750 | |
7,356,000 | | @@,#,L | | Woori Bank, 6.125%, due 05/03/16 | | 7,267,250 | |
| | | | | | 150,525,473 | |
| | | | Beverages: 0.3% | | | |
3,649,000 | | @@ | | Cia Brasileira de Bebidas, 8.750%, due 09/15/13 | | 4,036,706 | |
2,120,000 | | @@ | | Diageo Capital PLC, 5.590%, due 04/20/07 | | 2,122,033 | |
| | | | | | 6,158,739 | |
| | | | Chemicals: 0.6% | | | |
1,410,000 | | | | Stauffer Chemical, 6.020%, due 04/15/10 | | 1,129,622 | |
2,420,000 | | | | Stauffer Chemical, 6.360%, due 04/15/18 | | 1,169,102 | |
2,970,000 | | | | Stauffer Chemical, 8.620%, due 04/15/17 | | 1,527,857 | |
7,614,000 | | L | | Union Carbide Corp., 7.750%, due 10/01/96 | | 7,632,068 | |
| | | | | | 11,458,649 | |
| | | | Commercial Services: 0.4% | | | |
8,010,000 | | | | Tulane University of Louisiana, 5.970%, due 11/15/12 | | 8,050,050 | |
| | | | | | 8,050,050 | |
| | | | Diversified Financial Services: 8.4% | | | |
1,006,000 | | @@,#,I | | Alpine III, 5.290%, due 08/16/14 | | 1,008,231 | |
1,006,000 | | @@,#,I | | Alpine III, 6.120%, due 08/16/14 | | 1,008,907 | |
1,507,000 | | @@,#,I | | Alpine III, 7.920%, due 08/16/14 | | 1,515,258 | |
2,576,000 | | @@,#,I | | Alpine III, 11.170%, due 08/16/14 | | 2,645,160 | |
918,000 | | # | | Army Hawaii Family Housing Trust Certificates, 5.524%, due 06/15/50 | | 847,525 | |
675,000 | | # | | Army Hawaii Family Housing Trust Certificates, 5.624%, due 06/15/50 | | 624,665 | |
6,498,428 | | # | | Astoria Depositor Corp., 7.902%, due 05/01/21 | | 6,642,531 | |
11,382,000 | | # | | Astoria Depositor Corp., 8.144%, due 05/01/21 | | 11,938,637 | |
4,281,397 | | @@,# | | Brazilian Merchant Voucher Receivables Ltd., 5.911%, due 06/15/11 | | 4,227,880 | |
5,031,000 | | @@,# | | BTM Curacao Holdings NV, 4.760%, due 07/21/15 | | 4,833,553 | |
3,293,000 | | | | Citigroup Capital II, 7.750%, due 12/01/36 | | 3,420,973 | |
$ | 4,546,000 | | # | | Corestates Capital Trust I, 8.000%, due 12/15/26 | | $ | 4,751,866 | |
5,720,000 | | | | Countrywide Financial Corp., 5.566%, due 12/19/07 | | 5,726,035 | |
5,830,000 | | | | Countrywide Financial Corp., 5.670%, due 04/11/07 | | 5,836,127 | |
7,325,000 | | # | | Farmer Mac Guaranteed Notes Trust 2006-1, 4.875%, due 01/14/11 | | 7,127,656 | |
181,000 | | # | | Farmers Exchange Capital, 7.050%, due 07/15/28 | | 173,664 | |
2,565,000 | | @@ | | Financiere CSFB NV, 5.625%, due 03/29/49 | | 2,186,663 | |
3,743,000 | | | | Fund American Cos., Inc., 5.875%, due 05/15/13 | | 3,596,368 | |
5,068,000 | | | | General Motors Acceptance Corp., 8.000%, due 11/01/31 | | 4,840,521 | |
3,556,000 | | # | | HVB Funding Trust III, 9.000%, due 10/22/31 | | 4,308,226 | |
2,586,000 | | | | JPM Capital Trust I, 7.540%, due 01/15/27 | | 2,687,808 | |
2,866,000 | | | | JPM Capital Trust II, 7.950%, due 02/01/27 | | 3,005,256 | |
6,878,000 | | # | | Mangrove Bay Pass-Through Trust, 6.102%, due 07/15/33 | | 6,579,061 | |
3,644,000 | | @@,# | | Mantis Reef Ltd., 4.799%, due 11/03/09 | | 3,501,367 | |
8,700,000 | | | | Merrill Lynch & Co., Inc., 5.238%, due 08/24/07 | | 8,701,697 | |
2,560,000 | | @@ | | Paribas, 5.563%, due 12/31/49 | | 2,257,426 | |
1,720,889 | | @@ | | Petroleum Export Ltd., 4.623%, due 06/15/10 | | 1,683,783 | |
2,608,789 | | @@,# | | Petroleum Export Ltd./Cayman SPV, 5.265%, due 06/15/11 | | 2,531,347 | |
5,756,876 | | @@,# | | PF Export Receivables Master Trust, 6.436%, due 06/01/15 | | 5,759,495 | |
9,798,235 | | # | | Piper Jaffray Equipment Trust Securities, 7.000%, due 09/10/13 | | 9,700,252 | |
1,975,000 | | #,L | | Southern Star Central Corp., 6.750%, due 03/01/16 | | 1,905,875 | |
JPY | 3100000000 | | @@ | | Takefuji Corp., 1.000%, due 03/01/34 | | 13,685,075 | |
$ | 16,841,783 | | # | | Toll Road Investment, 18.600%, due 02/15/45 | | 2,031,927 | |
2,295,000 | | # | | Twin Reefs Pass-Through Trust, 6.345%, due 12/10/49 | | 2,295,103 | |
4,529,000 | | @@,L | | UFJ Finance Aruba AEC, 8.750%, due 12/31/49 | | 4,777,013 | |
2,105,000 | | # | | Wachovia Capital Trust V, 7.965%, due 06/01/27 | | 2,215,957 | |
8,591,000 | | # | | ZFS Finance USA Trust I, 6.150%, due 12/15/65 | | 8,238,614 | |
9,842,000 | | @@,# | | ZFS Finance USA Trust I, 6.450%, due 12/15/65 | | 9,020,508 | |
| | | | | | 167,838,010 | |
| | | | | | | | | | |
See Accompanying Notes to Financial Statements
68
| | PORTFOLIO OF INVESTMENTS |
ING VP INTERMEDIATE BOND PORTFOLIO | | AS OF JUNE 30, 2006 (UNAUDITED) (CONTINUED) |
|
Principal
Amount | | | | | | Value | |
| | | | Electric: 2.6% | | | |
$ | 4,569,593 | | | | CE Generation, LLC, 7.416%, due 12/15/18 | | $ | 4,687,182 | |
7,773,000 | | @@,L | | Empresa Nacional de Electricidad SA, 8.625%, due 08/01/15 | | 8,572,064 | |
3,603,000 | | | | Entergy Gulf States, Inc., 5.120%, due 08/01/10 | | 3,460,487 | |
4,917,000 | | L | | FirstEnergy Corp., 6.450%, due 11/15/11 | | 5,008,771 | |
5,769,000 | | | | FirstEnergy Corp., 7.375%, due 11/15/31 | | 6,207,657 | |
1,779,126 | | # | | Juniper Generation, 6.790%, due 12/31/14 | | 1,693,916 | |
2,538,000 | | @@,+ | | Korea Electric Power Corp., 0.610%, due 04/01/96 | | 1,472,040 | |
3,211,000 | | #,L | | Nevada Power Co., 5.950%, due 03/15/16 | | 3,059,425 | |
2,691,000 | | | | NorthWestern Corp., 5.875%, due 11/01/14 | | 2,649,873 | |
2,288,000 | | | | Potomac Edison Co., 5.000%, due 11/01/06 | | 2,290,510 | |
1,688,000 | | # | | Power Contract Financing, LLC, 6.256%, due 02/01/10 | | 1,688,893 | |
674,181 | | | | PPL Montana, LLC, 8.903%, due 07/02/20 | | 739,115 | |
5,185,000 | | # | | Sierra Pacific Power Co., 6.000%, due 05/15/16 | | 4,955,522 | |
880,000 | | | | Sierra Pacific Power Co., 6.250%, due 04/15/12 | | 869,283 | |
4,929,000 | | | | Southern Co. CAP Trust I, 8.190%, due 02/01/37 | | 5,174,440 | |
| | | | | | 52,529,178 | |
| | | | Energy-Alternate Sources: 0.2% | | | |
4,658,862 | | | | Salton SEA Funding, 7.840%, due 05/30/10 | | 4,799,070 | |
| | | | | | 4,799,070 | |
| | | | Food: 0.1% | | | |
997,000 | | | | Delhaize America, Inc., 8.050%, due 04/15/27 | | 977,393 | |
1,305,000 | | | | Delhaize America, Inc., 8.125%, due 04/15/11 | | 1,378,973 | |
| | | | | | 2,356,366 | |
| | | | Foreign Government Bonds: 0.6% | | | |
11,900,000 | | @@ | | Kaup Bank, 6.600%, due 12/28/15 | | 11,021,780 | |
| | | | | | 11,021,780 | |
| | | | Gas: 0.3% | | | |
5,438,000 | | # | | Southern Star Central Gas Pipeline, Inc., 6.000%, due 06/01/16 | | 5,308,848 | |
| | | | | | 5,308,848 | |
| | | | Home Builders: 0.4% | | | |
4,741,000 | | | | D.R. Horton, Inc., 5.625%, due 09/15/14 | | 4,351,688 | |
$ | 1,890,000 | | | | K Hovnanian Enterprises, Inc., 6.250%, due 01/15/16 | | $ | 1,649,025 | |
1,925,000 | | #,L | | Technical Olympic USA, Inc., 8.250%, due 04/01/11 | | 1,804,688 | |
| | | | | | 7,805,401 | |
| | | | Insurance: 1.0% | | | |
7,282,000 | | @@ | | Aegon NV, 5.798%, due 12/31/49 | | 6,100,951 | |
4,547,000 | | L | | AON Capital Trust, 8.205%, due 01/01/27 | | 4,917,803 | |
1,741,000 | | # | | North Front Pass-Thru, 5.810%, due 12/15/24 | | 1,657,947 | |
6,419,000 | | # | | Zurich Capital Trust I, 8.376%, due 06/01/37 | | 6,787,142 | |
| | | | | | 19,463,843 | |
| | | | Leisure Time: 0.7% | | | |
7,584,000 | | @@,L | | Royal Caribbean Cruises, 7.000%, due 06/15/13 | | 7,553,118 | |
5,564,000 | | @@,L | | Royal Caribbean Cruises, 7.250%, due 06/15/16 | | 5,537,654 | |
| | | | | | 13,090,772 | |
| | | | Media: 0.5% | | | |
2,842,000 | | L | | Comcast Corp., 5.650%, due 06/15/35 | | 2,419,898 | |
2,510,000 | | # | | Viacom, Inc., 5.750%, due 04/30/11 | | 2,467,925 | |
6,194,000 | | #,L | | Viacom, Inc., 6.250%, due 04/30/16 | | 6,023,659 | |
| | | | | | 10,911,482 | |
| | | | Mining: 0.5% | | | |
3,717,000 | | | | Southern Copper Corp., 7.500%, due 07/27/35 | | 3,567,316 | |
5,145,000 | | @@ | | Vale Overseas Ltd., 8.250%, due 01/17/34 | | 5,575,894 | |
| | | | | | 9,143,210 | |
| | | | Oil & Gas: 1.0% | | | |
3,932,000 | | | | Amerada Hess Corp., 7.300%, due 08/15/31 | | 4,179,091 | |
2,475,000 | | @@,# | | Empresa Nacional de Petroleo ENAP, 4.875%, due 03/15/14 | | 2,266,756 | |
1,588,000 | | @@,# | | Empresa Nacional de Petroleo ENAP, 6.750%, due 11/15/12 | | 1,641,570 | |
2,405,000 | | L | | Pemex Project Funding Master Trust, 6.625%, due 06/15/35 | | 2,179,531 | |
1,724,000 | | @@,# | | Pemex Project Funding Master Trust, 6.625%, due 06/15/35 | | 1,562,375 | |
4,608,000 | | @@,# | | Pemex Project Funding Master Trust, 6.629%, due 06/15/10 | | 4,716,288 | |
4,399,000 | | @@,# | | Ras Laffan Liquefied Natural Gas Co., Ltd. II, 5.298%, due 09/30/20 | | 4,108,965 | |
| | | | | | 20,654,576 | |
See Accompanying Notes to Financial Statements
69
| | PORTFOLIO OF INVESTMENTS |
ING VP INTERMEDIATE BOND PORTFOLIO | | AS OF JUNE 30, 2006 (UNAUDITED) (CONTINUED) |
|
Principal
Amount | | | | | | Value | |
| | | | Pharmaceuticals: 0.2% | | | |
$ | 3,878,000 | | | | AmerisourceBergen Corp., 5.625%, due 09/15/12 | | $ | 3,722,880 | |
1,037,000 | | # | | AmerisourceBergen Corp., 5.875%, due 09/15/15 | | 982,558 | |
| | | | | | 4,705,438 | |
| | | | Pipelines: 0.8% | | | |
7,988,000 | | #,I | | Cameron Highway Oil Pipeline, 5.860%, due 12/15/17 | | 7,580,612 | |
3,390,000 | | | | Kinder Morgan Finance Co. ULC, 5.350%, due 01/05/11 | | 3,126,373 | |
1,893,000 | | # | | Northwest Pipeline Corp., 7.000%, due 06/15/16 | | 1,890,634 | |
2,528,000 | | # | | Transcontinental Gas Pipe Line Corp., 6.400%, due 04/15/16 | | 2,433,200 | |
1,893,000 | | # | | Williams Partners LP/Williams Partners Finance Corp., 7.500%, due 06/15/11 | | 1,907,198 | |
| | | | | | 16,938,017 | |
| | | | Real Estate: 0.2% | | | |
3,251,000 | | | | EOP Operating LP, 7.750%, due 11/15/07 | | 3,332,535 | |
| | | | | | 3,332,535 | |
| | | | Real Estate Investment Trusts: 0.6% | | | |
801,000 | | | | Liberty Property LP, 6.375%, due 08/15/12 | | 816,135 | |
3,263,000 | | | | Liberty Property LP, 7.750%, due 04/15/09 | | 3,410,569 | |
2,882,000 | | | | Simon Property Group LP, 4.875%, due 03/18/10 | | 2,782,006 | |
4,299,000 | | | | Simon Property Group LP, 6.375%, due 11/15/07 | | 4,318,281 | |
| | | | | | 11,326,991 | |
| | | | Retail: 0.2% | | | |
3,670,000 | | | | May Department Stores Co., 3.950%, due 07/15/07 | | 3,599,136 | |
| | | | | | 3,599,136 | |
| | | | Savings & Loans: 0.1% | | | |
2,347,000 | | | | Great Western Financial, 8.206%, due 02/01/27 | | 2,466,897 | |
| | | | | | 2,466,897 | |
| | | | Telecommunications: 1.2% | | | |
3,565,000 | | | | AT&T Corp., 8.000%, due 11/15/31 | | 4,104,966 | |
6,964,000 | | @@,L | | Telefonica Emisones SAU, 6.421%, due 06/20/16 | | 6,962,196 | |
5,029,000 | | @@,L | | Telefonica Emisones SAU, 7.045%, due 06/20/36 | | 5,041,889 | |
9,735,000 | | L | | Verizon Global Funding Corp., 5.850%, due 09/15/35 | | 8,496,270 | |
| | | | | | 24,605,321 | |
| | | | Transportation: 0.3% | | | |
$ | 6,257,000 | | | | BNSF Funding Trust I, 6.613%, due 12/15/55 | | $ | 5,893,750 | |
| | | | | | 5,893,750 | |
| | | | Total Corporate Bonds/Notes (Cost $590,986,633) | | 575,724,380 | |
U.S. GOVERNMENT AGENCY OBLIGATIONS: 33.7% | | | |
| | | | Federal Home Loan Bank: 2.4% | | | |
18,505,000 | | | | 4.750%, due 08/17/07 | | 18,356,072 | |
9,655,000 | | | | 5.100%, due 03/06/08 | | 9,596,047 | |
9,360,000 | | | | 5.375%, due 07/18/11 | | 9,323,889 | |
9,843,000 | | | | 5.625%, due 06/13/16 | | 9,740,072 | |
| | | | | | 47,016,080 | |
| | | | Federal Home Loan Mortgage Corporation: 10.1% | | | |
9,946,000 | | | | 4.000%, due 08/17/07 | | 9,785,561 | |
2,816,444 | | S | | 4.500%, due 12/15/16 | | 2,742,903 | |
7,583,000 | | S | | 4.500%, due 02/15/20 | | 6,820,363 | |
19,687,000 | | L | | 4.875%, due 02/17/09 | | 19,439,810 | |
9,364,480 | | S | | 5.000%, due 08/15/16 | | 9,082,250 | |
1,621,000 | | S | | 5.000%, due 05/15/20 | | 1,523,383 | |
8,116,969 | | S | | 5.000%, due 08/15/21 | | 7,944,376 | |
7,694,000 | | S | | 5.000%, due 04/15/23 | | 7,180,519 | |
1,411,616 | | | | 5.042%, due 04/01/35 | | 1,360,186 | |
9,907,000 | | | | 5.125%, due 04/18/08 | | 9,850,649 | |
9,158,000 | | | | 5.150%, due 01/24/11 | | 8,994,136 | |
5,107,220 | | S | | 5.220%, due 06/01/35 | | 4,917,264 | |
11,875,000 | | L | | 5.250%, due 04/18/06 | | 11,638,118 | |
19,696,000 | | | | 5.500%, due 04/24/09 | | 19,614,065 | |
4,139,396 | | S | | 5.500%, due 11/15/18 | | 4,116,364 | |
19,794,752 | | S | | 5.500%, due 08/15/20 | | 18,329,893 | |
10,173,000 | | | | 5.500%, due 07/15/34 | | 9,772,438 | |
5,000,000 | | | | 5.750%, due 05/11/11 | | 4,981,195 | |
8,237,000 | | S | | 5.750%, due 06/27/16 | | 8,252,601 | |
6,390,752 | | | | 5.849%, due 04/15/32 | | 6,489,214 | |
7,343,000 | | L | | 5.875%, due 03/21/11 | | 7,409,168 | |
19,141,261 | | S | | 6.000%, due 01/15/29 | | 19,129,037 | |
1,042,000 | | W | | 6.000%, due 07/15/34 | | 1,026,045 | |
642,298 | | | | 7.500%, due 11/01/08 | | 666,564 | |
| | | | | | 201,066,102 | |
| | | | Federal National Mortgage Association: 20.9% | | | |
19,795,000 | | L | | 3.875%, due 07/15/08 | | 19,204,674 | |
5,984,000 | | L | | 4.250%, due 09/15/07 | | 5,898,375 | |
9,080,000 | | W | | 4.500%, due 07/15/19 | | 8,583,433 | |
502,000 | | W | | 4.500%, due 07/15/35 | | 454,938 | |
3,494,435 | | S | | 4.640%, due 08/01/35 | | 3,377,512 | |
9,837,000 | | | | 4.750%, due 08/10/07 | | 9,758,717 | |
4,699,896 | | S | | 4.750%, due 12/25/42 | | 4,652,750 | |
4,870,694 | | S | | 4.805%, due 08/01/35 | | 4,706,223 | |
1,471,536 | | | | 4.964%, due 04/01/35 | | 1,447,111 | |
10,602,000 | | W | | 5.000%, due 07/18/21 | | 10,211,051 | |
7,217,002 | | | | 5.000%, due 07/25/29 | | 7,039,945 | |
176,274,000 | | W | | 5.000%, due 08/15/34 | | 164,706,018 | |
1,671,267 | | S | | 5.090%, due 07/01/35 | | 1,618,195 | |
7,285,401 | | S | | 5.147%, due 09/01/35 | | 7,093,959 | |
19,719,000 | | | | 5.250%, due 08/01/12 | | 19,291,413 | |
1,463,884 | | | | 5.289%, due 08/01/35 | | 1,415,693 | |
3,000,000 | | | | 5.330%, due 06/25/36 | | 3,000,000 | |
24,934 | | | | 5.500%, due 11/01/16 | | 24,525 | |
See Accompanying Notes to Financial Statements
70
| | PORTFOLIO OF INVESTMENTS |
ING VP INTERMEDIATE BOND PORTFOLIO | | AS OF JUNE 30, 2006 (UNAUDITED) (CONTINUED) |
|
Principal
Amount | | | | | | Value | |
| | | | Federal National Mortgage Association (continued) | | | |
$ | 128,334 | | | | 5.500%, due 12/01/16 | | $ | 126,229 | |
19,738 | | | | 5.500%, due 04/01/17 | | 19,418 | |
44,836 | | | | 5.500%, due 02/01/18 | | 44,108 | |
13,736 | | | | 5.500%, due 06/01/18 | | 13,507 | |
67,418 | | | | 5.500%, due 10/01/18 | | 66,324 | |
4,690,000 | | W | | 5.500%, due 07/15/19 | | 4,603,526 | |
4,503,973 | | S | | 5.500%, due 11/01/32 | | 4,347,023 | |
26,997,469 | | S | | 5.500%, due 11/01/33 | | 26,055,023 | |
35,534,000 | | W | | 5.500%, due 08/13/34 | | 34,112,640 | |
858 | | I | | 5.625%, due 08/13/35 | | 873 | |
10,653 | | I | | 5.680%, due 08/13/36 | | 10,902 | |
170,163 | | | | 6.000%, due 06/01/16 | | 170,833 | |
23,113 | | | | 6.000%, due 08/01/16 | | 23,203 | |
335,842 | | | | 6.000%, due 10/01/16 | | 337,165 | |
391,205 | | | | 6.000%, due 01/01/17 | | 392,793 | |
144,646 | | | | 6.000%, due 02/01/17 | | 145,244 | |
780,886 | | | | 6.000%, due 04/01/17 | | 784,114 | |
532,663 | | | | 6.000%, due 05/01/17 | | 534,865 | |
252,612 | | | | 6.000%, due 06/01/17 | | 253,657 | |
426,603 | | | | 6.000%, due 07/01/17 | | 428,367 | |
653,171 | | | | 6.000%, due 08/01/17 | | 655,825 | |
489,492 | | | | 6.000%, due 09/01/17 | | 491,516 | |
1,651,712 | | S | | 6.000%, due 09/01/17 | | 1,658,540 | |
10,152 | | | | 6.000%, due 10/01/17 | | 10,194 | |
524,942 | | | | 6.000%, due 11/01/17 | | 527,010 | |
10,440 | | | | 6.000%, due 02/01/18 | | 10,484 | |
486,018 | | | | 6.000%, due 04/01/18 | | 488,176 | |
128,186 | | | | 6.000%, due 09/01/18 | | 128,732 | |
159,350 | | | | 6.000%, due 11/01/18 | | 160,029 | |
209,102 | | | | 6.000%, due 12/01/18 | | 209,926 | |
9,989,000 | | W | | 6.000%, due 07/15/20 | | 10,026,459 | |
10,312,362 | | S | | 6.000%, due 07/25/29 | | 10,320,891 | |
5,574,841 | | S | | 6.000%, due 04/25/31 | | 5,604,405 | |
28,722,000 | | W | | 6.000%, due 07/15/34 | | 28,273,219 | |
2,955,987 | | S | | 6.500%, due 08/01/29 | | 2,986,998 | |
277,004 | | | | 6.500%, due 01/01/32 | | 279,617 | |
217,321 | | | | 6.500%, due 09/01/32 | | 219,307 | |
453,148 | | | | 6.500%, due 10/01/32 | | 457,290 | |
3,266,000 | | W | | 6.500%, due 07/15/33 | | 3,283,349 | |
21,430 | | | | 7.000%, due 08/01/25 | | 21,985 | |
13,035 | | | | 7.000%, due 10/01/25 | | 13,373 | |
4,395 | | | | 7.000%, due 11/01/25 | | 4,509 | |
85,283 | | | | 7.000%, due 12/01/25 | | 87,493 | |
100,079 | | | | 7.000%, due 02/01/26 | | 102,674 | |
225,003 | | | | 7.000%, due 03/01/26 | | 230,819 | |
132,232 | | | | 7.000%, due 01/01/30 | | 135,609 | |
3,041,929 | | S | | 7.000%, due 06/01/31 | | 3,119,694 | |
149,607 | | | | 7.000%, due 08/01/35 | | 153,119 | |
16,832 | | | | 7.500%, due 11/01/29 | | 17,456 | |
133,990 | | | | 7.500%, due 10/01/30 | | 138,858 | |
107,254 | | | | 7.500%, due 11/01/30 | | 111,151 | |
2,054,429 | | S | | 7.500%, due 01/25/48 | | 2,113,171 | |
291,366 | | | | 10.000%, due 02/25/19 | | 319,700 | |
| | | | | | 417,315,924 | |
| | | | Government National Mortgage Association: 0.3% | | | |
174,786 | | | | 4.375%, due 04/20/28 | | 175,037 | |
118,813 | | | | 5.125%, due 12/20/29 | | 118,053 | |
3,240,811 | | S | | 6.500%, due 10/15/31 | | 3,286,742 | |
542,239 | | | | 7.000%, due 04/15/26 | | 560,112 | |
227,782 | | | | 7.000%, due 05/15/32 | | 235,047 | |
33,108 | | | | 7.500%, due 04/15/22 | | 34,604 | |
$ | 6,476 | | | | 7.500%, due 05/15/22 | | $ | 6,768 | |
6,855 | | | | 7.500%, due 06/15/22 | | 7,165 | |
4,802 | | | | 7.500%, due 08/15/22 | | 5,019 | |
9,728 | | | | 7.500%, due 06/15/24 | | 10,180 | |
16,008 | | | | 7.500%, due 01/15/26 | | 16,770 | |
2,123 | | | | 7.500%, due 07/15/26 | | 2,224 | |
41,574 | | | | 7.500%, due 03/15/29 | | 43,494 | |
61,471 | | | | 7.500%, due 04/15/29 | | 64,310 | |
160,406 | | | | 7.500%, due 08/15/29 | | 167,813 | |
10,014 | | | | 7.500%, due 09/15/29 | | 10,476 | |
31,738 | | | | 7.500%, due 10/15/29 | | 33,204 | |
50,433 | | | | 7.500%, due 12/15/29 | | 52,769 | |
40,361 | | | | 7.500%, due 01/15/30 | | 42,207 | |
88,898 | | | | 7.500%, due 02/15/30 | | 92,965 | |
44,332 | | | | 7.500%, due 05/15/30 | | 46,360 | |
29,184 | | | | 7.500%, due 06/15/30 | | 30,520 | |
39,670 | | | | 7.500%, due 07/15/30 | | 41,485 | |
44,183 | | | | 7.500%, due 08/15/30 | | 46,204 | |
28,960 | | | | 7.500%, due 10/15/30 | | 30,284 | |
4,404 | | | | 7.500%, due 11/15/30 | | 4,605 | |
1,958 | | | | 7.500%, due 01/15/31 | | 2,047 | |
25,958 | | | | 7.500%, due 02/15/31 | | 27,139 | |
18,038 | | | | 7.500%, due 03/15/31 | | 18,858 | |
12,740 | | | | 7.500%, due 04/15/31 | | 13,319 | |
1,636 | | | | 7.500%, due 09/15/31 | | 1,711 | |
551,289 | | | | 7.500%, due 12/15/31 | | 576,483 | |
83,838 | | | | 7.500%, due 01/15/32 | | 87,679 | |
89,657 | | | | 7.500%, due 03/15/32 | | 93,758 | |
1,589 | | | | 7.500%, due 04/15/32 | | 1,661 | |
46,266 | | | | 7.500%, due 05/15/32 | | 48,367 | |
108,530 | | | | 7.500%, due 06/15/32 | | 113,461 | |
52,109 | | | | 7.500%, due 07/15/32 | | 54,476 | |
49,688 | | | | 7.500%, due 08/15/32 | | 51,945 | |
695,042 | | | | 7.500%, due 09/15/32 | | 726,617 | |
| | | | | | 6,981,938 | |
| | | | Total U.S. Government Agency Obligations (Cost $683,123,887) | | 672,380,044 | |
U.S. TREASURY OBLIGATIONS: 9.7% | | | |
| | | | U.S. Treasury Bonds: 4.8% | | | |
19,452,000 | | L | | 2.000%, due 01/15/16 | | 18,864,994 | |
18,768,000 | | L | | 5.125%, due 05/15/16 | | 18,751,878 | |
20,153,000 | | L | | 5.375%, due 02/15/31 | | 20,507,269 | |
17,576,000 | | L | | 6.000%, due 02/15/26 | | 19,043,877 | |
17,607,000 | | L | | 6.250%, due 08/15/23 | | 19,424,113 | |
| | | | | | 96,592,131 | |
| | | | U.S. Treasury Note: 4.9% | | | |
29,640,000 | | L | | 2.375%, due 04/15/11 | | 29,980,649 | |
11,742,000 | | L | | 4.875%, due 05/15/09 | | 11,665,865 | |
32,704,000 | | | | 5.125%, due 06/30/08 | | 32,693,796 | |
14,255,000 | | | | 5.125%, due 06/30/11 | | 14,276,169 | |
14,392,000 | | | | 5.310%, due 05/15/16 | | 8,630,954 | |
| | | | | | 97,247,433 | |
| | | | Total U.S. Treasury Obligations
(Cost $196,561,852) | | 193,839,564 | |
See Accompanying Notes to Financial Statements
71
| | PORTFOLIO OF INVESTMENTS |
ING VP INTERMEDIATE BOND PORTFOLIO | | AS OF JUNE 30, 2006 (UNAUDITED) (CONTINUED) |
|
Principal
Amount | | | | | | Value | |
ASSET-BACKED SECURITIES: 4.5% | | | |
| | | | Automobile Asset-Backed Securities: 0.9% | | | |
$ | 1,049,528 | | | | Capital Auto Receivables Asset Trust, 2.750%, due 04/16/07 | | $ | 1,047,392 | |
330,000 | | | | Capital Auto Receivables Asset Trust, 5.030%, due 10/15/09 | | 327,148 | |
1,168,000 | | | | Capital One Prime Auto Receivables Trust, 5.010%, due 11/15/11 | | 1,150,817 | |
5,864,000 | | S | | Carmax Auto Owner Trust, 4.210%, due 01/15/10 | | 5,765,210 | |
818,105 | | | | Honda Auto Receivables Owner Trust, 2.790%, due 03/16/09 | | 804,021 | |
1,854,000 | | S | | Honda Auto Receivables Owner Trust, 3.820%, due 05/21/10 | | 1,794,669 | |
2,427,877 | | S | | Nissan Auto Receivables Owner Trust, 2.610%, due 07/15/08 | | 2,397,664 | |
4,778,000 | | S | | Nissan Auto Receivables Owner Trust, 4.190%, due 07/15/09 | | 4,697,653 | |
630,000 | | | | Nissan Auto Receivables Owner Trust, 4.740%, due 09/15/09 | | 622,409 | |
13,145 | | | | USAA Auto Owner Trust, 2.040%, due 02/16/10 | | 13,046 | |
| | | | | | 18,620,029 | |
| | | | Credit Card Asset-Backed Securities: 0.8% | | | |
6,000 | | | | Bank One Issuance Trust, 4.540%, due 09/15/10 | | 5,893 | |
6,000 | | | | Capital One Master Trust, 4.900%, due 03/15/10 | | 5,969 | |
6,496,000 | | S | | Citibank Credit Card Issuance Trust, 4.850%, due 02/10/11 | | 6,384,948 | |
375,000 | | | | Citibank Credit Card Master Trust I, 5.875%, due 03/10/11 | | 378,158 | |
4,472,000 | | S | | Citibank Credit Card Master Trust I, 6.050%, due 01/15/10 | | 4,512,027 | |
4,124,000 | | S | | MBNA Credit Card Master Note Trust, 4.900%, due 07/15/11 | | 4,066,925 | |
8,000 | | S | | MBNA Credit Card Master Note Trust, 4.950%, due 06/15/09 | | 7,988 | |
1,192,000 | | | | MBNA Master Credit Card Trust USA, 5.900%, due 08/15/11 | | 1,204,945 | |
| | | | | | 16,566,853 | |
| | | | Home Equity Asset-Backed Securities: 1.1% | | | |
$ | 2,949,764 | | | | Bayview Financial Acquisition Trust, 5.841%, due 09/28/43 | | $ | 2,952,991 | |
369,179 | | | | GMAC Mortgage Corp. Loan Trust, 5.553%, due 12/25/20 | | 369,468 | |
10,593,000 | | | | GSAA Trust, 5.242%, due 06/25/34 | | 10,395,106 | |
705,409 | | | | Merrill Lynch Mortgage Investors, Inc., 5.683%, due 07/25/34 | | 707,402 | |
1,114,000 | | + | | Renaissance Home Equity Loan Trust, 4.456%, due 05/25/35 | | 1,098,772 | |
1,977,000 | | +,S | | Renaissance Home Equity Loan Trust, 4.723%, due 11/25/35 | | 1,948,167 | |
1,380,000 | | + | | Renaissance Home Equity Loan Trust, 5.608%, due 05/25/36 | | 1,369,837 | |
1,990,000 | | S | | Wells Fargo Home Equity Trust, 3.970%, due 09/25/24 | | 1,967,043 | |
500,000 | | | | Wells Fargo Home Equity Trust, 4.430%, due 11/25/25 | | 492,930 | |
| | | | | | 21,301,716 | |
| | | | Other Asset-Backed Securities: 1.7% | | | |
505,821 | | | | Amortizing Residential Collateral Trust, 5.823%, due 05/25/32 | | 506,849 | |
996,000 | | | | Caterpillar Financial Asset Trust, 5.590%, due 02/25/09 | | 995,966 | |
217 | | | | Chase Funding Mortgage Loan, 2.734%, due 09/25/24 | | 217 | |
4,000 | | | | Chase Funding Mortgage Loan, 4.045%, due 05/25/33 | | 3,923 | |
1,192,276 | | | | Chase Funding Mortgage Loan, 5.623%, due 07/25/33 | | 1,195,949 | |
2,312,000 | | | | Countrywide Asset-Backed Certificates, 4.493%, due 02/25/36 | | 2,272,304 | |
2,766,000 | | +,S | | Credit-Based Asset Servicing and Securitization, 5.501%, due 12/25/36 | | 2,744,243 | |
3,375,000 | | | | Equity One ABS, Inc., 5.050%, due 09/25/33 | | 3,300,210 | |
1,766,671 | | S | | Fannie Mae Grantor Trust, 5.463%, due 04/25/35 | | 1,769,656 | |
6,239,758 | | S | | Lehman XS Trust, 5.603%, due 08/25/35 | | 6,260,197 | |
862,740 | | | | Long Beach Mortgage Loan Trust, 5.653%, due 01/25/36 | | 865,724 | |
See Accompanying Notes to Financial Statements
72
| | PORTFOLIO OF INVESTMENTS |
ING VP INTERMEDIATE BOND PORTFOLIO | | AS OF JUNE 30, 2006 (UNAUDITED) (CONTINUED) |
|
Principal
Amount | | | | | | Value | |
| | | | Other Asset-Backed Securities (continued) | | | |
$ | 3,846,000 | | S | | Merrill Lynch Mortgage Investors, Inc., 5.523%, due 01/25/37 | | $ | 3,849,213 | |
2,065,000 | | +,S | | Merrill Lynch Mortgage Investors, Inc., 5.609%, due 03/25/37 | | 2,051,351 | |
3,000 | | | | Popular ABS Mortgage Pass-Through Trust, 3.735%, due 12/25/34 | | 2,977 | |
3,000 | | | | Popular ABS Mortgage Pass-Through Trust, 4.000%, due 12/25/34 | | 2,943 | |
1,697,000 | | S | | Popular ABS Mortgage Pass-Through Trust, 4.596%, due 11/25/35 | | 1,670,907 | |
376,714 | | | | Residential Asset Mortgage Products, Inc., 5.633%, due 06/25/33 | | 377,449 | |
5,931,858 | | +,S | | Structured Asset Securities Corp., 6.000%, due 03/25/34 | | 5,914,885 | |
| | | | | | 33,784,963 | |
| | | | Total Asset-Backed Securities
(Cost $91,308,638) | | 90,273,561 | |
COLLATERALIZED MORTGAGE OBLIGATIONS: 26.0% | | | |
| | | | Commercial Mortgage-Backed Securities: 6.3% | | | |
385,000 | | | | Banc of America Commercial Mortgage, Inc., 4.429%, due 11/10/39 | | 361,440 | |
3,941,000 | | S | | Banc of America Commercial Mortgage, Inc., 4.502%, due 07/10/42 | | 3,724,316 | |
7,612,000 | | S | | Banc of America Commercial Mortgage, Inc., 4.611%, due 07/10/43 | | 7,346,303 | |
2,735,000 | | S | | Banc of America Commercial Mortgage, Inc., 4.764%, due 07/10/45 | | 2,638,796 | |
4,720,000 | | S | | Banc of America Commercial Mortgage, Inc., 4.772%, due 07/11/43 | | 4,606,783 | |
4,150,000 | | S | | Banc of America Commercial Mortgage, Inc., 4.891%, due 07/10/45 | | 3,955,350 | |
970,000 | | | | Banc of America Commercial Mortgage, Inc., 6.186%, due 06/11/35 | | 988,146 | |
3,083,000 | | S | | Bear Stearns Commercial Mortgage Securities, 3.880%, due 08/13/39 | | 2,946,233 | |
$ | 195,000 | | | | Bear Stearns Commercial Mortgage Securities, 4.030%, due 02/13/46 | | $ | 184,798 | |
3,380,000 | | S | | Bear Stearns Commercial Mortgage Securities, 4.170%, due 01/12/41 | | 3,263,511 | |
1,206,000 | | | | Bear Stearns Commercial Mortgage Securities, 4.565%, due 07/11/42 | | 1,142,852 | |
777,000 | | | | Capco America Securitization Corp., 6.260%, due 10/15/30 | | 786,579 | |
279,000 | | | | Capco America Securitization Corp., 6.460%, due 10/15/30 | | 283,928 | |
6,167,579 | | S | | Chase Manhattan Bank-First Union National Bank, 7.439%, due 08/15/31 | | 6,447,342 | |
1,540,000 | | S | | Citigroup Commercial Mortgage Trust, 5.721%, due 03/15/49 | | 1,545,149 | |
819,000 | | | | Commercial Mortgage Pass Through Certificates, 3.600%, due 03/10/39 | | 780,866 | |
1,470,000 | | | | Credit Suisse Mortgage Capital Certificates, 4.991%, due 06/15/38 | | 1,440,600 | |
3,239,551 | | S | | CS First Boston Mortgage Securities Corp., 3.727%, due 03/15/35 | | 3,079,412 | |
17,000 | | | | CS First Boston Mortgage Securities Corp., 3.861%, due 03/15/36 | | 16,468 | |
745,000 | | | | CS First Boston Mortgage Securities Corp., 4.321%, due 01/15/37 | | 701,772 | |
2,328,000 | | S | | CS First Boston Mortgage Securities Corp., 4.801%, due 03/15/36 | | 2,198,601 | |
1,777,000 | | S | | CS First Boston Mortgage Securities Corp., 5.183%, due 11/15/36 | | 1,725,138 | |
4,000 | | | | CS First Boston Mortgage Securities Corp., 7.544%, due 04/15/62 | | 4,276 | |
22,000 | | | | DLJ Commercial Mortgage Corp., 6.240%, due 11/12/31 | | 22,240 | |
63,000 | | | | DLJ Commercial Mortgage Corp., 7.300%, due 06/10/32 | | 65,428 | |
3,400,000 | | S | | First Union National Bank Commercial Mortgage, 6.663%, due 01/12/43 | | 3,518,635 | |
2,417,213 | | | | GE Capital Commercial Mortgage Corp., 3.752%, due 07/10/39 | | 2,348,181 | |
793,000 | | | | GE Capital Commercial Mortgage Corp., 4.371%, due 01/10/38 | | 756,061 | |
See Accompanying Notes to Financial Statements
73
| | PORTFOLIO OF INVESTMENTS |
ING VP INTERMEDIATE BOND PORTFOLIO | | AS OF JUNE 30, 2006 (UNAUDITED) (CONTINUED) |
|
Principal
Amount | | | | | | Value | |
| | | | Commercial Mortgage-Backed Securities (continued) | | | |
$ | 301,000 | | | | GE Capital Commercial Mortgage Corp., 4.865%, due 07/10/39 | | $ | 288,857 | |
1,933,960 | | S | | GE Capital Commercial Mortgage Corp., 5.560%, due 06/10/38 | | 1,930,538 | |
1,800,000 | | S | | Greenwich Capital Commercial Funding Corp., 6.032%, due 11/10/11 | | 1,812,938 | |
1,011,235 | | | | JP Morgan Chase Commercial Mortgage Securities Corp., 4.200%, due 07/12/35 | | 970,911 | |
3,890,000 | | S | | JP Morgan Chase Commercial Mortgage Securities Corp., 4.223%, due 01/15/42 | | 3,713,504 | |
6,696,581 | | S | | JP Morgan Chase Commercial Mortgage Securities Corp., 4.275%, due 01/12/37 | | 6,437,316 | |
10,000 | | | | JP Morgan Chase Commercial Mortgage Securities Corp., 4.449%, due 01/12/38 | | 9,492 | |
810,000 | | | | JP Morgan Chase Commercial Mortgage Securities Corp., 5.834%, due 04/15/45 | | 812,932 | |
4,589,000 | | S | | JP Morgan Chase Commercial Mortgage Securities Corp., 5.857%, due 10/12/35 | | 4,600,493 | |
1,580,000 | | S | | JP Morgan Chase Commercial Mortgage Securities Corp., 5.862%, due 04/15/45 | | 1,586,794 | |
1,794,000 | | S | | LB-UBS Commercial Mortgage Trust, 3.992%, due 10/15/29 | | 1,709,663 | |
10,000 | | | | LB-UBS Commercial Mortgage Trust, 4.201%, due 12/15/29 | | 9,558 | |
499,000 | | | | LB-UBS Commercial Mortgage Trust, 4.310%, due 02/15/30 | | 476,515 | |
567,000 | | | | LB-UBS Commercial Mortgage Trust, 4.510%, due 12/15/29 | | 534,927 | |
176,000 | | | | LB-UBS Commercial Mortgage Trust, 4.567%, due 06/15/29 | | 171,507 | |
2,416,000 | | S | | LB-UBS Commercial Mortgage Trust, 4.998%, due 04/15/30 | | 2,325,964 | |
1,470,000 | | | | LB-UBS Commercial Mortgage Trust, 5.741%, due 06/15/32 | | 1,474,364 | |
5,220,000 | | S | | LB-UBS Commercial Mortgage Trust, 6.226%, due 03/15/26 | | 5,292,697 | |
$ | 4,500,000 | | S | | LB-UBS Commercial Mortgage Trust, 7.370%, due 08/15/26 | | $ | 4,739,724 | |
2,725,000 | | S | | Merrill Lynch Mortgage Trust, 4.892%, due 02/12/42 | | 2,612,363 | |
1,475,000 | | | | Merrill Lynch/Countrywide Commercial Mortgage Trust, 5.439%, due 02/12/39 | | 1,456,029 | |
2,920,000 | | S | | Morgan Stanley Capital I, 4.827%, due 06/12/47 | | 2,788,921 | |
7,670,000 | | S | | Morgan Stanley Capital I, 5.007%, due 01/14/42 | | 7,393,623 | |
6,235,162 | | S | | Mortgage Capital Funding, Inc., 6.663%, due 03/18/30 | | 6,286,663 | |
1,804,000 | | S | | Nomura Asset Securities Corp., 6.690%, due 03/15/30 | | 1,881,385 | |
3,786,521 | | S | | Prudential Commercial Mortgage Trust, 3.669%, due 02/11/36 | | 3,572,826 | |
1,470,000 | | | | Wachovia Bank Commercial Mortgage Trust, 5.726%, due 06/15/45 | | 1,469,943 | |
1,470,000 | | | | Wachovia Bank Commercial Mortgage Trust, 5.935%, due 06/15/45 | | 1,476,949 | |
| | | | | | 124,716,600 | |
| | | | Whole Loan Collateral PAC: 0.6% | | | |
1,833,625 | | S | | MASTR Alternative Loans Trust, 8.500%, due 05/25/33 | | 1,859,218 | |
10,627,000 | | S | | Residential Funding Mortgage Securities II, Inc., 6.000%, due 07/25/16 | | 10,630,321 | |
| | | | | | 12,489,539 | |
| | | | Whole Loan Collateral CMO: 19.0% | | | |
9,048,957 | | S | | American Home Mortgage Investment Trust, 5.613%, due 11/25/45 | | 9,087,742 | |
7,465,390 | | S | | American Home Mortgage Investment Trust, 5.763%, due 11/25/45 | | 7,522,312 | |
13,337,963 | | S | | Banc of America Funding Corp., 5.277%, due 09/20/35 | | 12,865,924 | |
974,000 | | | | Banc of America Funding Corp., 5.640%, due 07/25/36 | | 974,000 | |
3,147,147 | | S | | Banc of America Funding Corp., 5.667%, due 09/20/35 | | 3,170,141 | |
6,583,384 | | S | | Banc of America Funding Corp., 5.750%, due 09/20/34 | | 6,338,074 | |
See Accompanying Notes to Financial Statements
74
| | PORTFOLIO OF INVESTMENTS |
ING VP INTERMEDIATE BOND PORTFOLIO | | AS OF JUNE 30, 2006 (UNAUDITED) (CONTINUED) |
|
Principal
Amount | | | | | | Value | |
| | | | Whole Loan Collateral CMO (continued) | | | |
$ | 6,606,958 | | S | | Banc of America Funding Corp., 6.595%, due 06/20/35 | | $ | 6,647,036 | |
2,389,335 | | S | | Banc of America Mortgage Securities, 5.250%, due 11/25/19 | | 2,319,267 | |
5,396,673 | | S | | Banc of America Mortgage Securities, 5.500%, due 06/25/35 | | 5,337,784 | |
95,668 | | | | Bank of America Alternative Loan Trust, 5.500%, due 11/25/35 | | 95,123 | |
3,427,465 | | S | | Bank of America Alternative Loan Trust, 6.500%, due 04/25/36 | | 3,414,032 | |
11,895,927 | | S | | Bank of America Alternative Loan Trust, 6.500%, due 05/25/36 | | 11,866,214 | |
2,205,066 | | S | | Bear Stearns Alt-A Trust, 5.643%, due 07/25/34 | | 2,208,737 | |
10,463,981 | | S | | Bear Stearns Asset Backed Securities, Inc., 5.653%, due 11/25/35 | | 10,474,207 | |
2,355,274 | | S | | Citigroup Mortgage Loan Trust, Inc., 5.443%, due 02/25/35 | | 2,357,441 | |
14,557,868 | | S | | Citigroup Mortgage Loan Trust, Inc., 6.000%, due 11/25/35 | | 14,420,326 | |
14,460,063 | | S | | Countrywide Alternative Loan Trust, 5.408%, due 10/25/35 | | 14,017,339 | |
2,129,627 | | S | | Countrywide Alternative Loan Trust, 5.500%, due 02/25/25 | | 2,107,769 | |
1,226,622 | | | | Countrywide Alternative Loan Trust, 5.623%, due 02/25/35 | | 1,227,856 | |
1,872,475 | | S | | Countrywide Alternative Loan Trust, 6.000%, due 05/25/36 | | 1,872,683 | |
20,557,201 | | S | | Countrywide Home Loan Mortgage Pass Through Trust, 5.390%, due 02/25/35 | | 20,688,767 | |
1,824,255 | | S | | CS First Boston Mortgage Securities Corp., 5.000%, due 08/25/20 | | 1,775,355 | |
15,509,484 | | S | | First Horizon Alternative Mortgage Securities, 5.500%, due 08/25/35 | | 15,059,094 | |
3,919,384 | | S | | GMAC Mortgage Corp. Loan Trust, 4.598%, due 10/19/33 | | 3,774,273 | |
9,571,439 | | S | | GMAC Mortgage Corp. Loan Trust, 5.259%, due 03/18/35 | | 9,232,700 | |
1,679,280 | | # | | GSMPS Mortgage Loan Trust, 5.673%, due 01/25/35 | | 1,687,527 | |
$ | 2,643,652 | | S | | Harborview Mortgage Loan Trust, 5.720%, due 01/19/35 | | $ | 2,654,748 | |
1,702,463 | | S | | Homebanc Mortgage Trust, 5.753%, due 08/25/29 | | 1,706,748 | |
1,640,761 | | S | | JP Morgan Alternative Loan Trust, 5.518%, due 01/25/36 | | 1,622,699 | |
15,000,000 | | S | | JP Morgan Alternative Loan Trust, 5.520%, due 08/25/36 | | 15,000,000 | |
12,637,337 | | S | | MASTR Adjustable Rate Mortgages Trust, 5.366%, due 06/25/35 | | 12,112,167 | |
6,412,378 | | S | | MASTR Alternative Loans Trust, 5.500%, due 01/25/20 | | 6,328,430 | |
766,509 | | | | MASTR Alternative Loans Trust, 6.500%, due 05/25/33 | | 768,694 | |
4,287,102 | | S | | MASTR Seasoned Securities Trust, 5.723%, due 10/25/32 | | 4,295,127 | |
2,692,275 | | S | | MLCC Mortgage Investors, Inc., 5.553%, due 04/25/29 | | 2,695,585 | |
1,241,128 | | | | MLCC Mortgage Investors, Inc., 5.643%, due 01/25/29 | | 1,242,946 | |
124,359 | | | | MortgageIT Trust, 5.693%, due 11/25/35 | | 124,367 | |
12,892,466 | | S | | Residential Accredit Loans, Inc., 5.500%, due 05/25/34 | | 11,861,662 | |
7,957,983 | | S | | Residential Accredit Loans, Inc., 5.500%, due 08/25/35 | | 8,003,839 | |
1,999,750 | | S | | Residential Accredit Loans, Inc., 5.553%, due 05/25/46 | | 1,999,001 | |
5,544,511 | | S | | Residential Accredit Loans, Inc., 5.723%, due 04/25/35 | | 5,566,167 | |
1,571,494 | | S | | Residential Funding Mtg Sec I, 5.773%, due 05/25/33 | | 1,579,121 | |
1,454,256 | | | | Sequoia Mortgage Trust, 5.648%, due 01/20/35 | | 1,456,930 | |
2,063,123 | | S | | Structured Adjustable Rate Mortgage Loan Trust, 5.633%, due 07/25/35 | | 2,073,298 | |
3,409,226 | | S | | Structured Asset Mortgage Investments, Inc., 5.610%, due 04/19/35 | | 3,416,150 | |
15,057,308 | | S | | Structured Asset Mortgage Investments, Inc., 6.274%, due 12/27/35 | | 15,311,293 | |
1,986,058 | | S | | Structured Asset Securities Corp., 5.500%, due 07/25/33 | | 1,894,824 | |
See Accompanying Notes to Financial Statements
75
| | PORTFOLIO OF INVESTMENTS |
ING VP INTERMEDIATE BOND PORTFOLIO | | AS OF JUNE 30, 2006 (UNAUDITED) (CONTINUED) |
|
Principal
Amount | | | | | | Value | |
| | | | Whole Loan Collateral CMO (continued) | | | |
$ | 3,665,925 | | S | | Thornburg Mortgage Securities Trust, 5.673%, due 12/25/33 | | $ | 3,673,846 | |
3,761,852 | | S | | Thornburg Mortgage Securities Trust, 5.693%, due 09/25/34 | | 3,777,937 | |
9,446,134 | | S | | Wamu Alternative Mortgage Pass-Through Certs., 5.252%, due 05/25/46 | | 9,430,982 | |
2,969,813 | | S | | Wamu Alternative Mortgage Pass-Through Certs., 5.252%, due 06/25/46 | | 2,969,813 | |
15,258,000 | | S | | Wamu Alternative Mortgage Pass-Through Certs., 5.621%, due 07/25/46 | | 15,258,000 | |
2,000,000 | | S | | Wamu Alternative Mortgage Pass-Through Certs., 5.681% due 06/25/36 | | 2,000,000 | |
15,788,078 | | S | | Wamu Alternative Mortgage Pass-Through Certs., 5.750%, due 02/25/36 | | 15,646,513 | |
2,568,285 | | S | | Washington Mutual, Inc., 5.545%, due 06/25/44 | | 2,576,181 | |
2,372,952 | | S | | Washington Mutual, Inc., 5.573%, due 01/25/45 | | 2,376,759 | |
15,964,133 | | S | | Washington Mutual, Inc., 5.627%, due 01/25/36 | | 15,480,308 | |
2,340,548 | | S | | Washington Mutual, Inc., 5.633%, due 01/25/45 | | 2,353,157 | |
4,374,777 | | S | | Washington Mutual, Inc., 5.723%, due 08/25/45 | | 4,403,569 | |
4,475,452 | | S | | Washington Mutual, Inc., 6.000%, due 06/25/34 | | 4,376,155 | |
5,950,000 | | S | | Wells Fargo Mortgage Backed Securities Trust, 4.500%, due 08/25/18 | | 5,502,508 | |
7,047,163 | | S | | Wells Fargo Mortgage Backed Securities Trust, 5.000%, due 12/25/33 | | 6,542,854 | |
11,107,077 | | S | | Wells Fargo Mortgage Backed Securities Trust, 5.387%, due 08/25/35 | | 10,751,520 | |
| | | | | | 379,375,621 | |
| | | | Whole Loan Collateral Support CMO: 0.1% | | | |
2,318,101 | | | | Banc of America Mortgage Securities, 5.500%, due 11/25/33 | | 2,251,715 | |
| | | | | | 2,251,715 | |
| | | | Total Collateralized Mortgage Obligations
(Cost $528,414,019) | | 518,833,475 | |
MUNICIPAL BONDS: 0.7% | | | |
| | | | Municipal: 0.7% | | | |
615,000 | | | | City of New York 5.000%, due 04/01/35 | | 622,774 | |
$ | 4,020,000 | | | | City of San Diego 7.125%, due 06/01/32 | | $ | 4,008,985 | |
9,410,000 | | | | Michigan Tobacco Settlement Finance Authority, 7.309%, due 06/01/34 | | 9,381,958 | |
| | | | Total Municipal Bonds
(Cost $14,061,089) | | 14,013,717 | |
OTHER BONDS: 0.2% | | | |
| | | | Sovereign: 0.2% | | | |
2,310,000 | | @@ | | Corp. Andina de Fomento CAF, 5.125%, due 05/05/15 | | 2,159,418 | |
2,415,000 | | @@,L | | Mexico Government International Bond, 6.750%, due 09/27/34 | | 2,354,625 | |
| | | | Total Other Bonds
(Cost $4,910,574) | | 4,514,043 | |
| | | | | | | |
Shares | | | | | | Value | |
PREFERRED STOCK: 1.9% | | | |
| | | | Banks: 0.4% | | | |
845 | | # | | DG Funding Trust | | 8,920,031 | |
| | | | | | 8,920,031 | |
| | | | Diversified Financial Services: 0.4% | | | |
285,000 | | C | | Merrill Lynch & Co., Inc. | | 7,059,450 | |
80,225 | | C | | National Rural Utilities Cooperative Finance Corp. | | 1,750,510 | |
| | | | | | 8,809,960 | |
| | | | Insurance: 0.8% | | | |
256,691 | | @@ | | Aegon NV | | 6,016,837 | |
100,168 | | @@ | | Aegon NV | | 2,529,242 | |
270,875 | | C | | Metlife, Inc. | | 6,671,651 | |
| | | | | | 15,217,730 | |
| | | | Real Estate Investment Trusts: 0.3% | | | |
204,807 | | C | | Duke Realty Corp. | | 5,028,012 | |
| | | | | | 5,028,012 | |
| | | | Total Preferred Stock
(Cost $39,299,288) | | 37,975,733 | |
| | | | Total Long-Term Investments
(Cost $2,148,665,980) | | 2,107,554,517 | |
SHORT-TERM INVESTMENTS: 18.8% | | | |
| | | | Commercial Paper: 1.1% | | | |
1,000,000 | | | | Cadbury Schweppes, 5.480%, due 08/08/06 | | 994,096 | |
2,700,000 | | | | Verizon Global Funding Corp., 5.200%, due 07/05/06 | | 2,698,050 | |
17,500,000 | | | | Volkswagen, 5.430%, due 07/05/06 | | 17,486,802 | |
| | | | Total Commercial Paper
(Cost $21,178,948) | | 21,178,948 | |
See Accompanying Notes to Financial Statements
76
| | PORTFOLIO OF INVESTMENTS |
ING VP INTERMEDIATE BOND PORTFOLIO | | AS OF JUNE 30, 2006 (UNAUDITED) (CONTINUED) |
|
Principal
Amount | | | | | | Value | |
| | Repurchase Agreement: 6.6% | | | |
$ | 132,675,000 | | Deutsche Bank Repurchase
Agreement dated 06/30/06, 5.180%, due 07/03/06, $132,732,271 to be received upon repurchase (Collateralized by $135,773,000 Federal National Mortgage Association, 5.625%, Market Value plus accrued interest $135,329,414 due 03/16/09) | | | $ | 132,675,000 | |
| | Total Repurchase Agreement
(Cost $132,675,000) | | 132,675,000 | |
| | Securities Lending
CollateralCC: 11.1% | | | |
222,577,281 | | The Bank of New York Institutional Cash Reserve Fund | | 222,577,281 | |
| | Total Securities Lending Collateral
(Cost $222,577,281) | | 222,577,281 | |
| | Total Short-Term Investments
(Cost $376,431,229) | | 376,431,229 | |
| | Total Investments In Securities
(Cost $2,525,097,209)* | | 124.3 | % | $ | 2,483,985,746 | |
| | Other Assets and Liabilities-Net | | (24.3 | ) | (486,284,194 | ) |
| | Net Assets | | 100.0 | % | $ | 1,997,701,552 | |
| | | | | | | | | | | | |
@@ Foreign Issuer
+ Step-up basis bonds. Interest rates shown reflect current coupon rates.
# Securities with purchases pursuant to Rule 144A, under the Securities Act of 1933 and may not be resold subject to that rulm except to qualified institutional buyers. These securities have been determined to be liquid under the guidelines established by the Funds’ Board of Directors/Trustees.
C Bond may be called prior to maturity date.
cc Securities purchased with cash collateral for securities loaned.
W When-issued or delayed delivery security.
S Segregated securities for certain derivatives, when-issued or delayed delivery securities and forward currency exchange contracts.
I Illiquid security
L Loaned security, a portion or all of the security is on loan at June 30, 2006.
** Defaulted security
* Cost for federal income tax purposes is $2,528,350,066.
Net unrealized depreciation consists of:
Gross Unrealized Appreciation | | $ | 429,964 | |
Gross Unrealized Depreciation | | (44,794,284 | ) |
Net Unrealized Depreciation | | $ | (44,364,320 | ) |
Information concerning open futures contracts at June 30, 2006 is shown below:
| | No. of
Contracts | | Notional
Market Value | | Expiration
Date | | Unrealized
Gain (Loss) | |
Long Contracts | | | | | | | | | |
U.S. 2 Year Note | | 1,197 | | $ | 242,729,168 | | 09/29/06 | | $ | (901,020 | ) |
U.S. 5 Year Treasury Note | | 1,164 | | 120,364,875 | | 09/29/06 | | (760,172 | ) |
| | | | $ | 363,094,043 | | | | $ | (1,661,192 | ) |
Short Contracts | | | | | | | | | |
U.S. 2 Year Note | | 342 | | $ | (35,861,908 | ) | 09/20/06 | | $ | 62,413 | |
U.S. Long Bond | | 455 | | (48,528,594 | ) | 09/20/06 | | 239,623 | |
| | | | $ | (84,390,502 | ) | | | $ | 302,036 | |
Information concerning the Interest Rate Swap Agreements outstanding for the ING VP Intermediate Bond Portfolio at June 30, 2006, is shown below:
| | Termination
Date | | Unrealized
Appreciation | |
Receive a floating rate based on 6-month USD-LIBOR plus 2.255% on $14,330,898 and pay a fixed rate equal to 1.000% on Y3,100,000,000. Upon termination of the contract, receive $14,330,898 and pay Y3,100,000,000.
Counterparty: UBS AG | | 03/01/34 | | $ | 897,504 | |
| | | | $ | 897,504 | |
Information concerning the credit default swap agreements outstanding for the ING VP Intermediate Bond Portfolio at June 30, 2006 is shown below:
Counterparty | | Reference
Entity/Obligation | | Buy/Sell
Protection | | (Pay)/Receive
Fixed Rate | | Expiration
Date | | Notional
Amount | | Unrealized
Appreciation/
(Depreciation) | |
Citibank N.A. | | Georgia Pacific 8.125% due 5/15/2011 | | Buy | | (3.55 | )% | 12/20/10 | | $ | 1,030,000 | | $ | (42,489 | ) |
UBS AG | | CDX.NA.IG.6 | | Buy | | (0.40 | )% | 6/20/11 | | $ | 55,217,800 | | (74,344 | ) |
Morgan Stanley | | CDX.NA.HY.6 | | Buy | | (3.45 | )% | 6/20/11 | | $ | 5,501,000 | | 11,923 | |
Morgan Stanley | | CDX.NA.HY.6 | | Buy | | (3.45 | )% | 6/20/11 | | $ | 5,501,000 | | (25,759 | ) |
UBS AG | | CDX.NA.HY.6 | | Buy | | (3.45 | )% | 6/20/11 | | $ | 5,501,000 | | (97,046 | ) |
Morgan Stanley | | CDX.NA.HY.6 | | Buy | | (3.45 | )% | 6/20/11 | | $ | 5,501,000 | | (21,794 | ) |
Citibank N.A. | | Windstream 8.125% due 8/1/2013 | | Buy | | (1.60 | )% | 9/20/11 | | $ | 2,885,000 | | (15,843 | ) |
UBS AG | | Windstream 8.125% due 8/1/2013 | | Buy | | (1.63 | )% | 9/20/11 | | $ | 2,750,500 | | (16,547 | ) |
| | | | | | | | | | | | $ | (281,899 | ) |
See Accompanying Notes to Financial Statements
77
| PORTFOLIO OF INVESTMENTS |
ING VP MONEY MARKET PORTFOLIO(1) | AS OF JUNE 30, 2006 (UNAUDITED) |
Investment Type Allocation
as of June 30, 2006
(as a percent of net assets)
Corporate Bonds/Notes | | 52.7 | % |
Commercial Paper | | 32.4 | % |
Repurchase Agreement | | 5.7 | % |
Collateralized Mortgage Obligations | | 5.2 | % |
Certificates of Deposit | | 4.6 | % |
Other Assets and Liabilities, Net* | | (0.6 | )% |
Total | | 100.0 | % |
* Includes short-term investments related to securities lending collateral.
Portfolio holdings are subject to change daily.
Principal
Amount | | | | | | Value | |
CERTIFICATE OF DEPOSIT: 4.6% | | | |
$ | 13,000,000 | | | | Barclays, 5.200%, due 08/24/2006 | | $ | 13,000,000 | |
33,000,000 | | | | BNP Paribas, 5.330%, due 08/08/06 | | 33,000,000 | |
8,000,000 | | | | Credit Suisse, 5.506%, due 02/02/07 | | 7,966,653 | |
| | | | Total Certificate Of Deposit (Cost $53,966,653) | | 53,966,653 | |
COLLATERALIZED MORTGAGE OBLIGATIONS: 5.2% | | | |
10,750,000 | | @@,#,C | | Cheyne High Grade CDO Ltd., 5.180%, due 11/10/06 | | 10,750,000 | |
13,900,000 | | @@,#,C,I | | Newcastle CDO I Ltd., 5.353%, due 09/24/38 | | 13,900,000 | |
13,900,000 | | #,C,I | | Newcastle CDO III Corp., 5.353%, due 09/24/38 | | 13,900,000 | |
13,700,000 | | @@,#,C | | Putnam Structured Product CDO, 5.219%, due 10/15/38 | | 13,700,000 | |
8,500,000 | | @@,#,C | | Whitehawk CDO Funding Ltd., 5.349%, due 09/15/06 | | 8,500,000 | |
| | | | Total Collateralized Mortgage Obligation (Cost $60,750,000) | | 60,750,000 | |
COMMERCIAL PAPER: 32.4% | | | |
21,000,000 | | | | Alliance & Leicester, 5.410%, due 09/22/06 | | 20,738,066 | |
3,000,000 | | | | ANZ National, 5.170%, due 04/04/07 | | 2,880,659 | |
17,000,000 | | | | ASB Bank, 5.385%, due 09/22/2006 | | 16,788,938 | |
10,000,000 | | | | Concord Minutemen Capital Co. LLC, 5.160%, due 07/05/06 | | 9,994,267 | |
8,077,000 | | | | Concord Minutemen Capital Co. LLC, 5.320%, due 07/24/06 | | 8,049,547 | |
10,000,000 | | | | Crown Point Cap, 5.120%, due 07/07/06 | | 9,992,789 | |
46,000,000 | | | | Crown Point Cap, 5.240%, due 07/14/06 | | 45,912,958 | |
11,100,000 | | | | Dexia Del, 5.350%, due 07/06/06 | | 11,091,752 | |
11,500,000 | | | | Duke Funding, 5.300%, due 07/13/06 | | 11,479,683 | |
$ | 21,000,000 | | | | Jupiter Sec, 5.290%, due 07/25/06 | | $ | 20,925,940 | |
11,000,000 | | | | Master FDG, 5.300%, due 07/31/2006 | | 10,951,417 | |
51,349,000 | | | | Monument Gardens, 5.410%, due 09/22/06 | | 50,735,813 | |
11,000,000 | | | | Old Line FDG, 5.300%, due 08/08/06 | | 10,938,461 | |
52,500,000 | | | | St. Germain, 5.275%, due 08/01/06 | | 52,266,055 | |
18,734,000 | | | | Three Pillars, 5.140%, due 07/07/06 | | 18,715,466 | |
5,000,000 | | | | Thunder Bay, 5.160%, due 07/20/06 | | 4,986,383 | |
54,000,000 | | | | Tulip Funding Co., 5.330%, due 07/31/06 | | 53,757,485 | |
8,000,000 | | | | Variable FDG, 5.210%, due 07/05/06 | | 7,995,369 | |
13,865,000 | | | | Yorktown Cap, 5.130%, due 07/11/06 | | 13,830,063 | |
| | | | Total Commercial Paper (Cost $382,031,111) | | 382,031,111 | |
CORPORATE BONDS/NOTES: 52.7% | | | |
25,000,000 | | # | | Allstate Life Global Funding II, 5.180%, due 11/09/06 | | 25,004,675 | |
15,000,000 | | # | | Allstate Life Global Funding II, 5.578%, due 04/02/07 | | 15,008,970 | |
24,800,000 | | | | American Express Bank FSB, 5.283%, due 01/26/07 | | 24,800,000 | |
16,000,000 | | | | American Express Bank FSB, 5.356%, due 12/01/06 | | 16,002,581 | |
6,239,000 | | | | American General Finance Corp., 4.004%, due 07/14/06 | | 6,242,917 | |
17,200,000 | | #,C | | American General Finance Corp., 5.299%, due 07/13/07 | | 17,199,850 | |
8,000,000 | | | | American General Finance Corp., 5.453%, due 03/15/07 | | 8,015,494 | |
17,100,000 | | @@,# | | American Honda Finance Corp., 5.216%, due 09/18/06 | | 17,100,000 | |
5,000,000 | | @@,# | | American Honda Finance Corp., 5.454%, due 09/21/06 | | 5,000,475 | |
9,500,000 | | # | | Bank of New York, 5.395%, due 07/27/07 | | 9,500,000 | |
12,300,000 | | | | Bear Stearns Cos., Inc., 5.179%, due 07/05/07 | | 12,300,000 | |
12,750,000 | | | | Bear Stearns Cos., Inc., 5.381%, due 07/27/07 | | 12,750,000 | |
6,000,000 | | | | Bear Stearns Cos., Inc., 5.506%, due 03/01/07 | | 6,007,362 | |
17,000,000 | | | | BNP Paribas, 5.286%, due 01/26/07 | | 17,000,000 | |
24,000,000 | | | | Credit Suisse, 5.015%, due 01/12/07 | | 23,992,862 | |
5,000,000 | | | | Credit Suisse, 5.470%, due 03/27/07 | | 4,999,746 | |
35,000,000 | | # | | Concord Minutemen Capital Co. LLC, 5.160%, due 07/12/07 | | 34,997,596 | |
41,000,000 | | | | Duke Funding, 5.118%, due 12/06/06 | | 41,000,000 | |
16,000,000 | | | | General Electric Capital Corp., 5.250%, due 07/09/07 | | 16,000,000 | |
See Accompanying Notes to Financial Statements
78
| PORTFOLIO OF INVESTMENTS |
ING VP MONEY MARKET PORTFOLIO(1) | AS OF JUNE 30, 2006 (UNAUDITED) (CONTINUED) |
| |
Principal
Amount | | | | | | Value | |
$ | 18,500,000 | | L | | General Electric Capital Corp., 5.497%, due 06/22/07 | | $ | 18,515,711 | |
3,500,000 | | | | Goldman Sachs Inc., 5.163%, due 01/09/07 | | 3,503,945 | |
10,500,000 | | I | | Goldman Sachs Inc., 5.190%, due 05/11/07 | | 10,500,000 | |
12,050,000 | | # | | Goldman Sachs Inc., 5.219%, due 07/13/07 | | 12,050,000 | |
11,000,000 | | I | | Goldman Sachs Inc., 5.224%, due 02/14/07 | | 11,000,000 | |
7,800,000 | | @@,# | | HBOS Treasury Services PLC, 5.396%, due 08/01/07 | | 7,800,000 | |
19,500,000 | | @@,# | | HBOS Treasury Services PLC, 5.530%, due 07/24/07 | | 19,500,000 | |
7,000,000 | | @@,# | | HBOS Treasury Services PLC, 7.722%, due 01/12/07 | | 6,915,482 | |
13,191,000 | | | | HSBC Finance Corp., 5.417%, due 03/01/07 | | 13,397,838 | |
1,980,000 | | | | Lehman Brothers Holdings, Inc., 5.598%, due 06/15/07 | | 2,028,182 | |
22,000,000 | | | | Merrill Lynch & Co., Inc., 5.280%, due 10/27/06 | | 22,007,978 | |
32,000,000 | | | | Merrill Lynch & Co., Inc., 5.320%, due 07/27/07 | | 32,000,000 | |
31,400,000 | | #,I | | Money Market Trust, 5.274%, due 07/10/07 | | 31,400,000 | |
1,047,000 | | | | Morgan Stanley, 4.037%, due 03/01/07 | | 1,056,643 | |
13,500,000 | | C | | Morgan Stanley, 5.410%, due 04/01/07 | | 13,537,088 | |
15,000,000 | | | | Morgan Stanley, 5.640%, due 01/12/07 | | 15,009,285 | |
30,500,000 | | | | PNC Bank, 5.320%, due 01/29/07 | | 30,499,500 | |
15,000,000 | | | | Toyota Motor Credit Corp., 5.276%, due 04/26/07 | | 15,000,000 | |
24,600,000 | | # | | Verizon Global Funding Corp., 5.439%, due 01/12/07 | | 24,600,000 | |
10,800,000 | | | | Wells Fargo & Co., 5.396%, due 08/02/07 | | 10,800,000 | |
7,800,000 | | | | Westpac Banking Corp., 5.340%, due 07/11/07 | | 7,800,000 | |
| | | | Total Corporate Bonds/Notes
(Cost $621,844,180) | | 621,844,180 | |
| | | |
REPURCHASE AGREEMENT: 5.7% | | | |
| | | |
67,459,000 | | | | Goldman Sachs Repurchase
Agreement dated 06/30/06, 5.230%, due 07/03/06, 67,488,401 to be received upon repurchase (Collateralized by $71,859,000 Federal Home Loan Mortgage Corporation, 5.125%, Market Value plus accrued interest $68,808,696, due 10/24/07). | | | 67,459,000 | |
| | | | Total Repurchase Agreement
(Cost $67,459,000) | | 67,459,000 | |
SECURITIES LENDING COLLATERALCC: 0.1% | | | |
$ | 867,863 | | | | The Bank of New York Institutional Cash Reserves Fund | | $ | 867,863 | |
| | | | Total Securities Lending Collateral
(Cost $867,863) | | 867,863 | |
| | | | Total Investments in Securities
(Cost $1,186,918,807)* | 100.7 | % | | | $ | 1,186,918,807 | |
| | | | Other Assets and Liabilities-Net | (0.7 | ) | | | (8,059,185 | ) |
| | | | Net Assets | 100.0 | % | | | $ | 1,178,859,622 | |
| | | | | | | | | | | | | |
(1) All securities with a maturity date greater than one year have either a variable rate, a demand feature, are prerefunded, or an optional or mandatory put resulting in an effective maturity of one year or less. Rate shown reflects current rate.
@@ Foreign Issuer
# Securities with purchases pursuant to Rule 144A, under the Securities Act of 1933 and may not be resold subject to that rule except to qualified institutional buyers. These securities have been determined to be liquid under the guidelines established by the Funds’ Board of Directors/Trustees.
C Bond may be called prior to maturity date.
cc Securities purchased with cash collateral for securities loaned.
I Illiquid security
L Loaned security, a portion or all of the security is on loan at June 30, 2006.
* Cost for federal income tax purposes is the same for financial statement purposes.
See Accompanying Notes to Financial Statements
79
ING VP GLOBAL SCIENCE AND | PORTFOLIO OF INVESTMENTS |
TECHNOLOGY PORTFOLIO | AS OF JUNE 30, 2006 (UNAUDITED) |
Country Allocation
as of June 30, 2006
(as a percent of net assets)
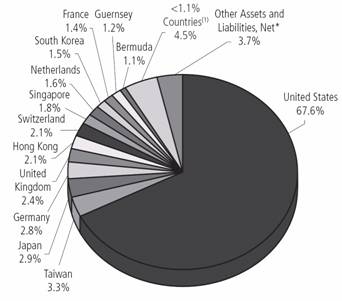
* Includes short-term investments related to securities lending collateral and U.S. government agency obligation.
(1) Includes seven countries, which each represents <1.1% of net assets.
Portfolio holdings are subject to change daily.
Shares | | | | | | Value | |
COMMON STOCK: 96.3% | | | |
| | | | Belgium: 0.8% | | | |
27,200 | | @,L | | Option NV | | $ | 651,578 | |
| | | | | | 651,578 | |
| | | | Bermuda: 1.1% | | | |
15,200 | | | | Accenture Ltd. | | 430,464 | |
10,700 | | @ | | Marvell Technology Group Ltd. | | 474,331 | |
| | | | | | 904,795 | |
| | | | Brazil: 0.3% | | | |
8,400 | | L | | Tim Participacoes SA ADR | | 231,420 | |
| | | | | | 231,420 | |
| | | | Finland: 1.0% | | | |
39,500 | | | | Nokia OYJ ADR | | 800,270 | |
| | | | | | 800,270 | |
| | | | France: 1.4% | | | |
49,600 | | @ | | Alcatel SA ADR | | 625,456 | |
5,000 | | | | Neopost SA | | 569,307 | |
| | | | | | 1,194,763 | |
| | | | Germany: 2.8% | | | |
15,200 | | | | MAN AG | | 1,100,127 | |
23,600 | | | | SAP AG ADR | | 1,239,472 | |
| | | | | | 2,339,599 | |
| | | | Guernsey: 1.2% | | | |
28,000 | | @ | | Amdocs Ltd. | | 1,024,800 | |
| | | | | | 1,024,800 | |
| | | | Hong Kong: 2.1% | | | |
135,000 | | L | | ASM Pacific Technology | | $ | 659,192 | |
123,000 | | | | China Mobile Hong Kong Ltd. | | 703,396 | |
20,500 | | @,L | | Tom Online, Inc. ADR | | 395,650 | |
| | | | | | 1,758,238 | |
| | | | India: 0.5% | | | |
51,000 | | @ | | Bharti Airtel Ltd. | | 410,611 | |
| | | | | | 410,611 | |
| | | | Japan: 2.9% | | | |
51,100 | | | | Nabtesco Corp. | | 574,484 | |
24,200 | | | | Nippon System Development Co., Ltd. | | 841,170 | |
8,800 | | | | Otsuka Corp. | | 992,350 | |
| | | | | | 2,408,004 | |
| | | | Mexico: 0.8% | | | |
19,300 | | | | America Movil SA de CV ADR | | 641,918 | |
| | | | | | 641,918 | |
| | | | Netherlands: 1.6% | | | |
42,800 | | @,L | | ASML Holding NV | | 865,416 | |
19,000 | | | | Ordina NV | | 439,147 | |
| | | | | | 1,304,563 | |
| | | | Norway: 0.4% | | | |
103,500 | | @,L | | Fast Search & Transfer ASA | | 328,692 | |
| | | | | | 328,692 | |
| | | | Singapore: 1.8% | | | |
45,000 | | @,L | | Chartered Semiconductor Manufacturing Ltd. ADR | | 391,500 | |
50,100 | | @ | | Flextronics International Ltd. | | 532,062 | |
900,000 | | @ | | STATS ChipPAC Ltd. | | 571,883 | |
| | | | | | 1,495,445 | |
| | | | South Korea: 1.5% | | | |
2,200 | | @ | | NHN Corp. | | 762,990 | |
700 | | | | Samsung Electronics Co., Ltd. | | 444,296 | |
| | | | | | 1,207,286 | |
| | | | Sweden: 0.7% | | | |
17,800 | | | | Telefonaktiebolaget LM Ericsson ADR | | 588,112 | |
| | | | | | 588,112 | |
| | | | Switzerland: 2.1% | | | |
19,750 | | | | Novartis AG ADR | | 1,064,920 | |
7,900 | | | | Roche Holding AG ADR | | 651,669 | |
| | | | | | 1,716,589 | |
| | | | Taiwan: 3.3% | | | |
100,000 | | | | Foxlink | | 405,978 | |
90,361 | | | | HON HAI Precision Industry Co., Ltd. | | 557,898 | |
507,640 | | | | Lite-On Technology Corp. | | 752,303 | |
244,000 | | | | Unimicron Technology Corp. | | 317,472 | |
569,000 | | @ | | Wistron Corp. | | 666,770 | |
| | | | | | 2,700,421 | |
| | | | United Kingdom: 2.4% | | | |
59,000 | | @ | | Autonomy Corp. PLC | | 446,808 | |
376,100 | | @ | | Colt Telecom Group PLC | | 406,862 | |
See Accompanying Notes to Financial Statements
80
ING VP GLOBAL SCIENCE AND | PORTFOLIO OF INVESTMENTS |
TECHNOLOGY PORTFOLIO | AS OF JUNE 30, 2006 (UNAUDITED) (CONTINUED) |
Shares | | | | | | Value | |
| | | | United Kingdom (continued) | | | |
117,800 | | | | Meggitt PLC | | $ | 694,329 | |
57,400 | | @ | | Wolfson Microelectronics PLC | | 474,814 | |
| | | | | | 2,022,813 | |
| | | | United States: 67.6% | | | |
16,400 | | @,L | | ADC Telecommunications, Inc. | | 276,504 | |
30,500 | | @,L | | Adobe Systems, Inc. | | 925,980 | |
58,900 | | @ | | Agere Systems, Inc. | | 865,830 | |
21,000 | | @ | | Agilent Technologies, Inc. | | 662,760 | |
40,600 | | @,L | | Akamai Technologies, Inc. | | 1,469,314 | |
45,600 | | @,L | | Alexion Pharmaceuticals, Inc. | | 1,647,072 | |
4,400 | | | | Allergan, Inc. | | 471,944 | |
13,000 | | | | Alltel Corp. | | 829,790 | |
20,300 | | | | Analog Devices, Inc. | | 652,442 | |
23,500 | | @ | | Apple Computer, Inc. | | 1,342,320 | |
52,500 | | L | | Applied Materials, Inc. | | 854,700 | |
31,600 | | @,L | | aQuantive, Inc. | | 800,428 | |
56,800 | | @ | | Atheros Communications, Inc. | | 1,076,928 | |
96,700 | | @,L | | BEA Systems, Inc. | | 1,265,803 | |
49,700 | | @,L | | BioMarin Pharmaceuticals, Inc. | | 714,189 | |
6,700 | | | | Black Box Corp. | | 256,811 | |
27,650 | | @ | | Broadcom Corp. | | 830,883 | |
52,100 | | @ | | Cadence Design Systems, Inc. | | 893,515 | |
33,700 | | @ | | Ceridian Corp. | | 823,628 | |
86,900 | | @ | | Cisco Systems, Inc. | | 1,697,157 | |
13,400 | | @,L | | Coherent, Inc. | | 451,982 | |
35,600 | | @ | | Corning, Inc. | | 861,164 | |
11,700 | | | | CR Bard, Inc. | | 857,142 | |
16,400 | | | | CVS Corp. | | 503,480 | |
11,400 | | @,L | | DaVita, Inc. | | 566,580 | |
9,000 | | @,L | | Edwards Lifesciences Corp. | | 408,870 | |
10,300 | | @,L | | Electronic Arts, Inc. | | 443,312 | |
44,400 | | @ | | EMC Corp. | | 487,068 | |
12,500 | | @ | | Fiserv, Inc. | | 567,000 | |
31,700 | | @ | | Foundry Networks, Inc. | | 337,922 | |
7,800 | | @ | | Genentech, Inc. | | 638,040 | |
10,700 | | @ | | Gilead Sciences, Inc. | | 633,012 | |
15,300 | | | | Goodrich Corp. | | 616,437 | |
3,600 | | @ | | Google, Inc. | | 1,509,588 | |
20,400 | | | | Harris Corp. | | 846,804 | |
44,800 | | | | Hewlett-Packard Co. | | 1,419,264 | |
21,700 | | @,L | | Huron Consulting Group, Inc. | | 761,453 | |
38,900 | | @ | | Informatica Corp. | | 511,924 | |
36,600 | | | | Intel Corp. | | 693,570 | |
13,300 | | | | International Business Machines Corp. | | 1,021,706 | |
17,400 | | | | Intersil Corp. | | 404,550 | |
61,900 | | @ | | Kemet Corp. | | 570,718 | |
41,878 | | @,L | | Keryx Biopharmaceuticals, Inc. | | 594,668 | |
11,600 | | L | | KLA-Tencor Corp. | | 482,212 | |
16,050 | | @,L | | Lam Research Corp. | | 748,251 | |
16,200 | | @ | | Leap Wireless International, Inc. | | 768,690 | |
15,900 | | | | Lockheed Martin Corp. | | 1,140,666 | |
18,400 | | | | Manor Care, Inc. | | 863,328 | |
19,300 | | @ | | MEMC Electronic Materials, Inc. | | 723,750 | |
18,900 | | | | Merck & Co., Inc. | | 688,527 | |
14,800 | | | | Microchip Technology, Inc. | | 496,540 | |
34,000 | | @ | | Micron Technology, Inc. | | 512,040 | |
39,300 | | | | Microsoft Corp. | | 915,690 | |
16,900 | | | | Molex, Inc. | | 567,333 | |
17,900 | | @ | | Monster Worldwide, Inc. | | 763,614 | |
35,900 | | | | Motorola, Inc. | | 723,385 | |
10,400 | | | | National Semiconductor Corp. | | 248,040 | |
32,400 | | @,L | | Network Appliance, Inc. | | $ | 1,143,720 | |
10,100 | | @,L | | Northstar Neuroscience, Inc. | | 104,838 | |
29,300 | | @ | | Oplink Communications, Inc. | | 536,483 | |
103,800 | | @ | | Oracle Corp. | | 1,504,062 | |
20,400 | | | | Qualcomm, Inc. | | 817,428 | |
11,300 | | | | Quest Diagnostics | | 677,095 | |
26,400 | | @ | | Regeneron Pharmaceuticals, Inc. | | 338,448 | |
15,886 | | @,L | | Renovis, Inc. | | 243,215 | |
33,500 | | | | Schering-Plough Corp. | | 637,505 | |
32,500 | | @,L | | Sybase, Inc. | | 630,500 | |
63,600 | | @,L | | TIBCO Software, Inc. | | 448,380 | |
60,600 | | @,L | | TTM Technologies, Inc. | | 876,882 | |
35,700 | | @,L | | Varian Medical Systems, Inc. | | 1,690,395 | |
21,195 | | @ | | Waters Corp. | | 941,058 | |
29,000 | | @,L | | Wright Medical Group, Inc. | | 606,970 | |
28,700 | | @,L | | Yahoo!, Inc. | | 947,100 | |
| | | | | | 55,850,397 | |
| | | | Total Common Stock
(Cost $75,435,049) | | 79,580,314 | |
Principal
Amount | | | | | | Value | |
SHORT-TERM INVESTMENTS: 19.9% | | | |
| | | | | | | |
| | | | U.S. Government Agency Obligation: 1.4% | | | |
$ | 1,200,000 | | | | Federal Home Loan Bank, 5.140%, due 07/14/06 | | 1,197,601 | |
| | | | Total U.S. Government Agency Obligation
(Cost $1,197,601) | | 1,197,601 | |
| | | | Securities Lending CollateralCC: 18.5% | | | |
15,269,180 | | | | The Bank of New York Institutional Cash Reserves Fund | | 15,269,180 | |
| | | | Total Securities Lending Collateral
(Cost $15,269,180) | | 15,269,180 | |
| | | | Total Short-Term Investments
(Cost $16,466,781) | | 16,466,781 | |
| | | | Total Investments In Securities
(Cost $91,901,830)* | 116.2 | % | | | $ | 96,047,095 | |
| | | | Other Assets and Liabilities-Net | (16.2 | ) | | | (13,405,448 | ) |
| | | | Net Assets | 100.0 | % | | | $ | 82,641,647 | |
| | | | | | | | | | | | |
@ Non-income producing security
ADR American Depositary Receipt
cc Securities purchased with cash collateral for securities loaned.
L Loaned security, a portion or all of the security is on loan at June 30, 2006.
* Cost for federal income tax purposes is $92,009,826.
Net unrealized appreciation consists of:
| | | | Gross Unrealized Appreciation | | | | | $ | 7,378,076 | |
| | | | Gross Unrealized Depreciation | | | | | (3,340,807 | ) |
| | | | Net Unrealized Appreciation | | | | | $ | 4,037,269 | |
See Accompanying Notes to Financial Statements
81
ING VP GLOBAL SCIENCE AND | PORTFOLIO OF INVESTMENTS |
TECHNOLOGY PORTFOLIO | AS OF JUNE 30, 2006 (UNAUDITED) (CONTINUED) |
| |
Industry | | Percentage of
Net Assets | |
Aerospace/Defense | | 3.0 | % | |
Biotechnology | | 3.9 | | |
Commercial Services | | 1.4 | | |
Computers | | 11.6 | | |
Electrical Components & Equipment | | 0.7 | | |
Electronics | | 6.4 | | |
Federal Home Loan Bank | | 1.4 | | |
Healthcare - Products | | 4.4 | | |
Healthcare - Services | | 2.6 | | |
Holding Companies - Diversified | | 0.5 | | |
Internet | | 8.6 | | |
Machinery - Diversified | | 2.0 | | |
Office/Business Equipment | | 0.7 | | |
Pharmaceuticals | | 6.2 | | |
Retail | | 0.6 | | |
Semiconductors | | 13.8 | | |
Software | | 11.6 | | |
Telecommunications | | 18.3 | | |
Securities Lending Collateral | | 18.5 | | |
Other Assets and Liabilities, Net | | (16.2 | ) | |
Net Assets | | 100.0 | % | |
See Accompanying Notes to Financial Statements
82
| | PORTFOLIO OF INVESTMENTS |
ING VP INTERNATIONAL EQUITY PORTFOLIO | | AS OF JUNE 30, 2006 (UNAUDITED) |
|
Country Allocation
as of June 30, 2006
(as a percent of net assets)
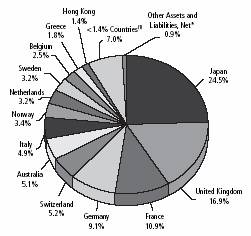
* Includes short-term investments related to securities lending collateral and repurchase agreement.
(1) Includes eight countries, which each represents < 1.4% of net assets.
Portfolio holdings are subject to change daily.
Shares | | | | | | Value | |
COMMON STOCK: 98.0% | | | |
| | | | Australia: 5.1% | | | |
61,938 | | | | BHP Billiton Ltd. | | $ | 1,339,649 | |
110,000 | | | | BlueScope Steel Ltd. | | 650,303 | |
35,700 | | | | National Australia Bank Ltd. | | 928,924 | |
46,800 | | | | QBE Insurance Group Ltd. | | 711,494 | |
| | | | | | 3,630,370 | |
| | | | Belgium: 2.5% | | | |
9,000 | | | | KBC Bancassurance Holding | | 965,932 | |
5,700 | | | | Umicore | | 761,002 | |
| | | | | | 1,726,934 | |
| | | | Brazil: 0.8% | | | |
6,600 | | | | Petroleo Brasileiro SA ADR | | 589,446 | |
| | | | | | 589,446 | |
| | | | China: 0.7% | | | |
291,000 | | | | China Life Insurance Co., Ltd. | | 460,977 | |
| | | | | | 460,977 | |
| | | | Egypt: 0.7% | | | |
12,700 | | | | Orascom Telecom Holding SAE GDR | | 524,250 | |
| | | | | | 524,250 | |
| | | | Finland: 1.0% | | | |
27,200 | | L | | Fortum OYJ | | 694,905 | |
| | | | | | 694,905 | |
| | | | France: 10.9% | | | |
72,809 | | | | Alcatel SA | | $ | 918,414 | |
10,113 | | @,# | | Atos Origin | | 661,101 | |
11,900 | | | | BNP Paribas | | 1,137,929 | |
10,800 | | | | Bouygues | | 554,567 | |
7,464 | | | | Lagardere SCA | | 550,184 | |
21,000 | | | | Total SA | | 1,379,529 | |
15,138 | | | | Veolia Environnement | | 781,079 | |
8,400 | | | | Vinci SA | | 863,813 | |
24,997 | | | | Vivendi Universal SA | | 873,212 | |
| | | | | | 7,719,828 | |
| | | | Germany: 9.1% | | | |
14,829 | | L | | DaimlerChrysler AG | | 730,389 | |
7,116 | | | | Deutsche Bank AG | | 799,356 | |
31,100 | | | | Deutsche Post AG | | 835,313 | |
75,900 | | | | Deutsche Telekom AG | | 1,218,146 | |
6,900 | | | | Fresenius Medical Care AG | | 789,239 | |
7,700 | | L | | Merck KGaA | | 699,945 | |
4,669 | | | | Muenchener Rueckversicherungs AG | | 637,112 | |
8,700 | | | | RWE AG | | 722,561 | |
| | | | | | 6,432,061 | |
| | | | Greece: 1.8% | | | |
19,137 | | | | Coca-Cola Hellenic Bottling Co. | | 569,834 | |
18,431 | | | | OPAP SA | | 669,818 | |
| | | | | | 1,239,652 | |
| | | | Hong Kong: 1.4% | | | |
55,000 | | | | Cheung Kong Holdings Ltd. | | 596,711 | |
60,000 | | | | Hong Kong Exchanges and Clearing Ltd. | | 386,328 | |
| | | | | | 983,039 | |
| | | | Indonesia: 0.8% | | | |
17,600 | | | | Telekomunikasi Indonesia Tbk PT ADR | | 564,960 | |
| | | | | | 564,960 | |
| | | | Ireland: 1.0% | | | |
40,200 | | | | Bank of Ireland | | 714,594 | |
| | | | | | 714,594 | |
| | | | Italy: 4.9% | | | |
141,235 | | L | | Banca Intesa S.p.A. | | 824,065 | |
31,700 | | | | ENI-Ente Nazionale Idrocarburi S.p.A. | | 931,124 | |
20,300 | | | | ERG S.p.A. | | 505,729 | |
26,308 | | | | Italcementi S.p.A | | 664,846 | |
46,500 | | L | | Mediaset S.p.A. | | 547,849 | |
| | | | | | 3,473,613 | |
| | | | Japan: 24.5% | | | |
28,200 | | | | Don Quijote Co., Ltd. | | 639,979 | |
141 | | | | East Japan Railway Co. | | 1,048,277 | |
16,400 | | | | Hoya Corp. | | 583,842 | |
245 | | | | Japan Tobacco, Inc. | | 894,737 | |
96,000 | | L | | Kawasaki Kisen Kaisha Ltd. | | 555,667 | |
93 | | | | Kenedix, Inc. | | 405,031 | |
17,800 | | | | Leopalace21 Corp. | | 613,187 | |
75 | | | | Mitsubishi Tokyo Financial Group, Inc. | | 1,051,346 | |
139 | | | | Mizuho Financial Group, Inc. | | 1,178,839 | |
See Accompanying Notes to Financial Statements
83
| | PORTFOLIO OF INVESTMENTS |
ING VP INTERNATIONAL EQUITY PORTFOLIO | | AS OF JUNE 30, 2006 (UNAUDITED)(CONTINUED) |
|
Shares | | | | | | Value | |
| | | | Japan (continued) | | | |
74,000 | | | | Nippon Shinpan Co., Ltd. | | $ | 599,275 | |
124 | | | | Nippon Telegraph & Telephone Corp. | | 605,440 | |
17,000 | | | | NOK Corp. | | 493,631 | |
4,400 | | | | Nomura Research Institute Ltd. | | 544,334 | |
8,800 | | | | Sankyo Co., Ltd. | | 558,569 | |
2,540 | | | | SFCG Co., Ltd. | | 578,518 | |
87,000 | | | | Sumitomo Chemical Co., Ltd. | | 725,945 | |
63,000 | | | | Sumitomo Corp. | | 832,882 | |
43,000 | | | | Sumitomo Electric Industries Ltd. | | 629,843 | |
122,000 | | | | Sumitomo Metal Industries Ltd. | | 504,052 | |
41,000 | | | | Sumitomo Rubber Industries, Inc. | | 451,556 | |
60,000 | | | | Sumitomo Trust & Banking Co., Ltd. | | 656,887 | |
121,000 | | | | Taisei Corp. | | 442,071 | |
41,000 | | | | Takashimaya Co., Ltd. | | 514,878 | |
16,100 | | | | Takeda Chemical Industries Ltd. | | 1,002,187 | |
119,000 | | | | Tokyo Gas Co., Ltd. | | 560,821 | |
23,500 | | | | Yamaha Motor Co., Ltd. | | 615,735 | |
| | | | | | 17,287,529 | |
| | | | Netherlands: 3.2% | | | |
17,359 | | | | European Aeronautic Defense and Space Co. | | 497,965 | |
49,689 | | | | Royal Dutch Shell PLC-Class B | | 1,735,615 | |
| | | | | | 2,233,580 | |
| | | | Norway: 3.4% | | | |
22,900 | | | | Norsk Hydro ASA | | 607,358 | |
13,750 | | @ | | Petrojarl ASA | | 90,564 | |
13,750 | | @ | | Petroleum Geo-Services ASA | | 833,011 | |
46,600 | | | | Storebrand | | 480,999 | |
24,808 | | @ | | Tandberg Television ASA | | 411,188 | |
| | | | | | 2,423,120 | |
| | | | Singapore: 0.9% | | | |
56,000 | | | | DBS Group Holdings Ltd. | | 639,793 | |
| | | | | | 639,793 | |
| | | | Sweden: 3.2% | | | |
42,840 | | @ | | Capio AB | | 768,636 | |
264,000 | | | | Telefonaktiebolaget LM Ericsson | | 871,245 | |
12,300 | | | | Volvo AB | | 604,413 | |
| | | | | | 2,244,294 | |
| | | | Switzerland: 5.2% | | | |
9,630 | | | | Roche Holding AG | | 1,589,071 | |
12,780 | | @ | | UBS AG | | 1,398,965 | |
3,122 | | | | Zurich Financial Services AG | | 683,478 | |
| | | | | | 3,671,514 | |
| | | | United Kingdom: 16.9% | | | |
22,275 | | | | AstraZeneca PLC | | 1,339,426 | |
102,126 | | @ | | British Airways PLC | | 646,967 | |
33,121 | | | | British American Tobacco PLC | | 833,898 | |
16,575 | | | | Carnival PLC | | 673,908 | |
139,800 | | | | Centrica Plc | | 736,161 | |
62,600 | | | | GlaxoSmithKline PLC | | 1,746,991 | |
69,569 | | | | HBOS PLC | | 1,207,307 | |
164,393 | | | | International Power PLC | | 863,420 | |
39,903 | | | | Royal Bank of Scotland Group PLC | | 1,309,821 | |
34,935 | | | | SABMiller PLC | | $ | 628,918 | |
45,305 | | | | Unilever PLC | | 1,017,229 | |
416,100 | | @ | | Vodafone Group PLC | | 885,609 | |
| | | | | | 11,889,655 | |
| | | | Total Common Stock
(Cost $59,765,481) | | 69,144,114 | |
PREFERRED STOCK: 1.1% | | | |
| | | | Germany 1.1% | | | |
7,100 | | L | | Henkel KGaA | | 810,597 | |
| | | | Total Preferred Stock
(Cost $710,032) | | 810,597 | |
| | | | Total Long-Term Investments
(Cost $60,475,513) | | 69,954,711 | |
| | | | | | | |
Principal
Amount | | | | | | Amount | |
SHORT-TERM INVESTMENTS: 5.1% | | | |
| | | | Repurchase Agreement: 0.7% | | | |
$ | 501,000 | | | | Goldman Sachs Repurchase Agreement dated 06/30/06, 5.230%, due 07/03/06, $501,218 to be received upon repurchase (Collateralized by $519,000 Federal Home Loan Mortgage Corporation, 5.250% Market Value plus accrued interest $511,465, due 04/18/16) | | 501,000 | |
| | | | Total Repurchase Agreement
(Cost $501,000) | | 501,000 | |
| | | | | | | |
| | | | Securities Lending CollateralCC: 4.4% | | | |
3,077,059 | | | | The Bank of New York Institutional Cash Reserve Fund | | 3,077,059 | |
| | | | Total Securities Lending Collateral
(Cost $3,077,059) | | 3,077,059 | |
| | | | Total Short-Term Investments
(Cost $3,578,059) | | 3,578,059 | |
| | | | Total Investments In Securities
(Cost $64,053,572)* | | 104.2 | % | $ | 73,532,770 | |
| | | | Other Assets and Liabilities-Net | | (4.2 | ) | (2,977,383 | ) |
| | | | Net Assets | | 100.0 | % | $ | 70,555,387 | |
| | | | | | | | | | | |
@ Non-income producing security
ADR American Depositary Receipt
GDR Global Depositary Receipt
cc Securities purchased with cash collateral for securities loaned.
L Loaned security, a portion or all of the security is on loan at June 30, 2006.
* Cost for federal income tax purposes is $64,225,775.
Net unrealized appreciation consists of:
Gross Unrealized Appreciation | | $ | 11,040,330 | |
Gross Unrealized Depreciation | | (1,733,335 | ) |
Net Unrealized Appreciation | | $ | 9,306,995 | |
See Accompanying Notes to Financial Statements
84
| | PORTFOLIO OF INVESTMENTS |
ING VP INTERNATIONAL EQUITY PORTFOLIO | | AS OF JUNE 30, 2006 (UNAUDITED)(CONTINUED) |
|
Industry | | Percentage of
Net Assets | |
Aerospace/Defense | | 0.7 | % |
Agriculture | | 2.5 | |
Airlines | | 0.9 | |
Auto Manufacturers | | 1.9 | |
Auto Parts & Equipment | | 1.3 | |
Banks | | 18.2 | |
Beverages | | 1.7 | |
Building Materials | | 1.0 | |
Chemicals | | 2.1 | |
Computers | | 0.9 | |
Distribution/Wholesale | | 1.2 | |
Diversified Financial Services | | 2.8 | |
Electric | | 3.2 | |
Electrical Components & Equipment | | 0.9 | |
Electronics | | 0.8 | |
Engineering & Construction | | 2.6 | |
Entertainment | | 1.0 | |
Food | | 1.4 | |
Gas | | 1.8 | |
Healthcare - Services | | 2.2 | |
Household Products/Wares | | 1.2 | |
Insurance | | 4.2 | |
Iron/Steel | | 1.6 | |
Leisure Time | | 2.6 | |
Media | | 2.8 | |
Mining | | 1.9 | |
Oil & Gas | | 8.2 | |
Oil & Gas Services | | 1.2 | |
Pharmaceuticals | | 9.0 | |
Real Estate | | 1.7 | |
Retail | | 1.6 | |
Software | | 0.8 | |
Telecommunications | | 8.5 | |
Transportation | | 3.6 | |
Water | | 1.1 | |
Repurchase Agreement | | 0.7 | |
Securities Lending Collateral | | 4.4 | |
Other Assets and Liabilities, Net | | | (4.2 | ) |
Total Net Assets | | | 100.0 | % |
| | | | | |
See Accompanying Notes to Financial Statements
85
SHAREHOLDER MEETING INFORMATION (UNAUDITED)
A meeting of shareholders of the ING Variable Products Trust was held March 16, 2006, at the offices of ING Funds, 7337 East Doubletree Ranch Road, Scottsdale, AZ 85258.
A brief description of each matter voted upon as well as the results are outlined below:
Matters:
1 To approve an Agreement and Plan of Reorganization by and among VP Convertible Portfolio and ING VP Balanced Portfolio (“VP Balanced”), providing for the reorganization of VP Convertible Portfolio with and into VP Balanced; and
2 To transact such other business, not currently contemplated, that may properly come before the Special Meeting, or any adjournment(s) or postponement(s) thereof, in the discretion of the proxies or their substitutes.
Results:
| | Proposal | | Shares voted for | | Shares voted
against or
withheld | | Shares
abstained | | Broker
non-vote | | Total Shares
Voted | |
ING VP Convertible Portfolio | | 1 | | 673,947 | | 9,538 | | 32,267 | | — | | 715,752 | |
A joint meeting of shareholders of the USLICO Series Fund was held April 6, 2006, at the offices of ING Funds, 7337 East Doubletree Ranch Road, Scottsdale, AZ 85258.
A brief description of each matter voted upon as well as the results are outlined below:
Matters:
1 The Asset Allocation Portfolio Only. To approve an Agreement and Plan of Reorganization (“Reorganization Agreement”) by and among The Asset Allocation Portfolio and ING VP Balanced Portfolio, a series of ING VP Balanced Portfolio, Inc., providing for the reorganization of The Asset Allocation Portfolio with and into ING VP Balanced Portfolio;
2 The Bond Portfolio Only. To approve an Agreement and Plan of Reorganization (“Reorganization Agreement”) by and among The Bond Portfolio and ING VP Intermediate Bond Portfolio, a series of ING VP Intermediate Bond Portfolio, providing for the reorganization of The Bond Portfolio with and into ING VP Intermediate Bond Portfolio;
3 The Money Market Portfolio Only. To approve an Agreement and Plan of Reorganization (“Reorganization Agreement”) by and among The Money Market Portfolio and ING Liquid Assets Portfolio, a series of ING Investors Trust, providing for the reorganization of The Money Market Portfolio with and into ING Liquid Assets Portfolio;
4 The Stock Portfolio Only. To approve an Agreement and Plan of Reorganization (“Reorganization Agreement”) by and among The Stock Portfolio and ING Fundamental Research Portfolio, a series of ING Partners, Inc., providing for the reorganization of The Stock Portfolio with and into ING Fundamental Research Portfolio;
Results:
| | Proposal | | Shares voted for | | Shares voted
against or
withheld | | Shares
abstained | | Broker
non-vote | | Total Shares
Voted | |
The Asset Allocation Portfolio Only | | 1 | | 1,229,166 | | | 71,789 | | | 61,839 | | | — | | 1,362,795 | | |
The Bond Portfolio Only | | 2 | | 239,071 | | | 40,013 | | | 17,969 | | | — | | 297,053 | | |
The Money Market Portfolio Only | | 3 | | 5,195,232 | | | 151,805 | | | 348,778 | | | — | | 5,695,815 | | |
The Stock Portfolio Only | | 4 | | 1,935,352 | | | 158,693 | | | 72,796 | | | — | | 2,166,841 | | |
86
Investment Manager
ING Investments, LLC
7337 East Doubletree Ranch Road
Scottsdale, Arizona 85258
Administrator
ING Funds Services, LLC
7337 East Doubletree Ranch Road
Scottsdale, Arizona 85258
Distributor
ING Funds Distributor, LLC
7337 East Doubletree Ranch Road
Scottsdale, Arizona 85258
1-800-334-3444
Legal Counsel
Goodwin Procter LLP
Exchange Place
53 State Street
Boston, Massachusetts 02109
Transfer Agent
DST Systems, Inc.
P.O. Box 419368
Kansas City, Missouri 64141
Custodian
The Bank of New York
100 Colonial Center Parkway, Suite 300
Lake Mary, Florida 32746
Before investing, carefully consider the investment objectives, risks, charges and expenses of the variable annuity contract and the underlying variable investment options. This and other information is contained in the prospectus for the variable annuity contract and the underlying variable investment options. Obtain these prospectuses from your agent/registered representative and read them carefully before investing.

| | VPSAR-ACAPAPPIS (0606-081606) |
ITEM 2. CODE OF ETHICS.
Not required for semi-annual filing.
ITEM 3. AUDIT COMMITTEE FINANCIAL EXPERT.
Not required for semi-annual filing.
ITEM 4. PRINCIPAL ACCOUNTANT FEES AND SERVICES.
Not required for semi-annual filing.
ITEM 5. AUDIT COMMITTEE OF LISTED REGISTRANTS.
Not required for semi-annual filing.
ITEM 6. SCHEDULE OF INVESTMENTS.
Schedule is included as part of the report to shareholders filed under Item 1 of this Form.
ITEM 7. DISCLOSURE OF PROXY VOTING POLICIES AND PROCEDURES FOR CLOSED-END MANAGEMENT INVESTMENT COMPANIES.
Not applicable.
ITEM 8. PORTFOLIO MANAGERS OF CLOSED-END MANAGEMENT INVESTMENT COMPANIES.
Not applicable.
ITEM 9. PURCHASES OF EQUITY SECURITIES BY CLOSED-END MANAGEMENT INVESTMENT COMPANY AND AFFILIATED PURCHASERS.
Not applicable.
ITEM 10. SUBMISSION OF MATTERS TO A VOTE OF SECURITY HOLDERS.
The Nominating Committee operates pursuant to a Charter approved by the Board. The primary purpose of the Nominating Committee is to consider, evaluate and make recommendations to the Board with respect to the nomination and selection of Independent Trustees. In evaluating candidates, the Nominating Committee may consider a variety of factors, but specific qualifications of candidates for Board membership will be based on the needs of the Board at the time of nomination.
The Nominating Committee is willing to consider nominations received from shareholders and shall assess shareholder nominees in the same manner as it reviews nominees it identifies. A shareholder nominee for director should be submitted in writing to the Fund’s Secretary. Any such shareholder nomination should include sufficient background information concerning the candidate and should be received in a timely manner. At a minimum, the following information as to each individual proposed for nomination as director should be included: the individual’s written consent to be named in the proxy statement as a nominee (if nominated) and to serve as a director (if elected), and all information relating to such individual that is required to be disclosed in a solicitation of proxies for election of directors, or is otherwise required, in each case under applicable federal securities laws, rules and regulations.
The Secretary shall submit all nominations received in a timely manner to the Nominating Committee. To be timely, any such submission must be delivered to the Fund’s Secretary not earlier than the 90th day prior to such meeting and not later than the close of business on the later of the 60th day prior to such meeting or the 10th day following the day on which public announcement of the date of the meeting is first made, by either disclosure in a press release or in a document publicly filed by the Fund with the SEC.
In evaluating a candidate for the position of Independent Trustee, including any candidate recommended by shareholders of the Fund, the Nominating Committee shall consider the following: (i) the candidate’s knowledge in matters relating to the mutual fund industry; (ii) any experience possessed by the candidate as a director or senior officer of other public companies; (iii) the candidate’s educational background, reputation for high ethical standards and professional integrity; (iv) any specific financial, technical or other expertise possessed by the candidate, and the extent to which such expertise would complement the Board’s existing mix of skills, core competencies and qualifications; (v) the candidate’s perceived ability to contribute to the ongoing functions of the Board, including the candidate’s ability and commitment to attend meetings regularly and work collaboratively with other members of the Board; (vi) the candidate’s ability to qualify as an Independent Trustee for purposes of the 1940 Act; and (vii) such other factors as the Committee determines to be relevant in light of the existing composition of the Board and any anticipated vacancies. Prior to making a final recommendation to the Board, the Committee shall conduct personal interviews with those candidates it concludes are the most qualified candidates.
ITEM 11. CONTROLS AND PROCEDURES.
(a) Based on our evaluation conducted within 90 days of the filing date, hereof, the design and operation of the registrant’s disclosure controls and procedures are effective to ensure that material information relating to the registrant is made known to the certifying officers by others within the appropriate entities, particularly during the period in which Forms N-CSR are being prepared, and the registrant’s disclosure controls and procedures allow timely preparation and review of the information for the registrant’s Form N-CSR and the officer certifications of such Form N-CSR.
(b) There were no significant changes in the registrant’s internal controls that occurred during the second fiscal quarter of the period covered by this report that has materially affected, or is reasonably likely to materially affect, the registrant’s internal control over financial reporting.
ITEM 12. EXHIBITS.
(a)(1) The Code of Ethics is not required for the semi-annual filing.
(a)(2) A separate certification for each principal executive officer and principal financial officer of the registrant as required by Rule 30a-2 under the Act (17 CFR 270.30a-2) is attached hereto as EX-99.CERT.
(a)(3) Not required for semi-annual filing.
(b) The officer certifications required by Section 906 of the Sarbanes-Oxley Act of 2002 are attached hereto as EX-99.906CERT
SIGNATURES
Pursuant to the requirements of the Securities Exchange Act of 1934 and the Investment Company Act of 1940, the registrant has duly caused this report to be signed on its behalf by the undersigned, thereunto duly authorized.
(Registrant): ING Variable Funds |
| |
| |
By | /s/ | James M. Hennessy | |
| | James M. Hennessy | |
| | President and Chief Executive Officer |
|
Date: | August 30, 2006 | |
|
Pursuant to the requirements of the Securities Exchange Act of 1934 and the Investment Company Act of 1940, this report has been signed below by the following persons on behalf of the registrant and in the capacities and on the dates indicated. |
| |
| |
By | /s/ | James M. Hennessy | |
| | James M. Hennessy | |
| | President and Chief Executive Officer |
| |
Date: | August 30, 2006 | |
| |
| |
By | /s/ | Todd Modic | |
| | Todd Modic | |
| | Senior Vice President and Chief Financial Officer |
| |
| |
Date: | August 30, 2006 | |
| | | | | | |