| | OMB APPROVAL |
| | OMB Number: | 3235-0570 |
| | Expires: | April 30, 2008 |
| UNITED STATES | Estimated average burden hours per response. . . . . . . . . . . . . . . . .19.4 |
| SECURITIES AND EXCHANGE COMMISSION | |
| Washington, D.C. 20549 | |
| | | | |
FORM N-CSR
CERTIFIED SHAREHOLDER REPORT OF REGISTERED
MANAGEMENT INVESTMENT COMPANIES
Investment Company Act file number | 811-2514 |
|
ING Variable Funds |
(Exact name of registrant as specified in charter) |
|
7337 E. Doubletree Ranch Rd., Scottsdale, AZ | | 85258 |
(Address of principal executive offices) | | (Zip code) |
|
CT Corporation System, 101 Federal Street, Boston, MA 02110 |
(Name and address of agent for service) |
|
Registrant’s telephone number, including area code: | 1-800-992-0180 | |
|
Date of fiscal year end: | December 31 | |
|
Date of reporting period: | January 1, 2007 to June 30, 2007 | |
| | | | | | | | | |
ITEM 1. REPORTS TO STOCKHOLDERS.
The following is a copy of the report transmitted to stockholders pursuant to Rule 30e-1 under the Act (17 CFR 270.30e-1):

Funds
Semi-Annual Report
June 30, 2007
Classes ADV, I and S
ING Variable Product Funds
Domestic Equity and Income Portfolios
n ING VP Balanced Portfolio
n ING VP Growth and Income Portfolio
Fixed Income Portfolios
n ING VP Intermediate Bond Portfolio
n ING VP Money Market Portfolio
Domestic Equity Growth Portfolios
n ING VP Growth Portfolio
n ING VP Small Company Portfolio
Global and International Equity Portfolios
n ING VP Global Science and Technology Portfolio
n ING VP International Equity Portfolio
Domestic Equity Value Portfolio
n ING VP Value Opportunity Portfolio
This report is submitted for general information to shareholders of the ING Funds. It is not authorized for distribution to prospective shareholders unless accompanied or preceded by a prospectus which includes details regarding the funds' investment objectives, risks, charges, expenses and other information. This information should be read carefully.

TABLE OF CONTENTS
| President's Letter | | | 1 | | |
|
| Market Perspective | | | 2 | | |
|
| Shareholder Expense Examples | | | 4 | | |
|
| Statements of Assets and Liabilities | | | 7 | | |
|
| Statements of Operations | | | 10 | | |
|
| Statements of Changes in Net Assets | | | 13 | | |
|
| Financial Highlights | | | 18 | | |
|
| Notes to Financial Statements | | | 33 | | |
|
| Portfolios of Investments | | | 51 | | |
|
PROXY VOTING INFORMATION
A description of the policies and procedures that the Portfolios use to determine how to vote proxies related to portfolio securities is available (1) without charge, upon request, by calling Shareholder Services toll-free at (800) 992-0180; (2) on the ING Funds' website at www.ingfunds.com; and (3) on the SEC's website at www.sec.gov. Information regarding how the Portfolios voted proxies related to portfolio securities during the most recent 12-month period ended June 30 is available without charge on the ING Funds' website at www.ingfunds.com and on the SEC's website at www.sec.gov.
QUARTERLY PORTFOLIO HOLDINGS
The Portfolios file their complete schedule of portfolio holdings with the SEC for the first and third quarters of each fiscal year on Form N-Q. The Portfolios' Forms N-Q are available on the SEC's website at www.sec.gov. The Portfolios' Forms N-Q may be reviewed and copied at the SEC's Public Reference Room in Washington, DC, and information on the operation of the Public Reference Room may be obtained by calling (800) SEC-0330; and is available upon request from the Portfolios by calling Shareholder Services toll-free at (800) 992-0180.
(THIS PAGE INTENTIONALLY LEFT BLANK)
PRESIDENT'S LETTER

Dear Shareholder,
So far, it has been a volatile year in the markets. In February, we saw an unprecedented, single-day freefall in Chinese stocks that sent tremors throughout global markets. Closer to home, we witnessed a downturn in the U.S. sub-prime mortgage industry that continues to impact fixed income investments as well as real estate and equity markets worldwide.
When friends and colleagues in the industry voice concerns about the market's recent volatility, I remind them that such ongoing events are fairly normal and that they underscore the importance of a well-diversified investment strategy. Studies have shown that an investment strategy allocated across a diverse group of asset classes and investment sectors can help provide an investor with solid footing for the long-term despite the short-term commotions.
We at ING Funds remain committed to providing our clients with a diverse and comprehensive line-up of innovative investment products — all designed to offer solutions to your investment needs. Whatever your investing goals, we look forward to continuing to serve you.

Shaun Mathews
President
ING Funds
August 10, 2007
The views expressed in the President's Letter reflect those of the President as of the date of the letter. Any such views are subject to change at any time based upon market or other conditions and ING Funds disclaims any responsibility to update such views. These views may not be relied on as investment advice and because investment decisions for an ING Fund are based on numerous factors, may not be relied on as an indication of investment intent on behalf of any ING Fund. Reference to specific company securities should not be construed as recommendations or investment advice.
International investing does pose special risks including currency fluctuation, economic and political risks not found in investments that are solely domestic.
1
MARKET PERSPECTIVE: SIX MONTHS ENDED JUNE 30, 2007
Investors will remember early 2007 for the well-anticipated shocks and corrections that finally struck. But global equities markets soon recovered their poise and provided good gains through May 2007 before some nervousness returned in June 2007. For the six months ended June 30, 2007, the Morgan Stanley Capital International World IndexSM(1) ("MSCI World Index") measured in local currencies, including net reinvested dividends ("MSCI" for regions discussed below) added 8.2%. In currencies, the dollar's early strides were retraced on the (perceived) certainty that European interest rates were on the way up, while those in the U.S. were not. The euro made a new closing high and the pound reached the best level in 25 years against the dollar. The yen however buckled under the "carry trade", in which speculators borrow in yen at low interest and buy higher yielding securities in other currencies. For the six months ended June 30, 2007, the dollar fell 2.5% against the euro and the pound, but gained 3.5% on the yen.
U.S. markets entered 2007 against a backdrop of a stable federal funds rate since June 2007. A slowing economy dragged by a slumping housing market seemed to be on the rebound in December 2006. The early reports in 2007 sustained this view, with unexpectedly strong employment, retail sales and confidence readings, as well as robust increases in housing starts and pending home sales. The first estimate of fourth quarter gross domestic product ("GDP") growth was an impressive 3.5%.
But from February 2007, it soon became apparent that the improvement in housing figures only reflected the mild weather of early winter. New starts, sales and prices were now falling. GDP growth was sharply revised down to 2.5%. To make matters worse, the country's largest sub-prime mortgage lenders were reporting major losses.
February 2007 was an unsettling month in other ways. The China stock market had practically doubled in 2006 and the long expected pull back eventually came on February 27th when the index fell 9%. The effect on sentiment was to shake relative risk strategies generally.
The housing gloom continued into the second quarter. Foreclosures in May 2007 were 90% higher than one year earlier. Existing housing prices fell in the first quarter year over year for the first time since 1991. The sub-prime dragon reared its head again in June 2007 when the investment bank, Bear Stearns, had to rescue two of its hedge funds in distress over holdings in mortgage bonds. The effect on GDP was clear. Growth in the latest quarter was finalized at just 0.69% annualized, the lowest since 2003.
Yet the feeling persisted that while the sub-prime debacle was serious, the chance of it tripping the economy into recession was remote. Unemployment remained light at 4.5%. The consumer was still spending, although as June ended high gasoline prices were weighing on consumer confidence. And the chances of a rate cut had all but vanished as the Federal Open Market Committee ("FOMC") in leaving the federal funds rate at 5.25%, made it clear that "...a sustained moderation in inflation pressures has yet to be convincingly demonstrated."
In U.S. fixed income markets the yield curve became steeper, with the yield on the ten-year Treasury Note making a five-year high before slipping to 5.03%, up 32 basis points (0.32%) for the six months ended June 30, 2007, while that on the three-month Bill fell 22 basis points (0.22%) to 4.67%. This surely reflected the confidence-shaking events of February 2007, as well as the FOMC's somewhat curious removal of its tightening bias on March 21, 2007, while still citing inflation as the predominant concern. For the six months ended June 30, 2007, the Lehman Brothers® Aggregate Bond Index(2) ("LBAB") of investment grade bonds r eturned just 98 basis points (0.98%).
U.S. equities, represented by the Standard & Poor's 500® Composite Stock Price Index(3) ("S&P 500® Index") including dividends, rose 7.0%, finally breaching its March 2000 record. Investors might have been depressed in anticipation of the first quarter in fifteen with less than double-digit year-over-year percentage profits growth for companies that make up the S&P 500® Index. But the earnings growth rate of 8.6% that emerged was much better than had been feared. Sentiment was also boosted by takeover activity, much of it from private equity firms able to draw from an apparently bottomless well of liquidity. By early June 2007 however, nerves were getting frayed as 10-year bond yields pushed through 5% and on the Bear Stearns' news, unlikely to be an isolated case. Led by financials and the interest sensitive utilities sectors, the S&P 500® Index gave back 1.7% in June.
Internationally, the MSCI Japan® Index(4) rose 6.6% for the six month ended June 30, 2007, amid the usual contradictory mix of economic statistics. GDP growth held up well after the fastest quarterly expansion in three years. Unemployment remained at a nine-year low. But consumer prices and wages started falling
2
MARKET PERSPECTIVE: SIX MONTHS ENDED JUNE 30, 2007
again, forcing the Bank of Japan, which raised interest rates in February 2007 to a still wafer-thin 0.5%, to leave them there, keeping the carry trade in business. The MSCI Europe ex UK® Index(5) surged 11.2% on the basis of high consumer and business confidence, the lowest Eurozone unemployment since records began, the fastest GDP growth in years and continuing merger and acquisition activity. But June 2007 saw sentiment tail off somewhat as the ascending euro threatened exports and the European Central Bank raised rates for the eighth time since late 2005. In the UK, a housing boom and robust service sector had raised year over year GDP growth to 3.0% amid buoyant retail sales, confident consumers and record profits for non-financial companies. The MSCI UK® Index(6) advanced 8.1% for the six months ended June 30, 2007, although again slipping in June as home price inflation and retail sales cooled after the Bank of England raised rates to 5.5%, a six-year high.
(1) The MSCI World IndexSM is an unmanaged index that measures the performance of over 1,400 securities listed on exchanges in the U.S., Europe, Canada, Australia, New Zealand and the Far East.
(2) The LBAB Index is a widely recognized, unmanaged index of publicly issued investment grade U.S. Government, mortgage-backed, asset-backed and corporate debt securities.
(3) The S&P 500® Index is an unmanaged index that measures the performance of securities of approximately 500 of the largest companies in the United States.
(4) The MSCI Japan® Index is a free float-adjusted market capitalization index that is designed to measure developed market equity performance in Japan.
(5) The MSCI Europe ex UK® Index is a free float rising adjusted market capitalization index that is designed to measure developed market equity performance in Europe, excluding the UK.
(6) The MSCI UK® Index is a free float-adjusted market capitalization index that is designed to measure developed market equity performance in the UK.
All indices are unmanaged and investors cannot invest directly in an index.
Past performance does not guarantee future results. The performance quoted represents past performance. Investment return and principal value of an investment will fluctuate, and shares, when redeemed, may be worth more or less than their original cost. The Portfolios' performance is subject to change since the period's end and may be lower or higher than the performance data shown. Please call (800) 992-0180 or log on to www.ingfunds.com to obtain performance data current to the most recent month end.
Market Perspective reflects the views of ING's Chief Investment Risk Officer only through the end of the period, and is subject to change based on market and other conditions.
3
SHAREHOLDER EXPENSE EXAMPLES (UNAUDITED)
As a shareholder of a Portfolio, you incur two types of costs: (1) transaction costs, including redemption fees and exchange fees; and (2) ongoing costs, including management fees, distribution and/or service (12b-1) fees, and other Portfolio expenses. These Examples are intended to help you understand your ongoing costs (in dollars) of investing in a Portfolio and to compare these costs with the ongoing costs of investing in other mutual funds.
The Examples are based on an investment of $1,000 invested at the beginning of the period and held for the entire period from January 1, 2007 to June 30, 2007. The Portfolios' expenses are shown without the imposition of any charges which are, or may be, imposed under your annuity contract. Expenses would have been higher if such charges were included.
Actual Expenses
The first section of the table shown, "Actual Portfolio Return," provides information about actual account values and actual expenses. You may use the information in this section, together with the amount you invested, to estimate the expenses that you paid over the period. Simply divide your account value by $1,000 (for example, an $8,600 account value divided by $1,000 = 8.6), then multiply the result by the number in the first section under the heading entitled "Expenses Paid During Period" to estimate the expenses you paid on your account during this period.
Hypothetical Example for Comparison Purposes
The second section of the table shown, "Hypothetical 5% Return," provides information about hypothetical account values and hypothetical expenses based on the Portfolio's actual expense ratio and an assumed rate of return of 5% per year before expenses, which is not the Portfolio's actual return. The hypothetical account values and expenses may not be used to estimate the actual ending account balance or expenses you paid for the period. You may use this information to compare the ongoing costs of investing in the Portfolio and other mutual funds. To do so, compare this 5% hypothetical example with the 5% hypothetical examples that appear in the shareholder reports of the other mutual funds.
Please note that the expenses shown in the table are meant to highlight your ongoing costs only and do not reflect any transactional costs, such as redemption fees or exchange fees. Therefore, the hypothetical lines of the table are useful in comparing ongoing costs only, and will not help you determine the relative total costs of owning different mutual funds. In addition, if these transactional costs were included, your costs would have been higher.
| ING VP Balanced Portfolio | | Beginning
Account
Value
January 1, 2007 | | Ending
Account
Value
June 30, 2007 | | Annualized
Expense
Ratio | | Expenses Paid
During the
Period Ended
June 30, 2007* | |
| Actual Portfolio Return | |
| Class ADV | | $ | 1,000.00 | | | $ | 1,044.10 | | | | 1.10 | % | | $ | 5.58 | | |
| Class I | | | 1,000.00 | | | | 1,047.60 | | | | 0.60 | | | | 3.05 | | |
| Class S | | | 1,000.00 | | | | 1,046.50 | | | | 0.85 | | | | 4.31 | | |
| Hypothetical (5% return before expenses) | |
| Class ADV | | $ | 1,000.00 | | | $ | 1,019.34 | | | | 1.10 | % | | $ | 5.51 | | |
| Class I | | | 1,000.00 | | | | 1,021.82 | | | | 0.60 | | | | 3.01 | | |
| Class S | | | 1,000.00 | | | | 1,020.58 | | | | 0.85 | | | | 4.26 | | |
* Expenses are equal to each Portfolio's respective annualized expense ratios multiplied by the average account value over the period, multiplied by 181/365 to reflect the most recent fiscal half-year.
4
SHAREHOLDER EXPENSE EXAMPLES (UNAUDITED) (CONTINUED)
| ING VP Growth and Income Portfolio | | Beginning
Account
Value
January 1, 2007 | | Ending
Account
Value
June 30, 2007 | | Annualized
Expense
Ratio | | Expenses Paid
During the
Period Ended
June 30, 2007* | |
| Actual Portfolio Return | |
| Class ADV | | $ | 1,000.00 | | | $ | 1,072.30 | | | | 1.09 | % | | $ | 5.60 | | |
| Class I | | | 1,000.00 | | | | 1,076.10 | | | | 0.59 | | | | 3.04 | | |
| Class S | | | 1,000.00 | | | | 1,074.70 | | | | 0.84 | | | | 4.32 | | |
| Hypothetical (5% return before expenses) | |
| Class ADV | | $ | 1,000.00 | | | $ | 1,019.39 | | | | 1.09 | % | | $ | 5.46 | | |
| Class I | | | 1,000.00 | | | | 1,021.87 | | | | 0.59 | | | | 2.96 | | |
| Class S | | | 1,000.00 | | | | 1,020.63 | | | | 0.84 | | | | 4.21 | | |
| ING VP Growth Portfolio | |
| Actual Portfolio Return | |
| Class ADV | | $ | 1,000.00 | | | $ | 1,076.10 | | | | 1.21 | % | | $ | 6.23 | | |
| Class I | | | 1,000.00 | | | | 1,078.00 | | | | 0.71 | | | | 3.66 | | |
| Class S | | | 1,000.00 | | | | 1,076.70 | | | | 0.96 | | | | 4.94 | | |
| Hypothetical (5% return before expenses) | |
| Class ADV | | $ | 1,000.00 | | | $ | 1,018.79 | | | | 1.21 | % | | $ | 6.06 | | |
| Class I | | | 1,000.00 | | | | 1,021.27 | | | | 0.71 | | | | 3.56 | | |
| Class S | | | 1,000.00 | | | | 1,020.03 | | | | 0.96 | | | | 4.81 | | |
| ING VP Small Company Portfolio | |
| Actual Portfolio Return | |
| Class I | | $ | 1,000.00 | | | $ | 1,106.10 | | | | 0.85 | % | | $ | 4.44 | | |
| Class S | | | 1,000.00 | | | | 1,105.30 | | | | 1.10 | | | | 5.74 | | |
| Hypothetical (5% return before expenses) | |
| Class I | | $ | 1,000.00 | | | $ | 1,020.58 | | | | 0.85 | % | | $ | 4.26 | | |
| Class S | | | 1,000.00 | | | | 1,019.34 | | | | 1.10 | | | | 5.51 | | |
| ING VP Value Opportunity Portfolio | |
| Actual Portfolio Return | |
| Class ADV | | $ | 1,000.00 | | | $ | 1,072.40 | | | | 1.19 | % | | $ | 6.11 | | |
| Class I | | | 1,000.00 | | | | 1,077.00 | | | | 0.69 | | | | 3.55 | | |
| Class S | | | 1,000.00 | | | | 1,075.40 | | | | 0.94 | | | | 4.84 | | |
| Hypothetical (5% return before expenses) | |
| Class ADV | | $ | 1,000.00 | | | $ | 1,018.89 | | | | 1.19 | % | | $ | 5.96 | | |
| Class I | | | 1,000.00 | | | | 1,021.37 | | | | 0.69 | | | | 3.46 | | |
| Class S | | | 1,000.00 | | | | 1,020.13 | | | | 0.94 | | | | 4.71 | | |
* Expenses are equal to each Portfolio's respective annualized expense ratios multiplied by the average account value over the period, multiplied by 181/365 to reflect the most recent fiscal half-year.
5
SHAREHOLDER EXPENSE EXAMPLES (UNAUDITED) (CONTINUED)
| ING VP Intermediate Bond Portfolio | | Beginning
Account
Value
January 1, 2007 | | Ending
Account
Value
June 30, 2007 | | Annualized
Expense
Ratio | | Expenses Paid
During the
Period Ended
June 30, 2007* | |
| Actual Portfolio Return | |
| Class ADV | | $ | 1,000.00 | | | $ | 1,009.30 | | | | 0.99 | % | | $ | 4.93 | | |
| Class I | | | 1,000.00 | | | | 1,011.60 | | | | 0.49 | | | | 2.44 | | |
| Class S | | | 1,000.00 | | | | 1,010.10 | | | | 0.74 | | | | 3.69 | | |
| Hypothetical (5% return before expenses) | |
| Class ADV | | $ | 1,000.00 | | | $ | 1,019.89 | | | | 0.99 | % | | $ | 4.96 | | |
| Class I | | | 1,000.00 | | | | 1,022.36 | | | | 0.49 | | | | 2.46 | | |
| Class S | | | 1,000.00 | | | | 1,021.12 | | | | 0.74 | | | | 3.71 | | |
| ING VP Money Market Portfolio | |
| Actual Portfolio Return | |
| Class I | | $ | 1,000.00 | | | $ | 1,025.30 | | | | 0.33 | % | | $ | 1.66 | | |
| Hypothetical (5% return before expenses) | |
| Class I | | $ | 1,000.00 | | | $ | 1,023.16 | | | | 0.33 | % | | $ | 1.66 | | |
| ING VP Global Science and Technology Portfolio | |
| Actual Portfolio Return | |
| Class I | | $ | 1,000.00 | | | $ | 1,107.00 | | | | 1.09 | % | | $ | 5.69 | | |
| Class S | | | 1,000.00 | | | | 1,105.30 | | | | 1.34 | | | | 6.99 | | |
| Hypothetical (5% return before expenses) | |
| Class I | | $ | 1,000.00 | | | $ | 1,019.39 | | | | 1.09 | % | | $ | 5.46 | | |
| Class S | | | 1,000.00 | | | | 1,018.15 | | | | 1.34 | | | | 6.71 | | |
| ING VP International Equity Portfolio | |
| Actual Portfolio Return | |
| Class ADV | | $ | 1,000.00 | | | $ | 1,077.50 | | | | 1.47 | % | | $ | 7.57 | | |
| Class I | | | 1,000.00 | | | | 1,081.10 | | | | 0.97 | | | | 5.01 | | |
| Class S | | | 1,000.00 | | | | 1,078.70 | | | | 1.22 | | | | 6.29 | | |
| Hypothetical (5% return before expenses) | |
| Class ADV | | $ | 1,000.00 | | | $ | 1,017.50 | | | | 1.47 | % | | $ | 7.35 | | |
| Class I | | | 1,000.00 | | | | 1,019.98 | | | | 0.97 | | | | 4.86 | | |
| Class S | | | 1,000.00 | | | | 1,018.74 | | | | 1.22 | | | | 6.11 | | |
* Expenses are equal to each Portfolio's respective annualized expense ratios multiplied by the average account value over the period, multiplied by 181/365 to reflect the most recent fiscal half-year.
6
STATEMENTS OF ASSETS AND LIABILITIES AS OF JUNE 30, 2007 (UNAUDITED)
| | | ING
VP Balanced
Portfolio | | ING
VP Growth and
Income
Portfolio | | ING
VP Growth
Portfolio | |
| ASSETS: | |
| Investments in securities at value+* | | $ | 1,102,328,593 | | | $ | 2,956,407,452 | | | $ | 203,762,246 | | |
| Short-term investments** | | | 4,054,911 | | | | — | | | | — | | |
| Short-term investments in affiliates at amortized cost | | | 63,000,000 | | | | 60,000,000 | | | | 1,000,000 | | |
| Short-term investments at amortized cost | | | 131,223,000 | | | | 381,544,000 | | | | 27,398,000 | | |
| Cash | | | 1,595,833 | | | | 4,457,203 | | | | 195 | | |
| Cash collateral for futures | | | 719,908 | | | | 770,000 | | | | — | | |
| Foreign currencies at value*** | | | 11,465 | | | | — | | | | — | | |
| Receivables: | |
| Investment securities sold | | | 34,218,851 | | | | 132,922,376 | | | | 6,635,232 | | |
| Fund shares sold | | | 4,460 | | | | 92,600 | | | | 3,075 | | |
| Dividends and interest | | | 3,704,608 | | | | 3,824,492 | | | | 274,409 | | |
| Variation margin | | | 212,951 | | | | — | | | | — | | |
| Upfront payments made on swap agreements | | | 320,901 | | | | — | | | | — | | |
| Unrealized appreciation on swap agreements | | | 725,205 | | | | — | | | | — | | |
| Prepaid expenses | | | 16,352 | | | | 39,726 | | | | 2,420 | | |
| Total assets | | | 1,342,137,038 | | | | 3,540,057,849 | | | | 239,075,577 | | |
| LIABILITIES: | |
| Payable for investment securities purchased | | | 73,605,358 | | | | 126,312,550 | | | | 7,115,096 | | |
| Payable for fund shares redeemed | | | 2,139,414 | | | | 2,122,277 | | | | 122,165 | | |
| Payable for futures variation margin | | | 33,541 | | | | 24,750 | | | | — | | |
| Payable upon receipt of securities loaned | | | 128,255,000 | | | | 371,430,000 | | | | 26,886,000 | | |
| Upfront payments received on swap agreements | | | 1,247,315 | | | | — | | | | — | | |
| Unrealized depreciation on swap agreements | | | 354,369 | | | | — | | | | — | | |
| Payable to affiliates | | | 524,358 | | | | 1,399,424 | | | | 117,130 | | |
| Payable for directors fees | | | 25,941 | | | | 49,895 | | | | 3,790 | | |
| Other accrued expenses and liabilities | | | 145,748 | | | | 331,887 | | | | 32,856 | | |
| Options written (premium received $1,138,880) | | | — | | | | 407,710 | | | | — | | |
| Total liabilities | | | 206,331,044 | | | | 502,078,493 | | | | 34,277,037 | | |
| NET ASSETS | | $ | 1,135,805,994 | | | $ | 3,037,979,356 | | | $ | 204,798,540 | | |
| NET ASSETS WERE COMPRISED OF: | |
| Paid-in capital | | $ | 1,019,725,611 | | | $ | 4,506,452,842 | | | $ | 346,355,244 | | |
| Undistributed net investment income | | | 15,381,644 | | | | 18,234,336 | | | | 186,597 | | |
Accumulated net realized gain (loss) on investments, foreign
currency related transactions, futures, swaps, and written options | | | 54,133,439 | | | | (1,910,186,396 | ) | | | (158,359,213 | ) | |
Net unrealized appreciation on investments, foreign currency
related transactions, futures, swaps, and written options | | | 46,565,300 | | | | 423,478,574 | | | | 16,615,912 | | |
| NET ASSETS | | $ | 1,135,805,994 | | | $ | 3,037,979,356 | | | $ | 204,798,540 | | |
| + Including securities loaned at value | | $ | 125,335,137 | | | $ | 359,972,838 | | | $ | 26,041,888 | | |
| * Cost of investments in securities | | $ | 1,055,828,101 | | | $ | 2,533,734,921 | | | $ | 187,146,334 | | |
| ** Cost of short-term investments | | $ | 4,146,404 | | | $ | — | | | $ | — | | |
| *** Cost of foreign currencies | | $ | 90,902 | | | $ | — | | | $ | — | | |
| Class ADV: | |
| Net assets | | $ | 1,002 | | | $ | 1,093 | | | $ | 3,067,993 | | |
| Shares authorized | | | 500,000,000 | | | | unlimited | | | | 100,000,000 | | |
| Par value | | $ | 0.001 | | | $ | 1.00 | | | $ | 0.001 | | |
| Shares outstanding | | | 70 | | | | 44 | | | | 268,266 | | |
| Net asset value and redemption price per share | | $ | 14.29 | | | $ | 25.07 | | | $ | 11.44 | | |
| Class I: | |
| Net assets | | $ | 1,125,331,734 | | | $ | 3,032,316,115 | | | $ | 178,710,477 | | |
| Shares authorized | | | 500,000,000 | | | | unlimited | | | | 100,000,000 | | |
| Par value | | $ | 0.001 | | | $ | 1.00 | | | $ | 0.001 | | |
| Shares outstanding | | | 78,454,255 | | | | 120,535,811 | | | | 15,588,625 | | |
| Net asset value and redemption price per share | | $ | 14.34 | | | $ | 25.16 | | | $ | 11.46 | | |
| Class S: | |
| Net assets | | $ | 10,473,258 | | | $ | 5,662,148 | | | $ | 23,020,070 | | |
| Shares authorized | | | 500,000,000 | | | | unlimited | | | | 100,000,000 | | |
| Par value | | $ | 0.001 | | | $ | 1.00 | | | $ | 0.001 | | |
| Shares outstanding | | | 733,793 | | | | 226,122 | | | | 2,027,559 | | |
| Net asset value and redemption price per share | | $ | 14.27 | | | $ | 25.04 | | | $ | 11.35 | | |
See Accompanying Notes to Financial Statements
7
STATEMENTS OF ASSETS AND LIABILITIES AS OF JUNE 30, 2007 (UNAUDITED)
| | | ING
VP Small
Company
Portfolio | | ING
VP Value
Opportunity
Portfolio | | ING
VP Intermediate
Bond
Portfolio | |
| ASSETS: | |
| Investments in securities at value+* | | $ | 570,128,330 | | | $ | 192,716,435 | | | $ | 2,920,529,191 | | |
| Short-term investments** | | | — | | | | — | | | | 25,870,980 | | |
| Short-term investments in affiliates at amortized cost | | | 22,000,000 | | | | 3,500,000 | | | | 205,600,000 | | |
| Short-term investments at amortized cost | | | 133,604,000 | | | | 26,736,000 | | | | 436,671,000 | | |
| Cash | | | 527,711 | | | | 5,115 | | | | 1,653,094 | | |
| Cash collateral for futures | | | — | | | | — | | | | 2,746,327 | | |
| Foreign currencies at value*** | | | — | | | | — | | | | 214,278 | | |
| Receivables: | |
| Investment securities sold | | | 8,842,308 | | | | 2,165,847 | | | | 258,291,483 | | |
| Fund shares sold | | | 123,625 | | | | 9,849 | | | | 2,541,234 | | |
| Dividends and interest | | | 776,035 | | | | 306,126 | | | | 20,740,840 | | |
| Variation margin | | | — | | | | — | | | | 1,138,279 | | |
| Upfront payments made on swap agreements | | | — | | | | — | | | | 2,292,096 | | |
| Unrealized appreciation on swap agreements | | | — | | | | — | | | | 4,881,119 | | |
| Prepaid expenses | | | 6,495 | | | | 2,498 | | | | 29,218 | | |
| Total assets | | | 736,008,504 | | | | 225,441,870 | | | | 3,883,199,139 | | |
| LIABILITIES: | |
| Payable for investment securities purchased | | | 12,748,948 | | | | 2,675,586 | | | | 578,595,459 | | |
| Payable for fund shares redeemed | | | 906,711 | | | | 24,862 | | | | 678,822 | | |
| Payable upon receipt of securities loaned | | | 131,970,000 | | | | 26,136,000 | | | | 426,736,000 | | |
| Unrealized depreciation on forward currency contracts | | | — | | | | — | | | | 602,543 | | |
| Upfront payments received on swap agreements | | | — | | | | — | | | | 8,751,582 | | |
| Unrealized depreciation on swap agreements | | | — | | | | — | | | | 2,259,366 | | |
| Payable to affiliates | | | 392,429 | | | | 113,380 | | | | 1,228,534 | | |
| Payable for directors fees | | | 9,102 | | | | 4,846 | | | | 20,296 | | |
| Other accrued expenses and liabilities | | | 75,482 | | | | 45,358 | | | | 152,949 | | |
| Total liabilities | | | 146,102,672 | | | | 29,000,032 | | | | 1,019,025,551 | | |
| NET ASSETS | | $ | 589,905,832 | | | $ | 196,441,838 | | | $ | 2,864,173,588 | | |
| NET ASSETS WERE COMPRISED OF: | |
| Paid-in capital | | $ | 473,714,453 | | | $ | 158,313,848 | | | $ | 2,864,806,143 | | |
| Undistributed net investment income | | | 4,192,644 | | | | 1,489,336 | | | | 73,230,835 | | |
Accumulated net realized gain (loss) on investments, foreign
currency related transactions, futures, and swaps | | | 43,136,887 | | | | 8,887,387 | | | | (47,305,536 | ) | |
Net unrealized appreciation or depreciation on investments, foreign
currency related transactions, futures, and swaps | | | 68,861,848 | | | | 27,751,267 | | | | (26,557,854 | ) | |
| NET ASSETS | | $ | 589,905,832 | | | $ | 196,441,838 | | | $ | 2,864,173,588 | | |
| + Including securities loaned at value | | $ | 128,080,747 | | | $ | 25,336,619 | | | $ | 420,280,624 | | |
| * Cost of investments in securities | | $ | 501,266,482 | | | $ | 164,965,168 | | | $ | 2,948,695,746 | | |
| ** Cost of short-term investments | | $ | — | | | $ | — | | | $ | 26,442,491 | | |
| *** Cost of foreign currencies | | $ | — | | | $ | — | | | $ | 216,587 | | |
| Class ADV: | |
| Net assets | | | n/a | | | $ | 1,082 | | | $ | 991 | | |
| Shares authorized | | | n/a | | | | 100,000,000 | | | | unlimited | | |
| Par value | | | n/a | | | $ | 0.001 | | | $ | 1.00 | | |
| Shares outstanding | | | n/a | | | | 65 | | | | 76 | | |
| Net asset value and redemption price per share | | | n/a | | | $ | 16.58 | | | $ | 13.08 | | |
| Class I: | |
| Net assets | | $ | 587,432,750 | | | $ | 168,525,962 | | | $ | 2,014,261,126 | | |
| Shares authorized | | | 100,000,000 | | | | 100,000,000 | | | | unlimited | | |
| Par value | | $ | 0.001 | | | $ | 0.001 | | | $ | 1.00 | | |
| Shares outstanding | | | 28,753,156 | | | | 10,040,509 | | | | 153,653,246 | | |
| Net asset value and redemption price per share | | $ | 20.43 | | | $ | 16.78 | | | $ | 13.11 | | |
| Class S: | |
| Net assets | | $ | 2,473,082 | | | $ | 27,914,794 | | | $ | 849,911,471 | | |
| Shares authorized | | | 100,000,000 | | | | 100,000,000 | | | | unlimited | | |
| Par value | | $ | 0.001 | | | $ | 0.001 | | | $ | 1.00 | | |
| Shares outstanding | | | 121,994 | | | | 1,673,902 | | | | 65,300,260 | | |
| Net asset value and redemption price per share | | $ | 20.28 | | | $ | 16.67 | | | $ | 13.02 | | |
See Accompanying Notes to Financial Statements
8
STATEMENTS OF ASSETS AND LIABILITIES AS OF JUNE 30, 2007 (UNAUDITED)
| | | ING
VP Money
Market
Portfolio | | ING
VP Global Science
and Technology
Portfolio | | ING
VP International
Equity
Portfolio | |
| ASSETS: | |
| Investments in securities at value+* | | $ | — | | | $ | 80,630,877 | | | $ | 83,942,579 | | |
| Short-term investments in affiliates at amortized cost | | | — | | | | — | | | | 100,000 | | |
| Short-term investments at amortized cost | | | 1,562,755,723 | | | | 20,063,000 | | | | 6,529,000 | | |
| Cash | | | 10,029,502 | | | | 817,525 | | | | 13,374 | | |
| Foreign currencies at value** | | | — | | | | 305,950 | | | | 48,515 | | |
| Receivables: | |
| Investment securities sold | | | — | | | | 667,575 | | | | — | | |
| Fund shares sold | | | 2,680,704 | | | | 5,613 | | | | 4,148 | | |
| Dividends and interest | | | 5,300,374 | | | | 55,604 | | | | 252,781 | | |
| Unrealized appreciation on forward foreign currency contracts | | | — | | | | 408,541 | | | | — | | |
| Prepaid expenses | | | 23,818 | | | | 1,036 | | | | 911 | | |
| Total assets | | | 1,580,790,121 | | | | 102,955,721 | | | | 90,891,308 | | |
| LIABILITIES: | |
| Payable for investment securities purchased | | | 24,988,444 | | | | 896,905 | | | | 204,465 | | |
| Payable for fund shares redeemed | | | 1,161 | | | | — | | | | 133,922 | | |
| Payable upon receipt of securities loaned | | | 402,000 | | | | 20,063,000 | | | | 6,233,000 | | |
| Unrealized depreciation on forward foreign currency contracts | | | — | | | | 431,661 | | | | — | | |
| Payable to affiliates | | | 383,000 | | | | 67,665 | | | | 62,969 | | |
| Payable for directors fees | | | 17,894 | | | | 2,122 | | | | 2,908 | | |
| Other accrued expenses and liabilities | | | 219,019 | | | | 30,260 | | | | 34,059 | | |
| Total liabilities | | | 26,011,518 | | | | 21,491,613 | | | | 6,671,323 | | |
| NET ASSETS | | $ | 1,554,778,603 | | | $ | 81,464,108 | | | $ | 84,219,985 | | |
| NET ASSETS WERE COMPRISED OF: | |
| Paid-in capital | | $ | 1,523,310,926 | | | $ | 105,960,480 | | | $ | 74,889,733 | | |
| Undistributed net investment income | |
| (accumulated net investment loss) | | | 36,070,843 | | | | (119,130 | ) | | | 1,030,495 | | |
Accumulated net realized loss on investments and foreign
currency related transactions | | | (4,603,166 | ) | | | (36,733,124 | ) | | | (5,496,149 | ) | |
Net unrealized appreciation on investments and foreign
currency related transactions | | | — | | | | 12,355,882 | | | | 13,795,906 | | |
| NET ASSETS | | $ | 1,554,778,603 | | | $ | 81,464,108 | | | $ | 84,219,985 | | |
| + Including securities loaned at value | | $ | 393,162 | | | $ | 19,480,688 | | | $ | 5,994,316 | | |
| * Cost of investments in securities | | $ | — | | | $ | 68,252,077 | | | $ | 70,149,873 | | |
| ** Cost of foreign currencies | | $ | — | | | $ | 306,428 | | | $ | 47,369 | | |
| Class ADV: | |
| Net assets | | | n/a | | | | n/a | | | $ | 1,081 | | |
| Shares authorized | | | n/a | | | | n/a | | | | 100,000,000 | | |
| Par value | | | n/a | | | | n/a | | | $ | 0.001 | | |
| Shares outstanding | | | n/a | | | | n/a | | | | 84 | | |
| Net asset value and redemption price per share | | | n/a | | | | n/a | | | $ | 12.89 | | |
| Class I: | |
| Net assets | | $ | 1,554,778,603 | | | $ | 80,875,840 | | | $ | 82,837,867 | | |
| Shares authorized | | | unlimited | | | | 100,000,000 | | | | 100,000,000 | | |
| Par value | | $ | 1.00 | | | $ | 0.001 | | | $ | 0.001 | | |
| Shares outstanding | | | 118,045,048 | | | | 15,956,022 | | | | 6,362,797 | | |
| Net asset value and redemption price per share | | $ | 13.17 | | | $ | 5.07 | | | $ | 13.02 | | |
| Class S: | |
| Net assets | | | n/a | | | $ | 588,268 | | | $ | 1,381,037 | | |
| Shares authorized | | | n/a | | | | 100,000,000 | | | | 100,000,000 | | |
| Par value | | | n/a | | | $ | 0.001 | | | $ | 0.001 | | |
| Shares outstanding | | | n/a | | | | 116,626 | | | | 106,778 | | |
| Net asset value and redemption price per share | | | n/a | | | $ | 5.04 | | | $ | 12.93 | | |
See Accompanying Notes to Financial Statements
9
STATEMENTS OF OPERATIONS FOR THE SIX MONTHS ENDED JUNE 30, 2007 (UNAUDITED)
| | | ING
VP Balanced
Portfolio | | ING
VP Growth and
Income
Portfolio | | ING
VP Growth
Portfolio | |
| INVESTMENT INCOME: | |
| Dividends, net of foreign taxes withheld* | | $ | 6,382,623 | | | $ | 24,539,558 | | | $ | 881,988 | | |
| Interest(1) | | | 12,250,915 | | | | 2,450,353 | | | | 60,890 | | |
| Securities lending income | | | 63,459 | | | | 83,117 | | | | 4,242 | | |
| Total investment income | | | 18,696,997 | | | | 27,073,028 | | | | 947,120 | | |
| EXPENSES: | |
| Investment management fees | | | 2,892,729 | | | | 7,583,555 | | | | 615,025 | | |
| Distribution and service fees: | |
| Class ADV | | | 4 | | | | 4 | | | | 6,826 | | |
| Class S | | | 13,065 | | | | 6,234 | | | | 27,638 | | |
| Transfer agent fees | | | 181 | | | | 4,706 | | | | 91 | | |
| Administrative service fees | | | 318,191 | | | | 834,166 | | | | 56,375 | | |
| Shareholder reporting expense | | | 40,580 | | | | 61,240 | | | | 5,108 | | |
| Registration fees | | | 586 | | | | 1,282 | | | | — | | |
| Professional fees | | | 67,688 | | | | 149,644 | | | | 18,055 | | |
| Custody and accounting expense | | | 79,380 | | | | 155,208 | | | | 14,188 | | |
| Directors fees | | | 52,236 | | | | 108,600 | | | | 8,148 | | |
| Miscellaneous expense | | | 36,504 | | | | 122,018 | | | | 9,378 | | |
| Interest expense | | | — | | | | 3,123 | | | | 552 | | |
| Total expenses | | | 3,501,144 | | | | 9,029,780 | | | | 761,384 | | |
| Net waived and reimbursed fees | | | (18,856 | ) | | | (29,562 | ) | | | (422 | ) | |
| Brokerage commission recapture | | | — | | | | — | | | | (1,615 | ) | |
| Net expenses | | | 3,482,288 | | | | 9,000,218 | | | | 759,347 | | |
| Net investment income | | | 15,214,709 | | | | 18,072,810 | | | | 187,773 | | |
REALIZED AND UNREALIZED GAIN (LOSS) ON
INVESTMENTS, FOREIGN CURRENCY RELATED
TRANSACTIONS, FUTURES, SWAPS, AND WRITTEN OPTIONS: | |
| Net realized gain (loss) on: | |
| Investments | | | 66,053,601 | | | | 224,541,155 | | | | 16,989,832 | | |
| Foreign currency related transactions | | | (185,813 | ) | | | (68,863 | ) | | | — | | |
| Futures, swaps, and written options | | | 2,444 | | | | 2,904,918 | | | | — | | |
Net realized gain on investments, foreign currency
related transactions, futures, swaps, and written options | | | 65,870,232 | | | | 227,377,210 | | | | 16,989,832 | | |
| Net change in unrealized appreciation or depreciation on: | |
| Investments | | | (26,721,348 | ) | | | (22,919,641 | ) | | | (2,416,013 | ) | |
| Foreign currency related transactions | | | (79,493 | ) | | | 1,549 | | | | — | | |
| Futures, swaps, and written options | | | 690,769 | | | | 471,901 | | | | — | | |
Net change in unrealized appreciation or depreciation on
investments, foreign currency related transactions,
futures, swaps, and written options | | | (26,110,072 | ) | | | (22,446,191 | ) | | | (2,416,013 | ) | |
Net realized and unrealized gain on
investments, foreign currency related transactions,
futures, swaps, and written options | | | 39,760,160 | | | | 204,931,019 | | | | 14,573,819 | | |
| Increase in net assets resulting from operations | | $ | 54,974,869 | | | $ | 223,003,829 | | | $ | 14,761,592 | | |
| * Foreign taxes withheld | | $ | 1,549 | | | $ | 260,637 | | | $ | 32,396 | | |
| (1) Affiliated income | | $ | 1,229,180 | | | $ | 1,904,115 | | | $ | 27,873 | | |
See Accompanying Notes to Financial Statements
10
STATEMENTS OF OPERATIONS FOR THE SIX MONTHS ENDED JUNE 30, 2007 (UNAUDITED)
| | | ING
VP Small
Company
Portfolio | | ING
VP Value
Opportunity
Portfolio | | ING
VP Intermediate
Bond
Portfolio | |
| INVESTMENT INCOME: | |
| Dividends, net of foreign taxes withheld* | | $ | 5,875,794 | | | $ | 2,134,571 | | | $ | 950,894 | | |
| Interest(1) | | | 517,627 | | | | 65,570 | | | | 78,492,660 | | |
| Securities lending income | | | 47,147 | | | | 4,286 | | | | 519,776 | | |
| Total investment income | | | 6,440,568 | | | | 2,204,427 | | | | 79,963,330 | | |
| EXPENSES: | |
| Investment management fees | | | 2,027,367 | | | | 590,708 | | | | 5,491,101 | | |
| Distribution and service fees: | |
| Class ADV | | | — | | | | 4 | | | | 2 | | |
| Class S | | | 2,823 | | | | 35,012 | | | | 942,884 | | |
| Transfer agent fees | | | 181 | | | | 272 | | | | 6,335 | | |
| Administrative service fees | | | 148,669 | | | | 54,146 | | | | 755,002 | | |
| Shareholder reporting expense | | | 14,080 | | | | 6,165 | | | | 65,067 | | |
| Registration fees | | | 214 | | | | — | | | | 10,568 | | |
| Professional fees | | | 27,105 | | | | 5,796 | | | | 150,985 | | |
| Custody and accounting expense | | | 31,675 | | | | 8,480 | | | | 133,375 | | |
| Directors fees | | | 15,660 | | | | 5,230 | | | | 63,410 | | |
| Miscellaneous expense | | | 21,270 | | | | 7,085 | | | | 77,966 | | |
| Interest expense | | | 597 | | | | — | | | | 665 | | |
| Total expenses | | | 2,289,641 | | | | 712,898 | | | | 7,697,360 | | |
| Net waived and reimbursed fees | | | (6,810 | ) | | | (401 | ) | | | (50,122 | ) | |
| Net expenses | | | 2,282,831 | | | | 712,497 | | | | 7,647,238 | | |
| Net investment income | | | 4,157,737 | | | | 1,491,930 | | | | 72,316,092 | | |
REALIZED AND UNREALIZED GAIN (LOSS) ON
INVESTMENTS, FOREIGN CURRENCY RELATED
TRANSACTIONS, FUTURES, AND SWAPS: | |
| Net realized gain (loss) on: | |
| Investments | | | 43,582,229 | | | | 14,726,803 | | | | (13,401,527 | ) | |
| Foreign currency related transactions | | | 10,983 | | | | 882 | | | | (1,132,467 | ) | |
| Futures and swaps | | | — | | | | — | | | | (10,137,805 | ) | |
Net realized gain (loss) on investments, foreign currency
related transactions, futures, and swaps | | | 43,593,212 | | | | 14,727,685 | | | | (24,671,799 | ) | |
| Net change in unrealized appreciation or depreciation on: | |
| Investments | | | 6,578,357 | | | | (1,563,391 | ) | | | (23,423,552 | ) | |
| Foreign currency related transactions | | | — | | | | — | | | | (605,300 | ) | |
| Futures and swaps | | | — | | | | — | | | | 4,131,038 | | |
Net change in unrealized appreciation or depreciation on
investments, foreign currency related transactions, futures, and swaps | | | 6,578,357 | | | | (1,563,391 | ) | | | (19,897,814 | ) | |
Net realized and unrealized gain (loss) on
investments, foreign currency related transactions, futures, and swaps | | | 50,171,569 | | | | 13,164,294 | | | | (44,569,613 | ) | |
| Increase in net assets resulting from operations | | $ | 54,329,306 | | | $ | 14,656,224 | | | $ | 27,746,479 | | |
| * Foreign taxes withheld | | $ | — | | | $ | 25,198 | | | $ | (6,033 | ) | |
| (1) Affiliated income | | $ | 444,005 | | | $ | 26,903 | | | $ | 3,308,858 | | |
See Accompanying Notes to Financial Statements
11
STATEMENTS OF OPERATIONS FOR THE SIX MONTHS ENDED JUNE 30, 2007 (UNAUDITED)
| | | ING
VP Money
Market
Portfolio | | ING
VP Global Science
and Technology
Portfolio | | ING VP
International
Equity
Portfolio | |
| INVESTMENT INCOME: | |
| Dividends, net of foreign taxes withheld* | | $ | — | | | $ | 281,252 | | | $ | 1,356,710 | | |
| Interest(1) | | | 38,462,127 | | | | 7,633 | | | | 34,597 | | |
| Securities lending income | | | 887 | | | | 12,425 | | | | 37,789 | | |
| Total investment income | | | 38,463,014 | | | | 301,310 | | | | 1,429,096 | | |
| EXPENSES: | |
| Investment management fees | | | 1,789,068 | | | | 383,665 | | | | 346,945 | | |
| Distribution and service fees: | |
| Class ADV | | | — | | | | — | | | | 4 | | |
| Class S | | | — | | | | 701 | | | | 1,265 | | |
| Transfer agent fees | | | 181 | | | | 162 | | | | 181 | | |
| Administrative service fees | | | 393,583 | | | | 22,211 | | | | 22,449 | | |
| Shareholder reporting expense | | | 23,650 | | | | 2,010 | | | | 181 | | |
| Registration fees | | | 427 | | | | — | | | | — | | |
| Professional fees | | | 46,440 | | | | 13,710 | | | | 4,726 | | |
| Custody and accounting expense | | | 63,550 | | | | 11,312 | | | | 13,301 | | |
| Directors fees | | | 34,687 | | | | 2,212 | | | | 2,876 | | |
| Miscellaneous expense | | | 30,969 | | | | 5,250 | | | | 3,488 | | |
| Interest expense | | | — | | | | 560 | | | | 158 | | |
| Total expenses | | | 2,382,555 | | | | 441,793 | | | | 395,574 | | |
| Net waived and reimbursed fees | | | — | | | | — | | | | (187 | ) | |
| Net expenses | | | 2,382,555 | | | | 441,793 | | | | 395,387 | | |
| Net investment income (loss) | | | 36,080,459 | | | | (140,483 | ) | | | 1,033,709 | | |
REALIZED AND UNREALIZED GAIN (LOSS) ON
INVESTMENTS AND FOREIGN CURRENCY RELATED TRANSACTIONS: | |
| Net realized gain on: | |
| Investments | | | 17,416 | | | | 5,811,948 | | | | 5,310,893 | | |
| Foreign currency related transactions | | | — | | | | 47,181 | | | | 13,561 | | |
Net realized gain on investments and foreign currency
related transactions | | | 17,416 | | | | 5,859,129 | | | | 5,324,454 | | |
| Net change in unrealized appreciation or depreciation on: | |
| Investments | | | — | | | | 2,502,334 | | | | 54,476 | | |
| Foreign currency related transactions | | | — | | | | 16,295 | | | | (2,548 | ) | |
Net change in unrealized appreciation or depreciation on investments
and foreign currency related transactions | | | — | | | | 2,518,629 | | | | 51,928 | | |
Net realized and unrealized gain on
investments and foreign currency related transactions | | | 17,416 | | | | 8,377,758 | | | | 5,376,382 | | |
| Increase in net assets resulting from operations | | $ | 36,097,875 | | | $ | 8,237,275 | | | $ | 6,410,091 | | |
| * Foreign taxes withheld | | $ | — | | | $ | 20,589 | | | $ | 147,451 | | |
| (1) Affiliated income | | $ | — | | | $ | — | | | $ | 12,295 | | |
See Accompanying Notes to Financial Statements
12
STATEMENTS OF CHANGES IN NET ASSETS (UNAUDITED)
| | | ING VP Balanced Portfolio | | ING VP Growth and
Income Portfolio | |
| | | Six Months
Ended
June 30,
2007 | | Year
Ended
December 31,
2006 | | Six Months
Ended
June 30,
2007 | | Year
Ended
December 31,
2006 | |
| FROM OPERATIONS: | |
| Net investment income | | $ | 15,214,709 | | | $ | 30,129,554 | | | $ | 18,072,810 | | | $ | 35,726,032 | | |
Net realized gain on investments, foreign
currency related transactions, futures, swaps,
and written options | | | 65,870,232 | | | | 64,973,809 | | | | 227,377,210 | | | | 284,669,891 | | |
Net change in unrealized appreciation or
depreciation on investments, foreign currency
related transactions, futures, swaps,
and written options | | | (26,110,072 | ) | | | 20,635,045 | | | | (22,446,191 | ) | | | 89,779,583 | | |
| Net increase in net assets resulting from operations | | | 54,974,869 | | | | 115,738,408 | | | | 223,003,829 | | | | 410,175,506 | | |
| FROM DISTRIBUTIONS TO SHAREHOLDERS: | |
| Net investment income: | |
| Class ADV | | | (27 | ) | | | — | | | | — | | | | (12 | ) | |
| Class I | | | (30,215,749 | ) | | | (28,870,646 | ) | | | — | | | | (35,978,959 | ) | |
| Class S | | | (258,983 | ) | | | (70,509 | ) | | | — | | | | (46,207 | ) | |
| Net realized gains: | |
| Class ADV | | | (40 | ) | | | — | | | | — | | | | — | | |
| Class I | | | (44,705,487 | ) | | | — | | | | — | | | | — | | |
| Class S | | | (414,002 | ) | | | — | | | | — | | | | — | | |
| Total distributions | | | (75,594,288 | ) | | | (28,941,155 | ) | | | — | | | | (36,025,178 | ) | |
| FROM CAPITAL SHARE TRANSACTIONS: | |
| Net proceeds from sale of shares | | | 2,707,349 | | | | 68,843,823 | | | | 3,975,350 | | | | 26,744,895 | | |
| Proceeds issued in merger (Note 15) | | | — | | | | 21,745,814 | | | | — | | | | — | | |
| Dividends reinvested | | | 75,594,221 | | | | 28,941,155 | | | | — | | | | 35,997,107 | | |
| | | | 78,301,570 | | | | 119,530,792 | | | | 3,975,350 | | | | 62,742,002 | | |
| Cost of shares redeemed | | | (116,488,236 | ) | | | (251,212,849 | ) | | | (291,878,509 | ) | | | (482,469,282 | ) | |
Net decrease in net assets resulting from
capital share transactions | | | (38,186,666 | ) | | | (131,682,057 | ) | | | (287,903,159 | ) | | | (419,727,280 | ) | |
| Net decrease in net assets | | | (58,806,085 | ) | | | (44,884,804 | ) | | | (64,899,330 | ) | | | (45,576,952 | ) | |
| NET ASSETS: | |
| Beginning of period | | | 1,194,612,079 | | | | 1,239,496,883 | | | | 3,102,878,686 | | | | 3,148,455,638 | | |
| End of period | | $ | 1,135,805,994 | | | $ | 1,194,612,079 | | | $ | 3,037,979,356 | | | $ | 3,102,878,686 | | |
| Undistributed net investment income at end of period | | $ | 15,381,644 | | | $ | 30,641,694 | | | $ | 18,234,336 | | | $ | 161,526 | | |
See Accompanying Notes to Financial Statements
13
STATEMENTS OF CHANGES IN NET ASSETS (UNAUDITED)
| | | ING VP Growth Portfolio | | ING VP Small Company Portfolio | |
| | | Six Months
Ended
June 30,
2007 | | Year
Ended
December 31,
2006 | | Six Months
Ended
June 30,
2007 | | Year
Ended
December 31,
2006 | |
| FROM OPERATIONS: | |
| Net investment income | | $ | 187,773 | | | $ | 365,241 | | | $ | 4,157,737 | | | $ | 1,129,645 | | |
Net realized gain on investments and foreign
currency related transactions | | | 16,989,832 | | | | 13,075,352 | | | | 43,593,212 | | | | 76,291,234 | | |
Net change in unrealized appreciation or
depreciation on investments | | | (2,416,013 | ) | | | (9,629,888 | ) | | | 6,578,357 | | | | (665,601 | ) | |
| Net increase in net assets resulting from operations | | | 14,761,592 | | | | 3,810,705 | | | | 54,329,306 | | | | 76,755,278 | | |
| FROM DISTRIBUTIONS TO SHAREHOLDERS: | |
| Net investment income: | |
| Class ADV | | | (5,297 | ) | | | — | | | | — | | | | — | | |
| Class I | | | (317,593 | ) | | | (113,349 | ) | | | (935,976 | ) | | | (1,544,649 | ) | |
| Class S | | | (41,178 | ) | | | — | | | | — | | | | (154,077 | ) | |
| Net realized gains: | |
| Class I | | | — | | | | — | | | | (76,399,058 | ) | | | (58,647,564 | ) | |
| Class S | | | — | | | | — | | | | (343,384 | ) | | | (12,123,157 | ) | |
| Total distributions | | | (364,068 | ) | | | (113,349 | ) | | | (77,678,418 | ) | | | (72,469,447 | ) | |
| FROM CAPITAL SHARE TRANSACTIONS: | |
| Net proceeds from sale of shares | | | 7,237,084 | | | | 51,217,584 | | | | 74,863,462 | | | | 161,701,457 | | |
| Proceeds issued in merger (Note 15) | | | 36,851,627 | | | | — | | | | — | | | | — | | |
| Dividends reinvested | | | 364,068 | | | | 113,349 | | | | 77,678,418 | | | | 72,469,447 | | |
| | | | 44,452,779 | | | | 51,330,933 | | | | 152,541,880 | | | | 234,170,904 | | |
| Cost of shares redeemed | | | (40,821,113 | ) | | | (43,840,954 | ) | | | (53,894,381 | ) | | | (186,317,390 | ) | |
Net increase in net assets resulting from
capital share transactions | | | 3,631,666 | | | | 7,489,979 | | | | 98,647,499 | | | | 47,853,514 | | |
| Net increase in net assets | | | 18,029,190 | | | | 11,187,335 | | | | 75,298,387 | | | | 52,139,345 | | |
| NET ASSETS: | |
| Beginning of period | | | 186,769,350 | | | | 175,582,015 | | | | 514,607,445 | | | | 462,468,100 | | |
| End of period | | $ | 204,798,540 | | | $ | 186,769,350 | | | $ | 589,905,832 | | | $ | 514,607,445 | | |
| Undistributed net investment income at end of period | | $ | 186,597 | | | $ | 362,892 | | | $ | 4,192,644 | | | $ | 970,883 | | |
See Accompanying Notes to Financial Statements
14
STATEMENTS OF CHANGES IN NET ASSETS (UNAUDITED)
| | | ING VP Value
Opportunity Portfolio | | ING VP Intermediate
Bond Portfolio | |
| | | Six Months
Ended
June 30,
2007 | | Year
Ended
December 31,
2006 | | Six Months
Ended
June 30,
2007 | | Year
Ended
December 31,
2006 | |
| FROM OPERATIONS: | |
| Net investment income | | $ | 1,491,930 | | | $ | 3,129,904 | | | $ | 72,316,092 | | | $ | 101,202,907 | | |
Net realized gain (loss) on investments, foreign
currency related transactions, futures, and swaps | | | 14,727,685 | | | | 17,917,306 | | | | (24,671,799 | ) | | | (13,025,987 | ) | |
Net change in unrealized appreciation or
depreciation on investments, foreign currency
related transactions, futures, and swaps | | | (1,563,391 | ) | | | 9,299,578 | | | | (19,897,814 | ) | | | (973,051 | ) | |
| Net increase in net assets resulting from operations | | | 14,656,224 | | | | 30,346,788 | | | | 27,746,479 | | | | 87,203,869 | | |
| FROM DISTRIBUTIONS TO SHAREHOLDERS: | |
| Net investment income: | |
| Class ADV | | | (17 | ) | | | — | | | | — | | | | (40 | ) | |
| Class I | | | (2,729,403 | ) | | | (2,514,028 | ) | | | — | | | | (75,863,165 | ) | |
| Class S | | | (385,996 | ) | | | (411,247 | ) | | | — | | | | (23,433,812 | ) | |
| Total distributions | | | (3,115,416 | ) | | | (2,925,275 | ) | | | — | | | | (99,297,017 | ) | |
| FROM CAPITAL SHARE TRANSACTIONS: | |
| Net proceeds from sale of shares | | | 1,012,477 | | | | 2,493,673 | | | | 592,157,349 | | | | 1,313,238,729 | | |
| Proceeds issued in merger (Note 15) | | | — | | | | — | | | | — | | | | 2,862,609 | | |
| Dividends reinvested | | | 3,115,398 | | | | 2,925,275 | | | | — | | | | 99,270,730 | | |
| | | | 4,127,875 | | | | 5,418,948 | | | | 592,157,349 | | | | 1,415,372,068 | | |
| Cost of shares redeemed | | | (20,632,898 | ) | | | (40,387,407 | ) | | | (285,956,192 | ) | | | (638,397,059 | ) | |
Net increase (decrease) in net assets resulting from
capital share transactions | | | (16,505,023 | ) | | | (34,968,459 | ) | | | 306,201,157 | | | | 776,975,009 | | |
| Net increase (decrease) in net assets | | | (4,964,215 | ) | | | (7,546,946 | ) | | | 333,947,636 | | | | 764,881,861 | | |
| NET ASSETS: | |
| Beginning of period | | | 201,406,053 | | | | 208,952,999 | | | | 2,530,225,952 | | | | 1,765,344,091 | | |
| End of period | | $ | 196,441,838 | | | $ | 201,406,053 | | | $ | 2,864,173,588 | | | $ | 2,530,225,952 | | |
| Undistributed net investment income at end of period | | $ | 1,489,336 | | | $ | 3,112,822 | | | $ | 73,230,835 | | | $ | 914,743 | | |
See Accompanying Notes to Financial Statements
15
STATEMENTS OF CHANGES IN NET ASSETS (UNAUDITED)
| | | ING VP Money Market Portfolio | | ING VP Global Science and
Technology Portfolio | |
| | | Six Months
Ended
June 30,
2007 | | Year
Ended
December 31,
2006 | | Six Months
Ended
June 30,
2007 | | Year
Ended
December 31,
2006 | |
| FROM OPERATIONS: | |
| Net investment income (loss) | | $ | 36,080,459 | | | $ | 57,136,163 | | | $ | (140,483 | ) | | $ | (248,859 | ) | |
Net realized gain on investments and foreign currency
related transactions | | | 17,416 | | | | 75,645 | | | | 5,859,129 | | | | 11,202,478 | | |
Net change in unrealized appreciation or depreciation on
investments and foreign currency related transactions | | | — | | | | — | | | | 2,518,629 | | | | (5,191,876 | ) | |
| Net increase in net assets resulting from operations | | | 36,097,875 | | | | 57,211,808 | | | | 8,237,275 | | | | 5,761,743 | | |
| FROM DISTRIBUTIONS TO SHAREHOLDERS: | |
| Net investment income | | | (57,130,928 | ) | | | (31,895,864 | ) | | | — | | | | — | | |
| Total distributions | | | (57,130,928 | ) | | | (31,895,864 | ) | | | — | | | | — | | |
| FROM CAPITAL SHARE TRANSACTIONS: | |
| Net proceeds from sale of shares | | | 248,605,603 | | | | 428,969,203 | | | | 1,886,002 | | | | 13,780,858 | | |
| Dividends reinvested | | | 57,130,928 | | | | 31,895,864 | | | | — | | | | — | | |
| | | | 305,736,531 | | | | 460,865,067 | | | | 1,886,002 | | | | 13,780,858 | | |
| Cost of shares redeemed | | | (85,774,958 | ) | | | (203,348,846 | ) | | | (10,809,392 | ) | | | (21,993,235 | ) | |
Net increase (decrease) in net assets resulting from
capital share transactions | | | 219,961,573 | | | | 257,516,221 | | | | (8,923,390 | ) | | | (8,212,377 | ) | |
| Net increase (decrease) in net assets | | | 198,928,520 | | | | 282,832,165 | | | | (686,115 | ) | | | (2,450,634 | ) | |
| NET ASSETS: | |
| Beginning of period | | | 1,355,850,083 | | | | 1,073,017,918 | | | | 82,150,223 | | | | 84,600,857 | | |
| End of period | | $ | 1,554,778,603 | | | $ | 1,355,850,083 | | | $ | 81,464,108 | | | $ | 82,150,223 | | |
Undistributed net investment income (accumulated
net investment loss) at end of period | | $ | 36,070,843 | | | $ | 57,121,312 | | | $ | (119,130 | ) | | $ | 21,353 | | |
See Accompanying Notes to Financial Statements
16
STATEMENTS OF CHANGES IN NET ASSETS (UNAUDITED)
| | | ING VP International
Equity Portfolio | |
| | | Six Months
Ended
June 30,
2007 | | Year
Ended
December 31,
2006 | |
| FROM OPERATIONS: | |
| Net investment income | | $ | 1,033,709 | | | $ | 1,625,567 | | |
| Net realized gain on investments and foreign currency related transactions | | | 5,324,454 | | | | 8,900,673 | | |
Net change in unrealized appreciation or depreciation on investments
and foreign currency related transactions | | | 51,928 | | | | 4,333,147 | | |
| Net increase in net assets resulting from operations | | | 6,410,091 | | | | 14,859,387 | | |
| FROM DISTRIBUTIONS TO SHAREHOLDERS: | |
| Net investment income: | |
| Class ADV | | | (21 | ) | | | — | | |
| Class I | | | (1,612,956 | ) | | | (1,095,926 | ) | |
| Class S | | | (18,053 | ) | | | (7,085 | ) | |
| Total distributions | | | (1,631,030 | ) | | | (1,103,011 | ) | |
| FROM CAPITAL SHARE TRANSACTIONS: | |
| Net proceeds from sale of shares | | | 7,379,982 | | | | 17,382,229 | | |
| Dividends reinvested | | | 1,631,009 | | | | 1,103,011 | | |
| | | | 9,010,991 | | | | 18,485,240 | | |
| Cost of shares redeemed | | | (9,019,204 | ) | | | (14,608,817 | ) | |
| Net increase (decrease) in net assets resulting from capital share transactions | | | (8,213 | ) | | | 3,876,423 | | |
| Net increase in net assets | | | 4,770,848 | | | | 17,632,799 | | |
| NET ASSETS: | |
| Beginning of period | | | 79,449,137 | | | | 61,816,338 | | |
| End of period | | $ | 84,219,985 | | | $ | 79,449,137 | | |
| Undistributed net investment income at end of period | | $ | 1,030,495 | | | $ | 1,627,816 | | |
See Accompanying Notes to Financial Statements
17
ING VP BALANCED PORTFOLIO (UNAUDITED)
FINANCIAL HIGHLIGHTS
Selected data for a share of beneficial interest outstanding throughout each period.
| | | Class ADV | |
| | | Six Months
Ended
June 30,
2007 | | December 29,
2006(1) to
December 31,
2006 | |
| Per Share Operating Performance: | |
| Net asset value, beginning of period | | $ | 14.65 | | | | 14.65 | | |
| Income (loss) from investment operations: | |
| Net investment income (loss) | | $ | 0.15 | | | | (0.00 | )** | |
| Net realized and unrealized gain on investments | | $ | 0.46 | | | | — | | |
| Total from investment operations | | $ | 0.61 | | | | (0.00 | )** | |
| Less distributions from: | | | | | | | | | |
| Net investment income | | $ | 0.39 | | | | — | | |
| Net realized gains on investments | | $ | 0.58 | | | | — | | |
| Total distributions | | $ | 0.97 | | | | — | | |
| Net asset value, end of period | | $ | 14.29 | | | | 14.65 | | |
| Total Return(2) | | % | 4.41 | | | | — | | |
| Ratios and Supplemental Data: | |
| Net assets, end of period (millions) | | $ | 0 | *** | | | 0 | *** | |
| Ratios to average net assets: | |
| Gross expenses prior to expense waiver(3) | | % | 1.10 | | | | 1.10 | | |
| Net expenses after expense waiver(3) | | % | 1.10 | † | | | 1.10 | † | |
| Net investment income (loss) after expense waiver(3) | | % | 2.04 | † | | | (1.10 | )† | |
| Portfolio turnover rate | | % | 110 | | | | 236 | | |
| | | Class I | |
| | | Six Months
Ended
June 30, | | Year Ended December 31, | |
| | | 2007 | | 2006 | | 2005 | | 2004 | | 2003 | | 2002 | |
| Per Share Operating Performance: | |
| Net asset value, beginning of period | | $ | 14.65 | | | | 13.64 | | | | 13.40 | | | | 12.50 | | | | 10.73 | | | | 12.09 | | |
| Income (loss) from investment operations: | | | | | | | | | | | | | | | | | | | | | | | | | |
| Net investment income | | $ | 0.19 | * | | | 0.34 | * | | | 0.29 | * | | | 0.29 | | | | 0.25 | | | | 0.25 | | |
Net realized and unrealized gain (loss)
on investments | | $ | 0.47 | | | | 1.00 | | | | 0.27 | | | | 0.87 | | | | 1.76 | | | | (1.49 | ) | |
| Total from investment operations | | $ | 0.66 | | | | 1.34 | | | | 0.56 | | | | 1.16 | | | | 2.01 | | | | (1.24 | ) | |
| Less distributions from: | |
| Net investment income | | $ | 0.39 | | | | 0.33 | | | | 0.32 | | | | 0.26 | | | | 0.24 | | | | 0.12 | | |
| Net realized gains on investments | | $ | 0.58 | | | | — | | | | — | | | | — | | | | — | | | | — | | |
| Total distributions | | $ | 0.97 | | | | 0.33 | | | | 0.32 | | | | 0.26 | | | | 0.24 | | | | 0.12 | | |
| Net asset value, end of period | | $ | 14.34 | | | | 14.65 | | | | 13.64 | | | | 13.40 | | | | 12.50 | | | | 10.73 | | |
| Total Return(2) | | % | 4.76 | | | | 9.99 | | | | 4.24 | | | | 9.42 | | | | 18.87 | | | | (10.31 | ) | |
| Ratios and Supplemental Data: | |
| Net assets, end of period (millions) | | $ | 1,125 | | | | 1,184 | | | | 1,236 | | | | 1,358 | | | | 1,375 | | | | 1,223 | | |
| Ratios to average net assets: | |
| Gross expenses prior to expense waiver(3) | | % | 0.60 | | | | 0.60 | | | | 0.60 | | | | 0.59 | | | | 0.60 | | | | 0.60 | | |
| Net expenses after expense waiver(3) | | % | 0.60 | † | | | 0.60 | † | | | 0.60 | | | | 0.59 | | | | 0.60 | | | | 0.60 | | |
| Net investment income after expense waiver(3) | | % | 2.63 | † | | | 2.44 | † | | | 2.30 | | | | 2.15 | | | | 2.04 | | | | 2.00 | | |
| Portfolio turnover rate | | % | 110 | | | | 236 | | | | 308 | | | | 272 | | | | 333 | | | | 345 | | |
(1) Commencement of operations.
(2) Total return is calculated assuming reinvestment of all dividends and capital gain distributions at net asset value and does not reflect the effect of insurance contract charges. Total return for periods less than one year is not annualized.
(3) Annualized for periods less than one year.
* Calculated using average number of shares outstanding throughout the period.
** Amount is more than $(0.005).
*** Amount is less than $500,000.
† Impact of waiving the advisory fee for the ING Institutional Prime Money Market Fund holding has less than 0.01% impact on the expense ratio.
See Accompanying Notes to Financial Statements
18
ING VP BALANCED PORTFOLIO (UNAUDITED) (CONTINUED)
FINANCIAL HIGHLIGHTS
Selected data for a share of beneficial interest outstanding throughout each period.
| | | Class S | |
| | | Six Months
Ended
June 30, | |
Year Ended December 31, | | May 29,
2003(1) to
December 31, | |
| | | 2007 | | 2006 | | 2005 | | 2004 | | 2003 | |
| Per Share Operating Performance: | | | | | |
| Net asset value, beginning of period | | $ | 14.57 | | | | 13.58 | | | | 13.35 | | | | 12.49 | | | | 11.53 | | |
| Income from investment operations: | | | | | | | | | | | | | | | | | | | | | |
| Net investment income | | $ | 0.18 | | | | 0.32 | * | | | 0.27 | | | | 0.22 | | | | 0.34 | | |
| Net realized and unrealized gain on investments | | $ | 0.46 | | | | 0.97 | | | | 0.25 | | | | 0.89 | | | | 0.85 | | |
| Total from investment operations | | $ | 0.64 | | | | 1.29 | | | | 0.52 | | | | 1.11 | | | | 1.19 | | |
| Less distributions from: | |
| Net investment income | | $ | 0.36 | | | | 0.30 | | | | 0.29 | | | | 0.25 | | | | 0.23 | | |
| Net realized gains on investments | | $ | 0.58 | | | | — | | | | — | | | | — | | | | — | | |
| Total distributions | | $ | 0.94 | | | | 0.30 | | | | 0.29 | | | | 0.25 | | | | 0.23 | | |
| Net asset value, end of period | | $ | 14.27 | | | | 14.57 | | | | 13.58 | | | | 13.35 | | | | 12.49 | | |
| Total Return(2) | | % | 4.65 | | | | 9.62 | | | | 3.99 | | | | 9.06 | | | | 10.51 | | |
| Ratios and Supplemental Data: | |
| Net assets, end of period (millions) | | $ | 10 | | | | 11 | | | | 3 | | | | 3 | | | | 1 | | |
| Ratios to average net assets: | |
| Gross expenses prior to expense waiver(3) | | % | 0.85 | | | | 0.85 | | | | 0.85 | | | | 0.84 | | | | 0.83 | | |
| Net expenses after expense waiver(3) | | % | 0.85 | † | | | 0.85 | † | | | 0.85 | | | | 0.84 | | | | 0.83 | | |
| Net investment income after expense waiver(3) | | % | 2.38 | † | | | 2.29 | † | | | 2.06 | | | | 1.98 | | | | 3.06 | | |
| Portfolio turnover rate | | % | 110 | | | | 236 | | | | 308 | | | | 272 | | | | 333 | | |
(1) Commencement of operations.
(2) Total return is calculated assuming reinvestment of all dividends and capital gain distributions at net asset value and does not reflect the effect of insurance contract charges. Total return for periods less than one year is not annualized.
(3) Annualized for periods less than one year.
* Calculated using average number of shares outstanding throughout the period.
† Impact of waiving the advisory fee for the ING Institutional Prime Money Market Fund holding has less than 0.01% impact on the expense ratio.
See Accompanying Notes to Financial Statements
19
ING VP GROWTH AND INCOME PORTFOLIO (UNAUDITED)
FINANCIAL HIGHLIGHTS
Selected data for a share of beneficial interest outstanding throughout each period.
| | | Class ADV | |
| | | Six Months
Ended
June 30,
2007 | | December 20,
2006(1) to
December 31,
2006 | |
| Per Share Operating Performance: | |
| Net asset value, beginning of period | | $ | 23.38 | | | | 23.70 | | |
| Income (loss) from investment operations: | | | | | | | | | |
| Net investment income | | $ | 0.08 | | | | 0.01 | ** | |
Net realized and unrealized gain (loss)
on investments | | $ | 1.61 | | | | (0.06 | ) | |
| Total from investment operations | | $ | 1.69 | | | | (0.05 | ) | |
| Less distributions from: | |
| Net investment income | | $ | — | | | | 0.27 | | |
| Total distributions | | $ | — | | | | 0.27 | | |
| Net asset value, end of period | | $ | 25.07 | | | | 23.38 | | |
| Total Return(2) | | % | 7.23 | | | | (0.23 | ) | |
| Ratios and Supplemental Data: | |
| Net assets, end of period (millions) | | $ | 0 | * | | | 0 | * | |
| Ratios to average net assets: | |
| Gross expenses prior to expense waiver(3) | | % | 1.09 | | | | 1.09 | | |
| Net expenses after expense waiver(3) | | % | 1.09 | † | | | 1.09 | † | |
| Net investment income after expense waiver(3) | | % | 0.69 | † | | | 1.08 | † | |
| Portfolio turnover rate | | % | 76 | | | | 103 | | |
| | | Class I | |
| | | Six Months
Ended
June 30, | | Year Ended December 31, | |
| | | 2007 | | 2006 | | 2005 | | 2004 | | 2003 | | 2002 | |
| Per Share Operating Performance: | |
| Net asset value, beginning of period | | $ | 23.38 | | | | 20.71 | | | | 19.35 | | | | 18.28 | | | | 14.50 | | | | 19.54 | | |
| Income (loss) from investment operations: | | | | | | | | | | | | | | | | | | | | | | | | | |
| Net investment income | | $ | 0.15 | | | | 0.25 | ** | | | 0.23 | | | | 0.28 | | | | 0.16 | | | | 0.16 | | |
Net realized and unrealized gain (loss)
on investments | | $ | 1.63 | | | | 2.69 | | | | 1.35 | | | | 1.24 | | | | 3.62 | | | | (5.04 | ) | |
| Total from investment operations | | $ | 1.78 | | | | 2.94 | | | | 1.58 | | | | 1.52 | | | | 3.78 | | | | (4.88 | ) | |
| Less distributions from: | |
| Net investment income | | $ | — | | | | 0.27 | | | | 0.22 | | | | 0.45 | | | | — | | | | 0.16 | | |
| Total distributions | | $ | — | | | | 0.27 | | | | 0.22 | | | | 0.45 | | | | — | | | | 0.16 | | |
| Net asset value, end of period | | $ | 25.16 | | | | 23.38 | | | | 20.71 | | | | 19.35 | | | | 18.28 | | | | 14.50 | | |
| Total Return(2) | | % | 7.61 | | | | 14.20 | | | | 8.13 | | | | 8.39 | | | | 26.07 | | | | (24.99 | ) | |
| Ratios and Supplemental Data: | |
| Net assets, end of period (millions) | | $ | 3,032 | | | | 3,098 | | | | 3,146 | | | | 3,531 | | | | 3,795 | | | | 3,525 | | |
| Ratios to average net assets: | |
| Gross expenses prior to expense waiver(3) | | % | 0.59 | | | | 0.59 | | | | 0.59 | | | | 0.58 | | | | 0.60 | | | | 0.59 | | |
| Net expenses after expense waiver(3) | | % | 0.59 | † | | | 0.59 | † | | | 0.59 | | | | 0.58 | | | | 0.60 | | | | 0.59 | | |
| Net investment income after expense waiver(3) | | % | 1.19 | † | | | 1.15 | † | | | 1.03 | | | | 1.41 | | | | 0.95 | | | | 0.83 | | |
| Portfolio turnover rate | | % | 76 | | | | 103 | | | | 80 | | | | 139 | | | | 150 | | | | 246 | | |
(1) Commencement of operations.
(2) Total return is calculated assuming reinvestment of all dividends and capital gain distributions at net asset value and does not reflect the effect of insurance contract charges. Total return for periods less than one year is not annualized.
(3) Annualized for periods less than one year.
* Amount is less than $500,000.
** Calculated using average shares outstanding throughout the period.
† Impact of waiving the advisory fee for the ING Institutional Prime Money Market Fund holding has less than 0.01% impact on the expense ratio.
See Accompanying Notes to Financial Statements
20
ING VP GROWTH AND INCOME PORTFOLIO (UNAUDITED) (CONTINUED)
FINANCIAL
HIGHLIGHTS
Selected data for a share of beneficial interest outstanding throughout each period.
| | | Class S | |
| | | Six Months
Ended
June 30, | | Year Ended December 31, | | June 11,
2003(1) to
December 31, | |
| | | 2007 | | 2006 | | 2005 | | 2004 | | 2003 | |
| Per Share Operating Performance: | |
| Net asset value, beginning of period | | $ | 23.30 | | | | 20.69 | | | | 19.34 | | | | 18.26 | | | | 16.32 | | |
| Income from investment operations: | | | | | | | | | | | | | | | | | | | | | |
| Net investment income | | $ | 0.10 | | | | 0.20 | * | | | 0.14 | | | | 0.21 | | | | 0.04 | | |
| Net realized and unrealized gain on investments | | $ | 1.64 | | | | 2.64 | | | | 1.41 | | | | 1.26 | | | | 1.90 | | |
| Total from investment operations | | $ | 1.74 | | | | 2.84 | | | | 1.55 | | | | 1.47 | | | | 1.94 | | |
| Less distributions from: | |
| Net investment income | | $ | — | | | | 0.23 | | | | 0.20 | | | | 0.39 | | | | — | | |
| Total distributions | | $ | — | | | | 0.23 | | | | 0.20 | | | | 0.39 | | | | — | | |
| Net asset value, end of period | | $ | 25.04 | | | | 23.30 | | | | 20.69 | | | | 19.34 | | | | 18.26 | | |
| Total Return(2) | | % | 7.47 | | | | 13.72 | | | | 7.98 | | | | 8.10 | | | | 11.89 | | |
| Ratios and Supplemental Data: | |
| Net assets, end of period (millions) | | $ | 6 | | | | 5 | | | | 2 | | | | 2 | | | | 2 | | |
| Ratios to average net assets: | |
| Gross expenses prior to expense waiver(3) | | % | 0.84 | | | | 0.84 | | | | 0.84 | | | | 0.83 | | | | 0.84 | | |
| Net expenses after expense waiver(3) | | % | 0.84 | † | | | 0.84 | † | | | 0.84 | | | | 0.83 | | | | 0.84 | | |
| Net investment income after expense waiver(3) | | % | 0.93 | † | | | 0.94 | † | | | 0.78 | | | | 1.18 | | | | 0.57 | | |
| Portfolio turnover rate | | % | 76 | | | | 103 | | | | 80 | | | | 139 | | | | 150 | | |
(1) Commencement of operations.
(2) Total return is calculated assuming reinvestment of all dividends and capital gain distributions at net asset value and does not reflect the effect of insurance contract charges. Total return for periods less than one year is not annualized.
(3) Annualized for periods less than one year.
* Calculated using average shares outstanding throughout the period.
† Impact of waiving the advisory fee for the ING Institutional Prime Money Market Fund holding has less than 0.01% impact on the expense ratio.
See Accompanying Notes to Financial Statements
21
ING VP GROWTH PORTFOLIO (UNAUDITED)
FINANCIAL HIGHLIGHTS
Selected data for a share of beneficial interest outstanding throughout each period.
| | | Class ADV | |
| | | Six Months
Ended
June 30,
2007 | | December 29,
2006(1) to
December 31,
2006 | |
| Per Share Operating Performance: | |
| Net asset value, beginning of period | | $ | 10.65 | | | | 10.65 | | |
| Income (loss) from investment operations: | | | | | | | | | |
| Net investment loss | | $ | (0.01 | )** | | | (0.00 | )* | |
| Net realized and unrealized gain on investments | | $ | 0.82 | | | | — | | |
| Total from investment operations | | $ | 0.81 | | | | (0.00 | )* | |
| Less distributions from: | | | | | | | | | |
| Net investment income | | $ | 0.02 | | | | — | | |
| Total distributions | | $ | 0.02 | | | | — | | |
| Net asset value, end of period | | $ | 11.44 | | | | 10.65 | | |
| Total Return(2) | | % | 7.61 | | | | — | | |
| Ratios and Supplemental Data: | |
| Net assets, end of period (000's) | | $ | 3,068 | | | | 1 | | |
| Ratios to average net assets: | | | | | | | | | |
| Gross expenses prior to expense waiver and brokerage commission recapture(3) | | % | 1.21 | | | | 1.19 | | |
| Net expenses after expense waiver and prior to brokerage commission recapture(3) | | % | 1.21 | †† | | | 1.19 | | |
| Net expenses after expense waiver and brokerage commission recapture(3) | | % | 1.21 | †† | | | 1.19 | | |
| Net investment loss after expense waiver and brokerage commission recapture(3) | | % | (0.27 | )†† | | | (1.19 | ) | |
| Portfolio turnover rate | | % | 118 | | | | 188 | | |
| | | Class I | |
| | | Six Months
Ended
June 30, | | Year Ended December 31, | |
| | | 2007 | | 2006 | | 2005 | | 2004 | | 2003 | | 2002 | |
| Per Share Operating Performance: | |
| Net asset value, beginning of period | | $ | 10.65 | | | | 10.38 | | | | 9.56 | | | | 8.93 | | | | 6.85 | | | | 9.64 | | |
| Income (loss) from investment operations: | | | | | | | | | | | | | | | | | | | | | | | | | |
| Net investment income (loss) | | $ | 0.01 | | | | 0.02 | | | | 0.02 | | | | 0.06 | | | | 0.01 | | | | (0.01 | ) | |
Net realized and unrealized gain (loss)
on investments | | $ | 0.82 | | | | 0.26 | | | | 0.87 | | | | 0.58 | | | | 2.07 | | | | (2.78 | ) | |
| Total from investment operations | | $ | 0.83 | | | | 0.28 | | | | 0.89 | | | | 0.64 | | | | 2.08 | | | | (2.79 | ) | |
| Less distributions from: | | | | | | | | | | | | | | | | | | | | | | | | | |
| Net investment income | | $ | 0.02 | | | | 0.01 | | | | 0.07 | | | | 0.01 | | | | — | | | | — | | |
| Total distributions | | $ | 0.02 | | | | 0.01 | | | | 0.07 | | | | 0.01 | | | | — | | | | — | | |
| Net asset value, end of period | | $ | 11.46 | | | | 10.65 | | | | 10.38 | | | | 9.56 | | | | 8.93 | | | | 6.85 | | |
| Total Return(2) | | % | 7.80 | | | | 2.65 | | | | 9.38 | † | | | 7.19 | | | | 30.36 | | | | (28.94 | ) | |
| Ratios and Supplemental Data: | |
| Net assets, end of period (000's) | | $ | 178,710 | | | | 186,495 | | | | 175,297 | | | | 193,280 | | | | 224,330 | | | | 181,029 | | |
| Ratios to average net assets: | | | | | | | | | | | | | | | | | | | | | | | | | |
Gross expenses prior to expense waiver and
brokerage commission recapture(3) | | % | 0.71 | | | | 0.69 | | | | 0.69 | | | | 0.69 | | | | 0.71 | | | | 0.72 | | |
Net expenses after expense waiver and prior
to brokerage commission recapture(3) | | % | 0.71 | †† | | | 0.69 | | | | 0.69 | | | | 0.69 | | | | 0.71 | | | | 0.72 | | |
Net expenses after expense waiver and
brokerage commission recapture(3) | | % | 0.71 | †† | | | 0.69 | | | | 0.69 | | | | 0.69 | | | | 0.71 | | | | 0.72 | | |
Net investment income (loss) after expense waiver
and brokerage commission recapture(3) | | % | 0.22 | †† | | | 0.19 | | | | 0.08 | | | | 0.61 | | | | 0.13 | | | | (0.06 | ) | |
| Portfolio turnover rate | | % | 118 | | | | 188 | | | | 119 | | | | 123 | | | | 162 | | | | 241 | | |
(1) Commencement of operations.
(2) Total return is calculated assuming reinvestment of all dividends and capital gain distributions at net asset value and does not reflect the effect of insurance contract charges. Total return for periods less than one year is not annualized.
(3) Annualized for periods less than one year.
* Amount is less than $0.005 or more than $(0.005).
** Calculated using average shares outstanding throughout the period.
† In 2005, the Investment Adviser fully reimbursed the Portfolio for a loss incurred from a transaction not meeting the Portfolio's investment's guidelines. There was no impact on total return.
†† Impact of waiving the advisory fee for the ING Institutional Prime Money Market Fund holding has less than 0.01% impact on the expense ratio.
See Accompanying Notes to Financial Statements
22
ING VP GROWTH PORTFOLIO (UNAUDITED) (CONTINUED)
FINANCIAL HIGHLIGHTS
Selected data for a share of beneficial interest outstanding throughout each period.
| | | Class S | |
| | | Six Months
Ended
June 30, | | Year Ended December 31, | |
| | | 2007 | | 2006 | | 2005 | | 2004 | | 2003 | | 2002 | |
| Per Share Operating Performance: | |
| Net asset value, beginning of period | | $ | 10.56 | | | | 10.31 | | | | 9.50 | | | | 8.88 | | | | 6.83 | | | | 9.63 | | |
| Income (loss) from investment operations: | | | | | | | | | | | | | | | | | | | | | | | | | |
| Net investment income (loss) | | $ | (0.00 | )* | | | (0.01 | ) | | | (0.00 | )* | | | 0.04 | | | | 0.00 | * | | | (0.01 | ) | |
Net realized and unrealized gain (loss)
on investments | | $ | 0.81 | | | | 0.26 | | | | 0.85 | | | | 0.58 | | | | 2.05 | | | | (2.79 | ) | |
| Total from investment operations | | $ | 0.81 | | | | 0.25 | | | | 0.85 | | | | 0.62 | | | | 2.05 | | | | (2.80 | ) | |
| Less distributions from: | | | | | | | | | | | | | | | | | | | | | | | | | |
| Net investment income | | $ | 0.02 | | | | — | | | | 0.04 | | | | — | | | | — | | | | — | | |
| Total distributions | | $ | 0.02 | | | | — | | | | 0.04 | | | | — | | | | — | | | | — | | |
| Net asset value, end of period | | $ | 11.35 | | | | 10.56 | | | | 10.31 | | | | 9.50 | | | | 8.88 | | | | 6.83 | | |
| Total Return(2) | | % | 7.67 | | | | 2.42 | | | | 9.05 | † | | | 6.98 | | | | 30.01 | | | | (29.08 | ) | |
| Ratios and Supplemental Data: | |
| Net assets, end of period (000's) | | $ | 23,020 | | | | 273 | | | | 285 | | | | 356 | | | | 292 | | | | 53 | | |
| Ratios to average net assets: | | | | | | | | | | | | | | | | | | | | | | | | | |
Gross expenses prior to expense waiver and
brokerage commission recapture(3) | | % | 0.96 | | | | 0.94 | | | | 0.94 | | | | 0.94 | | | | 0.96 | | | | 0.97 | | |
Net expenses after expense waiver and prior to
brokerage commission recapture(3) | | % | 0.96 | †† | | | 0.94 | | | | 0.94 | | | | 0.94 | | | | 0.96 | | | | 0.97 | | |
Net expenses after expense waiver and
brokerage commission recapture(3) | | % | 0.96 | †† | | | 0.94 | | | | 0.94 | | | | 0.94 | | | | 0.96 | | | | 0.97 | | |
Net investment income (loss) after expense
waiver and brokerage commission recapture(3) | | % | (0.03 | )†† | | | (0.06 | ) | | | (0.17 | ) | | | 0.44 | | | | (0.10 | ) | | | (0.31 | ) | |
| Portfolio turnover rate | | % | 118 | | | | 188 | | | | 119 | | | | 123 | | | | 162 | | | | 241 | | |
(1) Commencement of operations.
(2) Total return is calculated assuming reinvestment of all dividends and capital gain distributions at net asset value and does not reflect the effect of insurance contract charges. Total return for periods less than one year is not annualized.
(3) Annualized for periods less than one year.
* Amount is less than $0.005 or more than $(0.005).
† In 2005, the Investment Adviser fully reimbursed the Portfolio for a loss incurred from a transaction not meeting the Portfolio's investment's guidelines. There was no impact on total return.
†† Impact of waiving the advisory fee for the ING Institutional Prime Money Market Fund holding has less than 0.01% impact on the expense ratio.
See Accompanying Notes to Financial Statements
23
ING VP SMALL COMPANY PORTFOLIO (UNAUDITED)
FINANCIAL HIGHLIGHTS
Selected data for a share of beneficial interest outstanding throughout each period.
| | | Class I | |
| | | Six Months
Ended
June 30, | | Year Ended December 31, | |
| | | 2007 | | 2006 | | 2005 | | 2004 | | 2003 | | 2002 | |
| Per Share Operating Performance: | |
| Net asset value, beginning of period | | $ | 21.70 | | | | 21.65 | | | | 19.94 | | | | 17.48 | | | | 12.75 | | | | 16.68 | | |
| Income (loss) from investment operations: | | | | | | | | | | | | | | | | | | | | | | | | | |
| Net investment income | | $ | 0.16 | * | | | 0.05 | | | | 0.10 | | | | 0.04 | | | | 0.06 | | | | 0.05 | | |
Net realized and unrealized gain (loss)
on investments | | $ | 1.94 | | | | 3.46 | | | | 1.92 | | | | 2.47 | | | | 4.71 | | | | (3.91 | ) | |
| Total from investment operations | | $ | 2.10 | | | | 3.51 | | | | 2.02 | | | | 2.51 | | | | 4.77 | | | | (3.86 | ) | |
| Less distributions from: | | | | | | | | | | | | | | | | | | | | | | | | | |
| Net investment income | | $ | 0.04 | | | | 0.09 | | | | 0.03 | | | | 0.05 | | | | 0.04 | | | | 0.07 | | |
| Net realized gains on investments | | $ | 3.33 | | | | 3.37 | | | | 0.28 | | | | — | | | | — | | | | — | | |
| Total distributions | | $ | 3.37 | | | | 3.46 | | | | 0.31 | | | | 0.05 | | | | 0.04 | | | | 0.07 | | |
| Net asset value, end of period | | $ | 20.43 | | | | 21.70 | | | | 21.65 | | | | 19.94 | | | | 17.48 | | | | 12.75 | | |
| Total Return(1) | | % | 10.61 | | | | 16.79 | | | | 10.27 | †† | | | 14.39 | | | | 37.47 | | | | (23.23 | ) | |
| Ratios and Supplemental Data: | |
| Net assets, end of period (000's) | | $ | 587,433 | | | | 512,446 | | | | 393,700 | | | | 461,014 | | | | 464,228 | | | | 288,890 | | |
| Ratios to average net assets: | | | | | | | | | | | | | | | | | | | | | | | | | |
| Gross expenses prior to expense waiver(2) | | % | 0.85 | | | | 0.85 | | | | 0.85 | | | | 0.84 | | | | 0.85 | | | | 0.87 | | |
| Net expenses after expense waiver(2) | | % | 0.85 | † | | | 0.85 | † | | | 0.85 | | | | 0.84 | | | | 0.85 | | | | 0.87 | | |
| Net investment income after expense waiver(2) | | % | 1.54 | † | | | 0.26 | † | | | 0.43 | | | | 0.21 | | | | 0.47 | | | | 0.39 | | |
| Portfolio turnover rate | | % | 47 | | | | 83 | | | | 72 | | | | 93 | | | | 178 | | | | 371 | | |
| | | Class S | |
| | | Six Months
Ended
June 30, | | Year Ended December 31, | |
| | | 2007 | | 2006 | | 2005 | | 2004 | | 2003 | | 2002 | |
| Per Share Operating Performance: | |
| Net asset value, beginning of period | | $ | 21.54 | | | | 21.59 | | | | 19.90 | | | | 17.49 | | | | 12.72 | | | | 16.68 | | |
| Income (loss) from investment operations: | | | | | | | | | | | | | | | | | | | | | | | | | |
| Net investment income (loss) | | $ | 0.13 | * | | | (0.05 | )* | | | 0.06 | | | | 0.03 | * | | | 0.01 | | | | (0.04 | ) | |
Net realized and unrealized gain (loss)
on investments | | $ | 1.94 | | | | 3.41 | | | | 1.92 | | | | 2.43 | | | | 4.79 | | | | (3.86 | ) | |
| Total from investment operations | | $ | 2.07 | | | | 3.36 | | | | 1.98 | | | | 2.46 | | | | 4.80 | | | | (3.90 | ) | |
| Less distribution from: | | | | | | | | | | | | | | | | | | | | | | | | | |
| Net investment income | | $ | — | | | | 0.04 | | | | 0.01 | | | | 0.05 | | | | 0.03 | | | | 0.06 | | |
| Net realized gains on investments | | $ | 3.33 | | | | 3.37 | | | | 0.28 | | | | — | | | | — | | | | — | | |
| Total distribution | | $ | 3.33 | | | | 3.41 | | | | 0.29 | | | | 0.05 | | | | 0.03 | | | | 0.06 | | |
| Net asset value, end of period | | $ | 20.28 | | | | 21.54 | | | | 21.59 | | | | 19.90 | | | | 17.49 | | | | 12.72 | | |
| Total Return(1) | | % | 10.53 | | | | 16.07 | | | | 10.05 | †† | | | 14.09 | | | | 37.76 | | | | (23.45 | ) | |
| Ratios and Supplemental Data: | |
| Net assets, end of period (000's) | | $ | 2,473 | | | | 2,162 | | | | 68,768 | | | | 72,225 | | | | 840 | | | | 184 | | |
| Ratios to average net assets: | | | | | | | | | | | | | | | | | | | | | | | | | |
| Gross expenses prior to expense waiver(2) | | % | 1.10 | | | | 1.10 | | | | 1.10 | | | | 1.09 | | | | 1.10 | | | | 1.12 | | |
| Net expenses after expense waiver(2) | | % | 1.10 | † | | | 1.10 | † | | | 1.10 | | | | 1.09 | | | | 1.10 | | | | 1.12 | | |
Net investment income (loss) after
expense waiver(2) | | % | 1.25 | † | | | (0.24 | )† | | | 0.26 | | | | 0.19 | | | | 0.22 | | | | 0.14 | | |
| Portfolio turnover rate | | % | 47 | | | | 83 | | | | 72 | | | | 93 | | | | 178 | | | | 371 | | |
(1) Total return is calculated assuming reinvestment of all dividends and capital gain distributions at net asset value and does not reflect the effect of insurance contract charges. Total return for periods less than one year is not annualized.
(2) Annualized for periods less than one year.
* Calculated using average number of shares outstanding throughout the period.
† Impact of waiving the advisory fee for the ING Institutional Prime Money Market Fund holding has less than 0.01% impact on the expense ratio.
†† In 2005, the Investment Adviser fully reimbursed the Portfolio for a loss incurred from a transaction not meeting the Portfolio's investment guidelines. There was no impact on total return.
See Accompanying Notes to Financial Statements
24
ING VP VALUE OPPORTUNITY PORTFOLIO (UNAUDITED)
FINANCIAL HIGHLIGHTS
Selected data for a share of beneficial interest outstanding throughout each period.
| | | Class ADV | |
| | | Six Months
Ended
June 30,
2007 | | December 29,
2006(1) to
December 31,
2006 | |
| Per Share Operating Performance: | |
| Net asset value, beginning of period | | $ | 15.72 | | | | 15.72 | | |
| Income (loss) from investment operations: | | | | | | | | | |
| Net investment income (loss) | | $ | 0.06 | | | | (0.00 | )** | |
| Net realized and unrealized gain on investments | | $ | 1.06 | | | | — | | |
| Total from investment operations | | $ | 1.12 | | | | (0.00 | )** | |
| Less distributions from | | | | | | | : | | |
| Net investment income | | $ | 0.26 | | | | — | | |
| Total distributions | | $ | 0.26 | | | | — | | |
| Net asset value, end of period | | $ | 16.58 | | | | 15.72 | | |
| Total Return(2) | | % | 7.24 | | | | — | | |
| Ratios and Supplemental Data: | |
| Net assets, end of period (000's) | | $ | 1 | | | | 1 | | |
| Ratios to average net assets: | | | | | | | | | |
| Expenses(3) | | % | 1.19 | † | | | 1.19 | | |
| Net investment income (loss)(3) | | % | 0.71 | † | | | (1.19 | ) | |
| Portfolio turnover rate | | % | 54 | | | | 83 | | |
| | | Class I | |
| | | Six Months
Ended
June 30, | | Year Ended December 31, | |
| | | 2007 | | 2006 | | 2005 | | 2004 | | 2003 | | 2002 | |
| Per Share Operating Performance: | |
| Net asset value, beginning of period | | $ | 15.84 | | | | 13.84 | | | | 13.19 | | | | 12.08 | | | | 9.77 | | | | 13.25 | | |
| Income (loss) from investment operations: | | | | | | | | | | | | | | | | | | | | | | | | | |
| Net investment income | | $ | 0.13 | * | | | 0.23 | * | | | 0.19 | * | | | 0.24 | | | | 0.10 | | | | 0.04 | | |
Net realized and unrealized gain (loss)
on investments | | $ | 1.07 | | | | 1.98 | | | | 0.71 | | | | 0.98 | | | | 2.29 | | | | (3.47 | ) | |
| Total from investment operations | | $ | 1.20 | | | | 2.21 | | | | 0.90 | | | | 1.22 | | | | 2.39 | | | | (3.43 | ) | |
| Less distributions from: | | | | | | | | | | | | | | | | | | | | | | | | | |
| Net investment income | | $ | 0.26 | | | | 0.21 | | | | 0.25 | | | | 0.11 | | | | 0.08 | | | | 0.05 | | |
| Total distributions | | $ | 0.26 | | | | 0.21 | | | | 0.25 | | | | 0.11 | | | | 0.08 | | | | 0.05 | | |
| Net asset value, end of period | | $ | 16.78 | | | | 15.84 | | | | 13.84 | | | | 13.19 | | | | 12.08 | | | | 9.77 | | |
| Total Return(2) | | % | 7.70 | | | | 16.10 | | | | 6.95 | | | | 10.15 | | | | 24.59 | | | | (25.96 | ) | |
| Ratios and Supplemental Data: | |
| Net assets, end of period (000's) | | $ | 168,526 | | | | 173,014 | | | | 178,828 | | | | 219,889 | | | | 257,448 | | | | 211,470 | | |
| Ratios to average net assets: | | | | | | | | | | | | | | | | | | | | | | | | | |
| Expenses(3) | | % | 0.69 | † | | | 0.69 | | | | 0.70 | | | | 0.69 | | | | 0.70 | | | | 0.72 | | |
| Net investment income(3) | | % | 1.55 | † | | | 1.58 | | | | 1.47 | | | | 1.61 | | | | 0.91 | | | | 0.51 | | |
| Portfolio turnover rate | | % | 54 | | | | 83 | | | | 94 | | | | 16 | | | | 251 | | | | 304 | | |
(1) Commencement of operations.
(2) Total return is calculated assuming reinvestment of all dividends and capital gain distributions at net asset value and does not reflect the effect of insurance contract charges. Total return for periods less than one year is not annualized.
(3) Annualized for periods less than one year.
* Calculated using average number of shares outstanding throughout the period.
** Amount is more than $(0.005).
† Impact of waiving advisory fee for the ING Institutional Prime Money Market Fund holding has less than 0.01% impact on the expense ratio.
See Accompanying Notes to Financial Statements
25
ING VP VALUE OPPORTUNITY PORTFOLIO (UNAUDITED) (CONTINUED)
FINANCIAL
HIGHLIGHTS
Selected data for a share of beneficial interest outstanding throughout each period.
| | | Class S | |
| | | Six Months
Ended
June 30, | | Year Ended December 31, | |
| | | 2007 | | 2006 | | 2005 | | 2004 | | 2003 | | 2002 | |
| Per Share Operating Performance: | |
| Net asset value, beginning of period | | $ | 15.72 | | | | 13.77 | | | | 13.12 | | | | 12.03 | | | | 9.75 | | | | 13.24 | | |
| Income (loss) from investment operations: | | | | | | | | | | | | | | | | | | | | | | | | | |
| Net investment income | | $ | 0.10 | * | | | 0.19 | * | | | 0.16 | * | | | 0.13 | | | | 0.04 | | | | 0.01 | | |
Net realized and unrealized gain (loss)
on investments | | $ | 1.07 | | | | 1.96 | | | | 0.71 | | | | 1.05 | | | | 2.31 | | | | (3.46 | ) | |
| Total from investment operations | | $ | 1.17 | | | | 2.15 | | | | 0.87 | | | | 1.18 | | | | 2.35 | | | | (3.45 | ) | |
| Less distributions from: | | | | | | | | | | | | | | | | | | | | | | | | | |
| Net investment income | | $ | 0.22 | | | | 0.20 | | | | 0.22 | | | | 0.09 | | | | 0.07 | | | | 0.04 | | |
| Total distributions | | $ | 0.22 | | | | 0.20 | | | | 0.22 | | | | 0.09 | | | | 0.07 | | | | 0.04 | | |
| Net asset value, end of period | | $ | 16.67 | | | | 15.72 | | | | 13.77 | | | | 13.12 | | | | 12.03 | | | | 9.75 | | |
| Total Return(1) | | % | 7.60 | | | | 15.77 | | | | 6.76 | | | | 9.88 | | | | 24.21 | | | | (26.12 | ) | |
| Ratios and Supplemental Data: | |
| Net assets, end of period (000's) | | $ | 27,915 | | | | 28,391 | | | | 30,125 | | | | 3,505 | | | | 2,277 | | | | 1,092 | | |
| Ratios to average net assets: | | | | | | | | | | | | | | | | | | | | | | | | | |
| Expenses(2) | | % | 0.94 | † | | | 0.94 | | | | 0.95 | | | | 0.94 | | | | 0.95 | | | | 0.97 | | |
| Net investment income(2) | | % | 1.30 | † | | | 1.32 | | | | 1.18 | | | | 1.36 | | | | 0.64 | | | | 0.26 | | |
| Portfolio turnover rate | | % | 54 | | | | 83 | | | | 94 | | | | 16 | | | | 251 | | | | 304 | | |
(1) Total return is calculated assuming reinvestment of all dividends and capital gain distributions at net asset value and does not reflect the effect of insurance contract charges. Total return for periods less than one year is not annualized.
(2) Annualized for periods less than one year.
* Calculated using average number of shares outstanding throughout the period.
† Impact of waiving advisory fee for the ING Institutional Prime Money Market Fund holding has less than 0.01% impact on expense ratio.
See Accompanying Notes to Financial Statements
26
ING VP INTERMEDIATE BOND PORTFOLIO (UNAUDITED)
FINANCIAL HIGHLIGHTS
Selected data for a share of beneficial interest outstanding throughout each period.
| | | Class ADV | |
| | | Six Months
Ended
June 30,
2007 | | December 20,
2006(1) to
December 31,
2006 | |
| Per Share Operating Performance: | |
| Net asset value, beginning of period | | $ | 12.96 | | | | 13.53 | | |
| Income (loss) from investment operations: | | | | | | | | | |
| Net investment income | | $ | 0.31 | | | | 0.02 | | |
| Net realized and unrealized loss on investments | | $ | (0.19 | ) | | | (0.06 | ) | |
| Total from investment operations | | $ | 0.12 | | | | (0.04 | ) | |
| Less distributions from: | | | | | | | | | |
| Net investment income | | $ | — | | | | 0.53 | | |
| Total distributions | | $ | — | | | | 0.53 | | |
| Net asset value, end of period | | $ | 13.08 | | | | 12.96 | | |
| Total Return(2) | | % | 0.93 | | | | (0.30 | ) | |
| Ratios and Supplemental Data: | |
| Net assets, end of period (millions) | | $ | 0 | ** | | | 0 | ** | |
| Ratios to average net assets: | | | | | | | | | |
| Gross expenses prior to expense waiver(3) | | % | 0.99 | | | | 0.99 | | |
| Net expenses after expense waiver(3) | | % | 0.99 | † | | | 0.99 | † | |
| Net investment income after expense waiver(3) | | % | 4.86 | † | | | 6.82 | † | |
| Portfolio turnover rate | | % | 197 | | | | 390 | | |
| | | Class I | |
| | | Six Months
Ended
June 30, | | Year Ended December 31, | |
| | | 2007 | | 2006 | | 2005 | | 2004 | | 2003 | | 2002 | |
| Per Share Operating Performance: | |
| Net asset value, beginning of period | | $ | 12.96 | | | | 12.97 | | | | 13.14 | | | | 14.15 | | | | 13.53 | | | | 12.95 | | |
| Income (loss) from investment operations: | | | | | | | | | | | | | | | | | | | | | | | | | |
| Net investment income | | $ | 0.35 | | | | 0.65 | * | | | 0.54 | | | | 0.53 | | | | 0.56 | | | | 0.45 | | |
Net realized and unrealized gain (loss)
on investments | | $ | (0.20 | ) | | | (0.12 | ) | | | (0.13 | ) | | | 0.13 | | | | 0.29 | | | | 0.63 | | |
| Total from investment operations | | $ | 0.15 | | | | 0.53 | | | | 0.41 | | | | 0.66 | | | | 0.85 | | | | 1.08 | | |
| Less distributions from: | | | | | | | | | | | | | | | | | | | | | | | | | |
| Net investment income | | $ | — | | | | 0.54 | | | | 0.51 | | | | 1.11 | | | | 0.11 | | | | 0.43 | | |
| Net realized gains on investments | | $ | — | | | | — | | | | 0.07 | | | | 0.56 | | | | 0.12 | | | | 0.07 | | |
| Total distributions | | $ | — | | | | 0.54 | | | | 0.58 | | | | 1.67 | | | | 0.23 | | | | 0.50 | | |
| Net asset value, end of period | | $ | 13.11 | | | | 12.96 | | | | 12.97 | | | | 13.14 | | | | 14.15 | | | | 13.53 | | |
| Total Return(2) | | % | 1.16 | | | | 4.06 | | | | 3.14 | | | | 4.88 | | | | 6.30 | | | | 8.33 | | |
| Ratios and Supplemental Data: | |
| Net assets, end of period (millions) | | $ | 2,014 | | | | 1,909 | | | | 1,148 | | | | 1,093 | | | | 1,126 | | | | 1,206 | | |
| Ratios to average net assets: | | | | | | | | | | | | | | | | | | | | | | | | | |
| Gross expenses prior to expense waiver(3) | | % | 0.49 | | | | 0.49 | | | | 0.49 | | | | 0.48 | | | | 0.50 | | | | 0.49 | | |
| Net expenses after expense waiver(3) | | % | 0.49 | † | | | 0.49 | † | | | 0.49 | | | | 0.48 | | | | 0.50 | | | | 0.49 | | |
| Net investment income after expense waiver(3) | | % | 5.34 | † | | | 4.97 | † | | | 4.14 | | | | 3.79 | | | | 3.77 | | | | 3.50 | | |
| Portfolio turnover rate | | % | 197 | | | | 390 | | | | 589 | | | | 407 | | | | 521 | | | | 565 | | |
(1) Commencement of operations.
(2) Total return is calculated assuming reinvestment of all dividends and capital gain distributions at net asset value and does not reflect the effect of insurance contract charges. Total return for periods less than one year is not annualized.
(3) Annualized for periods less than one year.
* Calculated using average number of shares outstanding throughout the period.
** Amount is less than $500,000.
† Impact of waiving the advisory fee for the ING Institutional Prime Money Market Fund holding has less than 0.01% impact on the expense ratio.
See Accompanying Notes to Financial Statements
27
ING VP INTERMEDIATE BOND PORTFOLIO (UNAUDITED) (CONTINUED)
FINANCIAL
HIGHLIGHTS
Selected data for a share of beneficial interest outstanding throughout each period.
| | | Class S | |
| | | Six Months
Ended
June 30, | | Year Ended December 31, | | May 3,
2002(1) to
December 31, | |
| | | 2007 | | 2006 | | 2005 | | 2004 | | 2003 | | 2002 | |
| Per Share Operating Performance: | |
| Net asset value, beginning of period | | $ | 12.89 | | | | 12.91 | | | | 13.09 | | | | 14.13 | | | | 13.53 | | | | 13.05 | | |
| Income (loss) from investment operations: | | | | | | | | | | | | | | | | | | | | | | | | | |
| Net investment income | | $ | 0.33 | * | | | 0.61 | * | | | 0.41 | | | | 0.40 | | | | 0.49 | | | | 0.16 | | |
Net realized and unrealized gain (loss)
on investments | | $ | (0.20 | ) | | | (0.12 | ) | | | (0.03 | ) | | | 0.22 | | | | 0.32 | | | | 0.81 | | |
| Total from investment operations | | $ | 0.13 | | | | 0.49 | | | | 0.38 | | | | 0.62 | | | | 0.81 | | | | 0.97 | | |
| Less distributions from: | | | | | | | | | | | | | | | | | | | | | | | | | |
| Net investment income | | $ | — | | | | 0.51 | | | | 0.49 | | | | 1.10 | | | | 0.09 | | | | 0.42 | | |
| Net realized gains on investments | | $ | — | | | | — | | | | 0.07 | | | | 0.56 | | | | 0.12 | | | | 0.07 | | |
| Total distributions | | $ | — | | | | 0.51 | | | | 0.56 | | | | 1.66 | | | | 0.21 | | | | 0.49 | | |
| Net asset value, end of period | | $ | 13.02 | | | | 12.89 | | | | 12.91 | | | | 13.09 | | | | 14.13 | | | | 13.53 | | |
| Total Return(2) | | % | 1.01 | | | | 3.77 | | | | 2.94 | | | | 4.58 | | | | 6.04 | | | | 7.45 | | |
| Ratios and Supplemental Data: | |
| Net assets, end of period (millions) | | $ | 850 | | | | 621 | | | | 617 | | | | 301 | | | | 71 | | | | 50 | | |
| Ratios to average net assets: | | | | | | | | | | | | | | | | | | | | | | | | | |
| Gross expenses prior to expense waiver(3) | | % | 0.74 | | | | 0.74 | | | | 0.74 | | | | 0.73 | | | | 0.75 | | | | 0.74 | | |
| Net expenses after expense waiver(3) | | % | 0.74 | † | | | 0.74 | † | | | 0.74 | | | | 0.73 | | | | 0.75 | | | | 0.74 | | |
| Net investment income after expense waiver(3) | | % | 5.09 | † | | | 4.69 | † | | | 3.94 | | | | 3.52 | | | | 3.52 | | | | 3.25 | | |
| Portfolio turnover rate | | % | 197 | | | | 390 | | | | 589 | | | | 407 | | | | 521 | | | | 565 | | |
(1) Commencement of operations.
(2) Total return is calculated assuming reinvestment of all dividends and capital gain distributions at net asset value and does not reflect the effect of insurance contract charges. Total return for periods less than one year is not annualized.
(3) Annualized for periods less than one year.
* Calculated using average number of shares outstanding throughout the period.
† Impact of waiving the advisory fee for the ING Institutional Prime Money Market Fund holding has less than 0.01% impact on the expense ratio.
See Accompanying Notes to Financial Statements
28
ING VP MONEY MARKET PORTFOLIO (UNAUDITED)
FINANCIAL HIGHLIGHTS
Selected data for a share of beneficial interest outstanding throughout each period.
| | | Class I | |
| | | Six Months
Ended
June 30, | | Year Ended December 31, | |
| | | 2007 | | 2006 | | 2005 | | 2004 | | 2003 | | 2002 | |
| Per Share Operating Performance: | |
| Net asset value, beginning of period | | $ | 13.40 | | | | 13.17 | | | | 12.94 | | | | 12.94 | | | | 13.03 | | | | 13.33 | | |
| Income (loss) from investment operations: | | | | | | | | | | | | | | | | | | | | | | | | | |
| Net investment income | | $ | 0.33 | * | | | 0.63 | * | | | 0.39 | | | | 0.15 | | | | 0.08 | | | | 0.21 | | |
Net realized and unrealized gain (loss)
on investments | | $ | (0.01 | ) | | | 0.00 | ** | | | (0.01 | ) | | | (0.01 | ) | | | 0.03 | | | | — | | |
| Total from investment operations | | $ | 0.32 | | | | 0.63 | | | | 0.38 | | | | 0.14 | | | | 0.11 | | | | 0.21 | | |
| Less distributions from: | | | | | | | | | | | | | | | | | | | | | | | | | |
| Net investment income | | $ | 0.55 | | | | 0.40 | | | | 0.15 | | | | 0.14 | | | | 0.20 | | | | 0.51 | | |
| Total distributions | | $ | 0.55 | | | | 0.40 | | | | 0.15 | | | | 0.14 | | | | 0.20 | | | | 0.51 | | |
| Net asset value, end of period | | $ | 13.17 | | | | 13.40 | | | | 13.17 | | | | 12.94 | | | | 12.94 | | | | 13.03 | | |
| Total Return(1) | | % | 2.53 | | | | 4.88 | | | | 2.98 | | | | 1.06 | | | | 0.92 | | | | 1.66 | | |
| Ratios and Supplemental Data: | |
| Net assets, end of period (millions) | | $ | 1,555 | | | | 1,356 | | | | 1,073 | | | | 1,101 | | | | 1,238 | | | | 1,552 | | |
| Ratios to average net assets: | | | | | | | | | | | | | | | | | | | | | | | | | |
| Expenses(2) | | % | 0.33 | | | | 0.34 | | | | 0.35 | | | | 0.34 | | | | 0.35 | | | | 0.34 | | |
| Net investment income(2) | | % | 5.04 | | | | 4.79 | | | | 2.93 | | | | 1.11 | | | | 0.91 | | | | 1.63 | | |
(1) Total return is calculated assuming reinvestment of all dividends and capital gain distributions at net asset value and does not reflect the effect of insurance contract charges. Total return for periods less than one year is not annualized.
(2) Annualized for periods less than one year.
* Calculated using average number of shares outstanding throughout the period.
** Amount is less than $0.005.
See Accompanying Notes to Financial Statements
29
ING VP GLOBAL SCIENCE AND TECHNOLOGY PORTFOLIO (UNAUDITED)
FINANCIAL
HIGHLIGHTS
Selected data for a share of beneficial interest outstanding throughout each period.
| | | Class I | |
| | | Six Months
Ended
June 30, | | Year Ended December 31, | |
| | | 2007 | | 2006 | | 2005 | | 2004 | | 2003 | | 2002 | |
| Per Share Operating Performance: | |
| Net asset value, beginning of period | | $ | 4.58 | | | | 4.27 | | | | 3.82 | | | | 3.87 | | | | 2.66 | | | | 4.53 | | |
| Income (loss) from investment operations: | | | | | | | | | | | | | | | | | | | | | | | | | |
| Net investment loss | | $ | (0.01 | ) | | | (0.01 | ) | | | (0.02 | ) | | | (0.03 | ) | | | (0.02 | ) | | | (0.03 | ) | |
Net realized and unrealized gain (loss)
on investments | | $ | 0.50 | | | | 0.32 | | | | 0.47 | | | | (0.02 | ) | | | 1.23 | | | | (1.84 | ) | |
| Total from investment operations | | $ | 0.49 | | | | 0.31 | | | | 0.45 | | | | (0.05 | ) | | | 1.21 | | | | (1.87 | ) | |
| Net asset value, end of period | | $ | 5.07 | | | | 4.58 | | | | 4.27 | | | | 3.82 | | | | 3.87 | | | | 2.66 | | |
| Total Return(1) | | % | 10.70 | | | | 7.26 | | | | 11.78 | | | | (1.29 | ) | | | 45.49 | | | | (41.28 | ) | |
| Ratios and Supplemental Data: | |
| Net assets, end of period (000's) | | $ | 80,876 | | | | 81,599 | | | | 84,523 | | | | 86,291 | | | | 97,742 | | | | 45,559 | | |
| Ratios to average net assets: | | | �� | | | | | | | | | | | | | | | | | | | | | | |
Gross expenses prior to expense
reimbursement/recoupment(2) | | % | 1.09 | | | | 1.08 | | | | 1.06 | | | | 1.05 | | | | 1.10 | | | | 1.12 | | |
Net expenses after expense
reimbursement/recoupment(2)(3) | | % | 1.09 | | | | 1.08 | | | | 1.06 | | | | 1.05 | | | | 1.11 | | | | 1.11 | | |
Net investment loss after expense
reimbursement/recoupment(2)(3) | | % | (0.35 | ) | | | (0.29 | ) | | | (0.48 | ) | | | (0.67 | ) | | | (0.88 | ) | | | (0.89 | ) | |
| Portfolio turnover rate | | % | 42 | | | | 129 | | | | 118 | | | | 163 | | | | 15 | | | | 61 | | |
| | | Class S | |
| | | Six Months
Ended
June 30,
2007 | | Year
Ended
December 31,
2006 | | July 20,
2005(4) to
December 31,
2005 | |
| Per Share Operating Performance: | |
| Net asset value, beginning of period | | $ | 4.56 | | | | 4.27 | | | | 3.90 | | |
| Income (loss) from investment operations: | | | | | | | | | | | | | |
| Net investment loss | | $ | (0.01 | ) | | | (0.02 | ) | | | (0.01 | ) | |
Net realized and unrealized gain
on investments | | $ | 0.49 | | | | 0.31 | | | | 0.38 | | |
| Total from investment operations | | $ | 0.48 | | | | 0.29 | | | | 0.37 | | |
| Net asset value, end of period | | $ | 5.04 | | | | 4.56 | | | | 4.27 | | |
| Total Return(1) | | % | 10.53 | | | | 6.79 | | | | 9.49 | | |
| Ratios and Supplemental Data: | |
| Net assets, end of period (000's) | | $ | 588 | | | | 551 | | | | 78 | | |
| Ratios to average net assets: | | | | | | | | | | | | | |
Gross expenses prior to expense
reimbursement(2) | | % | 1.34 | | | | 1.33 | | | | 1.31 | | |
Net expenses after expense
reimbursement(2)(3) | | % | 1.34 | | | | 1.33 | | | | 1.31 | | |
Net investment loss after expense
reimbursement(2)(3) | | % | (0.59 | ) | | | (0.51 | ) | | | (0.73 | ) | |
| Portfolio turnover rate | | % | 42 | | | | 129 | | | | 118 | | |
(1) Total return is calculated assuming reinvestment of all dividends and capital gain distributions at net asset value and does not reflect the effect of insurance contract charges. Total return for periods less than one year is not annualized.
(2) Annualized for periods less than one year.
(3) The Investment Adviser has agreed to limit expenses, (excluding interest, taxes, brokerage and extraordinary expenses) subject to possible recoupment by the Investment Adviser within three years of being incurred.
(4) Commencement of operations.
See Accompanying Notes to Financial Statements
30
ING VP INTERNATIONAL EQUITY PORTFOLIO (UNAUDITED)
FINANCIAL HIGHLIGHTS
Selected data for a share of beneficial interest outstanding throughout each period.
| | | Class ADV | |
| | | Six Months
Ended
June 30,
2007 | | December 29,
2006(1) to
December 31,
2006 | |
| Per Share Operating Performance: | |
| Net asset value, beginning of period | | $ | 12.21 | | | | 12.21 | | |
| Income (loss) from investment operations: | | | | | | | | | |
| Net investment income (loss) | | $ | 0.13 | | | | (0.00 | )* | |
Net realized and unrealized gain
on investments | | $ | 0.80 | | | | — | | |
| Total from investment operations | | $ | 0.93 | | | | (0.00 | )* | |
| Less distributions from: | | | | | | | | | |
| Net investment income | | $ | 0.25 | | | | — | | |
| Total distributions | | $ | 0.25 | | | | — | | |
| Net asset value, end of period | | $ | 12.89 | | | | 12.21 | | |
| Total Return(2) | | % | 7.75 | | | | — | | |
| Ratios and Supplemental Data: | |
| Net assets, end of period (000's) | | $ | 1 | | | | 1 | | |
| Ratios to average net assets: | | | | | | | | | |
| Gross expenses prior to expense | | | | | | | | | |
| reimbursement/recoupment(3) | | % | 1.47 | | | | 1.49 | | |
Net expenses after expense
reimbursement/recoupment(3)(4) | | % | 1.47 | † | | | 1.49 | | |
Net investment income (loss) after expense
reimbursement/recoupment(3)(4) | | % | 2.15 | † | | | (1.49 | ) | |
| Portfolio turnover rate | | % | 37 | | | | 79 | | |
| | | Class I | |
| | | Six Months
Ended
June 30, | | Year Ended December 31, | |
| | | 2007 | | 2006 | | 2005 | | 2004 | | 2003 | | 2002 | |
| Per Share Operating Performance: | |
| Net asset value, beginning of period | | $ | 12.29 | | | | 10.11 | | | | 8.74 | | | | 7.55 | | | | 5.78 | | | | 7.90 | | |
| Income (loss) from investment operations: | | | | | | | | | | | | | | | | | | | | | | | | | |
| Net investment income | | $ | 0.16 | | | | 0.24 | | | | 0.14 | | | | 0.07 | | | | 0.06 | | | | 0.03 | | |
Net realized and unrealized gain (loss)
on investments | | $ | 0.82 | | | | 2.11 | | | | 1.32 | | | | 1.21 | | | | 1.78 | | | | (2.13 | ) | |
| Total from investment operations | | $ | 0.98 | | | | 2.35 | | | | 1.46 | | | | 1.28 | | | | 1.84 | | | | (2.10 | ) | |
| Less distributions from: | | | | | | | | | | | | | | | | | | | | | | | | | |
| Net investment income | | $ | 0.25 | | | | 0.17 | | | | 0.09 | | | | 0.09 | | | | 0.07 | | | | 0.02 | | |
| Total distributions | | $ | 0.25 | | | | 0.17 | | | | 0.09 | | | | 0.09 | | | | 0.07 | | | | 0.02 | | |
| Net asset value, end of period | | $ | 13.02 | | | | 12.29 | | | | 10.11 | | | | 8.74 | | | | 7.55 | | | | 5.78 | | |
| Total Return(2) | | % | 8.11 | | | | 23.48 | | | | 16.87 | | | | 17.17 | | | | 32.05 | | | | (26.68 | ) | |
| Ratios and Supplemental Data: | |
| Net assets, end of period (000's) | | $ | 82,838 | | | | 78,573 | | | | 61,464 | | | | 52,505 | | | | 40,537 | | | | 28,917 | | |
| Ratios to average net assets: | | | | | | | | | | | | | | | | | | | | | | | | | |
Gross expenses prior to expense
reimbursement/recoupment(3) | | % | 0.97 | | | | 0.99 | | | | 1.00 | | | | 0.95 | | | | 1.38 | | | | 1.46 | | |
Net expenses after expense
reimbursement/recoupment(3)(4) | | % | 0.97 | † | | | 0.99 | | | | 1.14 | | | | 1.15 | | | | 1.15 | | | | 1.15 | | |
Net investment income after expense
reimbursement/recoupment(3)(4) | | % | 2.53 | † | | | 2.27 | | | | 1.51 | | | | 1.00 | | | | 1.04 | | | | 0.40 | | |
| Portfolio turnover rate | | % | 37 | | | | 79 | | | | 97 | | | | 137 | | | | 85 | | | | 266 | | |
(1) Commencement of operations.
(2) Total return is calculated assuming reinvestment of all dividends and capital gain distributions at net asset value and does not reflect the effect of insurance contract charges. Total return for periods less than one year is not annualized.
(3) Annualized for periods less than one year.
(4) The Investment Adviser has agreed to limit expenses, (excluding interest, taxes, brokerage and extraordinary expenses) subject to possible recoupment by the Investment Adviser within three years of being incurred.
* Amount is more than $(0.005).
† Impact of waiving the advisory fee the ING Institutional Prime Money Market Fund holding has less than 0.01% impact on the expense ratio.
See Accompanying Notes to Financial Statements
31
ING VP INTERNATIONAL EQUITY PORTFOLIO (UNAUDITED) (CONTINUED)
FINANCIAL
HIGHLIGHTS
| | | Class S | |
| | | Six Months
Ended
June 30, | | Year Ended December 31, | |
| | | 2007 | | 2006 | | 2005 | | 2004 | | 2003 | | 2002 | |
| Per Share Operating Performance: | |
| Net asset value, beginning of period | | $ | 12.21 | | | | 10.05 | | | | 8.70 | | | | 7.53 | | | | 5.78 | | | | 7.90 | | |
| Income (loss) from investment operations: | | | | | | | | | | | | | | | | | | | | | | | | | |
| Net investment income (loss) | | $ | 0.15 | * | | | 0.19 | * | | | 0.09 | | | | 0.05 | | | | (0.01 | ) | | | 0.01 | | |
Net realized and unrealized gain (loss)
on investments | | $ | 0.80 | | | | 2.13 | | | | 1.33 | | | | 1.21 | | | | 1.82 | | | | (2.13 | ) | |
| Total from investment operations | | $ | 0.95 | | | | 2.32 | | | | 1.42 | | | | 1.26 | | | | 1.81 | | | | (2.12 | ) | |
| Less distributions from: | | | | | | | | | | | | | | | | | | | | | | | | | |
| Net investment income | | $ | 0.23 | | | | 0.16 | | | | 0.07 | | | | 0.09 | | | | 0.06 | | | | — | | |
| Total distributions | | $ | 0.23 | | | | 0.16 | | | | 0.07 | | | | 0.09 | | | | 0.06 | | | | — | | |
| Net asset value, end of period | | $ | 12.93 | | | | 12.21 | | | | 10.05 | | | | 8.70 | | | | 7.53 | | | | 5.78 | | |
| Total Return(1) | | % | 7.87 | | | | 23.24 | | | | 16.53 | | | | 16.87 | | | | 31.62 | | | | (26.84 | ) | |
| Ratios and Supplemental Data: | |
| Net assets, end of period (000's) | | $ | 1,381 | | | | 875 | | | | 353 | | | | 265 | | | | 197 | | | | 8 | | |
| Ratios to average net assets: | | | | | | | | | | | | | | | | | | | | | | | | | |
Gross expenses prior to expense
reimbursement/recoupment(2) | | % | 1.22 | | | | 1.24 | | | | 1.25 | | | | 1.20 | | | | 1.63 | | | | 1.71 | | |
Net expenses after expense
reimbursement/recoupment(2)(3) | | % | 1.22 | † | | | 1.24 | | | | 1.39 | | | | 1.40 | | | | 1.40 | | | | 1.40 | | |
Net investment income after expense
reimbursement/recoupment(2)(3) | | % | 2.40 | † | | | 1.70 | | | | 1.16 | | | | 0.68 | | | | 0.79 | | | | 0.15 | | |
| Portfolio turnover rate | | % | 37 | | | | 79 | | | | 97 | | | | 137 | | | | 85 | | | | 266 | | |
(1) Total return is calculated assuming reinvestment of all dividends and capital gain distributions at net asset value and does not reflect the effect of insurance contract charges. Total return for periods less than one year is not annualized.
(2) Annualized for periods less than one year.
(3) The Investment Adviser has agreed to limit expenses, (excluding interest, taxes, brokerage and extraordinary expenses) subject to possible recoupment by the Investment Adviser within three years of being incurred.
* Calculated using average number of shares outstanding throughout the period.
† Impact of waiving the advisory fee the ING Institutional Prime Money Market Fund holding has less than 0.01% impact on the expense ratio.
See Accompanying Notes to Financial Statements
32
NOTES TO FINANCIAL STATEMENTS AS OF JUNE 30, 2007 (UNAUDITED)
NOTE 1 — ORGANIZATION
Organization. The ING Variable Product Funds are comprised of ING VP Balanced Portfolio, Inc., ING Variable Funds, ING Variable Portfolios, Inc., ING VP Intermediate Bond Portfolio and ING VP Money Market Portfolio (collectively, "Registrants"), all of which are open-end investment management companies registered under the Investment Company Act of 1940, as amended ("1940 Act").
ING VP Balanced Portfolio, Inc. is a company incorporated under the laws of Maryland on December 14, 1988 with one portfolio, ING VP Balanced Portfolio ("Balanced"). ING Variable Funds is a business trust formed under the laws of Massachusetts on January 25, 1984 with one portfolio, ING VP Growth and Income Portfolio ("Growth and Income"). ING Variable Portfolios, Inc. is a company incorporated under the laws of Maryland on June 4, 1996 and has eight separate portfolios. The five portfolios that are in this report are: ING VP Growth Portfolio ("Growth"), ING VP Small Company Portfolio ("Small Company"), ING VP Value Opportunity Portfolio ("Value Opportunity"), ING VP Global Science and Technology Portfolio ("Global Science and Technology") and ING VP International Equity Portfolio ("International Equity"). ING VP Intermediate Bond Portfolio is a business trust formed under the laws of Massachusetts on January 25, 1984 with one portfolio, ING VP Intermediate Bond Portfolio ("Intermediate Bond"). ING VP Money Market Portfolio is a business trust under the laws of Massachusetts on January 25, 1984 with one portfolio, ING VP Money Market Portfolio ("Money Market"). Each of the portfolios is a "Portfolio" and collectively, they are the "Portfolios".
The following is a brief description of each Portfolio's investment objective:
• Balanced seeks to maximize investment return consistent with reasonable safety of principal, by investing in a diversified portfolio of one or more of the following asset classes: stocks, bonds, and cash equivalents;
• Growth and Income seeks to maximize total return through investments in a diversified portfolio of common stocks and securities convertible into common stock;
• Growth seeks growth of capital through investment in a diversified portfolio consisting primarily of common stocks and securities convertible into common stock believed to offer growth potential;
• Small Company seeks growth of capital primarily through investment in a diversified portfolio of common stocks and securities of companies with smaller market capitalizations;
• Value Opportunity seeks growth of capital primarily through investment in a diversified portfolio of common stocks;
• Intermediate Bond seeks to maximize total return consistent with reasonable risk by investing in a diversified portfolio consisting primarily of debt securities;
• Money Market seeks to provide high current return, consistent with preservation of capital and liquidity, through investment in high-quality money market instruments;
• Global Science and Technology seeks long-term capital appreciation; and
• International Equity seeks long-term capital growth primarily through investment in a diversified portfolio of common stocks principally traded in countries outside of the United States.
Each Portfolio offers Class I and Class S shares. Each Portfolio except, Small Company, Money Market and Global Science and Technology offers Adviser ("ADV") Class shares. The three classes differ principally in applicable distribution and service fees. Shareholders of each class also bear certain expenses that pertain to that particular class. All shareholders bear the common expenses of the Portfolios and earn income and realized gains/losses from the Portfolio pro rata based on the average daily net assets of each class, without discrimination between share classes. Differences in per share dividend rates generally result from differences in separate class expenses, including distribution, and shareholder servicing fees.
Shares of the Portfolios may be offered to segregated asset accounts of insurance companies as investment options under variable annuity contracts and variable life insurance policies. Shares may also be offered to qualified pension and retirement plans outside the variable contract and to certain investment advisers and their affiliates. Class I shares may be made available to other investment companies, including series of the companies under fund-of-funds arrangements.
Participating insurance companies and other designated organizations are authorized to receive purchase orders on the Portfolio's behalf.
ING Investments, LLC ("ING Investments'' or the "Investment Adviser"), an Arizona limited liability company, serves as the investment adviser to the Portfolios. ING Investments has engaged ING Investment Management Co. ("ING IM''), a Connecticut corporation, to serve as the Sub-Adviser to each Portfolio, with the
33
NOTES TO FINANCIAL STATEMENTS AS OF JUNE 30, 2007 (UNAUDITED) (CONTINUED)
NOTE 1 — ORGANIZATION (continued)
exception of Global Science and Technology. ING Funds Distributor, LLC ("IFD" or the "Distributor") is the principal underwriter of the Portfolios. ING Investments, ING IM and the Distributor are indirect, wholly-owned subsidiaries of ING Groep N.V. ("ING Groep"). ING Groep is one of the largest financial services organizations in the world, and offers an array of banking, insurance and asset management services to both individuals and institutional investors.
NOTE 2 — SIGNIFICANT ACCOUNTING POLICIES`
The following significant accounting policies are consistently followed by the Portfolios in the preparation of their financial statements. Such policies are in conformity with U.S. generally accepted accounting principles for investment companies.
A. Security Valuation. Investments in equity securities traded on a national securities exchange are valued at the last reported sale price. Securities reported by NASDAQ are valued at the NASDAQ official closing prices. Securities traded on an exchange or NASDAQ for which there has been no sale and securities traded in the over-the-counter-market are valued at the mean between the last reported bid and ask prices. All investments quoted in foreign currencies will be valued daily in U.S. dollars on the basis of the foreign currency exchange rates prevailing at that time. Debt securities are valued at prices obtained from independent services or from one or more dealers making markets in the securities and may be adjusted based on the Portfolios' valuation procedures. U.S. government obligations are valued by using market quotations or independent pricing services that use prices provided by market-makers or estimates of market values obtained from yield data relating to instruments or securities with similar characteristics.
Securities and assets for which market quotations are not readily available (which may include certain restricted securities, which are subject to limitations as to their sale) are valued at their fair values as determined in good faith by or under the supervision of the Portfolios' Board of Directors/Trustees ("Board"), in accordance with methods that are specifically authorized by the Board. Securities traded on exchanges, including foreign exchanges, which close earlier than the time that a Portfolio calculates its net asset value ("NAV") may also be valued at their fair values as determined in good faith by or under the supervision of a Portfolio's Board, in accordance with methods that are specifically authorized by the Board. The value of a foreign security traded on an exchange outside the United States is generally based on its price on the principal foreign exch ange where it trades as of the time a Portfolio determines its NAV or if the foreign exchange closes prior to the time the Portfolio determines its NAV, the most recent closing price of the foreign security on its principal exchange. Trading in certain non-U.S. securities may not take place on all days on which the New York Stock Exchange ("NYSE") is open. Further, trading takes place in various foreign markets on days on which the NYSE is not open. Consequently, the calculation of the Portfolio's NAV may not take place contemporaneously with the determination of the prices of securities held by a Portfolio in foreign securities markets. Further, the value of a Portfolio's assets may be significantly affected by foreign trading on days when a shareholder cannot purchase or redeem shares of the Portfolio. In calculating a Portfolio's NAV, foreign securities denominated in foreign currency are converted to U.S. dollar equivalents. If an event occurs after the time at which the market for foreign securities hel d by a Portfolio closes but before the time that a Portfolio's NAV is calculated, such event may cause the closing price on the foreign exchange to not represent a readily available reliable market value quotation for such securities at the time a Portfolio determines its NAV. In such a case, a Portfolio will use the fair value of such securities as determined under a Portfolio's valuation procedures. Events after the close of trading on a foreign market that could require the Portfolio to fair value some or all of its foreign securities include, among others, securities trading in the U.S. and other markets, corporate announcements, natural and other disasters, and political and other events. Among other elements of analysis in the determination of a security's fair value, the Board has authorized the use of one or more independent research services to assist with such determinations. An independent research service may use statistical analyses and quantitative models to help determine fair value as of the time a Portfolio calculates its NAV. There can be no assurance that such models accurately reflect the behavior of the applicable markets or the effect of the behavior of such markets on the fair value of securities, or that such markets will continue to behave in a fashion that is consistent
34
NOTES TO FINANCIAL STATEMENTS AS OF JUNE 30, 2007 (UNAUDITED) (CONTINUED)
NOTE 2 — SIGNIFICANT ACCOUNTING POLICIES (continued)
with such models. Unlike the closing price of a security on an exchange, fair value determinations employ elements of judgment. Consequently, the fair value assigned to a security may not represent the actual value that a Portfolio could obtain if it were to sell the security at the time of the close of the NYSE. Pursuant to procedures adopted by the Board, a Portfolio is not obligated to use the fair valuations suggested by any research service, and valuation recommendations provided by such research services may be overridden if other events have occurred or if other fair valuations are determined in good faith to be more accurate. Unless an event is such that it causes a Portfolio to determine that the closing prices for one or more securities do not represent readily available reliable market value quotations at the time the Portfolio determines its NAV, events that occur between the time of the close of the foreign market on which they are traded and the close of regular trading on the NYSE will not be reflected in the Portfolio's NAV. Investments in securities maturing in 60 days or less at the date of valuation are valued at amortized cost, which, when combined with accrued interest, approximates market value.
B. Security Transactions and Revenue Recognition. Securities transactions are accounted for on the trade date. Realized gains and losses are reported on the basis of identified cost of securities sold. Interest income is recorded on an accrual basis. Dividend income is recorded on the ex-dividend date, or for certain foreign securities, when the information becomes available to the Portfolios. Premium amortization and discount accretion are determined by the effective yield method.
C. Foreign Currency Translation. The books and records of the Portfolios are maintained in U.S. dollars. Any foreign currency amounts are translated into U.S. dollars on the following basis:
(1) Market value of investment securities, other assets and liabilities — at the exchange rates prevailing at the end of the day.
(2) Purchases and sales of investment securities, income and expenses — at the rates of exchange prevailing on the respective dates of such transactions.
Although the net assets and the market values are presented at the foreign exchange rates at the end of the day, the Portfolios do not isolate the portion of the results of operations resulting from changes in foreign exchange rates on investments from the fluctuations arising from changes in market prices of securities held. Such fluctuations are included with the net realized and unrealized gains or losses from investments. For securities, which are subject to foreign withholding tax upon disposition, liabilities are recorded on the Statements of Assets and Liabilities for the estimated tax withholding based on the securities' current market value. Upon disposition, realized gains or losses on such securities are recorded net of foreign withholding tax.
Reported net realized foreign exchange gains or losses arise from sales of foreign currencies, currency gains or losses realized between the trade and settlement dates on securities transactions, the difference between the amounts of dividends, interest, and foreign withholding taxes recorded on a Portfolio's books, and the U.S. dollar equivalent of the amounts actually received or paid. Net unrealized foreign exchange gains and losses arise from changes in the value of assets and liabilities other than investments in securities at fiscal year end, resulting from changes in the exchange rate. Foreign security and currency transactions may involve certain considerations and risks not typically associated with investing in U.S. companies and U.S. government securities. These risks include, but are not limited to, revaluation of currencies and future adverse political and economic developments, which could cause securities and their markets to be less liquid and prices more volatile than those of comparable U.S. companies and U.S. government securities.
D. Foreign Currency Transactions and Futures Contracts. Certain Portfolios may enter into foreign currency exchange transactions to convert to and from different foreign currencies and to and from the U.S. dollar in connection with the planned purchases or sales of securities. When entering into a currency forward contract, a Portfolio agrees to receive or deliver a fixed quantity of foreign currency for an agreed-upon price on an agreed future date. The Portfolios either enter into these transactions on a spot basis at the spot rate prevailing in the foreign currency exchange market or use forward foreign currency contracts to purchase or sell foreign currencies. When the contract is fulfilled or closed, gains or losses are realized. Until then, the gain or loss is included in unre alized appreciation or depreciation. Risks may arise upon entering into forward
35
NOTES TO FINANCIAL STATEMENTS AS OF JUNE 30, 2007 (UNAUDITED) (CONTINUED)
NOTE 2 — SIGNIFICANT ACCOUNTING POLICIES (continued)
contracts from the potential inability of counterparties to meet the terms of their forward contracts and from unanticipated movements in the value of foreign currencies relative to the U.S. dollar.
Each Portfolio, with the exception of Money Market, may enter into futures contracts involving foreign currency, interest rates, securities and securities indices. A futures contract obligates the seller of the contract to deliver and the purchaser of the contract to take delivery of the type of foreign currency, financial instrument or security called for in the contract at a specified future time for a specified price. Upon entering into such a contract, a Portfolio is required to deposit and maintain as collateral such initial margin as required by the exchange on which the contract is traded. Pursuant to the contract, a Portfolio agrees to receive from or pay to the broker an amount equal to the daily fluctuations in the value of the contract. Such receipts or payments are known as variation margins and are recorded as unrealized gains or losses by the Portfolio. When the contract is closed, the Portfolio records a realized gain or loss equal to the difference between the value of the contract at the time it was opened and the value at the time it was closed.
E. Distributions to Shareholders. The Portfolios record distributions to their shareholders on the ex-dividend date. Balanced, Growth, Small Company, Value Opportunity, Money Market and Global Science and Technology declare and pay dividends annually. Growth and Income and Intermediate Bond declare and pay dividends semi-annually. The Portfolios may make distributions on a more frequent basis to comply with the distribution requirements of the Internal Revenue Code. The characteristics of income and gains to be distributed are determined in accordance with income tax regulations, which may differ from U.S. generally accepted accounting principles for investment companies.
F. Federal Income Taxes. It is the policy of the Portfolios to comply with subchapter M of the Internal Revenue Code and related excise tax provisions applicable to requlated investment companies and to distribute substantially all of their net investment income and any net realized capital gains to their shareholders. Therefore, no federal income tax provision is required. No capital gain distributions shall be made until any capital loss carryforwards have been fully utilized or expired.
G. Use of Estimates. The preparation of financial statements in conformity with U.S. generally accepted accounting principles requires management to make estimates and assumptions that affect the reported amounts of assets and liabilities and disclosure of contingent assets and liabilities at the date of the financial statements and the reported amounts of increases and decreases in net assets from operations during the reporting period. Actual results could differ from those estimates.
H. Repurchase Agreements. Each Portfolio may invest in repurchase agreements only with government securities dealers recognized by the Board of Governors of the Federal Reserve System. Under such agreements, the seller of the security agrees to repurchase it at a mutually agreed upon time and price. The resale price is in excess of the purchase price and reflects an agreed upon interest rate for the period of time the agreement is outstanding. The period of the repurchase agreements is usually short, from overnight to one week, while the underlying securities generally have longer maturities. Each Portfolio will receive as collateral securities acceptable to it whose market value is equal to at least 100% of the carrying amount of the repurchase agreements, plus accrued interest, be ing invested by the Portfolio. The underlying collateral is valued daily on a mark-to-market basis to assure that the value, including accrued interest is at least equal to the repurchase price. There would be potential loss to the Portfolio in the event the Portfolio is delayed or prevented from exercising its right to dispose of the collateral, and it might incur disposition costs in liquidating the collateral.
I. Securities Lending. Each Portfolio has the option to temporarily loan up to 30% of its total assets to brokers, dealers or other financial institutions in exchange for a negotiated lender's fee. The borrower is required to fully collateralize the loans with cash or U.S. government securities. Generally, in the event of counterparty default, a Portfolio has the right to use collateral to offset losses incurred. There would be potential loss to the Portfolio in the event the Portfolio is delayed or prevented from exercising its right to dispose of the collateral. A Portfolio bears the risk of loss with respect to the investment of collateral. Engaging in securities lending could have a leveraging effect, which may intensify the credit, market and other risks associated with investi ng in a Portfolio.
J. Illiquid and Restricted Securities. The Portfolios may not invest more than 15% (10% for Money Market)
36
NOTES TO FINANCIAL STATEMENTS AS OF JUNE 30, 2007 (UNAUDITED) (CONTINUED)
NOTE 2 — SIGNIFICANT ACCOUNTING POLICIES (continued)
of their net assets in illiquid securities. Illiquid securities are not readily marketable. Disposing of illiquid investments may involve time-consuming negotiation and legal expenses, and it may be difficult or impossible for the Portfolios to sell them promptly at an acceptable price. The Portfolios may also invest in restricted securities, which include those sold under Rule 144A of the Securities Act of 1933 ("1933 Act") or securities offered pursuant to Section 4(2) of the 1933 Act, and/or are subject to legal or contractual restrictions on resale and may not be publicly sold without registration under the 1933 Act. Certain restricted securities may be considered liquid pursuant to guidelines approved by the Board or may be deemed to be illiquid because they may not be readily marketable. Illiquid and restricted securities are valued using market quotations when readily available. In the absence of market quotations, the securities are valued based upon their fair value determined under procedures approved by the Board.
K. Delayed Delivery Transactions. Each Portfolio may purchase or sell securities on a when-issued or forward commitment basis. The price of the underlying securities and date when the securities will be delivered and paid for are fixed at the time the transaction is negotiated. The market value of such is identified in the Portfolios' Portfolio of Investments. Losses may arise due to changes in the market value of the securities or from the inability of counterparties to meet the terms of the contract. In connection with such purchases, the Portfolios are required to hold liquid assets as collateral with the Portfolios' custodian sufficient to cover the purchase price.
L. Mortgage Dollar Roll Transactions. Balanced, Growth and Income, Value Opportunity, Global Science and Technology, International Equity and Money Market Portfolios may engage in dollar roll transactions with respect to mortgage-backed securities issued by Government National Mortgage Association, Federal National Mortgage Association and Federal Home Loan Mortgage Corp. In a dollar roll transaction, a Portfolio sells a mortgage-backed security to a financial institution, such as a bank or broker/dealer, and simultaneously agrees to repurchase a substantially similar (i.e., same type, coupon, and maturity) security from the institution on a delayed delivery basis at an agreed upon price. The mortgage-backed securities that are repurchased will bear the same interest rate as those sold, but generally will be collateralized by different pools of mortgages with different prepayment histories. The Portfolios account for dollar roll transactions as purchases and sales.
M. Options Contracts. Each Portfolio, with the exception of Money Market, may purchase put and call options and may write (sell) put options and covered call options. The Portfolios may engage in option transactions as a hedge against adverse movements in the value of portfolio holdings or to increase market exposure. Option contracts are valued daily and unrealized gains or losses are recorded based upon the last sales price on the principal exchange on which the options are traded. The Portfolios will realize a gain or loss upon the expiration or closing of the option contract. When an option is exercised, the proceeds on sales of the underlying security for a written call option, the purchase cost of the security for a written put option, or the cost of the security for a purchas ed put or call option is adjusted by the amount of premium received or paid. Realized and unrealized gains or losses on option contracts are reflected in the accompanying financial statements. The risk in writing a call option is that the Portfolios give up the opportunity for profit if the market price of the security increases and the option is exercised. The risk in writing a put option is that the Portfolios may incur a loss if the market price of the security decreases and the option is exercised. The risk in buying an option is that the Portfolios pay a premium whether or not the option is exercised. Risks may also arise from an illiquid secondary market or from the inability of counterparties to meet the terms of the contract.
N. Swap Contracts. Each Portfolio, with the exception of Money Market, may enter into interest rate swaps, currency swaps and other types of swap agreements, including swaps on securities and indices. A swap is an agreement between two parties pursuant to which each party agrees to make one or more payments to the other on regularly scheduled dates over a stated term, based on different interest rates, currency exchange rates, security prices, the prices or rates of other types of financial instruments or assets or the levels of specified indices. During the term of the swap, changes in the value of the swap are recognized as unrealized appreciation or depreciation.
O. Reverse Repurchase Agreements. A reverse repurchase agreement involves the sale of a
37
NOTES TO FINANCIAL STATEMENTS AS OF JUNE 30, 2007 (UNAUDITED) (CONTINUED)
NOTE 2 — SIGNIFICANT ACCOUNTING POLICIES (continued)
security, with an agreement to repurchase the same or substantially similar securities at an agreed upon price and date. Whether such a transaction produces a gain for a Portfolio depends upon the costs of the agreements and the income and gains of the securities purchased with the proceeds received from the sale of the security. If the income and gains on the securities purchased fail to exceed the costs, net asset value will decline faster than otherwise would be the case. Reverse repurchase agreements, as a leveraging technique, may increase a Portfolio's yield; however, such transactions also increase a Portfolio's risk to capital and may result in a shareholder's loss of principal.
P. Indemnifications. In the normal course of business, the Registrants may enter into contracts that provide certain indemnifications. The Registrants' maximum exposure under these arrangements is dependent on future claims that may be made against the Portfolios and, therefore, cannot be estimated; however, based on experience, the risk of loss from such claims is considered remote.
NOTE 3 — INVESTMENT TRANSACTIONS
For the six months ended June 30, 2007, the cost of purchases and the proceeds from the sales of securities, excluding short-term securities, were as follows:
| | | Purchases | | Sales | |
| Balanced | | $ | 638,559,045 | | | $ | 794,091,162 | | |
| Growth and Income | | | 2,261,025,642 | | | | 2,465,896,954 | | |
| Growth | | | 238,652,781 | | | | 238,463,701 | | |
| Small Company | | | 266,234,432 | | | | 249,198,905 | | |
| Value Opportunity | | | 105,739,389 | | | | 125,260,977 | | |
| Intermediate Bond | | | 972,296,802 | | | | 855,918,016 | | |
| Global Science and Technology | | | 33,804,457 | | | | 41,800,302 | | |
| International Equity | | | 29,991,163 | | | | 30,402,005 | | |
U.S. Government securities not included above were as follows:
| | | Purchases | | Sales | |
| Balanced | | $ | 608,876,873 | | | $ | 546,107,994 | | |
| Intermediate Bond | | | 5,020,843,514 | | | | 4,893,455,227 | | |
NOTE 4 — INVESTMENT MANAGEMENT AND ADMINISTRATIVE FEES
The Portfolios entered into investment management agreements ("Investment Management Agreements") with the Investment Adviser. The Investment Management Agreements compensate the Investment Adviser with a fee, computed daily and payable monthly, based on the average daily net assets of each Portfolio, at the following annual rates:
| Balanced | | | 0.500 | % | |
| Growth and Income | | | 0.500% on first $10 billion;
0.450% on next $5 billion; and
0.425% over $15 billion | | |
| Growth | | | 0.600 | % | |
| Small Company | | | 0.750 | % | |
| Value Opportunity | | | 0.600 | % | |
| Intermediate Bond | | | 0.400 | % | |
| Money Market | | | 0.250 | % | |
| Global Science and Technology | | | 0.950 | % | |
| International Equity | | | 0.850 | % | |
The Investment Adviser entered into a sub-advisory agreements with ING IM. ING IM acts as sub-adviser to all Portfolios except for Global Science and Technology. Subject to such policies as the Board or the Investment Adviser may determine, ING IM manages the Portfolios' assets in accordance with the Portfolios' investment objectives, policies, and limitations.
BlackRock Advisors, LLC, ("BlackRock"), serves as Sub-Adviser to Global Science and Technology pursuant to a Sub-Advisory Agreement effective April 1, 2004 between the Investment Adviser and BlackRock.
Effective November 1, 2006, certain ING Portfolios sub-advised by ING IM are permitted to invest end-of-day cash balances into ING Institutional Prime Money Market Fund. Investment management fees paid by the Portfolios will be reduced by an amount equal to management fees paid indirectly to the ING Institutional Prime Money Market Fund with respect to assets invested by the Portfolios. As of June 30, 2007, Balanced, Growth and Income, Growth, Small Company, Value Opportunity, Intermediate Bond and International Equity waived $18,856, $29,562, $422, $6,810, $401, $50,122 and $187, respectively. These fees are not subject to recoupment.
Pursuant to administration agreements, ING Funds Services, LLC ("IFS"), an indirect, wholly-owned subsidiary of ING Groep, acts as administrator and provides certain administrative and shareholder services necessary for Portfolio operations and is responsible for the supervision of other service providers.
IFS is entitled to receive from each Portfolio a fee at an annual rate of 0.055% on the first $5 billion of daily net assets and 0.03% thereafter.
38
NOTES TO FINANCIAL STATEMENTS AS OF JUNE 30, 2007 (UNAUDITED) (CONTINUED)
NOTE 5 — DISTRIBUTION AND SERVICE FEES
Each ADV Class shares of the respective Portfolios are subject to a Shareholder Service and Distribution Plan (the "Plan"). Under the Plan, the Distributor is paid an annual shareholder service fee at the rate of 0.25% and an annual distribution fee at the rate of 0.25% of the average daily net assets attributable to its ADV Class shares.
Class S shares of the Portfolios have adopted Distribution Plans pursuant to Rule 12b-1 under the 1940 Act (the "12b-1 Plans"), whereby the Distributor is compensated by the Portfolios for expenses incurred in the distribution of each Portfolio's shares ("Distribution Fees"). Pursuant to the 12b-1 Plans, the Distributor is entitled to a payment each month to compensate for expenses incurred in the distribution and promotion of each Portfolio's shares, including expenses incurred in printing prospectuses and reports used for sales purposes, expenses incurred in preparing and printing sales literature and other such distribution related expenses, including any distribution or shareholder servicing fees ("Service Fees") paid to securities dealers who have executed a distribution agreement with the Distributor. Under the 12b-1 Plans, Class S shares of the Portfolios pay the Distributor a fee calculated at an annual rate of 0.25% of average daily net assets.
NOTE 6 — OTHER TRANSACTIONS WITH AFFILIATED AND RELATED PARTIES
At June 30, 2007, the Portfolios had the following amounts recorded in payable to affiliates on the accompanying Statements of Assets and Liabilities (see Notes 4 and 5):
| | | Accrued
Investment
Management
Fees | | Accrued
Administrative
Fees | | Accrued
Sharholder
Service and
Distribution
Fees | | Total | |
| Balanced | | $ | 470,184 | | | $ | 52,012 | | | $ | 2,162 | | | $ | 524,358 | | |
| Growth and Income | | | 1,259,390 | | | | 138,925 | | | | 1,109 | | | | 1,399,424 | | |
| Growth | | | 101,741 | | | | 9,338 | | | | 6,051 | | | | 117,130 | | |
| Small Company | | | 365,042 | | | | 26,882 | | | | 505 | | | | 392,429 | | |
| Value Opportunity | | | 98,496 | | | | 9,041 | | | | 5,843 | | | | 113,380 | | |
| Intermediate Bond | | | 926,244 | | | | 128,874 | | | | 173,416 | | | | 1,228,534 | | |
| Money Market | | | 313,936 | | | | 69,064 | | | | — | | | | 383,000 | | |
Global Science and
Technology | | | 63,849 | | | | 3,696 | | | | 120 | | | | 67,665 | | |
| International Equity | | | 58,899 | | | | 3,811 | | | | 259 | | | | 62,969 | | |
The Registrants have adopted a Deferred Compensation Plan (the "Policy"), which allows eligible non-affiliated directors as described in the Policy to defer the receipt of all or a portion of the directors' fees payable. Deferred fees are invested in various funds advised by ING Investments until distribution in accordance with the Policy.
At June 30, 2007, the following indirect, wholly owned subsidiaries of ING Groep owned more than 5% of the following Portfolios:
ING Life Insurance and Annuity Company — Balanced (92.01%); Growth and Income (95.76%); Growth (67.05%); Small Company (66.36%); Value Opportunity (82.78%); Intermediate Bond (37.76%); Money Market (98.14%); Global Science and Technology (97.07%); International Equity (98.33%).
ING USA Annuity and Life Insurance Company — Value Opportunity (13.71%); Intermediate Bond (29.61%).
ING LifeStyle Aggressive Growth Portfolio — Small Company (9.09%).
ING LifeStyle Growth Portfolio — Small Company (15.85%); Intermediate Bond (17.33%).
ING LifeStyle Moderate Growth Portfolio — Intermediate Bond (9.19%).
ING LifeStyle Moderate Portfolio — Intermediate Bond (4.71%).
ING National Trust — Growth (20.98%).
NOTE 7 — EXPENSE LIMITATIONS
ING Investments entered into written expense limitation agreements ("Expense Limitation Agreements") with each of the following Portfolios whereby the Investment Adviser has agreed to limit expenses, excluding interest, taxes, brokerage and extraordinary expenses to the levels listed below:
| | | Class ADV | | Class I | | Class S | |
| Growth | | | 1.30 | % | | | 0.80 | % | | | 1.05 | % | |
| Small Company | | | N/A | | | | 0.95 | % | | | 1.20 | % | |
| Value Opportunity | | | 1.30 | % | | | 0.80 | % | | | 1.05 | % | |
| Global Science and Technology | | | N/A | | | | 1.15 | % | | | 1.40 | % | |
| International Equity | | | 1.65 | % | | | 1.15 | % | | | 1.40 | % | |
The Investment Adviser may at a later date recoup from a Portfolio management fees waived and other expenses assured by the Investment Adviser during the previous 36 months, but only if, after such recoupment, the Portfolio's expense ratio does not exceed the percentage described above. Waived and reimbursed fees net of any recoupment by the Investment Adviser of such waived and reimbursed fees are reflected on the accompanying Statements of Operations. Amounts payable by the Investment Manager are reflected on the accompanying Statements of Assets and Liabilities for each Portfolio.
39
NOTES TO FINANCIAL STATEMENTS AS OF JUNE 30, 2007 (UNAUDITED) (CONTINUED)
NOTE 7 — EXPENSE LIMITATIONS (continued)
As of June 30, 2007, the Portfolios have no reimbursed fees that are subject to possible recoupment by the Investment Adviser.
The Expense Limitation Agreements are contractual and shall renew automatically for one-year terms unless ING Investments provides written notice of the termination of an Expense Limitation Agreement within 90 days of the end of the then current term.
NOTE 8 — BORROWINGS
The Portfolios, in addition to certain other funds managed by the Investment Adviser, have entered into an unsecured committed revolving line of credit agreement (the "Credit Agreement ") with a syndicate of banks led by Citibank, N.A. for an aggregate amount of $100,000,000. The proceeds may be used only to: (1) temporarily finance the purchase and sale of securities; (2) finance the redemption of shares of an investor in the portfolios; and (3) enable the portfolios to meet other emergency expenses as defined in the Credit Agreement. The portfolios to which the line of credit is available pay a commitment fee equal to 0.09% per annum on the daily unused portion of the committed line amount. Each of the Portfolios will pay its pro rata share of both the agent and commitment fee. Generally, borrowings under the Credit Agreement accrue interest at the federal funds rate plus a specified margin. Repayments generally must be made within 30 days after the date of a revolving credit advance. The following Portfolios utilized the line of credit during the six months ended June 30, 2007:
| | | Days
Utilized | | Approximate
Average Daily
Balance | | Approximate
Weighted
Average
Interest Rate | |
| Growth and Income | | | 1 | | | $ | 19,860,000 | | | | 5.74 | % | |
| Growth | | | 5 | | | | 702,000 | | | | 5.74 | | |
| Small Company | | | 1 | | | | 3,840,000 | | | | 5.67 | | |
| Intermediate Bond | | | 1 | | | | 4,230,000 | | | | 5.74 | | |
Global Science and
Technology | | | 4 | | | | 890,000 | | | | 5.74 | | |
| International Equity | | | 1 | | | | 1,000,000 | | | | 5.75 | | |
During the six months ended June 30, 2007, Balanced did not enter into any reverse repurchase agreements.
NOTE 9 — OPTIONS WRITTEN
Transactions in written options for Growth & Income for the six months ended June 30, 2007 were as follows:
| | | Number of
Contracts | | Premium | |
| Balance at 12/31/06 | | | 150,000 | | | $ | 178,500 | | |
| Options Written | | | 614,000 | | | | 1,693,987 | | |
Options Terminated in
Closing Purchase
Transactions | | | (190,000 | ) | | | (555,107 | ) | |
| Options Expirations | | | (150,000 | ) | | | (178,500 | ) | |
| Balance at 06/30/07 | | | 424,000 | | | $ | 1,138,880 | | |
NOTE 10 — CAPITAL SHARES
Transactions in capital shares and dollars were as follows:
| | | Class ADV | | Class I | | Class S | |
| | | Six Months
Ended
June 30,
2007 | | December 29,
2006(1) to
December 31,
2006 | | Six Months
Ended
June 30,
2007 | | Year
Ended
December 31,
2006 | | Six Months
Ended
June 30,
2007 | | Year
Ended
December 31,
2006 | |
| Balanced (Number of Shares) | |
| Shares sold | | | 2 | | | | 68 | | | | 141,531 | | | | 4,878,404 | | | | 44,498 | | | | 102,380 | | |
| Shares issued in merger | | | — | | | | — | | | | — | | | | 974,709 | | | | — | | | | 599,724 | | |
| Dividends reinvested | | | — | | | | — | | | | 5,397,784 | | | | 2,095,112 | | | | 48,696 | | | | 5,132 | | |
| Shares redeemed | | | — | | | | — | | | | (7,918,227 | ) | | | (17,759,754 | ) | | | (92,785 | ) | | | (207,251 | ) | |
| Net increase (decrease) in shares outstanding | | | 2 | | | | 68 | | | | (2,378,912 | ) | | | (9,811,529 | ) | | | 409 | | | | 499,985 | | |
| Balanced ($) | |
| Shares sold | | $ | 28 | | | $ | 1,000 | | | $ | 2,063,664 | | | $ | 67,433,818 | | | $ | 643,657 | | | $ | 1,409,005 | | |
| Proceeds issued in merger | | | — | | | | — | | | | — | | | | 13,476,644 | | | | — | | | | 8,269,170 | | |
| Dividends reinvested | | | — | | | | — | | | | 74,921,236 | | | | 28,870,646 | | | | 672,985 | | | | 70,509 | | |
| Shares redeemed | | | — | | | | — | | | | (115,150,362 | ) | | | (248,353,965 | ) | | | (1,337,874 | ) | | | (2,858,884 | ) | |
| Net increase (decrease) | | $ | 28 | | | $ | 1,000 | | | $ | (38,165,462 | ) | | $ | (138,572,857 | ) | | $ | (21,232 | ) | | $ | 6,889,800 | | |
(1) Commencement of Operations
40
NOTES TO FINANCIAL STATEMENTS AS OF JUNE 30, 2007 (UNAUDITED) (CONTINUED)
NOTE 10 — CAPITAL SHARES (continued)
| | | Class ADV | | Class I | | Class S | |
| | | Six Months
Ended
June 30,
2007 | | December 20,
2006(1) to
December 31,
2006 | | Six Months
Ended
June 30,
2007 | | Year
Ended
December 31,
2006 | | Six Months
Ended
June 30,
2007 | | Year
Ended
December 31,
2006 | |
| Growth and Income (Number of Shares) | |
| Shares sold | | | 1 | | | | 43 | | | | 127,308 | | | | 1,044,630 | | | | 38,392 | | | | 112,415 | | |
| Dividends reinvested | | | — | | | | — | | | | — | | | | 1,528,513 | | | | — | | | | 1,970 | | |
| Shares redeemed | | | — | | | | — | | | | (12,099,251 | ) | | | (21,948,383 | ) | | | (16,460 | ) | | | (27,677 | ) | |
| Net increase (decrease) in shares outstanding | | | 1 | | | | 43 | | | | (11,971,943 | ) | | | (19,375,240 | ) | | | 21,932 | | | | 86,708 | | |
| Growth and Income ($) | |
| Shares sold | | $ | 10 | | | $ | 1,000 | | | $ | 3,041,424 | | | $ | 24,293,092 | | | $ | 933,916 | | | $ | 2,450,803 | | |
| Dividends reinvested | | | — | | | | — | | | | — | | | | 35,950,900 | | | | — | | | | 46,207 | | |
| Shares redeemed | | | — | | | | — | | | | (291,490,405 | ) | | | (481,867,035 | ) | | | (388,104 | ) | | | (602,247 | ) | |
| Net increase (decrease) | | $ | 10 | | | $ | 1,000 | | | $ | (288,448,981 | ) | | $ | (421,623,043 | ) | | $ | 545,812 | | | $ | 1,894,763 | | |
| | | Class ADV | | Class I | | Class S | |
| | | Six Months
Ended
June 30,
2007 | | December 29,
2006(1) to
December 31,
2006 | | Six Months
Ended
June 30,
2007 | | Year
Ended
December 31,
2006 | | Six Months
Ended
June 30,
2007 | | Year
Ended
December 31,
2006 | |
| Growth (Number of Shares) | |
| Shares sold | | | 34,935 | | | | 94 | | | | 543,469 | | | | 4,813,793 | | | | 83,775 | | | | 5,711 | | |
| Shares issued in merger | | | 260,859 | | | | — | | | | 294,101 | | | | — | | | | 2,834,516 | | | | — | | |
| Dividends reinvested | | | 493 | | | | — | | | | 29,544 | | | | 10,584 | | | | 3,866 | | | | — | | |
| Shares redeemed | | | (28,115 | ) | | | — | | | | (2,788,179 | ) | | | (4,206,698 | ) | | | (920,494 | ) | | | (7,478 | ) | |
| Net increase (decrease) in shares outstanding | | | 268,172 | | | | 94 | | | | (1,921,065 | ) | | | 617,679 | | | | 2,001,663 | | | | (1,767 | ) | |
| Growth ($) | |
| Shares sold | | $ | 379,204 | | | $ | 1,000 | | | $ | 5,942,624 | | | $ | 51,157,509 | | | $ | 915,256 | | | $ | 59,075 | | |
| Proceeds issued in merger | | | 2,856,192 | | | | — | | | | 3,220,605 | | | | — | | | | 30,774,830 | | | | — | | |
| Dividends reinvested | | | 5,295 | | | | — | | | | 317,595 | | | | 113,349 | | | | 41,178 | | | | — | | |
| Shares redeemed | | | (313,034 | ) | | | — | | | | (30,546,037 | ) | | | (43,763,130 | ) | | | (9,962,042 | ) | | | (77,824 | ) | |
| Net increase (decrease) | | $ | 2,927,657 | | | $ | 1,000 | | | $ | (21,065,213 | ) | | $ | 7,507,728 | | | $ | 21,769,222 | | | $ | (18,749 | ) | |
| | | Class I | | Class S | |
| | | Six Months
Ended
June 30,
2007 | | Year
Ended
December 31,
2006 | | Six Months
Ended
June 30,
2007 | | Year
Ended
December 31,
2006 | |
| Small Company (Number of Shares) | |
| Shares sold | | | 3,656,271 | | | | 6,746,441 | | | | 18,672 | | | | 822,424 | | |
| Dividends reinvested | | | 4,011,153 | | | | 2,874,293 | | | | 17,941 | | | | 587,427 | | |
| Shares redeemed | | | (2,531,499 | ) | | | (4,186,153 | ) | | | (14,971 | ) | | | (4,494,836 | ) | |
| Net increase (decrease) in shares outstanding | | | 5,135,925 | | | | 5,434,581 | | | | 21,642 | | | | (3,084,985 | ) | |
| Small Company ($) | |
| Shares sold | | $ | 74,466,906 | | | $ | 143,089,598 | | | $ | 396,556 | | | $ | 18,611,859 | | |
| Dividends reinvested | | | 77,335,035 | | | | 60,192,208 | | | | 343,383 | | | | 12,277,239 | | |
| Shares redeemed | | | (53,585,089 | ) | | | (90,027,948 | ) | | | (309,292 | ) | | | (96,289,442 | ) | |
| Net increase (decrease) | | $ | 98,216,852 | | | $ | 113,253,858 | | | $ | 430,647 | | | $ | (65,400,344 | ) | |
(1) Commencement of Operations
41
NOTES TO FINANCIAL STATEMENTS AS OF JUNE 30, 2007 (UNAUDITED) (CONTINUED)
NOTE 10 — CAPITAL SHARES (continued)
| | | Class ADV | | Class I | | Class S | |
| | | Six Months
Ended
June 30,
2007 | | December 29,
2006(1) to
December 31,
2006 | | Six Months
Ended
June 30,
2007 | | Year
Ended
December 31,
2006 | | Six Months
Ended
June 30,
2007 | | Year
Ended
December 31,
2006 | |
| Value Opportunity (Number of Shares) | |
| Shares sold | | | 1 | | | | 64 | | | | 48,700 | | | | 163,605 | | | | 14,325 | | | | 10,706 | | |
| Dividends reinvested | | | — | | | | — | | | | 171,661 | | | | 176,547 | | | | 24,430 | | | | 29,063 | | |
| Shares redeemed | | | — | | | | — | | | | (1,099,776 | ) | | | (2,338,568 | ) | | | (170,595 | ) | | | (421,907 | ) | |
| Net increase (decrease) in shares outstanding | | | 1 | | | | 64 | | | | (879,415 | ) | | | (1,998,416 | ) | | | (131,840 | ) | | | (382,138 | ) | |
| Value Opportunity ($) | |
| Shares sold | | $ | 10 | | | $ | 1,000 | | | $ | 780,109 | | | $ | 2,340,296 | | | $ | 232,358 | | | $ | 152,377 | | |
| Dividends reinvested | | | — | | | | — | | | | 2,729,402 | | | | 2,514,028 | | | | 385,996 | | | | 411,247 | | |
| Shares redeemed | | | — | | | | — | | | | (17,872,459 | ) | | | (34,295,707 | ) | | | (2,760,439 | ) | | | (6,091,700 | ) | |
| Net increase (decrease) | | $ | 10 | | | $ | 1,000 | | | $ | (14,362,948 | ) | | $ | (29,441,383 | ) | | $ | (2,142,085 | ) | | $ | (5,528,076 | ) | |
| | | Class ADV | | Class I | | Class S | |
| | | Six Months
Ended
June 30,
2007 | | December 20,
2006(1) to
December 31,
2006 | | Six Months
Ended
June 30,
2007 | | Year
Ended
December 31,
2006 | | Six Months
Ended
June 30,
2007 | | Year
Ended
December 31,
2006 | |
| Intermediate Bond (Number of Shares) | |
| Shares sold | | | 1 | | | | 75 | | | | 25,353,716 | | | | 68,647,762 | | | | 19,909,494 | | | | 31,962,510 | | |
| Shares issued in merger | | | — | | | | — | | | | — | | | | 222,036 | | | | — | | | | — | | |
| Dividends reinvested | | | — | | | | — | | | | — | | | | 5,842,808 | | | | — | | | | 1,815,268 | | |
| Shares redeemed | | | — | | | | — | | | | (18,977,738 | ) | | | (15,931,235 | ) | | | (2,783,748 | ) | | | (33,432,290 | ) | |
| Net increase in shares outstanding | | | 1 | | | | 75 | | | | 6,375,978 | | | | 58,781,371 | | | | 17,125,746 | | | | 345,488 | | |
| Intermediate Bond ($) | |
| Shares sold | | $ | 10 | | | $ | 1,000 | | | $ | 332,396,693 | | | $ | 896,296,588 | | | $ | 259,760,646 | | | $ | 416,941,141 | | |
| Proceeds issued in merger | | | — | | | | — | | | | — | | | | 2,862,609 | | | | — | | | | — | | |
| Dividends reinvested | | | — | | | | — | | | | — | | | | 75,836,918 | | | | — | | | | 23,433,812 | | |
| Shares redeemed | | | — | | | | — | | | | (249,698,344 | ) | | | (209,279,344 | ) | | | (36,257,848 | ) | | | (429,117,715 | ) | |
| Net increase | | $ | 10 | | | $ | 1,000 | | | $ | 82,698,349 | | | $ | 765,716,771 | | | $ | 223,502,798 | | | $ | 11,257,238 | | |
| | | Class I | |
| | | Six Months
Ended
June 30,
2007 | | Year
Ended
December 31,
2006 | |
| Money Market (Number of Shares) | |
| Shares sold | | | 18,956,584 | | | | 32,751,915 | | |
| Dividends reinvested | | | 4,428,411 | | | | 2,488,618 | | |
| Shares redeemed | | | (6,546,307 | ) | | | (15,506,729 | ) | |
| Net increase in shares outstanding | | | 16,838,688 | | | | 19,733,804 | | |
| Money Market ($) | |
| Shares sold | | $ | 248,605,603 | | | $ | 428,969,203 | | |
| Dividends reinvested | | | 57,130,928 | | | | 31,895,864 | | |
| Shares redeemed | | | (85,774,958 | ) | | | (203,348,846 | ) | |
| Net increase | | $ | 219,961,573 | | | $ | 257,516,221 | | |
| | | Class I | | Class S | |
| | | Six Months
Ended
June 30,
2007 | | Year
Ended
December 31,
2006 | | Six Months
Ended
June 30,
2007 | | Year
Ended
December 31,
2006 | |
| Global Science and Technology (Number of Shares) | |
| Shares sold | | | 393,709 | | | | 2,971,865 | | | | 4,814 | | | | 127,341 | | |
| Shares redeemed | | | (2,252,656 | ) | | | (4,955,941 | ) | | | (8,878 | ) | | | (25,008 | ) | |
| Net increase (decrease) in shares outstanding | | | (1,858,947 | ) | | | (1,984,076 | ) | | | (4,064 | ) | | | 102,333 | | |
| Global Science and Technology ($) | |
| Shares sold | | $ | 1,863,071 | | | $ | 13,210,390 | | | $ | 22,931 | | | $ | 570,468 | | |
| Shares redeemed | | | (10,767,812 | ) | | | (21,885,263 | ) | | | (41,580 | ) | | | (107,972 | ) | |
| Net increase (decrease) | | $ | (8,904,741 | ) | | $ | (8,674,873 | ) | | $ | (18,649 | ) | | $ | 462,496 | | |
(1) Commencement of Operations
42
NOTES TO FINANCIAL STATEMENTS AS OF JUNE 30, 2007 (UNAUDITED) (CONTINUED)
NOTE 10 — CAPITAL SHARES (continued)
| | | Class ADV | | Class I | | Class S | |
| | | Six Months
Ended
June 30,
2007 | | December 29,
2006(1) to
December 31,
2006 | | Six Months
Ended
June 30,
2007 | | Year
Ended
December 31,
2006 | | Six Months
Ended
June 30,
2007 | | Year
Ended
December 31,
2006 | |
| International Equity (Number of Shares) | |
| Shares sold | | | 2 | | | | 82 | | | | 541,153 | | | | 1,515,345 | | | | 50,226 | | | | 54,667 | | |
| Dividends reinvested | | | — | | | | — | | | | 130,498 | | | | 100,359 | | | | 1,469 | | | | 652 | | |
| Shares redeemed | | | — | | | | — | | | | (700,895 | ) | | | (1,305,211 | ) | | | (16,623 | ) | | | (18,699 | ) | |
| Net increase (decrease) in shares outstanding | | | 2 | | | | 82 | | | | (29,244 | ) | | | 310,493 | | | | 35,072 | | | | 36,620 | | |
| International Equity ($) | |
| Shares sold | | $ | 20 | | | $ | 1,000 | | | $ | 6,754,672 | | | $ | 16,604,593 | | | $ | 625,290 | | | $ | 776,636 | | |
| Dividends reinvested | | | — | | | | — | | | | 1,612,956 | | | | 1,095,926 | | | | 18,053 | | | | 7,085 | | |
| Shares redeemed | | | — | | | | — | | | | (8,815,547 | ) | | | (14,409,328 | ) | | | (203,657 | ) | | | (199,489 | ) | |
| Net increase (decrease) | | $ | 20 | | | $ | 1,000 | | | $ | (447,909 | ) | | $ | 3,291,191 | | | $ | 439,686 | | | $ | 584,232 | | |
(1) Commencement of Operations
NOTE 11 — ILLIQUID SECURITIES
Pursuant to guidelines adopted by the Portfolios' Board, the following securities have been deemed to be illiquid. Each Portfolio may invest up to 15% (10% for Money Market) of its net assets, in illiquid securities. Fair value for these securities was determined by ING Funds Valuation Committee appointed by the Portfolios' Board.
| Portfolio | | Security | | Principal
Amount | | Initial
Acquision
Date | | Cost | | Value | | Percent
of Net
Assets | |
| Balanced | | Alpine lll, 5.910%, due 08/16/14 | | $ | 218,000 | | | 8/16/04 | | $ | 218,085 | | | $ | 218,637 | | | | 0.0 | % | |
| | | Alpine lll, 6.310%, due 08/16/14 | | | 218,000 | | | 8/16/04 | | | 218,085 | | | | 218,720 | | | | 0.0 | % | |
| | | Alpine lll, 5.110%, due 08/16/14 | | | 328,000 | | | 8/16/04 | | | 331,056 | | | | 330,137 | | | | 0.0 | % | |
| | | Alpine lll, 11.360%, due 08/16/14 | | | 560,000 | | | 8/16/04 | | | 560,945 | | | | 573,782 | | | | 0.1 | % | |
| | | FNMA, 5.460%, due 04/25/35 | | | 4,203 | | | 4/30/06 | | | 4,247 | | | | 4,253 | | | | 0.0 | % | |
| | | | | | | | | | | $ | 1,332,418 | | | $ | 1,345,529 | | | | 0.1 | % | |
| Small Company | | Dayton Superior Corp. | | $ | 236,700 | | | 12/29/06 | | $ | 2,780,534 | | | $ | 3,195,450 | | | | 0.5 | % | |
| | | | | | | | | | | $ | 2,780,534 | | | $ | 3,195,450 | | | | 0.5 | % | |
| Intermediate Bond | | Alpine lll, 5.910%, due 08/16/14 | | $ | 1,006,000 | | | 8/16/04 | | $ | 1,006,374 | | | $ | 1,008,939 | | | | 0.0 | % | |
| | | Alpine lll, 6.310%, due 08/16/14 | | | 1,006,000 | | | 8/16/04 | | | 1,006,374 | | | | 1,009,322 | | | | 0.0 | % | |
| | | Alpine lll, 8.110%, due 08/16/14 | | | 1,507,000 | | | 8/16/04 | | | 1,523,111 | | | | 1,516,818 | | | | 0.1 | % | |
| | | Alpine lll, 11.360%, due 08/16/14 | | | 2,576,000 | | | 8/16/04 | | | 2,607,048 | | | | 2,639,395 | | | | 0.1 | % | |
| | | FNMA, 5.46% due 04/25/35 | | | 841 | | | 4/30/06 | | | 851 | | | | 851 | | | | 0.0 | % | |
| | | | | | | | | | | $ | 6,143,758 | | | $ | 6,175,325 | | | | 0.2 | % | |
| Money Market | | Goldman Sachs Group Inc, 5.350%,
due 04/11/08 | | $ | 22,000,000 | | | 4/12/07 | | $ | 22,000,000 | | | $ | 22,000,000 | | | | 1.4 | % | |
| | | | | | | | | | | $ | 22,000,000 | | | $ | 22,000,000 | | | | 1.4 | % | |
NOTE 12 — SECURITIES LENDING
Under an agreement with The Bank of New York Mellon Corporation ("BNY"), the Portfolios can lend their securities to approved brokers, dealers and other financial institutions. Loans are collateralized by cash and U.S. Government securities. The collateral must be in an amount equal to at least 105% of the market value of non-U.S. securities loaned and 102% of the market value of U.S. securities loaned. The cash collateral received is invested in approved investments as defined in the Securities Lending Agreement with BNY (the "Agreement"). The securities purchased with cash collateral received are reflected in the Portfolio of Investments. Generally, in the event of counterparty default, the Portfolios have the right to use the collateral to offset losses incurred. The Agreement contains certain guarantees by BNY in the event of counterparty default and/or a borrower's failure to return a loaned security, however there would be a potential loss to the Portfolios in the event the Portfolios are delayed or prevented from exercising their right to dispose of the collateral. The Portfolios bear the risk of loss with respect to the investment of collateral. Engaging in securities lending could have a leveraging effect, which may intensify the credit, market and other risks associated with investing in a
43
NOTES TO FINANCIAL STATEMENTS AS OF JUNE 30, 2007 (UNAUDITED) (CONTINUED)
NOTE 12 — SECURITIES LENDING (continued)
Portfolio. At June 30, 2007, the Portfolios had securities on loan with the following market values:
| | | Value of
Securities
Loaned | | Value of
Collateral | |
| Balanced | | $ | 125,335,137 | | | $ | 128,255,000 | | |
| Growth and Income | | | 359,972,838 | | | | 371,430,000 | | |
| Growth | | | 26,041,888 | | | | 26,886,000 | | |
| Small Company | | | 128,080,747 | | | | 131,970,000 | | |
| Value Opportunity | | | 25,336,619 | | | | 26,136,000 | | |
| Intermediate Bond | | | 420,280,624 | | | | 426,736,000 | | |
| Money Market | | | 393,162 | | | | 402,000 | | |
| Global Science and Technology | | | 19,480,688 | | | | 20,063,000 | | |
| International Equity | | | 5,994,316 | | | | 6,233,000 | | |
NOTE 13 — CONCENTRATION OF INVESTMENT RISKS
Concentration (Global Science and Technology). The Portfolio concentrates (for purposes of the 1940 Act) its assets in securities related to a particular industry, which means that at least 25% of its assets will be invested in that particular industry at all times. As a result, the Portfolio may be subject to greater market fluctuation than a portfolio which has securities representing a broader range of investment alternatives.
Foreign Securities (All Portfolios). Investments in foreign securities may entail risks not present in domestic investments. Since securities in which the Portfolios may invest are denominated in foreign currencies, changes in the relationship of these foreign currencies to the U.S. dollar can significantly affect the value of the investments and earnings of the Portfolios. Foreign investments may also subject the Portfolios to foreign government exchange restrictions, expropriation, taxation or other political, social or economic developments, as well as changes vis-a-vis the U.S. dollar from movements in currency, and changes in security value and interest rate, all of which could affect the market and/or credit risk of the Portfolios investments.
Emerging Markets Investments (Intermediate Bond, Global Science and Technology and International Equity). Because of less developed markets and economies and, in some countries, less mature governments and governmental institutions, the risks of investing in foreign securities can be intensified in the case of investments in issuers domiciled or doing substantial business in emerging market countries.
NOTE 14 — FEDERAL INCOME TAXES AND OTHER TAX MATTERS
The amount of distributions from net investment income and net realized capital gains are determined in accordance with federal income tax regulations, which may differ from U.S. generally accepted accounting principles for investment companies. These book/tax differences may be either temporary or permanent. Permanent differences are reclassified within the capital accounts based on their federal tax-basis treatment; temporary differences are not reclassified. Key differences include the treatment of short-term capital gains, foreign currency transactions, and wash sale deferrals. Distributions in excess of net investment income and/or net realized capital gains for tax purposes are reported as distributions of paid-in capital.
Dividends paid by the Portfolios from net investment income and distributions of net realized short-term capital gains are, for federal income tax purposes, taxable as ordinary income to shareholders.
The tax composition of dividends and distributions to shareholders was as follows:
| | | Six Months Ended
June 30, 2007 | | Year Ended
December 31, 2006 | |
| | | Ordinary
Income | | Long-Term
Capital Gains | | Ordinary
Income | | Long-Term
Capital Gains | |
| Balanced | | $ | 42,494,750 | | | $ | 33,099,538 | | | $ | 28,941,155 | | | $ | — | | |
| Growth and Income | | | — | | | | — | | | | 36,025,178 | | | | — | | |
| Growth | | | 364,068 | | | | — | | | | 113,349 | | | | — | | |
| Small Company | | | 10,266,371 | | | | 67,412,047 | | | | 6,394,186 | | | | 66,075,261 | | |
| Value Opportunity | | | 3,115,416 | | | | — | | | | 2,925,275 | | | | — | | |
| Intermediate Bond | | | — | | | | — | | | | 99,297,017 | | | | — | | |
| Money Market | | | 57,130,928 | | | | — | | | | 31,895,864 | | | | — | | |
| International Equity | | | 1,631,030 | | | | — | | | | 1,103,011 | | | | — | | |
44
NOTES TO FINANCIAL STATEMENTS AS OF JUNE 30, 2007 (UNAUDITED) (CONTINUED)
NOTE 14 — FEDERAL INCOME TAXES AND OTHER TAX MATTERS (continued)
The tax-basis components of distributable earnings and the expiration dates of the capital loss carryforwards which may be used to offset future realized capital gains for federal income tax purposes as of December 31, 2006 were:
| | | Undistributed
Ordinary
Income | | Undistributed
Long Term
Capital Gains | | Unrealized
Appreciation/
Depreciation | | Post-October
Capital
Losses
Deferred | | Post-October
Currency
Losses
Deferred | | Capital
Loss
Carryforwards | | Expiration
Dates | |
| Balanced | | $ | 42,481,592 | | | $ | 33,095,937 | | | $ | 62,843,492 | | | $ | — | | | $ | — | | | $ | (1,148,170 | ) | | | 2008 | | |
| | | | | | | | | | | | | | | | | | | | | | | | (574,085 | ) | | | 2009 | | |
| | | | | | | | | | | | | | | | | | | | | | | $ | (1,722,255 | ) | | | | | |
| Growth and Income | | | 161,526 | | | | — | | | | 434,102,939 | | | | — | | | | — | | | | (2,062,659,206 | ) | | | 2010 | | |
| | | | | | | | | | | | | | | | | | | | | | | | (63,082,574 | ) | | | 2011 | | |
| | | | | | | | | | | | | | | | | | | | | | | $ | (2,125,741,780 | ) | | | | | |
| Growth | | | 362,892 | | | | — | | | | 13,625,486 | | | | — | | | | — | | | | (112,000,851 | ) | | | 2009 | | |
| | | | | | | | | | | | | | | | | | | | | | | | (63,207,672 | ) | | | 2010 | | |
| | | | | | | | | | | | | | | | | | | | | | | $ | (175,208,523 | ) | | | | | |
| Small Company | | | 10,259,128 | | | | 67,410,628 | | | | 61,870,735 | | | | — | | | | — | | | | — | | | | — | | |
| Value Opportunity | | | 3,112,822 | | | | — | | | | 28,930,128 | | | | — | | | | — | | | | (5,455,768 | ) | | | 2010 | | |
| Intermediate Bond | | | — | | | | — | | | | (6,180,870 | ) | | | (1,765,163 | ) | | | (23,346 | ) | | | (47,445 | ) | | | 2008 | | |
| | | | | | | | | | | | | | | | | | | | | | | | (14,250 | ) | | | 2009 | | |
| | | | | | | | | | | | | | | | | | | | | | | | (41,990 | ) | | | 2013 | | |
| | | | | | | | | | | | | | | | | | | | | | | | (20,305,969 | ) | | | 2014 | | |
| | | | | | | | | | | | | | | | | | | | | | | $ | (20,409,654 | ) | | | | | |
| Money Market | | | 57,121,313 | | | | — | | | | (119 | ) | | | — | | | | — | | | | (659,806 | ) | | | 2008 | | |
| | | | | | | | | | | | | | | | | | | | | | | | (3,715,968 | ) | | | 2009 | | |
| | | | | | | | | | | | | | | | | | | | | | | | (169 | ) | | | 2011 | | |
| | | | | | | | | | | | | | | | | | | | | | | | (244,520 | ) | | | 2012 | | |
| | | | | | | | | | | | | | | | | | | | | | | $ | (4,620,463 | ) | | | | | |
| Global Science and Technology | | | — | | | | — | | | | 9,656,972 | | | | — | | | | — | | | | (21,943,692 | ) | | | 2009 | | |
| | | | | | | | | | | | | | | | | | | | | | | | (15,534,432 | ) | | | 2010 | | |
| | | | | | | | | | | | | | | | | | | | | | | | (4,912,495 | ) | | | 2011 | | |
| | | | | | | | | | | | | | | | | | | | | | | $ | (42,390,619 | ) | | | | | |
| International Equity | | | 1,627,816 | | | | — | | | | 13,658,216 | | | | — | | | | — | | | | (1,513,230 | ) | | | 2009 | | |
| | | | | | | | | | | | | | | | | | | | | | | | (9,221,611 | ) | | | 2010 | | |
| | | | | | | | | | | | | | | | | | | | | | | $ | (10,734,841 | ) | | | | | |
Under U.S. federal income tax law, as specified in the Internal Revenue Code (the "Code") and U.S. Treasury regulations, the Portfolios must meet various technical requirements relating to fund administration, portfolio investments, and "eligible investors" in the Portfolios. Complying with these requirements is a condition for beneficial tax treatment of certain insurance products that offer the Portfolios as investment options. The failure of the Portfolios to meet any of these complex requirements could result in an excise tax, administrative penalties imposed by the Internal Revenue Service, potential liability to insurers whose products include the Portfolios as investment options, and unanticipated costs associated with remedying a failure. It was disclosed in the Portfolio's Annual Report for the year ended December 31, 2006, that an affiliate of a Portfolio's investment adviser may have failed to limit the availability of Intermediat e Bond for investment to "eligible investors" under the Code. Subsequent to the issuance of the Portfolio's Annual Report, Management determined that it was more likely than not that there had been no adverse tax or other financial consequences to the Portfolio.
NOTE 15 — REORGANIZATIONS
On January 3, 2007, VP Growth, as listed below ("Acquiring Portfolio"), acquired the assets and certain liabilities of ING Goldman Sachs Capital Growth Portfolio, also listed below ("Acquired Portfolio"), in a tax-free reorganization in exchange for shares of the Acquiring Portfolio, pursuant to a plan or reorganization approved
45
NOTES TO FINANCIAL STATEMENTS AS OF JUNE 30, 2007 (UNAUDITED) (CONTINUED)
NOTE 15 — REORGANIZATIONS (continued)
by the Acquired Portfolio's shareholders. The number and value of shares issued by the Acquiring Portfolio are presented in Note 10 — Capital Share Transactions. Net assets and unrealized appreciation as of the reorganization date were as follows:
Acquiring
Portfolio | | Acquired
Portfolio | | Total
Net Assets of
Acquired
Portfolio (000's) | | Total
Net Assets of
Acquiring
Portfolio (000's) | | Acquired
Capital Loss
Carryforward
(000's) | | Acquired Portfolio
Unrealized
Appreciation (000's) | | Conversion
Ratio | |
| VP Growth | | ING Goldman Sachs | | | | | | | | | | | | | | | | | | |
| | |
| | | Capital Growth | | | | | | | | | | | | | | | | | | |
| | |
| | | Portfolio | | | | | | | | | | | | | | | | | | |
| | |
| Class ADV | | Class ADV | | $ | 2,856 | | | $ | 1 | | | $ | 740 | | | $ | 1,689 | | | | 1.14 | | |
| Class I | | Class I | | | 3,221 | | | | 189,159 | | | | 834 | | | | 254 | | | | 1.15 | | |
| Class S | | Class S | | | 30,775 | | | | 281 | | | | 7,973 | | | | 3,322 | | | | 1.15 | | |
| | | | | $ | 36,852 | | | $ | 189,441 | | | $ | 9,547 | | | $ | 5,265 | | | | | | |
The net assets of VP Growth after the acquisition were approximately $226,292,711.
On April 29, 2006, Balanced and Intermediate Bond as listed below (each "Acquiring Portfolio" and collectively, "Acquiring Portfolios"), acquired the assets and certain liabilities of the ING VP Convertible Portfolio, The Asset Allocation Portfolio and The Bond Portfolio, also listed below (each "Acquired Portfolio"and collectively, "Acquired Portfolios"), in a tax-free reorganization in exchange for shares of the Acquiring Portfolios, pursuant to a plan or reorganization approved by the Acquired Portfolios' shareholders. The number and value of shares issued by the Acquiring Portfolios are presented in Note 10 — Capital Share Transactions. Net assets and unrealized appreciation/depreciation as of the reorganization date were as follows:
Acquiring
Portfolio | | Acquired
Portfolio | | Total
Net Assets of
Acquired
Portfolio (000's) | | Total
Net Assets of
Acquiring
Portfolio (000's) | | Acquired
Capital Loss
Carryforward
(000's) | | Acquired Portfolio
Unrealized
Appreciation (000's) | | Conversion
Ratio | |
| Balanced | | ING VP | | | | | | | | | | | | | | | | | | |
| | |
| | | Convertible Portfolio | | $ | 8,269 | | | $ | 1,224,744 | | | $ | — | | | $ | 231 | | | | 0.81 | | |
| Balanced | | The Asset | | | | | | | | | | | | | | | | | | |
| | |
| | | Allocation Portfolio | | | 13,477 | | | | 1,224,744 | | | | 3,540 | | | | 632 | | | | 0.72 | | |
| Intermediate Bond | | The Bond Portfolio | | | 2,863 | | | | 1,890,564 | | | | 104 | | | | (60 | ) | | | 0.74 | | |
The net assets of Balanced and Intermediate Bond after the acquisition were approximately $1,246,490,241 and $1,893,426,244, respectively.
NOTE 16 — OTHER ACCOUNTING PRONOUNCEMENTS
In June 2006, the Financial Accounting Standards Board ("FASB") issued FASB Interpretation No. 48 ("FIN 48"), "Accounting for Uncertainty in Income Taxes." This standard defines the threshold for recognizing the benefits of tax-return positions in the financial statements as "more-likely-than-not" to be sustained upon challenge by the taxing authority and requires measurement of a tax position meeting the more-likely-than-not criterion, based on the largest benefit that is more than 50 percent likely to be realized. FIN 48 is effective for fiscal years beginning after December 15, 2006, with early application permitted if no interim financial statements have been issued. However, acknowledging the unique issues that FIN 48 presents for investment companies that calculate NAVs, the U.S. Securities and Exchange Commission (the "SEC") has indicated that they would not objec t if a fund implements FIN 48 in its NAV calculation as late as its last NAV calculation in the first required financial statement reporting period for its fiscal year beginning after December 15, 2006. For calendar year-end funds, this would be no later than their June 29, 2007 NAV and the effects of FIN 48 would be reflected in the funds' semi-annual financial statements contained in their Form N-CSR filing. At adoption, companies must adjust their financial statements to reflect only those tax positions that are more likely-than-not to be sustained as of the adoption date. Management of the Portfolios has analyzed the tax positions of the Portfolios. To date, this analysis reflects no uncertain tax positions that have not met the more likely-than-not standard.
On September 15, 2006, the FASB issued Statement of Financial Accounting Standards No. 157 ("SFAS No. 157"), "Fair Value Measurements." The new accounting
46
NOTES TO FINANCIAL STATEMENTS AS OF JUNE 30, 2007 (UNAUDITED) (CONTINUED)
statement defines fair value, establishes a framework for measuring fair value in generally accepted accounting principles ("GAAP"), and expands disclosures about fair value measurements. SFAS No. 157 defines fair value as the price that would be received to sell an asset or paid to transfer a liability in an orderly transaction between market participants at the measurement date (an exit price). SFAS No. 157 also stipulates that, as a market-based measurement, fair value measurement should be determined based on the assumptions that market participants would use in pricing the asset or liability, and establishes a fair value hierarchy that distinguishes between (a) market participant assumptions developed based on market data obtained from sources independent of the reporting entity (observable inputs) and (b) the reporting entity's own assumptions about market participant assumptions developed based on the best information available in the circumstances (unobservable inputs). SFAS No. 157 is effective for financial statements issued for fiscal years beginning after November 15, 2007. As of June 30, 2007, management of the Portfolios is currently assessing the impact, if any, that will result from adopting SFAS No. 157.
NOTE 17 — INFORMATION REGARDING TRADING OF ING'S U.S. MUTUAL FUNDS
In 2004, ING Investments reported to the Boards of Directors/Trustees (the "Boards") of the ING Funds that, like many U.S. financial services companies, ING Investments and certain of its U.S. affiliates have received informal and formal requests for information since September 2003 from various governmental and self-regulatory agencies in connection with investigations related to mutual funds and variable insurance products. ING Investments has advised the Boards that it and its affiliates have cooperated fully with each request.
In addition to responding to regulatory and governmental requests, ING Investments reported that management of U.S. affiliates of ING Groep, including ING Investments (collectively, "ING"), on their own initiative, have conducted, through independent special counsel and a national accounting firm, an extensive internal review of trading in ING insurance, retirement, and mutual fund products. The goal of this review was to identify any instances of inappropriate trading in those products by third parties or by ING investment professionals and other ING personnel. ING's internal review related to mutual fund trading is now substantially completed. ING has reported that, of the millions of customer relationships that ING maintains, the internal review identified several isolated arrangements allowing third parties to engage in frequent trading of mutual funds within ING's v ariable insurance and mutual fund products, and identified other circumstances where frequent trading occurred, despite measures taken by ING intended to combat market timing. ING further reported that each of these arrangements has been terminated and fully disclosed to regulators. The results of the internal review were also reported to the independent members of the Boards.
ING Investments has advised the Boards that most of the identified arrangements were initiated prior to ING's acquisition of the businesses in question in the U.S. ING Investments further reported that the companies in question did not receive special benefits in return for any of these arrangements, which have all been terminated.
Based on the internal review, ING Investments has advised the Boards that the identified arrangements do not represent a systemic problem in any of the companies that were involved.
In September 2005, IFD, the distributor of certain ING Funds, settled an administrative proceeding with the NASD regarding three arrangements, dating from 1995, 1996 and 1998, under which the administrator to the then-Pilgrim Funds, which subsequently became part of the ING Funds, entered into formal and informal arrangements that permitted frequent trading. Under the terms of the Letter of Acceptance, Waiver and Consent ("AWC") with the NASD, under which IFD neither admitted nor denied the allegations or findings, IFD consented to the following sanctions: (i) a censure; (ii) a fine of $1.5 million; (iii) restitution of approximately $1.44 million to certain ING Funds for losses attributable to excessive trading described in the AWC; and (iv) agreement to make certification to NASD regarding the review and establishment of certain procedures.
In addition to the arrangements discussed above, in 2004 ING Investments reported to the Boards that, at that time, these instances include the following, in addition to the arrangements subject to the AWC discussed above:
• Aeltus Investment Management, Inc. (a predecessor entity to ING IM Co.) identified two investment professionals who engaged in extensive frequent trading in certain ING Funds.
47
NOTES TO FINANCIAL STATEMENTS AS OF JUNE 30, 2007 (UNAUDITED) (CONTINUED)
NOTE 17 — INFORMATION REGARDING TRADING OF ING'S U.S. MUTUAL FUNDS (continued)
One was subsequently terminated for cause and incurred substantial financial penalties in connection with this conduct and the second has been disciplined.
• ReliaStar Life Insurance Company ("ReliaStar") entered into agreements seven years ago permitting the owner of policies issued by the insurer to engage in frequent trading and to submit orders until 4pm Central Time. In 2001 ReliaStar also entered into a selling agreement with a broker-dealer that engaged in frequent trading. Employees of ING affiliates were terminated and/or disciplined in connection with these matters.
• In 1998, Golden American Life Insurance Company entered into arrangements permitting a broker-dealer to frequently trade up to certain specific limits in a fund available in an ING variable annuity product. No employee responsible for this arrangement remains at the company.
For additional information regarding these matters, you may consult the Form 8-K and Form 8-K/A for each of four life insurance companies, ING USA Annuity and Life Insurance Company, ING Life Insurance and Annuity Company, ING Insurance Company of America, and ReliaStar Life Insurance Company of New York, each filed with the SEC on October 29, 2004 and September 8, 2004. These Forms 8-K and Forms 8-K/A can be accessed through the SEC's web site at http://www.sec.gov. Despite the extensive internal review conducted through independent special counsel and a national accounting firm, there can be no assurance that the instances of inappropriate trading reported to the Board are the only instances of such trading respecting the ING Funds.
ING Investments reported to the Board that ING is committed to conducting its business with the highest standards of ethical conduct with zero tolerance for noncompliance. Accordingly, ING Investments advised the Board that ING management was disappointed that its voluntary internal review identified these situations. Viewed in the context of the breadth and magnitude of its U.S. business as a whole, ING management does not believe that ING's acquired companies had systemic ethical or compliance issues in these areas. Nonetheless, ING Investments reported that given ING's refusal to tolerate any lapses, it has taken the steps noted below, and will continue to seek opportunities to further strengthen the internal controls of its affiliates.
• ING has agreed with the ING Funds to indemnify and hold harmless the ING Funds from all damages resulting from wrongful conduct by ING or its employees or from ING's internal investigation, any investigations conducted by any governmental or self-regulatory agencies, litigation or other formal proceedings, including any proceedings by the Securities and Exchange Commission. ING Investments reported to the Board that ING management believes that the total amount of any indemnification obligations will not be material to ING or its U.S. business.
• ING updated its Code of Conduct for employees reinforcing its employees' obligation to conduct personal trading activity consistent with the law, disclosed limits, and other requirements.
• The ING Funds, upon a recommendation from ING, updated their respective Codes of Ethics applicable to investment professionals with ING entities and certain other fund personnel, requiring such personnel to pre-clear any purchases or sales of ING Funds that are not systematic in nature (i.e., dividend reinvestment), and imposing minimum holding periods for shares of ING Funds.
• ING instituted excessive trading policies for all customers in its variable insurance and retirement products and for shareholders of the ING Funds sold to the public through financial intermediaries. ING does not make exceptions to these policies.
• ING reorganized and expanded its U.S. Compliance Department, and created an Enterprise Compliance team to enhance controls and consistency in regulatory compliance.
Other Regulatory Matters
The New York Attorney General (the "NYAG") and other federal and state regulators are also conducting broad inquiries and investigations involving the insurance industry. These initiatives currently focus on, among other things, compensation and other sales incentives; potential conflicts of interest; potential anti-competitive activity; reinsurance; marketing practices (including suitability); specific product types (including group annuities and indexed annuities); fund selection for investment products and brokerage sales; and disclosure. It is likely that the scope of these industry investigations will further broaden before
48
NOTES TO FINANCIAL STATEMENTS AS OF JUNE 30, 2007 (UNAUDITED) (CONTINUED)
NOTE 17 — INFORMATION REGARDING TRADING OF ING'S U.S. MUTUAL FUNDS (continued)
they conclude. ING has received formal and informal requests in connection with such investigations, and is cooperating fully with each request. In connection with one such investigation, affiliates of ING Investments were named in a petition for relief and cease and desist order filed by the New Hampshire Bureau of Securities Regulation (the "NH Bureau") concerning their administration of the New Hampshire state employees deferred compensation plan.
On October 10, 2006, an affiliate of ING Investments entered into an assurance of discontinuance with the NYAG (the "NYAG Agreement") regarding the endorsement of its products by the New York State United Teachers Union Member Benefits Trust ("NYSUT") and the sale of their products to NYSUT members. Under the terms of the NYAG Agreement, the affiliate of ING Investments, without admitting or denying the NYAG's findings, will distribute $30 million to NYSUT members, and/or former NYSUT members, who participated in the NYSUT-endorsed products at any point between January 1, 2001 and June 30, 2006. The affiliate also agreed with the NYAG's office to develop a one-page disclosure that will further improve transparency and disclosure regarding retirement product fees (the "One-Page Disclosure"). Pursuant to the terms of the NYAG Agreement, the affiliate has agreed for a five year period to provide its retirement product customers with the One-Pag e Disclosure.
In addition, on the same date, these affiliates of ING Investments entered into a consent agreement with the NH Bureau (the "NH Agreement") to resolve this petition for relief and cease and desist order. Under the terms of the NH Agreement, these affiliates of ING Investments, without admitting or denying the NH Bureau's claims, have agreed to pay $3 million to resolve the matter, and for a five year period to provide their retirement product customers with the One-Page Disclosure described above.
Other federal and state regulators could initiate similar actions in this or other areas of ING's businesses.
These regulatory initiatives may result in new legislation and regulation that could significantly affect the financial services industry, including businesses in which ING is engaged.
In light of these and other developments, ING continuously reviews whether modifications to its business practices are appropriate.
At this time, in light of the current regulatory factors, ING U.S. is actively engaged in reviewing whether any modifications in our practices are appropriate for the future.
There can be no assurance that these matters, or the adverse publicity associated with them, will not result in increased fund redemptions, reduced sale of fund shares, or other adverse consequences to ING Funds.
NOTE 18 — LITIGATION
On December 12, 2003, ING IM received a copy of a complaint (the "Complaint") filed in the United States Bankruptcy Court for the Southern District of New York styled Enron Corp. v. Mass Mutual Life Insurance Co., et al. Among other defendants named in the Complaint are defendants Balanced, and Intermediate Bond (the "Subject Portfolios"). The Complaint alleges that Enron Corp. ("Enron") transferred to the defendants, including the Subject Portfolios, over $1 billion in the aggregate for the purpose of prepaying certain commercial paper issued by Enron (the "Notes") and held by the defendants prior to the filing by Enron for bankruptcy protection under Chapter 11 of Title 11 of the Bankruptcy Code (the "Bankruptcy Code"). The Complaint seeks to recover from the defendants, including the Subject Portfolios, these transfers under the alternative but interrelated bankruptcy theories of preferential transfer and fraudulent conveyance. Although t he Complaint does not specify the amount of each transfer in dispute, it appears that the sale by ING VP Balanced Portfolio, Inc. of $23,181,757 of the Notes on or about October 29, 2001 and the sale by ING VP Bond Portfolio, Inc. of $24,963,125 of the Notes on or about October 29, 2001 are in dispute. The Complaint seeks to require the Subject Portfolios to repay to Enron the full amounts of these transfers, in which event the Subject Portfolios would be granted unsecured claims against the Enron bankruptcy estate in the amounts of the repayments. If Enron proves up the elements of preferential transfer and/or fraudulent conveyance, these are strict liability theories of recovery.
The Subject Portfolios are part of a defense group of similarly-situated defendants. Along with those and other defendants, the Subject Portfolios moved to dismiss all counts of the Complaint, contending, among other things, that section 546(e) of the Bankruptcy Code provides a complete defense.
The Bankruptcy Court denied the motion on July 1, 2005. Accordingly, the Subject Portfolios filed an answer to the Complaint on July 29, 2005. The Subject Portfolios have moved for leave to pursue an
49
NOTES TO FINANCIAL STATEMENTS AS OF JUNE 30, 2007 (UNAUDITED) (CONTINUED)
NOTE 18 — LITIGATION (continued)
immediate appeal (the "Appeal") of the Bankruptcy Court's decision to the District Court.
On April 4, 2006, the Securities and Exchange Commission filed a memorandum in support of the Subject Portfolio's motion for leave with the district court. In addition, the U.S. Attorney's office, on behalf of the United States of America and the Department of Treasury as well as the Governor of the Federal Reserve Board has each filed statements of interest in support of the Appeal.
The Bankruptcy Court has refused to stay discovery while the motion for leave to appeal is pending, so deposition and document discovery is continuing.
Since last update provided to the Board, Enron has settled with Lehman Brothers and their downstream investors for approximately 29.3% of their claim. The total cash that will be paid to Enron by this block of defendants is approximately $138 million and comprises approximately 42% of the total claims made in the litigation. Additionally, last year JPMorganChase settled with Enron on a global basis, including this lawsuit, for approximately $1 billion. Other smaller defendants have settled with Enron for varying amounts.
The Subject Portfolios motion for leave to appeal the denial of defendants' motion to dismiss that has been pending for over 18 months. A decision could come at any time. If the court grants our motion for leave, the settlement position improves The court is being informed of the settlements as they are reached and it is possible the courts is delaying a ruling on the motion for leave to appeal simply to keep the pressure on the parties to settle. The motion is quite strong and has been supported by amicus briefs as noted above. The message being sent to the court should be that the issue of settlement payments being a complete defense to a preference action is of extreme importance to the financial markets.
50
PORTFOLIO OF INVESTMENTS
ING VP BALANCED PORTFOLIO AS OF JUNE 30, 2007 (UNAUDITED)
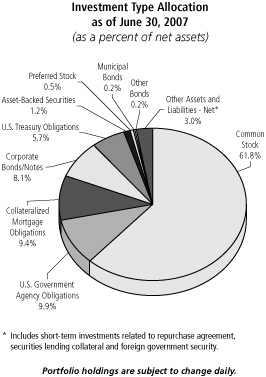
| Shares | | | | | | Value | |
| COMMON STOCK: 61.8% | | | |
| | | | | Advertising: 0.7% | |
| | 1,800 | | | | | Catalina Marketing Corp. | | $ | 56,700 | | |
| | 1,800 | | | @,L | | inVentiv Health, Inc. | | | 65,898 | | |
| | 137,200 | | | L | | Omnicom Group | | | 7,260,624 | | |
| | | | 7,383,222 | | |
| | | | | Aerospace/Defense: 3.1% | |
| | 1,700 | | | @,L | | Armor Holdings, Inc. | | | 147,679 | | |
| | 17,450 | | | | | Boeing Co. | | | 1,677,992 | | |
| | 2,300 | | | | | Curtiss-Wright Corp. | | | 107,203 | | |
| | 2,500 | | | | | DRS Technologies, Inc. | | | 143,175 | | |
| | 15,300 | | | | | General Dynamics Corp. | | | 1,196,766 | | |
| | 108,400 | | | | | Lockheed Martin Corp. | | | 10,203,692 | | |
| | 183,140 | | | | | Raytheon Co. | | | 9,869,415 | | |
| | 171,110 | | | | | United Technologies Corp. | | | 12,136,832 | | |
| | | | 35,482,754 | | |
| | | | | Agriculture: 1.0% | |
| | 19,300 | | | @ | | Alliance One
International, Inc. | | | 193,965 | | |
| | 98,605 | | | | | Altria Group, Inc. | | | 6,916,155 | | |
| | 2,600 | | | | | Universal Corp. | | | 158,392 | | |
| | 65,900 | | | L | | UST, Inc. | | | 3,539,489 | | |
| | | | 10,808,001 | | |
| | | | | Airlines: 0.0% | |
| | 3,900 | | | @ | | Airtran Holdings, Inc. | | | 42,588 | | |
| | 3,400 | | | @,L | | Alaska Air Group, Inc. | | | 94,724 | | |
| | 12,395 | | | | | Skywest, Inc. | | | 295,373 | | |
| | | | 432,685 | | |
| Shares | | | | | | Value | |
| | | | | Apparel: 0.8% | |
| | 111,700 | | | @ | | Coach, Inc. | | $ | 5,293,463 | | |
| | 2,500 | | | @,L | | CROCS, Inc. | | | 107,575 | | |
| | 1,200 | | | @,L | | Deckers Outdoor Corp. | | | 121,080 | | |
| | 6,500 | | | @ | | Gymboree Corp. | | | 256,165 | | |
| | 9,800 | | | @,L | | Hanesbrands, Inc. | | | 264,894 | | |
| | 4,400 | | | @,L | | Iconix Brand Group, Inc. | | | 97,768 | | |
| | 7,100 | | | L | | Kellwood Co. | | | 199,652 | | |
| | 3,200 | | | | | K-Swiss, Inc. | | | 90,656 | | |
| | 600 | | | | | Oxford Industries, Inc. | | | 26,604 | | |
| | 4,400 | | | | | Phillips-Van Heusen | | | 266,508 | | |
| | 24,400 | | | | | Polo Ralph Lauren Corp. | | | 2,393,884 | | |
| | 1,300 | | | @ | | Skechers USA, Inc. | | | 37,960 | | |
| | 2,000 | | | | | Stride Rite Corp. | | | 40,520 | | |
| | 1,600 | | | @ | | Timberland Co. | | | 40,304 | | |
| | 7,900 | | | | | Wolverine World Wide, Inc. | | | 218,909 | | |
| | | | 9,455,942 | | |
| | | | | Auto Manufacturers: 0.4% | |
| | 198,800 | | | L | | Ford Motor Co. | | | 1,872,696 | | |
| | 3,100 | | | | | Oshkosh Truck Corp. | | | 195,052 | | |
| | 28,000 | | | | | Paccar, Inc. | | | 2,437,120 | | |
| | | | 4,504,868 | | |
| | | | | Auto Parts & Equipment: 0.0% | |
| | 9,500 | | | L | | ArvinMeritor, Inc. | | | 210,900 | | |
| | 3,600 | | | @ | | Lear Corp. | | | 128,196 | | |
| | 3,300 | | | L | | Standard Motor
Products, Inc. | | | 49,599 | | |
| | | | 388,695 | | |
| | | | | Banks: 3.8% | |
| | 20,400 | | | L | | Associated Banc-Corp. | | | 667,080 | | |
| | 318,335 | | | | | Bank of America Corp. | | | 15,563,385 | | |
| | 2,100 | | | | | Bank of Hawaii Corp. | | | 108,444 | | |
| | 35,100 | | | @ | | Bank of New York Co., Inc. | | | 1,454,544 | | |
| | 800 | | | L | | Cathay General Bancorp. | | | 26,832 | | |
| | 1,000 | | | | | Central Pacific Financial Corp. | | | 33,010 | | |
| | 26,400 | | | L | | Colonial BancGroup, Inc. | | | 659,208 | | |
| | 37,000 | | | | | Comerica, Inc. | | | 2,200,390 | | |
| | 800 | | | | | Community Bank
System, Inc. | | | 16,016 | | |
| | 6,600 | | | | | Compass Bancshares, Inc. | | | 455,268 | | |
| | 5,300 | | | L | | Corus Bankshares, Inc. | | | 91,478 | | |
| | 6,892 | | | L | | East-West Bancorp., Inc. | | | 267,961 | | |
| | 11,700 | | | @@,L | | First Bancorp. | | | 128,583 | | |
| | 4,100 | | | L | | First Financial Bancorp. | | | 61,459 | | |
| | 800 | | | | | First Indiana Corp. | | | 17,696 | | |
| | 3,900 | | | | | First Midwest Bancorp., Inc. | | | 138,489 | | |
| | 1,800 | | | | | First Republic Bank | | | 96,588 | | |
| | 12,200 | | | | | FirstMerit Corp. | | | 255,346 | | |
| | 4,500 | | | L | | Fremont General Corp. | | | 48,420 | | |
| | 4,500 | | | | | Frontier Financial Corp. | | | 101,385 | | |
| | 2,400 | | | | | Greater Bay Bancorp. | | | 66,816 | | |
| | 7,900 | | | | | Hanmi Financial Corp. | | | 134,774 | | |
| | 96,600 | | | | | Huntington Bancshares, Inc. | | | 2,196,684 | | |
| | 5,000 | | | | | Independent Bank Corp. | | | 86,050 | | |
| | 2,200 | | | | | Irwin Financial Corp. | | | 32,934 | | |
| | 1,200 | | | | | Nara Bancorp., Inc. | | | 19,116 | | |
| | 5,600 | | | L | | Provident Bankshares Corp. | | | 183,568 | | |
| | 115,200 | | | | | Regions Financial Corp. | | | 3,813,120 | | |
| | 2,900 | | | | | Susquehanna
Bancshares, Inc. | | | 64,873 | | |
| | 7,500 | | | | | UCBH Holdings, Inc. | | | 137,025 | | |
See Accompanying Notes to Financial Statements
51
PORTFOLIO OF INVESTMENTS
ING VP BALANCED PORTFOLIO AS OF JUNE 30, 2007 (UNAUDITED) (CONTINUED)
| Shares | | | | | | Value | |
| | | | | Banks (continued) | |
| | 7,200 | | | L | | United Bankshares, Inc. | | $ | 228,960 | | |
| | 83,450 | | | | | Wachovia Corp. | | | 4,276,813 | | |
| | 7,000 | | | | | Webster Financial Corp. | | | 298,690 | | |
| | 238,800 | | | L | | Wells Fargo & Co. | | | 8,398,596 | | |
| | 8,000 | | | | | Whitney Holding Corp. | | | 240,800 | | |
| | 2,500 | | | | | Wilshire Bancorp., Inc. | | | 30,450 | | |
| | | | 42,600,851 | | |
| | | | | Beverages: 0.1% | |
| | 1,700 | | | @ | | Hansen Natural Corp. | | | 73,066 | | |
| | 39,500 | | | | | Pepsi Bottling Group, Inc. | | | 1,330,360 | | |
| | 11,400 | | | | | PepsiAmericas, Inc. | | | 279,984 | | |
| | | | 1,683,410 | | |
| | | | | Biotechnology: 0.1% | |
| | 2,400 | | | @ | | Arqule, Inc. | | | 16,920 | | |
| | 7,400 | | | @ | | Biogen Idec, Inc. | | | 395,900 | | |
| | 1,340 | | | @ | | Digene Corp. | | | 80,467 | | |
| | 1,100 | | | @,L | | Enzo Biochem, Inc. | | | 16,445 | | |
| | 1,100 | | | @,L | | Integra LifeSciences
Holdings Corp. | | | 54,362 | | |
| | 2,500 | | | @,L | | Invitrogen Corp. | | | 184,375 | | |
| | 34,300 | | | @,L | | Millennium
Pharmaceuticals, Inc. | | | 362,551 | | |
| | 3,300 | | | @,L | | PDL BioPharma, Inc. | | | 76,890 | | |
| | 4,300 | | | @,L | | Regeneron
Pharmaceuticals, Inc. | | | 77,056 | | |
| | 1,400 | | | @ | | Savient Pharmaceuticals, Inc. | | | 17,388 | | |
| | 3,500 | | | @ | | Vertex Pharmaceuticals, Inc. | | | 99,960 | | |
| | | | 1,382,314 | | |
| | | | | Building Materials: 0.4% | |
| | 600 | | | @ | | Drew Industries, Inc. | | | 19,884 | | |
| | 2,300 | | | | | Florida Rock Industries, Inc. | | | 155,250 | | |
| | 1,500 | | | | | Gibraltar Industries, Inc. | | | 33,225 | | |
| | 7,500 | | | | | Lennox International, Inc. | | | 256,725 | | |
| | 300 | | | | | Martin Marietta
Materials, Inc. | | | 48,606 | | |
| | 121,200 | | | | | Masco Corp. | | | 3,450,564 | | |
| | 3,700 | | | L | | Universal Forest
Products, Inc. | | | 156,362 | | |
| | | | 4,120,616 | | |
| | | | | Chemicals: 0.7% | |
| | 3,700 | | | | | Albemarle Corp. | | | 142,561 | | |
| | 500 | | | | | Arch Chemicals, Inc. | | | 17,570 | | |
| | 22,800 | | | | | Ashland, Inc. | | | 1,458,060 | | |
| | 8,600 | | | L | | Cabot Corp. | | | 410,048 | | |
| | 7,100 | | | | | Chemtura Corp. | | | 78,881 | | |
| | 1,800 | | | | | Ferro Corp. | | | 44,874 | | |
| | 4,500 | | | | | HB Fuller Co. | | | 134,505 | | |
| | 9,400 | | | | | Lubrizol Corp. | | | 606,770 | | |
| | 15,187 | | | L | | Lyondell Chemical Co. | | | 563,741 | | |
| | 25,300 | | | | | Monsanto Co. | | | 1,708,762 | | |
| | 17,100 | | | L | | Olin Corp. | | | 359,100 | | |
| | 1,100 | | | @ | | OM Group, Inc. | | | 58,212 | | |
| | 900 | | | | | Penford Corp. | | | 24,561 | | |
| | 23,400 | | | @,L | | PolyOne Corp. | | | 168,246 | | |
| | 7,500 | | | | | PPG Industries, Inc. | | | 570,825 | | |
| | 800 | | | | | Quaker Chemical Corp. | | | 18,880 | | |
| | 2,100 | | | | | Sensient Technologies Corp. | | | 53,319 | | |
| | 34,900 | | | | | Sigma-Aldrich Corp. | | | 1,489,183 | | |
| | 5,000 | | | | | Tronox, Inc. | | | 70,250 | | |
| | 3,000 | | | | | Valspar Corp. | | | 85,230 | | |
| | | | 8,063,578 | | |
| Shares | | | | | | Value | |
| | | | | Coal: 0.0% | |
| | 4,900 | | | | | Massey Energy Co. | | $ | 130,585 | | |
| | | | 130,585 | | |
| | | | | Commercial Services: 0.9% | |
| | 11,600 | | | | | ABM Industries, Inc. | | | 299,396 | | |
| | 2,100 | | | | | Administaff, Inc. | | | 70,329 | | |
| | 3,000 | | | @ | | Alliance Data Systems Corp. | | | 231,840 | | |
| | 3,600 | | | L | | Arbitron, Inc. | | | 185,508 | | |
| | 4,200 | | | | | Bowne & Co., Inc. | | | 81,942 | | |
| | 1,400 | | | @ | | Bright Horizons Family
Solutions, Inc. | | | 54,474 | | |
| | 4,400 | | | @,L | | Career Education Corp. | | | 148,588 | | |
| | 900 | | | | | Chemed Corp. | | | 59,661 | | |
| | 4,000 | | | @,W | | ChoicePoint, Inc. | | | 169,800 | | |
| | 2,600 | | | @,L | | Coinstar, Inc. | | | 81,848 | | |
| | 300 | | | @ | | Consolidated Graphics, Inc. | | | 20,784 | | |
| | 63,700 | | | @ | | Convergys Corp. | | | 1,544,088 | | |
| | 2,300 | | | L | | Corporate Executive
Board Co. | | | 149,293 | | |
| | 1,000 | | | | | CPI Corp. | | | 69,500 | | |
| | 7,500 | | | L | | DeVry, Inc. | | | 255,150 | | |
| | 2,200 | | | @,L | | Heidrick & Struggles
International, Inc. | | | 112,728 | | |
| | 2,100 | | | @ | | ITT Educational Services, Inc. | | | 246,498 | | |
| | 3,900 | | | | | Kelly Services, Inc. | | | 107,094 | | |
| | 500 | | | @ | | Kendle International, Inc. | | | 18,385 | | |
| | 11,200 | | | @ | | Korn/Ferry International | | | 294,112 | | |
| | 8,200 | | | @,L | | Labor Ready, Inc. | | | 189,502 | | |
| | 2,400 | | | @ | | Laureate Education, Inc. | | | 147,984 | | |
| | 1,600 | | | @ | | Live Nation, Inc. | | | 35,808 | | |
| | 7,400 | | | | | Manpower, Inc. | | | 682,576 | | |
| | 1,700 | | | L | | MAXIMUS, Inc. | | | 73,746 | | |
| | 55,000 | | | | | McKesson Corp. | | | 3,280,200 | | |
| | 1,500 | | | @,L | | Midas, Inc. | | | 34,005 | | |
| | 23,800 | | | @ | | MPS Group, Inc. | | | 318,206 | | |
| | 2,300 | | | @,L | | Pre-Paid Legal Services, Inc. | | | 147,913 | | |
| | 4,300 | | | @,L | | Quanta Services, Inc. | | | 131,881 | | |
| | 2,200 | | | | | Rollins, Inc. | | | 50,094 | | |
| | 5,000 | | | L | | Sotheby's | | | 230,100 | | |
| | 8,700 | | | @ | | Spherion Corp. | | | 81,693 | | |
| | 600 | | | L | | Strayer Education, Inc. | | | 79,026 | | |
| | 700 | | | @ | | Universal Technical
Institute, Inc. | | | 17,773 | | |
| | 510 | | | @ | | Vertrue, Inc. | | | 24,878 | | |
| | 5,300 | | | W | | Viad Corp. | | | 223,501 | | |
| | 3,550 | | | @ | | Volt Information
Sciences, Inc. | | | 65,462 | | |
| | 3,500 | | | | | Watson Wyatt
Worldwide, Inc. | | | 176,680 | | |
| | | | 10,192,046 | | |
| | | | | Computers: 5.0% | |
| | 5,100 | | | @ | | Affiliated Computer
Services, Inc. | | | 289,272 | | |
| | 3,700 | | | L | | Agilysys, Inc. | | | 83,250 | | |
| | 37,900 | | | @ | | Apple, Inc. | | | 4,625,316 | | |
| | 5,700 | | | @ | | BISYS Group, Inc. | | | 67,431 | | |
| | 4,590 | | | @,L | | CACI International, Inc. | | | 224,222 | | |
| | 9,500 | | | @ | | Cadence Design
Systems, Inc. | | | 208,620 | | |
| | 6,700 | | | @ | | Ceridian Corp. | | | 234,500 | | |
| | 9,700 | | | @,L | | Ciber, Inc. | | | 79,346 | | |
| | 16,100 | | | @ | | Computer Sciences Corp. | | | 952,315 | | |
See Accompanying Notes to Financial Statements
52
PORTFOLIO OF INVESTMENTS
ING VP BALANCED PORTFOLIO AS OF JUNE 30, 2007 (UNAUDITED) (CONTINUED)
| Shares | | | | | | Value | |
| | | | | Computers (continued) | |
| | 265,800 | | | @ | | Dell, Inc. | | $ | 7,588,590 | | |
| | 1,500 | | | @,L | | DST Systems, Inc. | | | 118,815 | | |
| | 77,400 | | | | | Electronic Data
Systems Corp. | | | 2,146,302 | | |
| | 348,100 | | | @ | | EMC Corp. | | | 6,300,610 | | |
| | 300 | | | | | Factset Research
Systems, Inc. | | | 20,505 | | |
| | 260,300 | | | | | Hewlett-Packard Co. | | | 11,614,586 | | |
| | 5,900 | | | | | Imation Corp. | | | 217,474 | | |
| | 147,950 | | | | | International Business
Machines Corp. | | | 15,571,738 | | |
| | 1,900 | | | | | Jack Henry & Associates, Inc. | | | 48,925 | | |
| | 42,900 | | | @ | | Lexmark International, Inc. | | | 2,115,399 | | |
| | 2,000 | | | @ | | Manhattan Associates, Inc. | | | 55,820 | | |
| | 1,600 | | | @,L | | Mercury Computer
Systems, Inc. | | | 19,520 | | |
| | 3,337 | | | @,L | | Micros Systems, Inc. | | | 181,533 | | |
| | 58,500 | | | @,L | | Network Appliance, Inc. | | | 1,708,200 | | |
| | 1,600 | | | @,L | | Palm, Inc. | | | 25,616 | | |
| | 1,000 | | | @,L | | Radisys Corp. | | | 12,400 | | |
| | 26,000 | | | @,L | | Sandisk Corp. | | | 1,272,440 | | |
| | 9,700 | | | @,L | | SRA International, Inc. | | | 245,022 | | |
| | 3,500 | | | @ | | SYKES Enterprises, Inc. | | | 66,465 | | |
| | 16,800 | | | @ | | Synopsys, Inc. | | | 444,024 | | |
| | 14,400 | | | @,L | | Western Digital Corp. | | | 278,640 | | |
| | | | 56,816,896 | | |
| | | | | Cosmetics/Personal Care: 1.2% | |
| | 9,000 | | | | | Alberto-Culver Co. | | | 213,480 | | |
| | 600 | | | @,L | | Chattem, Inc. | | | 38,028 | | |
| | 16,200 | | | L | | Estee Lauder Cos., Inc. | | | 737,262 | | |
| | 215,392 | | | | | Procter & Gamble Co. | | | 13,179,836 | | |
| | | | 14,168,606 | | |
| | | | | Distribution/Wholesale: 0.0% | |
| | 6,100 | | | L | | Building Materials
Holding Corp. | | | 86,559 | | |
| | 2,700 | | | | | CDW Corp. | | | 229,419 | | |
| | 2,400 | | | @ | | Ingram Micro, Inc. | | | 52,104 | | |
| | | | 368,082 | | |
| | | | | Diversified Financial Services: 4.4% | |
| | 3,500 | | | | | AG Edwards, Inc. | | | 295,925 | | |
| | 18,800 | | | | | American Express Co. | | | 1,150,184 | | |
| | 5,200 | | | @,L | | AmeriCredit Corp. | | | 138,060 | | |
| | 285,465 | | | | | Citigroup, Inc. | | | 14,641,500 | | |
| | 3,500 | | | | | Financial Federal Corp. | | | 104,370 | | |
| | 45,450 | | | | | Goldman Sachs Group, Inc. | | | 9,851,288 | | |
| | 3,500 | | | L | | IndyMac Bancorp., Inc. | | | 102,095 | | |
| | 2,300 | | | @,L | | Investment Technology
Group, Inc. | | | 99,659 | | |
| | 6,100 | | | | | Jefferies Group, Inc. | | | 164,578 | | |
| | 235,800 | | | | | JP Morgan Chase & Co. | | | 11,424,510 | | |
| | 2,600 | | | @,L | | LaBranche & Co., Inc. | | | 19,188 | | |
| | 16,400 | | | | | Lehman Brothers
Holdings, Inc. | | | 1,222,128 | | |
| | 37,410 | | | | | Merrill Lynch & Co., Inc. | | | 3,126,728 | | |
| | 77,200 | | | | | Morgan Stanley | | | 6,475,536 | | |
| | 1,200 | | | @ | | Piper Jaffray Cos. | | | 66,876 | | |
| | 12,500 | | | | | Raymond James
Financial, Inc. | | | 386,250 | | |
| | 16,700 | | | | | SLM Corp. | | | 961,586 | | |
| | 1,450 | | | | | SWS Group, Inc. | | | 31,349 | | |
| Shares | | | | | | Value | |
| | 1,400 | | | @ | | TradeStation Group, Inc. | | $ | 16,310 | | |
| | 400 | | | @ | | World Acceptance, Corp. | | | 17,092 | | |
| | | | 50,295,212 | | |
| | | | | Electric: 2.1% | |
| | 2,200 | | | | | Allete, Inc. | | | 103,510 | | |
| | 17,700 | | | @ | | Aquila, Inc. | | | 72,393 | | |
| | 600 | | | L | | Central Vermont Public
Service Corp. | | | 22,608 | | |
| | 81,400 | | | | | Edison International | | | 4,568,168 | | |
| | 6,900 | | | @ | | El Paso Electric Co. | | | 169,464 | | |
| | 7,400 | | | | | Energy East Corp. | | | 193,066 | | |
| | 81,400 | | | | | Entergy Corp. | | | 8,738,290 | | |
| | 25,400 | | | | | MDU Resources Group, Inc. | | | 712,216 | | |
| | 17,000 | | | | | Northeast Utilities | | | 482,120 | | |
| | 6,800 | | | | | NSTAR | | | 220,660 | | |
| | 10,000 | | | | | OGE Energy Corp. | | | 366,500 | | |
| | 12,500 | | | | | Pepco Holdings, Inc. | | | 352,500 | | |
| | 64,500 | | | | | Public Service Enterprise
Group, Inc. | | | 5,661,810 | | |
| | 5,500 | | | | | Puget Energy, Inc. | | | 132,990 | | |
| | 2,200 | | | @ | | Sierra Pacific Resources | | | 38,632 | | |
| | 21,700 | | | | | TXU Corp. | | | 1,460,410 | | |
| | 8,400 | | | | | Westar Energy, Inc. | | | 203,952 | | |
| | | | 23,499,289 | | |
| | | | | Electrical Components & Equipment: 0.1% | |
| | 2,100 | | | @ | | Advanced Energy
Industries, Inc. | | | 47,586 | | |
| | 6,800 | | | W | | Ametek, Inc. | | | 269,824 | | |
| | 2,100 | | | | | Belden Cdt, Inc. | | | 116,235 | | |
| | 600 | | | @ | | Energizer Holdings, Inc. | | | 59,760 | | |
| | 1,800 | | | @ | | Greatbatch, Inc. | | | 58,320 | | |
| | 2,100 | | | @,L | | Littelfuse, Inc. | | | 70,917 | | |
| | 3,300 | | | @ | | Magnetek, Inc. | | | 16,995 | | |
| | 1,300 | | | | | Vicor Corp. | | | 17,199 | | |
| | | | 656,836 | | |
| | | | | Electronics: 0.4% | |
| | 8,400 | | | | | Amphenol Corp. | | | 299,460 | | |
| | 1,100 | | | | | Analogic Corp. | | | 80,861 | | |
| | 5,000 | | | @,L | | Avnet, Inc. | | | 198,200 | | |
| | 500 | | | | | Bel Fuse, Inc. | | | 17,015 | | |
| | 3,600 | | | @ | | Benchmark Electronics, Inc. | | | 81,432 | | |
| | 3,400 | | | @ | | Checkpoint Systems, Inc. | | | 85,850 | | |
| | 8,190 | | | @,L | | Coherent, Inc. | | | 249,877 | | |
| | 4,300 | | | | | CTS Corp. | | | 54,438 | | |
| | 3,500 | | | | | Cubic Corp. | | | 105,630 | | |
| | 1,700 | | | @,L | | Cymer, Inc. | | | 68,340 | | |
| | 1,100 | | | @ | | Dionex Corp. | | | 78,089 | | |
| | 3,600 | | | @ | | FEI Co. | | | 116,856 | | |
| | 700 | | | @,L | | Flir Systems, Inc. | | | 32,375 | | |
| | 13,500 | | | | | Gentex Corp. | | | 265,815 | | |
| | 700 | | | @,L | | Itron, Inc. | | | 54,558 | | |
| | 1,300 | | | | | Keithley Instruments, Inc. | | | 16,315 | | |
| | 3,900 | | | @ | | Kemet Corp. | | | 27,495 | | |
| | 7,000 | | | | | Methode Electronics, Inc. | | | 109,550 | | |
| | 2,500 | | | | | National Instruments Corp. | | | 81,425 | | |
| | 3,700 | | | @ | | Photon Dynamics, Inc. | | | 40,330 | | |
| | 2,300 | | | @ | | Planar Systems, Inc. | | | 17,227 | | |
| | 900 | | | @ | | Plexus Corp. | | | 20,691 | | |
| | 600 | | | | | Technitrol, Inc. | | | 17,202 | | |
| | 38,100 | | | | | Tektronix, Inc. | | | 1,285,494 | | |
| | 10,400 | | | @ | | Thomas & Betts Corp. | | | 603,200 | | |
See Accompanying Notes to Financial Statements
53
PORTFOLIO OF INVESTMENTS
ING VP BALANCED PORTFOLIO AS OF JUNE 30, 2007 (UNAUDITED) (CONTINUED)
| Shares | | | | | | Value | |
| | | | | Electronics (continued) | |
| | 5,880 | | | @ | | Trimble Navigation Ltd. | | $ | 189,336 | | |
| | 5,000 | | | @,L | | Varian, Inc. | | | 274,150 | | |
| | 16,700 | | | @ | | Vishay Intertechnology, Inc. | | | 264,194 | | |
| | 1,600 | | | | | Woodward Governor Co. | | | 85,872 | | |
| | 3,000 | | | | | X-Rite, Inc. | | | 44,310 | | |
| | | | 4,865,587 | | |
| | | | | Energy-Alternate Sources: 0.0% | |
| | 5,100 | | | @,L | | Headwaters, Inc. | | | 88,077 | | |
| | | | 88,077 | | |
| | | | | Engineering & Construction: 0.2% | |
| | 3,300 | | | @ | | Dycom Industries, Inc. | | | 98,934 | | |
| | 5,200 | | | @ | | EMCOR Group, Inc. | | | 379,080 | | |
| | 7,900 | | | | | Granite Construction, Inc. | | | 507,022 | | |
| | 11,700 | | | @,L | | Jacobs Engineering
Group, Inc. | | | 672,867 | | |
| | 12,700 | | | @ | | KBR, Inc. | | | 333,121 | | |
| | 2,700 | | | @,L | | Shaw Group, Inc. | | | 124,983 | | |
| | 3,000 | | | @ | | URS Corp. | | | 145,650 | | |
| | | | 2,261,657 | | |
| | | | | Entertainment: 0.0% | |
| | 500 | | | | | International
Speedway Corp. | | | 26,355 | | |
| | 4,100 | | | @,L | | Macrovision Corp. | | | 123,246 | | |
| | 2,100 | | | @ | | Pinnacle Entertainment, Inc. | | | 59,115 | | |
| | | | 208,716 | | |
| | | | | Environmental Control: 0.1% | |
| | 5,950 | | | @,L | | Waste Connections, Inc. | | | 179,928 | | |
| | 10,900 | | | | | Waste Management, Inc. | | | 425,645 | | |
| | | | 605,573 | | |
| | | | | Food: 0.9% | |
| | 5,990 | | | | | Corn Products
International, Inc. | | | 272,246 | | |
| | 16,900 | | | @ | | Dean Foods Co. | | | 538,603 | | |
| | 3,400 | | | | | Flowers Foods, Inc. | | | 113,424 | | |
| | 141,617 | | | | | General Mills, Inc. | | | 8,273,265 | | |
| | 2,900 | | | @ | | Hain Celestial Group, Inc. | | | 78,706 | | |
| | 3,579 | | | | | Hormel Foods Corp. | | | 133,676 | | |
| | 800 | | | | | J&J Snack Foods Corp. | | | 30,192 | | |
| | 1,600 | | | L | | Nash Finch Co. | | | 79,200 | | |
| | 400 | | | @ | | Ralcorp Holdings, Inc. | | | 21,380 | | |
| | 4,100 | | | L | | Ruddick Corp. | | | 123,492 | | |
| | 1,800 | | | L | | Sanderson Farms, Inc. | | | 81,036 | | |
| | 11,600 | | | @ | | Smithfield Foods, Inc. | | | 357,164 | | |
| | 600 | | | L | | Spartan Stores, Inc. | | | 19,746 | | |
| | 2,600 | | | @ | | TreeHouse Foods, Inc. | | | 69,186 | | |
| | | | 10,191,316 | | |
| | | | | Forest Products & Paper: 0.1% | |
| | 5,300 | | | L | | Bowater, Inc. | | | 132,235 | | |
| | 4,500 | | | @ | | Buckeye Technologies, Inc. | | | 69,615 | | |
| | 1,800 | | | | | Neenah Paper, Inc. | | | 74,268 | | |
| | 6,900 | | | | | Rock-Tenn Co. | | | 218,868 | | |
| | 500 | | | | | Schweitzer-Mauduit
International, Inc. | | | 15,500 | | |
| | 4,900 | | | | | Wausau Paper Corp. | | | 65,660 | | |
| | | | 576,146 | | |
| | | | | Gas: 0.2% | |
| | 3,700 | | | | | AGL Resources, Inc. | | | 149,776 | | |
| | 800 | | | | | Atmos Energy Corp. | | | 24,048 | | |
| Shares | | | | | | Value | |
| | 700 | | | | | Cascade Natural Gas Corp. | | $ | 18,487 | | |
| | 8,446 | | | | | Energen Corp. | | | 464,023 | | |
| | 9,000 | | | | | KeySpan Corp. | | | 377,820 | | |
| | 3,700 | | | | | Northwest Natural Gas Co. | | | 170,903 | | |
| | 4,800 | | | | | Southern Union Co. | | | 156,432 | | |
| | 6,100 | | | | | Southwest Gas Corp. | | | 206,241 | | |
| | 15,130 | | | | | UGI Corp. | | | 412,746 | | |
| | 9,800 | | | | | WGL Holdings, Inc. | | | 319,872 | | |
| | | | 2,300,348 | | |
| | | | | Hand/Machine Tools: 0.2% | |
| | 26,600 | | | | | Black & Decker Corp. | | | 2,349,046 | | |
| | 7,700 | | | | | Snap-On, Inc. | | | 388,927 | | |
| | | | 2,737,973 | | |
| | | | | Healthcare-Products: 1.2% | |
| | 6,100 | | | @,L | | Advanced Medical
Optics, Inc. | | | 212,768 | | |
| | 1,200 | | | @ | | Arthrocare Corp. | | | 52,692 | | |
| | 22,800 | | | | | Baxter International, Inc. | | | 1,284,552 | | |
| | 2,700 | | | @,L | | Biolase Technology, Inc. | | | 16,389 | | |
| | 12,500 | | | | | Biomet, Inc. | | | 571,500 | | |
| | 5,200 | | | @ | | Cytyc Corp. | | | 224,172 | | |
| | 400 | | | | | Datascope Corp. | | | 15,312 | | |
| | 14,444 | | | | | Densply International, Inc. | | | 552,627 | | |
| | 8,700 | | | @,L | | Edwards Lifesciences Corp. | | | 429,258 | | |
| | 3,700 | | | @ | | Gen-Probe, Inc. | | | 223,554 | | |
| | 4,000 | | | @ | | Haemonetics Corp. | | | 210,440 | | |
| | 4,100 | | | @,L | | Henry Schein, Inc. | | | 219,063 | | |
| | 3,334 | | | @,L | | Hologic, Inc. | | | 184,404 | | |
| | 1,000 | | | @ | | ICU Medical, Inc. | | | 42,940 | | |
| | 1,586 | | | @,L | | Idexx Laboratories, Inc. | | | 150,083 | | |
| | 2,400 | | | @,L | | Immucor, Inc. | | | 67,128 | | |
| | 1,000 | | | @,L | | Intuitive Surgical, Inc. | | | 138,770 | | |
| | 124,000 | | | | | Johnson & Johnson | | | 7,640,880 | | |
| | 1,200 | | | L | | LCA-Vision, Inc. | | | 56,712 | | |
| | 3,200 | | | L | | Mentor Corp. | | | 130,176 | | |
| | 3,100 | | | @ | | Osteotech, Inc. | | | 22,320 | | |
| | 2,000 | | | @,L | | Palomar Medical
Technologies, Inc. | | | 69,420 | | |
| | 1,500 | | | @ | | Possis Medical, Inc. | | | 16,320 | | |
| | 4,800 | | | @,L | | PSS World Medical, Inc. | | | 87,456 | | |
| | 3,657 | | | @ | | Respironics, Inc. | | | 155,752 | | |
| | 2,800 | | | @,L | | SurModics, Inc. | | | 140,000 | | |
| | 4,900 | | | @,L | | Techne Corp. | | | 280,329 | | |
| | | | 13,195,017 | | |
| | | | | Healthcare-Services: 1.4% | |
| | 16,200 | | | | | Aetna, Inc. | | | 800,280 | | |
| | 8,000 | | | @ | | AMERIGROUP Corp. | | | 190,400 | | |
| | 2,300 | | | @,L | | Amsurg Corp. | | | 55,522 | | |
| | 5,600 | | | @,L | | Centene Corp. | | | 119,952 | | |
| | 33,650 | | | @ | | Coventry Health Care, Inc. | | | 1,939,923 | | |
| | 1,100 | | | @ | | Genesis HealthCare Corp. | | | 75,262 | | |
| | 3,200 | | | @ | | Gentiva Health Services, Inc. | | | 64,192 | | |
| | 8,300 | | | @ | | Health Net, Inc. | | | 438,240 | | |
| | 2,200 | | | @,L | | Healthways, Inc. | | | 104,214 | | |
| | 37,400 | | | @ | | Humana, Inc. | | | 2,278,034 | | |
| | 9,000 | | | @ | | Lincare Holdings, Inc. | | | 358,650 | | |
| | 5,400 | | | @ | | Pediatrix Medical Group, Inc. | | | 297,810 | | |
| | 3,200 | | | @,L | | Sierra Health Services, Inc. | | | 133,056 | | |
| | 1,300 | | | @ | | Sunrise Senior Living, Inc. | | | 51,987 | | |
| | 4,200 | | | @ | | Triad Hospitals, Inc. | | | 225,792 | | |
| | 125,800 | | | | | UnitedHealth Group, Inc. | | | 6,433,412 | | |
| | 3,100 | | | @ | | WellCare Health Plans, Inc. | | | 280,581 | | |
| | 24,440 | | | @ | | WellPoint, Inc. | | | 1,951,045 | | |
| | | | 15,798,352 | | |
See Accompanying Notes to Financial Statements
54
PORTFOLIO OF INVESTMENTS
ING VP BALANCED PORTFOLIO AS OF JUNE 30, 2007 (UNAUDITED) (CONTINUED)
| Shares | | | | | | Value | |
| | | | | Holding Companies-Diversified: 0.0% | |
| | 8,600 | | | L | | Leucadia National Corp. | | $ | 303,150 | | |
| | | | 303,150 | | |
| | | | | Home Builders: 0.2% | |
| | 3,700 | | | @,L | | Champion Enterprises, Inc. | | | 36,371 | | |
| | 35,800 | | | L | | KB Home | | | 1,409,446 | | |
| | 7,600 | | | L | | MDC Holdings, Inc. | | | 367,536 | | |
| | 300 | | | @,L | | NVR, Inc. | | | 203,925 | | |
| | 8,177 | | | | | Thor Industries, Inc. | | | 369,110 | | |
| | 3,000 | | | L | | Winnebago Industries | | | 88,560 | | |
| | | | 2,474,948 | | |
| | | | | Home Furnishings: 0.0% | |
| | 1,800 | | | @ | | Audiovox Corp. | | | 23,346 | | |
| | 3,200 | | | | | Ethan Allen Interiors, Inc. | | | 109,600 | | |
| | 3,200 | | | | | Harman International
Industries, Inc. | | | 373,760 | | |
| | | | 506,706 | | |
| | | | | Household Products/Wares: 0.2% | |
| | 11,000 | | | | | American Greetings Corp. | | | 311,630 | | |
| | 5,800 | | | | | Blyth, Inc. | | | 154,164 | | |
| | 1,400 | | | @,L | | Central Garden and Pet Co. | | | 16,422 | | |
| | 25,800 | | | | | Kimberly-Clark Corp. | | | 1,725,762 | | |
| | 5,000 | | | @,L | | Playtex Products, Inc. | | | 74,050 | | |
| | 5,000 | | | L | | Tupperware Corp. | | | 143,700 | | |
| | 1,000 | | | | | WD-40 Co. | | | 32,870 | | |
| | | | 2,458,598 | | |
| | | | | Housewares: 0.0% | |
| | 300 | | | | | National Presto
Industries, Inc. | | | 18,702 | | |
| | 1,600 | | | | | Toro Co. | | | 94,224 | | |
| | | | 112,926 | | |
| | | | | Insurance: 4.6% | |
| | 55,700 | | | @@ | | ACE Ltd. | | | 3,482,364 | | |
| | 80,400 | | | | | Allstate Corp. | | | 4,945,404 | | |
| | 14,075 | | | | | American Financial
Group, Inc. | | | 480,661 | | |
| | 102,900 | | | | | American International
Group, Inc. | | | 7,206,087 | | |
| | 8,800 | | | | | Arthur J Gallagher & Co. | | | 245,344 | | |
| | 5,100 | | | | | Brown & Brown, Inc. | | | 128,214 | | |
| | 66,300 | | | | | Chubb Corp. | | | 3,589,482 | | |
| | 2,200 | | | | | Commerce Group, Inc. | | | 76,384 | | |
| | 8,400 | | | | | Delphi Financial Group | | | 351,288 | | |
| | 7,400 | | | @@ | | Everest Re Group Ltd. | | | 803,936 | | |
| | 141,800 | | | | | Genworth Financial, Inc. | | | 4,877,920 | | |
| | 5,000 | | | | | Hanover Insurance
Group, Inc. | | | 243,950 | | |
| | 44,527 | | | L | | Hartford Financial
Services Group, Inc. | | | 4,386,355 | | |
| | 19,200 | | | | | HCC Insurance
Holdings, Inc. | | | 641,472 | | |
| | 800 | | | | | Hilb Rogal & Hobbs Co. | | | 34,288 | | |
| | 2,600 | | | | | Horace Mann
Educators Corp. | | | 55,224 | | |
| | 1,100 | | | | | Infinity Property &
Casualty Corp. | | | 55,803 | | |
| | 2,370 | | | L | | Landamerica Financial
Group, Inc. | | | 228,681 | | |
| | 2,800 | | | | | Mercury General Corp. | | | 154,308 | | |
| | 93,550 | | | L | | Metlife, Inc. | | | 6,032,104 | | |
| | 2,900 | | | | | Ohio Casualty Corp. | | | 125,599 | | |
| Shares | | | | | | Value | |
| | 10,606 | | | | | Old Republic
International Corp. | | $ | 225,484 | | |
| | 7,290 | | | @,L | | Philadelphia
Consolidated Holding Co. | | | 304,722 | | |
| | 4,200 | | | | | PMI Group, Inc. | | | 187,614 | | |
| | 3,200 | | | L | | Presidential Life Corp. | | | 62,912 | | |
| | 4,800 | | | @,L | | ProAssurance Corp. | | | 267,216 | | |
| | 5,300 | | | | | Protective Life Corp. | | | 253,393 | | |
| | 61,036 | | | | | Prudential Financial, Inc. | | | 5,934,530 | | |
| | 3,700 | | | L | | Radian Group, Inc. | | | 199,800 | | |
| | 4,500 | | | | | RLI Corp. | | | 251,775 | | |
| | 2,700 | | | | | Safety Insurance Group, Inc. | | | 111,780 | | |
| | 12,260 | | | L | | Selective Insurance Group | | | 329,549 | | |
| | 3,300 | | | | | Stancorp Financial
Group, Inc. | | | 173,184 | | |
| | 83,000 | | | | | Travelers Cos., Inc. | | | 4,440,500 | | |
| | 1,200 | | | | | United Fire & Casualty Co. | | | 42,456 | | |
| | 4,600 | | | | | Unitrin, Inc. | | | 226,228 | | |
| | 21,850 | | | | | WR Berkley Corp. | | | 710,999 | | |
| | 3,400 | | | | | Zenith National
Insurance Corp. | | | 160,106 | | |
| | | | 52,027,116 | | |
| | | | | Internet: 0.9% | |
| | 26,000 | | | @,L | | Amazon.com, Inc. | | | 1,778,660 | | |
| | 1,500 | | | @ | | Authorize.Net Holdings, Inc. | | | 26,835 | | |
| | 500 | | | @ | | Blue Coat Systems, Inc. | | | 24,760 | | |
| | 3,000 | | | @,L | | Blue Nile, Inc. | | | 181,200 | | |
| | 1,800 | | | @,L | | Digital River, Inc. | | | 81,450 | | |
| | 1,700 | | | @,L | | F5 Networks, Inc. | | | 137,020 | | |
| | 800 | | | @ | | Google, Inc. | | | 418,704 | | |
| | 49,100 | | | @,L | | IAC/InterActiveCorp. | | | 1,699,351 | | |
| | 4,000 | | | @ | | Infospace, Inc. | | | 92,840 | | |
| | 1,900 | | | @,L | | j2 Global
Communications, Inc. | | | 66,310 | | |
| | 12,475 | | | @ | | McAfee, Inc. | | | 439,120 | | |
| | 5,300 | | | @ | | Napster, Inc. | | | 18,020 | | |
| | 2,700 | | | @,L | | NetFlix, Inc. | | | 52,353 | | |
| | 2,100 | | | @ | | PC-Tel, Inc. | | | 18,375 | | |
| | 4,800 | | | @,L | | Secure Computing Corp. | | | 36,432 | | |
| | 3,400 | | | @,L | | Stamps.com, Inc. | | | 46,852 | | |
| | 136,600 | | | @ | | Symantec Corp. | | | 2,759,320 | | |
| | 4,500 | | | L | | United Online, Inc. | | | 74,205 | | |
| | 4,800 | | | @ | | Valueclick, Inc. | | | 141,408 | | |
| | 50,200 | | | @,L | | VeriSign, Inc. | | | 1,592,846 | | |
| | 3,000 | | | @ | | Websense, Inc. | | | 63,750 | | |
| | | | 9,749,811 | | |
| | | | | Iron/Steel: 0.7% | |
| | 1,260 | | | | | Carpenter Technology Corp. | | | 164,191 | | |
| | 2,100 | | | | | Chaparral Steel Co. | | | 150,927 | | |
| | 3,100 | | | L | | Cleveland-Cliffs, Inc. | | | 240,777 | | |
| | 1,300 | | | @ | | Material Sciences Corp. | | | 15,327 | | |
| | 88,300 | | | | | Nucor Corp. | | | 5,178,795 | | |
| | 1,300 | | | | | Reliance Steel &
Aluminum Co. | | | 73,138 | | |
| | 800 | | | | | Ryerson, Inc. | | | 30,120 | | |
| | 800 | | | | | Steel Dynamics, Inc. | | | 33,528 | | |
| | 17,700 | | | L | | United States Steel Corp. | | | 1,924,875 | | |
| | | | 7,811,678 | | |
| | | | | Leisure Time: 0.1% | |
| | 14,100 | | | | | Harley-Davidson, Inc. | | | 840,501 | | |
| | 2,700 | | | @ | | K2, Inc. | | | 41,013 | | |
| | 5,050 | | | L | | Polaris Industries, Inc. | | | 273,508 | | |
| | | | 1,155,022 | | |
See Accompanying Notes to Financial Statements
55
PORTFOLIO OF INVESTMENTS
ING VP BALANCED PORTFOLIO AS OF JUNE 30, 2007 (UNAUDITED) (CONTINUED)
| Shares | | | | | | Value | |
| | | | | Lodging: 0.1% | |
| | 9,800 | | | | | Harrah's Entertainment, Inc. | | $ | 835,548 | | |
| | 600 | | | @,L | | Monarch Casino
Resort, Inc. | | | 16,110 | | |
| | | | 851,658 | | |
| | | | | Machinery-Construction & Mining: 0.2% | |
| | 19,400 | | | | | Caterpillar, Inc. | | | 1,519,020 | | |
| | 7,800 | | | L | | Joy Global, Inc. | | | 454,974 | | |
| | | | 1,973,994 | | |
| | | | | Machinery - Diversified: 0.4% | |
| | 5,600 | | | @,L | | AGCO Corp. | | | 243,096 | | |
| | 5,500 | | | | | Applied Industrial
Technologies, Inc. | | | 162,250 | | |
| | 800 | | | | | Cascade Corp. | | | 62,752 | | |
| | 37,200 | | | | | Cummins, Inc. | | | 3,765,012 | | |
| | 2,100 | | | @ | | Gardner Denver, Inc. | | | 89,355 | | |
| | 2,283 | | | | | IDEX Corp. | | | 87,987 | | |
| | 1,000 | | | @,L | | Intevac, Inc. | | | 21,260 | | |
| | 3,500 | | | | | Manitowoc Co., Inc. | | | 281,330 | | |
| | 5,800 | | | | | Nordson Corp. | | | 290,928 | | |
| | 800 | | | | | Robbins & Myers, Inc. | | | 42,504 | | |
| | | | 5,046,474 | | |
| | | | | Media: 2.0% | |
| | 5,300 | | | | | Belo Corp. | | | 109,127 | | |
| | 24,000 | | | | | Clear Channel
Communications, Inc. | | | 907,680 | | |
| | 137,600 | | | | | McGraw-Hill Cos., Inc. | | | 9,367,808 | | |
| | 2,300 | | | @,W | | Radio One, Inc. | | | 16,238 | | |
| | 369,700 | | | | | Walt Disney Co. | | | 12,621,558 | | |
| | 300 | | | | | Washington Post | | | 232,827 | | |
| | | | 23,255,238 | | |
| | | | | Metal Fabricate/Hardware: 0.1% | |
| | 1,500 | | | L | | AM Castle & Co. | | | 53,865 | | |
| | 9,300 | | | | | Commercial Metals Co. | | | 314,061 | | |
| | 400 | | | | | Lawson Products | | | 15,480 | | |
| | 2,300 | | | | | Mueller Industries, Inc. | | | 79,212 | | |
| | 3,236 | | | | | Quanex Corp. | | | 157,593 | | |
| | | | 620,211 | | |
| | | | | Mining: 0.1% | |
| | 39,700 | | | | | Alcoa, Inc. | | | 1,609,041 | | |
| | 1,300 | | | @ | | Century Aluminum Co. | | | 71,019 | | |
| | | | 1,680,060 | | |
| | | | | Miscellaneous Manufacturing: 2.2% | |
| | 4,800 | | | | | 3M Co. | | | 416,592 | | |
| | 6,500 | | | | | Acuity Brands, Inc. | | | 391,820 | | |
| | 1,000 | | | L | | AO Smith Corp. | | | 39,890 | | |
| | 444 | | | | | Aptargroup, Inc. | | | 15,789 | | |
| | 1,600 | | | @,L | | Ceradyne, Inc. | | | 118,336 | | |
| | 12,200 | | | | | Cooper Industries Ltd. | | | 696,498 | | |
| | 10,000 | | | | | Crane Co. | | | 454,500 | | |
| | 25,000 | | | L | | Eastman Kodak Co. | | | 695,750 | | |
| | 34,300 | | | | | Eaton Corp. | | | 3,189,900 | | |
| | 4,600 | | | @ | | EnPro Industries, Inc. | | | 196,834 | | |
| | 220,815 | | | | | General Electric Co. | | | 8,452,798 | | |
| | 16,500 | | | | | ITT Corp. | | | 1,126,620 | | |
| | 1,800 | | | @ | | Lydall, Inc. | | | 26,298 | | |
| | 1,500 | | | | | Myers Industries, Inc. | | | 33,165 | | |
| | 46,800 | | | | | Parker Hannifin Corp. | | | 4,582,188 | | |
| | 7,500 | | | L | | Pentair, Inc. | | | 289,275 | | |
| | 2,100 | | | | | Roper Industries, Inc. | | | 119,910 | | |
| Shares | | | | | | Value | |
| | 1,400 | | | | | Standex International Corp. | | $ | 39,816 | | |
| | 4,600 | | | @,L | | Sturm Ruger & Co., Inc. | | | 71,392 | | |
| | 7,467 | | | | | Teleflex, Inc. | | | 610,651 | | |
| | 7,800 | | | | | Tredegar Corp. | | | 166,140 | | |
| | 94,800 | | | | | Tyco International Ltd. | | | 3,203,292 | | |
| | | | 24,937,454 | | |
| | | | | Office Furnishings: 0.0% | |
| | 7,802 | | | | | Herman Miller, Inc. | | | 246,543 | | |
| | 3,800 | | | | | HNI, Corp. | | | 155,800 | | |
| | 2,000 | | | | | Interface, Inc. | | | 37,720 | | |
| | | | 440,063 | | |
| | | | | Office/Business Equipment: 0.0% | |
| | 17,000 | | | @ | | Xerox Corp. | | | 314,160 | | |
| | | | 314,160 | | |
| | | | | Oil & Gas: 6.9% | |
| | 2,800 | | | @,L | | Atwood Oceanics, Inc. | | | 192,136 | | |
| | 5,400 | | | L | | Cabot Oil & Gas Corp. | | | 199,152 | | |
| | 205,886 | | | | | Chevron Corp. | | | 17,343,837 | | |
| | 15,500 | | | L | | Cimarex Energy Co. | | | 610,855 | | |
| | 74,200 | | | | | ConocoPhillips | | | 5,824,700 | | |
| | 358,140 | | | | | ExxonMobil Corp. | | | 30,040,783 | | |
| | 2,700 | | | @ | | Forest Oil Corp. | | | 114,102 | | |
| | 6,700 | | | | | Frontier Oil Corp. | | | 293,259 | | |
| | 17,900 | | | | | Helmerich & Payne, Inc. | | | 634,018 | | |
| | 196,400 | | | | | Marathon Oil Corp. | | | 11,776,144 | | |
| | 2,400 | | | @ | | Newfield Exploration Co. | | | 109,320 | | |
| | 15,400 | | | | | Noble Energy, Inc. | | | 960,806 | | |
| | 52,300 | | | | | Occidental Petroleum Corp. | | | 3,027,124 | | |
| | 1,800 | | | @,L | | Petroleum
Development Corp. | | | 85,464 | | |
| | 5,800 | | | L | | Pogo Producing Co. | | | 294,582 | | |
| | 13,000 | | | @ | | Pride International, Inc. | | | 486,980 | | |
| | 1,700 | | | @ | | Southwestern Energy Co. | | | 75,650 | | |
| | 3,700 | | | | | St. Mary Land &
Exploration Co. | | | 135,494 | | |
| | 1,600 | | | @ | | Swift Energy Co. | | | 68,416 | | |
| | 2,900 | | | @ | | Unit Corp. | | | 182,439 | | |
| | 76,500 | | | | | Valero Energy Corp. | | | 5,650,290 | | |
| | | | 78,105,551 | | |
| | | | | Oil & Gas Services: 0.5% | |
| | 1,200 | | | @,L | | Cameron International Corp. | | | 85,764 | | |
| | 1,600 | | | @,L | | Dril-Quip, Inc. | | | 71,920 | | |
| | 7,400 | | | @,L | | Grant Prideco, Inc. | | | 398,342 | | |
| | 105,520 | | | | | Halliburton Co. | | | 3,640,440 | | |
| | 4,900 | | | @,L | | Hanover Compressor Co. | | | 116,865 | | |
| | 5,100 | | | @,L | | Helix Energy
Solutions Group, Inc. | | | 203,541 | | |
| | 2,150 | | | @ | | Hornbeck Offshore
Services, Inc. | | | 83,334 | | |
| | 2,100 | | | | | Lufkin Industries, Inc. | | | 135,555 | | |
| | 500 | | | @ | | Oceaneering
International, Inc. | | | 26,320 | | |
| | 3,800 | | | @ | | SEACOR Holdings, Inc. | | | 354,768 | | |
| | 2,600 | | | @ | | W-H Energy Services, Inc. | | | 160,966 | | |
| | | | 5,277,815 | | |
| | | | | Packaging & Containers: 0.2% | |
| | 54,500 | | | @ | | Pactiv Corp. | | | 1,738,005 | | |
| | 13,900 | | | | | Sonoco Products Co. | | | 595,059 | | |
| | | | 2,333,064 | | |
See Accompanying Notes to Financial Statements
56
PORTFOLIO OF INVESTMENTS
ING VP BALANCED PORTFOLIO AS OF JUNE 30, 2007 (UNAUDITED) (CONTINUED)
| Shares | | | | | | Value | |
| | | | | Pharmaceuticals: 3.1% | |
| | 1,000 | | | | | Alpharma, Inc. | | $ | 26,010 | | |
| | 64,700 | | | | | AmerisourceBergen Corp. | | | 3,200,709 | | |
| | 1,400 | | | @,L | | Bradley Pharmaceuticals, Inc. | | | 30,394 | | |
| | 38,000 | | | | | Bristol-Myers Squibb Co. | | | 1,199,280 | | |
| | 4,100 | | | @,L | | Cephalon, Inc. | | | 329,599 | | |
| | 7,400 | | | @ | | Endo Pharmaceuticals
Holdings, Inc. | | | 253,302 | | |
| | 97,200 | | | @ | | Forest Laboratories, Inc. | | | 4,437,180 | | |
| | 1,700 | | | @,L | | HealthExtras, Inc. | | | 50,286 | | |
| | 99,800 | | | @,L | | King Pharmaceuticals, Inc. | | | 2,041,908 | | |
| | 6,400 | | | | | Medicis Pharmaceutical Corp. | | | 195,456 | | |
| | 63,200 | | | | | Merck & Co., Inc. | | | 3,147,360 | | |
| | 2,800 | | | @,L | | MGI Pharma, Inc. | | | 62,636 | | |
| | 85,600 | | | | | Mylan Laboratories | | | 1,557,064 | | |
| | 5,300 | | | @ | | NBTY, Inc. | | | 228,960 | | |
| | 6,400 | | | @,L | | Noven Pharmaceuticals, Inc. | | | 150,080 | | |
| | 1,100 | | | | | Omnicare, Inc. | | | 39,666 | | |
| | 398,190 | | | | | Pfizer, Inc. | | | 10,181,718 | | |
| | 200,200 | | | | | Schering-Plough Corp. | | | 6,094,088 | | |
| | 2,500 | | | @,L | | Sciele Pharma, Inc. | | | 58,900 | | |
| | 6,200 | | | @,L | | Sepracor, Inc. | | | 254,324 | | |
| | 4,700 | | | @ | | Theragenics Corp. | | | 19,599 | | |
| | 2,400 | | | @,L | | USANA Health Sciences, Inc. | | | 107,376 | | |
| | 3,900 | | | @,L | | VCA Antech, Inc. | | | 146,991 | | |
| | 5,400 | | | @ | | Viropharma, Inc. | | | 74,520 | | |
| | 24,200 | | | @ | | Watson Pharmaceuticals, Inc. | | | 787,226 | | |
| | | | 34,674,632 | | |
| | | | | Pipelines: 0.1% | |
| | 14,600 | | | | | Oneok, Inc. | | | 735,986 | | |
| | | | 735,986 | | |
| | | | | Real Estate Investment Trusts: 0.2% | |
| | 11,140 | | | | | Archstone-Smith Trust | | | 658,485 | | |
| | 400 | | | | | EastGroup Properties, Inc. | | | 17,528 | | |
| | 1,280 | | | | | Essex Property Trust, Inc. | | | 148,864 | | |
| | 15,800 | | | L | | Hospitality Properties Trust | | | 655,542 | | |
| | 9,700 | | | | | Liberty Property Trust | | | 426,121 | | |
| | 3,500 | | | | | LTC Properties, Inc. | | | 79,625 | | |
| | 900 | | | | | PS Business Parks, Inc. | | | 57,033 | | |
| | | | 2,043,198 | | |
| | | | | Retail: 2.7% | |
| | 2,200 | | | @ | | 99 Cents Only Stores | | | 28,842 | | |
| | 11,600 | | | @,L | | Aeropostale, Inc. | | | 483,488 | | |
| | 18,455 | | | | | American Eagle Outfitters | | | 473,555 | | |
| | 2,200 | | | @ | | AnnTaylor Stores Corp. | | | 77,924 | | |
| | 12,700 | | | @ | | Autozone, Inc. | | | 1,735,074 | | |
| | 800 | | | | | Barnes & Noble, Inc. | | | 30,776 | | |
| | 1,300 | | | | | Big 5 Sporting Goods Corp. | | | 33,150 | | |
| | 51,100 | | | @,L | | Big Lots, Inc. | | | 1,503,362 | | |
| | 2,625 | | | | | Brown Shoe Co., Inc. | | | 63,840 | | |
| | 1,300 | | | L | | Casey's General Stores, Inc. | | | 35,438 | | |
| | 2,300 | | | | | Cash America International, Inc. | | | 91,195 | | |
| | 2,900 | | | | | Cato Corp. | | | 63,626 | | |
| | 700 | | | | | CBRL Group, Inc. | | | 29,736 | | |
| | 4,600 | | | @,L | | CEC Entertainment, Inc. | | | 161,920 | | |
| | 1,200 | | | @ | | Charlotte Russe Holding, Inc. | | | 32,244 | | |
| | 78,100 | | | | | Costco Wholesale Corp. | | | 4,570,412 | | |
| | 500 | | | @,L | | Dick's Sporting Goods, Inc. | | | 29,085 | | |
| | 15,900 | | | | | Dollar General Corp. | | | 348,528 | | |
| | 8,100 | | | @ | | Dollar Tree Stores, Inc. | | | 352,755 | | |
| | 8,100 | | | @,L | | Dress Barn, Inc. | | | 166,212 | | |
| | 62,200 | | | | | Family Dollar Stores, Inc. | | | 2,134,704 | | |
| Shares | | | | | | Value | |
| | 9,500 | | | @ | | GameStop Corp. | | $ | 371,450 | | |
| | 1,300 | | | @,L | | Genesco, Inc. | | | 68,003 | | |
| | 1,660 | | | @ | | Guitar Center, Inc. | | | 99,285 | | |
| | 1,800 | | | @ | | Hibbett Sporting Goods, Inc. | | | 49,284 | | |
| | 6,700 | | | @ | | HOT Topic, Inc. | | | 72,829 | | |
| | 1,300 | | | L | | IHOP Corp. | | | 70,759 | | |
| | 2,400 | | | @ | | Insight Enterprises, Inc. | | | 54,168 | | |
| | 3,400 | | | @ | | Jack in the Box, Inc. | | | 241,196 | | |
| | 59,800 | | | | | JC Penney Co., Inc. | | | 4,328,324 | | |
| | 3,200 | | | @,L | | Jo-Ann Stores, Inc. | | | 90,976 | | |
| | 3,600 | | | @,L | | JOS A Bank Clothiers, Inc. | | | 149,292 | | |
| | 11,600 | | | @ | | Kohl's Corp. | | | 823,948 | | |
| | 31,200 | | | | | Macy's, Inc. | | | 1,241,136 | | |
| | 88,200 | | | | | McDonald's Corp. | | | 4,477,032 | | |
| | 3,500 | | | | | Men's Wearhouse, Inc. | | | 178,745 | | |
| | 1,250 | | | | | Movado Group, Inc. | | | 42,175 | | |
| | 30,400 | | | L | | Nordstrom, Inc. | | | 1,554,048 | | |
| | 680 | | | @,L | | Panera Bread Co. | | | 31,321 | | |
| | 1,400 | | | @ | | Papa John's International, Inc. | | | 40,264 | | |
| | 8,375 | | | @ | | Payless Shoesource, Inc. | | | 264,231 | | |
| | 4,700 | | | | | Pep Boys-Manny, Moe & Jack | | | 94,752 | | |
| | 4,300 | | | | | Petsmart, Inc. | | | 139,535 | | |
| | 2,500 | | | @,L | | PF Chang's China Bistro, Inc. | | | 88,000 | | |
| | 32,300 | | | L | | RadioShack Corp. | | | 1,070,422 | | |
| | 2,700 | | | @,L | | Rare Hospitality
International, Inc. | | | 72,279 | | |
| | 6,400 | | | L | | Regis Corp. | | | 244,800 | | |
| | 19,100 | | | | | Ross Stores, Inc. | | | 588,280 | | |
| | 1,300 | | | @,L | | School Specialty, Inc. | | | 46,072 | | |
| | 9,107 | | | @,L | | Select Comfort Corp. | | | 147,716 | | |
| | 8,660 | | | @,L | | Sonic Corp. | | | 191,559 | | |
| | 2,400 | | | @ | | Texas Roadhouse, Inc. | | | 30,696 | | |
| | 29,400 | | | | | TJX Cos., Inc. | | | 808,500 | | |
| | 300 | | | @,L | | Tractor Supply Co. | | | 15,615 | | |
| | 10,700 | | | | | Triarc Cos. | | | 167,990 | | |
| | 1,910 | | | @,L | | Tween Brands, Inc. | | | 85,186 | | |
| | 400 | | | | | World Fuel Services Corp. | | | 16,824 | | |
| | | | 30,502,558 | | |
| | | | | Savings & Loans: 0.5% | |
| | 8,498 | | | | | Bankunited Financial Corp. | | | 170,555 | | |
| | 6,800 | | | | | First Niagara
Financial Group, Inc. | | | 89,080 | | |
| | 4,600 | | | @,L | | FirstFed Financial Corp. | | | 260,958 | | |
| | 1,600 | | | | | MAF Bancorp., Inc. | | | 86,816 | | |
| | 2,800 | | | | | Washington Federal, Inc. | | | 68,068 | | |
| | 113,400 | | | L | | Washington Mutual, Inc. | | | 4,835,376 | | |
| | | | 5,510,853 | | |
| | | | | Semiconductors: 0.7% | |
| | 7,200 | | | @,L | | Actel Corp. | | | 100,152 | | |
| | 3,700 | | | @ | | AMIS Holdings, Inc. | | | 46,324 | | |
| | 31,500 | | | @,L | | Atmel Corp. | | | 175,140 | | |
| | 12,000 | | | @ | | Brooks Automation, Inc. | | | 217,800 | | |
| | 1,200 | | | | | Cohu, Inc. | | | 26,700 | | |
| | 4,600 | | | @,L | | DSP Group, Inc. | | | 94,162 | | |
| | 4,400 | | | @ | | Exar Corp. | | | 58,960 | | |
| | 12,800 | | | @ | | Integrated Device
Technology, Inc. | | | 195,456 | | |
| | 3,400 | | | @,L | | International Rectifier Corp. | | | 126,684 | | |
| | 35,000 | | | L | | KLA-Tencor Corp. | | | 1,923,250 | | |
| | 12,200 | | | @,L | | Kulicke & Soffa
Industries, Inc. | | | 127,734 | | |
| | 8,300 | | | @ | | Lam Research Corp. | | | 426,620 | | |
| | 2,800 | | | | | Micrel, Inc. | | | 35,616 | | |
See Accompanying Notes to Financial Statements
57
PORTFOLIO OF INVESTMENTS
ING VP BALANCED PORTFOLIO AS OF JUNE 30, 2007 (UNAUDITED) (CONTINUED)
| Shares | | | | | | Value | |
| | | | | Semiconductors (continued) | |
| | 4,010 | | | L | | Microchip Technology, Inc. | | $ | 148,530 | | |
| | 600 | | | @,L | | MKS Instruments, Inc. | | | 16,620 | | |
| | 25,000 | | | | | National Semiconductor
Corp. | | | 706,750 | | |
| | 58,500 | | | @,L | | Novellus Systems, Inc. | | | 1,659,645 | | |
| | 4,200 | | | @ | | Pericom Semiconductor
Corp. | | | 46,872 | | |
| | 4,100 | | | @ | | Photronics, Inc. | | | 61,008 | | |
| | 13,900 | | | @,L | | Semtech Corp. | | | 240,887 | | |
| | 21,600 | | | @,L | | Skyworks Solutions, Inc. | | | 158,760 | | |
| | 1,300 | | | @,L | | Standard Microsystems Corp. | | | 44,642 | | |
| | 71,700 | | | @,L | | Teradyne, Inc. | | | 1,260,486 | | |
| | 1,205 | | | @,L | | Varian Semiconductor
Equipment Associates, Inc. | | | 48,272 | | |
| | | | 7,947,070 | | |
| | | | | Software: 1.6% | |
| | 3,300 | | | | | Acxiom Corp. | | | 87,285 | | |
| | 800 | | | @,L | | Advent Software, Inc. | | | 26,040 | | |
| | 700 | | | @,L | | Allscripts Healthcare
Solutions, Inc. | | | 17,836 | | |
| | 1,800 | | | @,L | | Ansys, Inc. | | | 47,700 | | |
| | 53,300 | | | @ | | Autodesk, Inc. | | | 2,509,364 | | |
| | 83,800 | | | @ | | BMC Software, Inc. | | | 2,539,140 | | |
| | 6,400 | | | | | BroADRidge Financial
Solutions ADR | | | 122,368 | | |
| | 168,800 | | | L | | CA, Inc. | | | 4,360,104 | | |
| | 6,900 | | | @ | | Captaris, Inc. | | | 35,328 | | |
| | 2,800 | | | @,L | | Cerner Corp. | | | 155,316 | | |
| | 14,400 | | | @,L | | Citrix Systems, Inc. | | | 484,848 | | |
| | 9,900 | | | @ | | CSG Systems International | | | 262,449 | | |
| | 2,200 | | | @ | | Digi International, Inc. | | | 32,428 | | |
| | 529 | | | | | Dun & Bradstreet Corp. | | | 54,476 | | |
| | 2,200 | | | | | Fair Isaac Corp. | | | 88,264 | | |
| | 33,400 | | | | | First Data Corp. | | | 1,091,178 | | |
| | 5,600 | | | @,L | | Informatica Corp. | | | 82,712 | | |
| | 1,200 | | | L | | Inter-Tel, Inc. | | | 28,716 | | |
| | 58,100 | | | @,L | | Intuit, Inc. | | | 1,747,648 | | |
| | 1,800 | | | @ | | JDA Software Group, Inc. | | | 35,334 | | |
| | 3,000 | | | @ | | Mantech International Corp. | | | 92,490 | | |
| | 95,975 | | | | | Microsoft Corp. | | | 2,828,383 | | |
| | 67,500 | | | @ | | Novell, Inc. | | | 525,825 | | |
| | 6,200 | | | @,L | | Progress Software Corp. | | | 197,098 | | |
| | 1,800 | | | @ | | SPSS, Inc. | | | 79,452 | | |
| | 19,500 | | | @ | | Sybase, Inc. | | | 465,855 | | |
| | 4,600 | | | @ | | Wind River Systems, Inc. | | | 50,600 | | |
| | | | 18,048,237 | | |
| | | | | Telecommunications: 3.3% | |
| | 44,100 | | | @ | | 3Com Corp. | | | 182,133 | | |
| | 21,500 | | | @ | | Adaptec, Inc. | | | 81,915 | | |
| | 4,100 | | | @,L | | Aeroflex, Inc. | | | 58,097 | | |
| | 16,900 | | | | | Alltel Corp. | | | 1,141,595 | | |
| | 13,600 | | | @ | | Andrew Corp. | | | 196,384 | | |
| | 8,700 | | | @ | | Arris Group, Inc. | | | 153,033 | | |
| | 246,937 | | | | | AT&T, Inc. | | | 10,247,886 | | |
| | 21,800 | | | @ | | Avaya, Inc. | | | 367,112 | | |
| | 1,000 | | | | | Black Box Corp. | | | 41,380 | | |
| | 9,400 | | | @ | | C-COR, Inc. | | | 132,164 | | |
| | 40,800 | | | | | CenturyTel, Inc. | | | 2,001,240 | | |
| | 42,100 | | | @ | | Cincinnati Bell, Inc. | | | 243,338 | | |
| | 443,960 | | | @ | | Cisco Systems, Inc. | | | 12,364,286 | | |
| | 2,600 | | | @,L | | CommScope, Inc. | | | 151,710 | | |
| | 1,800 | | | @ | | Comtech
Telecommunications | | | 83,556 | | |
| Shares | | | | | | Value | |
| | 1,200 | | | | | CT Communications, Inc. | | $ | 36,612 | | |
| | 6,800 | | | @,L | | Ditech Networks, Inc. | | | 55,692 | | |
| | 1,400 | | | @ | | General Communication, Inc. | | | 17,934 | | |
| | 2,300 | | | @ | | Harmonic, Inc. | | | 20,401 | | |
| | 10,283 | | | L | | Harris Corp. | | | 560,938 | | |
| | 111,950 | | | | | Motorola, Inc. | | | 1,981,515 | | |
| | 2,500 | | | @ | | Network Equipment
Technologies, Inc. | | | 23,850 | | |
| | 1,400 | | | @ | | Novatel Wireless, Inc. | | | 36,428 | | |
| | 2,100 | | | @,L | | Polycom, Inc. | | | 70,560 | | |
| | 21,400 | | | | | Qualcomm, Inc. | | | 928,546 | | |
| | 61,200 | | | @,L | | Qwest Communications
International, Inc. | | | 593,640 | | |
| | 30,000 | | | @ | | RF Micro Devices, Inc. | | | 187,200 | | |
| | 58,600 | | | | | Sprint Nextel Corp. | | | 1,213,606 | | |
| | 6,100 | | | @,L | | Symmetricom, Inc. | | | 51,240 | | |
| | 10,275 | | | | | Telephone & Data
Systems, Inc. | | | 642,907 | | |
| | 1,900 | | | @ | | Tollgrade Communications,
Inc. | | | 20,045 | | |
| | 14,800 | | | @,L | | Utstarcom, Inc. | | | 83,028 | | |
| | 97,400 | | | | | Verizon Communications,
Inc. | | | 4,009,958 | | |
| | 500 | | | @ | | Viasat, Inc. | | | 16,050 | | |
| | | | 37,995,979 | | |
| | | | | Textiles: 0.1% | |
| | 800 | | | | | Angelica Corp. | | | 16,864 | | |
| | 900 | | | | | G&K Services, Inc. | | | 35,559 | | |
| | 6,500 | | | @,L | | Mohawk Industries, Inc. | | | 655,135 | | |
| | 600 | | | | | Unifirst Corp. | | | 26,430 | | |
| | | | 733,988 | | |
| | | | | Toys/Games/Hobbies: 0.4% | |
| | 2,000 | | | @,L | | Jakks Pacific, Inc. | | | 56,280 | | |
| | 161,300 | | | | | Mattel, Inc. | | | 4,079,277 | | |
| | | | 4,135,557 | | |
| | | | | Transportation: 0.2% | |
| | 9,000 | | | | | Con-way, Inc. | | | 452,160 | | |
| | 1,900 | | | @ | | EGL, Inc. | | | 88,312 | | |
| | 4,400 | | | L | | Expeditors International
Washington, Inc. | | | 181,720 | | |
| | 6,100 | | | L | | Heartland Express, Inc. | | | 99,430 | | |
| | 6,500 | | | @,L | | HUB Group, Inc. | | | 228,540 | | |
| | 1,300 | | | @,L | | Kansas City Southern | | | 48,802 | | |
| | 4,500 | | | | | Landstar System, Inc. | | | 217,125 | | |
| | 4,200 | | | @,L | | Old Dominion Freight Line | | | 126,630 | | |
| | 5,805 | | | L | | Overseas Shipholding Group | | | 472,527 | | |
| | 9,300 | | | L | | Tidewater, Inc. | | | 659,184 | | |
| | 3,600 | | | @,L | | YRC Worldwide, Inc. | | | 132,480 | | |
| | | | 2,706,910 | | |
| | | Total Common Stock
(Cost $650,566,234) | | | 701,733,915 | | |
| PREFERRED STOCK: 0.5% | | | |
| | | | | Banks: 0.1% | |
| | 35,875 | | | @@,#,P | | Santander Finance
Preferred SA Unipersonal | | | 859,881 | | |
| | | | 859,881 | | |
| | | | | Diversified Financial Services: 0.1% | |
| | 24,000 | | | P | | Deutsche Bank
Capital Trust II | | | 589,200 | | |
See Accompanying Notes to Financial Statements
58
PORTFOLIO OF INVESTMENTS
ING VP BALANCED PORTFOLIO AS OF JUNE 30, 2007 (UNAUDITED) (CONTINUED)
| Shares | | | | | | Value | |
| | | | | Diversified Financial Services (continued) | |
| | 46,500 | | | P,L | | Merrill Lynch & Co., Inc. | | $ | 1,181,100 | | |
| | | | 1,770,300 | | |
| | | | | Insurance: 0.3% | |
| | 48,903 | | | @@,P | | Aegon NV | | | 1,191,277 | | |
| | 19,271 | | | @@,P | | Aegon NV-Series 1 | | | 489,098 | | |
| | 51,650 | | | P | | Metlife, Inc. | | | 1,321,724 | | |
| | | | 3,002,099 | | |
| | | Total Preferred Stock
(Cost $5,667,670) | | | 5,632,280 | | |
Principal
Amount | | | | | | Value | |
| CORPORATE BONDS/NOTES: 8.1% | | | |
| | | | | Airlines: 0.2% | |
| $ | 1,752,000 | | | C | | Delta Airlines, Inc.,
7.570%, due 11/18/10 | | | 1,819,163 | | |
| | 756,000 | | | Z | | United AirLines, Inc.,
6.932%, due 09/01/11 | | | 877,433 | | |
| | | | 2,696,596 | | |
| | | | | Auto Manufacturers: 0.1% | |
| | 235,000 | | | Z | | Ford Motor Co., Discount
Note, due 11/29/13 | | | 236,235 | | |
| | 732,000 | | | | | Ford Motor Co., 8.360%,
due 11/29/13 | | | 735,847 | | |
| | | | 972,082 | | |
| | | | | Banks: 2.1% | |
| | 1,040,000 | | | @@,C | | Australia & New Zealand
Banking Group Ltd.,
5.494%, due 12/31/49 | | | 905,591 | | |
| | 330,724 | | | @@,# | | Banco Itau SA, 5.621%,
due 09/20/08 | | | 330,724 | | |
| | 1,081,000 | | | @@,#,C | | Banco Mercantil del Norte
SA, 6.135%, due 10/13/16 | | | 1,084,878 | | |
| | 400,000 | | | @@,C | | Bank of Ireland, 5.625%,
due 12/29/49 | | | 348,368 | | |
| | 430,000 | | | @@,C | | Bank of Nova Scotia,
5.500%, due 08/21/85 | | | 355,931 | | |
| | 210,000 | | | @@ | | Bank of Scotland, 5.563%,
due 11/30/49 | | | 181,368 | | |
| | 77,000 | | | C | | BankAmerica Capital II,
8.000%, due 12/15/26 | | | 80,056 | | |
| | 240,000 | | | @@,C | | Barclays Bank PLC, 5.563%,
due 12/31/49 | | | 209,997 | | |
| | 710,000 | | | @@,C | | BNP Paribas, 5.402%,
due 09/29/49 | | | 609,086 | | |
| | 1,267,000 | | | @@,#,C | | Chuo Mitsui Trust &
Banking Co., Ltd.,
5.506%, due 04/15/49 | | | 1,197,766 | | |
| | 377,000 | | | @@,#,C | | Danske Bank A/S, 5.914%,
due 12/29/49 | | | 373,849 | | |
| | 500,000 | | | @@,C | | Den Norske Bank ASA,
5.500%, due 08/29/49 | | | 427,500 | | |
| | 80,000 | | | @@,C | | Den Norske Bank ASA,
5.625%, due 11/29/49 | | | 69,260 | | |
| | 723,000 | | | #,C | | Dresdner Funding Trust I,
8.151%, due 06/30/31 | | | 835,086 | | |
| | 1,000 | | | C | | Fleet Capital Trust II,
7.920%, due 12/11/26 | | | 1,039 | | |
Principal
Amount | | | | | | Value | |
| $ | 1,290,000 | | | @@,#,C | | HBOS PLC, 5.375%,
due 11/29/49 | | $ | 1,250,788 | | |
| | 270,000 | | | @@,C | | Hongkong & Shanghai
Banking Corp., Ltd.,
5.500%, due 07/29/49 | | | 229,751 | | |
| | 1,120,000 | | | @@,C | | HSBC Bank PLC, 5.538%,
due 06/29/49 | | | 960,400 | | |
| | 1,140,000 | | | @@,C | | HSBC Bank PLC, 5.625%,
due 06/29/49 | | | 987,240 | | |
| | 1,030,000 | | | @@,C | | Lloyds TSB Bank PLC,
5.478%, due 08/29/49 | | | 889,424 | | |
| | 100,000 | | | @@,C | | Lloyds TSB Bank PLC,
5.563%, due 11/29/49 | | | 87,032 | | |
| | 390,000 | | | @@,C | | Lloyds TSB Bank PLC,
5.625%, due 06/29/49 | | | 343,233 | | |
| | 805,000 | | | @@,C | | Mizuho Financial Group
Cayman Ltd., 8.375%,
due 12/31/49 | | | 840,847 | | |
| | 370,000 | | | @@,C | | National Australia Bank
Ltd., 5.525%, due 12/31/49 | | | 321,255 | | |
| | 130,000 | | | @@,C | | National Westminster Bank
PLC, 5.500%, due 11/29/49 | | | 112,044 | | |
| | 60,000 | | | @@,C | | National Westminster
Bank PLC, 5.625%,
due 08/29/49 | | | 51,871 | | |
| | 640,000 | | | #,C | | Rabobank Capital Funding
II, 5.260%, due 12/29/49 | | | 614,586 | | |
| | 612,000 | | | #,C | | Rabobank Capital Funding
Trust, 5.254%,
due 12/31/49 | | | 574,052 | | |
| | 538,000 | | | C | | RBS Capital Trust I, 5.512%,
due 09/30/49 | | | 517,835 | | |
| | 962,000 | | | @@,#,C | | Resona Bank Ltd., 5.850%,
due 09/29/49 | | | 921,336 | | |
| | 1,540,000 | | | @@,C | | Royal Bank of Scotland
Group PLC, 5.563%,
due 12/29/49 | | | 1,321,837 | | |
| | 370,000 | | | @@,C | | Societe Generale, 5.469%,
due 11/29/49 | | | 319,887 | | |
| | 1,400,000 | | | @@,C | | Standard Chartered PLC,
5.563%, due 07/29/49 | | | 1,165,850 | | |
| | 230,000 | | | @@,C,L | | Standard Chartered PLC,
5.588%, due 01/29/49 | | | 191,331 | | |
| | 1,800,000 | | | @@,C,L | | Standard Chartered PLC,
5.625%, due 11/29/49 | | | 1,516,500 | | |
| | 898,000 | | | @@,C | | Sumitomo Mitsui Banking
Corp., 8.150%,
due 08/01/49 | | | 922,101 | | |
| | 712,000 | | | C | | Wachovia Capital Trust III,
5.800%, due 12/31/49 | | | 709,480 | | |
| | 450,000 | | | @@,C | | Westpac Banking Corp.,
5.494%, due 09/30/49 | | | 385,248 | | |
| | 372,000 | | | #,C | | Westpac Capital Trust IV,
5.256%, due 12/29/49 | | | 345,813 | | |
| | 1,232,000 | | | @@,#,C | | Woori Bank, 6.125%,
due 05/03/16 | | | 1,238,951 | | |
| | | | 23,829,191 | | |
| | | | | Chemicals: 0.2% | |
| | 260,000 | | | Z | | Stauffer Chemical,
5.830%, due 04/15/10 | | | 221,980 | | |
| | 450,000 | | | Z | | Stauffer Chemical, 6.220%,
due 04/15/18 | | | 234,522 | | |
| | 570,000 | | | Z | | Stauffer Chemical, 8.100%,
due 04/15/17 | | | 315,877 | | |
| | 1,051,000 | | | | | Union Carbide Corp.,
7.750%, due 10/01/96 | | | 1,072,155 | | |
| | | | 1,844,534 | | |
See Accompanying Notes to Financial Statements
59
PORTFOLIO OF INVESTMENTS
ING VP BALANCED PORTFOLIO AS OF JUNE 30, 2007 (UNAUDITED) (CONTINUED)
Principal
Amount | | | | | | Value | |
| | | | | Diversified Financial Services: 2.4% | |
| $ | 2,095,000 | | | @@,#,C,L | | Aiful Corp., 4.450%,
due 02/16/10 | | $ | 2,024,342 | | |
| | 218,000 | | | @@,#,I | | Alpine III, 5.910%,
due 08/16/14 | | | 218,637 | | |
| | 218,000 | | | @@,#,I | | Alpine III, 6.310%,
due 08/16/14 | | | 218,720 | | |
| | 328,000 | | | @@,#,I | | Alpine III, 8.110%,
due 08/16/14 | | | 330,137 | | |
| | 560,000 | | | @@,#,I | | Alpine III, 11.360%,
due 08/16/14 | | | 573,782 | | |
| | 2,520,000 | | | # | | Astoria Depositor Corp.,
8.144%, due 05/01/21 | | | 2,723,175 | | |
| | 1,131,000 | | | #,C | | Corestates Capital Trust I,
8.000%, due 12/15/26 | | | 1,171,437 | | |
| | 762,000 | | | @@ | | Eksportfinans A/S, 5.125%,
due 10/26/11 | | | 757,007 | | |
| | 420,000 | | | @@,C | | Financiere CSFB NV,
5.500%, due 03/29/49 | | | 361,200 | | |
| | 1,180,000 | | | | | Ford Motor Credit Co.,
8.000%, due 12/15/16 | | | 1,132,088 | | |
| | 492,000 | | | | | Ford Motor Credit Co.,
8.105%, due 01/13/12 | | | 491,213 | | |
| | 1,007,000 | | | | | Ford Motor Credit Co.,
9.806%, due 04/15/12 | | | 1,080,247 | | |
| | 825,000 | | | C | | Fund American Cos., Inc.,
5.875%, due 05/15/13 | | | 812,260 | | |
| | 1,227,000 | | | | | General Motors Acceptance
Corp., 7.250%,
due 03/02/11 | | | 1,223,945 | | |
| | 562,000 | | | #,C | | HVB Funding Trust III,
9.000%, due 10/22/31 | | | 700,663 | | |
| | 1,412,000 | | | #,C | | Mangrove Bay
Pass-Through Trust,
6.102%, due 07/15/33 | | | 1,370,275 | | |
| | 1,131,000 | | | @@,# | | Mantis Reef Ltd., 4.799%,
due 11/03/09 | | | 1,109,760 | | |
| | 804,000 | | | @@,C | | MUFG Capital Finance 1 Ltd.,
6.346%, due 12/31/49 | | | 791,331 | | |
| | 485,000 | | | @@,C | | Paribas, 5.500%,
due 12/31/49 | | | 423,515 | | |
| | 231,333 | | | @@,#,C | | Petroleum Export Ltd.,
4.623%, due 06/15/10 | | | 228,511 | | |
| | 388,141 | | | @@,#,C | | Petroleum Export Ltd.,
5.265%, due 06/15/11 | | | 377,223 | | |
| | 1,074,188 | | | @@,#,C | | PF Export Receivables
Master Trust, 6.436%,
due 06/01/15 | | | 1,111,113 | | |
| | 1,448,295 | | | #,C | | Piper Jaffray Equipment
Trust Securities, 6.000%,
due 09/10/11 | | | 1,412,088 | | |
| | 1,290,442 | | | #,C | | Piper Jaffray Equipment
Trust Securities, 6.750%,
due 04/01/11 | | | 1,280,764 | | |
| | 102,264 | | | # | | Power Receivable Finance,
LLC, 6.290%, due 01/01/12 | | | 103,434 | | |
| | 1,341,000 | | | C | | Southern Star Central Corp.,
6.750%, due 03/01/16 | | | 1,327,590 | | |
| | 1,122,000 | | | @@,# | | TNK-BP Finance SA, 7.500%,
due 07/18/16 | | | 1,159,587 | | |
| | 5,212,395 | | | #,Z | | Toll Road Investors
Partnership II LP, 17.680%,
due 02/15/45 | | | 672,686 | | |
| | 430,000 | | | #,C | | Twin Reefs Pass-Through
Trust, 6.320%, due 12/10/49 | | | 431,382 | | |
Principal
Amount | | | | | | Value | |
| $ | 848,000 | | | @@,C | | UFJ Finance Aruba AEC,
8.750%, due 12/31/49 | | $ | 882,085 | | |
| | 446,000 | | | #,C | | Wachovia Capital Trust
V, 7.965%, due 06/01/27 | | | 464,366 | | |
| | | | 26,964,563 | | |
| | | | | Electric: 0.6% | |
| | 1,721,000 | | | C | | Commonwealth Edison Co.,
6.950%, due 07/15/18 | | | 1,706,607 | | |
| | 224,000 | | | @@,L | | Empresa Nacional de
Electricidad SA, 8.625%,
due 08/01/15 | | | 257,921 | | |
| | 584,766 | | | #,C | | Juniper Generation, LLC,
6.790%, due 12/31/14 | | | 577,079 | | |
| | 1,040,000 | | | C | | Nevada Power Co.,
5.950%, due 03/15/16 | | | 1,022,019 | | |
| | 417,000 | | | C | | Nevada Power Co.,
6.750%, due 07/01/37 | | | 417,550 | | |
| | 1,214,000 | | | C | | NorthWestern Corp.,
5.875%, due 11/01/14 | | | 1,179,828 | | |
| | 171,000 | | | C | | Reliant Energy, Inc.,
7.625%, due 06/15/14 | | | 167,580 | | |
| | 85,000 | | | C,L | | Reliant Energy, Inc.,
7.875%, due 06/15/17 | | | 83,088 | | |
| | 1,113,000 | | | C | | Sierra Pacific Power Co.,
6.250%, due 04/15/12 | | | 1,127,555 | | |
| | | | 6,539,227 | | |
| | | | | Energy-Alternate Sources: 0.2% | |
| | 600,000 | | | | | Greater Ohio Ethanol,
LLC, 8.864%, due 12/31/13 | | | 594,750 | | |
| | 700,000 | | | | | Greater Ohio Ethanol,
LLC, 12.630%, due 12/31/13 | | | 679,000 | | |
| | 319,000 | | | # | | White Pine Hydro Portfolio,
LLC, 6.960%, due 07/10/37 | | | 310,809 | | |
| | 479,000 | | | # | | White Pine Hydro Portfolio,
LLC, 7.260%, due 07/20/15 | | | 471,663 | | |
| | 467,000 | | | # | | White Pine Hydro, LLC,
6.310%, due 07/10/17 | | | 458,265 | | |
| | | | 2,514,487 | | |
| | | | | Food: 0.3% | |
| | 3,460,000 | | | C | | HJ Heinz Finance Co.,
6.625%, due 07/15/11 | | | 3,563,022 | | |
| | | | 3,563,022 | | |
| | | | | Gas: 0.3% | |
| | 993,000 | | | @@,#,C | | Nakilat, Inc.,
6.067%, due 12/31/33 | | | 933,455 | | |
| | 528,000 | | | @@,#,C,L | | Nakilat, Inc.,
6.267%, due 12/31/33 | | | 503,034 | | |
| | 2,447,000 | | | C,L | | Southern Union Co.,
7.200%, due 11/01/66 | | | 2,462,465 | | |
| | | | 3,898,954 | | |
| | | | | Insurance: 0.2% | |
| | 1,355,000 | | | @@,C | | Aegon NV, 5.362%,
due 12/31/49 | | | 1,189,521 | | |
| | 368,000 | | | #,C | | North Front Pass-Through
Trust, 5.810%, due 12/15/24 | | | 356,128 | | |
| | 838,000 | | | @@,C | | XL Capital, Ltd., 6.500%,
due 12/15/49 | | | 788,424 | | |
| | | | 2,334,073 | | |
See Accompanying Notes to Financial Statements
60
PORTFOLIO OF INVESTMENTS
ING VP BALANCED PORTFOLIO AS OF JUNE 30, 2007 (UNAUDITED) (CONTINUED)
Principal
Amount | | | | | | Value | |
| | | | | Media: 0.2% | |
| $ | 1,492,000 | | | #,C | | Charter Communications
Operating, LLC,
8.375%, due 04/30/14 | | $ | 1,525,570 | | |
| | 233,000 | | | C | | Dex Media West,
LLC, 9.875%, due 08/15/13 | | | 250,475 | | |
| | | | 1,776,045 | | |
| | | | | Multi-National: 0.0% | |
| | 669,000 | | | @@ | | Corp. Andina de Fomento
CAF, 5.125%, due 05/05/15 | | | 636,392 | | |
| | | | 636,392 | | |
| | | | | Oil & Gas: 0.3% | |
| | 459,000 | | | @@,# | | Empresa Nacional de
Petroleo ENAP,
4.875%, due 03/15/14 | | | 430,592 | | |
| | 331,000 | | | @@,# | | Empresa Nacional de
Petroleo ENAP,
6.750%, due 11/15/12 | | | 345,204 | | |
| | 878,000 | | | C | | Pemex Project Funding
Master Trust,
6.625%, due 06/15/35 | | | 892,268 | | |
| | 1,003,000 | | | # | | Pemex Project Funding
Master Trust,
6.660%, due 06/15/10 | | | 1,031,586 | | |
| | 261,000 | | | @@,C | | Petroleos de Venezuela SA,
5.375%, due 04/12/27 | | | 172,260 | | |
| | 930,000 | | | @@,#,C | | Ras Laffan Liquefied Natural
Gas Co., Ltd. II, 5.298%,
due 09/30/20 | | | 871,018 | | |
| | | | 3,742,928 | | |
| | | | | Pipelines: 0.1% | |
| | 345,000 | | | C | | Northwest Pipeline Corp.,
7.000%, due 06/15/16 | | | 361,388 | | |
| | 460,000 | | | C | | Transcontinental Gas Pipe
Line Corp., 6.400%,
due 04/15/16 | | | 463,450 | | |
| | | | 824,838 | | |
| | | | | Real Estate Investment Trusts: 0.3% | |
| | 366,000 | | | C | | Istar Financial, Inc.,
5.150%, due 03/01/12 | | | 352,559 | | |
| | 111,000 | | | C | | Istar Financial, Inc.,
5.500%, due 06/15/12 | | | 109,190 | | |
| | 297,000 | | | C | | Istar Financial, Inc.,
5.850%, due 03/15/17 | | | 285,402 | | |
| | 162,000 | | | C | | Liberty Property LP,
6.375%, due 08/15/12 | | | 166,754 | | |
| | 532,000 | | | C | | Liberty Property LP,
7.750%, due 04/15/09 | | | 552,350 | | |
| | 134,000 | | | C | | Rouse Co., 7.200%,
due 09/15/12 | | | 138,198 | | |
| | 2,190,000 | | | #,C | | Rouse Co. LP/TRC Co.-Issuer,
Inc., 6.750%, due 05/01/13 | | | 2,199,005 | | |
| | | | 3,803,458 | | |
| | | | | Retail: 0.1% | |
| | 120,000 | | | #,C,L | | Rite Aid Corp., 9.375%,
due 12/15/15 | | | 115,800 | | |
| | 711,000 | | | #,C | | Rite Aid Corp., 9.500%,
due 06/15/17 | | | 686,115 | | |
| | | | 801,915 | | |
Principal
Amount | | | | | | Value | |
| | | | | Telecommunications: 0.5% | |
| $ | 1,263,000 | | | | | Bellsouth
Telecommunications, Inc.,
7.000%, due 12/01/95 | | $ | 1,252,527 | | |
| | 1,140,000 | | | C | | Qwest Corp.,
7.875%, due 09/01/11 | | | 1,194,150 | | |
| | 597,000 | | | @@,C | | Rogers Wireless, Inc.,
7.250%, due 12/15/12 | | | 631,055 | | |
| | 667,000 | | | C | | Sprint Capital Corp.,
6.875%, due 11/15/28 | | | 636,619 | | |
| | 614,000 | | | C | | Sprint Nextel Corp.,
6.000%, due 12/01/16 | | | 583,498 | | |
| | 1,058,000 | | | @@,C | | TELUS Corp., 8.000%,
due 06/01/11 | | | 1,132,320 | | |
| | | | 5,430,169 | | |
| | | Total Corporate Bonds/Notes
(Cost $93,122,841) | | | 92,172,474 | | |
| U.S. GOVERNMENT AGENCY OBLIGATIONS: 9.9% | | | |
| | | | | | | Federal Home Loan
Mortgage Corporation: 5.6% | | | | | |
| | 167,997 | | | C | | 4.500%, due 12/15/16 | | | 164,672 | | |
| | 2,072,000 | | | C,S | | 4.500%, due 02/15/20 | | | 1,888,676 | | |
| | 2,175,290 | | | C,S | | 5.000%, due 08/15/16 | | | 2,119,023 | | |
| | 1,441,000 | | | C | | 5.000%, due 12/15/17 | | | 1,404,159 | | |
| | 948,000 | | | C | | 5.000%, due 05/15/20 | | | 902,082 | | |
| | 2,034,198 | | | C,S | | 5.000%, due 08/15/21 | | | 2,002,591 | | |
| | 2,410,000 | | | C,S | | 5.000%, due 04/15/23 | | | 2,258,262 | | |
| | 897,000 | | | C | | 5.000%, due 09/15/31 | | | 850,263 | | |
| | 341,000 | | | C | | 5.000%, due 02/15/32 | | | 320,319 | | |
| | 1,937,000 | | | C | | 5.000%, due 03/15/32 | | | 1,810,601 | | |
| | 330,000 | | | C | | 5.000%, due 04/15/32 | | | 314,996 | | |
| | 14,542,000 | | | | | 5.000%, due 08/15/33 | | | 13,621,764 | | |
| | 355,556 | | | | | 5.018%, due 04/01/35 | | | 345,028 | | |
| | 1,934,000 | | | C | | 5.250%, due 03/15/12 | | | 1,917,708 | | |
| | 2,862,000 | | | Z | | 5.460%, due 03/15/31 | | | 798,567 | | |
| | 4,408,974 | | | C,S | | 5.500%, due 08/15/20 | | | 4,136,434 | | |
| | 571,000 | | | C | | 5.500%, due 12/15/20 | | | 554,912 | | |
| | 365,000 | | | C | | 5.500%, due 09/15/32 | | | 351,726 | | |
| | 342,000 | | | C | | 5.500%, due 10/15/32 | | | 332,220 | | |
| | 304,000 | | | C | | 5.500%, due 11/15/32 | | | 293,107 | | |
| | 362,000 | | | C | | 5.500%, due 07/15/33 | | | 352,143 | | |
| | 487,580 | | | | | 5.500%, due 06/01/36 | | | 467,590 | | |
| | 7,446,733 | | | C,S | | 6.000%, due 01/15/29 | | | 7,424,724 | | |
| | 12,588,000 | | | | | 6.000%, due 07/15/34 | | | 12,471,951 | | |
| | 2,375,000 | | | W | | 6.000%, due 08/15/34 | | | 2,350,880 | | |
| | 3,809,642 | | | C,S | | 6.470%, due 02/15/37 | | | 3,696,724 | | |
| | 313,221 | | | | | 6.500%, due 11/01/28 | | | 320,031 | | |
| | 61,280 | | | | | 6.500%, due 12/01/31 | | | 62,532 | | |
| | | | 63,533,685 | | |
| | | | | | | Federal National Mortgage
Corporation: 4.0% | | | | | |
| | 4,756,000 | | | Z | | Discount Note, due 04/01/49 | | | 4,398,558 | | |
| | 723,996 | | | | | 4.592%, due 08/01/35 | | | 706,810 | | |
| | 395,137 | | | C | | 4.750%, due 12/25/42 | | | 393,601 | | |
| | 1,942,051 | | | S | | 4.817%, due 08/01/35 | | | 1,896,936 | | |
| | 885,000 | | | L | | 4.875%, due 05/18/12 | | | 870,150 | | |
| | 1,288,000 | | | W | | 5.000%, due 07/18/21 | | | 1,244,731 | | |
| | 1,246,686 | | | | | 5.000%, due 02/25/29 | | | 1,218,670 | | |
| | 2,490,000 | | | W | | 5.000%, due 08/15/34 | | | 2,332,430 | | |
| | 1,532,495 | | | | | 5.000%, due 12/01/36 | | | 1,440,087 | | |
| | 1,000,000 | | | | | 5.000%, due 07/01/37 | | | 937,192 | | |
See Accompanying Notes to Financial Statements
61
PORTFOLIO OF INVESTMENTS
ING VP BALANCED PORTFOLIO AS OF JUNE 30, 2007 (UNAUDITED) (CONTINUED)
Principal
Amount | | | | | | Value | |
| | | | | | | Federal National Mortgage
Corporation (continued) | | | | | |
| $ | 1,870,000 | | | L | | 5.250%, due 08/01/12 | | $ | 1,855,988 | | |
| | 1,136,000 | | | C | | 5.400%, due 03/26/12 | | | 1,131,653 | | |
| | 1,853,000 | | | S | | 5.500%, due 05/25/30 | | | 1,775,934 | | |
| | 1,375,430 | | | | | 5.500%, due 11/01/32 | | | 1,333,149 | | |
| | 7,270,654 | | | S | | 5.500%, due 11/01/33 | | | 7,046,379 | | |
| | 937,000 | | | W | | 5.500%, due 08/13/34 | | | 903,180 | | |
| | 515,721 | | | | | 5.500%, due 07/01/36 | | | 494,577 | | |
| | 1,538,000 | | | C | | 5.550%, due 03/29/10 | | | 1,537,479 | | |
| | 85,247 | | | | | 6.000%, due 06/01/16 | | | 85,768 | | |
| | 410,016 | | | | | 6.000%, due 07/01/16 | | | 412,525 | | |
| | 143,722 | | | | | 6.000%, due 08/01/16 | | | 144,601 | | |
| | 108,224 | | | | | 6.000%, due 10/01/16 | | | 108,886 | | |
| | 466,476 | | | | | 6.000%, due 03/01/17 | | | 469,300 | | |
| | 195,599 | | | | | 6.000%, due 04/01/17 | | | 196,784 | | |
| | 279,390 | | | | | 6.000%, due 06/01/17 | | | 281,082 | | |
| | 59,663 | | | | | 6.000%, due 09/01/17 | | | 60,024 | | |
| | 76,232 | | | | | 6.000%, due 10/01/17 | | | 76,694 | | |
| | 282,283 | | | | | 6.000%, due 11/01/17 | | | 284,011 | | |
| | 302,580 | | | | | 6.000%, due 12/01/17 | | | 304,412 | | |
| | 266,969 | | | | | 6.000%, due 12/01/18 | | | 268,462 | | |
| | 2,731,287 | | | S | | 6.000%, due 07/25/29 | | | 2,734,631 | | |
| | 1,160,394 | | | | | 6.000%, due 07/25/29 | | | 1,162,073 | | |
| | 2,105,940 | | | S | | 6.000%, due 04/25/31 | | | 2,117,677 | | |
| | 2,275,641 | | | S | | 6.500%, due 04/01/30 | | | 2,322,810 | | |
| | 840,000 | | | L | | 6.625%, due 11/15/30 | | | 949,600 | | |
| | 95,072 | | | | | 7.000%, due 06/01/29 | | | 98,601 | | |
| | 815 | | | | | 7.000%, due 08/01/29 | | | 845 | | |
| | 5,527 | | | | | 7.000%, due 10/01/29 | | | 5,732 | | |
| | 83,987 | | | | | 7.000%, due 01/01/30 | | | 87,116 | | |
| | 58,619 | | | | | 7.000%, due 01/01/31 | | | 60,813 | | |
| | 1,224,487 | | | | | 7.000%, due 06/01/31 | | | 1,269,849 | | |
| | 12,142 | | | | | 7.000%, due 10/01/31 | | | 12,588 | | |
| | 54,324 | | | | | 7.000%, due 01/01/32 | | | 56,320 | | |
| | 7,475 | | | | | 7.000%, due 04/01/32 | | | 7,745 | | |
| | 16,458 | | | | | 7.000%, due 05/01/32 | | | 17,053 | | |
| | 40,932 | | | | | 7.000%, due 07/01/32 | | | 42,412 | | |
| | 4,203 | | | I | | 7.125%, due 07/01/27 | | | 4,253 | | |
| | 12,588 | | | | | 7.500%, due 11/01/29 | | | 13,171 | | |
| | 88,853 | | | | | 7.500%, due 10/01/30 | | | 92,830 | | |
| | 110,382 | | | | | 7.500%, due 11/01/30 | | | 115,324 | | |
| | 652,511 | | | C | | 7.500%, due 01/25/48 | | | 672,906 | | |
| | | | 46,054,402 | | |
| | | | | | | Government National
Mortgage Association: 0.3% | | | | | |
| | 116,301 | | | | | 5.375%, due 04/20/28 | | | 117,738 | | |
| | 28,356 | | | | | 6.125%, due 12/20/29 | | | 28,576 | | |
| | 146,949 | | | | | 6.500%, due 10/15/31 | | | 150,047 | | |
| | 461,282 | | | | | 7.000%, due 09/15/24 | | | 480,849 | | |
| | 770,918 | | | | | 7.000%, due 10/15/24 | | | 803,622 | | |
| | 131,146 | | | | | 7.000%, due 11/15/24 | | | 136,697 | | |
| | 1,198,907 | | | | | 7.500%, due 12/15/23 | | | 1,254,187 | | |
| | | | 2,971,716 | | |
| | | Total U.S. Government
Agency Obligations
(Cost $114,432,308) | | | 112,559,803 | | |
| U.S. TREASURY OBLIGATIONS: 5.7% | | | |
| | | | | U.S. Treasury Bonds: 0.8% | |
| | 6,728,000 | | | L | | 4.500%, due 05/15/17 | | | 6,452,576 | | |
| | 4,523,000 | | | L | | 4.500%, due 02/15/36 | | | 2,470,973 | | |
| | | | 8,923,549 | | |
Principal
Amount | | | | | | Value | |
| | | | | U.S. Treasury Notes: 3.1% | |
| $ | 8,724,000 | | | L | | 4.500%, due 05/15/10 | | $ | 8,635,399 | | |
| | 17,664,000 | | | L | | 4.750%, due 05/31/12 | | | 17,531,538 | | |
| | 9,085,000 | | | L | | 4.875%, due 05/31/09 | | | 9,085,009 | | |
| | | | 35,251,946 | | |
| | | | | | | Treasury Inflation Indexed
Protected Securities: 1.9% | | | | | |
| | 3,677,907 | | | L | | 2.375%, due 04/15/11 | | | 3,638,833 | | |
| | 4,821,130 | | | L | | 2.375%, due 01/15/17 | | | 4,708,513 | | |
| | 7,415,630 | | | L | | 2.375%, due 01/15/25 | | | 7,132,916 | | |
| | 5,497,341 | | | L | | 3.875%, due 01/15/09 | | | 5,586,679 | | |
| | | | 21,066,941 | | |
| | | Total U.S. Treasury
Obligations
(Cost $65,344,548) | | | 65,242,436 | | |
| ASSET-BACKED SECURITIES: 1.2% | | | |
| | | | | | | Automobile Asset-Backed
Securities: 0.0% | | | | | |
| | 148,834 | | | C | | AmeriCredit Automobile
Receivables Trust,
4.220%, due 07/06/09 | | | 148,366 | | |
| | | | 148,366 | | |
| | | | | | | Credit Card Asset-Backed
Securities: 0.0% | | | | | |
| | 12,000 | | | C | | Bank One Issuance Trust,
4.540%, due 09/15/10 | | | 11,940 | | |
| | | | 11,940 | | |
| | | | | | | Home Equity Asset-Backed
Securities: 0.4% | | | | | |
| | 350,000 | | | C | | Citigroup Mortgage Loan
Trust, Inc., 5.590%,
due 12/25/36 | | | 349,407 | | |
| | 150,000 | | | C | | Citigroup Mortgage
Loan Trust, Inc.,
5.620%, due 12/25/36 | | | 149,589 | | |
| | 2,707,000 | | | C,S | | GSAA Trust, 5.242%,
due 06/25/34 | | | 2,679,712 | | |
| | 850,000 | | | C | | GSAA Trust, 6.040%,
due 07/25/36 | | | 849,580 | | |
| | 428,000 | | | #,C | | Irwin Home Equity,
5.960%, due 08/25/37 | | | 428,226 | | |
| | 153,044 | | | C | | Merrill Lynch Mortgage
Investors, Inc.,
5.680%, due 07/25/34 | | | 153,608 | | |
| | 737 | | | C | | Renaissance Home Equity
Loan Trust,
4.456%, due 05/25/35 | | | 733 | | |
| | 428,000 | | | C | | Residential Funding
Mortgage Securities II, Inc.,
5.890%, due 05/25/37 | | | 427,399 | | |
| | | | 5,038,254 | | |
| | | | | Other Asset-Backed Securities: 0.8% | |
| | 136,491 | | | C | | Amortizing Residential
Collateral Trust,
5.820%, due 05/25/32 | | | 136,512 | | |
| | 48,327 | | | C | | Caterpillar Financial
Asset Trust, 5.590%,
due 02/25/09 | | | 48,377 | | |
| | 2,956 | | | C | | Chase Funding
Mortgage Loan,
4.045%, due 05/25/33 | | | 2,905 | | |
See Accompanying Notes to Financial Statements
62
PORTFOLIO OF INVESTMENTS
ING VP BALANCED PORTFOLIO AS OF JUNE 30, 2007 (UNAUDITED) (CONTINUED)
Principal
Amount | | | | | | Value | |
| | | | | | | Other Asset-Backed
Securities (continued) | | | | | |
| $ | 144,872 | | | C | | Chase Funding
Mortgage Loan,
5.620%, due 07/25/33 | | $ | 145,156 | | |
| | 3,316 | | | C | | Countrywide
Asset-Backed Certificates,
4.493%, due 02/25/36 | | | 3,302 | | |
| | 761,000 | | | C,S | | Countrywide Asset-Backed
Certificates, 5.683%,
due 10/25/46 | | | 759,180 | | |
| | 104,000 | | | C | | Countrywide Asset-Backed
Certificates,
5.689%, due 10/25/46 | | | 103,298 | | |
| | 987,000 | | | C | | Credit-Based Asset Servicing
and Securitization,
LLC, 4.831%, due 08/25/35 | | | 969,598 | | |
| | 1,583,000 | | | C | | Credit-Based Asset Servicing
and Securitization, LLC,
5.501%, due 12/25/36 | | | 1,577,189 | | |
| | 459,000 | | | #,C | | Credit-Based Asset Servicing
and Securitization, LLC,
5.746%, due 12/25/37 | | | 454,267 | | |
| | 241,000 | | | #,C | | Credit-Based Asset Servicing
and Securitization, LLC,
6.020%, due 12/25/37 | | | 236,594 | | |
| | 748,000 | | | C | | Equity One, Inc.,
5.050%, due 09/25/33 | | | 737,852 | | |
| | 163,878 | | | C | | Fannie Mae Grantor Trust,
5.460%, due 04/25/35 | | | 164,207 | | |
| | 927,000 | | | @@,#,C,S | | Hudson Mezzanine
Funding, 6.110%,
due 06/12/42 | | | 515,412 | | |
| | 719,000 | | | C | | Merrill Lynch Mortgage
Investors, Inc.,
5.609%, due 03/25/37 | | | 716,661 | | |
| | 4,410 | | | C | | Popular Mortgage
Pass-Through Trust,
4.000%, due 12/25/34 | | | 4,389 | | |
| | 3,000 | | | C | | Popular Mortgage
Pass-Through Trust,
4.596%, due 11/25/35 | | | 2,984 | | |
| | 796,000 | | | C | | Renaissance Home Equity
Loan Trust,
5.608%, due 05/25/36 | | | 793,823 | | |
| | 56,855 | | | C | | Residential Asset Mortgage
Products, Inc.,
5.630%, due 06/25/33 | | | 56,911 | | |
| | 534,957 | | | C,S | | Structured Asset Securities
Corp., 4.910%,
due 06/25/33 | | | 524,134 | | |
| | 587,945 | | | C | | Structured Asset Securities
Corp., 6.000%,
due 03/25/34 | | | 586,988 | | |
| | | | 8,539,739 | | |
| | | Total Asset-Backed Securities
(Cost $14,219,086) | | | 13,738,299 | | |
| COLLATERALIZED MORTGAGE OBLIGATIONS: 9.4% | | | |
| | 1,130,566 | | | # | | Astoria Depositor Corp.,
7.902%, due 05/01/21 | | | 1,176,495 | | |
| | 173,803 | | | C | | Banc of America Alternative
Loan Trust,
6.505%, due 04/25/37 | | | 174,670 | | |
Principal
Amount | | | | | | Value | |
| $ | 19,918,178 | | | C,^ | | Banc of America Commercial
Mortgage, Inc.,
0.465%, due 01/15/49 | | $ | 468,723 | | |
| | 100,000 | | | C | | Banc of America Commercial
Mortgage, Inc.,
4.161%, due 12/10/42 | | | 97,352 | | |
| | 60,000 | | | C | | Banc of America Commercial
Mortgage, Inc.,
4.429%, due 11/10/39 | | | 57,405 | | |
| | 10,000 | | | C | | Banc of America Commercial
Mortgage, Inc.,
4.502%, due 07/10/42 | | | 9,615 | | |
| | 8,690 | | | C | | Banc of America Commercial
Mortgage, Inc.,
4.772%, due 07/11/43 | | | 8,562 | | |
| | 10,000 | | | C | | Banc of America Commercial
Mortgage, Inc.,
4.877%, due 11/10/42 | | | 9,873 | | |
| | 10,000 | | | C | | Banc of America Commercial
Mortgage, Inc.,
4.891%, due 07/10/45 | | | 9,681 | | |
| | 516,000 | | | C | | Banc of America Commercial
Mortgage, Inc.,
5.463%, due 09/10/47 | | | 493,535 | | |
| | 160,000 | | | C | | Banc of America Commercial
Mortgage, Inc.,
6.186%, due 06/11/35 | | | 163,454 | | |
| | 1,689,892 | | | C,S | | Banc of America Funding
Corp., 5.259%,
due 09/20/35 | | | 1,635,565 | | |
| | 3,171,117 | | | C,S | | Banc of America Funding
Corp., 5.655%,
due 06/20/37 | | | 3,122,916 | | |
| | 2,496,540 | | | C,S | | Banc of America Funding
Corp., 5.750%,
due 09/20/34 | | | 2,474,261 | | |
| | 834,932 | | | C | | Banc of America Funding
Corp., 5.851%,
due 05/20/36 | | | 826,726 | | |
| | 1,176,000 | | | C | | Banc of America Mortgage
Securities, Inc.,
4.144%, due 07/25/34 | | | 1,148,405 | | |
| | 985,920 | | | C | | Banc of America Mortgage
Securities, Inc.,
5.181%, due 09/25/35 | | | 958,549 | | |
| | 804,198 | | | C | | Banc of America Mortgage
Securities, Inc.,
5.250%, due 11/25/19 | | | 797,500 | | |
| | 826,937 | | | C | | Banc of America Mortgage
Securities, Inc.,
5.500%, due 11/25/33 | | | 791,914 | | |
| | 1,678,413 | | | C,S | | Banc of America Mortgage
Securities, Inc.,
5.500%, due 06/25/35 | | | 1,666,021 | | |
| | 156,454 | | | C | | Bank of America Alternative
Loan Trust,
6.500%, due 04/25/36 | | | 157,065 | | |
| | 2,278,185 | | | C,S | | Bank of America Alternative
Loan Trust,
6.500%, due 05/25/46 | | | 2,296,546 | | |
| | 253,052 | | | C | | Bear Stearns Alternative-A
Trust, 5.640%,
due 07/25/34 | | | 252,737 | | |
| | 7,000 | | | C | | Bear Stearns Commercial
Mortgage Securities,
3.880%, due 08/13/39 | | | 6,892 | | |
See Accompanying Notes to Financial Statements
63
PORTFOLIO OF INVESTMENTS
ING VP BALANCED PORTFOLIO AS OF JUNE 30, 2007 (UNAUDITED) (CONTINUED)
Principal
Amount | | | | | | Value | |
| COLLATERALIZED MORTGAGE OBLIGATIONS (continued) | | | |
| $ | 26,000 | | | C | | Bear Stearns Commercial
Mortgage Securities,
4.030%, due 02/13/46 | | $ | 25,138 | | |
| | 944,266 | | | C | | Bear Stearns Commercial
Mortgage Securities,
4.170%, due 01/12/41 | | | 927,818 | | |
| | 392,000 | | | | | Bear Stearns Commercial
Mortgage Securities,
5.660%, due 09/11/41 | | | 381,124 | | |
| | 1,000 | | | C | | Capco America
Securitization Corp.,
6.460%, due 10/15/30 | | | 1,012 | | |
| | 2,005,396 | | | C,S | | Chase Manhattan Bank-First
Union National Bank,
7.439%, due 08/15/31 | | | 2,071,365 | | |
| | 2,375,099 | | | C,S | | Chase Mortgage Finance
Corp., 5.414%,
due 12/25/35 | | | 2,311,268 | | |
| | 1,421,666 | | | C | | Chase Mortgage Finance
Corp., 5.500%,
due 11/25/35 | | | 1,406,572 | | |
| | 814,460 | | | C | | Chaseflex Trust, 6.500%,
due 02/25/37 | | | 818,631 | | |
| | 179,584 | | | C | | Citigroup Mortgage Loan
Trust, Inc., 5.940%,
due 06/25/36 | | | 178,933 | | |
| | 2,602,046 | | | C, S | | Citigroup Mortgage Loan
Trust, Inc., 6.000%,
due 11/25/35 | | | 2,582,535 | | |
| | 1,028,834 | | | C | | Citigroup Mortgage
Securities, Inc.,
5.500%, due 02/25/22 | | | 1,021,906 | | |
| | 15,000 | | | C | | Commercial Mortgage Pass
-Through Certificates,
3.600%, due 03/10/39 | | | 14,623 | | |
| | 25,526 | | | C | | Countrywide Alternative
Loan Trust, 5.419%,
due 10/25/35 | | | 24,796 | | |
| | 2,039,317 | | | C,S | | Countrywide Alternative
Loan Trust,
5.500%, due 02/25/25 | | | 2,014,279 | | |
| | 124,715 | | | C | | Countrywide Alternative
Loan Trust,
5.620%, due 02/25/35 | | | 124,846 | | |
| | 713,455 | | | C | | Countrywide Alternative
Loan Trust,
5.909%, due 11/25/46 | | | 713,384 | | |
| | 98,641 | | | C | | Countrywide Alternative
Loan Trust,
6.000%, due 05/25/36 | | | 99,143 | | |
| | 572,638 | | | C | | Countrywide Home Loan
Mortgage Pass-Through
Trust, 5.250%,
due 10/25/35 | | | 540,369 | | |
| | 1,079,605 | | | C,S | | Credit Suisse First Boston
Mortgage Securities Corp.,
3.727%, due 03/15/35 | | | 1,045,305 | | |
| | 409,118 | | | C | | Credit Suisse First Boston
Mortgage Securities Corp.,
3.819%, due 05/15/36 | | | 390,020 | | |
| | 32,000 | | | C | | Credit Suisse First Boston
Mortgage Securities Corp.,
3.861%, due 03/15/36 | | | 31,508 | | |
Principal
Amount | | | | | | Value | |
| $ | 10,000 | | | C | | Credit Suisse First Boston
Mortgage Securities Corp.,
4.801%, due 03/15/36 | | $ | 9,581 | | |
| | 8,000 | | | C | | Credit Suisse First Boston
Mortgage Securities Corp.,
7.781%, due 04/15/62 | | | 8,482 | | |
| | 1,321,683 | | | C | | Credit Suisse Mortgage
Capital Certificates,
7.000%, due 08/25/36 | | | 1,346,619 | | |
| | 39,678 | | | C | | DLJ Commercial Mortgage
Corp., 6.240%,
due 11/12/31 | | | 39,939 | | |
| | 112,336 | | | C | | DLJ Commercial Mortgage
Corp., 7.300%,
due 06/10/32 | | | 115,501 | | |
| | 984,389 | | | C | | First Horizon Alternative
Mortgage Securities,
5.500%, due 08/25/35 | | | 969,707 | | |
| | 599,227 | | | C | | First Horizon Asset
Securities, Inc.,
5.390%, due 10/25/35 | | | 594,179 | | |
| | 844,338 | | | C | | First Horizon Asset
Securities, Inc.,
5.500%, due 12/25/35 | | | 835,586 | | |
| | 1,500,000 | | | C | | First Union National Bank
Commercial Mortgage,
6.663%, due 01/12/43 | | | 1,550,765 | | |
| | 20,340,487 | | | C,^ | | GE Capital Commercial
Mortgage Corp.,
0.680%, due 06/10/48 | | | 362,651 | | |
| | 739,044 | | | C | | GE Capital Commercial
Mortgage Corp.,
3.752%, due 07/10/39 | | | 726,465 | | |
| | 1,000 | | | C | | GE Capital Commercial
Mortgage Corp.,
4.865%, due 07/10/39 | | | 973 | | |
| | 266,248 | | | C | | GE Capital Commercial
Mortgage Corp.,
5.560%, due 06/10/38 | | | 266,659 | | |
| | 1,552,257 | | | C | | GMAC Mortgage Corp.
Loan Trust, 4.597%,
due 10/19/33 | | | 1,506,686 | | |
| | 1,764,193 | | | C,S | | GMAC Mortgage Corp.
Loan Trust, 5.259%,
due 03/18/35 | | | 1,707,477 | | |
| | 15,704,220 | | | #,C,^ | | Greenwich Capital
Commercial Funding Corp.,
0.512%, due 03/10/39 | | | 382,544 | | |
| | 870,000 | | | C | | Greenwich Capital
Commercial Funding Corp.,
5.117%, due 04/10/37 | | | 860,883 | | |
| | 474,000 | | | C | | Greenwich Capital
Commercial Funding Corp.,
5.534%, due 03/10/39 | | | 455,107 | | |
| | 240,000 | | | C | | Greenwich Capital
Commercial Funding Corp.,
5.554%, due 03/10/39 | | | 230,284 | | |
| | 192,000 | | | C | | Greenwich Capital
Commercial Funding Corp.,
5.613%, due 03/10/39 | | | 183,327 | | |
| | 684,000 | | | C | | GS Mortgage Securities
Corp. II, 5.814%,
due 04/10/38 | | | 663,368 | | |
| | 1,011,166 | | | #,C,S | | GSMPS 2005-RP1 1AF,
5.670%, due 01/25/35 | | | 1,015,995 | | |
See Accompanying Notes to Financial Statements
64
PORTFOLIO OF INVESTMENTS
ING VP BALANCED PORTFOLIO AS OF JUNE 30, 2007 (UNAUDITED) (CONTINUED)
Principal
Amount | | | | | | Value | |
| COLLATERALIZED MORTGAGE OBLIGATIONS (continued) | | | |
| $ | 879,412 | | | #,C | | GSMPS Mortgage Loan
Trust, 5.720%,
due 04/25/36 | | $ | 878,577 | | |
| | 443,769 | | | C | | GSR Mortgage Loan Trust,
5.500%, due 07/25/35 | | | 435,957 | | |
| | 319,856 | | | C | | Harborview Mortgage Loan
Trust, 5.670%,
due 01/19/35 | | | 321,025 | | |
| | 401,060 | | | C | | Homebanc Mortgage Trust,
5.750%, due 08/25/29 | | | 401,310 | | |
| | 267,933 | | | | | JP Morgan Alternative Loan
Trust, 5.510%,
due 01/25/36 | | | 266,695 | | |
| | 60,658,961 | | | C,^ | | JP Morgan Chase
Commercial Mortgage
Securities Corp., 0.090%,
due 01/12/43 | | | 132,485 | | |
| | 15,000 | | | C | | JP Morgan Chase
Commercial Mortgage
Securities Corp.,
4.223%, due 01/15/42 | | | 14,571 | | |
| | 1,000,000 | | | C | | JP Morgan Chase
Commercial Mortgage
Securities Corp.,
4.262%, due 08/12/40 | | | 984,182 | | |
| | 152,000 | | | C | | JP Morgan Chase
Commercial Mortgage
Securities Corp.,
5.455%, due 05/15/47 | | | 147,582 | | |
| | 304,000 | | | C | | JP Morgan Chase
Commercial Mortgage
Securities Corp.,
5.495%, due 05/15/47 | | | 293,736 | | |
| | 156,267 | | | C | | JP Morgan Chase
Commercial Mortgage
Securities Corp.,
6.024%, due 04/15/45 | | | 157,573 | | |
| | 877,000 | | | C | | JP Morgan Chase
Commercial Mortgage
Securities Corp.,
6.052%, due 04/15/45 | | | 887,312 | | |
| | 4,080,241 | | | C,^ | | LB-UBS Commercial
Mortgage Trust,
0.675%, due 02/15/40 | | | 143,031 | | |
| | 528,000 | | | C | | LB-UBS Commercial
Mortgage Trust,
4.201%, due 12/15/29 | | | 513,962 | | |
| | 1,000 | | | C | | LB-UBS Commercial
Mortgage Trust,
4.567%, due 06/15/29 | | | 987 | | |
| | 635,566 | | | C | | LB-UBS Commercial
Mortgage Trust,
4.821%, due 04/15/30 | | | 626,363 | | |
| | 231,000 | | | C | | LB-UBS Commercial
Mortgage Trust,
4.836%, due 02/15/40 | | | 215,634 | | |
| | 250,000 | | | C | | LB-UBS Commercial
Mortgage Trust,
4.885%, due 09/15/30 | | | 246,523 | | |
| | 10,000 | | | C | | LB-UBS Commercial
Mortgage Trust,
4.998%, due 04/15/30 | | | 9,738 | | |
| | 340,000 | | | C | | LB-UBS Commercial
Mortgage Trust,
5.103%, due 11/15/30 | | | 336,250 | | |
Principal
Amount | | | | | | Value | |
| $ | 620,000 | | | C | | LB-UBS Commercial
Mortgage Trust,
5.395%, due 04/15/40 | | $ | 593,476 | | |
| | 329,000 | | | C | | LB-UBS Commercial
Mortgage Trust,
5.516%, due 11/15/38 | | | 314,102 | | |
| | 246,000 | | | C | | LB-UBS Commercial
Mortgage Trust,
5.533%, due 02/15/40 | | | 235,944 | | |
| | 491,000 | | | C | | LB-UBS Commercial
Mortgage Trust,
5.563%, due 02/15/40 | | | 469,635 | | |
| | 2,212,000 | | | C,S | | LB-UBS Commercial
Mortgage Trust,
6.365%, due 12/15/28 | | | 2,271,530 | | |
| | 3,341,773 | | | C,S | | LB-UBS Commercial
Mortgage Trust,
7.370%, due 08/15/26 | | | 3,490,995 | | |
| | 522,000 | | | C | | MASTR Alternative Loans
Trust, 6.250%,
due 07/25/36 | | | 519,329 | | |
| | 161,323 | | | C | | MASTR Alternative Loans
Trust, 6.500%,
due 05/25/33 | | | 161,809 | | |
| | 389,336 | | | C | | MASTR Alternative Loans
Trust, 8.500%,
due 05/25/33 | | | 393,021 | | |
| | 14,393,560 | | | #,C,^ | | Merrill Lynch Mortgage
Trust, 0.358%,
due 11/12/35 | | | 99,116 | | |
| | 3,119,700 | | | C,^ | | Merrill Lynch/Countrywide
Commercial Mortgage
Trust, 0.735%,
due 08/12/48 | | | 130,965 | | |
| | 237,000 | | | C | | Merrill Lynch/Countrywide
Commercial Mortgage
Trust, 5.479%,
due 08/12/48 | | | 226,040 | | |
| | 264,000 | | | C | | Merrill Lynch/Countrywide
Commercial Mortgage
Trust, 5.509%,
due 08/12/48 | | | 251,093 | | |
| | 153,488 | | | C | | MLCC Mortgage Investors,
Inc., 5.640%,
due 01/25/29 | | | 153,631 | | |
| | 160,000 | | | C | | Morgan Stanley Capital I,
5.007%, due 01/14/42 | | | 156,005 | | |
| | 1,129,000 | | | C | | Mortgage Capital Funding,
Inc., 6.663%, due 03/18/30 | | | 1,131,869 | | |
| | 136,177 | | | C | | MortgageIT Trust, 5.690%,
due 11/25/35 | | | 136,889 | | |
| | 788,000 | | | C | | New York Mortgage Trust,
Inc., 5.654%, due 05/25/36 | | | 786,009 | | |
| | 500,919 | | | C | | Prime Mortgage Trust,
5.820%, due 02/25/35 | | | 502,545 | | |
| | 126,563 | | | C | | Prudential Commercial
Mortgage Trust,
3.669%, due 02/11/36 | | | 121,876 | | |
| | 600,000 | | | C | | Prudential Securities
Secured Financing
Corp., 6.649%,
due 07/15/08 | | | 605,121 | | |
| | 1,115,997 | | | C | | RAAC Series, 5.250%,
due 09/25/34 | | | 1,091,259 | | |
See Accompanying Notes to Financial Statements
65
PORTFOLIO OF INVESTMENTS
ING VP BALANCED PORTFOLIO AS OF JUNE 30, 2007 (UNAUDITED) (CONTINUED)
Principal
Amount | | | | | | Value | |
| COLLATERALIZED MORTGAGE OBLIGATIONS (continued) | | | |
| $ | 171,523 | | | C | | Sequoia Mortgage
Trust, 5.590%,
due 01/20/35 | | $ | 171,790 | | |
| | 4,530 | | | C | | Structured Adjustable Rate
Mortgage Loan Trust,
5.630%, due 07/25/35 | | | 4,543 | | |
| | 278,842 | | | C | | Structured Asset Mortgage
Investments, Inc., 5.560%,
due 04/19/35 | | | 279,538 | | |
| | 70,000 | | | C | | Wachovia Bank Commercial
Mortgage Trust, 5.285%,
due 07/15/42 | | | 69,469 | | |
| | 189,000 | | | #,C | | Wachovia Bank Commercial
Mortgage Trust, 5.368%,
due 10/15/44 | | | 177,716 | | |
| | 1,601,000 | | | C | | Wachovia Bank Commercial
Mortgage Trust, 5.368%,
due 10/15/44 | | | 1,516,194 | | |
| | 1,362,516 | | | C | | Washington Mutual
Mortgage Pass-Through
Certificates, 5.501%,
due 01/25/37 | | | 1,347,089 | | |
| | 1,031,295 | | | C | | Washington Mutual
Mortgage Pass-Through
Certificates, 5.709%,
due 06/25/37 | | | 1,022,703 | | |
| | 1,825,000 | | | C | | Washington Mutual
Mortgage Pass-Through
Certificates, 5.901%,
due 07/25/37 | | | 1,825,000 | | |
| | 1,304,000 | | | C | | Washington Mutual
Mortgage Pass-Through
Certificates, 5.925%,
due 07/25/37 | | | 1,304,000 | | |
| | 301,447 | | | C | | Washington Mutual
Mortgage Pass-Through
Certificates, 5.000%,
due 12/25/18 | | | 294,616 | | |
| | 478,987 | | | C | | Washington Mutual
Mortgage Pass-Through
Certificates, 5.630%,
due 01/25/45 | | | 480,052 | | |
| | 689,131 | | | C | | Washington Mutual
Mortgage Pass-Through
Certificates, 5.750%,
due 02/25/36 | | | 686,771 | | |
| | 77,530 | | | C | | Washington Mutual
Mortgage Pass-Through
Certificates, 5.795%,
due 06/25/44 | | | 77,738 | | |
| | 1,149,414 | | | C | | Washington Mutual
Mortgage Pass-Through
Certificates, 5.949%,
due 09/25/46 | | | 1,148,201 | | |
| | 75,415 | | | C | | Washington Mutual
Mortgage Pass-Through
Certificates, 5.999%,
due 05/25/46 | | | 75,442 | | |
| | 764,061 | | | C | | Washington Mutual
Mortgage Pass-Through
Certificates, 5.999%,
due 06/25/46 | | | 765,523 | | |
Principal
Amount | | | | | | Value | |
| $ | 1,686,885 | | | C | | Washington Mutual
Mortgage Pass-Through
Certificates,
6.000%, due 06/25/34 | | $ | 1,658,155 | | |
| | 1,161,974 | | | C | | Washington Mutual
Mortgage Pass-Through
Certificates,
6.000%, due 07/25/36 | | | 1,160,675 | | |
| | 758,000 | | | C | | Washington Mutual, Inc.,
3.799%, due 06/25/34 | | | 734,540 | | |
| | 1,445,000 | | | C | | Wells Fargo
Mortgage-Backed
Securities Trust,
3.500%, due 06/25/35 | | | 1,412,586 | | |
| | 3,165,000 | | | C,S | | Wells Fargo
Mortgage-Backed
Securities Trust,
4.110%, due 06/25/35 | | | 3,101,587 | | |
| | 2,225,000 | | | C,S | | Wells Fargo
Mortgage-Backed
Securities Trust,
4.500%, due 08/25/18 | | | 2,101,574 | | |
| | 1,245,000 | | | C | | Wells Fargo
Mortgage-Backed
Securities Trust,
4.795%, due 07/25/34 | | | 1,209,376 | | |
| | 760,123 | | | C | | Wells Fargo
Mortgage-Backed
Securities Trust,
4.894%, due 08/25/34 | | | 740,912 | | |
| | 1,771,435 | | | C,S | | Wells Fargo
Mortgage-Backed
Securities Trust,
5.111%, due 03/25/36 | | | 1,732,476 | | |
| | 2,531,417 | | | C,S | | Wells Fargo
Mortgage-Backed
Securities Trust,
5.386%, due 08/25/35 | | | 2,470,809 | | |
| | 1,140,022 | | | C | | Wells Fargo
Mortgage-Backed
Securities Trust,
5.500%, due 12/25/35 | | | 1,091,037 | | |
| | 1,675,620 | | | C,S | | Wells Fargo
Mortgage-Backed
Securities Trust,
5.500%, due 01/25/36 | | | 1,598,909 | | |
| | 2,126,955 | | | C,S | | Wells Fargo
Mortgage-Backed
Securities Trust,
5.668%, due 12/25/36 | | | 2,101,710 | | |
| | 1,581,534 | | | C,S | | Wells Fargo
Mortgage-Backed
Securities Trust,
5.950%, due 11/25/36 | | | 1,570,163 | | |
| | 2,387,156 | | | C,S | | Wells Fargo
Mortgage-Backed
Securities Trust,
5.957%, due 10/25/36 | | | 2,369,992 | | |
| | 257,169 | | | C | | Wells Fargo Mortgage-Backed
Securities Trust,
6.000%, due 06/25/36 | | | 256,193 | | |
| | | Total Collateralized
Mortgage Obligations
(Cost $108,152,858) | | | 106,774,646 | | |
See Accompanying Notes to Financial Statements
66
PORTFOLIO OF INVESTMENTS
ING VP BALANCED PORTFOLIO AS OF JUNE 30, 2007 (UNAUDITED) (CONTINUED)
Principal
Amount | | | | | | Value | |
| MUNICIPAL BONDS: 0.2% | | | |
| | | | | California: 0.1% | |
| $ | 836,000 | | | C | | City of San Diego, 7.125%,
due 06/01/32 | | $ | 849,117 | | |
| | | | 849,117 | | |
| | | | | Michigan: 0.1% | |
| | 1,275,000 | | | | | Michigan Tobacco
Settlement Finance
Authority,
7.309%, due 06/01/34 | | | 1,301,597 | | |
| | | | 1,301,597 | | |
| | | Total Municipal Bonds
(Cost $2,129,693) | | | 2,150,714 | | |
| OTHER BONDS: 0.2% | | | |
| | | | | Foreign Government Bonds: 0.2% | |
| ARS | 4,422,200 | | | @@,X | | Argentina Bonos, 2.000%,
due 09/30/14 | | | 1,596,488 | | |
| MXN | 7,710,000 | | | @@ | | Mexican Bonos,
8.000%, due 12/17/15 | | | 727,538 | | |
| | | Total Other Bonds
(Cost $2,192,863) | | | 2,324,026 | | |
| | | Total Long-Term Investments
(Cost $1,055,828,101) | | | 1,102,328,593 | | |
| SHORT-TERM INVESTMENTS: 17.5% | | | |
| | | | | Mutual Fund: 5.5% | |
| $ | 63,000,000 | | | ** | | ING Institutional Prime
Money Market Fund | | | 63,000,000 | | |
| | | Total Mutual Fund
(Cost $63,000,000) | | | 63,000,000 | | |
| | | | | Foreign Government Securities: 0.4% | |
| JPY | 370,000,000 | | | @@,Z | | Japan Financing Bills,
0.600%, due 09/03/07 | | | 3,001,894 | | |
| JPY | 130,000,000 | | | @@,Z | | Japan Government Treasury
Bill, 0.690%, due 11/20/07 | | | 1,053,017 | | |
| | | Total Foreign Government
Securities
(Cost $4,146,404) | | | 4,054,911 | | |
| | | | | Repurchase Agreement: 0.3% | |
| $ | 2,968,000 | | | | | Goldman Sachs Repurchase
Agreement dated 06/29/07,
5.300%, due 07/02/07,
$2,969,311 to be received
upon repurchase
(Collateralized by
$2,999,000 Federal
Home Loan Mortgage
Corporation, 5.000%,
Market Value plus
accrued interest
$3,027,537, due 02/01/13) | | | 2,968,000 | | |
| | | Total Repurchase
Agreement
(Cost $2,968,000) | | | 2,968,000 | | |
Principal
Amount | | | | | | Value | |
| | | | | Securities Lending Collateralcc: 11.3% | |
| $ | 128,255,000 | | | | | The Bank of New York
Institutional Cash
Reserves Fund | | $ | 128,255,000 | | |
| | | Total Securities Lending
Collateral
(Cost $128,255,000) | | | 128,255,000 | | |
| | | Total Short-Term
Investments
(Cost $198,369,404) | | | 198,277,911 | | |
Total Investments
in Securities (Cost
$1,254,197,505)* | | | 114.5 | % | | $ | 1,300,606,504 | | |
Other Assets and
Liabilities - Net | | | (14.5 | ) | | | (164,800,510 | ) | |
| Net Assets | | | 100.0 | % | | $ | 1,135,805,994 | | |
@ Non-income producing security
@@ Foreign Issuer
ADR American Depositary Receipt
MASTR Mortgage Asset Securitization Transaction, Inc.
# Securities with purchases pursuant to Rule 144A, under the Securities Act of 1933 and may not be resold subject to that rule except to qualified institutional buyers. Unless otherwise footnoted, these securities have been determined to be liquid under the guidelines established by the Funds' Board of Directors/Trustees.
C Bond may be called prior to maturity date.
P Preferred Stock may be called prior to convertible date.
cc Securities purchased with cash collateral for securities loaned.
W When-issued or delayed delivery security
S All or a portion of segregated securities for certain derivatives, when-issued or delayed delivery securities and forward currency exchange contracts.
I Illiquid security
L Loaned security, a portion or all of the security is on loan at June 30, 2007.
** Investment in affiliate
X Fair value determined by ING Funds Valuation Committee appointed by the Funds' Board of Directors/Trustees.
^ Interest Only (IO) Security
Z Indicates Zero Coupon Bond; rate shown reflects effective yield on the date of purchase
ARS Argentine Peso
JPY Japanese Yen
MXN Mexican Peso
* Cost for federal income tax purposes is $1,257,375,960.
Net unrealized appreciation consists of:
| Gross Unrealized Appreciation | | $ | 60,720,973 | | |
| Gross Unrealized Depreciation | | | (17,490,429 | ) | |
| Net Unrealized Appreciation | | $ | 43,230,544 | | |
See Accompanying Notes to Financial Statements
67
PORTFOLIO OF INVESTMENTS
ING VP BALANCED PORTFOLIO AS OF JUNE 30, 2007 (UNAUDITED) (CONTINUED)
ING VP Balanced Portfolio Credit Default Swap Agreements Outstanding on June 30, 2007:
| Counterparty | | Reference
Entity/Obligation | | Buy/Sell
Protection | | (Pay)/Receive
Fixed Rate | | Termination
Date | | Notional
Amount | | Unrealized
Appreciation/
(Depreciation) | |
| UBS AG | | Bear Stearns Co. Inc. 5.300%, 10/30/15 | | Sell | | | 0.240 | % | | 03/20/12 | | USD | 2,815,000 | | | $ | (24,222 | ) | |
Citibank, N.A.,
New York | | Centurytel Inc. 7.875%, 08/15/12 | | Buy | | | (0.730 | )% | | 09/20/12 | | USD | 1,134,000 | | | | (11,919 | ) | |
Citibank, N.A.,
New York | | Centurytel Inc. 7.875%, 08/15/12 | | Buy | | | (0.720 | )% | | 09/20/12 | | USD | 194,000 | | | | (1,951 | ) | |
Merrill Lynch
International | | Centurytel Inc. 7.875%, 08/15/12 | | Buy | | | (0.740 | )% | | 09/20/12 | | USD | 432,000 | | | | (4,581 | ) | |
Citibank N.A.,
New York | | Citizens Communications
6.250%, 01/15/13 | | Sell | | | 1.070 | % | | 06/20/12 | | USD | 920,000 | | | | (12,543 | ) | |
Citibank N.A.,
New York | | CMS Energy Corp. 6.875%, 12/15/15 | | Sell | | | 0.820 | % | | 03/20/12 | | USD | 190,000 | | | | 194 | | |
Merrill Lynch
International | | CMS Energy Corp. 6.875%, 12/15/15 | | Sell | | | 0.840 | % | | 03/20/12 | | USD | 1,020,000 | | | | 3,760 | | |
Morgan Stanley
Capital Services Inc. | | Domtar Inc. 7.875%, 10/15/11 | | Buy | | | (2.650 | )% | | 09/20/11 | | USD | 543,500 | | | | (23,834 | ) | |
| UBS AG | | Domtar Inc. 7.875%, 10/15/11 | | Sell | | | 2.600 | % | | 09/20/11 | | USD | 542,000 | | | | 26,464 | | |
Citibank N.A.,
New York | | Dow Jones CDX.EM.6 Index 5-Year | | Buy | | | (1.400 | )% | | 12/20/11 | | USD | 1,455,000 | | | | (679 | ) | |
Lehman Brothers
Special
Financing Inc. | | Dow Jones CDX.NA.HY.7 Index 5-Year | | Buy | | | (3.250 | )% | | 12/20/11 | | USD | 2,426,000 | | | | 43,139 | | |
| UBS AG | | Dow Jones CDX.NA.HY.7 Index 5-Year | | Buy | | | (3.250 | )% | | 12/20/11 | | USD | 1,502,000 | | | | 32,679 | | |
Citibank N.A.,
New York | | Dow Jones CDX.NA.HY.8
Index 7-Year (0-10% Tranche) | | Sell | | | 0.048 | % | | 06/20/14 | | USD | 1,306,000 | | | | 12,023 | | |
| Barclays Bank PLC | | Dow Jones CDX.NA.HY.8
Index 5-Year | | Buy | | | (2.750 | )% | | 06/20/12 | | USD | 1,494,000 | | | | 45,111 | | |
| Barclays Bank PLC | | Dow Jones CDX.NA.HY.8
Index 5-Year | | Buy | | | (2.750 | )% | | 06/20/12 | | USD | 1,881,000 | | | | (35,386 | ) | |
Citibank N.A.,
New York | | Dow Jones CDX.NA.HY.8 Index 5-Year | | Buy | | | (2.750 | )% | | 06/20/12 | | USD | 2,566,000 | | | | 63,794 | | |
| UBS AG | | Dow Jones CDX.NA.HY.8 Index 5-Year | | Buy | | | (2.750 | )% | | 06/20/12 | | USD | 1,633,000 | | | | 771 | | |
| UBS AG | | Dow Jones CDX.NA.HY.8 Index 5-Year | | Buy | | | (2.750 | )% | | 06/20/12 | | USD | 734,000 | | | | 861 | | |
Citibank N.A.,
New York | | Dow Jones CDX.NA.IG.6 Index
10-Year (7-10% Tranche) | | Sell | | | 1.003 | % | | 06/20/16 | | USD | 2,952,000 | | | | (102,064 | ) | |
Citibank, N.A.,
New York | | Dow Jones CDX.NA.IG.7 Index
10-Year (30-100% Tranche) | | Buy | | | (0.048 | )% | | 12/20/16 | | USD | 6,215,000 | | | | 10,139 | | |
Lehman Brothers
Special
Financing Inc. | | Dow Jones CDX.NA.IG.7 Index
10-Year (30-100% Tranche) | | Buy | | | (0.048 | )% | | 12/20/16 | | USD | 17,275,000 | | | | 29,032 | | |
Lehman Brothers
Special
Financing Inc. | | Dow Jones CDX.NA.IG.HVOL.8
Index 5-Year | | Buy | | | (0.750 | )% | | 06/20/12 | | USD | 13,063,000 | | | | 48,769 | | |
| UBS AG | | Dow Jones CDX.NA.IG.HVOL.8
Index 5-Year | | Buy | | | (0.750 | )% | | 06/20/12 | | USD | 6,404,000 | | | | 47,150 | | |
| UBS AG | | Dow Jones CDX.NA.IG.HVOL.8
Index 5-Year | | Buy | | | (0.750 | )% | | 06/20/12 | | USD | 3,988,000 | | | | 13,860 | | |
| Barclays Bank PLC | | Dow Jones CDX.NA.XO.8
Index 5-Year | | Buy | | | (1.400 | )% | | 06/20/12 | | USD | 4,082,000 | | | | 4,724 | | |
Lehman Brothers
Special
Financing Inc. | | Dow Jones CDX.NA.XO.8
Index 5-Year | | Buy | | | (1.400 | )% | | 06/20/12 | | USD | 3,999,000 | | | | 45,788 | | |
Lehman Brothers
Special
Financing Inc. | | Exelon Corp. 6.750%, 05/01/11 | | Buy | | | (0.640 | )% | | 06/20/12 | | USD | 952,000 | | | | (8,799 | ) | |
| Barclays Bank PLC | | Federative Republic
of Brazil 12.25%, 03/06/30 | | Sell | | | 0.240 | % | | 06/20/08 | | USD | 2,799,000 | | | | 663 | | |
| Barclays Bank PLC | | Federative Republic of Brazil
12.25%, 03/06/30 | | Buy | | | (0.725 | )% | | 06/20/12 | | USD | 979,000 | | | | 862 | | |
Lehman Brothers
Special Federative Republic of Brazil
Financing Inc. | | 12.25%, 03/06/30 | | Buy | | | (0.800 | )% | | 07/20/12 | | USD | 884,000 | | | | (2,710 | ) | |
| UBS AG | | Federative Republic of Brazil
12.25%, 03/06/30 | | Buy | | | (0.780 | )% | | 07/20/12 | | USD | 4,075,000 | | | | - | | |
See Accompanying Notes to Financial Statements
68
PORTFOLIO OF INVESTMENTS
ING VP BALANCED PORTFOLIO AS OF JUNE 30, 2007 (UNAUDITED) (CONTINUED)
| Counterparty | | Reference
Entity/Obligation | | Buy/Sell
Protection | | (Pay)/Receive
Fixed Rate | | Termination
Date | | Notional
Amount | | Unrealized
Appreciation/
(Depreciation) | |
Citibank N.A.,
New York | | Gannett Co. 6.375%, 04/01/12 | | Buy | | | (0.690 | )% | | 06/20/14 | | USD | 1,101,000 | | | $ | 282 | | |
Morgan Stanley
Capital Services Inc. | | H.J. Heinz Co. 6.000%, 03/15/08 | | Buy | | | (0.350 | )% | | 09/20/11 | | USD | 3,075,000 | | | | (4,341 | ) | |
Morgan Stanley
Capital Services Inc. | | H.J. Heinz Co. 6.000%, 03/15/08 | | Buy | | | (0.410 | )% | | 09/20/11 | | USD | 3,587,500 | | | | (13,264 | ) | |
| Barclays Bank PLC | | Kinder Morgan Inc. 6.500%, 09/01/12 | | Sell | | | 1.700 | % | | 09/20/11 | | USD | 217,000 | | | | 7,762 | | |
| UBS AG | | Lehman Brothers Holdings
6.625%, 01/18/12 | | Sell | | | 0.240 | % | | 03/20/12 | | USD | 2,815,000 | | | | (12,638 | ) | |
JPMorgan Chase
Bank, N.A.,
New York | | Macy's Inc. 6.625%, 04/01/11 | | Buy | | | (0.980 | )% | | 09/20/12 | | USD | 800,000 | | | | (9,794 | ) | |
| UBS AG | | Macy's Inc. 6.625%, 04/01/11 | | Buy | | | (0.980 | )% | | 09/20/12 | | USD | 1,600,000 | | | | (18,836 | ) | |
| UBS AG | | Morgan Stanley 6.600%, 04/01/12 | | Sell | | | 0.260 | % | | 03/20/12 | | USD | 4,283,000 | | | | (12,127 | ) | |
Bear Stearns
Credit Products Inc. | | Norbord Inc. 7.250%, 07/01/12 | | Buy | | | (1.600 | )% | | 06/20/12 | | USD | 929,000 | | | | (8,268 | ) | |
Credit Suisse
International | | Norbord Inc. 7.250%, 07/01/12 | | Buy | | | (1.450 | )% | | 06/20/14 | | USD | 1,448,000 | | | | 28,447 | | |
JPMorgan
Chase Bank, N.A.,
New York | | Norbord Inc. 7.250%, 07/01/12 | | Buy | | | (1.380 | )% | | 06/20/14 | | USD | 678,000 | | | | 18,693 | | |
JPMorgan
Chase Bank, N.A.,
New York | | Norbord Inc. 7.250%, 07/01/12 | | Buy | | | (2.000 | )% | | 06/20/14 | | USD | 811,000 | | | | (5,052 | ) | |
Morgan Stanley
Capital Services Inc. | | Norbord Inc. 7.250%, 07/01/12 | | Buy | | | (1.380 | )% | | 06/20/14 | | USD | 1,328,000 | | | | 34,490 | | |
| UBS AG | | Norbord Inc. 7.250%, 07/01/12 | | Buy | | | (1.500 | )% | | 06/20/12 | | USD | 386,000 | | | | (2,097 | ) | |
| UBS AG | | Norbord Inc. 7.250%, 07/01/12 | | Buy | | | (1.360 | )% | | 06/20/14 | | USD | 545,000 | | | | 12,015 | | |
| UBS AG | | Russian Federation 5.000% Step, 03/31/30 | | Sell | | | 0.240 | % | | 08/20/07 | | USD | 2,104,000 | | | | 2,436 | | |
| UBS AG | | Russian Federation 5.000% Step, 03/31/30 | | Sell | | | 0.310 | % | | 08/20/07 | | USD | 4,485,000 | | | | 7,874 | | |
Goldman Sachs
International | | Temple-Inland Inc. 7.875%, 05/01/12 | | Buy | | | (1.040 | )% | | 03/20/14 | | USD | 414,000 | | | | 2,244 | | |
JPMorgan
Chase Bank N.A.,
New York | | Temple-Inland Inc. 7.875%, 05/01/12 | | Buy | | | (0.890 | )% | | 03/20/14 | | USD | 905,000 | | | | 13,295 | | |
JPMorgan
Chase Bank, N.A.,
New York | | Temple-Inland Inc. 7.875%, 05/01/12 | | Buy | | | (1.020 | )% | | 03/20/14 | | USD | 1,181,000 | | | | 8,964 | | |
Morgan Stanley
Capital Services Inc. | | Temple-Inland Inc. 7.875%, 05/01/12 | | Buy | | | (0.900 | )% | | 03/20/14 | | USD | 793,000 | | | | 8,738 | | |
| UBS AG | | Temple-Inland Inc. 7.875%, 05/01/12 | | Buy | | | (0.900 | )% | | 03/20/14 | | USD | 847,000 | | | | 8,544 | | |
| UBS AG | | Toll Bros Finance Corp. 6.875%, 11/15/12 | | Buy | | | (1.000 | )% | | 06/20/12 | | USD | 1,756,000 | | | | 12,207 | | |
Merrill Lynch
International | | Transocean Inc. 7.375%, 04/15/18 | | Buy | | | (0.330 | )% | | 09/20/12 | | USD | 1,125,000 | | | | (4,032 | ) | |
| UBS AG | | Transocean Inc. 7.375%, 04/15/18 | | Buy | | | (0.340 | )% | | 09/20/12 | | USD | 970,000 | | | | (3,896 | ) | |
Merrill Lynch
International | | TXU Energy Co. 7.000%, 03/15/13 | | Buy | | | (1.200 | )% | | 03/20/12 | | USD | 1,463,000 | | | | 55,948 | | |
| UBS AG | | TXU Energy Co. 7.000%, 03/15/13 | | Buy | | | (1.230 | )% | | 03/20/12 | | USD | 279,000 | | | | 12,672 | | |
| Barclays Bank PLC | | UST Inc. 6.625%, 07/15/12 | | Buy | | | (0.300 | )% | | 03/20/14 | | USD | 909,000 | | | | (2,603 | ) | |
Bear Stearns Credit
Products Inc. | | UST Inc. 6.625%, 07/15/12 | | Buy | | | (0.280 | )% | | 03/20/14 | | USD | 2,475,000 | | | | 8,444 | | |
Bear Stearns Credit
Products Inc. | | UST Inc. 6.625%, 07/15/12 | | Buy | | | (0.380 | )% | | 03/20/17 | | USD | 1,980,000 | | | | 11,215 | | |
Morgan Stanley
Capital Services Inc. | | UST Inc. 6.625%, 07/15/12 | | Buy | | | (0.420 | )% | | 03/20/17 | | USD | 909,000 | | | | 346 | | |
| UBS AG | | UST Inc. 6.625%, 07/15/12 | | Buy | | | (0.280 | )% | | 03/20/14 | | USD | 131,000 | | | | 137 | | |
| UBS AG | | UST Inc. 6.625%, 07/15/12 | | Buy | | | (0.380 | )% | | 03/20/17 | | USD | 160,000 | | | | 339 | | |
Citibank N.A.,
New York | | Weyerhaeuser Co. 6.750%, 03/15/12 | | Buy | | | (0.580 | )% | | 03/20/14 | | USD | 157,000 | | | | 1,185 | | |
JPMorgan Chase
Bank, N.A.,
New York | | Weyerhaeuser Co. 6.750%, 03/15/12 | | Buy | | | (0.640 | )% | | 03/20/14 | | USD | 974,000 | | | | 2,641 | | |
Lehman Brothers
Special
Financing Inc. | | Weyerhaeuser Co. 6.750%, 03/15/12 | | Buy | | | (0.570 | )% | | 03/20/14 | | USD | 905,000 | | | | 5,168 | | |
Morgan Stanley
Capital Services Inc. | | Weyerhaeuser Co. 6.750%, 03/15/12 | | Buy | | | (0.600 | )% | | 03/20/14 | | USD | 1,644,000 | | | | 8,124 | | |
See Accompanying Notes to Financial Statements
69
PORTFOLIO OF INVESTMENTS
ING VP BALANCED PORTFOLIO AS OF JUNE 30, 2007 (UNAUDITED) (CONTINUED)
| Counterparty | | Reference
Entity/Obligation | | Buy/Sell
Protection | | (Pay)/Receive
Fixed Rate | | Termination
Date | | Notional
Amount | | Unrealized
Appreciation/
(Depreciation) | |
Morgan Stanley
Capital Services Inc. | | Weyerhaeuser Co. 6.750%, 03/15/12 | | Buy | | | (0.880 | )% | | 03/20/17 | | USD | 909,000 | | | $ | 6,763 | | |
Citibank N.A.,
New York | | Williams Partners LP 7.500%, 06/15/11 | | Sell | | | 1.030 | % | | 03/20/12 | | USD | 1,036,947 | | | | 16,448 | | |
| UBS AG | | XL Capital Ltd. 5.250%, 09/15/14 | | Buy | | | (0.610 | )% | | 09/20/16 | | USD | 1,025,000 | | | | (9,577 | ) | |
| UBS AG | | XL Capital Ltd. 5.250%, 09/15/14 | | Buy | | | (0.610 | )% | | 09/20/16 | | USD | 2,050,000 | | | | (19,155 | ) | |
| | | | | | | $ | 370,836 | | |
ING VP Balanced Portfolio Open Futures Contracts on June 30, 2007:
| Contract Description | | Number
of Contracts | | Notional
Market Value ($) | | Expiration Date | | Unrealized
Appreciation/
(Depreciation) | |
| Long Contracts | |
| Russell 2000 | | | 1 | | | | 421,050 | | | 09/20/07 | | $ | 5,497 | | |
| Russell Mini | | | 7 | | | | 589,470 | | | 09/21/07 | | | 83 | | |
| S&P 400 E-Mini | | | 7 | | | | 632,940 | | | 09/21/07 | | | (1,953 | ) | |
| S&P 500 | | | 19 | | | | 7,198,150 | | | 09/20/07 | | | (103,118 | ) | |
| U.S. Treasury 2-Year Note | | | 20 | | | | 4,075,625 | | | 09/28/07 | | | 7,450 | | |
| U.S. Treasury 5-Year Note | | | 96 | | | | 9,991,500 | | | 09/28/07 | | | (35,161 | ) | |
| U.S. Treasury Long Bond | | | 227 | | | | 24,459,250 | | | 09/19/07 | | | 12,568 | | |
| | | | | | | | | | | | | $ | (114,634 | ) | |
| Short Contracts | |
| U.S. Treasury 10-Year Note | | | 50 | | | | (5,285,157 | ) | | 09/19/07 | | $ | (20,438 | ) | |
| | | | | | | | | | | | | $ | (20,438 | ) | |
See Accompanying Notes to Financial Statements
70
PORTFOLIO OF INVESTMENTS
ING VP GROWTH AND INCOME PORTFOLIO AS OF JUNE 30, 2007 (UNAUDITED)
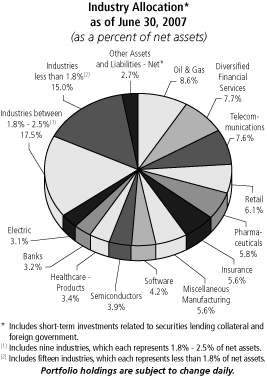
| Shares | | | | | | Value | |
| COMMON STOCK: 97.3% | | | |
| | | | | Aerospace/Defense: 1.9% | |
| | 953,550 | | | @,L | | BE Aerospace, Inc. | | $ | 39,381,615 | | |
| | 204,000 | | | | | Boeing Co. | | | 19,616,640 | | |
| | | | 58,998,255 | | |
| | | | | Agriculture: 1.9% | |
| | 808,250 | | | | | Altria Group, Inc. | | | 56,690,655 | | |
| | | | 56,690,655 | | |
| | | | | Apparel: 1.4% | |
| | 1,135,800 | | | L | | Liz Claiborne, Inc. | | | 42,365,340 | | |
| | | | 42,365,340 | | |
| | | | | | | Auto Parts &
Equipment: 0.5% | | | | | |
| | 465,500 | | | @,L | | Goodyear Tire & Rubber Co. | | | 16,180,780 | | |
| | | | 16,180,780 | | |
| | | | | Banks: 3.2% | |
| | 238,900 | | | | | Bank of America Corp. | | | 11,679,821 | | |
| | 251,500 | | | @ | | Bank of New York Co., Inc. | | | 10,422,160 | | |
| | 1,045,018 | | | | | People's United
Financial, Inc. | | | 18,528,169 | | |
| | 250,400 | | | L | | PNC Financial
Services Group, Inc. | | | 17,923,632 | | |
| | 377,700 | | | | | State Street Corp. | | | 25,834,680 | | |
| | 371,900 | | | L | | Wells Fargo & Co. | | | 13,079,723 | | |
| | | | 97,468,185 | | |
| Shares | | | | | | Value | |
| | | | | Beverages: 0.9% | |
| | 725,250 | | | @@ | | Fomento Economico
Mexicano SA de CV ADR | | $ | 28,516,830 | | |
| | | | 28,516,830 | | |
| | | | | Biotechnology: 0.6% | |
| | 281,900 | | | @,L | | Genzyme Corp. | | | 18,154,360 | | |
| | | | 18,154,360 | | |
| | | | | Commercial Services: 1.1% | |
| | 1,110,600 | | | @,L | | Quanta Services, Inc. | | | 34,062,102 | | |
| | | | 34,062,102 | | |
| | | | | Computers: 2.5% | |
| | 1,226,200 | | | @ | | Dell, Inc. | | | 35,008,010 | | |
| | 471,000 | | | | | Hewlett-Packard Co. | | | 21,016,020 | | |
| | 901,100 | | | @@,L | | Seagate Technology, Inc. | | | 19,616,947 | | |
| | | | 75,640,977 | | |
| | | | | | | Cosmetics/
Personal Care: 2.0% | | | | | |
| | 971,596 | | | | | Procter & Gamble Co. | | | 59,451,959 | | |
| | | | 59,451,959 | | |
| | | | | | | Diversified Financial
Services: 7.7% | | | | | |
| | 89,100 | | | | | Bear Stearns Cos., Inc. | | | 12,474,000 | | |
| | 173,400 | | | @ | | Blackstone Group LP | | | 5,075,418 | | |
| | 1,189,100 | | | | | Citigroup, Inc. | | | 60,988,939 | | |
| | 1,378,067 | | | @,L | | E*Trade Financial Corp. | | | 30,441,500 | | |
| | 1,758,800 | | | @@ | | Invesco PLC | | | 22,662,264 | | |
| | 811,200 | | | | | JP Morgan Chase & Co. | | | 39,302,640 | | |
| | 558,900 | | | | | Merrill Lynch & Co., Inc. | | | 46,712,862 | | |
| | 783,000 | | | @,L | | TD Ameritrade Holding Corp. | | | 15,660,000 | | |
| | | | 233,317,623 | | |
| | | | | Electric: 3.1% | |
| | 661,900 | | | L | | Centerpoint Energy, Inc. | | | 11,517,060 | | |
| | 120,000 | | | L | | DTE Energy Co. | | | 5,786,400 | | |
| | 350,550 | | | L | | Exelon Corp. | | | 25,449,930 | | |
| | 509,746 | | | @ | | Mirant Corp. | | | 21,740,667 | | |
| | 722,550 | | | @,L | | NRG Energy, Inc. | | | 30,036,404 | | |
| | | | 94,530,461 | | |
| | | | | | | Electrical Components &
Equipment: 1.1% | | | | | |
| | 444,050 | | | @,L | | General Cable Corp. | | | 33,636,788 | | |
| | | | 33,636,788 | | |
| | | | | | | Engineering &
Construction: 1.1% | | | | | |
| | 324,236 | | | @ | | Foster Wheeler Ltd. | | | 34,690,010 | | |
| | | | 34,690,010 | | |
| | | | | Entertainment: 1.4% | |
| | 762,300 | | | L | | International
Game Technology | | | 30,263,310 | | |
| | 101,147 | | | @,L | | Penn National Gaming, Inc. | | | 6,077,923 | | |
| | 209,200 | | | L | | Regal Entertainment Group | | | 4,587,756 | | |
| | | | 40,928,989 | | |
| | | | | Environmental Control: 0.8% | |
| | 630,550 | | | | | Waste Management, Inc. | | | 24,622,978 | | |
| | | | 24,622,978 | | |
See Accompanying Notes to Financial Statements
71
PORTFOLIO OF INVESTMENTS
ING VP GROWTH AND INCOME PORTFOLIO AS OF JUNE 30, 2007 (UNAUDITED) (CONTINUED)
| Shares | | | | | | Value | |
| | | | | Food: 1.5% | |
| | 1,276,175 | | | | | Kraft Foods, Inc. | | $ | 44,985,169 | | |
| | | | 44,985,169 | | |
| | | | | Healthcare-Products: 3.4% | |
| | 950,500 | | | | | Johnson & Johnson | | | 58,569,810 | | |
| | 1,052,100 | | | @,L | | St. Jude Medical, Inc. | | | 43,651,629 | | |
| | | | 102,221,439 | | |
| | | | | Healthcare-Services: 1.2% | |
| | 527,747 | | | @,L | | Covance, Inc. | | | 36,182,334 | | |
| | | | 36,182,334 | | |
| | | | | Insurance: 5.6% | |
| | 916,100 | | | | | American International
Group, Inc. | | | 64,154,483 | | |
| | 231,150 | | | L | | MBIA, Inc. | | | 14,382,153 | | |
| | 384,000 | | | | | Principal Financial Group | | | 22,383,360 | | |
| | 441,950 | | | | | Protective Life Corp. | | | 21,129,630 | | |
| | 565,000 | | | @@ | | Willis Group Holdings Ltd. | | | 24,893,900 | | |
| | 746,300 | | | | | WR Berkley Corp. | | | 24,284,602 | | |
| | | | 171,228,128 | | |
| | | | | Internet: 1.8% | |
| | 102,500 | | | @ | | Google, Inc. | | | 53,646,450 | | |
| | | | 53,646,450 | | |
| | | | | Investment Companies: 1.4% | |
| | 1,948,724 | | | @@ | | KKR Private Equity
Investors LP | | | 43,846,290 | | |
| | | | 43,846,290 | | |
| | | | | Iron/Steel: 1.3% | |
| | 373,250 | | | L | | Allegheny Technologies, Inc. | | | 39,146,460 | | |
| | | | 39,146,460 | | |
| | | | | Lodging: 0.7% | |
| | 275,200 | | | @,L | | MGM Mirage | | | 22,698,496 | | |
| | | | 22,698,496 | | |
| | | | | Media: 1.9% | |
| | 1,972,550 | | | | | News Corp., Inc.-Class A | | | 41,837,786 | | |
| | 395,000 | | | @,L | | Time Warner Cable, Inc. | | | 15,472,150 | | |
| | | | 57,309,936 | | |
| | | | | | | Metal Fabricate/
Hardware: 1.8% | | | | | |
| | 437,900 | | | L | | Precision Castparts Corp. | | | 53,143,544 | | |
| | | | 53,143,544 | | |
| | | | | Mining: 1.8% | |
| | 200,600 | | | @@ | | Alcan, Inc. | | | 16,308,780 | | |
| | 418,200 | | | | | Alcoa, Inc. | | | 16,949,646 | | |
| | 250,600 | | | | | Freeport-McMoRan
Copper & Gold, Inc. | | | 20,754,692 | | |
| | | | 54,013,118 | | |
| | | | | | | Miscellaneous
Manufacturing: 5.6% | | | | | |
| | 863,400 | | | | | Cooper Industries Ltd. | | | 49,291,506 | | |
| | 427,750 | | | | | Danaher Corp. | | | 32,295,125 | | |
| | 1,428,376 | | | | | General Electric Co. | | | 54,678,233 | | |
| | 584,900 | | | | | Roper Industries, Inc. | | | 33,397,790 | | |
| | | | 169,662,654 | | |
| Shares | | | | | | Value | |
| | | | | Oil & Gas: 8.6% | |
| | 481,250 | | | | | ConocoPhillips | | $ | 37,778,125 | | |
| | 1,383,600 | | | | | ExxonMobil Corp. | | | 116,056,368 | | |
| | 635,100 | | | @,L | | Plains Exploration &
Production Co. | | | 30,364,131 | | |
| | 324,550 | | | @ | | Southwestern Energy Co. | | | 14,442,475 | | |
| | 475,900 | | | @ | | Todco | | | 22,467,239 | | |
| | 363,250 | | | | | Valero Energy Corp. | | | 26,829,645 | | |
| | 224,500 | | | | | XTO Energy, Inc. | | | 13,492,450 | | |
| | | | 261,430,433 | | |
| | | | | Oil & Gas Services: 1.9% | |
| | 669,154 | | | L | | Schlumberger Ltd. | | | 56,837,941 | | |
| | | | 56,837,941 | | |
| | | | | Pharmaceuticals: 5.8% | |
| | 832,250 | | | | | Abbott Laboratories | | | 44,566,988 | | |
| | 216,198 | | | @,L | | Gilead Sciences, Inc. | | | 8,381,996 | | |
| | 236,202 | | | @ | | Medco Health Solutions, Inc. | | | 18,421,394 | | |
| | 798,700 | | | | | Merck & Co., Inc. | | | 39,775,260 | | |
| | 871,000 | | | L | | Omnicare, Inc. | | | 31,408,260 | | |
| | 599,300 | | | | | Wyeth | | | 34,363,862 | | |
| | | | 176,917,760 | | |
| | | | | Retail: 6.1% | |
| | 940,800 | | | | | Best Buy Co., Inc. | | | 43,907,136 | | |
| | 374,800 | | | @,L | | Childrens Place
Retail Stores, Inc. | | | 19,354,672 | | |
| | 1,162,400 | | | L | | CVS Corp. | | | 42,369,480 | | |
| | 743,450 | | | | | Home Depot, Inc. | | | 29,254,758 | | |
| | 622,300 | | | | | Macy's, Inc. | | | 24,755,094 | | |
| | 542,300 | | | | | Wal-Mart Stores, Inc. | | | 26,090,053 | | |
| | | | 185,731,193 | | |
| | | | | Semiconductors: 3.9% | |
| | 3,126,800 | | | | | Intel Corp. | | | 74,292,763 | | |
| | 355,750 | | | | | Maxim Integrated Products | | | 11,885,608 | | |
| | 2,850,680 | | | @@,L | | Taiwan Semiconductor
Manufacturing Co., Ltd. ADR | | | 31,728,068 | | |
| | | | 117,906,439 | | |
| | | | | Software: 4.2% | |
| | 966,100 | | | @,L | | Activision, Inc. | | | 18,037,087 | | |
| | 293,350 | | | @ | | Adobe Systems, Inc. | | | 11,778,003 | | |
| | 143,100 | | | @,L | | Electronic Arts, Inc. | | | 6,771,492 | | |
| | 528,450 | | | @@ | | Infosys Technologies Ltd. ADR | | | 26,623,311 | | |
| | 1,202,282 | | | | | Microsoft Corp. | | | 35,431,251 | | |
| | 1,493,400 | | | @ | | Oracle Corp. | | | 29,434,914 | | |
| | | | 128,076,058 | | |
| | | | | Telecommunications: 7.6% | |
| | 1,278,150 | | | @ | | Arris Group, Inc. | | | 22,482,659 | | |
| | 643,050 | | | @ | | Ciena Corp. | | | 23,233,397 | | |
| | 2,294,000 | | | @ | | Cisco Systems, Inc. | | | 63,887,900 | | |
| | 151,100 | | | @,L | | CommScope, Inc. | | | 8,816,685 | | |
| | 1,888,650 | | | @@,L | | Deutsche Telekom AG ADR | | | 34,770,047 | | |
| | 990,400 | | | | | Qualcomm, Inc. | | | 42,973,456 | | |
| | 874,500 | | | | | Verizon Communications, Inc. | | | 36,003,164 | | |
| | | | 232,167,308 | | |
| | | Total Common Stock
(Cost $2,533,635,171) | | | 2,956,407,442 | | |
See Accompanying Notes to Financial Statements
72
PORTFOLIO OF INVESTMENTS
ING VP GROWTH AND INCOME PORTFOLIO AS OF JUNE 30, 2007 (UNAUDITED) (CONTINUED)
| # of Contracts | | | | | | Value | |
| PURCHASED OPTIONS: 0.0% | | | |
| | 95,000 | | | | | Call Option-OTC Allegheny
Technologies Inc.
Strike @ $125.00-
Exp 07/20/07 | | $ | 10 | | |
| | | Total Purchased Options
(Cost $99,750) | | | 10 | | |
Principal
Amount | | | | Value | |
| CONVERTIBLE BONDS: 0.0% | | | |
| | | | | Electric: 0.0% | |
| $ | 20,000,000 | | | L,Z | | Mirant Corp.-Escrow
(In Default), Discount
Note, due 06/15/21 | | | — | | |
| | | Total Convertible Bonds
(Cost $ — ) | | | — | | |
| CORPORATE BONDS/NOTES: 0.0% | | | |
| | | | | Electric: 0.0% | |
| | 10,000,000 | | | Z | | Southern Energy Escrow,
Discount Note,
due 07/15/09 | | | — | | |
| | | Total Corporate Bonds/Notes
(Cost $ — ) | | | — | | |
| | | Total Long-Term Investments
(Cost $2,533,734,921) | | | 2,956,407,452 | | |
| SHORT-TERM INVESTMENTS: 14.5% | | | |
| Shares | | | | Value | |
| | | | | Mutual Fund: 2.0% | |
| | 60,000,000 | | | **,S | | ING Institutional Prime
Money Market Fund | | | 60,000,000 | | |
| | | Total Mutual Fund
(Cost $60,000,000) | | | 60,000,000 | | |
Principal
Amount | | | | Value | |
| | | | | Repurchase Agreement: 0.3% | |
| $ | 10,114,000 | | | | | Goldman Sachs Repurchase
Agreement dated 06/29/07,
5.300%, due 07/02/07,
$10,118,467 to be received
upon repurchase
(Collateralized by
$10,244,000 various U.S.
Government Agency
Obligations, 4.000%-4.000%,
Market Value plus accrued
interest $10,316,288, d | | | 10,114,000 | | |
| | | Total Repurchase
Agreement
(Cost $10,114,000) | | | 10,114,000 | | |
Principal
Amount | | | | Value | |
| | | | | Securities Lending Collateralcc: 12.2% | |
| $ | 371,430,000 | | | | | The Bank of New York
Institutional Cash
Reserves Fund | | $ | 371,430,000 | | |
| | | Total Securities Lending
Collateral
(Cost $371,430,000) | | | 371,430,000 | | |
| | | Total Short-Term
Investments
(Cost $441,544,000) | | | 441,544,000 | | |
Total Investments in
Securities (Cost
$2,975,278,921)* | | | 111.8 | % | | $ | 3,397,951,452 | | |
Other Assets and
Liabilities - Net | | | (11.8 | ) | | | (359,972,096 | ) | |
| Net Assets | | | 100.0 | % | | $ | 3,037,979,356 | | |
@ Non-income producing security
@@ Foreign Issuer
ADR American Depositary Receipt
cc Securities purchased with cash collateral for securities loaned.
S All or a portion of segregated securities for certain derivatives, when-issued or delayed delivery securities and forward currency exchange contracts.
L Loaned security, a portion or all of the security is on loan at June 30, 2007.
** Investment in affiliate
Z Indicates Zero Coupon Bond; rate shown reflects effective yield on the date of purchase
* Cost for federal income tax purposes is $2,982,394,479.
Net unrealized appreciation consists of:
| Gross Unrealized Appreciation | | $ | 445,989,183 | | |
| Gross Unrealized Depreciation | | | (30,432,209 | ) | |
| Net Unrealized Appreciation $4 | | | 15,556,973 | | |
See Accompanying Notes to Financial Statements
73
PORTFOLIO OF INVESTMENTS
ING VP GROWTH AND INCOME PORTFOLIO AS OF JUNE 30, 2007 (UNAUDITED) (CONTINUED)
ING VP Growth and Income Portfolio Open Futures Contracts on June 30, 2007
Contract
Description | | Number of
Contracts | | Notional
Market
Value ($) | | Expiration
Date | | Unrealized
Appreciation/
(Depreciation) | |
| Long Contracts | |
| S&P 500 | | | 55 | | | | 20,836,750 | | | 09/20/07 | | $ | 60,946 | | |
| | | | | | | | | $ | 60,946 | | |
ING VP Growth and Income Portfolio Written Options Outstanding on June 30, 2007:
| Description/Name of Issuer | | Strike
Price ($) | | Expiration
Date | | # of
Contracts | | Premium
Received | | Value | |
| Call Option OTC - Mirant Corp. | | | 49.000 | | | 09/21/07 | | | (165,000 | ) | | $ | (245,850 | ) | | $ | (132,000 | ) | |
| Call Option OTC - Allegheny Technologies Inc. | | | 125.000 | | | 07/20/07 | | | (95,000 | ) | | | (367,650 | ) | | | (10 | ) | |
| Call Option OTC - Allegheny Technologies Inc. | | | 130.000 | | | 10/19/07 | | | (95,000 | ) | | | (351,500 | ) | | | (186,000 | ) | |
| Call Option OTC - Precision Castparts Corp. | | | 125.000 | | | 07/20/07 | | | (69,000 | ) | | | (173,880 | ) | | | (89,700 | ) | |
| | | | | | | | | | | | | $ | (1,138,880 | ) | | $ | (407,710 | ) | |
See Accompanying Notes to Financial Statements
74
PORTFOLIO OF INVESTMENTS
ING VP GROWTH PORTFOLIO AS OF JUNE 30, 2007 (UNAUDITED)
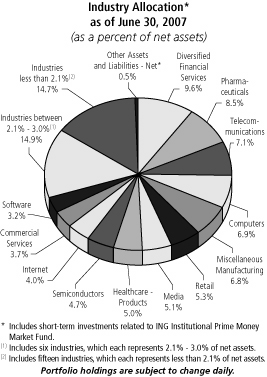
| Shares | | | | | | Value | |
| COMMON STOCK: 99.5% | | | |
| | | | | Agriculture: 2.4% | |
| $ | 70,600 | | | | | Altria Group, Inc. | | $ | 4,951,884 | | |
| | | | 4,951,884 | | |
| | | | | Apparel: 2.7% | |
| | 75,800 | | | @ | | Coach, Inc. | | | 3,592,162 | | |
| | 41,100 | | | | | Guess ?, Inc. | | | 1,974,444 | | |
| | | | 5,566,606 | | |
| | | | | Banks: 1.3% | |
| | 64,000 | | | @ | | Bank of New York Co., Inc. | | | 2,652,160 | | |
| | | | 2,652,160 | | |
| | | | | Chemicals: 3.0% | |
| | 90,740 | | | | | Monsanto Co. | | | 6,128,580 | | |
| | | | 6,128,580 | | |
| | | | | Coal: 1.7% | |
| | 73,500 | | | L | | Peabody Energy Corp. | | | 3,555,930 | | |
| | | | 3,555,930 | | |
| | | | | Commercial Services: 3.7% | |
| | 90,700 | | | @@ | | Accenture Ltd. | | | 3,890,123 | | |
| | 25,700 | | | | | McKesson Corp. | | | 1,532,748 | | |
| | 69,300 | | | @,L | | Quanta Services, Inc. | | | 2,125,431 | | |
| | | | 7,548,302 | | |
| | | | | Computers: 6.9% | |
| | 37,700 | | | @ | | Apple, Inc. | | | 4,600,908 | | |
| | 119,900 | | | | | Hewlett-Packard Co. | | | 5,349,938 | | |
| | 71,800 | | | @ | | Network Appliance, Inc. | | | 2,096,560 | | |
| Shares | | | | | | Value | |
| | 9,900 | | | @,@@ | | Research In Motion Ltd. | | $ | 1,979,901 | | |
| | | | 14,027,307 | | |
| | | | | Cosmetics/Personal Care: 1.7% | |
| | 91,600 | | | | | Avon Products, Inc. | | | 3,366,300 | | |
| | | | 3,366,300 | | |
| | | | | Diversified Financial Services: 9.6% | |
| | 105,280 | | | | | American Express Co. | | | 6,441,030 | | |
| | 41,700 | | | @,L | | Blackstone Group LP | | | 1,220,559 | | |
| | 159,410 | | | | | Charles Schwab Corp. | | | 3,271,093 | | |
| | 22,600 | | | | | Goldman Sachs Group, Inc. | | | 4,898,550 | | |
| | 46,600 | | | | | Morgan Stanley | | | 3,908,808 | | |
| | | | 19,740,040 | | |
| | | | | Electric: 1.4% | |
| | 134,700 | | | @ | | AES Corp. | | | 2,947,236 | | |
| | | | 2,947,236 | | |
| | | | | Engineering & Construction: 1.9% | |
| | 46,800 | | | @ | | McDermott International, Inc. | | | 3,890,016 | | |
| | | | 3,890,016 | | |
| | | | | Food: 1.0% | |
| | 39,000 | | | L | | Kellogg Co. | | | 2,019,810 | | |
| | | | 2,019,810 | | |
| | | | | Healthcare-Products: 5.0% | |
| | 63,400 | | | | | Baxter International, Inc. | | | 3,571,956 | | |
| | 63,500 | | | @,L | | St. Jude Medical, Inc. | | | 2,634,615 | | |
| | 46,460 | | | @ | | Zimmer Holdings, Inc. | | | 3,943,989 | | |
| | | | 10,150,560 | | |
| | | | | Household Products/Wares: 1.4% | |
| | 46,500 | | | | | Clorox Co. | | | 2,887,650 | | |
| | | | 2,887,650 | | |
| | | | | Insurance: 2.5% | |
| | 30,300 | | | | | AMBAC Financial Group, Inc. | | | 2,641,857 | | |
| | 43,200 | | | | | Principal Financial Group | | | 2,518,128 | | |
| | | | 5,159,985 | | |
| | | | | Internet: 4.0% | |
| | 10,160 | | | @ | | Google, Inc. | | | 5,317,541 | | |
| | 91,500 | | | @,L | | VeriSign, Inc. | | | 2,903,295 | | |
| | | | 8,220,836 | | |
| | | | | Media: 5.1% | |
| | 189,550 | | | @,L | | Comcast Corp.-Class A | | | 5,330,146 | | |
| | 109,400 | | | L | | News Corp., Inc.-Class B | | | 2,509,636 | | |
| | 72,800 | | | | | Walt Disney Co. | | | 2,485,392 | | |
| | | | 10,325,174 | | |
| | | | | Metal Fabricate/Hardware: 1.6% | |
| | 26,300 | | | | | Precision Castparts Corp. | | | 3,191,768 | | |
| | | | 3,191,768 | | |
| | | | | Mining: 2.1% | |
| | 52,100 | | | | | Freeport-McMoRan Copper &
Gold, Inc. | | | 4,314,922 | | |
| | | | 4,314,922 | | |
| | | | | Miscellaneous Manufacturing: 6.8% | |
| | 59,900 | | | | | Cooper Industries Ltd. | | | 3,419,691 | | |
See Accompanying Notes to Financial Statements
75
PORTFOLIO OF INVESTMENTS
ING VP GROWTH PORTFOLIO AS OF JUNE 30, 2007 (UNAUDITED) (CONTINUED)
| Shares | | | | | | Value | |
| | | | | | | Miscellaneous Manufacturing
(continued) | | | | | |
| | 94,794 | | | | | Danaher Corp. | | $ | 7,156,947 | | |
| | 59,500 | | | | | Roper Industries, Inc. | | | 3,397,450 | | |
| | | | 13,974,088 | | |
| | | | | Oil & Gas: 1.6% | |
| | 39,600 | | | | | ExxonMobil Corp. | | | 3,321,648 | | |
| | | | 3,321,648 | | |
| | | | | Oil & Gas Services: 2.2% | |
| | 26,000 | | | @ | | Cameron International Corp. | | | 1,858,220 | | |
| | 25,100 | | | @ | | National Oilwell Varco, Inc. | | | 2,616,424 | | |
| | | | 4,474,644 | | |
| | | | | Packaging & Containers: 1.1% | |
| | 71,800 | | | @ | | Pactiv Corp. | | | 2,289,702 | | |
| | | | 2,289,702 | | |
| | | | | Pharmaceuticals: 8.5% | |
| | 118,200 | | | | | Abbott Laboratories | | | 6,329,610 | | |
| | 68,838 | | | @ | | Express Scripts, Inc. | | | 3,442,588 | | |
| | 64,200 | | | @ | | Gilead Sciences, Inc. | | | 2,489,034 | | |
| | 61,500 | | | | | Merck & Co., Inc. | | | 3,062,700 | | |
| | 51,900 | | | @@ | | Teva Pharmaceutical
Industries Ltd. ADR | | | 2,140,875 | | |
| | | | 17,464,807 | | |
| | | | | Retail: 5.3% | |
| | 98,500 | | | @ | | GameStop Corp. | | | 3,851,350 | | |
| | 50,400 | | | | | McDonald's Corp. | | | 2,558,304 | | |
| | 55,800 | | | L | | Nordstrom, Inc. | | | 2,852,496 | | |
| | 74,900 | | | @,L | | Saks, Inc. | | | 1,599,115 | | |
| | | | 10,861,265 | | |
| | | | | Semiconductors: 4.7% | |
| | 130,300 | | | L | | Altera Corp. | | | 2,883,539 | | |
| | 68,400 | | | @,L | | Nvidia Corp. | | | 2,825,604 | | |
| | 359,404 | | | @@ | | Taiwan Semiconductor
Manufacturing Co., Ltd. ADR | | | 4,000,167 | | |
| | | | 9,709,310 | | |
| | | | | Software: 3.2% | |
| | 131,300 | | | @,L | | Activision, Inc. | | | 2,451,371 | | |
| | 137,010 | | | | | Microsoft Corp. | | | 4,037,685 | | |
| | | | 6,489,056 | | |
| | | | | Telecommunications: 7.1% | |
| | 280,100 | | | @ | | Cisco Systems, Inc. | | | 7,800,785 | | |
| | 32,700 | | | @,L | | NII Holdings, Inc. | | | 2,640,198 | | |
| | 94,300 | | | | | Qualcomm, Inc. | | | 4,091,677 | | |
| | | | 14,532,660 | | |
| | | Total Common Stock
(Cost $187,146,334) | | | 203,762,246 | | |
| SHORT-TERM INVESTMENTS: 13.9% | | | |
| | | | | Mutual Fund: 0.5% | |
| | 1,000,000 | | | ** | | ING Institutional Prime Money
Market Fund | | | 1,000,000 | | |
| | | Total Mutual Fund
(Cost $1,000,000) | | | 1,000,000 | | |
Principal
Amount | | | | | | Value | |
| | | | | Repurchase Agreement: 0.3% | |
| $ | 512,000 | | | | | Morgan Stanley Repurchase
Agreement dated 06/29/07,
5.300%, due 07/02/07,
$512,226 to be received
upon repurchase
(Collateralized by $1,100,000
Resolution Funding
Corporation, Discount Note,
Market Value $524,271,
due 01/15/21) | | $ | 512,000 | | |
| | | Total Repurchase Agreement
(Cost $512,000) | | | 512,000 | | |
| | | | | Securities Lending Collateralcc: 13.1% | |
| | 26,886,000 | | | | | The Bank of New York
Institutional Cash
Reserves Fund | | | 26,886,000 | | |
| | | Total Securities
Lending Collateral
(Cost $26,886,000) | | | 26,886,000 | | |
| | | Total Short-Term
Investments
(Cost $28,398,000) | | | 28,398,000 | | |
Total Investments in
Securities
(Cost $215,544,334)* | | | 113.4 | % | | $ | 232,160,246 | | |
Other Assets and
Liabilities - Net | | | (13.4 | ) | | | (27,361,706 | ) | |
| Net Assets | | | 100.0 | % | | $ | 204,798,540 | | |
@ Non-income producing security
@@ Foreign Issuer
ADR American Depositary Receipt
cc Securities purchased with cash collateral for securities loaned.
L Loaned security, a portion or all of the security is on loan at June 30, 2007.
** Investment in affiliate
* Cost for federal income tax purposes is $215,859,903.
Net unrealized appreciation consists of:
| Gross Unrealized Appreciation | | $ | 18,340,030 | | |
| Gross Unrealized Depreciation | | | (2,039,687 | ) | |
| Net Unrealized Appreciation | | $ | 16,300,343 | | |
See Accompanying Notes to Financial Statements
76
PORTFOLIO OF INVESTMENTS
ING VP SMALL COMPANY PORTFOLIO AS OF JUNE 30, 2007 (UNAUDITED)
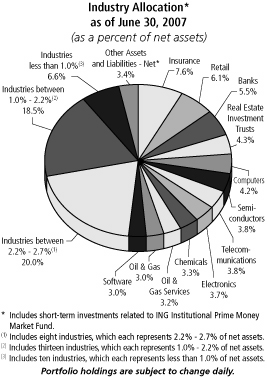
| Shares | | | | | | Value | |
| COMMON STOCK: 95.6% | | | |
| | | | | Aerospace/Defense: 2.6% | |
| | 80,800 | | | | | DRS Technologies, Inc. | | $ | 4,627,416 | | |
| | 108,500 | | | @ | | Moog, Inc. | | | 4,785,935 | | |
| | 128,700 | | | @ | | Teledyne Technologies, Inc. | | | 5,913,765 | | |
| | | | 15,327,116 | | |
| | | | | Apparel: 2.3% | |
| | 102,800 | | | @,@@,L | | Gildan Activewear, Inc. | | | 3,525,012 | | |
| | 93,300 | | | L | | Phillips-Van Heusen | | | 5,651,181 | | |
| | 141,800 | | | @ | | Steven Madden Ltd. | | | 4,645,368 | | |
| | | | 13,821,561 | | |
| | | | | Banks: 5.5% | |
| | 573,000 | | | L | | Bank Mutual Corp. | | | 6,606,690 | | |
| | 64,603 | | | L | | Citizens Banking Corp. | | | 1,182,235 | | |
| | 151,700 | | | L | | FirstMerit Corp. | | | 3,175,081 | | |
| | 143,000 | | | | | Provident Bankshares Corp. | | | 4,687,540 | | |
| | 148,000 | | | @,L | | Signature Bank | | | 5,046,800 | | |
| | 374,000 | | | @,L | | Superior Bancorp. | | | 3,826,020 | | |
| | 115,210 | | | L | | UMB Financial Corp. | | | 4,247,793 | | |
| | 129,600 | | | | | Whitney Holding Corp. | | | 3,900,960 | | |
| | | | 32,673,119 | | |
| | | | | Biotechnology: 1.1% | |
| | 69,900 | | | @,L | | Alexion Pharmaceuticals, Inc. | | | 3,149,694 | | |
| | 363,900 | | | @,L | | Human Genome Sciences, Inc. | | | 3,245,988 | | |
| | | | 6,395,682 | | |
| | | | | Building Materials: 0.9% | |
| | 236,700 | | | @,I | | Dayton Superior Corp. | | | 3,195,450 | | |
| | 106,300 | | | | | Gibraltar Industries, Inc. | | | 2,354,545 | | |
| | | | 5,549,995 | | |
| Shares | | | | | | Value | |
| | | | | Chemicals: 3.3% | |
| | 108,800 | | | | | Albemarle Corp. | | $ | 4,192,064 | | |
| | 55,200 | | | | | Cytec Industries, Inc. | | | 3,520,104 | | |
| | 135,000 | | | @,L | | Terra Industries, Inc. | | | 3,431,700 | | |
| | 270,500 | | | | | UAP Holding Corp. | | | 8,152,870 | | |
| | | | 19,296,738 | | |
| | | | | Commercial Services: 2.7% | |
| | 35,000 | | | @,L | | Advisory Board Co. | | | 1,944,600 | | |
| | 87,100 | | | | | Arbitron, Inc. | | | 4,488,263 | | |
| | 90,700 | | | @,L | | Exponent, Inc. | | | 2,028,959 | | |
| | 162,900 | | | @,L | | Geo Group, Inc. | | | 4,740,390 | | |
| | 127,710 | | | @ | | Live Nation, Inc. | | | 2,858,150 | | |
| | | | 16,060,362 | | |
| | | | | Computers: 4.2% | |
| | 58,200 | | | @,L | | CACI International, Inc. | | | 2,843,070 | | |
| | 114,700 | | | @,L | | Electronics for Imaging | | | 3,236,834 | | |
| | 222,800 | | | @,L | | Komag, Inc. | | | 7,105,092 | | |
| | 80,900 | | | @,@@,L | | Logitech International | | | 2,134,951 | | |
| | 102,600 | | | @ | | Mentor Graphics Corp. | | | 1,351,242 | | |
| | 80,100 | | | @,L | | Micros Systems, Inc. | | | 4,357,440 | | |
| | 320,200 | | | @ | | Radisys Corp. | | | 3,970,480 | | |
| | | | 24,999,109 | | |
| | | | | Distribution/Wholesale: 1.6% | |
| | 341,360 | | | @,L | | Brightpoint, Inc. | | | 4,707,354 | | |
| | 130,200 | | | L | | Owens & Minor, Inc. | | | 4,549,188 | | |
| | | | 9,256,542 | | |
| | | | | Diversified Financial Services: 1.6% | |
| | 103,950 | | | @ | | Investment Technology
Group, Inc. | | | 4,504,154 | | |
| | 187,200 | | | | | Waddell & Reed Financial, Inc. | | | 4,869,072 | | |
| | | | 9,373,226 | | |
| | | | | Electric: 2.2% | |
| | 83,100 | | | L | | Idacorp, Inc. | | | 2,662,524 | | |
| | 120,800 | | | | | ITC Holdings Corp. | | | 4,908,104 | | |
| | 185,500 | | | | | Portland General Electric Co. | | | 5,090,120 | | |
| | | | 12,660,748 | | |
| | | | | | | Electrical Components &
Equipment: 0.6% | | | | | |
| | 81,200 | | | | | Ametek, Inc. | | | 3,222,016 | | |
| | | | 3,222,016 | | |
| | | | | Electronics: 3.7% | |
| | 179,600 | | | @ | | Benchmark Electronics, Inc. | | | 4,062,552 | | |
| | 97,600 | | | @,L | | Cymer, Inc. | | | 3,923,520 | | |
| | 222,200 | | | @,L | | Kemet Corp. | | | 1,566,510 | | |
| | 61,200 | | | @ | | Thomas & Betts Corp. | | | 3,549,600 | | |
| | 122,787 | | | @ | | Trimble Navigation Ltd. | | | 3,953,741 | | |
| | 86,800 | | | @ | | Varian, Inc. | | | 4,759,244 | | |
| | | | 21,815,167 | | |
| | | | | | | Engineering &
Construction: 0.7% | | | | | |
| | 52,300 | | | @,L | | Washington Group
International, Inc. | | | 4,184,523 | | |
| | | | 4,184,523 | | |
| | | | | Entertainment: 1.0% | |
| | 191,700 | | | @,L | | Macrovision Corp. | | | 5,762,502 | | |
| | | | 5,762,502 | | |
See Accompanying Notes to Financial Statements
77
PORTFOLIO OF INVESTMENTS
ING VP SMALL COMPANY PORTFOLIO AS OF JUNE 30, 2007 (UNAUDITED) (CONTINUED)
| Shares | | | | | | Value | |
| | | | | Environmental Control: 0.7% | |
| | 138,200 | | | @ | | Waste Connections, Inc. | | $ | 4,179,168 | | |
| | | | 4,179,168 | | |
| | | | | Food: 0.6% | |
| | 82,500 | | | | | Corn Products International, Inc. | | | 3,749,625 | | |
| | | | 3,749,625 | | |
| | | | | Gas: 2.3% | |
| | 100,759 | | | L | | New Jersey Resources Corp. | | | 5,140,724 | | |
| | 160,700 | | | | | Vectren Corp. | | | 4,327,651 | | |
| | 126,500 | | | | | WGL Holdings, Inc. | | | 4,128,960 | | |
| | | | 13,597,335 | | |
| | | | | Healthcare-Products: 2.6% | |
| | 99,900 | | | | | Cooper Cos., Inc. | | | 5,326,668 | | |
| | 115,500 | | | @,L | | DJO, Inc. | | | 4,766,685 | | |
| | 107,100 | | | @,L | | Kyphon, Inc. | | | 5,156,865 | | |
| | | | 15,250,218 | | |
| | | | | Healthcare-Services: 2.6% | |
| | 82,726 | | | @,L | | Amedisys, Inc. | | | 3,005,436 | | |
| | 5,063 | | | @ | | LHC Group, Inc. | | | 132,651 | | |
| | 96,100 | | | @,L | | Magellan Health Services, Inc. | | | 4,465,767 | | |
| | 53,900 | | | @ | | Pediatrix Medical Group, Inc. | | | 2,972,585 | | |
| | 134,700 | | | @,L | | Psychiatric Solutions, Inc. | | | 4,884,222 | | |
| | | | 15,460,661 | | |
| | | | | Housewares: 1.4% | |
| | 143,000 | | | L | | Toro Co. | | | 8,421,270 | | |
| | | | 8,421,270 | | |
| | | | | Insurance: 7.6% | |
| | 150,300 | | | L | | American Equity Investment
Life Holding Co. | | | 1,815,624 | | |
| | 206,586 | | | @@ | | Aspen Insurance Holdings Ltd. | | | 5,798,869 | | |
| | 293,140 | | | @,L | | First Mercury Financial Corp. | | | 6,147,146 | | |
| | 145,800 | | | | | Ohio Casualty Corp. | | | 6,314,598 | | |
| | 42,800 | | | | | PMI Group, Inc. | | | 1,911,876 | | |
| | 79,600 | | | @,L | | ProAssurance Corp. | | | 4,431,332 | | |
| | 458,933 | | | @,@@,L | | RAM Holdings Ltd. | | | 7,228,192 | | |
| | 121,364 | | | | | Safety Insurance Group, Inc. | | | 5,024,470 | | |
| | 143,600 | | | @@ | | Security Capital Assurance Ltd. | | | 4,432,932 | | |
| | 46,900 | | | @,L | | Triad Guaranty, Inc. | | | 1,872,717 | | |
| | | | 44,977,756 | | |
| | | | | Leisure Time: 1.4% | |
| | 174,500 | | | @ | | K2, Inc. | | | 2,650,655 | | |
| | 103,500 | | | @,L | | Life Time Fitness, Inc. | | | 5,509,305 | | |
| | | | 8,159,960 | | |
| | | | | Machinery-Diversified: 2.2% | |
| | 148,667 | | | @,L | | Intermec, Inc. | | | 3,762,762 | | |
| | 65,300 | | | | | Nordson Corp. | | | 3,275,448 | | |
| | 46,200 | | | | | Tennant Co. | | | 1,686,300 | | |
| | 118,800 | | | | | Wabtec Corp. | | | 4,339,764 | | |
| | | | 13,064,274 | | |
| | | | | Media: 1.3% | |
| | 167,900 | | | | | Entercom Communications Corp. | | | 4,179,031 | | |
| | 201,200 | | | L | | GateHouse Media, Inc. | | | 3,732,260 | | |
| | | | 7,911,291 | | |
| | | | | Metal Fabricate/Hardware: 0.6% | |
| | 110,700 | | | | | Commercial Metals Co. | | | 3,738,339 | | |
| | | | 3,738,339 | | |
| Shares | | | | | | Value | |
| | | | | | | Miscellaneous
Manufacturing: 0.8% | | | | | |
| | 141,600 | | | L | | Barnes Group, Inc. | | $ | 4,485,888 | | |
| | | | 4,485,888 | | |
| | | | | Oil & Gas: 3.0% | |
| | 114,700 | | | @,L | | Carrizo Oil & Gas, Inc. | | | 4,756,609 | | |
| | 143,600 | | | @,L | | Denbury Resources, Inc. | | | 5,385,000 | | |
| | 238,800 | | | @,L | | EXCO Resources, Inc. | | | 4,164,672 | | |
| | 158,100 | | | @,L | | Parallel Petroleum Corp. | | | 3,462,390 | | |
| | | | 17,768,671 | | |
| | | | | Oil & Gas Services: 3.2% | |
| | 55,400 | | | @,@@,L | | Core Laboratories NV | | | 5,633,626 | | |
| | 43,300 | | | @ | | FMC Technologies, Inc. | | | 3,430,226 | | |
| | 216,700 | | | @ | | Global Industries Ltd. | | | 5,811,894 | | |
| | 102,800 | | | @,@@ | | North American
Energy Partners, Inc. | | | 2,082,728 | | |
| | 58,400 | | | @,L | | Tetra Technologies, Inc. | | | 1,646,880 | | |
| | | | 18,605,354 | | |
| | | | | Packaging & Containers: 1.2% | |
| | 182,800 | | | @ | | Crown Holdings, Inc. | | | 4,564,516 | | |
| | 41,600 | | | | | Silgan Holdings, Inc. | | | 2,299,648 | | |
| | | | 6,864,164 | | |
| | | | | Pharmaceuticals: 1.9% | |
| | 19,700 | | | @,L | | Alkermes, Inc. | | | 287,620 | | |
| | 172,100 | | | @,L | | BioMarin Pharmaceuticals, Inc. | | | 3,087,474 | | |
| | 91,100 | | | @,L | | Cubist Pharmaceuticals, Inc. | | | 1,795,581 | | |
| | 36,732 | | | @ | | HealthExtras, Inc. | | | 1,086,533 | | |
| | 85,700 | | | @,L | | Sciele Pharma, Inc. | | | 2,019,092 | | |
| | 59,400 | | | @,L | | USANA Health Sciences, Inc. | | | 2,657,556 | | |
| | | | 10,933,856 | | |
| | | | | Real Estate: 0.8% | |
| | 41,075 | | | | | Jones Lang LaSalle, Inc. | | | 4,662,013 | | |
| | | | 4,662,013 | | |
| | | | | | | Real Estate Investment
Trusts: 4.3% | | | | | |
| | 489,900 | | | | | American Financial Realty Trust | | | 5,055,768 | | |
| | 398,900 | | | | | Ashford Hospitality Trust, Inc. | | | 4,691,064 | | |
| | 167,500 | | | | | BioMed Realty Trust, Inc. | | | 4,207,600 | | |
| | 184,700 | | | | | Lexington Corporate
Properties Trust | | | 3,841,760 | | |
| | 101,100 | | | L | | Nationwide Health
Properties, Inc. | | | 2,749,920 | | |
| | 286,400 | | | | | U-Store-It Trust | | | 4,694,096 | | |
| | | | 25,240,208 | | |
| | | | | Retail: 6.1% | |
| | 188,900 | | | | | Casey's General Stores, Inc. | | | 5,149,414 | | |
| | 76,700 | | | @,L | | JOS A Bank Clothiers, Inc. | | | 3,180,749 | | |
| | 49,900 | | | | | Longs Drug Stores Corp. | | | 2,620,748 | | |
| | 82,000 | | | @,L | | Pantry, Inc. | | | 3,780,200 | | |
| | 145,000 | | | @ | | Papa John's International, Inc. | | | 4,170,200 | | |
| | 92,100 | | | | | Regis Corp. | | | 3,522,825 | | |
| | 198,800 | | | @,L | | Ruth's Chris Steak House | | | 3,377,612 | | |
| | 254,250 | | | | | Stage Stores, Inc. | | | 5,329,080 | | |
| | 113,900 | | | @,L | | Tween Brands, Inc. | | | 5,079,940 | | |
| | | | 36,210,768 | | |
| | | | | Savings & Loans: 2.7% | |
| | 291,500 | | | | | First Niagara Financial
Group, Inc. | | | 3,818,650 | | |
See Accompanying Notes to Financial Statements
78
PORTFOLIO OF INVESTMENTS
ING VP SMALL COMPANY PORTFOLIO AS OF JUNE 30, 2007 (UNAUDITED) (CONTINUED)
| Shares | | | | | | Value | |
| | | | | Savings & Loans (continued) | |
| | 472,600 | | | L | | NewAlliance Bancshares, Inc. | | $ | 6,956,672 | | |
| | 510,000 | | | | | Westfield Financial, Inc. | | | 5,084,700 | | |
| | | | 15,860,022 | | |
| | | | | Semiconductors: 3.8% | |
| | 150,000 | | | @,L | | Axcelis Technologies, Inc. | | | 973,500 | | |
| | 144,600 | | | @ | | DSP Group, Inc. | | | 2,959,962 | | |
| | 472,700 | | | @,L | | Entegris, Inc. | | | 5,615,676 | | |
| | 97,000 | | | @,L | | Fairchild Semiconductor
International, Inc. | | | 1,874,040 | | |
| | 114,400 | | | @,L | | Formfactor, Inc. | | | 4,381,520 | | |
| | 122,000 | | | | | Micrel, Inc. | | | 1,551,840 | | |
| | 99,700 | | | @,L | | Microsemi Corp. | | | 2,387,815 | | |
| | 227,900 | | | @,L | | ON Semiconductor Corp. | | | 2,443,088 | | |
| | | | 22,187,441 | | |
| | | | | Software: 3.0% | |
| | 308,300 | | | @ | | Ansys, Inc. | | | 8,169,950 | | |
| | 232,100 | | | @,L | | Informatica Corp. | | | 3,428,117 | | |
| | 138,550 | | | @ | | THQ, Inc. | | | 4,228,546 | | |
| | 46,900 | | | @,L | | Verifone Holdings, Inc. | | | 1,653,225 | | |
| | | | 17,479,838 | | |
| | | | | Storage/Warehousing: 0.7% | |
| | 148,400 | | | @,L | | Mobile Mini, Inc. | | | 4,333,280 | | |
| | | | 4,333,280 | | |
| | | | | Telecommunications: 3.8% | |
| | 323,200 | | | | | Alaska Communications
Systems Group, Inc. | | | 5,119,488 | | |
| | 174,100 | | | @,L | | Foundry Networks, Inc. | | | 2,900,506 | | |
| | 172,600 | | | @,L | | NeuStar, Inc. | | | 5,000,222 | | |
| | 71,000 | | | | | Otelco, Inc. | | | 1,391,600 | | |
| | 34,800 | | | @,L | | Polycom, Inc. | | | 1,169,280 | | |
| | 203,400 | | | @,L | | RCN Corp. | | | 3,821,886 | | |
| | 90,000 | | | @,L | | SBA Communications Corp. | | | 3,023,100 | | |
| | | | 22,426,082 | | |
| | | | | Textiles: 0.2% | |
| | 34,500 | | | | | G&K Services, Inc. | | | 1,363,095 | | |
| | | | 1,363,095 | | |
| | | | | Transportation: 1.7% | |
| | 103,800 | | | @,L | | American Commercial Lines, Inc. | | | 2,703,990 | | |
| | 115,900 | | | @ | | HUB Group, Inc. | | | 4,075,044 | | |
| | 61,000 | | | @ | | Kirby Corp. | | | 2,341,790 | | |
| | 47,700 | | | | | Pacer International, Inc. | | | 1,121,904 | | |
| | | | 10,242,728 | | |
| | | | | Trucking & Leasing: 1.1% | |
| | 241,400 | | | @@ | | Genesis Lease Ltd. ADR | | | 6,614,360 | | |
| | | | 6,614,360 | | |
| | | Total Common Stock
(Cost $495,668,949 ) | | | 564,186,071 | | |
| EXCHANGE-TRADED FUNDS: 1.0% | | | |
| | | | | Exchange-Traded Funds: 1.0% | |
| | 71,628 | | | L | | iShares Russell 2000 Index Fund | | | 5,942,259 | | |
| | | Total Exchange-Traded Funds
(Cost $5,597,533) | | | 5,942,259 | | |
| | | Total Long-Term Investments
(Cost $501,266,482) | | | 570,128,330 | | |
| Shares | | | | | | Value | |
| SHORT-TERM INVESTMENTS: 26.4% | |
| | | | | Mutual Fund: 3.7% | |
| | 22,000,000 | | | ** | | ING Institutional Prime
Money Market Fund | | $ | 22,000,000 | | |
| | | Total Mutual Fund
(Cost $22,000,000) | | | 22,000,000 | | |
Principal
Amount | | | | Value | |
| | | | | Repurchase Agreement: 0.3% | |
| $ | 1,634,000 | | | | | Morgan Stanley Repurchase
Agreement dated 06/29/07,
5.300%, due 07/02/07,
$1,634,722 to be received
upon repurchase
(Collateralized by $3,500,000
Resolution Funding
Corporation, Discount Note,
Market Value $1,668,135,
due 01/15/21) | | | 1,634,000 | | |
| | | Total Repurchase Agreement
(Cost $1,634,000) | | | 1,634,000 | | |
| | | | | Securities Lending Collateralcc: 22.4% | |
| | 131,970,000 | | | | | The Bank of New York
Institutional Cash
Reserves Fund | | | 131,970,000 | | |
| | | | 131,970,000 | | |
| | | Total Securities Lending
Collateral
(Cost $131,970,000) | | | 131,970,000 | | |
| | | Total Short-Term Investments
(Cost $155,604,000) | | | 155,604,000 | | |
Total Investments in
Securities
(Cost $656,870,482)* | | | 123.0 | % | | $ | 725,732,330 | | |
Other Assets and
Liabilities - Net | | | (23.0 | ) | | | (135,826,498 | ) | |
| Net Assets | | | 100.0 | % | | $ | 589,905,832 | | |
@ Non-income producing security
@@ Foreign Issuer
ADR American Depositary Receipt
cc Securities purchased with cash collateral for securities loaned.
I Illiquid security
L Loaned security, a portion or all of the security is on loan at June 30, 2007.
** Investment in affiliate
* Cost for federal income tax purposes is $657,631,044.
Net unrealized appreciation consists of:
| Gross Unrealized Appreciation | | $ | 79,740,107 | | |
| Gross Unrealized Depreciation | | | (11,638,821 | ) | |
| Net Unrealized Appreciation | | $ | 68,101,286 | | |
See Accompanying Notes to Financial Statements
79
PORTFOLIO OF INVESTMENTS
ING VP VALUE OPPORTUNITY PORTFOLIO AS OF JUNE 30, 2007 (UNAUDITED)
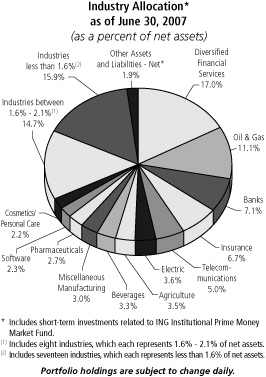
| Shares | | | | | | Value | |
| COMMON STOCK: 98.1% | | | |
| | | | | Aerospace/Defense: 0.8% | |
| | 23,400 | | | | | United Technologies Corp. | | $ | 1,659,762 | | |
| | | | 1,659,762 | | |
| | | | | Agriculture: 3.5% | |
| | 50,900 | | | | | Altria Group, Inc. | | | 3,570,126 | | |
| | 42,700 | | | | | Loews Corp. | | | 3,299,429 | | |
| | | | 6,869,555 | | |
| | | | | Airlines: 1.4% | |
| | 58,800 | | | @,L | | AMR Corp. | | | 1,549,380 | | |
| | 28,600 | | | @,L | | UAL Corp. | | | 1,160,874 | | |
| | | | 2,710,254 | | |
| | | | | Apparel: 1.8% | |
| | 95,900 | | | L | | Liz Claiborne, Inc. | | | 3,577,070 | | |
| | | | 3,577,070 | | |
| | | | | Auto Manufacturers: 0.7% | |
| | 37,500 | | | L | | General Motors Corp. | | | 1,417,500 | | |
| | | | 1,417,500 | | |
| | | | | Auto Parts & Equipment: 2.0% | |
| | 112,300 | | | @,L | | Goodyear Tire & Rubber Co. | | | 3,903,548 | | |
| | | | 3,903,548 | | |
| | | | | Banks: 7.1% | |
| | 93,600 | | | | | Bank of America Corp. | | | 4,576,104 | | |
| | 72,400 | | | @ | | Bank of New York Co., Inc. | | | 3,000,256 | | |
| | 27,100 | | | | | Commerce Bancorp., Inc. | | | 1,002,429 | | |
| | 70,900 | | | | | People's United Financial, Inc. | | | 1,257,057 | | |
| Shares | | | | | | Value | |
| | 114,000 | | | | | Wells Fargo & Co. | | $ | 4,009,380 | | |
| | | | 13,845,226 | | |
| | | | | Beverages: 3.3% | |
| | 42,400 | | | | | Coca-Cola Co. | | | 2,217,944 | | |
| | 55,500 | | | @@ | | Fomento Economico
Mexicano SA de CV ADR | | | 2,182,260 | | |
| | 22,145 | | | | | Molson Coors Brewing Co. | | | 2,047,527 | | |
| | | | 6,447,731 | | |
| | | | | Chemicals: 1.5% | |
| | 17,200 | | | | | Air Products & Chemicals, Inc. | | | 1,382,364 | | |
| | 52,263 | | | L | | HB Fuller Co. | | | 1,562,141 | | |
| | | | 2,944,505 | | |
| | | | | Coal: 1.0% | |
| | 39,300 | | | | | Peabody Energy Corp. | | | 1,901,334 | | |
| | | | 1,901,334 | | |
| | | | | Computers: 1.8% | |
| | 54,400 | | | | | Hewlett-Packard Co. | | | 2,427,328 | | |
| | 214,500 | | | @ | | Sun Microsystems, Inc. | | | 1,128,270 | | |
| | | | 3,555,598 | | |
| | | | | Cosmetics/Personal Care: 2.2% | |
| | 71,800 | | | | | Procter & Gamble Co. | | | 4,393,442 | | |
| | | | 4,393,442 | | |
| | | | | | | Diversified Financial
Services: 17.0% | | | | | |
| | 14,600 | | | @,L | | Affiliated Managers Group, Inc. | | | 1,879,896 | | |
| | 18,900 | | | | | Bear Stearns Cos., Inc. | | | 2,646,000 | | |
| | 39,900 | | | @,L | | Blackstone Group LP | | | 1,167,873 | | |
| | 110,400 | | | | | Citigroup, Inc. | | | 5,662,416 | | |
| | 27,500 | | | L | | Countrywide Financial Corp. | | | 999,625 | | |
| | 149,663 | | | @,L | | E*Trade Financial Corp. | | | 3,306,056 | | |
| | 36,300 | | | | | Freddie Mac | | | 2,203,410 | | |
| | 118,600 | | | @@ | | Invesco PLC | | | 1,528,170 | | |
| | 115,300 | | | | | JP Morgan Chase & Co. | | | 5,586,285 | | |
| | 56,100 | | | | | Merrill Lynch & Co., Inc. | | | 4,688,838 | | |
| | 31,500 | | | | | Morgan Stanley | | | 2,642,220 | | |
| | 33,000 | | | | | Raymond James Financial, Inc. | | | 1,019,700 | | |
| | | | 33,330,489 | | |
| | | | | Electric: 3.6% | |
| | 70,200 | | | @ | | Mirant Corp. | | | 2,994,030 | | |
| | 31,200 | | | @ | | NRG Energy, Inc. | | | 1,296,984 | | |
| | 30,500 | | | | | PG&E Corp. | | | 1,381,650 | | |
| | 43,000 | | | L | | Southern Co. | | | 1,474,470 | | |
| | | | 7,147,134 | | |
| | | | | | | Electrical Components &
Equipment: 0.8% | | | | | |
| | 21,200 | | | @,L | | General Cable Corp. | | | 1,605,900 | | |
| | | | 1,605,900 | | |
| | | | | Engineering & Construction: 1.7% | |
| | 89,700 | | | @ | | Infrasource Services, Inc. | | | 3,327,870 | | |
| | | | 3,327,870 | | |
| | | | | Entertainment: 1.0% | |
| | 87,100 | | | L | | Regal Entertainment Group | | | 1,910,103 | | |
| | | | 1,910,103 | | |
See Accompanying Notes to Financial Statements
80
PORTFOLIO OF INVESTMENTS
ING VP VALUE OPPORTUNITY PORTFOLIO AS OF JUNE 30, 2007 (UNAUDITED) (CONTINUED)
| Shares | | | | | | Value | |
| | | | | Food: 1.0% | |
| $ | 54,967 | | | | | Kraft Foods, Inc. | | $ | 1,937,587 | | |
| | | | 1,937,587 | | |
| | | | | Gas: 1.0% | |
| | 33,800 | | | | | Sempra Energy | | | 2,001,974 | | |
| | | | 2,001,974 | | |
| | | | | Healthcare-Products: 1.0% | |
| | 31,800 | | | | | Johnson & Johnson | | | 1,959,516 | | |
| | | | 1,959,516 | | |
| | | | | Home Builders: 0.2% | |
| | 11,417 | | | L | | KB Home | | | 449,487 | | |
| | | | 449,487 | | |
| | | | | Insurance: 6.7% | |
| | 62,200 | | | | | American International
Group, Inc. | | | 4,355,866 | | |
| | 44,200 | | | L | | MGIC Investment Corp. | | | 2,513,212 | | |
| | 32,700 | | | | | Principal Financial Group | | | 1,906,083 | | |
| | 41,925 | | | | | Stancorp Financial Group, Inc. | | | 2,200,224 | | |
| | 67,884 | | | | | WR Berkley Corp. | | | 2,208,945 | | |
| | | | 13,184,330 | | |
| | | | | Investment Companies: 0.6% | |
| | 80,970 | | | | | Blackrock Kelso Capital Corp. | | | 1,194,308 | | |
| | | | 1,194,308 | | |
| | | | | Iron/Steel: 1.2% | |
| | 22,500 | | | | | Allegheny Technologies, Inc. | | | 2,359,800 | | |
| | | | 2,359,800 | | |
| | | | | Lodging: 1.1% | |
| | 24,900 | | | @ | | MGM Mirage | | | 2,053,752 | | |
| | | | 2,053,752 | | |
| | | | | Media: 2.1% | |
| | 90,900 | | | @,L | | Comcast Corp.-Class A | | | 2,556,108 | | |
| | 69,700 | | | | | News Corp., Inc.-Class A | | | 1,478,337 | | |
| | | | 4,034,445 | | |
| | | | | Mining: 1.2% | |
| | 16,500 | | | @@ | | Alcan, Inc. | | | 1,341,450 | | |
| | 13,000 | | | | | Freeport-McMoRan
Copper & Gold, Inc. | | | 1,076,660 | | |
| | | | 2,418,110 | | |
| | | | | | | Miscellaneous
Manufacturing: 3.0% | | | | | |
| | 40,900 | | | | | Cooper Industries Ltd. | | | 2,334,981 | | |
| | 39,800 | | | | | Dover Corp. | | | 2,035,770 | | |
| | 41,800 | | | | | General Electric Co. | | | 1,600,104 | | |
| | | | 5,970,855 | | |
| | | | | Oil & Gas: 11.1% | |
| | 53,700 | | | | | ConocoPhillips | | | 4,215,450 | | |
| | 113,100 | | | | | ExxonMobil Corp. | | | 9,486,828 | | |
| | 44,200 | | | | | Occidental Petroleum Corp. | | | 2,558,296 | | |
| | 74,300 | | | @ | | Plains Exploration
& Production Co. | | | 3,552,283 | | |
| | 27,400 | | | | | Valero Energy Corp. | | | 2,023,764 | | |
| | | | 21,836,621 | | |
| Shares | | | | | | Value | |
| | | | | Pharmaceuticals: 2.7% | |
| | 29,600 | | | | | Merck & Co., Inc. | | $ | 1,474,080 | | |
| | 43,300 | | | | | Omnicare, Inc. | | | 1,561,398 | | |
| | 40,800 | | | | | Wyeth | | | 2,339,472 | | |
| | | | 5,374,950 | | |
| | | | | | | Real Estate Investment
Trusts: 1.8% | | | | | |
| | 42,900 | | | | | Liberty Property Trust | | | 1,884,597 | | |
| | 55,700 | | | | | Sunstone Hotel Investors, Inc. | | | 1,581,323 | | |
| | | | 3,465,920 | | |
| | | | | Retail: 1.9% | |
| | 25,700 | | | | | Macy's, Inc. | | | 1,022,346 | | |
| | 53,600 | | | | | McDonald's Corp. | | | 2,720,736 | | |
| | | | 3,743,082 | | |
| | | | | Savings & Loans: 0.9% | |
| | 144,600 | | | L | | Hudson City Bancorp., Inc. | | | 1,767,012 | | |
| | | | 1,767,012 | | |
| | | | | Semiconductors: 1.6% | |
| | 276,575 | | | @@ | | Taiwan Semiconductor
Manufacturing Co., Ltd. ADR | | | 3,078,280 | | |
| | | | 3,078,280 | | |
| | | | | Software: 2.3% | |
| | 95,400 | | | | | First Data Corp. | | | 3,116,718 | | |
| | 50,000 | | | | | Microsoft Corp. | | | 1,473,500 | | |
| | | | 4,590,218 | | |
| | | | | Telecommunications: 5.0% | |
| | 122,400 | | | | | AT&T, Inc. | | | 5,079,599 | | |
| | 183,000 | | | @,L | | Qwest Communications
International, Inc. | | | 1,775,100 | | |
| | 111,500 | | | @ | | Tellabs, Inc. | | | 1,199,740 | | |
| | 41,400 | | | | | Verizon Communications, Inc. | | | 1,704,438 | | |
| | | | 9,758,877 | | |
| | | | | Transportation: 0.5% | |
| | 8,600 | | | | | Union Pacific Corp. | | | 990,290 | | |
| | | | 990,290 | | |
| | | Total Common Stock
(Cost $164,965,168) | | | 192,716,435 | | |
| SHORT-TERM INVESTMENTS: 15.4% | | | |
| | | | | Mutual Fund: 1.8% | |
| | 3,500,000 | | | **,S | | ING Institutional Prime
Money Market Fund | | | 3,500,000 | | |
| | | Total Mutual Fund
(Cost $3,500,000) | | | 3,500,000 | | |
See Accompanying Notes to Financial Statements
81
PORTFOLIO OF INVESTMENTS
ING VP VALUE OPPORTUNITY PORTFOLIO AS OF JUNE 30, 2007 (UNAUDITED) (CONTINUED)
Principal
Amount | | | | Value | |
| | | | | Repurchase Agreement: 0.3% | |
| $ | 600,000 | | | | | Morgan Stanley Repurchase
Agreement dated 06/29/07,
5.300%, due 07/02/07,
$600,265 to be received
upon repurchase
(Collateralized by $1,285,000
Resolution Funding
Corporation, Discount Note,
Market Value $612,444,
due 01/15/21) | | $ | 600,000 | | |
| | | Total Repurchase Agreement
(Cost $600,000) | | | 600,000 | | |
| | | | | Securities Lending Collateralcc: 13.3% | |
| | 26,136,000 | | | | | The Bank of New York
Institutional Cash
Reserves Fund | | | 26,136,000 | | |
| | | Total Securities
Lending Collateral
(Cost $26,136,000) | | | 26,136,000 | | |
| | | Total Short-Term
Investments
(Cost $30,236,000) | | | 30,236,000 | | |
Total Investments in
Securities
(Cost $195,201,168)* | | | 113.5 | % | | $ | 222,952,435 | | |
Other Assets and
Liabilities-Net | | | (13.5 | ) | | | (26,510,597 | ) | |
| Net Assets | | | 100.0 | % | | $ | 196,441,838 | | |
@ Non-income producing security
@@ Foreign Issuer
ADR American Depositary Receipt
cc Securities purchased with cash collateral for securities loaned.
S All or a portion of segregated securities for certain derivatives, when-issued or delayed delivery securities and forward currency exchange contracts.
L Loaned security, a portion or all of the security is on loan at June 30, 2007.
** Investment in affiliate
* Cost for federal income tax purposes is $195,415,176.
Net unrealized appreciation consists of:
| Gross Unrealized Appreciation | | $ | 29,880,670 | | |
| Gross Unrealized Depreciation | | | (2,343,411 | ) | |
| Net Unrealized Appreciation | | $ | 27,537,259 | | |
See Accompanying Notes to Financial Statements
82
PORTFOLIO OF INVESTMENTS
ING VP INTERMEDIATE BOND PORTFOLIO AS OF JUNE 30, 2007 (UNAUDITED)
Industry Allocation
as of June 30, 2007
(as a percent of net assets)
| Collateralized Mortgage Obligations | | | 34.6 | % | |
| Federal National Mortgage Corporation | | | 16.0 | % | |
| Federal Home Loan Mortgage Corporation | | | 10.1 | % | |
| Diversified Financial Services | | | 6.9 | % | |
| Banks | | | 5.8 | % | |
| Treasury Inflation Indexed Protected Securities | | | 5.4 | % | |
| U.S. Treasury Notes | | | 4.2 | % | |
| U.S. Treasury Bonds | | | 2.8 | % | |
| Other Asset-Backed Securities | | | 1.9 | % | |
| Home Equity Asset-Backed Securities | | | 1.8 | % | |
| Electric | | | 1.5 | % | |
| Telecommunications | | | 1.4 | % | |
| Industries between 0.7% - 1.0%(1) | | | 5.5 | % | |
| Industries less than 0.7%(2) | | | 4.1 | % | |
| Other Assets and Liabilities - Net* | | | (2.0 | )% | |
| Net Assets | | | 100.0 | % | |
* Includes short-term investments related to repurchase agreement, securities lending
collateral and foreign government security.
(1) Includes seven industries, which each represents 0.7% - 1.0% of net assets.
(2) Includes fourteen industries, which each represents less than 0.7% of net assets.
Portfolio holdings are subject to change daily.
Principal
Amount | | | | | | Value | |
| CORPORATE BONDS/NOTES: 22.6% | | | |
| | | | | Airlines: 0.7% | |
| $ | 13,910,000 | | | C | | Delta Airlines, Inc.,
7.570%, due 11/18/10 | | $ | 14,443,240 | | |
| | 3,733,000 | | | Z | | United Airlines, Inc.,
6.932%, due 09/01/11 | | | 4,332,613 | | |
| | | | 18,775,853 | | |
| | | | | Auto Manufacturers: 0.2% | |
| | 1,590,000 | | | Z | | Ford Motor Co., Discount
Note, due 11/29/13 | | | 1,598,357 | | |
| | 4,695,000 | | | | | Ford Motor Co., 8.360%,
due 11/29/13 | | | 4,719,677 | | |
| | | | 6,318,034 | | |
| | | | | Banks: 5.8% | |
| | 7,320,000 | | | @@,C | | Australia & New Zealand
Banking Group Ltd.,
5.494%, due 12/31/49 | | | 6,373,971 | | |
| | 1,295,297 | | | @@,# | | Banco Itau SA, 5.621%,
due 09/20/08 | | | 1,295,297 | | |
| | 8,327,000 | | | @@,#,C | | Banco Mercantil del
NorteSA, 6.135%,
due 10/13/16 | | | 8,356,869 | | |
| | 2,800,000 | | | @@,C | | Bank of Ireland,
5.625%, due 12/29/49 | | | 2,438,573 | | |
| | 3,010,000 | | | @@,C | | Bank of Nova Scotia,
5.500%, due 08/21/85 | | | 2,491,518 | | |
| | 1,110,000 | | | @@,L | | Bank of Scotland, 5.563%,
due 11/30/49 | | | 958,659 | | |
| | 379,000 | | | C | | BankAmerica Capital II,
8.000%, due 12/15/26 | | | 394,043 | | |
Principal
Amount | | | | | | Value | |
| $ | 1,790,000 | | | @@,C | | Barclays Bank PLC,
5.563%, due 12/31/49 | | $ | 1,566,230 | | |
| | 4,870,000 | | | @@,C | | BNP Paribas, 5.402%,
due 09/29/49 | | | 4,177,812 | | |
| | 9,751,000 | | | @@,#,C | | Chuo Mitsui Trust &
Banking Co., Ltd.,
5.506%, due 04/15/49 | | | 9,218,166 | | |
| | 2,568,000 | | | @@,#,C | | Danske Bank A/S, 5.914%,
due 12/29/49 | | | 2,546,534 | | |
| | 3,080,000 | | | @@,C,L | | Den Norske Bank ASA,
5.500%, due 08/29/49 | | | 2,633,400 | | |
| | 510,000 | | | @@,C | | Den Norske Bank ASA,
5.625%, due 11/29/49 | | | 441,534 | | |
| | 6,186,000 | | | #,C | | Dresdner Funding Trust I,
8.151%, due 06/30/31 | | | 7,145,009 | | |
| | 2,000 | | | C | | Fleet Capital Trust II,
7.920%, due 12/11/26 | | | 2,078 | | |
| | 9,574,000 | | | @@,#,C | | HBOS PLC, 5.375%,
due 11/29/49 | | | 9,282,979 | | |
| | 3,970,000 | | | @@,C,L | | Hongkong & Shanghai
Banking Corp., Ltd.,
5.500%, due 07/29/49 | | | 3,378,184 | | |
| | 6,650,000 | | | @@,C | | HSBC Bank PLC, 5.538%,
due 06/29/49 | | | 5,702,375 | | |
| | 5,300,000 | | | @@,C,L | | HSBC Bank PLC, 5.625%,
due 06/29/49 | | | 4,589,801 | | |
| | 5,490,000 | | | @@,C | | Lloyds TSB Bank PLC,
5.478%, due 08/29/49 | | | 4,740,714 | | |
| | 510,000 | | | @@,C | | Lloyds TSB Bank PLC,
5.563%, due 11/29/49 | | | 443,865 | | |
| | 3,330,000 | | | @@,C | | Lloyds TSB Bank PLC,
5.625%, due 06/29/49 | | | 2,930,680 | | |
| | 6,355,000 | | | @@,C,L | | Mizuho Financial Group
Cayman Ltd., 8.375%,
due 12/31/49 | | | 6,637,995 | | |
| | 2,660,000 | | | @@,C | | National Australia
Bank Ltd.,5.525%,
due 12/31/49 | | | 2,309,564 | | |
| | 710,000 | | | @@,C,L | | National Westminster
Bank PLC, 5.500%,
due 11/29/49 | | | 611,931 | | |
| | 1,140,000 | | | @@,C | | National Westminster
BankPLC, 5.625%,
due 08/29/49 | | | 985,553 | | |
| | 4,649,000 | | | #,C | | Rabobank Capital
Funding II,5.260%,
due 12/29/49 | | | 4,464,388 | | |
| | 4,530,000 | | | #,C | | Rabobank Capital
Funding Trust, 5.254%,
due 12/31/49 | | | 4,249,113 | | |
| | 4,285,000 | | | C | | RBS Capital Trust I,
5.512%, due 09/30/49 | | | 4,124,390 | | |
| | 6,747,000 | | | @@,#,C | | Resona Bank Ltd.,
5.850%, due 09/29/49 | | | 6,461,804 | | |
| | 9,870,000 | | | @@,C,L | | Royal Bank of Scotland
Group PLC, 5.563%,
due 12/29/49 | | | 8,471,776 | | |
| | 2,570,000 | | | @@,C | | Societe Generale,
5.469%, due 11/29/49 | | | 2,221,919 | | |
| | 7,140,000 | | | @@,C | | Standard Chartered PLC,
5.563%, due 07/29/49 | | | 5,945,835 | | |
| | 1,150,000 | | | @@,C,L | | Standard Chartered PLC,
5.588%, due 01/29/49 | | | 956,656 | | |
See Accompanying Notes to Financial Statements
83
PORTFOLIO OF INVESTMENTS
ING VP INTERMEDIATE BOND PORTFOLIO AS OF JUNE 30, 2007 (UNAUDITED) (CONTINUED)
Principal
Amount | | | | | | Value | |
| | | | | Banks (continued) | |
| $ | 3,040,000 | | | @@,C | | Standard Chartered PLC,
5.588%, due 12/29/49 | | $ | 2,532,321 | | |
| | 11,400,000 | | | @@,C,L | | Standard Chartered PLC,
5.625%, due 11/29/49 | | | 9,604,500 | | |
| | 6,705,000 | | | @@,C | | Sumitomo Mitsui
BankingCorp., 8.150%,
due 08/01/49 | | | 6,884,949 | | |
| | 5,333,000 | | | C,L | | Wachovia Capital Trust III,
5.800%, due 12/31/49 | | | 5,314,121 | | |
| | 3,150,000 | | | @@,C | | Westpac Banking Corp.,
5.494%, due 09/30/49 | | | 2,696,737 | | |
| | 2,498,000 | | | #,C | | Westpac Capital Trust IV,
5.256%, due 12/29/49 | | | 2,322,153 | | |
| | 9,411,000 | | | @@,#,C | | Woori Bank, 6.125%,
due 05/03/16 | | | 9,464,097 | | |
| | | | 167,368,093 | | |
| | | | | Chemicals: 0.4% | |
| | 1,410,000 | | | Z | | Stauffer Chemical,
5.830%,due 04/15/10 | | | 1,203,816 | | |
| | 2,420,000 | | | Z | | Stauffer Chemical,
6.220%,due 04/15/18 | | | 1,261,207 | | |
| | 2,970,000 | | | Z | | Stauffer Chemical,
8.100%,due 04/15/17 | | | 1,645,885 | | |
| | 7,254,000 | | | L | | Union Carbide Corp.,
7.750%, due 10/01/96 | | | 7,400,009 | | |
| | | | 11,510,917 | | |
| | | | | Diversified Financial Services: 6.9% | |
| | 16,520,000 | | | @@,#,C,L | | Aiful Corp., 4.450%,
due 02/16/10 | | | 15,962,830 | | |
| | 1,006,000 | | | @@,#,I | | Alpine III, 5.910%,
due 08/16/14 | | | 1,008,939 | | |
| | 1,006,000 | | | @@,#,I | | Alpine III, 6.310%,
due 08/16/14 | | | 1,009,322 | | |
| | 1,507,000 | | | @@,#,I | | Alpine III, 8.110%,
due 08/16/14 | | | 1,516,818 | | |
| | 2,576,000 | | | @@,#,I | | Alpine III, 11.360%,
due 08/16/14 | | | 2,639,395 | | |
| | 17,659,000 | | | # | | Astoria Depositor Corp.,
8.144%, due 05/01/21 | | | 19,082,757 | | |
| | 4,546,000 | | | #,C | | Corestates Capital Trust I,
8.000%, due 12/15/26 | | | 4,708,533 | | |
| | 6,814,000 | | | @@ | | Eksportfinans A/S,
5.125%, due 10/26/11 | | | 6,769,355 | | |
| | 2,890,000 | | | @@,C | | Financiere CSFB NV,
5.500%, due 03/29/49 | | | 2,485,400 | | |
| | 8,272,000 | | | | | Ford Motor Credit Co.,
8.000%, due 12/15/16 | | | 7,936,132 | | |
| | 3,669,000 | | | | | Ford Motor Credit Co.,
8.105%, due 01/13/12 | | | 3,663,130 | | |
| | 7,223,000 | | | L | | Ford Motor Credit Co.,
9.806%, due 04/15/12 | | | 7,748,387 | | |
| | 5,852,000 | | | C | | Fund American Cos., Inc.,
5.875%, due 05/15/13 | | | 5,761,628 | | |
| | 9,145,000 | | | | | General Motors
Acceptance Corp.,
7.250%,due 03/02/11 | | | 9,122,229 | | |
| | 10,619,000 | | | C | | Goldman Sachs Capital II,
5.793%, due 12/31/49 | | | 10,374,444 | | |
| | 4,369,000 | | | #,C | | HVB Funding Trust III,
9.000%, due 10/22/31 | | | 5,446,972 | | |
Principal
Amount | | | | | | Value | |
| $ | 2,978,000 | | | C,L | | Lehman Brothers Capital
Trust VII, 5.857%,
due 11/29/49 | | $ | 2,920,182 | | |
| | 6,391,000 | | | C | | Lehman Brothers
Holdings Capital
Trust VIII,6.190%,
due 05/29/49 | | | 6,396,829 | | |
| | 8,668,000 | | | #,C | | Mangrove Bay Pass-
Through Trust, 6.102%,
due 07/15/33 | | | 8,411,861 | | |
| | 6,907,000 | | | @@,# | | Mantis Reef Ltd.,
4.799%, due 11/03/09 | | | 6,777,287 | | |
| | 5,605,000 | | | @@,C,L | | MUFG Capital
Finance 1 Ltd.,
6.346%, due 12/31/49 | | | 5,516,682 | | |
| | 2,560,000 | | | @@,C | | Paribas, 5.500%,
due 12/31/49 | | | 2,235,461 | | |
| | 1,290,667 | | | @@,#,C | | Petroleum Export Ltd.,
4.623%, due 06/15/10 | | | 1,274,922 | | |
| | 2,740,210 | | | @@,#,C | | Petroleum Export Ltd.,
5.265%, due 06/15/11 | | | 2,663,128 | | |
| | 5,262,487 | | | @@,#,C | | PF Export Receivables
Master Trust,
6.436%, due 06/01/15 | | | 5,443,385 | | |
| | 9,261,902 | | | #,C | | Piper Jaffray Equipment
Trust Securities,
6.000%,due 09/10/11 | | | 9,030,354 | | |
| | 7,674,691 | | | #,C | | Piper Jaffray Equipment
Trust Securities,
6.750%,due 04/01/11 | | | 7,617,131 | | |
| | 903,102 | | | # | | Power Receivable
Finance, LLC, 6.290%,
due 01/01/12 | | | 913,436 | | |
| | 8,607,000 | | | C | | Southern Star Central
Corp.,6.750%,
due 03/01/16 | | | 8,520,930 | | |
| | 9,082,000 | | | @@,# | | TNK-BP Finance SA,
7.500%, due 07/18/16 | | | 9,386,247 | | |
| | 32,846,336 | | | #,Z | | Toll Road Investors
Partnership II LP,
17.680%, due 02/15/45 | | | 4,238,984 | | |
| | 2,981,000 | | | #,C | | Twin Reefs Pass-
Through Trust,
6.320%, due 12/10/49 | | | 2,990,584 | | |
| | 6,653,000 | | | @@,C | | UFJ Finance Aruba AEC,
8.750%, due 12/31/49 | | | 6,920,411 | | |
| | 2,105,000 | | | #,C | | Wachovia Capital Trust V,
7.965%, due 06/01/27 | | | 2,191,682 | | |
| | | | 198,685,767 | | |
| | | | | Electric: 1.5% | |
| | 12,447,000 | | | C | | Commonwealth Edison
Co.,6.950%,
due 07/15/18 | | | 12,342,906 | | |
| | 1,542,000 | | | @@ | | Empresa Nacional de
Electricidad SA,
8.625%,due 08/01/15 | | | 1,775,511 | | |
| | 1,536,171 | | | #,C | | Juniper Generation, LLC,
6.790%, due 12/31/14 | | | 1,515,977 | | |
| | 5,310,000 | | | C | | Nevada Power Co.,
5.950%, due 03/15/16 | | | 5,218,195 | | |
| | 3,310,000 | | | C | | Nevada Power Co.,
6.750%, due 07/01/37 | | | 3,314,366 | | |
See Accompanying Notes to Financial Statements
84
PORTFOLIO OF INVESTMENTS
ING VP INTERMEDIATE BOND PORTFOLIO AS OF JUNE 30, 2007 (UNAUDITED) (CONTINUED)
Principal
Amount | | | | | | Value | |
| | | | | Electric (continued) | |
| $ | 8,873,000 | | | C | | NorthWestern Corp.,
5.875%, due 11/01/14 | | $ | 8,623,243 | | |
| | 1,325,000 | | | C,L | | Reliant Energy, Inc.,
7.625%, due 06/15/14 | | | 1,298,500 | | |
| | 661,000 | | | C,L | | Reliant Energy, Inc.,
7.875%, due 06/15/17 | | | 646,128 | | |
| | 8,677,000 | | | C | | Sierra Pacific Power Co.,
6.250%, due 04/15/12 | | | 8,790,469 | | |
| | | | 43,525,295 | | |
| | | | | Energy-Alternate Sources: 0.7% | |
| | 4,000,000 | | | | | Greater Ohio Ethanol,
LLC,8.864%,
due 12/31/13 | | | 3,965,000 | | |
| | 4,900,000 | | | | | Greater Ohio Ethanol,
LLC,12.630%,
due 12/31/13 | | | 4,753,000 | | |
| | 2,455,000 | | | # | | White Pine Hydro
Portfolio,LLC, 6.960%,
due 07/10/37 | | | 2,391,965 | | |
| | 3,936,000 | | | # | | White Pine Hydro
Portfolio,LLC, 7.260%,
due 07/20/15 | | | 3,875,708 | | |
| | 3,837,000 | | | # | | White Pine Hydro, LLC,
6.310%, due 07/10/17 | | | 3,765,233 | | |
| | | | 18,750,906 | | |
| | | | | Food: 0.8% | |
| | 23,045,000 | | | C | | HJ Heinz Finance Co.,
6.625%, due 07/15/11 | | | 23,731,165 | | |
| | | | 23,731,165 | | |
| | | | | Gas: 0.9% | |
| | 7,368,000 | | | @@,#,C | | Nakilat, Inc., 6.067%,
due 12/31/33 | | | 6,926,178 | | |
| | 4,147,000 | | | @@,#,C,L | | Nakilat, Inc., 6.267%,
due 12/31/33 | | | 3,950,909 | | |
| | 16,171,000 | | | C | | Southern Union Co.,
7.200%, due 11/01/66 | | | 16,273,201 | | |
| | | | 27,150,288 | | |
| | | | | Insurance: 0.6% | |
| | 9,566,000 | | | @@,C | | Aegon NV, 5.362%,
due 12/31/49 | | | 8,397,752 | | |
| | 1,741,000 | | | #,C | | North Front Pass-
Through Trust, 5.810%,
due 12/15/24 | | | 1,684,832 | | |
| | 6,528,000 | | | @@,C | | XL Capital, Ltd.,
6.500%, due 12/15/49 | | | 6,141,804 | | |
| | | | 16,224,388 | | |
| | | | | Media: 0.4% | |
| | 10,074,000 | | | #,C | | Charter Communications
Operating, LLC, 8.375%,
due 04/30/14 | | | 10,300,665 | | |
| | 1,862,000 | | | C | | Dex Media West, LLC,
9.875%, due 08/15/13 | | | 2,001,650 | | |
| | | | 12,302,315 | | |
| | | | | Multi-National: 0.2% | |
| | 4,459,000 | | | @@ | | Corp. Andina de
Fomento CAF, 5.125%,
due 05/05/15 | | | 4,241,659 | | |
| | | | 4,241,659 | | |
Principal
Amount | | | | | | Value | |
| | | | | Oil & Gas: 0.7% | |
| $ | 2,475,000 | | | @@,# | | Empresa Nacional de
Petroleo ENAP, 4.875%,
due 03/15/14 | | $ | 2,321,820 | | |
| | 1,588,000 | | | @@,# | | Empresa Nacional de
Petroleo ENAP, 6.750%,
due 11/15/12 | | | 1,656,143 | | |
| | 4,129,000 | | | C | | Pemex Project Funding
Master Trust, 6.625%,
due 06/15/35 | | | 4,196,096 | | |
| | 4,608,000 | | | # | | Pemex Project Funding
Master Trust, 6.660%,
due 06/15/10 | | | 4,739,328 | | |
| | 2,096,000 | | | @@,C | | Petroleos de Venezuela SA,
5.375%, due 04/12/27 | | | 1,383,360 | | |
| | 4,908,000 | | | @@,#,C | | Ras Laffan Liquefied
Natural Gas Co., Ltd. II,
5.298%, due 09/30/20 | | | 4,596,725 | | |
| | | | 18,893,472 | | |
| | | | | Pipelines: 0.2% | |
| | 1,893,000 | | | C,L | | Northwest Pipeline Corp.,
7.000%, due 06/15/16 | | | 1,982,918 | | |
| | 2,894,000 | | | C | | Transcontinental Gas
Pipe Line Corp.,
6.400%, due 04/15/16 | | | 2,915,705 | | |
| | | | 4,898,623 | | |
| | | | | Real Estate Investment Trusts: 1.0% | |
| | 2,828,000 | | | C | | Istar Financial, Inc.,
5.150%, due 03/01/12 | | | 2,724,142 | | |
| | 1,272,000 | | | C | | Istar Financial, Inc.,
5.500%, due 06/15/12 | | | 1,251,260 | | |
| | 3,398,000 | | | C | | Istar Financial, Inc.,
5.850%, due 03/15/17 | | | 3,265,308 | | |
| | 1,027,000 | | | C | | Liberty Property LP,
6.375%, due 08/15/12 | | | 1,057,135 | | |
| | 3,533,000 | | | C | | Liberty Property LP,
7.750%, due 04/15/09 | | | 3,668,144 | | |
| | 975,000 | | | C | | Rouse Co., 7.200%,
due 09/15/12 | | | 1,005,546 | | |
| | 14,834,000 | | | #,C | | Rouse Co. LP/TRC
Co.-Issuer, Inc.,
6.750%,due 05/01/13 | | | 14,894,997 | | |
| | | | 27,866,532 | | |
| | | | | Retail: 0.2% | |
| | 935,000 | | | #,C,L | | Rite Aid Corp., 9.375%,
due 12/15/15 | | | 902,275 | | |
| | 5,599,000 | | | #,C,L | | Rite Aid Corp., 9.500%,
due 06/15/17 | | | 5,403,035 | | |
| | | | 6,305,310 | | |
| | | | | Telecommunications: 1.4% | |
| | 9,173,000 | | | | | Bellsouth
Telecommunications, Inc.,
7.000%, due 12/01/95 | | | 9,096,937 | | |
| | 9,137,000 | | | C | | Qwest Corp., 7.875%,
due 09/01/11 | | | 9,571,008 | | |
| | 4,648,000 | | | @@,C | | Rogers Wireless, Inc.,
7.250%, due 12/15/12 | | | 4,913,141 | | |
| | 5,040,000 | | | C | | Sprint Capital Corp.,
6.875%, due 11/15/28 | | | 4,810,438 | | |
See Accompanying Notes to Financial Statements
85
PORTFOLIO OF INVESTMENTS
ING VP INTERMEDIATE BOND PORTFOLIO AS OF JUNE 30, 2007 (UNAUDITED) (CONTINUED)
Principal
Amount | | | | | | Value | |
| | | | | Telecommunications (continued) | |
| $ | 4,178,000 | | | C | | Sprint Nextel Corp.,
6.000%, due 12/01/16 | | $ | 3,970,445 | | |
| | 7,166,000 | | | @@,C | | TELUS Corp., 8.000%,
due 06/01/11 | | | 7,669,383 | | |
| | | | 40,031,352 | | |
| | | Total Corporate Bonds/
Notes
(Cost $654,470,433) | | | 646,579,969 | | |
| U.S. GOVERNMENT AGENCY OBLIGATIONS:26.3% | | | |
| | | | | | | Federal Home Loan Mortgage
Corporation: 10.1% | | | | | |
| | 2,212,728 | | | C | | 4.500%, due 12/15/16 | | | 2,168,935 | | |
| | 7,583,000 | | | C,S | | 4.500%, due 02/15/20 | | | 6,912,079 | | |
| | 8,637,743 | | | C,S | | 5.000%, due 08/15/16 | | | 8,414,316 | | |
| | 9,369,000 | | | C,S | | 5.000%, due 12/15/17 | | | 9,129,468 | | |
| | 1,621,000 | | | C | | 5.000%, due 05/15/20 | | | 1,542,484 | | |
| | 6,491,840 | | | C,S | | 5.000%, due 08/15/21 | | | 6,390,969 | | |
| | 7,694,000 | | | C,S | | 5.000%, due 04/15/23 | | | 7,209,570 | | |
| | 6,104,721 | | | C | | 5.000%, due 09/15/31 | | | 5,786,643 | | |
| | 2,317,000 | | | C | | 5.000%, due 02/15/32 | | | 2,176,476 | | |
| | 13,713,220 | | | C,S | | 5.000%, due 03/15/32 | | | 12,818,362 | | |
| | 6,181,000 | | | C | | 5.000%, due 04/15/32 | | | 5,899,976 | | |
| | 7,576,000 | | | C,S | | 5.000%, due 08/15/32 | | | 7,192,071 | | |
| | 11,016,000 | | | C,S | | 5.000%, due 12/15/32 | | | 10,455,973 | | |
| | 6,246,708 | | | C | | 5.000%, due 02/15/35 | | | 5,999,202 | | |
| | 1,291,498 | | | | | 5.018%, due 04/01/35 | | | 1,253,257 | | |
| | 15,107,000 | | | C | | 5.250%, due 03/15/12 | | | 14,979,739 | | |
| | 20,255,000 | | | Z | | 5.460%, due 03/15/31 | | | 5,651,631 | | |
| | 20,911,332 | | | C,S | | 5.500%, due 08/15/20 | | | 19,618,700 | | |
| | 3,877,000 | | | C | | 5.500%, due 12/15/20 | | | 3,767,765 | | |
| | 12,728,922 | | | C,S | | 5.500%, due 11/15/22 | | | 12,419,086 | | |
| | 11,420,000 | | | C,S | | 5.500%, due 09/15/32 | | | 11,057,335 | | |
| | 2,326,000 | | | C,S | | 5.500%, due 10/15/32 | | | 2,259,484 | | |
| | 2,068,000 | | | C | | 5.500%, due 11/15/32 | | | 1,993,898 | | |
| | 1,100,000 | | | C | | 5.500%, due 04/15/33 | | | 1,064,050 | | |
| | 2,511,000 | | | C | | 5.500%, due 06/15/33 | | | 2,428,887 | | |
| | 6,815,000 | | | C,S | | 5.500%, due 07/15/33 | | | 6,629,438 | | |
| | 2,504,547 | | | S | | 5.500%, due 06/01/36 | | | 2,401,866 | | |
| | 17,333,000 | | | | | 5.500%, due 08/14/36 | | | 16,691,375 | | |
| | 10,354,307 | | | C | | 6.000%, due 01/15/29 | | | 10,284,431 | | |
| | 6,680,686 | | | C,S | | 6.000%, due 01/15/29 | | | 6,698,286 | | |
| | 15,069,000 | | | W | | 6.000%, due 08/15/34 | | | 14,915,959 | | |
| | 14,586,000 | | | | | 6.000%, due 09/15/34 | | | 14,419,632 | | |
| | 16,795,431 | | | S | | 6.000%, due 02/01/36 | | | 16,726,865 | | |
| | 28,320,000 | | | | | 6.500%, due 07/15/34 | | | 28,616,482 | | |
| | 1,528,242 | | | | | 7.000%, due 09/01/26 | | | 1,575,127 | | |
| | 510,329 | | | | | 7.500%, due 11/01/28 | | | 534,186 | | |
| | | | 288,084,003 | | |
| | | | | | | Federal National Mortgage
Corporation: 16.0% | | | | | |
| | 36,495,642 | | | Z | | Discount Note,
due 04/01/49 | | | 33,752,776 | | |
| | 9,080,000 | | | W | | 4.500%, due 07/25/18 | | | 8,617,483 | | |
| | 3,028,792 | | | | | 4.592%, due 08/01/35 | | | 2,956,896 | | |
| | 1,055,869 | | | C | | 4.750%, due 12/25/42 | | | 1,051,765 | | |
| | 4,331,746 | | | | | 4.817%, due 08/01/35 | | | 4,231,118 | | |
| | 6,906,000 | | | L | | 4.875%, due 05/18/12 | | | 6,790,117 | | |
| | 1,216,812 | | | | | 4.951%, due 04/01/35 | | | 1,202,774 | | |
| | 43,536,000 | | | W | | 5.000%, due 07/18/21 | | | 42,073,452 | | |
| | 5,871,740 | | | | | 5.000%, due 02/25/29 | | | 5,739,790 | | |
| | 55,012,000 | | | W | | 5.000%, due 08/15/34 | | | 51,530,786 | | |
Principal
Amount | | | | | | Value | |
| $ | 11,126,386 | | | S | | 5.000%, due 12/01/36 | | $ | 10,455,477 | | |
| | 16,883,000 | | | W | | 5.000%, due 07/01/37 | | | 15,819,894 | | |
| | 9,466,145 | | | | | 5.000%, due 07/01/37 | | | 8,871,591 | | |
| | 1,504,109 | | | | | 5.065%, due 07/01/35 | | | 1,464,788 | | |
| | 6,131,056 | | | | | 5.156%, due 09/01/35 | | | 6,043,159 | | |
| | 1,073,707 | | | | | 5.225%, due 08/01/35 | | | 1,049,385 | | |
| | 13,276,000 | | | L | | 5.250%, due 08/01/12 | | | 13,176,523 | | |
| | 7,859,000 | | | C | | 5.400%, due 03/26/12 | | | 7,828,924 | | |
| | 20,345 | | | | | 5.500%, due 11/01/16 | | | 20,127 | | |
| | 104,482 | | | | | 5.500%, due 12/01/16 | | | 103,360 | | |
| | 18,248 | | | | | 5.500%, due 04/01/17 | | | 18,047 | | |
| | 38,536 | | | | | 5.500%, due 02/01/18 | | | 38,112 | | |
| | 12,878 | | | | | 5.500%, due 06/01/18 | | | 12,734 | | |
| | 61,635 | | | | | 5.500%, due 10/01/18 | | | 60,957 | | |
| | 3,538,000 | | | | | 5.500%, due 05/25/30 | | | 3,390,854 | | |
| | 3,892,445 | | | | | 5.500%, due 11/01/32 | | | 3,772,791 | | |
| | 10,367,913 | | | | | 5.500%, due 11/01/33 | | | 10,047,010 | | |
| | 13,135,894 | | | S | | 5.500%, due 11/01/33 | | | 12,732,097 | | |
| | 27,250,000 | | | W | | 5.500%, due 08/13/34 | | | 26,266,439 | | |
| | 11,048,022 | | | S | | 5.500%, due 01/25/36 | | | 10,592,426 | | |
| | 2,668,166 | | | S | | 5.500%, due 07/01/36 | | | 2,558,777 | | |
| | 13,979,609 | | | S | | 5.500%, due 12/25/36 | | | 13,493,395 | | |
| | 10,485,641 | | | | | 5.500%, due 02/25/37 | | | 10,222,377 | | |
| | 11,335,000 | | | C | | 5.550%, due 03/29/10 | | | 11,331,157 | | |
| | 2,678,793 | | | | | 5.570%, due 07/25/36 | | | 2,682,982 | | |
| | 141,094 | | | | | 6.000%, due 06/01/16 | | | 141,957 | | |
| | 17,591 | | | | | 6.000%, due 08/01/16 | | | 17,699 | | |
| | 272,584 | | | | | 6.000%, due 10/01/16 | | | 274,253 | | |
| | 314,360 | | | | | 6.000%, due 01/01/17 | | | 316,271 | | |
| | 131,678 | | | | | 6.000%, due 02/01/17 | | | 132,475 | | |
| | 663,527 | | | | | 6.000%, due 04/01/17 | | | 667,544 | | |
| | 432,244 | | | | | 6.000%, due 05/01/17 | | | 434,860 | | |
| | 174,995 | | | | | 6.000%, due 06/01/17 | | | 176,054 | | |
| | 328,397 | | | | | 6.000%, due 07/01/17 | | | 330,385 | | |
| | 552,135 | | | | | 6.000%, due 08/01/17 | | | 555,491 | | |
| | 1,718,007 | | | | | 6.000%, due 09/01/17 | | | 1,728,407 | | |
| | 7,132 | | | | | 6.000%, due 10/01/17 | | | 7,175 | | |
| | 404,420 | | | | | 6.000%, due 11/01/17 | | | 406,895 | | |
| | 9,636 | | | | | 6.000%, due 02/01/18 | | | 9,695 | | |
| | 388,361 | | | | | 6.000%, due 04/01/18 | | | 390,254 | | |
| | 106,667 | | | | | 6.000%, due 09/01/18 | | | 107,263 | | |
| | 128,633 | | | | | 6.000%, due 11/01/18 | | | 129,352 | | |
| | 166,722 | | | | | 6.000%, due 12/01/18 | | | 167,742 | | |
| | 6,224,794 | | | S | | 6.000%, due 07/25/29 | | | 6,232,415 | | |
| | 2,646,912 | | | | | 6.000%, due 07/25/29 | | | 2,650,742 | | |
| | 4,743,828 | | | | | 6.000%, due 04/25/31 | | | 4,770,267 | | |
| | 33,392,000 | | | W | | 6.000%, due 07/01/37 | | | 33,032,001 | | |
| | 2,422,635 | | | | | 6.500%, due 08/01/29 | | | 2,472,851 | | |
| | 213,969 | | | | | 6.500%, due 01/01/32 | | | 218,163 | | |
| | 142,873 | | | | | 6.500%, due 09/01/32 | | | 145,426 | | |
| | 412,197 | | | | | 6.500%, due 10/01/32 | | | 419,562 | | |
| | 60,763,000 | | | | | 6.500%, due 09/15/33 | | | 61,228,202 | | |
| | 451,000 | | | W | | 6.500%, due 08/15/34 | | | 454,876 | | |
| | 5,742,000 | | | | | 6.625%, due 11/15/30 | | | 6,491,193 | | |
| | 16,188 | | | | | 7.000%, due 08/01/25 | | | 16,776 | | |
| | 8,274 | | | | | 7.000%, due 10/01/25 | | | 8,575 | | |
| | 4,294 | | | | | 7.000%, due 11/01/25 | | | 4,450 | | |
| | 54,735 | | | | | 7.000%, due 12/01/25 | | | 56,720 | | |
| | 94,917 | | | | | 7.000%, due 02/01/26 | | | 98,360 | | |
| | 202,538 | | | | | 7.000%, due 03/01/26 | | | 209,918 | | |
| | 129,920 | | | | | 7.000%, due 01/01/30 | | | 134,760 | | |
| | 2,708,890 | | | | | 7.000%, due 06/01/31 | | | 2,809,242 | | |
| | 117,000 | | | W | | 7.000%, due 07/15/33 | | | 120,144 | | |
See Accompanying Notes to Financial Statements
86
PORTFOLIO OF INVESTMENTS
ING VP INTERMEDIATE BOND PORTFOLIO AS OF JUNE 30, 2007 (UNAUDITED) (CONTINUED)
Principal
Amount | | | | | | Value | |
| | | | | | | Federal National Mortgage
Corporation (continued) | | | | | |
| $ | 841 | | | I | | 7.125%, due 07/01/27 | | $ | 851 | | |
| | 12,588 | | | | | 7.500%, due 11/01/29 | | | 13,171 | | |
| | 79,406 | | | | | 7.500%, due 10/01/30 | | | 82,961 | | |
| | 105,435 | | | | | 7.500%, due 11/01/30 | | | 110,154 | | |
| | 1,601,172 | | | C | | 7.500%, due 01/25/48 | | | 1,651,218 | | |
| | 252,214 | | | | | 10.000%, due 02/25/19 | | | 277,125 | | |
| | | | 459,704,235 | | |
| | | | | | | Government National Mortgage
Association: 0.2% | | | | | |
| | 124,102 | | | | | 5.375%, due 04/20/28 | | | 125,635 | | |
| | 79,688 | | | | | 6.125%, due 12/20/29 | | | 80,308 | | |
| | 2,579,585 | | | | | 6.500%, due 10/15/31 | | | 2,633,969 | | |
| | 421,303 | | | | | 7.000%, due 04/15/26 | | | 439,540 | | |
| | 179,496 | | | | | 7.000%, due 05/15/32 | | | 187,116 | | |
| | 27,470 | | | | | 7.500%, due 04/15/22 | | | 28,740 | | |
| | 6,265 | | | | | 7.500%, due 05/15/22 | | | 6,555 | | |
| | 6,566 | | | | | 7.500%, due 06/15/22 | | | 6,870 | | |
| | 1,393 | | | | | 7.500%, due 08/15/22 | | | 1,457 | | |
| | 6,627 | | | | | 7.500%, due 06/15/24 | | | 6,941 | | |
| | 8,230 | | | | | 7.500%, due 01/15/26 | | | 8,628 | | |
| | 2,058 | | | | | 7.500%, due 07/15/26 | | | 2,158 | | |
| | 29,338 | | | | | 7.500%, due 03/15/29 | | | 30,743 | | |
| | 41,202 | | | | | 7.500%, due 04/15/29 | | | 43,176 | | |
| | 109,333 | | | | | 7.500%, due 08/15/29 | | | 114,571 | | |
| | 9,846 | | | | | 7.500%, due 09/15/29 | | | 10,317 | | |
| | 21,291 | | | | | 7.500%, due 10/15/29 | | | 22,311 | | |
| | 42,247 | | | | | 7.500%, due 12/15/29 | | | 44,274 | | |
| | 7,471 | | | | | 7.500%, due 01/15/30 | | | 7,826 | | |
| | 68,409 | | | | | 7.500%, due 02/15/30 | | | 71,663 | | |
| | 43,680 | | | | | 7.500%, due 05/15/30 | | | 45,758 | | |
| | 22,634 | | | | | 7.500%, due 06/15/30 | | | 23,711 | | |
| | 26,093 | | | | | 7.500%, due 07/15/30 | | | 27,334 | | |
| | 43,030 | | | | | 7.500%, due 08/15/30 | | | 45,078 | | |
| | 21,324 | | | | | 7.500%, due 10/15/30 | | | 22,338 | | |
| | 3,206 | | | | | 7.500%, due 11/15/30 | | | 3,354 | | |
| | 1,776 | | | | | 7.500%, due 01/15/31 | | | 1,860 | | |
| | 24,493 | | | | | 7.500%, due 02/15/31 | | | 25,654 | | |
| | 17,749 | | | | | 7.500%, due 03/15/31 | | | 18,590 | | |
| | 12,547 | | | | | 7.500%, due 04/15/31 | | | 13,141 | | |
| | 1,606 | | | | | 7.500%, due 09/15/31 | | | 1,682 | | |
| | 419,133 | | | | | 7.500%, due 12/15/31 | | | 439,060 | | |
| | 63,479 | | | | | 7.500%, due 01/15/32 | | | 66,503 | | |
| | 73,132 | | | | | 7.500%, due 03/15/32 | | | 76,590 | | |
| | 1,214 | | | | | 7.500%, due 04/15/32 | | | 1,270 | | |
| | 45,144 | | | | | 7.500%, due 05/15/32 | | | 47,233 | | |
| | 93,133 | | | | | 7.500%, due 06/15/32 | | | 97,443 | | |
| | 34,364 | | | | | 7.500%, due 07/15/32 | | | 35,955 | | |
| | 48,516 | | | | | 7.500%, due 08/15/32 | | | 50,761 | | |
| | | | 4,916,113 | | |
| | | Total U.S. Government
Agency Obligations
(Cost $760,325,214) | | | 752,704,351 | | |
| U.S. TREASURY OBLIGATIONS:12.4% | | | |
| | | | | U.S. Treasury Bonds: 2.8% | |
| | 40,928,000 | | | L | | 4.500%, due 05/15/17 | | | 39,252,530 | | |
| | 34,171,000 | | | L | | 4.500%, due 02/15/36 | | | 30,951,477 | | |
| | 10,000,000 | | | | | 4.875%, due 06/30/09 | | | 10,000,000 | | |
| | | | 80,204,007 | | |
Principal
Amount | | | | | | Value | |
| | | | | U.S. Treasury Notes: 4.2% | |
| $ | 32,189,000 | | | L | | 4.500%, due 05/15/10 | | $ | 31,862,089 | | |
| | 53,647,000 | | | L | | 4.750%, due 05/31/12 | | | 53,244,701 | | |
| | 33,269,000 | | | L | | 4.875%, due 05/31/09 | | | 33,269,033 | | |
| | | | 118,375,823 | | |
| | | | | | | Treasury Inflation Indexed
Protected Securities: 5.4% | | | | | |
| | 28,905,724 | | | L | | 2.375%, due 04/15/11 | | | 28,598,630 | | |
| | 33,992,858 | | | L | | 2.375%, due 01/15/17 | | | 33,198,819 | | |
| | 51,955,460 | | | L | | 2.375%, due 01/15/25 | | | 49,974,710 | | |
| | 42,904,972 | | | L | | 3.875%, due 01/15/09 | | | 43,602,221 | | |
| | | | 155,374,380 | | |
| | | Total U.S. Treasury
Obligations
(Cost $355,330,815) | | | 353,954,210 | | |
| ASSET-BACKED SECURITIES: 3.7% | | | |
| | | | | | | Automobile Asset-Backed
Securities: 0.0% | | | | | |
| | 688,560 | | | C | | AmeriCredit Automobile
Receivables Trust,
4.220%, due 07/06/09 | | | 686,396 | | |
| | | | 686,396 | | |
| | | | | | | Credit Card Asset-Backed
Securities: 0.0% | | | | | |
| | 6,000 | | | C | | Bank One Issuance Trust,
4.540%, due 09/15/10 | | | 5,970 | | |
| | | | 5,970 | | |
| | | | | | | Home Equity Asset-Backed
Securities: 1.8% | | | | | |
| | 2,353,000 | | | C,S | | Citigroup Mortgage
Loan Trust, Inc.,
5.590%, due 12/25/36 | | | 2,349,013 | | |
| | 1,000,000 | | | C | | Citigroup Mortgage
LoanTrust, Inc.,
5.620%, due 12/25/36 | | | 997,259 | | |
| | 10,593,000 | | | C,S | | GSAA Trust, 5.242%,
due 06/25/34 | | | 10,486,217 | | |
| | 2,021,000 | | | C | | GSAA Trust, 5.882%,
due 09/25/36 | | | 2,022,709 | | |
| | 9,441,000 | | | C,S | | GSAA Trust, 6.040%,
due 07/25/36 | | | 9,436,340 | | |
| | 3,328,000 | | | #,C | | Irwin Home Equity,
5.960%, due 08/25/37 | | | 3,329,754 | | |
| | 350,262 | | | C | | Merrill Lynch Mortgage
Investors, Inc.,
5.680%, due 07/25/34 | | | 351,551 | | |
| | 9,285,000 | | | C,S | | Morgan Stanley
Mortgage Loan Trust,
5.858%,due 01/25/47 | | | 9,179,208 | | |
| | 821,221 | | | C | | Renaissance Home
Equity Loan Trust,
4.456%, due 05/25/35 | | | 816,724 | | |
| | 2,507,884 | | | C | | Renaissance Home
Equity Loan Trust,
4.723%, due 11/25/35 | | | 2,496,751 | | |
| | 3,393,000 | | | C | | Residential Funding
Mortgage Securities II,
Inc., 5.890%,
due 05/25/37 | | | 3,388,236 | | |
See Accompanying Notes to Financial Statements
87
PORTFOLIO OF INVESTMENTS
ING VP INTERMEDIATE BOND PORTFOLIO AS OF JUNE 30, 2007 (UNAUDITED) (CONTINUED)
Principal
Amount | | | | | | Value | |
| | | | | | | Home Equity Asset-Backed
Securities (continued) | | | | | |
| $ | 4,000,000 | | | C | | Specialty Underwriting &
Residential Finance,
5.520%, due 12/25/36 | | $ | 4,004,701 | | |
| | 1,627,363 | | | C | | Wells Fargo Home
Equity Trust, 3.970%,
due 05/25/34 | | | 1,581,413 | | |
| | 500,000 | | | C | | Wells Fargo Home
Equity Trust, 4.430%,
due 05/25/34 | | | 478,439 | | |
| | | | 50,918,315 | | |
| | | | | | | Other Asset-Backed
Securities: 1.9% | | | | | |
| | 332,136 | | | C | | Amortizing Residential
Collateral Trust,
5.820%, due 05/25/32 | | | 332,188 | | |
| | 895,570 | | | C | | Bear Stearns Asset-
Backed Securities, Inc.,
5.720%, due 07/25/36 | | | 897,498 | | |
| | 609,287 | | | C | | Caterpillar Financial
Asset Trust, 5.590%,
due 02/25/09 | | | 609,918 | | |
| | 2,365 | | | C | | Chase Funding
Mortgage Loan,
4.045%, due 05/25/33 | | | 2,324 | | |
| | 838,597 | | | C | | Chase Funding
Mortgage Loan,
5.620%, due 07/25/33 | | | 840,238 | | |
| | 1,916,749 | | | C,S | | Countrywide Asset-
Backed Certificates,
4.493%,due 02/25/36 | | | 1,908,793 | | |
| | 6,668,000 | | | C,S | | Credit-Based Asset
Servicing and
Securitization, LLC,
4.831%, due 08/25/35 | | | 6,550,433 | | |
| | 4,266,000 | | | C | | Credit-Based Asset
Servicing and
Securitization, LLC,
5.501%, due 12/25/36 | | | 4,250,339 | | |
| | 3,360,000 | | | #,C | | Credit-Based Asset
Servicing and
Securitization, LLC,
5.746%, due 12/25/37 | | | 3,325,352 | | |
| | 2,876,000 | | | #,C | | Credit-Based Asset
Servicing and
Securitization, LLC,
6.020%, due 12/25/37 | | | 2,823,424 | | |
| | 3,375,000 | | | C | | Equity One, Inc.,
5.050%, due 09/25/33 | | | 3,329,211 | | |
| | 792,219 | | | C | | Fannie Mae Grantor Trust,
5.460%, due 04/25/35 | | | 793,809 | | |
| | 2,581,000 | | | C,Z | | First Horizon Asset Back
Trust, Discount Note,
due 09/25/29 | | | 2,581,000 | | |
| | 6,265,000 | | | @@,#,C | | Hudson Mezzanine
Funding, 6.110%,
due 06/12/42 | | | 3,483,340 | | |
| | 3,976,888 | | | C | | Lehman XS Trust,
5.600%, due 08/25/35 | | | 3,986,959 | | |
| | 540,774 | | | C | | Long Beach Mortgage
Loan Trust, 5.650%,
due 01/25/36 | | | 542,274 | | |
Principal
Amount | | | | | | Value | |
| $ | 1,951,817 | | | C | | Merrill Lynch Mortgage
Investors, Inc., 5.500%,
due 09/25/36 | | $ | 1,953,455 | | |
| | 5,845,000 | | | C | | Merrill Lynch Mortgage
Investors, Inc.,
5.520%, due 01/25/37 | | | 5,848,623 | | |
| | 2,065,000 | | | C | | Merrill Lynch Mortgage
Investors, Inc., 5.609%,
due 03/25/37 | | | 2,058,281 | | |
| | 1,654 | | | C | | Popular Mortgage
Pass-Through Trust,
4.000%, due 12/25/34 | | | 1,646 | | |
| | 1,697,000 | | | C | | Popular Mortgage
Pass-Through Trust,
4.596%, due 11/25/35 | | | 1,688,002 | | |
| | 1,380,000 | | | C | | Renaissance Home
Equity Loan Trust,
5.608%, due 05/25/36 | | | 1,376,225 | | |
| | 130,160 | | | C | | Residential Asset
Mortgage Products,Inc.,
5.630%, due 06/25/33 | | | 130,289 | | |
| | 3,626,875 | | | C | | Structured Asset
Securities Corp.,
4.910%, due 06/25/33 | | | 3,553,499 | | |
| | 1,520,989 | | | C | | Structured Asset
Securities Corp.,
6.000%, due 03/25/34 | | | 1,518,511 | | |
| | | | 54,385,631 | | |
| | | Total Asset-Backed
Securities
(Cost $109,179,142) | | | 105,996,312 | | |
| COLLATERALIZED MORTGAGE OBLIGATIONS: 34.6% | | | |
| | 843,317 | | | C | | American Home
Mortgage Assets,
5.819%, due 02/25/47 | | | 841,473 | | |
| | 5,062,874 | | | C | | American Home
Mortgage Assets,
6.029%, due 09/25/46 | | | 5,069,202 | | |
| | 5,808,344 | | | C | | American Home
Mortgage Investment
Trust,5.610%,
due 11/25/45 | | | 5,824,190 | | |
| | 7,691,810 | | | # | | Astoria Depositor Corp.,
7.902%, due 05/01/21 | | | 8,004,290 | | |
| | 11,331,402 | | | C,S | | Banc of America
Alternative Loan Trust,
6.290%, due 11/25/21 | | | 11,353,001 | | |
| | 8,697,834 | | | C,S | | Banc of America
Alternative Loan Trust,
6.505%, due 04/25/37 | | | 8,741,199 | | |
| | 138,293,916 | | | C,^ | | Banc of America
Commercial Mortgage,
Inc., 0.465%,
due 01/15/49 | | | 3,254,388 | | |
| | 781,000 | | | C | | Banc of America
Commercial Mortgage,
Inc., 4.161%,
due 12/10/42 | | | 760,322 | | |
See Accompanying Notes to Financial Statements
88
PORTFOLIO OF INVESTMENTS
ING VP INTERMEDIATE BOND PORTFOLIO AS OF JUNE 30, 2007 (UNAUDITED) (CONTINUED)
Principal
Amount | | | | | | Value | |
| COLLATERALIZED MORTGAGE OBLIGATIONS (continued) | | | |
| $ | 385,000 | | | C | | Banc of America
Commercial Mortgage,
Inc., 4.429%,
due 11/10/39 | | $ | 368,350 | | |
| | 3,941,000 | | | C | | Banc of America
Commercial Mortgage,
Inc., 4.502%,
due 07/10/42 | | | 3,789,428 | | |
| | 7,612,000 | | | C,S | | Banc of America
Commercial Mortgage,
Inc., 4.611%,
due 07/10/43 | | | 7,466,079 | | |
| | 2,735,000 | | | C | | Banc of America
Commercial Mortgage,
Inc., 4.764%,
due 07/10/45 | | | 2,681,376 | | |
| | 4,101,590 | | | C | | Banc of America
Commercial Mortgage,
Inc., 4.772%,
due 07/11/43 | | | 4,041,473 | | |
| | 4,150,000 | | | C | | Banc of America
Commercial Mortgage,
Inc., 4.891%,
due 07/10/45 | | | 4,017,701 | | |
| | 3,295,000 | | | C | | Banc of America
Commercial Mortgage,
Inc., 5.463%,
due 09/10/47 | | | 3,151,544 | | |
| | 970,000 | | | C | | Banc of America
CommercialMortgage,
Inc., 6.186%,
due 06/11/35 | | | 990,940 | | |
| | 12,030,857 | | | C,S | | Banc of America
Funding Corp.,
5.259%, due 09/20/35 | | | 11,644,085 | | |
| | 6,927,094 | | | C,S | | Banc of America
Funding Corp.,
5.530%, due 05/20/47 | | | 6,940,371 | | |
| | 8,141,072 | | | C | | Banc of America
Funding Corp.,
5.530%, due 06/20/47 | | | 8,141,072 | | |
| | 20,076,799 | | | C,S | | Banc of America
Funding Corp.,
5.655%, due 06/20/37 | | | 19,771,632 | | |
| | 5,627,075 | | | C | | Banc of America
Funding Corp.,
5.750%, due 09/20/34 | | | 5,576,859 | | |
| | 5,518,695 | | | C | | Banc of America
Funding Corp.,
5.851%, due 05/20/36 | | | 5,464,456 | | |
| | 5,430,000 | | | C | | Banc of America
Mortgage Securities,
Inc., 4.144%,
due 07/25/34 | | | 5,302,582 | | |
| | 5,673,803 | | | C | | Banc of America
Mortgage Securities,
Inc., 5.181%,
due 09/25/35 | | | 5,516,291 | | |
| | 2,029,358 | | | C | | Banc of America
Mortgage Securities,
Inc., 5.250%,
due 11/25/19 | | | 2,012,454 | | |
Principal
Amount | | | | | | Value | |
| $ | 2,158,120 | | | C | | Banc of America
Mortgage Securities,
Inc., 5.500%,
due 11/25/33 | | $ | 2,066,716 | | |
| | 4,318,683 | | | C | | Banc of America
Mortgage Securities,
Inc., 5.500%,
due 06/25/35 | | | 4,286,798 | | |
| | 2,962,418 | | | C | | Bank of America
Alternative Loan Trust,
6.500%, due 04/25/36 | | | 2,973,989 | | |
| | 10,248,410 | | | C | | Bank of America
Alternative Loan Trust,
6.500%,
due 05/25/46 | | | 10,331,007 | | |
| | 1,465,222 | | | C | | Bear Stearns Alternative-
A Trust, 5.640%,
due 07/25/34 | | | 1,463,395 | | |
| | 3,083,000 | | | C | | Bear Stearns Commercial
Mortgage Securities,
3.880%, due 08/13/39 | | | 3,035,470 | | |
| | 405,000 | | | C | | Bear Stearns Commercial
Mortgage Securities,
4.030%, due 02/13/46 | | | 391,565 | | |
| | 2,236,593 | | | C | | Bear Stearns Commercial
Mortgage Securities,
4.170%, due 01/12/41 | | | 2,197,636 | | |
| | 1,206,000 | | | C | | Bear Stearns Commercial
Mortgage Securities,
4.565%, due 07/11/42 | | | 1,161,977 | | |
| | 5,915,379 | | | C | | Bear Stearns Commercial
Mortgage Securities,
5.415%, due 04/12/38 | | | 5,908,753 | | |
| | 5,802,000 | | | | | Bear Stearns Commercial
Mortgage Securities,
5.660%, due 09/11/41 | | | 5,641,021 | | |
| | 3,221,000 | | | C | | Bear Stearns Commercial
Mortgage Securities,
7.780%, due 02/15/32 | | | 3,367,845 | | |
| | 753,255 | | | C | | Capco America
Securitization Corp.,
6.260%, due 10/15/30 | | | 758,618 | | |
| | 279,000 | | | C | | Capco America
Securitization Corp.,
6.460%, due 10/15/30 | | | 282,362 | | |
| | 6,004,096 | | | C,S | | Chase Manhattan
Bank-First
Union National Bank,
7.439%, due 08/15/31 | | | 6,201,607 | | |
| | 11,602,196 | | | C,S | | Chase Mortgage Finance
Corp., 5.414%,
due 12/25/35 | | | 11,290,387 | | |
| | 7,556,558 | | | C,S | | Chase Mortgage Finance
Corp., 5.500%,
due 11/25/35 | | | 7,476,331 | | |
| | 9,885,952 | | | C | | Chaseflex Trust, 6.500%,
due 02/25/37 | | | 9,936,584 | | |
| | 6,381,149 | | | C,S | | Citigroup Mortgage
Loan Trust, Inc.,
5.940%, due 06/25/36 | | | 6,358,016 | | |
| | 12,222,706 | | | C,S | | Citigroup Mortgage
Loan Trust, Inc.,
6.000%, due 11/25/35 | | | 12,131,056 | | |
See Accompanying Notes to Financial Statements
89
PORTFOLIO OF INVESTMENTS
ING VP INTERMEDIATE BOND PORTFOLIO AS OF JUNE 30, 2007 (UNAUDITED) (CONTINUED)
Principal
Amount | | | | | | Value | |
| COLLATERALIZED MORTGAGE OBLIGATIONS (continued) | | | |
| $ | 25,321,790 | | | C,S | | Citigroup Mortgage
Loan Trust, Inc.,
6.075%, due 08/25/36 | | $ | 25,147,829 | | |
| | 2,655,606 | | | C | | Citigroup Mortgage
Securities, Inc.,
5.500%, due 02/25/22 | | | 2,637,725 | | |
| | 819,000 | | | C | | Commercial Mortgage
Pass-Through
Certificates, 3.600%,
due 03/10/39 | | | 798,397 | | |
| | 12,521,127 | | | C,S | | Countrywide Alternative
Loan Trust, 5.419%,
due 10/25/35 | | | 12,162,960 | | |
| | 1,818,697 | | | C | | Countrywide Alternative
Loan Trust, 5.500%,
due 02/25/25 | | | 1,796,367 | | |
| | 2,946,255 | | | C | | Countrywide Alternative
Loan Trust, 5.560%,
due 11/25/46 | | | 2,957,639 | | |
| | 485,520 | | | C | | Countrywide Alternative
Loan Trust, 5.620%,
due 02/25/35 | | | 486,029 | | |
| | 8,251,970 | | | C,S | | Countrywide Alternative
Loan Trust, 5.909%,
due 11/25/46 | | | 8,251,145 | | |
| | 1,618,379 | | | C | | Countrywide Alternative
Loan Trust, 6.000%,
due 05/25/36 | | | 1,626,617 | | |
| | 6,984,267 | | | C,S | | Countrywide Alternative
Loan Trust, 6.020%,
due 09/25/36 | | | 6,994,225 | | |
| | 4,113,447 | | | C | | Countrywide Home Loan
Mortgage Pass-
Through Trust,
5.250%, due 10/25/35 | | | 3,881,653 | | |
| | 20,869,230 | | | C,S | | Countrywide Home Loan
Mortgage Pass-
Through Trust,
5.750%, due 07/25/37 | | | 20,758,372 | | |
| | 2,995,414 | | | C | | Credit Suisse First Boston
Mortgage Securities
Corp., 3.727%,
due 03/15/35 | | | 2,900,246 | | |
| | 1,102,113 | | | C | | Credit Suisse First Boston
Mortgage Securities
Corp., 3.819%,
due 05/15/36 | | | 1,050,667 | | |
| | 17,000 | | | C | | Credit Suisse First Boston
Mortgage Securities
Corp., 3.861%,
due 03/15/36 | | | 16,738 | | |
| | 2,328,000 | | | C,S,L | | Credit Suisse First Boston
Mortgage Securities
Corp., 4.801%,
due 03/15/36 | | | 2,230,349 | | |
| | 1,601,065 | | | C | | Credit Suisse First Boston
Mortgage Securities
Corp., 5.000%,
due 08/25/20 | | | 1,567,291 | | |
| | 4,000 | | | C | | Credit Suisse First Boston
Mortgage Securities
Corp., 7.781%,
due 04/15/62 | | | 4,241 | | |
Principal
Amount | | | | | | Value | |
| $ | 3,988,179 | | | C | | Credit Suisse Mortgage
Capital Certificates,
7.000%, due 08/25/36 | | $ | 4,063,424 | | |
| | 21,291 | | | C | | DLJ Commercial
Mortgage Corp.,
6.240%, due 11/12/31 | | | 21,431 | | |
| | 61,541 | | | C | | DLJ Commercial
Mortgage Corp.,
7.300%, due 06/10/32 | | | 63,275 | | |
| | 12,384,729 | | | C,S | | First Horizon Alternative
Mortgage Securities,
5.500%, due 08/25/35 | | | 12,200,010 | | |
| | 4,487,456 | | | C | | First Horizon Asset
Securities, Inc.,
5.500%, due 12/25/35 | | | 4,440,937 | | |
| | 3,400,000 | | | C | | First Union National Bank
Commercial Mortgage,
6.663%, due 01/12/43 | | | 3,515,067 | | |
| | 5,046,678 | | | C | | Freddie Mac, 5.970%,
due 04/15/32 | | | 5,115,218 | | |
| | 141,220,464 | | | C,S,^ | | GE Capital Commercial
Mortgage Corp.,
0.680%, due 06/10/48 | | | 2,517,820 | | |
| | 1,708,691 | | | C | | GE Capital Commercial
Mortgage Corp.,
3.752%, due 07/10/39 | | | 1,679,607 | | |
| | 793,000 | | | C | | GE Capital Commercial
Mortgage Corp.,
4.371%, due 01/10/38 | | | 770,966 | | |
| | 301,000 | | | C | | GE Capital Commercial
Mortgage Corp.,
4.865%, due 07/10/39 | | | 292,952 | | |
| | 1,052,334 | | | C | | GE Capital Commercial
Mortgage Corp.,
5.560%, due 06/10/38 | | | 1,053,955 | | |
| | 3,496,670 | | | C | | GMAC Mortgage Corp.
Loan Trust, 4.597%,
due 10/19/33 | | | 3,394,014 | | |
| | 8,345,231 | | | C,S | | GMAC Mortgage Corp.
Loan Trust, 5.259%,
due 03/18/35 | | | 8,076,946 | | |
| | 109,408,599 | | | #,C,^ | | Greenwich Capital
Commercial Funding
Corp., 0.512%,
due 03/10/39 | | | 2,665,117 | | |
| | 6,606,000 | | | C,S | | Greenwich Capital
Commercial Funding
Corp., 5.117%,
due 04/10/37 | | | 6,536,770 | | |
| | 3,280,000 | | | C | | Greenwich Capital
Commercial Funding
Corp., 5.534%,
due 03/10/39 | | | 3,149,266 | | |
| | 1,660,000 | | | C | | Greenwich Capital
Commercial Funding
Corp., 5.554%,
due 03/10/39 | | | 1,592,795 | | |
| | 1,325,000 | | | C | | Greenwich Capital
Commercial Funding
Corp., 5.613%,
due 03/10/39 | | | 1,265,150 | | |
| | 4,390,000 | | | C | | GS Mortgage Securities
Corp. II, 5.814%,
due 04/10/38 | | | 4,257,578 | | |
See Accompanying Notes to Financial Statements
90
PORTFOLIO OF INVESTMENTS
ING VP INTERMEDIATE BOND PORTFOLIO AS OF JUNE 30, 2007 (UNAUDITED) (CONTINUED)
Principal
Amount | | | | | | Value | |
| COLLATERALIZED MORTGAGE OBLIGATIONS (continued) | | | |
| $ | 1,319,414 | | | #,C | | GSMPS 2005-RP1 1AF,
5.670%, due 01/25/35 | | $ | 1,325,716 | | |
| | 3,063,065 | | | C | | GSR Mortgage Loan
Trust, 5.500%,
due 07/25/35 | | | 3,009,143 | | |
| | 1,466,426 | | | C | | Harborview Mortgage
Loan Trust, 5.670%,
due 01/19/35 | | | 1,471,787 | | |
| | 899,939 | | | C | | Homebanc Mortgage
Trust, 5.750%,
due 08/25/29 | | | 900,500 | | |
| | 15,000,000 | | | C,S | | JP Morgan Alternative
Loan Trust, 5.490%,
due 08/25/36 | | | 15,037,554 | | |
| | 1,222,735 | | | | | JP Morgan Alternative
Loan Trust, 5.510%,
due 01/25/36 | | | 1,217,086 | | |
| | 389,030,899 | | | C,^ | | JP Morgan Chase
Commercial Mortgage
Securities Corp.,
0.090%, due 01/12/43 | | | 849,682 | | |
| | 840,272 | | | C | | JP Morgan Chase
Commercial Mortgage
Securities Corp.,
4.200%, due 07/12/35 | | | 818,653 | | |
| | 3,890,000 | | | C | | JP Morgan Chase
Commercial Mortgage
Securities Corp.,
4.223%, due 01/15/42 | | | 3,778,827 | | |
| | 5,742,255 | | | C | | JP Morgan Chase
Commercial Mortgage
Securities Corp.,
4.275%, due 01/12/37 | | | 5,591,320 | | |
| | 978,000 | | | C | | JP Morgan Chase
Commercial Mortgage
Securities Corp.,
5.455%, due 05/15/47 | | | 949,576 | | |
| | 1,951,000 | | | C | | JP Morgan Chase
Commercial Mortgage
Securities Corp.,
5.495%, due 05/15/47 | | | 1,885,128 | | |
| | 4,589,000 | | | C | | JP Morgan Chase
Commercial Mortgage
Securities Corp.,
5.857%, due 10/12/35 | | | 4,625,643 | | |
| | 703,200 | | | C | | JP Morgan Chase
Commercial Mortgage
Securities Corp.,
6.024%, due 04/15/45 | | | 709,079 | | |
| | 4,005,000 | | | C | | JP Morgan Chase
Commercial Mortgage
Securities Corp.,
6.052%, due 04/15/45 | | | 4,052,093 | | |
| | 27,998,569 | | | C,S | | JP Morgan Mortgage
Trust, 5.406%,
due 11/25/35 | | | 27,540,554 | | |
| | 28,121,093 | | | C,^ | | LB-UBS Commercial
Mortgage Trust,
0.675%, due 02/15/40 | | | 985,774 | | |
| | 1,794,000 | | | C | | LB-UBS Commercial
Mortgage Trust,
3.992%, due 10/15/29 | | | 1,739,962 | | |
Principal
Amount | | | | | | Value | |
| $ | 6,291,000 | | | C,S | | LB-UBS Commercial
Mortgage Trust,
4.201%, due 12/15/29 | | $ | 6,123,737 | | |
| | 499,000 | | | C | | LB-UBS Commercial
Mortgage Trust,
4.310%, due 02/15/30 | | | 485,415 | | |
| | 1,707,000 | | | C | | LB-UBS Commercial
Mortgage Trust,
4.510%, due 12/15/29 | | | 1,636,622 | | |
| | 2,276,000 | | | C | | LB-UBS Commercial
Mortgage Trust,
4.567%, due 06/15/29 | | | 2,246,374 | | |
| | 2,570,112 | | | C | | LB-UBS Commercial
Mortgage Trust,
4.821%, due 04/15/30 | | | 2,532,894 | | |
| | 1,066,000 | | | C | | LB-UBS Commercial
Mortgage Trust,
4.836%, due 02/15/40 | | | 995,089 | | |
| | 2,050,000 | | | C | | LB-UBS Commercial
Mortgage Trust,
4.885%, due 09/15/30 | | | 2,021,488 | | |
| | 2,416,000 | | | C,S | | LB-UBS Commercial
Mortgage Trust,
4.998%, due 04/15/30 | | | 2,352,587 | | |
| | 3,322,000 | | | C | | LB-UBS Commercial
Mortgage Trust,
5.103%, due 11/15/30 | | | 3,285,356 | | |
| | 4,256,000 | | | C | | LB-UBS Commercial
Mortgage Trust,
5.395%, due 04/15/40 | | | 4,073,925 | | |
| | 6,517,000 | | | C,S | | LB-UBS Commercial
Mortgage Trust,
5.403%, due 02/15/40 | | | 6,375,897 | | |
| | 2,358,000 | | | C,S | | LB-UBS Commercial
Mortgage Trust,
5.516%, due 11/15/38 | | | 2,251,223 | | |
| | 1,693,000 | | | C | | LB-UBS Commercial
Mortgage Trust,
5.533%, due 02/15/40 | | | 1,623,797 | | |
| | 3,386,000 | | | C | | LB-UBS Commercial
Mortgage Trust,
5.563%, due 02/15/40 | | | 3,238,667 | | |
| | 5,220,000 | | | C | | LB-UBS Commercial
Mortgage Trust,
6.226%, due 03/15/26 | | | 5,283,528 | | |
| | 15,233,000 | | | C,S | | LB-UBS Commercial
Mortgage Trust,
6.365%, due 12/15/28 | | | 15,642,952 | | |
| | 12,136,502 | | | C,S | | LB-UBS Commercial
Mortgage Trust,
7.370%, due 08/15/26 | | | 12,678,440 | | |
| | 3,752,000 | | | C | | MASTR Alternative
Loans Trust, 6.250%,
due 07/25/36 | | | 3,732,801 | | |
| | 475,222 | | | C | | MASTR Alternative
Loans Trust, 6.500%,
due 05/25/33 | | | 476,655 | | |
| | 989,782 | | | C | | MASTR Alternative
Loans Trust, 8.500%,
due 05/25/33 | | | 999,151 | | |
| | 105,669,437 | | | ^ | | Merrill Lynch Mortgage
Trust, 0.157%, due
10/12/41 | | | 2,152,719 | | |
See Accompanying Notes to Financial Statements
91
PORTFOLIO OF INVESTMENTS
ING VP INTERMEDIATE BOND PORTFOLIO AS OF JUNE 30, 2007 (UNAUDITED) (CONTINUED)
Principal
Amount | | | | | | Value | |
| COLLATERALIZED MORTGAGE OBLIGATIONS (continued) | | | |
| $ | 92,309,229 | | | #,C,^ | | Merrill Lynch Mortgage
Trust, 0.358%,
due 11/12/35 | | $ | 635,651 | | |
| | 2,725,000 | | | C | | Merrill Lynch Mortgage
Trust, 4.892%,
due 02/12/42 | | | 2,648,618 | | |
| | 19,400,283 | | | C,^ | | Merrill Lynch/Countrywide
Commercial Mortgage
Trust, 0.735%,
due 08/12/48 | | | 814,426 | | |
| | 1,445,000 | | | C | | Merrill Lynch/
Countrywide
Commercial Mortgage
Trust, 5.479%,
due 08/12/48 | | | 1,378,175 | | |
| | 1,617,000 | | | C | | Merrill Lynch/
Countrywide
Commercial Mortgage
Trust, 5.509%,
due 08/12/48 | | | 1,537,945 | | |
| | 1,422,930 | | | C | | MLCC Mortgage
Investors, Inc.,
5.550%, due 04/25/29 | | | 1,424,277 | | |
| | 626,842 | | | C | | MLCC Mortgage
Investors, Inc.,
5.640%, due 01/25/29 | | | 627,426 | | |
| | 8,245,000 | | | C,S | | Morgan Stanley
Capital I, 5.007%,
due 01/14/42 | | | 8,039,132 | | |
| | 1,370,263 | | | C | | Morgan Stanley Dean
Witter Capital I,
4.180%, due 03/12/35 | | | 1,305,979 | | |
| | 3,324,968 | | | C | | Mortgage Capital
Funding, Inc., 6.663%,
due 03/18/30 | | | 3,333,418 | | |
| | 76,238 | | | C | | MortgageIT Trust,
5.690%, due 11/25/35 | | | 76,637 | | |
| | 3,764,000 | | | C | | New York Mortgage
Trust, Inc., 5.654%,
due 05/25/36 | | | 3,754,491 | | |
| | 1,804,000 | | | C | | Nomura Asset Securities
Corp., 6.690%,
due 03/15/30 | | | 1,875,591 | | |
| | 2,370,556 | | | C | | Prime Mortgage
Trust, 5.820%,
due 02/25/35 | | | 2,378,252 | | |
| | 2,760,289 | | | C | | Prudential Commercial
Mortgage Trust,
3.669%, due 02/11/36 | | | 2,658,050 | | |
| | 15,270,101 | | | C,S | | RAAC Series, 5.250%,
due 09/25/34 | | | 14,931,614 | | |
| | 13,619,849 | | | C,S | | Residential Accredit
Loans, Inc., 5.500%,
due 05/25/34 | | | 12,761,874 | | |
| | 1,740,876 | | | C | | Residential Accredit
Loans, Inc., 5.550%,
due 05/25/46 | | | 1,743,654 | | |
| | 4,565,994 | | | C | | Residential Accredit
Loans, Inc., 5.829%,
due 09/25/46 | | | 4,571,523 | | |
| | 1,384,738 | | | C | | Residential Funding
Mortgage Security I,
5.770%, due 05/25/33 | | | 1,392,479 | | |
Principal
Amount | | | | | | Value | |
| $ | 9,336,663 | | | C,S | | Residential Funding
Mortgage Security I,
6.000%, due 06/25/36 | | $ | 9,345,702 | | |
| | 908,967 | | | C | | Sequoia Mortgage
Trust, 5.590%,
due 01/20/35 | | | 910,380 | | |
| | 1,031,534 | | | C | | Structured Adjustable
Rate Mortgage Loan
Trust, 5.630%,
due 07/25/35 | | | 1,034,499 | | |
| | 1,220,923 | | | C | | Structured Adjustable
Rate Mortgage Loan
Trust, 5.941%,
due 05/25/36 | | | 1,212,535 | | |
| | 1,737,592 | | | C | | Structured Asset
Mortgage Investments,
Inc., 5.560%,
due 04/19/35 | | | 1,741,934 | | |
| | 7,916,124 | | | C,S | | Structured Asset
Mortgage Investments,
Inc., 7.653%,
due 12/27/35 | | | 8,044,070 | | |
| | 1,543,134 | | | C | | Structured Asset
Securities Corp.,
5.500%, due 07/25/33 | | | 1,480,204 | | |
| | 2,395,510 | | | C | | Thornburg Mortgage
Securities Trust,
5.670%, due 12/25/33 | | | 2,398,540 | | |
| | 2,650,349 | | | C | | Thornburg Mortgage
Securities Trust,
5.690%, due 09/25/34 | | | 2,654,172 | | |
| | 610,000 | | | C | | Wachovia Bank
Commercial Mortgage
Trust, 5.285%,
due 07/15/42 | | | 605,374 | | |
| | 1,336,000 | | | #,C | | Wachovia Bank
Commercial Mortgage
Trust, 5.368%,
due 10/15/44 | | | 1,256,238 | | |
| | 11,328,000 | | | C,S | | Wachovia Bank
Commercial
Mortgage Trust,
5.368%, due 10/15/44 | | | 10,727,946 | | |
| | 1,808,959 | | | C | | Washington Mutual
Alternative Mortgage
Pass-Through
Certificates, 5.772%,
due 02/25/47 | | | 1,808,251 | | |
| | 9,214,412 | | | C | | Washington Mutual
Mortgage Pass-
Through Certificates,
5.501%, due 01/25/37 | | | 9,110,082 | | |
| | 20,471,498 | | | C,S | | Washington Mutual
Mortgage Pass-
Through Certificates,
5.709%, due 06/25/37 | | | 20,300,946 | | |
| | 17,746,438 | | | C,S | | Washington Mutual
Mortgage Pass-
Through Certificates,
5.792%, due 05/25/47 | | | 17,745,053 | | |
| | 4,929,566 | | | C | | Washington Mutual
Mortgage Pass-
Through Certificates,
5.799%, due 05/25/47 | | | 4,929,182 | | |
See Accompanying Notes to Financial Statements
92
PORTFOLIO OF INVESTMENTS
ING VP INTERMEDIATE BOND PORTFOLIO AS OF JUNE 30, 2007 (UNAUDITED) (CONTINUED)
Principal
Amount | | | | | | Value | |
| COLLATERALIZED MORTGAGE OBLIGATIONS (continued) | | | |
| $ | 1,895,000 | | | C | | Washington Mutual
Mortgage Pass-
Through Certificates,
5.839%,
due 07/25/47 | | $ | 1,895,000 | | |
| | 14,066,000 | | | C,S | | Washington Mutual
Mortgage Pass-
Through Certificates,
5.901%, due 07/25/37 | | | 14,066,000 | | |
| | 10,047,000 | | | C | | Washington Mutual
Mortgage Pass-
Through Certificates,
5.925%, due 07/25/37 | | | 10,047,000 | | |
| | 10,578,759 | | | C | | Washington Mutual
Mortgage Pass-
Through Certificates,
5.989%, due 09/25/46 | | | 10,590,745 | | |
| | 4,274,930 | | | C | | Washington Mutual
Mortgage Pass-
Through Certificates,
5.000%, due 12/25/18 | | | 4,178,054 | | |
| | 9,222,346 | | | C,S | | Washington Mutual
Mortgage Pass-
Through Certificates,
5.610%, due 09/25/46 | | | 9,232,608 | | |
| | 1,294,471 | | | C | | Washington Mutual
Mortgage Pass-
Through Certificates,
5.630%, due 01/25/45 | | | 1,297,350 | | |
| | 2,163,574 | | | C,S | | Washington Mutual
Mortgage Pass-
Through Certificates,
5.720%, due 08/25/45 | | | 2,171,867 | | |
| | 1,830,603 | | | C | | Washington Mutual
Mortgage Pass-
Through Certificates,
5.724%, due 10/25/46 | | | 1,837,669 | | |
| | 13,795,463 | | | C,S | | Washington Mutual
Mortgage Pass-
Through Certificates,
5.750%, due 02/25/36 | | | 13,748,209 | | |
| | 1,237,727 | | | C | | Washington Mutual
Mortgage Pass-
Through Certificates,
5.795%, due 06/25/44 | | | 1,241,044 | | |
| | 2,761,000 | | | C | | Washington Mutual
Mortgage Pass-
Through Certificates,
5.826%, due 10/25/36 | | | 2,761,177 | | |
| | 861,799 | | | C | | Washington Mutual
Mortgage Pass-
Through Certificates,
5.869%, due 11/25/46 | | | 860,991 | | |
| | 1,459,152 | | | C | | Washington Mutual
Mortgage Pass-
Through Certificates,
5.920%, due 07/25/36 | | | 1,457,681 | | |
| | 5,601,691 | | | C | | Washington Mutual
Mortgage Pass-
Through Certificates,
5.989%, due 11/25/46 | | | 5,604,100 | | |
Principal
Amount | | | | | | Value | |
| $ | 7,315,287 | | | C,S | | Washington Mutual
Mortgage Pass-
Through Certificates,
5.999%, due 05/25/46 | | $ | 7,317,862 | | |
| | 2,292,182 | | | C | | Washington Mutual
Mortgage Pass-
Through Certificates,
5.999%, due 06/25/46 | | | 2,296,569 | | |
| | 3,827,367 | | | C | | Washington Mutual
Mortgage Pass-
Through Certificates,
6.000%, due 06/25/34 | | | 3,762,184 | | |
| | 7,529,975 | | | C,S | | Washington Mutual
Mortgage Pass-
Through Certificates,
6.000%, due 07/25/36 | | | 7,521,561 | | |
| | 1,593,952 | | | C | | Washington Mutual
Mortgage Pass-
Through Certificates,
6.019%, due 07/25/46 | | | 1,596,816 | | |
| | 4,782,000 | | | C | | Washington Mutual,
Inc., 3.799%,
due 06/25/34 | | | 4,633,998 | | |
| | 8,274,855 | | | C,S | | Washington Mutual,
Inc., 5.729%,
due 03/25/47 | | | 8,260,954 | | |
| | 9,921,092 | | | C | | Washington Mutual,
Inc., 5.789%,
due 04/25/47 | | | 9,904,425 | | |
| | 14,385,583 | | | C,S | | Washington Mutual,
Inc., 5.799%,
due 04/25/47 | | | 14,381,095 | | |
| | 6,671,000 | | | C,S | | Wells Fargo
Mortgage-Backed
Securities Trust,
3.500%, due 06/25/35 | | | 6,521,356 | | |
| | 20,208,000 | | | C,S | | Wells Fargo
Mortgage-Backed
Securities Trust,
4.110%, due 06/25/35 | | | 19,803,117 | | |
| | 5,950,000 | | | C | | Wells Fargo
Mortgage-Backed
Securities Trust,
4.500%, due 08/25/18 | | | 5,619,940 | | |
| | 4,195,000 | | | C | | Wells Fargo
Mortgage-Backed
Securities Trust,
4.795%, due 07/25/34 | | | 4,092,215 | | |
| | 4,243,000 | | | C,S | | Wells Fargo
Mortgage-Backed
Securities Trust,
4.795%, due 07/25/34 | | | 4,104,451 | | |
| | 4,387,984 | | | C | | Wells Fargo
Mortgage-Backed
Securities Trust,
4.894%, due 08/25/34 | | | 4,277,083 | | |
| | 6,547,450 | | | C,S | | Wells Fargo
Mortgage-Backed
Securities Trust,
5.000%, due 12/25/33 | | | 6,092,199 | | |
| | 10,228,697 | | | C | | Wells Fargo
Mortgage-Backed
Securities Trust,
5.111%, due 03/25/36 | | | 10,003,741 | | |
See Accompanying Notes to Financial Statements
93
PORTFOLIO OF INVESTMENTS
ING VP INTERMEDIATE BOND PORTFOLIO AS OF JUNE 30, 2007 (UNAUDITED) (CONTINUED)
Principal
Amount | | | | | | Value | |
| COLLATERALIZED MORTGAGE OBLIGATIONS (continued) | | | |
| $ | 10,138,897 | | | C,S | | Wells Fargo
Mortgage-Backed
Securities Trust,
5.386%, due 08/25/35 | | $ | 9,896,145 | | |
| | 5,743,390 | | | C | | Wells Fargo
Mortgage-Backed
Securities Trust,
5.500%, due 12/25/35 | | | 5,496,605 | | |
| | 6,309,270 | | | C | | Wells Fargo
Mortgage-Backed
Securities Trust,
5.500%, due 01/25/36 | | | 6,020,425 | | |
| | 21,128,088 | | | C,S | | Wells Fargo
Mortgage-Backed
Securities Trust,
5.668%, due 12/25/36 | | | 20,877,319 | | |
| | 8,563,680 | | | C,S | | Wells Fargo
Mortgage-Backed
Securities Trust, 5.950%,
due 11/25/36 | | | 8,502,107 | | |
| | 9,935,015 | | | C | | Wells Fargo
Mortgage-Backed
Securities Trust, 5.957%,
due 10/25/36 | | | 9,863,582 | | |
| | 10,987,789 | | | C,S | | Wells Fargo
Mortgage-Backed
Securities Trust, 6.000%,
due 06/25/36 | | | 10,946,117 | | |
| | | | 992,599,754 | | |
| | | Total Collateralized
Mortgage Obligations
(Cost $1,001,276,730) | | | 992,599,754 | | |
| MUNICIPAL BONDS: 0.6% | | | |
| | | | | California: 0.2% | |
| | 6,482,000 | | | C | | City of San Diego,
7.125%, due 06/01/32 | | | 6,583,703 | | |
| | | | 6,583,703 | | |
| | | | | Michigan: 0.4% | |
| | 10,060,000 | | | | | Michigan Tobacco
Settlement Finance
Authority, 7.309%,
due 06/01/34 | | | 10,269,852 | | |
| | | | 10,269,852 | | |
| | | Total Municipal Bonds
(Cost $16,694,591 ) | | | 16,853,555 | | |
| OTHER BONDS: 0.5% | | | |
| | | | | Foreign Government Bonds: 0.5% | |
| ARS | 27,615,300 | | | @@,X | | Argentina Bonos, 2.000%,
due 09/30/14 | | | 9,969,585 | | |
| MXN | 56,870,000 | | | @@ | | Mexican Bonos, 8.000%,
due 12/17/15 | | | 5,366,420 | | |
| | | Total Other Bonds
(Cost $14,496,664 ) | | | 15,336,005 | | |
| Shares | | | | | | Value | |
| PREFERRED STOCK: 1.3% | | | |
| | | | | Banks:0.2% | |
| | 248,050 | | | @@,#,P | | Santander Finance
Preferred
SA Unipersonal | | $ | 5,945,461 | | |
| | | | 5,945,461 | | |
| | | | | | | Diversified Financial
Services: 0.4% | | | | | |
| | 182,000 | | | P | | Deutsche Bank
Capital Trust II | | | 4,468,100 | | |
| | 302,625 | | | P,L | | Merrill Lynch & Co., Inc. | | | 7,686,675 | | |
| | | | 12,154,775 | | |
| | | | | Insurance: 0.7% | |
| | 324,192 | | | @@,P | | Aegon NV | | | 7,897,317 | | |
| | 126,500 | | | @@,P | | Aegon NV-Series 1 | | $ | 3,210,570 | | |
| | 285,147 | | | P | | Metlife, Inc. | | | 7,296,912 | | |
| | | | 18,404,799 | | |
| | | Total Preferred Stock
(Cost $36,922,157 ) | | | 36,505,035 | | |
| | | Total Long-Term
Investments
(Cost $2,948,695,746) | | | 2,920,529,191 | | |
| SHORT-TERM INVESTMENTS:23.3% | | | |
| | | | | Mutual Fund: 7.2% | |
| | 205,600,000 | | | ** | | ING Institutional Prime
Money Market Fund | | | 205,600,000 | | |
| | | Total Mutual Fund
(Cost $205,600,000) | | | 205,600,000 | | |
Principal
Amount | | | | | | Value | |
| | | | | | | Foreign Government
Securities: 0.9% | | | | | |
| JPY | 2,410,000,000 | | | @@,Z | | Japan Financing Bills,
0.600%, due 09/03/07 | | | 19,552,875 | | |
| JPY | 780,000,000 | | | @@,Z | | Japan Government
Treasury Bill, 0.690%,
due 11/20/07 | | | 6,318,105 | | |
| | | Total Foreign
Government
Securities
(Cost $26,442,491) | | | 25,870,980 | | |
See Accompanying Notes to Financial Statements
94
PORTFOLIO OF INVESTMENTS
ING VP INTERMEDIATE BOND PORTFOLIO AS OF JUNE 30, 2007 (UNAUDITED) (CONTINUED)
Principal
Amount | | | | | | Value | |
| | | | | Repurchase Agreement: 0.3% | |
| $ | 9,935,000 | | | | | Goldman Sachs
Repurchase Agreement
dated 06/29/07, 5.300%,
due 07/02/07, $9,939,388
to be received upon
repurchase (Collateralized
by $10,041,000 various
U.S. Government Agency
Obligations, 4.000%-
5.000 %, Market Value
plus accrued interest
$10,134,323, du | | $ | 9,935,000 | | |
| | | Total Repurchase
Agreement
(Cost $9,935,000) | | | 9,935,000 | | |
| | | | | Securities Lending Collateralcc: 14.9% | |
| | 426,736,000 | | | | | The Bank of New
York Institutional
Cash Reserves Fund | | | 426,736,000 | | |
| | | Total Securities
Lending Collateral
(Cost $426,736,000) | | | 426,736,000 | | |
| | | Total Short-Term
Investments
(Cost $668,713,491) | | | 668,141,980 | | |
Total Investments in
Securities
(Cost
$3,617,409,237)* | | | 125.3 | % | | $ | 3,588,671,171 | | |
Other Assets and
Liabilities - Net | | | (25.3 | ) | | | (724,497,583 | ) | |
| Net Assets | | | 100.0 | % | | $ | 2,864,173,588 | | |
@@ Foreign Issuer
MASTR Mortgage Asset Securitization Transaction, Inc.
# Securities with purchases pursuant to Rule 144A, under the Securities Act of 1933 and may not be resold subject to that rule except to qualified institutional buyers. Unless otherwise footnoted, these securities have been determined to be liquid under the guidelines established by the Funds' Board of Directors/Trustees.
C Bond may be called prior to maturity date.
P Preferred Stock may be called prior to convertible date.
cc Securities purchased with cash collateral for securities loaned.
W When-issued or delayed delivery security
S All or a portion of segregated securities for certain derivatives, when-issued or delayed delivery securities and forward currency exchange contracts.
I Illiquid security
L Loaned security, a portion or all of the security is on loan at June 30, 2007.
** Investment in affiliate
X Fair value determined by ING Funds Valuation Committee appointed by the Funds' Board of Directors/Trustees.
^ Interest Only (IO) Security
Z Indicates Zero Coupon Bond; rate shown reflects effective yield on the date of purchase
ARS Argentine Peso
JPY Japanese Yen
MXN Mexican Peso
* Cost for federal income tax purposes is $3,623,006,363. Net unrealized depreciation consists of:
| Gross Unrealized Appreciation | | $ | 2,727,153 | | |
| Gross Unrealized Depreciation | | | (37,062,345 | ) | |
| Net Unrealized Depreciation | | $ | (34,335,192 | ) | |
ING VP Intermediate Bond Portfolio Open Futures Contracts on June 30, 2007
Contract
Description | | Number of
Contracts | | Notional
Market
Value ($) | | Expiration
Date | | Unrealized
Appreciation/
(Depreciation) | |
| Long Contracts | |
| U.S. Treasury 2-Year Note | | | 904 | | | | 184,218,259 | | | 09/28/07 | | $ | (298,876 | ) | |
| U.S. Treasury 5-Year Note | | | 496 | | | | 51,622,752 | | | 09/28/07 | | | (330,613 | ) | |
| U.S. Treasury Long Bond | | | 1,051 | | | | 113,245,250 | | | 09/19/07 | | | 792,946 | | |
| | | | | | | | | | | | | $ | 163,457 | | |
At June 30, 2007 the following forward currency contracts were outstanding for the ING VP Intermediate Bond Portfolio:
| Currency | | Buy/Sell | | Settlement Date | | In Exchange For | | Value | | Depreciation | |
| | | | | | | USD | | | | | |
| Switzerland Francs | |
| CHF | 17,379,095 | | | Buy | | 7/6/07 | | $ | 14,236,000 | | | $ | 14,234,322 | | | $ | (1,678 | ) | |
| Malaysia Ringgits | |
| MYR | 145,206,010 | | | Buy | | 7/6/07 | | | 42,672,508 | | | | 42,071,643 | | | | (600,865 | ) | |
| | | | | $ | (602,543 | ) | |
See Accompanying Notes to Financial Statements
95
PORTFOLIO OF INVESTMENTS
ING VP INTERMEDIATE BOND PORTFOLIO AS OF JUNE 30, 2007 (UNAUDITED) (CONTINUED)
ING VP Intermediate Bond Portfolio Credit Default Swap Agreements Outstanding on June 30, 2007:
| Counterparty | | Reference
Entity/Obligation | | Buy/Sell
Protection | | (Pay)/Receive
Fixed Rate | | Termination
Date | | Notional
Amount | | Unrealized
Appreciation/
(Depreciation) | |
Citibank N.A.,
New York | | | Bear Stearns Co. Inc. 5.300%, 10/30/15 | | | Sell | | | 0.240 | % | | 03/20/12 | | USD | 7,856,000 | | | $ | (77,268 | ) | |
| UBS AG | | | Bear Stearns Co. Inc. 5.300%, 10/30/15 | | | Sell | | | 0.240 | % | | 03/20/12 | | USD | 11,239,000 | | | | (96,709 | ) | |
Citibank, N.A.,
New York | | | Centurytel Inc. 7.875%, 08/15/12 | | | Buy | | | (0.720 | )% | | 09/20/12 | | USD | 1,083,000 | | | | (10,894 | ) | |
Citibank, N.A.,
New York | | | Centurytel Inc. 7.875%, 08/15/12 | | | Buy | | | (0.730 | )% | | 09/20/12 | | USD | 8,176,000 | | | | (85,936 | ) | |
Merrill Lynch
International | | | Centurytel Inc. 7.875%, 08/15/12 | | | Buy | | | (0.740 | )% | | 09/20/12 | | USD | 3,114,000 | | | | (33,020 | ) | |
Citibank N.A.,
New York | | | Citizens Communications 6.250%, 01/15/13 | | | Sell | | | 1.070 | % | | 06/20/12 | | USD | 7,150,000 | | | | (97,480 | ) | |
Citibank N.A.,
New York | | | CMS Energy Corp. 6.875%, 12/15/15 | | | Sell | | | 0.820 | % | | 03/20/12 | | USD | 1,040,000 | | | | 1,064 | | |
Merrill Lynch
International | | | CMS Energy Corp. 6.875%, 12/15/15 | | | Sell | | | 0.840 | % | | 03/20/12 | | USD | 5,710,000 | | | | 21,049 | | |
Morgan Stanley
Capital Services Inc. | | | Domtar Inc. 7.875%, 10/15/11 | | | Buy | | | (2.650 | )% | | 09/20/11 | | USD | 2,758,500 | | | | (120,966 | ) | |
| UBS AG | | | Domtar Inc. 7.875%, 10/15/11 | | | Sell | | | 2.600 | % | | 09/20/11 | | USD | 2,761,000 | | | | 134,810 | | |
Citibank N.A.,
New York | | | Dow Jones CDX.EM.6 Index 5-Year | | | Buy | | | (1.400 | )% | | 12/20/11 | | USD | 9,301,000 | | | | (4,341 | ) | |
Lehman Brothers
Special Financing,
Inc. | | | Dow Jones CDX.NA.HY.7 Index 5-Year | | | Buy | | | (3.250 | )% | | 12/20/11 | | USD | 15,442,000 | | | | 274,591 | | |
| UBS AG | | | Dow Jones CDX.NA.HY.7 Index 5-Year | | | Buy | | | (3.250 | )% | | 12/20/11 | | USD | 9,333,500 | | | | 203,068 | | |
Citibank N.A.,
New York | | |
Dow Jones CDX.NA.HY.8 Index 7-Year
(0-10% Tranche) | | | Sell | | | 0.048% | | | 06/20/14 | | | USD9,292,000 | | | | 85,545 | | |
| Barclays Bank PLC | | | Dow Jones CDX.NA.HY.8 Index 5-Year | | | Buy | | | (2.750 | )% | | 06/20/12 | | USD | 11,886,000 | | | | 358,891 | | |
| Barclays Bank PLC | | | Dow Jones CDX.NA.HY.8 Index 5-Year | | | Buy | | | (2.750 | )% | | 06/20/12 | | USD | 14,792,000 | | | | (278,275 | ) | |
Citibank N.A.,
New York | | | Dow Jones CDX.NA.HY.8 Index 5-Year | | | Buy | | | (2.750 | )% | | 06/20/12 | | USD | 18,140,000 | | | | 408,402 | | |
| UBS AG | | | Dow Jones CDX.NA.HY.8 Index 5-Year | | | Buy | | | (2.750 | )% | | 06/20/12 | | USD | 5,226,000 | | | | 6,133 | | |
| UBS AG | | | Dow Jones CDX.NA.HY.8 Index 5-Year | | | Buy | | | (2.750 | )% | | 06/20/12 | | USD | 11,615,000 | | | | 5,485 | | |
Citibank N.A.,
New York Dow Jones CDX.NA.IG.6 Index
| | | 10-Year (7-10% Tranche) | | | Sell | | | 1.003 | % | | 06/20/16 | | USD | 16,142,880 | | | | (558,130 | ) | |
Citibank, N.A.,
New York | | | Dow Jones CDX.NA.IG.7 Index 10-Year
(30-100% Tranche) | | | Buy | | | (0.048)% | | | 12/20/16 | | | USD44,807,000 | | | | 73,098 | | |
Lehman Brothers
Special Financing Inc. | | | Dow Jones CDX.NA.IG.7 Index 10-Year
(30-100% Tranche) | | | Buy | | | (0.048)% | | | 12/20/16 | | | USD124,553,000 | | | | 209,321 | | |
Lehman Brothers
Special Financing Inc. | | | Dow Jones CDX.NA.IG.HVOL.8 Index 5-Year | | | Buy | | | (0.750 | )% | | 06/20/12 | | USD | 92,348,000 | | | | 344,771 | | |
| UBS AG | | | Dow Jones CDX.NA.IG.HVOL.8 Index 5-Year | | | Buy | | | (0.750 | )% | | 06/20/12 | | USD | 28,236,000 | | | | 98,135 | | |
| UBS AG | | | Dow Jones CDX.NA.IG.HVOL.8 Index 5-Year | | | Buy | | | (0.750 | )% | | 06/20/12 | | USD | 50,294,000 | | | | 370,293 | | |
| Barclays Bank PLC | | | Dow Jones CDX.NA.XO.8 Index 5-Year | | | Buy | | | (1.400 | )% | | 06/20/12 | | USD | 29,029,000 | | | | 33,597 | | |
Lehman Brothers
Special Financing Inc. | | | Dow Jones CDX.NA.XO.8 Index 5-Year | | | Buy | | | (1.400 | )% | | 06/20/12 | | USD | 28,271,000 | | | | 347,023 | | |
Lehman Brothers
Special Financing Inc. | | | Exelon Corp. 6.750%, 05/01/11 | | | Buy | | | (0.640 | )% | | 06/20/12 | | USD | 6,229,000 | | | | (57,574 | ) | |
| Barclays Bank PLC | | | Federative Republic of Brazil 12.25%,
03/06/30 | | | Sell | | | 0.240 | % | | 06/20/08 | | USD | 21,978,000 | | | | 5,202 | | |
| Barclays Bank PLC | | | Federative Republic of Brazil 12.25%,
03/06/30 | | | Buy | | | (0.725 | )% | | 06/20/12 | | USD | 7,693,000 | | | | 6,777 | | |
Lehman Brothers
Special Financing Inc. | | | Federative Republic of Brazil 12.25%,
03/06/30 | | | Buy | | | (0.800 | )% | | 07/20/12 | | USD | 6,292,000 | | | | (19,286 | ) | |
| UBS AG | | | Federative Republic of Brazil 12.25%,
03/06/30 | | | Buy | | | (0.780 | )% | | 07/20/12 | | USD | 29,035,000 | | | | - | | |
Citibank N.A.,
New York | | | Gannett Co. 6.375%, 04/01/12 | | | Buy | | | (0.690 | )% | | 06/20/14 | | USD | 8,772,000 | | | | 2,246 | | |
Morgan Stanley
Capital Services Inc. | | | H.J. Heinz Co. 6.000%, 03/15/08 | | | Buy | | | (0.350 | )% | | 09/20/11 | | USD | 16,503,000 | | | | (23,298 | ) | |
Morgan Stanley
Capital Services Inc. | | | H.J. Heinz Co. 6.000%, 03/15/08 | | | Buy | | | (0.410 | )% | | 09/20/11 | | USD | 19,253,500 | | | | (71,183 | ) | |
| Barclays Bank PLC | | | Kinder Morgan Inc. 6.500%, 09/01/12 | | | Sell | | | 1.700 | % | | 09/20/11 | | USD | 1,104,000 | | | | 39,487 | | |
See Accompanying Notes to Financial Statements
96
PORTFOLIO OF INVESTMENTS
ING VP INTERMEDIATE BOND PORTFOLIO AS OF JUNE 30, 2007 (UNAUDITED) (CONTINUED)
| Counterparty | | Reference
Entity/Obligation | | Buy/Sell
Protection | | (Pay)/Receive
Fixed Rate | | Termination
Date | | Notional
Amount | | Unrealized
Appreciation/
(Depreciation) | |
Citibank N.A.,
New York | | Lehman Brothers Holdings Inc.
6.625%, 01/18/12 | | Sell | | | 0.240 | % | | 03/20/12 | | USD | 7,856,000 | | | $ | (38,509 | ) | |
| UBS AG | | Lehman Brothers Holdings Inc. 6.625%,
01/18/12 | | Sell | | | 0.240 | % | | 03/20/12 | | USD | 11,239,000 | | | | (50,457 | ) | |
JPMorgan Chase
Bank N.A.,
New York | | Macy's Inc. 6.625%, 04/01/11 | | Buy | | | (0.980 | )% | | 09/20/12 | | USD | 6,400,000 | | | | (78,348 | ) | |
| UBS AG | | Macy's Inc. 6.625%, 04/01/11 | | Buy | | | (0.980 | )% | | 09/20/12 | | USD | 12,730,000 | | | | (149,861 | ) | |
| UBS AG | | Morgan Stanley 6.600%, 04/01/12 | | Sell | | | 0.260 | % | | 03/20/12 | | USD | 29,060,000 | | | | (82,283 | ) | |
Credit Suisse
International | | Norbord Inc. 7.25%, 07/01/12 | | Buy | | | (1.450 | )% | | 06/20/14 | | USD | 9,317,000 | | | | 183,039 | | |
| UBS AG | | Norbord Inc. 7.25%, 07/01/12 | | Buy | | | (1.360 | )% | | 06/20/14 | | USD | 3,490,000 | | | | 76,942 | | |
Bear Stearns
Credit Products Inc. | | Norbord Inc. 7.250%, 07/01/12 | | Buy | | | (1.600 | )% | | 06/20/12 | | USD | 6,303,000 | | | | (56,099 | ) | |
JPMorgan Chase
Bank N.A.,
New York | | Norbord Inc. 7.250%, 07/01/12 | | Buy | | | (1.380 | )% | | 06/20/14 | | USD | 4,344,000 | | | | 119,766 | | |
JPMorgan Chase
Bank N.A., New York | | Norbord Inc. 7.250%, 07/01/12 | | Buy | | | (2.000 | )% | | 06/20/14 | | USD | 6,390,000 | | | | (39,805 | ) | |
Morgan Stanley
Capital Services Inc. | | Norbord Inc. 7.250%, 07/01/12 | | Buy | | | (1.380 | )% | | 06/20/14 | | USD | 8,507,000 | | | | 220,937 | | |
| UBS AG | | Norbord Inc. 7.250%, 07/01/12 | | Buy | | | (1.500 | )% | | 06/20/12 | | USD | 2,991,000 | | | | (16,248 | ) | |
| UBS AG | | Russian Federation 5.000%
Step, 03/31/30 | | Sell | | | 0.240 | % | | 08/20/07 | | USD | 14,485,000 | | | | 16,768 | | |
| UBS AG | | Russian Federation 5.000%
Step, 03/31/30 | | Sell | | | 0.310 | % | | 08/20/07 | | USD | 21,897,000 | | | | 38,443 | | |
Morgan Stanley
Capital Services Inc. | | Temple Inland Inc. 7.875%, 05/01/12 | | Buy | | | (0.900 | )% | | 03/20/14 | | USD | 5,447,000 | | | | 60,019 | | |
Goldman Sachs
International | | Temple-Inland Inc. 7.875%, 05/01/12 | | Buy | | | (1.040 | )% | | 03/20/14 | | USD | 2,105,000 | | | | 11,408 | | |
JPMorgan Chase
Bank N.A.,
New York | | Temple-Inland Inc. 7.875%, 05/01/12 | | Buy | | | (0.890 | )% | | 03/20/14 | | USD | 6,218,000 | | | | 91,349 | | |
JPMorgan Chase
Bank N.A. | | Temple-Inland Inc. 7.875%, 05/01/12 | | Buy | | | (1.020 | )% | | 03/20/14 | | USD | 6,015,000 | | | | 45,655 | | |
| UBS AG | | Temple-Inland Inc. 7.875%, 05/01/12 | | Buy | | | (0.900 | )% | | 03/20/14 | | USD | 5,820,000 | | | | 58,706 | | |
| UBS AG | | Toll Bros Finance Corp.
6.875%, 11/15/12 | | Buy | | | (1.000 | )% | | 06/20/12 | | USD | 13,620,000 | | | | 94,684 | | |
Merrill Lynch
International | | Transocean Inc. 7.375%, 04/15/18 | | Buy | | | (0.330 | )% | | 09/20/12 | | USD | 5,801,000 | | | | (20,792 | ) | |
| UBS AG | | Transocean Inc. 7.375%, 04/15/18 | | Buy | | | (0.340 | )% | | 09/20/12 | | USD | 5,415,000 | | | | (21,752 | ) | |
Merrill Lynch
International | | TXU Energy Co. 7.000%, 03/15/13 | | Buy | | | (1.200 | )% | | 03/20/12 | | USD | 9,247,000 | | | | 353,620 | | |
| UBS AG | | TXU Energy Co. 7.000%, 03/15/13 | | Buy | | | (1.230 | )% | | 03/20/12 | | USD | 1,766,000 | | | | 80,213 | | |
| Barclays Bank PLC | | UST Inc. 6.625%, 07/15/12 | | Buy | | | (0.300 | )% | | 03/20/14 | | USD | 5,814,000 | | | | (16,651 | ) | |
Bear Stearns Credit
Products Inc. | | UST Inc. 6.625%, 07/15/12 | | Buy | | | (0.280 | )% | | 03/20/14 | | USD | 15,391,000 | | | | 52,512 | | |
Bear Stearns Credit
Products Inc. | | UST Inc. 6.625%, 07/15/12 | | Buy | | | (0.380 | )% | | 03/20/17 | | USD | 12,313,000 | | | | 69,742 | | |
Morgan Stanley
Capital Services Inc. | | UST Inc. 6.625%, 07/15/12 | | Buy | | | (0.420 | )% | | 03/20/17 | | USD | 5,814,000 | | | | 2,210 | | |
| UBS AG | | UST Inc. 6.625%, 07/15/12 | | Buy | | | (0.280 | )% | | 03/20/14 | | USD | 817,000 | | | | 853 | | |
| UBS AG | | UST Inc. 6.625%, 07/15/12 | | Buy | | | (0.380 | )% | | 03/20/17 | | USD | 1,000,000 | | | | 2,117 | | |
Morgan Stanley
Capital Services Inc. | | Weyerhaeuser Co. 6.750%, 03/15/12 | | Buy | | | (0.880 | )% | | 03/20/17 | | USD | 5,814,000 | | | | 43,260 | | |
Citibank N.A.,
New York | | Weyerhaeuser Co. 6.750%, 03/15/12 | | Buy | | | (0.580 | )% | | 03/20/14 | | USD | 1,083,000 | | | | 8,171 | | |
JPMorgan Chase
Bank N.A.,
New York | | Weyerhaeuser Co. 6.750%, 03/15/12 | | Buy | | | (0.640 | )% | | 03/20/14 | | USD | 6,191,000 | | | | 16,789 | | |
Lehman Brothers
Special Financing Inc. | | Weyerhaeuser Co. 6.750%, 03/15/12 | | Buy | | | (0.570 | )% | | 03/20/14 | | USD | 6,218,000 | | | | 35,505 | | |
Morgan Stanley
Capital Services Inc. | | Weyerhaeuser Co. 6.750%, 03/15/12 | | Buy | | | (0.600 | )% | | 03/20/14 | | USD | 11,701,000 | | | | 57,825 | | |
Citibank N.A.,
New York | | Williams Partners LP 7.500%, 06/15/11 | | Sell | | | 1.030 | % | | 03/20/12 | | USD | 7,035,351 | | | | 111,597 | | |
| UBS AG | | XL Capital Ltd. 5.250%, 09/15/14 | | Buy | | | (0.610 | )% | | 09/20/16 | | USD | 5,501,000 | | | | (51,400 | ) | |
| UBS AG | | XL Capital Ltd. 5.250%, 09/15/14 | | Buy | | | (0.610 | )% | | 09/20/16 | | USD | 11,002,000 | | | | (102,800 | ) | |
| | | | | | | $ | 2,621,753 | | |
See Accompanying Notes to Financial Statements
97
PORTFOLIO OF INVESTMENTS
ING VP MONEY MARKET PORTFOLIO(1) AS OF JUNE 30, 2007 (UNAUDITED)
Investment Type Allocation
as of June 30, 2007
(as a percent of net assets)
| Corporate Bonds/Notes | | | 54.3 | % | |
| Commercial Paper | | | 39.1 | % | |
| Repurchase Agreement | | | 4.2 | % | |
| Certificates of Deposit | | | 1.3 | % | |
| U.S. Government Agency Obligation | | | 0.9 | % | |
| Collateralized Mortgage Obligations | | | 0.7 | % | |
| Other Assets and Liabilities - Net | | | (0.5 | )% | |
| Net Assets | | | 100.0 | % | |
* Other Assets and Liabilities includes securities lending collateral
Portfolio holdings are subject to change daily.
Principal
Amount | | | | | | Value | |
| CERTIFICATES OF DEPOSIT: 1.3% | | | |
| $ | 21,600,000 | | | | | Mizuho Corporate Bank,
5.310%, due 07/17/07 | | $ | 21,600,000 | | |
| | | Total Certificates of Deposit
(Cost $21,600,000) | | | 21,600,000 | | |
| COLLATERALIZED MORTGAGE OBLIGATIONS: 0.7% | | | |
| | 10,750,000 | | | @@,#,C | | Cheyne High Grade
CDO Ltd., 5.370%,
due 11/13/07 | | | 10,750,000 | | |
| | | Total Collateralized Mortgage
Obligations
(Cost $10,750,000) | | | 10,750,000 | | |
| COMMERCIAL PAPER: 39.1% | | | |
| | 54,000,000 | | | @@,# | | ASB Finance Ltd.,
5.100%, due 01/25/08 | | | 53,015,725 | | |
| | 6,400,000 | | | | | Bank of America Corp.,
5.260%, due 09/25/07 | | | 6,319,580 | | |
| | 8,000,000 | | | | | Cafco, LLC, 5.280%,
due 07/17/07 | | | 7,981,227 | | |
| | 17,000,000 | | | @@ | | Cargill Global Funding PLC,
5.280%, due 08/23/07 | | | 16,857,336 | | |
| | 73,570,000 | | | # | | Concord Minutemen
Capital Co., LLC, 5.260%,
due 07/27/07 | | | 73,413,638 | | |
| | 69,500,000 | | | # | | Crown Point Capital Corp.,
5.305%, due 07/09/07 | | | 69,328,962 | | |
| | 70,529,000 | | | @@,# | | Duke Funding High
Grade I Ltd., 5.290%,
due 07/06/07 | | | 70,403,493 | | |
| | 11,500,000 | | | | | Jupiter Securitization Corp.,
5.350%, due 07/12/07 | | | 11,481,201 | | |
| | 70,500,000 | | | | | Monument Gardens Funding,
LLC, 5.320%, due 07/25/07 | | | 70,206,920 | | |
| | 23,100,000 | | | # | | Old Line Funding, LLC,
5.300%, due 07/25/07 | | | 23,045,785 | | |
| | 15,000,000 | | | | | Park Avenue Receivables
Corp., 5.300%,
due 07/16/07 | | | 14,966,875 | | |
| | 75,917,000 | | | # | | St. Germain Holdings Ltd.,
5.290%, due 07/11/07 | | | 75,765,691 | | |
| | 70,500,000 | | | | | Tulip Funding Corp.,
5.335%, due 07/31/07 | | | 70,306,946 | | |
Principal
Amount | | | | | | Value | |
| $ | 10,000,000 | | | | | UBS Finance, 5.350%,
due 07/18/07 | | $ | 9,974,736 | | |
| | 34,900,000 | | | | | Westpac Securities
New Zealand, 5.255%,
due 07/27/07 | | | 34,834,983 | | |
| | | Total Commercial Paper
(Cost $607,903,098) | | | 607,903,098 | | |
| CORPORATE BONDS/NOTES: 54.3% | | | |
| | 3,500,000 | | | @@ | | Alliance & Leicester PLC,
5.435%, due 01/14/08 | | | 3,501,356 | | |
| | 5,750,000 | | | | | Allstate Life Global
Funding II, 5.320%,
due 08/27/08 | | | 5,750,529 | | |
| | 2,400,000 | | | L | | Allstate Life Global Funding II,
5.337%, due 07/30/07 | | | 2,396,555 | | |
| | 10,940,000 | | | | | Allstate Life Global Funding II,
5.402%, due 01/25/08 | | | 10,846,296 | | |
| | 3,500,000 | | | # | | Allstate Life Global Funding II,
5.476%, due 06/20/08 | | | 3,402,964 | | |
| | 3,400,000 | | | | | American Express Bank FSB,
5.290%, due 08/10/07 | | | 3,399,959 | | |
| | 6,500,000 | | | | | American Express Bank FSB,
5.400%, due 11/21/07 | | | 6,502,519 | | |
| | 11,000,000 | | | | | American Express Centurion,
5.320%, due 08/20/08 | | | 11,000,211 | | |
| | 4,250,000 | | | | | American Express Centurion,
5.394%, due 05/16/08 | | | 4,164,872 | | |
| | 4,500,000 | | | | | American Express Centurion,
5.400%, due 11/16/07 | | | 4,501,667 | | |
| | 5,000,000 | | | | | American Express Centurion,
5.410%, due 09/14/07 | | | 5,001,113 | | |
| | 18,290,000 | | | | | American General Finance
Corp., 5.292%,
due 11/15/07 | | | 18,236,687 | | |
| | 34,200,000 | | | #,C | | American General Finance
Corp., 5.370%,
due 08/15/08 | | | 34,205,676 | | |
| | 16,000,000 | | | | | American General Finance
Corp., 5.480%,
due 01/18/08 | | | 16,012,161 | | |
| | 10,000,000 | | | # | | American Honda
Finance Corp., 5.360%,
due 03/11/08 | | | 9,921,650 | | |
| | 4,000,000 | | | # | | American Honda
Finance Corp., 5.380%,
due 02/04/08 | | | 4,001,994 | | |
| | 1,600,000 | | | # | | American International Group,
5.360%, due 06/23/08 | | | 1,600,314 | | |
| | 2,900,000 | | | @@,# | | ANZ National Bank,
5.302%, due 05/16/08 | | | 2,874,704 | | |
| | 7,100,000 | | | @@,# | | Banco Santander Totta,
5.330%, due 08/15/08 | | | 7,100,335 | | |
| | 7,500,000 | | | | | Bank of America N.A.,
5.315%, due 12/04/07 | | | 7,499,705 | | |
| | 9,500,000 | | | # | | Bank of New York, Inc.,
5.380%, due 05/27/08 | | | 9,500,000 | | |
| | 3,150,000 | | | | | Bear Stearns Cos., Inc.,
4.550%, due 07/02/08 | | | 3,071,334 | | |
| | 1,500,000 | | | | | Bear Stearns Cos., Inc.,
5.332%, due 08/15/07 | | | 1,504,429 | | |
| | 13,000,000 | | | | | Bear Stearns Cos., Inc.,
5.370%, due 08/01/07 | | | 13,000,408 | | |
See Accompanying Notes to Financial Statements
98
PORTFOLIO OF INVESTMENTS
ING VP MONEY MARKET PORTFOLIO(1) AS OF JUNE 30, 2007 (UNAUDITED) (CONTINUED)
Principal
Amount | | | | | | Value | |
| CORPORATE BONDS/NOTES (continued) | | | |
| $ | 12,750,000 | | | | | Bear Stearns Cos., Inc.,
5.380%, due 08/28/08 | | $ | 12,750,000 | | |
| | 12,300,000 | | | | | Bear Stearns Cos., Inc.,
5.400%, due 08/04/08 | | | 12,300,000 | | |
| | 4,300,000 | | | | | Bear Stearns Cos., Inc.,
5.420%, due 01/15/08 | | | 4,302,753 | | |
| | 6,850,000 | | | | | Bear Stearns Cos., Inc.,
5.465%, due 01/31/08 | | | 6,792,386 | | |
| | 4,000,000 | | | | | Bear Stearns Cos., Inc.,
5.510%, due 04/29/08 | | | 4,005,494 | | |
| | 5,000,000 | | | | | Bear Stearns Cos., Inc.,
5.618%, due 12/15/07 | | | 5,024,600 | | |
| | 6,000,000 | | | | | Canadian Imperial Bank
of Commerce, 5.320%,
due 08/22/08 | | | 6,001,306 | | |
| | 13,200,000 | | | | | Canadian Imperial Bank
of Commerce, 5.360%,
due 02/14/08 | | | 13,202,908 | | |
| | 12,000,000 | | | | | Citigroup Funding, Inc.,
5.360%, due 03/14/08 | | | 12,003,490 | | |
| | 15,000,000 | | | | | Credit Suisse, 5.320%,
due 03/14/08 | | | 15,000,000 | | |
| | 4,000,000 | | | | | Credit Suisse, 5.456%,
due 06/01/08 | | | 4,036,786 | | |
| | 2,865,000 | | | | | Credit Suisse, 5.470%,
due 06/02/08 | | | 2,868,332 | | |
| | 13,000,000 | | | @@,# | | Danske Bank A/S,
5.290%, due 08/20/08 | | | 12,998,892 | | |
| | 35,000,000 | | | | | Deutsche Bank, 5.360%,
due 06/19/08 | | | 35,008,619 | | |
| | 16,000,000 | | | | | General Electric Capital Corp.,
5.445%, due 07/09/07 | | | 16,000,000 | | |
| | 22,000,000 | | | I | | Goldman Sachs Group Inc.,
5.350%, due 04/11/08 | | | 22,000,000 | | |
| | 19,550,000 | | | # | | Goldman Sachs Group Inc.,
5.370%, due 08/15/08 | | | 19,553,834 | | |
| | 7,800,000 | | | @@,# | | HBOS Treasury Services PLC,
5.300%, due 07/31/08 | | | 7,800,000 | | |
| | 27,000,000 | | | @@,# | | HBOS Treasury Services PLC,
5.430%, due 06/24/08 | | | 27,000,488 | | |
| | 13,500,000 | | | | | HSBC Finance Corp.,
5.312%, due 06/17/08 | | | 13,629,455 | | |
| | 3,000,000 | | | | | HSBC Finance Corp.,
5.316%, due 01/15/08 | | | 2,989,182 | | |
| | 6,420,000 | | | | | HSBC Finance Corp.,
5.368%, due 03/11/08 | | | 6,366,076 | | |
| | 3,000,000 | | | | | JP Morgan Chase,
5.412%, due 06/30/08 | | | 2,919,880 | | |
| | 1,100,000 | | | | | JP Morgan Chase,
5.424%, due 09/01/07 | | | 1,097,628 | | |
| | 13,639,000 | | | | | Lehman Brothers
Holdings, Inc., 5.819%,
due 02/01/08 | | | 13,756,865 | | |
| | 1,000,000 | | | | | Marshall & Ilsley Bank,
5.030%, due 02/08/08 | | | 990,073 | | |
| | 6,000,000 | | | # | | MBIA Global Funding LLC,
5.315%, due 03/14/08 | | | 6,000,000 | | |
| | 28,000,000 | | | # | | MBIA Global Funding LLC,
5.350%, due 11/28/07 | | | 28,002,789 | | |
| | 10,000,000 | | | # | | MBIA Global Funding LLC,
5.370%, due 02/15/08 | | | 10,002,450 | | |
| | 6,925,000 | | | # | | MBIA Global Funding LLC,
5.390%, due 01/11/08 | | | 6,928,276 | | |
Principal
Amount | | | | | | Value | |
| $ | 4,500,000 | | | | | MBNA Corp., 5.786%,
due 05/05/08 | | $ | 4,516,726 | | |
| | 7,000,000 | | | | | Merrill Lynch & Co., Inc.,
5.323%, due 04/21/08 | | | 6,910,115 | | |
| | 5,000,000 | | | | | Merrill Lynch & Co., Inc.,
5.360%, due 08/22/07 | | | 5,000,504 | | |
| | 6,200,000 | | | | | Merrill Lynch & Co., Inc.,
5.390%, due 08/24/07 | | | 6,200,589 | | |
| | 8,000,000 | | | | | Morgan Stanley,
5.360%, due 08/01/08 | | | 8,005,120 | | |
| | 9,000,000 | | | | | Morgan Stanley,
5.390%, due 04/25/08 | | | 9,003,548 | | |
| | 10,000,000 | | | | | Morgan Stanley,
5.400%, due 08/04/08 | | | 10,009,264 | | |
| | 17,000,000 | | | | | Morgan Stanley,
5.410%, due 03/07/08 | | | 17,008,968 | | |
| | 7,450,000 | | | C | | Morgan Stanley,
5.449%, due 04/01/08 | | | 7,351,059 | | |
| | 14,000,000 | | | | | Morgan Stanley,
5.480%, due 07/27/07 | | | 14,001,529 | | |
| | 4,200,000 | | | | | Morgan Stanley,
5.760%, due 05/14/08 | | | 4,213,936 | | |
| | 14,000,000 | | | | | Natixis SA, 5.310%,
due 12/05/07 | | | 13,998,822 | | |
| | 10,040,000 | | | | | PNC Funding Corp.,
5.353%, due 03/10/08 | | | 9,961,858 | | |
| | 11,500,000 | | | | | Royal Bank of Canada,
5.305%, due 04/02/08 | | | 11,498,871 | | |
| | 25,500,000 | | | | | Royal Bank of Canada,
5.316%, due 01/22/08 | | | 25,492,080 | | |
| | 2,590,000 | | | @@,# | | Royal Bank of Scotland,
5.335%, due 11/30/07 | | | 2,570,840 | | |
| | 35,500,000 | | | @@,# | | Santander US Debt SA,
5.366%, due 02/06/08 | | | 35,506,018 | | |
| | 4,600,000 | | | @@,# | | Santander US Debt SA,
5.370%, due 09/21/07 | | | 4,600,359 | | |
| | 3,500,000 | | | | | Suntrust Bank, 5.290%,
due 11/19/07 | | | 3,500,000 | | |
| | 2,800,000 | | | | | Toyota Motor Credit Corp.,
5.286%, due 03/17/08 | | | 2,798,401 | | |
| | 4,200,000 | | | | | Toyota Motor Credit Corp.,
5.286%, due 03/24/08 | | | 4,197,498 | | |
| | 32,500,000 | | | | | Toyota Motor Credit Corp.,
5.340%, due 06/16/08 | | | 32,507,331 | | |
| | 14,500,000 | | | C | | UBS AG, 5.437%,
due 11/28/07 | | | 14,497,169 | | |
| | 8,500,000 | | | | | US Bank, 5.390%,
due 10/01/07 | | | 8,501,257 | | |
| | 4,500,000 | | | | | Washington Mutual Bank,
5.340%, due 09/17/07 | | | 4,499,929 | | |
| | 27,300,000 | | | | | Washington Mutual Bank,
5.390%, due 04/18/08 | | | 27,304,915 | | |
| | 23,800,000 | | | | | Washington Mutual Bank,
5.400%, due 11/16/07 | | | 23,803,803 | | |
| | 7,800,000 | | | | | Westpac Banking Corp.,
5.420%, due 07/11/08 | | | 7,800,000 | | |
| | | Total Corporate Bonds/Notes
(Cost $845,590,509) | | | 845,590,509 | | |
| U.S. GOVERNMENT AGENCY OBLIGATION: 0.9% | | | |
| | 13,000,000 | | | | | Federal Home Loan Bank,
4.000%, due 06/13/08 | | | 12,853,116 | | |
| | | Total U.S. Government
Agency Obligation
(Cost $12,853,116) | | | 12,853,116 | | |
See Accompanying Notes to Financial Statements
99
PORTFOLIO OF INVESTMENTS
ING VP MONEY MARKET PORTFOLIO(1) AS OF JUNE 30, 2007 (UNAUDITED) (CONTINUED)
Principal
Amount | | | | Value | |
| REPURCHASE AGREEMENT: 4.2% | |
| $ | 63,657,000 | | | | | Goldman Sachs Repurchase
Agreement dated 06/29/07,
5.300%, due 07/02/07
$63,685,115 to be received
upon repurchase
(Collateralized by $52,915,000
U.S. Treasury Bond, 7.250%,
Market Value plus accrued
interest $64,930,251,
due 08/15/22). | | $ | 63,657,000 | | |
| | | Total Repurchase Agreement
(Cost $63,657,000) | | | 63,657,000 | | |
| SECURITIES LENDING COLLATERALCC: 0.0% | |
| | 402,000 | | | | | The Bank of New York
Institutional Cash
Reserves Fund | | | 402,000 | | |
| | | Total Securities Lending Collateral
(Cost $402,000) | | | 402,000 | | |
Total Investments in
Securities
(Cost $1,562,755,723)* | | | 100.5 | % | | $ | 1,562,755,723 | | |
Other Assets and
Liabilities - Net | | | (0.5 | ) | | | (7,977,120 | ) | |
| Net Assets | | | 100.0 | % | | $ | 1,554,778,603 | | |
(1) All securities with a maturity date greater than one year have either a variable rate. a demand feature, are prerefunded, or an optional or mandatory put resulting in an effective maturity of one year or less. Rate shown reflects current rate.
@@ Foreign Issuer
# Securities with purchases pursuant to Rule 144A, under the Securities Act of 1933 and may not be resold subject to that rule except to qualified institutional buyers. These securities have been determined to be liquid under the guidelines established by the Funds' Board of Directors/Trustees.
cc Securities purchased with cash collateral for securities loaned.
C Bond may be called prior to maturity date.
I Illiquid security
L Loaned security, a portion or all of the security is on loan at June 30, 2007.
* Cost for federal income tax purposes is the same for financial statement purposes.
See Accompanying Notes to Financial Statements
100
ING VP GLOBAL SCIENCE AND PORTFOLIO OF INVESTMENTS
TECHNOLOGY PORTFOLIO AS OF JUNE 30, 2007 (UNAUDITED)

| Shares | | | | | | Value | |
| COMMON STOCK: 99.0% | | | |
| | | | | Australia: 0.5% | |
| | 46,000 | | | | | Computershare Ltd. | | $ | 438,921 | | |
| | | | 438,921 | | |
| | | | | Bermuda: 0.6% | |
| | 10,700 | | | | | Accenture Ltd. | | | 458,923 | | |
| | | | 458,923 | | |
| | | | | Brazil: 0.6% | |
| | 30,200 | | | @,L | | NET Servicos de
Comunicacao SA ADR | | | 499,206 | | |
| | | | 499,206 | | |
| | | | | Canada: 0.5% | |
| | 9,800 | | | @ | | Cognos, Inc. | | | 388,766 | | |
| | | | 388,766 | | |
| | | | | Cayman Islands: 0.6% | |
| | 21,900 | | | L | | Seagate Technology, Inc. | | | 476,763 | | |
| | | | 476,763 | | |
| | | | | China: 0.0% | |
| | 1,400 | | | @ | | China Communications
Services Corp., Ltd. | | | 1,034 | | |
| | | | 1,034 | | |
| | | | | France: 3.7% | |
| | 4,400 | | | @,L | | Alstom | | | 733,712 | | |
| | 14,000 | | | @ | | Business Objects SA ADR | | | 543,760 | | |
| | 5,615 | | | | | Capgemini SA | | | 410,505 | | |
| Shares | | | | | | Value | |
| | 3,400 | | | L | | Neopost SA | | $ | 497,485 | | |
| | 5,819 | | | @ | | NicOx SA | | | 141,582 | | |
| | 4,600 | | | | | Schneider Electric SA | | | 644,498 | | |
| | | | 2,971,542 | | |
| | �� | | | Germany: 2.5% | |
| | 13,200 | | | @,L | | Infineon Technologies AG ADR | | | 218,196 | | |
| | 13,500 | | | L | | SAP AG ADR | | | 689,445 | | |
| | 3,900 | | | | | Siemens AG | | | 558,487 | | |
| | 6,200 | | | | | Software AG | | | 601,773 | | |
| | | | 2,067,901 | | |
| | | | | Hong Kong: 1.9% | |
| | 76,900 | | | L | | ASM Pacific Technology | | | 557,055 | | |
| | 92,400 | | | | | China Mobile Ltd. | | | 994,134 | | |
| | | | 1,551,189 | | |
| | | | | India: 1.3% | |
| | 51,000 | | | @ | | Bharti Airtel Ltd. | | | 1,048,276 | | |
| | | | 1,048,276 | | |
| | | | | Japan: 3.6% | |
| | 7,000 | | | | | Disco Corp. | | | 404,628 | | |
| | 32,100 | | | | | Kurita Water Industries Ltd. | | | 1,007,814 | | |
| | 1,200 | | | | | Nintendo Co., Ltd. | | | 437,812 | | |
| | 56,300 | | | | | Shimadzu Corp. | | | 591,878 | | |
| | 22,000 | | | | | Sumitomo Metal Mining
Co., Ltd. | | | 476,932 | | |
| | | | 2,919,064 | | |
| | | | | Mexico: 0.7% | |
| | 9,000 | | | L | | America Movil SA de
CV ADR | | | 557,370 | | |
| | | | 557,370 | | |
| | | | | Singapore: 0.6% | |
| | 678,400 | | | @,L | | United Test and Assembly
Center Ltd. | | | 514,636 | | |
| | | | 514,636 | | |
| | | | | South Korea: 1.5% | |
| | 4,500 | | | @ | | NHN Corp. | | | 819,107 | | |
| | 700 | | | | | Samsung Electronics Co., Ltd. | | | 427,947 | | |
| | | | 1,247,054 | | |
| | | | | Switzerland: 1.5% | |
| | 3,100 | | | | | Roche Holding AG | | | 549,278 | | |
| | 7,500 | | | | | Roche Holding AG ADR | | | 665,185 | | |
| | | | 1,214,463 | | |
| | | | | Taiwan: 4.1% | |
| | 74,433 | | | | | HON HAI Precision Industry
Co., Ltd. | | | 642,917 | | |
| | 476,000 | | | | | Inventec Co., Ltd. | | | 360,495 | | |
| | 32,000 | | | | | MediaTek, Inc. | | | 497,873 | | |
| | 125,000 | | | | | Realtek Semiconductor Corp. | | | 619,717 | | |
| | 276,000 | | | | | Synnex Technology
International Corp. | | | 416,082 | | |
| | 52,259 | | | | | Taiwan Semiconductor
Manufacturing Co., Ltd. ADR | | | 581,643 | | |
| | 225,000 | | | | | Vanguard International
Semiconductor Corp. | | | 224,858 | | |
| | | | 3,343,585 | | |
See Accompanying Notes to Financial Statements
101
ING VP GLOBAL SCIENCE AND PORTFOLIO OF INVESTMENTS
TECHNOLOGY PORTFOLIO AS OF JUNE 30, 2007 (UNAUDITED) (CONTINUED)
| Shares | | | | | | Value | |
| | | | | United Kingdom: 2.0% | |
| | 41,200 | | | @ | | Autonomy Corp. PLC | | $ | 590,978 | | |
| | 52,900 | | | @ | | Blinkx PLC | | | 46,210 | | |
| | 88,200 | | | | | Meggitt PLC | | | 541,958 | | |
| | 33,500 | | | | | Rightmove PLC | | | 420,066 | | |
| | | | 1,599,212 | | |
| | | | | United States: 72.8% | |
| | 7,800 | | | | | Abbott Laboratories | | | 417,690 | | |
| | 24,800 | | | @,L | | Adobe Systems, Inc. | | | 995,720 | | |
| | 25,300 | | | @ | | Agilent Technologies, Inc. | | | 972,532 | | |
| | 10,800 | | | @,L | | Alexion Pharmaceuticals, Inc. | | | 486,648 | | |
| | 21,100 | | | L | | Altera Corp. | | | 466,943 | | |
| | 12,700 | | | @ | | American Tower Corp. | | | 533,400 | | |
| | 15,400 | | | | | Amphenol Corp. | | | 549,010 | | |
| | 15,800 | | | L | | Analog Devices, Inc. | | | 594,712 | | |
| | 21,700 | | | @ | | Apple, Inc. | | | 2,648,268 | | |
| | 23,500 | | | @ | | Applera Corp. - Celera
Genomics Group | | | 291,400 | | |
| | 29,000 | | | | | Applied Materials, Inc. | | | 576,230 | | |
| | 14,600 | | | | | AT&T, Inc. | | | 605,900 | | |
| | 24,500 | | | @ | | Atheros Communications, Inc. | | | 755,580 | | |
| | 16,900 | | | @,L | | Autodesk, Inc. | | | 795,652 | | |
| | 9,100 | | | @ | | Avnet, Inc. | | | 360,724 | | |
| | 8,400 | | | | | Becton Dickinson & Co. | | | 625,800 | | |
| | 12,300 | | | @ | | Biogen Idec, Inc. | | | 658,050 | | |
| | 22,800 | | | @,L | | BioMarin Pharmaceuticals, Inc. | | | 409,032 | | |
| | 14,600 | | | | | Biomet, Inc. | | | 667,512 | | |
| | 24,600 | | | @ | | Broadcom Corp. | | | 719,550 | | |
| | 24,900 | | | @,L | | Cadence Design Systems, Inc. | | | 546,804 | | |
| | 6,200 | | | @,L | | Cavium Networks, Inc. | | | 140,244 | | |
| | 2,500 | | | @,L | | Cephalon, Inc. | | | 200,975 | | |
| | 9,000 | | | @,L | | Charles River Laboratories
International, Inc. | | | 464,580 | | |
| | 23,100 | | | @ | | Chordiant Software, Inc. | | | 361,746 | | |
| | 24,700 | | | @,L | | Ciena Corp. | | | 892,411 | | |
| | 49,600 | | | @ | | Cisco Systems, Inc. | | | 1,381,360 | | |
| | 10,300 | | | @ | | Computer Sciences Corp. | | | 609,245 | | |
| | 3,000 | | | @ | | COMSCORE, Inc. | | | 69,450 | | |
| | 32,800 | | | @ | | Corning, Inc. | | | 838,040 | | |
| | 6,200 | | | @,W | | Covance, Inc. | | | 425,072 | | |
| | 10,600 | | | | | CVS Corp. | | | 386,370 | | |
| | 15,800 | | | @,L | | Cyberonics | | | 265,756 | | |
| | 24,100 | | | @,L | | DST Systems, Inc. | | | 1,908,957 | | |
| | 18,900 | | | @ | | eBay, Inc. | | | 608,202 | | |
| | 10,300 | | | @,L | | Electronic Arts, Inc. | | | 487,396 | | |
| | 39,300 | | | @ | | EMC Corp. | | | 711,330 | | |
| | 64,900 | | | @ | | Finisar Corp. | | | 245,322 | | |
| | 7,000 | | | @ | | Fiserv, Inc. | | | 397,600 | | |
| | 26,500 | | | @,L | | Foundry Networks, Inc. | | | 441,490 | | |
| | 6,800 | | | @ | | Genentech, Inc. | | | 514,488 | | |
| | 19,400 | | | @ | | Gilead Sciences, Inc. | | | 752,138 | | |
| | 14,000 | | | | | Goodrich Corp. | | | 833,840 | | |
| | 3,200 | | | @ | | Google, Inc. | | | 1,674,816 | | |
| | 13,100 | | | L | | Harris Corp. | | | 714,605 | | |
| | 21,700 | | | | | Hewlett-Packard Co. | | | 968,254 | | |
| | 10,500 | | | @ | | ImClone Systems, Inc. | | | 371,280 | | |
| | 14,600 | | | @ | | Infinera Corp. | | | 363,832 | | |
| | 9,100 | | | @,L | | Integra LifeSciences
Holdings Corp. | | | 449,722 | | |
| | 26,200 | | | @ | | Integrated Device
Technology, Inc. | | | 400,074 | | |
| | 43,200 | | | | | Intel Corp. | | | 1,026,432 | | |
| | 16,200 | | | | | International Business
Machines Corp. | | | 1,705,050 | | |
| | 15,100 | | | | | Intersil Corp. | | | 475,046 | | |
| | 4,400 | | | | | Johnson & Johnson | | | 271,128 | | |
| Shares | | | | | | Value | |
| | 24,800 | | | @,L | | Juniper Networks, Inc. | | $ | 624,216 | | |
| | 18,600 | | | L | | KLA-Tencor Corp. | | | 1,022,070 | | |
| | 19,949 | | | @,L | | Kosan Biosciences, Inc. | | | 104,134 | | |
| | 38,900 | | | @,L | | Kulicke & Soffa Industries, Inc. | | | 407,283 | | |
| | 4,300 | | | @,L | | Kyphon, Inc. | | | 207,045 | | |
| | 9,400 | | | @ | | Lam Research Corp. | | | 483,160 | | |
| | 15,900 | | | @,L | | Liberty Global, Inc. | | | 652,536 | | |
| | 10,700 | | | @,L | | Limelight Networks, Inc. | | | 211,646 | | |
| | 12,600 | | | L | | Linear Technology Corp. | | | 455,868 | | |
| | 9,700 | | | | | Lockheed Martin Corp. | | | 913,061 | | |
| | 23,900 | | | | | Maxim Integrated Products | | | 798,499 | | |
| | 11,800 | | | @ | | McAfee, Inc. | | | 415,360 | | |
| | 15,000 | | | | | Medtronic, Inc. | | | 777,900 | | |
| | 9,400 | | | @ | | MEMC Electronic Materials, Inc. | | | 574,528 | | |
| | 18,100 | | | | | Merck & Co., Inc. | | | 901,380 | | |
| | 21,500 | | | @ | | MetroPCS Communications, Inc. | | | 710,360 | | |
| | 32,200 | | | | | Microsoft Corp. | | | 948,934 | | |
| | 5,200 | | | @,L | | Millipore Corp. | | | 390,468 | | |
| | 23,200 | | | | | Motorola, Inc. | | | 410,640 | | |
| | 22,100 | | | @,L | | Myriad Genetics, Inc. | | | 821,899 | | |
| | 21,000 | | | | | National Semiconductor Corp. | | | 593,670 | | |
| | 8,900 | | | @,L | | Netlogic Microsystems, Inc. | | | 283,376 | | |
| | 13,000 | | | @,L | | Network Appliance, Inc. | | | 379,600 | | |
| | 14,700 | | | @,L | | Nvidia Corp. | | | 607,257 | | |
| | 34,100 | | | @ | | Oracle Corp. | | | 672,111 | | |
| | 10,900 | | | L | | Owens & Minor, Inc. | | | 380,846 | | |
| | 6,700 | | | @,L | | Priceline.com, Inc. | | | 460,558 | | |
| | 25,400 | | | | | Qualcomm, Inc. | | | 1,102,106 | | |
| | 13,000 | | | @ | | SenoRx, Inc. | | | 133,380 | | |
| | 6,600 | | | L | | Stryker Corp. | | | 416,394 | | |
| | 25,500 | | | @ | | Sybase, Inc. | | | 609,195 | | |
| | 14,900 | | | @ | | Synopsys, Inc. | | | 393,807 | | |
| | 25,700 | | | | | Texas Instruments, Inc. | | | 967,091 | | |
| | 4,300 | | | | | Textron, Inc. | | | 473,473 | | |
| | 22,800 | | | @,L | | Thoratec Corp. | | | 419,292 | | |
| | 44,700 | | | @ | | TIBCO Software, Inc. | | | 404,535 | | |
| | 7,500 | | | @ | | Varian, Inc. | | | 411,225 | | |
| | 24,300 | | | @ | | VeriSign, Inc. | | | 771,039 | | |
| | 41 | | | | | Windstream Corp. | | | 605 | | |
| | 26,000 | | | @ | | Wright Medical Group, Inc. | | | 627,120 | | |
| | 14,900 | | | L | | Xilinx, Inc. | | | 398,873 | | |
| | 18,600 | | | @,L | | Yahoo!, Inc. | | | 504,618 | | |
| | 5,400 | | | @ | | Zimmer Holdings, Inc. | | | 458,406 | | |
| | | | 59,332,972 | | |
| | | Total Common Stock
(Cost $68,252,077 ) | | | 80,630,877 | | |
Principal
Amount | | | | Value | |
| SHORT-TERM INVESTMENTS: 24.6% | |
| | | | | Securities Lending Collateralcc: 24.6% | |
| $ | 20,063,000 | | | | | The Bank of New York
Institutional Cash Reserves Fund | | | 20,063,000 | | |
| | | Total Short-Term Investments
(Cost $20,063,000) | | | 20,063,000 | | |
Total Investments in
Securities
(Cost $88,315,077)* | | | 123.6 | % | | $ | 100,693,877 | | |
Other Assets and
Liabilities - Net | | | (23.6 | ) | | | (19,229,769 | ) | |
| Net Assets | | | 100.0 | % | | $ | 81,464,108 | | |
See Accompanying Notes to Financial Statements
102
ING VP GLOBAL SCIENCE AND PORTFOLIO OF INVESTMENTS
TECHNOLOGY PORTFOLIO AS OF JUNE 30, 2007 (UNAUDITED) (CONTINUED)
@ Non-income producing security
ADR American Depositary Receipt
cc Securities purchased with cash collateral for securities loaned.
W When-issued or delayed delivery security
L Loaned security, a portion or all of the security is on loan at June 30, 2007.
* Cost for federal income tax purposes is $88,403,001.
Net unrealized appreciation consists of:
| Gross Unrealized Appreciation | | $ | 13,311,018 | | |
| Gross Unrealized Depreciation | | | (1,020,142 | ) | |
| Net Unrealized Appreciation | | $ | 12,290,876 | | |
| Industry | | Percentage of
Net Assets | |
| Aerospace/Defense | | | 2.8 | % | |
| Biotechnology | | | 5.3 | | |
| Commercial Services | | | 0.6 | | |
| Computers | | | 14.5 | | |
| Distribution/Wholesale | | | 0.5 | | |
| Electrical Components & Equipment | | | 0.8 | | |
| Electronics | | | 4.1 | | |
| Environmental Control | | | 1.2 | | |
| Hand/Machine Tools | | | 0.5 | | |
| Healthcare - Products | | | 6.7 | | |
| Healthcare - Services | | | 0.5 | | |
| Internet | | | 8.0 | | |
| Machinery - Diversified | | | 0.9 | | |
| Media | | | 1.4 | | |
| Mining | | | 0.6 | | |
| Miscellaneous Manufacturing | | | 1.3 | | |
| Office/Business Equipment | | | 0.6 | | |
| Pharmaceuticals | | | 5.2 | | |
| Retail | | | 0.5 | | |
| Semiconductors | | | 18.0 | | |
| Software | | | 9.5 | | |
| Telecommunications | | | 15.0 | | |
| Toys/Games/Hobbies | | | 0.5 | | |
| Short-Term Investments | | | 24.6 | | |
| Other Assets and Liabilities - Net | | | (23.6 | ) | |
| Net Assets | | | 100.0 | % | |
See Accompanying Notes to Financial Statements
103
ING VP GLOBAL SCIENCE AND PORTFOLIO OF INVESTMENTS
TECHNOLOGY PORTFOLIO AS OF JUNE 30, 2007 (UNAUDITED) (CONTINUED)
At June 30, 2007 the following forward currency contracts were outstanding for the ING VP Global Science and Technology Portfolio:
| Currency | | Buy/Sell | | Settlement Date | | In Exchange For | | USD
Exchange | | Value | | Unrealized
Appreciation/
(Deprec iation) | |
| | | | | | | | | | USD | | | | | | | | | | | | | | |
| Canada Dollars | |
| CAD | 300,000 | | | Buy | | 7/18/07 | | | 281,036 | | | USD | - | | | | 281,751 | | | $ | 715 | | |
| EURO | |
| EUR | 133,000 | | | Buy | | 7/18/07 | | | 180,084 | | | USD | - | | | | 180,122 | | | | 38 | | |
| EURO | |
| EUR | 590,000 | | | Buy | | 7/18/07 | | | 805,183 | | | USD | - | | | | 799,038 | | | | (6,145 | ) | |
| EURO | |
| EUR | 695,000 | | | Buy | | 7/18/07 | | | 950,301 | | | USD | - | | | | 941,240 | | | | (9,061 | ) | |
| EURO | |
| EUR | 2,900,000 | | | Buy | | 7/18/07 | | | 3,962,995 | | | USD | - | | | | 3,927,475 | | | | (35,520 | ) | |
| EURO | |
| EUR | 710,000 | | | Buy | | 7/18/07 | | | 946,849 | | | USD | - | | | | 961,554 | | | | 14,705 | | |
| British Pound Sterling | |
| GBP | 675,000 | | | Buy | | 7/18/07 | | | 1,352,005 | | | USD | - | | | | 1,355,166 | | | | 3,161 | | |
| Japanese Yen | |
| JPY | 66,230,000 | | | Buy | | 7/23/07 | | | 562,592 | | | USD | - | | | | 539,573 | | | | (23,019 | ) | |
| Japanese Yen | |
| JPY | 113,145,000 | | | Buy | | 7/18/07 | | | 955,524 | | | USD | - | | | | 921,169 | | | | (34,354 | ) | |
| Japanese Yen | |
| JPY | 199,720,000 | | | Buy | | 7/18/07 | | | 1,684,562 | | | USD | - | | | | 1,626,019 | | | | (58,543 | ) | |
| Japanese Yen | |
| JPY | 16,525,000 | | | Buy | | 7/18/07 | | | 139,178 | | | USD | - | | | | 134,538 | | | | (4,640 | ) | |
| Norway Krone | |
| NOK | 815,000 | | | Buy | | 7/18/07 | | | 135,423 | | | USD | - | | | | 138,256 | | | | 2,833 | | |
| | | | | | | $ | (149,830 | ) | |
| Canada Dollars | |
| CAD | 5,000 | | | Sell | | 7/18/07 | | | 4,354 | | | USD | - | | | | 4,696 | | | | (342 | ) | |
| Canada Dollars | |
| CAD | 155,000 | | | Sell | | 7/18/07 | | | 137,823 | | | USD | - | | | | 145,571 | | | | (7,748 | ) | |
| Canada Dollars | |
| CAD | 155,000 | | | Sell | | 7/18/07 | | | 137,824 | | | USD | - | | | | 145,571 | | | | (7,747 | ) | |
| Switzerland Francs | |
| CHF | 780,000 | | | Sell | | 7/18/07 | | | 645,960 | | | USD | - | | | | 639,455 | | | | 6,505 | | |
| EURO | |
| EUR | 1,000,000 | | | Sell | | 7/18/07 | | | 678,725 | | | GBP | 1,362,645 | | | | 1,354,302 | | | | 8,343 | | |
| EURO | |
| EUR | 1,400,000 | | | Sell | | 7/18/07 | | | 958,482 | | | GBP | 1,924,300 | | | | 1,896,023 | | | | 28,277 | | |
| EURO | |
| EUR | 1,005,000 | | | Sell | | 7/18/07 | | | 159,611,386 | | | JPY | 1,299,475 | | | | 1,361,073 | | | | (61,598 | ) | |
| EURO | |
| EUR | 1,005,000 | | | Sell | | 7/18/07 | | | 159,700,962 | | | JPY | 1,300,204 | | | | 1,361,073 | | | | (60,869 | ) | |
| EURO | |
| EUR | 1,675,500 | | | Sell | | 7/18/07 | | | 2,258,532 | | | USD | - | | | | 2,269,133 | | | | (10,601 | ) | |
| EURO | |
| EUR | 695,000 | | | Sell | | 7/18/07 | | | 949,301 | | | USD | - | | | | 941,240 | | | | 8,061 | | |
| EURO | |
| EUR | 2,000,000 | | | Sell | | 7/18/07 | | | 2,724,840 | | | USD | - | | | | 2,708,604 | | | | 16,236 | | |
| British Pound Sterling | |
| GBP | 955,788 | | | Sell | | 7/18/07 | | | 1,400,000 | | | EUR | 1,896,023 | | | | 1,918,892 | | | | (22,869 | ) | |
| British Pound Sterling | |
| GBP | 658,500 | | | Sell | | 7/18/07 | | | 1,301,657 | | | USD | - | | | | 1,322,040 | | | | (20,383 | ) | |
| British Pound Sterling | |
| GBP | 675,000 | | | Sell | | 7/18/07 | | | 1,352,255 | | | USD | - | | | | 1,355,166 | | | | (2,911 | ) | |
| British Pound Sterling | |
| GBP | 725,000 | | | Sell | | 7/18/07 | | | 1,448,189 | | | USD | - | | | | 1,455,549 | | | | (7,360 | ) | |
| British Pound Sterling | |
| GBP | 205,000 | | | Sell | | 7/18/07 | | | 404,592 | | | USD | - | | | | 411,569 | | | | (6,977 | ) | |
| British Pound Sterling | |
| GBP | 165,000 | | | Sell | | 7/18/07 | | | 325,014 | | | USD | - | | | | 331,263 | | | | (6,249 | ) | |
| Hong Kong Dollars | |
| HKD | 9,410,000 | | | Sell | | 7/18/07 | | | 1,207,696 | | | USD | - | | | | 1,203,998 | | | | 3,698 | | |
| Hong Kong Dollars | |
| HKD | 1,400,000 | | | Sell | | 7/18/07 | | | 179,375 | | | USD | - | | | | 179,128 | | | | 247 | | |
| India Rupees | |
| INR | 33,085,000 | | | Sell | | 7/19/07 | | | 794,739 | | | USD | - | | | | 811,884 | | | | (17,145 | ) | |
See Accompanying Notes to Financial Statements
104
ING VP GLOBAL SCIENCE AND PORTFOLIO OF INVESTMENTS
TECHNOLOGY PORTFOLIO AS OF JUNE 30, 2007 (UNAUDITED) (CONTINUED)
| Currency | | Buy/Sell | | Settlement Date | | In Exchange For | | USD
Exchange | | Value | | Unrealized
Appreciation/
(Depreciation) | |
| | | | | | | | | | USD | | | | | | | | | | | | | | |
| Japanese Yen | |
| JPY | 80,719,099 | | | Sell | | 7/18/07 | | | 505,000 | | | EUR | 683,922 | | | | 657,174 | | | $ | 26,748 | | |
| Japanese Yen | |
| JPY | 379,030,500 | | | Sell | | 7/18/07 | | | 3,217,350 | | | USD | - | | | | 3,085,875 | | | | 131,475 | | |
| Japanese Yen | |
| JPY | 113,145,000 | | | Sell | | 7/18/07 | | | 957,055 | | | USD | - | | | | 921,169 | | | | 35,886 | | |
| Japanese Yen | |
| JPY | 199,720,000 | | | Sell | | 7/18/07 | | | 1,685,486 | | | USD | - | | | | 1,626,019 | | | | 59,467 | | |
| Japanese Yen | |
| JPY | 220,000,000 | | | Sell | | 7/18/07 | | | 1,848,620 | | | USD | - | | | | 1,791,129 | | | | 57,491 | | |
| Korea (South) Won | |
| KRW | 2,394,675,000 | | | Sell | | 7/19/07 | | | 2,581,248 | | | USD | - | | | | 2,594,197 | | | | (12,949 | ) | |
| Singapore Dollars | |
| SGD | 557,000 | | | Sell | | 7/18/07 | | | 369,094 | | | USD | - | | | | 364,439 | | | | 4,655 | | |
| Taiwan New Dollars | |
| TWD | 90,000,000 | | | Sell | | 7/19/07 | | | 2,727,066 | | | USD | - | | | | 2,741,697 | | | | (14,631 | ) | |
| | | | | | | $ | 126,710 | | |
See Accompanying Notes to Financial Statements
105
PORTFOLIO OF INVESTMENTS
ING VP INTERNATIONAL EQUITY PORTFOLIO AS OF JUNE 30, 2007 (UNAUDITED)
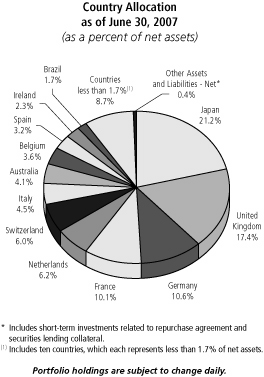
| Shares | | | | | | Value | |
| COMMON STOCK: 98.4% | | | |
| | | | | Australia: 4.1% | |
| | 52,599 | | | | | BHP Billiton Ltd. | | $ | 1,571,697 | | |
| | 66,989 | | | @ | | Brambles Ltd. | | | 690,616 | | |
| | 34,700 | | | | | National Australia Bank Ltd. | | | 1,205,916 | | |
| | | | 3,468,229 | | |
| | | | | Belgium: 3.6% | |
| | 32,882 | | | | | Fortis | | | 1,393,665 | | |
| | 6,800 | | | | | KBC Groep NV | | | 916,425 | | |
| | 8,731 | | | | | Omega Pharma SA | | | 755,827 | | |
| | | | 3,065,917 | | |
| | | | | Brazil: 1.7% | |
| | 6,000 | | | | | Petroleo Brasileiro SA ADR | | | 727,620 | | |
| | 6,300 | | | L | | Uniao de Bancos Brasileiros
SA GDR | | | 711,081 | | |
| | | | 1,438,701 | | |
| | | | | China: 0.8% | |
| | 633,000 | | | | | China Yurun Food Group Ltd. | | | 707,731 | | |
| | | | 707,731 | | |
| | | | | Egypt: 0.7% | |
| | 8,700 | | | L | | Orascom Telecom GDR | | | 555,318 | | |
| | | | 555,318 | | |
| | | | | France: 10.1% | |
| | 76,709 | | | L | | Alcatel SA | | | 1,072,979 | | |
| | 8,800 | | | | | Bouygues SA | | | 737,310 | | |
| Shares | | | | | | Value | |
| | 7,542 | | | | | LVMH Moet Hennessy Louis
Vuitton SA | | $ | 867,819 | | |
| | 11,675 | | | @ | | SeLoger.com | | | 648,196 | | |
| | 6,395 | | | | | Societe Generale | | | 1,184,856 | | |
| | 20,200 | | | | | Total SA | | | 1,637,780 | | |
| | 14,838 | | | L | | Veolia Environnement | | | 1,165,391 | | |
| | 28,397 | | | | | Vivendi | | | 1,221,574 | | |
| | | | 8,535,905 | | |
| | | | | Germany: 9.4% | |
| | 8,916 | | | | | Deutsche Bank AG | | | 1,290,392 | | |
| | 15,600 | | | | | Fresenius Medical Care
AG & Co. KGaA | | | 717,020 | | |
| | 23,076 | | | | | Heidelberger Druckmaschinen | | | 1,113,168 | | |
| | 15,900 | | | | | Henkel KGaA-Vorzug | | | 837,863 | | |
| | 5,936 | | | | | Hochtief AG | | | 646,407 | | |
| | 11,600 | | | | | RWE AG | | | 1,230,530 | | |
| | 14,717 | | | | | Siemens AG | | | 2,107,499 | | |
| | | | 7,942,879 | | |
| | | | | Greece: 1.1% | |
| | 20,197 | | | | | Coca-Cola Hellenic Bottling Co. SA | | | 929,415 | | |
| | | | 929,415 | | |
| | | | | Hong Kong: 0.8% | |
| | 53,000 | | | | | Cheung Kong Holdings Ltd. | | | 694,490 | | |
| | | | 694,490 | | |
| | | | | Ireland: 2.3% | |
| | 51,600 | | | | | Bank of Ireland-London
Exchange | | | 1,039,577 | | |
| | 36,510 | | | @ | | Smurfit Kappa PLC | | | 918,667 | | |
| | | | 1,958,244 | | |
| | | | | Italy: 4.5% | |
| | 35,400 | | | | | ERG S.p.A. | | | 961,045 | | |
| | 131,635 | | | | | Intesa Sanpaolo S.p.A. | | | 981,436 | | |
| | 25,808 | | | L | | Italcementi S.p.A. | | | 796,807 | | |
| | 482,106 | | | | | Telecom Italia S.p.A. RNC | | | 1,068,465 | | |
| | | | 3,807,753 | | |
| | | | | Japan: 21.2% | |
| | 90,000 | | | | | Bank of Yokohama Ltd. | | | 630,340 | | |
| | 35,300 | | | | | Don Quijote Co., Ltd. | | | 706,216 | | |
| | 118 | | | | | East Japan Railway Co. | | | 909,215 | | |
| | 13,500 | | | @,L | | Elpida Memory, Inc. | | | 592,821 | | |
| | 148,000 | | | | | Fuji Heavy Industries Ltd. | | | 707,844 | | |
| | 229,000 | | | @ | | Haseko Corp. | | | 677,198 | | |
| | 34,700 | | | | | Hitachi Construction Machinery
Co., Ltd. | | | 1,205,684 | | |
| | 26,900 | | | | | Hoya Corp. | | | 892,357 | | |
| | 266 | | | | | Kenedix, Inc. | | | 495,077 | | |
| | 64,500 | | | | | Konica Minolta Holdings, Inc. | | | 950,640 | | |
| | 42,000 | | | | | Matsushita Electric Industrial
Co., Ltd. | | | 832,321 | | |
| | 93 | | | | | Mitsubishi UFJ Financial Group, Inc. | | | 1,024,924 | | |
| | 29,000 | | | | | Mitsui Fudosan Co., Ltd. | | | 812,821 | | |
| | 81,700 | | | | | Nissan Motor Co., Ltd. | | | 874,672 | | |
| | 28,000 | | | | | Seven & I Holdings Co., Ltd. | | | 800,391 | | |
| | 5,000 | | | | | SFCG Co., Ltd. | | | 837,707 | | |
| | 35,900 | | | | | Shinko Electric Industries | | | 772,603 | | |
| | 131,000 | | | | | Sumitomo Chemical Co., Ltd. | | | 879,063 | | |
| | 43,000 | | | | | Sumitomo Corp. | | | 783,956 | | |
| | 196,000 | | | | | Sumitomo Metal Industries Ltd. | | | 1,152,316 | | |
See Accompanying Notes to Financial Statements
106
PORTFOLIO OF INVESTMENTS
ING VP INTERNATIONAL EQUITY PORTFOLIO AS OF JUNE 30, 2007 (UNAUDITED) (CONTINUED)
| Shares | | | | | | Value | |
| | | | | Japan (continued) | |
| | 58,000 | | | | | Sumitomo Trust & Banking
Co., Ltd. | | $ | 552,422 | | |
| | 23,900 | | | | | Tokyo Electric Power Co., Inc. | | | 768,789 | | |
| | | | 17,859,377 | | |
| | | | | Mexico: 0.8% | |
| | 16,200 | | | | | Fomento Economico Mexicano
SA de CV ADR | | | 636,984 | | |
| | | | 636,984 | | |
| | | | | Netherlands: 6.2% | |
| | 30,946 | | | | | Koninklijke Philips Electronics NV | | | 1,311,397 | | |
| | 47,868 | | | | | Royal Dutch Shell PLC-Class B | | | 1,995,426 | | |
| | 48,400 | | | @ | | Tele Atlas NV | | | 1,035,480 | | |
| | 18,428 | | | | | USG People NV | | | 864,632 | | |
| | | | 5,206,935 | | |
| | | | | Norway: 1.3% | |
| | 42,150 | | | @ | | Petroleum Geo-Services ASA | | | 1,052,508 | | |
| | | | 1,052,508 | | |
| | | | | Russia: 0.8% | |
| | 6,728 | | | | | Wimm-Bill-Dann Foods OJSC ADR | | | 699,779 | | |
| | | | 699,779 | | |
| | | | | South Korea: 0.6% | |
| | 5,737 | | | | | Kookmin Bank ADR | | | 503,250 | | |
| | | | 503,250 | | |
| | | | | Spain: 3.2% | |
| | 60,840 | | | L | | Banco Bilbao Vizcaya
Argentaria SA | | | 1,487,836 | | |
| | 54,418 | | | L | | Telefonica SA | | | 1,211,022 | | |
| | | | 2,698,858 | | |
| | | | | Sweden: 1.0% | |
| | 51,600 | | | | | Atlas Copco AB-Class B | | | 807,174 | | |
| | | | 807,174 | | |
| | | | | Switzerland: 6.0% | |
| | 5,173 | | | | | Nestle SA | | | 1,965,603 | | |
| | 10,100 | | | | | Roche Holding AG | | | 1,789,584 | | |
| | 4,222 | | | | | Zurich Financial Services AG | | | 1,305,149 | | |
| | | | 5,060,336 | | |
| | | | | Taiwan: 0.8% | |
| | 56,882 | | | L | | Taiwan Semiconductor
Manufacturing Co., Ltd. ADR | | | 633,097 | | |
| | | | 633,097 | | |
| | | | | United Kingdom: 17.4% | |
| | 22,656 | | | | | AstraZeneca PLC | | | 1,214,155 | | |
| | 69,654 | | | | | Barclays PLC | | | 969,090 | | |
| | 76,726 | | | @ | | British Airways PLC | | | 641,726 | | |
| | 40,421 | | | | | British American Tobacco PLC | | | 1,378,577 | | |
| | 83,884 | | | | | Croda International | | | 1,065,516 | | |
| | 130,742 | | | | | First Choice Holidays PLC | | | 830,418 | | |
| | 65,800 | | | | | GlaxoSmithKline PLC | | | 1,714,090 | | |
| | 109,303 | | | | | HSBC Holdings PLC | | | 2,001,392 | | |
| | 103,525 | | | | | International Power PLC | | | 889,869 | | |
| | 402,497 | | | | | Legal & General Group PLC | | | 1,207,515 | | |
| | 27,880 | | | | | Scottish & Southern Energy PLC | | | 808,360 | | |
| | 80,708 | | | | | Tate & Lyle PLC | | | 915,896 | | |
| Shares | | | | | | Value | |
| | 310,887 | | | | | Vodafone Group PLC | | $ | 1,041,724 | | |
| | | | 14,678,328 | | |
| | | Total Common Stock
(Cost $69,278,668 ) | | | 82,941,208 | | |
| PREFERRED STOCK: 1.2% | | | |
| | | | | Germany: 1.2% | |
| | 25,501 | | | | | ProSieben SAT.1 Media AG | | | 1,001,371 | | |
| | | Total Preferred Stock
(Cost $871,205 ) | | | 1,001,371 | | |
| | | Total Long-Term Investments
(Cost $70,149,873) | | | 83,942,579 | | |
| SHORT-TERM INVESTMENTS: 7.9% | | | |
| | | | | Mutual Fund: 0.1% | |
| | 100,000 | | | ** | | ING Institutional Prime Money
Market Fund | | | 100,000 | | |
| | | Total Mutual Fund
(Cost $100,000) | | | 100,000 | | |
Principal
Amount | | | | Value | |
| | | Repurchase Agreement: 0.4% | |
| $ | 296,000 | | | Goldman Sachs Repurchase
Agreement dated 06/29/07,
5.300%, due 07/02/07, $296,131
to be received upon repurchase
(Collateralized by $301,000
Federal National Mortgage
Association, 5.600%, Market
Value plus accrued interest
$302,286, due 02/01/17) | | | 296,000 | | |
| | | Total Repurchase Agreement
(Cost $296,000) | | | 296,000 | | |
| | | Securities Lending Collateralcc: 7.4% | |
| $ | 6,233,000 | | | The Bank of New York
Institutional Cash
Reserves Fund | | $ | 6,233,000 | | |
| | | Total Securities Lending
Collateral
(Cost $6,233,000) | | | 6,233,000 | | |
| | | Total Short-Term
Investments
(Cost $6,629,000) | | | 6,629,000 | | |
Total Investments in
Securities
(Cost $76,778,873)* | | | 107.5 | % | | $ | 90,571,579 | | |
Other Assets and
Liabilities - Net | | | (7.5 | ) | | | (6,351,594 | ) | |
| Net Assets | | | 100.0 | % | | $ | 84,219,985 | | |
@ Non-income producing security
ADR American Depositary Receipt
GDR Global Depositary Receipt
cc Securities purchased with cash collateral for securities loaned.
L Loaned security, a portion or all of the security is on loan at June 30, 2007.
** Investment in affiliate
* Cost for federal income tax purposes is $76,869,303.
Net unrealized appreciation consists of:
| Gross Unrealized Appreciation | | $ | 15,339,839 | | |
| Gross Unrealized Depreciation | | | (1,637,563 | ) | |
| Net Unrealized Appreciation | | $ | 13,702,276 | | |
See Accompanying Notes to Financial Statements
107
PORTFOLIO OF INVESTMENTS
ING VP INTERNATIONAL EQUITY PORTFOLIO AS OF JUNE 30, 2007 (UNAUDITED) (CONTINUED)
| Industry | | Percentage
of Net Assets | |
| Agriculture | | | 1.6 | % | |
| Airlines | | | 0.8 | | |
| Auto Manufacturers | | | 1.9 | | |
| Banks | | | 18.9 | | |
| Beverages | | | 1.9 | | |
| Building Materials | | | 0.9 | | |
| Chemicals | | | 2.3 | | |
| Commercial Services | | | 1.8 | | |
| Distribution/Wholesale | | | 0.9 | | |
| Diversified Financial Services | | | 1.6 | | |
| Electric | | | 4.4 | | |
| Electronics | | | 2.6 | | |
| Engineering & Construction | | | 1.6 | | |
| Food | | | 5.1 | | |
| Forest Products & Paper | | | 1.1 | | |
| Healthcare - Services | | | 0.8 | | |
| Holding Companies - Diversified | | | 1.0 | | |
| Home Builders | | | 0.8 | | |
| Home Furnishings | | | 1.0 | | |
| Household Products/Wares | | | 1.0 | | |
| Insurance | | | 3.0 | | |
| Internet | | | 0.8 | | |
| Iron/Steel | | | 1.4 | | |
| Leisure Time | | | 1.0 | | |
| Machinery - Construction & Mining | | | 2.4 | | |
| Machinery - Diversified | | | 1.3 | | |
| Media | | | 2.6 | | |
| Mining | | | 1.9 | | |
| Miscellaneous Manufacturing | | | 3.6 | | |
| Oil & Gas | | | 6.3 | | |
| Oil & Gas Services | | | 1.2 | | |
| Pharmaceuticals | | | 6.5 | | |
| Real Estate | | | 1.8 | | |
| Retail | | | 1.8 | | |
| Semiconductors | | | 2.4 | | |
| Software | | | 1.2 | | |
| Telecommunications | | | 5.9 | | |
| Transportation | | | 1.1 | | |
| Water | | | 1.4 | | |
| Short-Term Investments | | | 7.9 | | |
| Other Assets and Liabilities - Net | | | (7.5 | ) | |
| Net Assets | | | 100.0 | % | |
See Accompanying Notes to Financial Statements
108
(THIS PAGE INTENTIONALLY LEFT BLANK)
(THIS PAGE INTENTIONALLY LEFT BLANK)
Investment Adviser
ING Investments, LLC
7337 East Doubletree Ranch Road
Scottsdale, Arizona 85258
Administrator
ING Funds Services, LLC
7337 East Doubletree Ranch Road
Scottsdale, Arizona 85258
Distributor
ING Funds Distributor, LLC
7337 East Doubletree Ranch Road
Scottsdale, Arizona 85258
Transfer Agent
DST Systems, Inc.
P.O. Box 419368
Kansas City, Missouri 64141
Custodian
The Bank of New York Mellon Corporation
One Wall Street
New York, New York 10286
Legal Counsel
Goodwin Procter LLP
Exchange Place
53 State Street
Boston, Massachusetts 02109
Before investing, carefully consider the investment objectives, risks, charges and expenses of the variable annuity contract and the underlying variable investment options. This and other information is contained in the prospectus for the variable annuity contract and the underlying variable investment options. Obtain these prospectuses from your agent/registered representative and read them carefully before investing.

VPSAR-ACAPAPADVIS (0630-082407)
ITEM 2. CODE OF ETHICS.
Not required for semi-annual filing.
ITEM 3. AUDIT COMMITTEE FINANCIAL EXPERT.
Not required for semi-annual filing.
ITEM 4. PRINCIPAL ACCOUNTANT FEES AND SERVICES.
Not required for semi-annual filing.
ITEM 5. AUDIT COMMITTEE OF LISTED REGISTRANTS.
Not required for semi-annual filing.
ITEM 6. SCHEDULE OF INVESTMENTS.
Schedule is included as part of the report to shareholders filed under Item 1 of this Form.
ITEM 7. DISCLOSURE OF PROXY VOTING POLICIES AND PROCEDURES FOR CLOSED-END MANAGEMENT INVESTMENT COMPANIES.
Not applicable.
ITEM 8. PORTFOLIO MANAGERS OF CLOSED-END MANAGEMENT INVESTMENT COMPANIES.
Not applicable.
ITEM 9. PURCHASES OF EQUITY SECURITIES BY CLOSED-END MANAGEMENT INVESTMENT COMPANY AND AFFILIATED PURCHASERS.
Not applicable.
ITEM 10. SUBMISSION OF MATTERS TO A VOTE OF SECURITY HOLDERS.
The Board has a Nominating Committee for the purpose of considering and presenting to the Board candidates it proposes for nomination to fill Independent Trustee vacancies on the Board. The Committee currently consists of all Independent Trustees of the Board (6 individuals). The Nominating Committee operates pursuant to a Charter approved by the Board. The primary purpose of the Nominating Committee is to consider and present to the Board the candidates it proposes for nomination to fill vacancies on the Board. In evaluating candidates, the Nominating Committee may consider a variety of factors, but it has not at this time set any specific minimum qualifications that must be met. Specific qualifications of candidates for Board membership will be based on the needs of the Board at the time of nomination.
The Nominating Committee is willing to consider nominations received from shareholders and shall assess shareholder nominees in the same manner as it reviews its own nominees. A shareholder nominee for director should be submitted in writing to the Fund’s Secretary. Any such shareholder nomination should include at a minimum the following information as to each individual proposed for nomination as trustee: such individual’s written consent to be named in the proxy statement as a nominee (if nominated) and to serve as a trustee (if elected), and all information relating to such individual that is required to be disclosed in the solicitation of proxies for election of trustees, or is otherwise required, in each case under applicable federal securities laws, rules and regulations.
The Secretary shall submit all nominations received in a timely manner to the Nominating Committee. To be timely, any such submission must be delivered to the Fund’s Secretary not earlier than the 90th day prior to such meeting and not later than the close of business on the later of the 60th day prior to such meeting or the 10th day following the day on which public announcement of the date of the meeting is first made, by either disclosure in a press release or in a document publicly filed by the Fund with the Securities and Exchange Commission.
ITEM 11. CONTROLS AND PROCEDURES.
(a) Based on our evaluation conducted within 90 days of the filing date, hereof, the design and operation of the registrant’s disclosure controls and procedures are effective to ensure that material information relating to the registrant is made known to the certifying officers by others within the appropriate entities, particularly during the period in which Forms N-CSR are being prepared, and the registrant’s disclosure controls and procedures allow timely preparation and review of the information for the registrant’s Form N-CSR and the officer certifications of such Form N-CSR.
(b) There were no significant changes in the registrant’s internal controls that occurred during the second fiscal quarter of the period covered by this report that has materially affected, or is reasonably likely to materially affect, the registrant’s internal control over financial reporting.
ITEM 12. EXHIBITS.
(a)(1) The Code of Ethics is not required for the semi-annual filing.
(a)(2) A separate certification for each principal executive officer and principal financial officer of the registrant as required by Rule 30a-2 under the Act (17 CFR 270.30a-2) is attached hereto as EX-99.CERT.
(a)(3) Not required for semi-annual filing.
(b) The officer certifications required by Section 906 of the Sarbanes-Oxley Act of 2002 are attached hereto as EX-99.906CERT
SIGNATURES
Pursuant to the requirements of the Securities Exchange Act of 1934 and the Investment Company Act of 1940, the registrant has duly caused this report to be signed on its behalf by the undersigned, thereunto duly authorized.
(Registrant): ING Variable Funds |
| |
| |
By | /s/ | Shaun P. Mathews | |
| | Shaun P. Mathews | |
| | President and Chief Executive Officer |
|
Date: | September 5, 2007 | |
|
Pursuant to the requirements of the Securities Exchange Act of 1934 and the Investment Company Act of 1940, this report has been signed below by the following persons on behalf of the registrant and in the capacities and on the dates indicated. |
| |
| |
By | /s/ | Shaun P. Mathews | |
| | Shaun P. Mathews | |
| | President and Chief Executive Officer |
| |
Date: | September 5, 2007 | |
| |
| |
By | /s/ | Todd Modic | |
| | Todd Modic | |
| | Senior Vice President and Chief Financial Officer |
| |
| |
Date: | September 5, 2007 | |
| | | | | | | |