| | OMB APPROVAL |
| | OMB Number: | 3235-0570 |
| | Expires: | August 31, 2011 |
| UNITED STATES | Estimated average burden hours per response. . . . . . . . . . . . . . . . .18.9 |
| SECURITIES AND EXCHANGE COMMISSION | |
| Washington, D.C. 20549 | |
| | | | |
FORM N-CSR
CERTIFIED SHAREHOLDER REPORT OF REGISTERED
MANAGEMENT INVESTMENT COMPANIES
Investment Company Act file number | 811-2514 |
|
ING Variable Funds |
(Exact name of registrant as specified in charter) |
|
7337 E. Doubletree Ranch Rd., Scottsdale, AZ | | 85258 |
(Address of principal executive offices) | | (Zip code) |
|
CT Corporation System, 101 Federal Street, Boston, MA 02110 |
(Name and address of agent for service) |
|
Registrant’s telephone number, including area code: | 1-800-992-0180 | |
|
Date of fiscal year end: | December 31 | |
|
Date of reporting period: | January 1, 2009 to June 30, 2009 | |
| | | | | | | | | |
ITEM 1. REPORTS TO STOCKHOLDERS.
The following is a copy of the report transmitted to stockholders pursuant to Rule 30e-1 under the Act (17 CFR 270.30e-1):

Semi-Annual Report
June 30, 2009
Classes ADV, I, S and S2
ING Variable Product Funds
Domestic Equity and Income Portfolios
n ING Balanced Portfolio*
n ING Growth and Income Portfolio*
Domestic Equity Growth Portfolios
n ING Opportunistic LargeCap Growth Portfolio
n ING Small Company Portfolio*
Domestic Equity Value Portfolio
n ING Opportunistic LargeCap Portfolio (formerly, ING Opportunistic LargeCap Value Portfolio)
Fixed-Income Portfolios
n ING Intermediate Bond Portfolio*
n ING Money Market Portfolio*
Global Equity Portfolio
n ING BlackRock Science and Technology Opportunities Portfolio (formerly, ING BlackRock Global Science and Technology Portfolio)
* Prior to May 1, 2009, the Portfolio's name contained the "VP" prefix.
 E-Delivery Sign-up – details inside
This report is submitted for general information to shareholders of the ING Funds. It is not authorized for distribution to prospective shareholders unless accompanied or preceded by a prospectus which includes details regarding the funds' investment objectives, risks, charges, expenses and other information. This information should be read carefully.
MUTUAL FUNDS

TABLE OF CONTENTS
| President's Letter | | | 1 | | |
|
| Market Perspective | | | 2 | | |
|
| Shareholder Expense Examples | | | 4 | | |
|
| Statements of Assets and Liabilities | | | 6 | | |
|
| Statements of Operations | | | 10 | | |
|
| Statements of Changes in Net Assets | | | 12 | | |
|
| Financial Highlights | | | 16 | | |
|
| Notes to Financial Statements | | | 20 | | |
|
| Portfolios of Investments | | | 39 | | |
|
 Go Paperless with E-Delivery!
Sign up now for on-line prospectuses, fund reports, and proxy statements. In less than five minutes, you can help reduce paper mail and lower fund costs.
Just go to www.ingfunds.com, click on the E-Delivery icon from the home page, follow the directions and complete the quick 5 Steps to Enroll.
You will be notified by e-mail when these communications become available on the internet. Documents that are not available on the internet will continue to be sent by mail.
PROXY VOTING INFORMATION
A description of the policies and procedures that the Portfolios use to determine how to vote proxies related to portfolio securities is available: (1) without charge, upon request, by calling Shareholder Services toll-free at (800) 992-0180; (2) on the ING Funds' website at www.ingfunds.com; and (3) on the U.S. Securities and Exchange Commission's (the "SEC") website at www.sec.gov. Information regarding how the Portfolios voted proxies related to portfolio securities during the most recent 12-month period ended June 30 is available without charge on the ING Funds' website at www.ingfunds.com and on the SEC's website at www.sec.gov.
QUARTERLY PORTFOLIO HOLDINGS
The Portfolios file their complete schedule of portfolio holdings with the SEC for the first and third quarters of each fiscal year on Form N-Q. The Portfolios' Forms N-Q are available on the SEC's website at www.sec.gov. The Portfolios' Forms N-Q may be reviewed and copied at the SEC's Public Reference Room in Washington, DC, and information on the operation of the Public Reference Room may be obtained by calling (800) SEC-0330; and is available upon request from the Portfolios by calling Shareholder Services toll-free at (800) 992-0180.
PRESIDENT'S LETTER
Dear Shareholder,
As we enter the third quarter of 2009, we look forward hopefully to the end of the recession, at least in the United States. While recent economic news can best be characterized as less bad (as opposed to good), there is a chance that recovery could begin sometime in the third quarter.
Could this be the hour before the dawn? The financial markets seem to have factored in expectations of recovery, as evidenced by recent gains. The stock market, as measured by the S&P 500® Index(1), has advanced into the mid-900 range, a substantial climb from its mid-600s low in early March. The Dow Jones Industrial Average(2) recently broke through 9,000 to reach its highest level since January of this year. As investors become less risk-averse, they are shifting back into stocks.
Should you be doing the same? The answer depends on several important factors unique to your situation: your long-term investment goals, your tolerance for risk and your current portfolio allocation. If you made any changes to your portfolio allocation over the past year or so — perhaps in an effort to avoid losses during a time of high uncertainty or to feel more comfortable with your investments — your portfolio now may be out of alignment with your long-term goals. On the other hand, your current portfolio may now be better suited to your tolerance for risk. You may still want to reallocate your portfolio, but you should first rethink your goals in the context of the volatility you are willing to bear. This is particularly important in that the market may continue to experience periods of volatility as economic conditions stabilize and recover.
As always, we encourage you to discuss these matters thoroughly with your financial advisor before making any changes to your portfolio. Thank you for your continued confidence in ING Funds. We look forward to serving your investment needs in the future.
Sincerely,

Shaun Mathews
President & Chief Executive Officer
ING Funds
June 30, 2009
The views expressed in the President's Letter reflect those of the President as of the date of the letter. Any such views are subject to change at any time based upon market or other conditions and ING Funds disclaim any responsibility to update such views. These views may not be relied on as investment advice and because investment decisions for an ING Fund are based on numerous factors, may not be relied on as an indication of investment intent on behalf of any ING Fund. Reference to specific company securities should not be construed as recommendations or investment advice. Consider the fund's investment objectives, risks, and charges and expenses carefully before investing. The prospectus contains this information and other information about the fund.
International investing poses special risks including currency fluctuation, economic and political risks not found in investments that are solely domestic.
(1) The S&P 500® Index is an unmanaged index that measures the performance of securities of approximately 500 of the largest companies in the United States.
(2) The Dow Jones Industrial Average is a widely followed measurement of the stock market. The average is comprised of 30 stocks that represent leading companies in major industries.

1
MARKET PERSPECTIVE: SIX MONTHS ENDED JUNE 30, 2009
Many were hopeful as the year started that the newly elected U.S. president's promised $1 trillion stimulus package, a federal funds rate now reduced to 0%-0.25%, and record low mortgage rates would help to put a base under slumping economies and markets. But global equities in the form of the MSCI World® Index,(1) measured in local currencies, including net reinvested dividends ("MSCI" for regions discussed below), soon resumed their slide and by March 9, 2009, the index had dropped nearly 22% for the year to date, to the previous cycle lows of late 2002. Abruptly however, markets recovered, surgi ng by 34%, to record a gain of 4.8% for the six-month period ended June 30, 2009. Markets generally wavered somewhat at the end of the period, as the World Bank raised its estimate for the drop in global gross domestic product ("GDP") for 2009. In currencies, the dollar was initially strong but then fell back, gaining 0.3% on the euro, 5.7% against the yen, but losing 12.4% against the pound.
While credit markets had improved since the dark days of late 2008, most banks had tightened lending standards despite large capital infusions under the Troubled Asset Relief Program ("TARP"). The problem remained the enormous volumes of distressed loans and toxic assets of indeterminate value on bank balance sheets. The Administration soon announced a Public-Private Investment Program to buy these assets up. The Federal Reserve would also expand its purchases of agency mortgage-backed securities and buy up to $300 billion in longer dated Treasuries to push mortgage interest rates lower. Another $750 billion beyond TARP would be made available. A $75 billion plan would cut mortgage payments for struggling homeowners. Much of this was set out in the president's first budget, which projected a $1.75 trillion deficit!
While policy initiatives helped on balance, the reasons for the collective resurgence of equities after March 9, 2009 are hard to pin down. Troubled Citigroup's claim on March 10 that the year 2009 had been profitable so far was one catalyst. More generally, the economic reports from which markets seemed to be taking heart were only improving weakly and erratically. Nonetheless they were soon being referred to as "green shoots".
In housing, the Standard & Poor's ("S&P")/Case-Shiller National U.S. Home Price Index(2) of house prices in 20 cities sank a record 19% year-over-year in January. But from there the declines moderated to 18.1% in the most recent report. By the end of June 2009, sales of existing homes had risen for two months and the proportion of distressed sales was down to about one-third, from nearly half earlier in the year.
A flimsier (but welcome) green shoot emerged in the final employment report, where May payrolls fell by the smallest number in eight months, even as the rate increased to 9.4%, a 25-year record. The fall in the 2009 first quarter GDP was revised down to 5.5% annualized, having first been reported near the 2008 fourth quarter's decades high 6.3%.
Consumer demand was weak, evidenced by the largest annual drop in the consumer price index, 1.3%, since 1950. But the government's stimulus plan boosted incomes by 1.4% in May 2009, sending the savings rate to 6.9%, the most in 15 years. Still, retail sales were reported higher, the first increase in three months.
U.S. fixed income markets at first sight had an undistinguished first half. The Barclays Capital U.S. Aggregate Bond Index(3) of investment grade bonds returned 1.90%. But within this figure improved risk appetite propelled the index of investment grade corporate bonds to an 8.32% gain amid surging new issuances. Conversely, the Treasury index lost 4.30%, weighed by concerns about massive government borrowing, and the excess yield on 10-year Treasuries over 2-year issues briefly reached a record 275 basis points ("bp"). The star performers however, were high yield bonds, represented by the Barclays Capital High Yield Bond-2 % Issuer Constrained Index(4), which returned a remarkable 30.92%. By contrast, the yield on the 90-day Treasury Bills remained in the range of 6bp to 31bp throughout the period.
U.S. equities, represented by the S&P 500® Index,(5) including dividends, returned 3.2% in the first six months of 2009. As with stock markets generally, March 9, 2009, marked the low point for the index, closing at September 1996 levels. Profits for S&P 500® Index companies would be certain to suffer their eighth straight quarter of decline, but from March 9, 2009, investors only had eyes for green shoots and from there the market returned 36.9%, led by the financials component which soared 93.1%. The index broke through its 200-day moving average on June 1, 2009, but then drifted back, finally returning the last of the month's gains on June 30, 2009, as a reading of consumer confidence disappointed.
In international markets, the MSCI Japan® Index(6) rose 9.2% for the six months through June 30, 2009. The slump in exports stabilized during the period and despite two consecutive quarterly falls in GDP of 3.8%,
2
MARKET PERSPECTIVE: SIX MONTHS ENDED JUNE 30, 2009
there were hopes that stimulus packages in China and in Japan itself would speed a recovery. The MSCI Europe ex UK® Index(7) added 3.8%. Despite a bigger than expected drop in GDP of 2.5% in the first quarter and the first annual decline in consumer prices for 48 years, confidence proved resilient. The European Central Bank cut rates to 1% and finally embarked on a program to lend unlimited amounts to banks for one year at this interest rate. The MSCI UK® Index(8) lost 1.3%. The Bank of England reduced rates three times, to 0.5%, the lowest since it w as founded in 1694, as the UK suffered the largest annual fall in GDP, 4.9%, since records began in 1948.
(1) The MSCI World® Index is an unmanaged index that measures the performance of over 1,400 securities listed on exchanges in the U.S., Europe, Canada, Australia, New Zealand and the Far East.
(2) The S&P/Case-Shiller National U.S. Home Price Index tracks the value of single-family housing within the United States. The index is a composite of single-family home price indices for the nine U.S. Census divisions and is calculated quarterly.
(3) The Barclays Capital U.S. Aggregate Bond Index is an unmanaged index of publicly issued investment grade U.S. Government, mortgage-backed, asset-backed and corporate debt securities.
(4) The Barclays Capital High Yield Bond — 2% Issuer Constrained Composite Index is an unmanaged index that measures the performance of non-investment grade fixed-income securities.
(5) The S&P 500® Index is an unmanaged index tha.t measures the performance of securities of approximately 500 of the largest companies in the United States.
(6) The MSCI Japan® Index is a free float-adjusted market capitalization index that is designed to measure developed market equity performance in Japan.
(7) The MSCI Europe ex UK® Index is a free float-adjusted market capitalization index that is designed to measure developed market equity performance in Europe, excluding the UK.
(8) The MSCI UK® Index is a free float-adjusted market capitalization index that is designed to measure developed market equity performance in the UK.
Parenthesis denote a negative number.
All indices are unmanaged and investors cannot invest directly in an index.
Past performance does not guarantee future results. The performance quoted represents past performance. Investment return and principal value of an investment will fluctuate, and shares, when redeemed, may be worth more or less than their original cost. The Portfolios' performance is subject to change since the period's end and may be lower or higher than the performance data shown. Please call (800) 992-0180 or log on to www.ingfunds.com to obtain performance data current to the most recent month end.
Market Perspective reflects the views of ING's Chief Investment Risk Officer only through the end of the period, and is subject to change based on market and other conditions.
3
SHAREHOLDER EXPENSE EXAMPLES (UNAUDITED)
As a shareholder of a Portfolio, you incur two types of costs: (1) transaction costs, including redemption fees and exchange fees; and (2) ongoing costs, including management fees, distribution and/or service (12b-1) fees, and other Portfolio expenses. These Examples are intended to help you understand your ongoing costs (in dollars) of investing in a Portfolio and to compare these costs with the ongoing costs of investing in other mutual funds.
The Examples are based on an investment of $1,000 invested at the beginning of the period and held for the entire period from January 1, 2009 to June 30, 2009. The Portfolios' expenses are shown without the imposition of any charges which are, or may be, imposed under your annuity contract. Expenses would have been higher if such charges were included.
Actual Expenses
The first section of the table shown, "Actual Portfolio Return," provides information about actual account values and actual expenses. You may use the information in this section, together with the amount you invested, to estimate the expenses that you paid over the period. Simply divide your account value by $1,000 (for example, an $8,600 account value divided by $1,000 = 8.6), then multiply the result by the number in the first section under the heading entitled "Expenses Paid During the Period" to estimate the expenses you paid on your account during this period.
Hypothetical Example for Comparison Purposes
The second section of the table shown, "Hypothetical (5% return before expenses)," provides information about hypothetical account values and hypothetical expenses based on a Portfolio's actual expense ratio and an assumed rate of return of 5% per year before expenses, which is not a Portfolio's actual return. The hypothetical account values and expenses may not be used to estimate the actual ending account balance or expenses you paid for the period. You may use this information to compare the ongoing costs of investing in a Portfolio and other mutual funds. To do so, compare this 5% hypothetical example with the 5% hypothetical examples that appear in the shareholder reports of the other mutual funds.
Please note that the expenses shown in the table are meant to highlight your ongoing costs only and do not reflect any transactional costs, such as redemption fees or exchange fees. Therefore, the hypothetical lines of the table are useful in comparing ongoing costs only, and will not help you determine the relative total costs of owning different mutual funds. In addition, if these transactional costs were included, your costs would have been higher.
| | | Actual Portfolio Return | | Hypothetical (5% return before expenses) | |
| ING Balanced Portfolio | | Beginning
Account
Value
January 1,
2009 | | Ending
Account
Value
June 30,
2009 | | Annualized
Expense
Ratio | | Expenses Paid
During the
Period Ended
June 30,
2009* | | Beginning
Account
Value
January 1,
2009 | | Ending
Account
Value
June 30,
2009 | | Annualized
Expense
Ratio | | Expenses Paid
During the
Period Ended
June 30,
2009* | |
| Class ADV | | $ | 1,000.00 | | | $ | 1,022.20 | | | | 1.13 | % | | $ | 5.67 | | | $ | 1,000.00 | | | $ | 1,019.19 | | | | 1.13 | % | | $ | 5.66 | | |
| Class I | | | 1,000.00 | | | | 1,021.50 | | | | 0.63 | | | | 3.16 | | | | 1,000.00 | | | | 1,021.67 | | | | 0.63 | | | | 3.16 | | |
| Class S | | | 1,000.00 | | | | 1,020.40 | | | | 0.88 | | | | 4.41 | | | | 1,000.00 | | | | 1,020.43 | | | | 0.88 | | | | 4.41 | | |
| Class S2(1) | | | 1,000.00 | | | | 1,166.60 | | | | 1.03 | | | | 3.79 | | | | 1,000.00 | | | | 1,019.69 | | | | 1.03 | | | | 5.16 | | |
| ING Growth and Income Portfolio | |
| Class ADV | | $ | 1,000.00 | | | $ | 1,072.50 | | | | 1.11 | % | | $ | 5.70 | | | $ | 1,000.00 | | | $ | 1,019.29 | | | | 1.11 | % | | $ | 5.56 | | |
| Class I | | | 1,000.00 | | | | 1,074.80 | | | | 0.61 | | | | 3.14 | | | | 1,000.00 | | | | 1,021.77 | | | | 0.61 | | | | 3.06 | | |
| Class S | | | 1,000.00 | | | | 1,074.00 | | | | 0.86 | | | | 4.42 | | | | 1,000.00 | | | | 1,020.53 | | | | 0.86 | | | | 4.31 | | |
| Class S2(1) | | | 1,000.00 | | | | 1,271.90 | | | | 1.01 | | | | 3.90 | | | | 1,000.00 | | | | 1,019.79 | | | | 1.01 | | | | 5.06 | | |
| ING Opportunistic LargeCap Growth Portfolio | |
| Class ADV | | $ | 1,000.00 | | | $ | 1,077.90 | | | | 1.22 | % | | $ | 6.29 | | | $ | 1,000.00 | | | $ | 1,018.74 | | | | 1.22 | % | | $ | 6.11 | | |
| Class I | | | 1,000.00 | | | | 1,079.30 | | | | 0.72 | | | | 3.71 | | | | 1,000.00 | | | | 1,021.22 | | | | 0.72 | | | | 3.61 | | |
| Class S | | | 1,000.00 | | | | 1,078.20 | | | | 0.97 | | | | 5.00 | | | | 1,000.00 | | | | 1,019.98 | | | | 0.97 | | | | 4.86 | | |
* Expenses are equal to each Portfolio's respective annualized expense ratios multiplied by the average account value over the period, multiplied by 181/365 to reflect the most recent fiscal half-year.
(1) Commencement of operations was February 27, 2009. Expenses paid for the Actual Portfolio Return reflect the 124 day period ended June 30, 2009.
4
SHAREHOLDER EXPENSE EXAMPLES (UNAUDITED) (CONTINUED)
| | | Actual Portfolio Return | | Hypothetical (5% return before expenses) | |
| ING Small Company Portfolio | | Beginning
Account
Value
January 1,
2009 | | Ending
Account
Value
June 30,
2009 | | Annualized
Expense
Ratio | | Expenses Paid
During the
Period Ended
June 30,
2009* | | Beginning
Account
Value
January 1,
2009 | | Ending
Account
Value
June 30,
2009 | | Annualized
Expense
Ratio | | Expenses Paid
During the
Period Ended
June 30,
2009* | |
| Class ADV | | $ | 1,000.00 | | | $ | 1,027.00 | | | | 1.36 | % | | $ | 6.84 | | | $ | 1,000.00 | | | $ | 1,018.05 | | | | 1.36 | % | | $ | 6.80 | | |
| Class I | | | 1,000.00 | | | | 1,029.40 | | | | 0.86 | | | | 4.33 | | | | 1,000.00 | | | | 1,020.53 | | | | 0.86 | | | | 4.31 | | |
| Class S | | | 1,000.00 | | | | 1,028.90 | | | | 1.11 | | | | 5.58 | | | | 1,000.00 | | | | 1,019.29 | | | | 1.11 | | | | 5.56 | | |
| Class S2(1) | | | 1,000.00 | | | | 1,283.10 | | | | 1.26 | | | | 4.89 | | | | 1,000.00 | | | | 1,018.55 | | | | 1.26 | | | | 6.31 | | |
| ING Opportunistic LargeCap Portfolio | |
| Class ADV | | $ | 1,000.00 | | | $ | 945.90 | | | | 1.22 | % | | $ | 5.89 | | | $ | 1,000.00 | | | $ | 1,018.74 | | | | 1.22 | % | | $ | 6.11 | | |
| Class I | | | 1,000.00 | | | | 946.00 | | | | 0.72 | | | | 3.47 | | | | 1,000.00 | | | | 1,021.22 | | | | 0.72 | | | | 3.61 | | |
| Class S | | | 1,000.00 | | | | 944.90 | | | | 0.97 | | | | 4.68 | | | | 1,000.00 | | | | 1,019.98 | | | | 0.97 | | | | 4.86 | | |
| ING Intermediate Bond Portfolio | |
| Class ADV | | $ | 1,000.00 | | | $ | 1,015.30 | | | | 1.01 | % | | $ | 5.05 | | | $ | 1,000.00 | | | $ | 1,019.79 | | | | 1.01 | % | | $ | 5.06 | | |
| Class I | | | 1,000.00 | | | | 1,021.30 | | | | 0.51 | | | | 2.56 | | | | 1,000.00 | | | | 1,022.27 | | | | 0.51 | | | | 2.56 | | |
| Class S | | | 1,000.00 | | | | 1,020.60 | | | | 0.76 | | | | 3.81 | | | | 1,000.00 | | | | 1,021.03 | | | | 0.76 | | | | 3.81 | | |
| Class S2(1) | | | 1,000.00 | | | | 1,048.70 | | | | 0.91 | | | | 3.17 | | | | 1,000.00 | | | | 1,020.28 | | | | 0.91 | | | | 4.56 | | |
| ING Money Market Portfolio | |
| Class I | | $ | 1,000.00 | | | $ | 1,002.00 | | | | 0.36 | % | | $ | 1.79 | | | $ | 1,000.00 | | | $ | 1,023.01 | | | | 0.36 | % | | $ | 1.81 | | |
| ING BlackRock Science and Technology Opportunities Portfolio | |
| Class ADV | | $ | 1,000.00 | | | $ | 1,184.60 | | | | 1.56 | % | | $ | 8.45 | | | $ | 1,000.00 | | | $ | 1,017.06 | | | | 1.56 | % | | $ | 7.80 | | |
| Class I | | | 1,000.00 | | | | 1,189.00 | | | | 1.06 | | | | 5.75 | | | | 1,000.00 | | | | 1,019.54 | | | | 1.06 | | | | 5.31 | | |
| Class S | | | 1,000.00 | | | | 1,187.70 | | | | 1.31 | | | | 7.11 | | | | 1,000.00 | | | | 1,018.30 | | | | 1.31 | | | | 6.56 | | |
| Class S2(1) | | | 1,000.00 | | | | 1,282.40 | | | | 1.46 | | | | 5.66 | | | | 1,000.00 | | | | 1,017.55 | | | | 1.46 | | | | 7.30 | | |
* Expenses are equal to each Portfolio's respective annualized expense ratios multiplied by the average account value over the period, multiplied by 181/365 to reflect the most recent fiscal half-year.
(1) Commencement of operations was February 27, 2009. Expenses paid for the Actual Portfolio Return reflect the 124 day period ended June 30, 2009.
5
STATEMENTS OF ASSETS AND LIABILITIES AS OF JUNE 30, 2009 (UNAUDITED)
| | | ING
Balanced
Portfolio | | ING
Growth
and Income
Portfolio | | ING
Opportunistic
LargeCap Growth
Portfolio | | ING
Small
Company
Portfolio | |
| ASSETS: | |
| Investments in securities at value+* | | $ | 585,328,098 | | | $ | 2,003,790,848 | | | $ | 67,921,139 | | | $ | 500,370,826 | | |
| Short-term investments** | | | 48,806,335 | | | | 28,476,975 | | | | 1,798,322 | | | | 31,278,815 | | |
| Short-term investments in affiliates*** | | | 17,914,000 | | | | 35,788,000 | | | | 188,000 | | | | 2,651,000 | | |
| Cash | | | 29,980,470 | | | | 692,981 | | | | 361 | | | | 346 | | |
| Cash collateral for futures | | | 3,195,034 | | | | — | | | | — | | | | — | | |
| Foreign currencies at value**** | | | 196,427 | | | | 120,926 | | | | — | | | | — | | |
| Receivables: | |
| Investment securities sold | | | 18,803,234 | | | | — | | | | 1,474,655 | | | | 13,523,329 | | |
Investment securities sold on a delayed-delivery or
when-issued basis | | | 41,988,857 | | | | — | | | | — | | | | — | | |
| Fund shares sold | | | 84,467 | | | | 131,785 | | | | 19,678 | | | | 1,118,017 | | |
| Dividends and interest | | | 1,928,012 | | | | 2,132,439 | | | | 77,386 | | | | 620,624 | | |
| Upfront payments made on swap agreements | | | 260,842 | | | | — | | | | — | | | | — | | |
| Unrealized appreciation on swap agreements | | | 201,318 | | | | — | | | | — | | | | — | | |
| Prepaid expenses | | | 11,395 | | | | 37,386 | | | | 1,319 | | | | 8,237 | | |
| Total assets | | | 748,698,489 | | | | 2,071,171,340 | | | | 71,480,860 | | | | 549,571,194 | | |
| LIABILITIES: | |
| Payable for investment securities purchased | | | 19,273,729 | | | | 5,018,095 | | | | 1,033,039 | | | | 9,003,728 | | |
Payable for investment securities purchased on a
delayed-delivery or when-issued basis | | | 90,646,811 | | | | — | | | | — | | | | — | | |
| Payable for fund shares redeemed | | | 468,311 | | | | 1,314,063 | | | | 31,836 | | | | 234,316 | | |
| Payable upon receipt of securities loaned | | | 49,131,766 | | | | 28,561,378 | | | | 1,833,148 | | | | 31,619,673 | | |
| Payable for terminated investment contracts (Note 12) | | | 716,432 | | | | — | | | | — | | | | — | | |
| Upfront payments received on swap agreements | | | 293,772 | | | | — | | | | — | | | | — | | |
| Unrealized depreciation on swap agreements | | | 497,723 | | | | — | | | | — | | | | — | | |
| Payable to affiliates | | | 269,781 | | | | 991,676 | | | | 39,009 | | | | 355,914 | | |
| Payable for directors fees | | | 14,425 | | | | 18,449 | | | | 6,788 | | | | 1,450 | | |
| Other accrued expenses and liabilities | | | 88,416 | | | | 266,013 | | | | 33,990 | | | | 63,459 | | |
| Total liabilities | | | 161,401,166 | | | | 36,169,674 | | | | 2,977,810 | | | | 41,278,540 | | |
| NET ASSETS | | $ | 587,297,323 | | | $ | 2,035,001,666 | | | $ | 68,503,050 | | | $ | 508,292,654 | | |
| NET ASSETS WERE COMPRISED OF: | |
| Paid-in capital | | $ | 854,937,511 | | | $ | 4,634,494,770 | | | $ | 258,144,637 | | | $ | 675,074,215 | | |
| Undistributed net investment income | | | 4,475,309 | | | | 14,914,555 | | | | 204,542 | | | | 1,637,284 | | |
Accumulated net realized loss on investments, foreign
currency related transactions, futures, and swaps | | | (261,031,403 | ) | | | (2,717,496,663 | ) | | | (191,627,074 | ) | | | (161,911,042 | ) | |
Net unrealized appreciation or depreciation on
investments, foreign currency related transactions,
futures, and swaps | | | (11,084,094 | ) | | | 103,089,004 | | | | 1,780,945 | | | | (6,507,803 | ) | |
| NET ASSETS | | $ | 587,297,323 | | | $ | 2,035,001,666 | | | $ | 68,503,050 | | | $ | 508,292,654 | | |
| + Including securities loaned at value | | $ | 48,022,737 | | | $ | 27,102,777 | | | $ | 1,757,806 | | | $ | 30,577,132 | | |
| * Cost of investments in securities | | $ | 595,608,301 | | | $ | 1,900,617,561 | | | $ | 66,105,368 | | | $ | 506,537,771 | | |
| ** Cost of short-term investments | | $ | 49,131,766 | | | $ | 28,561,378 | | | $ | 1,833,148 | | | $ | 31,619,673 | | |
| *** Cost of short-term investments in affiliates | | $ | 17,914,000 | | | $ | 35,788,000 | | | $ | 188,000 | | | $ | 2,651,000 | | |
| **** Cost of foreign currencies | | $ | 164,779 | | | $ | 119,755 | | | $ | — | | | $ | — | | |
See Accompanying Notes to Financial Statements
6
STATEMENTS OF ASSETS AND LIABILITIES AS OF JUNE 30, 2009 (UNAUDITED) (CONTINUED)
| | | ING
Balanced
Portfolio | | ING
Growth
and Income
Portfolio | | ING
Opportunistic
LargeCap Growth
Portfolio | | ING
Small
Company
Portfolio | |
| Class ADV: | |
| Net assets | | $ | 611 | | | $ | 659,889 | | | $ | 647,434 | | | $ | 3,184 | | |
| Shares authorized | | | 500,000,000 | | | | unlimited | | | | 100,000,000 | | | | 100,000,000 | | |
| Par value | | $ | 0.001 | | | $ | 1.000 | | | $ | 0.001 | | | $ | 0.001 | | |
| Shares outstanding | | | 68 | | | | 40,923 | | | | 86,692 | | | | 270 | | |
| Net asset value and redemption price per share | | $ | 8.95 | | | $ | 16.13 | | | $ | 7.47 | | | $ | 11.81 | | |
| Class I: | |
| Net assets | | $ | 580,828,964 | | | $ | 1,749,938,410 | | | $ | 60,245,466 | | | $ | 455,089,322 | | |
| Shares authorized | | | 500,000,000 | | | | unlimited | | | | 100,000,000 | | | | 100,000,000 | | |
| Par value | | $ | 0.001 | | | $ | 1.000 | | | $ | 0.001 | | | $ | 0.001 | | |
| Shares outstanding | | | 65,007,808 | | | | 107,783,192 | | | | 8,074,693 | | | | 38,048,137 | | |
| Net asset value and redemption price per share | | $ | 8.93 | | | $ | 16.24 | | | $ | 7.46 | | | $ | 11.96 | | |
| Class S: | |
| Net assets | | $ | 6,464,416 | | | $ | 284,399,553 | | | $ | 7,610,150 | | | $ | 53,196,326 | | |
| Shares authorized | | | 500,000,000 | | | | unlimited | | | | 100,000,000 | | | | 100,000,000 | | |
| Par value | | $ | 0.001 | | | $ | 1.000 | | | $ | 0.001 | | | $ | 0.001 | | |
| Shares outstanding | | | 726,855 | | | | 17,657,362 | | | | 1,026,632 | | | | 4,497,760 | | |
| Net asset value and redemption price per share | | $ | 8.89 | | | $ | 16.11 | | | $ | 7.41 | | | $ | 11.83 | | |
| Class S2: | |
| Net assets | | $ | 3,332 | | | $ | 3,814 | | | | n/a | | | $ | 3,822 | | |
| Shares authorized | | | 500,000,000 | | | | unlimited | | | | n/a | | | | 100,000,000 | | |
| Par value | | $ | 0.001 | | | $ | 1.000 | | | | n/a | | | $ | 0.001 | | |
| Shares outstanding | | | 376 | | | | 236 | | | | n/a | | | | 324 | | |
| Net asset value and redemption price per share | | $ | 8.85 | | | $ | 16.14 | | | | n/a | | | $ | 11.81 | | |
See Accompanying Notes to Financial Statements
7
STATEMENTS OF ASSETS AND LIABILITIES AS OF JUNE 30, 2009 (UNAUDITED)
| | | ING
Opportunistic
LargeCap
Portfolio | | ING
Intermediate
Bond
Portfolio | | ING
Money
Market
Portfolio | | ING
BlackRock Science and
Technology Opportunities
Portfolio | |
| ASSETS: | |
| Investments in securities at value+* | | $ | 75,026,930 | | | $ | 3,121,365,722 | | | $ | — | | | $ | 214,549,077 | | |
| Short-term investments** | | | 1,103,446 | | | | 641,131,157 | | | | 927,609 | | | | 7,236,530 | | |
| Short-term investments in affiliates*** | | | 634,000 | | | | 76,799,000 | | | | — | | | | — | | |
| Short-term investments at amortized cost | | | — | | | | 189,218,692 | | | | 1,340,248,341 | | | | — | | |
| Repurchase agreement | | | — | | | | — | | | | 161,412,000 | | | | — | | |
| Cash | | | 191 | | | | 4,754,319 | | | | 2,219 | | | | 4,686,072 | | |
| Cash collateral for futures | | | — | | | | 31,258,668 | | | | — | | | | — | | |
| Foreign currencies at value**** | | | — | | | | 2,125,390 | | | | — | | | | 1,176,005 | | |
| Receivables: | |
| Investment securities sold | | | 2,203,797 | | | | 226,610,357 | | | | 95,881,450 | | | | 3,295,174 | | |
Investment securities sold on a delayed-delivery or
when-issued basis | | | — | | | | 385,456,692 | | | | — | | | | — | | |
| Fund shares sold | | | 75,359 | | | | 9,632,485 | | | | 16,502 | | | | 723 | | |
| Dividends and interest | | | 91,194 | | | | 19,603,699 | | | | 1,293,241 | | | | 38,862 | | |
Unrealized appreciation on forward foreign
currency contracts | | | — | | | | — | | | | — | | | | 2,975 | | |
| Upfront payments made on swap agreements | | | — | | | | 3,487,455 | | | | — | | | | — | | |
| Unrealized appreciation on swap agreements | | | — | | | | 2,481,358 | | | | — | | | | — | | |
| Prepaid expenses | | | 1,589 | | | | 58,138 | | | | 36,311 | | | | 2,831 | | |
| Reimbursement due from manager | | | — | | | | — | | | | — | | | | 8,391 | | |
| Total assets | | | 79,136,506 | | | | 4,713,983,132 | | | | 1,599,817,673 | | | | 230,996,640 | | |
| LIABILITIES: | |
| Payable for investment securities purchased | | | 1,824,499 | | | | 245,578,998 | | | | — | | | | 4,788,492 | | |
Payable for investment securities purchased on a
delayed-delivery or when-issued basis | | | — | | | | 1,086,283,616 | | | | — | | | | — | | |
| Payable for fund shares redeemed | | | 28 | | | | 1,538,332 | | | | 15,047,988 | | | | 821,341 | | |
| Payable upon receipt of securities loaned | | | 1,148,804 | | | | 533,761,298 | | | | 1,077,010 | | | | 7,315,890 | | |
| Payable for terminated investment contracts (Note 12) | | | — | | | | 2,597,084 | | | | — | | | | — | | |
Unrealized depreciation on forward foreign
currency contracts | | | — | | | | — | | | | — | | | | 70,251 | | |
| Upfront payments received on swap agreements | | | — | | | | 3,902,356 | | | | — | | | | — | | |
| Unrealized depreciation on swap agreements | | | — | | | | 6,401,442 | | | | — | | | | — | | |
| Payable to affiliates | | | 43,596 | | | | 1,283,071 | | | | 404,320 | | | | 208,835 | | |
| Payable for directors fees | | | 4,294 | | | | 1,760 | | | | — | | | | 874 | | |
| Payable for borrowings against line of credit | | | — | | | | 2,430,000 | | | | — | | | | — | | |
| Other accrued expenses and liabilities | | | 25,375 | | | | 144,590 | | | | 17,417 | | | | 44,265 | | |
| Total liabilities | | | 3,046,596 | | | | 1,883,922,547 | | | | 16,546,946 | | | | 13,249,948 | | |
| NET ASSETS | | $ | 76,089,910 | | | $ | 2,830,060,585 | | | $ | 1,583,270,938 | | | $ | 217,746,692 | | |
| NET ASSETS WERE COMPRISED OF: | |
| Paid-in capital | | $ | 130,390,460 | | | $ | 3,375,104,788 | | | $ | 1,584,783,463 | | | $ | 278,603,239 | | |
| Undistributed net investment income | | | 841,960 | | | | 21,783,562 | | | | 775 | | | | 465,885 | | |
Accumulated net realized loss on investments, foreign
currency related transactions, futures, and swaps | | | (55,615,531 | ) | | | (416,212,208 | ) | | | (1,363,899 | ) | | | (55,600,037 | ) | |
Net unrealized appreciation or depreciation on
investments, foreign currency related transactions,
futures, and swaps | | | 473,021 | | | | (150,615,557 | ) | | | (149,401 | ) | | | (5,722,395 | ) | |
| NET ASSETS | | $ | 76,089,910 | | | $ | 2,830,060,585 | | | $ | 1,583,270,938 | | | $ | 217,746,692 | | |
| + Including securities loaned at value | | $ | 1,108,732 | | | $ | 522,237,271 | | | $ | 1,058,427 | | | $ | 6,919,949 | | |
| * Cost of investments in securities | | $ | 74,508,551 | | | $ | 3,264,711,291 | | | $ | — | | | $ | 220,134,510 | | |
| ** Cost of short-term investments | | $ | 1,148,804 | | | $ | 642,921,804 | | | $ | 1,077,010 | | | $ | 7,315,890 | | |
| *** Cost of short-term investments in affiliates | | $ | 634,000 | | | $ | 76,799,000 | | | $ | — | | | $ | — | | |
| **** Cost of foreign currencies | | $ | — | | | $ | 1,791,710 | | | $ | — | | | $ | 1,167,250 | | |
See Accompanying Notes to Financial Statements
8
STATEMENTS OF ASSETS AND LIABILITIES AS OF JUNE 30, 2009 (UNAUDITED) (CONTINUED)
| | | ING
Opportunistic
LargeCap
Portfolio | | ING
Intermediate
Bond
Portfolio | | ING
Money
Market
Portfolio | | ING
BlackRock Science and
Technology Opportunities
Portfolio | |
| Class A: | |
| Net assets | | $ | 498 | | | $ | 839 | | | | n/a | | | $ | 3,515 | | |
| Shares authorized | | | 100,000,000 | | | | unlimited | | | | n/a | | | | 100,000,000 | | |
| Par value | | $ | 0.001 | | | $ | 1.000 | | | | n/a | | | $ | 0.001 | | |
| Shares outstanding | | | 64 | | | | 74 | | | | n/a | | | | 912 | | �� |
| Net asset value and redemption price per share | | $ | 7.84 | | | $ | 11.29 | | | | n/a | | | $ | 3.85 | | |
| Class I: | |
| Net assets | | $ | 65,693,243 | | | $ | 1,654,978,266 | | | $ | 1,583,270,938 | | | $ | 73,897,556 | | |
| Shares authorized | | | 100,000,000 | | | | unlimited | | | | unlimited | | | | 100,000,000 | | |
| Par value | | $ | 0.001 | | | $ | 1.000 | | | $ | 1.000 | | | $ | 0.001 | | |
| Shares outstanding | | | 8,322,637 | | | | 146,999,294 | | | | 1,579,677,662 | | | | 18,952,388 | | |
| Net asset value and redemption price per share | | $ | 7.89 | | | $ | 11.26 | | | $ | 1.00 | | | $ | 3.90 | | |
| Class S: | |
| Net assets | | $ | 10,396,169 | | | $ | 1,175,078,348 | | | | n/a | | | $ | 143,841,775 | | |
| Shares authorized | | | 100,000,000 | | | | unlimited | | | | n/a | | | | 100,000,000 | | |
| Par value | | $ | 0.001 | | | $ | 1.000 | | | | n/a | | | $ | 0.001 | | |
| Shares outstanding | | | 1,323,914 | | | | 104,955,235 | | | | n/a | | | | 37,250,477 | | |
| Net asset value and redemption price per share | | $ | 7.85 | | | $ | 11.20 | | | | n/a | | | $ | 3.86 | | |
| Class S2: | |
| Net assets | | | n/a | | | $ | 3,132 | | | | n/a | | | $ | 3,846 | | |
| Shares authorized | | | n/a | | | | unlimited | | | | n/a | | | | 100,000,000 | | |
| Par value | | | n/a | | | $ | 1.000 | | | | n/a | | | $ | 0.001 | | |
| Shares outstanding | | | n/a | | | | 278 | | | | n/a | | | | 997 | | |
| Net asset value and redemption price per share | | | n/a | | | $ | 11.26 | | | | n/a | | | $ | 3.86 | | |
See Accompanying Notes to Financial Statements
9
STATEMENTS OF OPERATIONS FOR THE SIX MONTHS ENDED JUNE 30, 2009 (UNAUDITED)
| | | ING
Balanced
Portfolio | | ING
Growth
and Income
Portfolio | | ING
Opportunistic
LargeCap Growth
Portfolio | | ING
Small
Company
Portfolio | |
| INVESTMENT INCOME: | |
| Dividends, net of foreign taxes withheld*(1) | | $ | 4,293,883 | | | $ | 20,774,124 | | | $ | 448,955 | | | $ | 3,547,859 | | |
| Interest | | | 5,251,454 | | | | 39,782 | | | | — | | | | — | | |
| Securities lending income, net | | | 120,702 | | | | 50,893 | | | | — | | | | 60,058 | | |
| Total investment income | | | 9,666,039 | | | | 20,864,799 | | | | 448,955 | | | | 3,607,917 | | |
| EXPENSES: | |
| Investment management fees | | | 1,406,130 | | | | 4,581,015 | | | | 194,189 | | | | 1,729,564 | | |
| Distribution and service fees: | | | | | | | | | | | | | | | | | |
| Class ADV | | | — | | | | 1,606 | | | | 1,446 | | | | 8 | | |
| Class S | | | 7,766 | | | | 331,328 | | | | 9,171 | | | | 57,969 | | |
| Class S2 | | | 4 | | | | 6 | | | | — | | | | 6 | | |
| Transfer agent fees | | | 739 | | | | 6,653 | | | | 319 | | | | 427 | | |
| Administrative service fees | | | 154,669 | | | | 503,898 | | | | 17,800 | | | | 126,831 | | |
| Shareholder reporting expense | | | 21,085 | | | | 79,378 | | | | 2,055 | | | | 11,540 | | |
| Registration fees | | | 293 | | | | 795 | | | | — | | | | 183 | | |
| Professional fees | | | 56,120 | | | | 116,886 | | | | 4,858 | | | | 32,960 | | |
| Custody and accounting expense | | | 70,680 | | | | 123,482 | | | | 1,073 | | | | 38,285 | | |
| Directors fees | | | 33,690 | | | | 96,873 | | | | 4,237 | | | | 21,480 | | |
| Miscellaneous expense | | | 44,479 | | | | 126,023 | | | | 7,038 | | | | 27,133 | | |
| Merger expense | | | — | | | | — | | | | 1,414 | | | | — | | |
| Interest expense | | | — | | | | 1,083 | | | | — | | | | — | | |
| Total expenses | | | 1,795,655 | | | | 5,969,026 | | | | 243,600 | | | | 2,046,386 | | |
| Net waived and reimbursed fees | | | (7,539 | ) | | | (18,782 | ) | | | (212 | ) | | | (4,734 | ) | |
| Net expenses | | | 1,788,116 | | | | 5,950,244 | | | | 243,388 | | | | 2,041,652 | | |
| Net investment income | | | 7,877,923 | | | | 14,914,555 | | | | 205,567 | | | | 1,566,265 | | |
REALIZED AND UNREALIZED GAIN (LOSS) ON
INVESTMENTS, FOREIGN CURRENCY RELATED
TRANSACTIONS, FUTURES, AND SWAPS | |
| Net realized gain (loss) on: | |
| Investments | | | (109,007,495 | ) | | | (170,570,339 | ) | | | (9,219,278 | ) | | | (87,746,890 | ) | |
| Foreign currency related transactions | | | (359,853 | ) | | | (5,113 | ) | | | — | | | | — | | |
| Futures | | | 1,371,241 | | | | 1,637,534 | | | | — | | | | — | | |
| Swaps | | | 2,844,583 | | | | — | | | | — | | | | — | | |
Net realized loss on investments, foreign currency
related transactions, futures, and swaps | | | (105,151,524 | ) | | | (168,937,918 | ) | | | (9,219,278 | ) | | | (87,746,890 | ) | |
Net change in unrealized appreciation
or depreciation on: | |
| Investments | | | 112,574,076 | | | | 295,611,061 | | | | 13,978,982 | | | | 109,508,803 | | |
| Foreign currency related transactions | | | 194,261 | | | | (16,514 | ) | | | — | | | | — | | |
| Futures | | | 247,401 | | | | (24,446 | ) | | | — | | | | — | | |
| Swaps | | | (3,923,387 | ) | | | — | | | | — | | | | — | | |
Net change in unrealized appreciation or
depreciation on investments, foreign currency
related transactions, futures, and swaps | | | 109,092,351 | | | | 295,570,101 | | | | 13,978,982 | | | | 109,508,803 | | |
Net realized and unrealized gain on investments,
foreign currency related transactions, futures,
and swaps | | | 3,940,827 | | | | 126,632,183 | | | | 4,759,704 | | | | 21,761,913 | | |
| Increase in net assets resulting from operations | | $ | 11,818,750 | | | $ | 141,546,738 | | | $ | 4,965,271 | | | $ | 23,328,178 | | |
| * Foreign taxes withheld | | $ | 1,105 | | | $ | 371,899 | | | $ | — | | | $ | 1,466 | | |
| (1) Dividends from affiliates | | $ | 22,928 | | | $ | 62,243 | | | $ | 990 | | | $ | 20,302 | | |
See Accompanying Notes to Financial Statements
10
STATEMENTS OF OPERATIONS FOR THE SIX MONTHS ENDED JUNE 30, 2009 (UNAUDITED)
| | | ING
Opportunistic
LargeCap
Portfolio | | ING
Intermediate
Bond
Portfolio | | ING
Money
Market
Portfolio | | ING
BlackRock Science and
Technology Opportunities
Portfolio | |
| INVESTMENT INCOME: | |
| Dividends, net of foreign taxes withheld*(1) | | $ | 1,122,174 | | | $ | 1,104,800 | | | $ | — | | | $ | 874,191 | | |
| Interest | | | — | | | | 63,199,070 | | | | 6,565,191 | | | | 7,111 | | |
| Securities lending income, net | | | 767 | | | | 1,171,669 | | | | — | | | | 18,086 | | |
| Total investment income | | | 1,122,941 | | | | 65,475,539 | | | | 6,565,191 | | | | 899,388 | | |
| EXPENSES: | |
| Investment management fees | | | 221,549 | | | | 5,567,861 | | | | 2,128,000 | | | | 810,156 | | |
| Distribution and service fees: | | | | | | | | | | | | | | | | | |
| Class ADV | | | — | | | | 4 | | | | — | | | | 8 | | |
| Class S | | | 12,722 | | | | 1,422,065 | | | | — | | | | 135,734 | | |
| Class S2 | | | — | | | | 4 | | | | — | | | | 6 | | |
| Transfer agent fees | | | 380 | | | | 6,353 | | | | 1,181 | | | | 480 | | |
| Administrative service fees | | | 20,308 | | | | 765,556 | | | | 468,151 | | | | 46,902 | | |
| Shareholder reporting expense | | | 3,160 | | | | 79,810 | | | | 80,396 | | | | 6,154 | | |
| Registration fees | | | — | | | | 957 | | | | 2,079 | | | | — | | |
| Professional fees | | | 7,277 | | | | 209,020 | | | | 144,239 | | | | 22,557 | | |
| Custody and accounting expense | | | 4,490 | | | | 179,075 | | | | 79,135 | | | | 27,693 | | |
| Directors fees | | | 2,490 | | | | 125,930 | | | | 93,742 | | | | 9,611 | | |
| Miscellaneous expense | | | 7,657 | | | | 171,057 | | | | 80,659 | | | | 16,493 | | |
| Interest expense | | | — | | | | 1,466 | | | | — | | | | — | | |
| Total expenses | | | 280,033 | | | | 8,529,158 | | | | 3,077,582 | | | | 1,075,794 | | |
| Net waived and reimbursed fees | | | (167 | ) | | | (42,973 | ) | | | — | | | | (40,194 | ) | |
| Net expenses | | | 279,866 | | | | 8,486,185 | | | | 3,077,582 | | | | 1,035,600 | | |
| Net investment income (loss) | | | 843,075 | | | | 56,989,354 | | | | 3,487,609 | | | | (136,212 | ) | |
REALIZED AND UNREALIZED GAIN (LOSS) ON
INVESTMENTS, FOREIGN CURRENCY RELATED
TRANSACTIONS, FUTURES, AND SWAPS | |
| Net realized gain (loss) on: | |
| Investments | | | (24,649,629 | ) | | | (320,171,741 | ) | | | 741,616 | | | | (18,328,430 | ) | |
| Foreign currency related transactions | | | — | | | | (6,156,406 | ) | | | — | | | | (370,249 | ) | |
| Futures | | | — | | | | 12,056,252 | | | | — | | | | — | | |
| Swaps | | | — | | | | 31,113,695 | | | | — | | | | — | | |
Net realized gain (loss) on investments, foreign
currency related transactions, futures, and swaps | | | (24,649,629 | ) | | | (283,158,200 | ) | | | 741,616 | | | | (18,698,679 | ) | |
Net change in unrealized appreciation
or depreciation on: | |
| Investments | | | 18,781,901 | | | | 304,555,766 | | | | — | | | | 49,450,443 | | |
| Foreign currency related transactions | | | — | | | | 2,639,063 | | | | — | | | | 539,610 | | |
| Futures | | | — | | | | 12,940,053 | | | | — | | | | — | | |
| Swaps | | | — | | | | (41,527,907 | ) | | | — | | | | — | | |
Net change in unrealized appreciation or
depreciation on investments foreign currency
related transactions, futures, and swaps | | | 18,781,901 | | | | 278,606,975 | | | | — | | | | 49,990,053 | | |
Net realized and unrealized gain (loss) on investments,
foreign currency related transactions, futures,
amd swaps | | | (5,867,728 | ) | | | (4,551,225 | ) | | | 741,616 | | | | 31,291,374 | | |
Increase (decrease) in net assets resulting from
operations | | $ | (5,024,653 | ) | | $ | 52,438,129 | | | $ | 4,229,225 | | | $ | 31,155,162 | | |
| * Foreign taxes withheld | | $ | 2,654 | | | $ | — | | | $ | — | | | $ | 28,275 | | |
| (1) Dividends from affiliates | | $ | 630 | | | $ | 209,959 | | | $ | — | | | $ | — | | |
See Accompanying Notes to Financial Statements
11
STATEMENTS OF CHANGES IN NET ASSETS (UNAUDITED)
| | | ING Balanced Portfolio | | ING Growth and Income Portfolio | |
| | | Six Months
Ended
June 30,
2009 | | Year
Ended
December 31,
2008 | | Six Months
Ended
June 30,
2009 | | Year
Ended
December 31,
2008 | |
| FROM OPERATIONS: | |
| Net investment income | | $ | 7,877,923 | | | $ | 25,162,629 | | | $ | 14,914,555 | | | $ | 39,466,367 | | |
Net realized loss on investments, foreign currency related
transactions, futures, swaps, and payments by affiliates | | | (105,151,524 | ) | | | (151,906,752 | ) | | | (168,937,918 | ) | | | (673,802,804 | ) | |
Net change in unrealized appreciation or depreciation on
investments, foreign currency related transactions,
futures, and swaps | | | 109,092,351 | | | | (137,938,086 | ) | | | 295,570,101 | | | | (515,276,248 | ) | |
| Increase (decrease) in net assets resulting from operations | | | 11,818,750 | | | | (264,682,209 | ) | | | 141,546,738 | | | | (1,149,612,685 | ) | |
| FROM DISTRIBUTIONS TO SHAREHOLDERS: | |
| Net investment income: | |
| Class ADV | | | (24 | ) | | | (24 | ) | | | — | | | | (11,483 | ) | |
| Class I | | | (27,220,392 | ) | | | (30,852,412 | ) | | | — | | | | (33,754,627 | ) | |
| Class S | | | (283,520 | ) | | | (281,504 | ) | | | — | | | | (5,751,055 | ) | |
| Class S2 | | | (162 | ) | | | — | | | | — | | | | — | | |
| Net realized gains: | | | | | | | | | | | | | | | | | |
| Class ADV | | | — | | | | (81 | ) | | | — | | | | — | | |
| Class I | | | — | | | | (79,796,689 | ) | | | — | | | | — | | |
| Class S | | | — | | | | (795,569 | ) | | | — | | | | — | | |
| Total distributions | | | (27,504,098 | ) | | | (111,726,279 | ) | | | — | | | | (39,517,165 | ) | |
| FROM CAPITAL SHARE TRANSACTIONS: | |
| Net proceeds from sale of shares | | | 15,136,420 | | | | 5,172,233 | | | | 127,090,772 | | | | 347,174,111 | | |
| Proceeds from shares issued in merger (Note 14) | | | — | | | | — | | | | — | | | | 353,711,801 | | |
| Reinvestment of distributions | | | 27,503,912 | | | | 111,726,174 | | | | — | | | | 39,492,686 | | |
| | | | 42,640,332 | | | | 116,898,407 | | | | 127,090,772 | | | | 740,378,598 | | |
| Cost of shares redeemed | | | (49,157,260 | ) | | | (187,770,892 | ) | | | (146,663,775 | ) | | | (460,715,815 | ) | |
Net increase (decrease) in net assets resulting from capital
share transactions | | | (6,516,928 | ) | | | (70,872,485 | ) | | | (19,573,003 | ) | | | 279,662,783 | | |
| Net increase (decrease) in net assets | | | (22,202,276 | ) | | | (447,280,973 | ) | | | 121,973,735 | | | | (909,467,067 | ) | |
| NET ASSETS: | |
| Beginning of period | | | 609,499,599 | | | | 1,056,780,572 | | | | 1,913,027,931 | | | | 2,822,494,998 | | |
| End of period | | $ | 587,297,323 | | | $ | 609,499,599 | | | $ | 2,035,001,666 | | | $ | 1,913,027,931 | | |
| Undistributed net investment income at end of period | | $ | 4,475,309 | | | $ | 24,101,484 | | | $ | 14,914,555 | | | $ | — | | |
See Accompanying Notes to Financial Statements
12
STATEMENTS OF CHANGES IN NET ASSETS (UNAUDITED)
| | | ING Opportunistic
LargeCap Growth Portfolio | | ING Small Company Portfolio | |
| | | Six Months
Ended
June 30,
2009 | | Year
Ended
December 31,
2008 | | Six Months
Ended
June 30,
2009 | | Year
Ended
December 31,
2008 | |
| FROM OPERATIONS: | |
| Net investment income | | $ | 205,567 | | | $ | 426,592 | | | $ | 1,566,265 | | | $ | 3,896,021 | | |
| Net realized loss on investments | | | (9,219,278 | ) | | | (42,958,725 | ) | | | (87,746,890 | ) | | | (73,348,618 | ) | |
Net change in unrealized appreciation or depreciation on
investments | | | 13,978,982 | | | | (18,373,805 | ) | | | 109,508,803 | | | | (127,986,885 | ) | |
| Increase (decrease) in net assets resulting from operations | | | 4,965,271 | | | | (60,905,938 | ) | | | 23,328,178 | | | | (197,439,482 | ) | |
| FROM DISTRIBUTIONS TO SHAREHOLDERS: | |
| Net investment income: | | | | | | | | | | | | | | | | | |
| Class ADV | | | — | | | | — | | | | (21 | ) | | | — | | |
| Class I | | | (404,193 | ) | | | (749,873 | ) | | | (3,140,359 | ) | | | (5,835,407 | ) | |
| Class S | | | (18,353 | ) | | | (45,652 | ) | | | (330,410 | ) | | | (24,190 | ) | |
| Class S2 | | | — | | | | — | | | | (26 | ) | | | — | | |
| Net realized gains: | | | | | | | | | | | | | | | | | |
| Class I | | | — | | | | — | | | | — | | | | (73,864,230 | ) | |
| Class S | | | — | | | | — | | | | — | | | | (384,889 | ) | |
| Total distributions | | | (422,546 | ) | | | (795,525 | ) | | | (3,470,816 | ) | | | (80,108,716 | ) | |
| FROM CAPITAL SHARE TRANSACTIONS: | |
| Net proceeds from sale of shares | | | 2,572,736 | | | | 5,106,219 | | | | 76,638,436 | | | | 213,494,928 | | |
| Reinvestment of distributions | | | 422,546 | | | | 795,525 | | | | 3,470,816 | | | | 80,108,716 | | |
| | | | 2,995,282 | | | | 5,901,744 | | | | 80,109,252 | | | | 293,603,644 | | |
| Cost of shares redeemed | | | (6,070,728 | ) | | | (36,759,935 | ) | | | (57,068,076 | ) | | | (157,042,784 | ) | |
Net increase (decrease) in net assets resulting from capital
share transactions | | | (3,075,446 | ) | | | (30,858,191 | ) | | | 23,041,176 | | | | 136,560,860 | | |
| Net increase (decrease) in net assets | | | 1,467,279 | | | | (92,559,654 | ) | | | 42,898,538 | | | | (140,987,338 | ) | |
| NET ASSETS: | |
| Beginning of period | | | 67,035,771 | | | | 159,595,425 | | | | 465,394,116 | | | | 606,381,454 | | |
| End of period | | $ | 68,503,050 | | | $ | 67,035,771 | | | $ | 508,292,654 | | | $ | 465,394,116 | | |
| Undistributed net investment income at end of period | | $ | 204,542 | | | $ | 421,521 | | | $ | 1,637,284 | | | $ | 3,541,835 | | |
See Accompanying Notes to Financial Statements
13
STATEMENTS OF CHANGES IN NET ASSETS (UNAUDITED)
| | | ING Opportunistic
LargeCap Portfolio | | ING Intermediate Bond Portfolio | |
| | | Six Months
Ended
June 30,
2009 | | Year
Ended
December 31,
2008 | | Six Months
Ended
June 30,
2009 | | Year
Ended
December 31,
2008 | |
| FROM OPERATIONS: | |
| Net investment income | | $ | 843,075 | | | $ | 2,635,604 | | | $ | 56,989,354 | | | $ | 171,309,481 | | |
Net realized loss on investments, foreign currency related
transactions, futures, swaps, and payments by affiliates | | | (24,649,629 | ) | | | (29,961,978 | ) | | | (283,158,200 | ) | | | (95,627,508 | ) | |
Net change in unrealized appreciation or depreciation on
investments, foreign currency related transactions,
futures, and swaps | | | 18,781,901 | | | | (25,565,739 | ) | | | 278,606,975 | | | | (382,926,910 | ) | |
| Increase (decrease) in net assets resulting from operations | | | (5,024,653 | ) | | | (52,892,113 | ) | | | 52,438,129 | | | | (307,244,937 | ) | |
| FROM DISTRIBUTIONS TO SHAREHOLDERS: | |
| Net investment income: | |
| Class ADV | | | (13 | ) | | | (11 | ) | | | — | | | | (47 | ) | |
| Class I | | | (2,288,544 | ) | | | (2,288,554 | ) | | | (7,992,679 | ) | | | (118,136,444 | ) | |
| Class S | | | (323,400 | ) | | | (316,610 | ) | | | (2,661,647 | ) | | | (72,938,302 | ) | |
| Class S2 | | | — | | | | — | | | | (15 | ) | | | — | | |
| Net realized gains: | | | | | | | | | | | | | | | | | |
| Class ADV | | | — | | | | (140 | ) | | | — | | | | (23 | ) | |
| Class I | | | — | | | | (17,966,905 | ) | | | — | | | | (47,870,738 | ) | |
| Class S | | | — | | | | (3,013,623 | ) | | | — | | | | (29,295,110 | ) | |
| Total distributions | | | (2,611,957 | ) | | | (23,585,843 | ) | | | (10,654,341 | ) | | | (268,240,664 | ) | |
| FROM CAPITAL SHARE TRANSACTIONS: | |
| Net proceeds from sale of shares | | | 992,305 | | | | 1,563,145 | | | | 236,021,862 | | | | 1,096,749,148 | | |
| Proceeds from shares issued in merger (Note 14) | | | — | | | | — | | | | — | | | | 48,015,614 | | |
| Reinvestment of distributions | | | 2,611,944 | | | | 23,585,688 | | | | 10,652,225 | | | | 268,200,908 | | |
| | | | 3,604,249 | | | | 25,148,833 | | | | 246,674,087 | | | | 1,412,965,670 | | |
| Cost of shares redeemed | | | (5,623,423 | ) | | | (30,249,954 | ) | | | (415,802,241 | ) | | | (1,226,745,331 | ) | |
Net increase (decrease) in net assets resulting from capital
share transactions | | | (2,019,174 | ) | | | (5,101,121 | ) | | | (169,128,154 | ) | | | 186,220,339 | | |
| Net decrease in net assets | | | (9,655,784 | ) | | | (81,579,077 | ) | | | (127,344,366 | ) | | | (389,265,262 | ) | |
| NET ASSETS: | |
| Beginning of period | | | 85,745,694 | | | | 167,324,771 | | | | 2,957,404,951 | | | | 3,346,670,213 | | |
| End of period | | $ | 76,089,910 | | | $ | 85,745,694 | | | $ | 2,830,060,585 | | | $ | 2,957,404,951 | | |
Undistributed net investment income (distributions in
excess of net investment income) at end of period | | $ | 841,960 | | | $ | 2,610,842 | | | $ | 21,783,562 | | | $ | (24,551,451 | ) | |
See Accompanying Notes to Financial Statements
14
STATEMENTS OF CHANGES IN NET ASSETS (UNAUDITED)
| | | ING Money Market Portfolio | | ING BlackRock
Science and Technology
Opportunities Portfolio | |
| | | Six Months
Ended
June 30,
2009 | | Year
Ended
December 31,
2008 | | Six Months
Ended
June 30,
2009 | | Year
Ended
December 31,
2008 | |
| FROM OPERATIONS: | |
| Net investment income (loss) | | $ | 3,487,609 | | | $ | 46,716,063 | | | $ | (136,212 | ) | | $ | 48,982 | | |
Net realized gain (loss) on investments and foreign
currency related transactions | | | 741,616 | | | | 2,471,989 | | | | (18,698,679 | ) | | | (17,342,801 | ) | |
Net change in unrealized appreciation or depreciation on
investments and foreign currency related transactions | | | — | | | | (149,401 | ) | | | 49,990,053 | | | | (70,362,339 | ) | |
| Increase (decrease) in net assets resulting from operations | | | 4,229,225 | | | | 49,038,651 | | | | 31,155,162 | | | | (87,656,158 | ) | |
| FROM DISTRIBUTIONS TO SHAREHOLDERS: | |
| Net investment income | | | (3,486,834 | ) | | | (124,653,168 | ) | | | — | | | | — | | |
| Total distributions | | | (3,486,834 | ) | | | (124,653,168 | ) | | | — | | | | — | | |
| FROM CAPITAL SHARE TRANSACTIONS: | |
| Net proceeds from sale of shares | | | 58,471,183 | | | | 384,970,723 | | | | 58,859,984 | | | | 52,450,776 | | |
| Proceeds from shares issued in merger (Note 14) | | | — | | | | — | | | | — | | | | 123,216,459 | | |
| Reinvestment of distributions | | | 3,486,834 | | | | 124,653,168 | | | | — | | | | — | | |
| | | | 61,958,017 | | | | 509,623,891 | | | | 58,859,984 | | | | 175,667,235 | | |
| Cost of shares redeemed | | | (278,262,395 | ) | | | (346,315,736 | ) | | | (17,717,867 | ) | | | (41,644,715 | ) | |
Net increase (decrease) in net assets resulting from capital
share transactions | | | (216,304,378 | ) | | | 163,308,155 | | | | 41,142,117 | | | | 134,022,520 | | |
| Net increase (decrease) in net assets | | | (215,561,987 | ) | | | 87,693,638 | | | | 72,297,279 | | | | 46,366,362 | | |
| NET ASSETS: | |
| Beginning of period | | | 1,798,832,925 | | | | 1,711,139,287 | | | | 145,449,413 | | | | 99,083,051 | | |
| End of period | | $ | 1,583,270,938 | | | $ | 1,798,832,925 | | | $ | 217,746,692 | | | $ | 145,449,413 | | |
| Undistributed net investment income at end of period | | $ | 775 | | | $ | — | | | $ | 465,885 | | | $ | 602,097 | | |
See Accompanying Notes to Financial Statements
15
FINANCIAL HIGHLIGHTS (UNAUDITED)
Selected data for a share of beneficial interest outstanding throughout each year or period.
| | | | | Income (loss)
from investment
operations | | | | Less distributions | | | |
| | | Net asset value, beginning of year or period | | Net investment income (loss) | | Net realized and unrealized gain (loss) | | Total from investment operations | | From net investment income | | From net realized gains | | From return of capital | | Total distributions | | Net asset value, end of year or period | |
| | | | | | | | | | | | | | | | | | | | |
| Year or period ended | | ($) | | ($) | | ($) | | ($) | | ($) | | ($) | | ($) | | ($) | | ($) | |
| ING Balanced Portfolio | | | |
| Class ADV | | | |
| 06-30-09 | | | 9.11 | | | | 0.09 | | | | 0.10 | | | | 0.19 | | | | 0.35 | | | | — | | | | — | | | | 0.35 | | | | 8.95 | | |
| 12-31-08 | | | 14.34 | | | | 0.29 | | | | (4.03 | ) | | | (3.74 | ) | | | 0.34 | | | | 1.15 | | | | — | | | | 1.49 | | | | 9.11 | | |
| 12-31-07 | | | 14.65 | | | | 0.29 | | | | 0.37 | | | | 0.66 | | | | 0.39 | | | | 0.58 | | | | — | | | | 0.97 | | | | 14.34 | | |
| 12-29-06(4)-12-31-06 | | | 14.65 | | | | (0.00 | )* | | | — | | | | (0.00 | )* | | | — | | | | — | | | | — | | | | — | | | | 14.65 | | |
| Class I | | | |
| 06-30-09 | | | 9.18 | | | | 0.14 | | | | 0.04 | | | | 0.18 | | | | 0.43 | | | | — | | | | — | | | | 0.43 | | | | 8.93 | | |
| 12-31-08 | | | 14.45 | | | | 0.40 | | | | (4.07 | ) | | | (3.67 | ) | | | 0.45 | | | | 1.15 | | | | — | | | | 1.60 | | | | 9.18 | | |
| 12-31-07 | | | 14.65 | | | | 0.39 | • | | | 0.38 | | | | 0.77 | | | | 0.39 | | | | 0.58 | | | | — | | | | 0.97 | | | | 14.45 | | |
| 12-31-06 | | | 13.64 | | | | 0.34 | • | | | 1.00 | | | | 1.34 | | | | 0.33 | | | | — | | | | — | | | | 0.33 | | | | 14.65 | | |
| 12-31-05 | | | 13.40 | | | | 0.29 | • | | | 0.27 | | | | 0.56 | | | | 0.32 | | | | — | | | | — | | | | 0.32 | | | | 13.64 | | |
| 12-31-04 | | | 12.50 | | | | 0.29 | | | | 0.87 | | | | 1.16 | | | | 0.26 | | | | — | | | | — | | | | 0.26 | | | | 13.40 | | |
| Class S | | | |
| 06-30-09 | | | 9.12 | | | | 0.13 | | | | 0.04 | | | | 0.17 | | | | 0.40 | | | | — | | | | — | | | | 0.40 | | | | 8.89 | | |
| 12-31-08 | | | 14.36 | | | | 0.34 | | | | (4.02 | ) | | | (3.68 | ) | | | 0.41 | | | | 1.15 | | | | — | | | | 1.56 | | | | 9.12 | | |
| 12-31-07 | | | 14.57 | | | | 0.35 | • | | | 0.38 | | | | 0.73 | | | | 0.36 | | | | 0.58 | | | | — | | | | 0.94 | | | | 14.36 | | |
| 12-31-06 | | | 13.58 | | | | 0.32 | • | | | 0.97 | | | | 1.29 | | | | 0.30 | | | | — | | | | — | | | | 0.30 | | | | 14.57 | | |
| 12-31-05 | | | 13.35 | | | | 0.27 | | | | 0.25 | | | | 0.52 | | | | 0.29 | | | | — | | | | — | | | | 0.29 | | | | 13.58 | | |
| 12-31-04 | | | 12.49 | | | | 0.22 | | | | 0.89 | | | | 1.11 | | | | 0.25 | | | | — | | | | — | | | | 0.25 | | | | 13.35 | | |
| Class S2 | | | |
| 02-27-09(4)-06-30-09 | | | 7.97 | | | | 0.06 | • | | | 1.25 | | | | 1.31 | | | | 0.43 | | | | — | | | | — | | | | 0.43 | | | | 8.85 | | |
| ING Growth and Income Portfolio | | | |
| Class ADV | | | |
| 06-30-09 | | | 15.04 | | | | 0.10 | | | | 0.99 | | | | 1.09 | | | | — | | | | — | | | | — | | | | — | | | | 16.13 | | |
| 12-31-08 | | | 24.61 | | | | 0.23 | • | | | (9.58 | ) | | | (9.35 | ) | | | 0.22 | | | | — | | | | — | | | | 0.22 | | | | 15.04 | | |
| 12-31-07 | | | 23.38 | | | | 0.72 | • | | | 0.84 | | | | 1.56 | | | | 0.33 | | | | — | | | | — | | | | 0.33 | | | | 24.61 | | |
| 12-20-06(4)-12-31-06 | | | 23.70 | | | | 0.01 | • | | | (0.06 | ) | | | (0.05 | ) | | | 0.27 | | | | — | | | | — | | | | 0.27 | | | | 23.38 | | |
| Class I | | | |
| 06-30-09 | | | 15.11 | | | | 0.12 | | | | 1.01 | | | | 1.13 | | | | — | | | | — | | | | — | | | | — | | | | 16.24 | | |
| 12-31-08 | | | 24.76 | | | | 0.36 | | | | (9.69 | ) | | | (9.33 | ) | | | 0.32 | | | | — | | | | — | | | | 0.32 | | | | 15.11 | | |
| 12-31-07 | | | 23.38 | | | | 0.33 | • | | | 1.40 | | | | 1.73 | | | | 0.35 | | | | — | | | | — | | | | 0.35 | | | | 24.76 | | |
| 12-31-06 | | | 20.71 | | | | 0.25 | • | | | 2.69 | | | | 2.94 | | | | 0.27 | | | | — | | | | — | | | | 0.27 | | | | 23.38 | | |
| 12-31-05 | | | 19.35 | | | | 0.23 | | | | 1.35 | | | | 1.58 | | | | 0.22 | | | | — | | | | — | | | | 0.22 | | | | 20.71 | | |
| 12-31-04 | | | 18.28 | | | | 0.28 | | | | 1.24 | | | | 1.52 | | | | 0.45 | | | | — | | | | — | | | | 0.45 | | | | 19.35 | | |
| Class S | | | |
| 06-30-09 | | | 15.00 | | | | 0.11 | | | | 1.00 | | | | 1.11 | | | | — | | | | — | | | | — | | | | — | | | | 16.11 | | |
| 12-31-08 | | | 24.63 | | | | 0.25 | • | | | (9.58 | ) | | | (9.33 | ) | | | 0.30 | | | | — | | | | — | | | | 0.30 | | | | 15.00 | | |
| 12-31-07 | | | 23.30 | | | | 0.37 | • | | | 1.29 | | | | 1.66 | | | | 0.33 | | | | — | | | | — | | | | 0.33 | | | | 24.63 | | |
| 12-31-06 | | | 20.69 | | | | 0.20 | • | | | 2.64 | | | | 2.84 | | | | 0.23 | | | | — | | | | — | | | | 0.23 | | | | 23.30 | | |
| 12-31-05 | | | 19.34 | | | | 0.14 | | | | 1.41 | | | | 1.55 | | | | 0.20 | | | | — | | | | — | | | | 0.20 | | | | 20.69 | | |
| 12-31-04 | | | 18.26 | | | | 0.21 | | | | 1.26 | | | | 1.47 | | | | 0.39 | | | | — | | | | — | | | | 0.39 | | | | 19.34 | | |
| Class S2 | | | |
| 02-27-09(4)-06-30-09 | | | 12.69 | | | | 0.04 | | | | 3.41 | | | | 3.45 | | | | — | | | | — | | | | — | | | | — | | | | 16.14 | | |
| | | | | Ratios to average net assets | | Supplemental data | |
| | | Total Return(1) | | Expenses before reductions/additions(2)(3) | | Expenses net of fee waivers and/or recoupments, if any(2)(3) | | Expenses net of all reductions/additions(2)(3) | | Net investment income (loss)(2)(3) | | Net assets, end of year or period | | Portfolio turnover rate | |
| | | | | | | | | | | | | | | | |
| Year or period ended | | (%) | | (%) | | (%) | | (%) | | (%) | | ($000's) | | (%) | |
| ING Balanced Portfolio | |
| Class ADV | |
| 06-30-09 | | | 2.22 | | | | 1.14 | | | | 1.13 | † | | | 1.13 | † | | | 2.12 | † | | | 1 | | | | 182 | | |
| 12-31-08 | | | (28.62 | ) | | | 1.12 | | | | 1.12 | † | | | 1.12 | † | | | 2.44 | † | | | 1 | | | | 294 | | |
| 12-31-07 | | | 4.78 | | | | 1.10 | | | | 1.10 | † | | | 1.10 | † | | | 2.05 | † | | | 1 | | | | 257 | | |
| 12-29-06(4)-12-31-06 | | | — | | | | 1.10 | | | | 1.10 | † | | | 1.10 | † | | | (1.10 | )† | | | 1 | | | | 236 | | |
| Class I | |
| 06-30-09 | | | 2.15 | | | | 0.64 | | | | 0.63 | † | | | 0.63 | † | | | 2.80 | † | | | 580,829 | | | | 182 | | |
| 12-31-08 | | | (28.10 | ) | | | 0.62 | | | | 0.62 | † | | | 0.62 | † | | | 2.97 | † | | | 602,815 | | | | 294 | | |
| 12-31-07 | | | 5.57 | | | | 0.60 | | | | 0.60 | † | | | 0.60 | † | | | 2.68 | † | | | 1,046,498 | | | | 257 | | |
| 12-31-06 | | | 9.99 | | | | 0.60 | | | | 0.60 | † | | | 0.60 | † | | | 2.44 | † | | | 1,183,928 | | | | 236 | | |
| 12-31-05 | | | 4.24 | | | | 0.60 | | | | 0.60 | | | | 0.60 | | | | 2.30 | | | | 1,236,327 | | | | 308 | | |
| 12-31-04 | | | 9.42 | | | | 0.59 | | | | 0.59 | | | | 0.59 | | | | 2.15 | | | | 1,357,854 | | | | 272 | | |
| Class S | |
| 06-30-09 | | | 2.04 | | | | 0.89 | | | | 0.88 | † | | | 0.88 | † | | | 2.61 | † | | | 6,464 | | | | 182 | | |
| 12-31-08 | | | (28.28 | ) | | | 0.87 | | | | 0.87 | † | | | 0.87 | † | | | 2.73 | † | | | 6,684 | | | | 294 | | |
| 12-31-07 | | | 5.31 | | | | 0.85 | | | | 0.85 | † | | | 0.85 | † | | | 2.43 | † | | | 10,281 | | | | 257 | | |
| 12-31-06 | | | 9.62 | | | | 0.85 | | | | 0.85 | † | | | 0.85 | † | | | 2.29 | † | | | 10,683 | | | | 236 | | |
| 12-31-05 | | | 3.99 | | | | 0.85 | | | | 0.85 | | | | 0.85 | | | | 2.06 | | | | 3,170 | | | | 308 | | |
| 12-31-04 | | | 9.06 | | | | 0.84 | | | | 0.84 | | | | 0.84 | | | | 1.98 | | | | 3,116 | | | | 272 | | |
| Class S2 | |
| 02-27-09(4)-06-30-09 | | | 16.66 | | | | 1.14 | | | | 1.03 | † | | | 1.03 | † | | | 2.21 | † | | | 3 | | | | 182 | | |
| ING Growth and Income Portfolio | |
| Class ADV | |
| 06-30-09 | | | 7.25 | | | | 1.12 | | | | 1.11 | † | | | 1.11 | † | | | 1.24 | † | | | 660 | | | | 54 | | |
| 12-31-08 | | | (37.94 | )(a) | | | 1.10 | | | | 1.10 | † | | | 1.10 | † | | | 1.14 | † | | | 791 | | | | 169 | | |
| 12-31-07 | | | 6.66 | | | | 1.09 | | | | 1.09 | † | | | 1.09 | † | | | 2.95 | † | | | 1,211 | | | | 146 | | |
| 12-20-06(4)-12-31-06 | | | (0.23 | ) | | | 1.09 | | | | 1.09 | † | | | 1.09 | † | | | 1.08 | † | | | 1 | | | | 103 | | |
| Class I | |
| 06-30-09 | | | 7.48 | | | | 0.62 | | | | 0.61 | † | | | 0.61 | † | | | 1.66 | † | | | 1,749,938 | | | | 54 | | |
| 12-31-08 | | | (37.63 | )(a) | | | 0.60 | | | | 0.60 | † | | | 0.60 | † | | | 1.64 | † | | | 1,622,085 | | | | 169 | | |
| 12-31-07 | | | 7.40 | | | | 0.59 | | | | 0.59 | † | | | 0.59 | † | | | 1.32 | † | | | 2,796,115 | | | | 146 | | |
| 12-31-06 | | | 14.20 | | | | 0.59 | | | | 0.59 | † | | | 0.59 | † | | | 1.15 | † | | | 3,098,120 | | | | 103 | | |
| 12-31-05 | | | 8.13 | | | | 0.59 | | | | 0.59 | | | | 0.59 | | | | 1.03 | | | | 3,146,025 | | | | 80 | | |
| 12-31-04 | | | 8.39 | | | | 0.58 | | | | 0.58 | | | | 0.58 | | | | 1.41 | | | | 3,531,422 | | | | 139 | | |
| Class S | |
| 06-30-09 | | | 7.40 | | | | 0.87 | | | | 0.86 | † | | | 0.86 | † | | | 1.43 | † | | | 284,400 | | | | 54 | | |
| 12-31-08 | | | (37.82 | )(a) | | | 0.85 | | | | 0.85 | † | | | 0.85 | † | | | 1.44 | † | | | 290,152 | | | | 169 | | |
| 12-31-07 | | | 7.13 | | | | 0.84 | | | | 0.84 | † | | | 0.84 | † | | | 1.50 | † | | | 25,169 | | | | 146 | | |
| 12-31-06 | | | 13.72 | | | | 0.84 | | | | 0.84 | † | | | 0.84 | † | | | 0.94 | † | | | 4,758 | | | | 103 | | |
| 12-31-05 | | | 7.98 | | | | 0.84 | | | | 0.84 | | | | 0.84 | | | | 0.78 | | | | 2,431 | | | | 80 | | |
| 12-31-04 | | | 8.10 | | | | 0.83 | | | | 0.83 | | | | 0.83 | | | | 1.18 | | | | 1,776 | | | | 139 | | |
| Class S2 | |
| 02-27-09(4)-06-30-09 | | | 27.19 | | | | 1.12 | | | | 1.01 | † | | | 1.01 | † | | | 0.85 | † | | | 4 | | | | 54 | | |
See Accompanying Notes to Financial Statements
16
FINANCIAL HIGHLIGHTS (UNAUDITED) (CONTINUED)
Selected data for a share of beneficial interest outstanding throughout each year or period.
| | | | | Income (loss)
from investment
operations | | | | Less distributions | | | |
| | | Net asset value, beginning of year or period | | Net investment income (loss) | | Net realized and unrealized gain (loss) | | Total from investment operations | | From net investment income | | From net realized gains | | From return of capital | | Total distributions | | Net asset value, end of year or period | |
| | | | | | | | | | | | | | | | | | | | |
| Year or period ended | | ($) | | ($) | | ($) | | ($) | | ($) | | ($) | | ($) | | ($) | | ($) | |
| ING Opportunistic LargeCap Growth Portfolio | | | |
| Class ADV | | | |
| 06-30-09 | | | 6.93 | | | | 0.00 | * | | | 0.54 | | | | 0.54 | | | | — | | | | — | | | | — | | | | — | | | | 7.47 | | |
| 12-31-08 | | | 12.46 | | | | (0.01 | )• | | | (5.52 | ) | | | (5.53 | ) | | | — | | | | — | | | | — | | | | — | | | | 6.93 | | |
| 12-31-07 | | | 10.65 | | | | (0.02 | )• | | | 1.85 | | | | 1.83 | | | | 0.02 | | | | — | | | | — | | | | 0.02 | | | | 12.46 | | |
| 12-29-06(4)-12-31-06 | | | 10.65 | | | | (0.00 | )* | | | — | | | | (0.00 | )* | | | — | | | | — | | | | — | | | | — | | | | 10.65 | | |
| Class I | | | |
| 06-30-09 | | | 6.96 | | | | 0.03 | | | | 0.52 | | | | 0.55 | | | | 0.05 | | | | — | | | | — | | | | 0.05 | | | | 7.46 | | |
| 12-31-08 | | | 12.53 | | | | 0.05 | | | | (5.54 | ) | | | (5.49 | ) | | | 0.08 | | | | — | | | | — | | | | 0.08 | | | | 6.96 | | |
| 12-31-07 | | | 10.65 | | | | 0.05 | • | | | 1.85 | | | | 1.90 | | | | 0.02 | | | | — | | | | — | | | | 0.02 | | | | 12.53 | | |
| 12-31-06 | | | 10.38 | | | | 0.02 | • | | | 0.26 | | | | 0.28 | | | | 0.01 | | | | — | | | | — | | | | 0.01 | | | | 10.65 | | |
| 12-31-05 | | | 9.56 | | | | 0.02 | | | | 0.87 | | | | 0.89 | | | | 0.07 | | | | — | | | | — | | | | 0.07 | | | | 10.38 | | |
| 12-31-04 | | | 8.93 | | | | 0.06 | | | | 0.58 | | | | 0.64 | | | | 0.01 | | | | — | | | | — | | | | 0.01 | | | | 9.56 | | |
| Class S | | | |
| 06-30-09 | | | 6.89 | | | | 0.01 | | | | 0.53 | | | | 0.54 | | | | 0.02 | | | | — | | | | — | | | | 0.02 | | | | 7.41 | | |
| 12-31-08 | | | 12.39 | | | | 0.02 | • | | | (5.49 | ) | | | (5.47 | ) | | | 0.03 | | | | — | | | | — | | | | 0.03 | | | | 6.89 | | |
| 12-31-07 | | | 10.56 | | | | 0.00 | * | | | 1.85 | | | | 1.85 | | | | 0.02 | | | | — | | | | — | | | | 0.02 | | | | 12.39 | | |
| 12-31-06 | | | 10.31 | | | | (0.01 | ) | | | 0.26 | | | | 0.25 | | | | — | | | | — | | | | — | | | | — | | | | 10.56 | | |
| 12-31-05 | | | 9.50 | | | | (0.00 | )* | | | 0.85 | | | | 0.85 | | | | 0.04 | | | | — | | | | — | | | | 0.04 | | | | 10.31 | | |
| 12-31-04 | | | 8.88 | | | | 0.04 | | | | 0.58 | | | | 0.62 | | | | — | | | | — | | | | — | | | | — | | | | 9.50 | | |
| ING Small Company Portfolio | | | |
| Class ADV | | | |
| 06-30-09 | | | 11.58 | | | | 0.01 | | | | 0.30 | | | | 0.31 | | | | 0.08 | | | | — | | | | — | | | | 0.08 | | | | 11.81 | | |
| 12-16-08(4)-12-31-08 | | | 11.13 | | | | 0.00 | *• | | | 0.45 | | | | 0.45 | | | | — | | | | — | | | | — | | | | — | | | | 11.58 | | |
| Class I | | | |
| 06-30-09 | | | 11.70 | | | | 0.03 | | | | 0.31 | | | | 0.34 | | | | 0.08 | | | | — | | | | — | | | | 0.08 | | | | 11.96 | | |
| 12-31-08 | | | 19.56 | | | | 0.11 | • | | | (5.52 | ) | | | (5.41 | ) | | | 0.18 | | | | 2.27 | | | | — | | | | 2.45 | | | | 11.70 | | |
| 12-31-07 | | | 21.70 | | | | 0.24 | • | | | 0.99 | | | | 1.23 | | | | 0.04 | | | | 3.33 | | | | — | | | | 3.37 | | | | 19.56 | | |
| 12-31-06 | | | 21.65 | | | | 0.05 | | | | 3.46 | | | | 3.51 | | | | 0.09 | | | | 3.37 | | | | — | | | | 3.46 | | | | 21.70 | | |
| 12-31-05 | | | 19.94 | | | | 0.10 | | | | 1.92 | | | | 2.02 | | | | 0.03 | | | | 0.28 | | | | — | | | | 0.31 | | | | 21.65 | | |
| 12-31-04 | | | 17.48 | | | | 0.04 | | | | 2.47 | | | | 2.51 | | | | 0.05 | | | | — | | | | — | | | | 0.05 | | | | 19.94 | | |
| Class S | | | |
| 06-30-09 | | | 11.57 | | | | 0.02 | • | | | 0.31 | | | | 0.33 | | | | 0.07 | | | | — | | | | — | | | | 0.07 | | | | 11.83 | | |
| 12-31-08 | | | 19.39 | | | | 0.09 | • | | | (5.50 | ) | | | (5.41 | ) | | | 0.14 | | | | 2.27 | | | | — | | | | 2.41 | | | | 11.57 | | |
| 12-31-07 | | | 21.54 | | | | 0.18 | • | | | 1.00 | | | | 1.18 | | | | — | | | | 3.33 | | | | — | | | | 3.33 | | | | 19.39 | | |
| 12-31-06 | | | 21.59 | | | | (0.05 | )• | | | 3.41 | | | | 3.36 | | | | 0.04 | | | | 3.37 | | | | — | | | | 3.41 | | | | 21.54 | | |
| 12-31-05 | | | 19.90 | | | | 0.06 | | | | 1.92 | | | | 1.98 | | | | 0.01 | | | | 0.28 | | | | — | | | | 0.29 | | | | 21.59 | | |
| 12-31-04 | | | 17.49 | | | | 0.03 | • | | | 2.43 | | | | 2.46 | | | | 0.05 | | | | — | | | | — | | | | 0.05 | | | | 19.90 | | |
| Class S2 | | | |
| 02-27-09(4)-06-30-09 | | | 9.27 | | | | 0.01 | • | | | 2.61 | | | | 2.62 | | | | 0.08 | | | | — | | | | — | | | | 0.08 | | | | 11.81 | | |
| | | | | Ratios to average net assets | | Supplemental data | |
| | | Total Return(1) | | Expenses before reductions/additions(2)(3) | | Expenses net of fee waivers and/or recoupments, if any(2)(3) | | Expenses net of all reductions/additions(2)(3) | | Net investment income (loss)(2)(3) | | Net assets, end of year or period | | Portfolio turnover rate | |
| | | | | | | | | | | | | | | | |
| Year or period ended | | (%) | | (%) | | (%) | | (%) | | (%) | | ($000's) | | (%) | |
| ING Opportunistic LargeCap Growth Portfolio | |
| Class ADV | |
| 06-30-09 | | | 7.79 | | | | 1.22 | | | | 1.22 | † | | | 1.22 | † | | | 0.15 | † | | | 647 | | | | 77 | | |
| 12-31-08 | | | (44.38 | ) | | | 1.24 | | | | 1.24 | † | | | 1.24 | † | | | (0.08 | )† | | | 590 | | | | 259 | | |
| 12-31-07 | | | 17.21 | | | | 1.20 | | | | 1.20 | † | | | 1.20 | † | | | (0.18 | )† | | | 1,386 | | | | 279 | | |
| 12-29-06(4)-12-31-06 | | | — | | | | 1.19 | | | | 1.19 | | | | 1.19 | | | | (1.19 | ) | | | 1 | | | | 188 | | |
| Class I | |
| 06-30-09 | | | 7.93 | | | | 0.72 | | | | 0.72 | † | | | 0.72 | † | | | 0.67 | † | | | 60,245 | | | | 77 | | |
| 12-31-08 | | | (44.06 | ) | | | 0.74 | | | | 0.74 | † | | | 0.74 | † | | | 0.43 | † | | | 59,412 | | | | 259 | | |
| 12-31-07 | | | 17.86 | | | | 0.70 | | | | 0.70 | † | | | 0.70 | † | | | 0.42 | † | | | 137,104 | | | | 279 | | |
| 12-31-06 | | | 2.65 | | | | 0.69 | | | | 0.69 | | | | 0.69 | | | | 0.19 | | | | 186,495 | | | | 188 | | |
| 12-31-05 | | | 9.38 | (c) | | | 0.69 | | | | 0.69 | | | | 0.69 | | | | 0.08 | | | | 175,297 | | | | 119 | | |
| 12-31-04 | | | 7.19 | | | | 0.69 | | | | 0.69 | | | | 0.69 | | | | 0.61 | | | | 193,280 | | | | 123 | | |
| Class S | |
| 06-30-09 | | | 7.82 | | | | 0.97 | | | | 0.97 | † | | | 0.97 | † | | | 0.42 | † | | | 7,610 | | | | 77 | | |
| 12-31-08 | | | (44.21 | ) | | | 0.99 | | | | 0.99 | † | | | 0.99 | † | | | 0.17 | † | | | 7,034 | | | | 259 | | |
| 12-31-07 | | | 17.54 | | | | 0.95 | | | | 0.95 | † | | | 0.95 | † | | | 0.23 | † | | | 21,105 | | | | 279 | | |
| 12-31-06 | | | 2.42 | | | | 0.94 | | | | 0.94 | | | | 0.94 | | | | (0.06 | ) | | | 273 | | | | 188 | | |
| 12-31-05 | | | 9.05 | (c) | | | 0.94 | | | | 0.94 | | | | 0.94 | | | | (0.17 | ) | | | 285 | | | | 119 | | |
| 12-31-04 | | | 6.98 | | | | 0.94 | | | | 0.94 | | | | 0.94 | | | | 0.44 | | | | 356 | | | | 123 | | |
| ING Small Company Portfolio | |
| Class ADV | |
| 06-30-09 | | | 2.70 | | | | 1.36 | | | | 1.36 | † | | | 1.36 | † | | | 0.20 | † | | | 3 | | | | 72 | | |
| 12-16-08(4)-12-31-08 | | | 4.04 | | | | 1.35 | | | | 1.35 | † | | | 1.35 | † | | | 0.65 | † | | | 3 | | | | 145 | | |
| Class I | |
| 06-30-09 | | | 2.94 | | | | 0.86 | | | | 0.86 | † | | | 0.86 | † | | | 0.70 | † | | | 455,089 | | | | 72 | | |
| 12-31-08 | | | (31.05 | ) | | | 0.85 | | | | 0.85 | † | | | 0.85 | † | | | 0.71 | † | | | 420,626 | | | | 145 | | |
| 12-31-07 | | | 5.90 | | | | 0.84 | | | | 0.84 | † | | | 0.84 | † | | | 1.16 | † | | | 603,492 | | | | 106 | | |
| 12-31-06 | | | 16.79 | | | | 0.85 | | | | 0.85 | † | | | 0.85 | † | | | 0.26 | † | | | 512,446 | | | | 83 | | |
| 12-31-05 | | | 10.27 | (c) | | | 0.85 | | | | 0.85 | | | | 0.85 | | | | 0.43 | | | | 393,700 | | | | 72 | | |
| 12-31-04 | | | 14.39 | | | | 0.84 | | | | 0.84 | | | | 0.84 | | | | 0.21 | | | | 461,014 | | | | 93 | | |
| Class S | |
| 06-30-09 | | | 2.89 | | | | 1.11 | | | | 1.11 | † | | | 1.11 | † | | | 0.45 | † | | | 53,196 | | | | 72 | | |
| 12-31-08 | | | (31.28 | ) | | | 1.10 | | | | 1.10 | † | | | 1.10 | † | | | 0.71 | † | | | 44,764 | | | | 145 | | |
| 12-31-07 | | | 5.68 | | | | 1.09 | | | | 1.09 | † | | | 1.09 | † | | | 0.90 | † | | | 2,890 | | | | 106 | | |
| 12-31-06 | | | 16.07 | | | | 1.10 | | | | 1.10 | † | | | 1.10 | † | | | (0.24 | )† | | | 2,162 | | | | 83 | | |
| 12-31-05 | | | 10.05 | (c) | | | 1.10 | | | | 1.10 | | | | 1.10 | | | | 0.26 | | | | 68,768 | | | | 72 | | |
| 12-31-04 | | | 14.09 | | | | 1.09 | | | | 1.09 | | | | 1.09 | | | | 0.19 | | | | 72,225 | | | | 93 | | |
| Class S2 | |
| 02-27-09(4)-06-30-09 | | | 28.31 | | | | 1.36 | | | | 1.26 | † | | | 1.26 | † | | | 0.37 | † | | | 4 | | | | 72 | | |
See Accompanying Notes to Financial Statements
17
FINANCIAL HIGHLIGHTS (UNAUDITED) (CONTINUED)
Selected data for a share of beneficial interest outstanding throughout each year or period.
| | | | | Income (loss)
from investment
operations | | | | Less distributions | | | |
| | | Net asset value, beginning of year or period | | Net investment income (loss) | | Net realized and unrealized gain (loss) | | Total from investment operations | | From net investment income | | From net realized gains | | From return of capital | | Total distributions | | Net asset value, end of year or period | |
| | | | | | | | | | | | | | | | | | | | |
| Year or period ended | | ($) | | ($) | | ($) | | ($) | | ($) | | ($) | | ($) | | ($) | | ($) | |
| ING Opportunistic LargeCap Portfolio | | | |
| Class ADV | | | |
| 06-30-09 | | | 8.52 | | | | 0.08 | | | | (0.55 | ) | | | (0.47 | ) | | | 0.21 | | | | — | | | | — | | | | 0.21 | | | | 7.84 | | |
| 12-31-08 | | | 15.82 | | | | 0.20 | | | | (5.19 | ) | | | (4.99 | ) | | | 0.16 | | | | 2.15 | | | | — | | | | 2.31 | | | | 8.52 | | |
| 12-31-07 | | | 15.72 | | | | 0.16 | | | | 0.20 | | | | 0.36 | | | | 0.26 | | | | — | | | | — | | | | 0.26 | | | | 15.82 | | |
| 12-29-06(4)-12-31-06 | | | 15.72 | | | | (0.00 | )* | | | — | | | | (0.00 | )* | | | — | | | | — | | | | — | | | | — | | | | 15.72 | | |
| Class I | | | |
| 06-30-09 | | | 8.65 | | | | 0.10 | | | | (0.58 | ) | | | (0.48 | ) | | | 0.28 | | | | — | | | | — | | | | 0.28 | | | | 7.89 | | |
| 12-31-08 | | | 16.05 | | | | 0.29 | | | | (5.27 | ) | | | (4.98 | ) | | | 0.27 | | | | 2.15 | | | | — | | | | 2.42 | | | | 8.65 | | |
| 12-31-07 | | | 15.84 | | | | 0.23 | • | | | 0.24 | | | | 0.47 | | | | 0.26 | | | | — | | | | — | | | | 0.26 | | | | 16.05 | | |
| 12-31-06 | | | 13.84 | | | | 0.23 | • | | | 1.98 | | | | 2.21 | | | | 0.21 | | | | — | | | | — | | | | 0.21 | | | | 15.84 | | |
| 12-31-05 | | | 13.19 | | | | 0.19 | • | | | 0.71 | | | | 0.90 | | | | 0.25 | | | | — | | | | — | | | | 0.25 | | | | 13.84 | | |
| 12-31-04 | | | 12.08 | | | | 0.24 | | | | 0.98 | | | | 1.22 | | | | 0.11 | | | | — | | | | — | | | | 0.11 | | | | 13.19 | | |
| Class S | | | |
| 06-30-09 | | | 8.58 | | | | 0.10 | | | | (0.58 | ) | | | (0.48 | ) | | | 0.25 | | | | — | | | | — | | | | 0.25 | | | | 7.85 | | |
| 12-31-08 | | | 15.93 | | | | 0.26 | | | | (5.23 | ) | | | (4.97 | ) | | | 0.23 | | | | 2.15 | | | | — | | | | 2.38 | | | | 8.58 | | |
| 12-31-07 | | | 15.72 | | | | 0.19 | • | | | 0.24 | | | | 0.43 | | | | 0.22 | | | | — | | | | — | | | | 0.22 | | | | 15.93 | | |
| 12-31-06 | | | 13.77 | | | | 0.19 | • | | | 1.96 | | | | 2.15 | | | | 0.20 | | | | — | | | | — | | | | 0.20 | | | | 15.72 | | |
| 12-31-05 | | | 13.12 | | | | 0.16 | • | | | 0.71 | | | | 0.87 | | | | 0.22 | | | | — | | | | — | | | | 0.22 | | | | 13.77 | | |
| 12-31-04 | | | 12.03 | | | | 0.13 | | | | 1.05 | | | | 1.18 | | | | 0.09 | | | | — | | | | — | | | | 0.09 | | | | 13.12 | | |
| ING Intermediate Bond Portfolio | | | |
| Class ADV | | | |
| 06-30-09 | | | 11.12 | | | | 0.22 | | | | (0.05 | ) | | | 0.17 | | | | — | | | | — | | | | — | | | | — | | | | 11.29 | | |
| 12-31-08 | | | 13.23 | | | | 0.58 | | | | (1.77 | ) | | | (1.19 | ) | | | 0.62 | | | | 0.30 | | | | — | | | | 0.92 | | | | 11.12 | | |
| 12-31-07 | | | 12.96 | | | | 0.63 | | | | 0.09 | | | | 0.72 | | | | 0.45 | | | | — | | | | — | | | | 0.45 | | | | 13.23 | | |
| 12-20-06(4)-12-31-06 | | | 13.53 | | | | 0.02 | | | | (0.06 | ) | | | (0.04 | ) | | | 0.53 | | | | — | | | | — | | | | 0.53 | | | | 12.96 | | |
| Class I | | | |
| 06-30-09 | | | 11.08 | | | | 0.22 | | | | 0.01 | | | | 0.23 | | | | 0.05 | | | | — | | | | — | | | | 0.05 | | | | 11.26 | | |
| 12-31-08 | | | 13.22 | | | | 0.64 | • | | | (1.73 | ) | | | (1.09 | ) | | | 0.75 | | | | 0.30 | | | | — | | | | 1.05 | | | | 11.08 | | |
| 12-31-07 | | | 12.96 | | | | 0.69 | • | | | 0.08 | | | | 0.77 | | | | 0.51 | | | | — | | | | — | | | | 0.51 | | | | 13.22 | | |
| 12-31-06 | | | 12.97 | | | | 0.65 | • | | | (0.12 | ) | | | 0.53 | | | | 0.54 | | | | — | | | | — | | | | 0.54 | | | | 12.96 | | |
| 12-31-05 | | | 13.14 | | | | 0.54 | | | | (0.13 | ) | | | 0.41 | | | | 0.51 | | | | 0.07 | | | | — | | | | 0.58 | | | | 12.97 | | |
| 12-31-04 | | | 14.15 | | | | 0.53 | | | | 0.13 | | | | 0.66 | | | | 1.11 | | | | 0.56 | | | | — | | | | 1.67 | | | | 13.14 | | |
| Class S | | | |
| 06-30-09 | | | 11.00 | | | | 0.21 | | | | 0.02 | | | | 0.23 | | | | 0.03 | | | | — | | | | — | | | | 0.03 | | | | 11.20 | | |
| 12-31-08 | | | 13.14 | | | | 0.60 | • | | | (1.72 | ) | | | (1.12 | ) | | | 0.72 | | | | 0.30 | | | | — | | | | 1.02 | | | | 11.00 | | |
| 12-31-07 | | | 12.89 | | | | 0.65 | • | | | 0.08 | | | | 0.73 | | | | 0.48 | | | | — | | | | — | | | | 0.48 | | | | 13.14 | | |
| 12-31-06 | | | 12.91 | | | | 0.61 | • | | | (0.12 | ) | | | 0.49 | | | | 0.51 | | | | — | | | | — | | | | 0.51 | | | | 12.89 | | |
| 12-31-05 | | | 13.09 | | | | 0.41 | | | | (0.03 | ) | | | 0.38 | | | | 0.49 | | | | 0.07 | | | | — | | | | 0.56 | | | | 12.91 | | |
| 12-31-04 | | | 14.13 | | | | 0.40 | | | | 0.22 | | | | 0.62 | | | | 1.10 | | | | 0.56 | | | | — | | | | 1.66 | | | | 13.09 | | |
| Class S2 | | | |
| 02-27-09(4)-06-30-09 | | | 10.79 | | | | 0.14 | • | | | 0.38 | | | | 0.52 | | | | 0.05 | | | | — | | | | — | | | | 0.05 | | | | 11.26 | | |
| ING Money Market Portfolio(d) | | | |
| Class I | | | |
| 06-30-09 | | | 1.00 | | | | 0.00 | * | | | 0.00 | * | | | 0.00 | * | | | 0.00 | * | | | — | | | | — | | | | 0.00 | * | | | 1.00 | | |
| 12-31-08 | | | 1.05 | | | | 0.02 | | | | 0.00 | | | | 0.02 | | | | 0.07 | | | | — | | | | — | | | | 0.07 | | | | 1.00 | | |
| 12-31-07 | | | 1.04 | | | | 0.05 | | | | (0.00 | ) | | | 0.05 | | | | 0.04 | | | | — | | | | — | | | | 0.04 | | | | 1.05 | | |
| 12-31-06 | | | 1.02 | | | | 0.05 | | | | 0.00 | | | | 0.05 | | | | 0.03 | | | | — | | | | — | | | | 0.03 | | | | 1.04 | | |
| 12-31-05 | | | 1.00 | | | | 0.03 | | | | (0.00 | ) | | | 0.03 | | | | 0.01 | | | | — | | | | — | | | | 0.01 | | | | 1.02 | | |
| 12-31-04 | | | 1.00 | | | | 0.01 | | | | (0.00 | ) | | | 0.01 | | | | 0.01 | | | | — | | | | — | | | | 0.01 | | | | 1.00 | | |
| | | | | Ratios to average net assets | | Supplemental data | |
| | | Total Return(1) | | Expenses before reductions/additions(2)(3) | | Expenses net of fee waivers and/or recoupments, if any(2)(3) | | Expenses net of all reductions/additions(2)(3) | | Net investment income (loss)(2)(3) | | Net assets, end of year or period | | Portfolio turnover rate | |
| | | | | | | | | | | | | | | | |
| Year or period ended | | (%) | | (%) | | (%) | | (%) | | (%) | | ($000's) | | (%) | |
| ING Opportunistic LargeCap Portfolio | |
| Class ADV | |
| 06-30-09 | | | (5.41 | ) | | | 1.22 | | | | 1.22 | † | | | 1.22 | † | | | 1.93 | † | | | 0 | * | | | 143 | | |
| 12-31-08 | | | (36.01 | )(a) | | | 1.21 | | | | 1.21 | † | | | 1.21 | † | | | 1.68 | † | | | 1 | | | | 132 | | |
| 12-31-07 | | | 2.33 | | | | 1.19 | | | | 1.19 | † | | | 1.19 | † | | | 0.99 | † | | | 1 | | | | 197 | | |
| 12-29-06(4)-12-31-06 | | | — | | | | 1.19 | | | | 1.19 | | | | 1.19 | | | | (1.19 | ) | | | 1 | | | | 83 | | |
| Class I | |
| 06-30-09 | | | (5.40 | ) | | | 0.72 | | | | 0.72 | † | | | 0.72 | † | | | 2.32 | † | | | 65,693 | | | | 143 | | |
| 12-31-08 | | | (35.61 | )(a) | | | 0.71 | | | | 0.71 | † | | | 0.71 | † | | | 2.16 | † | | | 73,764 | | | | 132 | | |
| 12-31-07 | | | 3.01 | | | | 0.69 | | | | 0.69 | † | | | 0.69 | † | | | 1.44 | † | | | 143,438 | | | | 197 | | |
| 12-31-06 | | | 16.10 | | | | 0.69 | | | | 0.69 | | | | 0.69 | | | | 1.58 | | | | 173,014 | | | | 83 | | |
| 12-31-05 | | | 6.95 | | | | 0.70 | | | | 0.70 | | | | 0.70 | | | | 1.47 | | | | 178,828 | | | | 94 | | |
| 12-31-04 | | | 10.15 | | | | 0.69 | | | | 0.69 | | | | 0.69 | | | | 1.61 | | | | 219,889 | | | | 16 | | |
| Class S | |
| 06-30-09 | | | (5.51 | ) | | | 0.97 | | | | 0.97 | † | | | 0.97 | † | | | 2.07 | † | | | 10,396 | | | | 143 | | |
| 12-31-08 | | | (35.80 | )(a) | | | 0.96 | | | | 0.96 | † | | | 0.96 | † | | | 1.91 | † | | | 11,981 | | | | 132 | | |
| 12-31-07 | | | 2.77 | | | | 0.94 | | | | 0.94 | † | | | 0.94 | † | | | 1.19 | † | | | 23,886 | | | | 197 | | |
| 12-31-06 | | | 15.77 | | | | 0.94 | | | | 0.94 | | | | 0.94 | | | | 1.32 | | | | 28,391 | | | | 83 | | |
| 12-31-05 | | | 6.76 | | | | 0.95 | | | | 0.95 | | | | 0.95 | | | | 1.18 | | | | 30,125 | | | | 94 | | |
| 12-31-04 | | | 9.88 | | | | 0.94 | | | | 0.94 | | | | 0.94 | | | | 1.36 | | | | 3,505 | | | | 16 | | |
| ING Intermediate Bond Portfolio | |
| Class ADV | |
| 06-30-09 | | | 1.53 | | | | 1.01 | | | | 1.01 | † | | | 1.01 | † | | | 3.96 | † | | | 1 | | | | 397 | | |
| 12-31-08 | | | (9.16 | ) | | | 1.01 | | | | 1.00 | † | | | 1.00 | † | | | 4.58 | † | | | 1 | | | | 666 | | |
| 12-31-07 | | | 5.60 | (b) | | | 0.99 | | | | 0.99 | † | | | 0.99 | † | | | 4.77 | † | | | 1 | | | | 438 | | |
| 12-20-06(4)-12-31-06 | | | (0.30 | ) | | | 0.99 | | | | 0.99 | † | | | 0.99 | † | | | 6.82 | † | | | 1 | | | | 390 | | |
| Class I | |
| 06-30-09 | | | 2.13 | | | | 0.51 | | | | 0.51 | † | | | 0.51 | † | | | 4.20 | † | | | 1,654,978 | | | | 397 | | |
| 12-31-08 | | | (8.41 | ) | | | 0.51 | | | | 0.50 | † | | | 0.50 | † | | | 5.05 | † | | | 1,803,886 | | | | 666 | | |
| 12-31-07 | | | 5.95 | (b) | | | 0.49 | | | | 0.49 | † | | | 0.49 | † | | | 5.19 | † | | | 2,267,008 | | | | 438 | | |
| 12-31-06 | | | 4.06 | | | | 0.49 | | | | 0.49 | † | | | 0.49 | † | | | 4.97 | † | | | 1,909,376 | | | | 390 | | |
| 12-31-05 | | | 3.14 | | | | 0.49 | | | | 0.49 | | | | 0.49 | | | | 4.14 | | | | 1,148,075 | | | | 589 | | |
| 12-31-04 | | | 4.88 | | | | 0.48 | | | | 0.48 | | | | 0.48 | | | | 3.79 | | | | 1,092,938 | | | | 407 | | |
| Class S | |
| 06-30-09 | | | 2.06 | | | | 0.76 | | | | 0.76 | † | | | 0.76 | † | | | 3.95 | † | | | 1,175,078 | | | | 397 | | |
| 12-31-08 | | | (8.73 | ) | | | 0.76 | | | | 0.75 | † | | | 0.75 | † | | | 4.82 | † | | | 1,153,518 | | | | 666 | | |
| 12-31-07 | | | 5.70 | (b) | | | 0.74 | | | | 0.74 | † | | | 0.74 | † | | | 4.92 | † | | | 1,079,662 | | | | 438 | | |
| 12-31-06 | | | 3.77 | | | | 0.74 | | | | 0.74 | † | | | 0.74 | † | | | 4.69 | † | | | 620,849 | | | | 390 | | |
| 12-31-05 | | | 2.94 | | | | 0.74 | | | | 0.74 | | | | 0.74 | | | | 3.94 | | | | 617,269 | | | | 589 | | |
| 12-31-04 | | | 4.58 | | | | 0.73 | | | | 0.73 | | | | 0.73 | | | | 3.52 | | | | 301,346 | | | | 407 | | |
| Class S2 | |
| 02-27-09(4)-06-30-09 | | | 4.87 | | | | 1.01 | | | | 0.91 | † | | | 0.91 | † | | | 3.75 | † | | | 3 | | | | 397 | | |
| ING Money Market Portfolio(d) | |
| Class I | |
| 06-30-09 | | | 0.20 | | | | 0.36 | | | | 0.36 | | | | 0.36 | | | | 0.41 | | | | 1,583,271 | | | | — | | |
| 12-31-08 | | | 2.67 | | | | 0.35 | | | | 0.35 | | | | 0.35 | | | | 2.66 | | | | 1,798,833 | | | | — | | |
| 12-31-07 | | | 5.13 | | | | 0.33 | | | | 0.33 | | | | 0.33 | | | | 5.03 | | | | 1,711,139 | | | | — | | |
| 12-31-06 | | | 4.88 | | | | 0.34 | | | | 0.34 | | | | 0.34 | | | | 4.79 | | | | 1,355,850 | | | | — | | |
| 12-31-05 | | | 2.98 | | | | 0.35 | | | | 0.35 | | | | 0.35 | | | | 2.93 | | | | 1,073,018 | | | | — | | |
| 12-31-04 | | | 1.06 | | | | 0.34 | | | | 0.34 | | | | 0.34 | | | | 1.11 | | | | 1,101,471 | | | | — | | |
See Accompanying Notes to Financial Statements
18
FINANCIAL HIGHLIGHTS (UNAUDITED) (CONTINUED)
Selected data for a share of beneficial interest outstanding throughout each year or period.
| | | | | Income (loss)
from investment
operations | | | | Less distributions | | | |
| | | Net asset value, beginning of year or period | | Net investment income (loss) | | Net realized and unrealized gain (loss) | | Total from investment operations | | From net investment income | | From net realized gains | | From return of capital | | Total distributions | | Net asset value, end of year or period | |
| | | | | | | | | | | | | | | | | | | | |
| Year or period ended | | ($) | | ($) | | ($) | | ($) | | ($) | | ($) | | ($) | | ($) | | ($) | |
| ING BlackRock Science and Technology Opportunities Portfolio | | | |
| Class ADV | | | |
| 06-30-09 | | | 3.25 | | | | (0.01 | ) | | | 0.61 | | | | 0.60 | | | | — | | | | — | | | | — | | | | — | | | | 3.85 | | |
| 12-16-08(4)-12-31-08 | | | 3.29 | | | | (0.01 | ) | | | (0.03 | ) | | | (0.04 | ) | | | — | | | | — | | | | — | | | | — | | | | 3.25 | | |
| Class I | | | |
| 06-30-09 | | | 3.28 | | | | 0.00 | * | | | 0.62 | | | | 0.62 | | | | — | | | | — | | | | — | | | | — | | | | 3.90 | | |
| 12-31-08 | | | 5.45 | | | | 0.00 | * | | | (2.17 | ) | | | (2.17 | ) | | | — | | | | — | | | | — | | | | — | | | | 3.28 | | |
| 12-31-07 | | | 4.58 | | | | (0.01 | ) | | | 0.88 | | | | 0.87 | | | | — | | | | — | | | | — | | | | — | | | | 5.45 | | |
| 12-31-06 | | | 4.27 | | | | (0.01 | ) | | | 0.32 | | | | 0.31 | | | | — | | | | — | | | | — | | | | — | | | | 4.58 | | |
| 12-31-05 | | | 3.82 | | | | (0.02 | ) | | | 0.47 | | | | 0.45 | | | | — | | | | — | | | | — | | | | — | | | | 4.27 | | |
| 12-31-04 | | | 3.87 | | | | (0.03 | ) | | | (0.02 | ) | | | (0.05 | ) | | | — | | | | — | | | | — | | | | — | | | | 3.82 | | |
| Class S | | | |
| 06-30-09 | | | 3.25 | | | | (0.01 | ) | | | 0.62 | | | | 0.61 | | | | — | | | | — | | | | — | | | | — | | | | 3.86 | | |
| 12-31-08 | | | 5.42 | | | | (0.01 | ) | | | (2.16 | ) | | | (2.17 | ) | | | — | | | | — | | | | — | | | | — | | | | 3.25 | | |
| 12-31-07 | | | 4.56 | | | | (0.02 | ) | | | 0.88 | | | | 0.86 | | | | — | | | | — | | | | — | | | | — | | | | 5.42 | | |
| 12-31-06 | | | 4.27 | | | | (0.02 | ) | | | 0.31 | | | | 0.29 | | | | — | | | | — | | | | — | | | | — | | | | 4.56 | | |
| 07-20-05(5)-12-31-05 | | | 3.90 | | | | (0.01 | ) | | | 0.38 | | | | 0.37 | | | | — | | | | — | | | | — | | | | — | | | | 4.27 | | |
| 01-01-03 -12-16-03(5) | | | 2.65 | | | | (0.07 | ) | | | 1.09 | | | | 1.02 | | | | — | | | | — | | | | — | | | | — | | | | 3.67 | | |
| 12-31-02 | | | 4.53 | | | | (0.04 | ) | | | (1.84 | ) | | | (1.88 | ) | | | — | | | | — | | | | — | | | | — | | | | 2.65 | | |
| Class S2 | | | |
| 02-27-09(4)-06-30-09 | | | 3.01 | | | | 0.00 | *• | | | 0.85 | | | | 0.85 | | | | — | | | | — | | | | — | | | | — | | | | 3.86 | | |
| | | | | Ratios to average net assets | | Supplemental data | |
| | | Total Return(1) | | Expenses before reductions/additions(2)(3) | | Expenses net of fee waivers and/or recoupments, if any(2)(3) | | Expenses net of all reductions/additions(2)(3) | | Net investment income (loss)(2)(3) | | Net assets, end of year or period | | Portfolio turnover rate | |
| | | | | | | | | | | | | | | | |
| Year or period ended | | (%) | | (%) | | (%) | | (%) | | (%) | | ($000's) | | (%) | |
| ING BlackRock Science and Technology Opportunities Portfolio | |
| Class ADV | |
| 06-30-09 | | | 18.46 | | | | 1.60 | | | | 1.56 | | | | 1.56 | | | | (0.47 | ) | | | 4 | | | | 42 | | |
| 12-16-08(4)-12-31-08 | | | (1.22 | ) | | | 1.58 | | | | 1.56 | | | | 1.56 | | | | (2.08 | ) | | | 3 | | | | 137 | | |
| Class I | |
| 06-30-09 | | | 18.90 | | | | 1.10 | | | | 1.06 | | | | 1.06 | | | | 0.01 | | | | 73,898 | | | | 42 | | |
| 12-31-08 | | | (39.82 | ) | | | 1.08 | | | | 1.06 | | | | 1.06 | | | | 0.09 | | | | 55,899 | | | | 137 | | |
| 12-31-07 | | | 19.00 | | | | 1.08 | | | | 1.08 | | | | 1.08 | | | | (0.24 | ) | | | 97,943 | | | | 84 | | |
| 12-31-06 | | | 7.26 | | | | 1.08 | | | | 1.08 | | | | 1.08 | | | | (0.29 | ) | | | 81,599 | | | | 129 | | |
| 12-31-05 | | | 11.78 | | | | 1.06 | | | | 1.06 | | | | 1.06 | | | | (0.48 | ) | | | 84,523 | | | | 118 | | |
| 12-31-04 | | | (1.29 | ) | | | 1.05 | | | | 1.05 | | | | 1.05 | | | | (0.67 | ) | | | 86,291 | | | | 163 | | |
| Class S | |
| 06-30-09 | | | 18.77 | | | | 1.35 | | | | 1.31 | | | | 1.31 | | | | (0.26 | ) | | | 143,842 | | | | 42 | | |
| 12-31-08 | | | (40.04 | ) | | | 1.33 | | | | 1.31 | | | | 1.31 | | | | (0.02 | ) | | | 89,548 | | | | 137 | | |
| 12-31-07 | | | 18.86 | | | | 1.33 | | | | 1.33 | | | | 1.33 | | | | (0.50 | ) | | | 1,140 | | | | 84 | | |
| 12-31-06 | | | 6.79 | | | | 1.33 | | | | 1.33 | | | | 1.33 | | | | (0.51 | ) | | | 551 | | | | 129 | | |
| 07-20-05(5)-12-31-05 | | | 9.49 | | | | 1.31 | | | | 1.31 | | | | 1.31 | | | | (0.73 | ) | | | 78 | | | | 118 | | |
| 01-01-03 -12-16-03(5) | | | 38.49 | | | | 1.35 | | | | 1.35 | | | | 1.36 | | | | (1.13 | ) | | | — | | | | 15 | | |
| 12-31-02 | | | (41.50 | ) | | | 1.36 | | | | 1.36 | | | | 1.37 | | | | (1.14 | ) | | | 7 | | | | 61 | | |
| Class S2 | |
| 02-27-09(4)-06-30-09 | | | 28.24 | | | | 1.60 | | | | 1.46 | | | | 1.46 | | | | (0.36 | ) | | | 4 | | | | 42 | | |
(1) Total return is calculated assuming reinvestment of all dividends and capital gain distributions at net asset value and does not reflect the effect of insurance contract charges. Total return for periods less than one year is not annualized.
(2) Annualized for periods less than one year.
(3) Expense ratios reflect operating expenses of a Portfolio. Expenses before reductions do not reflect amounts reimbursed by the Investment Adviser and/or Distributor or reductions from brokerage commission recapture arrangements or other expense offset arrangements and do not represent the amount paid by a Portfolio during periods when reimbursements or reductions occur. Expenses net of fee waivers reflect expenses after reimbursement by the Investment Adviser and/or Distributor but prior to reductions from brokerage commission recapture arrangements or other expense offset arrangements. Expenses net of all reductions represent the net expenses paid by a Portfolio. Net investment income (loss) is net of all such additions or reductions.
(4) Commencement of operations.
(5) Class S was fully redeemed on December 16, 2003 and recommenced operations on July 20, 2005.
* Amount is less than $0.005 or $500 or more than $(0.005).
• Calculated using average number of shares outstanding throughout the period.
† Impact of waiving the advisory fee for the ING Institutional Prime Money Market Fund holding has less than 0.005% impact on the expense ratio and net investment income or loss ratio (Note 4).
(a) There was no impact on total return by the affiliate payment in Note 15.
(b) There was no impact on total return by the affiliate payment.
(c) In 2005, the Investment Adviser fully reimbursed the Portfolio for a loss incurred from a transaction not meeting a Portfolio's investment's guidelines. There was no impact on total return.
(d) NAV and per share amounts have been restated to reflect the stock split that occurred on October 7, 2008. Effective October 7, 2008, the Portfolio converted to a stable share price of $1.00 per share. In connection with this change, the Portfolio utilized a stock split and distributed additional shares to its shareholders (adjustment factor: 12.926 shares to 1 share) such that each shareholder's proportionate interest and aggregate value of investment in the Portfolio remained the same.
See Accompanying Notes to Financial Statements
19
NOTES TO FINANCIAL STATEMENTS AS OF JUNE 30, 2009 (UNAUDITED)
NOTE 1 — ORGANIZATION
Organization. The ING Variable Product Funds are comprised of ING Balanced Portfolio, Inc., ING Variable Funds, ING Variable Portfolios, Inc., ING Intermediate Bond Portfolio, and ING Money Market Portfolio (collectively, "Registrants"), all of which are open-end investment management companies registered under the Investment Company Act of 1940, as amended ("1940 Act" or "Act").
ING Balanced Portfolio, Inc. is a company incorporated under the laws of Maryland on December 14, 1988 with one portfolio, ING Balanced Portfolio ("Balanced"). ING Variable Funds is a business trust formed under the laws of Massachusetts on January 25, 1984 with one portfolio, ING Growth and Income Portfolio ("Growth and Income"). ING Variable Portfolios, Inc. is a company incorporated under the laws of Maryland on June 4, 1996 and has nineteen separate active portfolios. The four portfolios that are in this report are: ING Opportunistic LargeCap Growth Portfolio ("Opportunistic LargeCap Growth"), ING Small Company Portfolio ("Small Company"), ING Opportunistic LargeCap Portfolio ("Opportunistic LargeCap"), formerly ING Opportunistic LargeCap Value Portfolio and ING BlackRock Science and Technology Opportunities Portfolio ("Science and Technology Opportunities"), formerly ING BlackRock Global Science and Technology Portfolio. ING Intermediat e Bond Portfolio is a business trust formed under the laws of Massachusetts on January 25, 1984 with one portfolio, ING Intermediate Bond Portfolio ("Intermediate Bond"). ING Money Market Portfolio is a business trust formed under the laws of Massachusetts on January 25, 1984 with one portfolio, ING Money Market Portfolio ("Money Market"). Prior to May 1, 2009, Balanced, Growth and Income, Small Company, Intermediate Bond and Money Market contained the "VP" prefix in their name. Each of the portfolios is a "Portfolio" and collectively, they are the "Portfolios".
The following is a brief description of each Portfolio's investment objective:
• Balanced seeks to maximize investment return consistent with reasonable safety of principal, by investing in a diversified portfolio of one or more of the following asset classes: stocks, bonds, and cash equivalents based on the judgment of the Portfolio's management, of which of those sectors or mix thereof offers the best investment prospects;
• Growth and Income seeks to maximize total return through investments in a diversified portfolio of common stocks and securities convertible into common stock;
• Opportunistic LargeCap Growth seeks growth of capital through investment in a diversified portfolio consisting primarily of common stocks and securities convertible into common stock believed to offer growth potential;
• Small Company seeks growth of capital primarily through investment in a diversified portfolio of common stocks and securities of companies with smaller market capitalizations;
• Opportunistic LargeCap seeks growth of capital primarily through investment in a diversified portfolio of common stocks;
• Intermediate Bond seeks to maximize total return consistent with reasonable risk;
• Money Market seeks to provide high current return, consistent with preservation of capital and liquidity, through investment in high-quality money market investments while maintaining a stable share price of $1.00(1); and
• Science and Technology Opportunities seeks long-term capital appreciation.
(1) Effective October 7, 2008, Money Market seeks to maintain a stable share price of $1.00 per share. In connection with this change, the Portfolio utilized a stock split and distributed additional shares to its shareholders such that each shareholder's proportionate interest and aggregate value of investment in the Portfolio remained the same.
Each Portfolio offers Class I and Class S shares. Each Portfolio, except Money Market, offers Adviser ("ADV") Class shares. Each Portfolio, except, Opportunistic LargeCap Growth, Opportunistic LargeCap and Money Market, offers Service 2 Class (Class "S2") shares. The four classes differ principally in applicable distribution and service fees. Shareholders of each class also bear certain expenses that pertain to that particular class. All shareholders bear the common expenses of the Portfolios and earn income and realized gains/losses from the Portfolio pro rata based on the average daily net assets of each class, without discrimination between share classes. Common expenses of the Portfolios (including custodial asset-based fees, legal and audit fees, printing and mailing expenses, transfer agency out-of-pocket expenses, and fees and expenses of the independent directors/trustees) are allocated to each Portfolio in proportion to its average net assets. Expenses directly attributable to a particular Portfolio (including advisory, administration, custodial transaction-based, registration, other professional, distribution and/or service fees, certain taxes, and offering costs) are charged directly to that Portfolio. Differences in per share dividend rates generally result from differences in separate class expenses, including distribution and shareholder service fees, if applicable.
20
NOTES TO FINANCIAL STATEMENTS AS OF JUNE 30, 2009 (UNAUDITED) (CONTINUED)
NOTE 1 — ORGANIZATION (continued)
Shares of the Portfolios may be offered to separate accounts of insurance companies as investment options under variable annuity contracts and variable life insurance policies. Shares may also be offered to qualified pension and retirement plans outside the variable contract and to certain investment advisers and their affiliates. Class I shares may be made available to other investment companies, including series of the companies under fund-of-funds arrangements.
Participating insurance companies and other designated organizations are authorized to receive purchase orders on each Portfolio's behalf.
ING Investments, LLC ("ING Investments'' or the "Investment Adviser"), an Arizona limited liability company, serves as the investment adviser to the Portfolios. ING Investments has engaged ING Investment Management Co. ("ING IM''), a Connecticut corporation, to serve as the sub-adviser to each Portfolio, with the exception of Science and Technology Opportunities. ING Funds Distributor, LLC ("IFD" or the "Distributor") is the principal underwriter of the Portfolios. ING Investments, ING IM and IFD are indirect, wholly-owned subsidiaries of ING Groep N.V. ("ING Groep"). ING Groep is a global financial institution of Dutch origin offering banking, investments, life insurance and retirement services.
On October 19, 2008, ING Groep announced that it reached an agreement with the Dutch government to strengthen its capital position. ING Groep issued non-voting core Tier-1 securities for a total consideration of EUR 10 billion to the Dutch State. The transaction boosts ING Bank's core Tier-1 ratio, strengthens the insurance balance sheet and reduces ING Groep's Debt/Equity ratio.
NOTE 2 — SIGNIFICANT ACCOUNTING POLICIES`
The following significant accounting policies are consistently followed by the Portfolios in the preparation of their financial statements. Such policies are in conformity with U.S. generally accepted accounting principles for investment companies.
A. Security Valuation. Investments in equity securities traded on a national securities exchange are valued at the last reported sale price. Securities reported by NASDAQ are valued at the NASDAQ official closing prices. Securities traded on an exchange or NASDAQ for which there has been no sale and securities traded in the over-the-counter-market are valued at the mean between the last reported bid and ask prices. All investments quoted in foreign currencies are valued daily in U.S. dollars on the basis of the foreign currency exchange rates prevailing at that time. Debt securities acquired with more than 60 days to maturity are fair valued using matrix pricing methods determined by an independent pricing servi ce which takes into consideration such factors as yields, maturities, liquidity, ratings and traded prices in similar or identical securities. Securities for which valuations are not readily available from an independent pricing service may be valued by brokers which use prices provided by market makers or estimates of fair market value obtained from yield data relating to investments or securities with similar characteristics. U.S. government obligations are valued by using market quotations or independent pricing services that use prices provided by market-makers or estimates of market values obtained from yield data relating to instruments or securities with similar characteristics. Investments in open-end mutual funds are valued at net asset value.
Securities and assets for which market quotations are not readily available (which may include certain restricted securities, which are subject to limitations as to their sale) are valued at their fair values, as defined in the 1940 Act, and as determined in good faith by or under the supervision of the Portfolios' Board of Directors/Trustees ("Board"), in accordance with methods that are specifically authorized by the Board. Securities traded on exchanges, including foreign exchanges, which close earlier than the time that a Portfolio calculates its net asset value ("NAV") may also be valued at their fair values as defined by the 1940 Act, and as determined in good faith by or under the supervision of the Board, in accordance with methods that are specifically authorized by the Board. The valuation techniques applied in any specific instance are likely to vary from case to case. With respect to a restricted security, for example, considerat ion is generally given to the cost of the investment, the market value of any unrestricted securities of the same class at the time of valuation, the potential expiration of restrictions on the security, the existence of any registration rights, the costs to the Portfolios related to registration of the security, as well as factors relevant to the issuer itself. Consideration may also be given to the price and extent of any public trading in similar securities of the issuer or comparable companies' securities. The value of a foreign security traded on an exchange outside the United States is generally based on its price on the principal
21
NOTES TO FINANCIAL STATEMENTS AS OF JUNE 30, 2009 (UNAUDITED) (CONTINUED)
NOTE 2 — SIGNIFICANT ACCOUNTING POLICIES (continued)
foreign exchange where it trades as of the time a Portfolio determines its NAV or if the foreign exchange closes prior to the time a Portfolio determines its NAV, the most recent closing price of the foreign security on its principal exchange. Trading in certain non-U.S. securities may not take place on all days on which the New York Stock Exchange ("NYSE") is open. Further, trading takes place in various foreign markets on days on which the NYSE is not open. Consequently, the calculation of a Portfolio's NAV may not take place contemporaneously with the determination of the prices of securities held by a Portfolio in foreign securities markets. Further, the value of a Portfolio's assets may be significantly affected by foreign trading on days when a shareholder cannot purchase or redeem shares of a Portfolio. In calculating a Portfolio's NAV, foreign securities denominated in foreign currency are converted to U.S. dollar equivalents. If an event occurs after the time at which the market for foreign securities held by a Portfolio closes but before the time that a Portfolio's NAV is calculated, such event may cause the closing price on the foreign exchange to not represent a readily available reliable market value quotation for such securities at the time a Portfolio determines its NAV. In such a case, a Portfolio will use the fair value of such securities as determined under a Portfolio's valuation procedures. Events after the close of trading on a foreign market that could require a Portfolio to fair value some or all of its foreign securities include, among others, securities trading in the U.S. and other markets, corporate announcements, natural and other disasters, and political and other events. Among other elements of analysis in the determination of a security's fair value, the Board has authorized the use of one or more independent research services to assist with such determinations. An independent research service may use statistical analyses and quantitative models to help determine fair value as of the time a Portfolio calculates its NAV. There can be no assurance that such models accurately reflect the behavior of the applicable markets or the effect of the behavior of such markets on the fair value of securities, or that such markets will continue to behave in a fashion that is consistent with such models. Unlike the closing price of a security on an exchange, fair value determinations employ elements of judgment. Consequently, the fair value assigned to a security may not represent the actual value that a Portfolio could obtain if it were to sell the security at the time of the close of the NYSE. Pursuant to procedures adopted by the Board, a Portfolio is not obligated to use the fair valuations suggested by any research service, and valuation recommendations provided by such research services may be overridden if other events have occurred or if other fair valu ations are determined in good faith to be more accurate. Unless an event is such that it causes a Portfolio to determine that the closing prices for one or more securities do not represent readily available reliable market value quotations at the time a Portfolio determines its NAV, events that occur between the time of the close of the foreign market on which they are traded and the close of regular trading on the NYSE will not be reflected in a Portfolio's NAV. Investments in securities maturing in 60 days or less from date of acquisition are valued at amortized cost which approximates market value.
Money Market uses the amortized cost method to value its portfolio securities, which approximates market value. The amortized cost method involves valuing a security at its cost and amortizing any discount or premium over the period until maturity, regardless of the impact of fluctuating interest rates or the market value of the security.
Effective for fiscal years beginning after November 15, 2007, Financial Accounting Standards Board ("FASB") Statement of Financial Accounting Standards No. 157, "Fair Value Measurements", establishes a hierarchy for measuring fair value of assets and liabilities. As required by the standard, each investment asset or liability of the Portfolios is assigned a level at measurement date based on the significance and source of the inputs to its valuation. Quoted prices in active markets for identical securities are classified as "Level 1", inputs other than quoted prices for an asset or liability that are observable are classified as "Level 2" and unobservable inputs, including the sub-adviser's judgment about the assumptions that a market participant would use in pricing an asset or liability are classified as "Level 3". The inputs used for valuing securities are not necessarily an indication of the risks associated with investing in those secur ities. A table summarizing each Portfolio's investments under these levels of classification is included following the Portfolios of Investments. For the six months ended June 30, 2009, there have been no significant changes to the fair valuation methodologies.
Effective for fiscal years and interim periods ending after November 15, 2008, the FASB issued
22
NOTES TO FINANCIAL STATEMENTS AS OF JUNE 30, 2009 (UNAUDITED) (CONTINUED)
NOTE 2 — SIGNIFICANT ACCOUNTING POLICIES (continued)
FASB Staff Position ("FSP") No. FAS 133-1 and FASB Interpretation Number ("FIN") 45-4, "Disclosures about Credit Derivatives and Certain Guarantees: An Amendment of FASB Statement No. 133 and FASB Interpretation No. 45; and Clarification of the Effective Date of FASB Statement No. 161." The amendments to FAS 133 require enhanced disclosure regarding credit derivatives sold, including (1) the nature and terms of the credit derivative, reasons for entering into the credit derivative, the events or circumstances that would require the seller to perform under the credit derivative, and the current status of the payment/performance risk of the credit derivative, (2) the maximum potential amount of future payments (undiscounted) the seller could be required to make under the credit derivative, (3) the fair value of the credit derivative, and (4) the nature of any recourse provisions and assets held either as collateral or by third parties. The ame ndments to FIN 45 require additional disclosures about the current status of the payment/performance risk of a guarantee. All changes to accounting policies have been made in accordance with the FSP and incorporated for the current period as part of the Notes to Financial Statements and Portfolio of Investments.
On March 19, 2008, the FASB issued Statement of Financial Accounting Standards No. 161 ("SFAS No. 161"), "Disclosure about Derivative Instruments and Hedging Activities." This new accounting statement requires enhanced disclosures about an entity's derivative and hedging activities. Entities are required to provide enhanced disclosures about (a) how and why an entity invests in derivatives, (b) how derivatives are accounted for under SFAS No. 133, and (c) how derivatives affect an entity's financial position, financial performance, and cash flows. SFAS No. 161 also requires enhanced disclosures regarding credit-risk-related contingent features of derivative instruments. All changes to disclosures have been made in accordance with SFAS 161 and have been incorporated for the current period as part of the Notes to Financial Statements and Portfolio of Investments.
On April 9, 2009, the FASB issued FASB Staff Position No. FAS 157-4, Determining Fair Value When the Volume and Level of Activity for the Asset or Liability Have Significantly Decreased and Identifying Transactions That Are Not Orderly ("FSP 157-4"). FSP 157-4 requires enhanced disclosures about the inputs and valuation technique(s) used to measure fair value and a discussion of changes in valuation techniques and related inputs, if any, during the period. In addition, the three-level hierarchy disclosure and the level three roll-forward disclosure are to be expanded for each major category of equity and debt securities. There was no change to the financial position of the Portfolios and the results of their operations due to the adoption of FSP 157-4 and all disclosures have been made for the current period as part of the Notes to Financial Statements and Portfolio of Investments.
B. Security Transactions and Revenue Recognition. Securities transactions are accounted for on the trade date. Realized gains and losses are reported on the basis of identified cost of securities sold. Interest income is recorded on an accrual basis. Dividend income is recorded on the ex-dividend date, or for certain foreign securities, when the information becomes available to the Portfolios. Premium amortization and discount accretion are determined by the effective yield method.
C. Foreign Currency Translation. The books and records of the Portfolios are maintained in U.S. dollars. Any foreign currency amounts are translated into U.S. dollars on the following basis:
(1) Market value of investment securities, other assets and liabilities — at the exchange rates prevailing at the end of the day.
(2) Purchases and sales of investment securities, income and expenses — at the rates of exchange prevailing on the respective dates of such transactions.
Although the net assets and the market values are presented at the foreign exchange rates at the end of the day, the Portfolios do not isolate the portion of the results of operations resulting from changes in foreign exchange rates on investments from the fluctuations arising from changes in market prices of securities held. Such fluctuations are included with the net realized and unrealized gains or losses from investments. For securities, which are subject to foreign withholding tax upon disposition, liabilities are recorded on the Statements of Assets and Liabilities for the estimated tax withholding based on the securities' current market value. Upon disposition, realized gains or losses on such securities are recorded net of foreign withholding tax.
23
NOTES TO FINANCIAL STATEMENTS AS OF JUNE 30, 2009 (UNAUDITED) (CONTINUED)
NOTE 2 — SIGNIFICANT ACCOUNTING POLICIES (continued)
Reported net realized foreign exchange gains or losses arise from sales of foreign currencies, currency gains or losses realized between the trade and settlement dates on securities transactions, the difference between the amounts of dividends, interest, and foreign withholding taxes recorded on a Portfolio's books, and the U.S. dollar equivalent of the amounts actually received or paid. Net unrealized foreign exchange gains and losses arise from changes in the value of assets and liabilities other than investments in securities at fiscal year end, resulting from changes in the exchange rate. Foreign security and currency transactions may involve certain considerations and risks not typically associated with investing in U.S. companies and U.S. government securities. These risks include, but are not limited to, revaluation of currencies and future adverse political and economic developments, which could cause securities and their markets to be less liquid and prices more volatile than those of comparable U.S. companies and U.S. government securities.
D. Risk Exposures and the use of Derivative Instruments. The Portfolios' investment objectives permit the Portfolios to enter into various types of derivatives contracts, including, but not limited to, futures contracts, forward foreign currency exchange contracts, credit default swaps, interest rate swaps, total return swaps, and purchased and written options. In doing so, a Portfolio will employ strategies in differing combinations to permit it to increase or decrease the level of risk, or change the level or types of exposure to market risk factors. This may allow a Portfolio to pursue its objectives more quickly, and efficiently than if it were to make direct purchases or sales of securities capable of affecting a similar response to market factors.
Market Risk Factors. In pursuit of its investment objectives, a Portfolio may seek to use derivatives to increase or decrease its exposure to the following market risk factors:
Credit Risk. Credit risk relates to the ability of the issuer to meet interest and principal payments, or both, as they come due. In general, lower-grade, higher-yield bonds are subject to credit risk to a greater extent than lower-yield, higher-quality bonds.
Equity Risk. Equity risk relates to the change in value of equity securities as they relate to increases or decreases in the general market.
Foreign Exchange Rate Risk. Foreign exchange rate risk relates to the change in U.S. dollar value of a security held that is denominated in a foreign currency. The U.S. dollar value of a foreign currency denominated security will decrease as the dollar appreciates against the currency, while the U.S. dollar value will increase as the dollar depreciates against the currency.
Interest Rate Risk. Interest rate risk refers to the fluctuations in value of fixed-income securities resulting from the inverse relationship between price and yield. For example, an increase in general interest rates will tend to reduce the market value of already issued fixed-income investments, and a decline in general interest rates will tend to increase their value. In addition, debt securities with longer maturities, which tend to have higher yields, are subject to potentially greater fluctuations in value from changes in interest rates than obligations with shorter maturities.
Risks of Investing in Derivatives. A Portfolio's use of derivatives can result in losses due to unanticipated changes in the market risk factors and the overall market. In instances where a Portfolio is using derivatives to decrease, or hedge, exposures to market risk factors for securities held by a Portfolio, there are also risks that those derivatives may not perform as expected resulting in losses for the combined or hedged positions.
The use of these strategies involves certain special risks, including a possible imperfect correlation, or even no correlation, between price movements of derivative instruments and price movements of related investments. While some strategies involving derivative instruments can reduce the risk of loss, they can also reduce the opportunity for gain or even result in losses by offsetting favorable price movements in related investments or otherwise, due to the possible inability of a Portfolio to purchase or sell a portfolio security at a time that otherwise would be favorable or the possible need to sell a portfolio security at a disadvantageous time because the Portfolio is required to maintain asset coverage or offsetting positions in connection with transactions in derivative instruments. Additional associated risks from investing in derivatives also exist and potentially could have significant effects on the valuation of the derivative and a Portfolio. Associated risks are not the risks that a Portfolio is attempting to increase or decrease exposure to, per their investment objectives, but are the additional risks from investing in derivatives. Examples of
24
NOTES TO FINANCIAL STATEMENTS AS OF JUNE 30, 2009 (UNAUDITED) (CONTINUED)
NOTE 2 — SIGNIFICANT ACCOUNTING POLICIES (continued)
these associated risks are liquidity risk, which is the risk that a Portfolio will not be able to sell the derivative in the open market in a timely manner, and counterparty credit risk, which is the risk that the counterparty will not fulfill its obligation to a Portfolio. Associated risks can be different for each type of derivative and are discussed by each derivative type in the following notes.
Counterparty Credit Risk. Certain derivative positions are subject to counterparty credit risk, which is the risk that the counterparty will not fulfill its obligation to a Portfolio. Each Portfolio's derivative counterparties are financial institutions who are subject to market conditions that may weaken their financial position. A Portfolio intends to enter into financial transactions with counterparties that they believe to be creditworthy at the time of the transaction. To reduce this risk, a Portfolio has entered into master netting arrangements, established within the Portfolios' International Swap and Derivatives Association, Inc. ("ISDA") Master Agreements. These agreements are with select counterparties and they govern transactions, including certain over-the counter derivative and foreign exchange contracts, entered into by a Portfolio and the counterpar ty. The ISDA Master Agreements maintain provisions for general obligations, representations, agreements, collateral, and events of default or termination. The occurrence of a specified event of termination may give a counterparty the right to terminate all of its contracts and affect settlement of all outstanding transactions under the applicable ISDA Master Agreement.
A Portfolio may also enter into collateral agreements with certain counterparties to further mitigate counterparty risk on swaps, OTC derivatives and forward foreign currency contracts. Subject to established minimum levels, collateral is generally determined based on the net aggregate unrealized gain or loss on contracts with a certain counterparty. Collateral pledged to a Portfolio is held in a segregated account by a third-party agent and can be in the form of cash or debt securities issued by the U.S. government or related agencies. At June 30, 2009, Intermediate Bond has pledged $1,130,000 in collateral to various counterparties. The collateral is being held by a third-party agent and is not reflected on the Statement of Assets and Liabilities.
E. Forward Foreign Currency Transactions and Futures Contracts. Certain Portfolios may enter into foreign currency exchange transactions to convert to and from different foreign currencies and to and from the U.S. dollar in connection with the planned purchases or sales of securities. When entering into a forward foreign currency contract, a Portfolio agrees to receive or deliver a fixed quantity of foreign currency for an agreed-upon price on an agreed future date. A Portfolio either enters into these transactions on a spot basis at the spot rate prevailing in th e foreign currency exchange market or uses forward foreign currency contracts to purchase or sell foreign currencies. When the contract is fulfilled or closed, gains or losses are realized. Until then, the gain or loss is included in unrealized appreciation or depreciation. Risks may arise upon entering into forward contracts from the potential inability of counterparties to meet the terms of their forward contracts and from unanticipated movements in the value of foreign currencies relative to the U.S. dollar.
For the six months ended June 30, 2009, Science and Technology Opportunities has entered into forward foreign currency contracts with the obligation to buy and sell specified foreign currencies in the future at a currently negotiated forward rate in order to increase or decrease exposure to foreign exchange rate risk. The Portfolio uses forward foreign currency contracts to enhance potential gain, hedge against anticipated currency exchange rates, gain exposure to foreign currencies and to maintain diversity and liquidity of the portfolio.
For the six months ended June 30, 2009, the total amount of all open forward foreign currency contracts as presented following the Portfolio of Investments is indicative of the volume of this derivative type.
Each Portfolio, with the exception of Money Market, may enter into futures contracts involving foreign currency, interest rates, securities and security indices. A futures contract is a commitment to buy or sell a specific amount of a financial instrument at a negotiated price on a stipulated future date. A Portfolio may buy and sell futures contracts. Futures contracts traded on a commodities or futures exchange will be valued at the final settlement price or official closing price on the principal exchange as reported by such principal exchange at its trading session ending at, or most recently prior to, the time when each Portfolio's assets are valued.
Upon entering into a futures contract, a Portfolio is required to deposit either cash or securities (initial margin) in an amount equal to a certain percentage of the contract value. Subsequent payments (variation margin) are made or received by a Portfolio each day. The variation margin
25
NOTES TO FINANCIAL STATEMENTS AS OF JUNE 30, 2009 (UNAUDITED) (CONTINUED)
NOTE 2 — SIGNIFICANT ACCOUNTING POLICIES (continued)
payments are equal to the daily changes in the contract value and are recorded as unrealized gains and losses. Open futures contracts are reported on a table following each Portfolio's Portfolio of Investments. Securities held in collateralized accounts to cover initial margin requirements on open futures contracts are footnoted in the Portfolio of Investments. Cash collateral held by the broker to cover initial margin requirements on open futures contracts are noted in the Statements of Assets and Liabilities. The net change in unrealized appreciation and depreciation is reported in the Statements of Operations. Realized gains (losses) are reported in the Statements of Operations at the closing or expiration of futures contracts.
Futures contracts are exposed to the market risk factor of the underlying financial instrument. During the six months ended June 30, 2009, Balanced, Growth and Income, and Intermediate Bond have purchased futures contracts on various equity indexes to increase exposure to equity risk. Balanced and Intermediate Bond also purchased futures contracts on various bonds and notes to increase exposure to interest rate risk. In addition, Balanced and Intermediate Bond sold futures contracts on various bonds and notes to decrease exposure to interest rate risk. Additional associated risks of entering into futures contracts include the possibility that there may be an illiquid market where a Portfolio is unable to liquidate the contract or enter into an offsetting position and, if used for hedging purposes, the risk that the price of the contract will correlate imperfectly with the prices of a Portfolio's securities. For the six months ended June 30, 2009, the total amount of all open futures contracts as presented following each Portfolio of Investments is indicative of the volume of this derivative type.
F. Distributions to Shareholders. The Portfolios record distributions to their shareholders on the ex-dividend date. Balanced, Opportunistic LargeCap Growth, Small Company, Opportunistic LargeCap and Science and Technology Opportunities declare and pay dividends annually. Growth and Income and Intermediate Bond, declare and pay dividends semi-annually. Money Market declares dividends daily and pays dividends, if any, monthly. Each Portfolio distributes capital gains, if any, annually. The Portfolios may make distributions on a more frequent basis to comply with the distribution requirements of the Internal Revenue Code. The characteristics of income and gains to be distributed are determined in accordance with i ncome tax regulations, which may differ from U.S. generally accepted accounting principles for investment companies.
G. Federal Income Taxes. It is the policy of the Portfolios to comply with subchapter M of the Internal Revenue Code and related excise tax provisions applicable to regulated investment companies and to distribute substantially all of their net investment income and any net realized capital gains to their shareholders. Therefore, no federal income tax provision is required. Management has considered the sustainability of each Portfolio's tax positions taken on federal income tax returns for all open tax years in making this determination. No capital gain distributions shall be made until any capital loss carryforwards have been fully utilized or expired.
H. Use of Estimates. The preparation of financial statements in conformity with U.S. generally accepted accounting principles requires management to make estimates and assumptions that affect the reported amounts of assets and liabilities and disclosure of contingent assets and liabilities at the date of the financial statements and the reported amounts of increases and decreases in net assets from operations during the reporting period. Actual results could differ from those estimates.
I. Repurchase Agreements. Each Portfolio may invest in repurchase agreements only with government securities dealers recognized by the Board of Governors of the Federal Reserve System. Under such agreements, the seller of the security agrees to repurchase it at a mutually agreed upon time and price. The resale price is in excess of the purchase price and reflects an agreed upon interest rate for the period of time the agreement is outstanding. The period of the repurchase agreements is usually short, from overnight to one week, while the underlying securities generally have longer maturities. Each Portfolio will receive as collateral securities acceptable to it whose market value is equal to at least 100% of the carrying amount of the repurchase agreements, plus accrued interest, be ing invested by the Portfolio. The underlying collateral is valued daily on a mark-to-market basis to assure that the value, including accrued interest is at least equal to the repurchase price. There would be potential loss to the Portfolio in the event the Portfolio is delayed or prevented from exercising its right to dispose of the collateral, and it might incur disposition costs in liquidating the collateral.
26
NOTES TO FINANCIAL STATEMENTS AS OF JUNE 30, 2009 (UNAUDITED) (CONTINUED)
NOTE 2 — SIGNIFICANT ACCOUNTING POLICIES (continued)
J. Securities Lending. Each Portfolio has the option to temporarily loan up to 331/3% of its total assets to brokers, dealers or other financial institutions in exchange for a negotiated lender's fee. The borrower is required to fully collateralize the loans with cash or U.S. government securities. Generally, in the event of counterparty default, a Portfolio has the right to use collateral to offset losses incurred. There would be potential loss to a Portfolio in the event a Por tfolio is delayed or prevented from exercising its right to dispose of the collateral. A Portfolio bears the risk of loss with respect to the investment of collateral. Engaging in securities lending could have a leveraging effect, which may intensify the credit, market and other risks associated with investing in a Portfolio.
K. Illiquid and Restricted Securities. Each Portfolio may not invest more than 15% (10% for Money Market) of its net assets in illiquid securities. Illiquid securities are not readily marketable. Disposing of illiquid investments may involve time-consuming negotiation and legal expenses, and it may be difficult or impossible for the Portfolios to sell them promptly at an acceptable price. The Portfolios may also invest in restricted securities, which include those sold under Rule 144A of the Securities Act of 1933 ("1933 Act") or securities offered pursuant to Section 4(2) of the 1933 Act, and/or are subject to legal or contractual restrictions on resale and may not be publicly sold without registration under the 1933 Act. Certain restricted securities may be considered liquid pursu ant to guidelines approved by the Board or may be deemed to be illiquid because they may not be readily marketable. Illiquid and restricted securities are valued using market quotations when readily available. In the absence of market quotations, the securities are valued based upon their fair value, as defined by the Act, determined under procedures approved by the Board.
L. When-Issued and Delayed-Delivery Transactions. Each Portfolio may purchase or sell securities on a when-issued or forward commitment basis. The price of the underlying securities and date when the securities will be delivered and paid for are fixed at the time the transaction is negotiated. The market value of such is identified in the Portfolio of Investments. Losses may arise due to changes in the market value of the securities or from the inability of counterparties to meet the terms of the contract. In connection with such purchases, the Portfolios are required to hold liquid assets as collateral with the Portfolios' custodian sufficient to cover the purchase price.
M. Mortgage Dollar Roll Transactions. Each Portfolio, except Opportunistic LargeCap Growth and Small Company, may engage in dollar roll transactions with respect to mortgage-backed securities issued by Government National Mortgage Association, Federal National Mortgage Association and Federal Home Loan Mortgage Corp. In a dollar roll transaction, a Portfolio sells a mortgage-backed security to a financial institution, such as a bank or broker/dealer, and simultaneously agrees to repurchase a substantially similar (i.e., same type, coupon, and maturity) security from the institution on a delayed delivery basis at an agreed upon price. The mortgage-backed securities that are repurchased will bear the same interest rate as those sold, but generally will be collateralized by different p ools of mortgages with different prepayment histories. The Portfolios account for dollar roll transactions as purchases and sales.
N. Swap Agreements. Certain Portfolios may enter into swap agreements. A swap is an agreement between two parties pursuant to which each party agrees to make one or more payments to the other at specified future intervals based on the return of an asset (such as a stock, bond or currency) or non-asset reference (such as an interest rate or index). The swap agreement will specify the "notional" amount of the asset or non-asset reference to which the contract relates. Subsequent changes in market value, if any, are calculated based upon changes in the performance of the asset or non-asset reference multiplied by the notional value of the contract. A Portfolio may enter into credit default, interest rate, total return and currency swaps to manage its exposure to credit, currency and in terest rate risk. All outstanding swap agreements are reported following each Portfolio's Portfolio of Investments.
Swaps are marked to market daily using quotations primarily from third party pricing services, counterparties or brokers. The value of the swap contract is recorded on each Portfolio's Statements of Assets or Liabilities. During the term of the swap, changes in the value of the swap, if any, are recorded as unrealized gains or losses on the Statements of Operations. Upfront payments paid or received by a Portfolio when entering into the agreements are reported on the Statements of Assets and Liabilities and as a component of the changes in unrealized gains or losses on the Statements of Operations. These upfront payments represent the amounts paid or received when initially entering into the swap agreement to compensate for differences between the stated
27
NOTES TO FINANCIAL STATEMENTS AS OF JUNE 30, 2009 (UNAUDITED) (CONTINUED)
NOTE 2 — SIGNIFICANT ACCOUNTING POLICIES (continued)
terms of the swap agreement and the prevailing market conditions. The upfront payments are included as a component in the realized gains or losses on each Portfolio's Statement of Operations upon termination or maturity of the swap. A Portfolio also records net periodic payments paid or received on the swap contract as a realized gain or loss on the Statements of Operations.
Entering into swap agreements involves the risk that the maximum potential loss of an investment exceeds the current value of the investment as reported on each Portfolio's Statements of Assets and Liabilities. Other risks involve the possibility that the counterparty to the agreements may default on its obligation to perform, that there will be no liquid market for these investments and that unfavorable changes in the market will have a negative impact on the value of the index or securities underlying the respective swap agreement.
Credit Default Swap Contracts. A credit default swap is a bilateral agreement between counterparties in which the buyer of the protection agrees to make a stream of periodic payments to the seller of protection in exchange for the right to receive a specified return in the event of a default or other credit event for a referenced entity, obligation or index. As a seller of protection on credit default swaps, a Portfolio will generally receive from the buyer a fixed payment stream based on the notional amount of the swap contract. This fixed payment stream will continue until the swap contract expires or a defined credit event occurs.
A Portfolio is subject to credit risk in the normal course of pursuing its investment objectives. As a seller of protection in a credit default swap, a Portfolio may execute these contracts to manage its exposure to the market or certain sectors of the market. Certain Portfolios may also enter into credit default swaps to speculate on changes in an issuer's credit quality, to take advantage of perceived spread advantages, or to offset an existing short equivalent (i.e. buying protection on an equivalent reference entity).
Certain Portfolios may sell credit default swaps which expose these Portfolios to the risk of loss from credit risk- related events specified in the contract. Although contract specific, credit events are generally defined as bankruptcy, failure to pay, restructuring, obligation acceleration, obligation default or repudiation/moratorium. If a Portfolio is a seller of protection, and a credit event occurs, as defined under the terms of that particular swap agreement, a Portfolio will generally either (i) pay to the buyer an amount equal to the notional amount of the swap and take delivery of the referenced obligation, other deliverable obligations, or underlying securities comprising a referenced index or (ii) pay a net settlement amount in the form of cash or securities equal to the notional amount of the swap less the recovery value of the referenced obligation or unde rlying securities comprising a referenced index. If a Portfolio is a buyer of protection and a credit event occurs, as defined under the terms of that particular swap agreement, a Portfolio will either (i) receive from the seller of protection an amount equal to the notional amount of the swap and deliver the referenced obligation, other deliverable obligations or underlying securities comprising the referenced index or (ii) receive a net settlement amount in the form of cash or securities equal to the notional amount of the swap less the recovery value of the referenced obligation or underlying securities comprising the referenced index. Recovery values are assumed by market makers considering either industry standard recovery rates or entity specific factors and considerations until a credit event occurs. If a credit event has occurred, the recovery value is determined by a facilitated auction whereby a minimum number of allowable broker bids, together with a specified valuation method, are used to calcula te the settlement value.
Implied credit spreads, represented in absolute terms, utilized in determining the market value of credit default swap agreements on corporate issues or sovereign issues are disclosed in each Portfolio's Portfolio of Investment and serve as an indicator of the current status of the payment/performance risk and represent the likelihood or risk of default for the credit derivative. The implied credit spread of a particular referenced entity reflects the cost of buying/selling protection and may include upfront payments required to be made to enter into the agreement. For credit default swaps on asset-backed securities or credit indices, the quoted market prices and resulting market values serve as the indicator of the current status of the payment/performance risk. Wider credit spreads and increasing market values, in absolute terms when compared to the notional amount of the swap, represent a deterioration of the referenced entity's credit so undness and a greater likelihood
28
NOTES TO FINANCIAL STATEMENTS AS OF JUNE 30, 2009 (UNAUDITED) (CONTINUED)
NOTE 2 — SIGNIFICANT ACCOUNTING POLICIES (continued)
or risk of default or other credit event occurring as defined under the terms of the agreement.
The maximum amount of future payments (undiscounted) that a Portfolio as seller of protection could be required to make under a credit default swap agreement would be an amount equal to the notional amount of the agreement. Notional amounts of all credit default swap agreements outstanding as of June 30, 2009, for which a Portfolio is seller of protection are disclosed in each Portfolio's Portfolio of Investments. These potential amounts would be partially offset by any recovery values of the respective referenced obligations, upfront payments received upon entering into the agreements, or net amounts received from the settlement of buy protection credit default swap agreements entered into by a Portfolio for the same referenced entity or entities.
For the six months ended June 30, 2009, both Balanced and Intermediate Bond have purchased credit protection through credit default swaps to decrease exposure to the credit risk of individual securities and to hedge against anticipated potential credit events.
For the six months ended June 30, 2009, both Balanced and Intermediate Bond have sold credit protection through credit default swaps to gain exposure to the credit risk of individual securities that are either unavailable or considered to be less attractive in the bond market.
Balanced and Intermediate Bond invest in derivatives only if the expected risks and rewards are consistent with their investment objectives, and overall risk profile as described in the accompanying Notes to Financial Statements. For the six months ended June 30, 2009, the total notional amount of all open swap positions as presented following each Portfolio of Investments is indicative of the volume of this derivative type.
O. Indemnifications. In the normal course of business, the Registrants may enter into contracts that provide certain indemnifications. The Registrants' maximum exposure under these arrangements is dependent on future claims that may be made against the Portfolios and, therefore, cannot be estimated; however, based on experience, the risk of loss from such claims is considered remote.
NOTE 3 — INVESTMENT TRANSACTIONS
For the six months ended June 30, 2009, the cost of purchases and the proceeds from the sales of securities, excluding short-term and U.S. government securities, were as follows:
| | | Purchases | | Sales | |
| Balanced | | $ | 329,576,212 | | | $ | 397,852,039 | | |
| Growth and Income | | | 979,481,665 | | | | 967,903,404 | | |
| Opportunistic LargeCap Growth | | | 50,133,465 | | | | 53,238,350 | | |
| Small Company | | | 351,481,160 | | | | 326,332,461 | | |
| Opportunistic LargeCap | | | 105,971,811 | | | | 110,602,333 | | |
| Intermediate Bond | | | 975,024,878 | | | | 1,201,001,539 | | |
Science and Technology
Opportunities | | | 115,472,734 | | | | 68,217,960 | | |
U.S. government securities not included above were as follows:
| | | Purchases | | Sales | |
| Balanced | | $ | 717,779,017 | | | $ | 689,125,300 | | |
| Intermediate Bond | | | 11,712,045,051 | | | | 11,485,479,031 | | |
NOTE 4 — INVESTMENT MANAGEMENT AND ADMINISTRATIVE FEES
The Portfolios entered into investment management agreements ("Investment Management Agreements") with the Investment Adviser. The Investment Management Agreements compensate the Investment Adviser with a fee, computed daily and payable monthly, based on the average daily net assets of each Portfolio, at the following annual rates:
| Balanced | | | 0.500 | % | |
| Growth and Income | | | 0.500% on first $10 billion;
0.450% on next $5 billion; and
0.425% over $15 billion | | |
| Opportunistic LargeCap Growth | | | 0.600 | % | |
| Small Company | | | 0.750 | % | |
| Opportunistic LargeCap | | | 0.600 | % | |
| Intermediate Bond | | | 0.400 | % | |
| Money Market | | | 0.250 | % | |
Science and Technology
Opportunities | | | 0.950 | % | |
The Investment Adviser entered into sub-advisory agreements with ING IM. ING IM acts as sub-adviser to all Portfolios except for Science and Technology Opportunities. Subject to such policies as the Board or the Investment Adviser may determine, ING IM manages the Portfolios' assets in accordance with the Portfolios' investment objectives, policies, and limitations.
BlackRock Advisors, LLC ("BlackRock"), serves as Sub-Adviser to Science and Technology Opportunities pursuant to a Sub-Advisory Agreement, effective February 2, 2007, between the Investment Adviser and BlackRock.
ING Portfolios are permitted to invest end-of-day cash balances into ING Institutional Prime Money Market
29
NOTES TO FINANCIAL STATEMENTS AS OF JUNE 30, 2009 (UNAUDITED) (CONTINUED)
NOTE 4 — INVESTMENT MANAGEMENT AND ADMINISTRATIVE FEES (continued)
Fund. Investment management fees paid by the Portfolios will be reduced by an amount equal to the management fees paid indirectly to ING Institutional Prime Money Market Fund with respect to assets invested by the Portfolios. For the six months ended June 30, 2009, the Investment Adviser for Balanced, Growth and Income, Opportunistic LargeCap Growth, Small Company, Opportunistic LargeCap and Intermediate Bond waived $7,538, $18,781, $212, $4,733, $167, and $42,972 of such management fees, respectively. These fees are not subject to recoupment.
Pursuant to administration agreements, ING Funds Services, LLC ("IFS"), an indirect, wholly-owned subsidiary of ING Groep, acts as administrator and provides certain administrative and shareholder services necessary for Portfolio operations and is responsible for the supervision of other service providers.
IFS is entitled to receive from each Portfolio a fee at an annual rate of 0.055% on the first $5 billion of daily net assets and 0.03% thereafter.
In placing equity security transactions, each sub-adviser is required to use its best efforts to choose a broker capable of providing brokerage services necessary to obtain the best execution for each transaction. Subject to this requirement, each sub-adviser may allocate equity security transactions through certain designated broker-dealers. Some of these broker-dealers participate in commission recapture programs that have been established for the benefit of the Portfolios. Under these programs, the participating broker-dealers will return to a Portfolio a portion of the brokerage commissions (in the form of a credit to a Portfolio) paid to the broker-dealers to pay certain expenses of a Portfolio. These commission recapture payments benefit the Portfolios and not the sub-adviser. Any amount credited to a Portfolio is recognized as brokerage commission recapture in the Statements of Operations.
NOTE 5 — DISTRIBUTION AND SERVICE FEES
ADV Class and Class S2 shares of the respective Portfolios are subject to a Shareholder Service and Distribution Plan (the "Plan"). Under the Plan, the Distributor is paid an annual shareholder service fee at the rate of 0.25% and an annual distribution fee at the rate of 0.25% of the average daily net assets attributable to its ADV Class and Class S2 shares. The Distributor has contractually agreed to waive a portion of its fee equal to 0.10% of the average daily net assets attributable to the distribution fee paid by Class S2 of the Portfolios, so that the actual fee paid by a Portfolio is an annual rate of 0.15%. The expense waiver will continue through at least May 1, 2010.
Class S shares of the Portfolios have adopted Distribution Plans pursuant to Rule 12b-1 under the 1940 Act (the "12b-1 Plans"), whereby the Distributor is compensated by each Portfolio for expenses incurred in the distribution of each Portfolio's shares ("Distribution Fees"). Pursuant to the 12b-1 Plans, the Distributor is entitled to a payment each month to compensate for expenses incurred in the distribution and promotion of each Portfolio's shares, including expenses incurred in printing prospectuses and reports used for sales purposes, expenses incurred in preparing and printing sales literature and other such distribution related expenses, including any distribution or shareholder servicing fees ("Service Fees") paid to securities dealers who have executed a distribution agreement with the Distributor. Under the 12b-1 Plans, Class S shares of the Portfolios pay the Distributor a fee calculated at an annual rate of 0.25% of average daily net assets.
NOTE 6 — OTHER TRANSACTIONS WITH AFFILIATED AND RELATED PARTIES
At June 30, 2009, the Portfolios had the following amounts recorded in payable to affiliates on the accompanying Statements of Assets and Liabilities (see Notes 4 and 5):
| | | Accrued
Investment
Management
Fees | | Accrued
Administrative
Fees | | Accrued
Shareholder
Service and
Distribution
Fees | | Total | |
| Balanced | | $ | 241,730 | | | $ | 26,717 | | | $ | 1,334 | | | $ | 269,781 | | |
| Growth and Income | | | 839,521 | | | | 92,685 | | | | 59,470 | | | | 991,676 | | |
Opportunistic LargeCap
Growth | | | 34,036 | | | | 3,124 | | | | 1,849 | | | | 39,009 | | |
| Small Company | | | 321,557 | | | | 23,641 | | | | 10,716 | | | | 355,914 | | |
| Opportunistic LargeCap | | | 37,950 | | | | 3,484 | | | | 2,162 | | | | 43,596 | | |
| Intermediate Bond | | | 919,044 | | | | 126,878 | | | | 237,149 | | | | 1,283,071 | | |
| Money Market | | | 331,412 | | | | 72,908 | | | | — | | | | 404,320 | | |
Science and Technology
Opportunities | | | 169,585 | | | | 9,818 | | | | 29,432 | | | | 208,835 | | |
The Registrants have adopted a Deferred Compensation Plan (the "Policy"), which allows eligible non-affiliated directors as described in the Policy to defer the receipt of all or a portion of the directors' fees payable. Deferred fees are invested in various funds advised by ING Investments until distribution in accordance with the Policy.
At June 30, 2009, the following ING Portfolios or indirect, wholly owned subsidiaries of ING Groep owned more than 5% of the following Portfolios:
ING Life Insurance and Annuity Company — Balanced (91.40%); Growth and Income (9.40%); Opportunistic
30
NOTES TO FINANCIAL STATEMENTS AS OF JUNE 30, 2009 (UNAUDITED) (CONTINUED)
NOTE 6 — OTHER TRANSACTIONS WITH AFFILIATED AND RELATED PARTIES (continued)
LargeCap Growth (91.40%); Small Company (41.00%); Opportunistic LargeCap Value (83.80%); Intermediate Bond (32.50%); Money Market (98.10%); and Science and Technology Opportunities (33.10%)
ING LifeStyle Growth Portfolio — Small Company (16.10%)
ING LifeSyle Moderate Growth Portfolio — Intermediate Bond (7.30%)
ING LifeSyle Moderate Portfolio — Intermediate Bond (5.30%)
ING Solution 2025 Portfolio — Small Company (9.20%)
ING USA Annuity and Life Insurance Company — Growth and Income (84.80%); Small Company (10.00%); Opportunistic LargeCap (13.10%); Intermediate Bond (40.30%); and Science and Technology Opportunities (63.90%)
Reliastar Life Insurance Company — Opportunistic LargeCap Growth (6.60%)
Control is defined by the 1940 Act as the beneficial ownership, either directly or through one or more controlled companies, of more than 25% of the voting securities of a company. The 1940 Act defines affiliates as companies that are under common control. Therefore, because the Portfolios have a common owner that owns over 25% of the outstanding securities of the Portfolios, they may be deemed to be affiliates of each other. Investment activities of these shareholders could have a material impact on the Portfolios.
NOTE 7 — EXPENSE LIMITATION AGREEMENTS
ING Investments entered into written expense limitation agreements ("Expense Limitation Agreements") with each of the following Portfolios whereby the Investment Adviser has agreed to limit expenses, excluding interest expense, taxes, brokerage commissions and extraordinary expenses (and acquired fund fees and expenses) to the levels listed below:
| | | Class ADV | | Class I | | Class S | | Class S2 | |
Opportunistic LargeCap
Growth | | | 1.30 | % | | | 0.80 | % | | | 1.05 | % | | n/a | |
| Small Company | | | 1.45 | % | | | 0.95 | % | | | 1.20 | % | | | 1.35 | % | |
| Opportunistic LargeCap | | | 1.30 | % | | | 0.80 | % | | | 1.05 | % | | n/a | |
Science and Technology
Opportunities | | | 1.55 | % | | | 1.05 | % | | | 1.30 | % | | | 1.45 | % | |
The Investment Adviser may at a later date recoup from a Portfolio management fees waived and other expenses assumed by the Investment Adviser during the previous 36 months, but only if, after such recoupment, the Portfolio's expense ratio does not exceed the percentage described above. Waived and reimbursed fees net of any recoupment by the Investment Adviser of such waived and reimbursed fees are reflected on the accompanying Statements of Operations. Amounts payable by the Investment Manager are reflected on the accompanying Statements of Assets and Liabilities for each Portfolio.
As of June 30, 2009, the amount of waived and reimbursed fees that are subject to recoupment by the Investment Adviser, and the related expiration dates are as follows:
| | | June 30, | | | |
| | | 2010 | | 2011 | | 2012 | | Total | |
Science and Technology
Opportunities | | $ | — | | | $ | — | | | $ | 72,286 | | | $ | 72,286 | | |
The Expense Limitation Agreements are contractual and shall renew automatically for one-year terms unless ING Investments provides written notice of the termination of an Expense Limitation Agreement within 90 days of the end of the then current term.
NOTE 8 — LINE OF CREDIT
The Portfolios, in addition to certain other portfolios managed by the Investment Adviser, have entered into an unsecured committed revolving line of credit agreement (the "Credit Agreement") with The Bank of New York Mellon for an aggregate amount of $100,000,000. The proceeds may be used to: (1) temporarily finance the purchase or sale of securities; and (2) finance the redemption of shares of an investor in the Portfolios to which the loan is made. The Portfolios to which the line of credit is available pay a commitment fee equal to 0.125% per annum on the daily unused portion of the committed line amount.
Generally, borrowings under the Credit Agreement accrue interest at the federal funds rate plus a specified margin. Repayments generally must be made within 60 days after the date of a revolving credit advance. The following Portfolios utilized the line of credit during the six months ended June 30, 2009:
| | | Days
Utilized | | Approximate
Average Daily
Balance | | Approximate
Weighted
Average
Interest Rate | |
| Growth and Income | | | 42 | | | $ | 804,762 | | | | 1.17 | % | |
| Intermediate Bond(1) | | | 5 | | | | 9,146,000 | | | | 1.17 | | |
(1) At June 30, 2009, Intermediate Bond had an outstanding balance of $2,430,000.
31
NOTES TO FINANCIAL STATEMENTS AS OF JUNE 30, 2009 (UNAUDITED) (CONTINUED)
NOTE 9 — CAPITAL SHARES
Transactions in capital shares and dollars were as follows:
| | | Shares sold | | Proceeds
from shares
issued
in merger | | Reinvestment
of
distributions | | Shares
redeemed | | Net increase
(decrease)
in shares
outstanding | | Shares sold | | Proceeds
from shares
issued
in merger | | Reinvestment
of
distributions | | Shares
redeemed | | Net increase
(decrease) | |
| Year or period ended | | # | | # | | # | | # | | # | | ($) | | ($) | | ($) | | ($) | | ($) | |
| Balanced | | | |
| Class ADV | | | |
| 06-30-09 | | | — | | | | — | | | | — | | | | (1 | ) | | | (1 | ) | | | — | | | | — | | | | — | | | | (8 | ) | | | (8 | ) | |
| 12-31-08 | | | — | | | | — | | | | — | | | | (1 | ) | | | (1 | ) | | | — | | | | — | | | | — | | | | (12 | ) | | | (12 | ) | |
| Class I | | | |
| 06-30-09 | | | 1,836,674 | | | | — | | | | 3,161,486 | | | | (5,656,562 | ) | | | (658,402 | ) | | | 14,958,327 | | | | — | | | | 27,220,392 | | | | (48,648,111 | ) | | | (6,469,392 | ) | |
| 12-31-08 | | | 354,934 | | | | — | | | | 9,121,937 | | | | (16,235,628 | ) | | | (6,758,757 | ) | | | 3,692,548 | | | | — | | | | 110,649,102 | | | | (185,483,682 | ) | | | (71,142,032 | ) | |
| Class S | | | |
| 06-30-09 | | | 20,550 | | | | — | | | | 33,083 | | | | (59,676 | ) | | | (6,043 | ) | | | 175,093 | | | | — | | | | 283,520 | | | | (509,141 | ) | | | (50,528 | ) | |
| 12-31-08 | | | 125,814 | | | | — | | | | 89,235 | | | | (198,053 | ) | | | 16,996 | | | | 1,479,685 | | | | — | | | | 1,077,072 | | | | (2,287,198 | ) | | | 269,559 | | |
| Class S2 | | | |
| 02-27-09(1) - 06-30-09 | | | 376 | | | | — | | | | — | | | | — | | | | 376 | | | | 3,000 | | | | — | | | | — | | | | — | | | | 3,000 | | |
| Growth and Income | | | |
| Class ADV | | | |
| 06-30-09 | | | 4,745 | | | | — | | | | — | | | | (16,415 | ) | | | (11,670 | ) | | | 69,936 | | | | — | | | | — | | | | (229,205 | ) | | | (159,269 | ) | |
| 12-31-08 | | | 40,306 | | | | — | | | | 792 | | | | (37,703 | ) | | | 3,395 | | | | 848,718 | | | | — | | | | 11,483 | | | | (780,408 | ) | | | 79,793 | | |
| Class I | | | |
| 06-30-09 | | | 8,642,028 | | | | — | | | | — | | | | (8,242,971 | ) | | | 399,057 | | | | 124,511,911 | | | | — | | | | — | | | | (120,375,996 | ) | | | 4,135,915 | | |
| 12-31-08 | | | 11,913,505 | | | | — | | | | 2,316,631 | | | | (19,771,802 | ) | | | (5,541,666 | ) | | | 251,520,863 | | | | — | | | | 33,730,148 | | | | (402,121,000 | ) | | | (116,869,989 | ) | |
| Class S | | | |
| 06-30-09 | | | 167,637 | | | | — | | | | — | | | | (1,848,868 | ) | | | (1,681,231 | ) | | | 2,505,925 | | | | — | | | | — | | | | (26,058,574 | ) | | | (23,552,649 | ) | |
| 12-31-08 | | | 4,145,988 | | | | 16,787,613 | | | | 397,722 | | | | (3,014,524 | ) | | | 18,316,799 | | | | 94,804,530 | | | | 353,711,801 | | | | 5,751,055 | | | | (57,814,407 | ) | | | 396,452,979 | | |
| Class S2 | | | |
| 02-27-09(1) - 06-30-09 | | | 236 | | | | — | | | | — | | | | — | | | | 236 | | | | 3,000 | | | | — | | | | — | | | | — | | | | 3,000 | | |
| Opportunistic LargeCap Growth | | | |
| Class ADV | | | |
| 06-30-09 | | | 14,542 | | | | — | | | | — | | | | (12,856 | ) | | | 1,686 | | | | 99,660 | | | | — | | | | — | | | | (85,962 | ) | | | 13,698 | | |
| 12-31-08 | | | 41,857 | | | | — | | | | — | | | | (68,101 | ) | | | (26,244 | ) | | | 449,026 | | | | — | | | | — | | | | (677,704 | ) | | | (228,678 | ) | |
| Class I | | | |
| 06-30-09 | | | 116,912 | | | | — | | | | 57,009 | | | | (636,671 | ) | | | (462,750 | ) | | | 815,827 | | | | — | | | | 404,193 | | | | (4,387,199 | ) | | | (3,167,179 | ) | |
| 12-31-08 | | | 252,635 | | | | — | | | | 69,368 | | | | (2,727,762 | ) | | | (2,405,759 | ) | | | 2,567,062 | | | | — | | | | 749,873 | | | | (27,428,648 | ) | | | (24,111,713 | ) | |
| Class S | | | |
| 06-30-09 | | | 238,763 | | | | — | | | | 2,607 | | | | (235,521 | ) | | | 5,849 | | | | 1,657,249 | | | | — | | | | 18,353 | | | | (1,597,567 | ) | | | 78,035 | | |
| 12-31-08 | | | 221,013 | | | | — | | | | 4,259 | | | | (907,567 | ) | | | (682,295 | ) | | | 2,090,131 | | | | — | | | | 45,652 | | | | (8,653,583 | ) | | | (6,517,800 | ) | |
| Small Company | | | |
| Class ADV | | | |
| 06-30-09 | | | — | | | | — | | | | — | | | | — | | | | — | | | | — | | | | — | | | | — | | | | — | | | | — | | |
| 12-16-08(1) - 12-31-08 | | | 270 | | | | — | | | | — | | | | — | | | | 270 | | | | 3,000 | | | | — | | | | — | | | | — | | | | 3,000 | | |
| Class I | | | |
| 06-30-09 | | | 5,914,832 | | | | — | | | | 272,837 | | | | (4,090,869 | ) | | | 2,096,800 | | | | 59,677,602 | | | | — | | | | 3,140,406 | | | | (46,459,836 | ) | | | 16,358,172 | | |
| 12-31-08 | | | 9,251,093 | | | | — | | | | 4,962,617 | | | | (9,110,644 | ) | | | 5,103,066 | | | | 147,087,480 | | | | — | | | | 79,699,637 | | | | (145,489,311 | ) | | | 81,297,806 | | |
| Class S | | | |
| 06-30-09 | | | 1,575,337 | | | | — | | | | 29,034 | | | | (973,954 | ) | | | 630,417 | | | | 16,957,834 | | | | — | | | | 330,410 | | | | (10,608,240 | ) | | | 6,680,004 | | |
| 12-31-08 | | | 4,478,420 | | | | — | | | | 25,696 | | | | (785,827 | ) | | | 3,718,289 | | | | 66,404,448 | | | | — | | | | 409,079 | | | | (11,553,473 | ) | | | 55,260,054 | | |
| Class S2 | | | |
| 02-27-09(1) - 06-30-09 | | | 324 | | | | — | | | | — | | | | — | | | | 324 | | | | 3,000 | | | | — | | | | — | | | | — | | | | 3,000 | | |
| Opportunistic LargeCap | | | |
| Class ADV | | | |
| 06-30-09 | | | — | | | | — | | | | — | | | | — | | | | — | | | | — | | | | — | | | | — | | | | — | | | | — | | |
| 12-31-08 | | | — | | | | — | | | | — | | | | (1 | ) | | | (1 | ) | | | — | | | | — | | | | — | | | | (11 | ) | | | (11 | ) | |
| Class I | | | |
| 06-30-09 | | | 97,480 | | | | — | | | | 302,318 | | | | (601,579 | ) | | | (201,781 | ) | | | 761,801 | | | | — | | | | 2,288,544 | | | | (4,532,628 | ) | | | (1,482,283 | ) | |
| 12-31-08 | | | 136,501 | | | | — | | | | 1,629,562 | | | | (2,175,855 | ) | | | (409,792 | ) | | | 1,384,980 | | | | — | | | | 20,255,455 | | | | (25,817,102 | ) | | | (4,176,667 | ) | |
| Class S | | | |
| 06-30-09 | | | 29,797 | | | | — | | | | 42,891 | | | | (144,621 | ) | | | (71,933 | ) | | | 230,504 | | | | — | | | | 323,400 | | | | (1,090,795 | ) | | | (536,891 | ) | |
| 12-31-08 | | | 14,810 | | | | — | | | | 269,654 | | | | (387,908 | ) | | | (103,444 | ) | | | 178,165 | | | | — | | | | 3,330,233 | | | | (4,432,841 | ) | | | (924,443 | ) | |
(1) Commencement of operations.
32
NOTES TO FINANCIAL STATEMENTS AS OF JUNE 30, 2009 (UNAUDITED) (CONTINUED)
NOTE 9 — CAPITAL SHARES (continued)
| | | Shares sold | | Proceeds
from shares
issued
in merger | | Reinvestment
of
distributions | | Shares
redeemed | | Net increase
(decrease)
in shares
outstanding | | Shares sold | | Proceeds
from shares
issued
in merger | | Reinvestment
of
distributions | | Shares
redeemed | | Net increase
(decrease) | |
| Year or period ended | | # | | # | | # | | # | | # | | ($) | | ($) | | ($) | | ($) | | ($) | |
| Intermediate Bond | |
| Class ADV | |
| 06-30-09 | | | — | | | | — | | | | — | | | | (1 | ) | | | (1 | ) | | | — | | | | — | | | | — | | | | (11 | ) | | | (11 | ) | |
| 12-31-08 | | | — | | | | — | | | | — | | | | (1 | ) | | | (1 | ) | | | — | | | | — | | | | — | | | | (12 | ) | | | (12 | ) | |
| Class I | |
| 06-30-09 | | | 12,595,624 | | | | — | | | | 731,736 | | | | (29,111,497 | ) | | | (15,784,137 | ) | | | 138,160,565 | | | | — | | | | 7,990,578 | | | | (316,574,353 | ) | | | (170,423,210 | ) | |
| 12-31-08 | | | 53,358,622 | | | | 2,918,609 | | | | 14,350,541 | | | | (79,274,180 | ) | | | (8,646,408 | ) | | | 686,343,323 | | | | 37,264,333 | | | | 165,967,496 | | | | (993,285,707 | ) | | | (103,710,555 | ) | |
| Class S | |
| 06-30-09 | | | 8,989,876 | | | | — | | | | 245,087 | | | | (9,099,439 | ) | | | 135,524 | | | | 97,858,297 | | | | — | | | | 2,661,647 | | | | (99,227,877 | ) | | | 1,292,067 | | |
| 12-31-08 | | | 32,168,698 | | | | 848,254 | | | | 8,949,716 | | | | (19,339,594 | ) | | | 22,627,074 | | | | 410,405,825 | | | | 10,751,281 | | | | 102,233,412 | | | | (233,459,612 | ) | | | 289,930,906 | | |
| Class S2 | |
| 02-27-09(1) - 06-30-09 | | | 278 | | | | — | | | | — | | | | — | | | | 278 | | | | 3,000 | | | | — | | | | — | | | | — | | | | 3,000 | | |
| Money Market | |
| Class I | |
| 06-30-09 | | | 58,471,183 | | | | — | | | | 3,588,024 | | | | (278,262,395 | ) | | | (216,203,188 | ) | | | 58,471,183 | | | | — | | | | 3,486,834 | | | | (278,262,395 | ) | | | (216,304,378 | ) | |
| 12-31-08 | | | 1,747,332,311 | | | | — | | | | 16,756,212 | | | | (94,879,849 | ) | | | 1,669,208,674 | | | | 384,970,723 | | | | — | | | | 124,653,168 | | | | (346,315,736 | ) | | | 163,308,155 | | |
| Science and Technology Opportunities | |
| Class ADV | |
| 06-30-09 | | | — | | | | — | | | | — | | | | — | | | | — | | | | — | | | | — | | | | — | | | | — | | | | — | | |
| 12-16-08(1) - 12-31-08 | | | 912 | | | | — | | | | — | | | | — | | | | 912 | | | | 3,000 | | | | — | | | | — | | | | — | | | | 3,000 | | |
| Class I | |
| 06-30-09 | | | 2,634,294 | | | | — | | | | — | | | | (720,976 | ) | | | 1,913,318 | | | | 9,265,952 | | | | — | | | | — | | | | (2,448,135 | ) | | | 6,817,817 | | |
| 12-31-08 | | | 3,072,997 | | | | — | | | | — | | | | (3,991,670 | ) | | | (918,673 | ) | | | 14,071,302 | | | | — | | | | — | | | | (18,237,345 | ) | | | (4,166,043 | ) | |
| Class S | |
| 06-30-09 | | | 14,346,033 | | | | — | | | | — | | | | (4,622,865 | ) | | | 9,723,168 | | | | 49,591,029 | | | | — | | | | — | | | | (15,269,729 | ) | | | 34,321,300 | | |
| 12-31-08 | | | 8,356,135 | | | | 24,911,193 | | | | — | | | | (5,950,375 | ) | | | 27,316,953 | | | | 38,376,474 | | | | 123,216,459 | | | | — | | | | (23,407,370 | ) | | | 138,185,563 | | |
| Class S2 | |
| 02-27-09(1)-06-30-09 | | | 998 | | | | — | | | | — | | | | (1 | ) | | | 997 | | | | 3,003 | | | | — | | | | — | | | | (3 | ) | | | 3,000 | | |
(1) Commencement of operations.
NOTE 10 — ILLIQUID SECURITIES
Pursuant to guidelines adopted by the Board, the following securities have been deemed to be illiquid. Each Portfolio currently limits investment in illiquid securities to 15% (10% for Money Market) of the Portfolio's net assets, at market value, at time of purchase.
| | | Security | | Principal
Amount/
Shares | | Initial
Acquision
Date | | Cost | | Value | | Percent
of Net
Assets | |
| Balanced | | Greater Ohio Ethanol, LLC,
12.630%, due 12/31/13 | | | 700,000 | | | 11/21/06 | | $ | 683,243 | | | $ | — | | | | 0.0 | % | |
| | | Greater Ohio Ethanol, LLC,
6.301%, due 12/31/13 | | | 600,000 | | | 11/21/06 | | | 597,758 | | | | — | | | | 0.0 | % | |
| | | PEA Lima, LLC,
0.000%, due 03/20/14 | | | 92,655 | | | 03/20/09 | | | 5,226 | | | | 9 | | | | 0.0 | % | |
| | | | | | | | | | | $ | 1,286,227 | | | $ | 9 | | | | 0.0 | % | |
| Growth and Income | | Seagate Technology, Inc. - Escrow | | | 2,600 | | | 05/09/02 | | $ | — | | | $ | — | | | | 0.0 | % | |
| | | | | | | | | | | $ | — | | | $ | — | | | | 0.0 | % | |
| Intermediate Bond | | Greater Ohio Ethanol, LLC,
6.301%, due 12/31/13 | | | 4,000,000 | | | 11/21/06 | | $ | 3,985,331 | | | $ | — | | | | 0.0 | % | |
| | | Greater Ohio Ethanol, LLC,
12.630%, due 12/31/13 | | | 4,900,000 | | | 11/21/06 | | | 4,850,115 | | | | — | | | | 0.0 | % | |
| | | PEA Lima, LLC,
0.000%, due 03/20/14 | | | 617,699 | | | 03/20/09 | | | 34,843 | | | | 62 | | | | 0.0 | % | |
| | | | | | | | | | | $ | 8,870,289 | | | $ | 62 | | | | 0.0 | % | |
33
NOTES TO FINANCIAL STATEMENTS AS OF JUNE 30, 2009 (UNAUDITED) (CONTINUED)
NOTE 11 — SECURITIES LENDING
Under an agreement with The Bank of New York Mellon ("BNY"), the Portfolios can lend their securities to approved brokers, dealers and other financial institutions. Loans are collateralized by cash and U.S. government securities. The collateral is equal to at least 105% of the market value of non-U.S. securities loaned and 102% of the market value of U.S. securities. The market value of the loaned securities is determined at the close of business of the Portfolios at their last sale price or official closing price on the principal exchange or system on which they are traded and any additional collateral is delivered to the Portfolios on the next business day. The cash collateral received is invested in approved investments as defined in the Securities Lending Agreement with BNY (the "Agreement"). The Portfolios bear the risk of loss with respect to the investment of collateral. Currently, the cash collateral is invested in the Bank of New Yo rk Mellon Corp. Institutional Cash Reserves Fund ("BICR Fund"). BNY serves as investment manager, custodian and operational trustee of the BICR Fund. As of June 30, 2009, and throughout the period covered by this report, the BICR Fund held certain defaulted securities that had market values significantly below amortized cost. The Portfolios agreed to the terms of capital support extended by The Bank of New York Mellon Corporation ("BNYC"), an affiliated company of BNY, for the certain defaulted securities held by the BICR Fund. BNYC will support the value of these securities up to a certain amount and subject, in part, to the Portfolios' continued lending of securities. The recorded value of each Portfolio's investment in the BICR Fund includes the value of the underlying securities held by the BICR Fund and the estimated value of the support to be provided by BNYC. The investment in the BICR Fund is included in the Portfolio of Investments under Securities Lending Collateral and the unrealized loss on such investment is included in Net Unrealized Depreciation on the Statements of Assets and Liabilities.
Generally, in the event of counterparty default, the Portfolios have the right to use the collateral to offset losses incurred. The Agreement contains certain guarantees by BNY in the event of counterparty default and/or a borrower's failure to return a loaned security; however, there would be a potential loss to the Portfolios in the event the Portfolios are delayed or prevented from exercising their right to dispose of the collateral. Engaging in securities lending could have a leveraging effect, which may intensify the credit, market and other risks associated with investing in a Portfolio. At June 30, 2009, the following Portfolios had securities on loan with the following market values:
| | | Value of
Securities
Loaned | | Cash
Collateral
Received* | |
| Balanced | | $ | 48,022,737 | | | $ | 49,131,766 | | |
| Growth and Income | | | 27,102,777 | | | | 28,561,378 | | |
| Opportunistic LargeCap Growth | | | 1,757,806 | | | | 1,833,148 | | |
| Small Company | | | 30,577,132 | | | | 31,619,673 | | |
| Opportunistic LargeCap | | | 1,108,732 | | | | 1,148,804 | | |
| Intermediate Bond | | | 522,237,271 | | | | 533,761,298 | | |
| Money Market | | | 1,058,427 | | | | 1,077,010 | | |
Science and Technology
Opportunities | | | 6,919,949 | | | | 7,315,890 | | |
* Cash collateral received was invested in the BICR Fund, the fair value of which is presented in the respective Portfolio's Portfolio of Investments.
NOTE 12 — CONCENTRATION OF INVESTMENT RISKS
Concentration (Science and Technology Opportunities). The Portfolio concentrates (for purposes of the 1940 Act) its assets in securities related to a particular industry, which means that at least 25% of its assets will be invested in that particular industry at all times. As a result, the Portfolio may be subject to greater market fluctuation than a portfolio which has securities representing a broader range of investment alternatives.
Foreign Securities (All Portfolios). Investments in foreign securities may entail risks not present in domestic investments. Since securities in which the Portfolios may invest are denominated in foreign currencies, changes in the relationship of these foreign currencies to the U.S. dollar can significantly affect the value of the investments and earnings of the Portfolios. Foreign investments may also subject the Portfolios to foreign government exchange restrictions, expropriation, taxation or other political, social or economic developments, as well as changes vis-a-vis the U.S. dollar from movements in currency, and changes in security value and interest rate, all of which could affect the market and/or credit risk of the Portfolios' investments.
Emerging Markets Investments (Intermediate Bond and Science and Technology Opportunities). Because of less developed markets and economies and, in some countries, less mature governments and governmental institutions, the risks of investing in foreign securities can be intensified in the case of investments in issuers domiciled or doing substantial business in emerging market countries.
Derivatives (All Portfolios except Opportunistic LargeCap and Money Market). Generally, derivatives can be characterized as financial instruments whose performance is derived, at least in part, from the performance of an underlying asset or assets. Some derivatives are sophisticated instruments that typically
34
NOTES TO FINANCIAL STATEMENTS AS OF JUNE 30, 2009 (UNAUDITED) (CONTINUED)
NOTE 12 — CONCENTRATION OF INVESTMENT RISKS (continued)
involve a small investment of cash relative to the magnitude of risks assumed. These may include swap agreements, options, forwards and futures. Derivative securities are subject to market risk which could be significant for those that have a leveraging effect. Derivatives are also subject to credit risks related to the counterparty's ability to perform and any deterioration in the counterparty's creditworthiness could adversely affect the instrument. In addition, derivatives and their underlying securities may experience periods of illiquidity which could cause a Portfolio to hold a security it might otherwise sell or could force the sale of a security at inopportune times or for prices that do not reflect current market value. A risk of using derivatives is that a Portfolio's adviser or sub-adviser might imperfectly judge the market's direction.
Corporate Debt Securities (Balanced and Intermediate Bond). Corporate debt securities are subject to the risk of the issuer's inability to meet principal and interest payment on the obligation and may also be subject to price volatility due to such factors as interest rate sensitivity, market perception of the creditworthiness of the issue and general market liquidity. When interest rates decline, the value of the Portfolio's debt securities can be expected to rise, and when interest rates rise, the value of those securities can be expected to decline. Debt securities with longer maturities tend to be more sensitive to interest rate movements than those with shorter maturities.
During the year ended December 31, 2008, Lehman Brothers Holdings, Inc. (LBHI) and certain of its affiliates sought protection under the insolvency laws of their jurisdictions of organization, including the United States, the United Kingdom and Japan. During that period, Balanced and Intermediate Bond had outstanding securities trades with counterparties affiliated with LBHI. As a result of these events, LBHI's affiliates were unable to fulfill their commitments and, in certain cases, Balanced and Intermediate Bond terminated their trades and related agreements with the relevant entities and, where appropriate, are in the process of initiating claims for damages. Management has determined that the financial impact to the Portfolios relating to these events is immaterial.
NOTE 13 — FEDERAL INCOME TAXES
The amount of distributions from net investment income and net realized capital gains are determined in accordance with federal income tax regulations, which may differ from U.S. generally accepted accounting principles for investment companies. These book/tax differences may be either temporary or permanent. Permanent differences are reclassified within the capital accounts based on their federal tax-basis treatment; temporary differences are not reclassified. Key differences include the treatment of short-term capital gains, foreign currency transactions, and wash sale deferrals. Distributions in excess of net investment income and/or net realized capital gains for tax purposes are reported as return of capital.
Dividends paid by the Portfolios from net investment income and distributions of net realized short-term capital gains are, for federal income tax purposes, taxable as ordinary income to shareholders.
The tax composition of dividends and distributions to shareholders was as follows:
| | | Six Months Ended June 30, 2009 | | Year Ended December 31, 2008 | |
| | | Ordinary
Income | | Ordinary
Income | | Long-Term
Capital Gains | |
| Balanced | | $ | 27,504,098 | | | $ | 60,981,872 | | | $ | 50,744,407 | | |
| Growth and Income | | | — | | | | 39,517,165 | | | | — | | |
| Opportunistic Large Cap Growth | | | 422,546 | | | | 795,525 | | | | — | | |
| Small Company | | | 3,470,816 | | | | 5,865,236 | | | | 74,243,480 | | |
| Opportunistic Large Cap | | | 2,611,957 | | | | 2,609,792 | | | | 20,976,051 | | |
| Intermediate Bond | | | 10,654,341 | | | | 268,240,664 | | | | — | | |
| Money Market | | | 3,486,834 | | | | 124,653,168 | | | | — | | |
The tax-basis components of distributable earnings and the expiration dates of the capital loss carryforwards which may be used to offset future realized capital gains for federal income tax purposes as of December 31, 2008 were:
| | | Undistributed
Ordinary
Income | | Unrealized
Appreciation/
(Depreciation) | | Post-October
Capital Loss
Deferred | | Capital Loss
Carryforwards | | Expiration
Dates | |
| Balanced | | $ | 27,501,921 | | | $ | (144,712,701 | ) | | $ | — | | | $ | (574,085 | ) | | | 2009 | | |
| | | | | | | | | | (134,169,975 | ) | | | 2016 | | |
| | | | | | | | | $ | (134,744,060 | )* | | | | | |
| Growth and Income | | | — | | | | (307,525,947 | ) | | | (121,332,257 | ) | | | (1,745,504,149 | ) | | | 2009 | | |
| | | | | | | | | | (63,082,574 | ) | | | 2010 | | |
| | | | | | | | | | (48,933,227 | ) | | | 2015 | | |
| | | | | | | | | | (454,661,688 | ) | | | 2016 | | |
| | | | | | | | | $ | (2,312,181,638 | )* | | | | | |
35
NOTES TO FINANCIAL STATEMENTS AS OF JUNE 30, 2009 (UNAUDITED) (CONTINUED)
NOTE 13 — FEDERAL INCOME TAXES (continued)
| | | Undistributed
Ordinary
Income | | Unrealized
Appreciation/
(Depreciation) | | Post-October
Capital Loss
Deferred | | Capital Loss
Carryforwards | | Expiration
Dates | |
| Opportunistic Large Cap Growth | | $ | 421,521 | | | $ | (13,379,890 | ) | | $ | — | | | $ | (71,685,369 | ) | | | 2009 | | |
| | | | | | | | | | | | | | | | (65,982,870 | ) | | | 2010 | | |
| | | | | | | | | | | | | | | | (1,529,437 | ) | | | 2011 | | |
| | | | | | | | | | | | | | | | (42,028,267 | ) | | | 2016 | | |
| | | | | | | | | | | | | | | $ | (181,225,943 | )* | | | | | |
| Small Company | | | 3,469,382 | | | | (137,432,190 | ) | | | — | | | | (52,676,115 | ) | | | 2016 | | |
| Opportunistic Large Cap | | | 2,610,842 | | | | (19,977,868 | ) | | | — | | | | (29,296,914 | ) | | | 2016 | | |
| Intermediate Bond | | | 10,648,573 | | | | (441,758,355 | ) | | | (155,718,209 | ) | | | — | | | | — | | |
| Money Market | | | — | | | | (149,401 | ) | | | — | | | | (1,860,826 | ) | | | 2009 | | |
| | | | | | | | | | | | | | | | (169 | ) | | | 2011 | | |
| | | | | | | | | | | | | | | | (244,520 | ) | | | 2012 | | |
| | | | | | | | | | | | | | | $ | (2,105,515 | ) | | | | | |
| Science and Technology Opportunities | | | — | | | | (59,100,007 | ) | | | — | | | | (6,713,564 | ) | | | 2009 | | |
| | | | | | | | | | | | | | | | (3,997,473 | ) | | | 2010 | | |
| | | | | | | | | | | | | | | | (3,997,473 | ) | | | 2011 | | |
| | | | | | | | | | | | | | | | (4,991,402 | ) | | | 2015 | | |
| | | | | | | | | | | | | | | | (13,211,790 | ) | | | 2016 | | |
| | | | | | | | | | | | | | | $ | (32,911,702 | )* | | | | | |
* Utilization of these capital losses is subject to annual limitations under Section 382 of the Internal Revenue Code. Amounts and years of expiration may be adjusted to reflect future gain/loss activity to comply with the limitation rules.
The Portfolios' major tax jurisdictions are federal, Arizona, and Massachusetts. The earliest tax year that remains subject to examination by these jurisdictions is 2004.
As of June 30, 2009, no provisions for income tax would be required in the Portfolios' financial statements as a result of tax positions taken on federal income tax returns for open tax years. The Portfolios' federal and state income and federal excise tax returns for tax years for which the applicable statutes of limitations have not expired are subject to examination by the Internal Revenue Service and state department of revenue.
NOTE 14 — REORGANIZATIONS
On September 8, 2008, Growth and Income, as listed below ("Acquiring Portfolio"), acquired the assets and certain liabilities of ING Capital Guardian U.S. Equities Portfolio, also listed below ("Acquired Portfolio"), in a tax-free reorganization in exchange for shares of the Acquiring Portfolio, pursuant to a plan of reorganization approved by the Acquired Portfolio's shareholders. The number and value of shares issued by the Acquiring Portfolio are presented in Note 9 — Capital Shares. Net assets and unrealized depreciation as of the reorganization date were as follows:
Acquiring
Portfolio | | Acquired
Portfolio | | Total
Net Assets of
Acquired
Portfolio (000's) | | Total
Net Assets of
Acquiring
Portfolio (000's) | | Acquired
Capital Loss
Carryforwards
(000's) | | Acquired Portfolio
Unrealized
Appreciation (000's) | | Conversion
Ratio | |
| Growth and | | ING Capital Guardian | | | | | | | | | | | | | | | | | | |
| | |
| Income | | U.S. Equities Portfolio | | $ | 353,712 | | | $ | 2,384,341 | | | $ | (48,933 | ) | | $ | 6,331 | | | | 0.35 | | |
The net assets of Growth and Income after the acquisition were $2,738,052,537.
On April 28, 2008, Science and Technology Opportunities and Intermediate Bond, as listed below ("Acquiring Portfolios"), acquired the assets and certain liabilities of ING Global Technology Portfolio and ING Lord Abbett U.S. Government Securities Portfolio, also listed below ("Acquired Portfolios"), respectively, in a tax-free reorganization in exchange for shares of each Acquiring Portfolio, pursuant to a plan of reorganization approved by each Acquired
36
NOTES TO FINANCIAL STATEMENTS AS OF JUNE 30, 2009 (UNAUDITED) (CONTINUED)
NOTE 14 — REORGANIZATIONS (continued)
Portfolio's shareholders. The number and value of shares issued by each Acquiring Portfolio are presented in Note 9 — Capital Shares. Net assets and unrealized depreciation as of the reorganization date were as follows:
Acquiring
Portfolios | | Acquired
Portfolio | | Total
Net Assets of
Acquired
Portfolio (000's) | | Total
Net Assets of
Acquiring
Portfolio (000's) | | Acquired
Capital Loss
Carryforwards
(000's) | | Acquired Portfolio
Unrealized
Depreciation (000's) | | Conversion
Ratio | |
| Science and | | ING Global | | | | | | | | | | | |
| Technology | | Technology | | | | | | | | | |
| |
| Opportunities | | Portfolio | | $ | 123,216 | | | $ | 87,851 | | | $ | (4,991 | ) | | $ | (128 | ) | | | 1.30 | | |
Intermediate
Bond | | ING Lord Abbett U.S
Government Securities
Portfolio | | | 48,016 | | | | 3,557,999 | | | | — | | | | — | | | | 0.77 | | |
The net assets of Science and Technology Opportunities and Intermediate Bond after the acquisitions were $211,067,879 and $3,606,015,157, respectively.
NOTE 15 — INFORMATION REGARDING TRADING OF ING'S U.S. MUTUAL FUNDS
As discussed in earlier supplements that were previously filed with the SEC, ING agreed with the Portfolios to indemnify and hold harmless the Portfolios from all damages resulting from wrongful conduct by ING or its employees or from ING's internal investigation, any investigations conducted by any governmental or self-regulatory agencies, litigation or other formal proceedings, including any proceedings by the U.S. Securities and Exchange Commission in connection with investigations related to mutual funds and variable insurance products. In December 2008, ING settled its indemnification commitments by making payments to the affected Portfolios. In connection with the settlement, ING paid $2,198 to Growth and Income, and $22,573 to Opportunistic LargeCap.
NOTE 16 — LITIGATION
On December 12, 2003, Aeltus Investment Management, Inc. (now known as ING Investment Management Co.)( "IIM" ) received a copy of a complaint (the "Complaint") filed in the United States Bankruptcy Court for the Southern District of New York in the matter of Enron Corp. v. Mass Mutual Life Insurance Co., et al. Among other defendants named in the Complaint are defendants ING VP Balanced Portfolio Inc. and ING VP Bond Portfolio (the "Subject Portfolios"). As of August 6, 2004, the ING VP Bond Portfolio changed its name to the ING VP Intermediate Bond Portfolio. As of May 1, 2009, the ING VP Intermediate Bond Portfolio and the ING VP Balanced Portfolio changed their names to ING Intermediate Bond Portfolio and ING Balanced Portfolio, respectively. The Complaint alleges that Enron Corp. ("Enron") transf erred to the defendants, including the Subject Portfolios, over $1 billion in the aggregate for the purpose of prepaying certain commercial paper issued by Enron (the "Notes") and held by the defendants prior to the filing by Enron for bankruptcy protection under Chapter 11 of Title 11 of the Bankruptcy Code (the "Bankruptcy Code").
The Complaint seeks to recover from the defendants including the Subject Portfolios, these transfers under the alternative but interrelated bankruptcy theories of preferential transfer and fraudulent conveyance. Although the Complaint does not specify the amount of each transfer in dispute, it appears that the sale of ING VP Balanced Portfolio, Inc. of $23,181,757 of the Notes on or about October 29, 2001, and the sale by ING VP Bond Portfolio of $24,963,125 of the Notes on or about October 29, 2001 are in dispute. The Complaint seeks to require the Subject Portfolios to repay to Enron the full amount of these transfers, in which event the Subject Portfolios would be granted unsecured claims against the Enron bankruptcy estate in the amounts of the repayments. If Enron proves up the elements of preferential transfer and/or fraudulent conveyance, these are strict liability theories of recovery.
The Subject Portfolios are part of a defense group of similarly-situated defendants. Along with those and other defendants, the Subject Portfolios moved to dismiss all counts of the Complaint, contending, among other things, that section 546(e) of the Bankruptcy Code provides a complete defense.
The bankruptcy court denied the motion on July 1, 2005. Accordingly, the Subject Portfolios filed an answer to the Complaint on July 29, 2005. The Subject Portfolios moved for leave to pursue an immediate appeal (the "Appeal") of the bankruptcy court's decision to the district court.
On April 4, 2006, the Securities and Exchange Commission filed a memorandum in support of the
37
NOTES TO FINANCIAL STATEMENTS AS OF JUNE 30, 2009 (UNAUDITED) (CONTINUED)
NOTE 16 — LITIGATION (continued)
Subject Portfolio's motion for leave with the U.S. District Court. In addition, the U.S. Attorney's office, on behalf of the United States of America and the Department of Treasury as well as the Federal Reserve Board has each filed statements of interest in support of the Appeal.
On January 25, 2008, the United States District Court of Southern New York denied the motion for leave to appeal the bankruptcy court's denial of the Subject Portfolios' motion to dismiss. The court found there were questions of fact that still needed to be resolved.
On April 29, 2008, IIM and the Funds joined a plenary motion for summary judgment filed by Goldman Sachs. In addition, a separate brief was filed on behalf of IIM asserting the defenses unique to the investment advisor defendants; that they were merely conduits. On April 7, 2009, the court heard oral arguments on the motions for summary judgment. The SEC intervened in the action and argued in favor of the defendants on the grounds that a decision against ING Funds would have a negative impact on the financial markets.
On June 29, 2009, the court ruled on the motion for summary judgment and held that the pre-payments made were not protected from avoidance by section 546(e) of the Bankruptcy Code and denied the summary judgment to the Funds; however, the court did grant the summary judgment to dismiss IIM. As a result the Funds will be bearing the full cost of the continuing litigation. Management is discussing next steps with bankruptcy counsel and Fund counsel. Currently, the most promising approach appears to be an appeal or a trial in the district court.
NOTE 17 — SUBSEQUENT EVENTS
Dividends. Subsequent to June 30, 2009, the following Portfolios declared dividends of:
| | | Type | | Per Share
Amount | | Payable Date | | Record Date | |
Opportunistic
LargeCap
Growth | |
| Class ADV | | NII | | $ | 0.0035 | | | August 6, 2009 | | August 4, 2009 | |
| Class I | | NII | | | 0.0234 | | | August 6, 2009 | | August 4, 2009 | |
| Class S | | NII | | | 0.0126 | | | August 6, 2009 | | August 4, 2009 | |
| Money Market | |
| Class I | | NII | | | 0.0002 | | | 8/3/09 | | Daily | |
NII — Net investment income
The Board approved a proposal to reorganize Opportunistic LargeCap Growth into Opportunistic LargeCap. Shareholder approval was obtained and the reorganization closed on August 7, 2009.
The Portfolios have evaluated events occurring after the balance sheet date (subsequent events) through August 26, 2009, the date the financial statements were available to be issued, to determine whether any subsequent events necessitated adjustment to or disclosure in the financial statements. Other than the above, no such subsequent events were identified.
38
PORTFOLIO OF INVESTMENTS
ING BALANCED PORTFOLIO AS OF JUNE 30, 2009 (UNAUDITED)
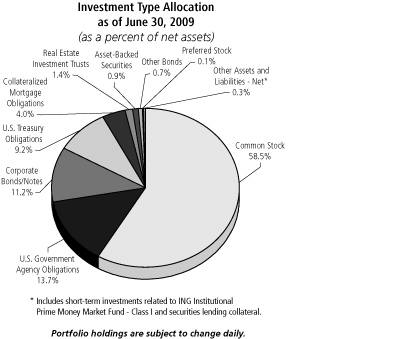
| Shares | | | | | | Value | |
| COMMON STOCK: 58.5% | | | |
| | | | | Advertising: 0.4% | |
| | 13,127 | | | | | Harte-Hanks, Inc. | | $ | 121,425 | | |
| | 146,370 | | | @ | | Interpublic Group of Cos., Inc. | | | 739,169 | | |
| | 2,905 | | | @ | | inVentiv Health, Inc. | | | 39,305 | | |
| | 36,439 | | | | | Omnicom Group | | | 1,150,744 | | |
| | | | 2,050,643 | | |
| | | | | Aerospace/Defense: 2.4% | |
| | 1,864 | | | @ | | AAR Corp. | | | 29,917 | | |
| | 1,056 | | | @ | | Aerovironment, Inc. | | | 32,588 | | |
| | 3,294 | | | @ | | Alliant Techsystems, Inc. | | | 271,294 | | |
| | 1,729 | | | @ | | BE Aerospace, Inc. | | | 24,828 | | |
| | 4,100 | | | | | Cubic Corp. | | | 146,739 | | |
| | 1,970 | | | | | Curtiss-Wright Corp. | | | 58,568 | | |
| | 1,290 | | | @ | | Esterline Technologies Corp. | | | 34,920 | | |
| | 22,467 | | | | | General Dynamics Corp. | | | 1,244,447 | | |
| | 18,974 | | | | | Goodrich Corp. | | | 948,131 | | |
| | 22,700 | | | | | L-3 Communications
Holdings, Inc. | | | 1,574,926 | | |
| | 35,201 | | | | | Lockheed Martin Corp. | | | 2,838,961 | | |
| | 1,438 | | | @ | | Moog, Inc. | | | 37,115 | | |
| | 1,058 | | | | | National Presto Industries, Inc. | | | 80,514 | | |
| | 51,430 | | | | | Northrop Grumman Corp. | | | 2,349,322 | | |
| | 4,064 | | | @ | | Orbital Sciences Corp. | | | 61,651 | | |
| | 43,650 | | | | | Raytheon Co. | | | 1,939,370 | | |
| | 1,700 | | | @ | | Teledyne Technologies, Inc. | | | 55,675 | | |
| | 1,032 | | | | | Triumph Group, Inc. | | | 41,280 | | |
| | 49,156 | | | | | United Technologies Corp. | | | 2,554,146 | | |
| | | | 14,324,392 | | |
| Shares | | | | | | Value | |
| | | | | Agriculture: 1.2% | |
| | 11,050 | | | @ | | Alliance One International, Inc. | | $ | 41,990 | | |
| | 124,121 | | | | | Altria Group, Inc. | | | 2,034,343 | | |
| | 2,203 | | | | | Andersons, Inc. | | | 65,958 | | |
| | 39,850 | | | | | Archer-Daniels-Midland Co. | | | 1,066,785 | | |
| | 61,460 | | | | | Philip Morris International, Inc. | | | 2,680,885 | | |
| | 30,416 | | | | | Reynolds American, Inc. | | | 1,174,666 | | |
| | | | 7,064,627 | | |
| | | | | Airlines: 0.0% | |
| | 12,315 | | | | | Skywest, Inc. | | | 125,613 | | |
| | | | 125,613 | | |
| | | | | Apparel: 0.2% | |
| | 9,479 | | | @ | | Carter's, Inc. | | | 233,278 | | |
| | 6,756 | | | @ | | CROCS, Inc. | | | 22,970 | | |
| | 1,290 | | | @ | | Deckers Outdoor Corp. | | | 90,648 | | |
| | 7,202 | | | @ | | Iconix Brand Group, Inc. | | | 110,767 | | |
| | 346 | | | @ | | Maidenform Brands, Inc. | | | 3,969 | | |
| | 1,898 | | | | | Oxford Industries, Inc. | | | 22,112 | | |
| | 4,324 | | | | | Polo Ralph Lauren Corp. | | | 231,507 | | |
| | 124 | | | @ | | Skechers USA, Inc. | | | 1,211 | | |
| | 9,284 | | | @ | | Timberland Co. | | | 123,199 | | |
| | 2,700 | | | @,L | | True Religion Apparel, Inc. | | | 60,210 | | |
| | 943 | | | @,L | | Under Armour, Inc. | | | 21,104 | | |
| | 1,451 | | | @,L | | Volcom, Inc. | | | 18,138 | | |
| | 2,800 | | | @ | | Warnaco Group, Inc. | | | 90,720 | | |
| | 1,937 | | | | | Wolverine World Wide, Inc. | | | 42,730 | | |
| | | | 1,072,563 | | |
| | | | | Auto Manufacturers: 0.1% | |
| | 55,600 | | | @ | | Ford Motor Co. | | | 337,492 | | |
| | 3,600 | | | | | Oshkosh Truck Corp. | | | 52,344 | | |
| | 3,860 | | | L | | Wabash National Corp. | | | 2,702 | | |
| | | | 392,538 | | |
| | | | | Auto Parts & Equipment: 0.1% | |
| | 5,800 | | | | | BorgWarner, Inc. | | | 198,070 | | |
| | 4,609 | | | | | Spartan Motors, Inc. | | | 52,220 | | |
| | 7,354 | | | | | Superior Industries International | | | 103,691 | | |
| | | | 353,981 | | |
| | | | | Banks: 4.8% | |
| | 17,200 | | | | | Associated Banc-Corp. | | | 215,000 | | |
| | 12,381 | | | | | Bancorpsouth, Inc. | | | 254,182 | | |
| | 5,557 | | | | | Bank Mutual Corp. | | | 48,457 | | |
| | 272,303 | | | | | Bank of America Corp. | | | 3,594,400 | | |
| | 3,561 | | | | | Bank of Hawaii Corp. | | | 127,591 | | |
| | 33,544 | | | | | Bank of New York Mellon Corp. | | | 983,175 | | |
| | 4,000 | | | | | Bank of the Ozarks, Inc. | | | 86,520 | | |
| | 32,770 | | | | | BB&T Corp. | | | 720,285 | | |
| | 12,900 | | | L | | Cascade Bancorp. | | | 18,189 | | |
| | 4,990 | | | | | Central Pacific Financial Corp. | | | 18,713 | | |
| | 197,600 | | | S,L | | Citigroup, Inc. | | | 586,872 | | |
| | 75 | | | | | Columbia Banking System, Inc. | | | 767 | | |
| | 4,617 | | | | | Commerce Bancshares, Inc. | | | 146,959 | | |
| | 4,181 | | | | | Community Bank System, Inc. | | | 60,875 | | |
| | 2,900 | | | | | Cullen/Frost Bankers, Inc. | | | 133,748 | | |
| | 4,547 | | | @@,L | | First Bancorp. Puerto Rico | | | 17,961 | | |
| | 4,842 | | | | | First Financial Bancorp. | | | 36,412 | | |
| | 4,150 | | | S,L | | First Financial Bankshares, Inc. | | | 208,994 | | |
| | 18,221 | | | | | First Midwest Bancorp., Inc. | | | 133,196 | | |
| | 13,958 | | | | | FirstMerit Corp. | | | 237,007 | | |
| | 1,141 | | | L | | Frontier Financial Corp. | | | 1,381 | | |
See Accompanying Notes to Financial Statements
39
PORTFOLIO OF INVESTMENTS
ING BALANCED PORTFOLIO AS OF JUNE 30, 2009 (UNAUDITED) (CONTINUED)
| Shares | | | | | | Value | |
| | | | | Banks (continued) | |
| | 6,850 | | | | | Fulton Financial Corp. | | $ | 35,689 | | |
| | 6,992 | | | | | Glacier Bancorp., Inc. | | | 103,272 | | |
| | 23,542 | | | | | Goldman Sachs Group, Inc. | | | 3,471,032 | | |
| | 4,037 | | | | | Hancock Holding Co. | | | 131,162 | | |
| | 327 | | | | | Home Bancshares, Inc. | | | 6,226 | | |
| | 6,079 | | | | | Independent Bank Corp. | | | 119,756 | | |
| | 14,400 | | | L | | International Bancshares Corp. | | | 148,464 | | |
| | 131,357 | | | | | JPMorgan Chase & Co. | | | 4,480,587 | | |
| | 12,500 | | | L | | M&T Bank Corp. | | | 636,625 | | |
| | 26,099 | | | | | Morgan Stanley | | | 744,082 | | |
| | 21,400 | | | | | National Penn Bancshares, Inc. | | | 98,654 | | |
| | 1,700 | | | | | NBT Bancorp., Inc. | | | 36,907 | | |
| | 21,410 | | | | | Northern Trust Corp. | | | 1,149,289 | | |
| | 10,839 | | | | | Old National Bancorp. | | | 106,439 | | |
| | 34,263 | | | | | PNC Financial Services
Group, Inc. | | | 1,329,747 | | |
| | 7,100 | | | | | Prosperity Bancshares, Inc. | | | 211,793 | | |
| | 10,333 | | | | | S&T Bancorp, Inc. | | | 125,649 | | |
| | 885 | | | @ | | Signature Bank | | | 24,001 | | |
| | 2,523 | | | | | Simmons First National Corp. | | | 67,415 | | |
| | 17,836 | | | | | State Street Corp. | | | 841,859 | | |
| | 7,267 | | | | | Sterling Bancorp. | | | 60,679 | | |
| | 20,500 | | | | | Sterling Bancshares, Inc. | | | 129,765 | | |
| | 27,284 | | | | | Susquehanna Bancshares, Inc. | | | 133,419 | | |
| | 2,257 | | | | | Tompkins Financial Corp. | | | 108,223 | | |
| | 11,300 | | | | | Trustco Bank Corp. | | | 66,783 | | |
| | 9,500 | | | | | Trustmark Corp. | | | 183,540 | | |
| | 167 | | | | | UCBH Holdings, Inc. | | | 210 | | |
| | 5,660 | | | | | UMB Financial Corp. | | | 215,137 | | |
| | 1,207 | | | | | Umpqua Holdings Corp. | | | 9,366 | | |
| | 2,050 | | | L | | United Bankshares, Inc. | | | 40,057 | | |
| | 50,178 | | | | | US Bancorp. | | | 899,190 | | |
| | 177,733 | | | | | Wells Fargo & Co. | | | 4,311,803 | | |
| | 3,550 | | | L | | Westamerica Bancorp. | | | 176,116 | | |
| | 1,768 | | | L | | Wilmington Trust Corp. | | | 24,151 | | |
| | 4,700 | | | | | Wilshire Bancorp., Inc. | | | 27,025 | | |
| | 1,148 | | | | | Wintrust Financial Corp. | | | 18,460 | | |
| | | | 27,903,256 | | |
| | | | | Beverages: 0.5% | |
| | 21,881 | | | | | Coca-Cola Co. | | | 1,050,069 | | |
| | 41,345 | | | | | Coca-Cola Enterprises, Inc. | | | 688,394 | | |
| | 2,675 | | | @,L | | Green Mountain Coffee
Roasters, Inc. | | | 158,146 | | |
| | 4,598 | | | @ | | Hansen Natural Corp. | | | 141,710 | | |
| | 1,100 | | | @ | | Peet's Coffee & Tea, Inc. | | | 27,720 | | |
| | 4,600 | | | | | Pepsi Bottling Group, Inc. | | | 155,664 | | |
| | 3,430 | | | | | PepsiAmericas, Inc. | | | 91,958 | | |
| | 15,510 | | | | | PepsiCo, Inc. | | | 852,430 | | |
| | | | 3,166,091 | | |
| | | | | Biotechnology: 0.6% | |
| | 29,045 | | | @ | | Amgen, Inc. | | | 1,537,642 | | |
| | 4,200 | | | @ | | Arqule, Inc. | | | 25,788 | | |
| | 18,255 | | | @ | | Biogen Idec, Inc. | | | 824,213 | | |
| | 1,050 | | | @ | | Charles River Laboratories
International, Inc. | | | 35,438 | | |
| | 10,200 | | | @ | | Cubist Pharmaceuticals, Inc. | | | 186,966 | | |
| | 2,050 | | | @ | | Enzo Biochem, Inc. | | | 9,082 | | |
| | 5,417 | | | @ | | Gilead Sciences, Inc. | | | 253,732 | | |
| | 6,120 | | | @ | | Martek Biosciences Corp. | | | 129,438 | | |
| | 2,071 | | | @ | | OSI Pharmaceuticals, Inc. | | | 58,464 | | |
| | 5,896 | | | @ | | Regeneron Pharmaceuticals, Inc. | | | 105,656 | | |
| | 10,700 | | | @ | | Vertex Pharmaceuticals, Inc. | | | 381,348 | | |
| | | | 3,547,767 | | |
| Shares | | | | | | Value | |
| | | | | Building Materials: 0.1% | |
| | 7,550 | | | | | Apogee Enterprises, Inc. | | $ | 92,865 | | |
| | 4,550 | | | | | Eagle Materials, Inc. | | | 114,842 | | |
| | 8,516 | | | | | Gibraltar Industries, Inc. | | | 58,505 | | |
| | 838 | | | | | Lennox International, Inc. | | | 26,908 | | |
| | 18,544 | | | | | Louisiana-Pacific Corp. | | | 63,420 | | |
| | 1,250 | | | | | Martin Marietta Materials, Inc. | | | 98,600 | | |
| | 6,150 | | | @,L | | NCI Building Systems, Inc. | | | 16,236 | | |
| | 170 | | | | | Simpson Manufacturing Co., Inc. | | | 3,675 | | |
| | 1,430 | | | L | | Texas Industries, Inc. | | | 44,845 | | |
| | 3,200 | | | | | Universal Forest Products, Inc. | | | 105,888 | | |
| | | | 625,784 | | |
| | | | | Chemicals: 1.0% | |
| | 7,747 | | | | | Airgas, Inc. | | | 313,986 | | |
| | 1,450 | | | | | Albemarle Corp. | | | 37,077 | | |
| | 1,363 | | | | | American Vanguard Corp. | | | 15,402 | | |
| | 2,864 | | | | | Arch Chemicals, Inc. | | | 70,426 | | |
| | 5,337 | | | | | Ashland, Inc. | | | 149,703 | | |
| | 5,765 | | | | | Balchem Corp. | | | 141,358 | | |
| | 14,170 | | | | | Cabot Corp. | | | 178,259 | | |
| | 3,608 | | | | | CF Industries Holdings, Inc. | | | 267,497 | | |
| | 54,600 | | | | | Dow Chemical Co. | | | 881,244 | | |
| | 5,127 | | | | | FMC Corp. | | | 242,507 | | |
| | 4,340 | | | | | HB Fuller Co. | | | 81,462 | | |
| | 4,918 | | | | | Lubrizol Corp. | | | 232,671 | | |
| | 4,626 | | | | | Minerals Technologies, Inc. | | | 166,629 | | |
| | 7,664 | | | | | Monsanto Co. | | | 569,742 | | |
| | 1,760 | | | | | NewMarket Corp. | | | 118,501 | | |
| | 2,200 | | | | | Olin Corp. | | | 26,158 | | |
| | 4,820 | | | @ | | OM Group, Inc. | | | 139,876 | | |
| | 17,735 | | | @ | | PolyOne Corp. | | | 48,062 | | |
| | 25,090 | | | | | PPG Industries, Inc. | | | 1,101,451 | | |
| | 3,881 | | | | | Quaker Chemical Corp. | | | 51,578 | | |
| | 8,920 | | | | | Schulman A, Inc. | | | 134,781 | | |
| | 6,610 | | | | | Sherwin-Williams Co. | | | 355,288 | | |
| | 740 | | | | | Stepan Co. | | | 32,678 | | |
| | 10,300 | | | | | Terra Industries, Inc. | | | 249,466 | | |
| | 7,961 | | | | | Valspar Corp. | | | 179,361 | | |
| | 1,975 | | | | | Zep, Inc. | | | 23,799 | | |
| | | | 5,808,962 | | |
| | | | | Coal: 0.1% | |
| | 9,983 | | | | | Arch Coal, Inc. | | | 153,439 | | |
| | 4,960 | | | @,L | | Patriot Coal Corp. | | | 31,645 | | |
| | 17,900 | | | | | Peabody Energy Corp. | | | 539,864 | | |
| | | | 724,948 | | |
| | | | | Commercial Services: 1.6% | |
| | 2,400 | | | L | | Aaron Rents, Inc. | | | 71,568 | | |
| | 1,456 | | | | | ABM Industries, Inc. | | | 26,310 | | |
| | 5,100 | | | | | Administaff, Inc. | | | 118,677 | | |
| | 7,617 | | | @,L | | Alliance Data Systems Corp. | | | 313,744 | | |
| | 1,600 | | | @ | | American Public Education, Inc. | | | 63,376 | | |
| | 3,900 | | | @ | | AMN Healthcare Services, Inc. | | | 24,882 | | |
| | 10,981 | | | @ | | Apollo Group, Inc. - Class A | | | 780,969 | | |
| | 1,912 | | | | | Arbitron, Inc. | | | 30,382 | | |
| | 19,500 | | | | | Automatic Data Processing, Inc. | | | 691,080 | | |
| | 2,900 | | | @,L | | Bankrate, Inc. | | | 73,196 | | |
| | 3,100 | | | @ | | Brink's Home Security
Holdings, Inc. | | | 87,761 | | |
| | 1,900 | | | @,L | | Capella Education Co. | | | 113,905 | | |
| | 8,500 | | | @ | | Career Education Corp. | | | 211,565 | | |
| | 2,755 | | | | | CDI Corp. | | | 30,718 | | |
| | 3,650 | | | | | Chemed Corp. | | | 144,102 | | |
See Accompanying Notes to Financial Statements
40
PORTFOLIO OF INVESTMENTS
ING BALANCED PORTFOLIO AS OF JUNE 30, 2009 (UNAUDITED) (CONTINUED)
| Shares | | | | | | Value | |
| | | | | Commercial Services (continued) | �� |
| | 1,114 | | | @ | | Coinstar, Inc. | | $ | 29,744 | | |
| | 1,467 | | | @ | | Consolidated Graphics, Inc. | | | 25,555 | | |
| | 15,300 | | | @ | | Corinthian Colleges, Inc. | | | 259,029 | | |
| | 3,289 | | | @ | | Corrections Corp. of America | | | 55,880 | | |
| | 1,200 | | | @ | | Corvel Corp. | | | 27,324 | | |
| | 2,070 | | | | | Deluxe Corp. | | | 26,517 | | |
| | 5,050 | | | @ | | Forrester Research, Inc. | | | 123,978 | | |
| | 5,445 | | | @ | | FTI Consulting, Inc. | | | 276,170 | | |
| | 11,500 | | | @ | | Gartner, Inc. | | | 175,490 | | |
| | 5,450 | | | @ | | Geo Group, Inc. | | | 101,261 | | |
| | 10,300 | | | | | Global Payments, Inc. | | | 385,838 | | |
| | 1,600 | | | | | Healthcare Services Group | | | 28,608 | | |
| | 9,650 | | | | | Heartland Payment Systems, Inc. | | | 92,351 | | |
| | 10,000 | | | @ | | Hewitt Associates, Inc. | | | 297,800 | | |
| | 2,102 | | | | | Hillenbrand, Inc. | | | 34,977 | | |
| | 1,415 | | | @ | | HMS Holdings Corp. | | | 57,619 | | |
| | 1,950 | | | @ | | ITT Educational Services, Inc. | | | 196,287 | | |
| | 6,000 | | | | | Kelly Services, Inc. | | | 65,700 | | |
| | 6,333 | | | @ | | Kendle International, Inc. | | | 77,516 | | |
| | 6,450 | | | | | Lender Processing Services, Inc. | | | 179,117 | | |
| | 6,712 | | | @ | | Live Nation, Inc. | | | 32,620 | | |
| | 7,350 | | | | | Manpower, Inc. | | | 311,199 | | |
| | 9,300 | | | | | Moody's Corp. | | | 245,055 | | |
| | 17,900 | | | @ | | MPS Group, Inc. | | | 136,756 | | |
| | 4,796 | | | @ | | Navigant Consulting, Inc. | | | 61,964 | | |
| | 16,050 | | | @ | | On Assignment, Inc. | | | 62,756 | | |
| | 1,450 | | | @ | | Parexel International Corp. | | | 20,851 | | |
| | 11,733 | | | | | Pharmaceutical Product
Development, Inc. | | | 272,440 | | |
| | 1,750 | | | @,L | | Pre-Paid Legal Services, Inc. | | | 76,283 | | |
| | 11,000 | | | @ | | Rent-A-Center, Inc. | | | 196,130 | | |
| | 61,623 | | | | | RR Donnelley & Sons Co. | | | 716,059 | | |
| | 21,250 | | | @ | | SAIC, Inc. | | | 394,188 | | |
| | 18,300 | | | | | Service Corp. International | | | 100,284 | | |
| | 2,958 | | | @ | | Spherion Corp. | | | 12,187 | | |
| | 550 | | | L | | Strayer Education, Inc. | | | 119,961 | | |
| | 3,700 | | | @ | | TeleTech Holdings, Inc. | | | 56,055 | | |
| | 4,400 | | | @ | | Ticketmaster | | | 28,248 | | |
| | 5,940 | | | @ | | TrueBlue, Inc. | | | 49,896 | | |
| | 3,000 | | | @ | | Universal Technical Institute, Inc. | | | 44,790 | | |
| | 5,240 | | | | | Viad Corp. | | | 90,233 | | |
| | 1,200 | | | | | Watson Wyatt Worldwide, Inc. | | | 45,036 | | |
| | 60,977 | | | | | Western Union Co. | | | 1,000,023 | | |
| | 5,756 | | | @ | | Wright Express Corp. | | | 146,605 | | |
| | | | 9,518,615 | | |
| | | | | Computers: 3.8% | |
| | 36,022 | | | @ | | Apple, Inc. | | | 5,130,613 | | |
| | 5,240 | | | @ | | CACI International, Inc. | | | 223,800 | | |
| | 22,650 | | | @ | | Ciber, Inc. | | | 70,215 | | |
| | 16,898 | | | @ | | Computer Sciences Corp. | | | 748,581 | | |
| | 47,499 | | | @ | | Dell, Inc. | | | 652,161 | | |
| | 9,100 | | | | | Diebold, Inc. | | | 239,876 | | |
| | 7,302 | | | @ | | DST Systems, Inc. | | | 269,809 | | |
| | 100,120 | | | @ | | EMC Corp. | | | 1,311,572 | | |
| | 128,245 | | | | | Hewlett-Packard Co. | | | 4,956,669 | | |
| | 2,663 | | | @,L | | Hutchinson Technology, Inc. | | | 5,193 | | |
| | 10,600 | | | | | Imation Corp. | | | 80,666 | | |
| | 9,457 | | | @ | | Insight Enterprises, Inc. | | | 91,355 | | |
| | 61,551 | | | | | International Business
Machines Corp. | | | 6,427,155 | | |
| | 3,900 | | | | | Jack Henry & Associates, Inc. | | | 80,925 | | |
| | 6,900 | | | @ | | Manhattan Associates, Inc. | | | 125,718 | | |
| Shares | | | | | | Value | |
| | 3,300 | | | @ | | Mercury Computer Systems, Inc. | | $ | 30,525 | | |
| | 11,584 | | | @ | | Micros Systems, Inc. | | | 293,307 | | |
| | 1,390 | | | | | MTS Systems Corp. | | | 28,704 | | |
| | 26,031 | | | @ | | NCR Corp. | | | 307,947 | | |
| | 6,350 | | | @,L | | Palm, Inc. | | | 105,220 | | |
| | 9,070 | | | @ | | Radisys Corp. | | | 81,721 | | |
| | 5,550 | | | @ | | SYKES Enterprises, Inc. | | | 100,400 | | |
| | 3,750 | | | @,L | | Synaptics, Inc. | | | 144,938 | | |
| | 9,388 | | | @ | | Synopsys, Inc. | | | 183,160 | | |
| | 15,395 | | | @ | | Teradata Corp. | | | 360,705 | | |
| | | | 22,050,935 | | |
| | | | | Cosmetics/Personal Care: 0.7% | |
| | 882 | | | | | Alberto-Culver Co. | | | 22,429 | | |
| | 1,050 | | | @,L | | Chattem, Inc. | | | 71,505 | | |
| | 76,835 | | | | | Procter & Gamble Co. | | | 3,926,269 | | |
| | | | 4,020,203 | | |
| | | | | Distribution/Wholesale: 0.2% | |
| | 12,960 | | | @ | | Brightpoint, Inc. | | | 81,259 | | |
| | 3,200 | | | @ | | Fossil, Inc. | | | 77,056 | | |
| | 20,137 | | | @ | | Ingram Micro, Inc. | | | 352,398 | | |
| | 10,450 | | | @ | | LKQ Corp. | | | 171,903 | | |
| | 5,061 | | | @ | | Scansource, Inc. | | | 124,096 | | |
| | 6,842 | | | @ | | School Specialty, Inc. | | | 138,277 | | |
| | 8,232 | | | @ | | Tech Data Corp. | | | 269,269 | | |
| | 2,450 | | | L | | Watsco, Inc. | | | 119,879 | | |
| | | | 1,334,137 | | |
| | | | | Diversified Financial Services: 1.0% | |
| | 940 | | | @ | | Affiliated Managers Group, Inc. | | | 54,699 | | |
| | 46,000 | | | | | American Express Co. | | | 1,069,040 | | |
| | 11,800 | | | @,L | | AmeriCredit Corp. | | | 159,890 | | |
| | 84,650 | | | | | Charles Schwab Corp. | | | 1,484,761 | | |
| | 2,524 | | | | | CME Group, Inc. | | | 785,242 | | |
| | 2,170 | | | | | Eaton Vance Corp. | | | 58,048 | | |
| | 452 | | | | | Financial Federal Corp. | | | 9,289 | | |
| | 1,150 | | | L | | Greenhill & Co., Inc. | | | 83,042 | | |
| | 4,300 | | | @ | | IntercontinentalExchange, Inc. | | | 491,232 | | |
| | 4,526 | | | @ | | Investment Technology
Group, Inc. | | | 92,285 | | |
| | 16,150 | | | | | Jefferies Group, Inc. | | | 344,480 | | |
| | 499 | | | @ | | LaBranche & Co., Inc. | | | 2,146 | | |
| | 33,050 | | | @ | | Nasdaq Stock Market, Inc. | | | 704,296 | | |
| | 10,380 | | | | | National Financial Partners Corp. | | | 75,982 | | |
| | 7,720 | | | | | OptionsXpress Holdings, Inc. | | | 119,892 | | |
| | 1,380 | | | @,L | | Portfolio Recovery
Associates, Inc. | | | 53,447 | | |
| | 2,200 | | | @ | | Stifel Financial Corp. | | | 105,798 | | |
| | 3,230 | | | | | SWS Group, Inc. | | | 45,123 | | |
| | 852 | | | @ | | TradeStation Group, Inc. | | | 7,208 | | |
| | 3,498 | | | | | Waddell & Reed Financial, Inc. | | | 92,242 | | |
| | 5,347 | | | @,L | | World Acceptance, Corp. | | | 106,459 | | |
| | | | 5,944,601 | | |
| | | | | Electric: 1.9% | |
| | 16,340 | | | @ | | AES Corp. | | | 189,707 | | |
| | 2,550 | | | | | Alliant Energy Corp. | | | 66,632 | | |
| | 1,600 | | | | | Avista Corp. | | | 28,496 | | |
| | 1,850 | | | | | Central Vermont Public
Service Corp. | | | 33,485 | | |
| | 4,178 | | | | | CH Energy Group, Inc. | | | 195,113 | | |
| | 72,320 | | | | | CMS Energy Corp. | | | 873,626 | | |
| | 12,800 | | | | | Dominion Resources, Inc. | | | 427,776 | | |
See Accompanying Notes to Financial Statements
41
PORTFOLIO OF INVESTMENTS
ING BALANCED PORTFOLIO AS OF JUNE 30, 2009 (UNAUDITED) (CONTINUED)
| Shares | | | | | | Value | |
| | | | | Electric (continued) | |
| | 8,300 | | | | | DPL, Inc. | | $ | 192,311 | | |
| | 3,697 | | | | | DTE Energy Co. | | | 118,304 | | |
| | 53,700 | | | | | Exelon Corp. | | | 2,749,977 | | |
| | 9,900 | | | | | FirstEnergy Corp. | | | 383,625 | | |
| | 24,116 | | | | | FPL Group, Inc. | | | 1,371,236 | | |
| | 14,300 | | | | | Hawaiian Electric Industries | | | 272,558 | | |
| | 6,000 | | | | | MDU Resources Group, Inc. | | | 113,820 | | |
| | 11,800 | | | | | NSTAR | | | 378,898 | | |
| | 1,949 | | | | | NV Energy, Inc. | | | 21,030 | | |
| | 7,000 | | | | | OGE Energy Corp. | | | 198,240 | | |
| | 4,100 | | | | | PNM Resources, Inc. | | | 43,911 | | |
| | 27,900 | | | | | PPL Corp. | | | 919,584 | | |
| | 54,100 | | | | | Public Service Enterprise
Group, Inc. | | | 1,765,283 | | |
| | 4,065 | | | | | Unisource Energy Corp. | | | 107,885 | | |
| | 25,000 | | | | | Xcel Energy, Inc. | | | 460,250 | | |
| | | | 10,911,747 | | |
| | | | | | | Electrical Components &
Equipment: 0.1% | | | | | |
| | 5,250 | | | | | Ametek, Inc. | | | 181,545 | | |
| | 3,933 | | | | | Belden CDT, Inc. | | | 65,681 | | |
| | 4,700 | | | @ | | Energizer Holdings, Inc. | | | 245,528 | | |
| | 7,259 | | | | | Hubbell, Inc. | | | 232,724 | | |
| | | | 725,478 | | |
| | | | | Electronics: 0.8% | |
| | 1,000 | | | | | American Science &
Engineering, Inc. | | | 69,120 | | |
| | 16,700 | | | | | Amphenol Corp. | | | 528,388 | | |
| | 12,600 | | | @ | | Arrow Electronics, Inc. | | | 267,624 | | |
| | 16,086 | | | @ | | Avnet, Inc. | | | 338,289 | | |
| | 350 | | | @ | | Axsys Technologies, Inc. | | | 18,774 | | |
| | 883 | | | | | Badger Meter, Inc. | | | 36,203 | | |
| | 1,503 | | | | | Bel Fuse, Inc. | | | 24,108 | | |
| | 15,360 | | | @ | | Benchmark Electronics, Inc. | | | 221,184 | | |
| | 9,600 | | | S | | Brady Corp. | | | 241,152 | | |
| | 10,095 | | | @ | | Checkpoint Systems, Inc. | | | 158,391 | | |
| | 14,041 | | | | | CTS Corp. | | | 91,969 | | |
| | 127 | | | @ | | Cymer, Inc. | | | 3,776 | | |
| | 2,400 | | | | | Daktronics, Inc. | | | 18,480 | | |
| | 2,848 | | | @ | | Dionex Corp. | | | 173,813 | | |
| | 1,615 | | | @ | | FEI Co. | | | 36,984 | | |
| | 2,811 | | | S | | Gentex Corp. | | | 32,608 | | |
| | 1,023 | | | @ | | Itron, Inc. | | | 56,337 | | |
| | 847 | | | @ | | LoJack Corp. | | | 3,549 | | |
| | 9,850 | | | | | Methode Electronics, Inc. | | | 69,147 | | |
| | 3,627 | | | @,@@ | | Mettler Toledo International, Inc. | | | 279,823 | | |
| | 8,500 | | | @ | | Newport Corp. | | | 49,215 | | |
| | 1,408 | | | | | Park Electrochemical Corp. | | | 30,314 | | |
| | 30,239 | | | | | PerkinElmer, Inc. | | | 526,159 | | |
| | 3,970 | | | @ | | Plexus Corp. | | | 81,226 | | |
| | 379 | | | @ | | Rogers Corp. | | | 7,667 | | |
| | 6,150 | | | @ | | Thomas & Betts Corp. | | | 177,489 | | |
| | 3,190 | | | @ | | Trimble Navigation Ltd. | | | 62,620 | | |
| | 8,979 | | | @ | | TTM Technologies, Inc. | | | 71,473 | | |
| | 5,708 | | | @ | | Varian, Inc. | | | 225,066 | | |
| | 23,800 | | | @ | | Vishay Intertechnology, Inc. | | | 161,602 | | |
| | 5,885 | | | @ | | Waters Corp. | | | 302,901 | | |
| | 5,950 | | | | | Watts Water Technologies, Inc. | | | 128,163 | | |
| | 7,900 | | | | | Woodward Governor Co. | | | 156,420 | | |
| | | | 4,650,034 | | |
| Shares | | | | | | Value | |
| | | | | Energy-Alternate Sources: 0.0% | |
| | 2,892 | | | @ | | Headwaters, Inc. | | $ | 9,717 | | |
| | | | 9,717 | | |
| | | | | Engineering & Construction: 0.7% | |
| | 6,500 | | | @ | | Aecom Technology Corp. | | | 208,000 | | |
| | 10,655 | | | @ | | Dycom Industries, Inc. | | | 117,951 | | |
| | 11,810 | | | @ | | EMCOR Group, Inc. | | | 237,617 | | |
| | 24,640 | | | | | Fluor Corp. | | | 1,263,786 | | |
| | 4,500 | | | | | Granite Construction, Inc. | | | 149,760 | | |
| | 2,326 | | | @ | | Insituform Technologies, Inc. | | | 39,472 | | |
| | 26,300 | | | @ | | Jacobs Engineering Group, Inc. | | | 1,106,967 | | |
| | 13,573 | | | | | KBR, Inc. | | | 250,286 | | |
| | 8,408 | | | @ | | Shaw Group, Inc. | | | 230,463 | | |
| | 1,100 | | | @ | | Stanley, Inc. | | | 36,168 | | |
| | 6,820 | | | @ | | URS Corp. | | | 337,726 | | |
| | | | 3,978,196 | | |
| | | | | Entertainment: 0.0% | |
| | 1,935 | | | @ | | DreamWorks Animation
SKG, Inc. | | | 53,387 | | |
| | 6,056 | | | @ | | Pinnacle Entertainment, Inc. | | | 56,260 | | |
| | 8,500 | | | @ | | Shuffle Master, Inc. | | | 56,185 | | |
| | | | 165,832 | | |
| | | | | Environmental Control: 0.1% | |
| | 5,378 | | | @ | | Calgon Carbon Corp. | | | 74,700 | | |
| | 704 | | | @ | | Clean Harbors, Inc. | | | 38,009 | | |
| | 5,445 | | | @ | | Darling International, Inc. | | | 35,937 | | |
| | 3,280 | | | @ | | Tetra Tech, Inc. | | | 93,972 | | |
| | 9,583 | | | @ | | Waste Connections, Inc. | | | 248,296 | | |
| | | | 490,914 | | |
| | | | | Food: 1.1% | |
| | 1,369 | | | L | | Cal-Maine Foods, Inc. | | | 34,170 | | |
| | 1,405 | | | | | Corn Products International, Inc. | | | 37,640 | | |
| | 11,500 | | | @ | | Dean Foods Co. | | | 220,685 | | |
| | 3,514 | | | | | Diamond Foods, Inc. | | | 98,041 | | |
| | 10,800 | | | | | General Mills, Inc. | | | 605,016 | | |
| | 127 | | | @ | | Hain Celestial Group, Inc. | | | 1,982 | | |
| | 4,000 | | | | | J&J Snack Foods Corp. | | | 143,600 | | |
| | 98,724 | | | | | Kraft Foods, Inc. | | | 2,501,666 | | |
| | 12,638 | | | | | Kroger Co. | | | 278,668 | | |
| | 2,785 | | | | | Lancaster Colony Corp. | | | 122,735 | | |
| | 789 | | | | | Lance, Inc. | | | 18,250 | | |
| | 1,890 | | | | | Nash Finch Co. | | | 51,143 | | |
| | 4,405 | | | @ | | Ralcorp Holdings, Inc. | | | 268,353 | | |
| | 4,852 | | | | | Ruddick Corp. | | | 113,682 | | |
| | 2,000 | | | | | Sanderson Farms, Inc. | | | 90,000 | | |
| | 79,490 | | | | | Sara Lee Corp. | | | 775,822 | | |
| | 4,700 | | | @,L | | Smithfield Foods, Inc. | | | 65,659 | | |
| | 1,586 | | | | | Spartan Stores, Inc. | | | 19,682 | | |
| | 9,750 | | | | | Supervalu, Inc. | | | 126,263 | | |
| | 4,243 | | | @ | | TreeHouse Foods, Inc. | | | 122,071 | | |
| | 43,600 | | | | | Tyson Foods, Inc. | | | 549,796 | | |
| | 2,550 | | | @ | | United Natural Foods, Inc. | | | 66,938 | | |
| | | | 6,311,862 | | |
| | | | | Forest Products & Paper: 0.2% | |
| | 4,650 | | | @ | | Buckeye Technologies, Inc. | | | 20,879 | | |
| | 1,100 | | | @ | | Clearwater Paper Corp. | | | 27,819 | | |
| | 45,316 | | | | | International Paper Co. | | | 685,631 | | |
| | 20,500 | | | | | MeadWestvaco Corp. | | | 336,405 | | |
| | 3,900 | | | | | Schweitzer-Mauduit
International, Inc. | | | 106,119 | | |
| | | | 1,176,853 | | |
See Accompanying Notes to Financial Statements
42
PORTFOLIO OF INVESTMENTS
ING BALANCED PORTFOLIO AS OF JUNE 30, 2009 (UNAUDITED) (CONTINUED)
| Shares | | | | | | Value | |
| | | | | Gas: 0.5% | |
| | 10,550 | | | | | AGL Resources, Inc. | | $ | 335,490 | | |
| | 13,102 | | | | | Atmos Energy Corp. | | | 328,074 | | |
| | 3,598 | | | | | Energen Corp. | | | 143,560 | | |
| | 151 | | | | | Laclede Group, Inc. | | | 5,003 | | |
| | 2,200 | | | | | National Fuel Gas Co. | | | 79,376 | | |
| | 7,021 | | | | | New Jersey Resources Corp. | | | 260,058 | | |
| | 950 | | | | | Northwest Natural Gas Co. | | | 42,104 | | |
| | 4,322 | | | | | Piedmont Natural Gas Co. | | | 104,203 | | |
| | 17,141 | | | | | Sempra Energy | | | 850,708 | | |
| | 2,100 | | | | | South Jersey Industries, Inc. | | | 73,269 | | |
| | 3,100 | | | | | Southwest Gas Corp. | | | 68,851 | | |
| | 13,997 | | | | | UGI Corp. | | | 356,784 | | |
| | 3,350 | | | | | Vectren Corp. | | | 78,491 | | |
| | 3,000 | | | | | WGL Holdings, Inc. | | | 96,060 | | |
| | | | 2,822,031 | | |
| | | | | Hand/Machine Tools: 0.0% | |
| | 1,175 | | | | | Baldor Electric Co. | | | 27,953 | | |
| | 1,053 | | | | | Kennametal, Inc. | | | 20,197 | | |
| | 2,550 | | | | | Lincoln Electric Holdings, Inc. | | | 91,902 | | |
| | 1,457 | | | | | Regal-Beloit Corp. | | | 57,872 | | |
| | | | 197,924 | | |
| | | | | Healthcare-Products: 1.5% | |
| | 663 | | | @ | | Abaxism, Inc. | | | 13,618 | | |
| | 12,204 | | | @ | | Affymetrix, Inc. | | | 72,370 | | |
| | 6,800 | | | @ | | Align Technology, Inc. | | | 72,080 | | |
| | 12,535 | | | @ | | American Medical Systems
Holdings, Inc. | | | 198,053 | | |
| | 1,480 | | | | | Beckman Coulter, Inc. | | | 84,567 | | |
| | 6,377 | | | | | Becton Dickinson & Co. | | | 454,744 | | |
| | 47,600 | | | @ | | Boston Scientific Corp. | | | 482,664 | | |
| | 2,526 | | | | | Cooper Cos., Inc. | | | 62,468 | | |
| | 5,970 | | | @ | | Cyberonics | | | 99,281 | | |
| | 1,318 | | | @ | | Edwards Lifesciences Corp. | | | 89,664 | | |
| | 4,481 | | | @ | | Gen-Probe, Inc. | | | 192,593 | | |
| | 1,900 | | | @ | | Haemonetics Corp. | | | 108,300 | | |
| | 6,950 | | | @ | | Henry Schein, Inc. | | | 333,253 | | |
| | 8,433 | | | S | | Hill-Rom Holdings, Inc. | | | 136,783 | | |
| | 20,598 | | | @ | | Hologic, Inc. | | | 293,110 | | |
| | 18,400 | | | @ | | Hospira, Inc. | | | 708,768 | | |
| | 1,038 | | | @ | | ICU Medical, Inc. | | | 42,714 | | |
| | 567 | | | @ | | Idexx Laboratories, Inc. | | | 26,195 | | |
| | 5,900 | | | | | Invacare Corp. | | | 104,135 | | |
| | 55,790 | | | | | Johnson & Johnson | | | 3,168,872 | | |
| | 5,190 | | | @ | | Kensey Nash Corp. | | | 136,030 | | |
| | 5,340 | | | @ | | Kinetic Concepts, Inc. | | | 145,515 | | |
| | 33,412 | | | | | Medtronic, Inc. | | | 1,165,745 | | |
| | 1,100 | | | | | Meridian Bioscience, Inc. | | | 24,838 | | |
| | 2,133 | | | @ | | Merit Medical Systems, Inc. | | | 34,768 | | |
| | 7,130 | | | @ | | PSS World Medical, Inc. | | | 131,976 | | |
| | 4,741 | | | @ | | Resmed, Inc. | | | 193,101 | | |
| | 10,750 | | | | | Steris Corp. | | | 280,360 | | |
| | 400 | | | | | Techne Corp. | | | 25,524 | | |
| | 2,900 | | | @ | | Thoratec Corp. | | | 77,662 | | |
| | 890 | | | | | West Pharmaceutical
Services, Inc. | | | 31,017 | | |
| | | | 8,990,768 | | |
| | | | | Healthcare-Services: 1.3% | |
| | 24,857 | | | | | Aetna, Inc. | | | 622,668 | | |
| | 709 | | | @ | | Air Methods Corp. | | | 19,398 | | |
| | 2,430 | | | @,L | | Amedisys, Inc. | | | 80,239 | | |
| Shares | | | | | | Value | |
| | 7,303 | | | @ | | AMERIGROUP Corp. | | $ | 196,086 | | |
| | 5,950 | | | @ | | Amsurg Corp. | | | 127,568 | | |
| | 5,800 | | | @ | | Centene Corp. | | | 115,884 | | |
| | 11,105 | | | | | Cigna Corp. | | | 267,519 | | |
| | 13,146 | | | @ | | Community Health Systems, Inc. | | | 331,937 | | |
| | 750 | | | @ | | Covance, Inc. | | | 36,900 | | |
| | 12,400 | | | @,S | | Coventry Health Care, Inc. | | | 232,004 | | |
| | 1,000 | | | @ | | Genoptix, Inc. | | | 31,990 | | |
| | 4,242 | | | @ | | Gentiva Health Services, Inc. | | | 69,823 | | |
| | 32,738 | | | @ | | Health Management
Associates, Inc. | | | 161,726 | | |
| | 12,300 | | | @ | | Health Net, Inc. | | | 191,265 | | |
| | 7,350 | | | @ | | Healthspring, Inc. | | | 79,821 | | |
| | 5,690 | | | @ | | Healthways, Inc. | | | 76,531 | | |
| | 8,544 | | | @ | | Humana, Inc. | | | 275,629 | | |
| | 900 | | | @ | | IPC The Hospitalist Co., Inc. | | | 24,021 | | |
| | 5,600 | | | @ | | Kindred Healthcare, Inc. | | | 69,272 | | |
| | 9,482 | | | @ | | Laboratory Corp. of
America Holdings | | | 642,785 | | |
| | 2,450 | | | @ | | LHC Group, Inc. | | | 54,415 | | |
| | 9,300 | | | @ | | LifePoint Hospitals, Inc. | | | 244,125 | | |
| | 10,300 | | | @ | | Lincare Holdings, Inc. | | | 242,256 | | |
| | 6,100 | | | @ | | Magellan Health Services, Inc. | | | 200,202 | | |
| | 7,080 | | | @ | | Mednax, Inc. | | | 298,280 | | |
| | 3,687 | | | @,L | | Molina Healthcare, Inc. | | | 88,193 | | |
| | 5,887 | | | @ | | Odyssey HealthCare, Inc. | | | 60,518 | | |
| | 7,700 | | | | | Quest Diagnostics | | | 434,511 | | |
| | 2,200 | | | @ | | RehabCare Group, Inc. | | | 52,646 | | |
| | 551 | | | @ | | Res-Care, Inc. | | | 7,879 | | |
| | 59,003 | | | | | UnitedHealth Group, Inc. | | | 1,473,895 | | |
| | 5,950 | | | | | Universal Health Services, Inc. | | | 290,658 | | |
| | 4,500 | | | @ | | WellCare Health Plans, Inc. | | | 83,205 | | |
| | 13,400 | | | @ | | WellPoint, Inc. | | | 681,926 | | |
| | | | 7,865,775 | | |
| | | | | Home Builders: 0.3% | |
| | 37,000 | | | | | D.R. Horton, Inc. | | | 346,320 | | |
| | 21,100 | | | | | KB Home | | | 288,648 | | |
| | 25,300 | | | | | Lennar Corp. | | | 245,157 | | |
| | 4,170 | | | | | M/I Homes, Inc. | | | 40,824 | | |
| | 5,350 | | | | | MDC Holdings, Inc. | | | 161,089 | | |
| | 4,550 | | | @ | | Meritage Homes Corp. | | | 85,813 | | |
| | 550 | | | @ | | NVR, Inc. | | | 276,315 | | |
| | 4,250 | | | | | Ryland Group, Inc. | | | 71,230 | | |
| | 16,917 | | | @ | | Standard-Pacific Corp. | | | 34,342 | | |
| | 6,371 | | | | | Thor Industries, Inc. | | | 117,035 | | |
| | 14,100 | | | @ | | Toll Brothers, Inc. | | | 239,277 | | |
| | | | 1,906,050 | | |
| | | | | Home Furnishings: 0.0% | |
| | 1,124 | | | @ | | DTS, Inc. | | | 30,427 | | |
| | 9,247 | | | | | La-Z-Boy, Inc. | | | 43,646 | | |
| | 3,500 | | | @ | | Universal Electronics, Inc. | | | 70,595 | | |
| | | | 144,668 | | |
| | | | | Household Products/Wares: 0.4% | |
| | 7,296 | | | | | Avery Dennison Corp. | | | 187,361 | | |
| | 8,747 | | | @ | | Central Garden & Pet Co. | | | 86,158 | | |
| | 5,280 | | | | | Church & Dwight Co., Inc. | | | 286,757 | | |
| | 3,200 | | | @ | | Helen of Troy Ltd. | | | 53,728 | | |
| | 25,234 | | | | | Kimberly-Clark Corp. | | | 1,323,019 | | |
| | 4,644 | | | | | Tupperware Corp. | | | 120,837 | | |
| | | | 2,057,860 | | |
See Accompanying Notes to Financial Statements
43
PORTFOLIO OF INVESTMENTS
ING BALANCED PORTFOLIO AS OF JUNE 30, 2009 (UNAUDITED) (CONTINUED)
| Shares | | | | | | Value | |
| | | | | Housewares: 0.0% | |
| | 4,657 | | | L | | Toro Co. | | $ | 139,244 | | |
| | | | 139,244 | | |
| | | | | Insurance: 1.7% | |
| | 13,546 | | | | | Aflac, Inc. | | | 421,145 | | |
| | 13,675 | | | | | American Financial Group, Inc. | | | 295,107 | | |
| | 178 | | | | | American Physicians Capital, Inc. | | | 6,970 | | |
| | 4,752 | | | @ | | Amerisafe, Inc. | | | 73,941 | | |
| | 36,762 | | | | | AON Corp. | | | 1,392,177 | | |
| | 5,404 | | | | | Arthur J. Gallagher & Co. | | | 115,321 | | |
| | 1,106 | | | | | Brown & Brown, Inc. | | | 22,043 | | |
| | 54,273 | | | | | Chubb Corp. | | | 2,164,407 | | |
| | 8,651 | | | | | Delphi Financial Group | | | 168,089 | | |
| | 1,698 | | | | | Employers Holdings, Inc. | | | 23,008 | | |
| | 6,629 | | | @@ | | Everest Re Group Ltd. | | | 474,438 | | |
| | 18,561 | | | | | Fidelity National Title Group, Inc. | | | 251,130 | | |
| | 10,050 | | | | | First American Corp. | | | 260,396 | | |
| | 2,969 | | | | | Hanover Insurance Group, Inc. | | | 113,149 | | |
| | 7,023 | | | | | HCC Insurance Holdings, Inc. | | | 168,622 | | |
| | 14,700 | | | | | Horace Mann Educators Corp. | | | 146,559 | | |
| | 3,633 | | | | | Infinity Property &
Casualty Corp. | | | 132,459 | | |
| | 9,000 | | | | | Loews Corp. | | | 246,600 | | |
| | 13,000 | | | | | Marsh & McLennan Cos., Inc. | | | 261,690 | | |
| | 2,100 | | | @ | | Navigators Group, Inc. | | | 93,303 | | |
| | 6,319 | | | | | Old Republic International Corp. | | | 62,242 | | |
| | 5,400 | | | @ | | ProAssurance Corp. | | | 249,534 | | |
| | 17,400 | | | @ | | Progressive Corp. | | | 262,914 | | |
| | 1,300 | | | | | Protective Life Corp. | | | 14,872 | | |
| | 5,143 | | | | | Reinsurance Group of
America, Inc. | | | 179,542 | | |
| | 144 | | | | | RLI Corp. | | | 6,451 | | |
| | 1,762 | | | | | Safety Insurance Group, Inc. | | | 53,847 | | |
| | 4,214 | | | | | Selective Insurance Group | | | 53,813 | | |
| | 5,400 | | | | | Stancorp Financial Group, Inc. | | | 154,872 | | |
| | 1,422 | | | | | Stewart Information
Services Corp. | | | 20,264 | | |
| | 10,910 | | | | | Torchmark Corp. | | | 404,106 | | |
| | 4,310 | | | | | Tower Group, Inc. | | | 106,802 | | |
| | 22,052 | | | | | Travelers Cos., Inc. | | | 905,014 | | |
| | 13,047 | | | | | Unitrin, Inc. | | | 156,825 | | |
| | 39,829 | | | | | UnumProvident Corp. | | | 631,688 | | |
| | 3,850 | | | | | WR Berkley Corp. | | | 82,660 | | |
| | 59 | | | L | | Zenith National Insurance Corp. | | | 1,283 | | |
| | | | 10,177,283 | | |
| | | | | Internet: 1.6% | |
| | 14,532 | | | @ | | Amazon.com, Inc. | | | 1,215,747 | | |
| | 2,054 | | | @ | | Avocent Corp. | | | 28,674 | | |
| | 4,820 | | | @ | | Blue Coat Systems, Inc. | | | 79,723 | | |
| | 1,390 | | | @,L | | Blue Nile, Inc. | | | 59,756 | | |
| | 1,152 | | | @ | | comScore, Inc. | | | 15,345 | | |
| | 5,070 | | | @ | | Cybersource Corp. | | | 77,571 | | |
| | 3,439 | | | @ | | DealerTrack Holdings, Inc. | | | 58,463 | | |
| | 2,533 | | | @ | | Digital River, Inc. | | | 91,999 | | |
| | 85,567 | | | @ | | eBay, Inc. | | | 1,465,763 | | |
| | 2,700 | | | @ | | Equinix, Inc. | | | 196,398 | | |
| | 6,668 | | | @ | | eResearch Technology, Inc. | | | 41,408 | | |
| | 5,250 | | | @ | | F5 Networks, Inc. | | | 181,598 | | |
| | 8,839 | | | @ | | Google, Inc. - Class A | | | 3,726,434 | | |
| | 8,208 | | | @ | | j2 Global Communications, Inc. | | | 185,172 | | |
| | 1,553 | | | @ | | Knot, Inc. | | | 12,238 | | |
| | 2,100 | | | @,L | | NetFlix, Inc. | | | 86,814 | | |
| Shares | | | | | | Value | |
| | 4,040 | | | L | | Nutri/System, Inc. | | $ | 58,580 | | |
| | 7,790 | | | @ | | Perficient, Inc. | | | 54,452 | | |
| | 3,450 | | | @,L | | Priceline.com, Inc. | | | 384,848 | | |
| | 6,460 | | | @ | | Stamps.com, Inc. | | | 54,781 | | |
| | 68,070 | | | @ | | Symantec Corp. | | | 1,059,169 | | |
| | 17,251 | | | | | United Online, Inc. | | | 112,304 | | |
| | 12,500 | | | @ | | Valueclick, Inc. | | | 131,500 | | |
| | 4,842 | | | @ | | Websense, Inc. | | | 86,381 | | |
| | 2,953 | | | @ | | Yahoo!, Inc. | | | 46,244 | | |
| | | | 9,511,362 | | |
| | | | | Investment Companies: 0.0% | |
| | 2,265 | | | | | Apollo Investment Corp. | | | 13,590 | | |
| | | | 13,590 | | |
| | | | | Iron/Steel: 0.3% | |
| | 3,800 | | | | | Allegheny Technologies, Inc. | | | 132,734 | | |
| | 13,133 | | | | | Cliffs Natural Resources, Inc. | | | 321,365 | | |
| | 7,979 | | | | | Nucor Corp. | | | 354,507 | | |
| | 8,500 | | | | | Reliance Steel & Aluminum Co. | | | 326,315 | | |
| | 9,999 | | | | | Steel Dynamics, Inc. | | | 147,285 | | |
| | 18,230 | | | L | | United States Steel Corp. | | | 651,540 | | |
| | | | 1,933,746 | | |
| | | | | Leisure Time: 0.0% | |
| | 145 | | | | | Brunswick Corp. | | | 626 | | |
| | 3,550 | | | @ | | Interval Leisure Group, Inc. | | | 33,086 | | |
| | 2,337 | | | L | | Polaris Industries, Inc. | | | 75,064 | | |
| | | | 108,776 | | |
| | | | | Lodging: 0.0% | |
| | 1,698 | | | | | Marcus Corp. | | | 17,863 | | |
| | | | 17,863 | | |
| | | | | | | Machinery-Construction &
Mining: 0.1% | | | | | |
| | 3,200 | | | | | Bucyrus International, Inc. | | | 91,392 | | |
| | 10,049 | | | | | Joy Global, Inc. | | | 358,950 | | |
| | 5,361 | | | @ | | Terex Corp. | | | 64,707 | | |
| | | | 515,049 | | |
| | | | | Machinery-Diversified: 0.4% | |
| | 3,917 | | | @ | | AGCO Corp. | | | 113,867 | | |
| | 2,079 | | | | | Albany International Corp. | | | 23,658 | | |
| | 7,500 | | | | | Applied Industrial
Technologies, Inc. | | | 147,750 | | |
| | 2,000 | | | | | Briggs & Stratton Corp. | | | 26,680 | | |
| | 3,000 | | | | | Cognex Corp. | | | 42,390 | | |
| | 10,100 | | | | | Flowserve Corp. | | | 705,081 | | |
| | 8,750 | | | @ | | Gardner Denver, Inc. | | | 220,238 | | |
| | 1,450 | | | | | Graco, Inc. | | | 31,929 | | |
| | 9,581 | | | | | IDEX Corp. | | | 235,405 | | |
| | 5,624 | | | @ | | Intermec, Inc. | | | 72,550 | | |
| | 643 | | | L | | Lindsay Manufacturing Co. | | | 21,283 | | |
| | 1,024 | | | | | Nordson Corp. | | | 39,588 | | |
| | 2,684 | | | | | Robbins & Myers, Inc. | | | 51,667 | | |
| | 4,300 | | | | | Rockwell Automation, Inc. | | | 138,116 | | |
| | 8,698 | | | | | Roper Industries, Inc. | | | 394,106 | | |
| | 6,042 | | | | | Wabtec Corp. | | | 194,371 | | |
| | | | 2,458,679 | | |
| | | | | Media: 1.0% | |
| | 170,432 | | | | | Comcast Corp. - Class A | | | 2,469,560 | | |
| | 26,850 | | | @,L | | DIRECTV Group, Inc. | | | 663,464 | | |
See Accompanying Notes to Financial Statements
44
PORTFOLIO OF INVESTMENTS
ING BALANCED PORTFOLIO AS OF JUNE 30, 2009 (UNAUDITED) (CONTINUED)
| Shares | | | | | | Value | |
| | | | | Media (continued) | |
| | 1,100 | | | L | | Factset Research Systems, Inc. | | $ | 54,857 | | |
| | 4,200 | | | | | McGraw-Hill Cos., Inc. | | | 126,462 | | |
| | 4,998 | | | @ | | Time Warner Cable, Inc. | | | 158,287 | | |
| | 65,916 | | | | | Time Warner, Inc. | | | 1,660,424 | | |
| | 39,000 | | | @ | | Viacom - Class B | | | 885,300 | | |
| | | | 6,018,354 | | |
| | | | | Metal Fabricate/Hardware: 0.3% | |
| | 550 | | | | | Kaydon Corp. | | | 17,908 | | |
| | 1,100 | | | | | Lawson Products | | | 15,631 | | |
| | 7,946 | | | | | Mueller Industries, Inc. | | | 165,277 | | |
| | 14,464 | | | | | Precision Castparts Corp. | | | 1,056,306 | | |
| | 95 | | | @ | | RTI International Metals, Inc. | | | 1,679 | | |
| | 6,000 | | | | | Timken Co. | | | 102,480 | | |
| | 1,200 | | | | | Valmont Industries, Inc. | | | 86,496 | | |
| | 9,884 | | | | | Worthington Industries | | | 126,416 | | |
| | | | 1,572,193 | | |
| | | | | Mining: 0.0% | |
| | 1,950 | | | | | Amcol International Corp. | | | 42,081 | | |
| | 1,689 | | | @ | | Brush Engineered Materials, Inc. | | | 28,291 | | |
| | 152 | | | @ | | Century Aluminum Co. | | | 947 | | |
| | | | 71,319 | | |
| | | | | Miscellaneous Manufacturing: 1.9% | |
| | 11,700 | | | | | Actuant Corp. | | | 142,740 | | |
| | 3,860 | | | L | | Acuity Brands, Inc. | | | 108,273 | | |
| | 140 | | | | | AO Smith Corp. | | | 4,560 | | |
| | 765 | | | | | Aptargroup, Inc. | | | 25,834 | | |
| | 1,653 | | | @ | | AZZ, Inc. | | | 56,880 | | |
| | 6,067 | | | | | Brink's Co. | | | 176,125 | | |
| | 7,250 | | | | | Carlisle Cos., Inc. | | | 174,290 | | |
| | 5,260 | | | @ | | Ceradyne, Inc. | | | 92,892 | | |
| | 3,183 | | | | | Clarcor, Inc. | | | 92,912 | | |
| | 17,300 | | | | | Cooper Industries Ltd. | | | 537,165 | | |
| | 4,479 | | | | | Crane Co. | | | 99,926 | | |
| | 6,873 | | | | | Donaldson Co., Inc. | | | 238,081 | | |
| | 58,570 | | | | | Dover Corp. | | | 1,938,081 | | |
| | 3,100 | | | | | Eaton Corp. | | | 138,291 | | |
| | 6,000 | | | @,S | | EnPro Industries, Inc. | | | 108,060 | | |
| | 3,155 | | | @ | | ESCO Technologies, Inc. | | | 141,344 | | |
| | 11,405 | | | | | Federal Signal Corp. | | | 87,248 | | |
| | 360,562 | | | | | General Electric Co. | | | 4,225,787 | | |
| | 5,536 | | | @ | | Griffon Corp. | | | 46,060 | | |
| | 8,284 | | | | | Harsco Corp. | | | 234,437 | | |
| | 17,000 | | | | | Honeywell International, Inc. | | | 533,800 | | |
| | 36,423 | | | | | ITT Corp. | | | 1,620,824 | | |
| | 3,150 | | | | | John Bean Technologies Corp. | | | 39,438 | | |
| | 2,342 | | | | | Myers Industries, Inc. | | | 19,485 | | |
| | 3,147 | | | | | Pentair, Inc. | | | 80,626 | | |
| | 2,098 | | | | | SPX Corp. | | | 102,739 | | |
| | 1,403 | | | | | Standex International Corp. | | | 16,275 | | |
| | 2,347 | | | L | | Sturm Ruger & Co., Inc. | | | 29,197 | | |
| | 2,300 | | | | | Teleflex, Inc. | | | 103,109 | | |
| | 5,000 | | | | | Tredegar Corp. | | | 66,600 | | |
| | | | 11,281,079 | | |
| | | | | Office Furnishings: 0.1% | |
| | 10,202 | | | | | Herman Miller, Inc. | | | 156,499 | | |
| | 2,250 | | | | | HNI, Corp. | | | 40,635 | | |
| | 6,469 | | | | | Interface, Inc. | | | 40,108 | | |
| | | | 237,242 | | |
| Shares | | | | | | Value | |
| | | | | Office/Business Equipment: 0.3% | |
| | 64,400 | | | | | Pitney Bowes, Inc. | | $ | 1,412,292 | | |
| | 70,704 | | | | | Xerox Corp. | | | 458,162 | | |
| | | | 1,870,454 | | |
| | | | | Oil & Gas: 4.7% | |
| | 13,029 | | | | | Anadarko Petroleum Corp. | | | 591,386 | | |
| | 11,588 | | | | | Apache Corp. | | | 836,074 | | |
| | 8,562 | | | @ | | Atwood Oceanics, Inc. | | | 213,279 | | |
| | 4,900 | | | @ | | Bill Barrett Corp. | | | 134,554 | | |
| | 56,076 | | | | | Chevron Corp. | | | 3,715,035 | | |
| | 3,500 | | | | | Cimarex Energy Co. | | | 99,190 | | |
| | 3,935 | | | @ | | Comstock Resources, Inc. | | | 130,052 | | |
| | 14,527 | | | | | ConocoPhillips | | | 611,006 | | |
| | 9,700 | | | L | | Diamond Offshore Drilling | | | 805,585 | | |
| | 8,600 | | | @ | | Encore Acquisition Co. | | | 265,310 | | |
| | 161,832 | | | | | ExxonMobil Corp. | | | 11,313,675 | | |
| | 4,850 | | | @ | | Forest Oil Corp. | | | 72,362 | | |
| | 18,612 | | | | | Frontier Oil Corp. | | | 244,003 | | |
| | 9,050 | | | | | Helmerich & Payne, Inc. | | | 279,374 | | |
| | 9,883 | | | | | Hess Corp. | | | 531,211 | | |
| | 4,655 | | | | | Holly Corp. | | | 83,697 | | |
| | 9,475 | | | | | Marathon Oil Corp. | | | 285,482 | | |
| | 25,124 | | | | | Murphy Oil Corp. | | | 1,364,736 | | |
| | 9,460 | | | @ | | Newfield Exploration Co. | | | 309,058 | | |
| | 33,414 | | | | | Occidental Petroleum Corp. | | | 2,198,975 | | |
| | 18,300 | | | | | Patterson-UTI Energy, Inc. | | | 235,338 | | |
| | 1,850 | | | | | Penn Virginia Corp. | | | 30,285 | | |
| | 758 | | | @ | | Petroleum Development Corp. | | | 11,893 | | |
| | 82 | | | @ | | Petroquest Energy, Inc. | | | 303 | | |
| | 1,995 | | | @ | | Pioneer Drilling Co. | | | 9,556 | | |
| | 5,746 | | | @ | | Plains Exploration &
Production Co. | | | 157,211 | | |
| | 5,850 | | | @ | | Pride International, Inc. | | | 146,601 | | |
| | 11,550 | | | @,L | | Quicksilver Resources, Inc. | | | 107,300 | | |
| | 14,960 | | | @ | | Southwestern Energy Co. | | | 581,196 | | |
| | 3,072 | | | | | St. Mary Land & Exploration Co. | | | 64,113 | | |
| | 9,298 | | | @ | | Stone Energy Corp. | | | 68,991 | | |
| | 48 | | | @ | | Swift Energy Co. | | | 799 | | |
| | 28,379 | | | L | | Tesoro Corp. | | | 361,265 | | |
| | 37,100 | | | | | XTO Energy, Inc. | | | 1,414,994 | | |
| | | | 27,273,889 | | |
| | | | | Oil & Gas Services: 1.3% | |
| | 3,842 | | | @ | | Basic Energy Services, Inc. | | | 26,241 | | |
| | 43,072 | | | | | BJ Services Co. | | | 587,071 | | |
| | 65,920 | | | @ | | Cameron International Corp. | | | 1,865,536 | | |
| | 1,621 | | | L | | CARBO Ceramics, Inc. | | | 55,438 | | |
| | 2,600 | | | @ | | Dril-Quip, Inc. | | | 99,060 | | |
| | 7,800 | | | @ | | Exterran Holdings, Inc. | | | 125,112 | | |
| | 1,980 | | | | | Gulf Island Fabrication, Inc. | | | 31,343 | | |
| | 4,467 | | | @ | | Helix Energy Solutions
Group, Inc. | | | 48,556 | | |
| | 4,377 | | | @ | | Hornbeck Offshore Services, Inc. | | | 93,624 | | |
| | 2,489 | | | @,L | | ION Geophysical Corp. | | | 6,397 | | |
| | 1,100 | | | | | Lufkin Industries, Inc. | | | 46,255 | | |
| | 5,700 | | | @ | | Matrix Service Co. | | | 65,436 | | |
| | 1,397 | | | @ | | NATCO Group, Inc. | | | 45,989 | | |
| | 60,619 | | | @ | | National Oilwell Varco, Inc. | | | 1,979,817 | | |
| | 2,921 | | | @ | | Oceaneering International, Inc. | | | 132,029 | | |
| | 5,825 | | | @ | | Oil States International, Inc. | | | 141,023 | | |
| | 33,768 | | | | | Schlumberger Ltd. | | | 1,827,186 | | |
| | 3,079 | | | @ | | SEACOR Holdings, Inc. | | | 231,664 | | |
See Accompanying Notes to Financial Statements
45
PORTFOLIO OF INVESTMENTS
ING BALANCED PORTFOLIO AS OF JUNE 30, 2009 (UNAUDITED) (CONTINUED)
| Shares | | | | | | Value | |
| | | | | Oil & Gas Services (continued) | |
| | 3,600 | | | @ | | Superior Energy Services | | $ | 62,172 | | |
| | 6,104 | | | @ | | Tetra Technologies, Inc. | | | 48,588 | | |
| | | | 7,518,537 | | |
| | | | | Packaging & Containers: 0.5% | |
| | 7,539 | | | | | Ball Corp. | | | 340,461 | | |
| | 31,524 | | | | | Bemis Co. | | | 794,405 | | |
| | 6,500 | | | | | Packaging Corp. of America | | | 105,300 | | |
| | 35,300 | | | @ | | Pactiv Corp. | | | 766,010 | | |
| | 6,030 | | | | | Rock-Tenn Co. | | | 230,105 | | |
| | 28,244 | | | | | Sealed Air Corp. | | | 521,102 | | |
| | 10,611 | | | | | Sonoco Products Co. | | | 254,133 | | |
| | 3,290 | | | | | Temple-Inland, Inc. | | | 43,165 | | |
| | | | 3,054,681 | | |
| | | | | Pharmaceuticals: 3.6% | |
| | 54,396 | | | | | Abbott Laboratories | | | 2,558,788 | | |
| | 29,738 | | | | | AmerisourceBergen Corp. | | | 527,552 | | |
| | 70,272 | | | | | Bristol-Myers Squibb Co. | | | 1,427,224 | | |
| | 3,950 | | | @ | | Catalyst Health Solutions, Inc. | | | 98,513 | | |
| | 72,596 | | | | | Eli Lilly & Co. | | | 2,514,725 | | |
| | 15,650 | | | @ | | Endo Pharmaceuticals
Holdings, Inc. | | | 280,448 | | |
| | 14,960 | | | @ | | Express Scripts, Inc. | | | 1,028,500 | | |
| | 30,814 | | | @ | | Forest Laboratories, Inc. | | | 773,740 | | |
| | 27,600 | | | @ | | King Pharmaceuticals, Inc. | | | 265,788 | | |
| | 4,829 | | | S | | McKesson Corp. | | | 212,476 | | |
| | 27,028 | | | @ | | Medco Health Solutions, Inc. | | | 1,232,747 | | |
| | 1,513 | | | | | Medicis Pharmaceutical Corp. | | | 24,692 | | |
| | 16,706 | | | | | Merck & Co., Inc. | | | 467,100 | | |
| | 10,450 | | | | | Omnicare, Inc. | | | 269,192 | | |
| | 3,650 | | | @ | | Par Pharmaceutical Cos., Inc. | | | 55,298 | | |
| | 3,450 | | | | | Perrigo Co. | | | 95,841 | | |
| | 325,370 | | | | | Pfizer, Inc. | | | 4,880,550 | | |
| | 6,300 | | | @ | | PharMerica Corp. | | | 123,669 | | |
| | 2,180 | | | @ | | Salix Pharmaceuticals Ltd. | | | 21,517 | | |
| | 53,860 | | | | | Schering-Plough Corp. | | | 1,352,963 | | |
| | 12,100 | | | @ | | Sepracor, Inc. | | | 209,572 | | |
| | 11,050 | | | @,L | | Valeant Pharmaceuticals
International | | | 284,206 | | |
| | 11,020 | | | @ | | Viropharma, Inc. | | | 65,349 | | |
| | 13,950 | | | @ | | Watson Pharmaceuticals, Inc. | | | 469,976 | | |
| | 46,259 | | | | | Wyeth | | | 2,099,696 | | |
| | | | 21,340,122 | | |
| | | | | Pipelines: 0.1% | |
| | 5,516 | | | | | Oneok, Inc. | | | 162,667 | | |
| | 16,400 | | | | | Williams Cos., Inc. | | | 256,004 | | |
| | | | 418,671 | | |
| | | | | Real Estate: 0.0% | |
| | 2,850 | | | @,L | | Forestar Real Estate Group, Inc. | | | 33,858 | | |
| | | | 33,858 | | |
| | | | | Retail: 4.3% | |
| | 3,200 | | | @ | | 99 Cents Only Stores | | | 43,456 | | |
| | 8,550 | | | | | Advance Auto Parts, Inc. | | | 354,740 | | |
| | 7,400 | | | @ | | Aeropostale, Inc. | | | 253,598 | | |
| | 3,200 | | | | | American Eagle Outfitters | | | 45,344 | | |
| | 26,800 | | | @,L | | Autonation, Inc. | | | 464,980 | | |
| | 7,700 | | | L | | Barnes & Noble, Inc. | | | 158,851 | | |
| | 1,474 | | | | | Big 5 Sporting Goods Corp. | | | 16,302 | | |
| | 4,800 | | | @ | | BJ's Wholesale Club, Inc. | | | 154,704 | | |
| Shares | | | | | | Value | |
| | 2,146 | | | | | Bob Evans Farms, Inc. | | $ | 61,676 | | |
| | 11,113 | | | S | | Brinker International, Inc. | | | 189,254 | | |
| | 4,360 | | | | | Buckle, Inc. | | | 138,517 | | |
| | 1,800 | | | @,L | | Buffalo Wild Wings, Inc. | | | 58,536 | | |
| | 6,450 | | | @ | | Cabela's, Inc. | | | 79,335 | | |
| | 6,200 | | | @ | | California Pizza Kitchen, Inc. | | | 82,398 | | |
| | 8,293 | | | @,L | | Carmax, Inc. | | | 121,907 | | |
| | 3,500 | | | | | Casey's General Stores, Inc. | | | 89,915 | | |
| | 6,200 | | | | | Cash America International, Inc. | | | 145,018 | | |
| | 9,600 | | | | | Cato Corp. | | | 167,424 | | |
| | 3,000 | | | @ | | CEC Entertainment, Inc. | | | 88,440 | | |
| | 5,578 | | | @ | | Charlotte Russe Holding, Inc. | | | 71,845 | | |
| | 10,657 | | | @ | | Cheesecake Factory | | | 184,366 | | |
| | 15,600 | | | @ | | Chico's FAS, Inc. | | | 151,788 | | |
| | 4,791 | | | @ | | Childrens Place Retail
Stores, Inc. | | | 126,626 | | |
| | 2,250 | | | @,L | | Chipotle Mexican Grill, Inc. | | | 180,000 | | |
| | 344 | | | | | Christopher & Banks Corp. | | | 2,308 | | |
| | 11,600 | | | @ | | Coldwater Creek, Inc. | | | 70,296 | | |
| | 4,247 | | | @ | | Collective Brands, Inc. | | | 61,879 | | |
| | 1,992 | | | @ | | Copart, Inc. | | | 69,063 | | |
| | 2,389 | | | | | Cracker Barrel Old Country Store | | | 66,653 | | |
| | 53,490 | | | | | CVS Caremark Corp. | | | 1,704,726 | | |
| | 6,200 | | | @ | | Dick's Sporting Goods, Inc. | | | 106,640 | | |
| | 1,551 | | | L | | DineEquity, Inc. | | | 48,376 | | |
| | 8,550 | | | @ | | Dollar Tree, Inc. | | | 359,955 | | |
| | 9,700 | | | @,L | | Dress Barn, Inc. | | | 138,710 | | |
| | 18,810 | | | | | Family Dollar Stores, Inc. | | | 532,323 | | |
| | 6,050 | | | | | Finish Line | | | 44,891 | | |
| | 6,230 | | | @ | | First Cash Financial Services, Inc. | | | 109,150 | | |
| | 13,950 | | | | | Foot Locker, Inc. | | | 146,057 | | |
| | 10,105 | | | | | Fred's, Inc. | | | 127,323 | | |
| | 48,598 | | | | | Gap, Inc. | | | 797,007 | | |
| | 885 | | | @ | | Genesco, Inc. | | | 16,611 | | |
| | 2,300 | | | | | Group 1 Automotive, Inc. | | | 59,846 | | |
| | 3,653 | | | | | Guess ?, Inc. | | | 94,174 | | |
| | 5,050 | | | @ | | Gymboree Corp. | | | 179,174 | | |
| | 2,300 | | | | | Haverty Furniture Cos., Inc. | | | 21,045 | | |
| | 3,150 | | | @,L | | Hibbett Sporting Goods, Inc. | | | 56,700 | | |
| | 84,764 | | | | | Home Depot, Inc. | | | 2,002,973 | | |
| | 6,300 | | | @ | | HOT Topic, Inc. | | | 46,053 | | |
| | 4,300 | | | @ | | HSN, Inc. | | | 45,451 | | |
| | 2,100 | | | @ | | Jack in the Box, Inc. | | | 47,145 | | |
| | 14,800 | | | | | JC Penney Co., Inc. | | | 424,908 | | |
| | 3,750 | | | @ | | Jo-Ann Stores, Inc. | | | 77,513 | | |
| | 2,568 | | | @,L | | JoS. A Bank Clothiers, Inc. | | | 88,493 | | |
| | 19,400 | | | @ | | Kohl's Corp. | | | 829,350 | | |
| | 651 | | | L | | Landry's Restaurants, Inc. | | | 5,599 | | |
| | 47,400 | | | S | | Limited Brands, Inc. | | | 567,378 | | |
| | 46,700 | | | | | Lowe's Cos., Inc. | | | 906,447 | | |
| | 6,700 | | | @ | | MarineMax, Inc. | | | 23,048 | | |
| | 34,460 | | | | | McDonald's Corp. | | | 1,981,105 | | |
| | 4,352 | | | | | Men's Wearhouse, Inc. | | | 83,471 | | |
| | 5,818 | | | | | MSC Industrial Direct Co. | | | 206,423 | | |
| | 408 | | | | | OfficeMax, Inc. | | | 2,562 | | |
| | 3,200 | | | @ | | Panera Bread Co. | | | 159,552 | | |
| | 4,251 | | | @ | | PetMed Express, Inc. | | | 63,893 | | |
| | 14,760 | | | | | Petsmart, Inc. | | | 316,750 | | |
| | 4,010 | | | @,L | | PF Chang's China Bistro, Inc. | | | 128,561 | | |
| | 5,419 | | | | | Phillips-Van Heusen | | | 155,471 | | |
| | 252 | | | @,L | | Red Robin Gourmet Burgers, Inc. | | | 4,725 | | |
| | 9,332 | | | | | Regis Corp. | | | 162,470 | | |
| | 13,650 | | | | | Ross Stores, Inc. | | | 526,890 | | |
| | 3,608 | | | @ | | Ruby Tuesday, Inc. | | | 24,029 | | |
| | 8,100 | | | @,L | | Sears Holding Corp. | | | 538,812 | | |
See Accompanying Notes to Financial Statements
46
PORTFOLIO OF INVESTMENTS
ING BALANCED PORTFOLIO AS OF JUNE 30, 2009 (UNAUDITED) (CONTINUED)
| Shares | | | | | | Value | |
| | | | | Retail (continued) | |
| | 9,992 | | | | | Stage Stores, Inc. | | $ | 110,911 | | |
| | 23,695 | | | | | Staples, Inc. | | | 477,928 | | |
| | 9,900 | | | @ | | Starbucks Corp. | | | 137,511 | | |
| | 6,929 | | | @ | | Steak N Shake Co. | | | 60,559 | | |
| | 6,812 | | | @ | | Stein Mart, Inc. | | | 60,354 | | |
| | 38,504 | | | | | Target Corp. | | | 1,519,753 | | |
| | 2,770 | | | @ | | Texas Roadhouse, Inc. | | | 30,221 | | |
| | 8,127 | | | | | TJX Cos., Inc. | | | 255,675 | | |
| | 5,900 | | | @ | | Tractor Supply Co. | | | 243,788 | | |
| | 1,025 | | | @ | | Tuesday Morning Corp. | | | 3,454 | | |
| | 1,953 | | | @ | | Urban Outfitters, Inc. | | | 40,759 | | |
| | 20,863 | | | | | Walgreen Co. | | | 613,372 | | |
| | 75,733 | | | | | Wal-Mart Stores, Inc. | | | 3,668,507 | | |
| | 10,200 | | | | | Williams-Sonoma, Inc. | | | 121,074 | | |
| | 4,360 | | | | | World Fuel Services Corp. | | | 179,763 | | |
| | 1,055 | | | @,L | | Zale Corp. | | | 3,629 | | |
| | 462 | | | @ | | Zumiez, Inc. | | | 3,701 | | |
| | | | 25,191,958 | | |
| | | | | Savings & Loans: 0.5% | |
| | 384 | | | | | Brookline Bancorp., Inc. | | | 3,579 | | |
| | 52 | | | | | Dime Community Bancshares | | | 474 | | |
| | 14,120 | | | | | First Niagara Financial
Group, Inc. | | | 161,250 | | |
| | 139,631 | | | | | Hudson City Bancorp., Inc. | | | 1,855,696 | | |
| | 36,550 | | | | | New York Community
Bancorp., Inc. | | | 390,720 | | |
| | 20,100 | | | | | NewAlliance Bancshares, Inc. | | | 231,150 | | |
| | | | 2,642,869 | | |
| | | | | Semiconductors: 1.2% | |
| | 6,100 | | | @ | | Broadcom Corp. | | | 151,219 | | |
| | 133 | | | @ | | Cabot Microelectronics Corp. | | | 3,763 | | |
| | 3,300 | | | @,L | | Cree, Inc. | | | 96,987 | | |
| | 21,797 | | | @ | | Cypress Semiconductor Corp. | | | 200,532 | | |
| | 2,570 | | | @ | | Diodes, Inc. | | | 40,195 | | |
| | 4,601 | | | @ | | DSP Group, Inc. | | | 31,103 | | |
| | 1,400 | | | @ | | Hittite Microwave Corp. | | | 48,650 | | |
| | 17,400 | | | @ | | Integrated Device
Technology, Inc. | | | 105,096 | | |
| | 84,530 | | | | | Intel Corp. | | | 1,398,972 | | |
| | 6,223 | | | | | Intersil Corp. | | | 78,223 | | |
| | 6,200 | | | @ | | Kopin Corp. | | | 22,754 | | |
| | 1,576 | | | @ | | Kulicke & Soffa Industries, Inc. | | | 5,406 | | |
| | 4,200 | | | @ | | Lam Research Corp. | | | 109,200 | | |
| | 11,321 | | | @ | | Microsemi Corp. | | | 156,230 | | |
| | 6,950 | | | @ | | MKS Instruments, Inc. | | | 91,671 | | |
| | 3,600 | | | @ | | Rudolph Technologies, Inc. | | | 19,872 | | |
| | 9,174 | | | @ | | Semtech Corp. | | | 145,958 | | |
| | 2,500 | | | @,S | | Silicon Laboratories, Inc. | | | 94,850 | | |
| | 18,100 | | | @ | | Skyworks Solutions, Inc. | | | 177,018 | | |
| | 900 | | | @,L | | Supertex, Inc. | | | 22,599 | | |
| | 125,600 | | | | | Texas Instruments, Inc. | | | 2,675,280 | | |
| | 6,503 | | | @ | | Triquint Semiconductor, Inc. | | | 34,531 | | |
| | 3,600 | | | @ | | Ultratech, Inc. | | | 44,316 | | |
| | 7,435 | | | @ | | Varian Semiconductor
Equipment Associates, Inc. | | | 178,366 | | |
| | 7,335 | | | @ | | Veeco Instruments, Inc. | | | 85,013 | | |
| | 34,708 | | | | | Xilinx, Inc. | | | 710,126 | | |
| | | | 6,727,930 | | |
| | | | | Software: 2.7% | |
| | 11,294 | | | | | Acxiom Corp. | | | 99,726 | | |
| | 1,049 | | | @,L | | Advent Software, Inc. | | | 34,397 | | |
| Shares | | | | | | Value | |
| | 5,350 | | | @ | | Ansys, Inc. | | $ | 166,706 | | |
| | 1,410 | | | @ | | Avid Technology, Inc. | | | 18,908 | | |
| | 3,947 | | | | | Blackbaud, Inc. | | | 61,376 | | |
| | 16,300 | | | | | Broadridge Financial
Solutions ADR | | | 270,254 | | |
| | 63,166 | | | | | CA, Inc. | | | 1,100,983 | | |
| | 2,850 | | | @,L | | Cerner Corp. | | | 177,527 | | |
| | 4,685 | | | @ | | Commvault Systems, Inc. | | | 77,677 | | |
| | 59,300 | | | @ | | Compuware Corp. | | | 406,798 | | |
| | 3,903 | | | @ | | Concur Technologies, Inc. | | | 121,305 | | |
| | 7,147 | | | @ | | CSG Systems International | | | 94,626 | | |
| | 884 | | | @ | | Digi International, Inc. | | | 8,619 | | |
| | 709 | | | @ | | Ebix, Inc. | | | 22,206 | | |
| | 9,236 | | | @ | | Eclipsys Corp. | | | 164,216 | | |
| | 14,950 | | | @ | | Epicor Software Corp. | | | 79,235 | | |
| | 12,950 | | | | | Fair Isaac Corp. | | | 200,207 | | |
| | 39,996 | | | | | Fidelity National Information
Services, Inc. | | | 798,320 | | |
| | 12,640 | | | @ | | Fiserv, Inc. | | | 577,648 | | |
| | 9,780 | | | @ | | Informatica Corp. | | | 168,118 | | |
| | 9,800 | | | @ | | Intuit, Inc. | | | 275,968 | | |
| | 4,400 | | | @ | | JDA Software Group, Inc. | | | 65,824 | | |
| | 7,000 | | | @ | | Metavante Technologies, inc. | | | 181,020 | | |
| | 250,332 | | | | | Microsoft Corp. | | | 5,950,353 | | |
| | 168,294 | | | @ | | Oracle Corp. | | | 3,604,857 | | |
| | 14,250 | | | @ | | Parametric Technology Corp. | | | 166,583 | | |
| | 6,780 | | | @ | | Phase Forward, Inc. | | | 102,446 | | |
| | 4,600 | | | @ | | Progress Software Corp. | | | 97,382 | | |
| | 852 | | | | | Quality Systems, Inc. | | | 48,530 | | |
| | 3,760 | | | @ | | Smith Micro Software, Inc. | | | 36,923 | | |
| | 2,700 | | | @ | | SPSS, Inc. | | | 90,099 | | |
| | 10,643 | | | @ | | Sybase, Inc. | | | 333,552 | | |
| | 4,900 | | | @ | | SYNNEX Corp. | | | 122,451 | | |
| | 8,870 | | | @ | | Take-Two Interactive
Software, Inc. | | | 83,999 | | |
| | 3,200 | | | @ | | Taleo Corp. | | | 58,464 | | |
| | 2,381 | | | @ | | Tyler Technologies, Inc. | | | 37,191 | | |
| | 4,900 | | | @ | | Wind River Systems, Inc. | | | 56,154 | | |
| | | | 15,960,648 | | |
| | | | | Storage/Warehousing: 0.0% | |
| | 309 | | | @ | | Mobile Mini, Inc. | | | 4,533 | | |
| | | | 4,533 | | |
| | | | | Telecommunications: 3.3% | |
| | 44,050 | | | @ | | 3Com Corp. | | | 207,476 | | |
| | 7,541 | | | @ | | ADC Telecommunications, Inc. | | | 60,026 | | |
| | 1,194 | | | | | Adtran, Inc. | | | 25,635 | | |
| | 1,960 | | | @ | | Anixter International, Inc. | | | 73,676 | | |
| | 2,100 | | | | | Applied Signal Technology, Inc. | | | 53,571 | | |
| | 15,618 | | | @ | | Arris Group, Inc. | | | 189,915 | | |
| | 193,957 | | | | | AT&T, Inc. | | | 4,817,892 | | |
| | 3,421 | | | | | Black Box Corp. | | | 114,501 | | |
| | 2,700 | | | @ | | Cbeyond, Inc. | | | 38,745 | | |
| | 16,400 | | | @,S | | Cincinnati Bell, Inc. | | | 46,576 | | |
| | 272,461 | | | @ | | Cisco Systems, Inc. | | | 5,078,673 | | |
| | 11,563 | | | @ | | CommScope, Inc. | | | 303,644 | | |
| | 5,170 | | | @ | | Comtech Telecommunications | | | 164,820 | | |
| | 18,912 | | | | | Corning, Inc. | | | 303,727 | | |
| | 4,980 | | | | | Embarq Corp. | | | 209,459 | | |
| | 7,340 | | | | | Fairpoint Communications, Inc. | | | 4,404 | | |
| | 3,000 | | | @ | | General Communication, Inc. | | | 20,790 | | |
| | 15,000 | | | @ | | Harmonic, Inc. | | | 88,350 | | |
| | 9,487 | | | | | Harris Corp. | | | 269,051 | | |
See Accompanying Notes to Financial Statements
47
PORTFOLIO OF INVESTMENTS
ING BALANCED PORTFOLIO AS OF JUNE 30, 2009 (UNAUDITED) (CONTINUED)
| Shares | | | | | | Value | |
| | | | | Telecommunications (continued) | |
| | 3,000 | | | | | Iowa Telecommunications
Services, Inc. | | $ | 37,530 | | |
| | 4,350 | | | @ | | Netgear, Inc. | | | 62,684 | | |
| | 9,600 | | | @ | | NeuStar, Inc. | | | 212,736 | | |
| | 2,400 | | | @ | | Neutral Tandem, Inc. | | | 70,848 | | |
| | 6,098 | | | @ | | Novatel Wireless, Inc. | | | 55,004 | | |
| | 11,016 | | | | | Plantronics, Inc. | | | 208,313 | | |
| | 4,400 | | | @ | | Polycom, Inc. | | | 89,188 | | |
| | 61,066 | | | | | Qualcomm, Inc. | | | 2,760,183 | | |
| | 32,600 | | | L | | Qwest Communications
International, Inc. | | | 135,290 | | |
| | 116,595 | | | @ | | Sprint Nextel Corp. | | | 560,822 | | |
| | 6,903 | | | @ | | Symmetricom, Inc. | | | 39,830 | | |
| | 5,611 | | | @ | | Syniverse Holdings, Inc. | | | 89,944 | | |
| | 4,200 | | | @ | | Tekelec | | | 70,686 | | |
| | 6,025 | | | | | Telephone & Data Systems, Inc. | | | 170,508 | | |
| | 93,725 | | | | | Verizon Communications, Inc. | | | 2,880,169 | | |
| | | | 19,514,666 | | |
| | | | | Textiles: 0.1% | |
| | 6,700 | | | | | Cintas Corp. | | | 153,028 | | |
| | 6,430 | | | | | G&K Services, Inc. | | | 135,995 | | |
| | 882 | | | @ | | Mohawk Industries, Inc. | | | 31,470 | | |
| | 1,866 | | | | | Unifirst Corp. | | | 69,359 | | |
| | | | 389,852 | | |
| | | | | Toys/Games/Hobbies: 0.0% | |
| | 348 | | | @ | | Jakks Pacific, Inc. | | | 4,465 | | |
| | 5,400 | | | @ | | Marvel Entertainment, Inc. | | | 192,186 | | |
| | | | 196,651 | | |
| | | | | Transportation: 0.8% | |
| | 1,153 | | | @ | | Bristow Group, Inc. | | | 34,163 | | |
| | 2,800 | | | | | CH Robinson Worldwide, Inc. | | | 146,020 | | |
| | 949 | | | | | Con-way, Inc. | | | 33,509 | | |
| | 34,200 | | | | | CSX Corp. | | | 1,184,346 | | |
| | 8,975 | | | | | Heartland Express, Inc. | | | 132,112 | | |
| | 6,271 | | | @ | | HUB Group, Inc. | | | 129,433 | | |
| | 2,607 | | | | | JB Hunt Transport Services, Inc. | | | 79,592 | | |
| | 1,512 | | | @ | | Kansas City Southern | | | 24,358 | | |
| | 4,091 | | | @ | | Kirby Corp. | | | 130,053 | | |
| | 1,600 | | | | | Knight Transportation, Inc. | | | 26,480 | | |
| | 4,222 | | | | | Landstar System, Inc. | | | 151,612 | | |
| | 3,000 | | | @ | | Old Dominion Freight Line | | | 100,710 | | |
| | 6,974 | | | | | Tidewater, Inc. | | | 298,975 | | |
| | 17,117 | | | | | Union Pacific Corp. | | | 891,111 | | |
| | 30,200 | | | | | United Parcel Service,
Inc. - Class B | | | 1,509,698 | | |
| | | | 4,872,172 | | |
| | | | | Trucking & Leasing: 0.0% | |
| | 800 | | | | | GATX Corp. | | | 20,576 | | |
| | | | 20,576 | | |
| | | | | Water: 0.0% | |
| | 7,900 | | | | | Aqua America, Inc. | | | 141,410 | | |
| | | | 141,410 | | |
Total Common Stock
(Cost $342,073,483) | | | 343,664,621 | | |
| Shares | | | | | | Value | |
| REAL ESTATE INVESTMENT TRUSTS: 1.4% | | | |
| | | | | Apartments: 0.3% | |
| | 4,300 | | | | | BRE Properties, Inc. | | $ | 102,168 | | |
| | 7,125 | | | | | Camden Property Trust | | | 196,650 | | |
| | 28,366 | | | | | Equity Residential | | | 630,576 | | |
| | 2,160 | | | | | Home Properties, Inc. | | | 73,656 | | |
| | 3,600 | | | | | Mid-America Apartment
Communities, Inc. | | | 132,156 | | |
| | 1,800 | | | | | Post Properties, Inc. | | | 24,192 | | |
| | 25,000 | | | | | UDR, Inc. | | | 258,250 | | |
| | | | 1,417,648 | | |
| | | | | Diversified: 0.1% | |
| | 7,855 | | | | | Colonial Properties Trust | | | 58,127 | | |
| | 13,235 | | | | | Cousins Properties, Inc. | | | 112,498 | | |
| | 9,402 | | | | | Duke Realty Corp. | | | 82,456 | | |
| | 4,340 | | | | | Entertainment Properties Trust | | | 89,404 | | |
| | 14,292 | | | | | Lexington Realty Trust | | | 48,593 | | |
| | 13,450 | | | | | Liberty Property Trust | | | 309,888 | | |
| | 1,626 | | | | | PS Business Parks, Inc. | | | 78,763 | | |
| | | | 779,729 | | |
| | | | | Forest Products & Paper: 0.1% | |
| | 9,550 | | | | | Rayonier, Inc. | | | 347,143 | | |
| | | | 347,143 | | |
| | | | | Health Care: 0.1% | |
| | 9,100 | | | | | Medical Properties Trust, Inc. | | | 55,237 | | |
| | 12,900 | | | | | Nationwide Health
Properties, Inc. | | | 332,046 | | |
| | 9,020 | | | | | Senior Housing Properties Trust | | | 147,206 | | |
| | | | 534,489 | | |
| | | | | Hotels: 0.1% | |
| | 20,711 | | | @ | | DiamondRock Hospitality Co. | | | 129,651 | | |
| | 17,800 | | | @ | | Hospitality Properties Trust | | | 211,642 | | |
| | 9,789 | | | | | LaSalle Hotel Properties | | | 120,796 | | |
| | | | 462,089 | | |
| | | | | Office Property: 0.2% | |
| | 674 | | | | | Alexandria Real Estate
Equities, Inc. | | | 24,122 | | |
| | 13,010 | | | | | BioMed Realty Trust, Inc. | | | 133,092 | | |
| | 5,300 | | | | | Corporate Office Properties
Trust SBI MD | | | 155,449 | | |
| | 2,500 | | | | | Franklin Street Properties Corp. | | | 33,125 | | |
| | 6,736 | | | | | Highwoods Properties, Inc. | | | 150,684 | | |
| | 3,099 | | | | | Kilroy Realty Corp. | | | 63,653 | | |
| | 12,200 | | | | | Mack-Cali Realty Corp. | | | 278,160 | | |
| | 4,830 | | | | | Parkway Properties, Inc. | | | 62,790 | | |
| | 9,350 | | | | | SL Green Realty Corp. | | | 214,489 | | |
| | | | 1,115,564 | | |
| | | | | Regional Malls: 0.3% | |
| | 4,576 | | | L | | Macerich Co. | | | 80,583 | | |
| | 8,650 | | | L | | Pennsylvania Real Estate
Investment Trust | | | 43,250 | | |
| | 34,282 | | | L | | Simon Property Group, Inc. | | | 1,763,123 | | |
| | | | 1,886,956 | | |
| | | | | Shopping Centers: 0.1% | |
| | 1,004 | | | | | Acadia Realty Trust | | | 13,102 | | |
| | 7,950 | | | @ | | Cedar Shopping Centers, Inc. | | | 35,934 | | |
| | 1,200 | | | | | Federal Realty Investment Trust | | | 61,824 | | |
See Accompanying Notes to Financial Statements
48
PORTFOLIO OF INVESTMENTS
ING BALANCED PORTFOLIO AS OF JUNE 30, 2009 (UNAUDITED) (CONTINUED)
| Shares | | | | | | Value | |
| | | | | Shopping Centers (continued) | |
| | 1,500 | | | | | Inland Real Estate Corp. | | $ | 10,500 | | |
| | 18,100 | | | | | Kite Realty Group Trust | | | 52,852 | | |
| | 1,500 | | | | | Regency Centers Corp. | | | 52,365 | | |
| | 1,950 | | | | | Tanger Factory Outlet
Centers, Inc. | | | 63,239 | | |
| | 9,100 | | | | | Weingarten Realty Investors | | | 132,041 | | |
| | | | 421,857 | | |
| | | | | Single Tenant: 0.0% | |
| | 4,750 | | | | | National Retail Properties, Inc. | | | 82,413 | | |
| | 1,650 | | | | | Realty Income Corp. | | | 36,168 | | |
| | | | 118,581 | | |
| | | | | Storage: 0.1% | |
| | 2,915 | | | @ | | Extra Space Storage, Inc. | | | 24,340 | | |
| | 9,150 | | | | | Public Storage, Inc. | | | 599,142 | | |
| | 3,196 | | | | | Sovran Self Storage, Inc. | | | 78,622 | | |
| | | | 702,104 | | |
| | | | | Warehouse/Industrial: 0.0% | |
| | 2,600 | | | | | AMB Property Corp. | | | 48,906 | | |
| | 1,250 | | | | | EastGroup Properties, Inc. | | | 41,275 | | |
| | | | 90,181 | | |
Total Real Estate
Investment Trusts
(Cost $8,389,242) | | | 7,876,341 | | |
| PREFERRED STOCK: 0.1% | | | |
| | | | | Diversified Financial Services: 0.1% | |
| | 857 | | | #,P | | Zurich RegCaPS Funding Trust | | | 519,288 | | |
Total Preferred Stock
(Cost $814,150) | | | 519,288 | | |
Principal
Amount | | | | | | Value | |
| CORPORATE BONDS/NOTES: 11.2% | | | |
| | | | | Agriculture: 0.2% | |
| $ | 699,000 | | | | | Altria Group, Inc.,
9.700%, due 11/10/18 | | $ | 802,636 | | |
| | 215,000 | | | | | Philip Morris
International, Inc.,
6.875%, due 03/17/14 | | | 242,835 | | |
| | | | 1,045,471 | | |
| | | | | Banks: 2.8% | |
| | 541,000 | | | | | American Express Bank FSB,
5.500%, due 04/16/13 | | | 531,367 | | |
| | 676,000 | | | C | | Bank of America Corp.,
8.000%, due 12/29/49 | | | 565,388 | | |
| | 140,000 | | | @@,C | | Bank of Ireland, 0.875%,
due 12/29/49 | | | 39,018 | | |
| | 1,438,000 | | | @@,# | | Barclays Bank PLC, 6.050%,
due 12/04/17 | | | 1,248,955 | | |
| | 200,000 | | | @@,C | | BNP Paribas, 1.928%,
due 09/29/49 | | | 84,000 | | |
| | 171,000 | | | | | Capital One Financial Corp.,
7.375%, due 05/23/14 | | | 176,511 | | |
| | 1,065,000 | | | | | Citigroup, Inc., 5.000%,
due 09/15/14 | | | 893,787 | | |
| | 721,000 | | | | | Citigroup, Inc., 5.250%,
due 02/27/12 | | | 704,483 | | |
Principal
Amount | | | | | | Value | |
| $ | 82,000 | | | | | Citigroup, Inc., 8.500%,
due 05/22/19 | | $ | 83,552 | | |
| | 241,000 | | | #,C | | Dresdner Funding Trust I,
8.151%, due 06/30/31 | | | 117,439 | | |
| | 1,114,000 | | | | | Fifth Third Bancorp.,
8.250%, due 03/01/38 | | | 854,691 | | |
| | 864,000 | | | | | First Tennessee Bank NA,
5.650%, due 04/01/16 | | | 648,270 | | |
| | 318,000 | | | | | Goldman Sachs Group, Inc.,
5.250%, due 04/01/13 | | | 325,484 | | |
| | 372,000 | | | | | Goldman Sachs Group, Inc.,
5.450%, due 11/01/12 | | | 384,935 | | |
| | 427,000 | | | | | Goldman Sachs Group, Inc.,
5.500%, due 11/15/14 | | | 428,468 | | |
| | 638,000 | | | | | Goldman Sachs Group, Inc.,
6.000%, due 05/01/14 | | | 666,549 | | |
| | 600,000 | | | @@,C | | HSBC Bank PLC, 1.288%,
due 06/29/49 | | | 285,000 | | |
| | 387,000 | | | | | JPMorgan Chase & Co.,
4.650%, due 06/01/14 | | | 386,398 | | |
| | 344,000 | | | | | JPMorgan Chase Bank NA,
5.875%, due 06/13/16 | | | 332,006 | | |
| | 803,000 | | | | | Morgan Stanley, 2.250%,
due 03/13/12 | | | 810,599 | | |
| | 396,000 | | | | | Morgan Stanley, 4.750%,
due 04/01/14 | | | 374,447 | | |
| | 167,000 | | | C | | Morgan Stanley, 5.300%,
due 03/01/13 | | | 169,288 | | |
| | 84,000 | | | C | | Morgan Stanley, 6.750%,
due 04/15/11 | | | 88,033 | | |
| | 511,000 | | | C | | Morgan Stanley, 7.300%,
due 05/13/19 | | | 530,811 | | |
| | 1,015,000 | | | C | | National City Preferred
Capital Trust I, 12.000%,
due 12/29/49 | | | 1,063,968 | | |
| | 960,000 | | | @@,#,C | | Rabobank, 11.000%,
due 12/29/49 | | | 1,070,706 | | |
| | 50,000 | | | @@,C | | Societe Generale, 1.375%,
due 11/29/49 | | | 21,906 | | |
| | 1,239,000 | | | L | | State Street Corp., 2.150%,
due 04/30/12 | | | 1,245,454 | | |
| | 506,000 | | | | | SunTrust Bank/Atlanta GA,
5.450%, due 12/01/17 | | | 445,148 | | |
| | 622,000 | | | | | Wachovia Bank NA, 6.000%,
due 11/15/17 | | | 627,885 | | |
| | 796,000 | | | S | | Wachovia Bank NA, 6.600%,
due 01/15/38 | | | 778,404 | | |
| | 365,000 | | | | | Wachovia Corp., 5.500%,
due 05/01/13 | | | 377,369 | | |
| | | | 16,360,319 | | |
| | | | | Beverages: 0.3% | |
| | 596,000 | | | #,C | | Anheuser-Busch InBev
Worldwide, Inc., 5.375%,
due 11/15/14 | | | 602,009 | | |
| | 547,000 | | | #,C | | Anheuser-Busch InBev
Worldwide, Inc., 7.750%,
due 01/15/19 | | | 599,251 | | |
| | 396,000 | | | C | | Dr Pepper Snapple
Group, Inc., 6.820%,
due 05/01/18 | | | 419,472 | | |
| | | | 1,620,732 | | |
See Accompanying Notes to Financial Statements
49
PORTFOLIO OF INVESTMENTS
ING BALANCED PORTFOLIO AS OF JUNE 30, 2009 (UNAUDITED) (CONTINUED)
Principal
Amount | | | | | | Value | |
| | | | | Chemicals: 0.2% | |
| $ | 287,000 | | | #,C | | Chevron Phillips Chemical Co.
LLC, 7.000%, due 06/15/14 | | $ | 293,740 | | |
| | 267,000 | | | #,C | | Chevron Phillips Chemical Co.
LLC, 8.250%, due 06/15/19 | | | 279,011 | | |
| | 432,000 | | | C | | Dow Chemical Co.,
7.600%, due 05/15/14 | | | 445,409 | | |
| | | | 1,018,160 | | |
| | | | | Computers: 0.1% | |
| | 521,000 | | | C | | Hewlett-Packard Co., 4.750%,
due 06/02/14 | | | 544,487 | | |
| | | | 544,487 | | |
| | | | | Diversified Financial Services: 1.5% | |
| | 940,000 | | | @@,#,C | | Aiful Corp., 4.450%,
due 02/16/10 | | | 686,287 | | |
| | 341,000 | | | | | American Express Credit Corp.,
7.300%, due 08/20/13 | | | 354,854 | | |
| | 307,000 | | | | | Capital One Bank USA NA,
6.500%, due 06/13/13 | | | 303,721 | | |
| | 684,000 | | | | | Capital One Bank USA NA,
8.800%, due 07/15/19 | | | 699,949 | | |
| | 241,000 | | | #,C | | Corestates Capital Trust I,
8.000%, due 12/15/26 | | | 158,132 | | |
| | 545,000 | | | | | FIA Card Services NA, 6.625%,
due 06/15/12 | | | 566,532 | | |
| | 428,000 | | | C | | Fund American Cos., Inc.,
5.875%, due 05/15/13 | | | 403,511 | | |
| | 1,238,000 | | | | | General Electric Capital Corp.,
2.200%, due 06/08/12 | | | 1,245,220 | | |
| | 730,000 | | | | | General Electric Capital Corp.,
5.875%, due 01/14/38 | | | 579,456 | | |
| | 1,203,000 | | | | | General Electric Capital Corp.,
6.875%, due 01/10/39 | | | 1,086,030 | | |
| | 1,131,000 | | | @@,# | | Mantis Reef Ltd., 4.799%,
due 11/03/09 | | | 1,120,573 | | |
| | 240,000 | | | | | Merrill Lynch & Co., Inc.,
4.250%, due 02/08/10 | | | 240,986 | | |
| | 468,000 | | | | | Merrill Lynch & Co., Inc.,
6.050%, due 08/15/12 | | | 469,565 | | |
| | 336,000 | | | C | | National Rural Utilities
Cooperative Finance
Corp., 10.375%,
due 11/01/18 | | | 421,953 | | |
| | 62,855 | | | # | | Power Receivable Finance,
LLC, 6.290%, due 01/01/12 | | | 61,999 | | |
| | 4,534,049 | | | #,Z | | Toll Road Investors
Partnership II LP, 5.000%,
due 02/15/45 | | | 413,832 | | |
| | 530,000 | | | #,±,C | | Twin Reefs Pass-through Trust,
1.386%, due 12/10/49 | | | 1,723 | | |
| | | | 8,814,323 | | |
| | | | | Electric: 1.3% | |
| | 284,000 | | | C | | Ameren Corp., 8.875%,
due 05/15/14 | | | 293,414 | | |
| | 1,298,000 | | | C | | Commonwealth Edison Co.,
6.950%, due 07/15/18 | | | 1,315,648 | | |
| | 391,000 | | | C | | DTE Energy Co., 7.050%,
due 06/01/11 | | | 409,358 | | |
| | 210,000 | | | C | | Duke Energy Corp., 6.300%,
due 02/01/14 | | | 226,950 | | |
Principal
Amount | | | | | | Value | |
| $ | 242,000 | | | C | | Entergy Texas, Inc., 7.125%,
due 02/01/19 | | $ | 252,724 | | |
| | 222,000 | | | C | | Indiana Michigan Power,
7.000%, due 03/15/19 | | | 239,023 | | |
| | 153,000 | | | C | | Jersey Central Power and Light,
7.350%, due 02/01/19 | | | 168,496 | | |
| | 359,856 | | | #,C | | Juniper Generation, LLC,
6.790%, due 12/31/14 | | | 326,823 | | |
| | 451,000 | | | C | | Metropolitan Edison, 7.700%,
due 01/15/19 | | | 494,142 | | |
| | 47,000 | | | C | | Nevada Power Co., 7.125%,
due 03/15/19 | | | 50,317 | | |
| | 1,214,000 | | | C | | NorthWestern Corp., 5.875%,
due 11/01/14 | | | 1,236,151 | | |
| | 419,000 | | | C | | Oncor Electric Delivery Co.,
6.800%, due 09/01/18 | | | 448,514 | | |
| | 568,000 | | | C | | Oncor Electric Delivery Co.,
7.500%, due 09/01/38 | | | 642,752 | | |
| | 243,000 | | | C | | Progress Energy, Inc., 6.050%,
due 03/15/14 | | | 255,782 | | |
| | 191,000 | | | C | | Progress Energy, Inc., 7.050%,
due 03/15/19 | | | 212,293 | | |
| | 473,000 | | | C | | Sierra Pacific Power Co.,
6.250%, due 04/15/12 | | | 491,239 | | |
| | 460,000 | | | C | | Southwestern Electric Power,
5.550%, due 01/15/17 | | | 447,711 | | |
| | | | 7,511,337 | | |
| | | | | Energy-Alternate Sources: 0.0% | |
| | 600,000 | | | I,±,X | | Greater Ohio Ethanol, LLC,
6.301%, due 12/31/13 | | | — | | |
| | 700,000 | | | I,±,X | | Greater Ohio Ethanol, LLC,
12.630%, due 12/31/13 | | | — | | |
| | 92,655 | | | I,X | | PEA Lima, LLC, 0.000%,
due 03/20/14 | | | 9 | | |
| | | | 9 | | |
| | | | | Entertainment: 0.0% | |
| | 203,000 | | | | | International Game Technology,
7.500%, due 06/15/19 | | | 205,179 | | |
| | | | 205,179 | | |
| | | | | Food: 0.2% | |
| | 631,000 | | | | | Kraft Foods, Inc., 6.125%,
due 02/01/18 | | | 653,490 | | |
| | 138,000 | | | | | Kraft Foods, Inc., 6.500%,
due 08/11/17 | | | 145,574 | | |
| | 205,000 | | | C | | Safeway, Inc., 6.250%,
due 03/15/14 | | | 220,219 | | |
| | | | 1,019,283 | | |
| | | | | Forest Products & Paper: 0.0% | |
| | 111,000 | | | C | | International Paper Co.,
7.400%, due 06/15/14 | | | 110,608 | | |
| | | | 110,608 | | |
| | | | | Gas: 0.1% | |
| | 596,000 | | | C | | Sempra Energy, 6.500%,
due 06/01/16 | | | 622,993 | | |
| | | | 622,993 | | |
See Accompanying Notes to Financial Statements
50
PORTFOLIO OF INVESTMENTS
ING BALANCED PORTFOLIO AS OF JUNE 30, 2009 (UNAUDITED) (CONTINUED)
Principal
Amount | | | | | | Value | |
| | | | | Healthcare-Services: 0.0% | |
| $ | 255,000 | | | C | | HCA, Inc., 9.250%,
due 11/15/16 | | $ | 251,813 | | |
| | | | 251,813 | | |
| | | | | Insurance: 0.8% | |
| | 1,355,000 | | | @@,C | | Aegon NV, 3.610%,
due 12/31/49 | | | 531,838 | | |
| | 785,000 | | | | | American International
Group, Inc., 5.850%,
due 01/16/18 | | | 415,886 | | |
| | 331,000 | | | C | | Hartford Financial Services
Group, Inc., 5.250%,
due 10/15/11 | | | 320,076 | | |
| | 416,000 | | | C | | Hartford Financial Services
Group, Inc., 6.000%,
due 01/15/19 | | | 319,266 | | |
| | 683,000 | | | C | | Metlife, Inc., 7.717%,
due 02/15/19 | | | 731,811 | | |
| | 462,000 | | | #,C | | Pacific Life Insurance Co.,
9.250%, due 06/15/39 | | | 449,490 | | |
| | 266,000 | | | C | | Principal Financial Group, Inc.,
7.875%, due 05/15/14 | | | 280,511 | | |
| | 194,000 | | | | | Prudential Financial, Inc.,
5.700%, due 12/14/36 | | | 145,978 | | |
| | 387,000 | | | | | Prudential Financial, Inc.,
6.000%, due 12/01/17 | | | 364,659 | | |
| | 623,000 | | | | | Prudential Financial, Inc.,
6.625%, due 12/01/37 | | | 541,349 | | |
| | 251,000 | | | | | Prudential Financial, Inc.,
7.375%, due 06/15/19 | | | 246,867 | | |
| | 244,000 | | | @@,C | | XL Capital, Ltd., 6.500%,
due 12/31/49 | | | 119,708 | | |
| | | | 4,467,439 | | |
| | | | | Iron/Steel: 0.1% | |
| | 398,000 | | | @@ | | ArcelorMittal, 9.850%,
due 06/01/19 | | | 430,215 | | |
| | | | 430,215 | | |
| | | | | Media: 1.2% | |
| | 156,000 | | | C | | Comcast Corp., 5.300%,
due 01/15/14 | | | 161,489 | | |
| | 145,000 | | | C | | Comcast Corp., 5.900%,
due 03/15/16 | | | 150,198 | | |
| | 714,000 | | | C | | Comcast Corp., 6.300%,
due 11/15/17 | | | 756,906 | | |
| | 1,006,000 | | | #,C | | COX Communications, Inc.,
6.250%, due 06/01/18 | | | 996,136 | | |
| | 276,000 | | | #,C | | COX Communications, Inc.,
6.950%, due 06/01/38 | | | 266,495 | | |
| | 80,000 | | | #,C | | Cox Communications, Inc.,
8.375%, due 03/01/39 | | | 89,461 | | |
| | 255,000 | | | C | | Echostar DBS Corp., 7.125%,
due 02/01/16 | | | 239,063 | | |
| | 395,000 | | | C | | News America, Inc., 6.650%,
due 11/15/37 | | | 356,370 | | |
| | 855,000 | | | #,C | | News America, Inc., 6.900%,
due 03/01/19 | | | 892,497 | | |
| | 1,541,000 | | | C | | Time Warner Cable, Inc.,
6.200%, due 07/01/13 | | | 1,625,095 | | |
| | 377,000 | | | C | | Time Warner Cable, Inc.,
6.750%, due 06/15/39 | | | 368,088 | | |
Principal
Amount | | | | | | Value | |
| $ | 1,013,000 | | | C | | Time Warner, Inc., 5.500%,
due 11/15/11 | | $ | 1,046,680 | | |
| | 75,000 | | | C | | Time Warner, Inc., 7.700%,
due 05/01/32 | | | 73,895 | | |
| | | | 7,022,373 | | |
| | | | | Miscellaneous Manufacturing: 0.2% | |
| | 521,000 | | | | | General Electric Co., 5.250%,
due 12/06/17 | | | 512,505 | | |
| | 615,000 | | | @@,C | | Tyco International Finance,
8.500%, due 01/15/19 | | | 683,033 | | |
| | | | 1,195,538 | | |
| | | | | Oil & Gas: 0.2% | |
| | 257,000 | | | C | | Chesapeake Energy Corp.,
7.250%, due 12/15/18 | | | 224,875 | | |
| | 221,000 | | | C | | Hess Corp., 8.125%,
due 02/15/19 | | | 252,029 | | |
| | 388,000 | | | C | | Marathon Oil Corp., 6.500%,
due 02/15/14 | | | 415,205 | | |
| | 191,000 | | | C | | Marathon Oil Corp., 7.500%,
due 02/15/19 | | | 208,829 | | |
| | | | 1,100,938 | | |
| | | | | Oil & Gas Services: 0.0% | |
| | 231,000 | | | @@,C | | Weatherford International, Ltd.,
9.625%, due 03/01/19 | | | 272,194 | | |
| | | | 272,194 | | |
| | | | | Pharmaceuticals: 0.1% | |
| | 244,000 | | | C | | Express Scripts, Inc., 6.250%,
due 06/15/14 | | | 258,452 | | |
| | 61,000 | | | C | | Express Scripts, Inc., 7.250%,
due 06/15/19 | | | 67,388 | | |
| | 216,000 | | | @@,C | | Novartis Securities Investment
Ltd., 5.125%, due 02/10/19 | | | 221,404 | | |
| | | | 547,244 | | |
| | | | | Pipelines: 0.4% | |
| | 417,000 | | | C | | Enbridge Energy Partners,
9.875%, due 03/01/19 | | | 484,219 | | |
| | 360,000 | | | C | | Energy Transfer Partners,
9.700%, due 03/15/19 | | | 413,967 | | |
| | 90,000 | | | C | | Kinder Morgan Energy
Partners L.P., 6.850%,
due 02/15/20 | | | 92,424 | | |
| | 345,000 | | | C | | Northwest Pipeline Corp.,
7.000%, due 06/15/16 | | | 364,416 | | |
| | 147,000 | | | @@,C | | Trans-Canada Pipelines,
7.125%, due 01/15/19 | | | 166,202 | | |
| | 163,000 | | | @@,C | | Trans-Canada Pipelines,
7.625%, due 01/15/39 | | | 190,850 | | |
| | 460,000 | | | C | | Transcontinental Gas
Pipe Line Corp., 6.400%,
due 04/15/16 | | | 472,743 | | |
| | | | 2,184,821 | | |
| | | | | Real Estate: 0.0% | |
| | 298,000 | | | C,L | | Simon Property Group, Inc.,
6.750%, due 05/15/14 | | | 299,738 | | |
| | | | 299,738 | | |
See Accompanying Notes to Financial Statements
51
PORTFOLIO OF INVESTMENTS
ING BALANCED PORTFOLIO AS OF JUNE 30, 2009 (UNAUDITED) (CONTINUED)
Principal
Amount | | | | | | Value | |
| | | | | Retail: 0.1% | |
| $ | 214,000 | | | C | | CVS Caremark Corp., 6.600%,
due 03/15/19 | | $ | 229,072 | | |
| | 453,598 | | | #,C | | CVS Lease Pass-through,
6.036%, due 12/10/28 | | | 388,604 | | |
| | | | 617,676 | | |
| | | | | Software: 0.1% | |
| | 421,000 | | | | | Oracle Corp., 5.000%,
due 07/08/19 | | | 419,430 | | |
| | 280,000 | | | | | Oracle Corp., 6.125%,
due 07/08/39 | | | 278,135 | | |
| | | | 697,565 | | |
| | | | | Telecommunications: 1.0% | |
| | 1,252,000 | | | C | | AT&T, Inc., 6.550%,
due 02/15/39 | | | 1,253,844 | | |
| | 471,000 | | | | | Bellsouth Telecommunications,
Inc., 7.000%, due 12/01/95 | | | 412,761 | | |
| | 136,000 | | | @@,C | | British Telecommunications PLC,
5.150%, due 01/15/13 | | | 135,639 | | |
| | 227,000 | | | @@,C | | British Telecommunications PLC,
5.950%, due 01/15/18 | | | 204,913 | | |
| | 155,000 | | | @@,C | | Deutsche Telekom
International Finance,
5.250%, due 07/22/13 | | | 159,350 | | |
| | 44,000 | | | C | | Embarq Corp., 6.738%,
due 06/01/13 | | | 44,453 | | |
| | 594,000 | | | C | | Embarq Corp., 7.995%,
due 06/01/36 | | | 523,670 | | |
| | 255,000 | | | C | | Sprint Nextel Corp., 6.000%,
due 12/01/16 | | | 209,738 | | |
| | 349,000 | | | @@,C | | Telecom Italia Capital SA,
7.175%, due 06/18/19 | | | 354,404 | | |
| | 154,000 | | | @@,C | | Telefonica Emisones SAU,
5.877%, due 07/15/19 | | | 159,073 | | |
| | 430,000 | | | @@,C | | Telefonica Emisones SAU,
6.421%, due 06/20/16 | | | 460,407 | | |
| | 491,000 | | | C | | Verizon Communications, Inc.,
7.350%, due 04/01/39 | | | 536,718 | | |
| | 447,000 | | | C | | Verizon Communications, Inc.,
8.950%, due 03/01/39 | | | 566,189 | | |
| | 1,000,000 | | | #,C | | Verizon Wireless Capital LLC,
5.550%, due 02/01/14 | | | 1,062,699 | | |
| | | | 6,083,858 | | |
| | | | | Transportation: 0.3% | |
| | 453,000 | | | C | | CSX Corp., 6.250%,
due 04/01/15 | | | 468,895 | | |
| | 517,000 | | | C | | CSX Corp., 7.450%,
due 04/01/38 | | | 561,532 | | |
| | 206,000 | | | C | | Union Pacific Corp., 5.125%,
due 02/15/14 | | | 213,149 | | |
| | 572,000 | | | C | | Union Pacific Corp., 5.700%,
due 08/15/18 | | | 574,178 | | |
| | | | 1,817,754 | | |
Total Corporate Bonds/Notes
(Cost $68,039,943) | | | 65,862,067 | | |
Principal
Amount | | | | | | Value | |
| U.S. GOVERNMENT AGENCY OBLIGATIONS: 13.7% | | | |
| | | | | | | Federal Home Loan Mortgage
Corporation##: 3.6% | | | | | |
| $ | 279,923 | | | S | | 4.969%, due 04/01/35 | | $ | 290,592 | | |
| | 2,842,000 | | | W | | 5.000%, due 08/15/33 | | | 2,878,858 | | |
| | 7,102,634 | | | S | | 5.000%, due 08/15/16-04/15/32 | | | 7,418,012 | | |
| | 2,918,000 | | | W | | 5.500%, due 07/15/34 | | | 3,012,380 | | |
| | 1,969,502 | | | S | | 5.500%, due 12/15/20-02/15/34 | | | 2,037,004 | | |
| | 5,156,673 | | | S | | 6.000%, due 01/15/29 | | | 5,499,246 | | |
| | 225,272 | | | S | | 6.500%, due 11/01/28-12/01/31 | | | 242,129 | | |
| | | | 21,378,221 | | |
| | | | | | | Federal National Mortgage
Association##: 7.4% | | | | | |
| | 104,137 | | | S | | 0.454%, due 04/25/35 | | | 95,403 | | |
| | 35,355 | | | S | | 0.664%, due 08/25/33 | | | 34,750 | | |
| | 866,000 | | | | | 4.000%, due 02/25/39 | | | 839,749 | | |
| | 4,043,000 | | | W | | 4.500%, due 07/25/18-07/15/35 | | | 4,067,657 | | |
| | 579,922 | | | S | | 5.000%, due 02/25/29-07/01/36 | | | 594,756 | | |
| | 6,463,000 | | | | | 5.000%, due 07/01/37 | | | 6,610,437 | | |
| | 6,187,000 | | | W | | 5.500%, due 07/15/34 | | | 6,387,112 | | |
| | 1,876,000 | | | S | | 5.500%, due 05/25/30 | | | 1,961,498 | | |
| | 4,329,000 | | | W | | 6.000%, due 07/01/37 | | | 4,524,480 | | |
| | 6,741,470 | | | S | | 6.000%, due 06/01/16-01/01/38 | | | 7,184,318 | | |
| | 8,654,000 | | | W | | 6.500%, due 08/01/39 | | | 9,180,007 | | |
| | 1,147,103 | | | S | | 7.000%, due 06/01/29-07/01/32 | | | 1,259,593 | | |
| | 182,339 | | | S | | 7.500%, due 11/01/29-11/01/30 | | | 199,103 | | |
| | 497,860 | | | S | | 7.500%, due 01/25/48 | | | 537,183 | | |
| | | | 43,476,046 | | |
| | | | | | | Government National Mortgage
Association: 2.7% | | | | | |
| | 16,384 | | | S | | 4.125%, due 12/20/29 | | | 16,636 | | |
| | 6,778,000 | | | W | | 4.500%, due 07/01/39 | | | 6,767,413 | | |
| | 747,552 | | �� | S | | 4.500%, due 04/15/39 | | | 747,990 | | |
| | 1,730,000 | | | W | | 5.000%, due 08/01/33 | | | 1,756,761 | | |
| | 63,653 | | | S | | 5.375%, due 04/20/28 | | | 65,665 | | |
| | 275,366 | | | S | | 5.500%, due 09/15/38 | | | 284,896 | | |
| | 678,243 | | | | | 5.500%, due 03/20/39 | | | 699,917 | | |
| | 532,000 | | | S | | 6.000%, due 10/15/38 | | | 554,922 | | |
| | 2,540,000 | | | | | 6.000%, due 07/15/33 | | | 2,645,966 | | |
| | 98,993 | | | S | | 6.500%, due 10/15/31 | | | 106,838 | | |
| | 964,155 | | | S | | 7.000%, due 09/15/24-11/15/24 | | | 1,048,147 | | |
| | 861,235 | | | S | | 7.500%, due 12/15/23 | | | 940,787 | | |
| | | | 15,635,938 | | |
Total U.S. Government
Agency Obligations
(Cost $79,105,232) | | | 80,490,205 | | |
| U.S. TREASURY OBLIGATIONS: 9.2% | | | |
| | | | | U.S. Treasury Bonds: 1.0% | |
| | 6,464,000 | | | S | | 3.500%, due 02/15/39 | | | 5,591,379 | | |
| | | | 5,591,379 | | |
| | | | | U.S. Treasury Notes: 8.2% | |
| | 5,420,000 | | | S | | 0.875%, due 05/31/11 | | | 5,402,239 | | |
| | 1,530,000 | | | | | 1.125%, due 06/30/11 | | | 1,530,478 | | |
| | 6,810,000 | | | L | | 1.875%, due 06/15/12 | | | 6,861,640 | | |
| | 16,583,000 | | | L | | 2.250%, due 05/31/14 | | | 16,365,315 | | |
| | 497,000 | | | S | | 2.625%, due 04/30/16 | | | 480,692 | | |
| | 14,540,000 | | | | | 2.625%, due 06/30/14 | | | 14,590,061 | | |
| | 3,018,000 | | | L | | 3.125%, due 05/15/19 | | | 2,919,924 | | |
| | | | 48,150,349 | | |
Total U.S. Treasury Obligations
(Cost $53,419,842) | | | 53,741,728 | | |
See Accompanying Notes to Financial Statements
52
PORTFOLIO OF INVESTMENTS
ING BALANCED PORTFOLIO AS OF JUNE 30, 2009 (UNAUDITED) (CONTINUED)
Principal
Amount | | | | | | Value | |
| ASSET-BACKED SECURITIES: 0.9% | | | |
| | | | | | | Automobile Asset-Backed
Securities: 0.1% | | | | | |
| $ | 376,000 | | | S | | Honda Auto Receivables Owner
Trust, 4.880%, due 09/18/14 | | $ | 393,214 | | |
| | 241,000 | | | S | | Nissan Auto Receivables Owner
Trust, 2.940%, due 07/15/11 | | | 242,698 | | |
| | 113,000 | | | S | | Nissan Auto Receivables Owner
Trust, 4.460%, due 04/16/12 | | | 116,200 | | |
| | | | 752,112 | | |
| | | | | | | Home Equity Asset-Backed
Securities: 0.4% | | | | | |
| | 1,733,878 | | | S | | GSAA Trust, 5.242%,
due 06/25/34 | | | 1,599,628 | | |
| | 428,000 | | | #,S | | Irwin Home Equity, 5.960%,
due 08/25/37 | | | 95,580 | | |
| | 153,045 | | | S | | Merrill Lynch Mortgage
Investors Trust, 0.674%,
due 07/25/34 | | | 81,838 | | |
| | 168 | | | S | | Renaissance Home Equity Loan
Trust, 4.456%, due 05/25/35 | | | 163 | | |
| | 387,857 | | | S | | Residential Funding Mortgage
Securities II, Inc., 5.890%,
due 05/25/37 | | | 327,005 | | |
| | | | 2,104,214 | | |
| | | | | Other Asset-Backed Securities: 0.4% | |
| | 107,455 | | | S | | Amortizing Residential
Collateral Trust, 0.564%,
due 05/25/32 | | | 57,774 | | |
| | 69,434 | | | S | | Chase Funding Mortgage
Loan Asset-Backed
Certificates, 0.914%,
due 07/25/33 | | | 54,303 | | |
| | 826 | | | S | | Chase Funding Mortgage
Loan Asset-Backed
Certificates, 4.045%,
due 05/25/33 | | | 774 | | |
| | 104,000 | | | S | | Countrywide Asset-Backed
Certificates, 5.689%,
due 10/25/46 | | | 45,310 | | |
| | 733,647 | | | S | | Credit-Based Asset
Servicing and
Securitization, LLC, 4.831%,
due 08/25/35 | | | 613,495 | | |
| | 851,801 | | | S | | Credit-Based Asset
Servicing and
Securitization, LLC, 5.501%,
due 12/25/36 | | | 584,213 | | |
| | 459,000 | | | #,S | | Credit-Based Asset
Servicing and
Securitization, LLC, 5.746%,
due 12/25/37 | | | 333,253 | | |
| | 241,000 | | | #,S | | Credit-Based Asset
Servicing and
Securitization, LLC, 6.020%,
due 12/25/37 | | | 142,675 | | |
| | 524,516 | | | S | | Equity One, Inc., 5.050%,
due 09/25/33 | | | 369,435 | | |
| | 927,000 | | | S | | Hudson Mezzanine Funding,
1.314%, due 06/12/42 | | | — | | |
Principal
Amount | | | | | | Value | |
| $ | 281,922 | | | S | | Merrill Lynch Mortgage
Investors Trust, 5.609%,
due 03/25/37 | | $ | 130,917 | | |
| | 1,528 | | | S | | Popular Mortgage
Pass-through Trust, 4.000%,
due 12/25/34 | | | 1,482 | | |
| | 20,045 | | | S | | Residential Asset Mortgage
Products, Inc., 0.934%,
due 06/25/33 | | | 12,141 | | |
| | 329,414 | | | S | | Structured Asset Securities
Corp., 4.910%, due 06/25/33 | | | 278,029 | | |
| | | | 2,623,801 | | |
Total Asset-Backed Securities
(Cost $8,075,568) | | | 5,480,127 | | |
| COLLATERALIZED MORTGAGE OBLIGATIONS: 4.0% | | | |
| | 752,170 | | | C,S | | American Home Mortgage
Assets, 2.260%, due 11/25/46 | | | 251,404 | | |
| | 1,342,710 | | | C,S | | American Home Mortgage
Investment Trust, 0.694%,
due 11/25/45 | | | 315,256 | | |
| | 1,420,396 | | | C,S | | Banc of America Funding Corp.,
5.258%, due 09/20/35 | | | 775,773 | | |
| | 887,287 | | | C,S | | Banc of America Mortgage
Securities, Inc., 5.145%,
due 09/25/35 | | | 709,169 | | |
| | 678,826 | | | C,S | | Banc of America Mortgage
Securities, Inc., 5.500%,
due 11/25/33 | | | 609,736 | | |
| | 191,706 | | | C,S | | Bear Stearns Alternative-A
Trust, 0.634%, due 07/25/34 | | | 96,248 | | |
| | 418,619 | | | C,S | | Chase Manhattan Bank-First
Union National Bank,
7.439%, due 08/15/31 | | | 417,854 | | |
| | 954,809 | | | C,S | | Chase Mortgage Finance Corp.,
5.500%, due 11/25/35 | | | 881,977 | | |
| | 539,489 | | | C,S | | Citicorp Mortgage Securities,
Inc., 5.500%, due 02/25/22 | | | 430,161 | | |
| | 790,000 | | | C,S | | Citigroup Commercial
Mortgage Trust, 5.888%,
due 12/10/49 | | | 626,795 | | |
| | 618,956 | | | C,S | | Countrywide Alternative
Loan Trust, 1.398%,
due 11/25/46 | | | 108,232 | | |
| | 304,423 | | | C,S | | Countrywide Home Loan
Mortgage Pass-through Trust,
0.634%, due 04/25/35 | | | 45,008 | | |
| | 539,633 | | | C,S | | Countrywide Home Loan
Mortgage Pass-through Trust,
5.250%, due 10/25/35 | | | 366,732 | | |
| | 429,548 | | | C,S | | Credit Suisse First Boston
Mortgage Securities Corp.,
3.727%, due 03/15/35 | | | 417,494 | | |
| | 1,116,581 | | | C,S | | Credit Suisse Mortgage
Capital Certificates, 7.000%,
due 08/25/36 | | | 543,473 | | |
| | 505,560 | | | C,S | | First Horizon Mortgage
Pass-through Trust, 5.394%,
due 10/25/35 | | | 429,113 | | |
| | 543,405 | | | C,S | | First Horizon Mortgage
Pass-through Trust, 5.500%,
due 12/25/35 | | | 479,732 | | |
See Accompanying Notes to Financial Statements
53
PORTFOLIO OF INVESTMENTS
ING BALANCED PORTFOLIO AS OF JUNE 30, 2009 (UNAUDITED) (CONTINUED)
Principal
Amount | | | | | | Value | |
| COLLATERALIZED MORTGAGE OBLIGATIONS (continued) | | | |
| $ | 1,442,752 | | | C,S | | First Union National Bank
Commercial Mortgage,
6.663%, due 01/12/43 | | $ | 1,486,410 | | |
| | 142,756 | | | C,S | | GE Capital Commercial
Mortgage Corp., 5.560%,
due 06/10/38 | | | 146,632 | | |
| | 1,378,570 | | | C,S | | GMAC Mortgage Corp. Loan
Trust, 5.261%, due 03/18/35 | | | 1,208,745 | | |
| | 152,243 | | | C,S | | GMAC Mortgage Corp. Loan
Trust, 5.466%, due 11/19/35 | | | 114,013 | | |
| | 683,130 | | | #,C,S | | GSMPS Mortgage Loan Trust,
0.714%, due 04/25/36 | | | 592,280 | | |
| | 765,246 | | | S | | GSMPS Mortgage Loan Trust,
0.872%, due 01/25/35 | | | 496,868 | | |
| | 378,783 | | | C,S | | GSR Mortgage Loan Trust,
5.500%, due 07/25/35 | | | 359,568 | | |
| | 198,248 | | | C,S | | Harborview Mortgage
Loan Trust, 0.663%,
due 01/19/35 | | | 87,208 | | |
| | 270,932 | | | C,S | | Homebanc Mortgage Trust,
1.174%, due 08/25/29 | | | 138,989 | | |
| | 200,380 | | | C,S | | JPMorgan Alternative
Loan Trust, 5.506%,
due 01/25/36 | | | 131,350 | | |
| | 246,517 | | | C,S | | JPMorgan Chase Commercial
Mortgage Securities Corp.,
4.262%, due 08/12/40 | | | 245,606 | | |
| | 1,180,000 | | | C,S | | JPMorgan Chase Commercial
Mortgage Securities Corp.,
5.399%, due 05/15/45 | | | 937,952 | | |
| | 81,940 | | | C,S | | JPMorgan Chase Commercial
Mortgage Securities Corp.,
6.023%, due 04/15/45 | | | 83,198 | | |
| | 690,000 | | | C,S | | LB-UBS Commercial Mortgage
Trust, 6.080%, due 06/15/38 | | | 579,552 | | |
| | 837,922 | | | C,S | | LB-UBS Commercial Mortgage
Trust, 7.370%, due 08/15/26 | | | 858,121 | | |
| | 569,490 | | | C,S | | Luminent Mortgage Trust,
0.514%, due 10/25/46 | | | 234,847 | | |
| | 21,468 | | | C,S | | MASTR Alternative
Loans Trust, 6.500%,
due 05/25/33 | | | 18,582 | | |
| | 201,506 | | | C,S | | MASTR Alternative
Loans Trust, 8.500%,
due 05/25/33 | | | 189,471 | | |
| | 100,072 | | | C,S | | MLCC Mortgage Investors, Inc.,
0.634%, due 01/25/29 | | | 78,870 | | |
| | 108,418 | | | C,S | | MortgageIT Trust, 0.684%,
due 11/25/35 | | | 18,493 | | |
| | 788,000 | | | C,S | | New York Mortgage Trust, Inc.,
5.658%, due 05/25/36 | | | 511,163 | | |
| | 325,521 | | | C,S | | Prime Mortgage Trust, 0.814%,
due 02/25/35 | | | 185,780 | | |
| | 82,941 | | | C,S | | Prudential Commercial
Mortgage Trust, 3.669%,
due 02/11/36 | | | 81,704 | | |
| | 379,621 | | | C,S | | Residential Accredit Loans, Inc.,
0.554%, due 04/25/46 | | | 65,874 | | |
| | 110,669 | | | C,S | | Sequoia Mortgage Trust,
0.585%, due 01/20/35 | | | 61,644 | | |
Principal
Amount | | | | | | Value | |
| $ | 3,151 | | | C,S | | Structured Adjustable Rate
Mortgage Loan Trust,
0.624%, due 07/25/35 | | $ | 1,386 | | |
| | 181,568 | | | C,S | | Structured Asset Mortgage
Investments, Inc., 0.553%,
due 04/19/35 | | | 91,651 | | |
| | 960,000 | | | C,S | | Wachovia Bank Commercial
Mortgage Trust, 5.083%,
due 03/15/42 | | | 828,221 | | |
| | 1,130,000 | | | C,S | | Wachovia Bank Commercial
Mortgage Trust, 5.308%,
due 11/15/48 | | | 866,080 | | |
| | 304,637 | | | C,S | | Washington Mutual Mortgage
Pass-through Certificates,
0.624%, due 01/25/45 | | | 142,051 | | |
| | 111,705 | | | C,S | | Washington Mutual Mortgage
Pass-through Certificates,
0.634%, due 08/25/45 | | | 60,760 | | |
| | 49,652 | | | C,S | | Washington Mutual Mortgage
Pass-through Certificates,
0.733%, due 06/25/44 | | | 26,650 | | |
| | 1,748,267 | | | C,S | | Washington Mutual Mortgage
Pass-through Certificates,
2.080%, due 01/25/47 | | | 615,970 | | |
| | 912,712 | | | C,S | | Washington Mutual Mortgage
Pass-through Certificates,
2.260%, due 09/25/46 | | | 174,748 | | |
| | 61,133 | | | C,S | | Washington Mutual Mortgage
Pass-through Certificates,
2.310%, due 05/25/46 | | | 10,416 | | |
| | 254,779 | | | C,S | | Washington Mutual Mortgage
Pass-through Certificates,
2.310%, due 06/25/46 | | | 90,640 | | |
| | 1,354,079 | | | C,S | | Washington Mutual Mortgage
Pass-through Certificates,
6.000%, due 06/25/34 | | | 1,214,358 | | |
| | 1,245,000 | | | C,S | | Wells Fargo Mortgage-Backed
Securities Trust, 4.775%,
due 07/25/34 | | | 1,129,852 | | |
| | 565,567 | | | C,S | | Wells Fargo Mortgage-Backed
Securities Trust, 4.878%,
due 08/25/34 | | | 510,752 | | |
| | 2,006,583 | | | C,S | | Wells Fargo Mortgage-Backed
Securities Trust, 5.388%,
due 08/25/35 | | | 1,524,009 | | |
Total Collateralized
Mortgage Obligations
(Cost $31,870,651) | | | 23,704,621 | | |
| OTHER BONDS: 0.7% | | | |
| | | | | Foreign Government Bonds: 0.7% | |
| BRL | 8,953,000 | | | | | Brazil Notas do Tesouro
Nacional Series F, 10.000%,
due 01/01/17 | | | 3,989,100 | | |
Total Other Bonds
(Cost $3,820,190) | | | 3,989,100 | | |
Total Long-Term Investments
(Cost $595,608,301) | | | 585,328,098 | | |
See Accompanying Notes to Financial Statements
54
PORTFOLIO OF INVESTMENTS
ING BALANCED PORTFOLIO AS OF JUNE 30, 2009 (UNAUDITED) (CONTINUED)
Principal
Amount | | | | | | Value | |
| SHORT-TERM INVESTMENTS: 11.3% | |
| | | | | Money Market: 3.0% | |
| $ | 17,914,000 | | | S | | ING Institutional Prime
Money Market Fund - Class I | | $ | 17,914,000 | | |
Total Money Market
(Cost $17,914,000) | | | 17,914,000 | | |
| | | Securities Lending Collateralcc: 8.3% | |
| | 49,131,766 | | | Bank of New York Mellon Corp.
Institutional Cash Reserves | | | 48,806,335 | | |
Total Securities Lending
Collateral
(Cost $49,131,766) | | | 48,806,335 | | |
Total Short-Term Investments
(Cost $67,045,766) | | | 66,720,335 | | |
Total Investments in
Securities
(Cost $662,654,067)* | | | 111.0 | % | | $ | 652,048,433 | | |
Other Assets and
Liabilities - Net | | | (11.0 | ) | | | (64,751,110 | ) | |
| Net Assets | | | 100.0 | % | | $ | 587,297,323 | | |
@ Non-income producing security
@@ Foreign Issuer
ADR American Depositary Receipt
MASTR Mortgage Asset Securitization Transaction, Inc.
# Securities with purchases pursuant to Rule 144A or section 4(2), under the Securities Act of 1933 and may not be resold subject to that rule except to qualified institutional buyers. Unless otherwise noted, these securities have been determined to be liquid under the guidelines established by the Funds' Board of Directors/Trustees.
C Bond may be called prior to maturity date.
P Preferred Stock may be called prior to convertible date.
cc Securities purchased with cash collateral for securities loaned.
## On September 7, 2008, the Federal Housing Finance Agency placed the Federal National Mortgage Association and the Federal Home Loan Mortgage Corporation into conservatorship and the U.S. Treasury guaranteed the debt issued by those organizations.
W Settlement is on a when-issued or delayed-delivery basis.
S All or a portion of this security is segregated to cover collateral requirements for applicable futures, options, swaps, foreign forward currency contracts and/or when-issued or delayed-delivery securities.
I Illiquid security
L Loaned security, a portion or all of the security is on loan at June 30, 2009.
± Defaulted security
X Fair value determined by ING Funds Valuation Committee appointed by the Funds' Board of Directors/Trustees.
Z Indicates Zero Coupon Bond; rate shown reflects current effective yield.
BRL Brazilian Real
* Cost for federal income tax purposes is $693,295,726.
Net unrealized depreciation consists of:
| Gross Unrealized Appreciation | | $ | 31,483,032 | | |
| Gross Unrealized Depreciation | | | (72,730,325 | ) | |
| Net Unrealized Depreciation | | $ | (41,247,293 | ) | |
| Fair Value Measurements* | |
The following is a summary of the inputs used as of June 30, 2009 in determining the Portfolio's investments at fair value for purposes of SFAS 157:
| | | Quoted Prices
in Active
Markets
for Identical
Investments
(Level 1) | | Significant
Other
Observable
Inputs
(Level 2) | | Significant
Unobservable
Inputs
(Level 3) | |
| Common Stock** | | $ | 343,664,621 | | | $ | — | | | $ | — | | |
Real Estate
Investment Trusts | | | 7,876,341 | | | | — | | | | — | | |
| Preferred Stock | | | — | | | | 519,288 | | | | — | | |
| Corporate Bonds/Notes | | | — | | | | 65,778,058 | | | | 84,009 | | |
U.S. Government
Agency Obligations | | | — | | | | 80,490,205 | | | | — | | |
U.S. Treasury
Obligations | | | — | | | | 53,741,728 | | | | — | | |
Asset-Backed
Securities | | | — | | | | 5,480,127 | | | | — | | |
Collateralized
Mortgage
Obligations | | | — | | | | 23,704,621 | | | | — | | |
Foreign Government
Bonds | | | — | | | | — | | | | 3,989,100 | | |
Short-Term
Investments | | | 17,914,000 | | | | 48,806,335 | | | | — | | |
| Total | | $ | 375,046,341 | | | $ | 272,928,983 | | | $ | 4,073,109 | | |
Other Financial
Instruments*** | | | (213,703 | ) | | | (329,335 | ) | | | — | | |
| Total | | $ | (213,703 | ) | | $ | (329,335 | ) | | $ | — | | |
The following is a reconciliation of the fair value measurements using significant unobservable inputs (Level 3) for the period ended June 30, 2009:
| | | Beginning
Balance
12/31/08 | | Net
Purchases/
(Sales) | | Accrued
Discounts/
(Premiums) | | Total
Realized
Gain/(Loss) | | Total
Unrealized
Appreciation/
(Depreciation) | | Net Transfers
In/(Out) of
Level 3 | | Ending
Balance
at 06/30/09 | |
| Corporate Bonds/Notes | | $ | — | | | $ | — | | | $ | 5,226 | | | $ | — | | | $ | (5,217 | ) | | $ | 84,000 | | | $ | 84,009 | | |
| Foreign Government Bonds | | | 2,290,460 | | | | 2,990,736 | | | | (129,189 | ) | | | (752,279 | ) | | | 582,997 | | | | (993,625 | ) | | | 3,989,100 | | |
| Total | | $ | 2,290,460 | | | $ | 2,990,736 | | | $ | (123,963 | ) | | $ | (752,279 | ) | | $ | 577,780 | | | $ | (909,625 | ) | | $ | 4,073,109 | | |
For the period ended June 30, 2009, total change in unrealized gain (loss) on Level 3 securities still held at period end and included in the change in net assets was $(345,582). Total unrealized gain (loss) for all securities (including Level 1 and Level 2) can be found on the accompanying Statement of Operations.
See Accompanying Notes to Financial Statements
55
PORTFOLIO OF INVESTMENTS
ING BALANCED PORTFOLIO AS OF JUNE 30, 2009 (UNAUDITED) (CONTINUED)
"Fair value" for purposes of SFAS 157 is different from "fair value" as used in the 1940 Act. The former generally implies market value, and can include market quotations as a source of value, and the latter refers to determinations of value in absence of available market quotations.
* See NOTE 2, "Significant Accounting Policies" in the Notes to Financial Statements for additional information.
** For further breakdown of Common Stock by industry type, please refer to the Portfolio of Investments.
*** Other financial instruments may include open forward foreign currency contracts, futures, swaps, and written options. Forward foreign currency contracts and futures are reported at their unrealized gain/loss at period end. Swaps and written options are reported at their market value at period end.
ING Balanced Portfolio Open Futures Contracts on June 30, 2009:
Contract
Description | | Number of
Contracts | | Expiration
Date | | Unrealized
Appreciation/
(Depreciation) | |
| Long Contracts | |
| Russell 2000 Mini Index | | | 22 | | | 09/18/09 | | $ | 6,355 | | |
| S&P 500 | | | 20 | | | 09/17/09 | | | (62,192 | ) | |
| S&P Mid 400 E-Mini | | | 23 | | | 09/18/09 | | | (16,434 | ) | |
| U.S. Treasury 2-Year Note | | | 26 | | | 09/30/09 | | | (8,596 | ) | |
| | | | | | | | | $ | (80,867 | ) | |
| Short Contracts | |
| U.S. Treasury 10-Year Note | | | 9 | | | 09/21/09 | | $ | (3,468 | ) | |
| U.S. Treasury Long Bond | | | 47 | | | 09/21/09 | | | (129,368 | ) | |
| | | | | | | | | $ | (132,836 | ) | |
ING Balanced Portfolio Credit Default Swap Agreements Outstanding on June 30, 2009:
Credit Default Swaps on Corporate and Sovereign Issues — Buy Protection(1)
| Counterparty | | Reference
Entity/Obligation | | Buy/Sell
Protection | | (Pay)/
Receive
Fixed
Rate (%) | | Termination
Date | | Notional
Amount(2) | | Market
Value(3) | | Upfront
Premium
Paid/
(Received) | | Unrealized
Appreciation/
(Depreciation) | |
Morgan Stanley
Capital
Services Inc. | | Domtar Inc.
7.875%, 10/15/11 | | Buy | | | (2.650 | ) | | 09/20/11 | | USD | 543,500 | | | $ | 43,945 | | | $ | — | | | $ | 43,945 | | |
Goldman Sachs
International | | Dow Chemical Co.
7.375%, 11/01/29 | | Buy | | | (1.280 | ) | | 12/20/13 | | USD | 681,000 | | | | 32,819 | | | | — | | | | 32,819 | | |
Barclays Bank
PLC | | GAP Inc.
8.800%, 12/15/08* | | Buy | | | (1.200 | ) | | 06/20/13 | | USD | 344,000 | | | | (10,905 | ) | | | — | | | | (10,905 | ) | |
Citibank N.A.,
New York | | MBIA Inc.
6.625%, 10/01/28 | | Buy | | | (5.000 | ) | | 09/20/13 | | USD | 140,000 | | | | 38,905 | | | | 39,978 | | | | (1,073 | ) | |
Citibank N.A.,
New York | | MBIA Inc.
6.625%, 10/01/28 | | Buy | | | (5.000 | ) | | 09/20/13 | | USD | 284,000 | | | | 78,921 | | | | 77,833 | | | | 1,088 | | |
JPMorgan
Chase Bank,
N.A. New York | | MBIA Inc.
6.625%, 10/01/28 | | Buy | | | (5.000 | ) | | 09/20/13 | | USD | 959,000 | | | | 266,497 | | | | 143,031 | | | | 123,466 | | |
| | | | | | | | | | | | | $ | 2,951,500 | | | $ | 450,182 | | | $ | 260,842 | | | $ | 189,340 | | |
Credit Default Swaps on Corporate and Sovereign Issues — Sell Protection(4)
| Counterparty | | Reference
Entity/Obligation | | Buy/Sell
Protection | | (Pay)/
Receive
Fixed
Rate (%) | | Termination
Date | | Implied
Credit
Spread at
12/31/08(5) | | Notional
Amount(2) | | Market
Value(3) | | Upfront
Premium
Paid/
(Received) | | Unrealized
Appreciation/
(Depreciation) | |
| UBS AG | | Domtar Inc.
7.875%, 10/15/11 | | Sell | | | 2.600 | | | 09/20/11 | | | 6.71 | | | USD | 542,000 | | | $ | (44,364 | ) | | $ | — | | | $ | (44,364 | ) | |
Citibank N.A.,
New York | | MBIA Global Funding
LLC, FRN, 10/06/10 | | Sell | | | 5.000 | | | 09/20/13 | | | 43.87 | | | USD | 139,000 | | | | (89,324 | ) | | | (44,165 | ) | | | (45,159 | ) | |
Citibank N.A.,
New York | | MBIA Global Funding
LLC, FRN, 10/06/10 | | Sell | | | 5.000 | | | 09/20/13 | | | 43.87 | | | USD | 284,000 | | | | (182,503 | ) | | | (98,437 | ) | | | (84,066 | ) | |
Goldman Sachs
International | | MBIA Global Funding
LLC, FRN, 10/06/10 | | Sell | | | 5.000 | | | 09/20/13 | | | 43.87 | | | USD | 241,000 | | | | (154,870 | ) | | | (75,603 | ) | | | (79,267 | ) | |
See Accompanying Notes to Financial Statements
56
PORTFOLIO OF INVESTMENTS
ING BALANCED PORTFOLIO AS OF JUNE 30, 2009 (UNAUDITED) (CONTINUED)
| Counterparty | | Reference
Entity/Obligation | | Buy/Sell
Protection | | (Pay)/
Receive
Fixed
Rate (%) | | Termination
Date | | Implied
Credit
Spread at
12/31/08(5) | | Notional
Amount(2) | | Market
Value(3) | | Upfront
Premium
Paid/
(Received) | | Unrealized
Appreciation/
(Depreciation) | |
JPMorgan Chase
Bank, N.A.
New York | | MBIA Global Funding
LLC, FRN, 10/06/10 | | Sell | | | 5.000 | | | | 09/20/13 | | | | 43.87 | | | USD | 480,000 | | | $ | (308,456 | ) | | $ | (75,567 | ) | | $ | (232,889 | ) | |
| | | | | | | | | | | | | | | | | | | $ | 1,686,000 | | | $ | (779,517 | ) | | $ | (293,772 | ) | | $ | (485,745 | ) | |
* In the event of a default, if this bond is no longer available an equivalent bond will be delivered.
(1) If a Fund is a buyer of protection and a credit event occurs, as defined under the terms of that particular swap agreement, a Fund will either 1.) receive from the seller of protection an amount equal to the notional amount of the swap and deliver the referenced obligation, other deliverable obligations or underlying securities comprising the referenced index or 2.) receive a net settlement amount in the form of cash or securities equal to the notional amount of the swap less the recovery value of the referenced obligation or underlying securities comprising the referenced index.
(2) The maximum amount of future payments (undiscounted) that a Fund as seller of protection could be required to make or receive as a buyer of credit protection under a credit default swap agreement would be an amount equal to the notional amount of the agreement.
(3) The market values for credit default swap agreements serve as an indicator of the current status of the payment/performance risk and represent the likelihood or risk of default for the credit derivative. Increasing market values, in absolute terms, when compared to the notional amount of the agreement, represent a deterioration of the referenced obligation's credit soundness and a greater likelihood or risk of default or other credit event occurring.
(4) If the Fund is a seller of protection, and a credit event occurs, as defined under the terms of that particular swap agreement, the Fund will generally either 1.) Pay to the buyer an amount equal to the notional amount of the swap and take delivery of the referenced obligation, other deliverable obligations, or underlying securities comprising a referenced index or 2.) Pay a net settlement amount in the form of cash or securities equal to the notional amount of the swap less the recovery value of the referenced obligation or underlying securities comprising a referenced index.
(5) Implied credit spreads, represented in absolute terms, utilized in determining the market value of credit default swap agreements on corporate issues or sovereign issues are disclosed in the table above and serve as an indicator of the current status of the payment/performance risk and represent the likelihood or risk of default for the credit derivative. The implied credit spread of a particular referenced entity reflects the cost of buying/selling protection and may include upfront payments required to be made to enter into the agreement. For credit default swaps on asset-backed securities or credit indices, the quoted market prices and resulting market values serve as the indicator of the current status of the payment/performance risk. Wider credit spreads and increasing market values, in absolute terms when compared to the notional amount of the swap, represent a deterioration of the referenced entity's credit soundness an d a greater likelihood or risk of default or other credit event occurring as defined under the terms of the agreement.
A summary of derivative instruments by primary risk exposure is outlined in the following tables.
The fair value of derivative instruments as of June 30, 2009 was as follows:
Derivatives not accounted for as hedging
instruments under SFAS No. 133 | | Location on Statement of Assets and Liabilities | | Fair Value | |
| Asset Derivatives | |
| Credit contracts | | Unrealized appreciation on swap agreements, net of upfront payments made | | $ | 462,160 | | |
| Total Asset Derivatives | | | | $ | 462,160 | | |
| Liability Derivatives | |
| Credit contracts | | Unrealized depreciation on swap agreements, net of upfront payments received | | $ | 791,495 | | |
| Total Liability Derivatives | | | | $ | 791,495 | | |
The effect of derivative instruments on the Portfolio's Statement of Operations for the six months ended June 30, 2009 was as follows:
| Amount of Realized Gain or (Loss) on Derivatives Recognized in Income | |
Derivatives not accounted for as hedging
instruments under SFAS No. 133 | | Forward Foreign
Currency Contracts | | Futures | | Swaps | | Total | |
| Equity contracts | | $ | — | | | $ | 880,973 | | | $ | — | | | $ | 880,973 | | |
| Foreign exchange contracts | | | (397,488 | ) | | | — | | | | — | | | | (397,488 | ) | |
| Interest rate contracts | | | — | | | | 490,268 | | | | 70,204 | | | | 560,472 | | |
| Credit contracts | | | — | | | | — | | | | 2,774,379 | | | | 2,774,379 | | |
| Total | | $ | (397,488 | ) | | $ | 1,371,241 | | | $ | 2,844,583 | | | $ | 3,818,336 | | |
See Accompanying Notes to Financial Statements
57
PORTFOLIO OF INVESTMENTS
ING BALANCED PORTFOLIO AS OF JUNE 30, 2009 (UNAUDITED) (CONTINUED)
| Change in Unrealized Appreciation or (Depreciation) on Derivatives Recognized in Income | |
Derivatives not accounted for as hedging
instruments under SFAS No. 133 | | Forward Foreign
Currency Contracts | | Futures | | Swaps | | Total | |
| Equity contracts | | $ | — | | | $ | (236,536 | ) | | $ | — | | | $ | (236,536 | ) | |
| Foreign exchange contracts | | | 163,392 | | | | — | | | | — | | | | 163,392 | | |
| Interest rate contracts | | | — | | | | 483,937 | | | | (164,419 | ) | | | 319,518 | | |
| Credit contracts | | | — | | | | — | | | | (3,758,968 | ) | | | (3,758,968 | ) | |
| Total | | $ | 163,392 | | | $ | 247,401 | | | $ | (3,923,387 | ) | | $ | (3,512,594 | ) | |
See Accompanying Notes to Financial Statements
58
PORTFOLIO OF INVESTMENTS
ING GROWTH AND INCOME PORTFOLIO AS OF JUNE 30, 2009 (UNAUDITED)
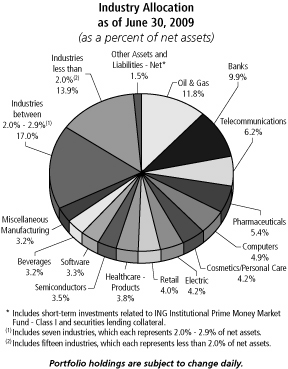
| Shares | | | | | | Value | |
| COMMON STOCK: 98.5% | | | |
| | | | | Advertising: 0.0% | |
| | 812 | | | @ | | Interpublic Group of Cos., Inc. | | $ | 4,101 | | |
| | | | 4,101 | | |
| | | | | Aerospace/Defense: 0.6% | |
| | 325,103 | | | @ | | TransDigm Group, Inc. | | | 11,768,729 | | |
| | | | 11,768,729 | | |
| | | | | Agriculture: 0.6% | |
| | 757,838 | | | | | Altria Group, Inc. | | | 12,420,965 | | |
| | | | 12,420,965 | | |
| | | | | Apparel: 1.1% | |
| | 840,237 | | | | | Coach, Inc. | | | 22,585,571 | | |
| | | | 22,585,571 | | |
| | | | | Auto Manufacturers: 1.9% | |
| | 366,317 | | | @ | | Navistar International Corp. | | | 15,971,421 | | |
| | 696,300 | | | | | Paccar, Inc. | | | 22,636,713 | | |
| | | | 38,608,134 | | |
| | | | | Auto Parts & Equipment: 1.1% | |
| | 805,300 | | | @@ | | Autoliv, Inc. | | | 23,168,481 | | |
| | | | 23,168,481 | | |
| | | | | Banks: 9.9% | |
| | 872,900 | | | | | Bank of America Corp. | | | 11,522,280 | | |
| | 188,200 | | | | | Comerica, Inc. | | | 3,980,430 | | |
| | 304,400 | | | | | Goldman Sachs Group, Inc. | | | 44,880,736 | | |
| | 1,655,160 | | | | | JPMorgan Chase & Co. | | | 56,457,507 | | |
| | 1,001,200 | | | | | Morgan Stanley | | | 28,544,212 | | |
| Shares | | | | | | Value | |
| | 273,700 | | | | | PNC Financial Services
Group, Inc. | | $ | 10,622,297 | | |
| | 1,891,300 | | | | | Wells Fargo & Co. | | | 45,882,938 | | |
| | | | 201,890,400 | | |
| | | | | Beverages: 3.2% | |
| | 756,600 | | | | | Coca-Cola Co. | | | 36,309,234 | | |
| | 506,450 | | | | | PepsiCo, Inc. | | | 27,834,492 | | |
| | | | 64,143,726 | | |
| | | | | Biotechnology: 1.6% | |
| | 695,400 | | | @ | | Gilead Sciences, Inc. | | | 32,572,536 | | |
| | | | 32,572,536 | | |
| | | | | Computers: 4.9% | |
| | 399,005 | | | @ | | Apple, Inc. | | | 56,830,283 | | |
| | 1,116,800 | | | | | Hewlett-Packard Co. | | | 43,164,320 | | |
| | 2,600 | | | I,X | | Seagate Technology,
Inc. - Escrow | | | — | | |
| | | | 99,994,603 | | |
| | | | | Cosmetics/Personal Care: 4.2% | |
| | 1,654,292 | | | | | Procter & Gamble Co. | | | 84,534,322 | | |
| | | | 84,534,322 | | |
| | | | | Distribution/Wholesale: 0.5% | |
| | 188,609 | | | | | Watsco, Inc. | | | 9,228,638 | | |
| | | | 9,228,638 | | |
| | | | | Diversified Financial Services: 0.7% | |
| | 167,531 | | | @@ | | Deutsche Boerse AG | | | 13,038,099 | | |
| | | | 13,038,099 | | |
| | | | | Electric: 4.2% | |
| | 347,000 | | | | | Entergy Corp. | | | 26,899,440 | | |
| | 638,900 | | | | | Exelon Corp. | | | 32,718,069 | | |
| | 653,800 | | | | | Pacific Gas & Electric Co. | | | 25,132,072 | | |
| | | | 84,749,581 | | |
| | | | | Electronics: 2.8% | |
| | 785,900 | | | | | Amphenol Corp. | | | 24,865,876 | | |
| | 787,900 | | | @ | | Thermo Electron Corp. | | | 32,122,683 | | |
| | | | 56,988,559 | | |
| | | | | Entertainment: 0.7% | |
| | 1,069,600 | | | | | Regal Entertainment Group | | | 14,214,984 | | |
| | | | 14,214,984 | | |
| | | | | Food: 2.6% | |
| | 459,800 | | | | | JM Smucker Co. | | | 22,373,868 | | |
| | 645,300 | | | | | Kellogg Co. | | | 30,051,621 | | |
| | | | 52,425,489 | | |
| | | | | Healthcare-Products: 3.8% | |
| | 585,510 | | | @@ | | Covidien PLC | | | 21,921,494 | | |
| | 508,060 | | | | | Johnson & Johnson | | | 28,857,808 | | |
| | 636,000 | | | @ | | St. Jude Medical, Inc. | | | 26,139,600 | | |
| | | | 76,918,902 | | |
| | | | | Healthcare-Services: 0.8% | |
| | 637,200 | | | | | Aetna, Inc. | | | 15,961,860 | | |
| | | | 15,961,860 | | |
See Accompanying Notes to Financial Statements
59
PORTFOLIO OF INVESTMENTS
ING GROWTH AND INCOME PORTFOLIO AS OF JUNE 30, 2009 (UNAUDITED) (CONTINUED)
| Shares | | | | | | Value | |
| | | | | Insurance: 2.9% | |
| | 1,253,100 | | | | | Principal Financial Group, Inc. | | $ | 23,608,404 | | |
| | 464,585 | | | | | Reinsurance Group of
America, Inc. | | | 16,218,662 | | |
| | 772,400 | | | @@ | | Willis Group Holdings Ltd. | | | 19,873,852 | | |
| | | | 59,700,918 | | |
| | | | | Internet: 2.3% | |
| | 111,874 | | | @ | | Google, Inc. - Class A | | | 47,164,959 | | |
| | | | 47,164,959 | | |
| | | | | Iron/Steel: 0.9% | |
| | 529,000 | | | L | | United States Steel Corp. | | | 18,906,460 | | |
| | | | 18,906,460 | | |
| | | | | Machinery-Diversified: 2.4% | |
| | 334,500 | | | @ | | AGCO Corp. | | | 9,723,915 | | |
| | 578,500 | | | | | Cummins, Inc. | | | 20,368,985 | | |
| | 430,300 | | | | | Roper Industries, Inc. | | | 19,496,893 | | |
| | | | 49,589,793 | | |
| | | | | Media: 2.0% | |
| | 3,006,300 | | | | | CBS Corp. - Class B | | | 20,803,596 | | |
| | 750,458 | | | @ | | Liberty Media Corp. -
Entertainment | | | 20,074,752 | | |
| | | | 40,878,348 | | |
| | | | | Mining: 2.0% | |
| | 974,600 | | | | | Alcoa, Inc. | | | 10,067,618 | | |
| | 381,900 | | | @@,L | | BHP Billiton Ltd. ADR | | | 20,901,387 | | |
| | 205,100 | | | | | Freeport-McMoRan Copper &
Gold, Inc. | | | 10,277,561 | | |
| | | | 41,246,566 | | |
| | | | | Miscellaneous Manufacturing: 3.2% | |
| | 1,453,781 | | | | | General Electric Co. | | | 17,038,313 | | |
| | 901,600 | | | | | Honeywell International, Inc. | | | 28,310,240 | | |
| | 540,600 | | | | | Illinois Tool Works, Inc. | | | 20,186,004 | | |
| | | | 65,534,557 | | |
| | | | | Oil & Gas: 11.8% | |
| | 264,500 | | | | | Apache Corp. | | | 19,083,675 | | |
| | 298,200 | | | @@ | | EnCana Corp. | | | 14,751,954 | | |
| | 1,535,315 | | | | | ExxonMobil Corp. | | | 107,333,872 | | |
| | 933,800 | | | | | Marathon Oil Corp. | | | 28,135,394 | | |
| | 852,041 | | | @@ | | Nexen, Inc. | | | 18,446,687 | | |
| | 388,300 | | | @@ | | Royal Dutch Shell
PLC ADR - Class A | | | 19,488,777 | | |
| | 292,500 | | | @ | | Transocean, Ltd. | | | 21,729,825 | | |
| | 264,200 | | | | | XTO Energy, Inc. | | | 10,076,588 | | |
| | | | 239,046,772 | | |
| | | | | Oil & Gas Services: 1.8% | |
| | 1,196,300 | | | | | BJ Services Co. | | | 16,305,569 | | |
| | 368,300 | | | | | Schlumberger Ltd. | | | 19,928,713 | | |
| | | | 36,234,282 | | |
| | | | | Packaging & Containers: 0.8% | |
| | 338,300 | | | | | Silgan Holdings, Inc. | | | 16,586,849 | | |
| | | | 16,586,849 | | |
| | | | | Pharmaceuticals: 5.4% | |
| | 751,950 | | | | | Abbott Laboratories | | | 35,371,727 | | |
| | 540,200 | | | | | McKesson Corp. | | | 23,768,800 | | |
| Shares | | | | | | Value | |
| | 2,044,100 | | | | | Pfizer, Inc. | | $ | 30,661,500 | | |
| | 422,150 | | | @@ | | Teva Pharmaceutical Industries
Ltd. ADR | | | 20,828,881 | | |
| | | | 110,630,908 | | |
| | | | | Retail: 4.0% | |
| | 705,400 | | | L | | Abercrombie & Fitch Co. | | | 17,910,106 | | |
| | 383,900 | | | | | Home Depot, Inc. | | | 9,071,557 | | |
| | 1,419,542 | | | | | Macy's, Inc. | | | 16,693,814 | | |
| | 1,174,700 | | | | | Staples, Inc. | | | 23,693,699 | | |
| | 297,500 | | | | | Wal-Mart Stores, Inc. | | | 14,410,900 | | |
| | | | 81,780,076 | | |
| | | | | Semiconductors: 3.5% | |
| | 888,100 | | | | | Applied Materials, Inc. | | | 9,742,457 | | |
| | 1,580,000 | | | | | Intel Corp. | | | 26,149,000 | | |
| | 766,000 | | | | | Linear Technology Corp. | | | 17,886,100 | | |
| | 1,905,000 | | | @@ | | Taiwan Semiconductor
Manufacturing Co.,
Ltd. ADR | | | 17,926,050 | | |
| | | | 71,703,607 | | |
| | | | | Software: 3.3% | |
| | 994,261 | | | | | Microsoft Corp. | | | 23,633,584 | | |
| | 2,016,350 | | | @ | | Oracle Corp. | | | 43,190,217 | | |
| | | | 66,823,801 | | |
| | | | | Telecommunications: 6.2% | |
| | 1,919,000 | | | | | AT&T, Inc. | | | 47,667,960 | | |
| | 2,390,700 | | | @ | | Cisco Systems, Inc. | | | 44,562,648 | | |
| | 761,150 | | | | | Qualcomm, Inc. | | | 34,403,980 | | |
| | | | 126,634,588 | | |
| | | | | Transportation: 0.8% | |
| | 527,700 | | | | | JB Hunt Transport
Services, Inc. | | | 16,110,681 | | |
| | | | 16,110,681 | | |
Total Common Stock
(Cost $1,900,617,561) | | | 2,003,790,845 | | |
Principal
Amount | | | | | | Value | |
| CORPORATE BONDS/NOTES: 0.0% | | | |
| | | | | Electric: 0.0% | |
| $ | 20,000,000 | | | ±,L | | Mirant Corp. - Escrow,
due 06/15/21 | | $ | 2 | | |
| | 10,000,000 | | | ± | | Southern Energy - Escrow,
due 07/15/49 | | | 1 | | |
Total Corporate Bonds/Notes
(Cost $—) | | | 3 | | |
Total Long-Term Investments
(Cost $1,900,617,561) | | | 2,003,790,848 | | |
| Shares | | | | | | Value | |
| SHORT-TERM INVESTMENTS: 3.1% | | | |
| | | Affiliated Mutual Fund: 1.7% | |
| | | | | | 35,788,000 | | | ING Institutional Prime
Money Market Fund - Class I | | $ | 35,788,000 | | |
Total Mutual Fund
(Cost $35,788,000) | | | 35,788,000 | | |
See Accompanying Notes to Financial Statements
60
PORTFOLIO OF INVESTMENTS
ING GROWTH AND INCOME PORTFOLIO AS OF JUNE 30, 2009 (UNAUDITED) (CONTINUED)
Principal
Amount | |
| | Value | |
| | | Securities Lending Collateralcc: 1.4% | |
| $ | 28,561,378 | | | Bank of New York Mellon Corp.
Institutional Cash Reserves | | $ | 28,476,975 | | |
Total Securities Lending Collateral
(Cost $28,561,378) | | | 28,476,975 | | |
Total Short-Term Investments
(Cost $64,349,378) | | | 64,264,975 | | |
Total Investments in
Securities
(Cost $1,964,966,939)* | | | 101.6 | % | | $ | 2,068,055,823 | | |
Other Assets and
Liabilities - Net | | | (1.6 | ) | | | (33,054,157 | ) | |
| Net Assets | | | 100.0 | % | | $ | 2,035,001,666 | | |
@ Non-income producing security
@@ Foreign Issuer
ADR American Depositary Receipt
cc Securities purchased with cash collateral for securities loaned.
± Defaulted security
L Loaned security, a portion or all of the security is on loan at June 30, 2009.
I Illiquid security
X Fair value determined by ING Funds Valuation Committee appointed by the Funds' Board of Directors/Trustees.
* Cost for federal income tax purposes is $2,044,952,116.
Net unrealized appreciation consists of:
| Gross Unrealized Appreciation | | $ | 210,260,230 | | |
| Gross Unrealized Depreciation | | | (187,156,523 | ) | |
| Net Unrealized Appreciation | | $ | 23,103,707 | | |
Fair Value Measurements*
The following is a summary of the inputs used as of June 30, 2009 in determining the Portfolio's investments at fair value for purposes of SFAS 157:
| | | Quoted Prices
in Active
Markets
for Identical
Investments
(Level 1) | | Significant
Other
Observable
Inputs
(Level 2) | | Significant
Unobservable
Inputs
(Level 3) | |
| Common Stock | |
| Advertising | | $ | 4,101 | | | $ | — | | | $ | — | | |
| Aerospace/Defense | | | 11,768,729 | | | | — | | | | — | | |
| Agriculture | | | 12,420,965 | | | | — | | | | — | | |
| Apparel | | | 22,585,571 | | | | — | | | | — | | |
| Auto Manufacturers | | | 38,608,134 | | | | — | | | | — | | |
Auto Parts &
Equipment | | | 23,168,481 | | | | — | | | | — | | |
| Banks | | | 201,890,400 | | | | — | | | | — | | |
| Beverages | | | 64,143,726 | | | | — | | | | — | | |
| Biotechnology | | | 32,572,536 | | | | — | | | | — | | |
| Computers | | | 99,994,603 | | | | — | | | | — | | |
Cosmetics/Personal
Care | | | 84,534,322 | | | | — | | | | — | | |
| Distribution/Wholesale | | | 9,228,638 | | | | — | | | | — | | |
Diversified Financial
Services | | | — | | | | 13,038,099 | | | | — | | |
| Electric | | | 84,749,581 | | | | — | | | | — | | |
| Electronics | | | 56,988,559 | | | | — | | | | — | | |
| Entertainment | | | 14,214,984 | | | | — | | | | — | | |
| Food | | | 52,425,489 | | | | — | | | | — | | |
| Healthcare - Products | | | 76,918,902 | | | | — | | | | — | | |
| Healthcare - Services | | | 15,961,860 | | | | — | | | | — | | |
| Insurance | | | 59,700,918 | | | | — | | | | — | | |
| Internet | | | 47,164,959 | | | | — | | | | — | | |
| Iron/Steel | | | 18,906,460 | | | | — | | | | — | | |
| Machinery - Diversified | | | 49,589,793 | | | | — | | | | — | | |
| Media | | | 40,878,348 | | | | — | | | | — | | |
| Mining | | | 41,246,566 | | | | — | | | | — | | |
Miscellaneous
Manufacturing | | | 65,534,557 | | | | — | | | | — | | |
| Oil & Gas | | | 239,046,772 | | | | — | | | | — | | |
| Oil & Gas Services | | | 36,234,282 | | | | — | | | | — | | |
| Packaging & Containers | | | 16,586,849 | | | | — | | | | — | | |
| Pharmaceuticals | | | 110,630,908 | | | | — | | | | — | | |
| Retail | | | 81,780,076 | | | | — | | | | — | | |
| Semiconductors | | | 71,703,607 | | | | — | | | | — | | |
| Software | | | 66,823,801 | | | | — | | | | — | | |
| Telecommunications | | | 126,634,588 | | | | — | | | | — | | |
| Transportation | | | 16,110,681 | | | | — | | | | — | | |
| Total Common Stock | | $ | 1,990,752,746 | | | $ | 13,038,099 | | | $ | — | | |
| Corporate Bonds/Notes | | | — | | | | — | | | | 3 | | |
| Short-Term Investments | | | 35,788,000 | | | | 28,476,975 | | | | — | | |
| Total | | $ | 2,026,540,746 | | | $ | 41,515,074 | | | $ | 3 | | |
Other Financial
Instruments** | | | — | | | | — | | | | — | | |
| Total | | $ | — | | | $ | — | | | $ | — | | |
See Accompanying Notes to Financial Statements
61
PORTFOLIO OF INVESTMENTS
ING GROWTH AND INCOME PORTFOLIO AS OF JUNE 30, 2009 (UNAUDITED) (CONTINUED)
The following is a reconciliation of the fair value measurements using significant unobservable inputs (Level 3) for the period ended June 30, 2009:
| | | Beginning
Balance
12/31/08 | | Net
Purchases/
(Sales) | | Accrued
Discounts/
(Premiums) | | Total
Realized
Gain/(Loss) | | Total
Unrealized
Appreciation/
(Depreciation) | | Net Transfers
In/(Out) of
Level 3 | | Ending
Balance
at 06/30/09 | |
| Corporate Bonds/Notes | | $ | — | | | $ | — | | | $ | — | | | $ | — | | | $ | 3 | | | $ | — | | | $ | 3 | | |
| Total | | $ | — | | | $ | — | | | $ | — | | | $ | — | | | $ | 3 | | | $ | — | | | $ | 3 | | |
For the period ended June 30, 2009, total change in unrealized gain (loss) on Level 3 securities still held at period end and included in the change in net assets was $3. Total unrealized gain (loss) for all securities (including Level 1 and Level 2) can be found on the accompanying Statement of Operations.
"Fair value" for purposes of SFAS 157 is different from "fair value" as used in the 1940 Act. The former generally implies market value, and can include market quotations as a source of value, and the latter refers to determinations of value in absence of available market quotations.
* See NOTE 2, "Significant Accounting Policies" in the Notes to Financial Statements for additional information.
** Other financial instruments may include open forward foreign currency contracts, futures, swaps, and written options. Forward foreign currency contracts and futures are reported at their unrealized gain/loss at period end. Swaps and written options are reported at their market value at period end.
See Accompanying Notes to Financial Statements
62
ING OPPORTUNISTIC LARGECAP PORTFOLIO OF INVESTMENTS
GROWTH PORTFOLIO AS OF JUNE 30, 2009 (UNAUDITED)
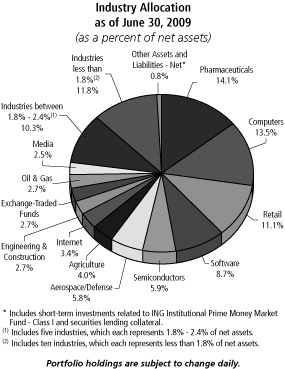
| Shares | | | | | | Value | |
| COMMON STOCK: 96.5% | | | |
| | | | | Aerospace/Defense: 5.8% | |
| | 12,000 | | | | | Goodrich Corp. | | $ | 599,640 | | |
| | 19,100 | | | | | Lockheed Martin Corp. | | | 1,540,415 | | |
| | 29,300 | | | | | Raytheon Co. | | | 1,301,799 | | |
| | 10,100 | | | | | United Technologies Corp. | | | 524,796 | | |
| | | | 3,966,650 | | |
| | | | | Agriculture: 4.0% | |
| | 82,100 | | | | | Altria Group, Inc. | | | 1,345,619 | | |
| | 32,200 | | | | | Philip Morris International, Inc. | | | 1,404,564 | | |
| | | | 2,750,183 | | |
| | | | | Banks: 2.4% | |
| | 6,000 | | | | | Goldman Sachs Group, Inc. | | | 884,640 | | |
| | 13,500 | | | | | Northern Trust Corp. | | | 724,680 | | |
| | | | 1,609,320 | | |
| | | | | Beverages: 1.1% | |
| | 13,200 | | | | | PepsiCo, Inc. | | | 725,472 | | |
| | | | 725,472 | | |
| | | | | Biotechnology: 1.6% | |
| | 10,300 | | | @ | | Biogen Idec, Inc. | | | 465,045 | | |
| | 18,500 | | | @ | | Myriad Genetics, Inc. | | | 659,525 | | |
| | | | 1,124,570 | | |
| | | | | Chemicals: 0.9% | |
| | 12,600 | | | | | Sigma-Aldrich Corp. | | | 624,456 | | |
| | | | 624,456 | | |
| Shares | | | | | | Value | |
| | | | | Computers: 13.5% | |
| | 28,800 | | | @ | | Apple, Inc. | | $ | 4,101,984 | | |
| | 80,500 | | | @ | | EMC Corp. | | | 1,054,551 | | |
| | 25,400 | | | | | Hewlett-Packard Co. | | | 981,710 | | |
| | 23,700 | | | | | International Business
Machines Corp. | | | 2,474,754 | | |
| | 23,000 | | | @ | | Western Digital Corp. | | | 609,500 | | |
| | | | 9,222,499 | | |
| | | | | Diversified Financial Services: 0.8% | �� |
| | 30,400 | | | @ | | TD Ameritrade Holding Corp. | | | 533,216 | | |
| | | | 533,216 | | |
| | | | | Electronics: 1.5% | |
| | 28,300 | | | @ | | Dolby Laboratories, Inc. | | | 1,055,024 | | |
| | | | 1,055,024 | | |
| | | | | Engineering & Construction: 2.7% | |
| | 36,700 | | | | | Fluor Corp. | | | 1,882,343 | | |
| | | | 1,882,343 | | |
| | | | | Food: 1.5% | |
| | 52,300 | | | @ | | Dean Foods Co. | | | 1,003,637 | | |
| | | | 1,003,637 | | |
| | | | | Healthcare-Services: 1.5% | |
| | 9,400 | | | | | Quest Diagnostics | | | 530,442 | | |
| | 21,200 | | | | | UnitedHealth Group, Inc. | | | 529,576 | | |
| | | | 1,060,018 | | |
| | | | | Household Products/Wares: 1.5% | |
| | 20,000 | | | | | Kimberly-Clark Corp. | | | 1,048,600 | | |
| | | | 1,048,600 | | |
| | | | | Internet: 3.4% | |
| | 7,800 | | | @ | | Amazon.com, Inc. | | | 652,548 | | |
| | 2,800 | | | @ | | Google, Inc. - Class A | | | 1,180,452 | | |
| | 26,100 | | | @ | | VeriSign, Inc. | | | 482,328 | | |
| | | | 2,315,328 | | |
| | | | | Machinery-Diversified: 0.9% | |
| | 8,600 | | | | | Flowserve Corp. | | | 600,366 | | |
| | | | 600,366 | | |
| | | | | Media: 2.5% | |
| | 88,600 | | | | | Comcast Corp. - Class A | | | 1,283,814 | | |
| | 18,700 | | | @,L | | DIRECTV Group, Inc. | | | 462,077 | | |
| | | | 1,745,891 | | |
| | | | | Miscellaneous Manufacturing: 1.8% | |
| | 27,900 | | | | | ITT Corp. | | | 1,241,550 | | |
| | | | 1,241,550 | | |
| | | | | Oil & Gas: 2.7% | |
| | 17,900 | | | | | Murphy Oil Corp. | | | 972,328 | | |
| | 22,800 | | | | | XTO Energy, Inc. | | | 869,592 | | |
| | | | 1,841,920 | | |
| | | | | Oil & Gas Services: 1.9% | |
| | 28,500 | | | @ | | Cameron International Corp. | | | 806,550 | | |
| | 15,600 | | | @ | | National Oilwell Varco, Inc. | | | 509,496 | | |
| | | | 1,316,046 | | |
See Accompanying Notes to Financial Statements
63
ING OPPORTUNISTIC LARGECAP PORTFOLIO OF INVESTMENTS
GROWTH PORTFOLIO AS OF JUNE 30, 2009 (UNAUDITED) (CONTINUED)
| Shares | | | | | | Value | |
| | | | | Packaging & Containers: 2.1% | |
| | 60,300 | | | @ | | Crown Holdings, Inc. | | $ | 1,455,642 | | |
| | | | 1,455,642 | | |
| | | | | Pharmaceuticals: 14.1% | |
| | 11,000 | | | | | Abbott Laboratories | | | 517,440 | | |
| | 35,600 | | | | | AmerisourceBergen Corp. | | | 631,544 | | |
| | 50,500 | | | | | Bristol-Myers Squibb Co. | | | 1,025,655 | | |
| | 20,800 | | | | | Eli Lilly & Co. | | | 720,512 | | |
| | 28,100 | | | @ | | Express Scripts, Inc. | | | 1,931,875 | | |
| | 28,100 | | | @ | | Forest Laboratories, Inc. | | | 705,591 | | |
| | 23,300 | | | @ | | Medco Health Solutions, Inc. | | | 1,062,713 | | |
| | 59,500 | | | @,L | | Mylan Laboratories | | | 776,475 | | |
| | 4,625 | | | @ | | Myriad Pharmaceuticals, Inc. | | | 21,506 | | |
| | 24,900 | | | | | Omnicare, Inc. | | | 641,424 | | |
| | 22,400 | | | | | Schering-Plough Corp. | | | 562,688 | | |
| | 31,000 | | | @ | | Watson Pharmaceuticals, Inc. | | | 1,044,390 | | |
| | | | 9,641,813 | | |
| | | | | Retail: 11.1% | |
| | 11,200 | | | | | Advance Auto Parts, Inc. | | | 464,688 | | |
| | 6,600 | | | @ | | Autozone, Inc. | | | 997,326 | | |
| | 13,900 | | | @ | | Dollar Tree, Inc. | | | 585,190 | | |
| | 19,100 | | | | | Family Dollar Stores, Inc. | | | 540,530 | | |
| | 6,000 | | | | | McDonald's Corp. | | | 344,940 | | |
| | 25,600 | | | | | Petsmart, Inc. | | | 549,376 | | |
| | 21,000 | | | | | Ross Stores, Inc. | | | 810,600 | | |
| | 63,300 | | | | | TJX Cos., Inc. | | | 1,991,418 | | |
| | 27,300 | | | | | Wal-Mart Stores, Inc. | | | 1,322,412 | | |
| | | | 7,606,480 | | |
| | | | | Savings & Loans: 0.5% | |
| | 23,400 | | | | | Hudson City Bancorp., Inc. | | | 310,986 | | |
| | | | 310,986 | | |
| | | | | Semiconductors: 5.9% | |
| | 62,000 | | | | | Altera Corp. | | | 1,009,360 | | |
| | 13,200 | | | | | Linear Technology Corp. | | | 308,220 | | |
| | 96,400 | | | @,@@ | | Marvell Technology Group Ltd. | | | 1,122,096 | | |
| | 77,500 | | | | | Xilinx, Inc. | | | 1,585,650 | | |
| | | | 4,025,326 | | |
| | | | | Software: 8.7% | |
| | 17,600 | | | @ | | BMC Software, Inc. | | | 594,704 | | |
| | 89,000 | | | | | CA, Inc. | | | 1,551,270 | | |
| | 30,600 | | | | | Microsoft Corp. | | | 727,362 | | |
| | 61,600 | | | @ | | Oracle Corp. | | | 1,319,472 | | |
| | 33,400 | | | @ | | Red Hat, Inc. | | | 672,342 | | |
| | 18,300 | | | @ | | Salesforce.com, Inc. | | | 698,511 | | |
| | 13,800 | | | @ | | VMware, Inc. | | | 376,326 | | |
| | | | 5,939,987 | | |
| | | | | Telecommunications: 2.1% | |
| | 19,400 | | | @ | | Cisco Systems, Inc. | | | 361,616 | | |
| | 11,700 | | | | | Qualcomm, Inc. | | | 528,840 | | |
| | 129,400 | | | L | | Qwest Communications
International, Inc. | | | 537,010 | | |
| | | | 1,427,466 | | |
Total Common Stock
(Cost $64,443,808) | | | 66,074,789 | | |
| Shares | | | | | | Value | |
| EXCHANGE-TRADED FUNDS: 2.7% | |
| | | | | Exchange-Traded Funds: 2.7% | |
| | 45,000 | | | | | iShares Russell 1000 Growth
Index Fund | | $ | 1,846,350 | | |
Total Exchange-Traded Funds
(Cost $1,661,560) | | | 1,846,350 | | |
Total Long-Term Investments
(Cost $66,105,368) | | | 67,921,139 | | |
| SHORT-TERM INVESTMENTS: 2.9% | |
| | | | | Affiliated Mutual Fund: 0.3% | |
| | 188,000 | | | | | ING Institutional Prime
Money Market Fund - Class I | | | 188,000 | | |
Total Mutual Fund
(Cost $188,000) | | | 188,000 | | |
Principal
Amount | | | | | | Value | |
| | | Securities Lending Collateralcc: 2.6% | |
| $ | 1,833,148 | | | Bank of New York Mellon Corp.
Institutional Cash Reserves | | $ | 1,798,322 | | |
Total Securities Lending Collateral
(Cost $1,833,148) | | | 1,798,322 | | |
Total Short-Term Investments
(Cost $2,021,148) | | | 1,986,322 | | |
Total Investments in
Securities
(Cost $68,126,516)* | | | 102.1 | % | | $ | 69,907,461 | | |
Other Assets and
Liabilities - Net | | | (2.1 | ) | | | (1,404,411 | ) | |
| Net Assets | | | 100.0 | % | | $ | 68,503,050 | | |
@ Non-income producing security
@@ Foreign Issuer
cc Securities purchased with cash collateral for securities loaned.
L Loaned security, a portion or all of the security is on loan at June 30, 2009.
* Cost for federal income tax purposes is $68,966,996.
Net unrealized appreciation consists of:
| Gross Unrealized Appreciation | | $ | 4,880,007 | | |
| Gross Unrealized Depreciation | | | (3,939,542 | ) | |
| Net Unrealized Appreciation | | $ | 940,465 | | |
See Accompanying Notes to Financial Statements
64
ING OPPORTUNISTIC LARGECAP PORTFOLIO OF INVESTMENTS
GROWTH PORTFOLIO AS OF JUNE 30, 2009 (UNAUDITED) (CONTINUED)
Fair Value Measurements*
The following is a summary of the inputs used as of June 30, 2009 in determining the Portfolio's investments at fair value for purposes of SFAS 157:
| | | Quoted Prices
in Active
Markets
for Identical
Investments
(Level 1) | | Significant
Other
Observable
Inputs
(Level 2) | | Significant
Unobservable
Inputs
(Level 3) | |
| Common Stock** | | $ | 66,074,789 | | | $ | — | | | $ | — | | |
| Exchange-Traded Funds | | | 1,846,350 | | | | — | | | | — | | |
| Short-Term Investments | | | 188,000 | | | | 1,798,322 | | | | — | | |
| Total | | $ | 68,109,139 | | | $ | 1,798,322 | | | $ | — | | |
Other Financial
Instruments*** | | | — | | | | — | | | | — | | |
| Total | | $ | — | | | $ | — | | | $ | — | | |
"Fair value" for purposes of SFAS 157 is different from "fair value" as used in the 1940 Act. The former generally implies market value, and can include market quotations as a source of value, and the latter refers to determinations of value in absence of available market quotations.
* See NOTE 2, "Significant Accounting Policies" in the Notes to Financial Statements for additional information.
** For further breakdown of Common Stock by industry type, please refer to the Portfolio of Investments.
*** Other financial instruments may include open forward foreign currency contracts, futures, swaps, and written options. Forward foreign currency contracts and futures are reported at their unrealized gain/loss at period end. Swaps and written options are reported at their market value at period end.
See Accompanying Notes to Financial Statements
65
PORTFOLIO OF INVESTMENTS
ING SMALL COMPANY PORTFOLIO AS OF JUNE 30, 2009 (UNAUDITED)
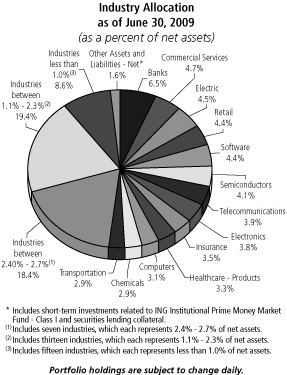
| Shares | | | | | | Value | |
| COMMON STOCK: 92.7% | | | |
| | | | | Advertising: 0.4% | |
| | 169,540 | | | @ | | inVentiv Health, Inc. | | $ | 2,293,876 | | |
| | | | 2,293,876 | | |
| | | | | Aerospace/Defense: 2.0% | |
| | 167,126 | | | @ | | Moog, Inc. | | | 4,313,522 | | |
| | 123,800 | | | @ | | Orbital Sciences Corp. | | | 1,878,046 | | |
| | 118,600 | | | @ | | Teledyne Technologies, Inc. | | | 3,884,150 | | |
| | | | 10,075,718 | | |
| | | | | Apparel: 2.7% | |
| | 215,288 | | | @ | | Carter's, Inc. | | | 5,298,238 | | |
| | 141,700 | | | @,L | | True Religion Apparel, Inc. | | | 3,159,910 | | |
| | 232,500 | | | | | Wolverine World Wide, Inc. | | | 5,128,950 | | |
| | | | 13,587,098 | | |
| | | | | Auto Parts & Equipment: 0.5% | |
| | 234,604 | | | | | Cooper Tire & Rubber Co. | | | 2,327,272 | | |
| | | | 2,327,272 | | |
| | | | | Banks: 6.5% | |
| | 288,314 | | | | | Bank Mutual Corp. | | | 2,514,098 | | |
| | 263,254 | | | | | FirstMerit Corp. | | | 4,470,053 | | |
| | 60,000 | | | | | Glacier Bancorp., Inc. | | | 886,200 | | |
| | 69,300 | | | | | IBERIABANK Corp. | | | 2,731,113 | | |
| | 290,300 | | | | | Old National Bancorp. | | | 2,850,746 | | |
| | 188,715 | | | | | PacWest Bancorp | | | 2,483,489 | | |
| | 127,918 | | | | | Prosperity Bancshares, Inc. | | | 3,815,794 | | |
| | 147,150 | | | @ | | Signature Bank | | | 3,990,708 | | |
| | 93,230 | | | | | UMB Financial Corp. | | | 3,543,672 | | |
| Shares | | | | | | Value | |
| | 59,000 | | | L | | Westamerica Bancorp. | | $ | 2,926,990 | | |
| | 423,422 | | | @ | | Western Alliance Bancorp. | | | 2,896,206 | | |
| | | | 33,109,069 | | |
| | | | | Biotechnology: 2.4% | |
| | 48,891 | | | @ | | Acorda Therapeutics, Inc. | | | 1,378,237 | | |
| | 24,200 | | | @,L | | AMAG Pharmaceuticals, Inc. | | | 1,323,014 | | |
| | 75,700 | | | @ | | Cubist Pharmaceuticals, Inc. | | | 1,387,581 | | |
| | 25,400 | | | @,L | | Dendreon Corp. | | | 631,190 | | |
| | 230,100 | | | @,L | | Human Genome Sciences, Inc. | | | 658,086 | | |
| | 131,200 | | | @,L | | InterMune, Inc. | | | 1,994,240 | | |
| | 140,785 | | | @ | | Medicines Co. | | | 1,181,186 | | |
| | 40,500 | | | @ | | OSI Pharmaceuticals, Inc. | | | 1,143,315 | | |
| | 274,874 | | | @ | | RTI Biologics, Inc. | | | 1,179,209 | | |
| | 112,000 | | | @ | | Seattle Genetics, Inc. | | | 1,088,640 | | |
| | | | 11,964,698 | | |
| | | | | Chemicals: 2.9% | |
| | 133,000 | | | | | Albemarle Corp. | | | 3,400,810 | | |
| | 76,100 | | | | | Cytec Industries, Inc. | | | 1,416,982 | | |
| | 218,500 | | | | | HB Fuller Co. | | | 4,101,245 | | |
| | 67,700 | | | | | Minerals Technologies, Inc. | | | 2,438,554 | | |
| | 244,400 | | | | | RPM International, Inc. | | | 3,431,376 | | |
| | | | 14,788,967 | | |
| | | | | Commercial Services: 4.7% | |
| | 214,737 | | | | | Arbitron, Inc. | | | 3,412,171 | | |
| | 82,500 | | | @,L | | Capella Education Co. | | | 4,945,875 | | |
| | 75,500 | | | @ | | FTI Consulting, Inc. | | | 3,829,360 | | |
| | 94,100 | | | | | Global Payments, Inc. | | | 3,524,986 | | |
| | 176,900 | | | @ | | PHH Corp. | | | 3,216,042 | | |
| | 196,248 | | | @ | | TrueBlue, Inc. | | | 1,648,483 | | |
| | 85,710 | | | | | Watson Wyatt Worldwide, Inc. | | | 3,216,696 | | |
| | | | 23,793,613 | | |
| | | | | Computers: 3.1% | |
| | 127,700 | | | @ | | CACI International, Inc. | | | 5,454,067 | | |
| | 672,769 | | | @ | | Mentor Graphics Corp. | | | 3,680,046 | | |
| | 142,300 | | | @ | | Micros Systems, Inc. | | | 3,603,036 | | |
| | 82,600 | | | @,L | | Synaptics, Inc. | | | 3,192,490 | | |
| | | | 15,929,639 | | |
| | | | | Cosmetics/Personal Care: 1.1% | |
| | 84,700 | | | @,L | | Chattem, Inc. | | | 5,768,070 | | |
| | | | 5,768,070 | | |
| | | | | Distribution/Wholesale: 2.7% | |
| | 204,100 | | | @ | | Fossil, Inc. | | | 4,914,728 | | |
| | 94,500 | | | | | Owens & Minor, Inc. | | | 4,140,990 | | |
| | 93,700 | | | L | | Watsco, Inc. | | | 4,584,741 | | |
| | | | 13,640,459 | | |
| | | | | Diversified Financial Services: 2.6% | |
| | 176,500 | | | | | Duff & Phelps Corp. | | | 3,138,170 | | |
| | 238,953 | | | @ | | Knight Capital Group, Inc. | | | 4,074,149 | | |
| | 234,269 | | | | | Sanders Morris Harris Group, Inc. | | | 1,288,480 | | |
| | 93,547 | | | @ | | Stifel Financial Corp. | | | 4,498,675 | | |
| | | | 12,999,474 | | |
| | | | | Electric: 4.5% | |
| | 133,500 | | | | | Black Hills Corp. | | | 3,069,165 | | |
| | 288,600 | | | | | Cleco Corp. | | | 6,470,412 | | |
| | 221,600 | | | @ | | El Paso Electric Co. | | | 3,093,536 | | |
| | 101,118 | | | | | Idacorp, Inc. | | | 2,643,225 | | |
| | 71,000 | | | | | NorthWestern Corp. | | | 1,615,960 | | |
| | 311,268 | | | | | Portland General Electric Co. | | | 6,063,502 | | |
| | | | 22,955,800 | | |
See Accompanying Notes to Financial Statements
66
PORTFOLIO OF INVESTMENTS
ING SMALL COMPANY PORTFOLIO AS OF JUNE 30, 2009 (UNAUDITED) (CONTINUED)
| Shares | | | | | | Value | |
| | | | | | | Electrical Components &
Equipment: 0.6% | | | | | |
| | 351,561 | | | @ | | Advanced Energy Industries, Inc. | | $ | 3,160,532 | | |
| | | | 3,160,532 | | |
| | | | | Electronics: 3.8% | |
| | 113,600 | | | | | Brady Corp. | | | 2,853,632 | | |
| | 203,900 | | | @ | | FEI Co. | | | 4,669,310 | | |
| | 136,554 | | | @ | | Flir Systems, Inc. | | | 3,080,658 | | |
| | 118,707 | | | @ | | Varian, Inc. | | | 4,680,617 | | |
| | 183,000 | | | | | Watts Water Technologies, Inc. | | | 3,941,820 | | |
| | | | 19,226,037 | | |
| | | | | Entertainment: 1.1% | |
| | 195,700 | | | @ | | Bally Technologies, Inc. | | | 5,855,344 | | |
| | | | 5,855,344 | | |
| | | | | Environmental Control: 1.3% | |
| | 58,139 | | | @ | | Clean Harbors, Inc. | | | 3,138,925 | | |
| | 124,899 | | | @ | | Waste Connections, Inc. | | | 3,236,133 | | |
| | | | 6,375,058 | | |
| | | | | Food: 1.5% | |
| | 67,600 | | | @,L | | American Italian Pasta Co. | | | 1,969,864 | | |
| | 108,669 | | | | | Flowers Foods, Inc. | | | 2,373,331 | | |
| | 255,700 | | | | | Spartan Stores, Inc. | | | 3,173,237 | | |
| | | | 7,516,432 | | |
| | | | | Gas: 0.4% | |
| | 65,400 | | | | | WGL Holdings, Inc. | | | 2,094,108 | | |
| | | | 2,094,108 | | |
| | | | | Hand/Machine Tools: 0.9% | |
| | 113,400 | | | | | Regal-Beloit Corp. | | | 4,504,248 | | |
| | | | 4,504,248 | | |
| | | | | Healthcare-Products: 3.3% | |
| | 78,800 | | | @ | | Gen-Probe, Inc. | | | 3,386,824 | | |
| | 101,575 | | | @ | | Greatbatch, Inc. | | | 2,296,611 | | |
| | 62,800 | | | @ | | Haemonetics Corp. | | | 3,579,600 | | |
| | 94,900 | | | @ | | Immucor, Inc. | | | 1,305,824 | | |
| | 198,252 | | | | | Meridian Bioscience, Inc. | | | 4,476,530 | | |
| | 184,624 | | | @ | | Micrus Endovascular Corp. | | | 1,669,001 | | |
| | | | 16,714,390 | | |
| | | | | Healthcare-Services: 2.3% | |
| | 100,400 | | | @ | | AMERIGROUP Corp. | | | 2,695,740 | | |
| | 122,933 | | | @ | | Healthsouth Corp. | | | 1,775,153 | | |
| | 172,600 | | | @ | | Psychiatric Solutions, Inc. | | | 3,924,924 | | |
| | 67,406 | | | | | Universal Health Services, Inc. | | | 3,292,783 | | |
| | | | 11,688,600 | | |
| | | | | Home Builders: 0.5% | |
| | 163,800 | | | | | Ryland Group, Inc. | | | 2,745,288 | | |
| | | | 2,745,288 | | |
| | | | | Home Furnishings: 0.2% | �� |
| | 122,400 | | | | | Ethan Allen Interiors, Inc. | | | 1,268,064 | | |
| | | | 1,268,064 | | |
| | | | | Housewares: 0.4% | |
| | 75,300 | | | L | | Toro Co. | | | 2,251,470 | | |
| | | | 2,251,470 | | |
| Shares | | | | | | Value | |
| | | | | Insurance: 3.5% | |
| | 107,332 | | | @,@@ | | Argo Group International
Holdings Ltd. | | $ | 3,028,909 | | |
| | 121,000 | | | | | Delphi Financial Group | | | 2,351,030 | | |
| | 73,300 | | | @ | | Navigators Group, Inc. | | | 3,256,719 | | |
| | 171,500 | | | @@ | | Platinum Underwriters
Holdings Ltd. | | | 4,903,185 | | |
| | 96,918 | | | @ | | ProAssurance Corp. | | | 4,478,581 | | |
| | | | 18,018,424 | | |
| | | | | Internet: 2.6% | |
| | 339,597 | | | @ | | Avocent Corp. | | | 4,740,774 | | |
| | 251,824 | | | @ | | Blue Coat Systems, Inc. | | | 4,165,169 | | |
| | 149,548 | | | @ | | j2 Global Communications, Inc. | | | 3,373,803 | | |
| | 101,800 | | | @ | | Valueclick, Inc. | | | 1,070,936 | | |
| | | | 13,350,682 | | |
| | | | | Investment Companies: 0.6% | |
| | 498,913 | | | L | | Apollo Investment Corp. | | | 2,993,478 | | |
| | | | 2,993,478 | | |
| | | | | Machinery-Diversified: 2.7% | |
| | 78,800 | | | @ | | AGCO Corp. | | | 2,290,716 | | |
| | 124,927 | | | @ | | Gardner Denver, Inc. | | | 3,144,413 | | |
| | 284,000 | | | @ | | Intermec, Inc. | | | 3,663,600 | | |
| | 62,968 | | | | | Nordson Corp. | | | 2,434,343 | | |
| | 61,421 | | | | | Wabtec Corp. | | | 1,975,914 | | |
| | | | 13,508,986 | | |
| | | | | Metal Fabricate/Hardware: 0.8% | |
| | 238,600 | | | | | Commercial Metals Co. | | | 3,824,758 | | |
| | | | 3,824,758 | | |
| | | | | Miscellaneous Manufacturing: 1.2% | |
| | 228,600 | | | | | Actuant Corp. | | | 2,788,920 | | |
| | 270,590 | | | | | Barnes Group, Inc. | | | 3,217,315 | | |
| | | | 6,006,235 | | |
| | | | | Oil & Gas: 2.7% | |
| | 98,700 | | | @ | | Bill Barrett Corp. | | | 2,710,302 | | |
| | 171,228 | | | @,L | | Carrizo Oil & Gas, Inc. | | | 2,936,560 | | |
| | 198,400 | | | | | Frontier Oil Corp. | | | 2,601,024 | | |
| | 342,600 | | | @ | | McMoRan Exploration Co. | | | 2,041,896 | | |
| | 127,300 | | | @ | | Unit Corp. | | | 3,509,661 | | |
| | | | 13,799,443 | | |
| | | | | Oil & Gas Services: 1.8% | |
| | 48,665 | | | L | | Core Laboratories NV | | | 4,241,155 | | |
| | 96,100 | | | @ | | Dril-Quip, Inc. | | | 3,661,410 | | |
| | 166,824 | | | @ | | Tetra Technologies, Inc. | | | 1,327,919 | | |
| | | | 9,230,484 | | |
| | | | | Packaging & Containers: 1.1% | |
| | 112,400 | | | | | Silgan Holdings, Inc. | | | 5,510,972 | | |
| | | | 5,510,972 | | |
| | | | | Pharmaceuticals: 1.8% | |
| | 327,600 | | | @ | | Akorn, Inc. | | | 393,120 | | |
| | 157,094 | | | @ | | Nektar Therapeutics | | | 1,017,969 | | |
| | 129,566 | | | | | Omnicare, Inc. | | | 3,337,620 | | |
| | 120,600 | | | @ | | Onyx Pharmaceuticals, Inc. | | | 3,408,156 | | |
| | 71,900 | | | @,L | | Savient Pharmaceuticals, Inc. | | | 996,534 | | |
| | | | 9,153,399 | | |
See Accompanying Notes to Financial Statements
67
PORTFOLIO OF INVESTMENTS
ING SMALL COMPANY PORTFOLIO AS OF JUNE 30, 2009 (UNAUDITED) (CONTINUED)
| Shares | | | | | | Value | |
| | | | | Retail: 4.4% | |
| | 169,700 | | | | | Casey's General Stores, Inc. | | $ | 4,359,593 | | |
| | 205,400 | | | @,L | | Dress Barn, Inc. | | | 2,937,220 | | |
| | 218,437 | | | @ | | Jack in the Box, Inc. | | | 4,903,911 | | |
| | 162,213 | | | @ | | Jo-Ann Stores, Inc. | | | 3,352,943 | | |
| | 190,012 | | | @ | | Papa John's International, Inc. | | | 4,710,397 | | |
| | 670,700 | | | @ | | Wet Seal, Inc. | | | 2,059,049 | | |
| | | | 22,323,113 | | |
| | | | | Savings & Loans: 1.8% | |
| | 324,168 | | | | | NewAlliance Bancshares, Inc. | | | 3,727,932 | | |
| | 276,199 | | | | | Provident Financial Services, Inc. | | | 2,513,411 | | |
| | 294,141 | | | | | Westfield Financial, Inc. | | | 2,664,917 | | |
| | | | 8,906,260 | | |
| | | | | Semiconductors: 4.1% | |
| | 115,900 | | | @,L | | Emulex Corp. | | | 1,133,502 | | |
| | 573,000 | | | @ | | Entegris, Inc. | | | 1,558,560 | | |
| | 213,800 | | | @ | | Formfactor, Inc. | | | 3,685,912 | | |
| | 192,400 | | | | | Micrel, Inc. | | | 1,408,368 | | |
| | 215,600 | | | @ | | MKS Instruments, Inc. | | | 2,843,764 | | |
| | 421,700 | | | @ | | ON Semiconductor Corp. | | | 2,892,862 | | |
| | 114,400 | | | | | Power Integrations, Inc. | | | 2,721,576 | | |
| | 367,837 | | | @,@@ | | Verigy Ltd. | | | 4,476,576 | | |
| | | | 20,721,120 | | |
| | | | | Software: 4.4% | |
| | 149,692 | | | @ | | Ansys, Inc. | | | 4,664,403 | | |
| | 58,300 | | | @ | | Concur Technologies, Inc. | | | 1,811,964 | | |
| | 82,900 | | | @ | | Parametric Technology Corp. | | | 969,101 | | |
| | 176,700 | | | @ | | Progress Software Corp. | | | 3,740,739 | | |
| | 321,900 | | | @ | | Quest Software, Inc. | | | 4,487,286 | | |
| | 224,200 | | | @ | | Solera Holdings, Inc. | | | 5,694,680 | | |
| | 172,850 | | | @ | | THQ, Inc. | | | 1,237,606 | | |
| | | | 22,605,779 | | |
| | | | | Telecommunications: 3.9% | |
| | 381,160 | | | | | Alaska Communications Systems
Group, Inc. | | | 2,790,091 | | |
| | 166,200 | | | | | NTELOS Holdings Corp. | | | 3,061,404 | | |
| | 276,037 | | | @ | | Polycom, Inc. | | | 5,595,270 | | |
| | 247,828 | | | @ | | RCN Corp. | | | 1,479,533 | | |
| | 152,200 | | | @ | | SBA Communications Corp. | | | 3,734,988 | | |
| | 176,200 | | | @ | | Tekelec | | | 2,965,446 | | |
| | | | 19,626,732 | | |
| | | | | Transportation: 2.9% | |
| | 140,811 | | | @ | | Atlas Air Worldwide
Holdings, Inc. | | | 3,265,407 | | |
| | 257,300 | | | | | Heartland Express, Inc. | | | 3,787,456 | | |
| | 158,481 | | | @ | | HUB Group, Inc. | | | 3,271,048 | | |
| | 99,400 | | | @ | | Kirby Corp. | | | 3,159,926 | | |
| | 38,400 | | | @ | | Old Dominion Freight Line | | | 1,289,088 | | |
| | | | 14,772,925 | | |
Total Common Stock
(Cost $479,151,713) | | | 470,986,114 | | |
| REAL ESTATE INVESTMENT TRUSTS: 4.4% | | | |
| | | | | Apartments: 0.8% | |
| | 182,800 | | | | | American Campus
Communities, Inc. | | | 4,054,504 | | |
| | | | 4,054,504 | | |
| Shares | | | | | | Value | |
| | | | | Hotels: 0.4% | |
| | 335,100 | | | @ | | DiamondRock Hospitality Co. | | $ | 2,097,726 | | |
| | | | 2,097,726 | | |
| | | | | Mortgage: 1.1% | |
| | 72,281 | | | | | Hatteras Financial Corp. | | | 2,066,514 | | |
| | 252,269 | | | | | Redwood Trust, Inc. | | | 3,723,490 | | |
| | | | 5,790,004 | | |
| | | | | Office Property: 0.7% | |
| | 163,700 | | | | | Highwoods Properties, Inc. | | | 3,661,969 | | |
| | | | 3,661,969 | | |
| | | | | Shopping Centers: 0.6% | |
| | 242,156 | | | | | Acadia Realty Trust | | | 3,160,136 | | |
| | | | 3,160,136 | | |
| | | | | Single Tenant: 0.8% | |
| | 220,272 | | | L | | National Retail Properties, Inc. | | | 3,821,719 | | |
| | | | 3,821,719 | | |
Total Real Estate
Investment Trusts
(Cost $20,954,084) | | | 22,586,058 | | |
| EXCHANGE-TRADED FUNDS: 1.3% | | | |
| | | | | Exchange-Traded Funds: 1.3% | |
| | 19,876 | | | L | | iShares Russell 2000 Index Fund | | | 1,012,881 | | |
| | 124,345 | | | L | | iShares Russell 2000 Value
Index Fund | | | 5,785,773 | | |
Total Exchange-Traded Funds
(Cost $6,431,974) | | | 6,798,654 | | |
Total Long-Term Investments
(Cost $506,537,771) | | | 500,370,826 | | |
| SHORT-TERM INVESTMENTS: 6.7% | | | |
| | | Affiliated Mutual Fund: 0.5% | |
| | 2,651,000 | | | ING Institutional Prime
Money Market Fund - Class I | | | | | 2,651,000 | | |
Total Mutual Fund
(Cost $2,651,000) | | | 2,651,000 | | |
Principal
Amount | | | | Value | |
| | | | | Securities Lending Collateralcc: 6.2% | |
| $ | 31,619,673 | | | Bank of New York Mellon Corp.
Institutional Cash Reserves | | $ | 31,278,815 | | |
Total Securities Lending Collateral
(Cost $31,619,673) | | | 31,278,815 | | |
Total Short-Term Investments
(Cost $34,270,673) | | | 33,929,815 | | |
Total Investments in
Securities
(Cost $540,808,444)* | | | 105.1 | % | | $ | 534,300,641 | | |
Other Assets and
Liabilities - Net | | | (5.1 | ) | | | (26,007,987 | ) | |
| Net Assets | | | 100.0 | % | | $ | 508,292,654 | | |
@ Non-income producing security
@@ Foreign Issuer
See Accompanying Notes to Financial Statements
68
PORTFOLIO OF INVESTMENTS
ING SMALL COMPANY PORTFOLIO AS OF JUNE 30, 2009 (UNAUDITED) (CONTINUED)
cc Securities purchased with cash collateral for securities loaned.
L Loaned security, a portion or all of the security is on loan at June 30, 2009.
* Cost for federal income tax purposes is $570,074,628.
Net unrealized depreciation consists of:
| Gross Unrealized Appreciation | | $ | 35,997,797 | | |
| Gross Unrealized Depreciation | | | (71,771,784 | ) | |
| Net Unrealized Depreciation | | $ | (35,773,987 | ) | |
| Fair Value Measurements* | |
The following is a summary of the inputs used as of June 30, 2009 in determining the Portfolio's investments at fair value for purposes of SFAS 157:
| | | Quoted Prices
in Active
Markets
for Identical
Investments
(Level 1) | | Significant
Other
Observable
Inputs
(Level 2) | | Significant
Unobservable
Inputs
(Level 3) | |
| Common Stock** | | $ | 470,986,114 | | | $ | — | | | $ | — | | |
Real Estate
Investment Trusts | | | 22,586,058 | | | | — | | | | — | | |
Exchange-Traded
Funds | | | 6,798,654 | | | | — | | | | — | | |
Short-Term
Investments | | | 2,651,000 | | | | 31,278,815 | | | | — | | |
| Total | | $ | 503,021,826 | | | $ | 31,278,815 | | | $ | — | | |
Other Financial
Instruments*** | | | — | | | | — | | | | — | | |
| Total | | $ | — | | | $ | — | | | $ | — | | |
"Fair value" for purposes of SFAS 157 is different from "fair value" as used in the 1940 Act. The former generally implies market value, and can include market quotations as a source of value, and the latter refers to determinations of value in absence of available market quotations.
* See NOTE 2, "Significant Accounting Policies" in the Notes to Financial Statements for additional information.
** For further breakdown of Common Stock by industry type, please refer to the Portfolio of Investments.
*** Other financial instruments may include open forward foreign currency contracts, futures, swaps, and written options. Forward foreign currency contracts and futures are reported at their unrealized gain/loss at period end. Swaps and written options are reported at their market value at period end.
See Accompanying Notes to Financial Statements
69
ING OPPORTUNISTIC PORTFOLIO OF INVESTMENTS
LARGECAP PORTFOLIO AS OF JUNE 30, 2009 (UNAUDITED)
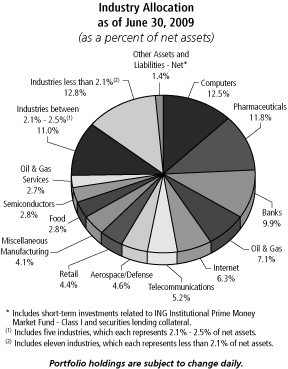
| Shares | | | | | | Value | |
| COMMON STOCK: 95.8% | | | |
| | | | | Aerospace/Defense: 4.6% | |
| | 14,200 | | | | | Lockheed Martin Corp. | | $ | 1,145,230 | | |
| | 15,200 | | | | | Northrop Grumman Corp. | | | 694,336 | | |
| | 18,900 | | | | | Raytheon Co. | | | 839,727 | | |
| | 15,800 | | | | | United Technologies Corp. | | | 820,968 | | |
| | | | 3,500,261 | | |
| | | | | Agriculture: 1.6% | |
| | 30,800 | | | | | Reynolds American, Inc. | | | 1,189,496 | | |
| | | | 1,189,496 | | |
| | | | | Banks: 9.9% | |
| | 113,500 | | | | | Bank of America Corp. | | | 1,498,200 | | |
| | 9,900 | | | | | Goldman Sachs Group, Inc. | | | 1,459,656 | | |
| | 311 | | | @@ | | HSBC Holdings PLC ADR | | | 12,990 | | |
| | 40,000 | | | | | JPMorgan Chase & Co. | | | 1,364,400 | | |
| | 10,900 | | | | | Northern Trust Corp. | | | 585,112 | | |
| | 20,700 | | | | | PNC Financial Services Group, Inc. | | | 803,367 | | |
| | 74,500 | | | | | Wells Fargo & Co. | | | 1,807,370 | | |
| | | | 7,531,095 | | |
| | | | | Biotechnology: 1.5% | |
| | 25,300 | | | @ | | Biogen Idec, Inc. | | | 1,142,295 | | |
| | | | 1,142,295 | | |
| | | | | Computers: 12.5% | |
| | 27,800 | | | @@ | | Accenture Ltd. | | | 930,188 | | |
| | 13,994 | | | @ | | Apple, Inc. | | | 1,993,165 | | |
| | 25,600 | | | @ | | Computer Sciences Corp. | | | 1,134,080 | | |
| | 79,700 | | | @ | | EMC Corp. | | | 1,044,070 | | |
| Shares | | | | | | Value | |
| | 47,200 | | | | | Hewlett-Packard Co. | | $ | 1,824,280 | | |
| | 24,600 | | | | | International Business
Machines Corp. | | | 2,568,732 | | |
| | | | 9,494,515 | | |
| | | | | Diversified Financial Services: 2.5% | |
| | 42,500 | | | | | American Express Co. | | | 987,700 | | |
| | 52,200 | | | | | Charles Schwab Corp. | | | 915,588 | | |
| | | | 1,903,288 | | |
| | | | | Electric: 1.6% | |
| | 15,700 | | | | | Exelon Corp. | | | 803,997 | | |
| | 11,900 | | | | | Public Service Enterprise
Group, Inc. | | | 388,297 | | |
| | | | 1,192,294 | | |
| | | | | Food: 3.4% | |
| | 49,603 | | | @ | | Dean Foods Co. | | | 951,882 | | |
| | 30,500 | | | | | Kraft Foods, Inc. | | | 772,870 | | |
| | 86,500 | | | | | Sara Lee Corp. | | | 844,240 | | |
| | | | 2,568,992 | | |
| | | | | Healthcare-Services: 1.3% | |
| | 41,000 | | | | | UnitedHealth Group, Inc. | | | 1,024,180 | | |
| | | | 1,024,180 | | |
| | | | | Home Builders: 0.9% | |
| | 74,200 | | | | | D.R. Horton, Inc. | | | 694,512 | | |
| | | | 694,512 | | |
| | | | | Household Products/Wares: 1.0% | |
| | 14,900 | | | | | Kimberly-Clark Corp. | | | 781,207 | | |
| | | | 781,207 | | |
| | | | | Insurance: 2.1% | |
| | 21,800 | | | @@ | | ACE Ltd. | | | 964,214 | | |
| | 40,300 | | | | | UnumProvident Corp. | | | 639,158 | | |
| | | | 1,603,372 | | |
| | | | | Internet: 6.3% | |
| | 14,300 | | | @ | | Amazon.com, Inc. | | | 1,196,338 | | |
| | 78,900 | | | @ | | eBay, Inc. | | | 1,351,557 | | |
| | 2,461 | | | @ | | Google, Inc. - Class A | | | 1,037,533 | | |
| | 78,500 | | | @ | | Symantec Corp. | | | 1,221,460 | | |
| | | | 4,806,888 | | |
| | | | | Iron/Steel: 0.7% | |
| | 13,300 | | | | | Reliance Steel & Aluminum Co. | | | 510,587 | | |
| | | | 510,587 | | |
| | | | | Media: 2.1% | |
| | 111,600 | | | | | Comcast Corp. - Class A | | | 1,617,084 | | |
| | | | 1,617,084 | | |
| | | | | Metal Fabricate/Hardware: 1.0% | |
| | 10,100 | | | | | Precision Castparts Corp. | | | 737,603 | | |
| | | | 737,603 | | |
| | | | | Miscellaneous Manufacturing: 4.1% | |
| | 15,100 | | | | | Cooper Industries Ltd. | | | 468,855 | | |
| | 33,600 | | | | | Dover Corp. | | | 1,111,824 | | |
| | 130,300 | | | | | General Electric Co. | | | 1,527,116 | | |
| | | | 3,107,795 | | |
See Accompanying Notes to Financial Statements
70
ING OPPORTUNISTIC PORTFOLIO OF INVESTMENTS
LARGECAP PORTFOLIO AS OF JUNE 30, 2009 (UNAUDITED) (CONTINUED)
| Shares | | | | | | Value | |
| | | | | Office/Business Equipment: 1.0% | |
| | 33,200 | | | | | Pitney Bowes, Inc. | | $ | 728,076 | | |
| | | | 728,076 | | |
| | | | | Oil & Gas: 7.1% | |
| | 7,000 | | | @@,L | | China Petroleum &
Chemical Corp. ADR | | | 531,020 | | |
| | 26,800 | | | | | ExxonMobil Corp. | | | 1,873,588 | | |
| | 25,300 | | | | | Murphy Oil Corp. | | | 1,374,296 | | |
| | 27,700 | | | @@ | | Nexen, Inc. | | | 599,705 | | |
| | 34,400 | | | | | Noble Corp. | | | 1,040,600 | | |
| | | | 5,419,209 | | |
| | | | | Oil & Gas Services: 2.7% | |
| | 33,600 | | | @ | | Cameron International Corp. | | | 950,880 | | |
| | 33,800 | | | @ | | National Oilwell Varco, Inc. | | | 1,103,908 | | |
| | | | 2,054,788 | | |
| | | | | Packaging & Containers: 2.2% | |
| | 31,300 | | | @ | | Crown Holdings, Inc. | | | 755,582 | | |
| | 44,300 | | | @ | | Pactiv Corp. | | | 961,310 | | |
| | | | 1,716,892 | | |
| | | | | Pharmaceuticals: 11.8% | |
| | 41,600 | | | | | AmerisourceBergen Corp. | | | 737,984 | | |
| | 24,400 | | | | | Eli Lilly & Co. | | | 845,216 | | |
| | 15,000 | | | @ | | Express Scripts, Inc. | | | 1,031,250 | | |
| | 51,800 | | | @ | | Forest Laboratories, Inc. | | | 1,300,698 | | |
| | 29,400 | | | @ | | Medco Health Solutions, Inc. | | | 1,340,934 | | |
| | 26,600 | | | | | Omnicare, Inc. | | | 685,216 | | |
| | 150,900 | | | | | Pfizer, Inc. | | | 2,263,500 | | |
| | 22,400 | | | @ | | Watson Pharmaceuticals, Inc. | | | 754,656 | | |
| | | | 8,959,454 | | |
| | | | | Retail: 4.4% | |
| | 22,300 | | | | | Family Dollar Stores, Inc. | | | 631,090 | | |
| | 45,800 | | | | | Home Depot, Inc. | | | 1,082,254 | | |
| | 18,600 | | | | | Ross Stores, Inc. | | | 717,960 | | |
| | 13,900 | | | @,L | | Sears Holding Corp. | | | 924,628 | | |
| | | | 3,355,932 | | |
| | | | | Savings & Loans: 1.5% | |
| | 85,700 | | | | | Hudson City Bancorp., Inc. | | | 1,138,953 | | |
| | | | 1,138,953 | | |
| | | | | Semiconductors: 2.8% | |
| | 69,900 | | | @,@@ | | Marvell Technology Group Ltd. | | | 813,636 | | |
| | 25,500 | | | @@ | | Taiwan Semiconductor
Manufacturing Co., Ltd. ADR | | | 239,955 | | |
| | 52,000 | | | | | Texas Instruments, Inc. | | | 1,107,600 | | |
| | | | 2,161,191 | | |
| | | | | Telecommunications: 5.2% | |
| | 38,500 | | | @,@@ | | Amdocs Ltd. | | | 825,825 | | |
| | 110,300 | | | @ | | Cisco Systems, Inc. | | | 2,055,992 | | |
| | 223,300 | | | @ | | Sprint Nextel Corp. | | | 1,074,073 | | |
| | | | 3,955,890 | | |
Total Common Stock
(Cost $72,360,860) | | | 72,895,849 | | |
| Shares | | | | | | Value | |
| REAL ESTATE INVESTMENT TRUSTS: 0.7% | | | |
| | | | | Regional Malls: 0.7% | |
| | 11,000 | | | L | | Simon Property Group, Inc. | | $ | 565,730 | | |
Total Real Estate Investment Trusts
(Cost $594,268) | | | 565,730 | | |
| EXCHANGE-TRADED FUNDS: 2.1% | | | |
| | | | | Exchange-Traded Funds: 2.1% | |
| | 41,300 | | | | | Consumer Staples Select
Sector SPDR Fund | | | 949,487 | | |
| | 6,700 | | | | | SPDR Trust Series 1 | | | 615,864 | | |
Total Exchange-Traded Funds
(Cost $1,553,423) | | | 1,565,351 | | |
Total Long-Term Investments
(Cost $74,508,551) | | | 75,026,930 | | |
| SHORT-TERM INVESTMENTS: 2.3% | | | |
| | | | | Affiliated Mutual Fund: 0.8% | |
| | 634,000 | | | | | ING Institutional Prime
Money Market Fund - Class I | | | 634,000 | | |
Total Mutual Fund
(Cost $634,000) | | | 634,000 | | |
Principal
Amount | | | | | | Value | |
| | | | | Securities Lending Collateralcc: 1.5% | |
| $ | 1,148,804 | | | | | Bank of New York Mellon Corp.
Institutional Cash Reserves | | $ | 1,103,446 | | |
Total Securities Lending Collateral
(Cost $1,148,804) | | | | 1,103,446 | |
Total Short-Term Investments
(Cost $1,782,804) | | | | 1,737,446 | |
Total Investments in
Securities
(Cost $76,291,355)* | | | 100.9 | % | | $ | 76,764,376 | | |
Other Assets and
Liabilities - Net | | | (0.9 | ) | | | (674,466 | ) | |
| Net Assets | | | 100.0 | % | | $ | 76,089,910 | | |
@ Non-income producing security
@@ Foreign Issuer
ADR American Depositary Receipt
cc Securities purchased with cash collateral for securities loaned.
L Loaned security, a portion or all of the security is on loan at June 30, 2009.
* Cost for federal income tax purposes is $79,633,865.
Net unrealized depreciation consists of:
| Gross Unrealized Appreciation | | $ | 3,145,611 | | |
| Gross Unrealized Depreciation | | | (6,015,100 | ) | |
| Net Unrealized Depreciation | | $ | (2,869,489 | ) | |
See Accompanying Notes to Financial Statements
71
ING OPPORTUNISTIC PORTFOLIO OF INVESTMENTS
LARGECAP PORTFOLIO AS OF JUNE 30, 2009 (UNAUDITED) (CONTINUED)
The following is a summary of the inputs used as of June 30, 2009 in determining the Portfolio's investments at fair value for purposes of SFAS 157:
| | | Quoted Prices
in Active
Markets
for Identical
Investments
(Level 1) | | Significant
Other
Observable
Inputs
(Level 2) | | Significant
Unobservable
Inputs
(Level 3) | |
| Common Stock** | | $ | 72,895,849 | | | $ | — | | | $ | — | | |
Real Estate
Investment Trusts | | | 565,730 | | | | — | | | | — | | |
Exchange-Traded
Funds | | | 1,565,351 | | | | — | | | | — | | |
Short-Term
Investments | | | 634,000 | | | | 1,103,446 | | | | — | | |
| Total | | $ | 75,660,930 | | | $ | 1,103,446 | | | $ | — | | |
Other Financial
Instruments*** | | | — | | | | — | | | | — | | |
| Total | | $ | — | | | $ | — | | | $ | — | | |
"Fair value" for purposes of SFAS 157 is different from "fair value" as used in the 1940 Act. The former generally implies market value, and can include market quotations as a source of value, and the latter refers to determinations of value in absence of available market quotations.
* See NOTE 2, "Significant Accounting Policies" in the Notes to Financial Statements for additional information.
** For further breakdown of Common Stock by industry type, please refer to the Portfolio of Investments.
*** Other financial instruments may include open forward foreign currency contracts, futures, swaps, and written options. Forward foreign currency contracts and futures are reported at their unrealized gain/loss at period end. Swaps and written options are reported at their market value at period end.
See Accompanying Notes to Financial Statements
72
PORTFOLIO OF INVESTMENTS
ING INTERMEDIATE BOND PORTFOLIO AS OF JUNE 30, 2009 (UNAUDITED)
| U.S. Government Agency Obligations | | | 38.5 | % | |
| Corporate Bonds/Notes | | | 30.4 | % | |
| U.S. Treasury Obligations | | | 26.0 | % | |
| Collateralized Mortgage Obligations | | | 11.6 | % | |
| Other Bonds | | | 1.9 | % | |
| Asset-Backed Securities | | | 1.7 | % | |
| Preferred Stock | | | 0.2 | % | |
| Other Assets and Liabilities — Net* | | | (10.3 | )% | |
| Net Assets | | | 100.0 | % | |
Investment Type Allocation
as of June 30, 2009
(as a percent of net assets)
* Includes short-term investments related to commercial paper, ING Institutional Prime Money Market Fund — Class I, securities lending collateral and U.S. Treasury Bill.
Portfolio holdings are subject to change daily.
Principal
Amount | | | | | | Value | |
| CORPORATE BONDS/NOTES: 30.4% | | | |
| | | | | Agriculture: 0.5% | |
| $ | 8,994,000 | | | | | Altria Group, Inc.,
9.700%, due 11/10/18 | | $ | 10,327,477 | | |
| | 620,000 | | | | | Philip Morris
International, Inc.,
5.650%, due 05/16/18 | | | 651,013 | | |
| | 2,798,000 | | | | | Philip Morris
International, Inc.,
6.875%, due 03/17/14 | | | 3,160,243 | | |
| | | | 14,138,733 | | |
| | | | | Banks: 7.4% | |
| | 7,348,000 | | | | | American Express Bank FSB,
5.500%, due 04/16/13 | | | 7,217,162 | | |
| | 8,714,000 | | | C | | Bank of America Corp.,
8.000%, due 12/29/49 | | | 7,288,154 | | |
| | 3,090,000 | | | @@,C | | Bank of Ireland, 0.875%,
due 12/29/49 | | | 861,183 | | |
| | 2,120,000 | | | @@,C | | Barclays Bank PLC,
1.875%, due 08/29/49 | | | 879,800 | | |
| | 16,627,000 | | | @@,# | | Barclays Bank PLC,
6.050%, due 12/04/17 | | | 14,441,148 | | |
| | 2,600,000 | | | @@,C | | BNP Paribas, 1.928%,
due 09/29/49 | | | 1,092,000 | | |
| | 2,140,000 | | | | | Capital One Financial Corp.,
7.375%, due 05/23/14 | | | 2,208,970 | | |
| | 13,279,000 | | | | | Citigroup, Inc., 5.000%,
due 09/15/14 | | | 11,144,228 | | |
| | 8,999,000 | | | | | Citigroup, Inc., 5.250%,
due 02/27/12 | | | 8,792,851 | | |
| | 1,020,000 | | | | | Citigroup, Inc., 8.500%,
due 05/22/19 | | | 1,039,306 | | |
| | 3,280,000 | | | #,C | | Dresdner Funding Trust I,
8.151%, due 06/30/31 | | | 1,598,334 | | |
Principal
Amount | | | | | | Value | |
| $ | 13,925,000 | | | | | Fifth Third Bancorp.,
8.250%, due 03/01/38 | | $ | 10,683,636 | | |
| | 10,773,000 | | | | | First Tennessee Bank NA,
5.650%, due 04/01/16 | | | 8,083,122 | | |
| | 3,650,000 | | | | | Goldman Sachs Group, Inc.,
5.250%, due 04/01/13 | | | 3,735,899 | | |
| | 4,974,000 | | | | | Goldman Sachs Group, Inc.,
5.450%, due 11/01/12 | | | 5,146,956 | | |
| | 6,202,000 | | | | | Goldman Sachs Group, Inc.,
5.500%, due 11/15/14 | | | 6,223,329 | | |
| | 8,651,000 | | | | | Goldman Sachs Group, Inc.,
6.000%, due 05/01/14 | | | 9,038,115 | | |
| | 7,580,000 | | | @@,C | | HSBC Bank PLC, 1.288%,
due 06/29/49 | | | 3,600,500 | | |
| | 3,796,000 | | | | | JPMorgan Chase & Co.,
4.650%, due 06/01/14 | | | 3,790,093 | | |
| | 5,734,000 | | | | | JPMorgan Chase Bank NA,
5.875%, due 06/13/16 | | | 5,534,078 | | |
| | 3,037,000 | | | | | Morgan Stanley, 2.250%,
due 03/13/12 | | | 3,065,739 | | |
| | 5,797,000 | | | | | Morgan Stanley, 4.750%,
due 04/01/14 | | | 5,481,481 | | |
| | 2,296,000 | | | C | | Morgan Stanley, 5.300%,
due 03/01/13 | | | 2,327,458 | | |
| | 8,806,000 | | | C | | Morgan Stanley, 6.750%,
due 04/15/11 | | | 9,228,750 | | |
| | 4,399,000 | | | C | | Morgan Stanley, 7.300%,
due 05/13/19 | | | 4,569,549 | | |
| | 13,106,000 | | | C | | National City Preferred
Capital Trust I, 12.000%,
due 12/29/49 | | | 13,738,286 | | |
| | 12,495,000 | | | @@,#,C | | Rabobank, 11.000%,
due 12/29/49 | | | 13,935,911 | | |
| | 660,000 | | | @@,C | | Societe Generale, 1.375%,
due 11/29/49 | | | 289,163 | | |
| | 17,277,000 | | | | | State Street Corp., 2.150%,
due 04/30/12 | | | 17,366,996 | | |
| | 6,361,000 | | | | | SunTrust Bank/Atlanta GA,
5.450%, due 12/01/17 | | | 5,596,026 | | |
| | 4,189,000 | | | | | Wachovia Bank NA,
6.000%, due 11/15/17 | | | 4,228,636 | | |
| | 10,798,000 | | | | | Wachovia Bank NA,
6.600%, due 01/15/38 | | | 10,559,299 | | |
| | 6,681,000 | | | | | Wachovia Corp., 5.500%,
due 05/01/13 | | | 6,907,412 | | |
| | | | 209,693,570 | | |
| | | | | Beverages: 0.8% | |
| | 8,214,000 | | | #,C | | Anheuser-Busch InBev
Worldwide, Inc., 5.375%,
due 11/15/14 | | | 8,296,822 | | |
| | 7,979,000 | | | #,C | | Anheuser-Busch InBev
Worldwide, Inc., 7.750%,
due 01/15/19 | | | 8,741,170 | | |
| | 3,790,000 | | | C | | Dr Pepper Snapple
Group, Inc., 6.820%,
due 05/01/18 | | | 4,014,645 | | |
| | 1,606,000 | | | C | | Dr Pepper Snapple
Group, Inc., 7.450%,
due 05/01/38 | | | 1,708,309 | | |
| | | | 22,760,946 | | |
See Accompanying Notes to Financial Statements
73
PORTFOLIO OF INVESTMENTS
ING INTERMEDIATE BOND PORTFOLIO AS OF JUNE 30, 2009 (UNAUDITED) (CONTINUED)
Principal
Amount | | | | | | Value | |
| | | | | Chemicals: 0.5% | |
| $ | 3,616,000 | | | #,C | | Chevron Phillips
Chemical Co. LLC,
7.000%, due 06/15/14 | | $ | 3,700,922 | | |
| | 3,316,000 | | | #,C | | Chevron Phillips
Chemical Co. LLC,
8.250%, due 06/15/19 | | | 3,465,174 | | |
| | 5,995,000 | | | C | | Dow Chemical Co.,
7.600%, due 05/15/14 | | | 6,181,079 | | |
| | | | 13,347,175 | | |
| | | | | Computers: 0.2% | |
| | 6,750,000 | | | C | | Hewlett-Packard Co.,
4.750%, due 06/02/14 | | | 7,054,290 | | |
| | | | 7,054,290 | | |
| | | | | Diversified Financial Services: 4.1% | |
| | 13,709,000 | | | @@,#,C | | Aiful Corp., 4.450%,
due 02/16/10 | | | 10,008,845 | | |
| | 4,859,000 | | | | | American Express
Credit Corp., 7.300%,
due 08/20/13 | | | 5,056,416 | | |
| | 3,840,000 | | | | | Capital One Bank USA NA,
6.500%, due 06/13/13 | | | 3,798,985 | | |
| | | | | | 9,127,000 | | | Capital One Bank USA NA,
8.800%, due 07/15/19 | | | 9,339,814 | | |
| | 3,403,000 | | | #,C | | Corestates Capital Trust I,
8.000%, due 12/15/26 | | | 2,232,875 | | |
| | 7,753,000 | | | | | FIA Card Services NA,
6.625%, due 06/15/12 | | | 8,059,306 | | |
| | 6,198,000 | | | C | | Fund American Cos., Inc.,
5.875%, due 05/15/13 | | | 5,843,363 | | |
| | 16,876,000 | | | | | General Electric
Capital Corp., 2.200%,
due 06/08/12 | | | 16,974,421 | | |
| | 7,666,000 | | | | | General Electric
Capital Corp., 5.875%,
due 01/14/38 | | | 6,085,087 | | |
| | 15,708,000 | | | | | General Electric
Capital Corp., 6.875%,
due 01/10/39 | | | 14,180,673 | | |
| | 11,976,000 | | | | | International Lease
Finance Corp., 6.625%,
due 11/15/13 | | | 9,226,167 | | |
| | 6,907,000 | | | @@,# | | Mantis Reef Ltd.,
4.799%, due 11/03/09 | | | 6,843,324 | | |
| | 3,245,000 | | | | | Merrill Lynch & Co., Inc.,
4.250%, due 02/08/10 | | | 3,258,327 | | |
| | 6,334,000 | | | | | Merrill Lynch & Co., Inc.,
6.050%, due 08/15/12 | | | 6,355,181 | | |
| | 4,574,000 | | | C | | National Rural Utilities
Cooperative Finance Corp.,
10.375%, due 11/01/18 | | | 5,744,089 | | |
| | 630,249 | | | # | | Power Receivable
Finance, LLC, 6.290%,
due 01/01/12 | | | 621,667 | | |
| | 30,862,493 | | | #,S,Z | | Toll Road Investors
Partnership II LP,
5.000%, due 02/15/45 | | | 2,816,881 | | |
| | 4,098,000 | | | #,±,C | | Twin Reefs Pass-through
Trust, 1.386%,
due 12/10/49 | | | 13,319 | | |
| | | | 116,458,740 | | |
Principal
Amount | | | | | | Value | |
| | | | | Electric: 3.1% | |
| $ | 3,541,000 | | | C | | Ameren Corp.,
8.875%, due 05/15/14 | | $ | 3,658,381 | | |
| | 1,760,000 | | | C | | Commonwealth
Edison Co., 6.150%,
due 03/15/12 | | | 1,869,534 | | |
| | 13,524,000 | | | C | | Commonwealth
Edison Co., 6.950%,
due 07/15/18 | | | 13,707,872 | | |
| | 4,306,000 | | | C | | DTE Energy Co.,
7.050%, due 06/01/11 | | | 4,508,171 | | |
| | 658,000 | | | C | | DTE Energy Co.,
7.625%, due 05/15/14 | | | 687,422 | | |
| | 2,708,000 | | | C | | Duke Energy Corp.,
6.300%, due 02/01/14 | | | 2,926,574 | | |
| | 3,534,000 | | | C | | Entergy Texas, Inc.,
7.125%, due 02/01/19 | | | 3,690,599 | | |
| | 3,197,000 | | | C | | Indiana Michigan Power,
7.000%, due 03/15/19 | | | 3,442,146 | | |
| | 2,236,000 | | | C | | Jersey Central
Power and Light,
7.350%, due 02/01/19 | | | 2,462,460 | | |
| | 945,336 | | | #,C | | Juniper Generation, LLC,
6.790%, due 12/31/14 | | | 858,558 | | |
| | 6,504,000 | | | C | | Metropolitan Edison,
7.700%, due 01/15/19 | | | 7,126,166 | | |
| | 2,398,000 | | | C | | Nevada Power Co.,
7.125%, due 03/15/19 | | | 2,567,227 | | |
| | 9,278,000 | | | C | | NorthWestern Corp.,
5.875%, due 11/01/14 | | | 9,447,286 | | |
| | 4,673,000 | | | C | | Oncor Electric
Delivery Co., 6.800%,
due 09/01/18 | | | 5,002,161 | | |
| | 6,356,000 | | | C | | Oncor Electric
Delivery Co.,
7.500%, due 09/01/38 | | | 7,192,481 | | |
| | 3,317,000 | | | C | | Progress Energy, Inc.,
6.050%, due 03/15/14 | | | 3,491,481 | | |
| | 2,607,000 | | | C | | Progress Energy, Inc.,
7.050%, due 03/15/19 | | | 2,897,628 | | |
| | 5,053,000 | | | C | | Sierra Pacific Power Co.,
6.250%, due 04/15/12 | | | 5,247,844 | | |
| | 6,562,000 | | | C | | Southwestern Electric
Power, 5.550%,
due 01/15/17 | | | 6,386,696 | | |
| | | | 87,170,687 | | |
| | | | | Energy-Alternate Sources: 0.0% | |
| | 4,000,000 | | | I,±,X | | Greater Ohio
Ethanol, LLC, 6.301%,
due 12/31/13 | | | — | | |
| | 4,900,000 | | | I,±,X | | Greater Ohio
Ethanol, LLC,
12.630%, due 12/31/13 | | | — | | |
| | 617,699 | | | I,X | | PEA Lima, LLC, 0.000%,
due 03/20/14 | | | 62 | | |
| | | | 62 | | |
| | | | | Entertainment: 0.1% | |
| | 2,542,000 | | | | | International Game
Technology, 7.500%,
due 06/15/19 | | | 2,569,281 | | |
| | | | 2,569,281 | | |
See Accompanying Notes to Financial Statements
74
PORTFOLIO OF INVESTMENTS
ING INTERMEDIATE BOND PORTFOLIO AS OF JUNE 30, 2009 (UNAUDITED) (CONTINUED)
Principal
Amount | | | | | | Value | |
| | | | | Food: 0.6% | |
| $ | 7,616,000 | | | | | Kraft Foods, Inc., 6.125%,
due 02/01/18 | | $ | 7,887,449 | | |
| | 3,278,000 | | | | | Kraft Foods, Inc., 6.125%,
due 08/23/18 | | | 3,400,633 | | |
| | 1,994,000 | | | | | Kraft Foods, Inc., 6.500%,
due 08/11/17 | | | 2,103,445 | | |
| | 2,893,000 | | | C | | Safeway, Inc., 6.250%,
due 03/15/14 | | | 3,107,768 | | |
| | | | 16,499,295 | | |
| | | | | Forest Products & Paper: 0.1% | |
| | 1,563,000 | | | C | | International Paper Co.,
7.400%, due 06/15/14 | | | 1,557,486 | | |
| | | | 1,557,486 | | |
| | | | | Gas: 0.3% | |
| | 8,238,000 | | | C | | Sempra Energy, 6.500%,
due 06/01/16 | | | 8,611,107 | | |
| | | | 8,611,107 | | |
| | | | | Healthcare-Services: 0.1% | |
| | 3,225,000 | | | C | | HCA, Inc., 9.250%,
due 11/15/16 | | | 3,184,688 | | |
| | | | 3,184,688 | | |
| | | | | Insurance: 1.9% | |
| | 10,157,000 | | | @@,C | | Aegon NV, 3.610%,
due 12/31/49 | | | 3,986,623 | | |
| | 8,012,000 | | | | | American International
Group, Inc., 5.850%,
due 01/16/18 | | | 4,244,685 | | |
| | 4,824,000 | | | C | | Hartford Financial Services
Group, Inc., 5.250%,
due 10/15/11 | | | 4,664,789 | | |
| | 4,366,000 | | | C | | Hartford Financial Services
Group, Inc., 6.000%,
due 01/15/19 | | | 3,350,761 | | |
| | 9,940,000 | | | C | | Metlife, Inc., 7.717%,
due 02/15/19 | | | 10,650,362 | | |
| | 6,004,000 | | | #,C | | Pacific Life Insurance Co.,
9.250%, due 06/15/39 | | | 5,841,424 | | |
| | 3,323,000 | | | C | | Principal Financial
Group, Inc., 7.875%,
due 05/15/14 | | | 3,504,273 | | |
| | 2,288,000 | | | | | Prudential Financial, Inc.,
5.700%, due 12/14/36 | | | 1,721,635 | | |
| | 4,220,000 | | | | | Prudential Financial, Inc.,
6.000%, due 12/01/17 | | | 3,976,388 | | |
| | 7,923,000 | | | | | Prudential Financial, Inc.,
6.625%, due 12/01/37 | | | 6,884,604 | | |
| | 3,798,000 | | | | | Prudential Financial, Inc.,
7.375%, due 06/15/19 | | | 3,735,455 | | |
| | 2,275,000 | | | @@,C | | XL Capital, Ltd., 6.500%,
due 12/31/49 | | | 1,116,126 | | |
| | | | 53,677,125 | | |
| | | | | Iron/Steel: 0.2% | |
| | 4,977,000 | | | @@ | | ArcelorMittal, 9.850%,
due 06/01/19 | | | 5,379,848 | | |
| | | | 5,379,848 | | |
Principal
Amount | | | | | | Value | |
| | | | | Media: 3.5% | |
| $ | 2,270,000 | | | C | | Comcast Corp., 5.300%,
due 01/15/14 | | $ | 2,349,865 | | |
| | 3,261,000 | | | C | | Comcast Corp., 5.700%,
due 05/15/18 | | | 3,284,176 | | |
| | 2,093,000 | | | C | | Comcast Corp., 5.900%,
due 03/15/16 | | | 2,168,030 | | |
| | 3,514,000 | | | C | | Comcast Corp., 6.300%,
due 11/15/17 | | | 3,725,163 | | |
| | 3,373,000 | | | C | | Comcast Corp., 6.500%,
due 01/15/17 | | | 3,583,624 | | |
| | 3,935,000 | | | #,C | | COX Communications, Inc.,
6.250%, due 06/01/18 | | | 3,896,417 | | |
| | 3,855,000 | | | #,C | | COX Communications, Inc.,
6.950%, due 06/01/38 | | | 3,722,242 | | |
| | 5,521,000 | | | #,C | | Cox Communications, Inc.,
8.375%, due 03/01/39 | | | 6,173,897 | | |
| | 3,376,000 | | | #,C | | Cox Enterprises, Inc.,
7.375%, due 07/15/27 | | | 3,290,709 | | |
| | 3,225,000 | | | C | | Echostar DBS Corp.,
7.125%, due 02/01/16 | | | 3,023,438 | | |
| | 5,290,000 | | | C | | News America, Inc.,
6.150%, due 03/01/37 | | | 4,500,166 | | |
| | 4,379,000 | | | C | | News America, Inc.,
6.650%, due 11/15/37 | | | 3,950,747 | | |
| | 9,094,000 | | | #,C | | News America, Inc.,
6.900%, due 03/01/19 | | | 9,492,826 | | |
| | 1,133,000 | | | C | | Time Warner Cable, Inc.,
6.200%, due 07/01/13 | | | 1,194,830 | | |
| | 6,568,000 | | | C | | Time Warner Cable, Inc.,
6.750%, due 07/01/18 | | | 6,852,532 | | |
| | 2,247,000 | | | C | | Time Warner Cable, Inc.,
6.750%, due 06/15/39 | | | 2,193,881 | | |
| | 11,237,000 | | | C | | Time Warner Cable, Inc.,
8.750%, due 02/14/19 | | | 13,112,444 | | |
| | 1,865,000 | | | | | Time Warner
Entertainment Co. LP,
8.375%, due 07/15/33 | | | 2,093,276 | | |
| | 7,923,000 | | | C | | Time Warner, Inc., 5.500%,
due 11/15/11 | | | 8,186,424 | | |
| | 7,139,000 | | | C | | Time Warner, Inc., 7.700%,
due 05/01/32 | | | 7,033,835 | | |
| | 5,710,000 | | | C | | Viacom, Inc., 6.875%,
due 04/30/36 | | | 5,275,983 | | |
| | | | 99,104,505 | | |
| | | | | Miscellaneous Manufacturing: 0.7% | |
| | 9,100,000 | | | | | General Electric Co.,
5.250%, due 12/06/17 | | | 8,951,615 | | |
| | 8,763,000 | | | @@,C | | Tyco International Finance,
8.500%, due 01/15/19 | | | 9,732,389 | | |
| | | | 18,684,004 | | |
| | | | | Oil & Gas: 0.5% | |
| | 3,218,000 | | | C | | Chesapeake Energy Corp.,
7.250%, due 12/15/18 | | | 2,815,750 | | |
| | 3,266,000 | | | C | | Hess Corp., 8.125%,
due 02/15/19 | | | 3,724,553 | | |
| | 5,618,000 | | | C | | Marathon Oil Corp.,
6.500%, due 02/15/14 | | | 6,011,906 | | |
| | 2,793,000 | | | C | | Marathon Oil Corp.,
7.500%, due 02/15/19 | | | 3,053,710 | | |
| | | | 15,605,919 | | |
See Accompanying Notes to Financial Statements
75
PORTFOLIO OF INVESTMENTS
ING INTERMEDIATE BOND PORTFOLIO AS OF JUNE 30, 2009 (UNAUDITED) (CONTINUED)
Principal
Amount | | | | | | Value | |
| | | | | Oil & Gas Services: 0.1% | |
| $ | 3,301,000 | | | @@,C | | Weatherford
International, Ltd.,
9.625%, due 03/01/19 | | $ | 3,889,671 | | |
| | | | 3,889,671 | | |
| | | | | Pharmaceuticals: 0.3% | |
| | 3,066,000 | | | C | | Express Scripts, Inc.,
6.250%, due 06/15/14 | | | 3,247,602 | | |
| | 763,000 | | | C | | Express Scripts, Inc.,
7.250%, due 06/15/19 | | | 842,907 | | |
| | 3,046,000 | | | @@,C | | Novartis Securities
Investment Ltd., 5.125%,
due 02/10/19 | | | 3,122,205 | | |
| | | | 7,212,714 | | |
| | | | | Pipelines: 0.9% | |
| | 5,758,000 | | | C | | Enbridge Energy Partners,
9.875%, due 03/01/19 | | | 6,686,172 | | |
| | 4,845,000 | | | C | | Energy Transfer Partners,
9.700%, due 03/15/19 | | | 5,571,309 | | |
| | 1,176,000 | | | C | | Kinder Morgan Energy
Partners L.P., 6.850%,
due 02/15/20 | | | 1,207,678 | | |
| | 1,893,000 | | | C | | Northwest Pipeline Corp.,
7.000%, due 06/15/16 | | | 1,999,536 | | |
| | 2,106,000 | | | @@,C | | Trans-Canada Pipelines,
7.125%, due 01/15/19 | | | 2,381,094 | | |
| | 2,337,000 | | | @@,C | | Trans-Canada Pipelines,
7.625%, due 01/15/39 | | | 2,736,290 | | |
| | 2,894,000 | | | C | | Transcontinental Gas Pipe
Line Corp., 6.400%,
due 04/15/16 | | | 2,974,172 | | |
| | 1,848,000 | | | # | | Williams Companies, Inc.,
8.750%, due 01/15/20 | | | 1,929,863 | | |
| | | | 25,486,114 | | |
| | | | | Real Estate: 0.1% | |
| | 4,114,000 | | | C | | Simon Property Group, Inc.,
6.750%, due 05/15/14 | | | 4,137,993 | | |
| | | | 4,137,993 | | |
| | | | | Retail: 0.3% | |
| | 2,890,000 | | | C | | CVS Caremark Corp.,
6.600%, due 03/15/19 | | | 3,093,540 | | |
| | 5,450,706 | | | #,C | | CVS Lease Pass-through,
6.036%, due 12/10/28 | | | 4,669,702 | | |
| | | | 7,763,242 | | |
| | | | | Software: 0.3% | |
| | 5,481,000 | | | | | Oracle Corp., 5.000%,
due 07/08/19 | | | 5,460,556 | | |
| | 3,635,000 | | | | | Oracle Corp., 6.125%,
due 07/08/39 | | | 3,610,791 | | |
| | | | 9,071,347 | | |
| | | | | Telecommunications: 3.0% | |
| | 6,783,000 | | | C | | AT&T, Inc., 6.550%,
due 02/15/39 | | | 6,792,991 | | |
| | 7,623,000 | | | C | | AT&T, Inc., 6.700%,
due 11/15/13 | | | 8,379,712 | | |
Principal
Amount | | | | | | Value | |
| $ | 6,675,000 | | | | | Bellsouth
Telecommunications, Inc.,
7.000%, due 12/01/95 | | $ | 5,849,636 | | |
| | 1,938,000 | | | @@,C | | British
Telecommunications PLC,
5.150%, due 01/15/13 | | | 1,932,853 | | |
| | 5,566,000 | | | @@,C | | British
Telecommunications PLC,
5.950%, due 01/15/18 | | | 5,024,423 | | |
| | 2,292,000 | | | @@,C | | Deutsche Telekom
International Finance,
5.250%, due 07/22/13 | | | 2,356,318 | | |
| | 1,839,000 | | | @@,C | | Deutsche Telekom
International Finance BV,
5.875%, due 08/20/13 | | | 1,930,739 | | |
| | 3,942,000 | | | C | | Embarq Corp., 6.738%,
due 06/01/13 | | | 3,982,591 | | |
| | 4,125,000 | | | C | | Embarq Corp., 7.995%,
due 06/01/36 | | | 3,636,600 | | |
| | 3,225,000 | | | C | | Sprint Nextel Corp.,
6.000%, due 12/01/16 | | | 2,652,563 | | |
| | 4,501,000 | | | @@,C | | Telecom Italia Capital SA,
7.175%, due 06/18/19 | | | 4,570,693 | | |
| | 3,282,000 | | | @@,C | | Telefonica Emisones SAU,
5.855%, due 02/04/13 | | | 3,462,471 | | |
| | 2,007,000 | | | @@,C | | Telefonica Emisones SAU,
5.877%, due 07/15/19 | | | 2,073,113 | | |
| | 2,441,000 | | | @@,C | | Telefonica Emisones SAU,
6.421%, due 06/20/16 | | | 2,613,613 | | |
| | 6,631,000 | | | C | | Verizon
Communications, Inc.,
7.350%, due 04/01/39 | | | 7,248,426 | | |
| | 6,060,000 | | | C | | Verizon
Communications, Inc.,
8.950%, due 03/01/39 | | | 7,675,844 | | |
| | 708,000 | | | #,C | | Verizon Wireless, 8.500%,
due 11/15/18 | | | 847,545 | | |
| | 12,280,000 | | | #,C | | Verizon Wireless
Capital LLC, 5.550%,
due 02/01/14 | | | 13,049,944 | | |
| | | | 84,080,075 | | |
| | | | | Transportation: 0.8% | |
| | 5,315,000 | | | C | | CSX Corp., 6.250%,
due 04/01/15 | | | 5,501,493 | | |
| | 7,491,000 | | | C | | CSX Corp., 7.450%,
due 04/01/38 | | | 8,136,245 | | |
| | 5,856,000 | | | C | | Union Pacific Corp.,
5.125%, due 02/15/14 | | | 6,059,215 | | |
| | 4,222,000 | | | C | | Union Pacific Corp.,
5.700%, due 08/15/18 | | | 4,238,077 | | |
| | | | 23,935,030 | | |
Total Corporate
Bonds/Notes
(Cost $858,812,878) | | | 861,073,647 | | |
See Accompanying Notes to Financial Statements
76
PORTFOLIO OF INVESTMENTS
ING INTERMEDIATE BOND PORTFOLIO AS OF JUNE 30, 2009 (UNAUDITED) (CONTINUED)
Principal
Amount | | | | | | Value | |
| U.S. GOVERNMENT AGENCY OBLIGATIONS: 38.5% | | | |
| | | | | | | Federal Home Loan Mortgage
Corporation##: 10.6% | | | | | |
| $ | 14,960,021 | | | S | | 0.669%, due 05/15/33 | | $ | 14,265,974 | | |
| | 3,697,737 | | | S | | 1.206%, due 04/15/32 | | | 3,642,836 | | |
| | 1,040,354 | | | S | | 4.969%, due 04/01/35 | | | 1,080,006 | | |
| | 82,511,000 | | | W | | 5.000%, due 08/15/33 | | | 83,581,085 | | |
| | 1,631,319 | | | S | | 5.000%, due 05/01/28 | | | 1,674,980 | | |
| | 7,331,914 | | | S,^ | | 5.000%, due 05/15/17 | | | 468,259 | | |
| | 63,302,723 | | | S | | 5.000%, due 08/15/16-
02/15/35 | | | 65,959,297 | | |
| | 61,700 | | | S | | 5.078%, due 11/01/35 | | | 63,621 | | |
| | 88,440,343 | | | S | | 5.500%, due 08/15/20-
02/15/34 | | | 91,834,717 | | |
| | 79,798 | | | S | | 5.699%, due 03/01/36 | | | 82,580 | | |
| | 167,832 | | | S | | 5.855%, due 12/01/37 | | | 175,925 | | |
| | 12,514,067 | | | S | | 6.000%, due 02/01/29-
02/01/36 | | | 13,154,044 | | |
| | 12,401,516 | | | S | | 6.000%, due 01/15/29 | | | 13,225,770 | | |
| | 7,600,000 | | | W | | 6.500%, due 08/15/34 | | | 8,050,064 | | |
| | 1,178,242 | | | S | | 7.000%, due 09/01/26-
11/01/31 | | | 1,279,187 | | |
| | 418,352 | | | S | | 7.500%, due 11/01/28 | | | 456,679 | | |
| | | | 298,995,024 | | |
| | | | | | | Federal National Mortgage
Association##: 22.0% | | | | | |
| | 503,420 | | | S | | 0.454, due 04/25/35 | | | 461,195 | | |
| | 337,153 | | | S | | 0.664%, due 08/25/33 | | | 331,390 | | |
| | 2,061,153 | | | S | | 0.772%, due 07/25/36 | | | 1,987,783 | | |
| | 9,941,000 | | | W | | 4.000%, due 02/25/39 | | | 9,639,663 | | |
| | 52,608,000 | | | W | | 4.500%, due 07/25/18-
07/15/35 | | | 52,607,670 | | |
| | 1,169,759 | | | S | | 4.982%, due 04/01/35 | | | 1,208,422 | | |
| | 28,194,531 | | | S | | 5.000%, due 02/25/29-
07/01/36 | | | 29,021,612 | | |
| | 34,159,043 | | | | | 5.000%, due 07/01/37 | | | 34,938,293 | | |
| | 1,370,367 | | | S | | 5.027%, due 07/01/35 | | | 1,429,725 | | |
| | 861,660 | | | S | | 5.224%, due 08/01/35 | | | 897,583 | | |
| | 192,829,000 | | | W | | 5.500%, due 07/15/34 | | | 199,065,861 | | |
| | 26,132,993 | | | S | | 5.500%, due 11/01/16-
01/01/39 | | | 27,117,582 | | |
| | 108,370,000 | | | W | | 6.000%, due 07/01/37 | | | 113,263,556 | | |
| | 6,837,286 | | | S,^ | | 6.000%, due 08/25/33 | | | 1,119,606 | | |
| | 41,362,028 | | | S | | 6.000%, due 06/01/16-
08/01/38 | | | 43,599,698 | | |
| | 4,100,000 | | | W | | 6.000%, due 04/15/38 | | | 4,278,735 | | |
| | 14,642,953 | | | S,^ | | 6.276%, due 06/25/36 | | | 1,427,729 | | |
| | 57,218,000 | | | W | | 6.500%, due 08/01/39 | | | 60,695,824 | | |
| | 6,403,615 | | | S | | 6.500%, due 01/01/23-
09/01/37 | | | 6,836,162 | | |
| | 11,546,628 | | | S | | 7.000%, due 08/01/25-
04/01/38 | | | 12,577,351 | | |
| | 241,975 | | | S | | 7.500%, due 11/01/29-
09/01/31 | | | 264,229 | | |
| | 1,221,680 | | | S | | 7.500%, due 01/25/48 | | | 1,318,172 | | |
| | 155,291 | | | S | | 10.000%, due 02/25/19 | | | 177,405 | | |
| | 6,174,926 | | | S | | 14.716%, due 03/25/38 | | | 6,709,485 | | |
| | 587,099 | | | S | | 27.345%, due 02/25/34 | | | 722,507 | | |
| | 8,796,137 | | | S | | 27.945%, due 03/25/35 | | | 10,944,844 | | |
| | | | 622,642,082 | | |
Principal
Amount | | | | | | Value | |
| | | | | | | Government National Mortgage
Association: 5.9% | | | | | |
| $ | 46,045 | | | S | | 4.125%, due 12/20/29 | | $ | 46,753 | | |
| | 45,400,000 | | | W | | 4.500%, due 07/01/39 | | | 45,329,085 | | |
| | 7,594,067 | | | S | | 4.500%, due 04/15/39 | | | 7,598,517 | | |
| | 26,000,000 | | | W | | 5.000%, due 08/01/33 | | | 26,402,194 | | |
| | 67,923 | | | S | | 5.375%, due 04/20/28 | | | 70,070 | | |
| | 17,772,000 | | | W | | 5.500%, due 07/15/33 | | | 18,352,362 | | |
| | 9,445,571 | | | S | | 5.500%, due 09/15/38 | | | 9,772,476 | | |
| | 6,008,965 | | | | | 5.500%, due 03/20/39 | | | 6,200,985 | | |
| | 65,828,245 | | | S,^ | | 5.885%, due 04/20/39 | | | 4,987,477 | | |
| | 907,000 | | | S | | 6.000%, due 10/15/38 | | | 946,079 | | |
| | 42,203,000 | | | W | | 6.000%, due 07/15/33 | | | 43,963,667 | | |
| | 10,389,956 | | | S,^ | | 6.182%, due 05/16/38 | | | 1,064,211 | | |
| | 1,909,344 | | | S | | 6.500%, due 01/15/29-
01/15/32 | | | 2,060,245 | | |
| | 601,902 | | | S | | 7.000%, due 04/15/26-
05/15/32 | | | 655,709 | | |
| | 1,034,037 | | | S | | 7.500%, due 04/15/22-
06/15/32 | | | 1,132,375 | | |
| | | | 168,582,205 | | |
Total U.S. Government
Agency Obligations
(Cost $1,077,919,514) | | | 1,090,219,311 | | |
| U.S. TREASURY OBLIGATIONS: 26.0% | | | |
| | | | | U.S. Treasury Bonds: 2.7% | |
| | 87,993,000 | | | S | | 3.500%, due 02/15/39 | | | 76,114,209 | | |
| | | | 76,114,209 | | |
| | | | | U.S. Treasury Notes: 23.3% | |
| | 9,210,000 | | | L | | 0.875%, due 05/31/11 | | | 9,179,819 | | |
| | 2,600,000 | | | | | 1.125%, due 06/30/11 | | | 2,600,813 | | |
| | 175,155,000 | | | L | | 1.875%, due 06/15/12 | | | 176,483,200 | | |
| | 258,800,000 | | | L | | 2.250%, due 05/31/14 | | | 255,402,732 | | |
| | 186,985,000 | | | | | 2.625%, due 06/30/14-
04/30/16 | | | 187,685,680 | | |
| | 29,324,000 | | | L | | 3.125%, due 05/15/19 | | | 28,371,058 | | |
| | | | 659,723,302 | | |
Total U.S. Treasury
Obligations
(Cost $730,523,491) | | | 735,837,511 | | |
| ASSET-BACKED SECURITIES: 1.7% | | | |
| | | | | | | Automobile Asset-Backed
Securities: 0.4% | | | | | |
| | 4,887,000 | | | S | | Honda Auto Receivables
Owner Trust, 4.880%,
due 09/18/14 | | | 5,110,731 | | |
| | 3,246,000 | | | S | | Nissan Auto Receivables
Owner Trust, 2.940%,
due 07/15/11 | | | 3,268,868 | | |
| | 2,017,500 | | | S | | Nissan Auto Receivables
Owner Trust, 4.280%,
due 06/16/14 | | | 2,061,462 | | |
| | 1,473,000 | | | S | | Nissan Auto Receivables
Owner Trust, 4.460%,
due 04/16/12 | | | 1,514,707 | | |
| | | | 11,955,768 | | |
See Accompanying Notes to Financial Statements
77
PORTFOLIO OF INVESTMENTS
ING INTERMEDIATE BOND PORTFOLIO AS OF JUNE 30, 2009 (UNAUDITED) (CONTINUED)
Principal
Amount | | | | | | Value | |
| | | | | | | Home Equity Asset-Backed
Securities: 0.6% | | | | | |
| $ | 1,253,000 | | | S | | GMAC Mortgage Corp.
Loan Trust, 6.249%,
due 12/25/37 | | $ | 337,900 | | |
| | 6,784,991 | | | S | | GSAA Trust, 5.242%,
due 06/25/34 | | | 6,259,645 | | |
| | 3,328,000 | | | #,S | | Irwin Home Equity,
5.960%, due 08/25/37 | | | 743,199 | | |
| | 350,262 | | | S | | Merrill Lynch Mortgage
Investors Trust, 0.674%,
due 07/25/34 | | | 187,296 | | |
| | 2,468,056 | | | S | | Morgan Stanley
Capital, Inc., 1.514%,
due 06/25/33 | | | 1,402,361 | | |
| | 197,897 | | | S | | Renaissance Home Equity
Loan Trust, 4.456%,
due 05/25/35 | | | 192,083 | | |
| | 3,074,761 | | | S | | Residential
Funding Mortgage
Securities II, Inc., 5.890%,
due 05/25/37 | | | 2,592,355 | | |
| | 4,000,000 | | | S | | Specialty Underwriting &
Residential Finance,
0.514%, due 12/25/36 | | | 2,879,768 | | |
| | 812,362 | | | S | | Wells Fargo Home
Equity Trust, 3.970%,
due 05/25/34 | | | 782,308 | | |
| | 500,000 | | | S | | Wells Fargo Home
Equity Trust, 4.430%,
due 05/25/34 | | | 457,430 | | |
| | | | 15,834,345 | | |
| | | | | Other Asset-Backed Securities: 0.7% | |
| | 261,482 | | | S | | Amortizing Residential
Collateral Trust, 0.564%,
due 05/25/32 | | | 140,587 | | |
| | 2,854,217 | | | S | | Bear Stearns Asset-Backed
Securities, Inc., 0.694%,
due 06/25/36 | | | 1,407,516 | | |
| | 1,087,413 | | | S | | Bear Stearns Asset-Backed
Securities, Inc., 0.714%,
due 07/25/36 | | | 238,245 | | |
| | 579,693 | | | S | | CenterPoint Energy
Transition Bond Co., LLC,
4.192%, due 02/01/20 | | | 588,271 | | |
| | 401,922 | | | S | | Chase Funding Mortgage
Loan Asset-Backed
Certificates, 0.914%,
due 07/25/33 | | | 314,331 | | |
| | 16,193 | | | S | | Chase Funding Mortgage
Loan Asset-Backed
Certificates, 4.045%,
due 05/25/33 | | | 15,163 | | |
| | 85,000 | | | S | | Countrywide Asset-Backed
Certificates, 5.689%,
due 10/25/46 | | | 37,032 | | |
| | 4,956,389 | | | S | | Credit-Based Asset
Servicing and
Securitization, LLC,
4.831%, due 08/25/35 | | | 4,144,663 | | |
| | 2,389,131 | | | S | | Credit-Based Asset
Servicing and
Securitization, LLC,
5.501%, due 12/25/36 | | | 1,638,601 | | |
Principal
Amount | | | | | | Value | |
| $ | 3,360,000 | | | #,S | | Credit-Based Asset
Servicing and
Securitization, LLC,
5.746%, due 12/25/37 | | $ | 2,439,502 | | |
| | 2,876,000 | | | #,S | | Credit-Based Asset
Servicing and
Securitization, LLC,
6.020%, due 12/25/37 | | | 1,702,634 | | |
| | 2,527,211 | | | S | | Equity One, Inc., 5.050%,
due 09/25/33 | | | 1,780,005 | | |
| | 2,159,777 | | | S | | First Horizon Asset
Back Trust, 0.444%,
due 09/25/29 | | | 1,084,031 | | |
| | 6,265,000 | | | S | | Hudson Mezzanine
Funding, 1.314%,
due 06/12/42 | | | — | | |
| | 2,015,962 | | | S | | Lehman XS Trust, 0.594%,
due 08/25/35 | | | 921,297 | | |
| | 804,129 | | | S | | Merrill Lynch Mortgage
Investors Trust, 0.494%,
due 09/25/36 | | | 168,108 | | |
| | 899,485 | | | S | | Merrill Lynch Mortgage
Investors Trust, 5.609%,
due 03/25/37 | | | 417,695 | | |
| | 23,498 | | | S | | Popular Mortgage
Pass-through Trust,
4.000%, due 12/25/34 | | | 22,783 | | |
| | 45,890 | | | S | | Residential Asset
Mortgage Products, Inc.,
0.934%, due 06/25/33 | | | 27,795 | | |
| | 2,233,348 | | | S | | Structured Asset
Securities Corp., 4.910%,
due 06/25/33 | | | 1,884,964 | | |
| | | | 18,973,223 | | |
Total Asset-Backed Securities
(Cost $68,317,131) | | | 46,763,336 | | |
| COLLATERALIZED MORTGAGE OBLIGATIONS: 11.6% | | | |
| | 735,193 | | | C,S | | American Home Mortgage
Assets, 2.130%,
due 02/25/47 | | | 117,040 | | |
| | 8,557,544 | | | C,S | | American Home Mortgage
Assets, 2.260%,
due 11/25/46 | | | 2,860,253 | | |
| | 4,235,287 | | | C,S | | American Home Mortgage
Assets, 2.340%,
due 09/25/46 | | | 768,414 | | |
| | 4,356,617 | | | C,S | | American Home Mortgage
Investment Trust,
0.604%, due 11/25/45 | | | 1,926,045 | | |
| | 14,849,531 | | | C,S | | American Home Mortgage
Investment Trust,
0.694%, due 11/25/45 | | | 3,486,530 | | |
| | 8,094,715 | | | C,S | | Banc of America
Alternative Loan Trust,
6.243%, due 11/25/21 | | | 5,915,722 | | |
| | 1,855,323 | | | C,S | | Banc of America
Commercial
Mortgage, Inc.,
4.772%, due 07/11/43 | | | 1,890,016 | | |
See Accompanying Notes to Financial Statements
78
PORTFOLIO OF INVESTMENTS
ING INTERMEDIATE BOND PORTFOLIO AS OF JUNE 30, 2009 (UNAUDITED) (CONTINUED)
Principal
Amount | | | | | | Value | |
| COLLATERALIZED MORTGAGE OBLIGATIONS (continued) | | | |
| $ | 10,112,233 | | | C,S | | Banc of America
Funding Corp., 5.258%,
due 09/20/35 | | $ | 5,522,964 | | |
| | 4,744,910 | | | C,S | | Banc of America
Funding Corp., 5.750%,
due 09/20/34 | | | 4,209,178 | | |
| | 5,106,187 | | | C,S | | Banc of America Mortgage
Securities, Inc., 5.145%,
due 09/25/35 | | | 4,081,151 | | |
| | 1,953,296 | | | C,S | | Banc of America Mortgage
Securities, Inc., 5.500%,
due 11/25/33 | | | 1,754,493 | | |
| | 2,834,877 | | | C,S | | Banc of America Mortgage
Securities, Inc., 5.500%,
due 06/25/35 | | | 2,604,150 | | |
| | 1,110,016 | | | C,S | | Bear Stearns
Alternative-A Trust,
0.634%, due 07/25/34 | | | 557,296 | | |
| | 300,341 | | | C,S | | Bear Stearns Commercial
Mortgage Securities,
5.415%, due 04/12/38 | | | 303,117 | | |
| | 2,142,271 | | | C,S | | Bear Stearns Commercial
Mortgage Securities,
7.780%, due 02/15/32 | | | 2,159,135 | | |
| | 1,253,333 | | | C,S | | Chase Manhattan Bank-First
Union National Bank,
7.439%, due 08/15/31 | | | 1,251,043 | | |
| | 9,642,525 | | | C,S | | Chase Mortgage
Finance Corp., 5.407%,
due 12/25/35 | | | 7,521,129 | | |
| | 5,075,080 | | | C,S | | Chase Mortgage
Finance Corp., 5.500%,
due 11/25/35 | | | 4,687,959 | | |
| | 1,564,221 | | | C,S | | Citicorp Mortgage
Securities, Inc., 5.500%,
due 02/25/22 | | | 1,247,230 | | |
| | 5,915,000 | | | C,S | | Citigroup Commercial
Mortgage Trust, 5.888%,
due 12/10/49 | | | 4,693,028 | | |
| | 4,523,000 | | | #,C,S | | Citigroup Mortgage Loan
Trust, Inc., 5.466%,
due 11/19/35 | | | 4,127,238 | | |
| | 1,736,375 | | | C,S | | Commercial Mortgage
Pass-through Certificates,
6.010%, due 12/10/49 | | | 1,384,785 | | |
| | 2,217,480 | | | C,S | | Countrywide Alternative
Loan Trust, 0.554%,
due 11/25/46 | | | 592,759 | | |
| | 7,158,975 | | | C,S | | Countrywide Alternative
Loan Trust, 1.398%,
due 11/25/46 | | | 1,251,828 | | |
| | 3,366,448 | | | C,S | | Countrywide Home
Loan Mortgage
Pass-through Trust,
0.634%, due 04/25/35 | | | 497,723 | | |
| | 10,564,010 | | | C,S | | Countrywide Home
Loan Mortgage
Pass-through Trust,
5.000%, due 04/25/35 | | | 8,523,412 | | |
| | 3,876,360 | | | C,S | | Countrywide Home
Loan Mortgage
Pass-through Trust,
5.250%, due 10/25/35 | | | 2,634,358 | | |
Principal
Amount | | | | | | Value | |
| $ | 12,328,841 | | | C,S | | Countrywide Home
Loan Mortgage
Pass-through Trust,
5.500%, due 10/25/35 | | $ | 9,525,683 | | |
| | 1,191,800 | | | C,S | | Credit Suisse First Boston
Mortgage Securities
Corp., 3.727%,
due 03/15/35 | | | 1,158,355 | | |
| | 811,634 | | | C,S | | Credit Suisse First Boston
Mortgage Securities
Corp., 3.819%,
due 05/15/36 | | | 776,838 | | |
| | 1,000,000 | | | C,S | | Credit Suisse First Boston
Mortgage Securities
Corp., 4.801%,
due 03/15/36 | | | 942,977 | | |
| | 1,133,191 | | | C,S | | Credit Suisse First Boston
Mortgage Securities
Corp., 5.000%, due 08/25/20 | | | 1,003,687 | | |
| | 3,369,283 | | | C,S | | Credit Suisse Mortgage
Capital Certificates,
7.000%, due 08/25/36 | | | 1,639,929 | | |
| | 3,000,000 | | | S | | Fannie Mae, 5.000%,
due 05/25/32 | | | 3,118,094 | | |
| | 2,888,066 | | | C,S | | First Horizon Mortgage
Pass-through Trust,
5.500%, due 12/25/35 | | | 2,549,663 | | |
| | 3,270,237 | | | C,S | | First Union National
Bank Commercial
Mortgage, 6.663%,
due 01/12/43 | | | 3,369,195 | | |
| | 500,000 | | | C,S | | GE Capital Commercial
Mortgage Corp., 4.371%,
due 01/10/38 | | | 494,863 | | |
| | 578,019 | | | C,S | | GE Capital Commercial
Mortgage Corp., 5.560%,
due 06/10/38 | | | 593,712 | | |
| | 2,820,000 | | | C,S | | GE Capital Commercial
Mortgage Corp., 6.531%,
due 05/15/33 | | | 2,903,878 | | |
| | 2,512,562 | | | C,S | | GMAC Commercial
Mortgage Securities, Inc.,
5.785%, due 11/15/39 | | | 2,534,449 | | |
| | 3,058,787 | | | C,S | | GMAC Mortgage Corp.
Loan Trust, 4.587%,
due 10/19/33 | | | 2,726,159 | | |
| | 6,521,106 | | | C,S | | GMAC Mortgage Corp.
Loan Trust, 5.261%,
due 03/18/35 | | | 5,717,778 | | |
| | 4,326,441 | | | C,S | | GMAC Mortgage Corp.
Loan Trust, 5.466%,
due 11/19/35 | | | 3,240,014 | | |
| | 159,239 | | | C,S | | GMAC Mortgage Corp.
Loan Trust, 5.500%,
due 09/25/34 | | | 159,712 | | |
| | 11,090,000 | | | C,S | | Greenwich Capital
Commercial Funding
Corp., 5.444%,
due 03/10/39 | | | 8,869,158 | | |
| | 1,118,083 | | | S | | GSMPS Mortgage Loan
Trust, 0.872%,
due 01/25/35 | | | 725,962 | | |
See Accompanying Notes to Financial Statements
79
PORTFOLIO OF INVESTMENTS
ING INTERMEDIATE BOND PORTFOLIO AS OF JUNE 30, 2009 (UNAUDITED) (CONTINUED)
Principal
Amount | | | | | | Value | |
| COLLATERALIZED MORTGAGE OBLIGATIONS (continued) | | | |
| $ | 2,614,509 | | | C,S | | GSR Mortgage Loan
Trust, 5.500%,
due 07/25/35 | | $ | 2,481,880 | | |
| | 908,901 | | | C,S | | Harborview Mortgage
Loan Trust, 0.663%,
due 01/19/35 | | | 399,819 | | |
| | 607,944 | | | C,S | | Homebanc Mortgage Trust,
1.174%, due 08/25/29 | | | 311,878 | | |
| | 15,000,000 | | | C,S | | JPMorgan Alternative
Loan Trust, 0.484%,
due 08/25/36 | | | 6,222,476 | | |
| | 914,452 | | | C,S | | JPMorgan Alternative
Loan Trust, 5.506%,
due 01/25/36 | | | 599,427 | | |
| | 465,498 | | | C,S | | JPMorgan Chase
Commercial Mortgage
Securities Corp., 4.200%,
due 07/12/35 | | | 465,678 | | |
| | 3,280,964 | | | C,S | | JPMorgan Chase
Commercial Mortgage
Securities Corp., 4.275%,
due 01/12/37 | | | 3,195,926 | | |
| | 386,938 | | | C,S | | JPMorgan Chase
Commercial Mortgage
Securities Corp., 6.023%,
due 04/15/45 | | | 392,878 | | |
| | 12,088,699 | | | C,S | | JPMorgan Mortgage
Trust, 5.397%,
due 11/25/35 | | | 9,976,366 | | |
| | 509,000 | | | C,S | | LB-UBS Commercial
Mortgage Trust, 4.310%,
due 02/15/30 | | | 499,371 | | |
| | 1,717,000 | | | C,S | | LB-UBS Commercial
Mortgage Trust, 4.510%,
due 12/15/29 | | | 1,520,458 | | |
| | 5,920,000 | | | C,S | | LB-UBS Commercial
Mortgage Trust, 5.372%,
due 09/15/39 | | | 4,815,216 | | |
| | 2,075,000 | | | C,S | | LB-UBS Commercial
Mortgage Trust, 5.594%,
due 06/15/31 | | | 2,085,522 | | |
| | 705,000 | | | C,S | | LB-UBS Commercial
Mortgage Trust, 6.080%,
due 06/15/38 | | | 592,151 | | |
| | 3,275,000 | | | C,S | | LB-UBS Commercial
Mortgage Trust, 6.317%,
due 04/15/41 | | | 2,525,349 | | |
| | 10,000,000 | | | C,S | | LB-UBS Commercial
Mortgage Trust, 6.365%,
due 12/15/28 | | | 10,231,184 | | |
| | 11,162,795 | | | C,S | | LB-UBS Commercial
Mortgage Trust, 7.370%,
due 08/15/26 | | | 11,431,886 | | |
| | 4,674,772 | | | C | | Lehman Mortgage Trust,
5.000%, due 12/25/35 | | | 4,256,469 | | |
| | 2,888,127 | | | C,S | | Luminent Mortgage Trust,
0.514%, due 10/25/46 | | | 1,191,007 | | |
| | 332,249 | | | C,S | | MASTR Adjustable Rate
Mortgages Trust, 2.080%,
due 01/25/47 | | | 84,335 | | |
| | 63,239 | | | C,S | | MASTR Alternative
Loans Trust, 6.500%,
due 05/25/33 | | | 54,739 | | |
Principal
Amount | | | | | | Value | |
| $ | 512,275 | | | C,S | | MASTR Alternative
Loans Trust, 8.500%,
due 05/25/33 | | $ | 481,679 | | |
| | 1,316,207 | | | C,S | | MASTR Asset Securitization
Trust, 5.500%,
due 06/25/33 | | | 1,214,639 | | |
| | 3,494,576 | | | #,C,S | | MASTR Reperforming
Loan Trust, 0.674%,
due 07/25/35 | | | 2,931,611 | | |
| | 861,318 | | | C,S | | MLCC Mortgage
Investors, Inc., 0.544%,
due 04/25/29 | | | 648,142 | | |
| | 408,692 | | | C,S | | MLCC Mortgage
Investors, Inc., 0.634%,
due 01/25/29 | | | 322,103 | | |
| | 7,280,000 | | | C,S | | Morgan Stanley Capital I,
5.283%, due 12/15/43 | | | 6,950,571 | | |
| | 1,646,523 | | | C,S | | Morgan Stanley Dean
Witter Capital I, 4.180%,
due 03/12/35 | | | 1,595,896 | | |
| | 60,697 | | | C,S | | MortgageIT Trust, 0.684%,
due 11/25/35 | | | 10,353 | | |
| | 3,764,000 | | | C,S | | New York Mortgage
Trust, Inc., 5.658%,
due 05/25/36 | | | 2,441,647 | | |
| | 1,804,000 | | | C,S | | Nomura Asset Securities
Corp., 6.690%,
due 03/15/30 | | | 1,918,930 | | |
| | 1,540,500 | | | C,S | | Prime Mortgage Trust,
0.814%, due 02/25/35 | | | 879,187 | | |
| | 1,808,896 | | | C,S | | Prudential Commercial
Mortgage Trust, 3.669%,
due 02/11/36 | | | 1,781,920 | | |
| | 10,763,685 | | | C,S | | RAAC Series, 5.250%,
due 09/25/34 | | | 10,230,253 | | |
| | 1,500,592 | | | C,S | | Residential Accredit
Loans, Inc., 0.544%,
due 05/25/46 | | | 264,605 | | |
| | 4,200,801 | | | C,S | | Residential Accredit
Loans, Inc., 0.554%,
due 04/25/46 | | | 728,947 | | |
| | 15,199,610 | | | C,S | | Residential Accredit
Loans, Inc., 5.500%,
due 05/25/34 | | | 8,950,609 | | |
| | 889,830 | | | C,S | | Residential Funding
Mortgage Securities I,
0.764%, due 05/25/33 | | | 649,263 | | |
| | 586,479 | | | C,S | | Sequoia Mortgage Trust,
0.585%, due 01/20/35 | | | 326,672 | | |
| | 717,434 | | | C,S | | Structured Adjustable Rate
Mortgage Loan Trust,
0.624%, due 07/25/35 | | | 315,472 | | |
| | 1,131,434 | | | C,S | | Structured Asset Mortgage
Investments, Inc.,
0.553%, due 04/19/35 | | | 571,121 | | |
| | 5,402,224 | | | C,S | | Structured Asset Mortgage
Investments, Inc.,
3.763%, due 12/27/35 | | | 1,968,062 | | |
| | 1,036,532 | | | C,S | | Structured Asset
Securities Corp., 5.500%,
due 07/25/33 | | | 910,927 | | |
| | 1,655,170 | | | C,S | | Thornburg Mortgage
Securities Trust, 0.664%,
due 12/25/33 | | | 1,268,449 | | |
See Accompanying Notes to Financial Statements
80
PORTFOLIO OF INVESTMENTS
ING INTERMEDIATE BOND PORTFOLIO AS OF JUNE 30, 2009 (UNAUDITED) (CONTINUED)
Principal
Amount | | | | | | Value | |
| COLLATERALIZED MORTGAGE OBLIGATIONS (continued) | | | |
| $ | 1,728,536 | | | C,S | | Thornburg Mortgage
Securities Trust, 0.684%,
due 09/25/44 | | $ | 1,395,558 | | |
| | 1,415,000 | | | C,S | | TIAA Seasoned Commercial
Mortgage Trust, 6.095%,
due 08/15/39 | | | 1,326,865 | | |
| | 5,970,000 | | | C,S | | Wachovia Bank Commercial
Mortgage Trust, 5.083%,
due 03/15/42 | | | 5,150,496 | | |
| | 8,900,000 | | | C,S | | Wachovia Bank Commercial
Mortgage Trust, 5.308%,
due 11/15/48 | | | 6,821,337 | | |
| | 2,801,956 | | | C,S | | Wachovia Bank Commercial
Mortgage Trust, 5.506%,
due 03/15/45 | | | 2,797,082 | | |
| | 7,034,153 | | | C,S | | Washington Mutual
Mortgage Pass-through
Certificates, 0.604%,
due 09/25/46 | | | 1,105,074 | | |
| | 823,287 | | | C,S | | Washington Mutual
Mortgage Pass-through
Certificates, 0.624%,
due 01/25/45 | | | 383,897 | | |
| | 1,062,603 | | | C,S | | Washington Mutual
Mortgage Pass-through
Certificates, 0.634%,
due 08/25/45 | | | 577,981 | | |
| | 1,543,666 | | | C,S | | Washington Mutual
Mortgage Pass-through
Certificates, 0.714%,
due 08/25/45 | | | 513,297 | | |
| | 792,668 | | | C,S | | Washington Mutual
Mortgage Pass-through
Certificates, 0.733%,
due 06/25/44 | | | 425,450 | | |
| | 6,826,774 | | | C,S | | Washington Mutual
Mortgage Pass-through
Certificates, 2.040%,
due 03/25/47 | | | 2,292,567 | | |
| | 12,232,111 | | | C,S | | Washington Mutual
Mortgage Pass-through
Certificates, 2.080%,
due 01/25/47 | | | 4,309,765 | | |
| | 4,998,906 | | | C,S | | Washington Mutual
Mortgage Pass-through
Certificates, 2.090%,
due 06/25/47 | | | 868,292 | | |
| | 8,285,376 | | | C,S | | Washington Mutual
Mortgage Pass-through
Certificates, 2.100%,
due 04/25/47 | | | 1,616,551 | | |
| | 12,013,796 | | | C,S | | Washington Mutual
Mortgage Pass-through
Certificates, 2.110%,
due 04/25/47 | | | 4,912,717 | | |
| | 4,372,193 | | | C,S | | Washington Mutual
Mortgage Pass-through
Certificates, 2.110%,
due 05/25/47 | | | 1,226,215 | | |
| | 685,543 | | | C,S | | Washington Mutual
Mortgage Pass-through
Certificates, 2.150%,
due 12/25/46 | | | 135,629 | | |
Principal
Amount | | | | | | Value | |
| $ | 4,559,247 | | | C,S | | Washington Mutual
Mortgage Pass-through
Certificates, 2.150%,
due 07/25/47 | | $ | 1,706,916 | | |
| | 10,794,463 | | | C,S | | Washington Mutual
Mortgage Pass-through
Certificates, 2.150%,
due 07/25/47 | | | 2,029,840 | | |
| | 7,195,137 | | | C,S | | Washington Mutual
Mortgage Pass-through
Certificates, 2.180%,
due 11/25/46 | | | 2,550,369 | | |
| | 1,344,885 | | | C,S | | Washington Mutual
Mortgage Pass-through
Certificates, 2.180%,
due 11/25/46 | | | 328,974 | | |
| | 3,889,371 | | | C,S | | Washington Mutual
Mortgage Pass-through
Certificates, 2.300%,
due 09/25/46 | | | 1,412,701 | | |
| | 5,929,855 | | | C,S | | Washington Mutual
Mortgage Pass-through
Certificates, 2.310%,
due 05/25/46 | | | 1,010,334 | | |
| | 763,719 | | | C,S | | Washington Mutual
Mortgage Pass-through
Certificates, 2.310%,
due 06/25/46 | | | 271,699 | | |
| | 9,006,593 | | | C,S | | Washington Mutual
Mortgage Pass-through
Certificates, 2.330%,
due 06/25/46 | | | 3,222,372 | | |
| | 1,568,492 | | | C,S | | Washington Mutual
Mortgage Pass-through
Certificates, 2.840%,
due 11/25/46 | | | 345,068 | | |
| | 1,382,814 | | | C,S | | Washington Mutual
Mortgage Pass-through
Certificates, 2.880%,
due 10/25/46 | | | 620,503 | | |
| | 3,072,265 | | | C,S | | Washington Mutual
Mortgage Pass-through
Certificates, 6.000%,
due 06/25/34 | | | 2,755,253 | | |
| | 8,712,000 | | | C,S | | Wells Fargo
Mortgage-Backed
Securities Trust, 4.775%,
due 07/25/34 | | | 7,908,450 | | |
| | 3,264,864 | | | C,S | | Wells Fargo
Mortgage-Backed
Securities Trust, 4.878%,
due 08/25/34 | | | 2,948,433 | | |
| | 4,991,103 | | | C,S | | Wells Fargo
Mortgage-Backed
Securities Trust, 5.000%,
due 12/25/33 | | | 4,341,497 | | |
| | 11,215,580 | | | #,C,S | | Wells Fargo
Mortgage-Backed
Securities Trust, 5.317%,
due 06/26/35 | | | 9,196,776 | | |
| | 9,091,879 | | | C,S | | Wells Fargo
Mortgage-Backed
Securities Trust,
5.388%, due 08/25/35 | | | 6,905,325 | | |
See Accompanying Notes to Financial Statements
81
PORTFOLIO OF INVESTMENTS
ING INTERMEDIATE BOND PORTFOLIO AS OF JUNE 30, 2009 (UNAUDITED) (CONTINUED)
Principal
Amount | | | | | | Value | |
| COLLATERALIZED MORTGAGE OBLIGATIONS (continued) | | | |
| $ | 6,498,247 | | | C,S | | Wells Fargo
Mortgage-Backed
Securities Trust, 5.921%,
due 11/25/36 | | $ | 4,301,046 | | |
Total Collateralized
Mortgage Obligations
(Cost $467,957,798) | | | 327,027,504 | | |
| OTHER BONDS: 1.9% | | | |
| | | | | Foreign Government Bonds: 1.9% | |
| BRL | 123,511,000 | | | | | Brazil Notas do Tesouro
Nacional Series F,
10.000%, due 01/01/17 | | | 55,031,573 | | |
Total Other Bonds
(Cost $52,694,129) | | | 55,031,573 | | |
| Shares | | | | | | Value | |
| PREFERRED STOCK: 0.2% | | | |
| | | | | Diversified Financial Services: 0.2% | |
| | 8,933 | | | #,P | | Zurich RegCaPS
Funding Trust | | $ | 5,412,840 | | |
Total Preferred Stock
(Cost $8,486,350) | | | 5,412,840 | | |
Total Long-Term Investments
(Cost $3,264,711,291) | | | 3,121,365,722 | | |
| SHORT-TERM INVESTMENTS: 32.0% | | | |
| | | | | Affiliated Mutual Fund: 2.7% | |
| | 76,799,000 | | | S | | ING Institutional Prime
Money Market
Fund - Class I | | | 76,799,000 | | |
Total Mutual Fund
(Cost $76,799,000) | | | 76,799,000 | | |
Principal
Amount | | | | | | Value | |
| | | | | Commercial Paper: 10.3% | |
| $ | 6,000,000 | | | S | | ASB Finance Ltd., 0.550%,
due 07/15/09 | | $ | 5,998,628 | | |
| | 25,000,000 | | | | | Barton Capital, 0.260%,
due 07/15/09 | | | 24,997,292 | | |
| | 23,100,000 | | | | | Caisse Nationale des
Caisses d' Epargne,
0.440%, due 09/16/09 | | | 23,076,438 | | |
| | 15,000,000 | | | S | | Caisse Nationale des
Caisses d' Epargne,
0.600%, due 07/01/09 | | | 14,999,712 | | |
| | 733,000 | | | S | | Ciesco L.P., 0.390%,
due 08/19/09 | | | 732,363 | | |
| | 10,894,000 | | | S | | General Mills, Inc., 0.400%,
due 07/21/09 | | | 10,891,458 | | |
| | 4,000,000 | | | S | | General Mills, Inc., 0.450%,
due 07/10/09 | | | 3,999,500 | | |
| | 25,000,000 | | | | | HSBC Finance Corp.,
0.480%, due 07/27/09 | | | 24,991,000 | | |
| | 7,355,000 | | | | | Kellogg Co., 0.300%,
due 07/13/09 | | | 7,354,203 | | |
Principal
Amount | | | | | | Value | |
| $ | 12,000,000 | | | | | Kellogg Co., 0.400%,
due 07/06/09 | | $ | 11,999,200 | | |
| | 8,000,000 | | | S | | Kellogg Co., 0.400%,
due 07/09/09 | | | 7,999,200 | | |
| | 12,465,000 | | | S | | Louis Drefus Corp.,
0.420%, due 09/01/09 | | | 12,455,901 | | |
| | 4,750,000 | | | S | | Louis Drefus Corp.,
0.450%, due 07/06/09 | | | 4,749,644 | | |
| | 26,750,000 | | | S | | Louis Drefus Corp.,
0.460%, due 09/21/09 | | | 26,721,378 | | |
| | 10,500,000 | | | S | | Natixis Finance, 0.600%,
due 10/13/09 | | | 10,481,625 | | |
| | 20,000,000 | | | S | | Natixis Finance, 0.520%,
due 08/03/09 | | | 20,010,366 | | |
| | 25,000,000 | | | | | Verizon
Communications, Inc.,
0.320%, due 07/16/09 | | | 24,996,445 | | |
| | 25,500,000 | | | | | Weatherford
International Ltd.,
0.450%, due 07/01/09 | | | 25,499,681 | | |
| | 29,500,000 | | | S | | Westpac Banking Corp.,
0.570%, due 09/14/09 | | | 29,478,759 | | |
Total Commercial Paper
(Cost $291,399,089) | | | 291,432,793 | | |
| | | | | U.S. Treasury Bills: 0.2% | |
| | 7,000,000 | | | | | 0.160%, due 09/24/09 | | | 6,997,270 | | |
Total U.S. Treasury Bills
(Cost $6,980,109) | | | 6,997,270 | | |
| | | | | Securities Lending Collateralcc: 18.8% | |
| | 533,761,298 | | | | | Bank of New York
Mellon Corp. Institutional
Cash Reserves | | | 531,919,786 | | |
Total Securities
Lending Collateral
(Cost $533,761,298) | | | | 531,919,786 | |
Total Short-Term Investments
(Cost $908,939,496) | | | | 907,148,849 | |
Total Investments in
Securities
(Cost $4,173,650,787)* | | | 142.3 | % | | $ | 4,028,514,571 | | |
Other Assets and
Liabilities - Net | | | (42.3 | ) | | | (1,198,453,986 | ) | |
| Net Assets | | | 100.0 | % | | $ | 2,830,060,585 | | |
@@ Foreign Issuer
MASTR Mortgage Asset Securitization Transaction, Inc.
# Securities with purchases pursuant to Rule 144A or section 4(2), under the Securities Act of 1933 and may not be resold subject to that rule except to qualified institutional buyers. Unless otherwise noted, these securities have been determined to be liquid under the guidelines established by the Funds' Board of Directors/Trustees.
C Bond may be called prior to maturity date.
P Preferred Stock may be called prior to convertible date.
cc Securities purchased with cash collateral for securities loaned.
## On September 7, 2008, the Federal Housing Finance Agency placed the Federal National Mortgage Association and the Federal Home Loan Mortgage Corporation into conservatorship and the U.S. Treasury guaranteed the debt issued by those organizations.
W Settlement is on a when-issued or delayed-delivery basis.
See Accompanying Notes to Financial Statements
82
PORTFOLIO OF INVESTMENTS
ING INTERMEDIATE BOND PORTFOLIO AS OF JUNE 30, 2009 (UNAUDITED) (CONTINUED)
S All or a portion of this security is segregated to cover collateral requirements for applicable futures, options, swaps, foreign forward currency contracts and/or when-issued or delayed-delivery securities.
I Illiquid security
L Loaned security, a portion or all of the security is on loan at June 30, 2009.
± Defaulted security
X Fair value determined by ING Funds Valuation Committee appointed by the Funds' Board of Directors/Trustees.
^ Interest only securities represent the right to receive the monthly interest payments on an underlying pool of mortgage loans. Principal amount shown represents the notional amount on which current interest is calculated. Payments of principal on the pool reduce the value of the interest only security.
Z Indicates Zero Coupon Bond; rate shown reflects current effective yield.
BRL Brazilian Real
* Cost for federal income tax purposes is $4,182,902,191.
Net unrealized depreciation consists of:
| Gross Unrealized Appreciation | | $ | 72,644,268 | | |
| Gross Unrealized Depreciation | | | (227,031,888 | ) | |
| Net Unrealized Depreciation | | $ | (154,387,620 | ) | |
The following is a summary of the inputs used as of June 30, 2009 in determining the Portfolio's investments at fair value for purposes of SFAS 157:
| | | Quoted Prices
in Active
Markets
for Identical
Investments
(Level 1) | | Significant
Other
Observable
Inputs
(Level 2) | | Significant
Unobservable
Inputs
(Level 3) | |
| Preferred Stock | | $ | — | | | $ | 5,412,840 | | | $ | — | | |
| Corporate Bonds/Notes | | | — | | | | 859,981,585 | | | | 1,092,062 | | |
U.S. Government
Agency Obligations | | | — | | | | 1,090,219,311 | | | | — | | |
U.S. Treasury
Obligations | | | — | | | | 735,837,511 | | | | — | | |
Asset-Backed
Securities | | | — | | | | 46,763,336 | | | | — | | |
Collateralized
Mortgage
Obligations | | | — | | | | 317,485,660 | | | | 9,541,844 | | |
Foreign Government
Bonds | | | — | | | | — | | | | 55,031,573 | | |
Short-Term
Investments | | | 76,799,000 | | | | 830,349,849 | | | | — | | |
| Total | | $ | 76,799,000 | | | $ | 3,886,050,092 | | | $ | 65,665,479 | | |
Other Financial
Instruments** | | | (1,892,937 | ) | | | (4,334,985 | ) | | | — | | |
| Total | | $ | (1,892,937 | ) | | $ | (4,334,985 | ) | | $ | — | | |
The following is a reconciliation of the fair value measurements using significant unobservable inputs (Level 3) for the period ended June 30, 2009:
| | | Beginning
Balance
12/31/08 | | Net
Purchases/
(Sales) | | Accrued
Discounts/
(Premiums) | | Total
Realized
Gain/(Loss) | | Total
Unrealized
Appreciation/
(Depreciation) | | Net Transfers
In/(Out) of
Level 3 | | Ending
Balance
at 06/30/09 | |
| Corporate Bonds/Notes | | $ | 13,813,319 | | | $ | (10,954,200 | ) | | $ | (103,062 | ) | | $ | (4,970,645 | ) | | $ | 3,306,650 | | | $ | — | | | $ | 1,092,062 | | |
Collateralized Mortgage
Obligations | | | 9,310,838 | | | | 957,496 | | | | (26,108 | ) | | | (1,763,600 | ) | | | 1,063,218 | | | | — | | | | 9,541,844 | | |
| Foreign Government Bonds | | | 21,291,606 | | | | 38,804,508 | | | | (824,133 | ) | | | (18,395,608 | ) | | | 21,531,775 | | | | (7,376,575 | ) | | | 55,031,573 | | |
| Total | | $ | 44,415,763 | | | $ | 28,807,804 | | | $ | (953,303 | ) | | $ | (25,129,853 | ) | | $ | 25,901,643 | | | $ | (7,376,575 | ) | | $ | 65,665,479 | | |
For the period ended June 30, 2009, total change in unrealized gain (loss) on Level 3 securities still held at period end and included in the change in net assets was $4,795,538. Total unrealized gain (loss) for all securities (including Level 1 and Level 2) can be found on the accompanying Statement of Operations.
"Fair value" for purposes of SFAS 157 is different from "fair value" as used in the 1940 Act. The former generally implies market value, and can include market quotations as a source of value, and the latter refers to determinations of value in absence of available market quotations.
* See NOTE 2, "Significant Accounting Policies" in the Notes to Financial Statements for additional information.
** Other financial instruments may include open forward foreign currency contracts, futures, swaps, and written options. Forward foreign currency contracts and futures are reported at their unrealized gain/loss at period end. Swaps and written options are reported at their market value at period end.
ING Intermediate Bond Portfolio Open Futures Contracts on June 30, 2009:
Contract
Description | | Number of
Contracts | | Expiration
Date | | Unrealized
Depreciation | |
| Long Contracts | |
| U.S. Treasury 2-Year Note | | | 7 | | | 09/30/09 | | $ | (2,314 | ) | |
| | | | | | | | | $ | (2,314 | ) | |
| Short Contracts | |
| U.S. Treasury 10-Year Note | | | 542 | | | 09/21/09 | | $ | (208,842 | ) | |
| U.S. Treasury Long Bond | | | 611 | | | 09/21/09 | | | (1,681,781 | ) | |
| | | | | | | | | $ | (1,890,623 | ) | |
See Accompanying Notes to Financial Statements
83
PORTFOLIO OF INVESTMENTS
ING INTERMEDIATE BOND PORTFOLIO AS OF JUNE 30, 2009 (UNAUDITED) (CONTINUED)
ING Intermediate Bond Portfolio Credit Default Swap Agreements Outstanding on June 30, 2009:
Credit Default Swaps on Corporate and Sovereign Issues — Buy Protection(1)
| Counterparty | | Reference
Entity/Obligation | | Buy/Sell
Protection | | (Pay)/
Receive
Fixed
Rate (%) | | Termination
Date | | Notional
Amount(2) | | Market
Value(3) | | Upfront
Premium
Paid/
(Received) | | Unrealized
Appreciation/
(Depreciation) | |
Morgan Stanley
Capital
Services Inc. | | Domtar Inc.
7.875%, 10/15/11 | | Buy | | | (2.650 | ) | | 09/20/11 | | USD | 2,758,500 | | | $ | 223,041 | | | $ | — | | | $ | 223,041 | | |
Goldman Sachs
International | | Dow Chemical Co.
7.375%, 11/01/29 | | Buy | | | (1.280 | ) | | 12/20/13 | | USD | 9,850,000 | | | | 474,691 | | | | — | | | | 474,691 | | |
Barclays
Bank PLC | | Gap Inc.
8.800%, 12/15/08* | | Buy | | | (1.200 | ) | | 06/20/13 | | USD | 3,711,000 | | | | (117,644 | ) | | | — | | | | (117,644 | ) | |
Citibank N.A.,
New York | | MBIA Inc.
6.625%, 10/01/28 | | Buy | | | (5.000 | ) | | 09/20/13 | | USD | 1,710,000 | | | | 475,193 | | | | 488,300 | | | | (13,107 | ) | |
Citibank N.A.,
New York | | MBIA Inc.
6.625%, 10/01/28 | | Buy | | | (5.000 | ) | | 09/20/13 | | USD | 3,460,000 | | | | 961,503 | | | | 948,254 | | | | 13,249 | | |
JPMorgan Chase
Bank, N.A.
New York | | MBIA Inc.
6.625%, 10/01/28 | | Buy | | | (5.000 | ) | | 09/20/13 | | USD | 13,751,000 | | | | 3,821,278 | | | | 2,050,901 | | | | 1,770,377 | | |
| | | | | | | | | | | | | $ | 35,240,500 | | | $ | 5,838,062 | | | $ | 3,487,455 | | | $ | 2,350,607 | | |
Credit Default Swaps on Corporate and Sovereign Issues — Sell Protection(4)
| Counterparty | | Reference
Entity/Obligation | | Buy/Sell
Protection | | (Pay)/
Receive
Fixed
Rate (%) | | Termination
Date | | Implied
Credit
Spread at
06/30/09(%)(5) | | Notional
Amount(2) | | Market
Value(3) | | Upfront
Premium
Paid/
(Received) | | Unrealized
Appreciation/
(Depreciation) | |
| UBS AG | | Domtar Inc.
7.875%, 10/15/11 | | Sell | | | 2.600 | | | 09/20/11 | | | 6.71 | | | USD | 2,761,000 | | | $ | (225,993 | ) | | $ | — | | | $ | (225,993 | ) | |
Citibank N.A.,
New York | | MBIA Global Funding
LLC, FRN, 10/06/10 | | Sell | | | 5.000 | | | 09/20/13 | | | 43.87 | | | USD | 1,710,000 | | | | (1,098,874 | ) | | | (543,320 | ) | | | (555,554 | ) | |
Citibank N.A.,
New York | | MBIA Global Funding
LLC, FRN, 10/06/10 | | Sell | | | 5.000 | | | 09/20/13 | | | 43.87 | | | USD | 3,460,000 | | | | (2,223,451 | ) | | | (1,199,261 | ) | | | (1,024,190 | ) | |
Goldman Sachs
International | | MBIA Global Funding
LLC, FRN, 10/06/10 | | Sell | | | 5.000 | | | 09/20/13 | | | 43.87 | | | USD | 3,435,000 | | | | (2,207,386 | ) | | | (1,077,590 | ) | | | (1,129,796 | ) | |
JPMorgan
Chase
Bank, N.A.
New York | | MBIA Global Funding
LLC, FRN, 10/06/10 | | Sell | | | 5.000 | | | 09/20/13 | | | 43.87 | | | USD | 6,874,000 | | | | (4,417,342 | ) | | | (1,082,184 | ) | | | (3,335,158 | ) | |
| | | | | | | | | | | | | | | | | $ | 18,240,000 | | | $ | (10,173,047 | ) | | $ | (3,902,356 | ) | | $ | (6,270,691 | ) | |
* In the event of a default, if this bond is no longer available an equivalent bond will be delivered.
(1) If a Fund is a buyer of protection and a credit event occurs, as defined under the terms of that paticular swap agreement, a Fund will either 1.) receive from the seller of protection an amount equal to the notional amount of the swap and deliver the referenced obligation, other deliverable obligations or underlying securities comprising the referenced index or 2.) receive a net settlement amount in the form of cash or securities equal to the notional amount of the swap less the recovery value of the referenced obligation or underlying securities comprising the referenced index.
(2) The maximum amount of future payments (undiscounted) that a Fund as seller of protection could be required to make or receive as a buyer of credit protection under a credit default swap agreement would be an amount equal to the notional amount of the agreement.
(3) The market values for credit default swap agreements serve as an indicator of the current status of the payment/performance risk and represent the likelihood or risk of default for the credit derivative. Increasing market values, in absolute terms, when compared to the notional amount of the agreement, represent a deterioration of the referenced obligation's credit soundness and a greater likelihood or risk of default or other credit event occurring.
(4) If the Fund is a seller of protection, and a credit event occurs, as defined under the terms of that particular swap agreement, the Fund will generally either 1.) Pay to the buyer an amount equal to the notional amount of the swap and take delivery of the referenced obligation, other deliverable obligations, or underlying securities comprising a referenced index or 2.) Pay a net settlement amount in the form of cash or securities equal to the notional amount of the swap less the recovery value of the referenced obligation or underlying securities comprising a referenced index.
See Accompanying Notes to Financial Statements
84
PORTFOLIO OF INVESTMENTS
ING INTERMEDIATE BOND PORTFOLIO AS OF JUNE 30, 2009 (UNAUDITED) (CONTINUED)
(5) Implied credit spreads, represented in absolute terms, utilized in determining the market value of credit default swap agreements on corporate issues or sovereign issues are disclosed in the table above and serve as an indicator of the current status of the payment/performance risk and represent the likelihood or risk of default for the credit derivative. The implied credit spread of a particular referenced entity reflects the cost of buying/selling protection and may include upfront payments required to be made to enter into the agreement. For credit default swaps on asset-backed securities or credit indices, the quoted market prices and resulting market values serve as the indicator of the current status of the payment/performance risk. Wider credit spreads and increasing market values, in absolute terms when compared to the notional amount of the swap, represent a deterioration of the referenced entity's credit soundness an d a greater likelihood or risk of default or other credit event occurring as defined under the terms of the agreement.
A summary of derivative instruments by primary risk exposure is outlined in the following tables.
The fair value of derivative instruments as of June 30, 2009 was as follows:
Derivatives not accounted for as hedging
instruments under SFAS No. 133 | | Location on Statement of Assets and Liabilities | | Fair Value | |
| Asset Derivatives | |
| Credit contracts | | Unrealized appreciation on swap agreements, net of upfront payments made | | $ | 5,968,813 | | |
| Total Asset Derivatives | | | | $ | 5,968,813 | | |
| Liability Derivatives | |
| Credit contracts | | Unrealized depreciation on swap agreements, net of upfront payments received | | $ | 10,303,798 | | |
| Total Liability Derivatives | | | | $ | 10,303,798 | | |
The effect of derivative instruments on the Portfolio's Statement of Operations for the six months ended June 30, 2009 was as follows:
| Amount of Realized Gain or (Loss) on Derivatives Recognized in Income | |
Derivatives not accounted for as hedging
instruments under SFAS No. 133 | | Forward Foreign
Currency Contracts | | Futures | | Swaps | | Total | |
| Foreign exchange contracts | | $ | (5,891,329 | ) | | $ | — | | | $ | — | | | $ | (5,891,329 | ) | |
| Interest rate contracts | | | — | | | | 12,056,252 | | | | 1,649,279 | | | | 13,705,531 | | |
| Credit contracts | | | — | | | | — | | | | 29,464,416 | | | | 29,464,416 | | |
| Total | | $ | (5,891,329 | ) | | $ | 12,056,252 | | | $ | 31,113,695 | | | $ | 37,278,618 | | |
| Change in Unrealized Appreciation or (Depreciation) on Derivatives Recognized in Income | |
Derivatives not accounted for as hedging
instruments under SFAS No. 133 | | Forward Foreign
Currency Contracts | | Futures | | Swaps | | Total | |
| Foreign exchange contracts | | $ | 2,296,570 | | | $ | — | | | $ | — | | | $ | 2,296,570 | | |
| Interest rate contracts | | | — | | | | 12,940,053 | | | | (1,803,696 | ) | | | 11,136,357 | | |
| Credit contracts | | | — | | | | — | | | | (39,724,211 | ) | | | (39,724,211 | ) | |
| Total | | $ | 2,296,570 | | | $ | 12,940,053 | | | $ | (41,527,907 | ) | | $ | (26,291,284 | ) | |
See Accompanying Notes to Financial Statements
85
PORTFOLIO OF INVESTMENTS
ING MONEY MARKET PORTFOLIO(1) AS OF JUNE 30, 2009 (UNAUDITED)
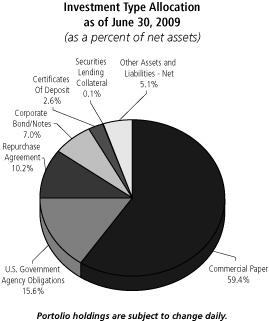
Principal
Amount | | | | | | Value | |
| CERTIFICATES OF DEPOSIT: 2.6% | | | |
| $ | 19,000,000 | | | | | Svenska Handelsbanken AB,
0.570%, due 07/17/09 | | $ | 19,000,674 | | |
22,000,000 UBS AG, 0.280%,
due 07/01/09 | | | 22,000,000 | | |
Total Certificates of Deposit
(Cost $41,000,674) | | | 41,000,674 | | |
| COMMERCIAL PAPER: 59.4% | | | |
| | 5,500,000 | | | | | American Honda Finance,
0.630%, due 08/25/09 | | | 5,494,615 | | |
| | 2,000,000 | | | | | ANZ National Bank Ltd.,
0.510%, due 09/14/09 | | | 1,997,833 | | |
| | 6,000,000 | | | | | ASB Finance Ltd., 0.510%,
due 09/21/09 | | | 5,992,893 | | |
| | 7,000,000 | | | | | ASB Finance Ltd., 0.690%,
due 09/15/09 | | | 6,989,656 | | |
| | 10,000,000 | | | | | ASB Finance Ltd., 0.790%,
due 10/22/09 | | | 9,974,889 | | |
| | 5,000,000 | | | | | Barton Capital, LLC, 0.310%,
due 07/06/09 | | | 4,999,743 | | |
| | 1,500,000 | | | | | Barton Capital, LLC, 0.340%,
due 07/07/09 | | | 1,499,900 | | |
| | 6,500,000 | | | | | Barton Capital, LLC, 0.340%,
due 08/18/09 | | | 6,496,967 | | |
| | 10,635,000 | | | | | Barton Capital, LLC, 0.350%,
due 08/10/09 | | | 10,630,819 | | |
| | 3,444,000 | | | | | Barton Capital, LLC, 0.350%,
due 09/09/09 | | | 3,441,656 | | |
| | 11,000,000 | | | | | Barton Capital, LLC, 0.350%,
due 09/17/09 | | | 10,991,658 | | |
Principal
Amount | | | | | | Value | |
| $ | 17,000,000 | | | | | Barton Capital, LLC, 0.440%,
due 07/17/09 | | $ | 16,996,480 | | |
| | 4,000,000 | | | | | Cafco, LLC, 0.340%,
due 08/20/09 | | | 3,998,056 | | |
| | 16,500,000 | | | | | Cafco, LLC, 0.370%,
due 08/27/09 | | | 16,490,073 | | |
| | 7,000,000 | | | | | Cafco, LLC, 0.470%,
due 08/11/09 | | | 6,996,173 | | |
| | 25,000,000 | | | | | Cafco, LLC, 0.740%,
due 09/15/09 | | | 24,960,416 | | |
| | 10,500,000 | | | | | Caisse Nationale des
Caisses d'Epargne et
de Prevoyance, 0.440%,
due 09/16/09 | | | 10,489,894 | | |
| | 12,000,000 | | | | | Caisse Nationale des
Caisses d'Epargne et
de Prevoyance, 0.470%,
due 08/31/09 | | | 11,990,240 | | |
| | 3,000,000 | | | | | Caisse Nationale des
Caisses d'Epargne et
de Prevoyance, 0.360%,
due 07/01/09 | | | 3,000,000 | | |
| | 22,000,000 | | | | | CBA Finance, Inc., 0.350%,
due 09/30/09 | | | 21,980,535 | | |
| | 12,000,000 | | | | | Ciesco, LLC, 0.380%,
due 07/27/09 | | | 11,996,620 | | |
| | 8,500,000 | | | | | Ciesco, LLC, 0.390%,
due 08/19/09 | | | 8,495,372 | | |
| | 12,000,000 | | | | | Ciesco, LLC, 0.440%,
due 09/09/09 | | | 11,989,500 | | |
| | 25,000,000 | | | | | Ciesco, LLC, 0.740%,
due 09/14/09 | | | 24,960,937 | | |
| | 22,500,000 | | | | | Concord Minutemen
Capital Co., LLC, 1.770%,
due 08/27/09 | | | 22,435,875 | | |
| | 32,000,000 | | | | | Concord Minutemen
Capital Co., LLC, 1.910%,
due 10/22/09 | | | 31,807,147 | | |
| | 22,000,000 | | | | | Crown Point Capital Co.,
1.770%, due 08/26/09 | | | 21,938,400 | | |
| | 32,500,000 | | | | | Crown Point Capital Co.,
1.910%, due 10/21/09 | | | 32,305,866 | | |
| | 1,500,000 | | | | | Danske Corp., 0.370%,
due 09/08/09 | | | 1,498,908 | | |
| | 7,000,000 | | | | | Danske Corp., 0.480%,
due 07/29/09 | | | 6,997,278 | | |
| | 15,000,000 | | | | | Danske Corp., 0.550%,
due 12/18/09 | | | 14,961,042 | | |
| | 22,000,000 | | | | | Dexia, 0.290%, due 07/06/09 | | | 21,998,931 | | |
| | 18,000,000 | | | | | Edison Asset Securities, LLC,
0.540%, due 10/30/09 | | | 17,966,927 | | |
| | 16,750,000 | | | | | Edison Asset Securities, LLC,
0.580%, due 09/21/09 | | | 16,728,065 | | |
| | 13,250,000 | | | | | Edison Asset Securities, LLC,
0.680%, due 10/20/09 | | | 13,222,219 | | |
| | 7,000,000 | | | | | Edison Asset Securities, LLC,
0.700%, due 10/21/09 | | | 6,984,756 | | |
| | 19,000,000 | | | | | Jupiter Securities Co., LLC,
0.300%, due 07/13/09 | | | 18,997,910 | | |
| | 7,000,000 | | | | | Jupiter Securities Co., LLC,
0.300%, due 08/25/09 | | | 6,996,685 | | |
| | 25,500,000 | | | | | Jupiter Securities Co., LLC,
0.340%, due 07/23/09 | | | 25,494,610 | | |
See Accompanying Notes to Financial Statements
86
PORTFOLIO OF INVESTMENTS
ING MONEY MARKET PORTFOLIO(1) AS OF JUNE 30, 2009 (UNAUDITED) (CONTINUED)
Principal
Amount | | | | | | Value | |
| COMMERCIAL PAPER (continued) | | | |
| $ | 4,000,000 | | | | | Jupiter Securities Co., LLC,
0.360%, due 08/12/09 | | $ | 3,998,273 | | |
| | 22,000,000 | | | | | KFW International Finance,
Inc., 0.170%, due 07/07/09 | | | 21,999,267 | | |
| | 23,000,000 | | | | | Natexis Banques Populaires
US Finance Co, LLC,
0.510%, due 08/24/09 | | | 22,982,060 | | |
| | 4,000,000 | | | | | Old Line Funding, LLC,
0.350%, due 09/02/09 | | | 3,997,480 | | |
| | 2,500,000 | | | | | Old Line Funding, LLC,
0.370%, due 09/15/09 | | | 2,498,047 | | |
| | 1,000,000 | | | | | Old Line Funding, LLC,
0.390%, due 08/13/09 | | | 999,522 | | |
| | 10,500,000 | | | | | Old Line Funding, LLC,
0.400%, due 07/14/09 | | | 10,498,321 | | |
| | 28,000,000 | | | | | Old Line Funding, LLC,
0.400%, due 10/15/09 | | | 27,966,198 | | |
| | 8,500,000 | | | | | Old Line Funding, LLC,
0.450%, due 07/15/09 | | | 8,498,413 | | |
| | 5,500,000 | | | | | Park Avenue Receivables,
0.240%, due 07/21/09 | | | 5,499,236 | | |
| | 4,500,000 | | | | | Park Avenue Receivables,
0.270%, due 07/10/09 | | | 4,499,663 | | |
| | 13,500,000 | | | | | Park Avenue Receivables,
0.270%, due 07/22/09 | | | 13,497,795 | | |
| | 9,000,000 | | | | | Park Avenue Receivables,
0.340%, due 08/05/09 | | | 8,996,938 | | |
| | 10,000,000 | | | | | Park Avenue Receivables,
0.360%, due 08/06/09 | | | 9,996,300 | | |
| | 10,000,000 | | | | | Park Avenue Receivables,
0.370%, due 07/13/09 | | | 9,998,667 | | |
| | 5,000,000 | | | | | Societe Generale, 0.440%,
due 09/15/09 | | | 4,995,250 | | |
| | 6,000,000 | | | | | Societe Generale, 0.710%,
due 07/16/09 | | | 6,000,025 | | |
| | 12,500,000 | | | @@,# | | Societe Generale, 1.060%,
due 09/04/09 | | | 12,500,000 | | |
| | 3,000,000 | | | | | Thunder Bay Funding, LLC,
0.350%, due 09/10/09 | | | 2,997,929 | | |
| | 8,500,000 | | | | | Thunder Bay Funding, LLC,
0.360%, due 09/08/09 | | | 8,494,135 | | |
| | 17,000,000 | | | | | Thunder Bay Funding, LLC,
0.390%, due 07/07/09 | | | 16,998,725 | | |
| | 12,500,000 | | | | | Thunder Bay Funding, LLC,
0.400%, due 10/19/09 | | | 12,484,722 | | |
| | 8,500,000 | | | | | Thunder Bay Funding, LLC,
0.450%, due 07/15/09 | | | 8,498,413 | | |
| | 7,500,000 | | | | | Thunder Bay Funding, LLC,
0.550%, due 10/08/09 | | | 7,488,656 | | |
| | 13,100,000 | | | | | Toyota Motor Credit Corp.,
0.660%, due 07/10/09 | | | 13,100,000 | | |
| | 2,000,000 | | | | | Tulip Funding Corp., 0.260%,
due 07/14/09 | | | 1,999,798 | | |
| | 12,000,000 | | | | | Tulip Funding Corp., 0.270%,
due 07/10/09 | | | 11,999,100 | | |
| | 28,000,000 | | | | | Tulip Funding Corp., 0.280%,
due 07/31/09 | | | 27,993,232 | | |
| | 19,000,000 | | | | | Variable Funding Capital,
0.570%, due 08/25/09 | | | 18,983,164 | | |
| | 25,000,000 | | | | | Variable Funding Capital,
0.960%, due 10/15/09 | | | 24,928,597 | | |
| | 12,000,000 | | | | | Variable Funding Capital,
1.120%, due 08/10/09 | | | 11,984,667 | | |
Principal
Amount | | | | | | Value | |
| $ | 14,000,000 | | | @@,# | | Westpac Banking Corp.,
0.560%, due 07/03/09 | | $ | 14,000,000 | | |
| | 9,000,000 | | | | | Westpac Banking Corp.,
0.570%, due 09/14/09 | | | 8,989,125 | | |
| | 10,000,000 | | | | | Windmill Funding Corp.,
0.270%, due 07/31/09 | | | 9,997,667 | | |
| | 8,000,000 | | | | | Yorktown Capital, LLC,
0.370%, due 09/21/09 | | | 7,992,893 | | |
| | 1,000,000 | | | | | Yorktown Capital, LLC,
0.390%, due 08/10/09 | | | 999,556 | | |
| | 8,500,000 | | | | | Yorktown Capital, LLC,
0.490%, due 08/03/09 | | | 8,496,104 | | |
| | 12,000,000 | | | | | Yorktown Capital, LLC,
0.490%, due 09/10/09 | | | 11,988,167 | | |
| | 15,000,000 | | | | | Yorktown Capital, LLC,
0.500%, due 10/09/09 | | | 14,979,167 | | |
12,000,000 Yorktown Capital, LLC,
0.500%, due 10/16/09 | | | 11,982,167 | | |
Total Commercial Paper
(Cost $939,986,983) | | | 939,986,983 | | |
| CORPORATE BONDS/NOTES: 7.0% | | | |
| | 10,000,000 | | | | | American Honda Finance,
0.200%, due 07/14/09 | | | 9,999,206 | | |
| | 7,500,000 | | | | | American Honda Finance,
0.470%, due 09/16/09 | | | 7,492,300 | | |
| | 23,000,000 | | | @@,# | | Australia & New Zealand
Banking Group Ltd.,
0.890%, due 09/02/09 | | | 23,000,000 | | |
| | 11,000,000 | | | | | BNP Paribas, 0.250%,
due 07/29/09 | | | 11,000,000 | | |
| | 14,000,000 | | | @@ | | BNP Paribas, 1.150%,
due 08/13/09 | | | 14,000,000 | | |
| | 18,000,000 | | | | | Rabobank USA Financial Corp.,
0.070%, due 07/02/09 | | | 17,999,930 | | |
| | 3,300,000 | | | | | Rabobank USA Financial Corp.,
0.150%, due 07/13/09 | | | 3,299,825 | | |
25,000,000 US Bank NA, 0.760%,
due 08/24/09 | | | 25,000,000 | | |
Total Corporate Bonds/Notes
(Cost $111,791,261) | | | 111,791,261 | | |
| U.S. GOVERNMENT AGENCY OBLIGATIONS: 15.6% | | | |
| | 113,775,000 | | | | | Federal Home Loan Bank,
0.700%, due 12/14/09 | | | 113,407,760 | | |
| | 4,000,000 | | | | | Federal Home Loan Bank,
0.720%, due 08/07/09 | | | 4,008,028 | | |
| | 23,000,000 | | | | | Federal Home Loan Bank,
0.800%, due 11/18/09 | | | 22,928,444 | | |
| | 3,000,000 | | | | | Federal Home Loan
Mortgage Corporation,
0.560%, due 08/10/09 | | | 2,998,100 | | |
| | 25,000,000 | | | L | | Federal Home Loan
Mortgage Corporation,
0.710%, due 07/12/10 | | | 25,878,685 | | |
| | 5,500,000 | | | | | Federal Home Loan
Mortgage Corporation,
0.860%, due 01/05/10 | | | 5,475,299 | | |
| | 3,750,000 | | | | | Federal Home Loan
Mortgage Corporation,
0.880%, due 02/09/10 | | | 3,841,179 | | |
| | 48,222,000 | | | | | Federal National Mortgage
Association, 0.620%,
due 12/01/09 | | | 48,093,827 | | |
See Accompanying Notes to Financial Statements
87
PORTFOLIO OF INVESTMENTS
ING MONEY MARKET PORTFOLIO(1) AS OF JUNE 30, 2009 (UNAUDITED) (CONTINUED)
Principal
Amount | | | | | | Value | |
| U.S. GOVERNMENT AGENCY OBLIGATIONS (continued) | |
| $ | 3,500,000 | | | | | Federal National Mortgage
Association, 0.690%,
due 07/12/10 | | $3,583,004 | |
| | 17,000,000 | | | | | Federal National Mortgage
Association, 1.330%,
due 12/15/09 | | | | | 17,255,097 | | |
| | | | Total U.S. Government
Agency Obligations
(Cost $247,469,423) | | | | | 247,469,423 | | |
| REPURCHASE AGREEMENT: 10.2% | |
| | 105,412,000 | | | Goldman Sachs Repurchase
Agreement dated 06/30/09,
0.040%, due 07/01/09,
$296,310,138 to be received
upon repurchase
(Collateralized by $105,412,117
U.S. Treasury, Discount Notes,
Market Value $108,574,366,
due 05/15/26-02/15/36) | | | 105,412,000 | | |
56,000,000Morgan Stanley Repurchase
Agreement dated 06/30/09,
0.030%, due 07/01/09,
$54,285,000 to be received
upon repurchase
(Collateralized by $56,000,047
Federal Home Loan Mortgage
Corporation, 1.450%-6.875%,
Market Value plus accrued
interest $58,151,234,
due 05/28/10-03/27/19) | | | 56,000,000 | | |
Total Repurchase Agreement
(Cost $161,412,000) | | | 161,412,000 | | |
| SECURITIES LENDING COLLATERALcc: 0.1% | | | |
1,077,010Bank of New York Mellon Corp.
Institutional Cash Reserves | | | 927,609 | | |
Total Securities Lending Collateral
(Cost $1,077,010) | | | 927,609 | | |
Total Investments in
Securities
(Cost $1,502,737,351)* | | | 94.9 | % | | $ | 1,502,587,950 | | |
Other Assets and
Liabilities - Net | | | 5.1 | | | | 80,682,988 | | |
| Net Assets | | | 100.0 | % | | $ | 1,583,270,938 | | |
(1) All securities with a maturity date of greater than 13 months have either a variable rate, a demand feature, prerefunded, optional or mandatory put resulting in a maturity of one year or less. Rate shown reflects current rate.
@@ Foreign Issuer
# Securities with purchases pursuant to Rule144A or section 4(2), under the Securities Act of 1933 and may not be resold subject to that rule except to qualified institutional buyers. Unless otherwise noted, these securities have been determined to be liquid under the guidelines established by the Funds' Board of Directors/Trustees.
cc Securities purchased with cash collateral for securities loaned.
L Loaned security, a portion or all of the security is on loan at June 30, 2009.
* Cost for federal income tax purposes is the same as for
financial statement purposes.
Net unrealized depreciation consists of:
| Gross Unrealized Appreciation | | $ | — | | |
| Gross Unrealized Depreciation | | | (149,401 | ) | |
| Net Unrealized Depreciation | | $ | (149,401 | ) | |
| Fair Value Measurements* | |
The following is a summary of the inputs used as of June 30, 2009 in determining the Portfolio's investments at fair value for purposes of SFAS 157:
| | | Quoted Prices
in Active
Markets
for Identical
Investments
(Level 1) | | Significant
Other
Observable
Inputs
(Level 2) | | Significant
Unobservable
Inputs
(Level 3) | |
Short-Term
Investments | | $ | — | | | $ | 1,502,587,950 | | | $ | — | | |
| Total | | $ | — | | | $ | 1,502,587,950 | | | $ | — | | |
Other Financial
Instruments** | | | — | | | | — | | | | — | | |
| Total | | $ | — | | | $ | — | | | $ | — | | |
"Fair value" for purposes of SFAS 157 is different from "fair value" as used in the 1940 Act. The former generally implies market value, and can include market quotations as a source of value, and the latter refers to determinations of value in absence of available market quotations.
| Money market securities are valued using the amortized cost method, in accordance with rules under the 1940 Act. Generally, amortized cost approximates the market value of a security, but since the value is not obtained from a quoted price in an active market, such securities are reflected as Level 2. | |
* See NOTE 2, "Significant Accounting Policies" in the Notes to Financial Statements for additional information.
** Other financial instruments may include open forward foreign currency contracts, futures, swaps, and written options. Forward foreign currency contracts and futures are reported at their unrealized gain/loss at period end. Swaps and written options are reported at their market value at period end.
See Accompanying Notes to Financial Statements
88
ING BLACKROCK SCIENCE AND PORTFOLIO OF INVESTMENTS
TECHNOLOGY OPPORTUNITIES PORTFOLIO AS OF JUNE 30, 2009 (UNAUDITED)
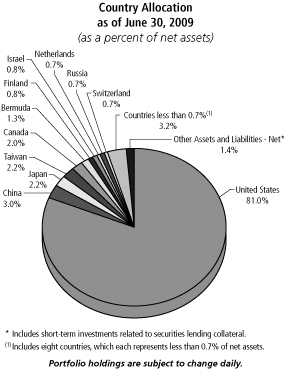
| Shares | | | | | | Value | |
| COMMON STOCK: 98.6% | | | |
| | | | | Bermuda: 1.3% | |
| | 234,900 | | | @ | | Marvell Technology Group Ltd. | | $ | 2,734,236 | | |
| | | | 2,734,236 | | |
| | | | | Canada: 2.0% | |
| | 96,800 | | | @ | | Celestica, Inc. | | | 660,176 | | |
| | 33,400 | | | @,L | | Open Text Corp. | | | 1,216,428 | | |
| | 35,500 | | | @ | | Research In Motion Ltd. | | | 2,522,275 | | |
| | | | 4,398,879 | | |
| | | | | China: 3.0% | |
| | 38,100 | | | @ | | AsiaInfo Holdings, Inc. | | | 655,701 | | |
| | 2,800 | | | @ | | Baidu.com ADR | | | 843,052 | | |
| | 20,200 | | | @ | | Changyou.com Ltd. ADR | | | 777,094 | | |
| | 23,000 | | | @ | | Longtop Financial Technologies
Ltd. ADR | | | 564,880 | | |
| | 27,400 | | | @ | | Netease.com ADR | | | 963,932 | | |
| | 37,900 | | | @,L | | Perfect World Co., Ltd. ADR | | | 1,083,940 | | |
| | 12,500 | | | @,L | | Shanda Interactive
Entertainment Ltd. ADR | | | 653,625 | | |
| | 31,000 | | | @ | | Sina Corp. | | | 913,880 | | |
| | | | 6,456,104 | | |
| | | | | Finland: 0.8% | |
| | 114,200 | | | L | | Nokia OYJ ADR | | | 1,665,036 | | |
| | | | 1,665,036 | | |
| | | | | Germany: 0.5% | |
| | | | | | 26,800 | | | SAP AG ADR | | | 1,077,092 | | |
| | | | 1,077,092 | | |
| Shares | | | | | | Value | |
| | | | | Hong Kong: 0.5% | |
| | 191,500 | | | | | ASM Pacific Technology | | $ | 979,285 | | |
| | | | 979,285 | | |
| | | | | India: 0.1% | |
| | 15,900 | | | @ | | Bharti Airtel Ltd. | | | 265,790 | | |
| | | | 265,790 | | |
| | | | | Ireland: 0.2% | |
| | 12,900 | | | | | Covidien PLC | | | 482,976 | | |
| | | | 482,976 | | |
| | | | | Israel: 0.8% | |
| | 73,300 | | | @ | | Check Point Software
Technologies | | | 1,720,351 | | |
| | | | 1,720,351 | | |
| | | | | Japan: 2.2% | |
| | 33,200 | | | | | Canon, Inc. | | | 1,084,445 | | |
| | 19,700 | | | L | | Disco Corp. | | | 834,538 | | |
| | 90,700 | | | | | Konica Minolta Holdings, Inc. | | | 947,674 | | |
| | 19,200 | | | | | Nidec Corp. | | | 1,168,692 | | |
| | 2,300 | | | | | Nintendo Co., Ltd. | | | 636,536 | | |
| | | | 4,671,885 | | |
| | | | | Luxembourg: 0.5% | |
| | 19,300 | | | @,L | | Millicom International
Cellular SA | | | 1,085,818 | | |
| | | | 1,085,818 | | |
| | | | | Netherlands: 0.7% | |
| | 73,200 | | | | | ASML Holding NV | | | 1,584,780 | | |
| | | | 1,584,780 | | |
| | | | | Portugal: 0.5% | |
| | 117,600 | | | | | Portugal Telecom SGPS SA | | | 1,153,554 | | |
| | | | 1,153,554 | | |
| | | | | Russia: 0.7% | |
| | 123,600 | | | | | Vimpel-Communications
OAO ADR | | | 1,454,772 | | |
| | | | 1,454,772 | | |
| | | | | South Korea: 0.5% | |
| | 2,400 | | | | | Samsung Electronics Co., Ltd. | | | 1,109,675 | | |
| | | | 1,109,675 | | |
| | | | | Switzerland: 0.7% | |
| | 13,600 | | | | | Alcon, Inc. | | | 1,579,232 | | |
| | | | 1,579,232 | | |
| | | | | Taiwan: 2.2% | |
| | 956,400 | | | | | Advanced Semiconductor
Engineering, Inc. | | | 553,138 | | |
| | 293,152 | | | | | Asustek Computer, Inc. | | | 378,967 | | |
| | 118,100 | | | L | | AU Optronics Corp. ADR | | | 1,143,208 | | |
| | 58,220 | | | | | High Tech Computer Corp. | | | 818,108 | | |
| | 128,300 | | | L | | Siliconware Precision
Industries Co. ADR | | | 795,460 | | |
| | 113,912 | | | | | Taiwan Semiconductor
Manufacturing Co., Ltd. ADR | | | 1,071,912 | | |
| | | | 4,760,793 | | |
See Accompanying Notes to Financial Statements
89
ING BLACKROCK SCIENCE AND PORTFOLIO OF INVESTMENTS
TECHNOLOGY OPPORTUNITIES PORTFOLIO AS OF JUNE 30, 2009 (UNAUDITED) (CONTINUED)
| Shares | | | | | | Value | |
| | | | | United Kingdom: 0.4% | |
| | 458,600 | | | | | ARM Holdings PLC | | $ | 905,032 | | |
| | | | 905,032 | | |
| | | | | United States: 81.0% | |
| | 97,300 | | | @ | | Adobe Systems, Inc. | | | 2,753,591 | | |
| | 64,600 | | | @ | | Agilent Technologies, Inc. | | | 1,312,026 | | |
| | 62,900 | | | @ | | Akamai Technologies, Inc. | | | 1,206,422 | | |
| | 81,200 | | | | | Altera Corp. | | | 1,321,936 | | |
| | 34,300 | | | @ | | American Tower Corp. | | | 1,081,479 | | |
| | 19,300 | | | @ | | Amgen, Inc. | | | 1,021,742 | | |
| | 52,800 | | | | | Amphenol Corp. | | | 1,670,592 | | |
| | 75,700 | | | | | Analog Devices, Inc. | | | 1,875,846 | | |
| | 29,400 | | | @ | | Anaren, Inc. | | | 519,792 | | |
| | 81,800 | | | @ | | Apple, Inc. | | | 11,650,774 | | |
| | 437,100 | | | | | Applied Materials, Inc. | | | 4,794,987 | | |
| | 34,400 | | | @ | | ArcSight, Inc. | | | 611,288 | | |
| | 124,800 | | | @ | | Ariba, Inc. | | | 1,228,032 | | |
| | 36,700 | | | @ | | Arrow Electronics, Inc. | | | 779,508 | | |
| | 44,600 | | | | | AT&T, Inc. | | | 1,107,864 | | |
| | 47,500 | | | @ | | Atheros Communications, Inc. | | | 913,900 | | |
| | 40,100 | | | @ | | ATMI, Inc. | | | 622,753 | | |
| | 49,800 | | | @ | | Autodesk, Inc. | | | 945,204 | | |
| | 47,400 | | | | | Automatic Data Processing, Inc. | | | 1,679,856 | | |
| | 63,100 | | | @ | | BMC Software, Inc. | | | 2,132,149 | | |
| | 118,500 | | | @ | | Boston Scientific Corp. | | | 1,201,590 | | |
| | 164,700 | | | @ | | Broadcom Corp. | | | 4,082,913 | | |
| | 190,100 | | | @ | | Brocade Communications
Systems, Inc. | | | 1,486,582 | | |
| | 87,800 | | | | | CA, Inc. | | | 1,530,354 | | |
| | 53,000 | | | @ | | Cavium Networks, Inc. | | | 890,930 | | |
| | 95,400 | | | @,L | | Ciena Corp. | | | 987,390 | | |
| | 292,400 | | | @ | | Cisco Systems, Inc. | | | 5,450,336 | | |
| | 81,200 | | | @ | | Citrix Systems, Inc. | | | 2,589,468 | | |
| | 113,400 | | | | | Corning, Inc. | | | 1,821,204 | | |
| | 54,400 | | | | | CVS Caremark Corp. | | | 1,733,728 | | |
| | 37,600 | | | @ | | Digital River, Inc. | | | 1,365,632 | | |
| | 9,900 | | | @ | | DigitalGlobe, Inc. | | | 190,080 | | |
| | 156,200 | | | @ | | eBay, Inc. | | | 2,675,706 | | |
| | 51,700 | | | @ | | Electronic Arts, Inc. | | | 1,122,924 | | |
| | 225,300 | | | @ | | EMC Corp. | | | 2,951,430 | | |
| | 42,000 | | | @ | | F5 Networks, Inc. | | | 1,452,780 | | |
| | 10,410 | | | @ | | Google, Inc. - Class A | | | 4,388,752 | | |
| | 141,700 | | | | | Hewlett-Packard Co. | | | 5,476,705 | | |
| | 340,500 | | | | | Intel Corp. | | | 5,635,275 | | |
| | 8,900 | | | @ | | IntercontinentalExchange, Inc. | | | 1,016,736 | | |
| | 75,000 | | | | | International Business
Machines Corp. | | | 7,831,500 | | |
| | 39,400 | | | @ | | Intuit, Inc. | | | 1,109,504 | | |
| | 98,600 | | | @ | | Juniper Networks, Inc. | | | 2,326,960 | | |
| | 92,800 | | | | | KLA-Tencor Corp. | | | 2,343,200 | | |
| | 85,800 | | | @ | | Lam Research Corp. | | | 2,230,800 | | |
| | 4,800 | | | @ | | LogMeIn, Inc. | | | 76,800 | | |
| | 30 | | | @ | | Macrovision Solutions Corp. | | | 654 | | |
| | 101,600 | | | @ | | McAfee, Inc. | | | 4,286,504 | | |
| | 67,600 | | | | | Medtronic, Inc. | | | 2,358,564 | | |
| | 192,900 | | | @ | | Micron Technology, Inc. | | | 976,074 | | |
| | 257,600 | | | | | Microsoft Corp. | | | 6,123,152 | | |
| | 204,900 | | | | | Motorola, Inc. | | | 1,358,487 | | |
| | 67,700 | | | @ | | NetApp, Inc. | | | 1,335,044 | | |
| | 57,800 | | | @ | | Netlogic Microsystems, Inc. | | | 2,107,388 | | |
| | 75,800 | | | @ | | Novellus Systems, Inc. | | | 1,265,860 | | |
| | 75,000 | | | @ | | Nvidia Corp. | | | 846,750 | | |
| | 272,000 | | | @ | | Oracle Corp. | | | 5,826,240 | | |
| Shares | | | | | | Value | |
| | 151,800 | | | @ | | PMC - Sierra, Inc. | | $ | 1,208,328 | | |
| | 55,000 | | | @ | | Polycom, Inc. | | | 1,114,850 | | |
| | 18,300 | | | @,L | | Priceline.com, Inc. | | | 2,041,365 | | |
| | 59,000 | | | @ | | Progress Software Corp. | | | 1,249,030 | | |
| | 43,800 | | | @ | | QLogic Corp. | | | 555,384 | | |
| | 184,380 | | | | | Qualcomm, Inc. | | | 8,333,977 | | |
| | 53,400 | | | @ | | Red Hat, Inc. | | | 1,074,942 | | |
| | 27,000 | | | @ | | Riverbed Technolgoy, Inc. | | | 626,130 | | |
| | 71,200 | | | @ | | Sandisk Corp. | | | 1,045,928 | | |
| | 126,400 | | | | | Seagate Technology, Inc. | | | 1,322,144 | | |
| | 27,300 | | | @,L | | Starent Networks Corp. | | | 666,393 | | |
| | 85,600 | | | @ | | Sybase, Inc. | | | 2,682,704 | | |
| | 185,900 | | | @ | | Symantec Corp. | | | 2,892,604 | | |
| | 50,500 | | | @ | | Synopsys, Inc. | | | 985,255 | | |
| | 142,400 | | | @ | | Tellabs, Inc. | | | 815,952 | | |
| | 33,100 | | | @ | | Teradata Corp. | | | 775,533 | | |
| | 152,200 | | | @ | | Teradyne, Inc. | | | 1,044,092 | | |
| | 204,100 | | | | | Texas Instruments, Inc. | | | 4,347,330 | | |
| | 93,800 | | | @ | | TTM Technologies, Inc. | | | 746,648 | | |
| | 115,600 | | | @ | | VeriSign, Inc. | | | 2,136,288 | | |
| | 37,000 | | | | | Verizon Communications, Inc. | | | 1,137,010 | | |
| | 35,900 | | | @ | | Vertex Pharmaceuticals, Inc. | | | 1,279,476 | | |
| | 94,600 | | | @ | | Vishay Intertechnology, Inc. | | | 642,334 | | |
| | 40,200 | | | @ | | Western Digital Corp. | | | 1,065,300 | | |
| | 52,800 | | | | | Western Union Co. | | | 865,920 | | |
| | 38,300 | | | | | Wyeth | | | 1,738,437 | | |
| | 53,900 | | | | | Xilinx, Inc. | | | 1,102,794 | | |
| | 209,700 | | | @ | | Yahoo!, Inc. | | | 3,283,902 | | |
| | | | 176,463,787 | | |
Total Common Stock
(Cost $220,134,510) | | | 214,549,077 | | |
Principal
Amount | | | | | | Value | |
| SHORT-TERM INVESTMENTS: 3.3% | | | |
| | | Securities Lending Collateralcc: 3.3% | |
| $ | 7,315,890 | | | Bank of New York Mellon Corp.
Institutional Cash Reserves | | $ | 7,236,530 | | |
Total Short-Term Investments
(Cost $7,315,890) | | | 7,236,530 | | |
Total Investments in
Securities
(Cost $227,450,400)* | | | 101.9 | % | | $ | 221,785,607 | | |
Other Assets and
Liabilities - Net | | | (1.9 | ) | | | (4,038,915 | ) | |
| Net Assets | | | 100.0 | % | | $ | 217,746,692 | | |
@ Non-income producing security
ADR American Depositary Receipt
cc Securities purchased with cash collateral for securities loaned.
L Loaned security, a portion or all of the security is on loan at June 30, 2009.
* Cost for federal income tax purposes is $234,278,124.
Net unrealized depreciation consists of:
| Gross Unrealized Appreciation | | $ | 11,185,345 | | |
| Gross Unrealized Depreciation | | | (23,677,862 | ) | |
| Net Unrealized Depreciation | | $ | (12,492,517 | ) | |
See Accompanying Notes to Financial Statements
90
ING BLACKROCK SCIENCE AND PORTFOLIO OF INVESTMENTS
TECHNOLOGY OPPORTUNITIES PORTFOLIO AS OF JUNE 30, 2009 (UNAUDITED) (CONTINUED)
| Industry | | Percentage of
Net Assets | |
| Biotechnology | | | 1.0 | % | |
| Commercial Services | | | 1.2 | | |
| Computers | | | 18.5 | | |
| Diversified Financial Services | | | 0.5 | | |
| Electronics | | | 3.7 | | |
| Hand/Machine Tools | | | 0.4 | | |
| Healthcare - Products | | | 2.6 | | |
| Internet | | | 14.2 | | |
| Miscellaneous Manufacturing | | | 0.4 | | |
| Office/Business Equipment | | | 0.5 | | |
| Pharmaceuticals | | | 0.8 | | |
| Retail | | | 0.8 | | |
| Semiconductors | | | 21.6 | | |
| Software | | | 16.7 | | |
| Telecommunications | | | 15.4 | | |
| Toys/Games/Hobbies | | | 0.3 | | |
| Short-Term Investments | | | 3.3 | | |
| Other Assets and Liabilities - Net | | | (1.9 | ) | |
| Net Assets | | | 100.0 | % | |
| Fair Value Measurements* | |
The following is a summary of the inputs used as of June 30, 2009 in determining the Portfolio's investments at fair value for purposes of SFAS 157:
| | | Quoted Prices
in Active
Markets
for Identical
Investments
(Level 1) | | Significant
Other
Observable
Inputs
(Level 2)+ | | Significant
Unobservable
Inputs
(Level 3) | |
| Common Stock | |
| Bermuda | | $ | 2,734,236 | | | $ | — | | | $ | — | | |
| Canada | | | 4,398,879 | | | | — | | | | — | | |
| China | | | 5,372,164 | | | | 1,083,940 | | | | — | | |
| Finland | | | 1,665,036 | | | | — | | | | — | | |
| Germany | | | 1,077,092 | | | | — | | | | — | | |
| Hong Kong | | | — | | | | 979,285 | | | | — | | |
| India | | | — | | | | 265,790 | | | | — | | |
| Ireland | | | 482,976 | | | | — | | | | — | | |
| Israel | | | 1,720,351 | | | | — | | | | — | | |
| Japan | | | — | | | | 4,671,885 | | | | — | | |
| Luxembourg | | | 1,085,818 | | | | — | | | | — | | |
| Netherlands | | | 1,584,780 | | | | — | | | | — | | |
| Portugal | | | — | | | | 1,153,554 | | | | — | | |
| Russia | | | 1,454,772 | | | | — | | | | — | | |
| South Korea | | | — | | | | 1,109,675 | | | | — | | |
| Switzerland | | | 1,579,232 | | | | — | | | | — | | |
| Taiwan | | | 3,010,580 | | | | 1,750,213 | | | | — | | |
| United Kingdom | | | — | | | | 905,032 | | | | — | | |
| United States | | | 176,463,787 | | | | — | | | | — | | |
| Total Common Stock | | $ | 202,629,703 | | | $ | 11,919,374 | | | $ | — | | |
Short-Term
Investments | | | — | | | | 7,236,530 | | | | — | | |
| Total | | $ | 202,629,703 | | | $ | 19,155,904 | | | $ | — | | |
Other Financial
Instruments** | | | — | | | | (67,276 | ) | | | — | | |
| Total | | $ | — | | | $ | (67,276 | ) | | $ | — | | |
"Fair value" for purposes of SFAS 157 is different from "fair value" as used in the 1940 Act. The former generally implies market value,
and can include market quotations as a source of value, and the latter refers to determinations of value in absence of available market quotations.
* See NOTE 2, "Significant Accounting Policies" in the Notes to Financial Statements for additional information.
** Other financial instruments may include open forward foreign currency contracts, futures, swaps, and written options. Forward foreign currency contracts and futures are reported at their unrealized gain/loss at period end. Swaps and written options are reported at their market value at period end.
+ The earlier close of the foreign markets gives rise to the possibility that significant events, including broad market moves, may have occurred in the interim and may materially affect the value of those securities. To account for this, the Portfolio may frequently value many of its foreign equity securities using fair value prices based on third party vendor modeling tools to the extent available. Accordingly, a significant portion of the Portfolio's investments are categorized as Level 2 investments.
At June 30, 2009 the following forward foreign currency contracts were outstanding for the ING BlackRock Science and Technology Opportunities Portfolio:
| Currency | | Buy/Sell | | Settlement
Date | | In
Exchange
For | | Value | | Unrealized
Appreciation/
(Depreciation) | |
| Hong Kong | | | | | | | | | |
| |
| Sar Dollar | | | | | | | | | |
| |
| HKD | 2,855,000 | | | BUY | | 8/26/09 | | | 368,531 | | | | 368,568 | | | $ | 37 | | |
Hong Kong
Sar Dollar
HKD 1,796,000 | | BUY | | 8/26/09 | | | 231,845 | | | | 231,856 | | | | 11 | | |
| | | $ | 48 | | |
EU Euro
| |
| EUR | 576,000 | | | SELL | | 8/26/09 | | | 809,691 | | | | 808,008 | | | $ | 1,683 | | |
British Pound
GBP 395,000 | | SELL | | 8/26/09 | | | 638,948 | | | | 649,813 | | | | (10,865 | ) | |
Hong Kong
Sar Dollar
HKD 5,183,000 | | SELL | | 8/26/09 | | | 669,166 | | | | 669,102 | | | | 64 | | |
Japanese Yen
JPY
305,799,000 | | SELL | | 8/26/09 | | | 3,117,045 | | | | 3,176,431 | | | | (59,386 | ) | |
Japanese Yen
JPY
23,369,000 | | SELL | | 8/26/09 | | | 243,921 | | | | 242,741 | | | | 1,180 | | |
| | | $ | (67,324 | ) | |
For the six months ended June 30, 2009, net realized gain (loss) on forward foreign currency contracts and the net change in unrealized gain (loss) on forward foreign currency contracts can be found on the Portfolio's Statement of Operations. For additional information on the reason(s) why the Portfolio may enter into forward foreign currency contracts and the risks associated with these contracts, please refer to NOTE 2 in the accompanying Notes to Financial Statements.
See Accompanying Notes to Financial Statements
91
Investment Adviser
ING Investments, LLC
7337 East Doubletree Ranch Road
Scottsdale, Arizona 85258
Administrator
ING Funds Services, LLC
7337 East Doubletree Ranch Road
Scottsdale, Arizona 85258
Distributor
ING Funds Distributor, LLC
7337 East Doubletree Ranch Road
Scottsdale, Arizona 85258
Transfer Agent
PNC Global Investment Servicing (U.S.) Inc.
301 Bellevue Parkway
Wilmington, Delaware 19809
Custodian
The Bank of New York Mellon
One Wall Street
New York, New York 10286
Legal Counsel
Goodwin Procter LLP
Exchange Place
53 State Street
Boston, Massachusetts 02109
Before investing, carefully consider the investment objectives, risks, charges and expenses of the variable annuity contract and the underlying variable investment options. This and other information is contained in the prospectus for the variable annuity contract and the underlying variable investment options. Obtain these prospectuses from your agent/registered representative and read them carefully before investing.
VPSAR-ACAPAPALL (0609-082809)

Not required for semi-annual filing.
ITEM 3. | AUDIT COMMITTEE FINANCIAL EXPERT. |
Not required for semi-annual filing.
ITEM 4. | PRINCIPAL ACCOUNTANT FEES AND SERVICES. |
Not required for semi-annual filing.
ITEM 5. | AUDIT COMMITTEE OF LISTED REGISTRANTS. |
Not required for semi-annual filing.
ITEM 6. | SCHEDULE OF INVESTMENTS. |
Schedule is included as part of the report to shareholders filed under Item 1 of this Form.
ITEM 7. | DISCLOSURE OF PROXY VOTING POLICIES AND PROCEDURES FOR CLOSED-END MANAGEMENT INVESTMENT COMPANIES. |
Not applicable.
ITEM 8. | PORTFOLIO MANAGERS OF CLOSED-END MANAGEMENT INVESTMENT COMPANIES. |
Not applicable.
ITEM 9. | PURCHASES OF EQUITY SECURITIES BY CLOSED-END MANAGEMENT INVESTMENT COMPANY AND AFFILIATED PURCHASERS. |
Not applicable.
ITEM 10. | SUBMISSION OF MATTERS TO A VOTE OF SECURITY HOLDERS. |
The Board has a Nominating Committee for the purpose of considering and presenting to the Board candidates it proposes for nomination to fill Independent Trustee vacancies on the Board. The Committee currently consists of all Independent Trustees of the Board (6 individuals). The Nominating Committee operates pursuant to a Charter approved by the Board. The primary purpose of the Nominating Committee is to consider and present to the Board the candidates it proposes for nomination to fill vacancies on the Board. In evaluating candidates, the Nominating Committee may consider a variety of factors, but it has not at this time set any specific minimum qualifications that must be met. Specific qualifications of candidates for Board membership will be based on the needs of the Board at the time of nomination.
The Nominating Committee is willing to consider nominations received from shareholders and shall assess shareholder nominees in the same manner as it reviews its own nominees. A shareholder nominee for director should be submitted in writing to the Fund’s Secretary. Any such shareholder nomination should include at a minimum the following information as to each individual proposed for nomination as trustee: such individual’s written consent to be named in the proxy statement as a nominee (if nominated) and to serve as a trustee (if elected), and all information relating to such individual that is required to be disclosed in the solicitation of proxies for election of trustees, or is otherwise required, in each case under applicable federal securities laws, rules and regulations.
The Secretary shall submit all nominations received in a timely manner to the Nominating Committee. To be timely, any such submission must be delivered to the Fund’s Secretary not earlier than the 90th day prior to such meeting and not later than the close of business on the later of the 60th day prior to such meeting or the 10th day following the day on which public announcement of the date of the meeting is first made, by either disclosure in a press release or in a document publicly filed by the Fund with the Securities and Exchange Commission.
ITEM 11. | CONTROLS AND PROCEDURES. |
(a) | | Based on our evaluation conducted within 90 days of the filing date, hereof, the design and operation of the registrant’s disclosure controls and procedures are effective to ensure that material information relating to the registrant is made known to the certifying officers by others within the appropriate entities, particularly during the period in which Forms N-CSR are being prepared, and the registrant’s disclosure controls and procedures allow timely preparation and review of the information for the registrant’s Form N-CSR and the officer certifications of such Form N-CSR. |
| | |
(b) | | There were no significant changes in the registrant’s internal controls that occurred during the second fiscal quarter of the period covered by this report that has materially affected, or is reasonably likely to materially affect, the registrant’s internal control over financial reporting. |
(a)(1) | | The Code of Ethics is not required for the semi-annual filing. |
| | |
(a)(2) | | A separate certification for each principal executive officer and principal financial officer of the registrant as required by Rule 30a-2 under the Act (17 CFR 270.30a-2) is attached hereto as EX-99.CERT. |
| | |
(a)(3) | | Not required for semi-annual filing. |
| | |
(b) | | The officer certifications required by Section 906 of the Sarbanes-Oxley Act of 2002 are attached hereto as EX-99.906CERT |
SIGNATURES
Pursuant to the requirements of the Securities Exchange Act of 1934 and the Investment Company Act of 1940, the registrant has duly caused this report to be signed on its behalf by the undersigned, thereunto duly authorized.
(Registrant): ING Variable Funds |
| |
| |
By | /s/ | Shaun P. Mathews | |
| | Shaun P. Mathews | |
| | President and Chief Executive Officer |
|
Date: | September 3, 2009 | |
|
Pursuant to the requirements of the Securities Exchange Act of 1934 and the Investment Company Act of 1940, this report has been signed below by the following persons on behalf of the registrant and in the capacities and on the dates indicated. |
| |
| |
By | /s/ | Shaun P. Mathews | |
| | Shaun P. Mathews | |
| | President and Chief Executive Officer |
| |
Date: | September 3, 2009 | |
| |
| |
By | /s/ | Todd Modic | |
| | Todd Modic | |
| | Senior Vice President and Chief Financial Officer |
| |
| |
Date: | September 3, 2009 | |
| | | | | | | |