UNITED STATES SECURITIES AND EXCHANGE COMMISSION
Washington, D.C. 20549
FORM N-CSR
CERTIFIED SHAREHOLDER REPORT OF REGISTERED MANAGEMENT
INVESTMENT COMPANIES
| Investment Company Act file number: | | 811-00750 |
| | |
| Exact name of registrant as specified in charter: | | Delaware Group® Equity Funds II |
| | |
| Address of principal executive offices: | | 2005 Market Street |
| | Philadelphia, PA 19103 |
| | |
| Name and address of agent for service: | | David F. Connor, Esq. |
| | 2005 Market Street |
| | | Philadelphia, PA 19103 |
| | |
| Registrant’s telephone number, including area code: | | (800) 523-1918 |
| | |
| Date of fiscal year end: | | November 30 |
| | |
| Date of reporting period: | | November 30, 2014 |
Item 1. Reports to Stockholders

Annual report
U.S. value equity mutual fund
Delaware Value® Fund
November 30, 2014
Carefully consider the Fund’s investment objectives, risk factors, charges, and expenses before investing. This and other information can be found in the Fund’s prospectus and its summary prospectus, which may be obtained by visiting delawareinvestments.com or calling 800 523-1918. Investors should read the prospectus and the summary prospectus carefully before investing.
You can obtain shareholder reports and prospectuses online instead of in the mail.
Visit delawareinvestments.com/edelivery.
Experience Delaware Investments
Delaware Investments is committed to the pursuit of consistently superior asset management and unparalleled client service. We believe in our investment processes, which seek to deliver consistent results, and in convenient services that help add value for our clients.
If you are interested in learning more about creating an investment plan, contact your financial advisor.
You can learn more about Delaware Investments or obtain a prospectus for Delaware Value® Fund at delawareinvestments.com.
Manage your investments online
| • | | 24-hour access to your account information |
| • | | Check your account balance and recent transactions |
| • | | Request statements or literature |
| • | | Make purchases and redemptions |
Delaware Management Holdings, Inc. and its subsidiaries (collectively known by the marketing name of Delaware Investments) are wholly owned subsidiaries of Macquarie Group Limited, a global provider of banking, financial, advisory, investment, and funds management services.
Investments in Delaware Value Fund are not and will not be deposits with or liabilities of Macquarie Bank Limited ABN 46 008 583 542 and its holding companies, including their subsidiaries or related companies (Macquarie Group), and are subject to investment risk, including possible delays in repayment and loss of income and capital invested. No Macquarie Group company guarantees or will guarantee the performance of the Fund, the repayment of capital from the Fund, or any particular rate of return.
Table of contents
Unless otherwise noted, views expressed herein are current as of Nov. 30, 2014, and subject to change for events occurring after such date.
Funds are not FDIC insured and are not guaranteed. It is possible to lose the principal amount invested.
Mutual fund advisory services provided by Delaware Management Company, a series of Delaware Management Business Trust, which is a registered investment advisor. Delaware Investments, a member of Macquarie Group, refers to Delaware Management Holdings, Inc. and its subsidiaries, including the Fund’s distributor, Delaware Distributors, L.P. Macquarie Group refers to Macquarie Group Limited and its subsidiaries and affiliates worldwide.
© 2015 Delaware Management Holdings, Inc.
All third-party marks cited are the property of their respective owners.
| | |
| Portfolio management review | | |
| Delaware Value® Fund | | December 9, 2014 |
| | | | | | | | |
Performance preview (for the year ended November 30, 2014) | | | | | | | | |
Delaware Value Fund (Class A shares) | | | 1-year return | | | | +14.92% | |
Russell 1000 ® Value Index (benchmark) | | | 1-year return | | | | +15.62% | |
Past performance does not guarantee future results.
For complete, annualized performance for Delaware Value Fund, please see the table on page 4. The performance of Class A shares excludes the applicable sales charge and reflects the reinvestment of all distributions.
For a description of the index, please see page 6. Index performance returns do not reflect any management fees, transaction costs, or expenses. Indices are unmanaged and one cannot invest directly in an index.
Overall, the fiscal year ended Nov. 30, 2014 was a relatively strong period for stocks. Large-cap stocks performed particularly well as corporate earnings growth remained positive, though it was somewhat slower than in the years immediately following the global financial crisis.
The upward trend of the markets and the economy was interrupted several times by short-lived periods of volatility. The first quarter of 2014 was particularly troublesome as the economic recovery briefly reversed course, suffering the first decline in the gross domestic product in three years. China’s slowing economy, the risk of deflation in the euro zone, the growing conflict between Russia and Ukraine, and continued tension throughout the Middle East all took their toll. Most of all, however, the recovery stumbled as severe winter weather slowed economic activity across much of the country.
As spring approached, the economy rebounded with auto sales, consumer confidence, employment, housing data, and manufacturing all posting strong numbers. The pace of new job growth hit a 15-year high in 2014. The national jobless rate declined throughout the year, dropping to 5.8% as of the end of November, the lowest level since July 2008 and down from 7.2% a year earlier. Over the course of the fiscal year, not only did U.S. employment grow at the fastest pace since 2006; the trend appears to be
continuing upward. (Source: U.S. Commerce Department, Bureau of Labor Statistics.)
The markets experienced additional periods of volatility in April, August, and most notably October when, once again, a series of events and concerns combined to give investors pause. The run-up to a vote on Scottish independence, the controversy over U.S. companies relocating overseas to avoid taxes, the threat of Ebola, and concern that a market correction was imminent fueled a sharp, but brief, dip in the market. As the fiscal year drew to a close, however, both the markets and the economy resumed their slow, but upward movement.
Also of note during the fiscal year, the U.S. Federal Reserve made good on its intent to end the quantitative easing (QE) program that had buoyed the economy and stocks since late 2012. Despite dire warnings from many economists that ending the bond-buying program would lead to sharp market declines and spikes in interest rates and inflation, the Fed began reducing its purchase of U.S. Treasurys in December 2013 and made its final buy in October 2014. Throughout the taper, inflation was fairly steady, running about 2% per year and short-term interest rates remained near zero. With QE behind it, the Fed turned its attention to interest rates, saying it was prepared to begin raising rates as early as the first half of 2015 if growth rates accelerate.
1
Portfolio management review
Delaware Value® Fund
Fund performance
For the fiscal year ended Nov. 30, 2014, Delaware Value Fund (Class A shares) returned +14.92% at net asset value and +8.30% at maximum offer price (both figures reflect all distributions reinvested). For the same period, the Russell 1000 Value Index returned +15.62%. Complete annualized performance for Delaware Value Fund is shown in the table on page 4.
In this market environment, the Fund performed relatively well in absolute terms. However, security selection in the healthcare sector was a source of weakness. In this group, the Fund’s position in drug maker Pfizer gained just 2% during the fiscal year. Various factors affected Pfizer’s shares, including a series of revenue declines and a failed effort to acquire U.K.-based competitor AstraZeneca. Despite the underperformance, we continue to hold Pfizer in the Fund and maintain a positive long-term outlook for the company.
The telecommunication services sector posed another challenge. Here, AT&T was the weakest individual performer, advancing 6%. The company’s new discounted pricing plan has succeeded in reducing customer turnover, but has also put pressure on revenues. Nevertheless, we still consider AT&T to be an undervalued stock with a strong balance sheet, and believe it may be well positioned to benefit from various growth opportunities.
Within the struggling energy group, Occidental Petroleum was another detractor. The company’s shares declined approximately -14% during the fiscal year, due in part to more limited exposure to North American shale drilling than some of the company’s competitors. We continue to hold the stock because we believe it is undervalued and because the company has what we view as attractive assets in California and Texas.
On the positive side, stock selection was strong in the industrials sector. Two defense contractors, Northrup Grumman and Raytheon, were strong
performers for the Fund, gaining 28% and 23%, respectively, during the fiscal year. Both companies have been successful in cutting costs, managing through an environment of declining defense spending, and taking such shareholder-friendly steps as buying back shares and increasing dividends.
The information technology sector also added value, especially a position in Broadcom, which makes semiconductors for communications applications. Broadcom’s shares rose sharply in June after the company announced plans to abandon its unprofitable cellular baseband business. The move boosted the company’s earnings and cash flow, setting the stage for a 64% stock-price increase during the fiscal year. We continue to view Broadcom as a high-quality company with a strong balance sheet and favorable competitive position in many growing business segments.
We made relatively few changes to the Fund during the fiscal year. In financials, we sold a longtime stake in property and casualty insurance company Travelers in March 2014, after the stock reached our price target. We used the proceeds to establish a new position in financial holding company BB&T. Meanwhile, within technology, we sold communications equipment maker Motorola Solutions, which similarly reached our target price. As of the end of the fiscal year, we were evaluating suitable alternatives for a replacement position.
At fiscal year end, the Fund was positioned somewhat defensively, with a significant overweighting in the healthcare sector and modest overweightings in consumer staples and telecommunication services. We believe a generally defensive portfolio stance is prudent, given that the stock market now strikes us as fully valued. The one exception to the Fund’s defensive allocation is a relative overweighting in the energy sector. In this group, we are taking a long-term view and see the potential for a reversal in the
2
trends that have pushed down commodity prices. We are watching this segment of the market closely, however, and will not hesitate to reevaluate the Fund’s positioning if recent pricing trends appear longer-lasting.
Regardless of market conditions, our approach remains consistent. We will continue to look for good businesses that may be available for purchase at what we view as attractive valuations arising from temporary fundamental challenges and negative investor sentiment. We will continue to adhere to our process of searching for favorable relative values in the marketplace.
3
| | |
| Performance summary | | |
| Delaware Value® Fund | | November 30, 2014 |
The performance data quoted represent past performance; past performance does not guarantee future results. Investment return and principal value will fluctuate so your shares, when redeemed, may be worth more or less than their original cost. Please obtain the performance data current for the most recent month end by calling 800 523-1918 or visiting our website at delawareinvestments.com/performance. Current performance may be lower or higher than the performance data quoted.
| | | | | | | | | | | | | | | | |
| Fund and benchmark performance1,2 | | Average annual total returns through November 30, 2014 | |
| | | | |
| | | 1 year | | | 5 years | | | 10 years | | | Lifetime | |
Class A (Est. Sept. 15, 1998) | | | | | | | | | | | | | | | | |
Excluding sales charge | | | +14.92% | | | | +17.06% | | | | +8.45% | | | | +7.71% | |
Including sales charge | | | +8.30% | | | | +15.67% | | | | +7.80% | | | | +7.31% | |
Class C (Est. May 1, 2002) | | | | | | | | | | | | | | | | |
Excluding sales charge | | | +14.10% | | | | +16.18% | | | | +7.63% | | | | +6.93% | |
Including sales charge | | | +13.10% | | | | +16.18% | | | | +7.63% | | | | +6.93% | |
Class R (Est. Sept. 1, 2005) | | | | | | | | | | | | | | | | |
Excluding sales charge | | | +14.63% | | | | +16.75% | | | | n/a | | | | +7.89% | |
Including sales charge | | | +14.63% | | | | +16.75% | | | | n/a | | | | +7.89% | |
Institutional Class (Est. Sept. 15, 1998) | | | | | | | | | | | | | | | | |
Excluding sales charge | | | +15.26% | | | | +17.36% | | | | +8.72% | | | | +7.92% | |
Including sales charge | | | +15.26% | | | | +17.36% | | | | +8.72% | | | | +7.92% | |
Russell 1000 Value Index* | | | +15.62% | | | | +15.69% | | | | +7.59% | | | | +7.90% | |
*Benchmark lifetime returns are for Class A share comparison only and are of the month end prior to the Class A inception date.
1Returns reflect the reinvestment of all distributions and are presented both with and without the applicable sales charges described below. Returns do not reflect the deduction of taxes the shareholder would pay on Fund distributions or redemptions of Fund shares.
Expense limitations were in effect for certain classes during some or all of the periods shown in the “Fund and benchmark performance” table. Expenses for each class are listed on the “Fund expense ratios” table on page 5. Performance would have been lower had expense limitations not been in effect.
Class A shares are sold with a maximum front-end sales charge of 5.75%, and have an annual distribution and service fee of 0.25% of average daily net assets. The Board has adopted a formula
for calculating 12b-1 plan fees for the Fund’s Class A shares. The Fund’s Class A shares are currently subject to a blended 12b-1 fee equal to the sum of: (i) 0.10% of average daily net assets representing shares acquired prior to May 2, 1994, and (ii) 0.25% of average daily net assets representing shares acquired on or after May 2, 1994. All Class A shares currently bear 12b-1 fees at the same rate, the blended rate, currently 0.24% of average daily net assets, based on the formula described above. This method of calculating Class A 12b-1 fees may be discontinued at the sole discretion of the Board. Performance for Class A shares, excluding sales charges, assumes that no front-end sales charge applied.
4
Class C shares are sold with a contingent deferred sales charge of 1.00% if redeemed during the first 12 months. They are also subject to an annual distribution and service fee of 1.00% of average daily net assets. Performance for Class C shares, excluding sales charges, assumes either that contingent deferred sales charges did not apply or that the investment was not redeemed.
Class R shares are available only for certain retirement plan products. They are sold without a sales charge and have an annual distribution and service fee of 0.50% of average daily net assets.
Institutional Class shares are available without sales or asset-based distribution charges only to certain eligible institutional accounts.
The “Fund and benchmark performance” table does not reflect the deduction of taxes the shareholder would pay on Fund distributions or redemptions of Fund shares.
Holding a relatively concentrated portfolio of a limited number of securities may increase risk because each investment has a greater effect on the Fund’s overall performance than would be the case for a more diversified fund.
2 Fund’s expense ratios, as described in the most recent prospectus, are disclosed in the following “Fund expense ratios” table.
| | | | | | | | |
| Fund expense ratios | | Class A | | Class C | | Class R | | Institutional Class |
Total annual operating expenses | | 1.02% | | 1.77% | | 1.27% | | 0.77% |
(without fee waivers) | | | | | | | | |
Net expenses | | 1.02% | | 1.77% | | 1.27% | | 0.77% |
(including fee waivers, if any) | | | | | | | | |
Type of waiver | | n/a | | n/a | | n/a | | n/a |
5
Performance summary
Delaware Value® Fund
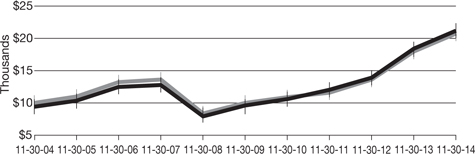
Performance of a $10,000 investment1
Average annual total returns from Nov. 30, 2004, through Nov. 30, 2014
| | | | | | | | | | |
| | | |
| For the period beginning Nov. 30, 2004, through Nov. 30, 2014 | | Starting value | | | Ending value | |

| | Delaware Value Fund — Class A shares | | | $9,425 | | | | $21,201 | |

| | Russell 1000 Value Index | | | $10,000 | | | | $20,779 | |
1The “Performance of a $10,000 investment” graph assumes $10,000 invested in Class A shares of the Fund on Nov. 30, 2004, and includes the effect of a 5.75% front-end sales charge and the reinvestment of all distributions. The graph does not reflect the deduction of taxes the shareholders would pay on Fund distributions or redemptions of Fund shares. Expense limitations were in effect for some or all of the periods shown. Performance would have been lower had expense limitations not been in effect. Expenses are listed in the “Fund expense ratios” table on page 5. Please note additional details on pages 4 through 6.
The graph also assumes $10,000 invested in the Russell 1000 Value Index as of Nov. 30, 2004. The
Russell 1000 Value Index measures the performance of the large-cap value segment of the U.S. equity universe. It includes those Russell 1000 companies with lower price-to-book ratios and lower forecasted growth values.
Index performance returns do not reflect any management fees, transaction costs, or expenses. Indices are unmanaged and one cannot invest directly in an index. Past performance is not a guarantee of future results.
Performance of other Fund classes will vary due to different charges and expenses.
| | | | | | | | |
| | | | | |
| | | Nasdaq symbols | | CUSIPs | | | | |
Class A | | DDVAX | | 24610C881 | | | | |
Class C | | DDVCX | | 24610C865 | | | | |
Class R | | DDVRX | | 245907860 | | | | |
Institutional Class | | DDVIX | | 24610C857 | | | | |
6
Disclosure of Fund expenses
For the six-month period from June 1, 2014 to November 30, 2014 (Unaudited)
As a shareholder of the Fund, you incur two types of costs: (1) transaction costs, including sales charges (loads) on purchase payments, reinvested dividends, or other distributions; redemption fees; and exchange fees; and (2) ongoing costs, including management fees; distribution and/or service (12b-1) fees; and other Fund expenses. This example is intended to help you understand your ongoing costs (in dollars) of investing in the Fund and to compare these costs with the ongoing costs of investing in other mutual funds.
The example is based on an investment of $1,000 invested at the beginning of the period and held for the entire six-month period from June 1, 2014 to Nov. 30, 2014.
Actual expenses
The first section of the table shown, “Actual Fund return,” provides information about actual account values and actual expenses. You may use the information in this section of the table, together with the amount you invested, to estimate the expenses that you paid over the period. Simply divide your account value by $1,000 (for example, an $8,600 account value divided by $1,000 = 8.6), then multiply the result by the number in the first section under the heading entitled “Expenses Paid During Period” to estimate the expenses you paid on your account during this period.
Hypothetical example for comparison purposes
The second section of the table shown, “Hypothetical 5% return,” provides information about hypothetical account values and hypothetical expenses based on the Fund’s actual expense ratio and an assumed rate of return of 5% per year before expenses, which is not the Fund’s actual return. The hypothetical account values and expenses may not be used to estimate the actual ending account balance or expenses you paid for the period. You may use this information to compare the ongoing costs of investing in the Fund and other funds. To do so, compare this 5% hypothetical example with the 5% hypothetical examples that appear in the shareholder reports of the other funds.
Please note that the expenses shown in the table are meant to highlight your ongoing costs only and do not reflect any transactional costs, such as sales charges (loads), redemption fees, or exchange fees. Therefore, the second section of the table is useful in comparing ongoing costs only, and will not help you determine the relative total costs of owning different funds. In addition, if these transactional costs were included, your costs would have been higher. The expenses shown in the table assume reinvestment of all dividends and distributions.
7
Disclosure of Fund expenses
For the six-month period from June 1, 2014 to November 30, 2014 (Unaudited)
Delaware Value® Fund
Expense analysis of an investment of $1,000
| | | | | | | | |
| | | Beginning | | Ending | | | | Expenses |
| | | Account Value | | Account Value | | Annualized | | Paid During Period |
| | | 6/1/14 | | 11/30/14 | | Expense Ratio | | 6/1/14 to 11/30/14* |
| | | | |
Actual Fund return† | | | | | | | | |
Class A | | $1,000.00 | | $1,064.30 | | 0.99% | | $5.12 |
Class C | | 1,000.00 | | 1,060.40 | | 1.75% | | 9.04 |
Class R | | 1,000.00 | | 1,063.50 | | 1.25% | | 6.47 |
Institutional Class | | 1,000.00 | | 1,066.10 | | 0.75% | | 3.88 |
| | |
Hypothetical 5% return (5% return before expenses) | | | | |
Class A | | $1,000.00 | | $1,020.11 | | 0.99% | | $5.01 |
Class C | | 1,000.00 | | 1,016.29 | | 1.75% | | 8.85 |
Class R | | 1,000.00 | | 1,018.80 | | 1.25% | | 6.33 |
Institutional Class | | 1,000.00 | | 1,021.31 | | 0.75% | | 3.80 |
| * | “Expenses Paid During Period” are equal to the Fund’s annualized expense ratio, multiplied by the average account value over the period, multiplied by 183/365 (to reflect the one-half year period). |
| † | Because actual returns reflect only the most recent six-month period, the returns shown may differ significantly from fiscal year returns. |
8
| | |
| Security type / sector allocation and top 10 equity holdings |
| Delaware Value® Fund | | As of November 30, 2014 (Unaudited) |
Sector designations may be different than the sector designations presented in other Fund materials. The sector designations may represent the investment manager’s internal sector classifications, which may result in the sector designations for one fund being different than another fund’s sector designations.
| | | | | |
| Security type / sector | | Percentage of net assets |
Common Stock | | 95.78% |
Consumer Discretionary | | 6.43% |
Consumer Staples | | 12.34% |
Energy | | 13.49% |
Financials | | 11.99% |
Healthcare | | 18.20% |
Industrials | | 8.95% |
Information Technology | | 12.43% |
Materials | | 2.95% |
Telecommunications | | 6.00% |
Utilities | | 3.00% |
Short-Term Investments | | 4.17% |
Total Value of Securities | | 99.95% |
Receivables and Other Assets Net of Liabilities | | 0.05% |
Total Net Assets | | 100.00% |
Holdings are for informational purposes only and are subject to change at any time. They are not a recommendation to buy, sell, or hold any security.
| | | | | |
| Top 10 equity holdings | | Percentage of net assets |
Lowe’s | | 3.22% |
Johnson Controls | | 3.21% |
Intel | | 3.19% |
Archer-Daniels-Midland | | 3.18% |
Mondelez International Class A | | 3.13% |
Cisco Systems | | 3.12% |
Broadcom Class A | | 3.09% |
Johnson & Johnson | | 3.05% |
Allstate | | 3.05% |
Baxter International | | 3.04% |
9
| | |
| Schedule of investments | | |
| Delaware Value® Fund | | November 30, 2014 |
| | | | | | | | |
| | | Number of shares | | | Value (U.S. $) | |
| |
Common Stock – 95.78% | | | | | | | | |
| |
Consumer Discretionary – 6.43% | | | | | | | | |
Johnson Controls | | | 4,376,981 | | | $ | 218,849,050 | |
Lowe’s | | | 3,433,966 | | | | 219,190,050 | |
| | | | | | | | |
| | | | | | | 438,039,100 | |
| | | | | | | | |
Consumer Staples – 12.34% | | | | | | | | |
Archer-Daniels-Midland | | | 4,113,037 | | | | 216,674,789 | |
CVS Health | | | 2,251,202 | | | | 205,669,815 | |
Kraft Foods Group | | | 3,396,762 | | | | 204,383,169 | |
Mondelez International Class A | | | 5,436,560 | | | | 213,113,152 | |
| | | | | | | | |
| | | | | | | 839,840,925 | |
| | | | | | | | |
Energy – 13.49% | | | | | | | | |
Chevron | | | 1,726,224 | | | | 187,934,007 | |
ConocoPhillips | | | 2,833,484 | | | | 187,208,288 | |
Halliburton | | | 4,240,999 | | | | 178,970,158 | |
Marathon Oil | | | 6,238,952 | | | | 180,430,492 | |
Occidental Petroleum | | | 2,309,722 | | | | 184,246,524 | |
| | | | | | | | |
| | | | | | | 918,789,469 | |
| | | | | | | | |
Financials – 11.99% | | | | | | | | |
Allstate | | | 3,043,419 | | | | 207,409,005 | |
Bank of New York Mellon | | | 5,011,974 | | | | 200,629,319 | |
BB&T | | | 5,449,823 | | | | 204,858,847 | |
Marsh & McLennan | | | 3,600,687 | | | | 203,762,877 | |
| | | | | | | | |
| | | | | | | 816,660,048 | |
| | | | | | | | |
Healthcare – 18.20% | | | | | | | | |
Baxter International | | | 2,838,305 | | | | 207,196,265 | |
Cardinal Health | | | 2,509,744 | | | | 206,275,859 | |
Johnson & Johnson | | | 1,919,412 | | | | 207,776,349 | |
Merck | | | 3,426,542 | | | | 206,963,137 | |
Pfizer | | | 6,597,358 | | | | 205,507,702 | |
Quest Diagnostics | | | 3,151,685 | | | | 205,836,547 | |
| | | | | | | | |
| | | | | | | 1,239,555,859 | |
| | | | | | | | |
Industrials – 8.95% | | | | | | | | |
Northrop Grumman | | | 1,436,432 | | | | 202,436,362 | |
Raytheon | | | 1,913,034 | | | | 204,120,728 | |
Waste Management | | | 4,165,499 | | | | 202,984,766 | |
| | | | | | | | |
| | | | | | | 609,541,856 | |
| | | | | | | | |
Information Technology – 12.43% | | | | | | | | |
Broadcom Class A | | | 4,870,954 | | | | 210,084,246 | |
Cisco Systems | | | 7,697,547 | | | | 212,760,199 | |
Intel | | | 5,827,833 | | | | 217,086,779 | |
Xerox | | | 14,791,736 | | | | 206,492,635 | |
| | | | | | | | |
| | | | | | | 846,423,859 | |
| | | | | | | | |
10
| | | | | | | | |
| | | Number of shares | | | Value (U.S. $) | |
| |
Common Stock (continued) | | | | | | | | |
| |
Materials – 2.95% | | | | | | | | |
duPont (E.I.) deNemours | | | 2,815,104 | | | $ | 200,998,426 | |
| | | | | | | | |
| | | | | | | 200,998,426 | |
| | | | | | | | |
Telecommunications – 6.00% | | | | | | | | |
AT&T | | | 5,793,908 | | | | 204,988,465 | |
Verizon Communications | | | 4,023,733 | | | | 203,560,652 | |
| | | | | | | | |
| | | | | | | 408,549,117 | |
| | | | | | | | |
Utilities – 3.00% | | | | | | | | |
Edison International | | | 3,211,698 | | | | 204,135,525 | |
| | | | | | | | |
| | | | | | | 204,135,525 | |
| | | | | | | | |
Total Common Stock (cost $5,035,551,723) | | | | | | | 6,522,534,184 | |
| | | | | | | | |
| | |
| | | Principal amount° | | | | |
| |
Short-Term Investments – 4.17% | | | | | | | | |
| |
Discount Notes – 2.07%≠ | | | | | | | | |
Federal Home Loan Bank | | | | | | | | |
0.065% 1/14/15 | | | 19,072,365 | | | | 19,071,697 | |
0.065% 1/21/15 | | | 14,337,339 | | | | 14,336,752 | |
0.065% 2/25/15 | | | 30,823,174 | | | | 30,820,215 | |
0.065% 3/5/15 | | | 35,778,946 | | | | 35,773,794 | |
0.067% 1/16/15 | | | 12,780,098 | | | | 12,779,625 | |
0.08% 2/20/15 | | | 27,663,060 | | | | 27,660,571 | |
| | | | | | | | |
| | | | | | | 140,442,654 | |
| | | | | | | | |
Repurchase Agreements – 1.60% | | | | | | | | |
Bank of America Merrill Lynch
0.05%, dated 11/28/14, to be repurchased on 12/1/14, repurchase price $38,432,995 (collateralized by U.S. government obligations 0.00%–1.375% 4/15/16–2/15/43 market value $39,201,497) | | | 38,432,835 | | | | 38,432,835 | |
Bank of Montreal
0.08%, dated 11/28/14, to be repurchased on 12/1/14, repurchase price $12,811,030 (collateralized by U.S. government obligations 0.25%–11.25% 11/30/14–2/15/22 market value $13,067,175) | | | 12,810,945 | | | | 12,810,945 | |
BNP Paribas
0.09%, dated 11/28/14, to be repurchased on 12/1/14, repurchase price $57,761,653 (collateralized by U.S. government obligations 0.00%–3.625% 12/26/14–2/15/21 market value $58,916,450) | | | 57,761,220 | | | | 57,761,220 | |
| | | | | | | | |
| | | | | | | 109,005,000 | |
| | | | | | | | |
11
Schedule of investments
Delaware Value® Fund
| | | | | | | | |
| | | Principal amount° | | | Value (U.S. $) | |
| |
Short-Term Investments (continued) | | | | | | | | |
| |
U.S. Treasury Obligation – 0.50%≠ | | | | | | | | |
U.S. Treasury Bill 0.005% 12/26/14 | | | 34,104,995 | | | $ | 34,104,074 | |
| | | | | | | | |
| | | | | | | 34,104,074 | |
| | | | | | | | |
Total Short-Term Investments (cost $283,545,092) | | | | | | | 283,551,728 | |
| | | | | | | | |
| | |
Total Value of Securities – 99.95%
(cost $5,319,096,815) | | | | | | $ | 6,806,085,912 | |
| | | | | | | | |
| ≠ | The rate shown is the effective yield at the time of purchase. |
| ° | Principal amount shown is stated in U.S. dollars unless noted that the security is denominated in another currency. |
See accompanying notes, which are an integral part of the financial statements.
12
This page intentionally left blank.
| | |
| Statement of assets and liabilities | | |
| Delaware Value® Fund | | November 30, 2014 |
| | | | |
Assets: | | | | |
Investments, at value1 | | $ | 6,522,534,184 | |
Short-term investments, at value2 | | | 283,551,728 | |
Cash | | | 4,858 | |
Receivable for fund shares sold | | | 35,297,781 | |
Dividends and interest receivable | | | 14,980,645 | |
| | | | |
Total assets | | | 6,856,369,196 | |
| | | | |
Liabilities: | | | | |
Payable for securities purchased | | | 35,587,385 | |
Payable for fund shares redeemed | | | 4,787,658 | |
Investment management fees payable | | | 2,903,564 | |
Other accrued expenses | | | 1,936,128 | |
Distribution fees payable to affiliates | | | 819,300 | |
Other affiliates payable | | | 651,141 | |
Trustees’ fees and expenses payable | | | 37,016 | |
| | | | |
Total liabilities | | | 46,722,192 | |
| | | | |
Total Net Assets | | $ | 6,809,647,004 | |
| | | | |
| |
Net Assets Consist of: | | | | |
Paid-in capital | | $ | 5,428,527,454 | |
Undistributed net investment income | | | 15,784,376 | |
Accumulated net realized loss on investments | | | (121,653,923 | ) |
Net unrealized appreciation of investments | | | 1,486,989,097 | |
| | | | |
Total Net Assets | | $ | 6,809,647,004 | |
| | | | |
14
| | | | |
Net Asset Value | | | | |
| |
Class A: | | | | |
Net assets | | $ | 2,410,758,753 | |
Shares of beneficial interest outstanding, unlimited authorization, no par | | | 132,438,978 | |
Net asset value per share | | $ | 18.20 | |
Sales charge | | | 5.75 | % |
Offering price per share, equal to net asset value per share / (1 – sales charge) | | $ | 19.31 | |
| |
Class C: | | | | |
Net assets | | $ | 415,075,792 | |
Shares of beneficial interest outstanding, unlimited authorization, no par | | | 22,866,684 | |
Net asset value per share | | $ | 18.15 | |
| |
Class R: | | | | |
Net assets | | $ | 37,236,620 | |
Shares of beneficial interest outstanding, unlimited authorization, no par | | | 2,047,493 | |
Net asset value per share | | $ | 18.19 | |
| |
Institutional Class: | | | | |
Net assets | | $ | 3,946,575,839 | |
Shares of beneficial interest outstanding, unlimited authorization, no par | | | 216,779,434 | |
Net asset value per share | | $ | 18.21 | |
1Investments, at cost | | $ | 5,035,551,723 | |
| 2Short-term investments, at cost | | | 283,545,092 | |
See accompanying notes, which are an integral part of the financial statements.
15
| | |
| Statement of operations | | |
| Delaware Value® Fund | | Year ended November 30, 2014 |
| | | | |
Investment Income: | | | | |
Dividends | | $ | 127,947,219 | |
Interest | | | 64,023 | |
| | | | |
| | | 128,011,242 | |
| | | | |
Expenses: | | | | |
Management fees | | | 27,703,258 | |
Distribution expenses – Class A | | | 4,800,748 | |
Distribution expenses – Class B | | | 27,751 | |
Distribution expenses – Class C | | | 2,800,783 | |
Distribution expenses – Class R | | | 109,013 | |
Dividend disbursing and transfer agent fees and expenses | | | 6,546,145 | |
Accounting and administration expenses | | | 1,727,978 | |
Registration fees | | | 637,254 | |
Reports and statements to shareholders | | | 467,876 | |
Legal fees | | | 300,986 | |
Trustees’ fees and expenses | | | 233,654 | |
Custodian fees | | | 183,770 | |
Audit and tax | | | 36,291 | |
Other | | | 125,877 | |
| | | | |
| | | 45,701,384 | |
Less waived distribution expenses – Class B | | | (20,856 | ) |
Less expense paid indirectly | | | (2,772 | ) |
| | | | |
Total operating expenses | | | 45,677,756 | |
| | | | |
Net Investment Income | | | 82,333,486 | |
| | | | |
| |
Net Realized and Unrealized Gain: | | | | |
Net realized gain on: | | | | |
Investments | | | 72,695,789 | |
Redemptions in kind* | | | 458,596 | |
| | | | |
Net realized gain | | | 73,154,385 | |
| | | | |
Net change in unrealized appreciation (depreciation) of investments | | | 579,755,801 | |
| | | | |
Net Realized and Unrealized Gain | | | 652,910,186 | |
| | | | |
Net Increase in Net Assets Resulting from Operations | | $ | 735,243,672 | |
| | | | |
*See Note 12 in “Notes to financial statements.”
See accompanying notes, which are an integral part of the financial statements.
16
This page intentionally left blank.
Statements of changes in net assets
Delaware Value® Fund
| | | | | | | | |
| | | Year ended | |
| | | 11/30/14 | | | 11/30/13 | |
Increase in Net Assets from Operations: | | | | | | | | |
Net investment income | | $ | 82,333,486 | | | $ | 45,657,500 | |
Net realized gain | | | 73,154,385 | | | | 44,229,661 | |
Net change in unrealized appreciation (depreciation) | | | 579,755,801 | | | | 642,413,105 | |
| | | | | | | | |
Net increase in net assets resulting from operations | | | 735,243,672 | | | | 732,300,266 | |
| | | | | | | | |
| | |
Dividends and Distributions to Shareholders from: | | | | | | | | |
Net investment income: | | | | | | | | |
Class A | | | (26,900,014 | ) | | | (28,315,408 | ) |
Class B | | | (41,557 | ) | | | (68,827 | ) |
Class C | | | (1,732,083 | ) | | | (1,267,433 | ) |
Class R | | | (233,991 | ) | | | (131,124 | ) |
Institutional Class | | | (45,342,234 | ) | | | (30,162,418 | ) |
| | | | | | | | |
| | | (74,249,879 | ) | | | (59,945,210 | ) |
| | | | | | | | |
| | |
Capital Share Transactions: | | | | | | | | |
Proceeds from shares sold: | | | | | | | | |
Class A | | | 999,119,582 | | | | 562,913,489 | |
Class B | | | 33,573 | | | | 46,164 | |
Class C | | | 210,406,941 | | | | 111,193,912 | |
Class R | | | 29,786,410 | | | | 5,958,002 | |
Institutional Class | | | 2,034,761,461 | | | | 1,255,428,108 | |
| | |
Net asset value of shares issued upon reinvestment of dividends and distributions: | | | | | | | | |
Class A | | | 25,651,872 | | | | 26,847,286 | |
Class B | | | 40,782 | | | | 65,539 | |
Class C | | | 1,596,006 | | | | 1,180,177 | |
Class R | | | 217,100 | | | | 131,123 | |
Institutional Class | | | 43,737,494 | | | | 29,453,189 | |
| | | | | | | | |
| | | 3,345,351,221 | | | | 1,993,216,989 | |
| | | | | | | | |
18
| | | | | | | | |
| | | Year ended | |
| | | 11/30/14 | | | 11/30/13 | |
Capital Share Transactions (continued): | | | | | | | | |
Cost of shares redeemed: | | | | | | | | |
Class A | | $ | (566,236,003 | ) | | $ | (191,842,612 | ) |
Class B | | | (4,864,613 | ) | | | (3,864,053 | ) |
Class C | | | (32,793,845 | ) | | | (17,768,660 | ) |
Class R | | | (7,421,886 | ) | | | (1,510,577 | ) |
Institutional Class | | | (573,135,172 | ) | | | (261,854,509 | ) |
| | | | | | | | |
| | | (1,184,451,519 | ) | | | (476,840,411 | ) |
| | | | | | | | |
Increase in net assets derived from capital share transactions | | | 2,160,899,702 | | | | 1,516,376,578 | |
| | | | | | | | |
Net Increase in Net Assets | | | 2,821,893,495 | | | | 2,188,731,634 | |
| | |
Net Assets: | | | | | | | | |
Beginning of year | | | 3,987,753,509 | | | | 1,799,021,875 | |
| | | | | | | | |
End of year | | $ | 6,809,647,004 | | | $ | 3,987,753,509 | |
| | | | | | | | |
Undistributed net investment income | | $ | 15,784,376 | | | $ | 7,695,969 | |
| | | | | | | | |
See accompanying notes, which are an integral part of the financial statements.
19
Financial highlights
Delaware Value® Fund Class A
Selected data for each share of the Fund outstanding throughout each period were as follows:
|
Net asset value, beginning of period |
|
Income from investment operations: |
Net investment income1 |
Net realized and unrealized gain |
|
Total from investment operations |
|
|
Less dividends and distributions from: |
Net investment income |
|
Total dividends and distributions |
|
|
Net asset value, end of period |
|
|
Total return2 |
|
Ratios and supplemental data: |
Net assets, end of period (000 omitted) |
Ratio of expenses to average net assets |
Ratio of expenses to average net assets prior to fees waived |
Ratio of net investment income to average net assets |
Ratio of net investment income to average net assets prior to fees waived |
Portfolio turnover |
| 1 | The average shares outstanding method has been applied for per share information. |
| 2 | Total investment return is based on the change in net asset value of a share during the period and assumes reinvestment of dividends and distributions at net asset value and does not reflect the impact of a sales charge. Total investment return during some of the periods shown reflects waivers by the manager and/or distributor. Performance would have been lower had the waivers not been in effect. |
See accompanying notes, which are an integral part of the financial statements.
20
| | | | | | | | | | | | | | | | | | | | |
| | | | | | | | | Year ended | | | | | | | |
| | | | |
| | | 11/30/14 | | | 11/30/13 | | | 11/30/12 | | | 11/30/11 | | | 11/30/10 | |
| |
| | $ | 16.060 | | | $ | 12.440 | | | $ | 10.970 | | | $ | 9.820 | | | $ | 9.100 | |
| | | | | |
| | | | | | | | | | | | | | | | | | | | | |
| | | 0.256 | | | | 0.233 | | | | 0.225 | | | | 0.190 | | | | 0.171 | |
| | | 2.121 | | | | 3.728 | | | | 1.439 | | | | 1.139 | | | | 0.738 | |
| | | | | | | | | | | | | | | | | | | | |
| | | 2.377 | | | | 3.961 | | | | 1.664 | | | | 1.329 | | | | 0.909 | |
| | | | | | | | | | | | | | | | | | | | |
| | | | | |
| | | | | | | | | | | | | | | | | | | | | |
| | | (0.237 | ) | | | (0.341 | ) | | | (0.194 | ) | | | (0.179 | ) | | | (0.189 | ) |
| | | | | | | | | | | | | | | | | | | | |
| | | (0.237 | ) | | | (0.341 | ) | | | (0.194 | ) | | | (0.179 | ) | | | (0.189 | ) |
| | | | | | | | | | | | | | | | | | | | |
| | | | | |
| | $ | 18.200 | | | $ | 16.060 | | | $ | 12.440 | | | $ | 10.970 | | | $ | 9.820 | |
| | | | | | | | | | | | | | | | | | | | |
| | | | | |
| | | 14.92% | | | | 32.41% | | | | 15.40% | | | | 13.65% | | | | 10.16% | |
| | | | | |
| | | | | | | | | | | | | | | | | | | | | |
| | $ | 2,410,759 | | | $ | 1,699,105 | | | $ | 988,578 | | | $ | 274,050 | | | $ | 298,110 | |
| | | 0.98% | | | | 1.01% | | | | 1.09% | | | | 1.10% | | | | 1.10% | |
| | | 0.98% | | | | 1.06% | | | | 1.17% | | | | 1.30% | | | | 1.32% | |
| | | 1.51% | | | | 1.61% | | | | 1.89% | | | | 1.78% | | | | 1.85% | |
| | | 1.51% | | | | 1.66% | | | | 1.81% | | | | 1.58% | | | | 1.63% | |
| | | 7% | | | | 6% | | | | 13% | | | | 24% | | | | 29% | |
| |
21
Financial highlights
Delaware Value® Fund Class C
Selected data for each share of the Fund outstanding throughout each period were as follows:
|
Net asset value, beginning of period |
|
Income from investment operations: |
Net investment income1 |
Net realized and unrealized gain |
|
Total from investment operations |
|
|
Less dividends and distributions from: |
Net investment income |
|
Total dividends and distributions |
|
|
Net asset value, end of period |
|
|
Total return2 |
|
Ratios and supplemental data: |
Net assets, end of period (000 omitted) |
Ratio of expenses to average net assets |
Ratio of expenses to average net assets prior to fees waived |
Ratio of net investment income to average net assets |
Ratio of net investment income to average net assets prior to fees waived |
Portfolio turnover |
| 1 | The average shares outstanding method has been applied for per share information. |
| 2 | Total investment return is based on the change in net asset value of a share during the period and assumes reinvestment of dividends and distributions at net asset value and does not reflect the impact of a sales charge. Total investment return during some of the periods shown reflects a waiver by the manager. Performance would have been lower had the waiver not been in effect. |
See accompanying notes, which are an integral part of the financial statements.
22
| | | | | | | | | | | | | | | | | | | | |
| | | Year ended | |
| | | | |
| | | 11/30/14 | | | 11/30/13 | | | 11/30/12 | | | 11/30/11 | | | 11/30/10 | |
| |
| | $ | 16.010 | | | $ | 12.340 | | | $ | 10.890 | | | $ | 9.750 | | | $ | 9.050 | |
| | | | | |
| | | | | | | | | | | | | | | | | | | | |
| | | 0.130 | | | | 0.126 | | | | 0.134 | | | | 0.109 | | | | 0.101 | |
| | | 2.119 | | | | 3.713 | | | | 1.430 | | | | 1.141 | | | | 0.729 | |
| | | | | | | | | | | | | | | | | | | | |
| | | 2.249 | | | | 3.839 | | | | 1.564 | | | | 1.250 | | | | 0.830 | |
| | | | | | | | | | | | | | | | | | | | |
| | | | | |
| | | | | | | | | | | | | | | | | | | | |
| | | (0.109 | ) | | | (0.169 | ) | | | (0.114 | ) | | | (0.110 | ) | | | (0.130 | ) |
| | | | | | | | | | | | | | | | | | | | |
| | | (0.109 | ) | | | (0.169 | ) | | | (0.114 | ) | | | (0.110 | ) | | | (0.130 | ) |
| | | | | | | | | | | | | | | | | | | | |
| | | | | |
| | $ | 18.150 | | | $ | 16.010 | | | $ | 12.340 | | | $ | 10.890 | | | $ | 9.750 | |
| | | | | | | | | | | | | | | | | | | | |
| | | | | |
| | | 14.10% | | | | 31.38% | | | | 14.49% | | | | 12.88% | | | | 9.28% | |
| | | | | |
| | | | | | | | | | | | | | | | | | | | |
| | $ | 415,076 | | | $ | 199,771 | | | $ | 74,407 | | | $ | 24,928 | | | $ | 19,377 | |
| | | 1.74% | | | | 1.77% | | | | 1.85% | | | | 1.85% | | | | 1.85% | |
| | | 1.74% | | | | 1.77% | | | | 1.88% | | | | 2.00% | | | | 2.02% | |
| | | 0.75% | | | | 0.87% | | | | 1.13% | | | | 1.03% | | | | 1.10% | |
| | | 0.75% | | | | 0.87% | | | | 1.10% | | | | 0.88% | | | | 0.93% | |
| | | 7% | | | | 6% | | | | 13% | | | | 24% | | | | 29% | |
| |
23
Financial highlights
Delaware Value® Fund Class R
Selected data for each share of the Fund outstanding throughout each period were as follows:
|
Net asset value, beginning of period |
|
Income from investment operations: |
Net investment income1 |
Net realized and unrealized gain |
|
Total from investment operations |
|
|
Less dividends and distributions from: |
Net investment income |
|
Total dividends and distributions |
|
|
Net asset value, end of period |
|
|
Total return2 |
|
Ratios and supplemental data: |
Net assets, end of period (000 omitted) |
Ratio of expenses to average net assets |
Ratio of expenses to average net assets prior to fees waived |
Ratio of net investment income to average net assets |
Ratio of net investment income to average net assets prior to fees waived |
Portfolio turnover |
| 1 | The average shares outstanding method has been applied for per share information. |
| 2 | Total investment return is based on the change in net asset value of a share during the period and assumes reinvestment of dividends and distributions at net asset value. Total investment return during some of the periods shown reflects waivers by the manager and/or distributor. Performance would have been lower had the waivers not been in effect. |
See accompanying notes, which are an integral part of the financial statements.
24
| | | | | | | | | | | | | | | | | | | | |
| Year ended | |
| | | | |
| | | 11/30/14 | | | 11/30/13 | | | 11/30/12 | | | 11/30/11 | | | 11/30/10 | |
| |
| | $ | 16.050 | | | $ | 12.400 | | | $ | 10.950 | | | $ | 9.800 | | | $ | 9.090 | |
| | | | | |
| | | | | | | | | | | | | | | | | | | | |
| | | 0.218 | | | | 0.197 | | | | 0.194 | | | | 0.163 | | | | 0.148 | |
| | | 2.115 | | | | 3.735 | | | | 1.423 | | | | 1.143 | | | | 0.731 | |
| | | | | | | | | | | | | | | | | | | | |
| | | 2.333 | | | | 3.932 | | | | 1.617 | | | | 1.306 | | | | 0.879 | |
| | | | | | | | | | | | | | | | | | | | |
| | | | | |
| | | | | | | | | | | | | | | | | | | | |
| | | (0.193 | ) | | | (0.282 | ) | | | (0.167 | ) | | | (0.156 | ) | | | (0.169 | ) |
| | | | | | | | | | | | | | | | | | | | |
| | | (0.193 | ) | | | (0.282 | ) | | | (0.167 | ) | | | (0.156 | ) | | | (0.169 | ) |
| | | | | | | | | | | | | | | | | | | | |
| | | | | |
| | $ | 18.190 | | | $ | 16.050 | | | $ | 12.400 | | | $ | 10.950 | | | $ | 9.800 | |
| | | | | | | | | | | | | | | | | | | | |
| | | | | |
| | | 14.63% | | | | 32.17% | | | | 14.96% | | | | 13.43% | | | | 9.81% | |
| | | | | |
| | | | | | | | | | | | | | | | | | | | |
| | $ | 37,236 | | | $ | 11,658 | | | $ | 5,219 | | | $ | 1,944 | | | $ | 1,816 | |
| | | 1.24% | | | | 1.27% | | | | 1.35% | | | | 1.35% | | | | 1.35% | |
| | | 1.24% | | | | 1.35% | | | | 1.48% | | | | 1.60% | | | | 1.62% | |
| | | 1.25% | | | | 1.37% | | | | 1.63% | | | | 1.53% | | | | 1.60% | |
| | | 1.25% | | | | 1.29% | | | | 1.50% | | | | 1.28% | | | | 1.33% | |
| | | 7% | | | | 6% | | | | 13% | | | | 24% | | | | 29% | |
| |
25
Financial highlights
Delaware Value® Fund Institutional Class
Selected data for each share of the Fund outstanding throughout each period were as follows:
|
|
Net asset value, beginning of period |
|
Income from investment operations: |
Net investment income1 |
Net realized and unrealized gain |
|
Total from investment operations |
|
|
Less dividends and distributions from: |
Net investment income |
|
Total dividends and distributions |
|
|
Net asset value, end of period |
|
|
Total return2 |
|
Ratios and supplemental data: |
Net assets, end of period (000 omitted) |
Ratio of expenses to average net assets |
Ratio of expenses to average net assets prior to fees waived |
Ratio of net investment income to average net assets |
Ratio of net investment income to average net assets prior to fees waived |
Portfolio turnover |
| 1 | The average shares outstanding method has been applied for per share information. |
| 2 | Total investment return is based on the change in net asset value of a share during the period and assumes reinvestment of dividends and distributions at net asset value. Total investment return during some of the periods shown reflects a waiver by the manager. Performance would have been lower had the waiver not been in effect. |
See accompanying notes, which are an integral part of the financial statements.
26
| | | | | | | | | | | | | | | | | | | | |
| | | Year ended | |
| | | | |
| | | 11/30/14 | | | 11/30/13 | | | 11/30/12 | | | 11/30/11 | | | 11/30/10 | |
| |
| | $ | 16.060 | | | $ | 12.460 | | | $ | 10.990 | | | $ | 9.830 | | | $ | 9.110 | |
| | | | | |
| | | | | | | | | | | | | | | | | | | | |
| | | 0.300 | | | | 0.272 | | | | 0.254 | | | | 0.216 | | | | 0.194 | |
| | | 2.128 | | | | 3.724 | | | | 1.437 | | | | 1.146 | | | | 0.735 | |
| | | | | | | | | | | | | | | | | | | | |
| | | 2.428 | | | | 3.996 | | | | 1.691 | | | | 1.362 | | | | 0.929 | |
| | | | | | | | | | | | | | | | | | | | |
| | | | | |
| | | | | | | | | | | | | | | | | | | | |
| | | (0.278 | ) | | | (0.396 | ) | | | (0.221 | ) | | | (0.202 | ) | | | (0.209 | ) |
| | | | | | | | | | | | | | | | | | | | |
| | | (0.278 | ) | | | (0.396 | ) | | | (0.221 | ) | | | (0.202 | ) | | | (0.209 | ) |
| | | | | | | | | | | | | | | | | | | | |
| | | | | |
| | $ | 18.210 | | | $ | 16.060 | | | $ | 12.460 | | | $ | 10.990 | | | $ | 9.830 | |
| | | | | | | | | | | | | | | | | | | | |
| | | | | |
| | | 15.26% | | | | 32.73% | | | | 15.66% | | | | 13.99% | | | | 10.39% | |
| | | | | |
| | | | | | | | | | | | | | | | | | | | |
| | $ | 3,946,576 | | | $ | 2,072,765 | | | $ | 724,098 | | | $ | 216,345 | | | $ | 106,001 | |
| | | 0.74% | | | | 0.77% | | | | 0.85% | | | | 0.85% | | | | 0.85% | |
| | | 0.74% | | | | 0.77% | | | | 0.88% | | | | 1.00% | | | | 1.02% | |
| | | 1.75% | | | | 1.87% | | | | 2.13% | | | | 2.03% | | | | 2.10% | |
| | | 1.75% | | | | 1.87% | | | | 2.10% | | | | 1.88% | | | | 1.93% | |
| | | 7% | | | | 6% | | | | 13% | | | | 24% | | | | 29% | |
| |
27
| | |
| Notes to financial statements | | |
| Delaware Value® Fund | | November 30, 2014 |
Delaware Group® Equity Funds II (Trust) is organized as a Delaware statutory trust and offers one series: Delaware Value Fund (Fund). The Trust is an open-end investment company. The Fund is considered diversified under the Investment Company Act of 1940, as amended, and offers Class A, Class C, Class R, and Institutional Class shares. Class A shares are sold with a maximum front-end sales charge of 5.75%. Class A share purchases of $1,000,000 or more will incur a contingent deferred sales charge (CDSC) of 1.00% if redeemed during the first year and 0.50% during the second year, provided that Delaware Distributors, L.P. (DDLP) paid a financial advisor a commission on the purchase of those shares. Effective Sept. 25, 2014, all remaining shares of Class B were converted to Class A shares. Between June 1, 2007 and Sept. 25, 2014, Class B shares could be purchased only through dividend reinvestment and certain permitted exchanges. Prior to June 1, 2007, Class B shares were sold with a CDSC that declined from 4.00% to zero depending upon the period of time the shares were held. Class B shares automatically converted to Class A shares on a quarterly basis approximately eight years after purchase. Class C shares are sold with a CDSC of 1.00%, if redeemed during the first 12 months. Class R and Institutional Class shares are not subject to a sales charge and are offered for sale exclusively to certain eligible investors.
The investment objective of the Fund is to seek long-term capital appreciation.
1. Significant Accounting Policies
The following accounting policies are in accordance with U.S. generally accepted accounting principles (U.S. GAAP) and are consistently followed by the Fund.
Security Valuation – Equity securities, except those traded on the Nasdaq Stock Market, Inc. (Nasdaq), are valued at the last quoted sales price as of the time of the regular close of the New York Stock Exchange on the valuation date. Securities traded on the Nasdaq are valued in accordance with the Nasdaq Official Closing Price, which may not be the last sales price. If, on a particular day, an equity security does not trade, then the mean between the bid and ask prices will be used, which approximates fair value. Investment company securities are valued at net asset value per share, as reported by the underlying investment company. U.S. government and agency securities are valued at the mean between the bid and ask prices, which approximates fair value. Generally, other securities and assets for which market quotations are not readily available are valued at fair value as determined in good faith under the direction of the Fund’s Board of Trustees (Board).
Federal Income Taxes – No provision for federal income taxes has been made as the Fund intends to continue to qualify for federal income tax purposes as a regulated investment company under Subchapter M of the Internal Revenue Code of 1986, as amended, and make the requisite distributions to shareholders. The Fund evaluates tax positions taken or expected to be taken in the course of preparing the Fund’s tax returns to determine whether the tax positions are “more-likely-than-not” of being sustained by the applicable tax authority. Tax positions not deemed to meet the “more-likely-than-not” threshold are recorded as a tax benefit or expense in the current year. Management has analyzed the Fund’s tax positions taken for all open federal income tax years (Nov. 30, 2011–Nov. 30, 2014), and has concluded that no provision for federal income tax is required in the Fund’s financial statements.
28
Class Accounting – Investment income, common expenses, and realized and unrealized gain (loss) on investments are allocated to the various classes of the Fund on the basis of daily net assets of each class. Distribution expenses relating to a specific class are charged directly to that class.
Repurchase Agreements – The Fund may purchase certain U.S. government securities subject to the counterparty’s agreement to repurchase them at an agreed upon date and price. The counterparty will be required on a daily basis to maintain the value of the collateral subject to the agreement at not less than the repurchase price (including accrued interest). The agreements are conditioned upon the collateral being deposited under the Federal Reserve book-entry system with the Fund’s custodian or a third-party sub-custodian. In the event of default or bankruptcy by the other party to the agreement, retention of the collateral may be subject to legal proceedings. All open repurchase agreements as of the date of this report were entered into on Nov. 28, 2014.
Use of Estimates – The preparation of financial statements in conformity with U.S. GAAP requires management to make estimates and assumptions that affect the fair value of investments, the reported amounts of assets and liabilities and disclosure of contingent assets and liabilities at the date of the financial statements, and the reported amounts of revenues and expenses during the reporting period. Actual results could differ from those estimates and the differences could be material.
Other – Expenses directly attributable to the Fund are charged directly to the Fund. Other expenses common to various funds within the Delaware Investments® Family of Funds are generally allocated among such funds on the basis of average net assets. Management fees and some other expenses are paid monthly. Security transactions are recorded on the date the securities are purchased or sold (trade date) for financial reporting purposes. Costs used in calculating realized gains and losses on the sale of investment securities are those of the specific securities sold. Dividend income is recorded on the ex-dividend date and interest income is recorded on the accrual basis. The Fund declares and pays distributions from net investment income and net realized gain on investments, if any, annually. The Fund may distribute more frequently, if necessary for tax purposes. Dividends and distributions, if any, are recorded on the ex-dividend date.
Subject to seeking best execution, the Fund may direct certain security trades to brokers who have agreed to rebate a portion of the related brokerage commission to the Fund in cash. In general, best execution refers to many factors, including the price paid or received for a security, the commission charged, the promptness and reliability of execution, the confidentiality and placement accorded the order, and other factors affecting the overall benefit obtained by the Fund on the transaction. There were no commission rebates for the year ended Nov. 30, 2014.
The Fund may receive earnings credits from its custodian when positive cash balances are maintained, which may be used to offset custody fees. There were no earnings credits for the year ended Nov. 30, 2014.
The Fund receives earnings credits from its transfer agent when positive cash balances are maintained, which may be used to offset transfer agent fees. If the amount earned is greater than one dollar, the expense paid under this arrangement is included on the “Statement of operations” under “Dividend
29
Notes to financial statements
Delaware Value® Fund
1. Significant Accounting Policies (continued)
disbursing and transfer agent fees and expenses” with the corresponding expense offset shown under “Less expense paid indirectly.” For the year ended Nov. 30, 2014, the Fund earned $2,772 under this agreement.
2. Investment Management, Administration Agreements and Other Transactions with Affiliates
In accordance with the terms of its investment management agreement, the Fund pays Delaware Management Company (DMC), a series of Delaware Management Business Trust and the investment manager, an annual fee which is calculated daily at the rate of 0.65% on the first $500 million of average daily net assets of the Fund, 0.60% on the next $500 million, 0.55% on the next $1.5 billion, and 0.50% on average daily net assets in excess of $2.5 billion.
DMC had contractually agreed to waive that portion, if any, of its management fee and reimburse the Fund to the extent necessary to ensure that total annual operating expenses (excluding any 12b-1 plan expenses, taxes, interest, inverse floater program expenses, short sale and dividend interest expenses, brokerage fees, certain insurance costs, acquired fund fees and expenses, and nonroutine expenses or costs including, but not limited to, those relating to reorganizations, litigation, conducting shareholder meetings, and liquidations (collectively, nonroutine expenses)) do not exceed 0.85% of average daily net assets of the Fund from Dec. 1, 2013 through March 28, 2014.* For purposes of this waiver and reimbursement, nonroutine expenses may also include such additional costs and expenses as may be agreed upon from time to time by the Fund’s Board and DMC. This expense waiver and reimbursement applies only to expenses paid directly by the Fund and may only be terminated by agreement of DMC and the Fund. As of March 29, 2014, this expense waiver and reimbursement was terminated by DMC and the Fund.
Effective Nov. 1, 2014, Delaware Investments Fund Services Company (DIFSC), an affiliate of DMC, provides fund accounting and financial administration oversight services to the Fund. Prior to this time, Delaware Service Company, Inc. (DSC), an affiliate of DMC, provided fund accounting and financial administration oversight services to the Fund. For these services, the Fund pays DIFSC fees based on the aggregate daily net assets of the Delaware Investments® Family of Funds at the following annual rate: 0.0050% of the first $30 billion; 0.0045% of the next $10 billion; 0.0040% of the next $10 billion; and 0.0025% of aggregate average daily net assets in excess of $50 billion. The fees payable to DIFSC under the service agreement described above are allocated among all Funds in the Delaware Investments Family of Funds on a relative net asset value basis. For the year ended Nov. 30, 2014, the Fund was charged $246,256 for these services. This amount is included on the “Statement of operations” under “Accounting and administrative expenses.”
Effective Nov. 1, 2014, DIFSC is the transfer agent and dividend disbursing agent of the Fund. Prior to this time, DSC was the transfer agent and dividend disbursing agent of the Fund. For these services, the Fund pays DIFSC fees based on the aggregate daily net assets of the retail funds within the Delaware Investments Family of Funds at the following annual rate: 0.025% of the first $20 billion; 0.020% of the next $5 billion; 0.015% of the next $5 billion; and 0.013% on average daily net assets in excess of $30 billion. This amount is included on the “Statement of operations” under “Dividend disbursing and transfer agent fees and expenses.” For the year ended Nov. 30, 2014, the Fund was charged $1,108,355 for these services. Pursuant to a sub-transfer agency agreement between DIFSC and BNY Mellon
30
Investment Servicing (US) Inc. (BNYMIS), BNYMIS provides certain sub-transfer agency services to the Fund. Sub-transfer agency fees are passed on to and paid directly by the Fund.
Pursuant to a distribution agreement and distribution plan, the Fund pays DDLP, the distributor and an affiliate of DMC, an annual distribution and service fee of 0.25% of the average daily net assets of the Class A shares, 1.00% of the average daily net assets of the Class C shares and 0.50% of the average daily net assets of Class R shares. Institutional Class shares pay no distribution and service expenses. The Board has adopted a formula for calculating 12b-1 plan fees for the Fund’s Class A shares. The total 12b-1 fees to be paid by Class A shareholders of the Fund will be the sum of (i) 0.10% of the average daily net assets representing shares that were acquired prior to May 2, 1994 and (ii) 0.25% of the average daily net assets representing shares that were acquired on or after May 2, 1994. All Class A shareholders will bear 12b-1 fees at the same rate, the blended rate, currently 0.24% of average daily net assets, based upon the allocation of the rates described above. This method of calculating Class A 12b-1 fees may be discontinued at the sole discretion of the Board. The Fund’s Class B shares paid DDLP 1.00% of the average daily net assets for the period Nov. 1, 2013 through Sept. 25, 2014.
DDLP contracted to limit the Fund’s Class B 12b-1 fees from Nov. 1, 2013 through Sept. 25, 2014** to 0.25% of average daily net assets.
As provided in the investment management agreement, the Fund bears a portion of the cost of certain resources shared with DMC, including the cost of internal personnel of DMC and/or its affiliates that provide legal, tax, and regulatory reporting services to the Fund. For the year ended Nov. 30, 2014, the Fund was charged $138,697 for internal legal, tax, and regulatory reporting services provided by DMC and/or its affiliates’ employees.
For the year ended Nov. 30, 2014, DDLP earned $384,303 for commissions on sales of the Fund’s Class A shares. For the year ended Nov. 30, 2014, DDLP received gross CDSC commissions of $11 and $6,229 on redemptions of the Fund’s Class A and Class C shares, respectively, and these commissions were entirely used to offset upfront commissions previously paid by DDLP to broker/dealers on sales of those shares.
Trustees’ fees include expenses accrued by the Fund for each Trustee’s retainer and meeting fees. Certain officers of DMC, DSC, and DDLP are officers and/or Trustees of the Trust. These officers and Trustees are paid no compensation by the Fund.
* The contractual period was March 29, 2012 through March 28, 2014.
** The contractual period was Nov. 1, 2013 through March 30, 2015.
3. Investments
For year ended Nov. 30, 2014, the Fund made purchases and sales of investment securities other than short-term investments as follows:
| | | | |
Purchases | | $ | 2,286,856,248 | |
Sales | | | 352,765,233 | |
31
Notes to financial statements
Delaware Value® Fund
3. Investments (continued)
At Nov. 30, 2014, the cost of investments and unrealized appreciation (depreciation) for federal income tax purposes were as follows:
| | | | |
Cost of investments | | $ | 5,326,354,532 | |
| | | | |
Aggregate unrealized appreciation | | $ | 1,546,326,596 | |
Aggregate unrealized depreciation | | | (66,595,216 | ) |
| | | | |
Net unrealized appreciation | | $ | 1,479,731,380 | |
| | | | |
U.S. GAAP defines fair value as the price that the Fund would receive to sell an asset or pay to transfer a liability in an orderly transaction between market participants at the measurement date under current market conditions. A three-level hierarchy for fair value measurements has been established based upon the transparency of inputs to the valuation of an asset or liability. Inputs may be observable or unobservable and refer broadly to the assumptions that market participants would use in pricing the asset or liability. Observable inputs reflect the assumptions market participants would use in pricing the asset or liability based on market data obtained from sources independent of the reporting entity. Unobservable inputs reflect the reporting entity’s own assumptions about the assumptions that market participants would use in pricing the asset or liability based on the best information available under the circumstances. The Fund’s investment in its entirety is assigned a level based upon the observability of the inputs which are significant to the overall valuation. The three-level hierarchy of inputs is summarized below.
Level 1 – Inputs are quoted prices in active markets for identical investments. (Examples: equity securities, open-end investment companies, futures contracts, exchange-traded options contracts)
Level 2 – Other observable inputs, including, but not limited to: quoted prices for similar assets or liabilities in markets that are active, quoted prices for identical or similar assets or liabilities in markets that are not active, inputs other than quoted prices that are observable for the assets or liabilities (such as interest rates, yield curves, volatilities, prepayment speeds, loss severities, credit risks, and default rates), or other market-corroborated inputs. (Examples: debt securities, government securities, swap contracts, foreign currency exchange contracts, foreign securities utilizing international fair value pricing, broker-quoted securities, fair valued securities)
Level 3 – Significant unobservable inputs, including the Fund’s own assumptions used to determine the fair value of investments. (Examples: broker-quoted securities, fair valued securities)
Level 3 investments are valued using significant unobservable inputs. The Fund may also use an income-based valuation approach in which the anticipated future cash flows of the investment are discounted to calculate fair value. Discounts may also be applied due to the nature or duration of any restrictions on the disposition of the investments. Valuations may also be based upon current market prices of securities that are comparable in coupon, rating, maturity, and industry. The derived value of a Level 3 investment may not represent the value which is received upon disposition and this could impact the results of operations.
32
The following table summarizes the valuation of the Fund’s investments by fair value hierarchy levels as of Nov. 30, 2014:
| | | | | | | | | | | | |
| | | Level 1 | | | Level 2 | | | Total | |
Common Stock | | $ | 6,522,534,184 | | | $ | — | | | $ | 6,522,534,184 | |
Short-Term Investments | | | — | | | | 283,551,728 | | | | 283,551,728 | |
| | | | | | | | | | | | |
Total | | $ | 6,522,534,184 | | | $ | 283,551,728 | | | $ | 6,806,085,912 | |
| | | | | | | | | | | | |
During the year ended Nov. 30, 2014, there were no transfers between Level 1 investments, Level 2 investments, or Level 3 investments that had a significant impact to the Fund. The Fund’s policy is to recognize transfers between levels at the beginning of the reporting period.
A reconciliation of Level 3 investments is presented when the Fund has a significant amount of Level 3 investments at the beginning, interim, or end of the period in relation to net assets. At Nov. 30, 2014, there were no Level 3 investments.
4. Dividend and Distribution Information
Income and long-term capital gain distributions are determined in accordance with federal income tax regulations, which may differ from U.S. GAAP. Additionally, distributions from net short-term gains on sales of investment securities are treated as ordinary income for federal income tax purposes. The tax character of dividends and distributions paid during the years ended Nov. 30, 2014 and 2013 was as follows:
| | | | | | | | |
| | | Year ended | |
| | | 11/30/14 | | | 11/30/13 | |
Ordinary income | | $ | 74,249,879 | | | $ | 59,945,210 | |
5. Components of Net Assets on a Tax Basis
As of Nov. 30, 2014, the components of net assets on a tax basis were as follows:
| | | | |
Shares of beneficial interest | | $ | 5,428,527,454 | |
Undistributed ordinary income | | | 15,784,376 | |
*Capital loss carryforwards | | | (114,396,206 | ) |
Unrealized appreciation | | | 1,479,731,380 | |
| | | | |
Net assets | | $ | 6,809,647,004 | |
| | | | |
| * | The amount of this loss which can be utilized in subsequent years may be subject to an annual limitation in accordance with the Internal Revenue Code due to the Fund merger with the Delaware Large Cap Value Fund in May 2012. |
The differences between book basis and tax basis components of net assets are primarily attributable to tax deferral of losses on wash sales.
For financial reporting purposes, capital accounts are adjusted to reflect the tax character of permanent book/tax differences. Reclassifications are primarily due to tax treatment of gain (loss) from redemptions in-kind, and tax treatment of non-deductible expenses. Results of operations and net assets were not affected by these reclassifications. For the year ended Nov. 30, 2014, the Fund recorded the following reclassifications:
33
Notes to financial statements
Delaware Value® Fund
5. Components of Net Assets on a Tax Basis (continued)
| | | | |
Undistributed net investment income | | $ | 4,800 | |
Accumulated net realized loss | | | (458,596 | ) |
Paid-in capital | | | 453,796 | |
For federal income tax purposes, capital loss carryforwards may be carried forward and applied against future capital gains. $72,796,300 was utilized in 2014. Capital loss carryforwards remaining at Nov. 30, 2014 will expire as follows: $30,822,232 expires in 2015, $57,684,984 expires in 2016, and $25,888,990 expires in 2017.
On Dec. 22, 2010, the Regulated Investment Company Modernization Act of 2010 (the Act) was enacted, which changed various technical rules governing the tax treatment of regulated investment companies. The changes are generally effective for taxable years beginning after the date of enactment. Under the Act, the Fund is permitted to carry forward capital losses incurred in taxable years beginning after the date of enactment for an unlimited period. However, any losses incurred during those future taxable years will be required to be utilized prior to the losses incurred in pre-enactment taxable years, which carry an expiration date. As a result of this ordering rule, pre-enactment capital loss carryforwards may be more likely to expire unused. Additionally, post-enactment capital loss carryforwards will retain their character as either short-term or long-term capital losses rather than being considered all short-term as permitted under previous regulation. At Nov. 30, 2014, there were no capital loss carryforwards incurred that will be carried forward under the Act.
34
6. Capital Shares
Transactions in capital shares were as follows:
| | | | | | | | |
| | | Year ended | |
| | | 11/30/14 | | | 11/30/13 | |
Shares sold: | | | | | | | | |
Class A | | | 58,473,483 | | | | 37,771,238 | |
Class B | | | 1,977 | | | | 3,245 | |
Class C | | | 12,223,895 | | | | 7,641,906 | |
Class R | | | 1,742,711 | | | | 403,911 | |
Institutional Class | | | 118,587,176 | | | | 86,718,655 | |
| | |
Shares issued upon reinvestment of dividends and distributions: | | | | | | | | |
Class A | | | 1,506,239 | | | | 1,991,397 | |
Class B | | | 2,415 | | | | 4,949 | |
Class C | | | 93,355 | | | | 86,056 | |
Class R | | | 12,638 | | | | 9,653 | |
Institutional Class | | | 2,557,056 | | | | 2,147,097 | |
| | | | | | | | |
| | | 195,200,945 | | | | 136,778,107 | |
| | | | | | | | |
| | |
Shares redeemed: | | | | | | | | |
Class A | | | (33,345,452 | ) | | | (13,439,562 | ) |
Class B | | | (282,680 | ) | | | (275,129 | ) |
Class C | | | (1,925,042 | ) | | | (1,283,917 | ) |
Class R | | | (434,451 | ) | | | (107,716 | ) |
Institutional Class | | | (33,418,372 | ) | | | (17,924,600 | ) |
| | | | | | | | |
| | | (69,405,997 | ) | | | (33,030,924 | ) |
| | | | | | | | |
Net increase | | | 125,794,948 | | | | 103,747,183 | |
| | | | | | | | |
For the years ended Nov. 30, 2014 and 2013, 174,400 Class B shares were converted to 173,894 Class A shares valued at $3,000,083, and 152,372 Class B shares were converted to 151,508 Class A shares valued at $2,125,580, respectively. The respective amounts are included in Class B redemptions and Class A subscriptions in the table above and the “Statements of changes in net assets.”
Certain shareholders may exchange shares of one class of shares for shares of another class in the Fund. For the year ended Nov. 30, 2014, exchange transactions were as follows:
| | | | | | | | | | |
| Exchange Redemptions | | Exchange Subscriptions |
Class A Shares | | Class C Shares | | Institutional Class Shares | | Class A Shares | | Institutional Class Shares | | Value |
| 5,774 | | 10,214 | | 3,089 | | 7,161 | | 11,891 | | $329,050 |
These exchange transactions are included as subscriptions and redemptions in the tables above and the “Statements of changes in net assets.”
35
Notes to financial statements
Delaware Value® Fund
7. Line of Credit
The Fund, along with certain other funds in the Delaware Investments® Family of Funds (Participants), was a participant in a $225,000,000 revolving line of credit intended to be used for temporary or emergency purposes as an additional source of liquidity to fund redemptions of investor shares. Under the agreement, the Participants were charged an annual commitment fee of 0.08%, which was allocated across the Participants on the basis of each Participant’s allocation of the entire facility. The Participants were permitted to borrow up to a maximum of one third of their net assets under the agreement. Each Participant was individually, and not jointly, liable for its particular advances, if any, under the line of credit. The line of credit available under the agreement expired on Nov. 10, 2014.
On Nov. 10, 2014, the Fund, along with the other Participants, entered into an amendment to the agreement for a $275,000,000 revolving line of credit. The line of credit is to be used as described above and operates in substantially the same manner as the original agreement. The line of credit available under the agreement expires on Nov. 9, 2015.
The Fund had no amounts outstanding as of Nov. 30, 2014 or at any time during the year then ended.
8. Offsetting
In December 2011, the Financial Accounting Standards Board (FASB) issued guidance that expands disclosure requirements on the offsetting of certain assets and liabilities. The disclosures are required for investments and derivative financial instruments subject to master netting or similar agreements which are eligible for offset on the “Statement of assets and liabilities” and require an entity to disclose both gross and net information about such investments and transactions in the financial statements. In January 2013, the FASB issued guidance that clarifies which investments and transactions are subject to the offsetting disclosure requirements. The scope of the disclosure requirements for offsetting is limited to derivative instruments, repurchase agreements and reverse repurchase agreements, and securities borrowing. The guidance is effective for financial statements with fiscal years beginning on or after Jan. 1, 2013, and interim periods within those fiscal years. The Fund adopted the disclosure provisions on offsetting during the current reporting period.
In order to better define its contractual rights and to secure rights that will help the Fund mitigate its counterparty risk, the Fund entered into an International Swaps and Derivatives Association, Inc. Master Agreement (ISDA Master Agreement) or a similar agreement with each of its derivative contract counterparties. An ISDA Master Agreement is a bilateral agreement between the Fund and a counterparty that governs certain over-the-counter (OTC) derivatives and foreign exchange contracts and typically contains, among other things, collateral posting items and netting provisions in the event of a default and/or termination event. Under an ISDA Master Agreement, the Fund may, under certain circumstances, offset with the counterparty certain derivative financial instrument’s payables and/or receivables with collateral held and/or posted and create one single net payment. The provisions of the ISDA Master Agreement typically permit a single net payment in the event of default (close-out), including the bankruptcy or insolvency of the counterparty. However, bankruptcy or insolvency laws of a particular jurisdiction may impose restrictions on or prohibitions against the right of offset in bankruptcy, insolvency or other events.
36
For financial reporting purposes, the Fund does not offset derivative assets and derivative liabilities that are subject to netting arrangements on the “Statement of assets and liabilities.”
At Nov. 30, 2014, the Fund had the following assets and liabilities subject to offsetting provisions:
Master Repurchase Agreements
| | | | | | | | | | | | | | | | | | | | | | | | | |
| | | | | Fair Value of | | | | | | |
| | | Repurchase | | Non-Cash | | Cash Collateral | | | | |
Counterparty | | Agreements | | Collateral Received | | Received | | Net Amount(a) | | |
Bank of America Merrill Lynch | | | $ | 38,432,835 | | | | $ | (38,432,835 | ) | | | $ | — | | | | $ | — | | | |
Bank of Montreal | | | | 12,810,945 | | | | | (12,810,945 | ) | | | | — | | | | | — | | | |
BNP Paribas | | | | 57,761,220 | | | | | (57,761,220 | ) | | | | — | | | | | — | | | |
| | | | | | | | | | | | | | | | | | | | | | | |
Total | | | $ | 109,005,000 | | | | $ | (109,005,000 | ) | | | $ | — | | | | $ | — | | | |
| | | | | | | | | | | | | | | | | | | | | | | |
(a)Net amount represents the receivable/(payable) that would be due from/(to) the counterparty in the event of default.
9. Securities Lending
The Fund, along with other funds in the Delaware Investments® Family of Funds, may lend its securities pursuant to a security lending agreement (Lending Agreement) with The Bank of New York Mellon (BNY Mellon). At the time a security is loaned, the borrower must post collateral equal to the required percentage of the market value of the loaned security, including any accrued interest. The required percentage is: (1) 102% with respect to U.S. securities and foreign securities that are denominated and payable in U.S. dollars; and (2) 105% with respect to foreign securities. With respect to each loan, if on any business day the aggregate market value of securities collateral plus cash collateral held is less than the aggregate market value of the securities which are the subject of such loan, the borrower will be notified to provide additional collateral by the end of the following business day which, together with the collateral already held, will be not less than the applicable initial collateral requirements for such security loan. If the aggregate market value of securities collateral and cash collateral held with respect to a security loan exceeds the applicable initial collateral requirement, upon the request of the borrower, BNY Mellon must return enough collateral to the borrower by the end of the following business day to reduce the value of the remaining collateral to the applicable initial collateral requirement for such security loan. As a result of the foregoing, the value of the collateral held with respect to a loaned security on any particular day may be more or less than the value of the security on loan.
Cash collateral received is generally invested in the Delaware Investments Collateral Fund No. 1 (Collective Trust) established by BNY Mellon for the purpose of investment on behalf of funds managed by DMC that participate in BNY Mellon’s securities lending program. The Collective Trust may invest in U.S. government securities and high-quality corporate debt, asset-backed and other money market securities, and in repurchase agreements collateralized by such securities, provided that the Collective Trust will generally have a dollar-weighted average portfolio maturity of 60 days or less. The Fund can also accept U.S. government securities and letters of credit (non-cash collateral) in connection with securities loans. In the event of default or bankruptcy by the lending agent, realization, and/or retention of the collateral may be subject to legal proceedings. In the event the borrower fails to return loaned
37
Notes to financial statements
Delaware Value® Fund
9. Securities Lending (continued)
securities and the collateral received is insufficient to cover the value of the loaned securities and provided such collateral shortfall is not the result of investment losses, the lending agent has agreed to pay the amount of the shortfall to the Fund or, at the discretion of the lending agent, replace the loaned securities. The Fund continues to record dividends or interest, as applicable, on the securities loaned and is subject to changes in value of the securities loaned that may occur during the term of the loan. The Fund has the right under the Lending Agreement to recover the securities from the borrower on demand. With respect to security loans collateralized by non-cash collateral, the Fund receives loan premiums paid by the borrower. With respect to security loans collateralized by cash collateral, the earnings from the collateral investments are shared among the Fund, the security lending agent, and the borrower. The Fund records security lending income net of allocations to the security lending agent and the borrower.
The Collective Trust used for the investment of cash collateral received from borrowers of securities seeks to maintain a net asset value per unit of $1.00, but there can be no assurance that it will always be able to do so. The Fund may incur investment losses as a result of investing securities lending collateral in the Collective Trust. This could occur if an investment in the Collective Trust defaulted or if it were necessary to liquidate assets in the Collective Trust to meet returns on outstanding security loans at a time when the Collective Trust’s net asset value per unit was less than $1.00. Under those circumstances, the Fund may not receive an amount from the Collective Trust that is equal in amount to the collateral the Fund would be required to return to the borrower of the securities and the Fund would be required to make up for this shortfall.
During the year ended Nov. 30, 2014, the Fund had no securities out on loan.
10. Credit and Market Risk
The Fund may invest up to 15% of its net assets in illiquid securities, which may include securities with contractual restrictions on resale, securities exempt from registration under Rule 144A of the Securities Act of 1933, as amended, and other securities which may not be readily marketable. The relative illiquidity of these securities may impair the Fund from disposing of them in a timely manner and at a fair price when it is necessary or desirable to do so. While maintaining oversight, the Fund’s Board has delegated to DMC the day-to-day functions of determining whether individual securities are liquid for purposes of the Fund’s limitation on investments in illiquid securities. Securities eligible for resale pursuant to Rule 144A, which are determined to be liquid, are not subject to the Fund’s 15% limit on investments in illiquid securities. As of Nov. 30, 2014, there were no Rule 144A securities held by the fund and no securities have been determined to be illiquid under the Fund’s Liquidity Procedures.
11. Contractual Obligations
The Fund enters into contracts in the normal course of business that contain a variety of indemnifications. The Fund’s maximum exposure under these arrangements is unknown. However, the Fund has not had prior claims or losses pursuant to these contracts. Management has reviewed the Fund’s existing contracts and expects the risk of loss to be remote.
38
12. In-Kind Redemptions
During the year ended Nov. 30, 2014, the Fund satisfied withdrawal requests with transfers of securities and cash of $12,032,738, resulting in net realized gain of $458,596.
13. Recent Accounting Pronouncements
In June 2014, the FASB issued guidance to improve the financial reporting of reverse repurchase agreements and other similar transactions. The guidance includes expanded disclosure requirements for entities that enter into reverse repurchase agreements and similar transactions accounted for as secured borrowings. The guidance is effective for financial statements with fiscal years beginning on or after Dec. 15, 2014 and interim periods within those fiscal years. Management is evaluating the impact, if any, of this guidance on the Fund’s financial statement disclosures.
14. Subsequent Events
Management has determined that no other material events or transactions occurred subsequent to Nov. 30, 2014, that would require recognition or disclosure in the Fund’s financial statements.
39
Report of independent
registered public accounting firm
To the Board of Trustees of Delaware Group® Equity Funds II
and Shareholders of Delaware Value® Fund:
In our opinion, the accompanying statement of assets and liabilities, including the schedule of investments, and the related statements of operations and of changes in net assets and the financial highlights present fairly, in all material respects, the financial position of Delaware Value Fund (constituting Delaware Group Equity Funds II, hereafter referred to as the “Fund”) at November 30, 2014, the results of its operations for the year then ended, the changes in its net assets for each of the two years in the period then ended and the financial highlights for each of the five years in the period then ended, in conformity with accounting principles generally accepted in the United States of America. These financial statements and financial highlights (hereafter referred to as “financial statements”) are the responsibility of the Fund’s management. Our responsibility is to express an opinion on these financial statements based on our audits. We conducted our audits of these financial statements in accordance with the standards of the Public Company Accounting Oversight Board (United States). Those standards require that we plan and perform the audit to obtain reasonable assurance about whether the financial statements are free of material misstatement. An audit includes examining, on a test basis, evidence supporting the amounts and disclosures in the financial statements, assessing the accounting principles used and significant estimates made by management, and evaluating the overall financial statement presentation. We believe that our audits, which included confirmation of securities at November 30, 2014 by correspondence with the custodian and brokers, and the application of alternative auditing procedures where confirmations of security purchases had not been received, provide a reasonable basis for our opinion.
PricewaterhouseCoopers LLP
Philadelphia, Pennsylvania
January 22, 2015
40
Other Fund information (Unaudited)
Delaware Value® Fund
Tax Information
The information set forth below is for the Fund’s fiscal year as required by federal income tax laws. Shareholders, however, must report distributions on a calendar year basis for income tax purposes, which may include distributions for portions of two fiscal years of the Fund. Accordingly, the information needed by shareholders for income tax purposes will be sent to them in January of each year. Please consult your tax advisor for proper treatment of this information.
All disclosures are based on financial information available as of the date of this annual report and, accordingly are subject to change. For any and all items requiring reporting, it is the intention of the Fund to report the maximum amount permitted under the Internal Revenue Code and the regulations thereunder.
For the fiscal year ended Nov. 30, 2014, the Fund reports distributions paid during the year as follows:
| | | | |
(A) Ordinary Income Distributions (Tax Basis)* | | | 100.00 | % |
(B) Qualified Dividends1 | | | 100.00 | % |
(A) is based on a percentage of the Fund’s total distributions.
(B) is based on the Fund’s ordinary income distributions.
| 1 | Qualified dividends represent dividends which qualify for the corporate dividends received deduction. |
| * | For the fiscal year ended Nov. 30, 2014, certain dividends paid by the Fund may be subject to a maximum tax rate of 20%. The percentage of dividends paid by the Fund from ordinary income reported as qualified dividend income is 100%. Complete information will be computed and reported in conjunction with your 2014 Form 1099-DIV, as applicable. |
For the fiscal year ended Nov. 30, 2014, certain interest income paid by the Fund, determined to be Qualified Interest Income may be subject to relief from U.S. withholding for foreign shareholders, as provided by the American Jobs Creation Act of 2004, and by Tax Relief Unemployment Insurance Reauthorization and Job Creations Act of 2010 and as extended by the American Taxpayer Relief Act of 2012. For the fiscal year ended Nov. 30, 2014, the Fund has reported maximum distributions of Qualified Interest Income of $41,173.
Board consideration of Delaware Value Fund investment advisory agreement
At a meeting held on Aug. 19-21, 2014 (the “Annual Meeting”), the Board of Trustees (the “Board”), including a majority of disinterested or independent Trustees, approved the renewal of the Investment Management Agreement for Delaware Value Fund (the “Fund”). In making its decision, the Board considered information furnished at regular quarterly Board meetings, including reports detailing Fund performance, investment strategies and expenses, as well as information prepared specifically in connection with the renewal of the investment advisory contract. Information furnished specifically in connection with the renewal of the Investment Management Agreement with Delaware Management Company (“DMC”) included materials provided by DMC and its affiliates (“Delaware Investments”) concerning, among other things, the nature, extent and quality of services provided to the Fund, the costs of such services to the Fund, economies of scale and the financial condition and profitability of Delaware Investments. In addition, in connection with the Annual Meeting, reports were provided
41
Other Fund information (Unaudited)
Delaware Value® Fund
Board consideration of Delaware Value Fund investment advisory agreement (continued)
to the Trustees in May 2014 and included reports provided by Lipper, Inc., an independent statistical compilation organization (“Lipper”). The Lipper reports compared the Fund’s investment performance and expenses with those of other comparable mutual funds. The Independent Trustees reviewed and discussed the Lipper reports with independent legal counsel to the Independent Trustees. The Board requested and received information regarding DMC’s policy with respect to advisory fee levels and its breakpoint philosophy; the structure of portfolio manager compensation; the investment manager’s profitability; comparative client fee information; and any constraints or limitations on the availability of securities for certain investment styles, which had in the past year inhibited, or which were likely in the future to inhibit, DMC’s ability to invest fully in accordance with Fund policies.
In considering information relating to the approval of the Fund’s advisory agreement, the Independent Trustees received assistance and advice from and met separately with independent legal counsel to the Independent Trustees. Although the Board gave attention to all information furnished, the following discussion identifies, under separate headings, the primary factors taken into account by the Board during its contract renewal considerations.
Nature, Extent and Quality of Service. The Board considered the services provided by Delaware Investments to the Fund and its shareholders. In reviewing the nature, extent and quality of services, the Board considered reports furnished to it throughout the year, which covered matters such as the relative performance of the Fund, compliance of portfolio managers with the investment policies, strategies and restrictions for the Fund, compliance by DMC and Delaware Distributors, L.P. (together, “Management”) personnel with the Code of Ethics adopted throughout the Delaware Investments® Family of Funds complex and adherence to fair value pricing procedures as established by the Board. The Board was pleased with the current staffing of the Fund’s investment manager and the emphasis placed on research in the investment process. The Board recognized DMC’s receipt of several industry distinctions. The Board gave favorable consideration to DMC’s efforts to control expenditures while maintaining service levels committed to Fund matters. The Board noted that, in the third and fourth quarters of 2013, Management reduced the maximum 12b-1 fee for certain funds; and in November 2013 Management negotiated a substantial reduction in fees for fund accounting services provided to the Funds. The Board noted the benefits provided to Fund shareholders through each shareholder’s ability to exchange an investment in one Delaware Investments fund for the same class of shares in another Delaware Investments fund without a sales charge, to reinvest Fund dividends into additional shares of the Fund or into additional shares of other Delaware Investments funds and the privilege to combine holdings in other Delaware Investments funds to obtain a reduced sales charge. The Board was satisfied with the nature, extent and quality of the overall services provided by Delaware Investments.
Investment Performance. The Board placed significant emphasis on the investment performance of the Fund in view of the importance of investment performance to shareholders. Although the Board gave appropriate consideration to performance reports and discussions with portfolio managers at Investment Committee meetings throughout the year, the Board gave particular weight to the Lipper reports furnished for the Annual Meeting. The Lipper reports prepared for the Fund showed the investment performance of its Class A shares in comparison to a group of similar funds as selected by Lipper (the “Performance Universe”). A fund with the best performance ranked first, and a fund with the poorest
42
performance ranked last. The highest/best performing 25% of funds in the Performance Universe make up the first quartile; the next 25%, the second quartile; the next 25%, the third quartile; and the poorest/ worst performing 25% of funds in the Performance Universe make up the fourth quartile. Comparative annualized performance for the Fund was shown for the past 1-, 3-, 5- and 10-year periods, to the extent applicable, ended March 31, 2014. The Board’s objective is that the Fund’s performance for the periods considered be at or above the median of its Performance Universe. The following paragraph summarizes the performance results for the Fund and the Board’s view of such performance.
The Performance Universe for the Fund consisted of the Fund and all retail and institutional large cap value funds as selected by Lipper. The Lipper report comparison showed that the Fund’s total return for the 1- and 5-year periods was in the second quartile of its Performance Universe. The report further showed that the Fund’s total return for the 3- and 10-year periods was in the first quartile of its Performance Universe. The Board was satisfied with performance.
Comparative Expenses. The Board considered expense comparison data for the Delaware Investments® Family of Funds. Management provided the Board with information on pricing levels and fee structures for the Fund as of its most recently completed fiscal year. The Board also focused on the comparative analysis of effective management fees and total expense ratios of the Fund versus effective management fees and expense ratios of a group of similar funds as selected by Lipper (the “Expense Group”). In reviewing comparative costs, the Fund’s contractual management fee and the actual management fee incurred by the Fund were compared with the contractual management fees (assuming all funds in the Expense Group were similar in size to the Fund) and actual management fees (as reported by each fund) within the Expense Group, taking into account any applicable breakpoints and fee waivers. The Fund’s total expenses were also compared with those of its Expense Group. The Lipper total expenses, for comparative consistency, were shown by Lipper for Class A shares and comparative total expenses including 12b-1 and non 12b-1 service fees. The Board considered fees paid to Delaware Investments for non-management services. The Board’s objective is to limit the Fund’s total expense ratio to be competitive with that of the Expense Group. The following paragraph summarizes the expense results for the Fund and the Board’s view of such expenses.
The expense comparisons for the Fund showed that its actual management fee and total expenses were in the quartile with the second lowest expenses of its Expense Group. The Board was satisfied with the management fee and total expenses of the Fund in comparison to those of its Expense Group as shown in the Lipper report.
Management Profitability. The Board considered the level of profits realized by Delaware Investments in connection with the operation of the Fund. In this respect, the Board reviewed the Investment Management Profitability Analysis that addressed the overall profitability of Delaware Investments’ business in providing management and other services to each of the individual funds and the Delaware Investments Family of Funds as a whole. Specific attention was given to the methodology followed in allocating costs for the purpose of determining profitability. Management stated that the level of profits of Delaware Investments, to a certain extent, reflects recent operational cost savings and efficiencies initiated by Delaware Investments. The Board considered Delaware Investments’ efforts to improve services provided to fund shareholders and to meet additional regulatory and compliance requirements resulting from recent industry-wide Securities and Exchange Commission initiatives. The Board also
43
Other Fund information (Unaudited)
Delaware Value® Fund
Board consideration of Delaware Value Fund investment advisory agreement (continued)
considered the extent to which Delaware Investments might derive ancillary benefits from fund operations, including the potential for procuring additional business as a result of the prestige and visibility associated with its role as service provider to the Delaware Investments® Family of Funds and the benefits from allocation of fund brokerage to improve trading efficiencies. The Board found that the management fees were reasonable in light of the services rendered and the level of profitability of Delaware Investments.
Economies of Scale. The Trustees considered whether economies of scale are realized by Delaware Investments as the Fund’s assets increase and the extent to which any economies of scale are reflected in the level of management fees charged. The Trustees reviewed the standardized advisory fee pricing and structure, approved by the Board and shareholders, which includes breakpoints. Breakpoints in the advisory fee occur when the advisory fee rate is reduced on assets in excess of specified levels. Breakpoints result in a lower advisory fee than would otherwise be the case on all assets when the asset levels specified are exceeded. The Board noted that the fee under the Fund’s management contract fell within the standard structure. The Board also noted that the Fund’s assets exceeded the final breakpoint level. The Board believed that, given the extent to which economies of scale might be realized by the advisor and its affiliates, the schedule of fees under the Investment Management Agreement provides a sharing of benefits with the Fund and its shareholders.
44
This page intentionally left blank.
Board of trustees / directors and officers addendum
Delaware Investments® Family of Funds
A mutual fund is governed by a Board of Trustees / Directors (“Trustees”), which has oversight responsibility for the management of a fund’s business affairs. Trustees establish procedures and oversee and review the performance of the investment manager, the distributor, and others who perform services for the fund. The independent fund trustees, in particular, are advocates
| | | | |
| | | | | |
| Name, Address, | | Position(s) | | Length of |
| and Birth Date | | Held with Fund(s) | | Time Served |
Interested Trustee | | | | |
Patrick P. Coyne1 | | Chairman, President, | | Chairman and Trustee |
| 2005 Market Street | | Chief Executive Officer, | | since August 16, 2006 |
| Philadelphia, PA 19103 | | and Trustee | | |
| April 1963 | | | | President and |
| | | | Chief Executive Officer |
| | | | since August 1, 2006 |
| | | | |
| | | | |
Independent Trustees | | | | |
Thomas L. Bennett | | Trustee | | Since March 2005 |
| 2005 Market Street | | | | |
| Philadelphia, PA 19103 | | | | |
| October 1947 | | | | |
| Joseph W. Chow | | Trustee | | Since January 2013 |
| 2005 Market Street | | | | |
| Philadelphia, PA 19103 | | | | |
| January 1953 | | | | |
| | | | | |
| | | | | |
| John A. Fry | | Trustee | | Since January 2001 |
| 2005 Market Street | | | | |
| Philadelphia, PA 19103 | | | | |
| May 1960 | | | | |
| | | | | |
| | | | | |
| | | | |
1 Patrick P. Coyne is considered to be an “Interested Trustee” because he is an executive officer of the Fund’s(s’) investment advisor.
46
for shareholder interests. Each trustee has served in that capacity since he or she was elected to or appointed to the Board of Trustees, and will continue to serve until his or her retirement or the election of a new trustee in his or her place. The following is a list of the Trustees and Officers with certain background and related information.
| | | | |
| | | Number of Portfolios in | | |
| Principal Occupation(s) | | Fund Complex Overseen | | Other Directorships |
| During the Past Five Years | | by Trustee or Officer | | Held by Trustee or Officer |
| | | | |
| Patrick P. Coyne has served in | | 65 | | Board of Governors Member |
| various executive capacities | | | | Investment Company |
| at different times at | | | | Institute (ICI) |
| Delaware Investments.2 | | | | |
| | | | Director and Audit |
| | | | Committee Member |
| | | | Kaydon Corp. |
| | | | (2007–2013) |
| | | | |
| Private Investor | | 65 | | Director |
| (March 2004–Present) | | | | Bryn Mawr Bank Corp. (BMTC) |
| | | | (2007–2011) |
| | | | | |
| Executive Vice President | | 65 | | Director and Audit Committee |
| (Emerging Economies | | | | Member — Hercules |
| Strategies, Risk and | | | | Technology Growth |
| Corporate Administration) | | | | Capital, Inc. |
| State Street Corporation | | | | (2004-2014) |
| (July 2004–March 2011) | | | | |
| President | | 65 | | Director — Hershey Trust |
| Drexel University | | | | Company |
| (August 2010–Present) | | | | |
| | | | Director, Audit Committee, |
| President | | | | and Governance Committee |
| Franklin & Marshall College | | | | Member Community |
| (July 2002–July 2010) | | | | Health Systems |
| 2 | Delaware Investments is the marketing name for Delaware Management Holdings, Inc. and its subsidiaries, including the Fund’s(s’) investment advisor, principal underwriter, and its transfer agent. |
47
Board of trustees / directors and officers addendum
Delaware Investments® Family of Funds
| | | | |
| Name, Address, | | Position(s) | | Length of |
| and Birth Date | | Held with Fund(s) | | Time Served |
Independent Trustees (continued) | | | | |
| Lucinda S. Landreth | | Trustee | | Since March 2005 |
| 2005 Market Street | | | | |
| Philadelphia, PA 19103 | | | | |
| June 1947 | | | | |
| Frances A. Sevilla-Sacasa | | Trustee | | Since September 2011 |
| 2005 Market Street | | | | |
| Philadelphia, PA 19103 | | | | |
January 1956 | | | | |
| Thomas K. Whitford | | Trustee | | Since January 2013 |
| 2005 Market Street | | | | |
| Philadelphia, PA 19103 | | | | |
March 1956 | | | | |
48
| | | | |
| | | Number of Portfolios in | | |
| Principal Occupation(s) | | Fund Complex Overseen | | Other Directorships |
| During the Past Five Years | | by Trustee or Officer | | Held by Trustee or Officer |
| | |
| | | | |
| Private Investor | | 65 | | None |
(2004–Present) | | | | |
| Chief Executive Officer — | | 65 | | Trust Manager and |
| Banco Itaú | | | | Audit Committee |
| International | | | | Member — Camden |
(April 2012–Present) | | | | Property Trust |
| Executive Advisor to Dean | | | | |
(August 2011–March 2012) and Interim Dean | | | | |
| (January 2011–July 2011) — | | | | |
| University of Miami School of | | | | |
Business Administration | | | | |
| President — U.S. Trust, | | | | |
| Bank of America Private | | | | |
| Wealth Management | | | | |
| (Private Banking) | | | | |
| (July 2007–December 2008) | | | | |
| Vice Chairman | | 65 | | Director — HSBC Finance |
| (2010–April 2013) | | | | Corporation and HSBC |
| Chief Administrative | | | | North America Holdings Inc. |
Officer (2008–2010) and Executive Vice | | | | |
| President and Chief | | | | |
| Administrative Officer | | | | |
| (2007–2009) — | | | | |
| PNC Financial | | | | |
| Services Group | | | | |
49
Board of trustees / directors and officers addendum
Delaware Investments® Family of Funds
| | | | |
| Name, Address, | | Position(s) | | Length of |
| and Birth Date | | Held with Fund(s) | | Time Served |
Independent Trustees (continued) | | | | |
| Janet L. Yeomans | | Trustee | | Since April 1999 |
| 2005 Market Street | | | | |
| Philadelphia, PA 19103 | | | | |
| July 1948 | | | | |
| | | | |
| | | | |
| | | | |
| | | | |
| | | | |
| | | | |
| | | | | |
| J. Richard Zecher | | Trustee | | Since March 2005 |
| 2005 Market Street | | | | |
| Philadelphia, PA 19103 | | | | |
| July 1940 | | | | |
| | | | |
| | | | |
| | | | |
| | | | |
| | | | | |
50
| | | | |
| | | Number of Portfolios in | | |
| Principal Occupation(s) | | Fund Complex Overseen | | Other Directorships |
| During the Past Five Years | | by Trustee or Officer | | Held by Trustee or Officer |
| | |
| | | | |
| Vice President and Treasurer | | 65 | | Director, Audit and |
| (January 2006–July 2012) | | | | Compliance Committee Chair, |
| Vice President — | | | | Investment Committee |
| Mergers & Acquisitions | | | | Member and Governance |
| (January 2003–January 2006), | | | | Committee Member |
| and Vice President | | | | Okabena Company |
| and Treasurer | | | | |
| (July 1995–January 2003) | | | | Chair — 3M |
| 3M Corporation | | | | Investment Management |
| | | | Company |
| | | | | (2005–2012) |
| Founder | | 65 | | Director and Compensation |
| Investor Analytics | | | | Committee Chairman |
| (Risk Management) | | | | Investor Analytics |
| (May 1999–Present) | | | | |
| | | | Director — P/E Investments |
| Founder | | | | |
| P/E Investments | | | | |
| (Hedge Fund) | | | | |
| (September 1996–Present) | | | | |
51
Board of trustees / directors and officers addendum
Delaware Investments® Family of Funds
| | | | |
| Name, Address, | | Position(s) | | Length of |
| and Birth Date | | Held with Fund(s) | | Time Served |
Officers | | | | |
| David F. Connor | | Senior Vice President, | | Senior Vice President, |
| 2005 Market Street | | Deputy General | | Deputy General Counsel |
| Philadelphia, PA 19103 | | Counsel, and Secretary | | since May 2013; |
| December 1963 | | | | Vice President, Deputy |
| | | | General Counsel |
| | | | September 2000 – |
| | | | May 2013; Secretary since |
| | | | | October 2005 |
| Daniel V. Geatens | | Vice President | | Treasurer since October 2007 |
| 2005 Market Street | | and Treasurer | | |
| Philadelphia, PA 19103 | | | | |
| October 1972 | | | | |
| David P. O’Connor | | Executive Vice President, | | Executive Vice President |
| 2005 Market Street | | General Counsel | | since February 2012; |
| Philadelphia, PA 19103 | | and Chief Legal Officer | | Senior Vice President |
| February 1966 | | | | October 2005 – |
| | | | February 2012; |
| | | | General Counsel and |
| | | | Chief Legal Officer |
| | | | | since October 2005 |
| Richard Salus | | Senior Vice President | | Chief Financial Officer |
| 2005 Market Street | | and Chief Financial Officer | | since November 2006 |
| Philadelphia, PA 19103 | | | | |
October 1963 | | | | |
The Statement of Additional Information for the Fund(s) includes additional information about the Trustees and Officers and is available, without charge, upon request by calling 800 523-1918.
52
| | | | |
| | | Number of Portfolios in | | |
| Principal Occupation(s) | | Fund Complex Overseen | | Other Directorships |
| During the Past Five Years | | by Trustee or Officer | | Held by Trustee or Officer |
| | |
| | | | |
| David F. Connor has served as | | 65 | | None3 |
| Deputy General Counsel of | | | | |
Delaware Investments since 2000. | | | | |
| Daniel V. Geatens has served | | 65 | | None3 |
in various capacities at different times at | | | | |
| Delaware Investments. | | | | |
| David P. O’Connor has served | | 65 | | None3 |
in various executive and legal capacities at different times at Delaware Investments. | | | | |
| Richard Salus has served in | | 65 | | None3 |
various executive capacities at different times at | | | | |
Delaware Investments. | | | | |
| 3 | David F. Connor, Daniel V. Geatens, David P. O’Connor, and Richard Salus serve in similar capacities for the six portfolios of the Optimum Fund Trust, which have the same investment advisor, principal underwriter, and transfer agent as the registrant. |
53
About the organization
| | | | | | |
| Board of trustees | | | | | | |
| Patrick P. Coyne | | Joseph W. Chow | | Lucinda S. Landreth | | Thomas K. Whitford |
| Chairman, President, and | | Former Executive Vice | | Former Chief Investment | | Former Vice Chairman |
| Chief Executive Officer | | President | | Officer | | PNC Financial Services Group |
| Delaware Investments® | | State Street Corporation | | Assurant, Inc. | | Pittsburgh, PA |
| Family of Funds | | Brookline, MA | | Philadelphia, PA | | |
| Philadelphia, PA | | | | | | Janet L. Yeomans |
| | John A. Fry | | Frances A. | | Former Vice President and |
| Thomas L. Bennett | | President | | Sevilla-Sacasa | | Treasurer |
| Private Investor | | Drexel University | | Chief Executive Officer | | 3M Corporation |
| Rosemont, PA | | Philadelphia, PA | | Banco Itaú | | St. Paul, MN |
| | | | International | | |
| | | | Miami, FL | | J. Richard Zecher |
| | | | | | Founder |
| | | | | | Investor Analytics |
| | | | | | Scottsdale, AZ |
Affiliated officers | | | | | | |
| David F. Connor | | Daniel V. Geatens | | David P. O’Connor | | Richard Salus |
| Senior Vice President, | | Vice President and | | Executive Vice President, | | Senior Vice President and |
| Deputy General Counsel, | | Treasurer | | General Counsel, | | Chief Financial Officer |
| and Secretary | | Delaware Investments | | and Chief Legal Officer | | Delaware Investments |
| Delaware Investments | | Family of Funds | | Delaware Investments | | Family of Funds |
| Family of Funds | | Philadelphia, PA | | Family of Funds | | Philadelphia, PA |
| Philadelphia, PA | | | | Philadelphia, PA | | |
This annual report is for the information of Delaware Value® Fund shareholders, but it may be used with prospective investors when preceded or accompanied by the Delaware Investments Fund fact sheet for the most recently completed calendar quarter. These documents are available at delawareinvestments.com.
Delaware Investments is the marketing name of Delaware Management Holdings, Inc. and its subsidiaries.
The Fund files its complete schedule of portfolio holdings with the Securities and Exchange Commission (SEC) for the first and third quarters of each fiscal year on Form N-Q. The Fund’s Forms N-Q, as well as a description of the policies and procedures that the Fund uses to determine how to vote proxies (if any) relating to portfolio securities are available without charge (i) upon request, by calling 800 523-1918; and (ii) on the SEC’s website at sec.gov. In addition, a description of the policies and procedures that the Fund uses to determine how to vote proxies (if any) relating to portfolio securities and the Fund’s Schedule of Investments are available without charge on the Fund’s website at delawareinvestments.com. The Fund’s Forms N-Q may be reviewed and copied at the SEC’s Public Reference Room in Washington, D.C.; information on the operation of the Public Reference Room may be obtained by calling 800 SEC-0330.
Information (if any) regarding how the Fund voted proxies relating to portfolio securities during the most recently disclosed 12-month period ended June 30 is available without charge (i) through the Fund’s website at delawareinvestments.com; and (ii) on the SEC’s website at sec.gov.
54
Item 2. Code of Ethics
The registrant has adopted a code of ethics that applies to the registrant’s principal executive officer, principal financial officer, principal accounting officer or controller, or persons performing similar functions, regardless of whether these individuals are employed by the registrant or a third party. A copy of the registrant’s Code of Business Ethics has been posted on the Delaware Investments Internet Web site at www.delawareinvestments.com. Any amendments to the Code of Business Ethics, and information on any waiver from its provisions granted by the registrant, will also be posted on this Web site within five business days of such amendment or waiver and will remain on the Web site for at least 12 months.
Item 3. Audit Committee Financial Expert
The registrant’s Board of Trustees/Directors has determined that certain members of the registrant’s Audit Committee are audit committee financial experts, as defined below. For purposes of this item, an “audit committee financial expert” is a person who has the following attributes:
a. An understanding of generally accepted accounting principles and financial statements;
b. The ability to assess the general application of such principles in connection with the accounting for estimates, accruals, and reserves;
c. Experience preparing, auditing, analyzing, or evaluating financial statements that present a breadth and level of complexity of accounting issues that are generally comparable to the breadth and complexity of issues that can reasonably be expected to be raised by the registrant’s financial statements, or experience actively supervising one or more persons engaged in such activities;
d. An understanding of internal controls and procedures for financial reporting; and
e. An understanding of audit committee functions.
An “audit committee financial expert” shall have acquired such attributes through:
a. Education and experience as a principal financial officer, principal accounting officer, controller, public accountant, or auditor or experience in one or more positions that involve the performance of similar functions;
b. Experience actively supervising a principal financial officer, principal accounting officer, controller, public accountant, auditor, or person performing similar functions;
c. Experience overseeing or assessing the performance of companies or public accountants with respect to the preparation, auditing, or evaluation of financial statements; or
d. Other relevant experience.
The registrant’s Board of Trustees/Directors has also determined that each member of the registrant’s Audit Committee is independent. In order to be “independent” for purposes of this item, the Audit Committee member may not: (i) other than in his or her capacity as a member of the Board of Trustees/Directors or any committee thereof, accept directly or indirectly any consulting, advisory or other compensatory fee from the issuer; or (ii) be an “interested person” of the registrant as defined in Section 2(a)(19) of the Investment Company Act of 1940.
The names of the audit committee financial experts on the registrant’s Audit Committee are set forth below:
Joseph W. Chow
Lucinda S. Landreth1
Frances A. Sevilla-Sacasa
Janet L. Yeomans
Item 4. Principal Accountant Fees and Services
(a) Audit fees.
The aggregate fees billed for services provided to the registrant by its independent auditors for the audit of the registrant’s annual financial statements and for services normally provided by the independent auditors in connection with statutory and regulatory filings or engagements were $26,750 for the fiscal year ended November 30, 2014.
The aggregate fees billed for services provided to the registrant by its independent auditors for the audit of the registrant’s financial statements and for services normally provided by the independent auditors in connection with statutory and regulatory filings or engagements were $23,435 for the fiscal year ended November 30, 2013.
(b) Audit-related fees.
The aggregate fees billed by the registrant’s independent auditors for services relating to the performance of the audit of the registrant’s financial statements and not reported under paragraph (a) of this Item were $0 for the fiscal year ended November 30, 2014.
The aggregate fees billed by the registrant’s independent auditors for services relating to the performance of the audit of the financial statements of the registrant’s investment adviser and other service providers under common control with the adviser and that relate directly to the operations or financial reporting of the registrant were $618,000 for the registrant’s fiscal year ended November 30, 2014. The percentage of these fees relating to services approved by the registrant’s Audit Committee pursuant to the de minimis exception from the pre-approval requirement in Rule 2-01(c)(7)(i)(C) of Regulation S-X was 0%. These audit-related services were as follows: year end audit procedures; group reporting and subsidiary statutory audits.
The aggregate fees billed by the registrant’s independent auditors for services relating to the performance of the audit of the registrant’s financial statements and not reported under paragraph (a) of this Item were $0 for the fiscal year ended November 30, 2013.
____________________
1 The instructions to Form N-CSR require disclosure on the relevant experience of persons who qualify as audit committee financial experts based on “other relevant experience.” The Board of Trustees/Directors has determined that Ms. Landreth qualifies as an audit committee financial expert by virtue of her experience as a financial analyst, her Chartered Financial Analyst (CFA) designation, and her service as an audit committee chairperson for a non-profit organization.
The aggregate fees billed by the registrant’s independent auditors for services relating to the performance of the audit of the financial statements of the registrant’s investment advisor and other service providers under common control with the advisor and that relate directly to the operations or financial reporting of the registrant were $618,000 for the registrant’s fiscal year ended November 30, 2013. The percentage of these fees relating to services approved by the registrant’s Audit Committee pursuant to the de minimus exception from the pre-approval requirement in Rule 2-01(c)(7)(i)(C) of Regulation S-X was 0%. These audit-related services were as follows: year end audit procedures; group reporting and subsidiary statutory audits.
(c) Tax fees.
The aggregate fees billed by the registrant’s independent auditors for tax-related services provided to the registrant were $4,741 for the fiscal year ended November 30, 2014. The percentage of these fees relating to services approved by the registrant’s Audit Committee pursuant to the de minimis exception from the pre-approval requirement in Rule 2-01(c)(7)(i)(C) of Regulation S-X was 0%. These tax-related services were as follows: review of income tax returns and review of annual excise distribution calculations.
The aggregate fees billed by the registrant’s independent auditors for tax-related services provided to the registrant’s investment adviser and other service providers under common control with the adviser and that relate directly to the operations or financial reporting of the registrant were $0 for the registrant’s fiscal year ended November 30, 2014. The percentage of these fees relating to services approved by the registrant’s Audit Committee pursuant to the de minimis exception from the pre-approval requirement in Rule 2-01(c)(7)(i)(C) of Regulation S-X was 0%.
The aggregate fees billed by the registrant’s independent auditors for tax-related services provided to the registrant were $4,500 for the fiscal year ended November 30, 2013. The percentage of these fees relating to services approved by the registrant’s Audit Committee pursuant to the de minimis exception from the pre-approval requirement in Rule 2-01(c)(7)(i)(C) of Regulation S-X was 0%. These tax-related services were as follows: review of income tax returns and review of annual excise distribution calculations.
The aggregate fees billed by the registrant’s independent auditors for tax-related services provided to the registrant’s investment adviser and other service providers under common control with the adviser and that relate directly to the operations or financial reporting of the registrant were $0 for the registrant’s fiscal year ended November 30, 2013. The percentage of these fees relating to services approved by the registrant’s Audit Committee pursuant to the de minimis exception from the pre-approval requirement in Rule 2-01(c)(7)(i)(C) of Regulation S-X was 0%.
(d) All other fees.
The aggregate fees billed for all services provided by the independent auditors to the registrant other than those set forth in paragraphs (a), (b) and (c) of this Item were $0 for the fiscal year ended November 30, 2014.
The aggregate fees billed for all services other than those set forth in paragraphs (b) and (c) of this Item provided by the registrant’s independent auditors to the registrant’s adviser and other service providers under common control with the adviser and that relate directly to the operations or financial reporting of the registrant were $0 for the registrant’s fiscal year ended November 30, 2014. The percentage of these fees relating to services approved by the registrant’s Audit Committee pursuant to the de minimis exception from the pre-approval requirement in Rule 2-01(c)(7)(i)(C) of Regulation S-X was 0%.
The aggregate fees billed for all services provided by the independent auditors to the registrant other than those set forth in paragraphs (a), (b) and (c) of this Item were $0 for the fiscal year ended November 30, 2013.
The aggregate fees billed for all services other than those set forth in paragraphs (b) and (c) of this Item provided by the registrant’s independent auditors to the registrant’s adviser and other service providers under common control with the adviser and that relate directly to the operations or financial reporting of the registrant were $0 for the registrant’s fiscal year ended November 30, 2013. The percentage of these fees relating to services approved by the registrant’s Audit Committee pursuant to the de minimis exception from the pre-approval requirement in Rule 2-01(c)(7)(i)(C) of Regulation S-X was 0%.
(e) The registrant’s Audit Committee has established pre-approval policies and procedures as permitted by Rule 2-01(c)(7)(i)(B) of Regulation S-X (the “Pre-Approval Policy”) with respect to services provided by the registrant’s independent auditors. Pursuant to the Pre-Approval Policy, the Audit Committee has pre-approved the services set forth in the table below with respect to the registrant up to the specified fee limits. Certain fee limits are based on aggregate fees to the registrant and other registrants within the Delaware Investments Family of Funds.
| Service | Range of Fees |
| Audit Services | |
| Statutory audits or financial audits for new Funds | up to $40,000 per Fund |
| Services associated with SEC registration statements (e.g., Form N-1A, Form N-14, etc.), periodic reports and other documents filed with the SEC or other documents issued in connection with securities offerings (e.g., comfort letters for closed-end Fund offerings, consents), and assistance in responding to SEC comment letters | up to $10,000 per Fund |
| Consultations by Fund management as to the accounting or disclosure treatment of transactions or events and/or the actual or potential impact of final or proposed rules, standards or interpretations by the SEC, FASB, or other regulatory or standard-setting bodies (Note: Under SEC rules, some consultations may be considered “audit-related services” rather than “audit services”) | up to $25,000 in the aggregate |
| Audit-Related Services | |
| Consultations by Fund management as to the accounting or disclosure treatment of transactions or events and /or the actual or potential impact of final or proposed rules, standards or interpretations by the SEC, FASB, or other regulatory or standard-setting bodies (Note: Under SEC rules, some consultations may be considered “audit services” rather than “audit-related services”) | up to $25,000 in the aggregate |
| Tax Services | |
| U.S. federal, state and local and international tax planning and advice (e.g., consulting on statutory, regulatory or administrative developments, evaluation of Funds’ tax compliance function, etc.) | up to $25,000 in the aggregate |
| U.S. federal, state and local tax compliance (e.g., excise distribution reviews, etc.) | up to $5,000 per Fund |
| Review of federal, state, local and international income, franchise and other tax returns | up to $5,000 per Fund |
Under the Pre-Approval Policy, the Audit Committee has also pre-approved the services set forth in the table below with respect to the registrant’s investment adviser and other entities controlling, controlled by or under common control with the investment adviser that provide ongoing services to the registrant (the “Control Affiliates”) up to the specified fee limit. This fee limit is based on aggregate fees to the investment adviser and its Control Affiliates.
| Service | Range of Fees |
| Non-Audit Services | |
| Services associated with periodic reports and other documents filed with the SEC and assistance in responding to SEC comment letters | up to $10,000 in the aggregate |
The Pre-Approval Policy requires the registrant’s independent auditors to report to the Audit Committee at each of its regular meetings regarding all services initiated since the last such report was rendered, including those services authorized by the Pre-Approval Policy.
(f) Not applicable.
(g) The aggregate non-audit fees billed by the registrant’s independent auditors for services rendered to the registrant and to its investment adviser and other service providers under common control with the adviser were $5,653,375 and $7,732,970 for the registrant’s fiscal years ended November 30, 2014 and November 30, 2013, respectively.
(h) In connection with its selection of the independent auditors, the registrant’s Audit Committee has considered the independent auditors’ provision of non-audit services to the registrant’s investment adviser and other service providers under common control with the adviser that were not required to be pre-approved pursuant to Rule 2-01(c)(7)(ii) of Regulation S-X. The Audit Committee has determined that the independent auditors’ provision of these services is compatible with maintaining the auditors’ independence.
Item 5. Audit Committee of Listed Registrants
Not applicable.
Item 6. Investments
(a) Included as part of report to shareholders filed under Item 1 of this Form N-CSR.
(b) Divestment of securities in accordance with Section 13(c) of the Investment Company Act of 1940.
Not applicable.
Item 7. Disclosure of Proxy Voting Policies and Procedures for Closed-End Management Investment Companies
Not applicable.
Item 8. Portfolio Managers of Closed-End Management Investment Companies
Not applicable.
Item 9. Purchases of Equity Securities by Closed-End Management Investment Company and Affiliated Purchasers
Not applicable.
Item 10. Submission of Matters to a Vote of Security Holders
Not applicable.
Item 11. Controls and Procedures
The registrant’s principal executive officer and principal financial officer have evaluated the registrant’s disclosure controls and procedures within 90 days of the filing of this report and have concluded that they are effective in providing reasonable assurance that the information required to be disclosed by the registrant in its reports or statements filed under the Securities Exchange Act of 1934 is recorded, processed, summarized and reported within the time periods specified in the rules and forms of the Securities and Exchange Commission.
There were no significant changes in the registrant’s internal control over financial reporting that occurred during the second fiscal quarter of the period covered by the report to stockholders included herein (i.e., the registrant’s fourth fiscal quarter) that have materially affected, or are reasonably likely to materially affect, the registrant’s internal control over financial reporting.
Item 12. Exhibits
| (a) | (1) Code of Ethics |
| |
| Not applicable. |
| |
| (2) Certifications of Principal Executive Officer and Principal Financial Officer pursuant to Rule 30a-2 under the Investment Company Act of 1940 are attached hereto as Exhibit 99.CERT. |
| |
| (3) Written solicitations to purchase securities pursuant to Rule 23c-1 under the Securities Exchange Act of 1934. |
| |
| Not applicable. |
| |
| (b) | Certifications pursuant to Section 906 of the Sarbanes-Oxley Act of 2002 are furnished herewith as Exhibit 99.906CERT. |
SIGNATURES
Pursuant to the requirements of the Securities Exchange Act of 1934 and the Investment Company Act of 1940, the registrant has duly caused this report to be signed on its behalf, by the undersigned, thereunto duly authorized.
Name of Registrant: DELAWARE GROUP® EQUITY FUNDS II
| /s/ PATRICK P. COYNE |
| By: | Patrick P. Coyne |
| Title: | Chief Executive Officer |
| Date: | February 2, 2015 |
Pursuant to the requirements of the Securities Exchange Act of 1934 and the Investment Company Act of 1940, this report has been signed below by the following persons on behalf of the registrant and in the capacities and on the dates indicated.
| /s/ PATRICK P. COYNE |
| By: | Patrick P. Coyne |
| Title: | Chief Executive Officer |
| Date: | February 2, 2015 |
| |
| /s/ RICHARD SALUS |
| By: | Richard Salus |
| Title: | Chief Financial Officer |
| Date: | February 2, 2015 |