Item 1. Reports to Stockholders
Annual report
U.S. equity mutual fund
Delaware Value® Fund
November 30, 2015
Carefully consider the Fund’s investment objectives, risk factors, charges, and expenses before investing. This and other information can be found in the Fund’s prospectus and its summary prospectus, which may be obtained by visiting delawareinvestments.com or calling 800 523-1918. Investors should read the prospectus and the summary prospectus carefully before investing.
You can obtain shareholder reports and prospectuses online instead of in the mail.
Visit delawareinvestments.com/edelivery.
Experience Delaware Investments
Delaware Investments is committed to the pursuit of consistently superior asset management and unparalleled client service. We believe in our investment processes, which seek to deliver consistent results, and in convenient services that help add value for our clients.
If you are interested in learning more about creating an investment plan, contact your financial advisor.
You can learn more about Delaware Investments or obtain a prospectus for Delaware Value® Fund at delawareinvestments.com.
Manage your investments online
| ● | | 24-hour access to your account information |
| ● | | Check your account balance and recent transactions |
| ● | | Request statements or literature |
| ● | | Make purchases and redemptions |
Delaware Management Holdings, Inc. and its subsidiaries (collectively known by the marketing name of Delaware Investments) are wholly owned subsidiaries of Macquarie Group Limited, a global provider of banking, financial, advisory, investment, and funds management services.
Neither Delaware Investments nor its affiliates noted in this document are authorized deposit-taking institutions for the purpose of the Banking Act 1959 (Commonwealth of Australia). The obligations of these entities do not represent deposits or other liabilities of Macquarie Bank Limited (MBL). MBL does not guarantee or otherwise provide assurance in respect of the obligations of these entities, unless noted otherwise.
Table of contents
Unless otherwise noted, views expressed herein are current as of Nov. 30, 2015, and subject to change for events occurring after such date.
Funds are not FDIC insured and are not guaranteed. It is possible to lose the principal amount invested.
Mutual fund advisory services provided by Delaware Management Company, a series of Delaware Management Business Trust, which is a registered investment advisor. Delaware Investments, a member of Macquarie Group, refers to Delaware Management Holdings, Inc. and its subsidiaries, including the Fund’s distributor, Delaware Distributors, L.P. Macquarie Group refers to Macquarie Group Limited and its subsidiaries and affiliates worldwide.
© 2016 Delaware Management Holdings, Inc.
All third-party marks cited are the property of their respective owners.
| | |
| Portfolio management review |
| Delaware Value® Fund | | December 8, 2015 |
Performance preview (for the year ended November 30, 2015)
| | | | | | | | |
Delaware Value Fund (Class A shares) | | | 1-year return | | | | +1.21% | |
Russell 1000 ® Value Index (benchmark) | | | 1-year return | | | | -1.11% | |
Past performance does not guarantee future results.
For complete, annualized performance for Delaware Value Fund, please see the table on page 4.
The performance of Class A shares excludes the applicable sales charge and reflects the reinvestment of all distributions. Please see page 6 for a description of the index. Index performance returns do not reflect any management fees, transaction costs, or expenses. Indices are unmanaged and one cannot invest directly in an index.
Stock prices in the United States failed to gather much momentum during the Fund’s fiscal year ended Nov. 30, 2015. There were several bouts of market turbulence throughout this period, as Europe’s economic woes, plunging oil prices, and China’s slowing growth resulted in several global market selloffs. A strong rebound in October for U.S. stocks followed by a lackluster November resulted in little overall movement for the fiscal year.
The period began on a positive note, economically, with gross domestic product (GDP) having risen 2.1% during the final three months of 2014. The first quarter of 2015 ushered in a broad slowdown, however, as inclement weather, the strong dollar, and energy-sector spending cuts resulted in GDP growth slowing to a crawl, at just 0.6%. Growth resumed in the second quarter, with GDP expanding 3.9% before easing to 2.1% in the third quarter. Over the course of the fiscal year, the unemployment rate improved, declining from 5.8% to 5.0%. In addition, the pace of new job creation was fairly robust throughout the fiscal year.
Outside of the U.S., the economic picture was less sanguine. With the notable exceptions of Germany and the United Kingdom, the European economy was anemic, prompting the European Central Bank to resume quantitative easing. Japan continued its stimulus program at a high level in
an effort to spur growth. Emerging markets struggled as China’s economy faltered.
Even for U.S. investors, the economic situation was not all rosy. The potential for an increase in interest rates hung over the market throughout the period. The fiscal year began just after the U.S. Federal Reserve ended the series of quantitative easing programs that had provided significant economic stimulus beginning in 2008. The Fed hinted throughout 2015 that an interest rate hike was not just likely, but likely to be sooner rather than later. That speculation had a dampening effect on the markets throughout the fiscal year. However, the hike did not materialize as repeated global economic shocks to the economy – the Greek debt crisis, China’s currency devaluation, and plunging worldwide oil prices, among others – gave the Fed pause. Nonetheless, at the end of the fiscal year, with the U.S. economy appearing relatively strong, many investors believed that a December 2015 rate hike was a certainty.
Oil prices fell precipitously throughout the fiscal year, bottoming out at a six-year low. Even as demand growth eased, largely the result of the Chinese economic slowdown, production held steady. In an effort to remain competitive with U.S. shale oil producers, the Organization of Petroleum Exporting Countries (OPEC) maintained production levels, creating a dramatic imbalance of supply and demand. Many U.S. producers were
1
Portfolio management review
Delaware Value® Fund
forced to cut back or close rigs during the fiscal period. Despite the possibility that geopolitical turmoil in the Middle East may constrain production, the International Energy Agency (IEA) forecasted a long, slow recovery for oil prices.
Fund performance
For the fiscal year ended Nov. 30, 2015, Delaware Value Fund returned +1.21% at net asset value and -4.60% at maximum offer price (both figures represent Class A shares with distributions reinvested). For the same period, the Fund’s benchmark, the Russell 1000 Value Index, returned -1.11%. For complete annualized performance for Delaware Value Fund please see the table on page 4.
Relative to the benchmark, the Fund benefited from its defensive positioning. In other words, we emphasized stocks that we viewed as having stronger business fundamentals. Many of these companies were in traditionally defensive sectors, such as consumer staples and healthcare, which tend to maintain more price stability in a down market. Also, when we did invest in more typically economically sensitive sectors, we tended to focus on companies with more conservative characteristics.
Within consumer staples, the Fund benefited the most from food products companies Kraft Heinz and Mondelez International. We originally invested in Kraft Foods, the predecessor of Kraft Heinz, for its strong collection of brands and its reasonably valued stock. We were also attracted to the company’s solid dividend and potential to further improve its financial strength and profitability. Apparently Heinz noticed these characteristics as well, agreeing to merge with Kraft in March 2015, a move that resulted in a sharply higher share price.
Meanwhile, shares of Mondelez – spun off from the old Kraft Foods several years ago – benefited from the company’s success in managing expenses and expanding its business
footprint. Its stock was up by approximately 13% for the fiscal year, while Kraft Heinz saw its shares gain just over 50%.
Stock selection in industrials also contributed to the Fund’s outperformance against the benchmark, especially its position in defense contractor Northrop Grumman. The company produced strong financial results despite cutbacks in U.S. military spending that seemed to concern many investors. Late in the fiscal year, Northrop Grumman further benefited from news that the company won a significant contract to build the U.S. Air Force’s next-generation Long Range Strike Bomber (LRS-B). The stock went up 10% on the news.
Other notable relative contributors included Broadcom, a maker of semiconductors for communications applications, and Lowe’s, a retailer of home improvement products. Shares of Broadcom gained sharply after the company agreed to be acquired by Avago at a significant premium. This put the company’s stock near our price target, and we ultimately exited the Fund’s position. Meanwhile, Lowe’s continued to benefit from the steady recovery in the housing market, and from the company’s efforts to improve its merchandising, which helped lift sales and earnings.
On the negative side, the Fund’s selections in the energy sector did poorly, where continued weakness in commodity prices hampered most companies. By far, the Fund’s largest detractor in the group was Marathon Oil. Its relatively high exposure to U.S. shale markets was a significant negative, as was its elevated debt level and smaller size relative to other large-cap operators. A position in Halliburton hurt performance, as reduced energy exploration activity across the industry cut into the company’s revenues and earnings. Weak market prices of crude oil and natural gas also hurt two other Fund holdings, Chevron and ConocoPhillips. We continue to closely monitor the Fund’s energy stocks for signs
2
of lasting financial stress. It’s possible that a bottoming process in oil prices is starting to take shape and our longer-term view on global oil demand remains positive.
Elsewhere, a stake in Xerox, a provider of document management and other business services, produced disappointing results. The company continued to face various business challenges that led to narrower profit margins, lower earnings, and reduced revenues. Despite recent execution challenges, in our view, Xerox has the potential to benefit from its transformation to a services-oriented business model.
We made relatively few changes to the Fund’s portfolio during the fiscal year. With the sale of Broadcom in June, we used the proceeds to establish a new position in pharmacy benefits manager Express Scripts Holding, which we viewed as a high-quality growth opportunity with an unusually attractive valuation. Another meaningful purchase was of enterprise software provider CA, which we acquired in March. The company’s recent business challenges left its stock with what we saw as a favorable risk-reward tradeoff.
We sold the Fund’s holding in Baxter International, which spun off its global pharmaceutical business, Baxalta. The new company will be focused on hematology, immunology, and oncology. With the proceeds of the Baxter sale, we added to our stake in Baxalta, which we think has an attractive valuation relative to its growth potential.
At fiscal year end, we found it difficult to identify attractive new purchase candidates in light of relatively high valuations. At the end of the period, we closed in on a few favorable opportunities in the consumer discretionary sector, and we also considered some longer-range ideas in the consumer staples, financials, and industrials sectors. Additionally, we are taking a fresh look at the Fund’s exposure to the energy sector, where we will closely monitor the direction of energy
prices over the next three to five years.
That said, we do not anticipate large adjustments to the Fund anytime soon. Regardless of market conditions, our approach remains consistent. We will continue to look for companies available for purchase at what we view as attractive valuations because of a company’s having experienced temporary fundamental challenges and negative investor sentiment, adhering to our process of searching for what we believe are favorable relative values in the marketplace.
3
| | |
| Performance summary |
| Delaware Value® Fund | | November 30, 2015 |
The performance data quoted represent past performance; past performance does not guarantee future results. Investment return and principal value will fluctuate so your shares, when redeemed, may be worth more or less than their original cost. Please obtain the performance data current for the most recent month end by calling 800 523-1918 or visiting our website at delawareinvestments.com/performance. Current performance may be lower or higher than the performance data quoted.
| | | | | | |
| Fund and benchmark performance1,2 | | Average annual total returns through November 30, 2015 |
| | | |
| | | 1 year | | 5 years | | 10 years |
Class A (Est. Sept. 15, 1998) | | | | | | |
Excluding sales charge | | +1.21% | | +15.10% | | +7.54% |
Including sales charge | | -4.60% | | +13.74% | | +6.91% |
Class C (Est. May 1, 2002) | | | | | | |
Excluding sales charge | | +0.45% | | +14.24% | | +6.73% |
Including sales charge | | -0.55% | | +14.24% | | +6.73% |
Class R (Est. Sept. 1, 2005) | | | | | | |
Excluding sales charge | | +0.95% | | +14.81% | | +7.28% |
Including sales charge | | +0.95% | | +14.81% | | +7.28% |
Institutional Class (Est. Sept. 15, 1998) | | | | | | |
Excluding sales charge | | +1.47% | | +15.40% | | +7.81% |
Including sales charge | | +1.47% | | +15.40% | | +7.81% |
Russell 1000 Value Index | | -1.11% | | +13.47% | | +6.45% |
1Returns reflect the reinvestment of all distributions and are presented both with and without the applicable sales charges described below. Returns do not reflect the deduction of taxes the shareholder would pay on Fund distributions or redemptions of Fund shares.
Expense limitations were in effect for certain classes during some or all of the periods shown in the “Fund and benchmark performance” table. Expenses for each class are listed on the “Fund expense ratios” table on page 5. Performance would have been lower had expense limitations not been in effect.
Class A shares are sold with a maximum front-end sales charge of 5.75%, and have an annual distribution and service fee of 0.25% of average daily net assets. The Board has adopted a formula for calculating 12b-1 plan fees for the Fund’s Class A shares. The Fund’s Class A shares are
currently subject to a blended 12b-1 fee equal to the sum of: (i) 0.10% of average daily net assets representing shares acquired prior to May 2, 1994, and (ii) 0.25% of average daily net assets representing shares acquired on or after May 2, 1994. All Class A shares currently bear 12b-1 fees at the same rate, the blended rate, currently 0.25% of average daily net assets, based on the formula described above. This method of calculating Class A 12b-1 fees may be discontinued at the sole discretion of the Board. Performance for Class A shares, excluding sales charges, assumes that no front-end sales charge applied.
Class C shares are sold with a contingent deferred sales charge of 1.00% if redeemed during the first 12 months. They are also subject to an annual distribution and service fee of 1.00% of average daily net assets. Performance for Class C shares,
4
excluding sales charges, assumes either that contingent deferred sales charges did not apply or that the investment was not redeemed.
Class R shares are available only for certain retirement plan products. They are sold without a
sales charge and have an annual distribution and service fee of 0.50% of average daily net assets.
Institutional Class shares are available without sales or asset-based distribution charges only to certain eligible institutional accounts.
2 Fund’s expense ratios, as described in the most recent prospectus, are disclosed in the following “Fund expense ratios” table.
| | | | | | | | |
| Fund expense ratios | | Class A | | Class C | | Class R | | Institutional Class |
Total annual operating expenses (without fee waivers) | | 0.98% | | 1.74% | | 1.24% | | 0.74% |
Net expenses (including fee waivers, if any) | | 0.98% | | 1.74% | | 1.24% | | 0.74% |
Type of waiver | | n/a | | n/a | | n/a | | n/a |
5
Performance summary
Delaware Value® Fund
Performance of a $10,000 investment1
Average annual total returns from Nov. 30, 2005 through Nov. 30, 2015
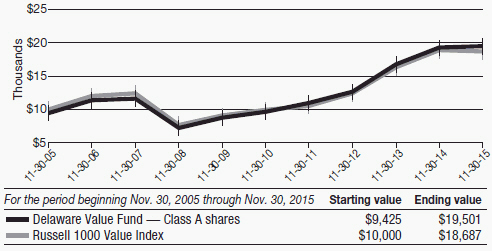
1The “Performance of a $10,000 investment” graph assumes $10,000 invested in Class A shares of the Fund on Nov. 30, 2005, and includes the effect of a 5.75% front-end sales charge and the reinvestment of all distributions. The graph does not reflect the deduction of taxes the shareholders would pay on Fund distributions or redemptions of Fund shares. Expense limitations were in effect for some or all of the periods shown. Performance would have been lower had expense limitations not been in effect. Expenses are listed in the “Fund expense ratios” table on page 5. Please note additional details on pages 4 through 6.
The graph also assumes $10,000 invested in the Russell 1000 Value Index as of Nov. 30, 2005. The
Russell 1000 Value Index measures the performance of the large-cap value segment of the U.S. equity universe. It includes those Russell 1000 companies with lower price-to-book ratios and lower forecasted growth values.
Russell Investment Group is the source and owner of the trademarks, service marks, and copyrights related to the Russell Indexes. Russell® is a trademark of Russell Investment Group.
Index performance returns do not reflect any management fees, transaction costs, or expenses. Indices are unmanaged and one cannot invest directly in an index. Past performance is not a guarantee of future results.
Performance of other Fund classes will vary due to different charges and expenses.
| | | | |
| | | Nasdaq symbols | | CUSIPs |
Class A | | DDVAX | | 24610C881 |
Class C | | DDVCX | | 24610C865 |
Class R | | DDVRX | | 245907860 |
Institutional Class | | DDVIX | | 24610C857 |
6
Disclosure of Fund expenses
For the six-month period from June 1, 2015 to November 30, 2015 (Unaudited)
As a shareholder of the Fund, you incur two types of costs: (1) transaction costs, including sales charges (loads) on purchase payments, reinvested dividends, or other distributions; redemption fees; and exchange fees; and (2) ongoing costs, including management fees; distribution and/or service (12b-1) fees; and other Fund expenses. This example is intended to help you understand your ongoing costs (in dollars) of investing in the Fund and to compare these costs with the ongoing costs of investing in other mutual funds.
The example is based on an investment of $1,000 invested at the beginning of the period and held for the entire six-month period from June 1, 2015 to Nov. 30, 2015.
Actual expenses
The first section of the table shown, “Actual Fund return,” provides information about actual account values and actual expenses. You may use the information in this section of the table, together with the amount you invested, to estimate the expenses that you paid over the period. Simply divide your account value by $1,000 (for example, an $8,600 account value divided by $1,000 = 8.6), then multiply the result by the number in the first section under the heading entitled “Expenses Paid During Period” to estimate the expenses you paid on your account during this period.
Hypothetical example for comparison purposes
The second section of the table shown, “Hypothetical 5% return,” provides information about hypothetical account values and hypothetical expenses based on the Fund’s actual expense ratio and an assumed rate of return of 5% per year before expenses, which is not the Fund’s actual return. The hypothetical account values and expenses may not be used to estimate the actual ending account balance or expenses you paid for the period. You may use this information to compare the ongoing costs of investing in the Fund and other funds. To do so, compare this 5% hypothetical example with the 5% hypothetical examples that appear in the shareholder reports of the other funds.
Please note that the expenses shown in the table are meant to highlight your ongoing costs only and do not reflect any transactional costs, such as sales charges (loads), redemption fees, or exchange fees. Therefore, the second section of the table is useful in comparing ongoing costs only, and will not help you determine the relative total costs of owning different funds. In addition, if these transactional costs were included, your costs would have been higher. The expenses shown in the table assume reinvestment of all dividends and distributions.
7
Disclosure of Fund expenses
For the six-month period from June 1, 2015 to November 30, 2015 (Unaudited)
Delaware Value® Fund
Expense analysis of an investment of $1,000
| | | | | | | | |
| | | Beginning | | Ending | | | | Expenses |
| | | | |
| | | Account Value | | Account Value | | Annualized | | Paid During Period |
| | | | |
| | | 6/1/15 | | 11/30/15 | | Expense Ratio | | 6/1/15 to 11/30/15* |
Actual Fund return† | | | | | | | | |
Class A | | $1,000.00 | | $969.70 | | 0.97% | | $4.79 |
Class C | | 1,000.00 | | 965.90 | | 1.72% | | 8.48 |
Class R | | 1,000.00 | | 968.40 | | 1.22% | | 6.02 |
Institutional Class | | 1,000.00 | | 971.00 | | 0.72% | | 3.56 |
Hypothetical 5% return (5% return before expenses) | | |
Class A | | $1,000.00 | | $1,020.21 | | 0.97% | | $4.91 |
Class C | | 1,000.00 | | 1,016.44 | | 1.72% | | 8.69 |
Class R | | 1,000.00 | | 1,018.95 | | 1.22% | | 6.17 |
Institutional Class | | 1,000.00 | | 1,021.46 | | 0.72% | | 3.65 |
* “Expenses Paid During Period” are equal to the Fund’s annualized expense ratio, multiplied by the average account value over the period, multiplied by 183/365 (to reflect the one-half year period).
† Because actual returns reflect only the most recent six-month period, the returns shown may differ significantly from fiscal year returns.
8
| | |
Security type / sector allocation and top 10 equity holdings |
| Delaware Value® Fund | | As of November 30, 2015 (Unaudited) |
Sector designations may be different than the sector designations presented in other fund materials. The sector designations may represent the investment manager’s internal sector classifications, which may result in the sector designations for one fund being different than another fund’s sector designations.
| | |
| Security type / sector | | Percentage of net assets |
| | |
Common Stock | | 98.63% |
Consumer Discretionary | | 6.31% |
Consumer Staples | | 12.02% |
Energy | | 13.54% |
Financials | | 12.15% |
Healthcare | | 21.08% |
Industrials | | 9.46% |
Information Technology | | 12.11% |
Materials | | 3.00% |
Telecommunications | | 5.97% |
Utilities | | 2.99% |
Short-Term Investments | | 1.03% |
Total Value of Securities | | 99.66% |
Receivables and Other Assets Net of Liabilities | | 0.34% |
Total Net Assets | | 100.00% |
Holdings are for informational purposes only and are subject to change at any time. They are not a recommendation to buy, sell, or hold any security.
| | |
| Top 10 equity holdings | | Percentage of net assets |
| | |
Intel | | 3.27% |
Lowe’s | | 3.23% |
Raytheon | | 3.20% |
Northrop Grumman | | 3.15% |
Waste Management | | 3.11% |
Bank of New York Mellon | | 3.10% |
Johnson Controls | | 3.08% |
Cardinal Health | | 3.07% |
Halliburton | | 3.07% |
Quest Diagnostics | | 3.06% |
| | | |
9
| | |
| Schedule of investments |
| Delaware Value® Fund | | November 30, 2015 |
| | | | | | | | |
| | | Number of shares | | | Value (U.S. $) | |
| |
Common Stock – 98.63% | | | | | | | | |
| |
Consumer Discretionary – 6.31% | | | | | | | | |
Johnson Controls | | | 6,344,381 | | | $ | 291,841,526 | |
Lowe’s | | | 3,988,866 | | | | 305,547,136 | |
| | | | | | | | |
| | | | | | | 597,388,662 | |
| | | | | | | | |
Consumer Staples – 12.02% | | | | | | | | |
Archer-Daniels-Midland | | | 7,760,937 | | | | 283,196,591 | |
CVS Health | | | 3,037,002 | | | | 285,751,518 | |
Kraft Heinz | | | 3,815,962 | | | | 281,198,240 | |
Mondelez International | | | 6,569,860 | | | | 286,840,088 | |
| | | | | | | | |
| | | | | | | 1,136,986,437 | |
| | | | | | | | |
Energy – 13.54% | | | | | | | | |
Chevron | | | 3,068,724 | | | | 280,235,876 | |
ConocoPhillips | | | 5,250,484 | | | | 283,788,660 | |
Halliburton | | | 7,278,199 | | | | 290,036,230 | |
Marathon Oil | | | 8,372,252 | | | | 146,598,133 | |
Occidental Petroleum | | | 3,713,522 | | | | 280,705,128 | |
| | | | | | | | |
| | | | | | | 1,281,364,027 | |
| | | | | | | | |
Financials – 12.15% | | | | | | | | |
Allstate | | | 4,568,619 | | | | 286,726,528 | |
Bank of New York Mellon | | | 6,696,474 | | | | 293,573,420 | |
BB&T | | | 7,477,223 | | | | 288,770,352 | |
Marsh & McLennan | | | 5,075,087 | | | | 280,652,311 | |
| | | | | | | | |
| | | | | | | 1,149,722,611 | |
| | | | | | | | |
Healthcare – 21.08% | | | | | | | | |
Baxalta | | | 8,288,705 | | | | 284,965,678 | |
Cardinal Health | | | 3,341,944 | | | | 290,247,836 | |
Express Scripts Holding † | | | 3,338,575 | | | | 285,381,391 | |
Johnson & Johnson | | | 2,781,912 | | | | 281,640,771 | |
Merck | | | 5,388,242 | | | | 285,630,708 | |
Pfizer | | | 8,450,058 | | | | 276,908,401 | |
Quest Diagnostics | | | 4,233,185 | | | | 289,211,199 | |
| | | | | | | | |
| | | | | | | 1,993,985,984 | |
| | | | | | | | |
Industrials – 9.46% | | | | | | | | |
Northrop Grumman | | | 1,597,932 | | | | 297,790,608 | |
Raytheon | | | 2,437,034 | | | | 302,265,327 | |
Waste Management | | | 5,478,099 | | | | 294,557,383 | |
| | | | | | | | |
| | | | | | | 894,613,318 | |
| | | | | | | | |
Information Technology – 12.11% | | | | | | | | |
CA | | | 10,240,777 | | | | 287,868,242 | |
Cisco Systems | | | 10,169,647 | | | | 277,122,881 | |
Intel | | | 8,898,733 | | | | 309,408,946 | |
10
| | | | | | | | |
| | | Number of shares | | | Value (U.S. $) | |
| |
Common Stock (continued) | | | | | | | | |
| |
Information Technology (continued) | | | | | | | | |
Xerox | | | 25,729,836 | | | $ | 271,449,770 | |
| | | | | | | | |
| | | | | | | 1,145,849,839 | |
| | | | | | | | |
Materials – 3.00% | | | | | | | | |
EI du Pont de Nemours | | | 4,207,504 | | | | 283,333,319 | |
| | | | | | | | |
| | | | | | | 283,333,319 | |
| | | | | | | | |
Telecommunications – 5.97% | | | | | | | | |
AT&T | | | 8,460,008 | | | | 284,848,469 | |
Verizon Communications | | | 6,159,733 | | | | 279,959,865 | |
| | | | | | | | |
| | | | | | | 564,808,334 | |
| | | | | | | | |
Utilities – 2.99% | | | | | | | | |
Edison International | | | 4,759,298 | | | | 282,511,929 | |
| | | | | | | | |
| | | | | | | 282,511,929 | |
| | | | | | | | |
Total Common Stock (cost $8,090,053,497) | | | | | | | 9,330,564,460 | |
| | | | | | | | |
| | |
| | | Principal amount° | | | | |
| |
Short-Term Investments – 1.03% | | | | | | | | |
| |
Discount Notes – 0.81%≠ | | | | | | | | |
Federal Home Loan Bank | | | | | | | | |
0.12% 1/4/16 | | | 14,050,784 | | | | 14,049,393 | |
0.12% 1/25/16 | | | 4,449,483 | | | | 4,448,771 | |
0.14% 2/18/16 | | | 9,188,188 | | | | 9,184,356 | |
0.155% 2/3/16 | | | 7,875,988 | | | | 7,873,326 | |
0.17% 1/21/16 | | | 7,403,529 | | | | 7,402,426 | |
0.18% 2/26/16 | | | 8,411,437 | | | | 8,407,576 | |
0.18% 3/7/16 | | | 8,538,435 | | | | 8,533,372 | |
0.185% 1/19/16 | | | 3,533,599 | | | | 3,533,094 | |
0.19% 3/22/16 | | | 6,514,268 | | | | 6,509,813 | |
0.195% 12/2/15 | | | 5,004,777 | | | | 5,004,767 | |
0.295% 3/2/16 | | | 1,779,523 | | | | 1,778,523 | |
| | | | | | | | |
| | | | | | | 76,725,417 | |
| | | | | | | | |
Repurchase Agreements – 0.22% | | | | | | | | |
Bank of America Merrill Lynch
0.07%, dated 11/30/15, to be repurchased on 12/1/15, repurchase price $4,027,908 (collateralized by U.S. government obligations 1.50%–3.375% 5/31/19–5/15/44; market value $4,108,459) | | | 4,027,900 | | | | 4,027,900 | |
Bank of Montreal
0.09%, dated 11/30/15, to be repurchased on 12/1/15, repurchase price $6,713,184 (collateralized by U.S. government obligations 0.125%–4.625% 4/15/16–2/15/40; market value $6,847,432) | | | 6,713,167 | | | | 6,713,167 | |
11
Schedule of investments
Delaware Value® Fund
| | | | | | | | |
| | | Principal amount° | | | Value (U.S. $) | |
| |
Short-Term Investments (continued) | | | | | | | | |
| |
Repurchase Agreements (continued) | | | | | | | | |
BNP Paribas
0.11%, dated 11/30/15, to be repurchased on 12/1/15, repurchase price $9,895,963 (collateralized by U.S. government obligations 0.00%–3.125% 9/15/17–8/15/44; market value $10,093,853) | | | 9,895,933 | | | $ | 9,895,933 | |
| | | | | | | | |
| | | | | | | 20,637,000 | |
| | | | | | | | |
Total Short-Term Investments (cost $97,363,918) | | | | | | | 97,362,417 | |
| | | | | | | | |
| | |
Total Value of Securities – 99.66%
(cost $8,187,417,415) | | | | | | $ | 9,427,926,877 | |
| | | | | | | | |
| ≠ | The rate shown is the effective yield at the time of purchase. |
| ° | Principal amount shown is stated in U.S. dollars unless noted that the security is denominated in another currency. |
| † | Non-income-producing security. |
See accompanying notes, which are an integral part of the financial statements.
12
This page intentionally left blank.
| | |
| Statement of assets and liabilities |
| Delaware Value® Fund | | November 30, 2015 |
| | | | |
Assets: | | | | |
Investments, at value1 | | $ | 9,330,564,460 | |
Short-term investments, at value2 | | | 97,362,417 | |
Cash | | | 812 | |
Receivable for fund shares sold | | | 37,815,005 | |
Dividends and interest receivable | | | 24,450,215 | |
| | | | |
Total assets | | | 9,490,192,909 | |
| | | | |
Liabilities: | | | | |
Payable for securities purchased | | | 12,187,370 | |
Payable for fund shares redeemed | | | 8,737,305 | |
Investment management fees payable | | | 4,004,477 | |
Other accrued expenses | | | 2,931,896 | |
Distribution fees payable to affiliates | | | 1,143,367 | |
Other affiliates payable | | | 581,374 | |
Trustees’ fees and expenses payable | | | 54,379 | |
| | | | |
Total liabilities | | | 29,640,168 | |
| | | | |
Total Net Assets | | $ | 9,460,552,741 | |
| | | | |
| |
Net Assets Consist of: | | | | |
Paid-in capital | | $ | 8,116,719,136 | |
Undistributed net investment income | | | 31,058,395 | |
Accumulated net realized gain on investments | | | 72,265,748 | |
Net unrealized appreciation of investments | | | 1,240,509,462 | |
| | | | |
Total Net Assets | | $ | 9,460,552,741 | |
| | | | |
14
| | | | |
Net Asset Value | | | | |
Class A: | | | | |
Net assets | | $ | 2,922,965,748 | |
Shares of beneficial interest outstanding, unlimited authorization, no par | | | 161,008,351 | |
Net asset value per share | | $ | 18.15 | |
Sales charge | | | 5.75 | % |
Offering price per share, equal to net asset value per share / (1 – sales charge) | | $ | 19.26 | |
| |
Class C: | | | | |
Net assets | | $ | 622,246,017 | |
Shares of beneficial interest outstanding, unlimited authorization, no par | | | 34,368,890 | |
Net asset value per share | | $ | 18.10 | |
| |
Class R: | | | | |
Net assets | | $ | 113,080,429 | |
Shares of beneficial interest outstanding, unlimited authorization, no par | | | 6,234,151 | |
Net asset value per share | | $ | 18.14 | |
| |
Institutional Class: | | | | |
Net assets | | $ | 5,802,260,547 | |
Shares of beneficial interest outstanding, unlimited authorization, no par | | | 319,570,189 | |
Net asset value per share | | $ | 18.16 | |
| | | | |
1 Investments, at cost | | $ | 8,090,053,497 | |
2 Short-term investments, at cost | | | 97,363,918 | |
See accompanying notes, which are an integral part of the financial statements.
15
| | |
| Statement of operations |
| Delaware Value® Fund | | Year ended November 30, 2015 |
| | | | |
Investment Income: | | | | |
Dividends | | $ | 217,544,120 | |
Interest | | | 116,604 | |
| | | | |
| | | 217,660,724 | |
| | | | |
Expenses: | | | | |
Management fees | | | 43,621,205 | |
Distribution expenses – Class A | | | 6,766,237 | |
Distribution expenses – Class C | | | 5,394,088 | |
Distribution expenses – Class R | | | 338,676 | |
Dividend disbursing and transfer agent fees and expenses | | | 11,316,002 | |
Accounting and administration expenses | | | 2,653,918 | |
Reports and statements to shareholders | | | 1,343,876 | |
Registration fees | | | 675,746 | |
Legal fees | | | 559,371 | |
Trustees’ fees and expenses | | | 385,725 | |
Custodian fees | | | 331,322 | |
Audit and tax fees | | | 34,405 | |
Other | | | 167,812 | |
| | | | |
| | | 73,588,383 | |
Less expense paid indirectly | | | (3,097 | ) |
| | | | |
Total operating expenses | | | 73,585,286 | |
| | | | |
Net Investment Income | | | 144,075,438 | |
| | | | |
| |
Net Realized and Unrealized Gain (Loss): | | | | |
Net realized gain | | | 189,655,114 | |
Net change in unrealized appreciation (depreciation) of investments | | | (246,479,635 | ) |
| | | | |
Net Realized and Unrealized Loss | | | (56,824,521 | ) |
| | | | |
Net Increase in Net Assets Resulting from Operations | | $ | 87,250,917 | |
| | | | |
See accompanying notes, which are an integral part of the financial statements.
16
This page intentionally left blank.
Statements of changes in net assets
Delaware Value® Fund
| | | | | | | | |
| | | Year ended | |
| | |
| | | 11/30/15 | | | 11/30/14 | |
Increase (Decrease) in Net Assets from Operations: | | | | | | | | |
Net investment income | | $ | 144,075,438 | | | $ | 82,333,486 | |
Net realized gain | | | 189,655,114 | | | | 73,154,385 | |
Net change in unrealized appreciation (depreciation) | | | (246,479,635 | ) | | | 579,755,801 | |
| | | | | | | | |
Net increase in net assets resulting from operations | | | 87,250,917 | | | | 735,243,672 | |
| | | | | | | | |
| | |
Dividends and Distributions to Shareholders from: | | | | | | | | |
Net investment income: | | | | | | | | |
Class A | | | (39,981,313 | ) | | | (26,900,014 | ) |
Class B | | | — | | | | (41,557 | ) |
Class C | | | (3,842,687 | ) | | | (1,732,083 | ) |
Class R | | | (788,390 | ) | | | (233,991 | ) |
Institutional Class | | | (84,189,029 | ) | | | (45,342,234 | ) |
| | | | | | | | |
| | | (128,801,419 | ) | | | (74,249,879 | ) |
| | | | | | | | |
| | |
Capital Share Transactions: | | | | | | | | |
Proceeds from shares sold: | | | | | | | | |
Class A | | | 1,119,589,298 | | | | 999,119,582 | |
Class B | | | — | | | | 33,573 | |
Class C | | | 280,748,002 | | | | 210,406,941 | |
Class R | | | 93,383,233 | | | | 29,786,410 | |
Institutional Class | | | 2,919,482,321 | | | | 2,034,761,461 | |
| | |
Net asset value of shares issued upon reinvestment of dividends and distributions: | | | | | | | | |
Class A | | | 37,665,649 | | | | 25,651,872 | |
Class B | | | — | | | | 40,782 | |
Class C | | | 3,566,975 | | | | 1,596,006 | |
Class R | | | 783,126 | | | | 217,100 | |
Institutional Class | | | 80,478,287 | | | | 43,737,494 | |
| | | | | | | | |
| | | 4,535,696,891 | | | | 3,345,351,221 | |
| | | | | | | | |
18
| | | | | | | | |
| | | Year ended | |
| | |
| | | 11/30/15 | | | 11/30/14 | |
Capital Share Transactions (continued): | | | | | | | | |
Cost of shares redeemed: | | | | | | | | |
Class A | | $ | (630,520,051 | ) | | $ | (566,236,003 | ) |
Class B | | | — | | | | (4,864,613 | ) |
Class C | | | (74,692,394 | ) | | | (32,793,845 | ) |
Class R | | | (18,259,126 | ) | | | (7,421,886 | ) |
Institutional Class | | | (1,119,769,081 | ) | | | (573,135,172 | ) |
| | | | | | | | |
| | | (1,843,240,652 | ) | | | (1,184,451,519 | ) |
| | | | | | | | |
Increase in net assets derived from capital share transactions | | | 2,692,456,239 | | | | 2,160,899,702 | |
| | | | | | | | |
Net Increase in Net Assets | | | 2,650,905,737 | | | | 2,821,893,495 | |
| | |
Net Assets: | | | | | | | | |
Beginning of year | | | 6,809,647,004 | | | | 3,987,753,509 | |
| | | | | | | | |
End of year | | $ | 9,460,552,741 | | | $ | 6,809,647,004 | |
| | | | | | | | |
Undistributed net investment income | | $ | 31,058,395 | | | $ | 15,784,376 | |
| | | | | | | | |
See accompanying notes, which are an integral part of the financial statements.
19
Financial highlights
Delaware Value® Fund Class A
Selected data for each share of the Fund outstanding throughout each period were as follows:
|
| |
| |
|
Net asset value, beginning of period |
|
Income (loss) from investment operations: |
Net investment income1 |
Net realized and unrealized gain (loss) |
|
Total from investment operations. |
|
|
Less dividends and distributions from: |
Net investment income |
|
Total dividends and distributions |
|
|
Net asset value, end of period |
|
|
Total return2 |
|
Ratios and supplemental data: |
Net assets, end of period (000 omitted) |
Ratio of expenses to average net assets |
Ratio of expenses to average net assets prior to fees waived |
Ratio of net investment income to average net assets |
Ratio of net investment income to average net assets prior to fees waived |
Portfolio turnover |
|
|
| 1 | The average shares outstanding method has been applied for per share information. |
| 2 | Total investment return is based on the change in net asset value of a share during the period and assumes reinvestment of dividends and distributions at net asset value and does not reflect the impact of a sales charge. Total investment return during some of the periods shown reflects waivers by the manager and/or distributor. Performance would have been lower had the waivers not been in effect. |
See accompanying notes, which are an integral part of the financial statements.
20
| | | | | | | | | | | | | | | | | | | | |
| | | Year ended | |
| | | 11/30/15 | | | 11/30/14 | | | 11/30/13 | | | 11/30/12 | | | 11/30/11 | |
| |
| | $ | 18.200 | | | $ | 16.060 | | | $ | 12.440 | | | $ | 10.970 | | | $ | 9.820 | |
| | | | | |
| | | | | | | | | | | | | | | | | | | | | |
| | | 0.297 | | | | 0.256 | | | | 0.233 | | | | 0.225 | | | | 0.190 | |
| | | (0.079 | ) | | | 2.121 | | | | 3.728 | | | | 1.439 | | | | 1.139 | |
| | | | | | | | | | | | | | | | | | | | |
| | | 0.218 | | | | 2.377 | | | | 3.961 | | | | 1.664 | | | | 1.329 | |
| | | | | | | | | | | | | | | | | | | | |
| | | | | |
| | | | | | | | | | | | | | | | | | | | | |
| | | (0.268 | ) | | | (0.237 | ) | | | (0.341 | ) | | | (0.194 | ) | | | (0.179 | ) |
| | | | | | | | | | | | | | | | | | | | |
| | | (0.268 | ) | | | (0.237 | ) | | | (0.341 | ) | | | (0.194 | ) | | | (0.179 | ) |
| | | | | | | | | | | | | | | | | | | | |
| | | | | |
| | $ | 18.150 | | | $ | 18.200 | | | $ | 16.060 | | | $ | 12.440 | | | $ | 10.970 | |
| | | | | | | | | | | | | | | | | | | | |
| | | | | |
| | | 1.21% | | | | 14.92% | | | | 32.41% | | | | 15.40% | | | | 13.65% | |
| | | | | |
| | | | | | | | | | | | | | | | | | | | | |
| | $ | 2,922,966 | | | $ | 2,410,759 | | | $ | 1,699,105 | | | $ | 988,578 | | | $ | 274,050 | |
| | | 0.98% | | | | 0.98% | | | | 1.01% | | | | 1.09% | | | | 1.10% | |
| | | 0.98% | | | | 0.98% | | | | 1.06% | | | | 1.17% | | | | 1.30% | |
| | | 1.63% | | | | 1.51% | | | | 1.61% | | | | 1.89% | | | | 1.78% | |
| | | 1.63% | | | | 1.51% | | | | 1.66% | | | | 1.81% | | | | 1.58% | |
| | | 12% | | | | 7% | | | | 6% | | | | 13% | | | | 24% | |
|
| |
21
Financial highlights
Delaware Value® Fund Class C
Selected data for each share of the Fund outstanding throughout each period were as follows:
|
| |
| |
|
Net asset value, beginning of period |
|
Income (loss) from investment operations: |
Net investment income1 |
Net realized and unrealized gain (loss) |
|
Total from investment operations. |
|
|
Less dividends and distributions from: |
Net investment income |
|
Total dividends and distributions |
|
|
Net asset value, end of period |
|
|
Total return2 |
|
Ratios and supplemental data: |
Net assets, end of period (000 omitted) |
Ratio of expenses to average net assets |
Ratio of expenses to average net assets prior to fees waived |
Ratio of net investment income to average net assets |
Ratio of net investment income to average net assets prior to fees waived |
Portfolio turnover |
|
|
| 1 | The average shares outstanding method has been applied for per share information. |
| 2 | Total investment return is based on the change in net asset value of a share during the period and assumes reinvestment of dividends and distributions at net asset value and does not reflect the impact of a sales charge. Total investment return during some of the periods shown reflects a waiver by the manager. Performance would have been lower had the waiver not been in effect. |
See accompanying notes, which are an integral part of the financial statements.
22
| | | | | | | | | | | | | | | | | | | | |
| | | Year ended | |
| | | 11/30/15 | | | 11/30/14 | | | 11/30/13 | | | 11/30/12 | | | 11/30/11 | |
| |
| | $ | 18.150 | | | $ | 16.010 | | | $ | 12.340 | | | $ | 10.890 | | | $ | 9.750 | |
| | | | | |
| | | | | | | | | | | | | | | | | | | | | |
| | | 0.160 | | | | 0.130 | | | | 0.126 | | | | 0.134 | | | | 0.109 | |
| | | (0.080 | ) | | | 2.119 | | | | 3.713 | | | | 1.430 | | | | 1.141 | |
| | | | | | | | | | | | | | | | | | | | |
| | | 0.080 | | | | 2.249 | | | | 3.839 | | | | 1.564 | | | | 1.250 | |
| | | | | | | | | | | | | | | | | | | | |
| | | | | |
| | | | | | | | | | | | | | | | | | | | | |
| | | (0.130 | ) | | | (0.109 | ) | | | (0.169 | ) | | | (0.114 | ) | | | (0.110 | ) |
| | | | | | | | | | | | | | | | | | | | |
| | | (0.130 | ) | | | (0.109 | ) | | | (0.169 | ) | | | (0.114 | ) | | | (0.110 | ) |
| | | | | | | | | | | | | | | | | | | | |
| | | | | |
| | $ | 18.100 | | | $ | 18.150 | | | $ | 16.010 | | | $ | 12.340 | | | $ | 10.890 | |
| | | | | | | | | | | | | | | | | | | | |
| | | | | |
| | | 0.45% | | | | 14.10% | | | | 31.38% | | | | 14.49% | | | | 12.88% | |
| | | | | |
| | | | | | | | | | | | | | | | | | | | | |
| | $ | 622,246 | | | $ | 415,076 | | | $ | 199,771 | | | $ | 74,407 | | | $ | 24,928 | |
| | | 1.73% | | | | 1.74% | | | | 1.77% | | | | 1.85% | | | | 1.85% | |
| | | 1.73% | | | | 1.74% | | | | 1.77% | | | | 1.88% | | | | 2.00% | |
| | | 0.88% | | | | 0.75% | | | | 0.87% | | | | 1.13% | | | | 1.03% | |
| | | 0.88% | | | | 0.75% | | | | 0.87% | | | | 1.10% | | | | 0.88% | |
| | | 12% | | | | 7% | | | | 6% | | | | 13% | | | | 24% | |
|
| |
23
Financial highlights
Delaware Value® Fund Class R
Selected data for each share of the Fund outstanding throughout each period were as follows:
|
| |
| |
|
Net asset value, beginning of period |
|
Income (loss) from investment operations: |
Net investment income1 |
Net realized and unrealized gain (loss) |
|
Total from investment operations. |
|
|
Less dividends and distributions from: |
Net investment income |
|
Total dividends and distributions |
|
|
Net asset value, end of period |
|
|
Total return2 |
|
Ratios and supplemental data: |
Net assets, end of period (000 omitted) |
Ratio of expenses to average net assets |
Ratio of expenses to average net assets prior to fees waived |
Ratio of net investment income to average net assets |
Ratio of net investment income to average net assets prior to fees waived |
Portfolio turnover |
|
|
| 1 | The average shares outstanding method has been applied for per share information. |
| 2 | Total investment return is based on the change in net asset value of a share during the period and assumes reinvestment of dividends and distributions at net asset value. Total investment return during some of the periods shown reflects waivers by the manager and/or distributor. Performance would have been lower had the waivers not been in effect. |
See accompanying notes, which are an integral part of the financial statements.
24
| | | | | | | | | | | | | | | | | | | | |
| | | Year ended | |
| | | 11/30/15 | | | 11/30/14 | | | 11/30/13 | | | 11/30/12 | | | 11/30/11 | |
| |
| | $ | 18.190 | | | $ | 16.050 | | | $ | 12.400 | | | $ | 10.950 | | | $ | 9.800 | |
| | | | | |
| | | | | | | | | | | | | | | | | | | | | |
| | | 0.250 | | | | 0.218 | | | | 0.197 | | | | 0.194 | | | | 0.163 | |
| | | (0.079 | ) | | | 2.115 | | | | 3.735 | | | | 1.423 | | | | 1.143 | |
| | | | | | | | | | | | | | | | | | | | |
| | | 0.171 | | | | 2.333 | | | | 3.932 | | | | 1.617 | | | | 1.306 | |
| | | | | | | | | | | | | | | | | | | | |
| | | | | |
| | | | | | | | | | | | | | | | | | | | | |
| | | (0.221 | ) | | | (0.193 | ) | | | (0.282 | ) | | | (0.167 | ) | | | (0.156 | ) |
| | | | | | | | | | | | | | | | | | | | |
| | | (0.221 | ) | | | (0.193 | ) | | | (0.282 | ) | | | (0.167 | ) | | | (0.156 | ) |
| | | | | | | | | | | | | | | | | | | | |
| | | | | |
| | $ | 18.140 | | | $ | 18.190 | | | $ | 16.050 | | | $ | 12.400 | | | $ | 10.950 | |
| | | | | | | | | | | | | | | | | | | | |
| | | | | |
| | | 0.95% | | | | 14.63% | | | | 32.17% | | | | 14.96% | | | | 13.43% | |
| | | | | |
| | | | | | | | | | | | | | | | | | | | | |
| | $ | 113,080 | | | $ | 37,236 | | | $ | 11,658 | | | $ | 5,219 | | | $ | 1,944 | |
| | | 1.23% | | | | 1.24% | | | | 1.27% | | | | 1.35% | | | | 1.35% | |
| | | 1.23% | | | | 1.24% | | | | 1.35% | | | | 1.48% | | | | 1.60% | |
| | | 1.38% | | | | 1.25% | | | | 1.37% | | | | 1.63% | | | | 1.53% | |
| | | 1.38% | | | | 1.25% | | | | 1.29% | | | | 1.50% | | | | 1.28% | |
| | | 12% | | | | 7% | | | | 6% | | | | 13% | | | | 24% | |
|
| |
25
Financial highlights
Delaware Value® Fund Institutional Class
Selected data for each share of the Fund outstanding throughout each period were as follows:
|
| |
| |
|
Net asset value, beginning of period |
|
Income (loss) from investment operations: |
Net investment income1 |
Net realized and unrealized gain (loss) |
|
Total from investment operations. |
|
|
Less dividends and distributions from: |
Net investment income |
|
Total dividends and distributions |
|
|
Net asset value, end of period |
|
|
Total return2 |
|
Ratios and supplemental data: |
Net assets, end of period (000 omitted) |
Ratio of expenses to average net assets |
Ratio of expenses to average net assets prior to fees waived |
Ratio of net investment income to average net assets |
Ratio of net investment income to average net assets prior to fees waived |
Portfolio turnover |
|
|
| 1 | The average shares outstanding method has been applied for per share information. |
| 2 | Total investment return is based on the change in net asset value of a share during the period and assumes reinvestment of dividends and distributions at net asset value. Total investment return during some of the periods shown reflects a waiver by the manager. Performance would have been lower had the waiver not been in effect. |
See accompanying notes, which are an integral part of the financial statements.
26
| | | | | | | | | | | | | | | | | | | | |
| | | Year ended | |
| | | 11/30/15 | | | 11/30/14 | | | 11/30/13 | | | 11/30/12 | | | 11/30/11 | |
| |
| | $ | 18.210 | | | $ | 16.060 | | | $ | 12.460 | | | $ | 10.990 | | | $ | 9.830 | |
| | | | | |
| | | | | | | | | | | | | | | | | | | | | |
| | | 0.341 | | | | 0.300 | | | | 0.272 | | | | 0.254 | | | | 0.216 | |
| | | (0.078 | ) | | | 2.128 | | | | 3.724 | | | | 1.437 | | | | 1.146 | |
| | | | | | | | | | | | | | | | | | | | |
| | | 0.263 | | | | 2.428 | | | | 3.996 | | | | 1.691 | | | | 1.362 | |
| | | | | | | | | | | | | | | | | | | | |
| | | | | |
| | | | | | | | | | | | | | | | | | | | | |
| | | (0.313 | ) | | | (0.278 | ) | | | (0.396 | ) | | | (0.221 | ) | | | (0.202 | ) |
| | | | | | | | | | | | | | | | | | | | |
| | | (0.313 | ) | | | (0.278 | ) | | | (0.396 | ) | | | (0.221 | ) | | | (0.202 | ) |
| | | | | | | | | | | | | | | | | | | | |
| | | | | |
| | $ | 18.160 | | | $ | 18.210 | | | $ | 16.060 | | | $ | 12.460 | | | $ | 10.990 | |
| | | | | | | | | | | | | | | | | | | | |
| | | | | |
| | | 1.47% | | | | 15.26% | | | | 32.73% | | | | 15.66% | | | | 13.99% | |
| | | | | |
| | | | | | | | | | | | | | | | | | | | | |
| | $ | 5,802,261 | | | $ | 3,946,576 | | | $ | 2,072,765 | | | $ | 724,098 | | | $ | 216,345 | |
| | | 0.73% | | | | 0.74% | | | | 0.77% | | | | 0.85% | | | | 0.85% | |
| | | 0.73% | | | | 0.74% | | | | 0.77% | | | | 0.88% | | | | 1.00% | |
| | | 1.88% | | | | 1.75% | | | | 1.87% | | | | 2.13% | | | | 2.03% | |
| | | 1.88% | | | | 1.75% | | | | 1.87% | | | | 2.10% | | | | 1.88% | |
| | | 12% | | | | 7% | | | | 6% | | | | 13% | | | | 24% | |
|
| |
27
| | | | |
| Notes to financial statements | | | | |
| Delaware Value® Fund | | | November 30, 2015 | |
Delaware Group® Equity Funds II (Trust) is organized as a Delaware statutory trust and offers one series: Delaware Value Fund (Fund). The Trust is an open-end investment company. The Fund is considered diversified under the Investment Company Act of 1940, as amended, and offers Class A, Class C, Class R, and Institutional Class shares. Class A shares are sold with a maximum front-end sales charge of 5.75%. Class A share purchases of $1,000,000 or more will incur a contingent deferred sales charge (CDSC) of 1.00% if redeemed during the first year and 0.50% during the second year, provided that Delaware Distributors, L.P. (DDLP) paid a financial advisor a commission on the purchase of those shares. Effective Sept. 25, 2014, all remaining shares of Class B were converted to Class A shares. Class C shares are sold with a CDSC of 1.00%, if redeemed during the first 12 months. Class R and Institutional Class shares are not subject to a sales charge and are offered for sale exclusively to certain eligible investors.
The investment objective of the Fund is to seek long-term capital appreciation.
1. Significant Accounting Policies
The following accounting policies are in accordance with U.S. generally accepted accounting principles (U.S. GAAP) and are consistently followed by the Fund.
Security Valuation – Equity securities, except those traded on the Nasdaq Stock Market LLC (Nasdaq), are valued at the last quoted sales price as of the time of the regular close of the New York Stock Exchange on the valuation date. Equity securities traded on the Nasdaq are valued in accordance with the Nasdaq Official Closing Price, which may not be the last sales price. If, on a particular day, an equity security does not trade, the mean between the bid and ask prices will be used, which approximates fair value. U.S. government and agency securities are valued at the mean between the bid and ask prices, which approximates fair value. Generally, other securities and assets for which market quotations are not readily available are valued at fair value as determined in good faith under the direction of the Trust’s Board of Trustees (Board). In determining whether market quotations are readily available or fair valuations will be used, various factors will be taken into consideration, such as market closures or suspension of trading in a security.
Federal Income Taxes – No provision for federal income taxes has been made as the Fund intends to continue to qualify for federal income tax purposes as a regulated investment company under Subchapter M of the Internal Revenue Code of 1986, as amended, and make the requisite distributions to shareholders. The Fund evaluates tax positions taken or expected to be taken in the course of preparing the Fund’s tax returns to determine whether the tax positions are “more-likely-than-not” of being sustained by the applicable tax authority. Tax positions not deemed to meet the “more-likely-than-not” threshold are recorded as a tax benefit or expense in the current year. Management has analyzed the Fund’s tax positions taken for all open federal income tax years (Nov. 30, 2012–Nov. 30, 2015), and has concluded that no provision for federal income tax is required in the Fund’s financial statements.
Class Accounting – Investment income, common expenses, and realized and unrealized gain (loss) on investments are allocated to the various classes of the Fund on the basis of daily net assets of each class. Distribution expenses relating to a specific class are charged directly to that class.
Repurchase Agreements – The Fund may purchase certain U.S. government securities subject to the counterparty’s agreement to repurchase them at an agreed upon date and price. The counterparty will
28
be required on a daily basis to maintain the value of the collateral subject to the agreement at not less than the repurchase price (including accrued interest). The agreements are conditioned upon the collateral being deposited under the Federal Reserve book-entry system with the Fund’s custodian or a third-party sub-custodian. In the event of default or bankruptcy by the other party to the agreement, retention of the collateral may be subject to legal proceedings. All open repurchase agreements as of the date of this report were entered into on Nov. 30, 2015 and matured on the next business day.
Use of Estimates – The Fund is an investment company whose financial statements are prepared in conformity with U.S. GAAP. Therefore, the Fund follows the accounting and reporting guidelines for investment companies. The preparation of financial statements in conformity with U.S. GAAP requires management to make estimates and assumptions that affect the fair value of investments, the reported amounts of assets and liabilities and disclosure of contingent assets and liabilities at the date of the financial statements, and the reported amounts of revenues and expenses during the reporting period. Actual results could differ from those estimates and the differences could be material.
Other – Expenses directly attributable to the Fund are charged directly to the Fund. Other expenses common to various funds within the Delaware Investments® Family of Funds are generally allocated among such funds on the basis of average net assets. Management fees and some other expenses are paid monthly. Security transactions are recorded on the date the securities are purchased or sold (trade date) for financial reporting purposes. Costs used in calculating realized gains and losses on the sale of investment securities are those of the specific securities sold. Dividend income is recorded on the ex-dividend date and interest income is recorded on the accrual basis. The Fund declares and pays distributions from net investment income and net realized gain on investments, if any, annually. The Fund may distribute more frequently, if necessary for tax purposes. Dividends and distributions, if any, are recorded on the ex-dividend date.
Subject to seeking best execution, the Fund may direct certain security trades to brokers who have agreed to rebate a portion of the related brokerage commission to the Fund in cash. Such commission rebates are included on the “Statement of operations” under “Net realized gain on investments” and totaled $4,003 for the year ended Nov. 30, 2015. In general, best execution refers to many factors, including the price paid or received for a security, the commission charged, the promptness and reliability of execution, the confidentiality and placement accorded the order, and other factors affecting the overall benefit obtained by the Fund on the transaction.
The Fund may receive earnings credits from its custodian when positive cash balances are maintained, which may be used to offset custody fees. There were no such earnings credits for the year ended Nov. 30, 2015.
The Fund receives earnings credits from its transfer agent when positive cash balances are maintained, which may be used to offset transfer agent fees. If the amount earned is greater than one dollar, the expense paid under this arrangement is included on the “Statement of operations” under “Dividend disbursing and transfer agent fees and expenses” with the corresponding expense offset shown under “Less expense paid indirectly.” For the year ended Nov. 30, 2015, the Fund earned $3,097 under this agreement.
29
Notes to financial statements
Delaware Value® Fund
2. Investment Management, Administration Agreements and Other Transactions with Affiliates
In accordance with the terms of its investment management agreement, the Fund pays Delaware Management Company (DMC), a series of Delaware Management Business Trust and the investment manager, an annual fee which is calculated daily at the rate of 0.65% on the first $500 million of average daily net assets of the Fund, 0.60% on the next $500 million, 0.55% on the next $1.5 billion, and 0.50% on average daily net assets in excess of $2.5 billion.
Delaware Investments Fund Services Company (DIFSC), an affiliate of DMC, provides fund accounting and financial administration oversight services to the Fund. For these services, DIFSC’s fees are calculated based on the aggregate daily net assets of the Delaware Investments® Family of Funds at the following annual rate: 0.0050% of the first $30 billion; 0.0045% of the next $10 billion; 0.0040% of the next $10 billion; and 0.0025% of aggregate average daily net assets in excess of $50 billion. The fees payable to DIFSC under the service agreement described above are allocated among all retail funds in the Delaware Investments Family of Funds on a relative net asset value basis. For the year ended Nov. 30, 2015, the Fund was charged $393,549 for these services. This amount is included on the “Statement of operations” under “Accounting and administrative expenses.”
DIFSC is also the transfer agent and dividend disbursing agent of the Fund. For these services, DIFSC’s fees are calculated based on the aggregate daily net assets of the retail funds within the Delaware Investments Family of Funds at the following annual rate: 0.025% of the first $20 billion; 0.020% of the next $5 billion; 0.015% of the next $5 billion; and 0.013% of average daily net assets in excess of $30 billion. The fees payable to DIFSC under the service agreement described above are allocated among all retail funds in the Delaware Investment Family of Funds on a relative net asset value basis. This amount is included on the “Statement of operations” under “Dividend disbursing and transfer agent fees and expenses.” For the year ended Nov. 30, 2015, the Fund was charged $1,721,415 for these services. Pursuant to a sub-transfer agency agreement between DIFSC and BNY Mellon Investment Servicing (US) Inc. (BNYMIS), BNYMIS provides certain sub-transfer agency services to the Fund. Sub-transfer agency fees are paid by the Fund and are also included on the “Statement of operations” under “Dividend disbursing and transfer agent fees and expenses.”
Pursuant to a distribution agreement and distribution plan, the Fund pays DDLP, the distributor and an affiliate of DMC, an annual distribution and service fee of 0.25% of the average daily net assets of the Class A shares, 1.00% of the average daily net assets of the Class C shares, and 0.50% of the average daily net assets of Class R shares. Institutional Class shares pay no distribution and service expenses. The Board has adopted a formula for calculating 12b-1 plan fees for the Fund’s Class A shares. The total 12b-1 fees to be paid by Class A shareholders of the Fund will be the sum of (i) 0.10% of the average daily net assets representing shares that were acquired prior to May 2, 1994 and (ii) 0.25% of the average daily net assets representing shares that were acquired on or after May 2, 1994. All Class A shareholders will bear 12b-1 fees at the same rate, the blended rate, currently 0.25% of average daily net assets, based upon the allocation of the rates described above. This method of calculating Class A 12b-1 fees may be discontinued at the sole discretion of the Board.
30
As provided in the investment management agreement, the Fund bears a portion of the cost of certain resources shared with DMC, including the cost of internal personnel of DMC and/or its affiliates that provide legal, tax, and regulatory reporting services to the Fund. For the year ended Nov. 30, 2015, the Fund was charged $197,500 for internal legal, tax, and regulatory reporting services provided by DMC and/or its affiliates’ employees. This amount is included on the “Statement of operations” under “Legal fees”.
For the year ended Nov. 30, 2015, DDLP earned $467,205 for commissions on sales of the Fund’s Class A shares. For the year ended Nov. 30, 2015, DDLP received gross CDSC commissions of $43,304 and $88,912 on redemptions of the Fund’s Class A and Class C shares, respectively, and these commissions were entirely used to offset upfront commissions previously paid by DDLP to broker/dealers on sales of those shares.
Trustees’ fees include expenses accrued by the Fund for each Trustee’s retainer and meeting fees. Certain officers of DMC, DIFSC, and DDLP are officers and/or Trustees of the Trust. These officers and Trustees are paid no compensation by the Fund.
3. Investments
For year ended Nov. 30, 2015, the Fund made purchases and sales of investment securities other than short-term investments as follows:
| | | | |
Purchases | | $ | 3,691,452,848 | |
Sales | | | 986,352,161 | |
At Nov. 30, 2015, the cost and unrealized appreciation (depreciation) of investments for federal income tax purposes were as follows: | | | | |
Cost of investments | | $ | 8,195,899,722 | |
| | | | |
Aggregate unrealized appreciation of investments | | $ | 1,514,724,000 | |
Aggregate unrealized depreciation of investments | | | (282,696,845 | ) |
| | | | |
Net unrealized appreciation of investments | | $ | 1,232,027,155 | |
| | | | |
U.S. GAAP defines fair value as the price that the Fund would receive to sell an asset or pay to transfer a liability in an orderly transaction between market participants at the measurement date under current market conditions. A three-level hierarchy for fair value measurements has been established based upon the transparency of inputs to the valuation of an asset or liability. Inputs may be observable or unobservable and refer broadly to the assumptions that market participants would use in pricing the asset or liability. Observable inputs reflect the assumptions market participants would use in pricing the asset or liability based on market data obtained from sources independent of the reporting entity. Unobservable inputs reflect the reporting entity’s own assumptions about the assumptions that market participants would use in pricing the asset or liability based on the best information available under the circumstances. The Fund’s investment in its entirety is assigned a level based upon the observability of the inputs which are significant to the overall valuation. The three-level hierarchy of inputs is summarized on the following page:
31
Notes to financial statements
Delaware Value® Fund
3. Investments (continued)
| | |
| Level 1 – | | Inputs are quoted prices in active markets for identical investments. (Examples: equity securities, open-end investment companies, futures contracts, exchange-traded options contracts) |
| |
| Level 2 – | | Other observable inputs, including, but not limited to: quoted prices for similar assets or liabilities in markets that are active, quoted prices for identical or similar assets or liabilities in markets that are not active, inputs other than quoted prices that are observable for the assets or liabilities (such as interest rates, yield curves, volatilities, prepayment speeds, loss severities, credit risks, and default rates), or other market-corroborated inputs. (Examples: debt securities, government securities, swap contracts, foreign currency exchange contracts, foreign securities utilizing international fair value pricing, broker-quoted securities, fair valued securities) |
| |
| Level 3 – | | Significant unobservable inputs, including the Fund’s own assumptions used to determine the fair value of investments. (Examples: broker-quoted securities, fair valued securities) |
Level 3 investments are valued using significant unobservable inputs. The Fund may also use an income-based valuation approach in which the anticipated future cash flows of the investment are discounted to calculate fair value. Discounts may also be applied due to the nature or duration of any restrictions on the disposition of the investments. Valuations may also be based upon current market prices of securities that are comparable in coupon, rating, maturity, and industry. The derived value of a Level 3 investment may not represent the value which is received upon disposition and this could impact the results of operations.
The following table summarizes the valuation of the Fund’s investments by fair value hierarchy levels as of Nov. 30, 2015:
| | | | | | | | | | | | |
Securities | | Level 1 | | | Level 2 | | | Total | |
| | | |
Common Stock | | $ | 9,330,564,460 | | | $ | — | | | $ | 9,330,564,460 | |
Short-Term Investments | | | — | | | | 97,362,417 | | | | 97,362,417 | |
| | | | | | | | | | | | |
Total Value of Securities | | $ | 9,330,564,460 | | | $ | 97,362,417 | | | $ | 9,427,926,877 | |
| | | | | | | | | | | | |
During the year ended Nov. 30, 2015, there were no transfers between Level 1 investments, Level 2 investments, or Level 3 investments that had a significant impact to the Fund. The Fund’s policy is to recognize transfers between levels at the beginning of the reporting period.
A reconciliation of Level 3 investments is presented when the Fund has a significant amount of Level 3 investments at the beginning, interim, or end of the period in relation to net assets. At Nov. 30, 2015, there were no Level 3 investments.
4. Dividend and Distribution Information
Income and long-term capital gain distributions are determined in accordance with federal income tax regulations, which may differ from U.S. GAAP. Additionally, distributions from net short-term gains on sales of investment securities are treated as ordinary income for federal income tax purposes. The tax character of dividends and distributions paid during the years ended Nov. 30, 2015 and 2014 was as follows:
32
| | | | | | | | |
| | | Year ended | |
| | | 11/30/15 | | | 11/30/14 | |
Ordinary income | | $ | 128,801,419 | | | $ | 74,249,879 | |
5. Components of Net Assets on a Tax Basis
As of Nov. 30, 2015, the components of net assets on a tax basis were as follows:
| | | | |
Shares of beneficial interest | | $ | 8,116,719,136 | |
Undistributed ordinary income | | | 31,058,395 | |
Capital loss carryforwards* | | | (46,856,795 | ) |
Undistributed long-term capital gain | | | 127,604,850 | |
Net unrealized appreciation on investments | | | 1,232,027,155 | |
| | | | |
Net assets | | $ | 9,460,552,741 | |
| | | | |
| * | The amount of this loss which can be utilized in subsequent years may be subject to an annual limitation in accordance with the Internal Revenue Code due to the Fund merger with the Delaware Large Cap Value Fund in May 2012. |
The differences between book basis and tax basis components of net assets are primarily attributable to tax deferral of losses on wash sales.
For financial reporting purposes, capital accounts are adjusted to reflect the tax character of permanent book/tax differences. Reclassifications are primarily due to tax treatment of expiring capital loss carryforwards. Results of operations and net assets were not affected by these reclassifications. For the year ended Nov. 30, 2015, the Fund recorded the following reclassifications:
| | | | |
Accumulated net realized gain | | $ | 4,264,557 | |
Paid-in capital | | | (4,264,557 | ) |
For federal income tax purposes, capital loss carryforwards may be carried forward and applied against future capital gains. $63,274,854 was utilized in 2015. Capital loss carryforwards remaining at Nov. 30, 2015 will expire as follows: $46,856,795 expires in 2016.
On Dec. 22, 2010, the Regulated Investment Company Modernization Act of 2010 (Act) was enacted, which changed various technical rules governing the tax treatment of regulated investment companies. The changes were generally effective for taxable years beginning after the date of enactment. Under the Act, the Fund is permitted to carry forward capital losses incurred in taxable years beginning after the date of enactment for an unlimited period. However, any losses incurred during those future taxable years will be required to be utilized prior to the losses incurred in pre-enactment taxable years, which carry an expiration date. As a result of this ordering rule, pre-enactment capital loss carryforwards may be more likely to expire unused. Additionally, post-enactment capital loss carryforwards will retain their character as either short-term or long-term capital losses rather than being considered all short-term as permitted under previous regulation. At Nov. 30, 2015, there were no capital loss carryforwards incurred under the Act.
33
Notes to financial statements
Delaware Value® Fund
6. Capital Shares
Transactions in capital shares were as follows:
| | | | | | | | |
| | | Year ended | |
| | | 11/30/15 | | | 11/30/14 | |
| | |
Shares sold: | | | | | | | | |
Class A | | | 61,426,340 | | | | 58,473,483 | |
Class B | | | — | | | | 1,977 | |
Class C | | | 15,442,416 | | | | 12,223,895 | |
Class R | | | 5,155,522 | | | | 1,742,711 | |
Institutional Class | | | 160,263,135 | | | | 118,587,176 | |
| | |
Shares issued upon reinvestment of dividends and distributions: | | | | | | | | |
Class A | | | 2,091,510 | | | | 1,506,239 | |
Class B | | | — | | | | 2,415 | |
Class C | | | 199,138 | | | | 93,355 | |
Class R | | | 43,938 | | | | 12,638 | |
Institutional Class | | | 4,473,966 | | | | 2,557,056 | |
| | | | | | | | |
| | | 249,095,965 | | | | 195,200,945 | |
| | | | | | | | |
| | |
Shares redeemed: | | | | | | | | |
Class A | | | (34,948,477 | ) | | | (33,345,452 | ) |
Class B | | | — | | | | (282,680 | ) |
Class C | | | (4,139,348 | ) | | | (1,925,042 | ) |
Class R | | | (1,012,802 | ) | | | (434,451 | ) |
Institutional Class | | | (61,946,346 | ) | | | (33,418,372 | ) |
| | | | | | | | |
| | | (102,046,973 | ) | | | (69,405,997 | ) |
| | | | | | | | |
Net increase | | | 147,048,992 | | | | 125,794,948 | |
| | | | | | | | |
For the year ended Nov. 30, 2014, 174,400 Class B shares were converted to 173,894 Class A shares valued at $3,000,083. The respective amounts are included in Class B redemptions and Class A subscriptions in the table above and the “Statements of changes in net assets.”
Certain shareholders may exchange shares of one class for another class in the same Fund. For years ended Nov. 30, 2015 and 2014, the Fund had the following exchange transactions:
Year ended Nov. 30, 2015
| | | | | | | | | | |
| Exchange Redemptions | | Exchange Subscriptions | | |
Class A
Shares | | Class C
Shares | | Institutional
Class
Shares | | Class A
Shares | | Institutional
Class
Shares | | Value |
69,676 | | 31,956 | | 19,221 | | 19,756 | | 101,070 | | $2,212,005 |
34
Year ended Nov. 30, 2014
| | | | | | | | | | |
| Exchange Redemptions | | Exchange Subscriptions | | |
Class A
Shares | | Class C
Shares | | Institutional
Class
Shares | | Class A
Shares | | Institutional
Class
Shares | | Value |
5,774 | | 10,214 | | 3,089 | | 7,161 | | 11,891 | | $329,050 |
7. Line of Credit
The Fund, along with certain other funds in the Delaware Investments® Family of Funds (Participants), was a participant in a $275,000,000 revolving line of credit intended to be used for temporary or emergency purposes as an additional source of liquidity to fund redemptions of investor shares. Under the agreement, the Participants were charged an annual commitment fee of 0.08%, which was allocated across the Participants on the basis of each Participant’s allocation of the entire facility. The Participants were permitted to borrow up to a maximum of one third of their net assets under the agreement. Each Participant was individually, and not jointly, liable for its particular advances, if any, under the line of credit. The line of credit available under the agreement expired on Nov. 9, 2015.
On Nov. 9, 2015, the Fund, along with the other Participants, entered into an amendment to the agreement for a $155,000,000 revolving line of credit. Under the amendment to the agreement, the Participants are charged an annual commitment fee of 0.10%, which is allocated across the Participants on the basis of each Participant’s allocation of the entire facility. Other than the annual commitment fee, the line of credit is to be used as described above and operates in substantially the same manner as the original agreement. The line of credit available under the agreement expires on Nov. 7, 2016.
The Fund had no amounts outstanding as of Nov. 30, 2015 or at any time during the year then ended.
8. Offsetting
In December 2011, the Financial Accounting Standards Board (FASB) issued guidance that expanded disclosure requirements on the offsetting of certain assets and liabilities. The disclosures are required for investments and derivative financial instruments subject to master netting or similar agreements which are eligible for offset on the “Statement of assets and liabilities” and require an entity to disclose both gross and net information about such investments and transactions in the financial statements. In January 2013, the FASB issued guidance that clarified which investments and transactions are subject to the offsetting disclosure requirements. The scope of the disclosure requirements for offsetting is limited to derivative instruments, repurchase agreements and reverse repurchase agreements, and securities borrowing. The guidance is effective for financial statements with fiscal years beginning on or after Jan. 1, 2013, and interim periods within those fiscal years.
In order to better define its contractual rights and to secure rights that will help the Fund mitigate its counterparty risk, the Fund entered into an International Swaps and Derivatives Association, Inc. Master Agreement (ISDA Master Agreement) or a similar agreement with certain of its derivative contract counterparties. An ISDA Master Agreement is a bilateral agreement between the Fund and a counterparty that governs certain over-the-counter (OTC) derivatives and foreign exchange contracts and typically contains, among other things, collateral posting items and netting provisions in the event of a default and/or termination event. Under an ISDA Master Agreement, the Fund may, under certain
35
Notes to financial statements
Delaware Value® Fund
8. Offsetting (continued)
circumstances, offset with the counterparty certain derivative financial instruments’ payables and/or receivables with collateral held and/or posted and create one single net payment. The provisions of the ISDA Master Agreement typically permit a single net payment in the event of default (close-out), including the bankruptcy or insolvency of the counterparty. However, bankruptcy or insolvency laws of a particular jurisdiction may impose restrictions on or prohibitions against the right of offset in bankruptcy, insolvency, or other events.
For financial reporting purposes, the Fund does not offset derivative assets and derivative liabilities that are subject to netting arrangements on the “Statement of assets and liabilities.” During the year ended Nov. 30, 2015, the Fund held no derivatives.
At Nov. 30, 2015, the Fund had the following assets and liabilities subject to offsetting provisions:
Master Repurchase Agreements
| | | | | | | | | | | | | | | | | | | | | | | | | |
| Counterparty | | Repurchase
Agreements | | Fair Value of Non-Cash
Collateral Received | | Cash Collateral
Received | | Net Collateral
Received | | Net Exposure(a) |
Bank of America Merrill Lynch | | | $ | 4,027,900 | | | | $ | (4,027,900 | ) | | | $ | — | | | | $ | (4,027,900 | ) | | | | $— | |
Bank of Montreal | | | | 6,713,167 | | | | | (6,713,167 | ) | | | | — | | | | | (6,713,167 | ) | | | | — | |
BNP Paribas | | | | 9,895,933 | | | | | (9,895,933 | ) | | | | — | | | | | (9,895,933 | ) | | | | — | |
| | | | | | | | | | | | | | | | | | | | | | | | | |
Total | | | $ | 20,637,000 | | | | $ | (20,637,000 | ) | | | $ | — | | | | $ | (20,637,000 | ) | | | | $— | |
| | | | | | | | | | | | | | | | | | | | | | | | | |
(a)Net exposure represents the receivable (payable) that would be due from (to) the counterparty in the event of default.
9. Securities Lending
The Fund, along with other funds in the Delaware Investments® Family of Funds, may lend its securities pursuant to a security lending agreement (Lending Agreement) with The Bank of New York Mellon (BNY Mellon). At the time a security is loaned, the borrower must post collateral equal to the required percentage of the market value of the loaned security, including any accrued interest. The required percentage is: (1) 102% with respect to U.S. securities and foreign securities that are denominated and payable in U.S. dollars; and (2) 105% with respect to foreign securities. With respect to each loan, if on any business day the aggregate market value of securities collateral plus cash collateral held is less than the aggregate market value of the securities which are the subject of such loan, the borrower will be notified to provide additional collateral by the end of the following business day which, together with the collateral already held, will be not less than the applicable initial collateral requirements for such security loan. If the aggregate market value of securities collateral and cash collateral held with respect to a security loan exceeds the applicable initial collateral requirement, upon request of the borrower, BNY Mellon must return enough collateral to the borrower by the end of the following business day to reduce the value of the remaining collateral to the applicable initial collateral requirement for such security loan. As a result of the foregoing, the value of the collateral held with respect to a loaned security on any particular day may be more or less than the value of the security on loan.
36
Cash collateral received is generally invested in the Delaware Investments Collateral Fund No. 1 (Collective Trust) established by BNY Mellon for the purpose of investment on behalf of funds managed by DMC that participate in BNY Mellon’s securities lending program. The Collective Trust may invest in U.S. government securities and high-quality corporate debt, asset-backed and other money market securities, and in repurchase agreements collateralized by such securities, provided that the Collective Trust will generally have a dollar-weighted average portfolio maturity of 60 days or less. The Fund can also accept U.S. government securities and letters of credit (non-cash collateral) in connection with securities loans. In the event of default or bankruptcy by the lending agent, realization and/or retention of the collateral may be subject to legal proceedings. In the event the borrower fails to return loaned securities and the collateral received is insufficient to cover the value of the loaned securities and provided such collateral shortfall is not the result of investment losses, the lending agent has agreed to pay the amount of the shortfall to the Fund or, at the discretion of the lending agent, replace the loaned securities. The Fund continues to record dividends or interest, as applicable, on the securities loaned and is subject to changes in value of the securities loaned that may occur during the term of the loan. The Fund has the right under the Lending Agreement to recover the securities from the borrower on demand. With respect to security loans collateralized by non-cash collateral, the Fund receives loan premiums paid by the borrower. With respect to security loans collateralized by cash collateral, the earnings from the collateral investments are shared among the Fund, the security lending agent, and the borrower. The Fund records security lending income net of allocations to the security lending agent and the borrower.
The Collective Trust used for the investment of cash collateral received from borrowers of securities seeks to maintain a net asset value per unit of $1.00, but there can be no assurance that it will always be able to do so. The Fund may incur investment losses as a result of investing securities lending collateral in the Collective Trust. This could occur if an investment in the Collective Trust defaulted or if it were necessary to liquidate assets in the Collective Trust to meet returns on outstanding security loans at a time when the Collective Trust’s net asset value per unit was less than $1.00. Under those circumstances, the Fund may not receive an amount from the Collective Trust that is equal in amount to the collateral the Fund would be required to return to the borrower of the securities and the Fund would be required to make up for this shortfall.
During the year ended Nov. 30, 2015, the Fund had no securities out on loan.
10. Credit and Market Risk
The Fund may invest up to 15% of its net assets in illiquid securities, which may include securities with contractual restrictions on resale, securities exempt from registration under Rule 144A promulgated under the Securities Act of 1933, as amended, and other securities which may not be readily marketable. The relative illiquidity of these securities may impair the Fund from disposing of them in a timely manner and at a fair price when it is necessary or desirable to do so. While maintaining oversight, the Fund’s Board has delegated to DMC, the day-to-day functions of determining whether individual securities are liquid for purposes of the Fund’s limitation on investments in illiquid securities. Securities eligible for resale pursuant to Rule 144A, which are determined to be liquid, are not subject to the Fund’s 15% limit on investments in illiquid securities. As of Nov. 30, 2015, there were no Rule 144A securities held by the fund and no securities have been determined to be illiquid under the Fund’s Liquidity Procedures.
37
Notes to financial statements
Delaware Value® Fund
11. Contractual Obligations
The Fund enters into contracts in the normal course of business that contain a variety of indemnifications. The Fund’s maximum exposure under these arrangements is unknown. However, the Fund has not had prior claims or losses pursuant to these contracts. Management has reviewed the Fund’s existing contracts and expects the risk of loss to be remote.
12. Recent Accounting Pronouncements
In June 2014, the FASB issued guidance to improve the financial reporting of reverse repurchase agreements and other similar transactions. The guidance includes expanded disclosure requirements for entities that enter into reverse repurchase agreements and similar transactions accounted for as secured borrowings. The guidance is effective for financial statements with fiscal years beginning on or after Dec. 15, 2014 and interim periods within those fiscal years. Management has determined that this pronouncement has no impact to the Fund’s financial statements.
In May 2015, the FASB issued Accounting Standards Update (“ASU”) No. 2015-07 regarding “Disclosures for Investments in Certain Entities That Calculate Net Asset Value per Share.” The amendments in this update are effective for the Funds for fiscal years beginning after Dec. 15, 2015, and interim periods within those fiscal years. ASU No. 2015-07 will eliminate the requirement to categorize investments in the fair value hierarchy if their fair value is measured at net asset value (“NAV”) per share (or its equivalent) using the practical expedient in the FASB’s fair value measurement guidance. Management is evaluating the impact, if any, of this guidance on the Fund’s financial statement disclosure.
13. Subsequent Events
Management has determined that no material events or transactions occurred subsequent to Nov. 30, 2015 that would require recognition or disclosure in the Fund’s financial statements.
38
Report of independent
registered public accounting firm
To the Board of Trustees of Delaware Group® Equity Funds II
and Shareholders of Delaware Value® Fund:
In our opinion, the accompanying statement of assets and liabilities, including the schedule of investments, and the related statements of operations and of changes in net assets and the financial highlights present fairly, in all material respects, the financial position of Delaware Value Fund (constituting Delaware Group Equity Funds II, hereafter referred to as the “Fund”) at November 30, 2015, the results of its operations for the year then ended, the changes in its net assets for each of the two years in the period then ended and the financial highlights for each of the five years in the period then ended, in conformity with accounting principles generally accepted in the United States of America. These financial statements and financial highlights (hereafter referred to as “financial statements”) are the responsibility of the Fund’s management. Our responsibility is to express an opinion on these financial statements based on our audits. We conducted our audits of these financial statements in accordance with the standards of the Public Company Accounting Oversight Board (United States). Those standards require that we plan and perform the audit to obtain reasonable assurance about whether the financial statements are free of material misstatement. An audit includes examining, on a test basis, evidence supporting the amounts and disclosures in the financial statements, assessing the accounting principles used and significant estimates made by management, and evaluating the overall financial statement presentation. We believe that our audits, which included confirmation of securities at November 30, 2015 by correspondence with the custodian and brokers and the application of alternative auditing procedures where confirmations of security purchases had not been received, provide a reasonable basis for our opinion.
PricewaterhouseCoopers LLP
Philadelphia, Pennsylvania
January 21, 2016
39
Other Fund information (Unaudited)
Delaware Value® Fund
Tax Information
The information set forth below is for the Fund’s fiscal year as required by federal income tax laws. Shareholders, however, must report distributions on a calendar year basis for income tax purposes, which may include distributions for portions of two fiscal years of the Fund. Accordingly, the information needed by shareholders for income tax purposes will be sent to them in January of each year. Please consult your tax advisor for proper treatment of this information.
All disclosures are based on financial information available as of the date of this annual report and, accordingly are subject to change. For any and all items requiring reporting, it is the intention of the Fund to report the maximum amount permitted under the Internal Revenue Code and the regulations thereunder.
For the fiscal year ended Nov. 30, 2015, the Fund reports distributions paid during the year as follows:
| | | | |
(A) Ordinary Income Distributions (Tax Basis)* | | | 100.00 | % |
(B) Qualified Dividends1 | | | 100.00 | % |
(A) is based on a percentage of the Fund’s total distributions | | | | |
(B) is based on the Fund’s ordinary income distributions | | | | |
| 1 | Qualified dividends represent dividends which qualify for the corporate dividends received deduction. |
| * | For the fiscal year ended Nov. 30, 2015, certain dividends paid by the Fund may be subject to a maximum tax rate of 20%. The percentage of dividends paid by the Fund from ordinary income reported as qualified dividend income is 100%. Complete information will be compiled and reported in conjunction with your 2015 Form 1099-DIV. |
For the fiscal year ended Nov. 30, 2015, certain interest income paid by the Fund, has been determined to be Qualified Interest Income, and may be subject to relief from U.S. withholding for foreign shareholders, as provided by the American Jobs Creation Act of 2004; the Tax Relief, Unemployment Insurance Reauthorization, and Job Creation Act of 2010; and as extended by the American Taxpayer Relief Act of 2012. For the fiscal year ended Nov. 30, 2015, the Fund has reported maximum distributions of Qualified Interest Income of $60,545. Complete information will be computed and reported in conjunction with your 2015 Form 1099-DIV.
40
Board consideration of Delaware Value® Fund investment management agreement
At a meeting held on Aug. 18–20, 2015 (the “Annual Meeting”), the Board of Trustees (collectively referred to here as the “Board”), including a majority of disinterested or independent Trustees, approved the renewal of the Investment Advisory Agreement for Delaware Value Fund (the “Fund”). In making its decision, the Board considered information furnished at regular quarterly Board meetings, including reports detailing Fund performance, investment strategies, and expenses, as well as information prepared specifically in connection with the renewal of the investment advisory and sub-advisory contracts. Information furnished specifically in connection with the renewal of the Investment Management Agreement with Delaware Management Company (“DMC”) included materials provided by DMC and its affiliates (“Delaware Investments”) concerning, among other things, the nature, extent, and quality of services provided to the Fund; the costs of such services to the Fund; economies of scale; and the investment manager’s financial condition and profitability. In addition, in connection with the Annual Meeting, reports were provided to the Trustees in May 2015 and included reports provided by Lipper, Inc., an independent statistical compilation organization (“Lipper”). The Lipper reports compared the Fund’s investment performance and expenses with those of other comparable mutual funds. The Independent Trustees reviewed and discussed the Lipper reports with independent legal counsel to the Independent Trustees. In addition to the information noted above, the Board also requested and received information regarding DMC’s policy with respect to advisory fee levels and its breakpoint philosophy; the structure of portfolio manager compensation; comparative client fee information; and any constraints or limitations on the availability of securities for certain investment styles, which had in the past year inhibited, or which were likely in the future to inhibit, the investment manager’s ability to invest fully in accordance with Fund policies.
In considering information relating to the approval of the Fund’s advisory agreement, the Independent Trustees received assistance and advice from and met separately with independent legal counsel to the Independent Trustees. They also engaged a consultant to assist them in analyzing portions of the data received. The Independent Trustees reviewed and discussed with such consultant two reports prepared by the consultant with respect to such data. Although the Board gave attention to all information furnished, the following discussion identifies, under separate headings, the primary factors taken into account by the Board during its contract renewal considerations.
Nature, extent, and quality of service. The Board considered the services provided by DMC to the Fund and its shareholders. In reviewing the nature, extent, and quality of services, the Board considered reports furnished to it throughout the year, which covered matters such as the relative performance of the Fund; compliance of portfolio managers with the investment policies, strategies, and restrictions for the Fund; compliance by DMC and Delaware Distributors, L.P. (together, “Management”) personnel with the Code of Ethics adopted throughout the Delaware Investments® Family of Funds complex; and adherence to fair value pricing procedures as established by the Board. The Board was pleased with the current staffing of the Fund’s investment adviser and the emphasis placed on research in the investment process. The Board recognized DMC’s receipt of several industry distinctions during the past several years. The Board gave favorable consideration to DMC’s efforts to control expenditures while maintaining service levels committed to Fund matters. The Board noted that, in the third and fourth quarters of 2013, Management reduced the maximum 12b-1 fee for certain Funds, and in November 2013 Management negotiated a substantial reduction in fees for fund accounting services
41
Other Fund information (Unaudited)
Delaware Value® Fund
Board consideration of Delaware Value Fund investment management agreement
provided to the Funds. The Board noted the benefits provided to Fund shareholders through each shareholder’s ability to exchange an investment in one Delaware Investments fund for the same class of shares in another Delaware Investments fund without a sales charge, to reinvest Fund dividends into additional shares of the Fund or into additional shares of other Delaware Investments funds, and the privilege to combine holdings in other Delaware Investments funds to obtain a reduced sales charge. The Board was satisfied with the nature, extent, and quality of the overall services provided by DMC.
Investment performance. The Board placed significant emphasis on the investment performance of the Fund in view of the importance of investment performance to shareholders. Although the Board gave appropriate consideration to performance reports and discussions with portfolio managers at Investment Committee meetings throughout the year, the Board gave particular weight to the Lipper reports furnished for the Annual Meeting. The Lipper reports prepared for the Fund showed the investment performance of its Class A shares in comparison to a group of similar funds as selected by Lipper (the “Performance Universe”). A fund with the best performance ranked first, and a fund with the poorest performance ranked last. The highest/best performing 25% of funds in the Performance Universe make up the first quartile; the next 25%, the second quartile; the next 25%, the third quartile; and the poorest/ worst performing 25% of funds in the Performance Universe make up the fourth quartile. Comparative annualized performance for the Fund was shown for the past 1-, 3-, 5-, and 10-year periods, to the extent applicable, ended March 31, 2015. The Board’s objective is that the Fund’s performance for the periods considered be at or above the median of its Performance Universe.
The Performance Universe for the Fund consisted of the Fund and all retail and institutional large-cap value funds as selected by Lipper. The Lipper report comparison showed that the Fund’s total return for the 1-, 3-, 5-, and 10-year periods was in the first quartile of its Performance Universe. The Board was very satisfied with performance.
Comparative expenses. The Board considered expense comparison data for the Delaware Investments® Family of Funds. Management provided the Board with information on pricing levels and fee structures for the Fund as of its most recently completed fiscal year. The Board also focused on the comparative analysis of effective management fees and total expense ratios of the Fund versus effective management fees and expense ratios of a group of similar funds as selected by Lipper (the “Expense Group”). In reviewing comparative costs, the Fund’s contractual management fee and the actual management fee incurred by the Fund were compared with the contractual management fees (assuming all funds in the Expense Group were similar in size to the Fund) and actual management fees (as reported by each fund) within the Expense Group, taking into account any applicable breakpoints and fee waivers. The Fund’s total expenses were also compared with those of its Expense Group. The Lipper total expenses, for comparative consistency, were shown by Lipper for Class A shares and comparative total expenses including 12b-1 and non-12b-1 service fees. The Board considered fees paid to DMC for non-management services. The Board’s objective is to limit the Fund’s total expense ratio to be competitive with that of the Expense Group.
The expense comparisons for the Fund showed that its actual management fee and total expenses were in the quartile with the second lowest expenses of its Expense Group. The Board was satisfied with the
42
management fee and total expenses of the Fund in comparison to those of its Expense Group as shown in the Lipper report.
Management profitability. The Board considered the level of profits realized by DMC in connection with the operation of the Fund. In this respect, the Board reviewed the Investment Management Profitability Analysis that addressed the overall profitability of DMC’s business in providing management and other services to each of the individual funds and the Delaware Investments® Family of Funds as a whole. Specific attention was given to the methodology followed in allocating costs for the purpose of determining profitability. Management stated that the level of profits of DMC, to a certain extent, reflects recent operational cost savings and efficiencies initiated by DMC. The Board considered DMC’s efforts to improve services provided to fund shareholders and to meet additional regulatory and compliance requirements resulting from recent industry-wide Securities and Exchange Commission initiatives. The Board also considered the extent to which DMC might derive ancillary benefits from fund operations, including the potential for procuring additional business as a result of the prestige and visibility associated with its role as service provider to the Delaware Investments Family of Funds and the benefits from allocation of fund brokerage to improve trading efficiencies. The Board found that the management fees were reasonable in light of the services rendered and the level of profitability of DMC.
Economies of scale. The Trustees considered whether economies of scale are realized by DMC as the Fund’s assets increase and the extent to which any economies of scale are reflected in the level of management fees charged. The Trustees reviewed the standardized advisory fee pricing and structure, approved by the Board and shareholders, which includes breakpoints, and which applies to most funds in the Delaware Investments Family of Funds complex. Breakpoints in the advisory fee occur when the advisory fee rate is reduced on assets in excess of specified levels. Breakpoints result in a lower advisory fee than would otherwise be the case in the absence of breakpoints, when the asset levels specified in the breakpoints are exceeded. The Board noted that the fee under the Fund’s management contract fell within the standardized fee pricing structure. Although the Fund has not reached a size at which it can take advantage of any breakpoints in the applicable fee schedule, the Board recognized that the fee was structured so that if the Fund grows, economies of scale may be shared.
43
Board of trustees / directors and officers addendum
Delaware Investments® Family of Funds
A mutual fund is governed by a Board of Trustees/Directors (“Trustees”), which has oversight responsibility for the management of a fund’s business affairs. Trustees establish procedures and oversee and review the performance of the investment manager, the distributor, and others who perform services for the fund. The independent fund trustees, in particular, are advocates
| | | | |
| | | | | |
| Name, Address, | | Position(s) | | Length of |
| and Birth Date | | Held with Fund(s) | | Time Served |
|
Interested Trustee |
| Shawn K. Lytle1 | | President, | | Trustee since |
| 2005 Market Street | | Chief Executive Officer, | | September 2015 |
| Philadelphia, PA 19103 | | and Trustee | | |
| February 1970 | | | | President and |
| | | | Chief Executive Officer |
| | | | since August 2015 |
| | | | | |
| | | | | |
|
Independent Trustees |
| Thomas L. Bennett | | Chairman and Trustee | | Trustee since |
| 2005 Market Street | | | | March 2005 |
| Philadelphia, PA 19103 | | | | |
| October 1947 | | | | Chairman since |
| | | | March 2015 |
| | | | | |
| Ann D. Borowiec | | Trustee | | Since March 2015 |
| 2005 Market Street | | | | |
| Philadelphia, PA 19103 | | | | |
| November 1958 | | | | |
| | | | | |
| | | | | |
| | | | | |
| | | | | |
| Joseph W. Chow | | Trustee | | Since January 2013 |
| 2005 Market Street | | | | |
| Philadelphia, PA 19103 | | | | |
| January 1953 | | | | |
| | | | | |
| | | | | |
| | | | | |
1 Shawn K. Lytle is considered to be an “Interested Trustee” because he is an executive officer of the Fund’s(s’) investment advisor.
44
for shareholder interests. Each trustee has served in that capacity since he or she was elected to or appointed to the Board of Trustees, and will continue to serve until his or her retirement or the election of a new trustee in his or her place. The following is a list of the Trustees and Officers with certain background and related information.
| | | | |
| | | Number of Portfolios in | | |
| Principal Occupation(s) | | Fund Complex Overseen | | Other Directorships |
| During the Past Five Years | | by Trustee or Officer | | Held by Trustee or Officer |
|
|
| Shawn K. Lytle has served as | | 65 | | Trustee — UBS |
| President of | | | | Relationship Funds, |
| Delaware Investments2 | | | | SMA Relationship |
| since June 2015 and was the | | | | Trust, and UBS Funds |
| Regional Head of Americas for | | | | (May 2010–April 2015) |
| UBS Global Asset | | | | |
| Management from | | | | |
| 2010 through 2015. | | | | |
|
|
| Private Investor | | 65 | | Director — |
| (March 2004–Present) | | | | Bryn Mawr Bank Corp. (BMTC) |
| | | | (2007–2011) |
| | | | | |
| | | | | |
| | | | | |
| Chief Executive Officer | | 65 | | None |
| Private Wealth Management | | | | |
| (2011–2013) and | | | | |
| Market Manager, | | | | |
| New Jersey Private | | | | |
| Bank (2005–2011) — | | | | |
| J.P. Morgan Chase & Co. | | | | |
| | | | | |
| Executive Vice President | | 65 | | Director and Audit Committee |
| (Emerging Economies | | | | Member — Hercules |
| Strategies, Risks, and | | | | Technology Growth |
| Corporate Administration) | | | | Capital, Inc. |
| State Street Corporation | | | | (2004–2014) |
| (July 2004–March 2011) | | | | |
| | | | | |
2 Delaware Investments is the marketing name for Delaware Management Holdings, Inc. and its subsidiaries, including the Fund’s(s’) investment advisor, principal underwriter, and its transfer agent.
45
Board of trustees / directors and officers addendum
Delaware Investments® Family of Funds
| | | | |
| | | | | |
| Name, Address, | | Position(s) | | Length of |
| and Birth Date | | Held with Fund(s) | | Time Served |
|
Independent Trustees (continued) |
| John A. Fry | | Trustee | | Since January 2001 |
| 2005 Market Street | | | | |
| Philadelphia, PA 19103 | | | | |
| May 1960 | | | | |
| | | | | |
| | | | | |
| | | | | |
| | | | | |
| | | | | |
| | | | | |
| | | | | |
| | | | | |
| | | | | |
| Lucinda S. Landreth | | Trustee | | Since March 2005 |
| 2005 Market Street | | | | |
| Philadelphia, PA 19103 | | | | |
| June 1947 | | | | |
| | | | | |
| Frances A. Sevilla-Sacasa | | Trustee | | Since September 2011 |
| 2005 Market Street | | | | |
| Philadelphia, PA 19103 | | | | |
| January 1956 | | | | |
| | | | | |
| | | | | |
| | | | | |
| | | | | |
| | | | | |
| | | | | |
| | | | | |
| | | | | |
| | | | | |
| | | | | |
| | | | | |
| | | | | |
| | | | | |
| | | | | |
46
| | | | |
| | | Number of Portfolios in | | |
| Principal Occupation(s) | | Fund Complex Overseen | | Other Directorships |
| During the Past Five Years | | by Trustee or Officer | | Held by Trustee or Officer |
|
|
| President — | | 65 | | Director — Hershey Trust |
| Drexel University | | | | Company |
| (August 2010–Present) | | | | |
| | | | Director, Audit Committee, |
| President — | | | | and Governance Committee |
| Franklin & Marshall College | | | | Member — Community |
| (July 2002–July 2010) | | | | Health Systems |
| | |
| | | | Director — Drexel |
| | | | Morgan & Co. |
| | | | | |
| | | | | |
| Private Investor | | 65 | | None |
| (2004–Present) | | | | |
| | | | | |
| | | | | |
| | | | | |
| Chief Executive Officer — | | 65 | | Trust Manager and |
| Banco Itaú | | | | Audit Committee |
| International | | | | Member — Camden |
| (April 2012–Present) | | | | Property Trust |
| | |
| Executive Advisor to Dean | | | | |
(August 2011–March 2012) and Interim Dean | | | | |
| (January 2011–July 2011) — | | | | |
| University of Miami School of | | | | |
| Business Administration | | | | |
| | | | | |
| President — U.S. Trust, | | | | |
| Bank of America Private | | | | |
| Wealth Management | | | | |
| (Private Banking) | | | | |
| (July 2007–December 2008) | | | | |
| | | | | |
47
Board of trustees / directors and officers addendum
Delaware Investments® Family of Funds
| | | | |
| | | | | |
| Name, Address, | | Position(s) | | Length of |
| and Birth Date | | Held with Fund(s) | | Time Served |
|
Independent Trustees (continued) |
| Thomas K. Whitford | | Trustee | | Since January 2013 |
| 2005 Market Street | | | | |
| Philadelphia, PA 19103 | | | | |
| March 1956 | | | | |
| | | | | |
| | | | | |
| | | | | |
| | | | | |
| | | | | |
| | | | | |
| | | | | |
| Janet L. Yeomans | | Trustee | | Since April 1999 |
| 2005 Market Street | | | | |
| Philadelphia, PA 19103 | | | | |
| July 1948 | | | | |
| | | | | |
| | | | | |
| | | | | |
| | | | | |
| | | | | |
| | | | | |
| | | | | |
| | | | | |
48
| | | | |
| | | Number of Portfolios in | | |
| Principal Occupation(s) | | Fund Complex Overseen | | Other Directorships |
| During the Past Five Years | | by Trustee or Officer | | Held by Trustee or Officer |
|
|
| Vice Chairman | | 65 | | Director — HSBC Finance |
| (2010–April 2013), | | | | Corporation and HSBC |
| Chief Administrative | | | | North America Holdings Inc. |
Officer (2008–2010), and Executive Vice | | | | Director — |
| President and Chief | | | | HSBC Bank |
| Administrative Officer | | | | |
| (2007–2009) — | | | | |
| PNC Financial | | | | |
| Services Group | | | | |
| | | | | |
| Vice President and Treasurer | | 65 | | Director, Audit and |
| (January 2006–July 2012) | | | | Compliance Committee Chair, |
| Vice President — | | | | Investment Committee |
| Mergers & Acquisitions | | | | Member, and Governance |
| (January 2003–January 2006), | | | | Committee Member — |
| and Vice President | | | | Okabena Company |
| and Treasurer | | | | |
| (July 1995–January 2003) | | | | Chair — 3M |
| 3M Corporation | | | | Investment Management |
| | | | Company |
| | | | (2005–2012) |
| | | | | |
49
Board of trustees / directors and officers addendum
Delaware Investments® Family of Funds
| | | | |
| | | | | |
| Name, Address, | | Position(s) | | Length of |
| and Birth Date | | Held with Fund(s) | | Time Served |
|
Officers |
| David F. Connor | | Senior Vice President, | | Senior Vice President |
| 2005 Market Street | | General Counsel, | | since May 2013; |
| Philadelphia, PA 19103 | | and Secretary | | General Counsel |
| December 1963 | | | | since May 2015; |
| | | | Secretary since |
| | | | October 2005 |
| | | | | |
| | | | | |
| | | | | |
| | | | | |
| | | | | |
| Daniel V. Geatens | | Vice President | | Treasurer since October 2007 |
| 2005 Market Street | | and Treasurer | | |
| Philadelphia, PA 19103 | | | | |
| October 1972 | | | | |
| | | | | |
| | | | | |
| | | | | |
| | | | | |
| Richard Salus | | Senior Vice President | | Chief Financial Officer |
| 2005 Market Street | | and Chief Financial Officer | | since November 2006 |
| Philadelphia, PA 19103 | | | | |
| October 1963 | | | | |
| | | | | |
| | | | | |
The Statement of Additional Information for the Fund(s) includes additional information about the Trustees and Officers and is available, without charge, upon request by calling 800 523-1918.
50
| | | | |
| | | Number of Portfolios in | | |
| Principal Occupation(s) | | Fund Complex Overseen | | Other Directorships |
| During the Past Five Years | | by Trustee or Officer | | Held by Trustee or Officer |
|
|
| David F. Connor has served as | | 65 | | None3 |
Senior Vice President of the Fund(s) and the investment advisor since 2013, General Counsel of the Fund(s) and the investment advisor since 2015, and Secretary of the Fund(s) and the investment advisor since 2005. | | | | |
| | | | | |
| Daniel V. Geatens has served | | 65 | | None3 |
| as Vice President and | | | | |
Treasurer of the Fund(s) since 2007 and Vice President and Director of Financial | | | | |
Administration of the investment advisor since 2010. | | | | |
| | | | | |
| Richard Salus has served as | | 65 | | None3 |
Senior Vice President and Chief Financial Officer of the Fund(s) and the investment advisor since 2006. | | | | |
| | | | | |
3 David F. Connor, Daniel V. Geatens, and Richard Salus serve in similar capacities for the six portfolios of the Optimum Fund Trust, which have the same investment advisor, principal underwriter, and transfer agent as the registrant.
51
About the organization
| | | | | | |
| Board of trustees |
| | | |
Shawn K. Lytle President and Chief Executive Officer Delaware Investments® Family of Funds Philadelphia, PA Thomas L. Bennett Chairman of the Board Delaware Investments Family of Funds Private Investor Rosemont, PA | | Ann D. Borowiec Former Chief Executive Officer Private Wealth Management J.P. Morgan Chase & Co. New York, NY Joseph W. Chow Former Executive Vice President State Street Corporation Boston, MA | | John A. Fry President Drexel University Philadelphia, PA Lucinda S. Landreth Former Chief Investment Officer Assurant, Inc. New York, NY | | Frances A. Sevilla-Sacasa Chief Executive Officer Banco Itaú International Miami, FL Thomas K. Whitford Former Vice Chairman PNC Financial Services Group Pittsburgh, PA Janet L. Yeomans Former Vice President and Treasurer 3M Corporation St. Paul, MN |
|
| Affiliated officers |
| | | |
David F. Connor Senior Vice President, General Counsel, and Secretary Delaware Investments Family of Funds Philadelphia, PA | | Daniel V. Geatens Vice President and Treasurer Delaware Investments Family of Funds Philadelphia, PA | | Richard Salus Senior Vice President and Chief Financial Officer Delaware Investments Family of Funds Philadelphia, PA | | |
This annual report is for the information of Delaware Value® Fund shareholders, but it may be used with prospective investors when preceded or accompanied by the Delaware Investments Fund fact sheet for the most recently completed calendar quarter. These documents are available at delawareinvestments.com.
Delaware Investments is the marketing name of Delaware Management Holdings, Inc. and its subsidiaries.
The Fund files its complete schedule of portfolio holdings with the Securities and Exchange Commission (SEC) for the first and third quarters of each fiscal year on Form N-Q. The Fund’s Forms N-Q, as well as a description of the policies and procedures that the Fund uses to determine how to vote proxies (if any) relating to portfolio securities are available without charge (i) upon request, by calling 800 523-1918; and (ii) on the SEC’s website at sec.gov. In addition, a description of the policies and procedures that the Fund uses to determine how to vote proxies (if any) relating to portfolio securities and the Schedule of Investments included in the Fund’s most recent Form N-Q are available without charge on the Fund’s website at delawareinvestments.com. The Fund’s Forms N-Q may be reviewed and copied at the SEC’s Public Reference Room in Washington, D.C.; information on the operation of the Public Reference Room may be obtained by calling 800 SEC-0330.
Information (if any) regarding how the Fund voted proxies relating to portfolio securities during the most recently disclosed 12-month period ended June 30 is available without charge (i) through the Fund’s website at delawareinvestments.com; and (ii) on the SEC’s website at sec.gov.
52
Item 2. Code of Ethics
The registrant has adopted a code of ethics that applies to the registrant’s principal executive officer, principal financial officer, principal accounting officer or controller, or persons performing similar functions, regardless of whether these individuals are employed by the registrant or a third party. A copy of the registrant’s Code of Business Ethics has been posted on the Delaware Investments Internet Web site at www.delawareinvestments.com. Any amendments to the Code of Business Ethics, and information on any waiver from its provisions granted by the registrant, will also be posted on this Web site within five business days of such amendment or waiver and will remain on the Web site for at least 12 months.
Item 3. Audit Committee Financial Expert
The registrant’s Board of Trustees/Directors has determined that certain members of the registrant’s Audit Committee are audit committee financial experts, as defined below. For purposes of this item, an “audit committee financial expert” is a person who has the following attributes:
a. An understanding of generally accepted accounting principles and financial statements;
b. The ability to assess the general application of such principles in connection with the accounting for estimates, accruals, and reserves;
c. Experience preparing, auditing, analyzing, or evaluating financial statements that present a breadth and level of complexity of accounting issues that are generally comparable to the breadth and complexity of issues that can reasonably be expected to be raised by the registrant’s financial statements, or experience actively supervising one or more persons engaged in such activities;
d. An understanding of internal controls and procedures for financial reporting; and
e. An understanding of audit committee functions.
An “audit committee financial expert” shall have acquired such attributes through:
a. Education and experience as a principal financial officer, principal accounting officer, controller, public accountant, or auditor or experience in one or more positions that involve the performance of similar functions;
b. Experience actively supervising a principal financial officer, principal accounting officer, controller, public accountant, auditor, or person performing similar functions;
c. Experience overseeing or assessing the performance of companies or public accountants with respect to the preparation, auditing, or evaluation of financial statements; or
d. Other relevant experience.
The registrant’s Board of Trustees/Directors has also determined that each member of the registrant’s Audit Committee is independent. In order to be “independent” for purposes of this item, the Audit Committee member may not: (i) other than in his or her capacity as a member of the Board of Trustees/Directors or any committee thereof, accept directly or indirectly any consulting, advisory or other compensatory fee from the issuer; or (ii) be an “interested person” of the registrant as defined in Section 2(a)(19) of the Investment Company Act of 1940.
The names of the audit committee financial experts on the registrant’s Audit Committee are set forth below:
Item 4. Principal Accountant Fees and Services
The aggregate fees billed for services provided to the registrant by its independent auditors for the audit of the registrant’s annual financial statements and for services normally provided by the independent auditors in connection with statutory and regulatory filings or engagements were $29,030 for the fiscal year ended November 30, 2015.
The aggregate fees billed for services provided to the registrant by its independent auditors for the audit of the registrant’s financial statements and for services normally provided by the independent auditors in connection with statutory and regulatory filings or engagements were $26,750 for the fiscal year ended November 30, 2014.
The aggregate fees billed by the registrant’s independent auditors for services relating to the performance of the audit of the registrant’s financial statements and not reported under paragraph (a) of this Item were $0 for the fiscal year ended November 30, 2015.
The aggregate fees billed by the registrant’s independent auditors for services relating to the performance of the audit of the registrant’s financial statements and not reported under paragraph (a) of this Item were $0 for the fiscal year ended November 30, 2014.
The aggregate fees billed for all services provided by the independent auditors to the registrant other than those set forth in paragraphs (a), (b) and (c) of this Item were $0 for the fiscal year ended November 30, 2015.
The aggregate fees billed for all services provided by the independent auditors to the registrant other than those set forth in paragraphs (a), (b) and (c) of this Item were $0 for the fiscal year ended November 30, 2014.
(e) The registrant’s Audit Committee has established pre-approval policies and procedures as permitted by Rule 2-01(c)(7)(i)(B) of Regulation S-X (the “Pre-Approval Policy”) with respect to services provided by the registrant’s independent auditors. Pursuant to the Pre-Approval Policy, the Audit Committee has pre-approved the services set forth in the table below with respect to the registrant up to the specified fee limits. Certain fee limits are based on aggregate fees to the registrant and other registrants within the Delaware Investments Family of Funds.
Under the Pre-Approval Policy, the Audit Committee has also pre-approved the services set forth in the table below with respect to the registrant’s investment adviser and other entities controlling, controlled by or under common control with the investment adviser that provide ongoing services to the registrant (the “Control Affiliates”) up to the specified fee limit. This fee limit is based on aggregate fees to the investment adviser and its Control Affiliates.
The Pre-Approval Policy requires the registrant’s independent auditors to report to the Audit Committee at each of its regular meetings regarding all services initiated since the last such report was rendered, including those services authorized by the Pre-Approval Policy.
(f) Not applicable.
(g) The aggregate non-audit fees billed by the registrant’s independent auditors for services rendered to the registrant and to its investment adviser and other service providers under common control with the adviser were $11,111,212 and $5,653,375 for the registrant’s fiscal years ended November 30, 2015 and November 30, 2014, respectively.
(h) In connection with its selection of the independent auditors, the registrant’s Audit Committee has considered the independent auditors’ provision of non-audit services to the registrant’s investment adviser and other service providers under common control with the adviser that were not required to be pre-approved pursuant to Rule 2-01(c)(7)(ii) of Regulation S-X. The Audit Committee has determined that the independent auditors’ provision of these services is compatible with maintaining the auditors’ independence.
Item 5. Audit Committee of Listed Registrants
Not applicable.
Item 6. Investments
(a) Included as part of report to shareholders filed under Item 1 of this Form N-CSR.
(b) Divestment of securities in accordance with Section 13(c) of the Investment Company Act of 1940.
Not applicable.
Item 7. Disclosure of Proxy Voting Policies and Procedures for Closed-End Management Investment Companies
Not applicable.
Item 8. Portfolio Managers of Closed-End Management Investment Companies
Not applicable.
Item 9. Purchases of Equity Securities by Closed-End Management Investment Company and Affiliated Purchasers
Not applicable.
Item 10. Submission of Matters to a Vote of Security Holders
Not applicable.
Item 11. Controls and Procedures
The registrant’s principal executive officer and principal financial officer have evaluated the registrant’s disclosure controls and procedures within 90 days of the filing of this report and have concluded that they are effective in providing reasonable assurance that the information required to be disclosed by the registrant in its reports or statements filed under the Securities Exchange Act of 1934 is recorded, processed, summarized and reported within the time periods specified in the rules and forms of the Securities and Exchange Commission.
There were no significant changes in the registrant’s internal control over financial reporting that occurred during the second fiscal quarter of the period covered by the report to stockholders included herein (i.e., the registrant’s fourth fiscal quarter) that have materially affected, or are reasonably likely to materially affect, the registrant’s internal control over financial reporting.
Item 12. Exhibits
Not applicable.
(2) Certifications of Principal Executive Officer and Principal Financial Officer pursuant to Rule 30a-2 under the Investment Company Act of 1940 are attached hereto as Exhibit 99.CERT.
(3) Written solicitations to purchase securities pursuant to Rule 23c-1 under the Securities Exchange Act of 1934.
Not applicable.
(b) Certifications pursuant to Section 906 of the Sarbanes-Oxley Act of 2002 are furnished herewith as Exhibit 99.906CERT.
Pursuant to the requirements of the Securities Exchange Act of 1934 and the Investment Company Act of 1940, the registrant has duly caused this report to be signed on its behalf, by the undersigned, thereunto duly authorized.
Pursuant to the requirements of the Securities Exchange Act of 1934 and the Investment Company Act of 1940, this report has been signed below by the following persons on behalf of the registrant and in the capacities and on the dates indicated.