UNITED STATES
SECURITIES AND EXCHANGE COMMISSION
Washington, D.C. 20549
FORM N-CSR
CERTIFIED SHAREHOLDER REPORT OF REGISTERED
MANAGEMENT INVESTMENT COMPANIES
Investment Company Act file number 811-2490
Smith Barney Money Funds, Inc.
(Exact name of registrant as specified in charter)
| 125 Broad Street, New York, NY | 10004 | |
| (Address of principal executive offices) | (Zip code) | |
Robert I. Frenkel, Esq.
Smith Barney Fund Management LLC
300 First Stamford Place
Stamford, CT 06902
(Name and address of agent for service)
Registrant’s telephone number, including area code: (800) 451-2010
Date of fiscal year end: December 31
Date of reporting period: December 31, 2004
ITEM 1. REPORT TO STOCKHOLDERS.
The Annual Report to Stockholders is filed herewith.
SMITH BARNEY
MONEY FUNDS, INC.
ANNUAL REPORT | DECEMBER 31, 2004

NOT FDIC INSURED • NOT BANK GUARANTEED • MAY LOSE VALUE
WHAT’S INSIDE
| 1 | ||
| 3 | ||
| 6 | ||
| 7 | ||
| 8 | ||
| 10 | ||
| 16 | ||
| 17 | ||
| 18 | ||
| 20 | ||
| 24 | ||
| 35 | ||
| 36 | ||
| 40 | ||

R. JAY GERKEN, CFA
Chairman, President and Chief Executive Officer
Dear Shareholder,
Despite sharply rising oil prices, threats of terrorism, geopolitical concerns and uncertainties surrounding the presidential election, the U.S. economy continued to expand during the reporting period. Following a robust 4.5% gain in the first quarter of 2004, gross domestic product (“GDP”)i growth was 3.3% in the second quarter of the year. This decline was largely attributed to higher energy prices. However, third quarter 2004 GDP rose a solid 4.0%. While fourth quarter GDP figures have not yet been released, continued growth is expected.
Given the overall strength of the economy, Federal Reserve Board (“Fed”)ii monetary policy was seen as highly accommodative and expectations were that it would start raising rates to ward off the threat of inflation. As expected, the Fed raised its target for the federal funds rateiii by 0.25% to 1.25% at the end of June 2004 — the first rate increase in four years. The Fed again raised rates in 0.25% increments during August, September, November, and December, bringing the target for the federal funds rate to 2.25%. After the end of the fund’s reporting period, at their February meeting, the Fed once again raised the target rate by 0.25% to 2.50%.
Please read on for a more detailed look at prevailing economic and market conditions during the fund’s fiscal year and to learn how those conditions have affected fund performance.
Information About Your Funds
As you may be aware, several issues in the mutual fund industry have recently come under the scrutiny of federal and state regulators. The funds’ Adviser and some of its affiliates have received requests for information from various government regulators regarding market timing, late trading, fees, and other mutual fund issues in connection with various investigations. The regulators appear to be examining, among other things, the funds’ response to market timing and shareholder exchange activity, including compliance with prospectus disclosure related to these subjects. The funds have been informed that the Adviser and its affiliates are responding to those information requests, but are not in a position to predict the outcome of these requests and investigations.
1 Smith Barney Money Funds, Inc. | 2004 Annual Report
As previously disclosed by Citigroup, the Staff of the Securities and Exchange Commission (“SEC”) has notified Citigroup Asset Management (“CAM”) and Citicorp Trust Bank (“CTB”), an affiliate of CAM, that the Staff is considering recommending a civil injunctive action and/or an administrative proceeding against CAM, CTB, the former CEO of CAM, two former employees and a current employee of CAM, relating to the creation, operation and fees of an internal transfer agent unit that serves various CAM-managed funds. Citigroup is cooperating with the SEC and will seek to resolve this matter in discussion with the SEC Staff. Although there can be no assurance, Citigroup does not believe that this matter will have a material adverse effect on the funds. For further information, please see the “Additional Information” note in the Notes to the Financial Statements included in this report.
As always, thank you for your confidence in our stewardship of your assets. We look forward to helping you continue to meet your financial goals.
Sincerely,

R. Jay Gerken, CFA
Chairman, President and Chief Executive Officer
February 3, 2005
2 Smith Barney Money Funds, Inc. | 2004 Annual Report

MARTIN R. HANLEY
Vice President and
Investment Officer

KEVIN KENNEDY
Vice President and
Investment Officer
Market/Economic Overview
Robust consumer spending and business investment spurred GDP growth over the reporting period. Households benefited from a healthier job market, low interest rates, and the wealth effect created from rising home prices. Corporations continued to reap profits from improved balance sheets, low borrowing costs, and continued tax incentives. The economy maintained the momentum of the recovery from the previous year enough for GDP to grow over 4% for 2004. Labor markets improved, although at times unevenly, adding over 2 million jobs during the reporting period. Oil prices rose sharply over the year, peaking in October 2004. Prices have since fallen and we believe this should lessen the negative impact to economic growth in the coming months. Overall, inflation remained well contained, but it rose modestly at the core level.
In response, the Fed raised the federal funds rate in 0.25% increments five times starting at their June meeting, from 1.00% to its current level of 2.25%. After the end of the fund’s reporting period, at their February meeting, the Fed once again raised the target rate by 0.25% to 2.50%.
Performance Review
As of December 31, 2004, the seven-day current yield for Class A shares of the Smith Barney Money Funds — Cash Portfolio was 1.71% and its seven-day effective yield, which reflects compounding, was 1.72%. The seven-day current yield and seven-day effective yield for Class A shares of the Smith Barney Money Funds — Government Portfolio were 1.67% and 1.68%, respectively, for the same period.1
| 1 | The seven-day effective yield is calculated similarly to the seven-day current yield but, when annualized, the income earned by an investment in the fund is assumed to be reinvested. The effective yield typically will be slightly higher than the current yield because of the compounding effect of the assumed reinvestment. |
3 Smith Barney Money Funds, Inc. | 2004 Annual Report
Past performance is no guarantee of future results. The funds’ yields will vary and performance of other share classes may differ. In addition, your investment is neither insured nor guaranteed by the Federal Deposit Insurance Corporation (“FDIC”) or any other government agency. Although the fund seeks to preserve the value of your investment at $1.00 per share, it is possible to lose money by investing in the fund.
SMITH BARNEY MONEY FUNDS YIELDS AS OF DECEMBER 31, 2004
(unaudited)
| Cash Portfolio | Government Portfolio | |||||
Class A Shares | ||||||
Seven-day current yield | 1.71 | % | 1.67 | % | ||
Seven-day effective yield | 1.72 | % | 1.68 | % | ||
Class C Shares | ||||||
Seven-day current yield | 1.71 | % | 1.27 | % | ||
Seven-day effective yield | 1.73 | % | 1.28 | % | ||
Class Y Shares | ||||||
Seven-day current yield | 1.81 | % | 1.79 | % | ||
Seven-day effective yield | 1.83 | % | 1.81 | % |
The performance shown represents past performance. Past performance is no guarantee of future results and current performance may be higher or lower than the performance shown above. Principal value and investment returns will fluctuate and investors’ shares, when redeemed, may be worth more or less than their original cost.
Performance figures may reflect reimbursements and/or fee waivers, without which the performance would have been lower.
Cash Portfolio Changes
In anticipation of the Fed moving to a more neutral policy, money market yields began to increase in the second quarter of 2004. Monetary policy was viewed as being accommodative and would need to shift to a less stimulative stance. Against this backdrop and in anticipation of higher yields and more attractive extension opportunities, we began to shorten the average maturity of the fund in May. For the remainder of the year, we maintained a cautious maturity stance. We continue to invest in high quality commercial paper, bank certificates of deposit, and government agencies.
4 Smith Barney Money Funds, Inc. | 2004 Annual Report
Government Portfolio Changes
Short-term yields began to move higher in the second quarter in anticipation of the first Fed increase. Monetary policy was viewed as being accommodative and the Fed was seen as needing to shift to a less stimulative stance. Agency discount note issuance remained fairly abundant throughout 2004. Increased supply, at times, made the spread in yields between short-term agencies and comparable money market securities narrow. In the middle of the second quarter of 2004, we started to shorten the average maturity of the fund in anticipation of higher yields and more attractive extension opportunities. For the remainder of the year we maintained a cautious maturity stance.
Thank you for your investment in the Smith Barney Money Funds — Cash Portfolio and Government Portfolio. As ever, we appreciate that you have chosen us to manage your assets and we remain focused on achieving the funds’ investment goals.
Sincerely,
Martin R. Hanley Vice President and Investment Officer |
Kevin Kennedy Vice President and Investment Officer |


February 3, 2005
The information provided is not intended to be a forecast of future events, a guarantee of future results or investment advice. Views expressed may differ from those of the firm as a whole.
RISKS: An investment in a money market is neither insured nor guaranteed by the FDIC or any other government agency. Although the fund seeks to preserve the value of your investment at one dollar per share, it is possible to lose money by investing in the fund.
| i | Gross domestic product is a market value of goods and services produced by labor and property in a given country. |
| ii | The Fed is responsible for the formulation of a policy designed to promote economic growth, full employment, stable prices, and a sustainable pattern of international trade and payments. |
| iii | The federal funds rate is the interest rate that banks with excess reserves at a Federal Reserve district bank charge other banks that need overnight loans. |
5 Smith Barney Money Funds, Inc. | 2004 Annual Report
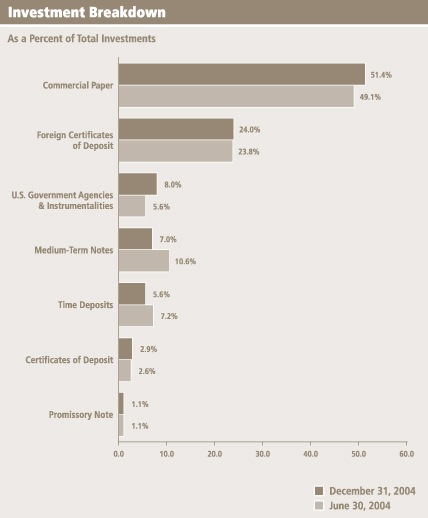
Cash Portfolio Fund at a Glance (unaudited)
6 Smith Barney Money Funds, Inc. | 2004 Annual Report
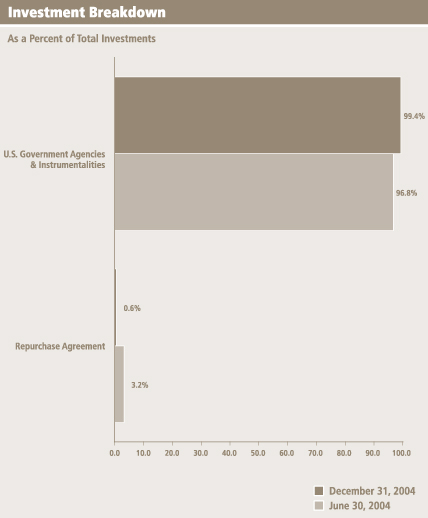
Government Portfolio Fund at a Glance (unaudited)
7 Smith Barney Money Funds, Inc. | 2004 Annual Report
Example
As a shareholder of the Fund, you may incur two types of costs: (1) transaction costs, including front-end and back-end sales charges (loads) on purchase payments, reinvested dividends, or other distributions; and (2) ongoing costs, including management fees; distribution and/or service (12b-1) fees; and other Fund expenses. This example is intended to help you understand your ongoing costs (in dollars) of investing in the Fund and to compare these costs with the ongoing costs of investing in other mutual funds.
This example is based on an investment of $1,000 invested on July 1, 2004 and held for the six months ended December 31, 2004.
Actual Expenses
The table below titled “Based on Actual Total Return” provides information about actual account values and actual expenses. You may use the information provided in this table, together with the amount you invested, to estimate the expenses that you paid over the period. To estimate the expenses you paid on your account, divide your ending account value by $1,000 (for example, an $8,600 ending account value divided by $1,000 = 8.6), then multiply the result by the number under the heading entitled “Expenses Paid During the Period.”
Based on Actual Total Return(1)
| Actual Total Return(2) | Beginning Account Value | Ending Account Value | Annualized Expense Ratio | Expenses Paid During the Period(3) | |||||||||||
Cash Portfolio: | 0.64 | % | $ | 1,000.00 | $ | 1,006.40 | 0.49 | % | $ | 2.47 | |||||
Class C(4) | 0.64 | 1,000.00 | 1,006.40 | 0.50 | 2.52 | ||||||||||
Class Y | 0.69 | 1,000.00 | 1,006.90 | 0.39 | 1.97 | ||||||||||
Government Portfolio: | 0.58 | 1,000.00 | 1,005.80 | 0.54 | 2.72 | ||||||||||
Class C(4) | 0.50 | 1,000.00 | 1,005.00 | 0.68 | 3.43 | ||||||||||
Class Y | 0.64 | 1,000.00 | 1,006.40 | 0.43 | 2.17 | ||||||||||
| (1) | For the six months ended December 31, 2004. |
| (2) | Assumes reinvestment of all dividends and capital gain distributions, if any, at net asset value. Total return is not annualized, as it may not be representative of the total return for the year. Performance figures may reflect voluntary fee waivers and/or expense reimbursements. Past performance is no guarantee of future results. In the absence of voluntary fee waivers and/or expense reimbursements, the total return would have been lower. |
| (3) | Expenses (net of voluntary fee waiver) are equal to each class’ respective annualized expense ratio multiplied by the average account value over the period, multiplied by the number of days in the most recent fiscal half-year, then divided by 366. |
| (4) | On April 29, 2004, Class L shares were renamed as Class C shares. |
8 Smith Barney Money Funds, Inc. | 2004 Annual Report
Fund Expenses (unaudited) (continued)
Hypothetical Example for Comparison Purposes
The table below titled “Based on Hypothetical Total Return” provides information about hypothetical account values and hypothetical expenses based on the actual expense ratio and an assumed rate of return of 5.00% per year before expenses, which is not the Fund’s actual return. The hypothetical account values and expenses may not be used to estimate the actual ending account balance or expenses you paid for the period. You may use the information provided in this table to compare the ongoing costs of investing in the Fund and other funds. To do so, compare the 5.00% hypothetical example relating to the Fund with the 5.00% hypothetical examples that appear in the shareholder reports of the other funds.
Please note that the expenses shown in the table below are meant to highlight your ongoing costs only and do not reflect any transactional costs, such as front-end or back-end sales charges (loads). Therefore, the table is useful in comparing ongoing costs only, and will not help you determine the relative total costs of owning different funds. In addition, if these transaction costs were included, your costs would have been higher.
Based on Hypothetical Total Return(1)
| Hypothetical Annualized Total Return | Beginning Account Value | Ending Account Value | Annualized Expense Ratio | Expenses Paid During the Period(2) | |||||||||||
Cash Portfolio: | 5.00 | % | $ | 1,000.00 | $ | 1,022.67 | 0.49 | % | $ | 2.49 | |||||
Class C(3) | 5.00 | 1,000.00 | 1,022.62 | 0.50 | 2.54 | ||||||||||
Class Y | 5.00 | 1,000.00 | 1,023.18 | 0.39 | 1.98 | ||||||||||
Government Portfolio: | 5.00 | 1,000.00 | 1,022.42 | 0.54 | 2.75 | ||||||||||
Class C(3) | 5.00 | 1,000.00 | 1,021.72 | 0.68 | 3.46 | ||||||||||
Class Y | 5.00 | 1,000.00 | 1,022.97 | 0.43 | 2.19 | ||||||||||
| (1) | For the six months ended December 31, 2004. |
| (2) | Expenses (net of voluntary fee waiver) are equal to each class’ respective annualized expense ratio multiplied by the average account value over the period, multiplied by the number of days in the most recent fiscal half-year, then divided by 366. |
| (3) | On April 29, 2004, Class L shares were renamed as Class C shares. |
9 Smith Barney Money Funds, Inc. | 2004 Annual Report
| Schedules of Investments | December 31, 2004 | |||
CASH PORTFOLIO
FACE AMOUNT | SECURITY | ANNUALIZED YIELD | VALUE | |||||||
| U.S. GOVERNMENT AGENCIES & INSTRUMENTALITIES — 8.2% | ||||||||||
| $ | 105,278,000 | Federal Home Loan Bank | 2.01% to 2.14% | $ | 104,897,377 | |||||
| 190,000,000 | Federal Home Loan Bank | 2.27 to 2.33 | 189,844,750 | |||||||
| 367,000,000 | Federal Home Loan Mortgage Corp. | 1.91 to 2.48 | 365,586,671 | |||||||
| 450,071,000 | Federal National Mortgage Association | 1.91 to 2.46 | 448,695,468 | |||||||
| 300,000,000 | Federal National Mortgage Association | 1.97 to 2.48 | 299,838,790 | |||||||
| TOTAL U.S. GOVERNMENT AGENCIES & INSTRUMENTALITIES (Cost — $1,408,863,056) | 1,408,863,056 | |||||||||
| COMMERCIAL PAPER — 52.3% | ||||||||||
| 163,600,000 | Aquinas Funding LLC | 2.17 to 2.48 | 162,966,425 | |||||||
| 21,500,000 | Aspen Funding Corp. matures 1/3/05 (a) | 2.25 | 21,497,312 | |||||||
| 406,400,000 | Bank of America Corp. | 1.77 to 2.46 | 404,671,399 | |||||||
| 108,136,000 | Barton Capital LLC matures 2/10/05 (a) | 2.26 | 107,865,660 | |||||||
| 100,386,000 | Beethoven Funding Corp. matures 1/14/05 (a) | 2.39 | 100,299,361 | |||||||
| 98,802,000 | Brahms Funding Corp. | 2.42 to 2.45 | 98,737,629 | |||||||
| 112,787,000 | Bryant Park Funding LLC | 2.21 to 2.31 | 112,679,852 | |||||||
| 200,482,000 | Chariot Funding LLC matures 1/14/05 (a) | 2.31 | 200,315,489 | |||||||
| 426,500,000 | Chesham Financial LLC | 2.33 to 2.44 | 425,714,447 | |||||||
| 97,750,000 | Cimaron Collateralized Debt Obligation Ltd. matures 2/1/05 (a) | 2.43 | 97,546,300 | |||||||
| 144,676,000 | Cobbler Funding Ltd. | 2.31 to 2.49 | 144,159,971 | |||||||
| 131,050,000 | Danske Corp. mature 1/24/05 to 2/1/05 | 2.25 to 2.29 | 130,833,181 | |||||||
| 100,000,000 | Depfa Bank PLC matures 2/2/05 (a) | 2.30 | 99,796,000 | |||||||
| 80,000,000 | Dexia Delaware LLC matures 2/2/05 | 2.29 | 79,837,867 | |||||||
| 35,000,000 | Fenway Funding LLC matures 1/18/05 (a) | 2.41 | 34,960,333 | |||||||
| 50,839,000 | Fountain Square Commercial Funding | 2.25 | 50,712,467 | |||||||
| 20,198,000 | Foxboro Funding Ltd. matures 1/14/05 (a) | 2.41 | 20,180,422 | |||||||
| 188,500,000 | Galaxy Funding Inc. | 2.25 to 2.47 | 187,830,111 | |||||||
| 41,835,000 | Galleon Capital LLC matures 2/9/05 (a) | 2.26 | 41,733,027 | |||||||
| 161,717,000 | General Electric Capital Corp. | 2.21 to 2.26 | 161,335,402 | |||||||
See Notes to Financial Statements.
10 Smith Barney Money Funds, Inc. | 2004 Annual Report
| Schedules of Investments (continued) | December 31, 2004 |
CASH PORTFOLIO
FACE AMOUNT | SECURITY | ANNUALIZED YIELD | VALUE | |||||
| COMMERCIAL PAPER — 52.3% (continued) | ||||||||
| $ | 473,327,000 | Georgetown Funding Co. LLC | 2.24 to 2.48% | $ | 472,448,097 | |||
| 117,528,000 | Giro Balanced-Funding Corp. matures 1/12/05 (a) | 2.29 | 117,446,122 | |||||
| 37,755,000 | Greyhawk Funding LLC matures 2/2/05 (a) | 2.28 | 37,678,819 | |||||
| 110,000,000 | Hannover Funding Co. LLC matures 2/1/05 (a) | 2.27 | 109,785,928 | |||||
| 98,000,000 | Harwood Street Funding LLC matures 1/4/05 (a) | 2.45 | 97,979,992 | |||||
| 75,000,000 | HBOS Treasury Services matures 2/7/05 | 2.30 | 74,823,094 | |||||
| 75,000,000 | Honeywell International matures 1/3/05 | 2.15 | 74,991,042 | |||||
| 105,500,000 | ING (US) Funding LLC matures 2/9/05 | 2.29 to 2.36 | 105,249,585 | |||||
| 84,441,000 | Ivory Funding Corp. | 2.26 to 2.29 | 84,194,355 | |||||
| 150,000,000 | Kitty Hawk Funding Corp. matures 1/18/05 (a) | 2.24 | 149,842,042 | |||||
| 180,000,000 | Lake Constance Funding LLC | 2.18 to 2.36 | 179,558,987 | |||||
| 50,000,000 | Landale Funding LLC matures 2/15/05 (a) | 2.26 | 49,859,375 | |||||
| 374,500,000 | Main Street Warehouse Funding | 2.31 to 2.43 | 374,039,612 | |||||
| 250,000,000 | Mane Funding Corp. | 2.26 to 2.37 | 249,517,660 | |||||
| 100,000,000 | Market Street Funding matures 1/25/05 (a) | 2.36 | 99,843,333 | |||||
| 268,588,000 | Mica Funding LLC | 2.32 to 2.38 | 268,079,053 | |||||
| 165,000,000 | Moat Funding LLC mature 2/2/05 to 2/8/05 (a) | 1.89 to 2.20 | 164,676,486 | |||||
| 71,948,000 | Monument Gardens Funding | 2.40 to 2.43 | 71,752,813 | |||||
| 100,000,000 | Morgan Stanley matures 1/19/05 | 2.24 | 99,888,500 | |||||
| 210,734,000 | Nieuw Amsterdam Receivables Corp. | 2.22 to 2.37 | 210,560,015 | |||||
| 44,400,000 | Norddeutsche Landesbank matures 1/19/05 | 2.33 | 44,348,496 | |||||
| 113,260,000 | Nyala Funding LLC matures 2/15/05 (a) | 2.44 | 112,915,973 | |||||
| 148,400,000 | Paradigm Funding LLC | 2.22 to 2.25 | 148,201,202 | |||||
| 175,285,000 | Perry Global Funding | 2.21 to 2.37 | 175,033,746 | |||||
| 105,000,000 | Picaros Funding LLC matures 5/3/05 (a) | 2.61 | 104,078,392 | |||||
| 279,045,000 | Polonius Inc. mature 1/18/05 to 3/21/05 (a) | 2.36 to 2.38 | 278,496,433 | |||||
| 40,000,000 | Premier Asset Collateralized Entity LLC | 2.42 | 39,852,722 | |||||
| 239,596,000 | Ranger Funding Co, LLC | 2.24 to 2.26 | 239,364,469 | |||||
| 164,230,000 | Regency Markets No. 1 LLC | 2.33 to 2.41 | 163,909,099 | |||||
| 50,000,000 | Scaldis Capital LLC matures 2/17/05 (a) | 2.32 | 49,849,208 | |||||
| 250,000,000 | Societe Generale mature 2/2/05 to 3/2/05 | 2.31 to 2.34 | 249,417,500 | |||||
See Notes to Financial Statements.
11 Smith Barney Money Funds, Inc. | 2004 Annual Report
| Schedules of Investments (continued) | December 31, 2004 |
CASH PORTFOLIO
FACE AMOUNT | SECURITY | ANNUALIZED YIELD | VALUE | |||||
| COMMERCIAL PAPER — 52.3% (continued) | ||||||||
| $ | 334,256,000 | Solitaire Funding LLC | 2.04 to 2.36% | $ | 333,561,970 | |||
| 30,000,000 | Stanfield Victoria Funding LLC | 2.27 | 29,922,783 | |||||
| 139,000,000 | Surrey Funding Corp. | 2.16 to 2.41 | 138,611,992 | |||||
| 85,000,000 | Svenska Handelsbank Inc. matures 2/2/05 | 2.28 | 84,828,489 | |||||
| 295,197,000 | Tasman Funding LLC | 2.26 to 2.38 | 294,964,059 | |||||
| 43,220,000 | Thames Asset Global Securities | 2.26 | 43,114,651 | |||||
| 83,990,000 | Three Pillars Funding Corp. matures 1/7/05 (a) | 2.26 | 83,958,504 | |||||
| 93,571,000 | Thunder Bay Funding LLC | 2.26 to 2.46 | 93,216,414 | |||||
| 160,693,000 | Ticonderoga Funding LLC | 2.26 | 160,519,801 | |||||
| 341,502,000 | Victory Receivables Corp. | 2.28 to 2.35 | 341,319,531 | |||||
| 38,000,000 | Westpac Capital Corp. matures 3/10/05 (a) | 2.42 | 37,827,016 | |||||
| TOTAL COMMERCIAL PAPER (Cost — $9,023,200,015) | 9,023,200,015 | |||||||
| PROMISSORY NOTE — 1.2% | ||||||||
| 200,000,000 | Goldman Sachs Group Inc. matures 6/20/05† (Cost — $200,000,000) | 2.42 | 200,000,000 | |||||
| MEDIUM-TERM NOTES — 7.1% | ||||||||
| 220,000,000 | Blue Heron Funding Ltd. | 2.45 | 220,000,000 | |||||
| 300,000,000 | General Electric Capital Corp. matures 2/17/06† | 2.51 | 300,000,000 | |||||
| 125,000,000 | Harrier Finance mature 5/16/05 to 9/15/05 (a)† | 2.40 to 2.51 | 124,977,556 | |||||
| 200,000,000 | Morgan Stanley Dean Witter matures 1/3/05† | 2.51 | 200,000,000 | |||||
| 50,000,000 | Premier Asset Collateralized Entity LLC mature 2/15/05 (a)† | 2.38 | 49,998,764 | |||||
| 100,000,000 | Sigma Finance Inc. matures 7/25/05 (a)† | 2.33 | 99,983,242 | |||||
| 239,500,000 | White Pine Finance LLC | 2.33 to 2.41 | 239,478,359 | |||||
| TOTAL MEDIUM-TERM NOTES (Cost — $1,234,437,921) | 1,234,437,921 | |||||||
See Notes to Financial Statements.
12 Smith Barney Money Funds, Inc. | 2004 Annual Report
| Schedules of Investments (continued) | December 31, 2004 |
CASH PORTFOLIO
FACE AMOUNT | SECURITY | ANNUALIZED YIELD | VALUE | |||||
| CERTIFICATES OF DEPOSIT — 2.9% | ||||||||
| $ | 75,000,000 | Bank of America NA matures 2/4/05 | 2.28% | $ | 75,000,000 | |||
| 95,000,000 | Chase Manhattan Bank USA NA | 2.33 | 95,000,000 | |||||
| 328,200,000 | Wells Fargo Bank N.A. | 2.33 to 2.42 | 328,196,396 | |||||
| TOTAL CERTIFICATES OF DEPOSIT (Cost — $498,196,396) | 498,196,396 | |||||||
| FOREIGN CERTIFICATES OF DEPOSIT — 24.4% | ||||||||
| 68,000,000 | ABN AMRO NV matures 1/12/05 | 2.00 | 68,000,202 | |||||
| 445,050,000 | Barclays Bank PLC mature 1/21/05 to 4/18/05 | 1.88 to 2.41 | 445,050,000 | |||||
| 190,000,000 | BNP Paribas mature 1/12/05 to 4/15/05 | 2.18 to 2.42 | 189,858,004 | |||||
| 303,500,000 | Calyon NY mature 1/18/05 to 2/28/05 | 2.19 to 2.35 | 303,498,209 | |||||
| 111,900,000 | Canadian Imperial Bank of Commerce NY matures 2/2/05 | 2.25 | 111,900,000 | |||||
| 199,500,000 | CS First Boston NY mature 1/31/05 to 2/3/05 | 2.30 to 2.32 | 199,500,000 | |||||
| 103,000,000 | CS First Boston NY | 2.39 | 103,000,714 | |||||
| 346,400,000 | Depfa Bank PLC NY mature 2/2/05 to 3/15/05 | 2.15 to 2.44 | 346,391,405 | |||||
| 287,100,000 | Dexia Bank NY mature 1/13/05 to 2/7/05 | 2.29 to 2.35 | 287,100,000 | |||||
| 333,250,000 | Fortis Bank NY mature 1/24/05 to 2/9/05 | 2.28 to 2.35 | 333,249,409 | |||||
| 351,750,000 | HBOS Treasury Services PLC NY | 2.02 to 2.43 | 351,723,665 | |||||
| 30,000,000 | Lloyds TSB Bank PLC NY matures 2/7/05 | 2.30 | 30,000,000 | |||||
| 230,000,000 | Nordea Bank Finland PLC NY | 2.38 to 2.39 | 229,995,296 | |||||
| 80,000,000 | Royal Bank of Canada NY matures 2/1/05 | 2.26 | 80,000,000 | |||||
| 280,000,000 | Royal Bank of Scotland | 2.05 to 2.34 | 280,000,354 | |||||
| 100,000,000 | Societe Generale NY matures 2/2/05 | 2.31 | 99,795,556 | |||||
| 391,500,000 | Toronto Dominion Bank NY | 2.01 to 2.43 | 391,498,658 | |||||
| 305,000,000 | Unicredito Italiano S.p.A. | 2.02 to 2.30 | 304,999,241 | |||||
| 48,800,000 | Westpac Banking Corp. NY matures 1/12/05 | 2.17 | 48,800,000 | |||||
| TOTAL FOREIGN CERTIFICATES OF DEPOSIT (Cost — $4,204,360,713) | 4,204,360,713 | |||||||
See Notes to Financial Statements.
13 Smith Barney Money Funds, Inc. | 2004 Annual Report
| Schedules of Investments (continued) | December 31, 2004 |
CASH PORTFOLIO
FACE AMOUNT | SECURITY | ANNUALIZED YIELD | VALUE | ||||||
| TIME DEPOSITS — 5.6% | |||||||||
| $ | 198,016,000 | Calyon matures 1/3/05 | 2.19% | $ | 198,016,000 | ||||
| 27,829,000 | Deutsche Bank matures 1/3/05 | 2.18 | 27,829,000 | ||||||
| 300,000,000 | Royal Bank of Canada matures 1/3/05 | 2.20 | 300,000,000 | ||||||
| 300,000,000 | Societe Generale matures 1/3/05 | 2.16 | 300,000,000 | ||||||
| 150,000,000 | Toronto Dominion Bank matures 1/3/05 | 2.20 | 150,000,000 | ||||||
| TOTAL TIME DEPOSITS (Cost — $975,845,000) | 975,845,000 | ||||||||
| TOTAL INVESTMENTS — 101.7% (Cost — $17,544,903,101*) | 17,544,903,101 | ||||||||
Liabilities in Excess of Other Assets — (1.7%) | (298,634,901 | ) | |||||||
| TOTAL NET ASSETS — 100.0% | $ | 17,246,268,200 | |||||||
| (a) | Security is exempt from registration under Rule 144A of the Securities Act of 1933. This security may be resold in transactions that are exempt from registration, normally to qualified institutional buyers. This security has been deemed liquid pursuant to the guidelines approved by the Board of Directors. |
| † | Variable rate security. |
| * | Aggregate cost for federal income tax purposes is substantially the same. |
See Notes to Financial Statements.
14 Smith Barney Money Funds, Inc. | 2004 Annual Report
| Schedules of Investments (continued) | December 31, 2004 |
GOVERNMENT PORTFOLIO
| FACE AMOUNT | SECURITY | ANNUALIZED YIELD | VALUE | ||||||
| U.S. GOVERNMENT AGENCIES & INSTRUMENTALITIES — 100.3% | |||||||||
| $ | 335,000,000 | Federal Farm Credit Bank | 2.23% to 2.35% | $ | 334,943,327 | ||||
| 487,465,000 | Federal Home Loan Bank | 2.17 to 2.41 | 486,762,698 | ||||||
| 597,631,000 | Federal Home Loan Mortgage Corp. | 1.98 to 2.42 | 596,131,505 | ||||||
| 916,240,000 | Federal National Mortgage Association | 1.34 to 2.46 | 915,072,565 | ||||||
| TOTAL U.S. GOVERNMENT AGENCIES & INSTRUMENTALITIES (Cost — $2,332,910,095) | 2,332,910,095 | ||||||||
| REPURCHASE AGREEMENT — 0.6% | |||||||||
| 14,077,000 | Goldman, Sachs & Co., dated 12/31/04, | 14,077,000 | |||||||
| TOTAL INVESTMENTS — 100.9% (Cost — $2,346,987,095*) | 2,346,987,095 | ||||||||
Liabilities in Excess of Other Assets — (0.9%) | (20,460,922 | ) | |||||||
| TOTAL NET ASSETS — 100.0% | $ | 2,326,526,173 | |||||||
| * | Aggregate cost for federal income tax purposes is substantially the same. |
See Notes to Financial Statements.
15 Smith Barney Money Funds, Inc. | 2004 Annual Report
| Statements of Assets and Liabilities | December 31, 2004 |
| Cash Portfolio | Government Portfolio | |||||
| ASSETS: | ||||||
Investments, at amortized cost | $ | 17,544,903,101 | $ | 2,346,987,095 | ||
Cash | 371 | 916 | ||||
Receivable for Fund shares sold | 606,573,970 | 35,491,187 | ||||
Interest receivable | 14,116,566 | 2,326,244 | ||||
Deferred compensation | 477,374 | 64,608 | ||||
Prepaid expenses | 463,243 | 140,337 | ||||
Total Assets | 18,166,534,625 | 2,385,010,387 | ||||
| LIABILITIES: | ||||||
Payable for Fund shares purchased | 908,944,269 | 57,175,036 | ||||
Management fees payable | 5,672,361 | 906,612 | ||||
Transfer agency services payable | 3,962,600 | 133,225 | ||||
Distribution plan fees payable | 533,018 | 72,722 | ||||
Directors’ fees payable | 483,644 | 65,101 | ||||
Dividends payable | 316,449 | 45,573 | ||||
Accrued expenses | 354,084 | 85,945 | ||||
Total Liabilities | 920,266,425 | 58,484,214 | ||||
Total Net Assets | $ | 17,246,268,200 | $ | 2,326,526,173 | ||
| NET ASSETS: | ||||||
Par value of capital shares (Note 5) | $ | 172,460,031 | $ | 23,264,864 | ||
Capital paid in excess of par value | 17,073,790,937 | 2,303,238,153 | ||||
Undistributed net investment income | 17,232 | 23,156 | ||||
Total Net Assets | $ | 17,246,268,200 | $ | 2,326,526,173 | ||
Shares Outstanding: | ||||||
Class A | 17,159,581,521 | 2,323,826,522 | ||||
Class C | 165,719 | 6,221 | ||||
Class Y | 86,255,887 | 2,653,628 | ||||
Net Asset Value, per class | $1.00 | $1.00 | ||||
See Notes to Financial Statements.
16 Smith Barney Money Funds, Inc. | 2004 Annual Report
Statements of Operations For the Year Ended December 31, 2004
| Cash Portfolio | Government Portfolio | |||||||
| INVESTMENT INCOME: | ||||||||
Interest | $ | 263,333,913 | $ | 36,833,743 | ||||
| EXPENSES: | ||||||||
Management fees (Note 2) | 69,671,046 | 11,554,650 | ||||||
Transfer agency services (Notes 2 and 3) | 20,008,967 | 702,385 | ||||||
Distribution plan fees (Notes 2 and 3) | 18,525,072 | 2,695,753 | ||||||
Custody | 857,556 | 105,395 | ||||||
Shareholder communications (Note 3) | 495,792 | 27,803 | ||||||
Registration fees | 421,047 | 129,703 | ||||||
Directors’ fees | 179,185 | 19,512 | ||||||
Audit and legal | 113,007 | 56,355 | ||||||
Other | 249,040 | 34,889 | ||||||
Total Expenses | 110,520,712 | 15,326,445 | ||||||
Less: Management fee waiver and expense reimbursement | (10,705,896 | ) | (665,832 | ) | ||||
Net Expenses | 99,814,816 | 14,660,613 | ||||||
Net Investment Income | 163,519,097 | 22,173,130 | ||||||
Net Realized Gain From Investment Transactions | 75,944 | 20,414 | ||||||
Increase in Net Assets From Operations | $ | 163,595,041 | $ | 22,193,544 | ||||
See Notes to Financial Statements.
17 Smith Barney Money Funds, Inc. | 2004 Annual Report
Statements of Changes in Net Assets
| For the Years Ended December 31, | ||||||||
| Cash Portfolio | 2004 | 2003 | ||||||
| OPERATIONS: | ||||||||
Net investment income | $ | 163,519,097 | $ | 141,273,647 | ||||
Net realized gain | 75,944 | 189,125 | ||||||
Increase in Net Assets From Operations | 163,595,041 | 141,462,772 | ||||||
| DIVIDENDS AND DISTRIBUTIONS TO SHAREHOLDERS FROM (NOTES 1 AND 4): | ||||||||
Net investment income | (163,254,028 | ) | (141,273,647 | ) | ||||
Net realized gains | (265,069 | ) | — | |||||
Decrease in Net Assets From | (163,519,097 | ) | (141,273,647 | ) | ||||
| FUND SHARE TRANSACTIONS (NOTE 5): | ||||||||
Net proceeds from sale of shares | 94,763,889,887 | 86,286,428,316 | ||||||
Net asset value of shares issued for reinvestment of dividends and distributions | 158,525,154 | 137,283,219 | ||||||
Net asset value of shares issued in connection with the transfer of the Smith Barney Money Funds, Inc. — Retirement Portfolio’s net assets (Note 7) | — | 646,749,540 | ||||||
Cost of shares reacquired | (97,314,303,363 | ) | (90,616,867,506 | ) | ||||
Decrease in Net Assets From Fund Share Transactions | (2,391,888,322 | ) | (3,546,406,431 | ) | ||||
Decrease in Net Assets | (2,391,812,378 | ) | (3,546,217,306 | ) | ||||
| NET ASSETS: | ||||||||
Beginning of year | 19,638,080,578 | 23,184,297,884 | ||||||
End of year | $ | 17,246,268,200 | $ | 19,638,080,578 | ||||
Undistributed net investment income | $17,232 | — | ||||||
See Notes to Financial Statements.
18 Smith Barney Money Funds, Inc. | 2004 Annual Report
Statements of Changes in Net Assets (continued)
| For the Years Ended December 31, | ||||||||
| Government Portfolio | 2004 | 2003 | ||||||
| OPERATIONS: | ||||||||
Net investment income | $ | 22,173,130 | $ 19,792,678 | |||||
Net realized gain | 20,414 | 26,082 | ||||||
Increase in Net Assets From Operations | 22,193,544 | 19,818,760 | ||||||
| DIVIDENDS AND DISTRIBUTIONS TO SHAREHOLDERS FROM (NOTES 1 AND 4): | ||||||||
Net investment income | (22,133,330 | ) | (19,792,678) | |||||
Net realized gains | (39,800 | ) | (6,696) | |||||
Decrease in Net Assets From | (22,173,130 | ) | (19,799,374) | |||||
| FUND SHARE TRANSACTIONS (NOTE 5): | ||||||||
Net proceeds from sale of shares | 9,723,013,124 | 9,903,440,532 | ||||||
Net asset value of shares issued for reinvestment of dividends and distributions | 21,559,416 | 19,286,025 | ||||||
Cost of shares reacquired | (10,208,828,172 | ) | (10,516,977,932 | ) | ||||
Decrease in Net Assets From Fund Share Transactions | (464,255,632 | ) | (594,251,375 | ) | ||||
Decrease in Net Assets | (464,235,218 | ) | (594,231,989 | ) | ||||
| NET ASSETS: | ||||||||
Beginning of year | 2,790,761,391 | 3,384,993,380 | ||||||
End of year | $2,326,526,173 | $2,790,761,391 | ||||||
Undistributed net investment income | $23,156 | — | ||||||
See Notes to Financial Statements.
19 Smith Barney Money Funds, Inc. | 2004 Annual Report
For a share of each class of capital stock outstanding throughout each year ended December 31:
| Class A Shares | |||||||||||||||
| Cash Portfolio | 2004 | 2003 | 2002 | 2001 | 2000 | ||||||||||
Net Asset Value, Beginning of Year | $1.00 | $1.00 | $1.00 | $1.00 | $1.00 | ||||||||||
Net investment income | 0.009 | 0.007 | 0.013 | 0.037 | 0.058 | ||||||||||
Dividends from net investment income | (0.009 | ) | (0.007 | ) | (0.013 | ) | (0.037 | ) | (0.058 | ) | |||||
Distributions from net realized gains | (0.000 | )* | — | — | — | — | |||||||||
Net Asset Value, End of Year | $1.00 | $1.00 | $1.00 | $1.00 | $1.00 | ||||||||||
Total Return(1) | 0.90 | % | 0.67 | % | 1.28 | % | 3.78 | % | 5.98 | % | |||||
Net Assets, End of Year (billions) | $17 | $20 | $23 | $32 | $55 | ||||||||||
Ratios to Average Net Assets: | |||||||||||||||
Expenses(2) | 0.54 | %(3) | 0.56 | % | 0.62 | % | 0.59 | % | 0.57 | % | |||||
Net investment income | 0.88 | 0.68 | 1.27 | 3.93 | 5.84 | ||||||||||
| Class C(4) Shares | |||||||||||||||
| Cash Portfolio | 2004 | 2003 | 2002 | 2001 | 2000 | ||||||||||
Net Asset Value, Beginning of Year | $1.00 | $1.00 | $1.00 | $1.00 | $1.00 | ||||||||||
Net investment income | 0.009 | 0.007 | 0.013 | 0.037 | 0.058 | ||||||||||
Dividends from net investment income | (0.009 | ) | (0.007 | ) | (0.013 | ) | (0.037 | ) | (0.058 | ) | |||||
Distributions from net realized gains | (0.000 | )* | — | — | — | — | |||||||||
Net Asset Value, End of Year | $1.00 | $1.00 | $1.00 | $1.00 | $1.00 | ||||||||||
Total Return(1) | 0.90 | % | 0.67 | % | 1.29 | % | 3.81 | % | 6.01 | % | |||||
Net Assets, End of Year (000s) | $166 | $381 | $347 | $304 | $193 | ||||||||||
Ratios to Average Net Assets: | |||||||||||||||
Expenses(2) | 0.55 | %(3) | 0.55 | % | 0.61 | % | 0.56 | % | 0.54 | % | |||||
Net investment income | 0.79 | 0.67 | 1.28 | 3.53 | 5.58 | ||||||||||
| (1) | Performance figures may reflect voluntary fee waivers and/or expense reimbursements. Past performance is no guarantee of future results. In the absence of voluntary fee waivers and/or expense reimbursements, the total return would be reduced. |
| (2) | The Fund has a voluntary expense limitation. Expense ratios for each class will not exceed 0.70%. From time to time, the investment manager may voluntarily waive additional fees and/or reimburse additional expenses to maintain a minimum yield threshold. |
| (3) | The investment manager voluntarily waived a portion of its management fee for the year ended December 31, 2004. If such fees were not voluntarily waived, the actual expense ratios would have been 0.59% and 0.59% for Class A and C shares, respectively. |
| (4) | On April 29, 2004, Class L shares were renamed as Class C shares. |
| * | Amount represents less than $0.001 per share. |
See Notes to Financial Statements.
20 Smith Barney Money Funds, Inc. | 2004 Annual Report
Financial Highlights (continued)
For a share of each class of capital stock outstanding throughout each year ended December 31:
| Class Y Shares | |||||||||||||||
| Cash Portfolio | 2004 | 2003 | 2002 | 2001 | 2000 | ||||||||||
Net Asset Value, Beginning of Year | $1.00 | $1.00 | $1.00 | $1.00 | $1.00 | ||||||||||
Net investment income | 0.010 | 0.008 | 0.014 | 0.039 | 0.060 | ||||||||||
Dividends from net investment income | (0.010 | ) | (0.008 | ) | (0.014 | ) | (0.039 | ) | (0.060 | ) | |||||
Distributions from net realized gains | (0.000 | )* | — | — | — | — | |||||||||
Net Asset Value, End of Year | $1.00 | $1.00 | $1.00 | $1.00 | $1.00 | ||||||||||
Total Return(1) | 1.00 | % | 0.78 | % | 1.45 | % | 3.94 | % | 6.17 | % | |||||
Net Assets, End of Year (millions) | $86 | $128 | $63 | $60 | $25 | ||||||||||
Ratios to Average Net Assets: | |||||||||||||||
Expenses(2) | 0.43 | %(3) | 0.44 | % | 0.45 | % | 0.40 | % | 0.38 | % | |||||
Net investment income | 0.98 | 0.76 | 1.44 | 3.96 | 5.92 | ||||||||||
| (1) | Performance figures may reflect voluntary fee waivers and/or expense reimbursements. Past performance is no guarantee of future results. In the absence of voluntary fee waivers and/or expense reimbursements, the total return would be reduced. |
| (2) | The Fund has a voluntary expense limitation. Expense ratios for each class will not exceed 0.70%. From time to time, the investment manager may voluntarily waive additional fees and/or reimburse additional expenses to maintain a minimum yield threshold. |
| (3) | The investment manager voluntarily waived a portion of its management fee for the year ended December 31, 2004. If such fees were not voluntarily waived, the actual expense ratio would have been 0.49% for Class Y shares. |
| * | Amount represents less than $0.001 per share. |
See Notes to Financial Statements.
21 Smith Barney Money Funds, Inc. | 2004 Annual Report
Financial Highlights (continued)
For a share of each class of capital stock outstanding throughout each year ended December 31:
| Class A Shares | |||||||||||||||
| Government Portfolio | 2004 | 2003 | 2002 | 2001 | 2000 | ||||||||||
Net Asset Value, Beginning of Year | $1.00 | $1.00 | $1.00 | $1.00 | $1.00 | ||||||||||
Net investment income | 0.009 | 0.006 | 0.012 | 0.036 | 0.057 | ||||||||||
Dividends from net investment income | (0.009 | ) | (0.006 | ) | (0.012 | ) | (0.036 | ) | (0.057 | ) | |||||
Distributions from net realized gains | (0.000 | )* | (0.000 | )* | — | — | — | ||||||||
Net Asset Value, End of Year | $1.00 | $1.00 | $1.00 | $1.00 | $1.00 | ||||||||||
Total Return(1) | 0.85 | % | 0.62 | % | 1.22 | % | 3.67 | % | 5.85 | % | |||||
Net Assets, End of Year (billions) | $2 | $3 | $3 | $4 | $6 | ||||||||||
Ratios to Average Net Assets: | |||||||||||||||
Expenses(2) | 0.54 | %(3) | 0.56 | % | 0.61 | % | 0.56 | % | 0.59 | % | |||||
Net investment income | 0.82 | % | 0.63 | 1.21 | 3.74 | 5.71 | |||||||||
| Class C(4) Shares | |||||||||||||||
| Government Portfolio | 2004 | 2003 | 2002 | 2001 | 2000 | ||||||||||
Net Asset Value, Beginning of Year | $1.00 | $1.00 | $1.00 | $1.00 | $1.00 | ||||||||||
Net investment income | 0.007 | 0.006 | 0.012 | 0.036 | 0.057 | ||||||||||
Dividends from net investment income | (0.007 | ) | (0.006 | ) | (0.012 | ) | (0.036 | ) | (0.057 | ) | |||||
Distributions from net realized gains | (0.000 | )* | (0.000 | )* | — | — | — | ||||||||
Net Asset Value, End of Year | $1.00 | $1.00 | $1.00 | $1.00 | $1.00 | ||||||||||
Total Return(1) | 0.73 | % | 0.58 | % | 1.21 | % | 3.68 | % | 5.87 | % | |||||
Net Assets, End of Year (000s) | $6 | $14 | $131 | $123 | $121 | ||||||||||
Ratios to Average Net Assets: | |||||||||||||||
Expenses(2) | 0.65 | %(3) | 0.61 | % | 0.61 | % | 0.63 | % | 0.58 | % | |||||
Net investment income | 0.69 | 0.65 | 1.21 | 3.53 | 5.70 | ||||||||||
| (1) | Performance figures may reflect voluntary fee waivers and/or expense reimbursements. Past performance is no guarantee of future results. In the absence of voluntary fee waivers and/or expense reimbursements, the total return would be reduced. |
| (2) | The Fund has a voluntary expense limitation. Expense ratios for each class will not exceed 0.70%. From time to time, the investment manager may voluntarily waive additional fees and/or reimburse additional expenses to maintain a minimum yield threshold. |
| (3) | The investment manager voluntarily waived a portion of its management fee for the year ended December 31, 2004. If such fees were not voluntarily waived, the actual expense ratios would have been 0.57% and 0.76% for Class A and C shares, respectively. |
| (4) | On April 29, 2004, Class L shares were renamed as Class C shares. |
| * | Amount represents less than $0.001 per share. |
See Notes to Financial Statements.
22 Smith Barney Money Funds, Inc. | 2004 Annual Report
Financial Highlights (continued)
For a share of each class of capital stock outstanding throughout each year ended December 31:
| Class Y Shares | |||||||||||||||
| Government Portfolio | 2004 | 2003 | 2002 | 2001 | 2000 | ||||||||||
Net Asset Value, Beginning of Year | $1.00 | $1.00 | $1.00 | $1.00 | $1.00 | ||||||||||
Net investment income | 0.010 | 0.007 | 0.013 | 0.037 | 0.058 | ||||||||||
Dividends from net investment income | (0.010 | ) | (0.007 | ) | (0.013 | ) | (0.037 | ) | (0.058 | ) | |||||
Distributions from net realized gains | (0.000 | )* | (0.000 | )* | — | — | — | ||||||||
Net Asset Value, End of Year | $1.00 | $1.00 | $1.00 | $1.00 | $1.00 | ||||||||||
Total Return(1) | 0.98 | % | 0.75 | % | 1.35 | % | 3.78 | % | 6.02 | % | |||||
Net Assets, End of Year (millions) | $3 | $1 | $2 | $21 | $20 | ||||||||||
Ratios to Average Net Assets: | |||||||||||||||
Expenses(2) | 0.41 | %(3) | 0.44 | % | 0.48 | % | 0.44 | % | 0.44 | % | |||||
Net investment income | 1.05 | % | 0.76 | 1.38 | 3.69 | 5.85 | |||||||||
| (1) | Performance figures may reflect voluntary fee waivers and/or expense reimbursements. Past performance is no guarantee of future results. In the absence of voluntary fee waivers and/or expense reimbursements, the total return would have been reduced. |
| (2) | The Fund has a voluntary expense limitation. Expense ratios for each class will not exceed 0.70%. From time to time, the investment manager may voluntarily waive additional fees and/or reimburse additional expenses to maintain a minimum yield threshold. |
| (3) | The investment manager voluntarily waived a portion of its management fee for the year ended December 31, 2004. If such fees were not voluntarily waived, the actual expense ratio would have been 0.43% for Class Y shares. |
| * | Amount represents less than $0.001 per share. |
See Notes to Financial Statements.
23 Smith Barney Money Funds, Inc. | 2004 Annual Report
| 1. | Organization and Significant Accounting Policies |
Smith Barney Money Funds, Inc. (“Company”), a Maryland corporation, is registered under the Investment Company Act of 1940, as amended, as a diversified, open-end management investment company. The Company consists of two separate investment funds (“Funds”): the Cash Portfolio and the Government Portfolio.
The following are significant accounting policies consistently followed by the Funds and are in conformity with U.S. generally accepted accounting principles (“GAAP”). Estimates and assumptions are required to be made regarding assets, liabilities and changes in net assets resulting from operations when financial statements are prepared. Changes in the economic environment, financial markets and any other parameters used in determining these estimates could cause actual results to differ.
(a) Investment Valuation. Money market instruments are valued at amortized cost, in accordance with Rule 2a-7 under the Investment Company Act of 1940 (the “1940 Act”), which approximates market value. This method involves valuing a portfolio security at its cost and thereafter assuming a constant amortization to maturity of any discount or premium. The Funds’ use of amortized cost is subject to their compliance with certain conditions as specified under Rule 2a-7 of the 1940 Act.
(b) Repurchase Agreements. When entering into repurchase agreements, it is the Funds’ policy that a custodian takes possession of the underlying collateral securities, the value of which at least equals the principal amount of the repurchase transaction, including accrued interest. To the extent that any repurchase transaction exceeds one business day, the value of the collateral is marked-to-market to ensure the adequacy of the collateral. If the seller defaults and the value of the collateral declines or if bankruptcy proceedings are commenced with respect to the seller of the security, realization of the collateral by the Fund may be delayed or limited.
(c) Security Transactions and Investment Income. Security transactions are accounted for on a trade date basis. Interest income, adjusted for amortization of premium and accretion of discount, is recorded on the accrual basis. The cost of investments sold is determined by use of the specific identification method.
24 Smith Barney Money Funds, Inc. | 2004 Annual Report
Notes to Financial Statements (continued)
(d) Dividends and Distributions to Shareholders. Dividends on the shares of the Funds are declared each business day to shareholders of record that day, and are paid or reinvested monthly in each respective Fund’s shares on the payable date. Distributions of net realized gains to shareholders of the Funds, if any, are declared at least annually. Dividends and distributions to shareholders of the Funds are recorded on the ex-dividend date and are determined in accordance with income tax regulations which may differ from GAAP.
(e) Class Accounting. Investment income, common expenses and realized/unrealized gain (loss) on investments are allocated to the various classes of the Funds on the basis of daily net assets of each class. Distribution, transfer agency services and shareholder communications fees relating to a specific class are charged directly to that class.
(f ) Federal and Other Taxes. It is the Funds’ policy to comply with the federal income and excise tax requirements of the Internal Revenue Code of 1986, as amended, applicable to regulated investment companies. Accordingly, the Funds intend to distribute substantially all of their taxable income and net realized gains on investments, if any, to shareholders each year. Therefore, no federal income tax provision is required.
(g) Reclassification. GAAP requires that certain components of net assets be adjusted to reflect permanent differences between financial and tax reporting. Accordingly, during the current year, $269,967 has been reclassified between accumulated net realized gain from investment transactions and overdistributed net investment income due to differences in the book/tax treatment of various items for the Cash Portfolio. This reclassification has no effect on net assets or net asset values per share. There were no reclassifications for the Government Portfolio.
| 2. | Management Agreement and Other Transactions with Affiliates |
Smith Barney Fund Management LLC (“SBFM”), an indirect wholly-owned subsidiary of Citigroup Inc. (“Citigroup”), acts as investment manager to the Funds. As compensation for its services, the Funds pay SBFM a fee calculated at the following annual rates: 0.45% on the first $1.0 billion of each of the Fund’s average daily net assets; 0.425% on the next $1.0 billion; 0.40% on the next $3.0
25 Smith Barney Money Funds, Inc. | 2004 Annual Report
Notes to Financial Statements (continued)
billion; 0.375% on the next $5.0 billion and 0.35% on each of the Fund’s average daily net assets in excess of $10.0 billion. This fee is calculated daily and paid monthly.
During the year ended December 31, 2004, SBFM voluntarily waived a portion of its management fee amounting to $10,705,896 and $665,832 for the Cash and Government portfolios, respectively.
Citicorp Trust Bank, fsb. (“CTB”), another subsidiary of Citigroup, acts as the Funds’ transfer agent. PFPC Inc. (“PFPC”) and Primerica Shareholder Services (“PSS”), another subsidiary of Citigroup, act as the Funds’ sub-transfer agents. CTB receives account fees and asset-based fees that vary according to the size and type of account. PFPC and PSS are responsible for shareholder recordkeeping and financial processing for all shareholder accounts. For the year ended December 31, 2004, the Funds paid transfer agent fees of $12,679,160 and $775,871 for the Cash and Government Portfolios, respectively, to CTB.
Citigroup Global Markets Inc. (“CGM”) and PFS Distributors, Inc., both of which are subsidiaries of Citigroup, act as the Funds’ distributors.
All officers and one Director of the Company are employees of Citigroup or its affiliates and do not receive compensation from the Company.
| 3. | Class Specific Expenses |
Pursuant to a Rule 12b-1 Distribution Plan, each Fund makes payments to CGM for assistance in distributing Class A and C shares calculated at an annual rate of 0.10% of the average daily net assets of each class. For the year ended December 31, 2004, total Rule 12b-1 Distribution Plan fees, which are accrued daily and paid monthly, were as follows:
| Class A | Class C | |||
Cash Portfolio | $18,524,836 | $236 | ||
Government Portfolio | 2,695,739 | 14 | ||
26 Smith Barney Money Funds, Inc. | 2004 Annual Report
Notes to Financial Statements (continued)
For the year ended December 31, 2004, Shareholder Communication expenses were as follows:
| Class A | Class C | Class Y | |||||
Cash Portfolio | $493,295 | $6 | $2,491 | ||||
Government Portfolio | 27,754 | 0 | * | 49 | |||
| * | Amount represents less than $1. |
For the year ended December 31, 2004, total Transfer Agency Service expenses were as follows:
| Class A | Class C | Class Y | ||||
Cash Portfolio | $19,905,745 | $253 | $102,969 | |||
Government Portfolio | 702,320 | 25 | 40 | |||
27 Smith Barney Money Funds, Inc. | 2004 Annual Report
Notes to Financial Statements (continued)
| 4. | Dividends and Distributions Paid to Shareholders by Class |
| Cash Portfolio | Year Ended December 31, 2004 | Year Ended December 31, 2003 | ||||||
Class A | ||||||||
Net investment income | $ | 162,322,586 | $ | 139,522,047 | ||||
Net realized gains | 262,418 | — | ||||||
Total | $ | 162,585,004 | $ | 139,522,047 | ||||
Class C† | ||||||||
Net investment income | $ | 1,870 | $ | 2,519 | ||||
Net realized gains | 0 | * | — | |||||
Total | $ | 1,870 | $ | 2,519 | ||||
Class Y | ||||||||
Net investment income | $ | 929,572 | $ | 738,527 | ||||
Net realized gains | 2,651 | — | ||||||
Total | $ | 932,223 | $ | 738,527 | ||||
Class Z** | ||||||||
Net investment income | — | $ | 1,010,554 | |||||
Net realized gains | — | — | ||||||
Total | — | $ | 1,010,554 | |||||
| Government Portfolio | ||||||||
Class A | ||||||||
Net investment income | $ | 22,076,354 | $ | 19,757,661 | ||||
Net realized gains | 39,800 | 6,685 | ||||||
Total | $ | 22,116,154 | $ | 19,764,346 | ||||
Class C† | ||||||||
Net investment income | $ | 94 | $ | 467 | ||||
Net realized gains | 0 | * | 0 | * | ||||
Total | $ | 94 | $ | 467 | ||||
Class Y | ||||||||
Net investment income | $ | 56,882 | $ | 34,550 | ||||
Net realized gains | 0 | * | 11 | |||||
Total | $ | 56,882 | $ | 34,561 | ||||
| † | On April 29, 2004, Class L shares were renamed as Class C shares. |
| * | Amount represents less than $1. |
| ** | As of April 21, 2003, Class Z shares were fully redeemed. |
28 Smith Barney Money Funds, Inc. | 2004 Annual Report
Notes to Financial Statements (continued)
| 5. | Capital Shares |
The Company offers multiple classes of shares within the Cash and Government Portfolios. Class A and Class Y shares can be purchased directly by investors; Class C shares can only be purchased by participants in the Smith Barney 401(k) Program. Effective April 29, 2004, the Funds renamed Class L shares as Class C shares.
Transactions in shares of each Fund, each at $1.00, were as follows:
| Cash Portfolio | Year Ended December 31, 2004 | Year Ended December 31, 2003 | ||||
Class A | ||||||
Shares sold | 94,705,680,845 | 86,041,295,627 | ||||
Shares issued on reinvestment | 158,356,650 | 135,909,343 | ||||
Net asset value of shares issued in connection with the transfer of the Smith Barney Money Funds, Inc. — Retirement Portfolio’s net assets (Note 7) | — | 646,749,540 | ||||
Shares reacquired | (97,214,217,387 | ) | (90,061,010,242 | ) | ||
Net Decrease | (2,350,179,892 | ) | (3,237,055,732 | ) | ||
Class C† | ||||||
Shares sold | 15,089 | 97,225 | ||||
Shares issued on reinvestment | 1,773 | 2,512 | ||||
Shares reacquired | (232,571 | ) | (65,475 | ) | ||
Net Increase (Decrease) | (215,709 | ) | 34,262 | |||
Class Y | ||||||
Shares sold | 58,193,953 | 114,923,543 | ||||
Shares issued on reinvestment | 166,731 | 418,995 | ||||
Shares reacquired | (99,853,405 | ) | (50,994,850 | ) | ||
Net Increase (Decrease) | (41,492,721 | ) | 64,347,688 | |||
Class Z* | ||||||
Shares sold | — | 130,111,921 | ||||
Shares issued on reinvestment | — | 952,375 | ||||
Shares reacquired | — | (504,796,939 | ) | |||
Net Decrease | — | (373,732,643 | ) | |||
| † | On April 29, 2004, Class L shares were renamed as Class C shares. |
| * | As of April 21, 2003, Class Z shares were fully redeemed. |
29 Smith Barney Money Funds, Inc. | 2004 Annual Report
Notes to Financial Statements (continued)
| Government Portfolio | Year Ended December 31, 2004 | Year Ended December 31, 2003 | ||||
Class A | ||||||
Shares sold | 9,685,704,372 | 9,829,329,633 | ||||
Shares issued on reinvestment | 21,502,446 | 19,251,108 | ||||
Shares reacquired | (10,173,101,768 | ) | (10,441,931,975 | ) | ||
Net Decrease | (465,894,950 | ) | (593,351,234 | ) | ||
Class C† | ||||||
Shares sold | 1,660 | 8,682 | ||||
Shares issued on reinvestment | 87 | 414 | ||||
Shares reacquired | (9,504 | ) | (126,545 | ) | ||
Net Decrease | (7,757 | ) | (117,449 | ) | ||
Class Y | ||||||
Shares sold | 37,307,092 | 74,102,215 | ||||
Shares issued on reinvestment | 56,883 | 34,503 | ||||
Shares reacquired | (35,716,900 | ) | (74,919,412 | ) | ||
Net Increase (Decrease) | 1,647,075 | (782,694 | ) | |||
| † | On April 29, 2004, Class L shares were renamed as Class C shares. |
| 6. | Income Tax Information and Dividends to Shareholders |
The tax character of distributions paid during the year ended December 31, 2004 were as follows:
| Cash Portfolio | Government Portfolio | |||||
Ordinary income | $ | 163,519,097 | $ | 22,173,130 | ||
The tax character of distributions paid during the year ended December 31, 2003 were as follows:
| Cash Portfolio | Government Portfolio | |||||
Ordinary income | $ | 141,273,647 | $ | 19,799,374 | ||
30 Smith Barney Money Funds, Inc. | 2004 Annual Report
Notes to Financial Statements (continued)
As of December 31, 2004, the components of accumulated earnings on a tax basis were as follows:
| Cash Portfolio | Government Portfolio | |||||||
Undistributed ordinary income — net | $ | 536,269 | $ | 96,827 | ||||
Total undistributed earnings | $ | 536,269 | $ | 96,827 | ||||
Other book/tax temporary differences(1) | (519,037 | ) | (73,671 | ) | ||||
Total accumulated earnings — net | $ | 17,232 | $ | 23,156 | ||||
| (1) | Other book/tax temporary differences are attributable primarily to the differences in the book/tax treatment of various items. |
The Cash and Government Portfolio’s paid ordinary income distributions of $26,975,174 and $3,731,106, respectively, to shareholders of record on January 14, 2005. These distributions will be reflected in the financial statements for the fiscal year ended December 31, 2005.
| 7. | Transfer of Net Assets |
On December 5, 2003, the Cash Portfolio acquired the assets and certain liabilities of Retirement Portfolio pursuant to a plan of reorganization approved by Retirement Portfolio shareholders on July 30, 2003. Total shares issued by the Cash Portfolio and the total net assets of the Retirement Portfolio and the Cash Portfolio on the date of the transfer were as follows:
| Acquired Fund | Shares Issued by the Cash Portfolio | Total Net Assets of Retirement Portfolio | Total Net Assets of the Cash Portfolio | |||||
Retirement Portfolio | 646,749,540 | $ | 646,749,540 | $ | 19,634,679,276 | |||
Total net assets of the Cash Portfolio immediately after the transfer were $20,281,428,816. The transaction was structured to qualify as a tax-free reorganization under the Internal Revenue Code of 1986, as amended.
| 8. | Additional Information |
In connection with an investigation previously disclosed by Citigroup, the Staff of the Securities and Exchange Commission (“SEC”) has notified Citigroup Asset Management (“CAM”), the Citigroup business unit that includes the funds’ investment manager and other investment advisory companies; Citicorp Trust Bank (“CTB”), an affiliate of CAM; Thomas W. Jones, the former CEO
31 Smith Barney Money Funds, Inc. | 2004 Annual Report
Notes to Financial Statements (continued)
of CAM; and three other individuals, one of whom is an employee and two of whom are former employees of CAM, that the SEC Staff is considering recommending a civil injunctive action and/or an administrative proceeding against each of them relating to the creation and operation of an internal transfer agent unit to serve various CAM-managed funds.
In 1999, CTB entered the transfer agent business. CTB hired an unaffiliated subcontractor to perform some of the transfer agent services. The subcontractor, in exchange, had signed a separate agreement with CAM in 1998 that guaranteed investment management revenue to CAM and investment banking revenue to a CAM affiliate. The subcontractor’s business was later taken over by PFPC Inc., and at that time the revenue guarantee was eliminated and a one-time payment was made by the subcontractor to a CAM affiliate.
CAM did not disclose the revenue guarantee when the boards of various CAM-managed funds hired CTB as transfer agent. Nor did CAM disclose to the boards of the various CAM-managed funds the one-time payment received by the CAM affiliate when it was made. As previously disclosed, CAM has already paid the applicable funds, primarily through voluntary fee waivers, a total of approximately $17 million (plus interest), which is the amount of the revenue received by Citigroup relating to the revenue guarantee.
In addition, the SEC Staff has indicated that it is considering recommending action based on the adequacy of the disclosures made to the fund boards that approved the transfer agency arrangement, CAM’s initiation and operation of, and compensation for, the transfer agent business and CAM’s retention of, and agreements with, the subcontractor.
Citigroup is cooperating fully in the SEC’s investigation and is seeking to resolve the matter in discussions with the SEC Staff. On January 20, 2005, Citigroup stated that it had established an aggregate reserve of $196 million ($25 million in the third quarter of 2004 and $171 million in the fourth quarter of 2004) related to its discussions with the SEC Staff. Settlement negotiations are ongoing and any settlement of this matter with the SEC will require approval by the Citigroup Board and acceptance by the Commission.
Unless and until any settlement is consummated, there can be no assurance that any amount reserved by Citigroup will be distributed. Nor is there at this time
32 Smith Barney Money Funds, Inc. | 2004 Annual Report
Notes to Financial Statements (continued)
any certainty as to how the proceeds of any settlement would be distributed, to whom any such distribution would be made, the methodology by which such distribution would be allocated, and when such distribution would be made.
Although there can be no assurance, Citigroup does not believe that this matter will have a material adverse effect on the funds.
| 9. | Legal Matters |
Beginning in June 2004, class action lawsuits alleging violations of the federal securities laws were filed against Citigroup Global Markets Inc. (the “Distributor”) and a number of its affiliates, including Smith Barney Fund Management LLC and Salomon Brothers Asset Management Inc (the “Advisers”), substantially all of the mutual funds managed by the Advisers, including the Funds, and directors or trustees of the Funds (collectively, the “Defendants”). The complaints alleged, among other things, that the Distributor created various undisclosed incentives for its brokers to sell Smith Barney and Salomon Brothers funds. In addition, according to the complaints, the Advisers caused the Funds to pay excessive brokerage commissions to the Distributor for steering clients towards proprietary funds. The complaints also alleged that the defendants breached their fiduciary duty to the Funds by improperly charging Rule 12b-1 fees and by drawing on fund assets to make undisclosed payments of soft dollars and excessive brokerage commissions. The complaints also alleged that the Funds failed to adequately disclose certain of the allegedly wrongful conduct. The complaints sought injunctive relief and compensatory and punitive damages, rescission of the Funds’ contracts with the Advisers, recovery of all fees paid to the Advisers pursuant to such contracts and an award of attorneys’ fees and litigation expenses.
On December 15, 2004, a consolidated amended complaint (the “Complaint”) was filed alleging substantially similar causes of action. While the lawsuit is in its earliest stages, to the extent that the Complaint purports to state causes of action against the Funds, Citigroup Asset Management believes the Funds have significant defenses to such allegations, which the Funds intend to vigorously assert in responding to the Complaint.
Additional lawsuits arising out of these circumstances and presenting similar allegations and requests for relief may be filed against the Defendants in the future.
33 Smith Barney Money Funds, Inc. | 2004 Annual Report
Notes to Financial Statements (continued)
As of the date of this report, Citigroup Asset Management and the Funds believe that the resolution of the pending lawsuit will not have a material effect on the financial position or results of operations of the Funds or the ability of the Advisers and their affiliates to continue to render services to the Funds under their respective contracts.
34 Smith Barney Money Funds, Inc. | 2004 Annual Report
Report of Independent Registered Public Accounting Firm
The Shareholders and Board of Directors of Smith Barney Money Funds, Inc.:
We have audited the accompanying statements of assets and liabilities, including the schedules of investments, of Cash Portfolio and Government Portfolio of Smith Barney Money Funds, Inc. (“Funds”) as of December 31, 2004, and the related statements of operations for the year then ended, the statements of changes in net assets for each of the years in the two-year period then ended, and the financial highlights for each of the years in the five-year period then ended. These financial statements and financial highlights are the responsibility of the Fund’s management. Our responsibility is to express an opinion on these financial statements and financial highlights based on our audits.
We conducted our audits in accordance with the standards of the Public Company Accounting Oversight Board (United States). Those standards require that we plan and perform the audit to obtain reasonable assurance about whether the financial statements and financial highlights are free of material misstatement. An audit includes examining, on a test basis, evidence supporting the amounts and disclosures in the financial statements. Our procedures included confirmation of securities owned as of December 31, 2004, by correspondence with the custodian and brokers. An audit also includes assessing the accounting principles used and significant estimates made by management, as well as evaluating the overall financial statement presentation. We believe that our audits provide a reasonable basis for our opinion.
In our opinion, the financial statements and financial highlights referred to above present fairly, in all material respects, the financial position of Cash Portfolio and Government Portfolio of Smith Barney Money Funds, Inc. as of December 31, 2004, and the results of their operations for the year then ended, the changes in their net assets for each of the years in the two-year period then ended, and the financial highlights for each of the years in the five-year period then ended, in conformity with U.S. generally accepted accounting principles.

New York, New York
February 22, 2005
35 Smith Barney Money Funds, Inc. | 2004 Annual Report
Additional Information (unaudited)
Information about Directors and Officers
The business and affairs of the Smith Barney Money Funds, Inc. (“Fund”) are managed under the direction of the Board of Directors. Information pertaining to the Directors and Officers of the Fund is set forth below. The Statement of Additional Information includes additional information about Directors and is available, without charge, upon request by calling the Fund’s transfer agent (Citicorp Trust Bank, fsb. at 1-800-451-2010) or the Fund’s sub-transfer agents, (Primerica Shareholder Services at 1-800-544-5445 and PFPC at 1-800-451-2010).
| Name, Address and Birth Year | Position(s) Held with | Term of Office* and Length of Time Served | Principal Occupation(s) During Past | Number of Portfolios in Fund Complex Overseen by Director | Other Board | |||||
| Non-Interested Directors: | ||||||||||
Lee Abraham 13732 LeHavre Drive Frenchman’s Creek Palm Beach Gardens, Birth Year: 1927 | Director | Since 1999 | Retired; Former Director of Signet Group PLC | 27 | None | |||||
Jane F. Dasher Korsant Partners 283 Greenwich Avenue 3rd Floor Greenwich, Birth Year: 1949 | Director | Since 1999 | Controller of PBK Holdings Inc., a family investment company | 27 | None | |||||
Donald R. Foley 3668 Freshwater Drive Jupiter, FL 33477 Birth Year: 1922 | Director | Since 1982 | Retired | 27 | None | |||||
Richard E. Hanson, Jr. 2751 Vermont Route 140 Poultney, Birth Year: 1941 | Director | Since 1999 | Retired; Former Head of the New Atlanta Jewish Community High School | 27 | None | |||||
Paul Hardin 12083 Morehead Chapel Hill, Birth Year: 1931 | Director | Since 1994 | Professor of Law & Chancellor Emeritus at the University of North Carolina | 34 | None | |||||
Roderick C. Rasmussen 9 Cadence Court Morristown, NJ 07960 Birth Year: 1926 | Director | Since 1982 | Investment Counselor | 27 | None | |||||
36 Smith Barney Money Funds, Inc. | 2004 Annual Report
Additional Information (unaudited) (continued)
| Name, Address and Birth Year | Position(s) Held with | Term of Office* and Length of Time Served | Principal Occupation(s) During Past | Number of Portfolios in Fund Complex Overseen by Director | Other Board | |||||
| Non-Interested Directors: | ||||||||||
John P. Toolan 13 Chadwell Place Morristown, NJ 07960 Birth Year: 1930 | Director | Since 1992 | Retired | 27 | John Hancock Funds | |||||
| Interested Director: | ||||||||||
R. Jay Gerken, CFA** Citigroup Asset Management (“CAM”) 399 Park Avenue 4th Floor New York, NY 10022 Birth Year: 1951 | Chairman, President and Chief Executive Officer | Since 2002 | Managing Director of Citigroup Global Markets Inc. (“CGM”); Chairman, President and Chief Executive Officer of Smith Barney Fund Management LLC (“SBFM”), Travelers Investment Adviser, Inc (“TIA”) and Citi Fund Management Inc. (“CFM”); President and Chief Executive Officer of certain mutual funds associated with Citigroup Inc. (“Citigroup”); Formerly, Portfolio Manager of Smith Barney Allocation Series Inc. (from 1996 to 2001) and Smith Barney Growth and Income Fund (from 1996 to 2000) | 219 | None | |||||
37 Smith Barney Money Funds, Inc. | 2004 Annual Report
Additional Information (unaudited) (continued)
| Name, Address and Birth Year | Position(s) Held with | Term of Office* and Length of Time Served | Principal Occupation(s) During Past | Number of Portfolios in Fund Complex Overseen by Director | Other Board | |||||
| Officers: | ||||||||||
Andrew B. Shoup CAM 125 Broad Street 11th Floor New York, NY 10004 Birth Year: 1956 | Senior Vice President and Chief Administrative Officer | Since 2003 | Director of CAM; Senior Vice President and Chief Administrative Officer of mutual funds associated with Citigroup; Treasurer of certain mutual funds associated with Citigroup; Head of International Funds Administration of CAM (from 2001 to 2003); Director of Global Funds Administration of CAM (from 2000 to 2001); Head of U.S. Citibank Funds Administration of CAM (from 1998 to 2000) | N/A | N/A | |||||
Robert J. Brault CAM 125 Broad Street 11th floor New York, NY 10004 Birth Year: 1965 | Chief Financial Officer and Treasurer | Since 2004 | Director of CGM; Chief Financial Officer and Treasurer of certain mutual funds associated with Citigroup; Director of Internal Control for CAM U.S. Mutual Fund Administration (from 2002 to 2004); Director of Project Management & Information Systems for CAM U.S. Mutual Fund Administration (from 2000 to 2002); Vice President of Mutual Fund Administration at Investors Capital Services (from 1999 to 2000) | N/A | N/A | |||||
Martin R. Hanley CAM 399 Park Avenue 4th Floor New York, NY 10022 Birth Year: 1965 | Vice President and Investment Officer | Since 1993 | Portfolio Manager | N/A | N/A | |||||
38 Smith Barney Money Funds, Inc. | 2004 Annual Report
Additional Information (unaudited) (continued)
| Name, Address and Birth Year | Position(s) Held with | Term of Office* and Length of Time Served | Principal Occupation(s) During Past | Number of Portfolios in Fund Complex Overseen by Director | Other Board | |||||
| Officers: | ||||||||||
Kevin Kennedy CAM 399 Park Avenue 4th Floor New York, NY 10022 Birth Year: 1954 | Vice President and Investment Officer | Since 2001 | Portfolio Manager | N/A | N/A | |||||
Andrew Beagley CAM 399 Park Avenue 4th Floor New York, NY 10022 Birth Year: 1962 | Chief Anti-Money Laundering Compliance Officer Chief Compliance Officer | Since Since | Director of CGM (since 2000); Director of Compliance, North America, CAM (since 2000); Chief Anti-Money Laundering Compliance Officer and Vice President of certain mutual funds associated with Citigroup; Director of Compliance Europe, the Middle East and Africa, CAM (from 1999 to 2000); Compliance Officer, SBFM, CFM, TIA, Salomon Brothers Asset Management Limited, Smith Barney Global Capital Management Inc. | N/A | N/A | |||||
Robert I. Frenkel CAM 300 First Stamford Place 4th Floor Stamford, CT 06902 Birth Year: 1954 | Secretary and Chief Legal Officer | Since 2003 | Managing Director and General Counsel of Global Mutual Funds for CAM and its predecessor (since 1994); Secretary and Chief Legal Officer of mutual funds associated with Citigroup | N/A | N/A | |||||
| * | Each Director and officer serves until his or her successor has been duly elected and qualified. |
| ** | Mr. Gerken is an “interested person” of the Fund as defined in the Investment Company Act of 1940, as amended, because Mr. Gerken is an officer of SBFM and certain of its affiliates. |
39 Smith Barney Money Funds, Inc. | 2004 Annual Report
Important Tax Information (unaudited)
The following information is provided with respect to the distributions paid during the taxable year ended December 31, 2004:
| Government Portfolio | ||
Record Date: | Daily | |
Payable Date: | Monthly | |
Interest from Federal Obligations | 35.96% | |
The law varies in each state as to whether and what percentage of dividend income attributable to Federal obligations is exempt from state income tax. We recommend that you consult with your tax adviser to determine if any portion of the dividends you received is exempt from state income taxes.
Please retain this information for your records.
40 Smith Barney Money Funds, Inc. | 2004 Annual Report
SMITH BARNEY
MONEY FUNDS, INC.
DIRECTORS Lee Abraham Jane F. Dasher Donald R. Foley R. Jay Gerken, CFA Chairman Richard E. Hanson, Jr. Paul Hardin Roderick C. Rasmussen John P. Toolan
OFFICERS R. Jay Gerken, CFA President and Chief Executive Officer
Andrew B. Shoup Senior Vice President and Chief Administrative Officer
Robert J. Brault Chief Financial Officer and Treasurer
Martin R. Hanley Vice President and Investment Officer
Kevin Kennedy Vice President and Investment Officer
Andrew Beagley Chief Anti-Money Laundering Compliance Officer and Chief Compliance Officer
|
OFFICERS (continued) Robert I. Frenkel Secretary and
INVESTMENT MANAGER Smith Barney Fund
DISTRIBUTORS Citigroup Global Markets Inc. PFS Distributors, Inc.
CUSTODIAN State Street Bank and
TRANSFER AGENT Citicorp Trust Bank, fsb. 125 Broad Street, 11th Floor New York, New York 10004
SUB-TRANSFER AGENTS PFPC Inc. P.O. Box 9699 Providence, Rhode Island 02940-9699
Primerica Shareholder Services P.O. Box 9662 Providence, Rhode Island 02940-9662 |
Smith Barney Money Funds, Inc.
Cash Portfolio
Government Portfolio
The Funds are separate investment funds of the Smith Barney Money Funds, Inc., a Maryland corporation.
The Funds file their complete schedule of portfolio holdings with the Securities and Exchange Commission for the first and third quarters of each fiscal year on Form N-Q. The Funds’ Forms N-Q are available on the Commission’s website at www.sec.gov. The Funds’ Forms N-Q may be reviewed and copied at the Commission’s Public Reference Room in Washington D.C., and information on the operation of the Public Reference Room may be obtained by calling 1-800-SEC-0330. To obtain information on Form N-Q from the Funds, shareholders can call 1-800-842-9368.
Information on how the Funds voted proxies relating to portfolio securities during the 12-month period ended June 30, 2004 and a description of the policies and procedures that the Funds use to determine how to vote proxies relating to portfolio securities is available (1) without charge, upon request, by calling 1-800-842-9368, (2) on the Funds’ website at www.citigroupAM.com and (3) on the SEC’s website at www.sec.gov.
This report is submitted for general information of the shareholders of Smith Barney Money Funds, Inc.
SMITH BARNEY MONEY FUNDS, INC.
Smith Barney Mutual Funds
125 Broad Street
10th Floor, MF-2
New York, New York 10004
©2005 Citigroup Global Markets Inc.
Member NASD, SIPC
FD0858 2/05 | 05-7817 |
| ITEM 2. | CODE OF ETHICS. | |
| The registrant has adopted a code of ethics that applies to the registrant’s principal executive officer, principal financial officer, principal accounting officer or controller. | ||
| ITEM 3. | AUDIT COMMITTEE FINANCIAL EXPERT. | |
| The Board of Trustees of the registrant has determined that Jane F. Dasher, a member of the Board’s Audit Committee, possesses the technical attributes identified in Instruction 2(b) of Item 3 to Form N-CSR to qualify as an “audit committee financial expert,” and has designated Ms. Dasher as the Audit Committee’s financial expert. Ms. Dasher is an “independent” Trustee pursuant to paragraph (a)(2) of Item 3 to Form N-CSR. | ||
| Item 4. | Principal Accountant Fees and Services | |
(a) Audit Fees for the Smith Barney Money Funds, Inc. were $94,000 and $114,500 for the years ended 12/31/04 and 12/31/03.
(b) Audit-Related Fees for the Smith Barney Money Funds, Inc. were $0 and $0 for the years ended 12/31/04 and 12/31/03.
(c) Tax Fees for Smith Barney Money Funds, Inc. of $6,000 and $6,000 for the years ended 12/31/04 and 12/31/03. These amounts represent aggregate fees paid for tax compliance, tax advice and tax planning services, which include (the filing and amendment of federal, state and local income tax returns, timely RIC qualification review and tax distribution and analysis planning) rendered by the Accountant to Smith Barney Money Funds, Inc.
(d) All Other Fees for Smith Barney Money Funds, Inc. of $0 and $0 for the years ended 12/31/04 and 12/31/03.
(e) (1) Audit Committee’s pre–approval policies and procedures described in paragraph (c) (7) of Rule 2-01 of Regulation S-X.
The Charter for the Audit Committee (the “Committee”) of the Board of each registered investment company (the “Fund”) advised by Smith Barney Fund Management LLC or Salomon Brothers Asset Management Inc or one of their affiliates (each, an “Adviser”) requires that the Committee shall approve (a) all audit and permissible non-audit services to be provided to the Fund and (b) all permissible non-audit services to be provided by the Fund’s independent auditors to the Adviser and any Covered Service Providers if the engagement relates directly to the operations and financial reporting of the Fund. The Committee may implement policies and procedures by which such services are approved other than by the full Committee.
The Committee shall not approve non-audit services that the Committee believes may impair the independence of the auditors. As of the date of the approval of this Audit Committee Charter, permissible non-audit services include any professional services (including tax services), that are not prohibited services as described below, provided to the Fund by the independent auditors, other than those provided to the Fund in connection with an audit or a review of the financial statements of the | ||
Fund. Permissible non-audit services may not include: (i) bookkeeping or other services related to the accounting records or financial statements of the Fund; (ii) financial information systems design and implementation; (iii) appraisal or valuation services, fairness opinions or contribution-in-kind reports; (iv) actuarial services; (v) internal audit outsourcing services; (vi) management functions or human resources; (vii) broker or dealer, investment adviser or investment banking services; (viii) legal services and expert services unrelated to the audit; and (ix) any other service the Public Company Accounting Oversight Board determines, by regulation, is impermissible.
Pre-approval by the Committee of any permissible non-audit services is not required so long as: (i) the aggregate amount of all such permissible non-audit services provided to the Fund, the Adviser and any service providers controlling, controlled by or under common control with the Adviser that provide ongoing services to the Fund (“Covered Service Providers”) constitutes not more than 5% of the total amount of revenues paid to the independent auditors during the fiscal year in which the permissible non-audit services are provided to (a) the Fund, (b) the Adviser and (c) any entity controlling, controlled by or under common control with the Adviser that provides ongoing services to the Fund during the fiscal year in which the services are provided that would have to be approved by the Committee; (ii) the permissible non-audit services were not recognized by the Fund at the time of the engagement to be non-audit services; and (iii) such services are promptly brought to the attention of the Committee and approved by the Committee (or its delegate(s)) prior to the completion of the audit.
(2) For the Smith Barney Money Funds, Inc., the percentage of fees that were approved by the audit committee, with respect to: Audit-Related Fees were 100% and 100% for the years ended 12/31/04 and 12/31/03; Tax Fees were 100% and 100% for the years ended 12/31/04 and 12/31/03; and Other Fees were 100% and 100% for the years ended 12/31/04 and 12/31/03.
| (f) | N/A |
| (g) | Non-audit fees billed by the Accountant for services rendered to The Smith Barney Money Funds, Inc. and CAM and any entity controlling, controlled by, or under common control with CAM that provides ongoing services to Smith Barney Money Funds, Inc. Fees billed to and paid by Citigroup Global Markets, Inc. related to the transfer agent matter as fully described in the notes to the financial statements titled “additional information” were $75,000 and $0 for the years ended 12/31/04 and 12/31/03. |
| (h) | Yes. The Smith Barney Money Funds, Inc.’s Audit Committee has considered whether the provision of non-audit services that were rendered to Service Affiliates which were not pre-approved (not requiring pre-approval) is compatible with maintaining the Accountant’s independence. All services provided by the Accountant to the Smith Barney Money Funds, Inc. or to Service Affiliates which were required to be pre-approved were pre-approved as required. |
| ITEM 5. | AUDIT COMMITTEE OF LISTED REGISTRANTS. | |
Not applicable. | ||
| ITEM 6. | [RESERVED] | |||
| ITEM 7. | DISCLOSURE OF PROXY VOTING POLICIES AND PROCEDURES FOR CLOSED-END MANAGEMENT INVESTMENT COMPANIES. | |||
| Not applicable. | ||||
| ITEM 8. | [RESERVED] | |||
| ITEM 9. | SUBMISSION OF MATTERS TO A VOTE OF SECURITY HOLDER. | |||
| Not applicable. | ||||
| ITEM 10. | CONTROLS AND PROCEDURES. | |||
(a) The registrant’s principal executive officer and principal financial officer have concluded that the registrant’s disclosure controls and procedures (as defined in Rule 30a- 3(c) under the Investment Company Act of 1940, as amended (the “1940 Act”)) are effective as of a date within 90 days of the filing date of this report that includes the disclosure required by this paragraph, based on their evaluation of the disclosure controls and procedures required by Rule 30a-3(b) under the 1940 Act and 15d-15(b) under the Securities Exchange Act of 1934. | ||||
(b) There were no changes in the registrant’s internal control over financial reporting (as defined in Rule 30a-3(d) under the 1940 Act) that occurred during the registrant’s last fiscal half-year (the registrant’s second fiscal half-year in the case of an annual report) that have materially affected, or are likely to materially affect the registrant’s internal control over financial reporting. | ||||
| ITEM 11. | EXHIBITS. | |||
(a) Code of Ethics attached hereto. | ||||
| Exhibit 99.CODE ETH | ||||
(b) Attached hereto. | ||||
| Exhibit 99.CERT | Certifications pursuant to section 302 of the Sarbanes-Oxley Act of 2002 | |||
| Exhibit 99.906CERT | Certifications pursuant to Section 906 of the Sarbanes-Oxley Act of 2002 | |||
SIGNATURES
Pursuant to the requirements of the Securities Exchange Act of 1934 and the Investment Company Act of 1940, the registrant has duly caused this Report to be signed on its behalf by the undersigned, there unto duly authorized.
| Smith Barney Money Funds, Inc. | ||
| By: | /s/ R. Jay Gerken | |
| (R. Jay Gerken) | ||
| Chief Executive Officer of | ||
| Smith Barney Money Funds, Inc. | ||
Date: March 7, 2005
Pursuant to the requirements of the Securities Exchange Act of 1934 and the Investment Company Act of 1940, this report has been signed below by the following persons on behalf of the registrant and in the capacities and on the dates indicated.
| By: | /s/ R. Jay Gerken | |
| (R. Jay Gerken) | ||
| Chief Executive Officer of | ||
| Smith Barney Money Funds, Inc. |
Date: March 7, 2005
| By: | /s/ Robert J. Brault | |
| (Robert J. Brault) | ||
| Chief Financial Officer of | ||
| Smith Barney Money Funds, Inc. |
Date: March 7, 2005