UNITED STATES
SECURITIES AND EXCHANGE COMMISSION
Washington, D.C. 20549
FORM N-CSR
CERTIFIED SHAREHOLDER REPORT OF REGISTERED
MANAGEMENT INVESTMENT COMPANIES
Investment Company Act file number 811-2490
Smith Barney Money Funds, Inc.
(Exact name of registrant as specified in charter)
125 Broad Street, New York, NY 10004
(Address of principal executive offices) (Zip code)
Robert I. Frenkel, Esq.
Legg Mason & Co., LLC
300 First Stamford Place, 4th Floor
Stamford, CT 06902
(Name and address of agent for service)
Registrant’s telephone number, including area code: (800) 451-2010
Date of fiscal year end: December 31
Date of reporting period: December 31, 2005
| ITEM 1. | REPORT TO STOCKHOLDERS. | |
The Annual Report to Stockholders is filed herewith. | ||
EXPERIENCE
ANNUAL REPORT
DECEMBER 31, 2005


Smith Barney
Money Funds, Inc.
Cash Portfolio
Government Portfolio
INVESTMENT PRODUCTS • NOT FDIC INSURED • NO BANK GUARANTEE • MAY LOSE VALUE
Smith Barney Money Funds, Inc.
Cash Portfolio
Government Portfolio
Annual Report • December 31, 2005
What’s
Inside
Funds’ Objective
Each Fund seeks maximum current income and preservation of capital.
| I | ||
| 1 | ||
| 4 | ||
| 5 | ||
| 6 | ||
| 8 | ||
| 18 | ||
| 19 | ||
| 20 | ||
| 22 | ||
| 28 | ||
| 37 | ||
| 38 | ||
| 45 | ||
| 49 | ||
| 51 | ||
Under a licensing agreement between Citigroup and Legg Mason, the name of the funds, the names of any classes of shares of funds, and the names of investment advisers of funds, as well as logos, trademarks and service marks related to Citigroup or any of its affiliates (“Citi Marks”) are licensed for use by Legg Mason. Citi Marks include, but are not limited to, “Smith Barney,” “Salomon Brothers,” “Citi” and “Citigroup Asset Management.” Legg Mason and its affiliates, as well as the Fund’s investment manager, are not affiliated with Citigroup.
All Citi Marks are owned by Citigroup, and are licensed for use until no later than one year after the date of the licensing agreement.

R. Jay Gerken, CFA
Chairman, President and Chief Executive Officer
Dear Shareholder,
Despite numerous obstacles, including rising short-term interest rates, surging oil prices, a destructive hurricane season, and geopolitical issues, the U.S. economy continued to expand at a healthy pace during the reporting period. After a 3.8% advance in the first quarter of 2005, gross domestic product (“GDP”)i growth was 3.3% during the second quarter and 4.1% in the third quarter. While fourth quarter figures have not yet been released, another slight gain is anticipated.
Given the strength of the economy and inflationary pressures, the Federal Reserve Board (“Fed”)ii continued to raise interest rates throughout the period. After raising rates five times from June 2004 through December 2004, the Fed increased its target for the federal funds rateiii in 0.25% increments eight additional times over the reporting period. This represents the longest sustained Fed tightening cycle since the 1970s. All told, the Fed’s thirteen rate hikes have brought the target for the federal funds rate from 1.00% to 4.25%. After the end of the Fund’s reporting period, at its January meeting, the Fed once again raised its target for the federal funds rate by 0.25% to 4.50%.
As the year began, it was widely expected that both short- and long-term yields would rise. This panned out with short-term rates, as two-year Treasury yields rose from 3.08% to 4.41% over the 12-month period ended December 31, 2005. However, while there were periods of volatility, over the same period long-term yields experienced only a modest increase, moving from 4.24% to 4.37%. In late December, the yield curve inverted, as the yield on two-year Treasuries surpassed that of 10-year Treasuries. This anomaly has historically foreshadowed an economic slowdown or recession.
Given the steady increase in short-term rates, the yields available from money market instruments steadily rose over the one-year reporting period.
Smith Barney Money Funds, Inc. I
Please read on for a more detailed look at prevailing economic and market conditions during the Fund’s fiscal year and to learn how those conditions have affected Fund performance.
Special Shareholder Notice for Cash Portfolio
On December 1, 2005, Citigroup Inc. (“Citigroup”) completed the sale of substantially all of its asset management business, Citigroup Asset Management (“CAM”), to Legg Mason, Inc. (“Legg Mason”). As a result, the Fund’s investment adviser (the “Manager”), previously an indirect wholly-owned subsidiary of Citigroup, has become a wholly-owned subsidiary of Legg Mason. Completion of the sale caused the Fund’s existing investment management contract to terminate. The Fund’s shareholders approved a new investment management contract between the Fund and the Manager, which became effective on December 19, 2005.
Special Shareholder Notice for Government Portfolio
On December 1, 2005, Citigroup Inc. (“Citigroup”) completed the sale of substantially all of its asset management business, Citigroup Asset Management (“CAM”), to Legg Mason, Inc. (“Legg Mason”). As a result, the Fund’s investment adviser (the “Manager”), previously an indirect wholly-owned subsidiary of Citigroup, has become a wholly-owned subsidiary of Legg Mason. Completion of the sale caused the Fund’s existing investment management contract to terminate. The Fund’s shareholders previously approved a new investment management contract between the Fund and the Manager, which became effective on December 1, 2005.
Information About Your Fund
As you may be aware, several issues in the mutual fund industry have recently come under the scrutiny of federal and state regulators. The Fund’s Manager and some of its affiliates have received requests for information from various government regulators regarding market timing, late trading, fees, and other mutual fund issues in connection with various investigations. The regulators appear to be examining, among other things, the Fund’s response to market timing and shareholder exchange activity, including compliance with
II Smith Barney Money Funds, Inc.
prospectus disclosure related to these subjects. The Fund has been informed that the Manager and its affiliates are responding to those information requests, but are not in a position to predict the outcome of these requests and investigations.
Important information concerning the Fund and its Manager with regard to recent regulatory developments is contained in the Notes to Financial Statements included in this report.
As always, thank you for your confidence in our stewardship of your assets. We look forward to helping you continue to meet your financial goals.
Sincerely,

R. Jay Gerken, CFA
Chairman, President and Chief Executive Officer
February 2, 2006
| i | Gross domestic product is a market value of goods and services produced by labor and property in a given country. |
| ii | The Federal Reserve Board is responsible for the formulation of a policy designed to promote economic growth, full employment, stable prices, and a sustainable pattern of international trade and payments. |
| iii | The federal funds rate is the interest rate that banks with excess reserves at a Federal Reserve district bank charge other banks that need overnight loans. |
Smith Barney Money Funds, Inc. III
 |  | Martin R. Hanley (left) Vice President and Investment Officer
Kevin Kennedy (right) Vice President and Investment Officer |
Q. What were the overall market conditions during the Fund’s reporting period?
A. In many ways, the marketplace in 2005 was similar to that in 2004. Steadily rising short-term interest rates, higher oil price, and a strong economy all posed threats to fixed income prices. The U.S. economy continued its solid growth in 2005 and finished the year on a respectable note, as holiday sales appeared to meet expectations. While the economy in the second half of the year faced several negative shocks — higher energy prices, hurricane losses and rising interest rates, gross domestic product (“GDP”)i did manage to grow 4.1% in the third quarter and market participants are nevertheless expecting another slight increase for the 4th quarter.
As anticipated, the Federal Reserve Board (“Fed”)ii continued to raise short-term interest rates at a measured pace during the reporting period. Since the Fed began its tightening cycle in June 2004, it has raised the federal funds rateiii thirteen times, bringing the rate from 1.00% to 4.25% at the end of 2005. This caused short-term yields to rise sharply. After the end of the Fund’s reporting period, at its January meeting, the Fed once again raised its target for the federal funds rate by 0.25% to 4.50%. Over the 12-month period ended December 31, 2005, three-month U.S. Treasury bill yields rose from 2.21% to 4.07%, while 3-month LIBORiv rose from 2.56% to 4.54%. However, as was the case in 2004, longer-term yields were relatively stable or fell modestly during the reporting period. This was due to relatively benign inflation and continued strong demand by a host of investors.
Performance Review
As of December 31, 2005, the seven-day current yield for the Class A shares of Smith Barney Money Funds, Inc. — Cash Portfolio was 3.83% and its seven-day effective yield, which reflects compounding, was 3.90%. The seven-day current yield for Smith Barney Money Funds — Government Portfolio was 3.68% and its seven-day effective yield, which reflects compounding, was 3.75%.1
| 1 | The seven-day current yield reflects the amount of income generated by the investment during that seven-day period and assumes that the income is generated each week over a 365-day period. The yield is shown as a percentage of the investment. The seven-day effective yield is calculated similarly to the seven-day current yield but, when annualized, the income earned by an investment in the Fund is assumed to be reinvested. The effective yield typically will be slightly higher than the current yield because of the compounding effect of the assumed reinvestment. |
Smith Barney Money Funds, Inc. 2005 Annual Report 1
| Smith Barney Money Funds, Inc. Yields as of December 31, 2005 (unaudited) | ||||
| Cash Portfolio1 | Government Portfolio1 | |||
Class A Shares | ||||
Seven-day current yield | 3.83% | 3.68% | ||
Seven-day effective yield | 3.90% | 3.75% | ||
Class C Shares | ||||
Seven-day current yield | 3.78% | 3.39% | ||
Seven-day effective yield | 3.85% | 3.45% | ||
Class Y Shares | ||||
Seven-day current yield | 3.96% | 3.81% | ||
Seven-day effective yield | 4.04% | 3.88% | ||
| The performance shown represents past performance. Past performance is no guarantee of future results and current performance may be higher or lower than the performance shown above. | ||||
An investment in the Fund is neither insured nor guaranteed by the Federal Deposit Insurance Corporation (“FDIC”) or any other government agency. Although the Fund seeks to preserve the value of your investment at $1.00 per share, it is possible to lose money by investing in the Fund.
Q. What were the most significant factors affecting Fund performance?
What were the leading contributors to performance?
A. Although the Fed continued to steadily raise the targeted federal funds rate over the fiscal year, we lengthened the Portfolios’ average maturity over the second half of the reporting period. This was done in order to capture higher yields given the rising interest rate environment.
What were the leading detractors from performance?
A. Through the reporting period we maintained a high quality, diversified portfolio
for the two funds, supported by thorough credit analysis. We did not invest in any
securities that we believed would be detrimental to the Portfolios’ performance.
Q. Were there any significant changes to the Fund during the
reporting period?
A. There were no significant changes to the Cash Portfolio, although, similar to last
year, we employed longer dated bank obligations to extend the Portfolio’s
average maturity.
| 1 | The seven-day current yield reflects the amount of income generated by the investment during that seven-day period and assumes that the income is generated each week over a 365-day period. The yield is shown as a percentage of the investment. The seven-day effective yield is calculated similarly to the seven-day current yield but, when annualized, the income earned by an investment in the Fund is assumed to be reinvested. The effective yield typically will be slightly higher than the current yield because of the compounding effect of the assumed reinvestment. |
2 Smith Barney Money Funds, Inc. 2005 Annual Report
For the Government Portfolio, we utilized more floating rate agency products as interest rates rose. These securities also served as an alternative to fixed rate agency discount notes which experienced a decline in supply over the period.
Thank you for your investment in the Smith Barney Money Funds — Cash Portfolio and Government Portfolio. As ever, we appreciate that you have chosen us to manage your assets and we remain focused on achieving the Portfolios’ investment goals.
Sincerely,
Martin R. Hanley Vice President and Investment Officer |
Kevin Kennedy Vice President and Investment Officer |


February 2, 2006
The information provided is not intended to be a forecast of future events, a guarantee of future results or investment advice. Views expressed may differ from those of the firm as a whole.
RISKS: An investment in a money market fund is neither insured nor guaranteed by the FDIC or any other government agency. Although the Fund seeks to preserve the value of your investment at one dollar per share. It is possible to lose money by investing in the Fund.
All Index performance reflects no deduction for fees, expenses or taxes. Please note that an investor cannot invest directly in an index.
| i | Gross domestic product is a market value of goods and services produced by labor and property in a given country. |
| ii | The Federal Reserve Board is responsible for the formulation of a policy designed to promote economic growth, full employment, stable prices, and a sustainable pattern of international trade and payments. |
| iii | The federal funds rate is the interest rate that banks with excess reserves at a Federal Reserve district bank charge other banks that need overnight loans. |
| iv | The London Interbank Offered Rate (“LIBOR”) is the interest rate offered by a specific group of London banks for U.S. dollar deposits of a stated maturity. LIBOR is used as a base index for setting rates of some adjustable rate financial instruments, including Adjustable Rate Mortgages (“ARMs”). |
Smith Barney Money Funds, Inc. 2005 Annual Report 3
4 Smith Barney Money Funds, Inc. 2005 Annual Report
Fund at a Glance (unaudited) (continued)
Smith Barney Money Funds, Inc. 2005 Annual Report 5
Example
As a shareholder of the Fund, you may incur two types of costs: (1) transaction costs and (2) ongoing costs, including management fees; distribution and/or service (12b-1) fees; and other Fund expenses. This example is intended to help you understand your ongoing costs (in dollars) of investing in the Fund and to compare these costs with the ongoing costs of investing in other mutual funds.
This example is based on an investment of $1,000 invested on July 1, 2005 and held for the six months ended December 31, 2005.
Actual Expenses
The table below titled “Based on Actual Total Return” provides information about actual account values and actual expenses. You may use the information provided in this table, together with the amount you invested, to estimate the expenses that you paid over the period. To estimate the expenses you paid on your account, divide your ending account value by $1,000 (for example, an $8,600 ending account value divided by $1,000 = 8.6), then multiply the result by the number under the heading entitled “Expenses Paid During the Period.”
| Based on Actual Total Return(1) | |||||||||||||||
| Actual Total Return(2) | Beginning Account Value | Ending Account Value | Annualized Expense Ratio | Expenses Paid During the Period(3) | |||||||||||
Cash Portfolio: | |||||||||||||||
Class A | 1.64 | % | $ | 1,000.00 | $ | 1,016.40 | 0.56 | % | $ | 2.85 | |||||
Class C | 1.62 | 1,000.00 | 1,016.20 | 0.60 | 3.05 | ||||||||||
Class Y | 1.73 | 1,000.00 | 1,017.30 | 0.39 | 1.98 | ||||||||||
Government Portfolio: | |||||||||||||||
Class A | 1.59 | 1,000.00 | 1,015.90 | 0.59 | 3.00 | ||||||||||
Class C | 1.66 | 1,000.00 | 1,016.60 | 0.65 | 3.30 | ||||||||||
Class Y | 1.66 | 1,000.00 | 1,016.60 | 0.45 | 2.29 | ||||||||||
| (1) | For the six months ended December 31, 2005. |
| (2) | Assumes reinvestment of all distributions, including returns of capital, if any, at net asset value. Total return is not annualized, as it may not be representative of the total return for the year. Performance figures may reflect voluntary fee waivers and/or expense reimbursements. Past performance is no guarantee of future results. In the absence of voluntary fee waivers and/or expense reimbursements, the total return would have been lower. |
| (3) | Expenses are equal to each class’ respective annualized expense ratio multiplied by the average account value over the period, multiplied by the number of days in the most recent fiscal half-year, then divided by 365. |
6 Smith Barney Money Funds, Inc. 2005 Annual Report
Fund Expenses (unaudited) (continued)
Hypothetical Example for Comparison Purposes
The table below titled “Based on Hypothetical Total Return” provides information about hypothetical account values and hypothetical expenses based on the actual expense ratio and an assumed rate of return of 5.00% per year before expenses, which is not the Fund’s actual return. The hypothetical account values and expenses may not be used to estimate the actual ending account balance or expenses you paid for the period. You may use the information provided in this table to compare the ongoing costs of investing in the Fund and other funds. To do so, compare the 5.00% hypothetical example relating to the Fund with the 5.00% hypothetical examples that appear in the shareholder reports of the other funds.
Please note that the expenses shown in the table below are meant to highlight your ongoing costs only and do not reflect any transactional costs. Therefore, the table is useful in comparing ongoing costs only, and will not help you determine the relative total costs of owning different funds. In addition, if these transaction costs were included, your costs would have been higher.
| Based on Hypothetical Total Return(1) | |||||||||||||||
| Hypothetical Annualized Total Return | Beginning Account Value | Ending Account Value | Annualized Expense Ratio | Expenses Paid During the Period(2) | |||||||||||
Cash Portfolio: | |||||||||||||||
Class A | 5.00 | % | $ | 1,000.00 | $ | 1,022.38 | 0.56 | % | $ | 2.85 | |||||
Class C | 5.00 | 1,000.00 | 1,022.18 | 0.60 | 3.06 | ||||||||||
Class Y | 5.00 | 1,000.00 | 1,023.24 | 0.39 | 1.99 | ||||||||||
Government Portfolio: | |||||||||||||||
Class A | 5.00 | 1,000.00 | 1,022.23 | 0.59 | 3.01 | ||||||||||
Class C | 5.00 | 1,000.00 | 1,021.93 | 0.65 | 3.31 | ||||||||||
Class Y | 5.00 | 1,000.00 | 1,022.94 | 0.45 | 2.29 | ||||||||||
| (1) | For the six months ended December 31, 2005. |
| (2) | Expenses are equal to each class’ respective annualized expense ratio multiplied by the average account value over the period, multiplied by the number of days in the most recent fiscal half-year, then divided by 365. |
Smith Barney Money Funds, Inc. 2005 Annual Report 7
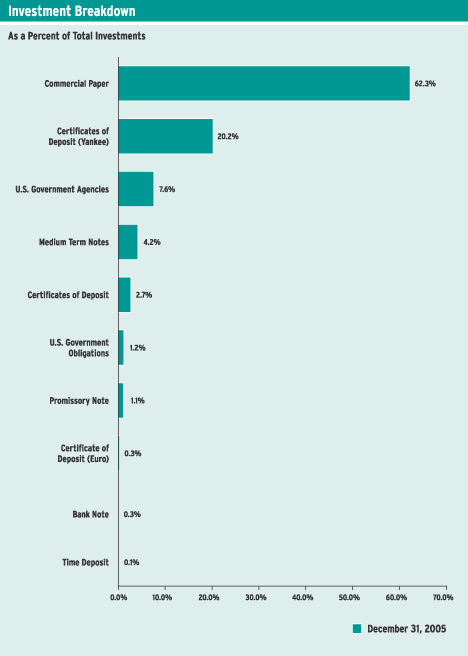
Schedules of Investments (December 31, 2005)
CASH PORTFOLIO
| Face Amount | Security | Value | |||||
| SHORT-TERM INVESTMENTS — 101.9% | |||||||
| Commercial Paper — 63.5% | |||||||
| $ | 40,000,000 | Abbey National North America LLC, 4.353% due 2/3/06 (a) | $ | 39,841,233 | |||
Albis Capital Corp.: | |||||||
| 40,000,000 | 4.319% due 1/5/06 (a)(b) | 39,980,933 | |||||
| 75,000,000 | 4.390% due 1/23/06 (a)(b) | 74,799,708 | |||||
| 36,000,000 | 4.439% due 2/1/06 (a)(b) | 35,863,600 | |||||
Amstel Funding Corp.: | |||||||
| 99,554,000 | 3.910% due 1/3/06 (a)(b) | 99,532,678 | |||||
| 42,015,000 | 4.327% due 2/15/06 (a)(b) | 41,790,220 | |||||
| 36,500,000 | 4.543% due 5/5/06 (a)(b) | 35,939,279 | |||||
Aquinas Funding LLC: | |||||||
| 25,000,000 | 4.010% due 2/21/06 (a)(b) | 24,860,812 | |||||
| 90,000,000 | 3.873% due 3/3/06 (a)(b) | 89,420,500 | |||||
| 34,218,000 | 4.562% due 5/22/06 (a)(b) | 33,620,269 | |||||
| 10,000,000 | 4.604% due 6/13/06 (a)(b) | 9,796,250 | |||||
Atlantic Asset Securitization Corp.: | |||||||
| 40,000,000 | 4.337% due 1/12/06 (a)(b) | 39,947,078 | |||||
| 45,502,000 | 4.355% due 2/15/06 (a)(b) | 45,255,720 | |||||
| 91,787,000 | 4.162% due 3/20/06 (a)(b) | 90,975,603 | |||||
| 81,000,000 | Atomium Funding LLC, 4.428% due 2/1/06 (a)(b) | 80,693,100 | |||||
Bank of America Corp.: | |||||||
| 120,000,000 | 4.143% due 1/23/06 (a) | 119,699,333 | |||||
| 75,000,000 | 4.205% due 2/3/06 (a) | 74,714,000 | |||||
| 135,000,000 | 4.362% due 2/6/06 (a) | 134,415,450 | |||||
| 23,000,000 | 4.481% due 4/12/06 (a) | 22,715,110 | |||||
| 43,677,000 | Bavaria TRR Corp., 4.425% due 1/5/06 (a)(b) | 43,655,550 | |||||
Beethoven Funding Corp.: | |||||||
| 80,306,000 | 4.332% due 1/6/06 (a)(b) | 80,257,816 | |||||
| 194,850,000 | 4.329% due 1/12/06 (a)(b) | 194,593,393 | |||||
| 30,000,000 | 4.279% due 1/19/06 (a)(b) | 29,936,250 | |||||
| 23,383,000 | 4.368% due 2/1/06 (a)(b) | 23,295,411 | |||||
Belmont Funding LLC: | |||||||
| 65,000,000 | 4.355% due 1/13/06 (a)(b) | 64,905,967 | |||||
| 156,885,000 | 4.376% due 1/20/06 (a)(b) | 156,523,990 | |||||
| 37,831,000 | 4.427% due 2/15/06 (a)(b) | 37,622,929 | |||||
Berkeley Square Finance LLC: | |||||||
| 38,850,000 | 4.365% due 1/11/06 (a)(b) | 38,803,056 | |||||
| 100,000,000 | 4.367% due 1/17/06 (a)(b) | 99,806,667 | |||||
| 23,000,000 | BNP Paribas Finance, 4.249% due 4/11/06 (a) | 22,734,222 | |||||
Brahms Funding Corp.: | |||||||
| 65,697,000 | 4.373% due 1/6/06 (a)(b) | 65,657,217 | |||||
| 100,000,000 | 4.388% due 1/12/06 (a)(b) | 99,866,472 | |||||
| 178,000 | 4.432% due 1/19/06 (a)(b) | 177,607 | |||||
| 50,000,000 | 4.433% due 1/19/06 (a)(b) | 49,889,500 | |||||
| 162,857,000 | 4.390% due 1/27/06 (a)(b) | 162,343,005 | |||||
See Notes to Financial Statements.
8 Smith Barney Money Funds, Inc. 2005 Annual Report
Schedules of Investments (December 31, 2005) (continued)
| Face Amount | Security | Value | |||||
| Commercial Paper — 63.5% (continued) | |||||||
| $ | 20,000,000 | 4.394% due 1/27/06 (a)(b) | $ | 19,936,878 | |||
| 100,568,000 | 4.405% due 1/27/06 (a)(b) | 100,249,870 | |||||
| 100,000,000 | 4.346% due 1/30/06 (a)(b) | 99,651,194 | |||||
| 31,500,000 | Calyon North America Inc., 4.075% due 1/3/06 (a) | 31,492,930 | |||||
Chesham Finance LLC: | |||||||
| 50,000,000 | 4.222% due 1/3/06 (a)(b) | 49,988,278 | |||||
| 7,851,000 | 4.222% due 1/3/06 (a)(b) | 7,849,159 | |||||
| 48,000,000 | 4.464% due 3/20/06 (a)(b) | 47,540,320 | |||||
Cobbler Funding LLC: | |||||||
| 9,399,000 | 4.123% due 1/10/06 (a)(b) | 9,389,413 | |||||
| 178,558,000 | 4.367% due 1/17/06 (a)(b) | 178,212,788 | |||||
| 51,637,000 | 4.325% due 2/10/06 (a)(b) | 51,391,437 | |||||
Concord Minutemen Capital Co.: | |||||||
| 55,416,000 | 3.818% due 1/6/06 (a)(b) | 55,387,137 | |||||
| 50,000,000 | 4.365% due 2/15/06 (a)(b) | 49,728,750 | |||||
| 51,103,000 | 4.240% due 4/7/06 (a)(b) | 50,537,460 | |||||
| 103,971,000 | Crown Point Capital Co., Series A, 3.874% due 3/7/06 (a)(b) | 103,257,643 | |||||
Cullinan Finance Corp.: | |||||||
| 31,831,000 | 4.405% due 2/13/06 (a) | 31,664,471 | |||||
| 65,000,000 | 3.895% due 2/23/06 (a)(b) | 64,633,969 | |||||
| 38,000,000 | 4.352% due 4/21/06 (a)(b) | 37,505,367 | |||||
| 55,000,000 | 4.581% due 5/23/06 (a)(b) | 54,027,004 | |||||
Curzon Funding LLC: | |||||||
| 107,000,000 | 4.350% due 1/30/06 (a) | 106,627,209 | |||||
| 94,000,000 | 4.352% due 1/30/06 (a)(b) | 93,672,501 | |||||
Danske Corp.: | |||||||
| 40,000,000 | 4.317% due 1/23/06 (a) | 39,894,889 | |||||
| 33,544,000 | Series A, 4.134% due 2/13/06 (a) | 33,380,930 | |||||
| 100,000,000 | Dexia Delaware LLC, 4.331% due 2/1/06 (a) | 99,629,292 | |||||
Ebury Finance LLC: | |||||||
| 20,000,000 | 4.252% due 1/3/06 (a)(b) | 19,995,278 | |||||
| 40,000,000 | 4.354% due 1/9/06 (a)(b) | 39,961,422 | |||||
| 74,850,000 | 4.353% due 1/12/06 (a)(b) | 74,750,741 | |||||
| 250,000,000 | 4.366% due 1/13/06 (a)(b) | 249,637,500 | |||||
| 59,000,000 | 4.377% due 1/30/06 (a)(b) | 58,792,779 | |||||
| 25,000,000 | 4.397% due 1/30/06 (a)(b) | 24,911,792 | |||||
| 79,145,000 | Falcon Asset Securitization, 4.192% due 1/3/06 (a)(b) | 79,126,577 | |||||
Fenway Funding LLC: | |||||||
| 75,161,000 | 4.555% due 1/4/06 (a)(b) | 75,132,501 | |||||
| 47,000,000 | 4.143% due 1/10/06 (a)(b) | 46,951,825 | |||||
| 88,850,000 | 4.379% due 1/30/06 (a)(b) | 88,538,655 | |||||
| 50,295,000 | 4.395% due 1/30/06 (a)(b) | 50,117,948 | |||||
| 100,000,000 | 4.406% due 1/30/06 (a)(b) | 99,647,167 | |||||
| 58,999,000 | 4.421% due 1/30/06 (a)(b) | 58,789,881 | |||||
Fountain Square Commercial Funding: | |||||||
| 29,555,000 | 3.882% due 1/4/06 (a) | 29,545,567 | |||||
| 38,574,000 | 4.431% due 2/24/06 (a) | 38,319,412 | |||||
See Notes to Financial Statements.
Smith Barney Money Funds, Inc. 2005 Annual Report 9
Schedules of Investments (December 31, 2005) (continued)
| Face Amount | Security | Value | |||||
| Commercial Paper — 63.5% (continued) | |||||||
| $ | 83,000,000 | Foxboro Funding LTD., 4.399% due 1/6/06 (a)(b) | $ | 82,949,393 | |||
| 75,000,000 | Gemini Securitization LLC, 4.358% due 1/24/06 (a)(b) | 74,792,042 | |||||
General Electric Capital Corp.: | |||||||
| 65,000,000 | 3.862% due 3/2/06 (a) | 64,589,417 | |||||
| 133,000,000 | 3.926% due 3/2/06 (a) | 132,146,583 | |||||
Georgetown Funding Co. LLC: | |||||||
| 165,000,000 | 4.252% due 1/4/06 (a)(b) | 164,941,837 | |||||
| 54,565,000 | 4.368% due 1/24/06 (a)(b) | 54,413,355 | |||||
| 100,000,000 | 4.369% due 1/24/06 (a)(b) | 99,722,083 | |||||
| 150,000,000 | 4.379% due 1/25/06 (a)(b) | 149,564,000 | |||||
| 39,287,000 | 4.415% due 1/25/06 (a)(b) | 39,171,758 | |||||
| 73,774,000 | 4.416% due 1/26/06 (a)(b) | 73,548,579 | |||||
| 51,516,000 | Giro Balanced Funding Corp., 4.357% due 1/17/06 (a) | 51,416,631 | |||||
| 162,100,000 | Giro Multi-Funding Corp., 4.366% due 1/20/06 (a) | 161,727,845 | |||||
Grampian Funding LLC: | |||||||
| 12,000,000 | 3.820% due 1/13/06 (a) | 11,985,000 | |||||
| 5,000,000 | 3.937% due 2/21/06 (a) | 4,972,587 | |||||
| 100,000,000 | 4.040% due 3/21/06 (a) | 99,131,000 | |||||
| 49,250,000 | 4.238% due 4/3/06 (a) | 48,727,676 | |||||
| 100,000,000 | 4.547% due 5/12/06 (a)(b) | 98,377,056 | |||||
| 51,860,000 | Hannover Funding Co. LLC, 4.372% due 1/30/06 (a)(b) | 51,678,274 | |||||
Harwood Street Funding I: | |||||||
| 39,300,000 | 4.344% due 1/17/06 (a)(b) | 39,224,544 | |||||
| 30,000,000 | 4.390% due 1/27/06 (a)(b) | 29,905,317 | |||||
Harwood Street Funding II: | |||||||
| 149,250,000 | 4.347% due 1/9/06 (a)(b) | 149,106,389 | |||||
| 50,000,000 | 4.383% due 1/13/06 (a)(b) | 49,927,167 | |||||
| 29,858,000 | 4.441% due 1/17/06 (a)(b) | 29,799,213 | |||||
| 52,500,000 | ING U.S. Funding LLC, 4.589% due 6/9/06 (a)(b) | 51,460,041 | |||||
KKR Pacific Funding Trust: | |||||||
| 25,000,000 | 4.388% due 1/12/06 (a)(b) | 24,966,618 | |||||
| 75,000,000 | 4.368% due 1/19/06 (a)(b) | 74,836,875 | |||||
| 65,000,000 | Landale Funding LLC, 4.377% due 2/15/06 (a)(b) | 64,647,375 | |||||
| 16,882,000 | Liberty Harbour CDO Inc., 4.457% due 2/9/06 (a)(b) | 16,800,980 | |||||
| 25,000,000 | Liberty Street Funding Corp., 4.354% due 1/3/06 (a)(b) | 24,993,958 | |||||
Main Street Warehouse Funding: | |||||||
| 48,200,000 | 4.381% due 1/3/06 (a)(b) | 48,188,298 | |||||
| 41,137,000 | 4.606% due 1/3/06 (a)(b) | 41,126,487 | |||||
| 15,000,000 | 4.397% due 1/4/06 (a)(b) | 14,994,512 | |||||
| 67,028,000 | 4.375% due 1/11/06 (a)(b) | 66,946,822 | |||||
| 130,000,000 | 4.376% due 1/11/06 (a)(b) | 129,842,556 | |||||
| 17,000,000 | 4.385% due 1/11/06 (a)(b) | 16,979,364 | |||||
| 100,000,000 | 4.386% due 1/18/06 (a)(b) | 99,793,639 | |||||
| 90,000,000 | 4.387% due 1/20/06 (a)(b) | 89,792,425 | |||||
| 75,000,000 | 4.433% due 1/20/06 (a)(b) | 74,825,042 | |||||
| 100,000,000 | Mane Funding Corp., 4.183% due 1/9/06 (a)(b) | 99,907,778 | |||||
See Notes to Financial Statements.
10 Smith Barney Money Funds, Inc. 2005 Annual Report
Schedules of Investments (December 31, 2005) (continued)
| Face Amount | Security | Value | |||||
| Commercial Paper — 63.5% (continued) | |||||||
Market Street Funding: | |||||||
| $ | 74,458,000 | 4.272% due 1/3/06 (a)(b) | $ | 74,440,337 | |||
| 40,064,000 | 4.093% due 3/21/06 (a)(b) | 39,711,448 | |||||
Mica Funding LLC: | |||||||
| 54,450,000 | 4.381% due 1/3/06 (a)(b) | 54,436,781 | |||||
| 155,000,000 | 4.389% due 1/4/06 (a)(b) | 154,943,425 | |||||
| 24,550,000 | 4.365% due 1/5/06 (a)(b) | 24,538,134 | |||||
| 135,000,000 | 4.354% due 1/9/06 (a)(b) | 134,869,800 | |||||
| 75,000,000 | 4.439% due 1/12/06 (a)(b) | 74,898,479 | |||||
| 20,000,000 | 4.162% due 1/17/06 (a)(b) | 19,963,378 | |||||
| 50,000,000 | 4.246% due 3/1/06 (c) | 49,997,963 | |||||
Monument Gardens Funding LLC: | |||||||
| 100,000,000 | 4.382% due 1/23/06 (a)(b) | 99,733,556 | |||||
| 84,000,000 | 4.414% due 1/23/06 (a)(b) | 83,774,133 | |||||
| 50,000,000 | 4.394% due 2/13/06 (a)(b) | 49,739,014 | |||||
| 35,000,000 | 4.473% due 2/24/06 (a)(b) | 34,766,900 | |||||
| 350,000,000 | Morgan Stanley, 4.450% due 1/3/06 | 350,000,000 | |||||
| 64,500,000 | Newport Funding Corp., 4.430% due 3/8/06 (a)(b) | 63,982,065 | |||||
Nieuw Amsterdam Receivables: | |||||||
| 33,016,000 | 4.390% due 2/3/06 (a)(b) | 32,883,743 | |||||
| 21,737,000 | 4.632% due 6/13/06 (a)(b) | 21,291,156 | |||||
Nordea North America Inc.: | |||||||
| 70,000,000 | 4.355% due 2/24/06 (a) | 69,547,450 | |||||
| 84,000,000 | 4.390% due 4/27/06 (a) | 82,837,487 | |||||
| 90,430,000 | 4.478% due 4/27/06 (a) | 89,150,817 | |||||
Ormond Quay Funding LLC: | |||||||
| 68,000,000 | 4.350% due 1/17/06 (a)(b) | 67,869,138 | |||||
| 100,000,000 | 4.350% due 1/19/06 (a)(b) | 99,783,500 | |||||
| 62,000,000 | 4.271% due 1/23/06 (a)(b) | 61,839,351 | |||||
| 59,500,000 | 4.362% due 1/23/06 (a)(b) | 59,342,193 | |||||
| 52,000,000 | 4.362% due 1/25/06 (a)(b) | 51,849,547 | |||||
| 22,000,000 | Park Granada LLC, 4.507% due 3/22/06 (a) | 21,781,956 | |||||
Picaros Funding LLC: | |||||||
| 41,008,000 | 3.967% due 3/1/06 (a)(b) | 40,746,563 | |||||
| 92,477,000 | 4.552% due 5/22/06 (a)(b) | 90,865,203 | |||||
Polonius Inc.: | |||||||
| 10,131,000 | 4.291% due 1/20/06 (a)(b) | 10,108,115 | |||||
| 39,505,000 | 3.977% due 1/23/06 (a)(b) | 39,410,605 | |||||
| 59,180,000 | 4.389% due 3/7/06 (a)(b) | 58,717,327 | |||||
| 18,030,000 | 4.494% due 4/18/06 (a)(b) | 17,793,672 | |||||
Regency Markets No. 1 LLC: | |||||||
| 79,250,000 | 4.338% due 1/17/06 (a)(b) | 79,097,840 | |||||
| 105,000,000 | 4.345% due 1/17/06 (a)(b) | 104,797,933 | |||||
| 121,936,000 | 4.393% due 1/17/06 (a)(b) | 121,698,631 | |||||
| 104,252,000 | 4.218% due 1/20/06 (a)(b) | 104,022,009 | |||||
| 75,000,000 | Saint Germain Holdings Inc., 4.367% due 1/18/06 (a)(b) | 74,845,937 | |||||
See Notes to Financial Statements.
Smith Barney Money Funds, Inc. 2005 Annual Report 11
Schedules of Investments (December 31, 2005) (continued)
| Face Amount | Security | Value | |||||
| Commercial Paper — 63.5% (continued) | |||||||
Scaldis Capital LLC: | |||||||
| $ | 17,985,000 | 3.997% due 2/17/06 (a)(b) | $ | 17,892,957 | |||
| 36,900,000 | 4.211% due 3/20/06 (a)(b) | 36,569,806 | |||||
| 2,119,000 | 4.242% due 3/24/06 (a)(b) | 2,098,921 | |||||
Societe Generale North America: | |||||||
| 3,000,000 | 4.304% due 2/3/06 (a)(b) | 2,988,258 | |||||
| 38,175,000 | 4.382% due 2/28/06 (a)(b) | 37,907,457 | |||||
| 37,423,000 | Solitaire Funding LLC, 3.968% due 2/9/06 (a)(b) | 37,265,293 | |||||
Stanfield Victoria Funding: | |||||||
| 21,500,000 | 4.397% due 2/28/06 (a)(b) | 21,349,321 | |||||
| 50,000,000 | 4.182% due 3/30/06 (a)(b) | 49,499,500 | |||||
Strand Capital LLC: | |||||||
| 50,000,000 | 4.048% due 1/11/06 (a)(b) | 49,944,444 | |||||
| 35,000,000 | 4.003% due 1/24/06 (a)(b) | 34,912,121 | |||||
| 30,083,000 | 4.393% due 2/6/06 (a)(b) | 29,951,838 | |||||
| 42,125,000 | 4.496% due 3/3/06 (a)(b) | 41,806,652 | |||||
| 38,000,000 | 4.089% due 3/14/06 (a)(b) | 37,695,240 | |||||
| 35,000,000 | 4.279% due 4/3/06 (a)(b) | 34,625,228 | |||||
| 10,000,000 | Stratford Receivables Co., LLC, 4.364% due 1/9/06 (a)(b) | 9,990,333 | |||||
Tasman Funding Inc.: | |||||||
| 50,000,000 | 4.053% due 1/3/06 (a)(b) | 49,988,861 | |||||
| 67,798,000 | 4.336% due 1/12/06 (a)(b) | 67,708,507 | |||||
| 33,688,000 | 4.346% due 1/20/06 (a)(b) | 33,611,014 | |||||
| 61,911,000 | 4.378% due 1/23/06 (a)(b) | 61,746,042 | |||||
| 24,118,000 | 4.441% due 3/14/06 (a)(b) | 23,905,762 | |||||
| 47,000,000 | Thunder Bay Funding, Inc., 4.270% due 4/10/06 (a)(b) | 46,459,735 | |||||
| 101,614,000 | UBS Finance Delaware LLC, 4.316% due 2/1/06 (a) | 101,238,621 | |||||
Victory Receivable Corp.: | |||||||
| 93,527,000 | 4.404% due 1/5/06 (a)(b) | 93,481,276 | |||||
| 52,390,000 | 4.337% due 1/10/06 (a)(b) | 52,333,419 | |||||
| 22,206,000 | 4.335% due 1/12/06 (a)(b) | 22,176,688 | |||||
| 35,850,000 | Westpac Banking Corp., 4.605% due 6/15/06 (a)(b) | 35,110,594 | |||||
Whistlejacket Capital Ltd.: | |||||||
| 12,433,000 | 3.854% due 1/24/06 (a)(b) | 12,402,974 | |||||
| 12,658,000 | 3.944% due 2/23/06 (a)(b) | 12,585,881 | |||||
| Total Commercial Paper (Cost — $11,223,040,707) | 11,223,040,707 | ||||||
| Certificates of Deposit — 2.7% | |||||||
| HSBC Bank USA: | |||||||
| 38,000,000 | 3.990% due 7/17/06 | 38,000,000 | |||||
| 20,000,000 | 3.995% due 7/18/06 | 20,000,000 | |||||
Wells Fargo Bank NA: | |||||||
| 98,850,000 | 4.290% due 1/24/06 | 98,850,000 | |||||
| 72,000,000 | 4.300% due 1/25/06 | 72,000,000 | |||||
| 79,000,000 | 4.300% due 1/30/06 | 78,999,367 | |||||
See Notes to Financial Statements.
12 Smith Barney Money Funds, Inc. 2005 Annual Report
Schedules of Investments (December 31, 2005) (continued)
| Face Amount | Security | Value | |||||
| Certificates of Deposit — 2.7% (continued) | |||||||
| $ | 150,000,000 | 4.310% due 1/30/06 | $ | 149,998,798 | |||
| 25,000,000 | 4.010% due 7/24/06 | 24,982,980 | |||||
| Total Certificates of Deposit (Cost — $482,850,000) | 482,831,145 | ||||||
| Certificate of Deposit (Euro) — 0.2% | |||||||
| 45,000,000 | Societe Generale London, 4.000% due 7/19/06 (Cost — $44,992,723) | 44,992,723 | |||||
| Certificates of Deposit (Yankee) — 20.6% | |||||||
| 40,000,000 | ABN Amro Bank Chicago NV, 4.435% due 10/12/06 | 40,000,000 | |||||
| 45,000,000 | Bank Nova Scotia, 4.700% due 9/29/06 | 45,000,000 | |||||
| 25,000,000 | Bank of Montreal Chicago, 4.380% due 2/27/06 | 25,000,000 | |||||
Barclays Bank PLC NY: | |||||||
| 40,000,000 | 4.050% due 1/6/06 | 40,000,000 | |||||
| 82,350,000 | 4.190% due 1/9/06 | 82,350,000 | |||||
| 80,000,000 | 4.335% due 2/6/06 | 80,000,000 | |||||
| 150,000,000 | 4.370% due 2/13/06 | 150,000,000 | |||||
| 84,000,000 | 4.200% due 2/17/06 | 84,000,000 | |||||
| 55,000,000 | 4.180% due 3/6/06 | 55,000,000 | |||||
| 10,000,000 | 3.780% due 6/30/06 | 10,000,000 | |||||
BNP Paribas NY Branch: | |||||||
| 85,000,000 | 4.010% due 2/28/06 | 84,987,455 | |||||
| 20,000,000 | 3.995% due 3/20/06 | 20,000,000 | |||||
| 24,000,000 | 4.480% due 4/13/06 | 24,000,000 | |||||
| 73,900,000 | 4.100% due 5/24/06 | 73,900,000 | |||||
| 10,000,000 | 3.690% due 6/12/06 | 10,000,000 | |||||
Calyon NY: | |||||||
| 100,000,000 | 4.255% due 2/1/06 | 100,000,000 | |||||
| 134,000,000 | 4.360% due 2/16/06 | 133,997,670 | |||||
| 50,000,000 | 4.015% due 2/28/06 | 49,999,203 | |||||
| 80,000,000 | 4.300% due 4/26/06 | 79,971,033 | |||||
Credit Suisse First Boston NY: | |||||||
| 245,000,000 | 4.330% due 1/17/06 | 245,000,000 | |||||
| 65,000,000 | 4.700% due 11/3/06 | 65,000,000 | |||||
Depfa Bank PLC: | |||||||
| 45,000,000 | 4.020% due 7/18/06 | 45,000,000 | |||||
| 53,750,000 | 4.160% due 8/4/06 | 53,750,000 | |||||
| 60,800,000 | 4.220% due 8/11/06 | 60,800,000 | |||||
Deutsche Bank NY: | |||||||
| 51,500,000 | 4.100% due 5/22/06 | 51,500,000 | |||||
| 10,000,000 | 4.000% due 7/21/06 | 10,000,000 | |||||
| 75,000,000 | 4.250% due 8/9/06 | 75,000,000 | |||||
| 75,000,000 | 4.730% due 11/6/06 | 75,000,000 | |||||
Dexia Bank NY Branch: | |||||||
| 208,300,000 | 4.335% due 2/1/06 | 208,300,869 | |||||
| 20,000,000 | 3.920% due 3/14/06 | 20,000,000 | |||||
See Notes to Financial Statements.
Smith Barney Money Funds, Inc. 2005 Annual Report 13
Schedules of Investments (December 31, 2005) (continued)
| Face Amount | Security | Value | |||||
| Certificates of Deposit (Yankee) — 20.6% (continued) | |||||||
Dexia Credit Local SA: | |||||||
| $ | 100,000,000 | 4.280% due 1/30/06 | $ | 99,998,401 | |||
| 26,000,000 | 4.290% due 2/1/06 | 25,999,287 | |||||
| 135,000,000 | 4.350% due 2/7/06 | 135,001,377 | |||||
Fortis Bank NY: | |||||||
| 142,300,000 | 4.290% due 1/17/06 | 142,300,000 | |||||
| 105,000,000 | 4.330% due 1/27/06 | 105,000,000 | |||||
| 100,000,000 | 4.140% due 8/4/06 | 100,000,000 | |||||
HBOS Treasury Services NY: | |||||||
| 80,000,000 | 4.010% due 7/20/06 | 79,938,549 | |||||
| 50,000,000 | 4.700% due 9/29/06 | 50,000,000 | |||||
| 62,000,000 | Lloyds TSB Bank PLC NY, 4.040% due 1/6/06 | 62,000,043 | |||||
| 67,000,000 | Nordea Bank Finland NY, 4.590% due 6/5/06 | 67,001,245 | |||||
Royal Bank of Canada NY: | |||||||
| 18,500,000 | 3.990% due 2/21/06 | 18,500,000 | |||||
| 74,500,000 | 4.030% due 7/24/06 | 74,471,639 | |||||
Royal Bank of Scotland NY: | |||||||
| 33,000,000 | 3.830% due 3/6/06 | 33,001,727 | |||||
| 20,000,000 | 4.225% due 8/15/06 | 20,000,000 | |||||
| 79,000,000 | 4.640% due 11/1/06 | 79,000,000 | |||||
Societe Generale NY: | |||||||
| 249,850,000 | 4.310% due 1/31/06 | 249,850,000 | |||||
| 35,000,000 | 3.730% due 6/23/06 | 35,000,000 | |||||
| 116,850,000 | Svenska Handelsbanken NY, 4.360% due 2/14/06 | 116,850,000 | |||||
| 50,000,000 | Toronto Dominion Bank NY, 3.600% due 6/7/06 | 50,000,000 | |||||
| Total Certificates of Deposit (Yankee) (Cost — $3,641,449,643) | 3,641,468,498 | ||||||
| Bank Note — 0.3% | |||||||
| 45,000,000 | Bank of America N.A., 4.100% due 5/22/06 (Cost — $45,000,000) | 45,000,000 | |||||
| Medium Term Notes — 4.3% | |||||||
| 200,000,000 | Cheyne Finance LLC, 4.339% due 1/17/06 (b)(c) | 199,968,366 | |||||
| 300,000,000 | General Electric Capital Corp., 4.470% due 1/17/06 (c) | 300,000,000 | |||||
Stanfield Victoria Funding LLC: | |||||||
| 50,000,000 | 4.271% due 1/5/06 (b)(c) | 49,994,904 | |||||
| 50,000,000 | 4.329% due 1/17/06 (b)(c) | 49,991,699 | |||||
| 130,000,000 | 4.339% due 1/25/06 (b)(c) | 129,993,943 | |||||
| 25,000,000 | 4.339% due 1/25/06 (b)(c) | 24,995,785 | |||||
| Total Medium Term Notes (Cost — $754,944,697) | 754,944,697 | ||||||
| Promissory Note — 1.1% | |||||||
| 200,000,000 | Goldman Sachs Group Inc., 4.170% due 3/20/06 (Cost — $200,000,000) | 200,000,000 | |||||
| U.S. Government Agencies — 7.8% | |||||||
| 147,000,000 | Federal Home Loan Bank (FHLB), 4.220% due 5/16/06 (c) | 146,964,704 | |||||
Federal Home Loan Mortgage Corp. (FHLMC): | |||||||
Discount Notes: | |||||||
| 20,000,000 | 3.536% due 2/27/06 (a) | 19,891,067 | |||||
| 75,000,000 | 3.572% due 3/7/06 (a) | 74,532,812 | |||||
See Notes to Financial Statements.
14 Smith Barney Money Funds, Inc. 2005 Annual Report
Schedules of Investments (December 31, 2005) (continued)
| Face Amount | Security | Value | |||||
| U.S. Government Agencies — 7.8% (continued) | |||||||
| $ | 50,000,000 | 3.606% due 3/27/06 (a) | $ | 49,585,625 | |||
| 85,000,000 | 4.545% due 6/20/06 (a) | 83,217,833 | |||||
| 25,000,000 | 3.889% due 7/5/06 (a) | 24,518,872 | |||||
| 80,000,000 | 4.605% due 9/18/06 (a) | 77,434,667 | |||||
| 50,000,000 | 4.610% due 9/27/06 (a) | 48,346,771 | |||||
| 76,000,000 | 4.575% due 11/1/06 (a) | 73,185,804 | |||||
| 50,000,000 | 4.623% due 11/1/06 (a) | 48,133,778 | |||||
| 50,000,000 | 4.575% due 12/1/06 (a) | 47,931,056 | |||||
| 25,000,000 | 4.669% due 12/1/06 (a) | 23,965,528 | |||||
| 76,500,000 | 4.669% due 12/12/06 (a) | 73,230,262 | |||||
Series RB: | |||||||
| 11,312,000 | 3.402% due 2/7/06 (a) | 11,273,517 | |||||
| 23,000,000 | 3.900% due 2/14/06 (a) | 22,892,475 | |||||
| 100,000,000 | 4.046% due 3/28/06 (a) | 99,052,806 | |||||
| 23,253,000 | 3.558% due 5/30/06 (a) | 22,922,410 | |||||
| 46,173,000 | 3.717% due 5/30/06 (a) | 45,486,933 | |||||
Federal National Mortgage Association (FNMA): | |||||||
Discount Notes: | |||||||
| 44,285,000 | 3.691% due 3/17/06 (a) | 43,956,553 | |||||
| 5,000,000 | 3.472% due 3/31/06 (a) | 4,958,467 | |||||
| 50,000,000 | 3.712% due 5/26/06 (a) | 49,278,021 | |||||
| 25,000,000 | 3.803% due 6/30/06 (a) | 24,541,875 | |||||
| 85,000,000 | 4.345% due 9/29/06 (a) | 82,334,978 | |||||
Notes: | |||||||
| 100,000,000 | 4.268% due 2/22/06 (c) | 99,976,753 | |||||
| 75,000,000 | 4.360% due 3/21/06 (c) | 74,957,059 | |||||
| Total U.S. Government Agencies (Cost — $1,372,570,626) | 1,372,570,626 | ||||||
| U.S. Government Obligations — 1.3% | |||||||
| 75,000,000 | U.S. Treasury Bills, 4.29% due 6/1/06 (a) | 73,691,333 | |||||
| 150,000,000 | U.S. Treasury Notes, 2.375% due 8/31/06 | 148,425,420 | |||||
| Total U.S. Government Obligations (Cost — $222,116,753) | 222,116,753 | ||||||
| Time Deposit — 0.1% | |||||||
| 22,176,000 | State Street Cayman Islands, 4.125% due 1/3/06 (Cost — $22,176,000) | 22,176,000 | |||||
| TOTAL INVESTMENTS — 101.9% (Cost — $18,009,141,149#) | 18,009,141,149 | ||||||
Liabilities in Excess of Other Assets — (1.9)% | (341,567,212 | ) | |||||
| TOTAL NET ASSETS — 100.0% | $ | 17,667,573,937 | |||||
| (a) | Yield to maturity on date of purchase. |
| (b) | Security is exempt from registration under Rule 144A of the Securities Act of 1933. This security may be resold in transactions that are exempt from registration, normally to qualified institutional buyers. This security has been deemed liquid pursuant to guidelines approved by the Board of Directors, unless otherwise noted. |
| (c) | Variable rate security. Coupon rate disclosed is that which is in effect at December 31, 2005. |
| # | Aggregate cost for federal income tax purposes is substantially the same. |
See Notes to Financial Statements.
Smith Barney Money Funds, Inc. 2005 Annual Report 15
Schedules of Investments (December 31, 2005) (continued)
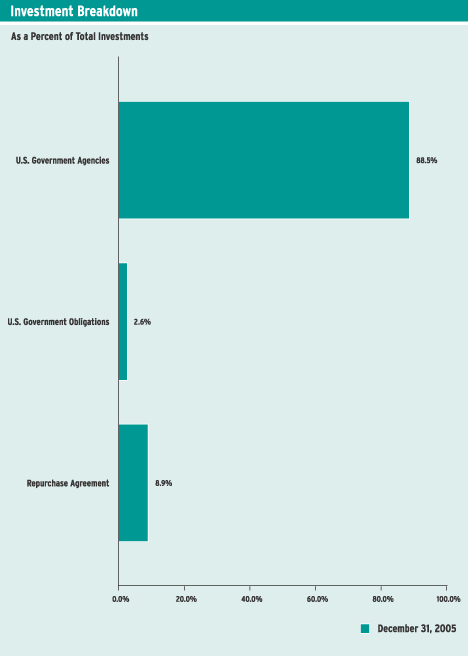
GOVERNMENT PORTFOLIO
| Face Amount | Security | Value | |||||
| SHORT-TERM INVESTMENTS — 102.4% | |||||||
| U.S. Government & Agency Obligations — 93.3% | |||||||
| U.S. Government Agencies — 90.7% | |||||||
Federal Farm Credit Bank (FFCB): | |||||||
| $ | 75,000,000 | 4.186% due 1/1/06 (a) | $ | 74,995,695 | |||
| 50,000,000 | 4.300% due 1/11/06 (a) | 50,015,930 | |||||
| 80,000,000 | 4.260% due 2/1/06 (a) | 79,992,117 | |||||
| 55,000,000 | 4.249% due 2/2/06 (a) | 54,983,807 | |||||
| 10,000,000 | Discount Notes, 4.017% due 9/13/06 (b) | 9,726,583 | |||||
| 100,000,000 | Series I, 4.230% due 1/14/06 (a) | 99,989,222 | |||||
Federal Home Loan Bank (FHLB): | |||||||
| 60,000,000 | 3.925% due 1/15/06 (a) | 59,970,349 | |||||
| 100,000,000 | 4.220% due 2/16/06 (a) | 99,975,989 | |||||
| 20,000,000 | 2.950% due 9/14/06 | 19,830,010 | |||||
| 125,000,000 | Bonds, 4.195% due 2/10/06 (a) | 124,982,720 | |||||
Discount Notes: | |||||||
| 36,000,000 | 4.079% due 1/11/06 (b) | 35,959,500 | |||||
| 35,000,000 | 4.332% due 3/8/06 (b) | 34,725,046 | |||||
| 85,000,000 | 4.247% due 4/21/06 (b) | 83,919,556 | |||||
| 50,000,000 | Series I, 4.401% due 1/6/06 (a) | 49,970,790 | |||||
Federal Home Loan Mortgage Corp. (FHLMC): | |||||||
| 24,282,000 | 4.051% due 3/28/06 (b) | 24,051,712 | |||||
Discount Notes: | |||||||
| 25,000,000 | 3.436% due 1/10/06 (b) | 24,979,125 | |||||
| 150,000,000 | 4.244% due 1/31/06 (b) | 149,472,500 | |||||
| 50,000,000 | 4.069% due 3/7/06 (b) | 49,638,889 | |||||
| 22,741,000 | 3.992% due 3/27/06 (b) | 22,531,593 | |||||
| 60,000,000 | 3.768% due 3/31/06 (b) | 59,456,358 | |||||
| 25,000,000 | 3.889% due 7/5/06 (b) | 24,518,872 | |||||
| 40,000,000 | 3.930% due 7/5/06 (b) | 39,221,972 | |||||
| 8,645,000 | 4.120% due 8/1/06 (b) | 8,443,399 | |||||
| 15,000,000 | 4.610% due 9/27/06 (b) | 14,504,031 | |||||
| 92,320,000 | Series RB, 4.257% due 2/7/06 (b) | 91,918,639 | |||||
Federal National Mortgage Association (FNMA): | |||||||
| 34,400,000 | 4.325% due 3/7/06 (a) | 34,389,023 | |||||
Discount Notes: | |||||||
| 100,000,000 | 4.124% due 2/1/06 (b) | 99,648,236 | |||||
| 28,496,000 | 4.253% due 2/22/06 (b) | 28,322,713 | |||||
| 90,100,000 | 4.343% due 3/8/06 (b) | 89,389,712 | |||||
| 46,173,000 | 4.071% due 3/29/06 (b) | 45,727,777 | |||||
| 23,510,000 | 4.072% due 3/29/06 (b) | 23,283,305 | |||||
| 55,000,000 | 4.277% due 4/19/06 (b) | 54,308,650 | |||||
| 25,000,000 | 4.391% due 4/26/06 (b) | 24,655,799 | |||||
| 25,000,000 | 3.716% due 5/26/06 (b) | 24,638,507 | |||||
See Notes to Financial Statements.
16 Smith Barney Money Funds, Inc. 2005 Annual Report
Schedules of Investments (December 31, 2005) (continued)
| Face Amount | Security | Value | |||||
| U.S. Government Agencies — 90.7% (continued) | |||||||
| $ | 40,000,000 | 4.085% due 7/28/06 (b) | $ | 39,092,889 | |||
| 20,000,000 | 4.619% due 10/27/06 (b) | 19,264,128 | |||||
| Total U.S. Government Agencies (Cost — $1,870,495,143) | 1,870,495,143 | ||||||
| U.S. Government Obligations — 2.6% | |||||||
| 25,000,000 | U.S. Treasury Bills, 4.093% due 4/20/06 (b) | 24,696,465 | |||||
| 30,000,000 | U.S. Treasury Notes, 2.375% due 8/31/06 | 29,739,063 | |||||
| Total U.S. Government Obligations (Cost — $54,435,528) | 54,435,528 | ||||||
| Total U.S. Government & Agency Obligations (Cost — $1,924,930,671) | 1,924,930,671 | ||||||
| Repurchase Agreement — 9.1% | |||||||
| 187,052,000 | Greenwich Capital Markets Inc., dated 12/30/05, 4.280% due 1/3/06; Proceeds at maturity — $187,140,954; (Fully collateralized by various U.S. government agency obligations, 3.050% to 6.210%, due 6/28/06 to 8/6/38; Market value — $190,794,316) (Cost — $187,052,000) | 187,052,000 | |||||
| TOTAL INVESTMENTS — 102.4% (Cost — $2,111,982,671#) | 2,111,982,671 | ||||||
Liabilities in Excess of Other Assets — (2.4)% | (49,554,475 | ) | |||||
| TOTAL NET ASSETS — 100.0% | $ | 2,062,428,196 | |||||
| (a) | Variable rate security. Coupon rate disclosed is that which is in effect at December 31, 2005. |
| (b) | Yield to maturity on date of purchase. |
| # | Aggregate cost for federal income tax purposes is substantially the same. |
See Notes to Financial Statements.
Smith Barney Money Funds, Inc. 2005 Annual Report 17
Statements of Assets and Liabilities (December 31, 2005)
| Cash Portfolio | Government Portfolio | ||||||
| ASSETS: | |||||||
Investments, at amortized cost | $ | 18,009,141,149 | $ | 2,111,982,671 | |||
Cash | 876 | 855 | |||||
Receivable for Fund shares sold | 694,471,481 | 68,989,166 | |||||
Interest receivable | 34,948,418 | 3,102,892 | |||||
Deferred compensation | 537,900 | 78,186 | |||||
Prepaid expenses | 466,289 | 118,001 | |||||
Total Assets | 18,739,566,113 | 2,184,271,771 | |||||
| LIABILITIES: | |||||||
Payable for Fund shares repurchased | 1,060,391,665 | 70,505,405 | |||||
Payable for securities purchased | — | 49,970,790 | |||||
Management fee payable | 5,721,673 | 782,231 | |||||
Transfer agent fees payable | 3,083,616 | 134,371 | |||||
Distributions payable | 1,116,057 | 194,711 | |||||
Distribution fees payable (Notes 2 and 3) | 541,390 | 62,021 | |||||
Deferred compensation payable | 537,900 | 78,186 | |||||
Directors’ fees payable | 6,165 | 5,364 | |||||
Accrued expenses | 593,710 | 110,496 | |||||
Total Liabilities | 1,071,992,176 | 121,843,575 | |||||
Total Net Assets | $ | 17,667,573,937 | $ | 2,062,428,196 | |||
NET ASSETS: | |||||||
Par value (Note 5) | $ | 176,673,271 | $ | 20,623,798 | |||
Paid-in capital in excess of par value | 17,490,901,666 | 2,041,772,605 | |||||
Undistributed net investment income | 17,232 | 31,793 | |||||
Accumulated net realized gain (loss) on investments | (18,232 | ) | — | ||||
Total Net Assets | $ | 17,667,573,937 | $ | 2,062,428,196 | |||
Shares Outstanding: | |||||||
Class A | 17,546,472,956 | 2,049,262,435 | |||||
Class C | 152,362 | 3,160 | |||||
Class Y | 120,701,780 | 13,114,162 | |||||
Net Asset Value: | |||||||
Class A | $1.00 | $1.00 | |||||
Class C | $1.00 | $1.00 | |||||
Class Y | $1.00 | $1.00 | |||||
See Notes to Financial Statements.
18 Smith Barney Money Funds, Inc. 2005 Annual Report
Statements of Operations (For the year ended December 31, 2005)
| Cash Portfolio | Government Portfolio | |||||||
| INVESTMENT INCOME: | ||||||||
Interest | $ | 573,112,650 | $ | 74,030,341 | ||||
| EXPENSES: | ||||||||
Management fee (Note 2) | 65,276,720 | 9,953,207 | ||||||
Distribution fees (Notes 2 and 3) | 17,262,701 | 2,287,222 | ||||||
Transfer agent fees (Notes 2 and 3) | 15,828,334 | 765,395 | ||||||
Custody fees | 839,567 | 100,444 | ||||||
Registration fees | 472,809 | 205,022 | ||||||
Insurance | 328,311 | 61,156 | ||||||
Directors’ fees | 297,698 | 42,261 | ||||||
Shareholder reports (Note 3) | 292,639 | 68,061 | ||||||
Legal fees | 57,903 | 32,214 | ||||||
Audit and tax | 54,090 | 39,177 | ||||||
Miscellaneous expenses | 32,617 | 8,673 | ||||||
Total Expenses | 100,743,389 | 13,562,832 | ||||||
Less: Expense reimbursement (Note 2) | — | (5 | ) | |||||
Net Expenses | 100,743,389 | 13,562,827 | ||||||
Net Investment Income | 472,369,261 | 60,467,514 | ||||||
| REALIZED AND UNREALIZED GAIN (LOSS) ON INVESTMENTS (NOTE 1): | ||||||||
Net Realized Gain (Loss) From Investment Transactions | (18,232 | ) | 8,634 | |||||
Increase in Net Assets From Operations | $ | 472,351,029 | $ | 60,476,148 | ||||
See Notes to Financial Statements.
Smith Barney Money Funds, Inc. 2005 Annual Report 19
Statements of Changes in Net Assets (For the years ended December 31,)
| Cash Portfolio | 2005 | 2004 | ||||||
| OPERATIONS: | ||||||||
Net investment income | $ | 472,369,261 | $ | 163,519,097 | ||||
Net realized gain (loss) | (18,232 | ) | 75,944 | |||||
Increase in Net Assets From Operations | 472,351,029 | 163,595,041 | ||||||
DISTRIBUTIONS TO SHAREHOLDERS FROM (NOTES 1 AND 4): | ||||||||
Net investment income | (472,369,261 | ) | (163,254,028 | ) | ||||
Net realized gains | — | (265,069 | ) | |||||
Decrease in Net Assets From | (472,369,261 | ) | (163,519,097 | ) | ||||
| FUND SHARE TRANSACTIONS (NOTE 5): | ||||||||
Net proceeds from sale of shares | 102,958,638,804 | 94,763,889,887 | ||||||
Reinvestment of distributions | 457,134,926 | 158,525,154 | ||||||
Cost of shares repurchased | (102,994,449,761 | ) | (97,314,303,363 | ) | ||||
Increase (Decrease) in Net Assets From | 421,323,969 | (2,391,888,322 | ) | |||||
Increase (Decrease) in Net Assets | 421,305,737 | (2,391,812,378 | ) | |||||
| NET ASSETS: | ||||||||
Beginning of year | 17,246,268,200 | 19,638,080,578 | ||||||
End of year* | $ | 17,667,573,937 | $ | 17,246,268,200 | ||||
*Includes undistributed net investment income of: | $17,232 | $17,232 | ||||||
See Notes to Financial Statements.
20 Smith Barney Money Funds, Inc. 2005 Annual Report
Statements of Changes in Net Assets (For the years ended December 31,) (continued)
| Government Portfolio | 2005 | 2004 | ||||||
| OPERATIONS: | ||||||||
Net investment income | $ | 60,467,514 | $ | 22,173,130 | ||||
Net realized gain | 8,634 | 20,414 | ||||||
Increase in Net Assets From Operations | 60,476,148 | 22,193,544 | ||||||
| DISTRIBUTIONS TO SHAREHOLDERS FROM (NOTES 1 AND 4): | ||||||||
Net investment income | (60,458,877 | ) | (22,133,330 | ) | ||||
Net realized gains | (8,634 | ) | (39,800 | ) | ||||
Decrease in Net Assets From | (60,467,511 | ) | (22,173,130 | ) | ||||
| FUND SHARE TRANSACTIONS (NOTE 5): | ||||||||
Net proceeds from sale of shares | 9,602,150,169 | 9,723,013,124 | ||||||
Reinvestment of distributions | 58,143,963 | 21,559,416 | ||||||
Cost of shares repurchased | (9,924,400,746 | ) | (10,208,828,172 | ) | ||||
Decrease in Net Assets From Fund Share Transactions | (264,106,614 | ) | (464,255,632 | ) | ||||
Decrease in Net Assets | (264,097,977 | ) | (464,235,218 | ) | ||||
| NET ASSETS: | ||||||||
Beginning of year | 2,326,526,173 | 2,790,761,391 | ||||||
End of year* | $ | 2,062,428,196 | $ | 2,326,526,173 | ||||
* Includes undistributed net investment income of: | $31,793 | $23,156 | ||||||
See Notes to Financial Statements.
Smith Barney Money Funds, Inc. 2005 Annual Report 21
For a share of each class of capital stock outstanding throughout each year ended December 31:
| Class A Shares | ||||||||||||||||||||
| Cash Portfolio | 2005(1) | 2004 | 2003 | 2002 | 2001 | |||||||||||||||
Net Asset Value, Beginning of Year | $ | 1.000 | $ | 1.000 | $ | 1.000 | $ | 1.000 | $ | 1.000 | ||||||||||
Income from Operations: | ||||||||||||||||||||
Net investment income | 0.027 | 0.009 | 0.007 | 0.013 | 0.037 | |||||||||||||||
Net realized gain (loss) | (0.000 | )(2) | 0.000 | (2) | 0.000 | (2) | 0.000 | (2) | 0.000 | (2) | ||||||||||
Total Income from Operations | 0.027 | 0.009 | 0.007 | 0.013 | 0.037 | |||||||||||||||
Less Distributions From: | ||||||||||||||||||||
Net investment income | (0.027 | ) | (0.009 | ) | (0.007 | ) | (0.013 | ) | (0.037 | ) | ||||||||||
Net realized gains | — | (0.000 | )(2) | — | — | — | ||||||||||||||
Total Distributions | (0.027 | ) | (0.009 | ) | (0.007 | ) | (0.013 | ) | (0.037 | ) | ||||||||||
Net Asset Value, End of Year | $ | 1.000 | $ | 1.000 | $ | 1.000 | $ | 1.000 | $ | 1.000 | ||||||||||
Total Return(3) | 2.75 | % | 0.90 | % | 0.67 | % | 1.28 | % | 3.78 | % | ||||||||||
Net Assets, End of Year (billions) | $18 | $17 | $20 | $23 | $32 | |||||||||||||||
Ratios to Average Net Assets: | ||||||||||||||||||||
Gross expenses | 0.58 | % | 0.59 | % | 0.56 | % | 0.62 | % | 0.59 | % | ||||||||||
Net expenses(4) | 0.58 | 0.54 | (5) | 0.56 | 0.62 | 0.59 | ||||||||||||||
Net investment income | 2.72 | 0.88 | 0.68 | 1.27 | 3.93 | |||||||||||||||
| (1) | Per share amounts have been calculated using the average shares method. |
| (2) | Amount represents less than $0.001 per share. |
| (3) | Performance figures may reflect voluntary fee waivers and/or expense reimbursements. Past performance is no guarantee of future results. In the absence of voluntary fee waivers and/or expense reimbursements, the total return would have been lower. |
| (4) | As a result of a voluntary expense limitation, the ratio of expenses to average net assets of Class A shares of the Fund will not exceed 0.70%. |
| (5) | The investment manager voluntarily waived a portion of its fees. |
See Notes to Financial Statements.
22 Smith Barney Money Funds, Inc. 2005 Annual Report
Financial Highlights (continued)
For a share of each class of capital stock outstanding throughout each year ended December 31:
| Class C Shares(1) | ||||||||||||||||||||
| Cash Portfolio | 2005(2) | 2004 | 2003 | 2002 | 2001 | |||||||||||||||
Net Asset Value, Beginning of Year | $ | 1.000 | $ | 1.000 | $ | 1.000 | $ | 1.000 | $ | 1.000 | ||||||||||
Income from Operations: | ||||||||||||||||||||
Net investment income | 0.027 | 0.009 | 0.007 | 0.013 | 0.037 | |||||||||||||||
Net realized gain (loss) | (0.000 | )(3) | 0.000 | (3) | 0.000 | (3) | 0.000 | (3) | 0.000 | (3) | ||||||||||
Total Income from Operations | 0.027 | 0.009 | 0.007 | 0.013 | 0.037 | |||||||||||||||
Less Distributions From: | ||||||||||||||||||||
Net investment income | (0.027 | ) | (0.009 | ) | (0.007 | ) | (0.013 | ) | (0.037 | ) | ||||||||||
Net realized gains | — | (0.000 | )(3) | — | — | — | ||||||||||||||
Total Distributions | (0.027 | ) | (0.009 | ) | (0.007 | ) | (0.013 | ) | (0.037 | ) | ||||||||||
Net Asset Value, End of Year | $ | 1.000 | $ | 1.000 | $ | 1.000 | $ | 1.000 | $ | 1.000 | ||||||||||
Total Return(4) | 2.71 | % | 0.90 | % | 0.67 | % | 1.29 | % | 3.81 | % | ||||||||||
Net Assets, End of Year (000s) | $152 | $166 | $381 | $347 | $304 | |||||||||||||||
Ratios to Average Net Assets: | ||||||||||||||||||||
Gross expenses | 0.63 | % | 0.59 | % | 0.55 | % | 0.61 | % | 0.56 | % | ||||||||||
Net expenses(5) | 0.63 | 0.55 | (6) | 0.55 | 0.61 | 0.56 | ||||||||||||||
Net investment income | 2.65 | 0.79 | 0.67 | 1.28 | 3.53 | |||||||||||||||
| (1) | On April 29, 2004, Class L shares were renamed Class C shares. |
| (2) | Per share amounts have been calculated using the average shares method. |
| (3) | Amount represents less than $0.001 per share. |
| (4) | Performance figures may reflect voluntary fee waivers and/or expense reimbursements. Past performance is no guarantee of future results. In the absence of voluntary fee waivers and/or expense reimbursements, the total return would have been lower. |
| (5) | As a result of a voluntary expense limitation, the ratio of expenses to average net assets of Class C shares of the Fund will not exceed 0.70%. |
| (6) | The investment manager voluntarily waived a portion of its fees. |
See Notes to Financial Statements.
Smith Barney Money Funds, Inc. 2005 Annual Report 23
Financial Highlights (continued)
For a share of each class of capital stock outstanding throughout each year ended December 31:
| Class Y Shares | ||||||||||||||||||||
| Cash Portfolio | 2005(1) | 2004 | 2003 | 2002 | 2001 | |||||||||||||||
Net Asset Value, Beginning of Year | $ | 1.000 | $ | 1.000 | $ | 1.000 | $ | 1.000 | $ | 1.000 | ||||||||||
Income from Operations: | ||||||||||||||||||||
Net investment income | 0.029 | 0.010 | 0.008 | 0.014 | 0.039 | |||||||||||||||
Net realized gain (loss) | (0.000 | )(2) | 0.000 | (2) | 0.000 | (2) | 0.000 | (2) | 0.000 | (2) | ||||||||||
Total Income from Operations | 0.029 | 0.010 | 0.008 | 0.014 | 0.039 | |||||||||||||||
Less Distributions From: | ||||||||||||||||||||
Net investment income | (0.029 | ) | (0.010 | ) | (0.008 | ) | (0.014 | ) | (0.039 | ) | ||||||||||
Net realized gains | — | (0.000 | )(2) | — | — | — | ||||||||||||||
Total Distributions | (0.029 | ) | (0.010 | ) | (0.008 | ) | (0.014 | ) | (0.039 | ) | ||||||||||
Net Asset Value, End of Year | $ | 1.000 | $ | 1.000 | $ | 1.000 | $ | 1.000 | $ | 1.000 | ||||||||||
Total Return(3) | 2.91 | % | 1.00 | % | 0.78 | % | 1.45 | % | 3.94 | % | ||||||||||
Net Assets, End of Year (millions) | $121 | $86 | $128 | $63 | $60 | |||||||||||||||
Ratios to Average Net Assets: | ||||||||||||||||||||
Gross expenses | 0.43 | % | 0.49 | % | 0.44 | % | 0.45 | % | 0.40 | % | ||||||||||
Net expenses(4) | 0.43 | 0.43 | (5) | 0.44 | 0.45 | 0.40 | ||||||||||||||
Net investment income | 2.93 | 0.98 | 0.76 | 1.44 | 3.96 | |||||||||||||||
| (1) | Per share amounts have been calculated using the average shares method. |
| (2) | Amount represents less than $0.001 per share. |
| (3) | Performance figures may reflect voluntary fee waivers and/or expense reimbursements. Past performance is no guarantee of future results. In the absence of voluntary fee waivers and/or expense reimbursements, the total return would have been lower. |
| (4) | As a result of a voluntary expense limitation, the ratio of expenses to average net assets of Class Y shares of the Fund will not exceed 0.70%. |
| (5) | The investment manager voluntarily waived a portion of its fees. |
See Notes to Financial Statements.
24 Smith Barney Money Funds, Inc. 2005 Annual Report
Financial Highlights (continued)
For a share of each class of capital stock outstanding throughout each year ended December 31:
| Class A Shares | ||||||||||||||||||||
| Government Portfolio | 2005(1) | 2004 | 2003 | 2002 | 2001 | |||||||||||||||
Net Asset Value, Beginning of Year | $ | 1.000 | $ | 1.000 | $ | 1.000 | $ | 1.000 | $ | 1.000 | ||||||||||
Income from Operations: | ||||||||||||||||||||
Net investment income | 0.027 | 0.009 | 0.006 | 0.012 | 0.036 | |||||||||||||||
Net realized gain | 0.000 | (2) | 0.000 | (2) | 0.000 | (2) | 0.000 | (2) | 0.000 | (2) | ||||||||||
Total Income from Operations | 0.027 | 0.009 | 0.006 | 0.012 | 0.036 | |||||||||||||||
Less Distributions From: | ||||||||||||||||||||
Net investment income | (0.027 | ) | (0.009 | ) | (0.006 | ) | (0.012 | ) | (0.036 | ) | ||||||||||
Net realized gains | (0.000 | )(2) | (0.000 | )(2) | (0.000 | )(2) | — | — | ||||||||||||
Total Distributions | (0.027 | ) | (0.009 | ) | (0.006 | ) | (0.012 | ) | (0.036 | ) | ||||||||||
Net Asset Value, End of Year | $ | 1.000 | $ | 1.000 | $ | 1.000 | $ | 1.000 | $ | 1.000 | ||||||||||
Total Return(3) | 2.69 | % | 0.85 | % | 0.62 | % | 1.22 | % | 3.67 | % | ||||||||||
Net Assets, End of Year (billions) | $2 | $2 | $3 | $3 | $4 | |||||||||||||||
Ratios to Average Net Assets: | ||||||||||||||||||||
Gross expenses | 0.59 | % | 0.57 | % | 0.56 | % | 0.61 | % | 0.56 | % | ||||||||||
Net expenses(4) | 0.59 | 0.54 | (5) | 0.56 | 0.61 | 0.56 | ||||||||||||||
Net investment income | 2.63 | 0.82 | 0.63 | 1.21 | 3.74 | |||||||||||||||
| (1) | Per share amounts have been calculated using the average shares method. |
| (2) | Amount represents less than $0.001 per share. |
| (3) | Performance figures may reflect voluntary fee waivers and/or expense reimbursements. Past performance is no guarantee of future results. In the absence of voluntary fee waivers and/or expense reimbursements, the total return would have been lower. |
| (4) | As a result of a voluntary expense limitation, the ratio of expenses to average net assets of Class A shares of the Fund will not exceed 0.70%. |
| (5) | The investment manager voluntarily waived a portion of its fees. |
See Notes to Financial Statements.
Smith Barney Money Funds, Inc. 2005 Annual Report 25
Financial Highlights (continued)
For a share of each class of capital stock outstanding throughout each year ended December 31:
| Class C Shares(1) | ||||||||||||||||||||
| Government Portfolio | 2005(2) | 2004 | 2003 | 2002 | 2001 | |||||||||||||||
Net Asset Value, Beginning of Year | $ | 1.000 | $ | 1.000 | $ | 1.000 | $ | 1.000 | $ | 1.000 | ||||||||||
Income from Operations: | ||||||||||||||||||||
Net investment income | 0.025 | 0.007 | 0.006 | 0.012 | 0.036 | |||||||||||||||
Net realized gain | 0.000 | (3) | 0.000 | (3) | 0.000 | (3) | 0.000 | (3) | 0.000 | (3) | ||||||||||
Total Income from Operations | 0.025 | 0.007 | 0.006 | 0.012 | 0.036 | |||||||||||||||
Less Distributions From: | ||||||||||||||||||||
Net investment income | (0.025 | ) | (0.007 | ) | (0.006 | ) | (0.012 | ) | (0.036 | ) | ||||||||||
Net realized gains | (0.000 | )(3) | (0.000 | )(3) | (0.000 | )(3) | — | — | ||||||||||||
Total Distributions | (0.025 | ) | (0.007 | ) | (0.006 | ) | (0.012 | ) | (0.036 | ) | ||||||||||
Net Asset Value, End of Year | $ | 1.000 | $ | 1.000 | $ | 1.000 | $ | 1.000 | $ | 1.000 | ||||||||||
Total Return(4) | 2.57 | % | 0.73 | % | 0.58 | % | 1.21 | % | 3.68 | % | ||||||||||
Net Assets, End of Year (000s) | $3 | $6 | $14 | $131 | $123 | |||||||||||||||
Ratios to Average Net Assets: | ||||||||||||||||||||
Gross expenses | 0.79 | % | 0.76 | % | 0.61 | % | 0.61 | % | 0.63 | % | ||||||||||
Net expenses(5) | 0.65 | (6) | 0.65 | (6) | 0.61 | 0.61 | 0.63 | |||||||||||||
Net investment income | 2.49 | 0.69 | 0.65 | 1.21 | 3.53 | |||||||||||||||
| (1) | On April 29, 2004, Class L shares were renamed Class C shares. |
| (2) | Per share amounts have been calculated using the average shares method. |
| (3) | Amount represents less than $0.001 per share. |
| (4) | Performance figures may reflect voluntary fee waivers and/or expense reimbursements. Past performance is no guarantee of future results. In the absence of voluntary fee waivers and/or expense reimbursements, the total return would have been lower. |
| (5) | As a result of a voluntary expense limitation, the ratio of expenses to average net assets of Class C shares of the Fund will not exceed 0.70%. |
| (6) | The investment manager voluntarily waived a portion of its fees. |
See Notes to Financial Statements.
26 Smith Barney Money Funds, Inc. 2005 Annual Report
Financial Highlights (continued)
For a share of each class of capital stock outstanding throughout each year ended December 31:
| Class Y Shares | ||||||||||||||||||||
| Government Portfolio | 2005(1) | 2004 | 2003 | 2002 | 2001 | |||||||||||||||
Net Asset Value, Beginning of Year | $ | 1.000 | $ | 1.000 | $ | 1.000 | $ | 1.000 | $ | 1.000 | ||||||||||
Income from Operations: | ||||||||||||||||||||
Net investment income | 0.028 | 0.010 | 0.007 | 0.013 | 0.037 | |||||||||||||||
Net realized gain | 0.000 | (2) | 0.000 | (2) | 0.000 | (2) | 0.000 | (2) | 0.000 | (2) | ||||||||||
Total Income from Operations | 0.028 | 0.010 | 0.007 | 0.013 | 0.037 | |||||||||||||||
Less Distributions From: | ||||||||||||||||||||
Net investment income | (0.028 | ) | (0.010 | ) | (0.007 | ) | (0.013 | ) | (0.037 | ) | ||||||||||
Net realized gains | (0.000 | )(2) | (0.000 | )(2) | (0.000 | )(2) | — | — | ||||||||||||
Total Distributions | (0.028 | ) | (0.010 | ) | (0.007 | ) | (0.013 | ) | (0.037 | ) | ||||||||||
Net Asset Value, End of Year | $ | 1.000 | $ | 1.000 | $ | 1.000 | $ | 1.000 | $ | 1.000 | ||||||||||
Total Return(3) | 2.83 | % | 0.98 | % | 0.75 | % | 1.35 | % | 3.78 | % | ||||||||||
Net Assets, End of Year (millions) | $13 | $3 | $1 | $2 | $21 | |||||||||||||||
Ratios to Average Net Assets: | ||||||||||||||||||||
Gross expenses | 0.45 | % | 0.43 | % | 0.44 | % | 0.48 | % | 0.44 | % | ||||||||||
Net expenses(4) | 0.45 | 0.41 | (5) | 0.44 | 0.48 | 0.44 | ||||||||||||||
Net investment income | 2.77 | 1.05 | 0.76 | 1.38 | 3.69 | |||||||||||||||
| (1) | Per share amounts have been calculated using the average shares method. |
| (2) | Amount represents less than $0.001 per share. |
| (3) | Performance figures may reflect voluntary fee waivers and/or expense reimbursements. Past performance is no guarantee of future results. In the absence of voluntary fee waivers and/or expense reimbursements, the total return would have been lower. |
| (4) | As a result of a voluntary expense limitation, the ratio of expenses to average net assets of Class Y shares of the Fund will not exceed 0.70%. |
| (5) | The investment manager voluntarily waived a portion of its fees. |
See Notes to Financial Statements.
Smith Barney Money Funds, Inc. 2005 Annual Report 27
| 1. | Organization and Significant Accounting Policies |
The Cash Portfolio (“Cash”) and Government Portfolio (“Government”) (collectively, the “Funds”) are separate diversified investment funds of the Smith Barney Money Funds, Inc. (“Company”). The Company, a Maryland corporation, is registered under the Investment Company Act of 1940, as amended, (the “1940 Act”), as an open-end management investment company.
The following are significant accounting policies consistently followed by the Funds and are in conformity with U.S. generally accepted accounting principles (“GAAP”). Estimates and assumptions are required to be made regarding assets, liabilities and changes in net assets resulting from operations when financial statements are prepared. Changes in the economic environment, financial markets and any other parameters used in determining these estimates could cause actual results to differ.
(a) Investment valuation. Money market instruments are valued at amortized cost, in accordance with Rule 2a-7 under the 1940 Act, which approximates market value. This method involves valuing portfolio securities at its cost and thereafter assuming a constant amortization to maturity of any discount or premium. The Funds’ use of amortized cost is subject to their compliance with certain conditions as specified under Rule 2a-7 of the 1940 Act.
(b) Repurchase Agreements. When entering into repurchase agreements, it is the Funds’ policy that their custodian or a third party custodian take possession of the underlying collateral securities, the market value of which at least equals the principal amount of the repurchase transaction, including accrued interest. To the extent that any repurchase transaction exceeds one business day, the value of the collateral is marked-to-market to ensure the adequacy of the collateral. If the seller defaults and the market value of the collateral declines or if bankruptcy proceedings are commenced with respect to the seller of the security, realization of the collateral by the Funds may be delayed or limited.
(c) Security Transactions and Investment Income. Security transactions are accounted for on a trade date basis. Interest income, adjusted for amortization of premium and accretion of discount, is recorded on the accrual basis. The cost of investments sold is determined by use of the specific identification method.
(d) Distributions to Shareholders. Distributions from net investment income on the shares of each of the Funds are declared each business day to shareholders of record, and are paid monthly. Distributions of net realized gains, if any, are declared at least annually. Distributions are recorded on the ex-dividend date and are determined in accordance with income tax regulations, which may differ from GAAP.
(e) Class Accounting. Investment income, common expenses and realized/unrealized gain (loss) on investments are allocated to the various classes of the Funds on the basis of daily net assets of each class. Fees relating to a specific class are charged directly to that class.
(f) Federal and Other Taxes. It is the Funds’ policy to comply with the federal income and excise tax requirements of the Internal Revenue Code of 1986, as amended, applicable to regulated investment companies. Accordingly, the Funds intend to distribute substantially all of their taxable income and net realized gains on investments, if any, to share - -
28 Smith Barney Money Funds, Inc. 2005 Annual Report
Notes to Financial Statements (continued)
holders each year. Therefore, no federal income tax provision is required in the Funds’ financial statements.
(g) Reclassification. GAAP requires that certain components of net assets be adjusted to reflect permanent differences between financial and tax reporting. These reclassifications have no effect on net assets or net asset values per share. There were no reclassifications during the current year for Cash Portfolio and Government Portfolio.
| 2. | Management Agreement and Other Transactions with Affiliates |
On December 1, 2005, Citigroup Inc. (“Citigroup”) completed the sale of substantially all of its asset management business, Citigroup Asset Management (“CAM”), to Legg Mason, Inc. (“Legg Mason”). As a result, the Funds’ investment adviser, Smith Barney Fund Management LLC (“SBFM” or the “Manager”), previously an indirect wholly-owned subsidiary of Citigroup, has become a wholly-owned subsidiary of Legg Mason. Completion of the sale caused the Funds’ existing investment management contract to terminate. The Funds’ shareholders approved a new investment management contract between the Funds and the Manager, which became effective on December 1, 2005.
Legg Mason, whose principal executive offices are in Baltimore, Maryland, is a financial services holding company.
Prior to the transaction, the Funds paid the Manager a fee calculated at an annual rate of the Fund’s average daily net assets as follows:
| Average Daily Net Assets | Annual Rate | ||
First $1.0 billion | 0.450 | % | |
Next $1.0 billion | 0.425 | % | |
Next $3.0 billion | 0.400 | % | |
Next $5.0 billion | 0.375 | % | |
Over $10.0 billion | 0.350 | % | |
Under the new Investment Management agreement the Funds will continue to pay the Manager a management fee calculated at an annual rate of the Funds’ average daily net assets as shown in the table above. This fee is calculated daily and paid monthly.
During the year ended December 31, 2005, SBFM voluntarily reimbursed certain expenses amounting to $5 for the Government Portfolio Class C shares.
The Funds’ Board has approved PFPC Inc. (“PFPC”) to serve as transfer agent for the Funds, effective January 1, 2006. The principal business office of PFPC is located at 4400 Computer Drive Westborough, MA 01581. The Board has approved Boston Financial Data Services, Inc. (“BFDS”) to serve as transfer agent for the Fund with respect to Cash Portfolio effective January 23, 2006. BFDS is located at 2 Heritage Drive, North Quincy, MA 02171.
During the period covered by this report, Citicorp Trust Bank, fsb. (“CTB”), a subsidiary of Citigroup, acted as the Funds’ transfer agent. PFPC and Primerica Shareholder Services (“PSS”), another subsidiary of Citigroup, acted as the Funds’ sub-transfer agents. CTB received account fees and asset-based fees that varied according to the size and type
Smith Barney Money Funds, Inc. 2005 Annual Report 29
Notes to Financial Statements (continued)
of account. PFPC was responsible for shareholder recordkeeping and financial processing for all shareholder accounts and was paid by CTB. For the period ended December 31, 2005, the Funds paid transfer agent fees of $13,461,780 and $658,022 for the Cash and Government Portfolios, respectively, to CTB.
The Funds’ Board has appointed the Funds’ current distributor, Citigroup Global Markets Inc. (“CGM”) and Legg Mason Investor Services, LLC (“LMIS”), a wholly-owned broker-dealer subsidiary of Legg Mason, as co-distributors of the Funds. The Board also appointed PFS Investments Inc. (“PFS”) as a co-distributor of Cash Portfolio. The Funds’ Board has also approved amended and restated Rule 12b-1 Plans. CGM, LMIS, PFS and other broker-dealers, financial intermediaries and financial institutions (each called a “Service Agent”) that currently offer Fund shares will continue to make the Funds’ shares available to their clients. Additional Service Agents may offer Fund shares in the future.
The Funds have adopted an unfunded, non-qualified deferred compensation plan (the “Plan”) which allows non-interested directors (“Director”) to defer the receipt of all or a portion of their fees until a later date specified by the Director. The deferred fees earn a return based on notional investments selected by the Director. The balance of the deferred fees payable may change depending upon the investment performance. Any gains earned or losses incurred in the deferred balances are reported in the Statement of Operations under Directors’ fees. Under the Plan, deferred fees are considered an obligation of the Funds and any payments made pursuant to the Plan will be made from each Fund’s assets. Effective January 1, 2006, the Board of Directors voted to discontinue offering the Plan to its members. This change will have no effect on fees previously deferred.
As of December 31, 2005, the Funds have accrued $537,900 and $78,186 for the Cash Portfolio and Government Portfolio, respectively, as deferred compensation payable.
Certain officers and one director of the Company are employees of Legg Mason or its affiliates and do not receive compensation from the Company.
| 3. | Class Specific Expenses |
Pursuant to a Distribution Plan, each Fund pays a distribution fee with respect to its Class A and C shares calculated at the annual rate of 0.10% of the average daily net assets of each respective class. For the year ended December 31, 2005, total distribution fees, which are accrued daily and paid monthly, were as follows:
| Distribution Fees | ||||||
| Class A | Class C | |||||
Cash Portfolio | $ | 17,262,543 | $ | 158 | ||
Government Portfolio | 2,287,218 | 4 | ||||
For the year ended December 31, 2005, total transfer agent fees were as follows:
| Transfer Agent Fees | |||||||||
| Class A | Class C | Class Y | |||||||
Cash Portfolio | $ | 15,787,265 | $ | 222 | $ | 40,847 | |||
Government Portfolio | 765,372 | 9 | 14 | ||||||
30 Smith Barney Money Funds, Inc. 2005 Annual Report
Notes to Financial Statements (continued)
For the year ended December 31, 2005, total shareholder reports expenses were as follows:
| Shareholder Reports Expenses | |||||||||
| Class A | Class C | Class Y | |||||||
Cash Portfolio | $ | 291,588 | $ | 4 | $ | 1,047 | |||
Government Portfolio | 68,005 | 1 | 55 | ||||||
| 4. | Distributions to Shareholders by Class |
| Cash Portfolio | Year Ended December 31, 2005 | Year Ended December 31, 2004 | |||||
Net Investment Income |
| ||||||
Class A | $ | 469,375,138 | $ | 162,322,586 | |||
Class C† | 4,185 | 1,870 | |||||
Class Y | 2,989,938 | 929,572 | |||||
Total | $ | 472,369,261 | $ | 163,254,028 | |||
Net Realized Gains | |||||||
Class A | $ | — | $ | 262,418 | |||
Class C† | — | 0 | * | ||||
Class Y | — | 2,651 | |||||
Total | $ | — | $ | 265,069 | |||
| † | On April 29, 2004, Class L shares were renamed as Class C shares. |
| * | Amount represents less than $1. |
| Government Portfolio | Year Ended December 31, 2005 | Year Ended December 31, 2004 | ||||||
Net Investment Income | ||||||||
Class A | $ | 60,082,453 | $ | 22,076,354 | ||||
Class C† | 92 | 94 | ||||||
Class Y | 376,332 | 56,882 | ||||||
Total | $ | 60,458,877 | $ | 22,133,330 | ||||
Net Realized Gains | ||||||||
Class A | $ | 8,583 | $ | 39,800 | ||||
Class C† | 0 | * | 0 | * | ||||
Class Y | 51 | 0 | * | |||||
Total | $ | 8,634 | $ | 39,800 | ||||
| † | On April 29, 2004, Class L shares were renamed as Class C shares. |
| * | Amount represents less than $1. |
Smith Barney Money Funds, Inc. 2005 Annual Report 31
Notes to Financial Statements (continued)
| 5. | Capital Shares |
The Company offers multiple classes of shares within the Cash and Government Portfolios. Class A and Class Y shares can be purchased directly by investors; Class C shares can only be purchased by participants in the Smith Barney 401(k) Program.
Transactions in shares of each class, each at $1.00, were as follows:
| Year Ended December 31, 2005 | Year Ended December 31, 2004 | |||||
| Cash Portfolio | Shares | Shares | ||||
Class A | ||||||
Shares sold | 102,843,224,266 | 94,705,680,845 | ||||
Shares issued on reinvestment | 456,973,525 | 158,356,650 | ||||
Shares repurchased | (102,913,306,356 | ) | (97,214,217,387 | ) | ||
Net Increase (Decrease) | 386,891,435 | (2,350,179,892 | ) | |||
Class C† | ||||||
Shares sold | — | 15,089 | ||||
Shares issued on reinvestment | 4,159 | 1,773 | ||||
Shares repurchased | (17,516 | ) | (232,571 | ) | ||
Net Decrease | (13,357 | ) | (215,709 | ) | ||
Class Y | ||||||
Shares sold | 115,414,539 | 58,193,953 | ||||
Shares issued on reinvestment | 157,243 | 166,731 | ||||
Shares repurchased | (81,125,889 | ) | (99,853,405 | ) | ||
Net Increase (Decrease) | 34,445,893 | (41,492,721 | ) | |||
| † | On April 29, 2004, Class L shares were renamed Class C shares. |
| Year Ended December 31, 2005 | Year Ended December 31, 2004 | |||||
| Government Portfolio | Shares | Shares | ||||
Class A | ||||||
Shares sold | 9,575,766,056 | 9,685,704,372 | ||||
Shares issued on reinvestment | 57,767,451 | 21,502,446 | ||||
Shares repurchased | (9,908,097,594 | ) | (10,173,101,768 | ) | ||
Net Decrease | (274,564,087 | ) | (465,894,950 | ) | ||
Class C† | ||||||
Shares sold | — | 1,660 | ||||
Shares issued on reinvestment | 91 | 87 | ||||
Shares repurchased | (3,152 | ) | (9,504 | ) | ||
Net Decrease | (3,061 | ) | (7,757 | ) | ||
Class Y | ||||||
Shares sold | 26,384,113 | 37,307,092 | ||||
Shares issued on reinvestment | 376,421 | 56,883 | ||||
Shares repurchased | (16,300,000 | ) | (35,716,900 | ) | ||
Net Increase | 10,460,534 | 1,647,075 | ||||
| † | On April 29, 2004, Class L shares were renamed Class C shares. |
32 Smith Barney Money Funds, Inc. 2005 Annual Report
Notes to Financial Statements (continued)
| 6. | Income Tax Information and Distributions to Shareholders |
Subsequent to the fiscal year end, the Fund made the following distributions:
| Record Date | Payable Date | Class A | Class C | Class Y | |||||||||
Cash Portfolio | Daily | 1/31/2006 | $ | 0.003084 | $ | 0.003052 | $ | 0.003195 | |||||
Government Portfolio | Daily | 1/31/2006 | $ | 0.002944 | $ | 0.002669 | $ | 0.003039 | |||||
The tax character of distributions paid during the fiscal year ended December 31, 2005 was as follows:
| Cash Portfolio | Government Portfolio | |||||
Distributions paid from: | ||||||
Ordinary Income | $ | 472,369,261 | $ | 60,467,511 | ||
The tax character of distributions paid during the fiscal year ended December 31, 2004 was as follows:
| Cash Portfolio | Government Portfolio | |||||
Distributions paid from: | ||||||
Ordinary Income | $ | 163,519,097 | $ | 22,173,130 | ||
As of December 31, 2005, there were no significant differences between the book and tax components of net assets for both Cash Portfolio and Government Portfolio.
As of December 31, 2005, the Cash Portfolio had the following net capital loss carryforward remaining:
| Year of Expiration | Amount | |||
12/31/2013 | $ | (18,232 | ) | |
This amount will be available to offset any future taxable capital gains.
| 7. | Regulatory Matters |
On May 31, 2005, the U.S. Securities and Exchange Commission (“SEC”) issued an order in connection with the settlement of an administrative proceeding against SBFM and CGM relating to the appointment of an affiliated transfer agent for the Smith Barney family of mutual funds (the “Funds”).
The SEC order finds that SBFM and CGM willfully violated Section 206(1) of the Investment Advisers Act of 1940 (“Advisers Act”). Specifically, the order finds that SBFM
Smith Barney Money Funds, Inc. 2005 Annual Report 33
Notes to Financial Statements (continued)
and CGM knowingly or recklessly failed to disclose to the boards of the Funds in 1999 when proposing a new transfer agent arrangement with an affiliated transfer agent that: First Data Investors Services Group (“First Data”), the Funds’ then-existing transfer agent, had offered to continue as transfer agent and do the same work for substantially less money than before; and that Citigroup Asset Management (“CAM”), the Citigroup business unit that, at the time, included the fund’s investment manager and other investment advisory companies, had entered into a side letter with First Data under which CAM agreed to recommend the appointment of First Data as sub-transfer agent to the affiliated transfer agent in exchange for, among other things, a guarantee by First Data of specified amounts of asset management and investment banking fees to CAM and CGM. The order also finds that SBFM and CGM willfully violated Section 206(2) of the Advisers Act by virtue of the omissions discussed above and other misrepresentations and omissions in the materials provided to the Funds’ boards, including the failure to make clear that the affiliated transfer agent would earn a high profit for performing limited functions while First Data continued to perform almost all of the transfer agent functions, and the suggestion that the proposed arrangement was in the Funds’ best interests and that no viable alternatives existed. SBFM and CGM do not admit or deny any wrongdoing or liability. The settlement does not establish wrongdoing or liability for purposes of any other proceeding.
The SEC censured SBFM and CGM and ordered them to cease and desist from violations of Sections 206(1) and 206(2) of the Advisers Act. The order requires Citigroup to pay $208.1 million, including $109 million in disgorgement of profits, $19.1 million in interest, and a civil money penalty of $80 million. Approximately $24.4 million has already been paid to the Funds, primarily through fee waivers. The remaining $183.7 million, including the penalty, has been paid to the U.S. Treasury and will be distributed pursuant to a plan prepared and submitted for approval by the SEC. The order also requires that transfer agency fees received from the Funds since December 1, 2004 less certain expenses be placed in escrow and provides that a portion of such fees may be subsequently distributed in accordance with the terms of the order.
The order required SBFM to recommend a new transfer agent contract to the Fund boards within 180 days of the entry of the order; if a Citigroup affiliate submitted a proposal to serve as transfer agent or sub-transfer agent, SBFM and CGM would have been required, at their expense, to engage an independent monitor to oversee a competitive bidding process. On November 21, 2005, and within the specified timeframe, the Fund’s Board selected a new transfer agent for the Fund. No Citigroup affiliate submitted a proposal to serve as transfer agent. Under the order, SBFM also must comply with an amended version of a vendor policy that Citigroup instituted in August 2004.
At this time, there is no certainty as to how the proceeds of the settlement will be distributed, to whom such distributions will be made, the methodology by which such distributions will be allocated, and when such distributions will be made. Although there can be no assurance, SBFM does not believe that this matter will have a material adverse effect on the Funds.
On December 1, 2005, Citigroup completed the sale of substantially all of its global asset management business, including SBFM, to Legg Mason Inc.
34 Smith Barney Money Funds, Inc. 2005 Annual Report
Notes to Financial Statements (continued)
| 8. | Legal Matters |
Beginning in August 2005, five class action lawsuits alleging violations of federal securities laws and state law were filed against CGM and SBFM (collectively, the “Defendants”) based on the May 31, 2005 settlement order issued against the Defendants by the SEC described in Note 7. The complaints seek injunctive relief and compensatory and punitive damages, removal of SBFM as the advisor for the Smith Barney family of funds, rescission of the Funds’ management and other contracts with SBFM, recovery of all fees paid to SBFM pursuant to such contracts, and an award of attorneys’ fees and litigation expenses.
On October 5, 2005, a motion to consolidate the five actions and any subsequently filed, related action was filed. That motion contemplates that a consolidated amended complaint alleging substantially similar causes of action will be filed in the future.
As of the date of this report, the Fund’s investment manager believes that resolution of the pending lawsuit will not have a material effect on the financial position or results of operations of the Funds or the ability of the Fund’s investment manager and its affiliates to continue to render services to the Funds under their respective contracts.
***
Beginning in June 2004, class action lawsuits alleging violations of the federal securities laws were filed against Citigroup Global Markets Inc. (the “Distributor”) and a number of its affiliates, including SBFM and Salomon Brothers Asset Management Inc (SBAM) (the “Advisers”), substantially all of the mutual funds managed by the Advisers, including the Fund (the “Funds”), and directors or trustees of the Funds (collectively, the “Defendants”). The complaints alleged, among other things, that CGM created various undisclosed incentives for its brokers to sell Smith Barney and Salomon Brothers funds. In addition, according to the complaints, the Advisers caused the Funds to pay excessive brokerage commissions to CGM for steering clients towards proprietary funds. The complaints also alleged that the defendants breached their fiduciary duty to the Funds by improperly charging Rule 12b-1 fees and by drawing on fund assets to make undisclosed payments of soft dollars and excessive brokerage commissions. The complaints also alleged that the Funds failed to adequately disclose certain of the allegedly wrongful conduct. The complaints sought injunctive relief and compensatory and punitive damages, rescission of the Funds’ contracts with the Advisers, recovery of all fees paid to the Advisers pursuant to such contracts and an award of attorneys’ fees and litigation expenses.
On December 15, 2004, a consolidated amended complaint (the “Complaint”) was filed alleging substantially similar causes of action. While the lawsuit is in its earliest stages, to the extent that the Complaint purports to state causes of action against the Funds, the Fund’s investment manager believes the Funds have significant defenses to such allegations, which the Funds intend to vigorously assert in responding to the Complaint.
Additional lawsuits arising out of these circumstances and presenting similar allegations and requests for relief may be filed against the Defendants in the future.
As of the date of this report, the Fund’s investment manager and the Funds believe that the resolution of the pending lawsuit will not have a material effect on the financial position or results of operations of the Funds or the ability of the Advisers and their affiliates to continue to render services to the Funds under their respective contracts.
Smith Barney Money Funds, Inc. 2005 Annual Report 35
Notes to Financial Statements (continued)
The Defendants have moved to dismiss the Complaint. Those motions are pending before the court.
| 9. | Other Matters |
On September 16, 2005, the staff of the Securities and Exchange Commission (the “Commission”) informed SBFM and SBAM that the staff is considering recommending that the Commission institute administrative proceedings against SBFM and SBAM for alleged violations of Section 19(a) and 34(b) of the Investment Company Act (and related Rule 19a-1). The notification is a result of an industry wide inspection by the SEC and is based upon alleged deficiencies in disclosures regarding dividends and distributions paid to shareholders of certain funds. Section 19(a) and related Rule 19a-1 of the Investment Company Act generally require funds that are making dividend and distribution payments to provide shareholders with a written statement disclosing the source of the dividends and distributions, and, in particular, the portion of the payments made from each of net investment income, undistributed net profits and/or paid-in capital. In connection with the contemplated proceedings, the staff may seek a cease and desist order and/or monetary damages from SBFM or SBAM.
Although there can be no assurance, SBFM and SBAM believe that this matter is not likely to have a material adverse effect on the Fund or SBFM and SBAM’s ability to perform investment management services relating to the Fund.
36 Smith Barney Money Funds, Inc. 2005 Annual Report
Report of Independent Registered Public Accounting Firm
The Board of Directors and Shareholders Smith Barney Money Funds, Inc.:
We have audited the accompanying statements of assets and liabilities, including the schedules of investments, of Cash Portfolio and Government Portfolio, each a series of Smith Barney Money Funds, Inc., as of December 31, 2005, and the related statements of operations for the year then ended, the statements of changes in net assets for each of the years in the two-year period then ended, and the financial highlights for each of the years in the five-year period then ended. These financial statements and financial highlights are the responsibility of the Funds’ management. Our responsibility is to express an opinion on these financial statements and financial highlights based on our audits.
We conducted our audits in accordance with the standards of the Public Company Accounting Oversight Board (United States). Those standards require that we plan and perform the audit to obtain reasonable assurance about whether the financial statements and financial highlights are free of material misstatement. An audit includes examining, on a test basis, evidence supporting the amounts and disclosures in the financial statements. Our procedures included confirmation of securities owned as of December 31, 2005, by correspondence with the custodian and brokers or by other appropriate auditing procedures. An audit also includes assessing the accounting principles used and significant estimates made by management, as well as evaluating the overall financial statement presentation. We believe that our audits provide a reasonable basis for our opinion.
In our opinion, the financial statements and financial highlights referred to above present fairly, in all material respects, the financial position of Cash Portfolio and Government Portfolio as of December 31, 2005, and the results of their operations for the year then ended, the changes in their net assets for each of the years in the two-year period then ended, and the financial highlights for each of the years in the five-year period then ended, in conformity with U.S. generally accepted accounting principles.

New York, New York
February 22, 2006
Smith Barney Money Funds, Inc. 2005 Annual Report 37
Board Approval of Management Agreement (unaudited)
The members of the Board of Smith Barney Money Funds — Cash Portfolio and Government Portfolio (each a “Fund”), including the Fund’s independent, or non-interested, Board members (the “Independent Board Members”), received information from the Fund’s manager (the “Manager”) to assist them in their consideration of the Fund’s management agreement (the “Management Agreement”). The Board received and considered a variety of information about the Manager, Smith Barney Funds Management LLC, and the Fund’s distributor(s), as well as the advisory, and distribution arrangements for the Fund and other funds overseen by the Board, certain portions of which are discussed below.
The presentation made to the Board encompassed the Fund and all the funds for which the Board has responsibility. Some funds overseen by the Board have an investment advisory agreement and an administration agreement and some funds have an investment management agreement that encompasses both functions. The discussion below covers both advisory and administrative functions being rendered by the Manager whether a fund has a single agreement in place or both an advisory and administration agreement. The terms “Management Agreement”, “Contractual Management Fee” and “Actual Management Fee” are used in a similar manner to refer to both advisory and administration agreements and their related fees whether a fund has a single agreement or separate agreements in place.
Board Approval of Management Agreement
In approving the Management Agreement, the Fund’s Board, including the Independent Board Members, considered the following factors:
Nature, Extent and Quality of the Services under the Management Agreement
The Board received and considered information regarding the nature, extent and quality of services provided to the Fund by the Manager under the Management Agreement during the past year. The Board also received a description of the administrative and other services rendered to the Fund and its shareholders by the Manager. The Board noted information received at regular meetings throughout the year related to the services rendered by the Manager about the management of the Fund’s affairs and the Manager’s role in coordinating the activities of the Fund’s other service providers. The Board’s evaluation of the services provided by the Manager took into account the Board’s knowledge and familiarity gained as Board members of funds in the Citigroup Asset Management (“CAM”) fund complex, including the scope and quality of the Manager’s investment management and other capabilities and the quality of its administrative and other services. The Board observed that the scope of services provided by the Manager had expanded over time as a result of regulatory and other developments, including maintaining and monitoring its own and the Fund’s expanded compliance programs. The Board also considered the Manager’s response to recent regulatory compliance issues affecting it and the CAM fund complex. The Board reviewed information received from the Manager regarding the implementation to date of the Fund’s compliance policies and procedures established pursuant to Rule 38a-1 under the Investment Company Act of 1940.
The Board reviewed the qualifications, backgrounds and responsibilities of the Fund’s senior personnel and the portfolio management team primarily responsible for the
38 Smith Barney Money Funds, Inc. 2005 Annual Report
Board Approval of Management Agreement (unaudited) (continued)
day-to-day portfolio management of the Fund. The Board also considered the degree to which the Manager implemented organizational changes to improve investment results and the services provided to the CAM fund complex. The Board noted that the Manager’s Office of the Chief Investment Officer, composed of the senior officers of the investment teams managing the funds in the CAM complex, participates in reporting to the Board on investment matters. The Board also considered, based on its knowledge of the Manager and its affiliates, the financial resources available to CAM and its parent organization, Citigroup Inc.
The Board also considered the Manager’s brokerage policies and practices, the standards applied in seeking best execution, the Manager’s policies and practices regarding soft dollars, the use of a broker affiliated with the Manager and the existence of quality controls applicable to brokerage allocation procedures. In addition, management also reported to the Board on, among other things, its business plans, recent organizational changes and portfolio manager compensation plan.
At the Board’s request following the conclusion of the 2004 contract continuance discussions, the Manager prepared and provided to the Board in connection with the 2005 discussions an analysis of complex-wide management fees, which, among other things, set out a proposed framework of fees based on asset classes. The Board engaged the services of independent consultants to assist it in evaluating the Fund’s fees generally and within the context of the framework.
The Board concluded that, overall, the nature, extent and quality of services provided (and expected to be provided) under the Management Agreement were acceptable.
Fund Performance
The Board received and considered performance information for the Fund as well as for a group of funds (the “Performance Universe”) selected by Lipper, Inc. (“Lipper”), an independent provider of investment company data. The Board was provided with a description of the methodology Lipper used to determine the similarity of the Fund with the funds included in the Performance Universe. The Board also noted that it had received and discussed with management information throughout the year at periodic intervals comparing the Fund’s performance against its benchmark(s).
Smith Barney Money Funds: Cash Portfolio
The information comparing the Fund’s performance to that of its Performance Universe, consisting of all retail and institutional funds classified as “money market funds” by Lipper, showed that the Fund’s performance for all of the periods presented was better than the median. As a result of this and based on their review, the Board concluded that the Fund’s relative investment performance was satisfactory.
Smith Barney Money Funds: Government Portfolio
The information comparing the Fund’s performance to that of its Performance Universe, consisting of all retail and institutional funds classified as “US government money market
Smith Barney Money Funds, Inc. 2005 Annual Report 39
Board Approval of Management Agreement (unaudited) (continued)
funds” by Lipper, showed that the Fund’s performance for all of the periods presented was better than the median. As a result of this and based on their review, the Board concluded that the Fund’s relative investment performance was acceptable.
Management Fees and Expense Ratios
The Board reviewed and considered the contractual management fee (the “Contractual Management Fee”) payable by the Fund to the Manager in light of the nature, extent and quality of the management services provided by the Manager.
Additionally, the Board received and considered information comparing the Fund’s Contractual Management Fees and Actual Management Fee and the Fund’s overall expenses with those of funds in both the relevant expense group and a broader group of funds, each selected and provided by Lipper. The Board also reviewed information regarding fees charged by the Manager to other U.S. clients investing primarily in an asset class similar to that of the Fund including, where applicable, separate accounts. The Manager reviewed with the Board the significant differences in scope of services provided to the Fund and to these other clients, noting that the Fund is provided with administrative services, office facilities, Fund officers (including the Fund’s chief executive, chief financial and chief compliance officers), and that the Manager coordinates and oversees the provision of services to the Fund by other Fund providers. The Board considered the fee comparisons in light of the differences required to manage these different types of accounts. The Board received an analysis of complex-wide management fees provided by the Manager, which, among other things, set out a proposed framework of fees based on asset classes.
Management also discussed with the Board the Fund’s distribution arrangements. The Board was provided with information concerning revenues received by and certain expenses incurred by the Fund’s affiliated distributors and how the amounts received by the distributors are paid.
Smith Barney Money Funds: Cash Portfolio
The information comparing the Fund’s Class A shares’ Contractual and Actual Management Fees, as well as its actual total expense ratio, to its Expense Group, consisting of 10 retail no-load funds (including the Fund) classified as “money market funds” by Lipper, showed that although the Fund’s Contractual and Actual Management Fees were higher than the median, they were within the range of management fees paid by the other funds in the Expense Group. The Board noted that the Fund’s transfer agency fees were higher than the median for its Expense Group because the Fund is used as a sweep vehicle for certain customers’ brokerage accounts it may have a larger number of relatively small accounts than its peer group and therefore higher transfer agent fees. The Board noted that the Fund’s actual total expense ratio was within the median range.
The Board will continue to monitor management fees and total expenses of the Fund. The Board noted that the Fund’s transfer agency fees were among the highest in its Lipper Expense Group.
40 Smith Barney Money Funds, Inc. 2005 Annual Report
Board Approval of Management Agreement (unaudited) (continued)
Smith Barney Money Funds: Government Portfolio
The information comparing the Fund’s Class A shares’ Contractual and Actual Management Fees as well as its actual total expense ratio to its Expense Group, consisting of 13 retail no-load funds (including the Fund) classified as “US government money market funds” by Lipper, showed that although the Fund’s Contractual and Actual Management Fees were higher than the median range of management fees paid by the other funds in the Expense Group the Fund’s actual total expense ratio was better than the median and the Board concluded that it was acceptable.
Taking all of the above into consideration, the Board determined that the Management Fee was reasonable in light of the nature, extent and quality of the services provided to the Fund under the Management Agreement.
Manager Profitability
The Board received and considered a profitability analysis of the Manager and its affiliates in providing services to the Fund. The Board also received profitability information with respect to the CAM fund complex as a whole. In addition, the Board received information with respect to the Manager’s allocation methodologies used in preparing this profitability data as well as a report from an outside consultant that had reviewed the Manager’s methodology. The Manager’s profitability was considered not excessive in light of the nature, extent and quality of the services provided to the Fund.
Economies of Scale
The Board received and discussed information concerning whether the Manager realizes economies of scale as the Fund’s assets grow beyond current levels. However, because of the nature of the Manager’s business, the Board could not reach definitive conclusions as to whether the Manager might realize economies of scale or how great they may be.
The Board noted that the Fund’s asset level exceeded the breakpoints (or would exceed any proposed breakpoints) and, as a result, the Fund and its shareholders realized or would realize the benefit of a lower total expense ratio than if no breakpoints had been in place. The Board also noted that as the Fund’s assets have increased over time, it has realized other economies of scale as certain expenses, such as fees for Board members, auditors and legal fees, become a smaller percentage of overall assets.
Other Benefits to the Manager
The Board considered other benefits received by the Manager and its affiliates as a result of their relationship with the Fund, including soft dollar arrangements, receipt of brokerage and the opportunity to offer additional products and services to Fund shareholders.
In light of the costs of providing investment management and other services to the Fund and the Manager’s ongoing commitment to the Fund, the profits and other ancillary benefits that the Manager and its affiliates received were considered reasonable.
In light of all of the foregoing, the Board approved the Management Agreement to continue for another year.
Smith Barney Money Funds, Inc. 2005 Annual Report 41
Board Approval of Management Agreement (unaudited) (continued)
No single factor reviewed by the Board was identified by the Board as the principal factor in determining whether to approve the Management Agreement. The Independent Board Members were advised by separate independent legal counsel throughout the process. The Board discussed the proposed continuance of the Management Agreement in a private session with their independent legal counsel at which no representatives of the Manager were present.
Additional Information
On June 23, 2005, Citigroup Inc. entered into a definitive agreement (the “Transaction Agreement”) with Legg Mason, Inc. under which Citigroup agreed to sell substantially all of its asset management business, Citigroup Asset Management (“CAM”), which includes the Adviser, to Legg Mason in exchange for the broker-dealer and investment banking businesses of Legg Mason and certain other considerations (the “Transaction”). The Transaction closed on December 1, 2005.
The consummation of the Transaction resulted in the automatic termination of the Fund’s current management agreement in accordance with the Investment Company Act of 1940, as amended (the “1940 Act”). Prior to the closing of the Transaction, the Fund’s Board approved a new management agreement between the Fund and the Adviser (the “New Management Agreement”) and authorized the Fund’s officers to submit the New Management Agreement to shareholders for their approval.
On July 11, 2005, members of the Board discussed with CAM management and certain Legg Mason representatives the Transaction and Legg Mason’s general plans and intentions regarding CAM’s business and its combination with Legg Mason’s business. The Board Members also inquired about the plans for and anticipated roles and responsibilities of certain CAM employees and officers after the Transaction.
At a meeting held on August 1, 2005, the Fund’s Board, including a majority of the Board Members who are not “interested persons” of the Fund or the Adviser as defined in the 1940 Act (the “Independent Board Members”), approved the New Management Agreement. To assist the Board in its consideration of the New Management Agreement, Legg Mason provided materials and information about Legg Mason, including its financial condition, asset management capabilities and organization, and CAM provided materials and information about the Transaction between Legg Mason and Citigroup. Representatives of CAM and Legg Mason also made presentations to and responded to questions from the Board. The Independent Board Members, through their independent legal counsel, also requested and received additional information from CAM and Legg Mason in connection with their consideration of the New Management Agreement. The additional information was provided in advance of and at the August meeting. After the presentations and after reviewing the written materials provided, the Independent Board Members met in executive session with their counsel to consider the New Management Agreement. The Independent Board Members also conferred separately and with their counsel about the Transaction on a number of occasions, including in connection with the July and August meetings.
42 Smith Barney Money Funds, Inc. 2005 Annual Report
Board Approval of Management Agreement (unaudited) (continued)
In their deliberations concerning the New Management Agreement, among other things, the Board Members considered:
(i) the reputation, financial strength and resources of Legg Mason and its investment advisory subsidiaries;
(ii) that, following the Transaction, CAM will be part of an organization focused on the asset management business;
(iii) that Legg Mason and its wholly-owned subsidiary, Western Asset Management Company and its affiliates (“Western Asset”), are experienced and respected asset management firms, and that Legg Mason has advised the Board Members that (a) it intends to combine the fixed income investment operations (including money market fund operations) of CAM with those of Western Asset and may also wish to combine other CAM operations with those of other Legg Mason subsidiaries; (b) after the closing of the Transaction, it will take steps to combine the investment management operations of Western Asset with the fixed income operations of the Adviser, which, among other things, may involve Western Asset and the Adviser sharing common systems and procedures, employees (including portfolio managers), investment and trading platforms, and other resources; (c) it is expected that these combination processes will result in changes to portfolio managers or portfolio management teams for a number of the CAM funds, subject to Board oversight and appropriate notice to shareholders, and that, in other cases, the current portfolio managers or portfolio management teams will remain in place; and (d) in the future, it may recommend that Western Asset or other Legg Mason subsidiaries be appointed as the adviser or subadviser to some or all of the CAM funds, subject to applicable regulatory requirements;
(iv) that CAM management had advised the Board that a number of portfolio managers and other key CAM personnel would be retained after the closing of the Transaction;
(v) that CAM management and Legg Mason have advised the Board that following the Transaction, there is not expected to be any diminution in the nature, quality and extent of services provided to the Fund and their shareholders by the Adviser, including compliance services;
(vi) that Legg Mason has advised the Board that it has no present intention to alter the expense waivers and reimbursements currently in effect and, while it reserves the right to do so in the future, it would consult with the Board before making any changes;
(vii) that under the Transaction Agreement, Citigroup and Legg Mason have agreed not to take any action that is not contemplated by the Transaction or fail to take any action that to their respective knowledge would cause any “undue burden” on Fund shareholders under applicable provisions of the 1940 Act;
(viii) the assurances from Citigroup and Legg Mason that, for a three-year period following the closing of the Transaction, Citigroup-affiliated broker-dealers will
Smith Barney Money Funds, Inc. 2005 Annual Report 43
Board Approval of Management Agreement (unaudited) (continued)
continue to offer the Fund as an investment product, and the potential benefits to Fund shareholders from this and other third-party distribution access;
(ix) the potential benefits to Fund shareholders from being part of a combined fund family with Legg Mason-sponsored funds;
(x) that Citigroup and Legg Mason would derive benefits from the Transaction and that, as a result, they have a financial interest in the matters that were being considered;
(xi) the potential effects of regulatory restrictions on the Fund if Citigroup-affiliated broker-dealers remain principal underwriters of the Fund after the closing of the Transaction;
(xii) the fact that the Fund’s total advisory and administrative fees will not increase by virtue of the New Management Agreement, but will remain the same;
(xiii) the terms and conditions of the New Management Agreement, including the differences from the current management agreement, and the benefits of a single, uniform form of agreement covering these services;
(xiv) that the Fund would not bear the costs of obtaining shareholder approval of the New Management Agreement;
(xv) that the Fund would avail itself of permissions granted under certain licensing arrangements between Citigroup and Legg Mason that would permit the Fund (including any share classes thereof) to maintain its current name, as well as all logos, trademarks and service marks, related to Citigroup or any of its affiliates for some agreed upon time period after the closing of the Transaction ; and
(xvi) that, as discussed in detail above, within the past year the Board had performed a full annual review of the current management agreement as required by the 1940 Act. In that regard, the Board, in its deliberations concerning the New Management Agreement, considered the same factors regarding the nature, quality and extent of services provided, costs of services provided, profitability, fall-out benefits, fees and economies of scale and investment performance as it did when it renewed the current management agreement, and reached substantially the same conclusions.
44 Smith Barney Money Funds, Inc. 2005 Annual Report
Additional Information (unaudited)
Information about Directors and Officers
The business and affairs of the Smith Barney Money Funds, Inc. (“Fund”) are managed under the direction of the Board of Directors. Information pertaining to the Directors and Officers of the Fund is set forth below. The Statement of Additional Information includes additional information about Directors and is available, without charge, upon request by calling Shareholder Services at 1-800-451-2010.
| Name, Address and Birth Year | Position(s) Held with | Term of Office* and Length of Time Served | Principal Occupation(s) During Past | Number of Portfolios in Fund Complex Overseen by Director | Other Board | |||||
| Non-Interested Directors: | ||||||||||
Lee Abraham 13732 LeHavre Drive Frenchman’s Creek Palm Beach Gardens, FL 33410 Birth Year: 1927 | Director | Since 1999 | Retired; Former Director of Signet Group PLC | 27 | None | |||||
Jane F. Dasher Korsant Partners 283 Greenwich Avenue 3rd Floor Greenwich, CT 06830 Birth Year: 1949 | Director | Since 1999 | Controller of PBK Holdings Inc., a family investment company | 27 | None | |||||
Donald R. Foley 3668 Freshwater Drive Jupiter, FL 33477 Birth Year: 1922 | Director | Since 1982 | Retired | 27 | None | |||||
Richard E. Hanson, Jr. 2751 Vermont Route 140 Poultney, VT 05764 Birth Year: 1941 | Director | Since 1999 | Retired; Former Head of the New Atlanta Jewish Community High School | 27 | None | |||||
Paul Hardin 12083 Morehead Chapel Hill, NC 27514-8426 Birth Year: 1931 | Director | Since 1994 | Professor of Law & Chancellor Emeritus at the University of North Carolina | 34 | None | |||||
Roderick C. Rasmussen 9 Cadence Court Morristown, NJ 07960 Birth Year: 1926 | Director | Since 1982 | Investment Counselor | 27 | None | |||||
John P. Toolan 7202 Southeast Golf Ridge Way Hobe Sound, Florida 33455 Birth Year: 1930 | Director | Since 1992 | Retired | 27 | None | |||||
Smith Barney Money Funds, Inc. 2005 Annual Report 45
Additional Information (unaudited) (continued)
| Name, Address and Birth Year | Position(s) Held with | Term of Office* and Length of Time Served | Principal Occupation(s) During Past | Number of Portfolios in Fund Complex Overseen by Director | Other Board | |||||
| Interested Director: | ||||||||||
R. Jay Gerken, CFA** Citigroup Asset Management (“CAM”) 399 Park Avenue Mezzanine New York, NY 10022 Birth Year: 1951 | Chairman, President and Chief Executive Officer | Since 2002 | Managing Director of CAM; Chairman, President, Chief Executive Officer and Director SBFM, and CFM; President and Chief Executive Officer of certain mutual funds associated with CAM; formerly Portfolio Manager of Smith Barney Allocation Series, Inc. (from 1996 to 2001) and Smith Barney Growth and Income Fund (from 1996 to 2000); formerly Chairman, President and Chief Executive Officer of Travelers Investment Adviser, Inc. (“TIA”) (from 2002 to 2005) | 183 | None | |||||
| Officers: | ||||||||||
Andrew B. Shoup CAM 125 Broad Street 11th Floor New York, NY 10004 Birth Year: 1956 | Senior Vice President and Chief Administrative Officer | Since 2003 | Director of CAM; Senior Vice President and Chief Administrative Officer of mutual funds associated with CAM; Treasurer of certain mutual funds associated with CAM; Head of International Funds Administration of CAM (from 2001 to 2003); Director of Global Funds Administration of CAM (from 2000 to 2001); Head of U.S. Citibank Funds Administration of CAM (from 1998 to 2000) | N/A | N/A | |||||
46 Smith Barney Money Funds, Inc. 2005 Annual Report
Additional Information (unaudited) (continued)
| Name, Address and Birth Year | Position(s) Held with | Term of Office* and Length of Time Served | Principal Occupation(s) During Past | Number of Portfolios in Fund Complex Overseen by Director | Other Board | |||||
Robert J. Brault CAM 125 Broad Street New York, NY 10004 Birth Year: 1965 | Chief Financial Officer and Treasurer | Since 2004 | Director of CAM; Chief Financial Officer and Treasurer of certain mutual funds associated with CAM; Director of Internal Control for CAM U.S. Mutual Fund Administration (from 2002 to 2004); Director of Project Management & Information Systems for CAM U.S. Mutual Fund Administration (from 2000 to 2002); Vice President of Mutual Fund Administration at Investors Capital Services (from 1999 to 2000) | N/A | N/A | |||||
Martin R. Hanley CAM 399 Park Avenue 4th Floor New York, NY 10022 Birth Year: 1965 | Vice President and Investment Officer | Since 1993 | Portfolio Manager | N/A | N/A | |||||
Kevin Kennedy CAM 399 Park Avenue 4th Floor New York, NY 10022 Birth Year: 1954 | Vice President and Investment Officer | Since 2001 | Portfolio Manager | N/A | N/A | |||||
Smith Barney Money Funds, Inc. 2005 Annual Report 47
Additional Information (unaudited) (continued)
| Name, Address and Birth Year | Position(s) Held with | Term of Office* and Length of Time Served | Principal Occupation(s) During Past | Number of Portfolios in Fund Complex Overseen by Director | Other Board | |||||
Ted P. Becker CAM 399 Park Avenue New York, NY 10022 Birth Year: 1951 | Chief Compliance Officer | Since 2006 | Managing Director of Compliance at Legg Mason & Co., LLC, (2005-Present); Chief Compliance Officer with certain mutual funds associated with CAM (since 2006); Managing Director of Compliance at Citigroup Asset Management (2002-2005). Prior to 2002, Managing Director-Internal Audit & Risk Review at Citigroup Inc. | N/A | N/A | |||||
John Chiota CAM 100 First Stamford Place 5th Floor Stamford, CT 06902 Birth Year: 1968 | Chief Anti-Money Laundering Compliance Officer | Since 2006 | Vice President of CAM (since 2004); Chief Anti-Money Laundering Compliance Officer with certain mutual funds associated with CAM (since 2006); prior to August 2004, Chief AML Compliance Officer with TD Waterhouse. | N/A | N/A | |||||
Robert I. Frenkel CAM 300 First Stamford Place 4th Floor Stamford, CT 06902 Birth Year: 1954 | Secretary and Chief Legal Officer | Since 2003 | Managing Director and General Counsel, Global Mutual Funds for CAM and its predecessor (since 1994); Secretary of CFM (from 2001 to 2004); Secretary and Chief Legal Officer of mutual funds associated with CAM | N/A | N/A | |||||
| * | Each Director and officer serves until his or her successor has been duly elected and qualified. |
| ** | Mr. Gerken is an “interested person” of the Fund as defined in the Investment Company Act of 1940, as amended, because Mr. Gerken is an officer of SBFM and certain of its affiliates. |
48 Smith Barney Money Funds, Inc. 2005 Annual Report
Additional Shareholder Information (unaudited)
Smith Barney Money Funds, Inc. — Cash Portfolio
Results of a Special Meeting of Shareholders
On November 15, 2005, a Special Meeting of Shareholders was held to elect directors. The following table provides the number of votes cast for, against or withheld, as well as the number of abstentions as to the matter voted on at the Special Meeting of Shareholders.
1. Election of Directors
| Name | Votes For | Authority Withheld | Abstentions | |||
Lee Abraham | 7,374,688,916.418 | 317,278,333.280 | 9,053,847.110 | |||
Jane F. Dasher | 7,381,764,987.808 | 310,202,261.890 | 9,053,847.110 | |||
Donald R. Foley | 7,377,399,557.028 | 314,567,692.670 | 9,053,847.110 | |||
Richard E. Hanson, Jr. | 7,379,534,386.118 | 312,432,863.580 | 9,053,847.110 | |||
Paul Hardin | 7,378,461,605.888 | 313,505,643.810 | 9,053,847.110 | |||
Roderick C. Rasmussen | 7,376,644,184.108 | 315,323,065.590 | 9,053,847.110 | |||
John P. Toolan | 7,377,276,346.178 | 314,690,903.520 | 9,053,847.110 | |||
R. Jay Gerken | 7,371,718,942.188 | 320,248,307.510 | 9,053,847.110 | |||
On December 19, 2005, a Special Meeting of Shareholders was held to approve a new management agreement. The following table provides the number of votes cast for, against or withheld, as well as the number of abstentions and broker non-votes as to the matter voted on at the Special Meeting of Shareholders.
| Item Voted On | Votes For | Votes Against | Abstentions | Broker Non-Votes | ||||
New Management Agreement | 7,998,268,481.234 | 275,394,489.830 | 645,242,137.580 | 1,025,998.000 | ||||
Smith Barney Money Funds, Inc. 2005 Annual Report 49
Additional Shareholder Information (unaudited) (continued)
Smith Barney Money Funds, Inc. — Government Portfolio
Results of a Special Meeting of Shareholders
On November 15, 2005, a Special Meeting of Shareholders was held to elect directors. The following table provides the number of votes cast for, against or withheld, as well as the number of abstentions as to the matter voted on at the Special Meeting of Shareholders.
| Name | Votes For | Authority Withheld | Abstentions | |||
Lee Abraham | 7,374,688,916.418 | 317,278,333.280 | 9,053,847.110 | |||
Jane F. Dasher | 7,381,764,987.808 | 310,202,261.890 | 9,053,847.110 | |||
Donald R. Foley | 7,377,399,557.028 | 314,567,692.670 | 9,053,847.110 | |||
Richard E. Hanson, Jr. | 7,379,534,386.118 | 312,432,863.580 | 9,053,847.110 | |||
Paul Hardin | 7,378,461,605.888 | 313,505,643.810 | 9,053,847.110 | |||
Roderick C. Rasmussen | 7,376,644,184.108 | 315,323,065.590 | 9,053,847.110 | |||
John P. Toolan | 7,377,276,346.178 | 314,690,903.520 | 9,053,847.110 | |||
R. Jay Gerken | 7,371,718,942.188 | 320,248,307.510 | 9,053,847.110 | |||
On November 29, 2005, a Special Meeting of Shareholders was held to approve a new management agreement. The following table provides the number of votes cast for, against or withheld, as well as the number of abstentions and broker non-votes as to the matter voted on at the Special Meeting of Shareholders.
| Item Voted On | Votes For | Votes Against | Abstentions | Broker Non-Votes | ||||
New Management Agreement | 988,307,832.918 | 40,412,627.880 | 129,523,098.903 | 5,589.000 | ||||
50 Smith Barney Money Funds, Inc. 2005 Annual Report
Important Tax Information (unaudited)
The following information is provided with respect to the distributions paid monthly by the Funds during the taxable year ended December 31, 2005:
| Cash Portfolio | Government Portfolio | |||||
Interest from Federal Obligations | 1.73 | % | 36.24 | % | ||
The law varies in each state as to whether and what percentage of dividend income attributable to Federal obligations is exempt from state income tax. We recommend that you consult with your tax adviser to determine if any portion of the dividends you received is exempt from state income taxes.
Please retain this information for your records.
Smith Barney Money Funds, Inc. 2005 Annual Report 51
Smith Barney Money Funds, Inc.
Cash Portfolio
Government Portfolio
DIRECTORS Lee Abraham Jane F. Dasher Donald R. Foley R. Jay Gerken, CFA Richard E. Hanson, Jr. Paul Hardin Roderick C. Rasmussen John P. Toolan
OFFICERS R. Jay Gerken, CFA President and Chief
Andrew B. Shoup Senior Vice President and
Robert J. Brault Chief Financial Officer
Martin R. Hanley Vice President and
Kevin Kennedy Vice President and
Ted P. Becker Chief Compliance Officer
John Chiota Chief Anti-Money | OFFICERS (continued) Robert I. Frenkel Secretary and
INVESTMENT MANAGER Smith Barney Fund
DISTRIBUTORS Citigroup Global Markets Inc. Legg Mason Investor Services, LLC PFS Investments Inc.
CUSTODIAN State Street Bank and
TRANSFER AGENTS PFPC Inc. 4400 Computer Drive Westborough, Massachusetts 01581
Boston Financial Data 2 Heritage Drive North Quincy, Massachusetts 02171
INDEPENDENT REGISTERED PUBLIC ACCOUNTING FIRM KPMG LLP 345 Park Avenue New York, New York 10154 |
This report is submitted for general information of the shareholders of Smith Barney Money Funds, Inc., but it may also be used as sales literature when preceded or accompanied by the current prospectus.
This report must be preceded or accompanied by a free prospectus. Investors should consider the Funds’ investment objectives, risks, charges and expenses carefully before investing. The prospectus contains this and other important information about the Funds. Please read the prospectus carefully before investing.
www.citigroupam.com
©2005 Legg Mason Investor Services, LLC
Member NASD, SIPC
| FD0858 2/06 | 06-9598 |
Smith Barney Money Funds, Inc.
Cash Portfolio
Government Portfolio
The Funds are separate investment funds of the Smith Barney Money Funds, Inc., a Maryland corporation.
SMITH BARNEY MONEY FUNDS, INC.
Smith Barney Mutual Funds
125 Broad Street
10th Floor, MF-2
New York, New York 10004
The Funds file their complete schedule of portfolio holdings with the Securities and Exchange Commission for the first and third quarters of each fiscal year on Form N-Q. The Funds’ Forms N-Q are available on the Commission’s website at www.sec.gov. The Funds’ Forms N-Q may be reviewed and copied at the Commission’s Public Reference Room in Washington, D.C., and information on the operation of the Public Reference Room may be obtained by calling 1-800-SEC-0330. To obtain information on Form N-Q from the Funds, shareholders can call 1-800-451-2010
Information on how the Funds voted proxies relating to portfolio securities during the most recent 12-month period ended June 30 and a description of the policies and procedures that the Funds use to determine how to vote proxies relating to portfolio securities is available (1) without charge, upon request, by calling 1-800-451-2010, (2) on the Funds’ website at www.citigroupam.com and (3) on the SEC’s website at www.sec.gov.
ITEM 2. CODE OF ETHICS.
The registrant has adopted a code of ethics that applies to the registrant’s principal executive officer, principal financial officer, principal accounting officer or controller.
ITEM 3. AUDIT COMMITTEE FINANCIAL EXPERT.
The Board of Directors of the registrant has determined that Jane Dasher, the Chairperson of the Board’s Audit Committee, possesses the technical attributes identified in Instruction 2(b) of Item 3 to Form N-CSR to qualify as an “audit committee financial expert,” and has designated Ms. Dasher as the Audit Committee’s financial expert. Ms. Dasher is an “independent” Director pursuant to paragraph (a)(2) of Item 3 to Form N-CSR.
ITEM 4. PRINCIPAL ACCOUNTANT FEES AND SERVICES.
a) Audit Fees. The aggregate fees billed in the last two fiscal years ending December 31, 2004 and December 31, 2005 (the “Reporting Periods”) for professional services rendered by the Registrant’s principal accountant (the “Auditor”) for the audit of the Registrant’s annual financial statements, or services that are normally provided by the Auditor in connection with the statutory and regulatory filings or engagements for the Reporting Periods, were $94,000 in 2004 and $94,000 in 2005.
b) Audit-Related Fees. There were no fees billed in the Reporting Periods for assurance and related services by the Auditor that are reasonably related to the performance of the audit of the Registrant’s financial statements and are not reported under paragraph (a) of this Item 4.
In addition, there were no Audit-Related Fees billed in the Reporting Period for assurance and related services by the Auditor to the Registrant’s investment adviser (not including any sub-adviser whose role is primarily portfolio management and is subcontracted with or overseen by another investment adviser), and any entity controlling, controlled by or under common control with the investment adviser that provides ongoing services to the Smith Barney Money Funds, Inc. (“service affiliates”), that were reasonably related to the performance of the annual audit of the service affiliates. Accordingly, there were no such fees that required pre-approval by the Audit Committee for the Reporting Periods (prior to May 6, 2003 services provided by the Auditor were not required to be pre-approved).
(c) Tax Fees. The aggregate fees billed in the Reporting Periods for professional services rendered by the Auditor for tax compliance, tax advice and tax planning (“Tax Services”) were $6,000 in 2004 and $4,000 in 2005. These services consisted of (i) review or preparation of U.S. federal, state, local and excise tax returns; (ii) U.S. federal, state and local tax planning, advice and assistance regarding statutory, regulatory or administrative developments, and (iii) tax advice regarding tax qualification matters and/or treatment of various financial instruments held or proposed to be acquired or held.
There were no fees billed for tax services by the Auditors to service affiliates during the Reporting Periods that required pre-approval by the Audit Committee.
d) All Other Fees. There were no other fees billed in the Reporting Periods for products and services provided by the Auditor, other than the services reported in paragraphs (a) through (c) of this Item for the Smith Barney Money Funds, Inc.
All Other Fees. There were no other non-audit services rendered by the Auditor to Smith Barney Fund Management LLC (“SBFM”), and any entity controlling, controlled by or under common control with SBFM that provided ongoing services to Smith Barney Money Funds, Inc. requiring pre-approval by the Audit Committee in the Reporting Period.
(e) Audit Committee’s pre–approval policies and procedures described in paragraph (c) (7) of Rule 2-01 of Regulation S-X.
(1) The Charter for the Audit Committee (the “Committee”) of the Board of each registered investment company (the “Fund”) advised by Smith Barney Fund Management LLC or Salomon Brothers Asset Management Inc. or one of their affiliates (each, an “Adviser”) requires that the Committee shall approve (a) all audit and permissible non-audit services to be provided to the Fund and (b) all permissible non-audit services to be provided by the Fund’s independent auditors to the Adviser and any Covered Service Providers if the engagement relates directly to the operations and financial reporting of the Fund. The Committee may implement policies and procedures by which such services are approved other than by the full Committee.
The Committee shall not approve non-audit services that the Committee believes may impair the independence of the auditors. As of the date of the approval of this Audit Committee Charter, permissible non-audit services include any professional services (including tax services), that are not prohibited services as described below, provided to the Fund by the independent auditors, other than those provided to the Fund in connection with an audit or a review of the financial statements of the Fund. Permissible non-audit services may not include: (i) bookkeeping or other services related to the accounting records or financial statements of the Fund; (ii) financial information systems design and implementation; (iii) appraisal or valuation services, fairness opinions or contribution-in-kind reports; (iv) actuarial services; (v) internal audit outsourcing services; (vi) management functions or human resources; (vii) broker or dealer, investment adviser or investment banking services; (viii) legal services and expert services unrelated to the audit; and (ix) any other service the Public Company Accounting Oversight Board determines, by regulation, is impermissible.
Pre-approval by the Committee of any permissible non-audit services is not required so long as: (i) the aggregate amount of all such permissible non-audit services provided to the Fund, the Adviser and any service providers controlling, controlled by or under common control with the Adviser that provide ongoing services to the Fund (“Covered Service Providers”) constitutes not more than 5% of the total amount of revenues paid to the independent auditors during the fiscal year in which the permissible non-audit services are provided to (a) the Fund, (b) the Adviser and (c) any entity controlling, controlled by or under common control with the Adviser that provides ongoing services to the Fund during the fiscal year in which the services are provided that would have to be approved by the Committee; (ii) the permissible non-audit services were not recognized by the Fund at the time of the engagement to be non-audit services; and (iii) such services are promptly brought to the attention of the Committee and approved by the Committee (or its delegate(s)) prior to the completion of the audit.
(2) For the Smith Barney Money Funds, Inc., the percentage of fees that were approved by the audit committee, with respect to: Audit-Related Fees were 100% and 100% for 2004 and 2005; Tax Fees were 100% and 100% for 2004 and 2005; and Other Fees were 100% and 100% for 2004 and 2005.
(f) N/A
(g) Non-audit fees billed by the Auditor for services rendered to Smith Barney Money Funds, Inc. and CAM and any entity controlling, controlled by, or under common control with CAM that provides ongoing services to Smith Barney Money Funds, Inc. during the reporting period were $0 in 2005 for fees related to the transfer agent matter as fully described in the notes the financial statements titled “additional information” and $75,000 for 2004.
(h) Yes. The Smith Barney Money Funds, Inc.’ Audit Committee has considered whether the provision of non-audit services that were rendered to Service Affiliates which were not pre-approved (not requiring pre-approval) is compatible with maintaining the Accountant’s independence. All services provided by the Auditor to the Smith Barney Money Funds, Inc. or to Service Affiliates, which were required to be pre-approved, were pre-approved as required
ITEM 5. AUDIT COMMITTEE OF LISTED REGISTRANTS.
Not applicable.
ITEM 6. SCHEDULE OF INVESTMENTS.
Included herein under Item 1.
ITEM 7. DISCLOSURE OF PROXY VOTING POLICIES AND PROCEDURES FOR CLOSED-END MANAGEMENT INVESTMENT COMPANIES.
Not applicable.
ITEM 8. PORTFOLIO MANAGERS OF CLOSED-END MANAGEMENT INVESTMENT COMPANIES.
Not Applicable.
ITEM 9. PURCHASES OF EQUITY SECURITIES BY CLOSED-END MANAGEMENT INVESTMENT COMPANY AND AFFILIATED PURCHASERS.
Not applicable.
ITEM 10. SUBMISSION OF MATTERS TO A VOTE OF SECURITY HOLDERS.
Not applicable.
ITEM 11. CONTROLS AND PROCEDURES.
| (a) | The registrant’s principal executive officer and principal financial officer have concluded that the registrant’s disclosure controls and procedures (as defined in Rule 30a- 3(c) under the Investment Company Act of 1940, as amended (the “1940 Act”)) are effective as of a date within 90 days of the filing date of this report that includes the disclosure required by this paragraph, based on their evaluation of the disclosure controls and procedures required by Rule 30a-3(b) under the 1940 Act and 15d-15(b) under the Securities Exchange Act of 1934. |
| (b) | There were no changes in the registrant’s internal control over financial reporting (as defined in Rule 30a-3(d) under the 1940 Act) that occurred during the registrant’s last fiscal half-year (the registrant’s second fiscal half-year in the case of an annual report) that have materially affected, or are likely to materially affect the registrant’s internal control over financial reporting. |
ITEM 12. EXHIBITS.
| (a) | Code of Ethics attached hereto. |
Exhibit 99.CODE ETH
| (b) | Attached hereto. |
| Exhibit 99.CERT | Certifications pursuant to section 302 of the Sarbanes-Oxley Act of 2002 | |
| Exhibit 99.906CERT | Certifications pursuant to Section 906 of the Sarbanes-Oxley Act of 2002 | |
SIGNATURES
Pursuant to the requirements of the Securities Exchange Act of 1934 and the Investment Company Act of 1940, the registrant has duly caused this Report to be signed on its behalf by the undersigned, there unto duly authorized.
| Smith Barney Money Funds, Inc. | ||
| By: | /s/ R. Jay Gerken | |
| (R. Jay Gerken) | ||
| Chief Executive Officer of | ||
| Smith Barney Money Funds, Inc. | ||
Date: March 10, 2006
Pursuant to the requirements of the Securities Exchange Act of 1934 and the Investment Company Act of 1940, this report has been signed below by the following persons on behalf of the registrant and in the capacities and on the dates indicated.
| By: | /s/ R. Jay Gerken | |
| (R. Jay Gerken) | ||
| Chief Executive Officer of | ||
| Smith Barney Money Funds, Inc. |
Date: March 10, 2006
| By: | /s/ Robert J. Brault | |
| (Robert J. Brault) | ||
| Chief Financial Officer of | ||
| Smith Barney Money Funds, Inc. |
Date: March 10, 2006