UNITED STATES
SECURITIES AND EXCHANGE COMMISSION
Washington, D.C. 20549
FORM N-CSR
CERTIFIED SHAREHOLDER REPORT OF REGISTERED
MANAGEMENT INVESTMENT COMPANIES
Investment Company Act file number | 811-2490 |
Smith Barney Money Funds, Inc.
| (Exact name of registrant as specified in charter) |
| 125 Broad Street, New York, NY | 10004 | |
| (Address of principal executive offices) | (Zip code) |
Robert I. Frenkel, Esq.
Legg Mason & Co., LLC
300 First Stamford Place, 4th Floor
Stamford, CT 06902
| (Name and address of agent for service) |
Registrant’s telephone number, including area code: (800) 451-2010
Date of fiscal year end: December 31
Date of reporting period: December 31, 2006
ITEM 1. REPORT TO STOCKHOLDERS.
The Annual Report to Stockholders is filed herewith.
ANNUAL REPORT
DECEMBER 31, 2006


Smith Barney
Money Funds, Inc.
Cash Portfolio
Government Portfolio
INVESTMENT PRODUCTS • NOT FDIC INSURED • NO BANK GUARANTEE • MAY LOSE VALUE
Smith Barney
Money Funds, Inc.
Cash Portfolio
Government Portfolio
Annual Report • December 31, 2006
Inside
Funds’ Objective
Each Fund seeks maximum current income and preservation of capital.
| I | ||
| 1 | ||
| 4 | ||
| 6 | ||
| 8 | ||
| 20 | ||
| 21 | ||
| 22 | ||
| 24 | ||
| 30 | ||
| 39 | ||
| 40 | ||
| 43 | ||
| 45 | ||
“Smith Barney”, is a service mark of Citigroup, licensed for use by Legg Mason as the names of funds and investment managers. Legg Mason and its affiliates, as well as the Funds’ investment manager, are not affiliated with Citigroup.

R. JAY GERKEN, CFA
Chairman, President and Chief Executive Officer
Dear Shareholder,
U.S. economic growth was mixed during the 12-month reporting period. After gross domestic product (“GDP”)i increased 1.7% in the fourth quarter of 2005, the economy then rebounded sharply in the first quarter of 2006. Over this period, GDP rose 5.6%, its best showing since the third quarter of 2003. In the second quarter of 2006, GDP growth was 2.6% and it further moderated to 2.0% in the third quarter. The economy then strengthened in the fourth quarter, due largely to increased consumer spending. Over this time, the advance estimate for GDP growth was 3.5%.
After increasing the federal funds rateii to 5.25% in June—its 17th consecutive rate hike—the Federal Reserve Board (“Fed”)iii paused from raising rates at its next five meetings. In its statement accompanying the January 2007 meeting, the Fed stated, “Recent indicators have suggested somewhat firmer economic growth, and some tentative signs of stabilization have appeared in the housing market. Readings on core inflation have improved modestly in recent months, and inflation pressures seem likely to moderate over time.”
During the reporting period, short- and long-term Treasury yields experienced periods of significant volatility. After peaking in late June—with two- and 10- year Treasuries hitting 5.29% and 5.25%, respectively—rates fell sharply as the Fed paused from its tightening cycle. In addition, inflationary pressures eased as oil prices fell after reaching a record high in mid-July. Overall, during the 12 months ended December 31, 2006, two-year Treasury yields increased to 4.82% versus 4.41% when the reporting period began. Over the same period, 10-year Treasury yields moved from 4.39% to 4.71%.
The yields available from money market instruments fluctuated given the changes in short term interest rates over the
Smith Barney Money Funds, Inc. I
12-month reporting period. Overall, there remained solid demand for shorter dated money market securities.
Please read on for a more detailed look at prevailing economic and market conditions during the Funds’ fiscal year and to learn how those conditions have affected each Fund’s performance.
Certain changes regarding share class initial investment minimums and related matters were implemented on November 20, 2006. Please consult the Funds’ current prospectus for more information.
Special Shareholder Notices
Effective August 1, 2006, Legg Mason Partners Fund Advisor, LLC (“LMPFA”) became each Fund’s investment manager and Western Asset Management Company (“Western Asset”) became each Fund’s subadviser. The portfolio managers who are responsible for the day-to-day management of the Funds remained the same immediately prior to and immediately after the date of these changes. LMPFA and Western Asset are wholly-owned subsidiaries of Legg Mason, Inc.
Information About Your Funds
As you may be aware, several issues in the mutual fund industry have come under the scrutiny of federal and state regulators. Affiliates of the Funds’ manager have, in recent years, received requests for information from various government regulators regarding market timing, late trading, fees, and other mutual fund issues in connection with various investigations. The regulators appear to be examining, among other things, the Funds’ response to market timing and shareholder exchange activity, including compliance with prospectus disclosure related to these subjects. The Funds are not in a position to predict the outcome of these requests and investigations.
Important information with regard to recent regulatory developments that may affect the Funds is contained in the Notes to Financial Statements included in this report.
II Smith Barney Money Funds, Inc.
As always, thank you for your confidence in our stewardship of your assets. We look forward to helping you meet your financial goals.
Sincerely,

R. Jay Gerken, CFA
Chairman, President and Chief Executive Officer
January 31, 2007
All index performance reflects no deduction for fees, expenses or taxes. Please note that an investor cannot invest directly in an index.
i | Gross domestic product is a market value of goods and services produced by labor and property in a given country. |
ii | The federal funds rate is the interest rate that banks with excess reserves at a Federal Reserve district bank charge other banks that need overnight loans. |
iii | The Federal Reserve Board is responsible for the formulation of a policy designed to promote economic growth, full employment, stable prices, and a sustainable pattern of international trade and payments. |
Smith Barney Money Funds, Inc. III
Q. What were the overall market conditions during the Funds’ reporting period?
A. Interest rates rose across the yield curvei in 2006, driven by a tighter-than-expected Federal Reserve Board (“Fed”)ii and a stronger-than-expected economy in the first half of the year. Short-term rates rose more than long-term rates, leaving the yield curve inverted out to the 5-year area, but it was still positively sloped beyond that.iii The Fed raised its target federal funds rateiv by 25 basis pointsv at each of its first four meetings during the year, exceeding the market’s expectation in late 2005 that only one or two more tightenings were likely to occur in 2006. Beginning with its August meeting, the Fed adopted a wait-and-see attitude to judge the extent to which the housing slowdown would impact the rest of the economy.
Following a strong first quarter, economic growth decelerated to a moderate pace over the course of the year. In addition, a big drop in energy prices resulted in a substantial decline in inflation. A significant downturn in the housing market, coupled with some developing weakness in the manufacturing sector, gave rise to the widely held perception that the economy was likely to slow enough to reduce inflation pressures and allow the Fed to adopt an easing posture in 2007. The labor market exhibited modest but steady growth in jobs, and the unemployment rate declined from 4.9% to 4.5%.vi
Performance Review
As of December 31, 2006, the seven-day current yield for Class A of Smith Barney Money Funds, Inc.—Cash Portfolio was 4.84% and its seven-day effective yield, which reflects compounding, was 4.96%. The seven-day current yield for Smith Barney Money Funds, Inc.—Government Portfolio was 4.76% and its seven-day effective yield, which reflects compounding, was 4.88%.1
1 | The seven-day current yield reflects the amount of income generated by the investment during that seven-day period and assumes that the income is generated each week over a 365-day period. The yield is shown as a percentage of the investment. The seven-day effective yield is calculated similarly to the seven-day current yield but, when annualized, the income earned by an investment in the Fund is assumed to be reinvested. The effective yield typically will be slightly higher than the current yield because of the compounding effect of the assumed reinvestment. |
Smith Barney Money Funds, Inc. 2006 Annual Report 1
| Smith Barney Money Funds, Inc. Yields as of December 31, 2006 (unaudited) | ||||
| Cash Portfolio1 | Government Portfolio1 | |||
Class A Shares | ||||
Seven-Day Current Yield | 4.84% | 4.76% | ||
Seven-Day Effective Yield | 4.96% | 4.88% | ||
Class C Shares | ||||
Seven-Day Current Yield | 4.88% | n/a | ||
Seven-Day Effective Yield | 5.00% | n/a | ||
Class I Shares (formerly Class Y) | ||||
Seven-Day Current Yield | 4.98% | 4.82% | ||
Seven-Day Effective Yield | 5.10% | 4.94% | ||
| The performance shown represents past performance. Past performance is no guarantee of future results and current performance may be higher or lower than the performance shown above. Yields will fluctuate. To obtain performance data current to the most recent month-end for Smith Barney Money Funds, Inc. – Cash Portfolio, please visit our website at www.leggmason.com/InvestorServices. | ||||
An investment in the Funds is neither insured nor guaranteed by the Federal Deposit Insurance Corporation (“FDIC”) or any other government agency. Although the Funds seek to preserve the value of your investment at $1.00 per share, it is possible to lose money by investing in the Funds.
Q. What were the most significant factors affecting each Fund’s performance?
What were the leading contributors to performance?
A. The average maturities of both the Cash Portfolio and Government Portfolio were longer than their peer groups during the 12-month period. This was beneficial to performance during the second half of the period, as we were able to lock in higher yields as the market began to price in an easing of economic policy over the course of 2006 and short-term interest rates declined.
What were the leading detractors from performance?
A. In the first half of the reporting period, the Cash Portfolio’s longer average maturity versus its peer group was a modest drag on performance as our ability to reinvest its maturing assets at higher yields was delayed.
1 | The seven-day current yield reflects the amount of income generated by the investment during that seven-day period and assumes that the income is generated each week over a 365-day period. The yield is shown as a percentage of the investment. The seven-day effective yield is calculated similarly to the seven-day current yield but, when annualized, the income earned by an investment in the Fund is assumed to be reinvested. The effective yield typically will be slightly higher than the current yield because of the compounding effect of the assumed reinvestment. |
2 Smith Barney Money Funds, Inc. 2006 Annual Report
Q. Were there any significant changes to the Funds during the reporting period?
A. Both the Cash Portfolio and Government Portfolio increased their exposure to floating rate securities during the year. This was beneficial to performance as the yield they provided adjusted more quickly to changes in interest rates.
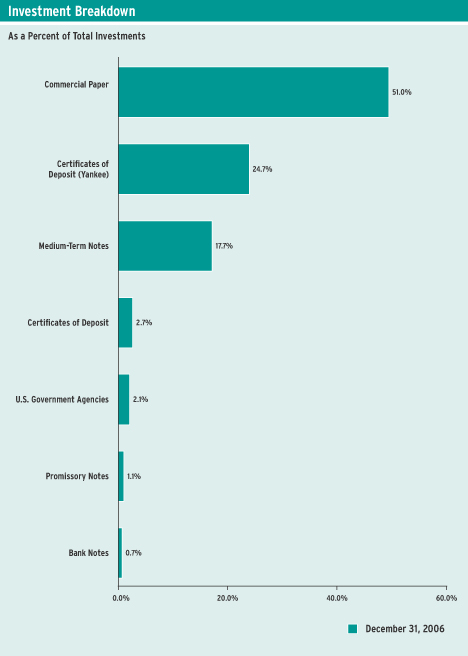
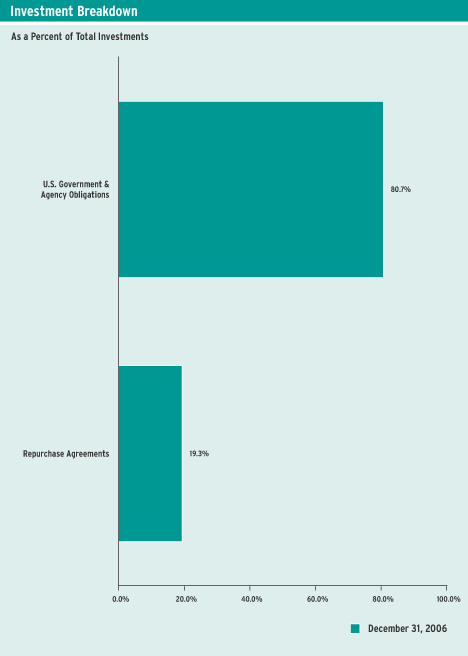
The Cash Portfolio maintained a diversified portfolio during the reporting period, consisting of bank obligations, commercial paper and government agency securities. The Government Portfolio was diversified as well, holding a broad array of U.S. agency securities and U.S. Treasury obligations.
Thank you for your investment in the Smith Barney Money Funds, Inc.—Cash Portfolio and Government Portfolio. As always, we appreciate that you have chosen us to manage your assets and we remain focused on achieving the Funds’ investment goals.
Sincerely,
Western Asset Management Company
January 26, 2007
The information provided is not intended to be a forecast of future events, a guarantee of future results or investment advice. Views expressed may differ from those of the firm as a whole.
RISKS: An investment in a money market fund is neither insured nor guaranteed by the FDIC or any other government agency. Although the Funds seek to preserve the value of your investment at one dollar per share, it is possible to lose money by investing in the Funds. Please see the Funds’ prospectus for more information on these and other risks.
i | The yield curve is the graphical depiction of the relationship between the yield on bonds of the same credit quality but different maturities. |
ii | The Federal Reserve Board is responsible for the formulation of a policy designed to promote economic growth, full employment, stable prices, and a sustainable pattern of international trade and payments. |
iii | Source: The Federal Reserve Board, 1/07. |
iv | The federal funds rate is the interest rate that banks with excess reserves at a Federal Reserve district bank charge other banks that need overnight loans. |
v | A basis point is one one-hundredth (1/100 or 0.01) of one percent. |
vi | Source of all data in this paragraph, Bloomberg, 1/07. |
Smith Barney Money Funds, Inc. 2006 Annual Report 3
Cash Portfolio
4 Smith Barney Money Funds, Inc. 2006 Annual Report
Fund at a Glance (unaudited) (continued)
Government Portfolio
Smith Barney Money Funds, Inc. 2006 Annual Report 5
Example
As a shareholder of the Fund, you may incur two types of costs: (1) transaction costs and (2) ongoing costs, including management fees; distribution and/or service (12b-1) fees; and other Fund expenses. This example is intended to help you understand your ongoing costs (in dollars) of investing in the Fund and to compare these costs with the ongoing costs of investing in other mutual funds.
This example is based on an investment of $1,000 invested on July 1, 2006 and held for the six months ended December 31, 2006.
Actual Expenses
The table below titled “Based on Actual Total Return” provides information about actual account values and actual expenses. You may use the information provided in this table, together with the amount you invested, to estimate the expenses that you paid over the period. To estimate the expenses you paid on your account, divide your ending account value by $1,000 (for example, an $8,600 ending account value divided by $1,000 = 8.6), then multiply the result by the number under the heading entitled “Expenses Paid During the Period.”
| Based on Actual Total Return(1) | |||||||||||||||
| Actual Total Return(2) | Beginning Account Value | Ending Account Value | Annualized Expense Ratio(3) | Expenses Paid During the Period(4) | |||||||||||
Cash Portfolio: | |||||||||||||||
Class A† | 2.44 | % | $ | 1,000.00 | $ | 1,024.40 | 0.51 | % | $ | 2.60 | |||||
Class C | 2.33 | 1,000.00 | 1,023.30 | 0.73 | 3.72 | ||||||||||
Class I(5) | 2.51 | 1,000.00 | 1,025.10 | 0.38 | 1.94 | ||||||||||
Government Portfolio: | |||||||||||||||
Class A | 2.37 | 1,000.00 | 1,023.70 | 0.55 | 2.81 | ||||||||||
Class I(5) | 2.42 | 1,000.00 | 1,024.20 | 0.44 | 2.24 | ||||||||||
(1) | For the six months ended December 31, 2006. |
(2) | Assumes reinvestment of all distributions, including returns of capital, if any, at net asset value. Total return is not annualized, as it may not be representative of the total return for the year. Performance figures may reflect fee waivers and/or expense reimbursements. Past performance is no guarantee of future results. In the absence of fee waivers and/or expense reimbursements, the total return would have been lower. |
(3) | The expense ratios do not include the non-recurring restructuring and/or reorganization fees. |
(4) | Expenses (net of fee waivers and/or expense reimbursements) are equal to each class’ respective annualized expense ratio multiplied by the average account value over the period, multiplied by the number of days in the most recent fiscal half-year, then divided by 365. |
(5) | As of November 20, 2006, Class Y shares were renamed Class I shares. |
6 Smith Barney Money Funds, Inc. 2006 Annual Report
Fund Expenses (unaudited) (continued)
Hypothetical Example for Comparison Purposes
The table below titled “Based on Hypothetical Total Return” provides information about hypothetical account values and hypothetical expenses based on the actual expense ratio and an assumed rate of return of 5.00% per year before expenses, which is not the Fund’s actual return. The hypothetical account values and expenses may not be used to estimate the actual ending account balance or expenses you paid for the period. You may use the information provided in this table to compare the ongoing costs of investing in the Fund and other funds. To do so, compare the 5.00% hypothetical example relating to the Fund with the 5.00% hypothetical examples that appear in the shareholder reports of the other funds.
Please note that the expenses shown in the table below are meant to highlight your ongoing costs only and do not reflect any transactional costs. Therefore, the table is useful in comparing ongoing costs only, and will not help you determine the relative total costs of owning different funds. In addition, if these transaction costs were included, your costs would have been higher.
| Based on Hypothetical Total Return(1) | |||||||||||||||
| Hypothetical Annualized Total Return | Beginning Account Value | Ending Account Value | Annualized Expense Ratio(2) | Expenses Paid During the Period(3) | |||||||||||
Cash Portfolio: | |||||||||||||||
Class A | 5.00 | % | $ | 1,000.00 | $ | 1,022.63 | 0.51 | % | $ | 2.60 | |||||
Class C | 5.00 | 1,000.00 | 1,021.53 | 0.73 | 3.72 | ||||||||||
Class I(4) | 5.00 | 1,000.00 | 1,023.29 | 0.38 | 1.94 | ||||||||||
Government Portfolio: | |||||||||||||||
Class A | 5.00 | 1,000.00 | 1,022.43 | 0.55 | 2.80 | ||||||||||
Class I(4) | 5.00 | 1,000.00 | 1,022.99 | 0.44 | 2.24 | ||||||||||
(1) | For the six months ended December 31, 2006. |
(2) | The expense ratios do not include the non-recurring restructuring and/or reorganization fees. |
(3) | Expenses (net of fee waivers and/or expense reimbursements) are equal to each class’ respective annualized expense ratio multiplied by the average account value over the period, multiplied by the number of days in the most recent fiscal half-year, then divided by 365. |
(4) | As of November 20, 2006, Class Y shares were renamed Class I shares. |
Smith Barney Money Funds, Inc. 2006 Annual Report 7
Schedules of Investments (December 31, 2006)
CASH PORTFOLIO
| Face Amount | Security | Value | |||||
| SHORT-TERM INVESTMENTS — 99.2% | |||||||
| Commercial Paper — 50.6% | |||||||
| $ | 38,000,000 | ABN AMRO North America Finance, 5.335% due 4/5/07 (a) | $ | 37,484,044 | |||
Albis Capital Corp.: | |||||||
| 27,000,000 | 5.390% due 1/26/07 (a) | 26,900,250 | |||||
| 41,000,000 | 5.392% due 3/21/07 (a) | 40,521,348 | |||||
Amstel Funding Corp.: | |||||||
| 150,000,000 | 5.550% due 1/22/07 (a) | 149,527,500 | |||||
| 15,783,000 | 5.431% due 2/2/07 (a) | 15,708,785 | |||||
| 41,922,000 | 5.303% due 5/25/07 (a) | 41,055,053 | |||||
Anglesea Funding: | |||||||
| 93,096,000 | 5.346% due 1/4/07 (a) | 93,054,883 | |||||
| 46,450,000 | 5.398% due 1/5/07 (a) | 46,422,233 | |||||
| 150,000,000 | 5.340% due 1/8/07 (a)(b) | 149,846,583 | |||||
| 66,158,000 | 5.337%-5.373% due 1/12/07 (a) | 66,050,353 | |||||
| 55,000,000 | 5.393% due 1/16/07 (a) | 54,878,771 | |||||
| 100,000,000 | 5.351% due 2/21/07 (a) | 99,252,000 | |||||
| 28,700,000 | 5.375% due 3/12/07 (a) | 28,406,463 | |||||
| 45,000,000 | 5.300% due 7/2/07 (a) | 43,840,433 | |||||
Atlantic Asset Securitization Corp.: | |||||||
| 35,000,000 | 5.348% due 2/26/07 (a) | 34,711,444 | |||||
| 68,391,000 | 5.392% due 3/20/07 (a) | 67,613,052 | |||||
| 88,258,000 | Atlantis One Funding Corp., 5.377% due 3/12/07 (a) | 87,360,465 | |||||
Atomium Funding Corp.: | |||||||
| 32,600,000 | 5.351% due 1/30/07 (a) | 32,461,341 | |||||
| 76,223,000 | 5.339% due 2/12/07 (a) | 75,754,356 | |||||
| 80,000,000 | 5.353% due 2/23/07 (a) | 79,378,133 | |||||
Bank of America Corp.: | |||||||
| 25,000,000 | 5.297% due 3/1/07 (a) | 24,785,715 | |||||
| 79,500,000 | 5.326% due 4/17/07 (a) | 78,280,426 | |||||
| 75,000,000 | 5.337% due 6/4/07 (a) | 73,328,459 | |||||
| 100,000,000 | 5.250% due 6/5/07 (a) | 97,798,139 | |||||
| 25,675,000 | Barton Capital Corp., 5.331% due 1/18/07 (a) | 25,610,984 | |||||
Bavaria TRR Corp.: | |||||||
| 78,530,000 | 5.369% due 1/5/07 (a) | 78,483,318 | |||||
| 207,825,000 | 3.356%-5.371% due 1/8/07 (a) | 207,609,395 | |||||
| 98,900,000 | 5.407% due 1/22/07 (a) | 98,589,619 | |||||
| 75,000,000 | 5.393% due 1/25/07 (a) | 74,731,500 | |||||
Bear Stearns Co.: | |||||||
| 64,500,000 | 5.341% due 4/20/07 (a) | 63,482,530 | |||||
Beethoven Funding Corp.: | |||||||
| 120,894,000 | 5.329% due 1/16/07 (a) | 120,627,530 | |||||
| 145,705,000 | 5.341% due 1/24/07 (a) | 145,212,558 | |||||
| 21,119,000 | 5.347% due 1/31/07 (a) | 21,025,900 | |||||
| 50,425,000 | 5.375% due 2/15/07 (a) | 50,089,044 | |||||
| 42,132,000 | 5.366% due 3/14/07 (a) | 41,685,401 | |||||
See Notes to Financial Statements.
8 Smith Barney Money Funds, Inc. 2006 Annual Report
Schedules of Investments (December 31, 2006) (continued)
| Face Amount | Security | Value | |||||
| Commercial Paper — 50.6% (continued) | |||||||
| $ | 68,050,000 | Belmont Funding LLC, 5.353% due 2/13/07 (a) | $ | 67,618,393 | |||
Berkeley Square Finance LLC: | |||||||
| 71,637,000 | 5.346% due 1/5/07 (a) | 71,594,814 | |||||
| 95,325,000 | 5.350% due 1/11/07 (a) | 95,183,998 | |||||
| 100,000,000 | 5.359% due 2/20/07 (a) | 99,262,500 | |||||
Brahms Funding Corp.: | |||||||
| 50,000,000 | 5.347% due 1/5/07 (a) | 49,970,528 | |||||
| 35,716,000 | 5.354% due 1/12/07 (a) | 35,658,051 | |||||
| 35,500,000 | 5.350% due 1/22/07 (a) | 35,390,246 | |||||
| 31,663,000 | 5.344% due 1/25/07 (a) | 31,551,124 | |||||
| 100,000,000 | 5.368% due 1/26/07 (a) | 99,630,555 | |||||
| 74,973,000 | 5.355% due 2/2/07 (a) | 74,619,127 | |||||
Carrera Capital Financial Ltd.: | |||||||
| 12,939,000 | 5.340% due 1/29/07 (a) | 12,885,864 | |||||
| 4,173,000 | 5.387% due 2/5/07 (a) | 4,151,295 | |||||
| 28,800,000 | 5.354% due 3/5/07 (a) | 28,532,880 | |||||
Chesham Finance LLC: | |||||||
| 75,000,000 | 5.574% due 1/12/07 (a) | 74,875,792 | |||||
| 150,000,000 | 5.300% due 2/9/07 | 149,995,091 | |||||
| 95,000,000 | 5.400% due 2/28/07 (a)(b) | 94,195,387 | |||||
| 182,854,000 | 5.320%-5.350% due 3/5/07 (a) | 181,169,325 | |||||
| 85,000,000 | 5.358% due 3/15/07 (a) | 84,088,210 | |||||
| 50,000,000 | 5.305% due 7/18/07 | 49,990,668 | |||||
| 25,000,000 | 5.310% due 7/26/07 | 24,995,774 | |||||
| 91,000,000 | 5.239% due 8/27/07 (a) | 87,967,880 | |||||
Cheyne Finance LLC: | |||||||
| 9,300,000 | 5.364% due 2/13/07 (a)(b) | 9,241,459 | |||||
| 39,750,000 | 5.338% due 4/18/07 (a)(b) | 39,130,916 | |||||
| 50,000,000 | 5.325% due 6/25/07 (b)(c) | 49,996,452 | |||||
| 42,718,000 | Cobbler Funding LLC, 5.356% due 3/15/07 (a) | 42,259,767 | |||||
Concord Minuteman Capital Co.: | |||||||
| 252,803,000 | 5.345% due 1/11/07 (a) | 252,430,116 | |||||
| 84,300,000 | 5.583% due 1/12/07 (a) | 84,160,132 | |||||
| 150,434,000 | 5.369% due 1/19/07 (a) | 150,037,606 | |||||
| 49,000,000 | Credit Suisse Securities USA, 5.553% due 1/19/07 (a)(b) | 48,867,700 | |||||
Crown Point Capital Co.: | |||||||
| 26,767,000 | 5.552% due 1/12/07 (a) | 26,722,834 | |||||
| 209,420,000 | 5.363% due 1/17/07 (a) | 208,929,492 | |||||
| 144,242,000 | 5.392% due 3/7/07 (a) | 142,874,706 | |||||
Cullinan Finance Corp.: | |||||||
| 21,333,000 | 5.402% due 1/30/07 (a)(b) | 21,242,436 | |||||
| 52,000,000 | 5.362% due 4/18/07 (a) | 51,193,220 | |||||
| 25,000,000 | 5.351% due 4/25/07 (a) | 24,587,146 | |||||
Curzon Funding LLC: | |||||||
| 36,000,000 | 5.328% due 2/9/07 (a) | 35,794,860 | |||||
| 150,000,000 | 5.408% due 2/28/07 (a) | 148,727,625 | |||||
See Notes to Financial Statements.
Smith Barney Money Funds, Inc. 2006 Annual Report 9
Schedules of Investments (December 31, 2006) (continued)
| Face Amount | Security | Value | |||||
| Commercial Paper — 50.6% (continued) | |||||||
| $ | 45,000,000 | 5.387% due 3/13/07 (a) | $ | 44,534,063 | |||
| 55,000,000 | 5.372% due 4/19/07 (a) | 54,137,050 | |||||
| 40,000,000 | 5.280% due 6/1/07 (a) | 39,136,783 | |||||
East-Fleet Finance LLC: | |||||||
| 71,300,000 | 5.413% due 1/4/07 (a) | 71,267,915 | |||||
| 100,000,000 | 5.355% due 1/5/07 (a) | 99,940,778 | |||||
| 40,408,000 | 5.355% due 1/11/07 (a) | 40,348,174 | |||||
| 44,849,000 | 5.357% due 1/16/07 (a) | 44,749,398 | |||||
| 50,000,000 | 5.320% due 1/25/07 | 49,999,348 | |||||
| 100,000,000 | 5.310% due 5/15/07 | 99,990,746 | |||||
Ebbets PLC: | |||||||
| 65,000,000 | 5.361% due 3/19/07 (a) | 64,264,543 | |||||
| 10,500,000 | 5.214% due 8/28/07 (a) | 10,150,064 | |||||
| 75,000,000 | 5.334% due 9/14/07 (a) | 72,264,000 | |||||
Ebury Finance Ltd.: | |||||||
| 17,000,000 | 5.353% due 1/3/07 (a) | 16,994,985 | |||||
| 75,000,000 | 5.553% due 1/17/07 (a) | 74,820,000 | |||||
| 25,000,000 | 5.448% due 2/16/07 (a) | 24,830,694 | |||||
| 50,000,000 | 5.448% due 2/22/07 (a) | 49,617,222 | |||||
| 100,000,000 | 5.403% due 2/28/07 (a) | 99,152,556 | |||||
| 20,932,000 | 5.367% due 3/14/07 (a) | 20,710,121 | |||||
| 195,000,000 | 5.337%-5.392% due 3/19/07 (a) | 192,820,472 | |||||
| 30,000,000 | 5.377% due 4/17/07 (a) | 29,537,575 | |||||
| 25,000,000 | 5.377% due 4/20/07 (a) | 24,603,740 | |||||
| 45,000,000 | 5.305% due 6/27/07 (a) | 43,871,625 | |||||
| 76,000,000 | 5.305% due 7/5/07 (a) | 74,008,167 | |||||
Fenway Funding LLC: | |||||||
| 21,770,000 | 5.453% due 1/2/07 (a) | 21,766,704 | |||||
| 50,000,000 | 5.372% due 1/12/07 (a) | 49,918,722 | |||||
| 198,950,000 | 5.361% due 1/23/07 (a) | 198,304,407 | |||||
| 119,600,000 | 5.358% due 2/16/07 (a) | 118,790,042 | |||||
| 100,000,000 | 5.361% due 2/28/07 (a) | 99,146,111 | |||||
| 53,050,000 | Foxboro Funding Ltd., 5.349% due 1/3/07 (a) | 53,034,321 | |||||
General Electric Capital Corp.: | |||||||
| 150,000,000 | 5.402% due 2/5/07 (a) | 149,232,917 | |||||
| 150,000,000 | 5.335% due 6/19/07 (a) | 146,387,625 | |||||
Georgetown Funding Co. LLC: | |||||||
| 20,007,000 | 5.354% due 1/4/07 (a) | 19,998,130 | |||||
| 69,600,000 | 5.334% due 1/16/07 (a) | 69,446,300 | |||||
| 141,000,000 | 5.354% due 1/17/07 (a) | 140,666,614 | |||||
| 156,595,000 | 5.409% due 1/24/07 (a) | 156,056,748 | |||||
| 25,000,000 | Grampian Funding LLC, 5.328% due 3/21/07 (a) | 24,715,271 | |||||
| 38,000,000 | Greyhawk Capital Corp., 5.319% due 3/26/07 (a) | 37,536,273 | |||||
Harwood Street Funding I: | |||||||
| 48,500,000 | 5.353% due 1/5/07 (a) | 48,471,277 | |||||
| 42,300,000 | 5.348% due 1/9/07 (a) | 42,249,992 | |||||
| 50,000,000 | 5.370% due 2/9/07 (a) | 49,711,292 | |||||
See Notes to Financial Statements.
10 Smith Barney Money Funds, Inc. 2006 Annual Report
Schedules of Investments (December 31, 2006) (continued)
| Face Amount | Security | Value | |||||
| Commercial Paper — 50.6% (continued) | |||||||
| $ | 15,000,000 | HBOS Treasury Services PLC, 5.318% due 3/5/07 (a) | $ | 14,863,500 | |||
Kaiserplatz Delaware: | |||||||
| 65,000,000 | 5.348% due 1/12/07 (a) | 64,895,133 | |||||
| 100,000,000 | 5.347% due 3/21/07 (a) | 98,843,528 | |||||
| 85,000,000 | 5.340% due 4/4/07 (a) | 83,858,167 | |||||
| 20,886,000 | Kestrel Funding PLC, 5.324% due 2/27/07 (a) | 20,712,054 | |||||
| 134,330,000 | KKR Pacific Funding Trust, 5.385% due 1/22/07 (a) | 133,909,994 | |||||
| 15,000,000 | Market Street Funding Corp., 5.325% due 1/26/07 (a) | 14,944,948 | |||||
| 24,500,000 | Merrill Lynch & Co., 5.305% due 7/18/07 (a) | 23,811,428 | |||||
| 233,500,000 | Mica Funding LLC, 5.344%-5.359% due 1/12/07 (a) | 233,119,592 | |||||
Mint II LLC: | |||||||
| 70,000,000 | 5.392% due 1/25/07 (a) | 69,750,800 | |||||
| 101,350,000 | 5.405% due 2/27/07 (a) | 100,496,295 | |||||
| 63,000,000 | 5.428% due 2/27/07 (a) | 62,471,325 | |||||
| 100,000,000 | 5.370% due 3/28/07 (a) | 98,749,417 | |||||
| 40,000,000 | 5.395% due 3/29/07 (a) | 39,488,633 | |||||
| 100,000,000 | Morgan Stanley Dean Witter, 5.360% due 3/8/07 | 100,000,000 | |||||
Morrigan TRR Funding LLC: | |||||||
| 25,000,000 | 5.412% due 1/3/07 (a) | 24,992,500 | |||||
| 111,610,000 | 5.356% due 1/12/07 (a) | 111,428,572 | |||||
| 60,000,000 | 5.377% due 1/16/07 (a) | 59,866,250 | |||||
| 5,000,000 | 5.397% due 1/16/07 (a) | 4,988,813 | |||||
| 100,000,000 | 5.363% due 1/22/07 (a) | 99,689,667 | |||||
| 100,000,000 | 5.340% due 2/9/07 (c) | 99,998,940 | |||||
| 98,500,000 | 5.374% due 3/23/07 (a) | 97,325,387 | |||||
| 75,000,000 | 5.322% due 7/27/07 (a) | 72,792,000 | |||||
| 55,500,000 | 5.308% due 8/6/07 (a) | 53,790,492 | |||||
| 125,000,000 | 5.270% due 8/28/07 (a) | 120,792,604 | |||||
| 50,000,000 | 5.270% due 8/31/07 (a) | 48,295,917 | |||||
| 35,000,000 | Nestle Capital Corp., 5.287% due 8/13/07 (a) | 33,888,244 | |||||
| 44,300,000 | New Center Asset Trust, 5.293% due 5/3/07 (a) | 43,522,338 | |||||
North Lake Capital: | |||||||
| 49,083,000 | 5.385% due 1/5/07 (a) | 49,053,823 | |||||
| 100,000,000 | 5.391% due 1/12/07 (a) | 99,836,222 | |||||
| 53,150,000 | 5.382% due 1/26/07 (a) | 52,952,902 | |||||
| 46,600,000 | 5.375% due 2/9/07 (a) | 46,330,924 | |||||
North Sea Funding LLC: | |||||||
| 30,000,000 | 5.371% due 1/9/07 (a) | 29,964,333 | |||||
| 55,000,000 | 5.386% due 1/22/07 (a) | 54,828,033 | |||||
| 35,000,000 | Nyala Funding LLC, 5.341% due 2/15/07 (a) | 34,769,437 | |||||
Orion Financial LLC: | |||||||
| 46,300,000 | 5.586% due 1/11/07 (a) | 46,230,164 | |||||
| 38,650,000 | 5.341% due 5/16/07 (a) | 37,896,325 | |||||
Ormond Quay Funding LLC: | |||||||
| 143,000,000 | 5.333% due 1/8/07 (a) | 142,853,048 | |||||
| 228,950,000 | 5.334%-5.339% due 1/22/07 (a) | 228,243,498 | |||||
See Notes to Financial Statements.
Smith Barney Money Funds, Inc. 2006 Annual Report 11
Schedules of Investments (December 31, 2006) (continued)
| Face Amount | Security | Value | |||||
| Commercial Paper — 50.6% (continued) | |||||||
| $ | 100,000,000 | 5.310% due 1/29/07 (c) | $ | 99,997,669 | |||
| 73,750,000 | 5.336% due 2/22/07 (a) | 73,187,533 | |||||
Perry Global Funding LLC: | |||||||
| 50,000,000 | 5.588% due 1/10/07 (a) | 49,932,000 | |||||
| 90,000,000 | 5.316% due 3/13/07 (a) | 89,069,900 | |||||
Polonius Inc.: | |||||||
| 48,000,000 | 5.421% due 1/8/07 (a)(b) | 47,950,533 | |||||
| 66,099,000 | 5.388% due 1/10/07 (a) | 66,010,262 | |||||
| 30,000,000 | Santander Centro Hispano LLC, 5.403% due 2/14/07 (a) | 29,807,133 | |||||
| 44,945,000 | Scaldis Capital LLC, 5.397% due 1/25/07 (a) | 44,786,794 | |||||
| 100,000,000 | Sigma Financial Inc., 5.267% due 6/27/07 (a)(b) | 97,509,708 | |||||
Societe Generale North America: | |||||||
| 18,000,000 | 5.351% due 4/19/07 (a) | 17,718,660 | |||||
| 130,000,000 | 5.250% due 7/27/07 (a) | 126,222,882 | |||||
| 82,500,000 | 5.297% due 8/13/07 (a) | 79,884,567 | |||||
| 30,000,000 | 5.226% due 8/27/07 (a) | 29,002,383 | |||||
| 80,000,000 | Solitaire Funding LLC, 5.368% due 3/2/07 (a) | 79,302,667 | |||||
Stanfield Victoria Finance Ltd.: | |||||||
| 50,000,000 | 5.554% due 1/22/07 (a) | 49,842,500 | |||||
| 100,000,000 | 5.501% due 1/29/07 (a) | 99,583,889 | |||||
| 41,000,000 | 5.259% due 8/24/07 (a) | 39,645,480 | |||||
| 61,050,000 | Strand Capital LLC, 5.377% due 1/5/07 (a) | 61,013,981 | |||||
Stratford Receivables Co. LLC: | |||||||
| 49,350,000 | 5.333% due 1/8/07 (a) | 49,299,142 | |||||
| 18,635,000 | 5.355% due 1/26/07 (a) | 18,566,219 | |||||
| 137,812,000 | 5.369% due 2/8/07 (a) | 137,036,655 | |||||
| 85,000,000 | Svenska Handlesbanken Inc., 5.499% due 2/2/07 (a) | 84,595,778 | |||||
Tasman Funding Inc.: | |||||||
| 78,053,000 | 5.344% due 1/12/07 (a) | 77,926,121 | |||||
| 100,000,000 | 5.381% due 1/22/07 (a) | 99,687,333 | |||||
| 100,000,000 | Thornburg Mortgage Capital Resource, 5.330% due 6/4/07 | 99,995,834 | |||||
| 78,400,000 | UBS Finance Delaware LLC, 5.430% due 2/5/07 (a) | 77,997,166 | |||||
| 44,800,000 | Westpac Banking Corp., 5.429% due 1/25/07 (a) | 44,642,005 | |||||
| 21,443,000 | White Pine Finance LLC, 5.329% due 1/16/07 (a)(b) | 21,395,825 | |||||
Windsor Funding Trust: | |||||||
| 30,350,000 | 5.361% due 3/13/07 (a) | 30,033,357 | |||||
| 50,000,000 | 5.362% due 3/14/07 (a) | 49,471,000 | |||||
Total Commercial Paper | 12,853,634,965 | ||||||
| Bank Notes — 0.7% | |||||||
Bank of America NA, Charlotte, NC: | |||||||
| 100,000,000 | 5.330% due 2/15/07 | 100,000,000 | |||||
| 70,000,000 | 5.310% due 1/24/07 | 70,000,000 | |||||
Total Bank Notes | 170,000,000 | ||||||
See Notes to Financial Statements.
12 Smith Barney Money Funds, Inc. 2006 Annual Report
Schedules of Investments (December 31, 2006) (continued)
| Face Amount | Security | Value | |||||
| Certificates of Deposit — 2.7% | |||||||
Bank of America NA: | |||||||
| $ | 150,000,000 | 5.310% due 1/10/07 | $ | 150,000,000 | |||
| 100,000,000 | 5.320% due 3/21/07 | 100,000,000 | |||||
| 100,000,000 | 5.320% due 3/22/07 | 100,000,000 | |||||
Wells Fargo Bank NA: | |||||||
| 90,000,000 | 4.800% due 1/16/07 | 90,001,026 | |||||
| 84,000,000 | 4.790% due 1/18/07 | 83,970,729 | |||||
| 87,000,000 | 4.800% due 1/29/07 | 86,997,420 | |||||
| 55,000,000 | 4.860% due 1/31/07 | 55,000,000 | |||||
| 10,000,000 | 4.865% due 1/31/07 | 9,999,960 | |||||
Total Certificates of Deposit | 675,969,135 | ||||||
| Certificates of Deposit (Yankee) — 24.5% | |||||||
| 81,710,000 | Abbey National Treasury Services PLC, 5.280% due 1/4/07 | 81,710,034 | |||||
Bank of Nova Scotia: | |||||||
| 35,000,000 | 4.860% due 1/30/07 | 34,999,445 | |||||
| 38,000,000 | 5.290% due 3/6/07 | 38,000,000 | |||||
| 50,000,000 | Bank of Tokyo, 5.370% due 3/19/07 | 50,000,000 | |||||
Barclays Bank PLC NY: | |||||||
| 100,000,000 | 5.320% due 1/22/07 | 100,000,000 | |||||
| 75,000,000 | 5.310% due 1/30/07 | 75,000,000 | |||||
| 93,000,000 | 5.320% due 1/30/07 | 93,000,000 | |||||
| 60,400,000 | 5.430% due 2/5/07 | 60,400,000 | |||||
| 49,500,000 | 5.320% due 2/7/07 | 49,500,000 | |||||
| 38,000,000 | 5.320% due 2/12/07 | 38,000,000 | |||||
| 75,000,000 | 5.330% due 2/14/07 | 75,000,000 | |||||
| 132,000,000 | 5.320% due 2/20/07 | 132,000,000 | |||||
| 100,000,000 | 5.310% due 3/14/07 | 100,000,000 | |||||
| 100,000,000 | 5.320% due 6/27/07 | 100,000,000 | |||||
BNP Paribas NY Branch: | |||||||
| 45,000,000 | 5.455% due 1/31/07 | 45,000,000 | |||||
| 100,690,000 | 5.320% due 2/14/07 | 100,690,018 | |||||
| 100,000,000 | 5.330% due 3/13/07 | 100,000,000 | |||||
| 55,750,000 | 5.345% due 3/20/07 | 55,750,000 | |||||
| 130,000,000 | 5.350% due 4/23/07 | 129,999,061 | |||||
| 100,000,000 | 5.255% due 5/7/07 | 100,000,000 | |||||
| 89,500,000 | 5.285% due 5/11/07 | 89,500,000 | |||||
| 145,000,000 | 5.320% due 5/29/07 | 145,000,000 | |||||
Calyon NY: | |||||||
| 91,000,000 | 5.320% due 2/9/07 | 91,000,000 | |||||
| 150,000,000 | 5.320% due 2/12/07 | 150,000,000 | |||||
| 100,000,000 | 5.310% due 3/1/07 | 100,000,000 | |||||
| 43,500,000 | 5.095% due 3/6/07 | 43,470,096 | |||||
| 63,500,000 | 5.200% due 3/30/07 | 63,495,577 | |||||
| 50,000,000 | 5.346% due 7/30/07 | 50,001,388 | |||||
Canadian Imperial Bank: | |||||||
| 150,000,000 | 5.340% due 2/9/07 | 150,000,000 | |||||
| 125,000,000 | 5.230% due 8/29/07 | 125,000,000 | |||||
See Notes to Financial Statements.
Smith Barney Money Funds, Inc. 2006 Annual Report 13
Schedules of Investments (December 31, 2006) (continued)
| Face Amount | Security | Value | |||||
| Certificates of Deposit (Yankee) — 24.5% (continued) | |||||||
Credit Suisse New York: | |||||||
| $ | 48,000,000 | 5.310% due 1/3/07 | $ | 48,000,000 | |||
| 143,000,000 | 5.300% due 1/12/07 | 143,000,000 | |||||
| 75,000,000 | 5.356% due 8/13/07 | 75,000,000 | |||||
Depfa Bank PLC: | |||||||
| 38,000,000 | 5.300% due 1/22/07 | 38,000,000 | |||||
| 44,000,000 | 5.325% due 2/9/07 | 44,000,000 | |||||
| 50,000,000 | 5.320% due 2/16/07 | 50,000,000 | |||||
| 100,000,000 | 5.330% due 2/26/07 | 100,002,207 | |||||
| 100,000,000 | 5.285% due 6/26/07 | 100,000,000 | |||||
| 50,000,000 | 5.330% due 7/30/07 | 50,000,000 | |||||
Deutsche Bank NY: | |||||||
| 100,000,000 | 5.320% due 1/22/07 | 100,000,000 | |||||
| 105,000,000 | 5.290% due 2/26/07 | 105,000,000 | |||||
| 136,400,000 | 5.250% due 8/2/07 | 136,400,000 | |||||
| 117,000,000 | 5.400% due 12/12/07 | 117,000,000 | |||||
Dexia Credit Local NY: | |||||||
| 250,000,000 | 5.285% due 1/5/07 | 250,000,000 | |||||
| 49,000,000 | 5.370% due 10/26/07 | 49,022,025 | |||||
| 142,000,000 | Dresdner Bank NY, 5.320% due 2/9/07 | 142,000,000 | |||||
Fortis Bank NY: | |||||||
| 100,000,000 | 5.280% due 1/5/07 | 100,000,055 | |||||
| 97,000,000 | 5.300% due 3/5/07 | 97,000,000 | |||||
| 93,000,000 | 5.225% due 4/4/07 | 93,000,000 | |||||
| 100,000,000 | 5.270% due 12/12/07 | 99,981,302 | |||||
HBOS Treasury Services NY: | |||||||
| 35,500,000 | 4.770% due 1/3/07 | 35,498,484 | |||||
| 89,200,000 | 5.255% due 4/5/07 | 89,201,106 | |||||
| 58,000,000 | 5.540% due 6/20/07 | 58,026,933 | |||||
Lloyds TSB Bank PLC NY: | |||||||
| 40,000,000 | 5.300% due 1/19/07 | 40,000,000 | |||||
| 89,000,000 | 5.295% due 1/23/07 | 89,087,800 | |||||
| 100,000,000 | Natexis Banque Populaires NY, 5.340% due 4/5/07 | 100,000,000 | |||||
| 22,500,000 | Nordea Bank Finland NY, 5.350% due 5/21/07 | 22,482,124 | |||||
| 7,000,000 | Rabobank Nederland NY, 5.050% due 3/7/07 | 6,994,329 | |||||
Royal Bank of Canada NY: | |||||||
| 23,000,000 | 5.300% due 3/1/07 | 23,000,000 | |||||
| 41,500,000 | 5.340% due 3/21/07 | 41,500,000 | |||||
| 143,000,000 | Royal Bank of Scotland NY, 5.310% due 1/29/07 | 143,000,000 | |||||
| 143,500,000 | Svenska Handelsbanken NY, 5.310% due 3/1/07 | 143,500,000 | |||||
Toronto Dominion Bank NY: | |||||||
| 70,000,000 | 5.535% due 1/26/07 | 70,002,955 | |||||
| 149,000,000 | 5.420% due 2/12/07 | 149,002,422 | |||||
| 61,500,000 | 5.230% due 3/30/07 | 61,500,000 | |||||
See Notes to Financial Statements.
14 Smith Barney Money Funds, Inc. 2006 Annual Report
Schedules of Investments (December 31, 2006) (continued)
| Face Amount | Security | Value | |||||
| Certificates of Deposit (Yankee) — 24.5% (continued) | |||||||
UBS AG Stamford CT: | |||||||
| $ | 92,350,000 | 5.300% due 1/5/07 | $ | 92,350,000 | |||
| 103,500,000 | 5.305% due 1/9/07 | 103,500,000 | |||||
| 30,000,000 | 5.310% due 1/22/07 | 29,999,604 | |||||
| 5,000,000 | 5.270% due 2/9/07 | 4,998,857 | |||||
Unicredito Italiano SpA NY: | |||||||
| 95,000,000 | 5.420% due 2/20/07 | 95,003,250 | |||||
| 90,600,000 | 5.390% due 3/1/07 | 90,603,468 | |||||
| 4,000,000 | 5.370% due 3/7/07 | 3,999,628 | |||||
| 41,000,000 | 5.385% due 3/12/07 | 41,000,326 | |||||
| 25,000,000 | 5.330% due 7/31/07 | 25,000,000 | |||||
| 135,000,000 | 5.290% due 8/16/07 | 135,000,000 | |||||
| 24,500,000 | 5.395% due 10/29/07 | 24,535,694 | |||||
Total Certificates of Deposit (Yankee) | 6,222,708,188 | ||||||
| Medium-Term Notes — 17.5% | |||||||
| 40,000,000 | Arlo III, Ltd., 5.510% due 10/26/07 (b)(c) | 40,035,389 | |||||
Bear Stearns Co.: | |||||||
| 98,250,000 | 5.393% due 3/1/07 | 98,250,000 | |||||
Carrera Capital Finance LLC: | |||||||
| 80,000,000 | 5.330% due 10/11/07 (b)(c) | 79,993,797 | |||||
| 50,000,000 | 5.340% due 12/17/07 (b)(c) | 49,995,422 | |||||
Cheyne Finance LLC: | |||||||
| 100,000,000 | 5.330% due 6/5/07 (b)(c) | 99,993,630 | |||||
| 75,000,000 | 5.315% due 6/15/07 (b)(c) | 74,989,829 | |||||
| 100,000,000 | 5.084% due 7/25/07 (b)(c) | 99,988,767 | |||||
| 150,000,000 | 5.315% due 9/17/07 (b)(c) | 149,973,853 | |||||
| 50,000,000 | 5.320% due 10/9/07 (b)(c) | 49,992,423 | |||||
| 50,000,000 | 5.324% due 10/25/07 (b)(c) | 49,993,490 | |||||
Notes: | |||||||
| 100,000,000 | 5.323% due 7/16/07 (b)(c) | 99,989,231 | |||||
| 100,000,000 | 5.320% due 9/6/07 (b)(c) | 99,986,595 | |||||
Cullinan Finance Corp.: | |||||||
| 100,000,000 | 5.310% due 3/26/07 (b)(c) | 99,993,038 | |||||
| 175,000,000 | 5.320% due 11/15/07 (b)(c) | 174,984,753 | |||||
| 300,000,000 | General Electric Capital Corp., 5.475% due 6/15/07 (c) | 300,000,000 | |||||
| 50,000,000 | Harrier Finance Funding LLC, 5.315% due 4/11/07 (b)(c) | 49,995,285 | |||||
K2 USA LLC: | |||||||
| 125,000,000 | 5.320% due 10/18/07 (b)(c) | 124,982,690 | |||||
| 50,000,000 | 5.320% due 11/8/07 (b)(c) | 49,993,703 | |||||
Notes: | |||||||
| 80,000,000 | 5.325% due 8/28/07 (b)(c) | 79,992,326 | |||||
| 200,000,000 | 5.325% due 9/4/07 (b)(c) | 199,986,631 | |||||
| 150,000,000 | 5.325% due 9/4/07 (b)(c) | 149,989,863 | |||||
| 110,000,000 | 5.325% due 9/28/07 (b)(c) | 109,991,841 | |||||
See Notes to Financial Statements.
Smith Barney Money Funds, Inc. 2006 Annual Report 15
Schedules of Investments (December 31, 2006) (continued)
| Face Amount | Security | Value | |||||
| Medium-Term Notes — 17.5% (continued) | |||||||
Kestrel Funding US LLC: | |||||||
| $ | 80,000,000 | 5.320% due 9/12/07 (b)(c) | $ | 79,988,639 | |||
| 100,000,000 | 5.328% due 11/7/07 (b)(c) | 99,991,507 | |||||
Orion Financial LLC: | |||||||
| 100,000,000 | 5.303% due 8/15/07 | 99,980,014 | |||||
Premier Asset Collateralized Entity LLC: | |||||||
| 53,250,000 | 5.330% due 1/25/07 (b)(c) | 53,249,273 | |||||
| 55,000,000 | 5.330% due 3/15/07 (b)(c) | 55,000,000 | |||||
| 50,000,000 | 5.330% due 5/25/07 (b)(c) | 49,998,027 | |||||
| 50,000,000 | 5.335% due 7/25/07 (b)(c) | 50,000,000 | |||||
| 75,000,000 | 5.330% due 11/26/07 (b)(c) | 75,000,000 | |||||
| 175,000,000 | Sigma Financial Inc., 5.320% due 11/16/07 (b)(c) | 174,984,747 | |||||
Stanfield Victoria Finance: | |||||||
| 100,000,000 | 4.780% due 1/16/07 (b) | 99,999,392 | |||||
| 100,000,000 | 5.320% due 7/6/07 (b)(c) | 99,989,836 | |||||
| 50,000,000 | 5.325% due 10/5/07 (b)(c) | 49,994,324 | |||||
| 100,000,000 | 5.320% due 11/1/07 (b)(c) | 99,983,343 | |||||
| 75,000,000 | 5.320% due 11/3/07 (b)(c) | 74,987,425 | |||||
| 100,000,000 | 5.320% due 11/13/07 (b)(c) | 99,985,014 | |||||
| 100,000,000 | 5.320% due 11/26/07 (b)(c) | 99,986,704 | |||||
| 100,000,000 | Tango Finance Corp., 5.315% due 11/28/07 (b)(c) | 99,981,863 | |||||
Whistlejacket Capital Ltd.: | |||||||
| 50,000,000 | 5.320% due 10/19/07 (b)(c) | 49,992,027 | |||||
| 75,000,000 | 5.320% due 11/15/07 (b)(c) | 74,987,447 | |||||
White Pine Finance LLC: | |||||||
| 60,000,000 | 5.320% due 9/6/07 (b)(c) | 59,993,885 | |||||
| 60,000,000 | 5.320% due 9/12/07 (b)(c) | 59,993,737 | |||||
| 200,000,000 | 5.320% due 9/17/07 (b)(c) | 199,978,828 | |||||
| 70,000,000 | 5.320% due 9/21/07 (b)(c) | 69,990,109 | |||||
| 100,000,000 | 5.320% due 10/25/07 (b)(c) | 99,983,726 | |||||
| 40,000,000 | Notes, 5.320% due 9/27/07 (b)(c) | 39,994,104 | |||||
Total Medium-Term Notes | 4,451,106,527 | ||||||
| Promissory Notes — 1.1% | |||||||
Goldman Sachs Group Inc.: | |||||||
| 200,000,000 | 5.430% due 5/21/07 (c) | 200,000,000 | |||||
| 75,000,000 | 5.340% due 8/13/07 | 75,000,000 | |||||
Total Promissory Notes | 275,000,000 | ||||||
| U.S. Government Agencies — 2.1% | |||||||
Federal Home Loan Mortgage Corp. (FHLMC), Discount Notes: | |||||||
| 140,000,000 | 4.742% due 1/17/07 (a) | 139,718,133 | |||||
| 49,200,000 | 5.145% due 8/3/07 (a) | 47,746,441 | |||||
| 71,090,000 | 5.096%-5.101% due 12/11/07 (a) | 67,793,799 | |||||
Series RB: | |||||||
| 32,769,000 | 5.204% due 4/17/07 (a) | 32,291,392 | |||||
| 18,657,000 | 5.085% due 8/21/07 (a) | 18,067,252 | |||||
See Notes to Financial Statements.
16 Smith Barney Money Funds, Inc. 2006 Annual Report
Schedules of Investments (December 31, 2006) (continued)
| Face Amount | Security | Value | |||||
| U.S. Government Agencies — 2.1% (continued) | |||||||
Federal National Mortgage Association (FNMA): | |||||||
Discount Notes: | |||||||
| $ | 50,000,000 | 4.821% due 1/26/07 (a) | $ | 49,840,278 | |||
| 23,000,000 | 4.958% due 2/23/07 (a) | 22,840,006 | |||||
| 43,000,000 | 5.111% due 3/6/07 (a) | 42,626,951 | |||||
| 33,500,000 | 5.123% due 3/30/07 (a) | 33,100,792 | |||||
| 75,000,000 | Notes, 5.225% due 6/21/07 (c) | 74,986,300 | |||||
| Total U.S. Government Agencies | 529,011,344 | ||||||
| TOTAL INVESTMENTS — 99.2% (Cost — $25,177,430,159#) | 25,177,430,159 | ||||||
Other Assets in Excess of Liabilities — 0.8% | 204,451,719 | ||||||
| TOTAL NET ASSETS — 100.0% | $ | 25,381,881,878 | |||||
(a) | Rate shown represents yield-to-maturity. |
(b) | Security is exempt from registration under Rule 144A of the Securities Act of 1933. This security may be resold in transactions that are exempt from registration, normally to qualified institutional buyers. This security has been deemed liquid pursuant to guidelines approved by the Board of Directors, unless otherwise noted. |
(c) | Variable rate security. Interest rate disclosed is that which is in effect at December 31, 2006. |
| # | Aggregate cost for federal income tax purposes is substantially the same. |
See Notes to Financial Statements.
Smith Barney Money Funds, Inc. 2006 Annual Report 17
Schedules of Investments (December 31, 2006) (continued)
GOVERNMENT PORTFOLIO
Face Amount | Security | Value | |||||
| SHORT-TERM INVESTMENTS — 99.8% | |||||||
| U.S. Government & Agency Obligations — 80.5% | |||||||
| U.S. Government Agencies — 79.8% | |||||||
Federal Farm Credit Bank (FFCB): | |||||||
Bonds: | |||||||
| $ | 75,000,000 | 5.244% due 3/1/07 (a) | $ | 74,999,401 | |||
| 55,000,000 | 5.220% due 7/2/07 (a) | 54,994,612 | |||||
| 35,000,000 | 5.210% due 7/10/07 (a) | 34,995,347 | |||||
| 65,000,000 | 5.210% due 8/6/07 (a) | 64,992,333 | |||||
| 65,000,000 | 5.230% due 1/24/08 (a) | 64,986,583 | |||||
| 75,000,000 | 5.220% due 6/18/08 (a) | 74,989,148 | |||||
Series 1: | |||||||
| 25,000,000 | 5.230% due 12/27/07 (a) | 24,995,210 | |||||
| 70,000,000 | 5.230% due 3/13/08 (a) | 69,983,753 | |||||
Discount Notes: | |||||||
| 15,000,000 | 5.229% due 3/22/07 (b) | 14,827,833 | |||||
| 37,000,000 | 5.226% due 3/27/07 (b) | 36,549,217 | |||||
| 23,680,000 | 5.180% due 5/11/07 (b) | 23,246,459 | |||||
| 23,500,000 | 5.222% due 5/29/07 (b) | 23,006,317 | |||||
| 35,000,000 | 5.210% due 6/13/07 (b) | 34,194,010 | |||||
| 60,000,000 | Series I, 5.209% due 8/1/07 (a) | 59,993,244 | |||||
Federal Home Loan Bank (FHLB): | |||||||
Bonds: | |||||||
| 60,000,000 | 5.230% due 4/5/07 (a) | 59,993,928 | |||||
| 35,000,000 | 5.230% due 2/14/08 (a) | 34,992,412 | |||||
| 85,000,000 | Series 743, 5.216% due 10/24/08 (a) | 84,948,275 | |||||
Discount Notes: | |||||||
| 87,250,000 | 5.218% due 2/21/07 (b) | 86,613,438 | |||||
| 32,117,000 | 5.206% due 3/14/07 (b) | 31,786,195 | |||||
| 35,000,000 | 5.189% due 3/29/07 (b) | 34,570,317 | |||||
| 12,000,000 | 5.163% due 4/9/07 (b) | 11,835,687 | |||||
| 50,000,000 | Series I, 5.230% due 7/6/07 (a) | 49,990,049 | |||||
| 40,000,000 | Global Bonds, 4.625% due 7/18/07 | 39,864,961 | |||||
Federal Home Loan Mortgage Corp. (FHLMC): | |||||||
Discount Notes: | |||||||
| 15,000,000 | 4.655% due 1/9/07 (b) | 14,985,167 | |||||
| 45,000,000 | 4.764% due 1/17/07 (b) | 44,909,000 | |||||
| 83,150,000 | 5.230% due 1/23/07 (b) | 82,885,260 | |||||
| 25,000,000 | 4.981% due 2/16/07 (b) | 24,848,264 | |||||
| 26,744,000 | 5.262% due 2/28/07 (b) | 26,522,530 | |||||
| 29,301,000 | 5.322% due 3/30/07 (b) | 28,932,133 | |||||
| 35,000,000 | 5.302% due 4/13/07 (b) | 34,491,275 | |||||
| 15,320,000 | 5.201% due 5/29/07 (b) | 15,000,365 | |||||
| 22,000,000 | 5.138% due 8/3/07 (b) | 21,353,304 | |||||
Series RB: | |||||||
| 18,537,000 | 5.350% due 1/30/07 (b) | 18,459,052 | |||||
| 6,025,000 | 5.247%-5.173% due 2/6/07 (b) | 5,995,116 | |||||
| 73,644,000 | 5.247%-5.338% due 2/6/07 (b) | 73,263,611 | |||||
| 20,000,000 | 5.111% due 3/6/07 (b) | 19,826,667 | |||||
See Notes to Financial Statements.
18 Smith Barney Money Funds, Inc. 2006 Semi-Annual Report
Schedules of Investments (December 31, 2006) (continued)
| Face Amount | Security | Value | |||||
| U.S. Government Agencies — 79.8% (continued) | |||||||
| $ | 42,474,000 | 5.249% due 5/1/07 (b) | $ | 41,767,516 | |||
| 16,163,000 | 5.193% due 5/15/07 (b) | 15,857,977 | |||||
| 35,000,000 | 5.150% due 5/31/07 (b) | 34,273,750 | |||||
| 17,474,000 | 5.216% due 8/21/07 (b) | 16,909,260 | |||||
| 42,267,000 | 5.205%-5.211% due 9/18/07 (b) | 40,749,323 | |||||
| 80,000,000 | Medium-Term Note, 5.203% due 9/27/07 (a) | 79,977,903 | |||||
Federal National Mortgage Association (FNMA): | |||||||
| 35,882,000 | 5.248% due 1/26/07 (b) | 35,753,672 | |||||
| 10,094,000 | 5.186% due 2/23/07 (b) | 10,020,291 | |||||
| 30,000,000 | 5.111% due 3/6/07 (b) | 29,739,733 | |||||
| 35,000,000 | 5.202% due 3/7/07 (b) | 34,675,496 | |||||
| 25,000,000 | 5.345% due 3/30/07 (b) | 24,686,805 | |||||
| 35,000,000 | 5.218% due 5/9/07 (b) | 34,367,200 | |||||
| 42,000,000 | 5.213% due 5/30/07 (b) | 41,115,188 | |||||
| 25,000,000 | 5.500% due 6/29/07 (b) | 24,349,882 | |||||
| 25,000,000 | 5.276% due 8/31/07 (b) | 24,152,160 | |||||
| 33,600,000 | Series BB, 5.206% due 5/31/07 (b) | 32,894,960 | |||||
Series RB: | |||||||
| 20,000,000 | 5.022% due 2/23/07 (b) | 19,858,667 | |||||
| 85,000,000 | 5.181%-5.222% due 3/28/07 (b) | 83,580,760 | |||||
| 79,974,000 | 5.159%-5.185% due 4/30/07 (b) | 78,996,661 | |||||
| Total U.S. Government Agencies | 2,206,547,677 | ||||||
| U.S. Government Obligation — 0.7% | |||||||
| 20,000,000 | U.S. Treasury Bills, 5.013% due 1/18/07 (b) | 19,953,250 | |||||
| TOTAL U.S. GOVERNMENT & AGENCY OBLIGATIONS | 2,226,500,927 | ||||||
| Repurchase Agreements — 19.3% | |||||||
| 300,000,000 | Countrywide Alternative Loan Trust, repurchase agreement dated 12/29/06, 5.230% due 1/2/07; Proceeds at maturity — $300,174,333; (Fully collateralized by U.S. government agency obligations, 4.750% to 5.50% due 12/26/08 to 12/16/16; Market value — $306,003,331) | 300,000,000 | |||||
| 83,068,000 | Deutsche Banc Securities Inc., repurchase agreement dated 12/29/06, 5.250% due 1/2/07; Proceeds at maturity — $83,116,456; (Fully collateralized by U.S. government agency obligations, 3.375% to 5.750% due 4/15/08 to 7/15/08; Market value — $84,729,834) | 83,068,000 | |||||
| 150,000,000 | Morgan Stanley, repurchase agreement dated 12/29/06, 5.250% due 1/2/07; Proceeds at maturity — $150,087,500; (Fully collateralized by various U.S. government agency obligations, 0.000% to 6.500% due 1/4/07 to 7/1/33; Market Value — $153,000,000) | 150,000,000 | |||||
| Total Repurchase Agreements | 533,068,000 | ||||||
| TOTAL INVESTMENTS — 99.8% (Cost — $2,759,568,927#) | 2,759,568,927 | ||||||
Other Assets in Excess of Liabilities — 0.2% | 6,774,386 | ||||||
| TOTAL NET ASSETS — 100.0% | $ | 2,766,343,313 | |||||
(a) | Variable rate security. Interest rate disclosed is that which is in effect at December 31, 2006. |
(b) | Rate shown represents yield-to-maturity. |
| # | Aggregate cost for federal income tax purposes is substantially the same. |
See Notes to Financial Statements.
Smith Barney Money Funds, Inc. 2006 Semi-Annual Report 19
Statements of Assets and Liabilities (December 31, 2006)
| Cash Portfolio | Government Portfolio | |||||||
| ASSETS: | ||||||||
Investments, at amortized cost | $ | 25,177,430,159 | $ | 2,226,500,927 | ||||
Repurchase agreement, at value | — | 533,068,000 | ||||||
Cash | 489 | 688 | ||||||
Receivable for Fund shares sold | 679,801,123 | 46,624,331 | ||||||
Interest receivable | 129,174,176 | 5,993,044 | ||||||
Deferred compensation | 624,368 | 86,416 | ||||||
Receivable from manager | 372,117 | 42,949 | ||||||
Prepaid expenses | 989,093 | 169,766 | ||||||
Total Assets | 25,988,391,525 | 2,812,486,121 | ||||||
| LIABILITIES: | ||||||||
Payable for Fund shares repurchased | 592,248,198 | 44,292,207 | ||||||
Investment management fee payable | 7,892,403 | 955,616 | ||||||
Distributions payable | 1,846,937 | 470,973 | ||||||
Distribution fees payable | 757,623 | 79,035 | ||||||
Directors’ fees payable | 744,448 | 87,408 | ||||||
Deferred compensation payable | 624,368 | 86,416 | ||||||
Accrued expenses | 2,395,670 | 171,153 | ||||||
Total Liabilities | 606,509,647 | 46,142,808 | ||||||
Total Net Assets | $ | 25,381,881,878 | $ | 2,766,343,313 | ||||
| NET ASSETS: | ||||||||
Par value (Note 5) | $ | 253,821,452 | $ | 27,664,464 | ||||
Paid-in capital in excess of par value | 25,128,571,503 | 2,738,798,574 | ||||||
Undistributed net investment income | 17,232 | 31,787 | ||||||
Accumulated net realized loss on investments | (528,309 | ) | (151,512 | ) | ||||
Total Net Assets | $ | 25,381,881,878 | $ | 2,766,343,313 | ||||
Shares Outstanding: | ||||||||
Class A | 25,219,231,600 | 2,761,199,491 | ||||||
Class C | 32,131 | — | (1) | |||||
Class I(2) | 162,881,465 | 5,246,901 | ||||||
Net Asset Value: | ||||||||
Class A | $1.00 | $1.00 | ||||||
Class C | $1.00 | — | (1) | |||||
Class I(2) | $1.00 | $1.00 | ||||||
(1) | As of November 20, 2006, Class C shares merged into Class A shares. |
(2) | As of November 20, 2006, Class Y shares were renamed Class I shares. |
See Notes to Financial Statements.
20 Smith Barney Money Funds, Inc. 2006 Annual Report
Statements of Operations (For the year ended December 31, 2006 )
| Cash Portfolio | Government Portfolio | |||||||
| INVESTMENT INCOME: | ||||||||
Interest | $ | 1,117,897,578 | $ | 122,045,365 | ||||
| EXPENSES: | ||||||||
Investment management fee (Note 2) | 81,921,089 | 10,655,281 | ||||||
Distribution fees (Notes 2 and 3) | 21,978,696 | 2,468,928 | ||||||
Transfer agent fees (Note 3) | 7,432,948 | 191,994 | ||||||
Restructuring and reorganization fees (Note 10) | 1,937,505 | 132,552 | ||||||
Directors’ fees | 860,740 | 98,362 | ||||||
Registration fees | 435,863 | 209,106 | ||||||
Insurance | 383,571 | 51,931 | ||||||
Shareholder reports (Note 3) | 326,759 | 66,387 | ||||||
Custody fees | 146,903 | 14,117 | ||||||
Audit and tax | 57,000 | 37,000 | ||||||
Legal fees | 43,515 | 44,404 | ||||||
Miscellaneous expenses | 52,398 | 15,290 | ||||||
Total Expenses | 115,576,987 | 13,985,352 | ||||||
Less: Fee waivers and/or expense reimbursements (Notes 2, 7 and 10) | (3,393,273 | ) | (251,500 | ) | ||||
Net Expenses | 112,183,714 | 13,733,852 | ||||||
Net Investment Income | 1,005,713,864 | 108,311,513 | ||||||
Net Realized Loss From Investment Transactions | (510,077 | ) | (151,512 | ) | ||||
Increase in Net Assets From Operations | $ | 1,005,203,787 | $ | 108,160,001 | ||||
See Notes to Financial Statements.
Smith Barney Money Funds, Inc. 2006 Annual Report 21
Statements of Changes in Net Assets (For the years ended December 31,)
| Cash Portfolio | 2006 | 2005 | ||||||
| OPERATIONS: | ||||||||
Net investment income | $ | 1,005,713,864 | $ | 472,369,261 | ||||
Net realized loss | (510,077 | ) | (18,232 | ) | ||||
Increase in Net Assets From Operations | 1,005,203,787 | 472,351,029 | ||||||
| DISTRIBUTIONS TO SHAREHOLDERS FROM (NOTES 1 AND 4): | ||||||||
Net investment income | (1,005,713,864 | ) | (472,369,261 | ) | ||||
Decrease in Net Assets From Distributions to Shareholders | (1,005,713,864 | ) | (472,369,261 | ) | ||||
| FUND SHARE TRANSACTIONS (NOTE 5): | ||||||||
Net proceeds from sale of shares | 131,032,540,415 | 102,958,638,804 | ||||||
Reinvestment of distributions | 970,565,161 | 457,134,926 | ||||||
Cost of shares repurchased | (124,288,287,558 | ) | (102,994,449,761 | ) | ||||
Increase in Net Assets From Fund Share Transactions | 7,714,818,018 | 421,323,969 | ||||||
Increase in Net Assets | 7,714,307,941 | 421,305,737 | ||||||
| NET ASSETS: | ||||||||
Beginning of year | 17,667,573,937 | 17,246,268,200 | ||||||
End of year* | $ | 25,381,881,878 | $ | 17,667,573,937 | ||||
* Includes undistributed net investment income of: | $17,232 | $17,232 | ||||||
See Notes to Financial Statements.
22 Smith Barney Money Funds, Inc. 2006 Annual Report
Statements of Changes in Net Assets (For the years ended December 31,) (continued)
| Government Portfolio | 2006 | 2005 | ||||||
| OPERATIONS: | ||||||||
Net investment income | $ | 108,311,513 | $ | 60,467,514 | ||||
Net realized gain (loss) | (151,512 | ) | 8,634 | |||||
Increase in Net Assets From Operations | 108,160,001 | 60,476,148 | ||||||
| DISTRIBUTIONS TO SHAREHOLDERS FROM (NOTES 1 AND 4): | ||||||||
Net investment income | (108,311,519 | ) | (60,458,877 | ) | ||||
Net realized gains | — | (8,634 | ) | |||||
Decrease in Net Assets From Distributions to Shareholders | (108,311,519 | ) | (60,467,511 | ) | ||||
| FUND SHARE TRANSACTIONS (NOTE 5): | ||||||||
Net proceeds from sale of shares | 10,914,056,472 | 9,602,150,169 | ||||||
Reinvestment of distributions | 101,698,743 | 58,143,963 | ||||||
Cost of shares repurchased | (10,311,688,580 | ) | (9,924,400,746 | ) | ||||
Increase (Decrease) in Net Assets From Fund | 704,066,635 | (264,106,614 | ) | |||||
Increase (Decrease) in Net Assets | 703,915,117 | (264,097,977 | ) | |||||
| NET ASSETS: | ||||||||
Beginning of year | 2,062,428,196 | 2,326,526,173 | ||||||
End of year* | $ | 2,766,343,313 | $ | 2,062,428,196 | ||||
* Includes undistributed net investment income of: | $31,787 | $31,793 | ||||||
See Notes to Financial Statements.
Smith Barney Money Funds, Inc. 2006 Annual Report 23
For a share of each class of capital stock outstanding throughout each year ended December 31,:
| Class A Shares | ||||||||||||||||||||
| Cash Portfolio | 2006(1) | 2005(1) | 2004 | 2003 | 2002 | |||||||||||||||
Net Asset Value, Beginning of Year | $ | 1.000 | $ | 1.000 | $ | 1.000 | $ | 1.000 | $ | 1.000 | ||||||||||
Income (Loss) From Operations: | ||||||||||||||||||||
Net investment income | 0.045 | 0.027 | 0.009 | 0.007 | 0.013 | |||||||||||||||
Net realized gain (loss)(2) | (0.000 | ) | 0.000 | 0.000 | 0.000 | 0.000 | ||||||||||||||
Total Income from Operations | 0.045 | 0.027 | 0.009 | 0.007 | 0.013 | |||||||||||||||
Less Distributions From: | ||||||||||||||||||||
Net investment income | (0.045 | ) | (0.027 | ) | (0.009 | ) | (0.007 | ) | (0.013 | ) | ||||||||||
Net realized gains | — | — | (0.000 | )(2) | — | — | ||||||||||||||
Total Distributions | (0.045 | ) | (0.027 | ) | (0.009 | ) | (0.007 | ) | (0.013 | ) | ||||||||||
Net Asset Value, End of Year | $ | 1.000 | $ | 1.000 | $ | 1.000 | $ | 1.000 | $ | 1.000 | ||||||||||
Total Return(3) | 4.62 | % | 2.75 | % | 0.90 | % | 0.67 | % | 1.28 | % | ||||||||||
Net Assets, End of Year (billions) | $25 | $18 | $17 | $20 | $23 | |||||||||||||||
Ratios to Average Net Assets: | ||||||||||||||||||||
Gross expenses | 0.52 | %† | 0.58 | % | 0.59 | % | 0.56 | % | 0.62 | % | ||||||||||
Net expenses(4) | 0.51 | (5)† | 0.58 | 0.54 | (5) | 0.56 | 0.62 | |||||||||||||
Net investment income | 4.55 | 2.72 | 0.88 | 0.68 | 1.27 | |||||||||||||||
(1) | Per share amounts have been calculated using the average shares method. |
(2) | Amount represents less than $0.001 per share. |
(3) | Performance figures may reflect fee waivers and/or expense reimbursements. Past performance is no guarantee of future results. In the absence of fee waivers and/or expense reimbursements, the total return would have been lower. |
(4) | As a result of an expense limitation, the ratio of expenses to average net assets of Class A shares will not exceed 0.70%. |
(5) | Reflects fee waivers and/or expense reimbursements. |
| † | Included in the expense ratios are certain non-recurring restructuring (and reorganization if applicable) fees that were incurred by the Fund during the period. Without these fees, the gross and net expense ratios would have been 0.51% and 0.50%, respectively (Note 10). |
See Notes to Financial Statements.
24 Smith Barney Money Funds, Inc. 2006 Annual Report
Financial Highlights (continued)
For a share of each class of capital stock outstanding throughout each year ended December 31,:
| Class C Shares | ||||||||||||||||||||
| Cash Portfolio | 2006(1) | 2005(1) | 2004 | 2003 | 2002 | |||||||||||||||
Net Asset Value, Beginning of Year | $ | 1.000 | $ | 1.000 | $ | 1.000 | $ | 1.000 | $ | 1.000 | ||||||||||
Income (Loss) From Operations: | ||||||||||||||||||||
Net investment income | 0.043 | 0.027 | 0.009 | 0.007 | 0.013 | |||||||||||||||
Net realized gain (loss)(2) | (0.000 | ) | 0.000 | 0.000 | 0.000 | 0.000 | ||||||||||||||
Total Income From Operations | 0.043 | 0.027 | 0.009 | 0.007 | 0.013 | |||||||||||||||
Less Distributions From: | ||||||||||||||||||||
Net investment income | (0.043 | ) | (0.027 | ) | (0.009 | ) | (0.007 | ) | (0.013 | ) | ||||||||||
Net realized gains | — | — | (0.000 | )(2) | — | — | ||||||||||||||
Total Distributions | (0.043 | ) | (0.027 | ) | (0.009 | ) | (0.007 | ) | (0.013 | ) | ||||||||||
Net Asset Value, End of Year | $ | 1.000 | $ | 1.000 | $ | 1.000 | $ | 1.000 | $ | 1.000 | ||||||||||
Total Return(3) | 4.42 | % | 2.71 | % | 0.90 | % | 0.67 | % | 1.29 | % | ||||||||||
Net Assets, End of Year (000s) | $32 | $152 | $166 | $381 | $347 | |||||||||||||||
| Ratios to Average Net Assets: | ||||||||||||||||||||
Gross expenses | 0.63 | %† | 0.63 | % | 0.59 | % | 0.55 | % | 0.61 | % | ||||||||||
Net expenses(4) | 0.63 | (5)† | 0.63 | 0.55 | (5) | 0.55 | 0.61 | |||||||||||||
Net investment income | 4.17 | 2.65 | 0.79 | 0.67 | 1.28 | |||||||||||||||
(1) | Per share amounts have been calculated using the average shares method. |
(2) | Amount represents less than $0.001 per share. |
(3) | Performance figures may reflect fee waivers and/or expense reimbursements. Past performance is no guarantee of future results. In the absence of fee waivers and/or expense reimbursements, the total return would have been lower. |
(4) | As a result of an expense limitation, the ratio of expenses to average net assets of Class C shares will not exceed 0.70%. |
(5) | Reflects fee waivers and/or expense reimbursements. |
| † | Included in the expense ratios are certain non-recurring restructuring (and reorganization if applicable) fees that were incurred by the Fund during the period. Without these fees, the gross and net expense ratios would have been 0.62% and 0.62%, respectively (Note 10). |
See Notes to Financial Statements.
Smith Barney Money Funds, Inc. 2006 Annual Report 25
Financial Highlights (continued)
For a share of each class of capital stock outstanding throughout each year ended December 31,:
| Class I Shares(1) | ||||||||||||||||||||
| Cash Portfolio | 2006(2) | 2005(2) | 2004 | 2003 | 2002 | |||||||||||||||
Net Asset Value, Beginning of Year | $ | 1.000 | $ | 1.000 | $ | 1.000 | $ | 1.000 | $ | 1.000 | ||||||||||
Income (Loss) From Operations: | ||||||||||||||||||||
Net investment income | 0.047 | 0.029 | 0.010 | 0.008 | 0.014 | |||||||||||||||
Net realized gain (loss)(3) | (0.000 | ) | 0.000 | 0.000 | 0.000 | 0.000 | ||||||||||||||
Total Income From Operations | 0.047 | 0.029 | 0.010 | 0.008 | 0.014 | |||||||||||||||
Less Distributions From: | ||||||||||||||||||||
Net investment income | (0.047 | ) | (0.029 | ) | (0.010 | ) | (0.008 | ) | (0.014 | ) | ||||||||||
Net realized gains | — | — | (0.000 | )(3) | — | — | ||||||||||||||
Total Distributions | (0.047 | ) | (0.029 | ) | (0.010 | ) | (0.008 | ) | (0.014 | ) | ||||||||||
Net Asset Value, End of Year | $ | 1.000 | $ | 1.000 | $ | 1.000 | $ | 1.000 | $ | 1.000 | ||||||||||
Total Return(4) | 4.75 | % | 2.91 | % | 1.00 | % | 0.78 | % | 1.45 | % | ||||||||||
Net Assets, End of Year (millions) | $163 | $121 | $86 | $128 | $63 | |||||||||||||||
Ratios to Average Net Assets: | ||||||||||||||||||||
Gross expenses | 0.39 | %† | 0.43 | % | 0.49 | % | 0.44 | % | 0.45 | % | ||||||||||
Net expenses(5) | 0.38 | (6)† | 0.43 | 0.43 | (6) | 0.44 | 0.45 | |||||||||||||
Net investment income | 4.68 | 2.93 | 0.98 | 0.76 | 1.44 | |||||||||||||||
(1) | As of November 20, 2006, Class Y shares were renamed Class I shares. |
(2) | Per share amounts have been calculated using the average shares method. |
(3) | Amounts represents less than $0.001 per share. |
(4) | Performance figures may reflect fee waivers and/or expense reimbursements. Past performance is no guarantee of future results. In the absence of fee waivers and/or expense reimbursements, the total return would have been lower. |
(5) | As a result of an expense limitation, the ratio of expenses to average net assets of Class I shares will not exceed 0.70%. |
(6) | Reflects fee waivers and/or expense reimbursements. |
| † | Included in the expense ratios are certain non-recurring restructuring (and reorganization if applicable) fees that were incurred by the Fund during the period. Without these fees, the gross and net expense ratios would have been 0.38% and 0.37%, respectively (Note 10). |
See Notes to Financial Statements.
26 Smith Barney Money Funds, Inc. 2006 Semi-Annual Report
Financial Highlights (continued)
For a share of each class of capital stock outstanding throughout each year ended December 31,:
| Class A Shares | ||||||||||||||||||||
| Government Portfolio | 2006(1) | 2005(1) | 2004 | 2003 | 2002 | |||||||||||||||
Net Asset Value, Beginning of Year | $ | 1.000 | $ | 1.000 | $ | 1.000 | $ | 1.000 | $ | 1.000 | ||||||||||
Income From Operations: | ||||||||||||||||||||
Net investment income | 0.044 | 0.027 | 0.009 | 0.006 | 0.012 | |||||||||||||||
Net realized gain(2) | 0.000 | 0.000 | 0.000 | 0.000 | 0.000 | |||||||||||||||
Total Income From Operations | 0.044 | 0.027 | 0.009 | 0.006 | 0.012 | |||||||||||||||
Less Distributions From: | ||||||||||||||||||||
Net investment income | (0.044 | ) | (0.027 | ) | (0.009 | ) | (0.006 | ) | (0.012 | ) | ||||||||||
Net realized gains | — | (0.000 | )(2) | (0.000 | )(2) | (0.000 | )(2) | — | ||||||||||||
Total Distributions | (0.044 | ) | (0.027 | ) | (0.009 | ) | (0.006 | ) | (0.012 | ) | ||||||||||
Net Asset Value, End of Year | $ | 1.000 | $ | 1.000 | $ | 1.000 | $ | 1.000 | $ | 1.000 | ||||||||||
Total Return(3) | 4.45 | % | 2.69 | % | 0.85 | % | 0.62 | % | 1.22 | % | ||||||||||
Net Assets, End of Year (billions) | $3 | $2 | $2 | $3 | $3 | |||||||||||||||
| Ratios to Average Net Assets: | ||||||||||||||||||||
Gross expenses | 0.57 | %† | 0.59 | % | 0.57 | % | 0.56 | % | 0.61 | % | ||||||||||
Net expenses(4) | 0.55 | (5)† | 0.59 | 0.54 | (5) | 0.56 | 0.61 | |||||||||||||
Net investment income | 4.37 | 2.63 | 0.82 | 0.63 | 1.21 | |||||||||||||||
(1) | Per share amounts have been calculated using the average shares method. |
(2) | Amount represents less than $0.001 per share. |
(3) | Performance figures may reflect fee waivers and/or expense reimbursements. Past performance is no guarantee of future results. In the absence of fee waivers and/or expense reimbursements, the total return would have been lower. |
(4) | As a result of an expense limitation, the ratio of expenses to average net assets of Class A shares will not exceed 0.70%. |
(5) | Reflects fee waivers and/or expense reimbursements. |
| † | Included in the expense ratios are certain non-recurring restructuring (and reorganization if applicable) fees that were incurred by the Fund during the period. Without these fees, the gross and net expense ratios would have been 0.56% and 0.55% respectively (Note 10). |
See Notes to Financial Statements.
Smith Barney Money Funds, Inc. 2006 Annual Report 27
Financial Highlights (continued)
For a share of each class of capital stock outstanding throughout each year ended December 31, unless otherwise noted:
| Class C Shares(1) | ||||||||||||||||||||
| Government Portfolio | 2006(2)(3) | 2005(2) | 2004 | 2003 | 2002 | |||||||||||||||
Net Asset Value, Beginning of Year | $ | 1.000 | $ | 1.000 | $ | 1.000 | $ | 1.000 | $ | 1.000 | ||||||||||
Income From Operations: | ||||||||||||||||||||
Net investment income | 0.039 | 0.025 | 0.007 | 0.006 | 0.012 | |||||||||||||||
Net realized gain(4) | 0.000 | 0.000 | 0.000 | 0.000 | 0.000 | |||||||||||||||
Total Income From Operations | 0.039 | 0.025 | 0.007 | 0.006 | 0.012 | |||||||||||||||
Less Distributions From: | ||||||||||||||||||||
Net investment income | (0.039 | ) | (0.025 | ) | (0.007 | ) | (0.006 | ) | (0.012 | ) | ||||||||||
Net realized gains | — | (0.000 | )(4) | (0.000 | )(4) | (0.000 | )(4) | — | ||||||||||||
Total Distributions | (0.039 | ) | (0.025 | ) | (0.007 | ) | (0.006 | ) | (0.012 | ) | ||||||||||
Net Asset Value, End of Year | $ | 1.000 | $ | 1.000 | $ | 1.000 | $ | 1.000 | $ | 1.000 | ||||||||||
Total Return(5) | 3.95 | % | 2.57 | % | 0.73 | % | 0.58 | % | 1.21 | % | ||||||||||
Net Assets, End of Year (000s) | — | $3 | $6 | $14 | $131 | |||||||||||||||
Ratios to Average Net Assets: | ||||||||||||||||||||
Gross expenses | 1.26 | %(7) | 0.79 | % | 0.76 | % | 0.61 | % | 0.61 | % | ||||||||||
Net expenses(6) | 0.70 | %(7) | 0.65 | (8) | 0.65 | (8) | 0.61 | 0.61 | ||||||||||||
Net investment income | 4.11 | %(7) | 2.49 | 0.69 | 0.65 | 1.21 | ||||||||||||||
(1) | As of November 20, 2006, Class C shares merged into Class A shares. |
(2) | Per share amounts have been calculated using the average shares method. |
(3) | For the period January 1, 2006 to November 19, 2006. |
(4) | Amount represents less than $0.001 per share. |
(5) | Performance figures may reflect fee waivers and/or expense reimbursements. Past performance is no guarantee of future results. In the absence of fee waivers and/or expense reimbursements, the total return would have been lower. |
(6) | As a result of an expense limitation, the ratio of expenses to average net assets of Class C shares will not exceed 0.70%. |
(7) | Annualized |
(8) | Reflects fee waivers and/or expense reimbursements. |
See Notes to Financial Statements.
28 Smith Barney Money Funds, Inc. 2006 Annual Report
Financial Highlights (continued)
For a share of each class of capital stock outstanding throughout each year ended December 31,:
| Class I Shares(1) | ||||||||||||||||||||
| Government Portfolio | 2006(2) | 2005(2) | 2004 | 2003 | 2002 | |||||||||||||||
Net Asset Value, Beginning of Year | $ | 1.000 | $ | 1.000 | $ | 1.000 | $ | 1.000 | $ | 1.000 | ||||||||||
Income From Operations: | ||||||||||||||||||||
Net investment income | 0.045 | 0.028 | 0.010 | 0.007 | 0.013 | |||||||||||||||
Net realized gain(3) | 0.000 | 0.000 | 0.000 | 0.000 | 0.000 | |||||||||||||||
Total Income From Operations | 0.045 | 0.028 | 0.010 | 0.007 | 0.013 | |||||||||||||||
Net investment income | (0.045 | ) | (0.028 | ) | (0.010 | ) | (0.007 | ) | (0.013 | ) | ||||||||||
Net realized gains | — | (0.000 | )(3) | (0.000 | )(3) | (0.000 | )(3) | — | ||||||||||||
Total Distributions | (0.045 | ) | (0.028 | ) | (0.010 | ) | (0.007 | ) | (0.013 | ) | ||||||||||
Net Asset Value, End of Year | $ | 1.000 | $ | 1.000 | $ | 1.000 | $ | 1.000 | $ | 1.000 | ||||||||||
Total Return(4) | 4.56 | % | 2.83 | % | 0.98 | % | 0.75 | % | 1.35 | % | ||||||||||
Net Assets, End of Year (millions) | $5 | $13 | $3 | $1 | $2 | |||||||||||||||
Ratios to Average Net Assets: | ||||||||||||||||||||
Gross expenses | 0.45 | %† | 0.45 | % | 0.43 | % | 0.44 | % | 0.48 | % | ||||||||||
Net expenses(5) | 0.45 | (6)† | 0.45 | 0.41 | (6) | 0.44 | 0.48 | |||||||||||||
Net investment income | 4.35 | 2.77 | 1.05 | 0.76 | 1.38 | |||||||||||||||
(1) | As of November 20, 2006, Class Y shares were renamed Class I shares. |
(2) | Per share amounts have been calculated using the average shares method. |
(3) | Amount represents less than $0.001 per share. |
(4) | Performance figures may reflect fee waivers and/or expense reimbursements. Past performance is no guarantee of future results. In the absence of fee waivers and/or expense reimbursements, the total return would have been lower. |
(5) | As a result of an expense limitation, the ratio of expenses to average net assets of Class I shares will not exceed 0.70%. |
(6) | Reflects fee waivers and/or expense reimbursements. |
| † | Included in the expense ratios are certain non-recurring restructuring (and reorganization if applicable) fees that were incurred by the Fund during the period. Without these fees, the gross and net expense ratios would have been 0.45% and 0.44%, respectively (Note 10). |
See Notes to Financial Statements.
Smith Barney Money Funds, Inc. 2006 Annual Report 29
| 1. | Organization and Significant Accounting Policies |
The Cash Portfolio (“Cash”) and Government Portfolio (“Government”) (the “Funds”) are separate diversified investment funds of the Smith Barney Money Funds, Inc. (the “Company”). The Company, a Maryland corporation, is registered under the Investment Company Act of 1940, as amended (the “1940 Act”), as an open-end management investment company.
The following are significant accounting policies consistently followed by the Funds and are in conformity with U.S. generally accepted accounting principles (“GAAP”). Estimates and assumptions are required to be made regarding assets, liabilities and changes in net assets resulting from operations when financial statements are prepared. Changes in the economic environment, financial markets and any other parameters used in determining these estimates could cause actual results to differ.
(a) Investment valuation. Money market instruments are valued at amortized cost, in accordance with Rule 2a-7 under the 1940 Act, which approximates market value. This method involves valuing portfolio securities at its cost and thereafter assuming a constant amortization to maturity of any discount or premium. The Funds’ use of amortized cost is subject to their compliance with certain conditions as specified under Rule 2a-7 of the 1940 Act.
(b) Repurchase Agreements. When entering into repurchase agreements, it is the Funds’ policy that their custodian or a third party custodian take possession of the underlying collateral securities, the market value of which at least equals the principal amount of the repurchase transaction, including accrued interest. To the extent that any repurchase transaction exceeds one business day, the value of the collateral is marked-to-market to ensure the adequacy of the collateral. If the seller defaults and the market value of the collateral declines or if bankruptcy proceedings are commenced with respect to the seller of the security, realization of the collateral by the Funds may be delayed or limited.
(c) Security Transactions and Investment Income. Security transactions are accounted for on a trade date basis. Interest income, adjusted for amortization of premium and accretion of discount, is recorded on the accrual basis. The cost of investments sold is determined by use of the specific identification method. To the extent any issuer defaults on an expected interest payment, the Funds’ policy is to generally halt any additional interest income accruals and consider the realizability of interest accrued up to the date of default.
(d) Distributions to Shareholders. Distributions from net investment income on the shares of each of the Funds are declared each business day to shareholders of record, and are paid monthly. Distributions of net realized gains, if any, are declared at least annually. Distributions are recorded on the ex-dividend date and are determined in accordance with income tax regulations, which may differ from GAAP.
(e) Class Accounting. Investment income, common expenses and realized/unrealized gain (loss) on investments are allocated to the various classes of the Funds on the basis of daily net assets of each class. Fees relating to a specific class are charged directly to that class.
30 Smith Barney Money Funds, Inc. 2006 Annual Report
Notes to Financial Statements (continued)
(f) Federal and Other Taxes. It is the Funds’ policy to comply with the federal income and excise tax requirements of the Internal Revenue Code of 1986, as amended, applicable to regulated investment companies. Accordingly, the Funds intend to distribute substantially all of its income and net realized gains on investments, if any, to shareholders each year. Therefore, no federal income tax provision is required in the Funds’ financial statements.
(g) Reclassification. GAAP requires that certain components of net assets be adjusted to reflect permanent differences between financial and tax reporting. These reclassifications have no effect on net assets or net asset values per share. During the current year, the Fund had no reclassifications.
| 2. | Investment Management Agreement and Other Transactions with Affiliates |
Prior to August 1, 2006, Smith Barney Fund Management LLC (“SBFM”), a wholly-owned subsidiary of Legg Mason, Inc. (“Legg Mason”), acted as the investment manager of the Funds. Under the investment management agreement, each Fund paid an investment management fee calculated daily and paid monthly in accordance with the following breakpoint schedule:
| Average Daily Net Assets | Annual Rate | ||
First $1.0 billion | 0.450 | % | |
Next $1.0 billion | 0.425 | ||
Next $3.0 billion | 0.400 | ||
Next $5.0 billion | 0.375 | ||
Over $10.0 billion | 0.350 | ||
Effective August 1, 2006, Legg Mason Partners Fund Advisor, LLC (“LMPFA”) became each Funds’ investment manager and Western Asset Management Company (“Western Asset”) became each Funds’ subadviser. The portfolio managers who are responsible for the day-to-day management of the Funds remained the same immediately prior to and immediately after the date of these changes. LMPFA and Western Asset are wholly-owned subsidiaries of Legg Mason.
LMPFA provides administrative and certain oversight services to the Funds. LMPFA has delegated to the subadviser the day-to-day portfolio management of the Funds. The Funds’ investment management fee remains unchanged. For its services, LMPFA pays Western Asset 70% of the net management fee it receives from the Funds.
During the year ended December 31, 2006, each class of the Cash Portfolio and the Government Portfolio had an expense limitation in place of 0.70%.
During the year ended December 31, 2006, SBFM and LMPFA waived a portion of their investment management fee in the amount of $398,608 and $45,625 for the Cash Portfolio and the Government Portfolio, respectively. In addition, during the year ended December 31, 2006, the Cash Portfolio and the Government Portfolio were reimbursed for expenses amounting to of $2,994,665 and $205,875, respectively.
Smith Barney Money Funds, Inc. 2006 Annual Report 31
Notes to Financial Statements (continued)
Citigroup Global Markets Inc. (“CGM”), PFS Investments Inc., and Legg Mason Investor Services, LLC (“LMIS”) serve as co-distributors of the Funds. LMIS is a wholly owned broker-dealer subsidiary of Legg Mason.
The Funds have adopted an unfunded, non-qualified deferred compensation plan (the “Plan”) which allows non-interested directors (“Directors”) to defer the receipt of all or a portion of the directors’ fees earned until a later date specified by the Directors. The deferred fees earn a return based on notional investments selected by the Directors. The balance of the deferred fees payable may change depending upon the investment performance. Any gains or losses incurred in the deferred balances are reported in the Statements of Operations under Directors’ fees. Under the Plan, deferred fees are considered a general obligation of the Funds and any payments made pursuant to the Plan will be made from the Funds’ general assets. Effective January 1, 2006, the Board of Directors voted to discontinue offering the Plan to its members. This change will have no effect on fees previously deferred. As of December 31, 2006, Cash Portfolio and the Government Portfolio, had accrued $624,368 and $86,416 respectively, as deferred compensation payable.
Certain officers and one Director of the Company are employees of Legg Mason or its affiliates and do not receive compensation from the Company.
| 3. | Class Specific Expenses |
The Funds have adopted a Rule 12b-1 distribution plan and under that plan the Funds pay a distribution fee with respect to their Class A and Class C shares calculated at the annual rate of 0.10% of the average daily net assets of each respective class. Distribution fees are accrued daily and paid monthly.
For the year ended December 31, 2006, class specific expenses were as follows:
| Distribution Fees | Transfer Agent Fees | Shareholder Reports Expenses | |||||||
Cash Portfolio | |||||||||
Class A | $ | 21,978,630 | $ | 7,432,900 | $ | 326,595 | |||
Class C | 66 | 19 | 81 | ||||||
Class I† | — | 29 | 83 | ||||||
Total | $ | 21,978,696 | $ | 7,432,948 | $ | 326,759 | |||
| Government Portfolio | |||||||||
Class A | $ | 2,468,925 | $ | 191,973 | $ | 66,383 | |||
Class C* | 3 | 14 | 4 | ||||||
Class I† | — | 7 | — | ||||||
Total | $ | 2,468,928 | $ | 191,994 | $ | 66,387 | |||
| † | As of November 20, 2006, Class Y shares were renamed Class I shares. |
| * | As of November 20, 2006, Class C shares merged into Class A shares. |
32 Smith Barney Money Funds, Inc. 2006 Annual Report
Notes to Financial Statements (continued)
| 4. | Distributions to Shareholders by Class |
| Cash Portfolio | Year Ended December 31, 2006 | Year Ended December 31, 2005 | |||||
Net Investment Income | |||||||
Class A | $ | 999,089,464 | $ | 469,375,138 | |||
Class C | 2,761 | 4,185 | |||||
Class I† | 6,621,639 | 2,989,938 | |||||
Total | $ | 1,005,713,864 | $ | 472,369,261 | |||
| Government Portfolio | |||||||
Net Investment Income | |||||||
Class A | $ | 107,989,733 | $ | 60,082,453 | |||
Class C* | 103 | 92 | |||||
Class I† | 321,683 | 376,332 | |||||
Total | $ | 108,311,519 | $ | 60,458,877 | |||
Net Realized Gains | |||||||
Class A | – | $ | 8,583 | ||||
Class C* | – | 0 | ‡ | ||||
Class I† | – | 51 | |||||
Total | – | $ | 8,634 | ||||
| * | As of November 20, 2006, Class C shares merged into Class A shares. |
| † | As of November 20, 2006, Class Y shares were renamed Class I shares. |
| ‡ | Amount represents less than $1. |
| 5. | Capital Shares |
The Company offers multiple classes of shares within the Cash and Government Portfolios. Class A and Class I shares can be purchased directly by investors; Class C shares can only be purchased by participants in the Smith Barney 401(k) Program.
Transactions in shares of each class at $1.00, were as follows:
| Cash Portfolio | Year Ended December 31, 2006 | Year Ended December 31, 2005 | ||||
Class A | ||||||
Shares sold | 130,965,686,998 | 102,843,224,266 | ||||
Shares issued on reinvestment | 970,505,430 | 456,973,525 | ||||
Shares repurchased | (124,263,433,864 | ) | (102,913,306,356 | ) | ||
Net Increase | 7,672,758,564 | 386,891,435 | ||||
Class C | ||||||
Shares issued on reinvestment | 2,619 | 4,159 | ||||
Shares repurchased | (122,850 | ) | (17,516 | ) | ||
Net Decrease | (120,231 | ) | (13,357 | ) | ||
Class I† | ||||||
Shares sold | 66,853,417 | 115,414,539 | ||||
Shares issued on reinvestment | 57,112 | 157,243 | ||||
Shares repurchased | (24,730,844 | ) | (81,125,889 | ) | ||
Net Increase | 42,179,685 | 34,445,893 | ||||
† As of November 20, 2006 Class Y shares were renamed Class I shares.
Smith Barney Money Funds, Inc. 2006 Annual Report 33
Notes to Financial Statements (continued)
| Government Portfolio | Year Ended December 31, 2006 | Year Ended December 31, 2005 | ||||
Class A | ||||||
Shares sold | 10,913,073,768 | 9,575,766,056 | ||||
Shares issued on reinvestment | 101,376,993 | 57,767,451 | ||||
Shares repurchased | (10,302,513,705 | ) | (9,908,097,594 | ) | ||
Net Increase (Decrease) | 711,937,056 | (274,564,087 | ) | |||
Class C* | ||||||
Shares issued on reinvestment | 95 | 91 | ||||
Shares repurchased | (3,255 | ) | (3,152 | ) | ||
Net Decrease | (3,160 | ) | (3,061 | ) | ||
Class I† | ||||||
Shares sold | 982,704 | 26,384,113 | ||||
Shares issued on reinvestment | 321,655 | 376,421 | ||||
Shares repurchased | (9,171,620 | ) | (16,300,000 | ) | ||
Net Increase (Decrease) | (7,867,261 | ) | 10,460,534 | |||
| † | As of November 20, 2006, Class Y shares were renamed Class I shares. |
| * | As of November 20, 2006, Class C shares merged into Class A shares. |
Because the Funds have maintained a $1.00 net asset value per share from inception, the number of shares issued in reinvestment of dividends declared, and shares repurchased, is equal to the dollar amount shown in the Statements of Changes in Net Assets for the co-responding capital share transactions.
| 6. | Income Tax Information and Distributions to Shareholders |
Subsequent to the fiscal year end, the Funds made the following distributions:
| Record Date | Payable Date | Class A | Class C | Class I | |||||||||
Cash Portfolio | Daily | 1/31/2007 | $ | 0.003864 | $ | 0.003890 | $ | 0.003967 | |||||
Government Portfolio | Daily | 1/31/2007 | 0.003745 | — | 0.003831 | ||||||||
The tax character of distributions paid during the fiscal year ended December 31, 2006 were as follows:
| Cash Portfolio | Government Portfolio | |||||
Distributions Paid From: | ||||||
Ordinary income | $ | 1,005,713,864 | $ | 108,311,519 | ||
The tax character of distributions paid during the fiscal year ended December 31, 2005 were as follows:
| Cash Portfolio | Government Portfolio | |||||
Distributions Paid From: | ||||||
Ordinary income | $ | 472,369,261 | $ | 60,467,511 | ||
34 Smith Barney Money Funds, Inc. 2006 Annual Report
Notes to Financial Statements (continued)
As of December 31, 2006, there were no significant differences between the book and tax components of net assets for both Cash Portfolio and Government Portfolio.
As of December 31, 2006, the Funds had the following net capital loss carryforward remaining:
| Year of Expiration | Cash Portfolio | Government Portfolio | ||||||
12/31/2013 | $ | (18,832 | ) | — | ||||
12/31/2014 | (510,077 | ) | $ | (151,512 | ) | |||
| $ | (528,909 | ) | $ | (151,512 | ) | |||
These amounts will be available to offset any future taxable capital gains.
| 7. | Regulatory Matters |
On May 31, 2005, the U.S. Securities and Exchange Commission (“SEC”) issued an order in connection with the settlement of an administrative proceeding against SBFM, the Funds’ prior investment manager, and CGM relating to the appointment of an affiliated transfer agent for the Smith Barney family of mutual funds (the “Funds”).
The SEC order finds that SBFM and CGM willfully violated Section 206(1) of the Investment Advisers Act of 1940 (“Advisers Act”). Specifically, the order finds that SBFM and CGM knowingly or recklessly failed to disclose to the boards of the Funds in 1999 when proposing a new transfer agent arrangement with an affiliated transfer agent that: First Data Investors Services Group (“First Data”), the Funds’ then-existing transfer agent, had offered to continue as transfer agent and do the same work for substantially less money than before; and that Citigroup Asset Management (“CAM”), the Citigroup business unit that, at the time, included the fund’s investment manager and other investment advisory companies, had entered into a side letter with First Data under which CAM agreed to recommend the appointment of First Data as sub-transfer agent to the affiliated transfer agent in exchange for, among other things, a guarantee by First Data of specified amounts of asset management and investment banking fees to CAM and CGM. The order also finds that SBFM and CGM willfully violated Section 206(2) of the Advisers Act by virtue of the omissions discussed above and other misrepresentations and omissions in the materials provided to the Funds’ boards, including the failure to make clear that the affiliated transfer agent would earn a high profit for performing limited functions while First Data continued to perform almost all of the transfer agent functions, and the suggestion that the proposed arrangement was in the Funds’ best interests and that no viable alternatives existed. SBFM and CGM do not admit or deny any wrongdoing or liability. The settlement does not establish wrongdoing or liability for purposes of any other proceeding.
The SEC censured SBFM and CGM and ordered them to cease and desist from violations of Sections 206(1) and 206(2) of the Advisers Act. The order requires Citigroup to pay $208.1 million, including $109 million in disgorgement of profits, $19.1 million in interest, and a civil money penalty of $80 million. Approximately $24.4 million has already been paid to the Funds, primarily through fee waivers. The remaining $183.7 million, including the penalty, has been paid to the U.S. Treasury and will be distributed pursuant to a plan
Smith Barney Money Funds, Inc. 2006 Annual Report 35
Notes to Financial Statements (continued)
submitted for the approval of the SEC. At this time, there is no certainty as to how the above-described proceeds of the settlement will be distributed, to whom such distributions will be made, the methodology by which such distributions will be allocated, and when such distributions will be made.
The order also required that transfer agency fees received from the Funds since December 1, 2004, less certain expenses be placed in escrow and provided that a portion of such fees might be subsequently distributed in accordance with the terms of the order.
On April 3, 2006, an aggregate amount of approximately $9 million was distributed to the affected Funds.
The order required SBFM to recommend a new transfer agent contract to the Funds’ boards within 180 days of the entry of the order; if a Citigroup affiliate submitted a proposal to serve as transfer agent or sub-transfer agent, SBFM and CGM would have been required, at their expense, to engage an independent monitor to oversee a competitive bidding process. On November 21, 2005, and within the specified timeframe, the Fund’s Board selected a new transfer agent for the Fund. No Citigroup affiliate submitted a proposal to serve as transfer agent. Under the order, SBFM also must comply with an amended version of a vendor policy that Citigroup instituted in August 2004.
Although there can be no assurance, the Fund’s manager does not believe that this matter will have a material adverse effect on the Funds.
On December 1, 2005, Citigroup completed the sale of substantially all of its global asset management business, including SBFM, to Legg Mason.
| 8. | Legal Matters |
Beginning in August 2005, five class action lawsuits alleging violations of federal securities laws and state law were filed against CGM and SBFM, (collectively, the “Defendants”) based on the May 31, 2005 settlement order issued against the Defendants by the SEC as described in Note 7. The complaints seek injunctive relief and compensatory and punitive damages, removal of SBFM as the investment manager for the Smith Barney family of funds, rescission of the Funds’ management and other contracts with SBFM, recovery of all fees paid to SBFM pursuant to such contracts, and an award of attorneys’ fees and litigation expenses.
On October 5, 2005, a motion to consolidate the five actions and any subsequently filed, related action was filed. That motion contemplates that a consolidated amended complaint alleging substantially similar causes of action will be filed in the future.
As of the date of this report, the Funds’ investment manager believes that resolution of the pending lawsuit will not have a material effect on the financial position or results of operations of the Funds or the ability of the Fund’s investment manager and its affiliates to continue to render services to the Funds under their respective contracts.
* * *
Beginning in June 2004, class action lawsuits alleging violations of the federal securities laws were filed against CGM and a number of its then affiliates, including SBFM and Salomon Brothers Asset Management Inc (“SBAM”), which were then investment adviser or manager to certain of the Funds (the “Managers”), substantially all of the mutual funds
36 Smith Barney Money Funds, Inc. 2006 Annual Report
Notes to Financial Statements (continued)
then managed by the Managers (the “Defendant Funds”), and Board members of the Defendant Funds (collectively, the “Defendants”). The complaints alleged, among other things, that CGM created various undisclosed incentives for its brokers to sell Smith Barney and Salomon Brothers funds. In addition, according to the complaints, the Managers caused the Defendant Funds to pay excessive brokerage commissions to CGM for steering clients towards proprietary funds. The complaints also alleged that the defendants breached their fiduciary duty to the Defendant Funds by improperly charging Rule 12b-1 fees and by drawing on fund assets to make undisclosed payments of soft dollars and excessive brokerage commissions. The complaints also alleged that the Defendant Funds failed to adequately disclose certain of the allegedly wrongful conduct. The complaints sought injunctive relief and compensatory and punitive damages, rescission of the Defendant Funds’ contracts with the Managers, recovery of all fees paid to the Managers pursuant to such contracts and an award of attorneys’ fees and litigation expenses.
On December 15, 2004, a consolidated amended complaint (the “Complaint”) was filed alleging substantially similar causes of action. On May 27, 2005, all of the Defendants filed motions to dismiss the Complaint. On July 26, 2006, the court issued a decision and order (1) finding that plaintiffs lacked standing to sue on behalf of the shareholders of the Funds in which none of the plaintiffs had invested( including Cash Portfolio and Government Portfolio) and dismissing those Funds from the case (although stating that they could be brought back into the case if standing as to them could be established), and (2) other than one stayed claim, dismissing all of the causes of action against the remaining Defendants, with prejudice, except for the cause of action under Section 36(b) of the 1940 Act, which the court granted plaintiffs leave to repeal as a derivative claim.
On October 16, 2006, plaintiffs filed their Second Consolidated Amended Complaint (“Second Amended Complaint”) which alleges derivative claims on behalf of nine funds identified in the Second Amended Complaint, under Section 36(b) of the 1940 Act, against CAM, SBAM, SBFM and CGM as investment advisers to the identified funds, as well as CGM as a distributor for the identified funds (collectively, the “Second Amended Complaint Defendants”). The Funds were not identified in the Second Amended Complaint. The Second Amended Complaint alleges no claims against any of the Funds or an of their Board Members. Under Section 36(b), the Second Amended Complaint alleges similar facts and seeks similar relief against the Second Amended Complaint Defendants as the Complaint.
Additional lawsuits arising out of these circumstances and presenting similar allegations and requests for relief may be filed in the future.
9. Other Matters
On September 16, 2005, the staff of the SEC informed SBFM and SBAM that the staff is considering recommending that the SEC institute administrative proceedings against SBFM and SBAM for alleged violations of Section 19(a) and 34(b) of the 1940 Act (and related Rule 19a-1). The notification is a result of an industry wide inspection by the SEC and is based upon alleged deficiencies in disclosures regarding dividends and distributions paid to shareholders of certain funds. Section 19(a) and related Rule 19a-1 of the 1940 Act generally require funds that are making dividend and distribution payments to provide shareholders with a written statement disclosing the source of the dividends and distributions, and, in
Smith Barney Money Funds, Inc. 2006 Annual Report 37
Notes to Financial Statements (continued)
particular, the portion of the payments made from each of net investment income, undistributed net profits and/or paid-in capital. In connection with the contemplated proceedings, the staff may seek a cease and desist order and/or monetary damages from SBFM or SBAM.
Although there can be no assurance, the Funds’ manager believes that this matter is not likely to have a material adverse effect on the Funds.
| 10. | Special Shareholder Meeting and Reorganization |
Shareholders approved a number of initiatives designed to streamline and restructure the fund complex. These matters generally are expected to be implemented in 2007. As noted in the proxy materials, Legg Mason will pay for a portion of the costs related to these initiatives. The portion of the costs that are borne by the Funds will be recognized in the period during which the expense is incurred. Such expenses relate to obtaining shareholder votes for proposals presented in the proxy, the election of board members, retirement of board members, as well as printing, mailing, and soliciting proxies. The portions of these costs borne by the Funds and reflected in the Statements of Operations are deemed extraordinary for expense cap purposes and are not subject to the Funds’ expense limitation agreement. See also “Additional Shareholder Information “ at the end of this report.
| 11. | Recent Accounting Pronouncements |
During June 2006, the Financial Accounting Standards Board (“FASB”) issued FASB Interpretation 48 (“FIN 48” or the “Interpretation”), Accounting for Uncertainty in Income Taxes — an interpretation of FASB statement 109. FIN 48 supplements FASB Statement 109, Accounting for Income Taxes, by defining the confidence level that a tax position must meet in order to be recognized in the financial statements. FIN 48 prescribes a comprehensive model for how a fund should recognize, measure, present, and disclose in its financial statements uncertain tax positions that the fund has taken or expects to take on a tax return. FIN 48 requires that the tax effects of a position be recognized only if it is “more likely than not” to be sustained based solely on its technical merits. Management must be able to conclude that the tax law, regulations, case law, and other objective information regarding the technical merits sufficiently support the position’s sustainability with a likelihood of more than 50 percent. FIN 48 is effective for fiscal periods beginning after December 15, 2006, which for this Fund will be January 1, 2007. At adoption, the financial statements must be adjusted to reflect only those tax positions that are more likely than not to be sustained as of the adoption date. Management of the Fund has determined that adopting FIN 48 will not have a material impact on the Fund’s financial statements.
***
On September 20, 2006, FASB released Statement of Financial Accounting Standards No. 157 Fair Value Measurements (“FAS 157”). FAS 157 establishes an authoritative definition of fair value, sets out a framework for measuring fair value, and requires additional disclosures about fair value measurements. The application of FAS 157 is required for fiscal years beginning after November 15, 2007 and interim periods within those fiscal years. At this time, management is evaluating the implications of FAS 157 and its impact on the financial statements has not yet been determined.
38 Smith Barney Money Funds, Inc. 2006 Annual Report
Report of Independent Registered Public Accounting Firm
The Board of Directors and Shareholders
Smith Barney Money Funds, Inc.:
We have audited the accompanying statements of assets and liabilities, including the schedules of investments, of Cash Portfolio and Government Portfolio, each a series of Smith Barney Money Funds, Inc., as of December 31, 2006, and the related statements of operations for the year then ended, the statements of changes in net assets for each of the years in the two-year period then ended, and the financial highlights for each of the years or periods in the five-year period then ended. These financial statements and financial highlights are the responsibility of the Funds’ management. Our responsibility is to express an opinion on these financial statements and financial highlights based on our audits.
We conducted our audits in accordance with the standards of the Public Company Accounting Oversight Board (United States). Those standards require that we plan and perform the audit to obtain reasonable assurance about whether the financial statements and financial highlights are free of material misstatement. An audit includes examining, on a test basis, evidence supporting the amounts and disclosures in the financial statements. Our procedures included confirmation of securities owned as of December 31, 2006, by correspondence with the custodian and brokers or by other appropriate auditing procedures. An audit also includes assessing the accounting principles used and significant estimates made by management, as well as evaluating the overall financial statement presentation. We believe that our audits provide a reasonable basis for our opinion.
In our opinion, the financial statements and financial highlights referred to above present fairly, in all material respects, the financial position of Cash Portfolio and Government Portfolio as of December 31, 2006, and the results of their operations for the year then ended, the changes in their net assets for each of the two-year period then ended and the financial highlights for each of the years or periods in the five-year period then ended in conformity with U.S. generally accepted accounting principles.

New York, New York
February 26, 2007
Smith Barney Money Funds, Inc. 2006 Annual Report 39
Additional Information (unaudited)
Information about Directors and Officers
The business and affairs of the Cash Portfolio and Government Portfolio (“Funds”) are managed under the direction of the Board of Directors of the Smith Barney Money Funds, Inc. (the “Company”). Information pertaining to the Directors and Officers of the Company is set forth below. The Statement of Additional Information includes additional information about the Directors and is available, without charge, upon request by calling Shareholder Services at 1-800-451-2010.
| Name, Address and Birth Year | Position(s) Held with | Term of Office* and Length of Time Served | Principal Occupation(s) During Past | Number of Portfolios in Fund Complex Overseen by Director | Other Board | |||||
| Non-Interested Directors: | ||||||||||
Lee Abraham 13732 LeHavre Drive Frenchman’s Creek Palm Beach Gardens, FL 33410 Birth Year: 1927 | Director | Since 1999 | Retired; Former Director of Signet Group PLC | 27 | None | |||||
Jane F. Dasher Korsant Partners 283 Greenwich Avenue 3rd Floor Greenwich, CT 06830 Birth Year: 1949 | Director | Since 1999 | Controller of PBK Holdings Inc., a family investment company | 27 | None | |||||
Donald R. Foley 3668 Freshwater Drive Jupiter, FL 33477 Birth Year: 1922 | Director | Since 1982 | Retired | 27 | None | |||||
Richard E. Hanson, Jr. 2751 Vermont Route 140 Poultney, VT 05764 Birth Year: 1941 | Director | Since 1999 | Retired; Former Head of the New Atlanta Jewish Community High School | 27 | None | |||||
Paul Hardin 12083 Morehead Chapel Hill, NC 27514-8426 Birth Year: 1931 | Director | Since 1994 | Professor of Law & Chancellor Emeritus at the University of North Carolina | 34 | None | |||||
Roderick C. Rasmussen 9 Cadence Court Morristown, NJ 07960 Birth Year: 1926 | Director | Since 1982 | Investment Counselor | 27 | None | |||||
John P. Toolan 7202 Southeast Golf Ridge Way Hobe Sound, Florida 33455 Birth Year: 1930 | Director | Since 1992 | Retired | 27 | None | |||||
40 Smith Barney Money Funds, Inc.
Additional Information (unaudited) (continued)
| Name, Address and Birth Year | Position(s) Held with | Term of Office* and Length of Time Served | Principal Occupation(s) During Past | Number of Portfolios in Fund Complex Overseen by Director | Other Board | |||||
| Interested Trustee: | ||||||||||
R. Jay Gerken, CFA** Legg Mason & Co. LLC (Legg Mason) 399 Park Avenue, 4th Floor New York, NY 10022 Birth Year: 1951 | Chairman, President and Chief Executive Officer | Since 2002 | Managing Director of Legg Mason; President and Chief Executive Officer of Legg Mason Partners Fund Advisors, LLC (“LMPFA”) (Since 2006); President and Chief Executive Officer of Smith Barney Fund Management LLC (“SBFM”) and Citi Fund Management Inc. (“CFM”); President and Chief Executive Officer of certain mutual funds associated with Legg Mason; Formerly, Chairman of SBFM and CFM (from 2002 to 2006); Formerly, Chairman, President and Chief Executive Officer of Travelers Investment Advisers, Inc. (from 2002 to 2005) | 162 | None | |||||
| Officers: | ||||||||||
Robert J. Brault Legg Mason 125 Broad Street, 11th Floor New York, NY 10004 Birth Year: 1965 | Chief Financial Officer and Treasurer | Since 2004 | Director of Legg Mason; Chief Financial Officer and Treasurer of certain mutual funds associated with Legg Mason; Director of Internal Control for CAM U.S. Mutual Fund Administration (from 2002 to 2004); Director of Project Management & Information Systems for CAM U.S. Mutual Fund Administration (from 2000 to 2002) | N/A | N/A | |||||
Smith Barney Money Funds, Inc. 41
Additional Information (unaudited) (continued)
| Name, Address and Birth Year | Position(s) Held with | Term of Office* and Length of Time Served | Principal Occupation(s) During Past | Number of Portfolios in Fund Complex Overseen by Director | Other Board | |||||
Ted P. Becker Legg Mason 399 Park Avenue, 4th Floor New York, NY 10022 Birth Year: 1951 | Chief Compliance Officer | Since | Director of Global Compliance at Legg Mason (since 2006); Chief Compliance Officer of LMPFA (since 2006); Managing Director of Compliance at Legg Mason (since 2005); Chief Compliance Officer with certain mutual funds associated with Legg Mason (since 2006); Managing Director of Compliance at Legg Mason or its predecessor (2002 to 2005); Prior to 2002, Managing Director-Internal Audit & Risk Review at Citigroup Inc. | N/A | N/A | |||||
John Chiota Legg Mason 300 First Stamford Plaza 4th Floor Stamford, CT 06902 Birth Year: 1968 | Chief Anti-Money Laundering Compliance Officer | Since | Vice President of Legg Mason or its predecessor (since 2004); Chief Anti-Money Laundering Compliance Officer with certain mutual funds associated with Legg Mason (since 2006); Prior to August 2004, Chief AML Compliance Officer with TD Waterhouse | N/A | N/A | |||||
Robert I. Frenkel Legg Mason 300 First Stamford Place 4th Floor Stamford, CT 06902 Birth Year: 1954 | Secretary and Chief Legal Officer | Since 2003 | Managing Director and General Counsel of Global Mutual Funds for Legg Mason and its predecessors (since 1994); Secretary and Chief Legal Officer of mutual funds associated with Legg Mason (since 2003); Formerly, Secretary of CFM (from 2001 to 2004) | N/A | N/A | |||||
| * | Each Director and officer serves until his or her successor has been duly elected and qualified. |
| ** | Mr. Gerken is an “interested person” of the Fund as defined in the Investment Company Act of 1940, as amended, because Mr. Gerken is an officer of LMPFA and certain of its affiliates. |
42 Smith Barney Money Funds, Inc.
Additional Shareholder Information (unaudited)
Results of Special Meeting of Shareholders
On January 29, 2007, a Special Meeting of Shareholders was held to vote on various proposals recently approved by the Funds’ Board Members. The following tables provide the number of votes cast for, against or witheld, as well as the number of abstentions and as to the following proposals: (1) Elect Board Members and (2) Revise Fundamental Investment Policies.
Proposal 1: Election of Board Members†
| Nominees | Votes For | Authority Withheld | Abstentions | |||
Elliot J. Berv | 12,467,086,228.188 | 602,654,007.857 | 302,825.281 | |||
A. Benton Cocanougher | 12,470,732,271.337 | 599,007,964.708 | 302,825.281 | |||
Jane F. Dasher | 12,462,461,614.682 | 607,278,621.363 | 302,825.281 | |||
Mark T. Finn | 12,472,044,859.124 | 597,695,376.921 | 302,825.281 | |||
Rainer Greeven | 12,464,177,206.150 | 605,563,029.895 | 302,825.281 | |||
Stephen Randolph Gross | 12,469,705,810.509 | 600,064,425.536 | 302,825.281 | |||
Richard E. Hanson Jr. | 12,467,138,727.637 | 602,601,508.408 | 302,825.281 | |||
Diana R. Harrington | 12,468,701,687.383 | 601,038,548.662 | 302,825.281 | |||
Susan M. Heilbron | 12,472,938,700.383 | 596,801,535.622 | 302,825.281 | |||
Susan B. Kerley | 12,472,879,608.515 | 596,860,627.530 | 302,825.281 | |||
Alan G. Merten | 12,468,854,357.263 | 600,885,878.782 | 302,825.281 | |||
R. Richardson Pettit | 12,471,312,893.357 | 598,427,342.688 | 302,825.281 | |||
R. Jay Gerken, CFA | 12,456,114,589.907 | 613,625,646.138 | 302,825.281 | |||
| † | Board Members are elected by the shareholders of all of the series of the Company of which the Fund is a series. |
Proposal 2: Revise Fundamental Investment Policies
| Items Voted On | Votes For | Votes | Abstentions | Broker Non-Votes | ||||
Cash Portfolio | ||||||||
Borrowing Money | 10,975,269,398.567 | 346,843,508.558 | 331,728,464.921 | 30,795,751.000 | ||||
Underwriting | 10,990,156,243.246 | 332,152,791.108 | 331,532,337.692 | 30,795,751.000 | ||||
Lending | 10,972,266,695.470 | 346,759,190.767 | 334,815,485.809 | 30,795,751.000 | ||||
Issuing Senior Securities | 10,998,090,552.413 | 335,822,204.263 | 319,928,615.370 | 30,795,751.000 | ||||
Real Estate | 10,986,467,768.685 | 333,612,389.925 | 333,761,213.436 | 30,795,751.000 | ||||
Commodities | 10,960,846,863.520 | 352,213,961.182 | 340,780,547.344 | 30,795,751.000 | ||||
Concentration | 10,975,782,179.019 | 342,058,945.120 | 336,000,247.907 | 30,795,751.000 | ||||
Diversification | 10,980,261,545.925 | 340,693,076.166 | 332,886,749.955 | 30,795,751.000 | ||||
Non-Fundamental | 10,666,336,529.120 | 651,142,341.271 | 336,362,501.655 | 30,795,751.000 | ||||
Smith Barney Money Funds, Inc. 43
Additional Shareholder Information (unaudited) (continued)
| Items Voted On | Votes For | Votes | Abstentions | Broker Non-Votes | ||||
Government Portfolio | ||||||||
Borrowing Money | 1,218,091,505.670 | 58,933,158.510 | 36,749,084.100 | 71,632,190.000 | ||||
Underwriting | 1,215,737,341.090 | 59,929,747.090 | 38,106,660.100 | 71,632,190.000 | ||||
Lending | 1,215,367,389.200 | 61,113,638.580 | 37,292,720.500 | 71,632,190.000 | ||||
Issuing Senior Securities | 1,216,838,301.980 | 59,078,652.910 | 37,856,793.390 | 71,632,190.000 | ||||
Real Estate | 1,223,099,887.840 | 53,181,987.230 | 37,491,873.210 | 71,632,190.000 | ||||
Commodities | 1,214,480,185.040 | 60,461,658.560 | 38,831,904.680 | 71,632,190.000 | ||||
Concentration | 1,223,775,589.540 | 51,079,466.460 | 38,918,692.280 | 71,632,190.000 | ||||
Diversification | 1,214,485,300.270 | 61,184,377.520 | 38,104,070.490 | 71,632,190.000 | ||||
Non-Fundamental | 1,182,997,184.880 | 72,056,284.630 | 58,720,278.770 | 71,632,190.000 | ||||
44 Smith Barney Money Funds, Inc. 2006 Annual Report
Important Tax Information (unaudited)
The following information is provided with respect to the distributions paid monthly by the Funds during the taxable year ended December 31, 2006:
| Cash Portfolio | Government Portfolio | |||||
Interest from Federal Obligations | 1.21 | % | 36.76 | % | ||
The law varies in each state as to whether and what percentage of dividend income attributable to Federal obligations is exempt from state income tax. We recommend that you consult with your tax adviser to determine if any portion of the dividends you received is exempt from state income taxes.
Please retain this information for your records.
Smith Barney Money Funds, Inc. 45
Smith Barney
Money Funds, Inc.
Cash Portfolio
Government Portfolio
DIRECTORS Lee Abraham Jane F. Dasher Donald R. Foley R. Jay Gerken, CFA Richard E. Hanson, Jr. Paul Hardin Roderick C. Rasmussen John P. Toolan
| INVESTMENT MANAGER Legg Mason Partners
SUBADVISER Western Asset Management Company
DISTRIBUTORS Citigroup Global Markets Inc. Legg Mason Investor Services, LLC PFS Investments Inc.
CUSTODIAN State Street Bank and
TRANSFER AGENTS PFPC Inc. 4400 Computer Drive Westborough, Massachusetts 01581
Boston Financial Data Services, Inc. 2 Heritage Drive North Quincy, Massachusetts 02171
INDEPENDENT REGISTERED PUBLIC ACCOUNTING FIRM KPMG LLP 345 Park Avenue New York, New York 10154 |
This report is submitted for general information of the shareholders of Smith Barney Money Funds, Inc., but it may also be used as sales literature when preceded or accompanied by the current prospectus.
This report must be preceded or accompanied by a free prospectus. Investors should consider the Funds’ investment objectives, risks, charges and expenses carefully before investing. The prospectus contains this and other important information about the Funds. Please read the prospectus carefully before investing.
www.leggmason.com/InvestorServices
©2007 Legg Mason Investor Services, LLC
Member NASD, SIPC
| FD0858 2/07 | SR07-276 |
Smith Barney Money Funds, Inc.
Cash Portfolio
Government Portfolio
The Funds are separate investment funds of the Smith Barney Money Funds, Inc., a Maryland corporation.
SMITH BARNEY MONEY FUNDS, INC.
125 Broad Street
10th Floor, MF-2
New York, New York 10004
The Funds file their complete schedule of portfolio holdings with the Securities and Exchange Commission (“Commission”) for the first and third quarters of each fiscal year on Form NQs. The Funds’ Form NQs are available on the Commission’s website at www.sec.gov. The Funds’ Form NQs may be reviewed and copied at the Commission’s Public Reference Room in Washington, D.C., and information on the operation of the Public Reference Room may be obtained by calling 1-800-SEC-0330. To obtain information on Form N-Q from the Funds, shareholders can call 1-800-451-2010
Information on how the Funds voted proxies relating to portfolio securities during the prior 12-month period ended June 30th of each year, and a description of the policies and procedures that the Funds use to determine how to vote proxies relating to portfolio securities is available (1) without charge, upon request, by calling 1-800-451-2010, (2) on the Funds’ website at www.leggmason.com/InvestorServices and (3) on the SEC’s website at www.sec.gov.
| ITEM 2. | CODE OF ETHICS. |
The registrant has adopted a code of ethics that applies to the registrant’s principal executive officer, principal financial officer, principal accounting officer or controller.
| ITEM 3. | AUDIT COMMITTEE FINANCIAL EXPERT. |
The Board of Directors of the registrant has determined that Jane Dasher, the Chairperson of the Board’s Audit Committee, possesses the technical attributes identified in Instruction 2(b) of Item 3 to Form N-CSR to qualify as an “audit committee financial expert,” and has designated Ms. Dasher as the Audit Committee’s financial expert. Ms. Dasher is an “independent” Director pursuant to paragraph (a)(2) of Item 3 to Form N-CSR.
| ITEM 4. | PRINCIPAL ACCOUNTANT FEES AND SERVICES. |
a) Audit Fees. The aggregate fees billed in the last two fiscal years ending December 31, 2005 and December 31, 2006 (the “Reporting Periods”) for professional services rendered by the Registrant’s principal accountant (the “Auditor”) for the audit of the Registrant’s annual financial statements, or services that are normally provided by the Auditor in connection with the statutory and regulatory filings or engagements for the Reporting Periods, were $94,000 in 2005 and $94,000 in 2006.
b) Audit-Related Fees. There were no fees billed in the Reporting Periods for assurance and related services by the Auditor that are reasonably related to the performance of the audit of the Registrant’s financial statements and are not reported under paragraph (a) of this Item 4.
In addition, there were no Audit-Related Fees billed in the Reporting Period for assurance and related services by the Auditor to the Registrant’s investment adviser (not including any sub-adviser whose role is primarily portfolio management and is subcontracted with or overseen by another investment adviser), and any entity controlling, controlled by or under common control with the investment adviser that provides ongoing services to the Smith Barney Money Funds, Inc. (“service affiliates”), that were reasonably related to the performance of the annual audit of the service affiliates. Accordingly, there were no such fees that required pre-approval by the Audit Committee for the Reporting Periods (prior to May 6, 2003 services provided by the Auditor were not required to be pre-approved).
(c) Tax Fees. The aggregate fees billed in the Reporting Periods for professional services rendered by the Auditor for tax compliance, tax advice and tax planning (“Tax Services”) were $4,000 in 2005 and $4,000 in 2006. These services consisted of (i) review or preparation of U.S. federal, state, local and excise tax returns; (ii) U.S. federal, state and local tax planning, advice and assistance regarding statutory, regulatory or administrative developments, and (iii) tax advice regarding tax qualification matters and/or treatment of various financial instruments held or proposed to be acquired or held.
There were no fees billed for tax services by the Auditors to service affiliates during the Reporting Periods that required pre-approval by the Audit Committee.
d) All Other Fees. There were no other fees billed in the Reporting Periods for products and services provided by the Auditor, other than the services reported in paragraphs (a) through (c) of this Item for the Smith Barney Money Funds, Inc.
All Other Fees. There were no other non-audit services rendered by the Auditor to Smith Barney Fund Management LLC (“SBFM”), and any entity controlling, controlled by or under common control with SBFM that provided ongoing services to Smith Barney Money Funds, Inc.requiring pre-approval by the Audit Committee in the Reporting Period.
(e) Audit Committee’s pre–approval policies and procedures described in paragraph (c) (7) of Rule 2-01 of Regulation S-X.
(1) The Charter for the Audit Committee (the “Committee”) of the Board of each registered investment company (the “Fund”) advised by Smith Barney Fund Management LLC or Salomon Brothers Asset Management Inc. or one of their affiliates (each, an “Adviser”) requires that the Committee shall approve (a) all audit and permissible non-audit services to be provided to the Fund and (b) all permissible non-audit services to be provided by the Fund’s independent auditors to the Adviser and any Covered Service Providers if the engagement relates directly to the operations and financial reporting of the Fund. The Committee may implement policies and procedures by which such services are approved other than by the full Committee.
The Committee shall not approve non-audit services that the Committee believes may impair the independence of the auditors. As of the date of the approval of this Audit Committee Charter, permissible non-audit services include any professional services (including tax services), that are not prohibited services as described below, provided to the Fund by the independent auditors, other than those provided to the Fund in connection with an audit or a review of the financial statements of the Fund. Permissible non-audit services may not include: (i) bookkeeping or other services related to the accounting records or financial statements of the Fund; (ii) financial information systems design and implementation; (iii) appraisal or valuation services, fairness opinions or contribution-in-kind reports; (iv) actuarial services; (v) internal audit outsourcing services; (vi) management functions or human resources; (vii) broker or dealer, investment adviser or investment banking services; (viii) legal services and expert services unrelated to the audit; and (ix) any other service the Public Company Accounting Oversight Board determines, by regulation, is impermissible.
Pre-approval by the Committee of any permissible non-audit services is not required so long as: (i) the aggregate amount of all such permissible non-audit services provided to the Fund, the Adviser and any service providers controlling, controlled by or under common control with the Adviser that provide ongoing services to the Fund (“Covered Service Providers”) constitutes not more than 5% of the total amount of revenues paid to the independent auditors during the fiscal year in which the permissible non-audit services are provided to (a) the Fund, (b) the Adviser and (c) any entity controlling, controlled by or under common control with the Adviser that provides ongoing services to the Fund during the fiscal year in which the services are provided that would have to be approved by the Committee; (ii) the permissible non-audit services were not recognized by the Fund at the time of the engagement to be non-audit services; and (iii) such services are promptly brought to the attention of the Committee and approved by the Committee (or its delegate(s)) prior to the completion of the audit.
(2) For the Legg Mason Partners Investment Trust, the percentage of fees that were approved by the audit committee, with respect to: Audit-Related Fees were 100% and 0% for 2005 and 2006; Tax Fees were 100% and 0% for 2005 and 2006; and Other Fees were 100% and 0% for 2005 and 2006.
(f) N/A
(g) Non-audit fees billed by the Auditor for services rendered to Smith Barney Money Funds, Inc. and CAM and any entity controlling, controlled by, or under common control with CAM that provides ongoing services to Smith Barney Money Funds, Inc. during the reporting period were $0 in 2006 for fees related to the transfer agent matter as fully described in the notes the financial statements titled “additional information” and $75,000 for 2005.
(h) Yes. Smith Barney Money Funds, Inc.’s Audit Committee has considered whether the provision of non-audit services that were rendered to Service Affiliates, which were not pre-approved (not requiring pre-approval), is compatible with maintaining the Accountant’s independence. All services provided by the Auditor to the Smith Barney Money Funds, Inc. or to Service Affiliates, which were required to be pre-approved, were pre-approved as required.
| ITEM 5. | AUDIT COMMITTEE OF LISTED REGISTRANTS. |
Not applicable.
| ITEM 6. | SCHEDULE OF INVESTMENTS. |
Included herin under Item 1.
| ITEM 7. | DISCLOSURE OF PROXY VOTING POLICIES AND PROCEDURES FOR CLOSED-END MANAGEMENT INVESTMENT COMPANIES. |
Not applicable.
| ITEM 8. | PORTFOLIO MANAGERS OF CLOSED-END MANAGEMENT INVESTMENT COMPANIES. |
Not applicable.
| ITEM 9. | PURCHASES OF EQUITY SECURITIES BY CLOSED-END MANAGEMENT INVESTMENT COMPANY AND AFFILIATED PURCHASERS. |
Not applicable.
| ITEM 10. | SUBMISSION OF MATTERS TO A VOTE OF SECURITY HOLDERS. |
Not applicable.
| ITEM 11. | CONTROLS AND PROCEDURES. |
| (a) | The registrant’s principal executive officer and principal financial officer have concluded that the registrant’s disclosure controls and procedures (as defined in Rule 30a- 3(c) under the Investment Company Act of 1940, as |
amended (the “1940 Act”)) are effective as of a date within 90 days of the filing date of this report that includes the disclosure required by this paragraph, based on their evaluation of the disclosure controls and procedures required by Rule 30a-3(b) under the 1940 Act and 15d-15(b) under the Securities Exchange Act of 1934. |
| (b) | There were no changes in the registrant’s internal control over financial reporting (as defined in Rule 30a-3(d) under the 1940 Act) that occurred during the registrant’s last fiscal half-year (the registrant’s second fiscal half-year in the case of an annual report) that have materially affected, or are likely to materially affect the registrant’s internal control over financial reporting. |
| ITEM 12. | EXHIBITS. |
(a)(1) Code of Ethics attached hereto.
Exhibit 99.CODE ETH
(a) (2) Certifications pursuant to section 302 of the Sarbanes-Oxley Act of 2002 attached hereto.
Exhibit 99.CERT
(b) Certifications pursuant to Section 906 of the Sarbanes-Oxley Act of 2002 attached hereto.
Exhibit 99.906CERT
SIGNATURES
Pursuant to the requirements of the Securities Exchange Act of 1934 and the Investment Company Act of 1940, the registrant has duly caused this Report to be signed on its behalf by the undersigned, there unto duly authorized.
Smith Barney Money Funds, Inc. | ||
By: | /s/ R. Jay Gerken | |
| (R. Jay Gerken) | ||
| Chief Executive Officer of | ||
| Smith Barney Money Funds, Inc. | ||
Date: | March 9, 2007 | |
Pursuant to the requirements of the Securities Exchange Act of 1934 and the Investment Company Act of 1940, this report has been signed below by the following persons on behalf of the registrant and in the capacities and on the dates indicated.
By: | /s/ R. Jay Gerken | |
| (R. Jay Gerken) | ||
| Chief Executive Officer of | ||
| Smith Barney Money Funds, Inc. | ||
Date: | March 9, 2007 | |
By: | /s/ Robert J. Brault | |
| (Robert J. Brault) | ||
| Chief Financial Officer of | ||
| Smith Barney Money Funds, Inc. | ||
Date: | March 9, 2007 | |