UNITED STATES
SECURITIES AND EXCHANGE COMMISSION
Washington, DC 20549
FORM N-CSRS
CERTIFIED SHAREHOLDER REPORT OF REGISTERED MANAGEMENT INVESTMENT COMPANIES
Investment Company Act file number 811-01608
Franklin High Income Trust
(Exact name of registrant as specified in charter)
One Franklin Parkway, San Mateo, CA 94403-1906
(Address of principal executive offices) (Zip code)
Craig S. Tyle, One Franklin Parkway, San Mateo, CA 94403-1906
(Name and address of agent for service)
Registrant’s telephone number, including area code: 650 312-2000
Date of fiscal year end: 5/31
Date of reporting period: 11/30/17
Item 1. Reports to Stockholders.
Franklin Templeton Investments
Gain From Our Perspective®
At Franklin Templeton Investments, we’re dedicated to one goal: delivering exceptional asset management for our clients. By bringing together multiple, world-class investment teams in a single firm, we’re able to offer specialized expertise across styles and asset classes, all supported by the strength and resources of one of the world’s largest asset managers. This has helped us to become a trusted partner to individual and institutional investors across the globe.
Dear Shareholder:
During the six months ended November 30, 2017, generally upbeat economic data encouraging corporate earnings and a supportive monetary policy were positives for US securities markets. At its June meeting, the US Federal Reserve (Fed) raised its target range for the federal funds rate 0.25% to 1.00%–1.25% amid signs of a growing US economy. The 10-year US Treasury yield began the period at 2.21% and ended the period at 2.42%. In this environment, investment-grade bonds, as measured by the Bloomberg Barclays US Aggregate Bond Index, posted a +0.68% total return.1 Below investment-grade bonds, as measured by the Credit Suisse High Yield Index, generated a +2.24% total return.2
A couple of weeks after the end of the reporting period, the Fed raised its target range a quarter point to 1.25%–1.50% amid ongoing labor market strength and rising economic activity in the US. The Fed’s inflation outlook remained essentially the same.
We are committed to our long-term perspective and disciplined investment approach as we conduct a rigorous, fundamental analysis of securities with a regular emphasis on investment risk management.
We believe active, professional investment management serves investors well. We also recognize the important role of financial advisors in today’s markets and encourage investors to continue to seek their advice. Amid changing markets and economic conditions, we are confident investors with a
well-diversified portfolio and a patient, long-term outlook should be well positioned for the years ahead.
In addition, Franklin High Income Fund’s semiannual report includes more detail about prevailing conditions and a discussion about investment decisions during the period. Please remember all securities markets fluctuate, as do mutual fund share prices.
We thank you for investing with Franklin Templeton, welcome your questions and comments, and look forward to serving your future investment needs.
Sincerely,

Christopher J. Molumphy, CFA
President and Chief Executive Officer –
Investment Management
Franklin High Income Trust
This letter reflects our analysis and opinions as of November 30, 2017, unless otherwise indicated. The information is not a complete analysis of every aspect of any market, country, industry, security or fund. Statements of fact are from sources considered reliable.
CFA® is a trademark owned by CFA Institute.
1. Source: Morningstar.
See www.franklintempletondatasources.com for additional data provider information.
2. Source: Credit Suisse Group.
| | |
| | Not FDIC Insured | May Lose Value | No Bank Guarantee |
| | | | |
| | | |
franklintempleton.com | | Not part of the semiannual report | | 1 |
Contents
Semiannual Report
Visit franklintempleton.com for fund updates, to access your account, or to find helpful financial planning tools.
| | | | |
| | | |
2 | | Semiannual Report | | franklintempleton.com |
Semiannual Report
Franklin High Income Fund
This semiannual report for Franklin High Income Fund covers the period ended November 30, 2017.
Your Fund’s Goals and Main Investments
The Fund seeks a high level of current income, with a secondary goal of capital appreciation, by investing predominantly in high yield, lower rated debt securities including bonds, notes, debentures, convertible securities and senior and subordinated debt securities. The Fund may also invest in preferred stocks.
Performance Overview
The Fund’s Class A shares had a +1.58% cumulative total return for the six months under review. In comparison, the benchmark Credit Suisse (CS) High Yield Index, which tracks the high yield debt market, returned +2.24%.1 The Fund’s peers had a +2.01% total return, as measured by the Lipper High Yield Funds Classification Average, which consists of funds chosen by Lipper that aim at high relative current yield from fixed income securities.2 You can find more of the Fund’s performance data in the Performance Summary beginning on page 6.
Performance data represent past performance, which does not guarantee future results. Investment return and principal value will fluctuate, and you may have a gain or loss when you sell your shares. Current performance may differ from figures shown. For most recent month-end performance, go to franklintempleton.com or call (800) 342-5236.
Economic and Market Overview
The US economy grew during the six months under review. The economy strengthened in 2017’s third quarter compared to the second quarter, largely due to growth in consumer spending across goods and services, business and inventory investment, as well as net exports due to lower imports. The manufacturing and services sectors expanded during the period. The
Asset Allocation
Based on Total Net Assets as of 11/30/17
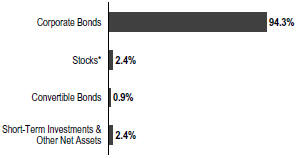
*Includes common, convertible preferred stocks, escrows and litigation trusts as well as other equity investments.
unemployment rate decreased from 4.3% in May 2017 to 4.1% at period-end.3 Monthly retail sales were volatile but positive on average during the period. Annual inflation, as measured by the Consumer Price Index, increased from 1.9% in May 2017 to 2.2% at period-end.3
At its June meeting, the US Federal Reserve (Fed) raised its target range for the federal funds rate 0.25% to 1.00%–1.25%, amid signs of a growing US economy, strengthening labor market and improving business spending. At its subsequent meetings, the Fed kept its target range unchanged. However, minutes of its October 31–November 1 meeting indicated that the Fed continued to maintain a positive outlook for the US economy and signaled the possibility of a third rate hike in 2017, though concerns about the ongoing softness in inflation remained.
The 10-year Treasury yield, which moves inversely to its price, shifted throughout the period. The yield rose in June amid renewed optimism for improvement in economic growth and was supported in July by hawkish comments from key central bankers around the world. Easing concerns about Hurricane Irma’s economic impact, the Fed’s balance sheet normalization beginning in October and strong economic data also pushed the
1. Source: Credit Suisse Group.
2. Source: Lipper, a Thomson Reuters Company. For the six-month period ended 11/30/17, this category consisted of 709 funds. Lipper calculations do not include sales charges or expense subsidization by a fund’s manager. Fund performance relative to the average may have differed if these or other factors had been considered. The indexes are unmanaged and include reinvestment of any income or distributions. They do not reflect any fees, expenses or sales charges. One cannot invest directly in an index, and an index is not representative of the Fund’s portfolio.
3. Source: Bureau of Labor Statistics.
The dollar value, number of shares or principal amount, and names of all portfolio holdings are listed in the Fund’s Statement of Investments (SOI). The SOI begins on page 14.
| | | | |
| | | |
| franklintempleton.com | | Semiannual Report | | 3 |
FRANKLIN HIGH INCOME FUND
yield higher. However, several factors weighed on the Treasury yield at certain points during the period, including tensions between the US and North Korea; uncertainty on whether the Fed would raise rates in December 2017; and the appointment of Jerome Powell, viewed as more dovish than other contenders, as the next Fed chair. Near period-end, the Senate’s approval of a budget plan and subsequent vote to begin debate on a tax reform bill raised expectations for reforms and drove the yield higher. Overall, the 10-year Treasury yield rose from 2.21% at the beginning of the period to 2.42% at period-end.
Investment Strategy
We are research driven, fundamental investors who rely on our team of analysts to provide in-depth industry expertise and use qualitative and quantitative analysis to evaluate companies. As bottom-up investors, we focus primarily on individual securities but consider sectors when choosing investments and, from time to time, may have significant investments in certain sectors. In selecting securities, we do not rely principally on the ratings assigned by rating agencies, but perform our own independent investment analysis to evaluate the creditworthiness of the issuer. We consider a variety of factors, including the issuer’s experience and managerial strength, its sensitivity to economic conditions, and its current and prospective financial condition.
Manager’s Discussion
Over the past six months, the financial markets largely shrugged off events such as the UK’s vote to exit the European Union and escalating tension between the US and North Korea. Instead, the markets generally focused on the continuation of moderate US economic growth and generally supportive central bank policies globally. Overall, US stocks held near a record high, largely driven by investor expectations for US tax reform. At period-end, the 10-year US Treasury yield reached 2.42%, which was lower than historical levels and continued to support returns across the fixed income sector. The Fed moved to normalize policy and raised its benchmark rate 25 basis points in June 2017 based on economic growth that appeared sustainable, if moderate, and a declining unemployment rate.
As moderate economic growth continued and commodity-related defaults from 2016 became less of a factor, the default rate declined at the end of November to the lowest level since March 2014.4 The declining default rate helped the
Dividend Distributions*
6/1/17–11/30/17
| | | | | | | | | | | | | | | | | | | | |
| | | | | | Dividend per Share (cents) | | | | |
| | | | | | | | | | | | | | | Advisor | |
| Month | | Class A | | | Class C | | | Class R | | | Class R6 | | | Class | |
June | | | 0.83 | | | | 0.75 | | | | 0.77 | | | | 0.87 | | | | 0.85 | |
July | | | 0.83 | | | | 0.75 | | | | 0.77 | | | | 0.87 | | | | 0.85 | |
August | | | 0.83 | | | | 0.75 | | | | 0.77 | | | | 0.87 | | | | 0.85 | |
September | | | 0.83 | | | | 0.74 | | | | 0.77 | | | | 0.87 | | | | 0.85 | |
October | | | 0.83 | | | | 0.74 | | | | 0.77 | | | | 0.87 | | | | 0.85 | |
November | | | 0.83 | | | | 0.74 | | | | 0.77 | | | | 0.87 | | | | 0.85 | |
Total | | | 4.98 | | | | 4.47 | | | | 4.62 | | | | 5.22 | | | | 5.10 | |
*The distribution amount is the sum of all estimated tax-basis net investment income distributions for the period shown. A portion or all of the distribution may be reclassified as return of capital or short-term or long-term capital gains once final tax designations are known. All Fund distributions will vary depending upon current market conditions, and past distributions are not indicative of future trends.
performance of the high yield corporate bond market. The broad recovery in the energy sector and metals and mining industry that began in 2016 also continued to benefit from the high yield corporate bond market’s performance.5 Although the metals and mining industry and utilities sector were among the best performers during the period, the health care sector experienced heightened volatility driven by policy uncertainty surrounding congressional efforts to repeal and replace the Affordable Care Act.6
The technical trading environment continued to support high yield returns as well. New issue activity continued to be fairly light with many of the proceeds allocated toward refinancing existing debt. This trend resulted in an undersupplied high yield market relative to investor demand. As a result, yield spreads to treasuries with comparable maturities contracted over the period, ending within their long-term historical averages.
The Fund underperformed its benchmark, the CS High Yield Index, as well as its peers, as represented by the Lipper High Yield Funds Classification Average.
Despite an increase in oil prices during the period, the primary detractor from the Fund’s relative performance was the energy sector. During the period, certain holdings revealed a more challenging operating picture than we anticipated, and the market reacted accordingly. The Fund remained underweighted in the energy sector relative to the CS High Yield Index, although it is the Fund’s largest sector allocation in absolute terms.
4. Source: JP Morgan.
5. Metals and mining is part of materials in the SOI.
6. The health care sector comprises health care equipment and services and pharmaceuticals, biotechnology and life sciences in the SOI.
| | | | |
| | | |
4 | | Semiannual Report | | franklintempleton.com |
FRANKLIN HIGH INCOME FUND
Top 10 Holdings by Issuer*
11/30/17
| | | | |
Company Sector/Industry | | % of Total
Net Assets | |
HCA Inc. | | | 1.9 | % |
Health Care Equipment & Services | | | | |
Navient Corp. | | | 1.8 | % |
Diversified Financials | | | | |
Citigroup Inc. | | | 1.7 | % |
Banks | | | | |
Sprint Communications Inc. | | | 1.6 | % |
Telecommunications Services | | | | |
Valeant Pharmaceuticals International Inc. | | | 1.6 | % |
Pharmaceuticals, Biotechnology & Life Sciences | | | | |
First Data Corp. | | | 1.5 | % |
Software & Services | | | | |
CSC Holdings LLC | | | 1.3 | % |
Media | | | | |
CCO Holdings LLC/CCO Holdings Capital Corp. | | | 1.3 | % |
Media | | | | |
Dynegy Inc. | | | 1.2 | % |
Utilities | | | | |
Post Holdings Inc. | | | 1.2 | % |
Food, Beverage & Tobacco | | | | |
*Securities are listed by issuer, which may appear by another name in the SOI.
Looking at sectors that drove the Fund’s relative performance, the Fund’s exposure to utilities was a significant contributor. During the period, we maintained a significant overweighting in utilities. Our holdings benefited from their ability to improve operating margins through various initiatives, including mergers and acquisitions. The Fund’s underweighting in the wireless telecommunication services industry also aided relative performance as some of the industry’s larger issuers reported earnings results that fell short of consensus forecasts.7
Thank you for your continued participation in Franklin High Income Fund. We look forward to serving you future investment needs.
| | |
 | |  |
| | Christopher J. Molumphy, CFA |
| |
 | |  |
| | Glenn I. Voyles, CFA |
| | Portfolio Management Team |
The foregoing information reflects our analysis, opinions and portfolio holdings as of November 30, 2017, the end of the reporting period. The way we implement our main investment strategies and the resulting portfolio holdings may change depending on factors such as market and economic conditions. These opinions may not be relied upon as investment advice or an offer for a particular security. The information is not a complete analysis of every aspect of any market, country, industry, security or the Fund. Statements of fact are from sources considered reliable, but the investment manager makes no representation or warranty as to their completeness or accuracy. Although historical performance is no guarantee of future results, these insights may help you understand our investment management philosophy.
7. Wireless telecommunication services is in telecommunication services in the SOI.
See www.franklintempletondatasources.com for additional data provider information.
| | | | |
| | | |
franklintempleton.com | | Semiannual Report | | 5 |
FRANKLIN HIGH INCOME FUND
Performance Summary as of November 30, 2017
The performance tables do not reflect any taxes that a shareholder would pay on Fund dividends, capital gain distributions, if any, or any realized gains on the sale of Fund shares. Total return reflects reinvestment of the Fund’s dividends and capital gain distributions, if any, and any unrealized gains or losses. Your dividend income will vary depending on dividends or interest paid by securities in the Fund’s portfolio, adjusted for operating expenses of each class. Capital gain distributions are net profits realized from the sale of portfolio securities.
Performance as of 11/30/171
Cumulative total return excludes sales charges. Average annual total return includes maximum sales charges. Sales charges will vary depending on the size of the investment and the class of share purchased. The maximum is 4.25% and the minimum is 0%. Class A: 4.25% maximum initial sales charge; Advisor Class: no sales charges. For other share classes, visit franklintempleton.com.
| | | | | | | | | | | | |
| Share Class | |
| Cumulative
Total Return |
2 | | | | | |
| Average Annual
Total Return3 |
|
| | | |
A | | | | | | | | | | | | |
6-Month | | | +1.58% | | | | | | | | -2.51% | |
1-Year | | | +8.86% | | | | | | | | +4.30% | |
5-Year | | | +23.65% | | | | | | | | +3.45% | |
10-Year | | | +87.16% | | | | | | | | +6.01% | |
| | | |
Advisor | | | | | | | | | | | | |
6-Month | | | +1.64% | | | | | | | | +1.64% | |
1-Year | | | +9.00% | | | | | | | | +9.00% | |
5-Year | | | +24.50% | | | | | | | | +4.48% | |
10-Year | | | +89.69% | | | | | | | | +6.61% | |
| | | | | | | | | | | | |
| |
| Distribution
Rate |
4 | | | 30-Day Standardized Yield5 | |
| | | | | |
| Share Class | | | | (with waiver) | | | | (without waiver) | |
| | | |
A | | | 5.06% | | | | 4.53% | | | | 4.51% | |
Advisor | | | 5.40% | | | | 4.88% | | | | 4.87% | |
Performance data represent past performance, which does not guarantee future results. Investment return and principal value will fluctuate, and you may have a gain or loss when you sell your shares. Current performance may differ from figures shown. For most recent month-end performance, go to franklintempleton.com or call (800) 342-5236.
See page 7 for Performance Summary footnotes.
| | | | |
| | | |
6 | | Semiannual Report | | franklintempleton.com |
FRANKLIN HIGH INCOME FUND
PERFORMANCE SUMMARY
Net Asset Value
| | | | | | | | | | | | | | | | | | |
| Share Class (Symbol) | | 11/30/17 | | | | | 5/31/17 | | | | | | Change | |
A (FHAIX) | | $1.89 | | | | | | | $1.91 | | | | | | | | -$0.02 | |
C (FCHIX) | | $1.91 | | | | | | | $1.93 | | | | | | | | -$0.02 | |
R (FHIRX) | | $1.93 | | | | | | | $1.94 | | | | | | | | -$0.01 | |
R6 (FHRRX) | | $1.89 | | | | | | | $1.90 | | | | | | | | -$0.01 | |
Advisor (FVHIX) | | $1.89 | | | | | | | $1.91 | | | | | | | | -$0.02 | |
Distributions (6/1/17–11/30/17) | | | | | | | | | | | | | | | | | | |
| Share Class | | Net Investment
Income | | | | | | | | | | | | |
A | | $0.0498 | | | | | | | | | | | | | | | | |
C | | $0.0447 | | | | | | | | | | | | | | | | |
R | | $0.0462 | | | | | | | | | | | | | | | | |
R6 | | $0.0522 | | | | | | | | | | | | | | | | |
Advisor | | $0.0510 | | | | | | | | | | | | | | | | |
Total Annual Operating Expenses6
| | | | | | |
| Share Class | | With Waiver | | Without Waiver | |
A | | 0.77% | | | 0.78% | |
Advisor | | 0.62% | | | 0.63% | |
Each class of shares is available to certain eligible investors and has different annual fees and expenses, as described in the prospectus.
All investments involve risks, including possible loss of principal. The risks associated with higher yielding, lower rated securities include higher risk of default and loss of principal. Changes in the financial strength of a bond issuer or in a bond’s credit rating may affect its value. In addition, interest rate movements will affect the Fund’s share price and yield. Bond prices generally move in the opposite direction of interest rates. Thus, as prices of bonds in the Fund adjust to a rise in interest rates, the Fund’s share price may decline. Investment in foreign securities also involves special risks, including currency fluctuations, and political and economic uncertainty. The Fund is actively managed but there is no guarantee that the manager’s investment decisions will produce the desired results. The Fund’s prospectus also includes a description of the main investment risks.
1. The Fund has a fee waiver associated with any investment it makes in a Franklin Templeton money fund and/or other Franklin Templeton fund, contractually guaranteed through 9/30/18. Fund investment results reflect the fee waiver; without this waiver, the results would have been lower.
2. Cumulative total return represents the change in value of an investment over the periods indicated.
3. Average annual total return represents the average annual change in value of an investment over the periods indicated. Return for less than one year, if any, has not been annualized.
4. Distribution rate is based on an annualization of the respective class’s November dividend and the maximum offering price (NAV for Advisor class) per share on 11/30/17.
5. The Fund’s 30-day standardized yield is calculated over a trailing 30-day period using the yield to maturity on bonds and/or the dividends accrued on stocks. It may not equal the Fund’s actual income distribution rate, which reflects the Fund’s past dividends paid to shareholders.
6. Figures are as stated in the Fund’s current prospectus and may differ from the expense ratios disclosed in the Your Fund’s Expenses and Financial Highlights sections in this report. In periods of market volatility, assets may decline significantly, causing total annual Fund operating expenses to become higher than the figures shown.
| | | | |
| | | |
franklintempleton.com | | Semiannual Report | | 7 |
FRANKLIN HIGH INCOME FUND
Your Fund’s Expenses
As a Fund shareholder, you can incur two types of costs: (1) transaction costs, including sales charges (loads) on Fund purchases and redemptions; and (2) ongoing Fund costs, including management fees, distribution and service (12b-1) fees, and other Fund expenses. All mutual funds have ongoing costs, sometimes referred to as operating expenses. The table below shows ongoing costs of investing in the Fund and can help you understand these costs and compare them with those of other mutual funds. The table assumes a $1,000 investment held for the six months indicated.
Actual Fund Expenses
The table below provides information about actual account values and actual expenses in the columns under the heading “Actual.” In these columns the Fund’s actual return, which includes the effect of Fund expenses, is used to calculate the “Ending Account Value” for each class of shares. You can estimate the expenses you paid during the period by following these steps (of course, your account value and expenses will differ from those in this illustration): Divide your account value by $1,000 (if your account had an $8,600 value, then $8,600 ÷ $1,000 = 8.6). Then multiply the result by the number in the row for your class of shares under the headings “Actual” and “Expenses Paid During Period” (if Actual Expenses Paid During Period were $7.50, then 8.6 x $7.50 = $64.50). In this illustration, the actual expenses paid this period are $64.50.
Hypothetical Example for Comparison with Other Funds
Under the heading “Hypothetical” in the table, information is provided about hypothetical account values and hypothetical expenses based on the Fund’s actual expense ratio and an assumed rate of return of 5% per year before expenses, which is not the Fund’s actual return. This information may not be used to estimate the actual ending account balance or expenses you paid for the period, but it can help you compare ongoing costs of investing in the Fund with those of other funds. To do so, compare this 5% hypothetical example for the class of shares you hold with the 5% hypothetical examples that appear in the shareholder reports of other funds.
Please note that expenses shown in the table are meant to highlight ongoing costs and do not reflect any transactional costs. Therefore, information under the heading “Hypothetical” is useful in comparing ongoing costs only, and will not help you compare total costs of owning different funds. In addition, if transactional costs were included, your total costs would have been higher.
| | | | | | | | | | | | | | | | | | |
| | | | | | | Actual | | | | Hypothetical | | | | |
| | | | | | | (actual return after expenses) | | | | (5% annual return before expenses) | | | | |
| | | | | | | | | | | | | | |
| | | | | | | | | Expenses | | | | | | Expenses | | | | Net |
| | | Beginning | | | | Ending | | Paid During | | | | Ending | | Paid During | | | | Annualized |
| Share | | Account | | | | Account | | Period | | | | Account | | Period | | | | Expense |
| Class | | Value 6/1/17 | | | | Value 11/30/17 | | 6/1/17–11/30/171,2 | | | | Value 11/30/17 | | 6/1/17–11/30/171,2 | | | | Ratio2 |
| | | | | | | | | | | | |
| A | | $1,000 | | | | $1,015.80 | | $3.94 | | | | $1,021.16 | | $3.95 | | | | 0.78% |
| C | | $1,000 | | | | $1,012.90 | | $6.46 | | | | $1,018.65 | | $6.48 | | | | 1.28% |
| R | | $1,000 | | | | $1,018.90 | | $5.72 | | | | $1,019.40 | | $5.72 | | | | 1.13% |
| R6 | | $1,000 | | | | $1,022.40 | | $2.43 | | | | $1,022.66 | | $2.43 | | | | 0.48% |
| Advisor | | $1,000 | | | | $1,016.40 | | $3.18 | | | | $1,021.91 | | $3.19 | | | | 0.63% |
1. Expenses are equal to the annualized expense ratio for the six-month period as indicated above—in the far right column—multiplied by the simple average account value over the period indicated, and then multiplied by 183/365 to reflect the one-half year period.
2. Reflects expenses after fee waivers and expense reimbursements. Does not include acquired fund fees and expenses.
| | | | |
| | | |
8 | | Semiannual Report | | franklintempleton.com |
FRANKLIN HIGH INCOME TRUST
Financial Highlights
Franklin High Income Fund
| | | | | | | | | | | | | | | | | | | | | | | | |
| | | Six Months Ended
November 30, 2017 | | | Year Ended May 31, | |
| | | (unaudited) | | | 2017 | | | 2016 | | | 2015 | | | 2014 | | | 2013 | |
Class A | | | | | | | | | | | | | | | | | | | | | | | | |
| | | | | | |
Per share operating performance | | | | | | | | | | | | | | | | | | | | | | | | |
| | | | | | |
(for a share outstanding throughout the period) | | | | | | | | | | | | | | | | | | | | | | | | |
| | | | | | |
Net asset value, beginning of period | | $ | 1.91 | | | $ | 1.73 | | | $ | 2.01 | | | $ | 2.15 | | | $ | 2.12 | | | $ | 1.97 | |
| | | | | | |
Income from investment operationsa: | | | | | | | | | | | | | | | | | | | | | | | | |
| | | | | | |
Net investment incomeb | | | 0.05 | | | | 0.10 | | | | 0.11 | | | | 0.12 | | | | 0.13 | | | | 0.13 | |
| | | | | | |
Net realized and unrealized gains (losses) | | | (0.02 | ) | | | 0.18 | | | | (0.27 | ) | | | (0.14 | ) | | | 0.03 | | | | 0.16 | |
| | | | | | |
Total from investment operations | | | 0.03 | | | | 0.28 | | | | (0.16 | ) | | | (0.02 | ) | | | 0.16 | | | | 0.29 | |
| | | | | | |
Less distributions from net investment income | | | (0.05 | ) | | | (0.10 | ) | | | (0.12 | ) | | | (0.12 | ) | | | (0.13 | ) | | | (0.14 | ) |
| | | | | | |
Net asset value, end of period | | $ | 1.89 | | | $ | 1.91 | | | $ | 1.73 | | | $ | 2.01 | | | $ | 2.15 | | | $ | 2.12 | |
| | | | | | |
Total returnc | | | 1.58 | % | | | 16.82 | % | | | (8.08)% | | | | (0.83)% | | | | 8.01 | % | | | 15.24% | |
| | | | | | |
Ratios to average net assetsd | | | | | | | | | | | | | | | | | | | | | | | | |
| | | | | | |
Expenses before waiver and payments by affiliates | | | 0.79 | % | | | 0.77 | % | | | 0.78 | % | | | 0.76 | % | | | 0.76 | % | | | 0.76 | % |
| | | | | | |
Expenses net of waiver and payments by affiliatese | | | 0.78 | % | | | 0.76 | % | | | 0.77 | % | | | 0.76 | %f | | | 0.76 | %f | | | 0.76 | % |
| | | | | | |
Net investment income | | | 5.25 | % | | | 5.38 | % | | | 6.15 | % | | | 5.76 | % | | | 6.10 | % | | | 6.49 | % |
| | | | | | |
Supplemental data | | | | | | | | | | | | | | | | | | | | | | | | |
| | | | | | |
Net assets, end of period (000’s) | | $ | 2,641,928 | | | $ | 2,788,669 | | | $ | 2,745,474 | | | $ | 3,611,985 | | | $ | 4,058,942 | | | $ | 3,920,619 | |
| | | | | | |
Portfolio turnover rate | | | 10.63 | % | | | 35.06 | % | | | 18.58 | % | | | 34.67 | % | | | 29.33 | % | | | 28.89 | % |
a The amount shown for a share outstanding throughout the period may not correlate with the Statement of Operations for the period due to the timing of sales and repurchases of the Fund’s shares in relation to income earned and/or fluctuating fair value of the investments of the Fund.
b Based on average daily shares outstanding.
c Total return does not reflect sales commissions or contingent deferred sales charges, if applicable, and is not annualized for periods less than one year.
d Ratios are annualized for periods less than one year, except for non-recurring expenses, if any.
e Benefit of expense reduction rounds to less than 0.01%.
f Benefit of waiver and payments by affiliates rounds to less than 0.01%.
| | | | |
| | | |
franklintempleton.com | | The accompanying notes are an integral part of these financial statements. | Semiannual Report | | 9 |
FRANKLIN HIGH INCOME TRUST
FINANCIAL HIGHLIGHTS
Franklin High Income Fund (continued)
| | | | | | | | | | | | | | | | | | | | | | | | |
| | | Six Months Ended
November 30, 2017 | | | Year Ended May 31, | |
| | | (unaudited) | | | 2017 | | | 2016 | | | 2015 | | | 2014 | | | 2013 | |
Class C | | | | | | | | | | | | | | | | | | | | | | | | |
| | | | | | |
Per share operating performance | | | | | | | | | | | | | | | | | | | | | | | | |
| | | | | | |
(for a share outstanding throughout the period) | | | | | | | | | | | | | | | | | | | | | | | | |
| | | | | | |
Net asset value, beginning of period | | $ | 1.93 | | | $ | 1.75 | | | $ | 2.03 | | | $ | 2.17 | | | $ | 2.13 | | | $ | 1.99 | |
| | | | | | |
Income from investment operationsa: | | | | | | | | | | | | | | | | | | | | | | | | |
| | | | | | |
Net investment incomeb | | | 0.05 | | | | 0.09 | | | | 0.10 | | | | 0.11 | | | | 0.12 | | | | 0.13 | |
| | | | | | |
Net realized and unrealized gains (losses) | | | (0.03 | ) | | | 0.18 | | | | (0.27 | ) | | | (0.14 | ) | | | 0.04 | | | | 0.14 | |
| | | | | | |
Total from investment operations | | | 0.02 | | | | 0.27 | | | | (0.17 | ) | | | (0.03 | ) | | | 0.16 | | | | 0.27 | |
| | | | | | |
Less distributions from net investment income | | | (0.04 | ) | | | (0.09 | ) | | | (0.11 | ) | | | (0.11 | ) | | | (0.12 | ) | | | (0.13 | ) |
| | | | | | |
Net asset value, end of period | | $ | 1.91 | | | $ | 1.93 | | | $ | 1.75 | | | $ | 2.03 | | | $ | 2.17 | | | $ | 2.13 | |
| | | | | | |
Total returnc | | | 1.29 | % | | | 16.02 | % | | | (8.46)% | | | | (1.32)% | | | | 7.90 | % | | | 13.99 | % |
| | | | | | |
Ratios to average net assetsd | | | | | | | | | | | | | | | | | | | | | | | | |
| | | | | | |
Expenses before waiver and payments by affiliates | | | 1.29 | % | | | 1.27 | % | | | 1.28 | % | | | 1.26 | % | | | 1.26 | % | | | 1.26 | % |
| | | | | | |
Expenses net of waiver and payments by affiliatese | | | 1.28 | % | | | 1.26 | % | | | 1.27 | % | | | 1.26 | %f | | | 1.26 | %f | | | 1.26 | % |
| | | | | | |
Net investment income | | | 4.75 | % | | | 4.88 | % | | | 5.65 | % | | | 5.26 | % | | | 5.60 | % | | | 5.99 | % |
| | | | | | |
Supplemental data | | | | | | | | | | | | | | | | | | | | | | | | |
| | | | | | |
Net assets, end of period (000’s) | | $ | 522,675 | | | $ | 563,539 | | | $ | 563,218 | | | $ | 784,613 | | | $ | 907,458 | | | $ | 814,757 | |
| | | | | | |
Portfolio turnover rate | | | 10.63 | % | | | 35.06 | % | | | 18.58 | % | | | 34.67 | % | | | 29.33 | % | | | 28.89 | % |
a The amount shown for a share outstanding throughout the period may not correlate with the Statement of Operations for the period due to the timing of sales and repurchases of the Fund’s shares in relation to income earned and/or fluctuating fair value of the investments of the Fund.
b Based on average daily shares outstanding.
c Total return does not reflect sales commissions or contingent deferred sales charges, if applicable, and is not annualized for periods less than one year.
d Ratios are annualized for periods less than one year, except for non-recurring expenses, if any.
e Benefit of expense reduction rounds to less than 0.01%.
f Benefit of waiver and payments by affiliates rounds to less than 0.01%.
| | | | |
| | | |
10 | | Semiannual Report | The accompanying notes are an integral part of these financial statements. | | franklintempleton.com |
FRANKLIN HIGH INCOME TRUST
FINANCIAL HIGHLIGHTS
Franklin High Income Fund (continued)
| | | | | | | | | | | | | | | | | | | | | | | | |
| | | Six Months Ended
November 30, 2017 | | | Year Ended May 31, | |
| | | (unaudited) | | | 2017 | | | 2016 | | | 2015 | | | 2014 | | | 2013 | |
Class R | | | | | | | | | | | | | | | | | | | | | | | | |
| | | | | | |
Per share operating performance | | | | | | | | | | | | | | | | | | | | | | | | |
| | | | | | |
(for a share outstanding throughout the period) | | | | | | | | | | | | | | | | | | | | | | | | |
| | | | | | |
Net asset value, beginning of period | | $ | 1.94 | | | $ | 1.76 | | | $ | 2.04 | | | $ | 2.18 | | | $ | 2.14 | | | $ | 2.00 | |
| | | | | | |
Income from investment operationsa: | | | | | | | | | | | | | | | | | | | | | | | | |
| | | | | | |
Net investment incomeb | | | 0.05 | | | | 0.09 | | | | 0.10 | | | | 0.11 | | | | 0.12 | | | | 0.13 | |
| | | | | | |
Net realized and unrealized gains (losses) | | | (0.01 | ) | | | 0.19 | | | | (0.27 | ) | | | (0.14 | ) | | | 0.04 | | | | 0.14 | |
| | | | | | |
Total from investment operations | | | 0.04 | | | | 0.28 | | | | (0.17 | ) | | | (0.03 | ) | | | 0.16 | | | | 0.27 | |
| | | | | | |
Less distributions from net investment income | | | (0.05 | ) | | | (0.10 | ) | | | (0.11 | ) | | | (0.11 | ) | | | (0.12 | ) | | | (0.13 | ) |
| | | | | | |
Net asset value, end of period | | $ | 1.93 | | | $ | 1.94 | | | $ | 1.76 | | | $ | 2.04 | | | $ | 2.18 | | | $ | 2.14 | |
| | | | | | |
Total returnc | | | 1.89 | % | | | 16.07 | % | | | (8.27)% | | | | (1.16)% | | | | 8.02 | % | | | 14.05 | % |
| | | | | | |
Ratios to average net assetsd | | | | | | | | | | | | | | | | | | | | | | | | |
| | | | | | |
Expenses before waiver and payments by affiliates | | | 1.14 | % | | | 1.12 | % | | | 1.13 | % | | | 1.11 | % | | | 1.11 | % | | | 1.11 | % |
| | | | | | |
Expenses net of waiver and payments by affiliatese | | | 1.13 | % | | | 1.11 | % | | | 1.12 | % | | | 1.11 | %f | | | 1.11 | %f | | | 1.11 | % |
| | | | | | |
Net investment income | | | 4.90 | % | | | 5.03 | % | | | 5.80 | % | | | 5.41 | % | | | 5.75 | % | | | 6.14 | % |
| | | | | | |
Supplemental data | | | | | | | | | | | | | | | | | | | | | | | | |
| | | | | | |
Net assets, end of period (000’s) | | $ | 152,738 | | | $ | 187,180 | | | $ | 227,440 | | | $ | 323,397 | | | $ | 363,756 | | | $ | 335,335 | |
| | | | | | |
Portfolio turnover rate | | | 10.63 | % | | | 35.06 | % | | | 18.58 | % | | | 34.67 | % | | | 29.33 | % | | | 28.89 | % |
a The amount shown for a share outstanding throughout the period may not correlate with the Statement of Operations for the period due to the timing of sales and repurchases of the Fund’s shares in relation to income earned and/or fluctuating fair value of the investments of the Fund.
b Based on average daily shares outstanding.
c Total return is not annualized for periods less than one year.
d Ratios are annualized for periods less than one year, except for non-recurring expenses, if any.
e Benefit of expense reduction rounds to less than 0.01%.
f Benefit of waiver and payments by affiliates rounds to less than 0.01%.
| | | | |
| | | |
franklintempleton.com | | The accompanying notes are an integral part of these financial statements. | Semiannual Report | | 11 |
FRANKLIN HIGH INCOME TRUST
FINANCIAL HIGHLIGHTS
Franklin High Income Fund (continued)
| | | | | | | | | | | | | | | | | | | | | | | | |
| | | Six Months Ended
November 30, 2017 | | | Year Ended May 31, | |
| | | (unaudited) | | | 2017 | | | 2016 | | | 2015 | | | 2014 | | | 2013a | |
Class R6 | | | | | | | | | | | | | | | | | | | | | | | | |
| | | | | | |
Per share operating performance | | | | | | | | | | | | | | | | | | | | | | | | |
| | | | | | |
(for a share outstanding throughout the period) | | | | | | | | | | | | | | | | | | | | | | | | |
| | | | | | |
Net asset value, beginning of period | | $ | 1.90 | | | $ | 1.73 | | | $ | 2.01 | | | $ | 2.15 | | | $ | 2.12 | | | $ | 2.14 | |
| | | | | | |
Income from investment operationsb: | | | | | | | | | | | | | | | | | | | | | | | | |
| | | | | | |
Net investment incomec | | | 0.05 | | | | 0.10 | | | | 0.11 | | | | 0.12 | | | | 0.13 | | | | 0.01 | |
| | | | | | |
Net realized and unrealized gains (losses) | | | (0.01 | ) | | | 0.18 | | | | (0.27 | ) | | | (0.13 | ) | | | 0.04 | | | | (0.03 | ) |
| | | | | | |
Total from investment operations | | | 0.04 | | | | 0.28 | | | | (0.16 | ) | | | (0.01 | ) | | | 0.17 | | | | (0.02 | ) |
| | | | | | |
Less distributions from net investment income | | | (0.05 | ) | | | (0.11 | ) | | | (0.12 | ) | | | (0.13 | ) | | | (0.14 | ) | | | — | |
| | | | | | |
Net asset value, end of period | | $ | 1.89 | | | $ | 1.90 | | | $ | 1.73 | | | $ | 2.01 | | | $ | 2.15 | | | $ | 2.12 | |
| | | | | | |
Total returnd | | | 2.24 | % | | | 16.56 | % | | | (7.78)% | | | | (0.57)% | | | | 8.27 | % | | | (0.93)% | |
| | | | | | |
Ratios to average net assetse | | | | | | | | | | | | | | | | | | | | | | | | |
| | | | | | |
Expenses before waiver and payments by affiliates | | | 0.49 | % | | | 0.49 | % | | | 0.47 | % | | | 0.47 | % | | | 0.49 | % | | | 0.48 | % |
| | | | | | |
Expenses net of waiver and payments by affiliatesf | | | 0.48 | % | | | 0.48 | % | | | 0.46 | % | | | 0.47 | %g | | | 0.49 | %g | | | 0.48 | % |
| | | | | | |
Net investment income | | | 5.55 | % | | | 5.66 | % | | | 6.46 | % | | | 6.05 | % | | | 6.37 | % | | | 6.78 | % |
| | | | | | |
Supplemental data | | | | | | | | | | | | | | | | | | | | | | | | |
| | | | | | |
Net assets, end of period (000’s) | | $ | 96,191 | | | $ | 33,371 | | | $ | 37,872 | | | $ | 81,133 | | | $ | 35,633 | | | $ | 298 | |
| | | | | | |
Portfolio turnover rate | | | 10.63 | % | | | 35.06 | % | | | 18.58 | % | | | 34.67 | % | | | 29.33 | % | | | 28.89 | % |
a For the period May 1, 2013 (effective date) to May 31, 2013.
b The amount shown for a share outstanding throughout the period may not correlate with the Statement of Operations for the period due to the timing of sales and repurchases of the Fund’s shares in relation to income earned and/or fluctuating fair value of the investments of the Fund.
c Based on average daily shares outstanding.
d Total return is not annualized for periods less than one year.
e Ratios are annualized for periods less than one year, except for non-recurring expenses, if any.
f Benefit of expense reduction rounds to less than 0.01%.
g Benefit of waiver and payments by affiliates rounds to less than 0.01%.
| | | | |
| | | |
12 | | Semiannual Report | The accompanying notes are an integral part of these financial statements. | | franklintempleton.com |
FRANKLIN HIGH INCOME TRUST
FINANCIAL HIGHLIGHTS
Franklin High Income Fund (continued)
| | | | | | | | | | | | | | | | | | | | | | | | |
| | | Six Months Ended November 30, 2017 | | | Year Ended May 31, | |
| | | (unaudited) | | | 2017 | | | 2016 | | | 2015 | | | 2014 | | | 2013 | |
Advisor Class | | | | | | | | | | | | | | | | | | | | | | | | |
| | | | | | |
Per share operating performance | | | | | | | | | | | | | | | | | | | | | | | | |
| | | | | | |
(for a share outstanding throughout the period) | | | | | | | | | | | | | | | | | | | | | | | | |
| | | | | | |
Net asset value, beginning of period | | $ | 1.91 | | | $ | 1.74 | | | $ | 2.01 | | | $ | 2.15 | | | $ | 2.12 | | | $ | 1.98 | |
| | | | | | |
Income from investment operationsa: | | | | | | | | | | | | | | | | | | | | | | | | |
| | | | | | |
Net investment incomeb | | | 0.05 | | | | 0.10 | | | | 0.11 | | | | 0.12 | | | | 0.13 | | | | 0.14 | |
| | | | | | |
Net realized and unrealized gains (losses) | | | (0.02 | ) | | | 0.18 | | | | (0.26 | ) | | | (0.14 | ) | | | 0.04 | | | | 0.14 | |
| | | | | | |
Total from investment operations | | | 0.03 | | | | 0.28 | | | | (0.15 | ) | | | (0.02 | ) | | | 0.17 | | | | 0.28 | |
| | | | | | |
Less distributions from net investment income | | | (0.05 | ) | | | (0.11 | ) | | | (0.12 | ) | | | (0.12 | ) | | | (0.14 | ) | | | (0.14 | ) |
| | | | | | |
Net asset value, end of period | | $ | 1.89 | | | $ | 1.91 | | | $ | 1.74 | | | $ | 2.01 | | | $ | 2.15 | | | $ | 2.12 | |
| | | | | | |
Total returnc | | | 1.64 | % | | | 16.29 | % | | | (7.39)% | | | | (0.69)% | | | | 8.15 | % | | | 14.81% | |
| | | | | | |
Ratios to average net assetsd | | | | | | | | | | | | | | | | | | | | | | | | |
| | | | | | |
Expenses before waiver and payments by affiliates | | | 0.64 | % | | | 0.62 | % | | | 0.63 | % | | | 0.61 | % | | | 0.61 | % | | | 0.61 | % |
| | | | | | |
Expenses net of waiver and payments by affiliatese | | | 0.63 | % | | | 0.61 | % | | | 0.62 | % | | | 0.61 | %f | | | 0.61 | %f | | | 0.61 | % |
| | | | | | |
Net investment income | | | 5.40 | % | | | 5.53 | % | | | 6.30 | % | | | 5.91 | % | | | 6.25 | % | | | 6.64 | % |
| | | | | | |
Supplemental data | | | | | | | | | | | | | | | | | | | | | | | | |
| | | | | | |
Net assets, end of period (000’s) | | $ | 414,237 | | | $ | 488,699 | | | $ | 526,634 | | | $ | 1,443,439 | | | $ | 1,720,196 | | | $ | 1,275,166 | |
| | | | | | |
Portfolio turnover rate | | | 10.63 | % | | | 35.06 | % | | | 18.58 | % | | | 34.67 | % | | | 29.33 | % | | | 28.89 | % |
a The amount shown for a share outstanding throughout the period may not correlate with the Statement of Operations for the period due to the timing of sales and repurchases of the Fund’s shares in relation to income earned and/or fluctuating fair value of the investments of the Fund.
b Based on average daily shares outstanding.
c Total return is not annualized for periods less than one year.
d Ratios are annualized for periods less than one year, except for non-recurring expenses, if any.
e Benefit of expense reduction rounds to less than 0.01%.
f Benefit of waiver and payments by affiliates rounds to less than 0.01%.
| | | | |
| | | |
franklintempleton.com | | The accompanying notes are an integral part of these financial statements. | Semiannual Report | | 13 |
FRANKLIN HIGH INCOME TRUST
Statement of Investments, November 30, 2017 (unaudited)
Franklin High Income Fund
| | | | | | | | | | | | | | |
| | | | | Country | | | Shares/
Warrants | | | Value | |
| |
| | Common Stocks and Other Equity Interests 2.1% | | | | | | | | | | | | |
| | Energy 2.0% | | | | | | | | | | | | |
a | | Alpha Natural Resources Holdings Inc. | | | United States | | | | 43,457 | | | $ | 184,692 | |
a | | Amplify Energy Corp. | | | United States | | | | 450,023 | | | | 4,635,237 | |
a | | Chaparral Energy Inc., A | | | United States | | | | 213,001 | | | | 5,112,024 | |
a,b | | Chaparral Energy Inc., A, 144A | | | United States | | | | 5,033 | | | | 120,792 | |
a | | Chaparral Energy Inc., B | | | United States | | | | 43,062 | | | | 1,033,488 | |
a,c | | CHC Group LLC | | | Cayman Islands | | | | 386,335 | | | | 3,090,680 | |
| | Contura Energy Inc. | | | United States | | | | 6,606 | | | | 393,057 | |
| a | | Contura Energy Inc., wts., 7/26/23 | | | United States | | | | 5,033 | | | | 130,858 | |
| a | | Energy XXI Gulf Coast Inc. | | | United States | | | | 366,846 | | | | 1,841,567 | |
a | | Energy XXI Gulf Coast Inc., wts., 12/30/21 | | | United States | | | | 124,561 | | | | 2,491 | |
a,c | | Goodrich Petroleum Corp. | | | United States | | | | 1,049,684 | | | | 11,074,166 | |
a,c,d | | Goodrich Petroleum Corp., wts., 10/12/26 | | | United States | | | | 515,625 | | | | 5,435,673 | |
a | | Halcon Resources Corp. | | | United States | | | | 1,889,580 | | | | 13,397,122 | |
a | | Halcon Resources Corp., wts., 9/09/20 | | | United States | | | | 145,844 | | | | 83,117 | |
a | | Linn Energy Inc. | | | United States | | | | 423,986 | | | | 15,895,235 | |
a | | Midstates Petroleum Co. Inc. | | | United States | | | | 11,378 | | | | 188,989 | |
a,d | | Midstates Petroleum Co. Inc., wts., 4/21/20 | | | United States | | | | 80,604 | | | | 14,899 | |
a,d | | Nine Point Energy LLC | | | United States | | | | 369,532 | | | | 3,695,270 | |
a | | Penn Virginia Corp. | | | United States | | | | 242,758 | | | | 8,329,027 | |
a,c | | Titan Energy LLC | | | United States | | | | 289,137 | | | | 433,705 | |
| | | | | | | | | | | | | | |
| | | | | | | | | | | | | 75,092,089 | |
| | | | | | | | | | | | | | |
| | Materials 0.1% | | | | | | | | | | | | |
a | | ANR Inc., C1 | | | United States | | | | 43,457 | | | | 793,090 | |
a | | Verso Corp., A | | | United States | | | | 83,362 | | | | 952,828 | |
a | | Verso Corp., wts., 7/25/23 | | | United States | | | | 8,775 | | | | 88 | |
| | | | | | | | | | | | | | |
| | | | | | | | | | | | | 1,746,006 | |
| | | | | | | | | | | | | | |
| | Transportation 0.0%† | | | | | | | | | | | | |
a | | CEVA Holdings LLC | | | United States | | | | 3,364 | | | | 1,429,794 | |
| | | | | | | | | | | | | | |
| | Total Common Stocks and Other Equity Interests
(Cost $208,179,515) | | | | | | | | | | | 78,267,889 | |
| | | | | | | | | | | | | | |
| | | | |
| | Convertible Preferred Stocks 0.3% | | | | | | | | | | | | |
| | Energy 0.2% | | | | | | | | | | | | |
a,d,e | | Nine Point Energy Holdings Inc., cvt. pfd. | | | United States | | | | 8,080 | | | | 9,148,179 | |
| | | | | | | | | | | | | | |
| | Transportation 0.1% | | | | | | | | | | | | |
a | | CEVA Holdings LLC, cvt. pfd., A-1 | | | United States | | | | 134 | | | | 78,390 | |
a | | CEVA Holdings LLC, cvt. pfd., A-2 | | | United States | | | | 7,283 | | | | 3,095,114 | |
| | | | | | | | | | | | | | |
| | | | | | | | | | | | | 3,173,504 | |
| | | | | | | | | | | | | | |
| | Total Convertible Preferred Stocks (Cost $18,588,881) | | | | | | | | | | | 12,321,683 | |
| | | | | | | | | | | | | | |
| | | | |
| | | |
14 | | Semiannual Report | | franklintempleton.com |
FRANKLIN HIGH INCOME TRUST
STATEMENT OF INVESTMENTS (UNAUDITED)
Franklin High Income Fund (continued)
| | | | | | | | | | | | | | |
| | | | | Country | | | Principal Amount* | | | Value | |
| |
| | Convertible Bonds 0.9% | | | | | | | | | | | | |
| | Energy 0.9% | | | | | | | | | | | | |
| | CHC Group LLC/CHC Finance Ltd., cvt., secured note, zero cpn., 10/01/20 | | | Cayman Islands | | | $ | 19,897,092 | | | $ | 25,368,792 | |
c,f | | Goodrich Petroleum Corp., senior secured note, second lien, PIK, cvt., 13.50%, 8/30/19 | | | United States | | | | 8,250,000 | | | | 9,301,875 | |
| | | | | | | | | | | | | | |
| | Total Convertible Bonds (Cost $42,975,210) | | | | | | | | | | | 34,670,667 | |
| | | | | | | | | | | | | | |
| | | | |
| | Corporate Bonds 94.3% | | | | | | | | | | | | |
| | Automobiles & Components 1.3% | | | | | | | | | | | | |
| | Fiat Chrysler Automobiles NV, senior note, 5.25%, 4/15/23 | | | United Kingdom | | | | 17,500,000 | | | | 18,476,150 | |
| | The Goodyear Tire & Rubber Co.,
senior bond, 5.00%, 5/31/26 | | | United States | | | | 14,400,000 | | | | 14,962,320 | |
| | senior note, 5.125%, 11/15/23 | | | United States | | | | 15,000,000 | | | | 15,600,000 | |
| | | | | | | | | | | | | | |
| | | | | | | | | | | | | 49,038,470 | |
| | | | | | | | | | | | | | |
| | Banks 3.9% | | | | | | | | | | | | |
g | | Bank of America Corp., junior sub. bond, M, 8.125% to 5/15/18, FRN thereafter, Perpetual | | | United States | | | | 42,500,000 | | | | 43,724,850 | |
| | CIT Group Inc.,
senior note, 5.375%, 5/15/20 | | | United States | | | | 777,000 | | | | 825,563 | |
| | senior note, 5.00%, 8/15/22 | | | United States | | | | 13,850,000 | | | | 14,836,812 | |
g | | Citigroup Inc., junior sub. bond, M, 6.30% to 5/15/24, FRN thereafter, Perpetual | | | United States | | | | 45,000,000 | | | | 48,723,750 | |
g | | JPMorgan Chase & Co.,
junior sub. bond, R, 6.00% to 8/01/23, FRN thereafter, Perpetual | | | United States | | | | 15,000,000 | | | | 16,293,750 | |
| | junior sub. bond, V, 5.00% to 7/30/19, FRN thereafter, Perpetual | | | United States | | | | 9,900,000 | | | | 10,172,250 | |
| | Royal Bank of Scotland Group PLC,
sub. note, 6.125%, 12/15/22 | | | United Kingdom | | | | 4,000,000 | | | | 4,406,960 | |
| | sub. note, 5.125%, 5/28/24 | | | United Kingdom | | | | 10,000,000 | | | | 10,620,400 | |
| | | | | | | | | | | | | | |
| | | | | | | | | | | | | 149,604,335 | |
| | | | | | | | | | | | | | |
| | Capital Goods 3.8% | | | | | | | | | | | | |
| | Aircastle Ltd., senior note, 4.125%, 5/01/24 | | | United States | | | | 18,000,000 | | | | 18,447,120 | |
b | | Beacon Escrow Corp., senior note, 144A, 4.875%, 11/01/25 | | | United States | | | | 14,400,000 | | | | 14,715,000 | |
b | | Cloud Crane LLC, secured note, second lien, 144A, 10.125%, 8/01/24 | | | United States | | | | 10,000,000 | | | | 11,300,000 | |
| | CNH Industrial Capital LLC, senior note, 3.875%, 10/15/21 | | | United States | | | | 20,000,000 | | | | 20,500,000 | |
b | | H&E Equipment Services Inc., senior note, 144A, 5.625%, 9/01/25 | | | United States | | | | 19,700,000 | | | | 20,685,000 | |
b | | Terex Corp., senior note, 144A, 5.625%, 2/01/25 | | | United States | | | | 10,400,000 | | | | 10,991,500 | |
| | TransDigm Inc., senior sub. bond, 6.50%, 5/15/25 | | | United States | | | | 8,900,000 | | | | 9,105,590 | |
b | | Vertiv Group Corp., senior note, 144A, 9.25%, 10/15/24 | | | United States | | | | 36,500,000 | | | | 39,785,000 | |
| | | | | | | | | | | | | | |
| | | | | | | | | | | | | 145,529,210 | |
| | | | | | | | | | | | | | |
| | Commercial & Professional Services 0.9% | | | | | | | | | | | | |
d,h | | Goss Graphic Systems Inc., senior sub. note, 12.25%, 11/19/05 | | | United States | | | | 9,053,899 | | | | 905 | |
b | | West Corp., senior note, 144A, 8.50%, 10/15/25 | | | United States | | | | 34,900,000 | | | | 34,158,375 | |
| | | | | | | | | | | | | | |
| | | | | | | | | | | | | 34,159,280 | |
| | | | | | | | | | | | | | |
| | Consumer Durables & Apparel 2.9% | | | | | | | | | | | | |
b | | Hanesbrands Inc., senior note, 144A, 4.625%, 5/15/24 | | | United States | | | | 21,300,000 | | | | 21,752,625 | |
| | KB Home, senior note, 7.00%, 12/15/21 | | | United States | | | | 10,000,000 | | | | 11,225,000 | |
| | PulteGroup Inc., senior bond, 5.00%, 1/15/27 | | | United States | | | | 27,000,000 | | | | 28,513,350 | |
b | | Taylor Morrison Communities Inc./Taylor Morrison Holdings II Inc., senior note, 144A, 5.625%, 3/01/24 | | | United States | | | | 25,000,000 | | | | 26,125,000 | |
| | | | |
| | | |
franklintempleton.com | | Semiannual Report | | 15 |
FRANKLIN HIGH INCOME TRUST
STATEMENT OF INVESTMENTS (UNAUDITED)
Franklin High Income Fund (continued)
| | | | | | | | | | | | | | |
| | | | | Country | | | Principal
Amount* | | | Value | |
| |
| | Corporate Bonds (continued) | | | | | | | | | | | | |
| | Consumer Durables & Apparel (continued) | | | | | | | | | | | | |
b | | Weekley Homes LLC/Weekley Finance Corp., senior note, 144A, 6.625%, 8/15/25 | | | United States | | | $ | 25,000,000 | | | $ | 24,503,750 | |
| | | | | | | | | | | | | | |
| | | | | | | | | | | | | 112,119,725 | |
| | | | | | | | | | | | | | |
| | Consumer Services 7.8% | | | | | | | | | | | | |
b | | 1011778 BC ULC/New Red Finance Inc.,
secured note, second lien, 144A, 5.00%, 10/15/25 | | | Canada | | | | 12,300,000 | | | | 12,669,000 | |
| | senior secured note, first lien, 144A, 4.25%, 5/15/24 | | | Canada | | | | 21,100,000 | | | | 21,184,400 | |
b | | 24 Hour Holdings III LLC, senior note, 144A, 8.00%, 6/01/22 | | | United States | | | | 30,000,000 | | | | 28,950,000 | |
b | | International Game Technology PLC,
senior secured bond, 144A, 6.50%, 2/15/25 | | | United States | | | | 24,000,000 | | | | 27,120,000 | |
| | senior secured note, 144A, 6.25%, 2/15/22 | | | United States | | | | 17,000,000 | | | | 18,561,110 | |
b | | Jack Ohio Finance LLC/Jack Ohio Finance 1 Corp., | | | | | | | | | | | | |
| | secured note, second lien, 144A, 10.25%, 11/15/22 | | | United States | | | | 11,500,000 | | | | 12,664,375 | |
| | senior secured note, first lien, 144A, 6.75%, 11/15/21 | | | United States | | | | 25,100,000 | | | | 26,574,625 | |
b | | KFC Holding Co./Pizza Hut Holdings LLC/Taco Bell of America LLC,
senior note, 144A, 5.00%, 6/01/24 | | | United States | | | | 15,600,000 | | | | 16,380,000 | |
| | senior note, 144A, 5.25%, 6/01/26 | | | United States | | | | 12,700,000 | | | | 13,462,000 | |
b | | Silversea Cruise Finance Ltd., senior secured note, first lien, 144A, 7.25%, 2/01/25 | | | United States | | | | 19,900,000 | | | | 21,541,750 | |
| | United Rentals North America Inc.,
senior bond, 5.75%, 11/15/24 | | | United States | | | | 14,000,000 | | | | 14,822,500 | |
| | senior bond, 5.875%, 9/15/26 | | | United States | | | | 9,600,000 | | | | 10,368,000 | |
| | senior bond, 5.50%, 5/15/27 | | | United States | | | | 18,400,000 | | | | 19,550,000 | |
b | | Wynn Las Vegas LLC/Wynn Las Vegas Capital Corp., senior bond, 144A, 5.50%, 3/01/25 | | | United States | | | | 20,000,000 | | | | 20,706,000 | |
b | | Wynn Macau Ltd.,
senior bond, 144A, 5.50%, 10/01/27 | | | Macau | | | | 23,000,000 | | | | 23,402,500 | |
| | senior note, 144A, 4.875%, 10/01/24 | | | Macau | | | | 11,300,000 | | | | 11,385,202 | |
| | | | | | | | | | | | | | |
| | | | | | | | | | | | | 299,341,462 | |
| | | | | | | | | | | | | | |
| | Diversified Financials 2.5% | | | | | | | | | | | | |
b | | Five Point Operating Co. LP/Five Point Capital Corp., senior note, 144A, 7.875%, 11/15/25 | | | United States | | | | 21,400,000 | | | | 21,881,500 | |
b | | MSCI Inc., senior note, 144A, 4.75%, 8/01/26 | | | United States | | | | 5,900,000 | | | | 6,252,820 | |
| | Navient Corp.,
senior note, 5.00%, 10/26/20 | | | United States | | | | 12,500,000 | | | | 12,765,625 | |
| | senior note, 5.875%, 3/25/21 | | | United States | | | | 5,000,000 | | | | 5,231,800 | |
| | senior note, 6.625%, 7/26/21 | | | United States | | | | 9,500,000 | | | | 10,070,000 | |
| | senior note, 6.50%, 6/15/22 | | | United States | | | | 9,900,000 | | | | 10,414,447 | |
| | senior note, 7.25%, 9/25/23 | | | United States | | | | 27,780,000 | | | | 30,071,850 | |
| | | | | | | | | | | | | | |
| | | | | | | | | | | | | 96,688,042 | |
| | | | | | | | | | | | | | |
| | Energy 10.1% | | | | | | | | | | | | |
h | | BreitBurn Energy Partners LP/BreitBurn Finance Corp., senior bond, 7.875%, 4/15/22 | | | United States | | | | 16,900,000 | | | | 1,014,000 | |
| | California Resources Corp.,
b secured note, second lien, 144A, 8.00%, 12/15/22 | | | United States | | | | 14,782,000 | | | | 10,994,113 | |
| | senior bond, 6.00%, 11/15/24 | | | United States | | | | 850,000 | | | | 531,250 | |
| | senior note, 5.50%, 9/15/21 | | | United States | | | | 411,000 | | | | 304,140 | |
| | Calumet Specialty Products Partners LP/Calumet Finance Corp., | | | | | | | | | | | | |
| | senior note, 7.75%, 4/15/23 | | | United States | | | | 25,100,000 | | | | 25,225,500 | |
| | b senior note, 144A, 11.50%, 1/15/21 | | | United States | | | | 6,800,000 | | | | 7,820,000 | |
| | | | |
| | | |
16 | | Semiannual Report | | franklintempleton.com |
FRANKLIN HIGH INCOME TRUST
STATEMENT OF INVESTMENTS (UNAUDITED)
Franklin High Income Fund (continued)
| | | | | | | | | | | | | | |
| | | | | Country | | | Principal
Amount* | | | Value | |
| |
| | Corporate Bonds (continued) | | | | | | | | | | | | |
| | Energy (continued) | | | | | | | | | | | | |
| | Cheniere Corpus Christi Holdings LLC,
senior secured note, first lien, 7.00%, 6/30/24 | | | United States | | | $ | 15,600,000 | | | $ | 17,784,000 | |
| | senior secured note, first lien, 5.875%, 3/31/25 | | | United States | | | | 21,500,000 | | | | 23,381,250 | |
b | | Cheniere Energy Partners LP, senior secured note, first lien, 144A, 5.25%, 10/01/25 | | | United States | | | | 28,700,000 | | | | 29,525,125 | |
| | CONSOL Energy Inc., senior note, 8.00%, 4/01/23 | | | United States | | | | 25,000,000 | | | | 26,812,500 | |
| | Crestwood Midstream Partners LP/Crestwood Midstream Finance Corp.,
senior note, 6.25%, 4/01/23 | | | United States | | | | 17,000,000 | | | | 17,680,000 | |
| | senior note, 5.75%, 4/01/25 | | | United States | | | | 20,000,000 | | | | 20,675,000 | |
| | CSI Compressco LP/CSI Compressco Finance Inc., senior note, 7.25%, 8/15/22 | | | United States | | | | 12,900,000 | | | | 12,255,000 | |
| | Energy Transfer Equity LP,
senior secured bond, first lien, 5.875%, 1/15/24 | | | United States | | | | 15,000,000 | | | | 16,125,000 | |
| | senior secured bond, first lien, 5.50%, 6/01/27 | | | United States | | | | 17,900,000 | | | | 18,750,250 | |
b,f | | EnQuest PLC, senior note, 144A, PIK, 7.00%, 10/15/23 | | | United Kingdom | | | | 22,179,300 | | | | 15,494,050 | |
| | Ferrellgas LP/Ferrellgas Finance Corp., senior note, 6.75%, 6/15/23 | | | United States | | | | 23,600,000 | | | | 22,007,000 | |
c,d,f | | Goodrich Petroleum Corp., senior secured note, second lien, PIK, 13.50%, 8/30/19 | | | United States | | | | 1,181,662 | | | | 1,139,047 | |
| | Martin Midstream Partners LP/Martin Midstream Finance Corp., senior note, 7.25%, 2/15/21 | | | United States | | | | 17,000,000 | | | | 17,382,500 | |
b | | Murray Energy Corp., secured note, second lien, 144A, 11.25%, 4/15/21 | | | United States | | | | 24,500,000 | | | | 13,781,250 | |
| | QEP Resources Inc.,
senior bond, 5.375%, 10/01/22 | | | United States | | | | 14,000,000 | | | | 14,402,500 | |
| | senior note, 5.625%, 3/01/26 | | | United States | | | | 10,700,000 | | | | 10,899,341 | |
| | Sanchez Energy Corp.,
senior note, 7.75%, 6/15/21 | | | United States | | | | 7,000,000 | | | | 6,667,500 | |
| | senior note, 6.125%, 1/15/23 | | | United States | | | | 8,000,000 | | | | 6,790,000 | |
b,f | | W&T Offshore Inc.,
secured note, second lien, 144A, PIK, 10.75%, 5/15/20 | | | United States | | | | 9,676,322 | | | | 8,758,329 | |
| | senior secured note, third lien, 144A, PIK, 10.00%, 6/15/21 | | | United States | | | | 8,217,777 | | | | 6,246,820 | |
| | Weatherford International Ltd.,
senior note, 5.125%, 9/15/20 | | | United States | | | | 5,300,000 | | | | 5,300,000 | |
| | senior note, 4.50%, 4/15/22 | | | United States | | | | 8,500,000 | | | | 7,692,500 | |
| | senior note, 8.25%, 6/15/23 | | | United States | | | | 9,600,000 | | | | 9,546,000 | |
| | WPX Energy Inc., senior note, 6.00%, 1/15/22 | | | United States | | | | 10,000,000 | | | | 10,350,000 | |
| | | | | | | | | | | | | | |
| | | | | | | | | | | | | 385,333,965 | |
| | | | | | | | | | | | | | |
| | Food, Beverage & Tobacco 3.6% | | | | | | | | | | | | |
| | B&G Foods Inc., senior note, 5.25%, 4/01/25 | | | United States | | | | 17,300,000 | | | | 17,730,770 | |
b | | Cott Holdings Inc., senior note, 144A, 5.50%, 4/01/25 | | | Canada | | | | 37,500,000 | | | | 38,737,500 | |
b | | JBS USA LLC/Finance Inc., senior bond, 144A, 5.875%, 7/15/24 | | | United States | | | | 1,400,000 | | | | 1,379,000 | |
b | | Lamb Weston Holdings Inc.,
senior note, 144A, 4.625%, 11/01/24 | | | United States | | | | 13,900,000 | | | | 14,438,625 | |
| | senior note, 144A, 4.875%, 11/01/26 | | | United States | | | | 17,700,000 | | | | 18,673,500 | |
b | | Post Holdings Inc.,
senior bond, 144A, 5.00%, 8/15/26 | | | United States | | | | 33,000,000 | | | | 32,793,750 | |
| | senior bond, 144A, 5.75%, 3/01/27 | | | United States | | | | 5,000,000 | | | | 5,137,500 | |
| | senior note, 144A, 5.50%, 3/01/25 | | | United States | | | | 7,500,000 | | | | 7,809,375 | |
| | | | | | | | | | | | | | |
| | | | | | | | | | | | | 136,700,020 | |
| | | | | | | | | | | | | | |
| | | | |
| | | |
franklintempleton.com | | Semiannual Report | | 17 |
FRANKLIN HIGH INCOME TRUST
STATEMENT OF INVESTMENTS (UNAUDITED)
Franklin High Income Fund (continued)
| | | | | | | | | | | | | | |
| | | | | Country | | | Principal
Amount* | | | Value | |
| |
| | Corporate Bonds (continued) | | | | | | | | | | | | |
| | Health Care Equipment & Services 5.8% | | | | | | | | | | | | |
b | | Avantor Inc., senior secured note, first lien, 144A, 6.00%, 10/01/24 | | | United States | | | $ | 17,300,000 | | | $ | 17,375,687 | |
| | CHS/Community Health Systems Inc.,
senior note, 7.125%, 7/15/20 | | | United States | | | | 13,300,000 | | | | 10,440,500 | |
| | senior note, 6.875%, 2/01/22 | | | United States | | | | 4,600,000 | | | | 2,794,500 | |
| | senior secured note, 5.125%, 8/01/21 | | | United States | | | | 4,100,000 | | | | 3,854,000 | |
| | senior secured note, first lien, 6.25%, 3/31/23 | | | United States | | | | 14,200,000 | | | | 13,348,000 | |
b | | Envision Healthcare Corp., senior note, 144A, 6.25%, 12/01/24 | | | United States | | | | 10,300,000 | | | | 10,905,125 | |
| | HCA Inc.,
senior bond, 5.875%, 5/01/23 | | | United States | | | | 32,000,000 | | | | 34,160,000 | |
| | senior bond, 5.375%, 2/01/25 | | | United States | | | | 7,000,000 | | | | 7,280,000 | |
| | senior secured bond, first lien, 5.25%, 4/15/25 | | | United States | | | | 11,000,000 | | | | 11,742,500 | |
| | senior secured note, first lien, 5.00%, 3/15/24 | | | United States | | | | 20,000,000 | | | | 21,050,000 | |
b | | MPH Acquisition Holdings LLC, senior note, 144A, 7.125%, 6/01/24 | | | United States | | | | 17,400,000 | | | | 18,726,750 | |
b,f | | Polaris Intermediate Corp., senior note, PIK, 144A, 8.50%, 12/01/22 | | | United States | | | | 7,000,000 | | | | 7,300,300 | |
| | Tenet Healthcare Corp.,
senior note, 8.125%, 4/01/22 | | | United States | | | | 12,000,000 | | | | 11,925,000 | |
| | senior note, 6.75%, 6/15/23 | | | United States | | | | 13,700,000 | | | | 12,860,875 | |
| | senior secured note, first lien, 6.00%, 10/01/20 | | | United States | | | | 6,700,000 | | | | 7,085,250 | |
| | WellCare Health Plans Inc., senior note, 5.25%, 4/01/25 | | | United States | | | | 29,500,000 | | | | 31,306,875 | |
| | | | | | | | | | | | | | |
| | | | | | | | | | | | | 222,155,362 | |
| | | | | | | | | | | | | | |
| | Materials 14.6% | | | | | | | | | | | | |
f | | ARD Finance SA, secured note, PIK, 7.875%, 9/15/23 | | | Luxembourg | | | | 14,000,000 | | | | 14,892,500 | |
b | | Ardagh Packaging Finance PLC/Ardagh MP Holdings USA Inc.,
senior note, 144A, 6.00%, 6/30/21 | | | Luxembourg | | | | 7,000,000 | | | | 7,218,750 | |
| | senior note, 144A, 6.00%, 2/15/25 | | | Luxembourg | | | | 10,000,000 | | | | 10,662,500 | |
b | | Axalta Coating Systems LLC, senior note, 144A, 4.875%, 8/15/24 | | | United States | | | | 9,600,000 | | | | 10,080,000 | |
b | | BWAY Holding Co., senior note, 144A, 7.25%, 4/15/25 | | | United States | | | | 39,900,000 | | | | 41,446,125 | |
b | | Cemex SAB de CV, senior secured bond, first lien, 144A, 5.70%, 1/11/25 | | | Mexico | | | | 30,000,000 | | | | 31,478,400 | |
| | The Chemours Co.,
senior bond, 7.00%, 5/15/25 | | | United States | | | | 8,500,000 | | | | 9,339,375 | |
| | senior note, 6.625%, 5/15/23 | | | United States | | | | 17,000,000 | | | | 18,062,500 | |
| | senior note, 5.375%, 5/15/27 | | | United States | | | | 12,200,000 | | | | 12,749,000 | |
b | | CVR Partners LP/CVR Nitrogen Finance Corp., secured note, second lien, 144A, 9.25%, 6/15/23 | | | United States | | | | 7,100,000 | | | | 7,552,625 | |
b | | Eldorado Gold Corp., senior note, 144A, 6.125%, 12/15/20 | | | Canada | | | | 21,700,000 | | | | 21,266,000 | |
b | | First Quantum Minerals Ltd.,
senior note, 144A, 7.00%, 2/15/21 | | | Zambia | | | | 16,000,000 | | | | 16,640,000 | |
| | senior note, 144A, 7.25%, 4/01/23 | | | Zambia | | | | 19,400,000 | | | | 20,503,375 | |
b | | FMG Resources (August 2006) Pty. Ltd.,
senior note, 144A, 4.75%, 5/15/22 | | | Australia | | | | 5,000,000 | | | | 5,099,900 | |
| | senior note, 144A, 5.125%, 5/15/24 | | | Australia | | | | 8,600,000 | | | | 8,824,976 | |
b | | Grinding Media Inc./MC Grinding Media Canada Inc., senior secured note, 144A, 7.375%, 12/15/23 | | | United States | | | | 16,500,000 | | | | 17,778,750 | |
b | | HudBay Minerals Inc., senior note, 144A, 7.25%, 1/15/23 | | | Canada | | | | 4,800,000 | | | | 5,154,000 | |
b | | New Gold Inc., senior note, 144A, 6.375%, 5/15/25 | | | Canada | | | | 16,600,000 | | | | 17,596,000 | |
b | | Northwest Acquisitions ULC/Dominion Finco Inc., secured note, second lien, 144A, 7.125%, 11/01/22 | | | United States | | | | 9,100,000 | | | | 9,418,500 | |
b | | Novelis Corp.,
senior bond, 144A, 5.875%, 9/30/26 | | | United States | | | | 15,700,000 | | | | 16,445,750 | |
| | senior note, 144A, 6.25%, 8/15/24 | | | United States | | | | 16,000,000 | | | | 16,920,000 | |
| | | | |
| | | |
18 | | Semiannual Report | | franklintempleton.com |
FRANKLIN HIGH INCOME TRUST
STATEMENT OF INVESTMENTS (UNAUDITED)
Franklin High Income Fund (continued)
| | | | | | | | | | | | | | |
| | | | | Country | | | Principal
Amount* | | | Value | |
| | Corporate Bonds (continued) | | | | | | | | | | | | |
| | Materials (continued) | | | | | | | | | | | | |
b | | Owens-Brockway Glass Container Inc., | | | | | | | | | | | | |
| | senior note, 144A, 5.00%, 1/15/22 | | | United States | | | $ | 13,000,000 | | | $ | 13,731,250 | |
| | senior note, 144A, 5.875%, 8/15/23 | | | United States | | | | 10,000,000 | | | | 10,943,750 | |
b | | Petra Diamonds U.S. Treasury PLC, secured note, second lien, 144A, 7.25%, 5/01/22 | | | South Africa | | | | 17,400,000 | | | | 17,487,000 | |
b | | Platform Specialty Products Corp., | | | | | | | | | | | | |
| | senior note, 144A, 6.50%, 2/01/22 | | | United States | | | | 15,500,000 | | | | 16,061,875 | |
| | senior note, 144A, 5.875%, 12/01/25 | | | United States | | | | 20,000,000 | | | | 20,175,000 | |
b | | Rain CII Carbon LLC/CII Carbon Corp., secured note, second lien, 144A, 8.25%, 1/15/21 | | | United States | | | | 18,700,000 | | | | 19,237,625 | |
| | Reynolds Group Issuer Inc./Reynolds Group Issuer LLC/Reynolds Group | | | | | | | | | | | | |
| | Issuer Luxembourg SA, | | | | | | | | | | | | |
| | senior secured note, first lien, 5.75%, 10/15/20 | | | United States | | | | 11,600,000 | | | | 11,810,250 | |
| | bsenior secured note, first lien, 144A, 5.125%, 7/15/23 | | | United States | | | | 7,200,000 | | | | 7,479,000 | |
| | b,isenior secured note, first lien, 144A, FRN, 4.859%, (3-month USD LIBOR + 3.50%), 7/15/21. | | | United States | | | | 5,300,000 | | | | 5,425,875 | |
b | | Sealed Air Corp., senior bond, 144A, 5.50%, 9/15/25 | | | United States | | | | 10,000,000 | | | | 10,975,000 | |
| | Steel Dynamics Inc., | | | | | | | | | | | | |
| | senior bond, 5.50%, 10/01/24 | | | United States | | | | 10,000,000 | | | | 10,669,000 | |
| | senior bond, 5.00%, 12/15/26 | | | United States | | | | 15,000,000 | | | | 15,890,700 | |
| | senior note, 5.125%, 10/01/21 | | | United States | | | | 8,500,000 | | | | 8,744,375 | |
| | Summit Materials LLC/Summit Materials Finance Corp., senior note, 8.50%, 4/15/22 | | | United States | | | | 25,000,000 | | | | 27,906,250 | |
b | | SunCoke Energy Partners LP/SunCoke Energy Partners Finance Corp., senior note, 144A, 7.50%, 6/15/25 | | | United States | | | | 30,000,000 | | | | 31,762,500 | |
b | | Univar USA Inc., senior note, 144A, 6.75%, 7/15/23 | | | United States | | | | 11,500,000 | | | | 12,103,750 | |
| | | | | | | | | | | | | | |
| | | | | | | | | | | | | 559,532,226 | |
| | | | | | | | | | | | | | |
| | Media 10.7% | | | | | | | | | | | | |
b | | Altice U.S. Finance I Corp., senior secured bond, 144A, 5.50%, 5/15/26 | | | United States | | | | 23,550,000 | | | | 23,903,250 | |
| | AMC Entertainment Holdings Inc., senior sub. note, 5.875%, 11/15/26 | | | United States | | | | 18,700,000 | | | | 18,349,375 | |
| | AMC Networks Inc., senior note, 5.00%, 4/01/24 | | | United States | | | | 22,800,000 | | | | 23,142,000 | |
| | CCO Holdings LLC/CCO Holdings Capital Corp., senior bond, 5.25%, 9/30/22 | | | United States | | | | 2,800,000 | | | | 2,882,250 | |
| | senior bond, 5.125%, 2/15/23 | | | United States | | | | 10,000,000 | | | | 10,275,000 | |
| | bsenior bond, 144A, 5.375%, 5/01/25. | | | United States | | | | 12,000,000 | | | | 12,345,000 | |
| | bsenior bond, 144A, 5.75%, 2/15/26 | | | United States | | | | 13,200,000 | | | | 13,728,000 | |
| | bsenior bond, 144A, 5.00%, 2/01/28 | | | United States | | | | 10,000,000 | | | | 9,800,000 | |
| | Clear Channel Worldwide Holdings Inc., | | | | | | | | | | | | |
| | senior note, 6.50%, 11/15/22 | | | United States | | | | 3,500,000 | | | | 3,539,375 | |
| | senior note, 6.50%, 11/15/22 | | | United States | | | | 6,500,000 | | | | 6,605,625 | |
| | senior sub. note, 7.625%, 3/15/20 | | | United States | | | | 1,650,000 | | | | 1,617,000 | |
| | senior sub. note, 7.625%, 3/15/20 | | | United States | | | | 14,000,000 | | | | 13,912,500 | |
| | CSC Holdings LLC, | | | | | | | | | | | | |
| | bsenior bond, 144A, 10.875%, 10/15/25 | | | United States | | | | 7,800,000 | | | | 9,301,500 | |
| | bsenior bond, 144A, 5.50%, 4/15/27 | | | United States | | | | 8,000,000 | | | | 8,130,000 | |
| | senior note, 6.75%, 11/15/21 | | | United States | | | | 5,000,000 | | | | 5,387,500 | |
| | senior note, 5.25%, 6/01/24. | | | United States | | | | 28,000,000 | | | | 27,361,250 | |
| | DISH DBS Corp., | | | | | | | | | | | | |
| | senior bond, 5.00%, 3/15/23 | | | United States | | | | 5,000,000 | | | | 4,880,250 | |
| | senior note, 5.875%, 7/15/22 | | | United States | | | | 20,000,000 | | | | 20,650,000 | |
| | senior note, 5.875%, 11/15/24 | | | United States | | | | 17,500,000 | | | | 17,649,625 | |
| | | | |
| | | |
franklintempleton.com | | Semiannual Report | | 19 |
FRANKLIN HIGH INCOME TRUST
STATEMENT OF INVESTMENTS (UNAUDITED)
Franklin High Income Fund (continued)
| | | | | | | | | | | | | | |
| | | | | Country | | | Principal
Amount* | | | Value | |
| |
| | Corporate Bonds (continued) | | | | | | | | | | | | |
| | Media (continued) | | | | | | | | | | | | |
| | iHeartCommunications Inc.,
senior secured bond, first lien, 9.00%, 3/01/21 | | | United States | | | $ | 23,000,000 | | | $ | 16,560,000 | |
| | senior secured note, first lien, 9.00%, 9/15/22 | | | United States | | | | 15,000,000 | | | | 10,875,000 | |
b | | Nexstar Broadcasting Inc., senior note, 144A, 5.625%, 8/01/24 | | | United States | | | | 12,800,000 | | | | 13,120,000 | |
b | | Radio One Inc., senior sub. note, 144A, 9.25%, 2/15/20 | | | United States | | | | 19,000,000 | | | | 17,812,500 | |
| | Tegna Inc., senior bond, 6.375%, 10/15/23 | | | United States | | | | 10,000,000 | | | | 10,562,500 | |
b | | Unitymedia KabelBW GmbH, senior bond, 144A, 6.125%, 1/15/25 | | | Germany | | | | 23,500,000 | | | | 24,880,625 | |
| b | | Univision Communications Inc.,
senior secured note, first lien, 144A, 5.125%, 5/15/23 | | | United States | | | | 5,000,000 | | | | 5,012,500 | |
| | senior secured note, first lien, 144A, 5.125%, 2/15/25 | | | United States | | | | 16,000,000 | | | | 15,600,000 | |
b | | Virgin Media Secured Finance PLC, senior secured bond, 144A, 5.25%, 1/15/26 | | | United Kingdom | | | | 20,000,000 | | | | 20,600,000 | |
| | senior secured bond, first lien, 144A, 5.50%, 1/15/25 | | | United Kingdom | | | | 12,000,000 | | | | 12,570,000 | |
| | senior secured bond, first lien, 144A, 5.50%, 8/15/26 | | | United Kingdom | | | | 7,300,000 | | | | 7,640,910 | |
b | | WMG Acquisition Corp., secured note, 144A, 4.875%, 11/01/24 | | | United States | | | | 13,300,000 | | | | 13,832,000 | |
| | secured note, first lien, 144A, 5.00%, 8/01/23 | | | United States | | | | 8,500,000 | | | | 8,829,375 | |
| | | | | | | | | | | | | | |
| | | | | | | | | | | | | 411,354,910 | |
| | | | | | | | | | | | | | |
| | Pharmaceuticals, Biotechnology & Life Sciences 4.5% | | | | | | | | | | | | |
b | | AMAG Pharmaceuticals Inc., senior note, 144A, 7.875%, 9/01/23 | | | United States | | | | 19,000,000 | | | | 18,715,000 | |
| | Concordia International Corp.,
hsenior note, 144A, 7.00%, 4/15/23 | | | Canada | | | | 23,100,000 | | | | 2,425,500 | |
| | senior secured note, first lien, 144A, 9.00%, 4/01/22 | | | Canada | | | | 11,000,000 | | | | 9,240,000 | |
b,f | | Eagle Holdings Co. II LLC, senior note, 144A, PIK, 8.375%, 5/15/22 | | | United States | | | | 14,200,000 | | | | 14,448,500 | |
b | | Endo DAC/Endo Finance LLC/Endo Finco Inc., senior bond, 144A, 6.00%, 2/01/25 | | | United States | | | | 28,400,000 | | | | 21,584,000 | |
| | senior note, 144A, 6.00%, 7/15/23 | | | United States | | | | 16,200,000 | | | | 12,474,000 | |
| | Horizon Pharma Inc., senior note, 6.625%, 5/01/23 | | | United States | | | | 24,000,000 | | | | 23,520,000 | |
b | | Horizon Pharma Inc./Horizon Pharma USA Inc., senior note, 144A, 8.75%, 11/01/24 | | | United States | | | | 7,300,000 | | | | 7,756,250 | |
b | | Valeant Pharmaceuticals International, senior note, 144A, 6.375%, 10/15/20 . | | | United States | | | | 21,000,000 | | | | 21,052,500 | |
| b | | Valeant Pharmaceuticals International Inc.,
senior bond, 144A, 6.125%, 4/15/25. | | | United States | | | | 12,500,000 | | | | 10,765,625 | |
| | senior note, 144A, 7.50%, 7/15/21 | | | United States | | | | 10,000,000 | | | | 9,925,000 | |
| | senior note, 144A, 5.625%, 12/01/21 | | | United States | | | | 15,000,000 | | | | 14,025,000 | |
| | senior note, first lien, 144A, 7.00%, 3/15/24 | | | United States | | | | 4,200,000 | | | | 4,509,750 | |
| | | | | | | | | | | | | | |
| | | | | | | | | | | | | 170,441,125 | |
| | | | | | | | | | | | | | |
| | Real Estate 1.7% | | | | | | | | | | | | |
b | | Crescent Communities LLC/Crescent Ventures Inc., secured note, 144A, 8.875%, 10/15/21 | | | United States | | | | 15,208,000 | | | | 16,234,540 | |
b | | CyrusOne LP/CyrusOne Finance Corp., senior note, 144A, 5.375%, 3/15/27 | | | United States | | | | 9,400,000 | | | | 9,870,000 | |
| | Equinix Inc., senior bond, 5.375%, 4/01/23 | | | United States | | | | 14,000,000 | | | | 14,501,200 | |
| | MPT Operating Partnership LP/MPT Finance Corp.,
senior bond, 5.25%, 8/01/26 | | | United States | | | | 7,700,000 | | | | 8,142,750 | |
| | senior bond, 5.00%, 10/15/27 | | | United States | | | | 17,100,000 | | | | 17,869,500 | |
| | | | | | | | | | | | | | |
| | | | | | | | | | | | | 66,617,990 | |
| | | | | | | | | | | | | | |
| | Retailing 1.4% | | | | | | | | | | | | |
| | Netflix Inc.,
senior bond, 4.375%, 11/15/26 | | | United States | | | | 15,700,000 | | | | 15,543,000 | |
| | senior note, 5.50%, 2/15/22. | | | United States | | | | 14,200,000 | | | | 15,176,250 | |
| | | | |
| | | |
20 | | Semiannual Report | | franklintempleton.com |
FRANKLIN HIGH INCOME TRUST
STATEMENT OF INVESTMENTS (UNAUDITED)
Franklin High Income Fund (continued)
| | | | | | | | | | | | | | |
| | | | | Country | | | Principal
Amount* | | | Value | |
| |
| | Corporate Bonds (continued) | | | | | | | | | | | | |
| | Retailing (continued) | | | | | | | | | | | | |
b | | PetSmart Inc.,
senior note, 144A, 7.125%, 3/15/23 | | | United States | | | $ | 12,700,000 | | | $ | 9,302,750 | |
| | senior secured note, first lien, 144A, 5.875%, 6/01/25 | | | United States | | | | 15,600,000 | | | | 13,494,000 | |
| | | | | | | | | | | | | | |
| | | | | | | | | | | | | 53,516,000 | |
| | | | | | | | | | | | | | |
| | Semiconductors & Semiconductor Equipment 0.5% | | | | | | | | | | | | |
| | Qorvo Inc., senior note, 6.75%, 12/01/23. | | | United States | | | | 15,800,000 | | | | 17,131,150 | |
| | | | | | | | | | | | | | |
| | Software & Services 2.9% | | | | | | | | | | | | |
b | | First Data Corp.,
secured note, first lien, 144A, 5.00%, 1/15/24 | | | United States | | | | 10,000,000 | | | | 10,387,500 | |
| | secured note, second lien, 144A, 5.75%, 1/15/24 | | | United States | | | | 30,000,000 | | | | 31,237,500 | |
| | senior note, 144A, 7.00%, 12/01/23 | | | United States | | | | 14,000,000 | | | | 14,848,750 | |
| | Infor (U.S.) Inc., senior note, 6.50%, 5/15/22 | | | United States | | | | 39,000,000 | | | | 40,365,000 | |
b | | Symantec Corp., senior note, 144A, 5.00%, 4/15/25 | | | United States | | | | 12,600,000 | | | | 13,230,000 | |
| | | | | | | | | | | | | | |
| | | | | | | | | | | | | 110,068,750 | |
| | | | | | | | | | | | | | |
| | Technology Hardware & Equipment 3.0% | | | | | | | | | | | | |
b | | Blackboard Inc., secured note, second lien, 144A, 9.75%, 10/15/21 | | | United States | | | | 34,410,000 | | | | 31,313,100 | |
| | CDW LLC/CDW Finance Corp., senior note, 5.00%, 9/01/25 | | | United States | | | | 9,600,000 | | | | 10,080,000 | |
b | | CommScope Inc., senior bond, 144A, 5.50%, 6/15/24 | | | United States | | | | 7,000,000 | | | | 7,358,750 | |
| | senior note, 144A, 5.00%, 6/15/21 | | | United States | | | | 15,000,000 | | | | 15,429,375 | |
b | | CommScope Technologies LLC, senior bond, 144A, 6.00%, 6/15/25 | | | United States | | | | 10,200,000 | | | | 10,965,000 | |
b | | Dell International LLC/EMC Corp.,
senior note, 144A, 5.875%, 6/15/21 | | | United States | | | | 4,500,000 | | | | 4,691,271 | |
| | senior note, 144A, 7.125%, 6/15/24 | | | United States | | | | 4,900,000 | | | | 5,318,561 | |
| | senior secured bond, first lien, 144A, 6.02%, 6/15/26 | | | United States | | | | 5,400,000 | | | | 5,941,687 | |
| | senior secured note, first lien, 144A, 5.45%, 6/15/23 | | | United States | | | | 7,000,000 | | | | 7,558,822 | |
b | | TTM Technologies Inc., senior note, 144A, 5.625%, 10/01/25 | | | United States | | | | 15,600,000 | | | | 16,048,500 | |
| | | | | | | | | | | | | | |
| | | | | | | | | | | | | 114,705,066 | |
| | | | | | | | | | | | | | |
| | Telecommunication Services 5.5% | | | | | | | | | | | | |
b | | Block Communications Inc., senior note, 144A, 6.875%, 2/15/25 | | | United States | | | | 8,700,000 | | | | 9,287,250 | |
| | CenturyLink Inc.,
senior bond, 6.75%, 12/01/23 | | | United States | | | | 4,400,000 | | | | 4,255,680 | |
| | senior bond, 5.625%, 4/01/25 | | | United States | | | | 3,500,000 | | | | 3,108,875 | |
b | | Digicel Group Ltd., senior note, 144A, 8.25%, 9/30/20 | | | Bermuda | | | | 15,000,000 | | | | 14,524,050 | |
b | | Digicel Ltd.,
senior note, 144A, 6.00%, 4/15/21 | | | Bermuda | | | | 22,000,000 | | | | 21,340,660 | |
| | senior note, 144A, 6.75%, 3/01/23 | | | Bermuda | | | | 8,100,000 | | | | 7,871,661 | |
| | Hughes Satellite Systems Corp., senior bond, 6.625%, 8/01/26 | | | United States | | | | 22,650,000 | | | | 23,754,188 | |
| | Intelsat Jackson Holdings SA,
senior note, 7.25%, 10/15/20 | | | Luxembourg | | | | 10,000,000 | | | | 9,500,000 | |
| | senior note, 7.50%, 4/01/21. | | | Luxembourg | | | | 4,000,000 | | | | 3,745,000 | |
| | bsenior secured note, first lien, 144A, 8.00%, 2/15/24 | | | Luxembourg | | | | 8,400,000 | | | | 8,925,000 | |
| | Sprint Communications Inc.,
senior note, 6.00%, 11/15/22 | | | United States | | | | 6,500,000 | | | | 6,573,125 | |
| | bsenior note, 144A, 9.00%, 11/15/18 | | | United States | | | | 3,968,000 | | | | 4,196,160 | |
| | bsenior note, 144A, 7.00%, 3/01/20 | | | United States | | | | 9,800,000 | | | | 10,522,750 | |
| | Sprint Corp., senior note, 7.625%, 2/15/25 | | | United States | | | | 20,000,000 | | | | 21,290,000 | |
b | | Sprint Spectrum Co. LLC/Sprint Spectrum Co. II LLC, first lien, 144A, 3.36%, 3/20/23 | | | United States | | | | 20,000,000 | | | | 20,206,000 | |
| | | | |
| | | |
franklintempleton.com | | Semiannual Report | | 21 |
FRANKLIN HIGH INCOME TRUST
STATEMENT OF INVESTMENTS (UNAUDITED)
Franklin High Income Fund (continued)
| | | | | | | | | | | | | | |
| | | | | Country | | | Principal
Amount* | | | Value | |
| |
| | Corporate Bonds (continued) | | | | | | | | | | | | |
| | Telecommunication Services (continued) | | | | | | | | | | | | |
| | T-Mobile USA Inc.,
senior bond, 6.375%, 3/01/25 | | | United States | | | $ | 22,400,000 | | | $ | 24,101,280 | |
| | senior note, 6.00%, 4/15/24 | | | United States | | | | 8,500,000 | | | | 9,073,750 | |
| | senior note, 5.125%, 4/15/25 | | | United States | | | | 9,000,000 | | | | 9,427,500 | |
| | | | | | | | | | | | | | |
| | | | | | | | | | | | | 211,702,929 | |
| | | | | | | | | | | | | | |
| | Transportation 1.6% | | | | | | | | | | | | |
b | | DAE Funding LLC,
senior note, 144A, 4.50%, 8/01/22 | | | United Arab Emirates | | | | 16,000,000 | | | | 16,094,080 | |
| | senior note, 144A, 5.00%, 8/01/24 | | | United Arab Emirates | | | | 17,000,000 | | | | 17,104,210 | |
b | | Park Aerospace Holdings Ltd.,
senior note, 144A, 5.25%, 8/15/22 | | | Ireland | | | | 11,300,000 | | | | 11,554,250 | |
| | senior note, 144A, 5.50%, 2/15/24 | | | Ireland | | | | 17,700,000 | | | | 18,164,625 | |
| | | | | | | | | | | | | | |
| | | | | | | | | | | | | 62,917,165 | |
| | | | | | | | | | | | | | |
| | Utilities 5.3% | | | | | | | | | | | | |
| | Calpine Corp.,
senior bond, 5.75%, 1/15/25 | | | United States | | | | 17,400,000 | | | | 16,834,500 | |
| | senior note, 5.375%, 1/15/23 | | | United States | | | | 18,300,000 | | | | 18,300,000 | |
| | b senior secured bond, first lien, 144A, 5.875%, 1/15/24 | | | United States | | | | 5,000,000 | | | | 5,175,000 | |
| | Dynegy Inc.,
senior bond, 7.625%, 11/01/24 | | | United States | | | | 3,000,000 | | | | 3,281,250 | |
| | b senior note, 144A, 8.00%, 1/15/25 | | | United States | | | | 38,700,000 | | | | 42,763,500 | |
| | Ferrellgas Partners LP/Ferrellgas Partners Finance Corp., senior note, 8.625%, 6/15/20 | | | United States | | | | 6,600,000 | | | | 5,874,000 | |
b | | InterGen NV, secured bond, 144A, 7.00%, 6/30/23 | | | Netherlands | | | | 35,000,000 | | | | 34,037,325 | |
| | NRG Yield Operating LLC,
senior bond, 5.375%, 8/15/24 | | | United States | | | | 16,000,000 | | | | 16,680,000 | |
| | senior bond, 5.00%, 9/15/26 | | | United States | | | | 24,000,000 | | | | 24,540,000 | |
| | Talen Energy Supply LLC, senior note, 6.50%, 6/01/25 | | | United States | | | | 39,650,000 | | | | 33,702,500 | |
| | | | | | | | | | | | | | |
| | | | | | | | | | | | | 201,188,075 | |
| | | | | | | | | | | | | | |
| | Total Corporate Bonds (Cost $3,584,197,225) | | | | | | | | | | | 3,609,845,257 | |
| | | | | | | | | | | | | | |
| | | | |
| | | | | | | | Shares | | | | |
| | Escrows and Litigation Trusts 0.0%† | | | | | | | | | | | | |
a,d | | Alpha Natural Resources Inc., Escrow Account | | | United States | | | | 25,000,000 | | | | — | |
a,d | | Midstates Petroleum Co. Inc./Midstates Petroleum Co. LLC, Escrow Account | | | United States | | | | 25,000,000 | | | | — | |
a,d | | NewPage Corp., Litigation Trust | | | United States | | | | 30,000,000 | | | | — | |
a | | Penn Virginia Corp., Escrow Account | | | United States | | | | 25,000,000 | | | | 93,750 | |
a,d | | Vistra Energy Corp., Escrow Account | | | United States | | | | 50,000,000 | | | | 580,000 | |
| | | | | | | | | | | | | | |
| | Total Escrows and Litigation Trusts (Cost $1,442,951) | | | | | | | | | | | 673,750 | |
| | | | | | | | | | | | | | |
| | Total Investments before Short Term Investments
(Cost $3,855,383,782) | | | | | | | | | | | 3,735,779,246 | |
| | | | | | | | | | | | | | |
| | | | |
| | | |
22 | | Semiannual Report | | franklintempleton.com |
FRANKLIN HIGH INCOME TRUST
STATEMENT OF INVESTMENTS (UNAUDITED)
Franklin High Income Fund (continued)
| | | | | | | | | | | | | | |
| | | | | Country | | | Shares | | | Value | |
| |
| | Short Term Investments (Cost $51,056,576) 1.3% | | | | | | | | | | | | |
| | Money Market Funds 1.3% | | | | | | | | | | | | |
j,k | | Institutional Fiduciary Trust Money Market Portfolio, 0.75% | | | United States | | | | 51,056,576 | | | $ | 51,056,576 | |
| | | | | | | | | | | | | | |
| | Total Investments (Cost $3,906,440,358) 98.9% | | | | | | | | | | | 3,786,835,822 | |
| | Other Assets, less Liabilities 1.1% | | | | | | | | | | | 40,933,215 | |
| | | | | | | | | | | | | | |
| | Net Assets 100.0% | | | | | | | | | | $ | 3,827,769,037 | |
| | | | | | | | | | | | | | |
See Abbreviations on page 36.
†Rounds to less than 0.1% of net assets.
*The principal amount is stated in U.S. dollars unless otherwise indicated.
aNon-income producing.
bSecurity was purchased pursuant to Rule 144A under the Securities Act of 1933 and may be sold in transactions exempt from registration only to qualified institutional buyers or in a public offering registered under the Securities Act of 1933. These securities have been deemed liquid under guidelines approved by the Trust’s Board of Trustees. At November 30, 2017, the aggregate value of these securities was $2,011,260,811, representing 52.5% of net assets.
cSee Note 9 regarding holdings of 5% voting securities.
dFair valued using significant unobservable inputs. See Note 11 regarding fair value measurements.
eSee Note 8 regarding restricted securities.
fIncome may be received in additional securities and/or cash.
gPerpetual security with no stated maturity date.
hSee Note 7 regarding defaulted securities.
iThe coupon rate shown represents the rate at period end.
jSee Note 3(f) regarding investments in affiliated management investment companies.
kThe rate shown is the annualized seven-day yield at period end.
| | | | |
| | | |
franklintempleton.com | | The accompanying notes are an integral part of these financial statements. | Semiannual Report | | 23 |
FRANKLIN HIGH INCOME TRUST
Financial Statements
Statement of Assets and Liabilities
November 30, 2017 (unaudited)
Franklin High Income Fund
| | | | |
Assets: | | | | |
Investments in securities: | | | | |
Cost - Unaffiliated issuers | | $ | 3,821,110,005 | |
Cost - Non-controlled affiliates (Note 3f and 9) | | | 85,330,353 | |
| | | | |
Value - Unaffiliated issuers | | $ | 3,705,304,100 | |
Value - Non-controlled affiliates (Note 3f and 9) | | | 81,531,722 | |
Receivables: | | | | |
Investment securities sold | | | 5,093,357 | |
Capital shares sold | | | 3,356,819 | |
Dividends and interest | | | 54,232,095 | |
Other assets | | | 852 | |
| | | | |
Total assets | | | 3,849,518,945 | |
| | | | |
Liabilities: | | | | |
Payables: | | | | |
Investment securities purchased | | | 10,872,263 | |
Capital shares redeemed | | | 6,420,136 | |
Management fees | | | 1,434,768 | |
Distribution fees | | | 670,456 | |
Transfer agent fees | | | 2,058,604 | |
Accrued expenses and other liabilities | | | 293,681 | |
| | | | |
Total liabilities | | | 21,749,908 | |
| | | | |
Net assets, at value | | $ | 3,827,769,037 | |
| | | | |
Net assets consist of: | | | | |
Paid-in capital | | $ | 4,686,520,715 | |
Distributions in excess of net investment income | | | (15,259,830 | ) |
Net unrealized appreciation (depreciation) | | | (119,604,536 | ) |
Accumulated net realized gain (loss) | | | (723,887,312 | ) |
| | | | |
Net assets, at value | | $ | 3,827,769,037 | |
| | | | |
| | | | |
| | | |
24 | | Semiannual Report | The accompanying notes are an integral part of these financial statements. | | franklintempleton.com |
FRANKLIN HIGH INCOME TRUST
FINANCIAL STATEMENTS
Statement of Assets and Liabilities (continued)
November 30, 2017 (unaudited)
Franklin High Income Fund
| | | | |
Class A: | | | | |
Net assets, at value | | | $ 2,641,927,539 | |
| | | | |
Shares outstanding | | | 1,396,247,161 | |
| | | | |
Net asset value per sharea | | | $1.89 | |
| | | | |
Maximum offering price per share (net asset value per share ÷ 95.75%) | | | $1.97 | |
| | | | |
Class C: | | | | |
Net assets, at value | | | $ 522,674,651 | |
| | | | |
Shares outstanding | | | 273,000,931 | |
| | | | |
Net asset value and maximum offering price per sharea | | | $1.91 | |
| | | | |
Class R: | | | | |
Net assets, at value | | | $ 152,738,194 | |
| | | | |
Shares outstanding | | | 79,311,970 | |
| | | | |
Net asset value and maximum offering price per share | | | $1.93 | |
| | | | |
Class R6: | | | | |
Net assets, at value | | | $ 96,191,459 | |
| | | | |
Shares outstanding | | | 50,900,080 | |
| | | | |
Net asset value and maximum offering price per share | | | $1.89 | |
| | | | |
Advisor Class: | | | | |
Net assets, at value | | | $ 414,237,194 | |
| | | | |
Shares outstanding | | | 218,634,282 | |
| | | | |
Net asset value and maximum offering price per share | | | $1.89 | |
| | | | |
aRedemption price is equal to net asset value less contingent deferred sales charges, if applicable.
| | | | |
| | | |
franklintempleton.com | | The accompanying notes are an integral part of these financial statements. | Semiannual Report | | 25 |
FRANKLIN HIGH INCOME TRUST
FINANCIAL STATEMENTS
Statement of Operations
for the six months ended November 30, 2017 (unaudited)
Franklin High Income Fund
| | | | |
Investment income: | | | | |
Dividends: | | | | |
Unaffiliated issuers | | $ | 59,443 | |
Non-controlled affiliates (Note 3f and 9) | | | 324,081 | |
Interest: | | | | |
Unaffiliated issuers | | | 118,380,198 | |
Non-controlled affiliates (Note 9) | | | 616,022 | |
| | | | |
Total investment income | | | 119,379,744 | |
| | | | |
Expenses: | | | | |
Management fees (Note 3a) | | | 8,980,953 | |
Distribution fees: (Note 3c) | | | | |
Class A | | | 2,039,451 | |
Class C | | | 1,768,453 | |
Class R | | | 418,643 | |
Transfer agent fees: (Note 3e) | | | | |
Class A | | | 2,590,365 | |
Class C | | | 518,280 | |
Class R | | | 159,514 | |
Class R6 | | | 3,075 | |
Advisor Class | | | 458,047 | |
Custodian fees (Note 4) | | | 17,051 | |
Reports to shareholders | | | 171,110 | |
Registration and filing fees | | | 97,308 | |
Professional fees | | | 94,807 | |
Trustees’ fees and expenses | | | 49,668 | |
Other | | | 59,611 | |
| | | | |
Total expenses | | | 17,426,336 | |
Expense reductions (Note 4) | | | (1,286 | ) |
Expenses waived/paid by affiliates (Note 3f and 3g) | | | (180,329 | ) |
| | | | |
Net expenses | | | 17,244,721 | |
| | | | |
Net investment income | | | 102,135,023 | |
| | | | |
Realized and unrealized gains (losses): | | | | |
Net realized gain (loss) from: | | | | |
Investments: | | | | |
Unaffiliated issuers | | | (31,194,372 | ) |
| | | | |
Net change in unrealized appreciation (depreciation) on: | | | | |
Investments: | | | | |
Unaffiliated issuers | | | 6,911,255 | |
Non-controlled affiliates (Note 3f and 9) | | | (6,115,788 | ) |
| | | | |
Net change in unrealized appreciation (depreciation) | | | 795,467 | |
| | | | |
Net realized and unrealized gain (loss) | | | (30,398,905 | ) |
| | | | |
Net increase (decrease) in net assets resulting from operations | | $ | 71,736,118 | |
| | | | |
| | | | |
| | | |
26 | | Semiannual Report | The accompanying notes are an integral part of these financial statements. | | franklintempleton.com |
FRANKLIN HIGH INCOME TRUST
FINANCIAL STATEMENTS
Statements of Changes in Net Assets
Franklin High Income Fund
| | | | | | | | |
| | | Six Months Ended
November 30, 2017
(unaudited) | | | Year Ended
May 31, 2017 | |
| |
Increase (decrease) in net assets: | | | | | | | | |
Operations: | | | | | | | | |
Net investment income | | $ | 102,135,023 | | | $ | 218,520,275 | |
Net realized gain (loss) | | | (31,194,372 | ) | | | (232,323,111 | ) |
Net change in unrealized appreciation (depreciation) | | | 795,467 | | | | 631,183,633 | |
| | | | |
Net increase (decrease) in net assets resulting from operations | | | 71,736,118 | | | | 617,380,797 | |
| | | | |
Distributions to shareholders from: | | | | | | | | |
Net investment income: | | | | | | | | |
Class A | | | (71,342,408 | ) | | | (159,247,901 | ) |
Class C | | | (12,695,462 | ) | | | (29,102,019 | ) |
Class R | | | (4,051,753 | ) | | | (10,930,939 | ) |
Class R6 | | | (1,244,718 | ) | | | (1,886,706 | ) |
Advisor Class | | | (12,927,536 | ) | | | (27,401,355 | ) |
| | | | |
Total distributions to shareholders | | | (102,261,877 | ) | | | (228,568,920 | ) |
| | | | |
Capital share transactions: (Note 2) | | | | | | | | |
Class A | | | (125,635,857 | ) | | | (223,129,945 | ) |
Class C | | | (36,833,449 | ) | | | (54,401,859 | ) |
Class R | | | (33,189,007 | ) | | | (60,792,884 | ) |
Class R6 | | | 63,362,932 | | | | (7,559,596 | ) |
Advisor Class | | | (70,868,391 | ) | | | (82,107,010 | ) |
| | | | |
Total capital share transactions | | | (203,163,772 | ) | | | (427,991,294 | ) |
| | | | |
Net increase (decrease) in net assets | | | (233,689,531 | ) | | | (39,179,417 | ) |
Net assets: | | | | | | | | |
Beginning of period | | | 4,061,458,568 | | | | 4,100,637,985 | |
| | | | |
End of period | | $ | 3,827,769,037 | | | $ | 4,061,458,568 | |
| | | | |
Distributions in excess of net investment income included in net assets: | | | | | | | | |
End of period | | $ | (15,259,830 | ) | | $ | (15,132,976 | ) |
| | | | |
| | | | |
| | | |
franklintempleton.com | | The accompanying notes are an integral part of these financial statements. | Semiannual Report | | 27 |
FRANKLIN HIGH INCOME TRUST
Notes to Financial Statements (unaudited)
Franklin High Income Fund
1. Organization and Significant Accounting Policies
Franklin High Income Trust (Trust) is registered under the Investment Company Act of 1940 (1940 Act) as an open-end management investment company, consisting of one fund, Franklin High Income Fund (Fund) and applies the specialized accounting and reporting guidance in U.S. Generally Accepted Accounting Principles (U.S. GAAP). The Fund offers five classes of shares: Class A, Class C, Class R, Class R6 and Advisor Class. Each class of shares may differ by its initial sales load, contingent deferred sales charges, voting rights on matters affecting a single class, its exchange privilege and fees due to differing arrangements for distribution and transfer agent fees.
The following summarizes the Fund’s significant accounting policies.
a. Financial Instrument Valuation
The Fund’s investments in financial instruments are carried at fair value daily. Fair value is the price that would be received to sell an asset or paid to transfer a liability in an orderly transaction between market participants on the measurement date. The Fund calculates the net asset value (NAV) per share as of 4 p.m. Eastern time each day the New York Stock Exchange (NYSE) is open for trading. Under compliance policies and procedures approved by the Trust’s Board of Trustees (the Board), the Fund’s administrator has responsibility for oversight of valuation, including leading the cross-functional Valuation Committee (VC). The VC provides administration and oversight of the Fund’s valuation policies and procedures, which are approved annually by the Board. Among other things, these procedures allow the Fund to utilize independent pricing services, quotations from securities and financial instrument dealers, and other market sources to determine fair value.
Equity securities listed on an exchange or on the NASDAQ National Market System are valued at the last quoted sale price or the official closing price of the day, respectively. Foreign equity securities are valued as of the close of trading on the foreign stock exchange on which the security is primarily traded, or as of 4 p.m. Eastern time. The value is then converted into its U.S. dollar equivalent at the foreign exchange rate in effect at 4 p.m. Eastern time on the day that the value of the security is determined. Over-the-counter (OTC) securities are valued within the range of the most recent quoted bid and ask
prices. Securities that trade in multiple markets or on multiple exchanges are valued according to the broadest and most representative market. Certain equity securities are valued based upon fundamental characteristics or relationships to similar securities.
Debt securities generally trade in the OTC market rather than on a securities exchange. The Fund’s pricing services use multiple valuation techniques to determine fair value. In instances where sufficient market activity exists, the pricing services may utilize a market-based approach through which quotes from market makers are used to determine fair value. In instances where sufficient market activity may not exist or is limited, the pricing services also utilize proprietary valuation models which may consider market characteristics such as benchmark yield curves, credit spreads, estimated default rates, anticipated market interest rate volatility, coupon rates, anticipated timing of principal repayments, underlying collateral, and other unique security features in order to estimate the relevant cash flows, which are then discounted to calculate the fair value.
Investments in open-end mutual funds are valued at the closing NAV.
The Fund has procedures to determine the fair value of financial instruments for which market prices are not reliable or readily available. Under these procedures, the VC convenes on a regular basis to review such financial instruments and considers a number of factors, including significant unobservable valuation inputs, when arriving at fair value. The VC primarily employs a market-based approach which may use related or comparable assets or liabilities, recent transactions, market multiples, book values, and other relevant information for the investment to determine the fair value of the investment. An income-based valuation approach may also be used in which the anticipated future cash flows of the investment are discounted to calculate fair value. Discounts may also be applied due to the nature or duration of any restrictions on the disposition of the investments. Due to the inherent uncertainty of valuations of such investments, the fair values may differ significantly from the values that would have been used had an active market existed. The VC employs various methods for calibrating these valuation approaches including a regular review of key inputs and assumptions, transactional back-testing or disposition analysis, and reviews of any related market activity.
| | | | |
| | | |
28 | | Semiannual Report | | franklintempleton.com |
FRANKLIN HIGH INCOME TRUST
NOTES TO FINANCIAL STATEMENTS (UNAUDITED)
Franklin High Income Fund (continued)
Trading in securities on foreign securities stock exchanges and OTC markets may be completed before 4 p.m. Eastern time. In addition, trading in certain foreign markets may not take place on every Fund’s business day. Occasionally, events occur between the time at which trading in a foreign security is completed and 4 p.m. Eastern time that might call into question the reliability of the value of a portfolio security held by the Fund. As a result, differences may arise between the value of the Fund’s portfolio securities as determined at the foreign market close and the latest indications of value at 4 p.m. Eastern time. In order to minimize the potential for these differences, the VC monitors price movements following the close of trading in foreign stock markets through a series of country specific market proxies (such as baskets of American Depositary Receipts, futures contracts and exchange traded funds). These price movements are measured against established trigger thresholds for each specific market proxy to assist in determining if an event has occurred that may call into question the reliability of the values of the foreign securities held by the Fund. If such an event occurs, the securities may be valued using fair value procedures, which may include the use of independent pricing services.
When the last day of the reporting period is a non-business day, certain foreign markets may be open on those days that the Fund’s NAV is not calculated, which could result in differences between the value of the Fund’s portfolio securities on the last business day and the last calendar day of the reporting period. Any significant security valuation changes due to an open foreign market are adjusted and reflected by the Fund for financial reporting purposes.
b. Income and Deferred Taxes
It is the Fund’s policy to qualify as a regulated investment company under the Internal Revenue Code. The Fund intends to distribute to shareholders substantially all of its taxable income and net realized gains to relieve it from federal income and excise taxes. As a result, no provision for U.S. federal income taxes is required.
The Fund may be subject to foreign taxation related to income received, capital gains on the sale of securities and certain foreign currency transactions in the foreign jurisdictions in which it invests. Foreign taxes, if any, are recorded based on the tax regulations and rates that exist in the foreign markets in which the Fund invests. When a capital gain tax is determined
to apply, the Fund records an estimated deferred tax liability in an amount that would be payable if the securities were disposed of on the valuation date.
The Fund may recognize an income tax liability related to its uncertain tax positions under U.S. GAAP when the uncertain tax position has a less than 50% probability that it will be sustained upon examination by the tax authorities based on its technical merits. As of November 30, 2017, the Fund has determined that no tax liability is required in its financial statements related to uncertain tax positions for any open tax years (or expected to be taken in future tax years). Open tax years are those that remain subject to examination and are based on the statute of limitations in each jurisdiction in which the Fund invests.
c. Security Transactions, Investment Income, Expenses and Distributions
Security transactions are accounted for on trade date. Realized gains and losses on security transactions are determined on a specific identification basis. Interest income and estimated expenses are accrued daily. Amortization of premium and accretion of discount on debt securities are included in interest income. Dividend income is recorded on the ex-dividend date except for certain dividends from securities where the dividend rate is not available. In such cases, the dividend is recorded as soon as the information is received by the Fund. Distributions to shareholders are recorded on the ex-dividend date. Distributable earnings are determined according to income tax regulations (tax basis) and may differ from earnings recorded in accordance with U.S. GAAP. These differences may be permanent or temporary. Permanent differences are reclassified among capital accounts to reflect their tax character. These reclassifications have no impact on net assets or the results of operations. Temporary differences are not reclassified, as they may reverse in subsequent periods.
Realized and unrealized gains and losses and net investment income, excluding class specific expenses, are allocated daily to each class of shares based upon the relative proportion of net assets of each class. Differences in per share distributions by class are generally due to differences in class specific expenses.
d. Accounting Estimates
The preparation of financial statements in accordance with U.S. GAAP requires management to make estimates and assumptions that affect the reported amounts of assets and
| | | | |
| | | |
franklintempleton.com | | Semiannual Report | | 29 |
FRANKLIN HIGH INCOME TRUST
NOTES TO FINANCIAL STATEMENTS (UNAUDITED)
Franklin High Income Fund (continued)
1. Organization and Significant Accounting
Policies (continued)
d. Accounting Estimates (continued)
liabilities at the date of the financial statements and the amounts of income and expenses during the reporting period. Actual results could differ from those estimates.
e. Guarantees and Indemnifications
Under the Trust’s organizational documents, its officers and trustees are indemnified by the Trust against certain liabilities arising out of the performance of their duties to the Trust.
Additionally, in the normal course of business, the Trust, on behalf of the Fund, enters into contracts with service providers that contain general indemnification clauses. The Trust’s maximum exposure under these arrangements is unknown as this would involve future claims that may be made against the Trust that have not yet occurred. Currently, the Trust expects the risk of loss to be remote.
2. Shares of Beneficial Interest
At November 30, 2017, there were an unlimited number of shares authorized (without par value). Transactions in the Fund’s shares were as follows:
| | | | | | | | | | | | | | | | |
| | | Six Months Ended November 30, 2017 | | | Year Ended May 31, 2017 | |
| | | Shares | | | Amount | | | Shares | | | Amount | |
Class A Shares: | | | | | | | | | | | | | | | | |
Shares sold | | | 82,341,316 | | | $ | 156,148,265 | | | | 257,158,477 | | | $ | 473,549,850 | |
Shares issued in reinvestment of distributions | | | 32,739,180 | | | | 62,148,894 | | | | 75,932,035 | | | | 138,843,273 | |
Shares redeemed | | | (181,310,523 | ) | | | (343,933,016 | ) | | | (453,037,278 | ) | | | (835,523,068 | ) |
Net increase (decrease) | | | (66,230,027 | ) | | $ | (125,635,857 | ) | | | (119,946,766 | ) | | $ | (223,129,945 | ) |
Class C Shares: | | | | | | | | | | | | | | | | |
Shares sold | | | 11,605,873 | | | $ | 22,270,883 | | | | 41,221,633 | | | $ | 76,670,732 | |
Shares issued in reinvestment of distributions | | | 6,045,957 | | | | 11,598,035 | | | | 14,146,434 | | | | 26,167,808 | |
Shares redeemed | | | (36,852,780 | ) | | | (70,702,367 | ) | | | (84,439,105 | ) | | | (157,240,399 | ) |
Net increase (decrease) | | | (19,200,950 | ) | | $ | (36,833,449 | ) | | | (29,071,038 | ) | | $ | (54,401,859 | ) |
Class R Shares: | | | | | | | | | | | | | | | | |
Shares sold | | | 4,932,600 | | | $ | 9,518,669 | | | | 17,776,146 | | | $ | 33,224,811 | |
Shares issued in reinvestment of distributions | | | 2,052,881 | | | | 3,962,107 | | | | 5,769,905 | | | | 10,711,866 | |
Shares redeemed | | | (24,168,106 | ) | | | (46,669,783 | ) | | | (56,102,557 | ) | | | (104,729,561 | ) |
Net increase (decrease) | | | (17,182,625 | ) | | $ | (33,189,007 | ) | | | (32,556,506 | ) | | $ | (60,792,884 | ) |
Class R6 Shares: | | | | | | | | | | | | | | | | |
Shares sold | | | 35,305,385 | | | $ | 67,033,652 | | | | 7,749,689 | | | $ | 14,240,327 | |
Shares issued in reinvestment of distributions | | | 656,770 | | | | 1,244,717 | | | | 973,873 | | | | 1,779,538 | |
Shares redeemed | | | (2,601,205 | ) | | | (4,915,437 | ) | | | (13,045,466 | ) | | | (23,579,461 | ) |
Net increase (decrease) | | | 33,360,950 | | | $ | 63,362,932 | | | | (4,321,904 | ) | | $ | (7,559,596 | ) |
Advisor Class Shares: | | | | | | | | | | | | | | | | |
Shares sold | | | 42,741,222 | | | $ | 81,216,919 | | | | 182,890,582 | | | $ | 338,403,487 | |
Shares issued in reinvestment of distributions | | | 6,055,894 | | | | 11,495,720 | | | | 13,258,046 | | | | 24,255,051 | |
Shares redeemed | | | (86,074,036 | ) | | | (163,581,030 | ) | | | (243,393,629 | ) | | | (444,765,548 | ) |
Net increase (decrease) | | | (37,276,920 | ) | | $ | (70,868,391 | ) | | | (47,245,001 | ) | | $ | (82,107,010 | ) |
| | | | |
| | | |
30 | | Semiannual Report | | franklintempleton.com |
FRANKLIN HIGH INCOME TRUST
NOTES TO FINANCIAL STATEMENTS (UNAUDITED)
Franklin High Income Fund (continued)
3. Transactions with Affiliates
Franklin Resources, Inc. is the holding company for various subsidiaries that together are referred to as Franklin Templeton Investments. Certain officers and trustees of the Fund are also officers, and/or directors of the following subsidiaries:
| | |
| Subsidiary | | Affiliation |
Franklin Advisers, Inc. (Advisers) | | Investment manager |
Franklin Templeton Services, LLC (FT Services) | | Administrative manager |
Franklin Templeton Distributors, Inc. (Distributors) | | Principal underwriter |
Franklin Templeton Investor Services, LLC (Investor Services) | | Transfer agent |
a. Management Fees
The Fund pays an investment management fee to Advisers based on the month-end net assets of the Fund as follows:
| | |
| Annualized Fee Rate | | Net Assets |
0.625% | | Up to and including $100 million |
0.500% | | Over $100 million, up to and including $250 million |
0.450% | | Over $250 million, up to and including $7.5 billion |
0.440% | | Over $7.5 billion, up to and including $10 billion |
0.430% | | Over $10 billion, up to and including $12.5 billion |
0.420% | | Over $12.5 billion, up to and including $15 billion |
0.400% | | Over $15 billion, up to and including $17.5 billion |
0.380% | | Over $17.5 billion, up to and including $20 billion |
0.360% | | Over $20 billion, up to and including $35 billion |
0.355% | | Over $35 billion, up to and including $50 billion |
0.350% | | In excess of $50 billion |
For the period ended November 30, 2017, the annualized effective investment management fee rate was 0.454% of the Fund’s average daily net assets.
b. Administrative Fees
Under an agreement with Advisers, FT Services provides administrative services to the Fund. The fee is paid by Advisers based on the Fund’s average daily net assets, and is not an additional expense of the Fund.
c. Distribution Fees
The Board has adopted distribution plans for each share class, with the exception of Class R6 and Advisor Class shares, pursuant to Rule 12b-1 under the 1940 Act. Under the Fund’s Class A reimbursement distribution plan, the Fund reimburses Distributors for costs incurred in connection with the servicing, sale and distribution of the Fund’s shares up to the maximum annual plan rate. Under the Class A reimbursement distribution plan, costs exceeding the maximum for the current plan year cannot be reimbursed in subsequent periods. In addition, under the Fund’s Class C and R compensation distribution plans, the Fund pays Distributors for costs incurred in connection with the servicing, sale and distribution of the Fund’s shares up to the maximum annual plan rate for each class. The plan year, for purposes of monitoring compliance with the maximum annual plan rates, is February 1 through January 31.
| | | | |
| | | |
franklintempleton.com | | Semiannual Report | | 31 |
FRANKLIN HIGH INCOME TRUST
NOTES TO FINANCIAL STATEMENTS (UNAUDITED)
Franklin High Income Fund (continued)
3. Transactions with Affiliates (continued)
c. Distribution Fees (continued)
The maximum annual plan rates, based on the average daily net assets, for each class, are as follows:
| | | | |
Class A | | | 0.15 | % |
Class C | | | 0.65 | % |
Class R | | | 0.50 | % |
d. Sales Charges/Underwriting Agreements
Front-end sales charges and contingent deferred sales charges (CDSC) do not represent expenses of the Fund. These charges are deducted from the proceeds of sales of Fund shares prior to investment or from redemption proceeds prior to remittance, as applicable. Distributors has advised the Fund of the following commission transactions related to the sales and redemptions of the Fund’s shares for the period:
| | | | |
Sales charges retained net of commissions
paid to unaffiliated brokers/dealers | | $ | 204,305 | |
CDSC retained | | $ | 23,085 | |
e. Transfer Agent Fees
Each class of shares pays transfer agent fees to Investor Services for its performance of shareholder servicing obligations. Effective November 1, 2017, the fees are based on an annualized asset based fee of 0.02% plus a transaction based fee. Prior to November 1, 2017, the fees were account based fees that varied based on fund or account type. In addition, each class reimburses Investor Services for out of pocket expenses incurred and, except for Class R6, reimburses shareholder servicing fees paid to third parties. These fees are allocated daily based upon their relative proportion of such classes’ aggregate net assets. Class R6 pays Investor Services transfer agent fees specific to that class.
For the period ended November 30, 2017, the Fund paid transfer agent fees of $3,729,281, of which $1,043,736 was retained by Investor Services.
f. Investments in Affiliated Management Investment Companies
The Fund invests in one or more affiliated management investment companies for purposes other than exercising a controlling influence over the management or policies. Management fees paid by the Fund are waived on assets invested in the affiliated management investment companies, as noted in the Statement of Operations, in an amount not to exceed the management and administrative fees paid directly or indirectly by each affiliate. Prior to June 1, 2013, the waiver was accounted for as a reduction to management fees. During the period ended November 30, 2017, the Fund held investments in affiliated management investment companies as follows:
| | | | | | | | | | | | | | | | | | | | | | | | | | | | | | | | |
| | | Number of
Shares Held
at Beginning
of Period | | | Gross
Additions | | | Gross
Reductions | | | Number of
Shares Held at End
of Period | | | Value at End of Period | | | Dividend
Income | | | Realized
Gain (Loss) | | | Net Change in
Unrealized Appreciation (Depreciation) | |
Non-Controlled Affiliates | | | | | | | | | | | | | | | | | | | | | | | | | | | | | | | | |
Institutional Fiduciary Trust Money Market Portfolio, 0.75% | | | 99,711,624 | | | | 409,580,100 | | | | (458,235,148 | ) | | | 51,056,576 | | | | $51,056,576 | | | | $324,081 | | | | $— | | | | $— | |
| | | | | | | | | | | | | | | | | | | | |
g. Waiver and Expense Reimbursements
Investor Services has voluntarily agreed in advance to waive or limit its fees so that the Class R6 transfer agent fees do not exceed 0.03%. Investor Services may discontinue this waiver in the future.
| | | | |
| | | |
32 | | Semiannual Report | | franklintempleton.com |
FRANKLIN HIGH INCOME TRUST
NOTES TO FINANCIAL STATEMENTS (UNAUDITED)
Franklin High Income Fund (continued)
4. Expense Offset Arrangement
The Fund has entered into an arrangement with its custodian whereby credits realized as a result of uninvested cash balances are used to reduce a portion of the Fund’s custodian expenses. During the period ended November 30, 2017, the custodian fees were reduced as noted in the Statement of Operations.
5. Income Taxes
For tax purposes, capital losses may be carried over to offset future capital gains. Capital loss carryforwards with no expiration, if any, must be fully utilized before those losses with expiration dates.
At May 31, 2017, capital loss carryforwards were as follows:
| | | | |
Capital loss carryforwards subject to expiration: | | | | |
2018 | | $ | 146,834,317 | |
Capital loss carryforwards not subject to expiration: | | | | |
Short term | | | 321,647 | |
Long term | | | 545,534,214 | |
Total capital loss carryforwards | | $ | 692,690,178 | |
At November 30, 2017, the cost of investments and net unrealized appreciation (depreciation) for income tax purposes were as follows:
| | | | |
Cost of investments. | | $ | 3,918,080,990 | |
| |
Unrealized appreciation | | $ | 149,534,941 | |
Unrealized depreciation | | | (280,780,109 | ) |
Net unrealized appreciation (depreciation) | | $ | (131,245,168 | ) |
Differences between income and/or capital gains as determined on a book basis and a tax basis are primarily due to differing treatments of defaulted securities and bond discounts and premiums.
6. Investment Transactions
Purchases and sales (excluding short term securities) for the period ended November 30, 2017, aggregated $404,562,567 and $525,689,663, respectively.
7. Credit Risk and Defaulted Securities
At November 30, 2017, the Fund had 90.5% of its portfolio invested in high yield or other securities rated below investment grade and unrated securities, if any. These securities may be more sensitive to economic conditions causing greater price volatility and are potentially subject to a greater risk of loss due to default than higher rated securities.
The Fund held defaulted securities and/or other securities for which the income has been deemed uncollectible. At November 30, 2017, the aggregate value of these securities was $3,440,405, representing 0.1% of the Fund’s net assets. The Fund discontinues accruing income on securities for which income has been deemed uncollectible and provides an estimate for losses on interest receivable. The securities have been identified in the accompanying Statement of Investments.
| | | | |
| | | |
franklintempleton.com | | Semiannual Report | | 33 |
FRANKLIN HIGH INCOME TRUST
NOTES TO FINANCIAL STATEMENTS (UNAUDITED)
Franklin High Income Fund (continued)
8. Restricted Securities
The Fund invests in securities that are restricted under the Securities Act of 1933 (1933 Act). Restricted securities are often purchased in private placement transactions, and cannot be sold without prior registration unless the sale is pursuant to an exemption under the 1933 Act. Disposal of these securities may require greater effort and expense, and prompt sale at an acceptable price may be difficult. The Fund may have registration rights for restricted securities. The issuer generally incurs all registration costs.
At November 30, 2017, investments in restricted securities, excluding securities exempt from registration under the 1933 Act deemed to be liquid, were as follows:
| | | | | | | | | | | | | | | | |
| Shares | | | Issuer | | Acquisition
Date | | | Cost | | | Value | |
| | |
| | 8,080 | | | a Nine Point Energy Holdings Inc., cvt. pfd. (Value is 0.2% of Net Assets) | | | 3/24/17 | | | $ | 7,552,087 | | | $ | 9,148,179 | |
| | | | | | | | | | | | |
a The Fund also invests in unrestricted securities or other investments in the issuer, valued at $3,695,270 as of November 30, 2017.
9. Holdings of 5% Voting Securities of Portfolio Companies
The 1940 Act defines “affiliated companies” to include investments in portfolio companies in which a fund owns 5% or more of the outstanding voting securities. During the period ended November 30, 2017, investments in “affiliated companies” were as follows:
| | | | | | | | | | | | | | | | | | | | | | | | | | | | | | | | |
| Name of Issuer | | Number of
Shares/
Warrants/
Principal
Amount* Held
at Beginning
of Period | | | Gross
Additions | | | Gross
Reductions | | | Number of
Shares/
Warrants/
Principal
Amount* Held
at End of Period | | | Value at End of Period | | | Investment Income | | | Realized
Gain
(Loss) | | | Net Change in Unrealized
Appreciation
(Depreciation) | |
Non-Controlled Affiliates | | | | | | | | | | | | | | | | | | | | | | | | | | | | | | | | |
| | | | | | | | | | | | | | | | | | | | | | | Dividends | | | | | | | | | |
CHC Group LLC | | | 386,335 | | | | — | | | | — | | | | 386,335 | | | $ | 3,090,680 | | | | $ — | | | $ | — | | | $ | (1,352,172 | ) |
Goodrich Petroleum Corp | | | 1,049,684 | | | | — | | | | — | | | | 1,049,684 | | | | 11,074,166 | | | | — | | | | — | | | | (1,606,017 | ) |
Goodrich Petroleum Corp., wts., 10/12/26 | | | 515,625 | | | | — | | | | — | | | | 515,625 | | | | 5,435,673 | | | | — | | | | — | | | | (788,873 | ) |
Titan Energy LLC | | | 289,137 | | | | — | | | | — | | | | 289,137 | | | | 433,705 | | | | — | | | | — | | | | (2,298,640 | ) |
| | | | | | | | | | | | | | | | | | | | |
| | | | | | | | | | | | | | | | | | $ | 20,034,224 | | | | $ — | | | $ | — | | | $ | (6,045,702 | ) |
| | | | | | | | | | | | | | | | | | | | |
| | | | | | | | | | | | | | | | | | | | | | | Interest | | | | | | | | | |
Goodrich Petroleum Corp., senior secured note, second lien, PIK, 13.50%, 8/30/19 | | | 575,865 | | | | 605,797 | a | | | — | | | | 1,181,662 | | | | 1,139,047 | | | | 59,147 | | | | — | | | | (35,401 | ) |
Goodrich Petroleum Corp., senior secured note, second lien, PIK, cvt., 13.50%, 8/30/19 | | | 8,250,000 | | | | — | | | | — | | | | 8,250,000 | | | | 9,301,875 | | | | 556,875 | | | | — | | | | (34,685 | ) |
| | | | | | | | | | | | | | | | | | | | |
| | | | | | | | | | | | | | | | | | $ | 10,440,922 | | | | $616,022 | | | $ | — | | | $ | (70,086 | ) |
| | | | | | | | | | | | | | | | | | | | |
Total Affiliated Securities (Value is 0.8% of Net Assets) | | | | | | | | | | | $ | 30,475,146 | | | | $616,022 | | | $ | — | | | $ | (6,115,788 | ) |
| | | | | | | | | | | | | | | | | | | | |
*The principal amount is stated in U.S. dollars unless otherwise indicated.
aGross addition was the result of various corporate actions.
10. Credit Facility
The Fund, together with other U.S. registered and foreign investment funds (collectively, Borrowers), managed by Franklin Templeton Investments, are borrowers in a joint syndicated senior unsecured credit facility totaling $2 billion (Global Credit Facility) which matures on February 9, 2018. This Global Credit Facility provides a source of funds to the Borrowers for temporary and emergency purposes, including the ability to meet future unanticipated or unusually large redemption requests.
| | | | |
| | | |
34 | | Semiannual Report | | franklintempleton.com |
FRANKLIN HIGH INCOME TRUST
NOTES TO FINANCIAL STATEMENTS (UNAUDITED)
Franklin High Income Fund (continued)
Under the terms of the Global Credit Facility, the Fund shall, in addition to interest charged on any borrowings made by the Fund and other costs incurred by the Fund, pay its share of fees and expenses incurred in connection with the implementation and maintenance of the Global Credit Facility, based upon its relative share of the aggregate net assets of all of the Borrowers, including an annual commitment fee of 0.15% based upon the unused portion of the Global Credit Facility. These fees are reflected in other expenses in the Statement of Operations. During the period ended November 30, 2017, the Fund did not use the Global Credit Facility.
11. Fair Value Measurements
The Fund follows a fair value hierarchy that distinguishes between market data obtained from independent sources (observable inputs) and the Fund’s own market assumptions (unobservable inputs). These inputs are used in determining the value of the Fund’s financial instruments and are summarized in the following fair value hierarchy:
| | • | | Level 1 – quoted prices in active markets for identical financial instruments |
| | • | | Level 2 – other significant observable inputs (including quoted prices for similar financial instruments, interest rates, prepayment speed, credit risk, etc.) |
| | • | | Level 3 – significant unobservable inputs (including the Fund’s own assumptions in determining the fair value of financial instruments) |
The input levels are not necessarily an indication of the risk or liquidity associated with financial instruments at that level.
For movements between the levels within the fair value hierarchy, the Fund has adopted a policy of recognizing the transfers as of the date of the underlying event which caused the movement.
A summary of inputs used as of November 30, 2017, in valuing the Fund’s assets carried at fair value, is as follows:
| | | | | | | | | | | | | | | | |
| | | Level 1 | | | Level 2 | | | Level 3 | | | Total | |
Assets: | | | | | | | | | | | | | | | | |
Investments in Securities: | | | | | | | | | | | | | | | | |
Equity Investments:a | | | | | | | | | | | | | | | | |
Energy. | | $ | 61,691,221 | | | $ | 4,255,026 | | | $ | 18,294,021 | | | $ | 84,240,268 | |
Materials | | | 1,745,918 | | | | 88 | | | | — | | | | 1,746,006 | |
Transportation | | | — | | | | 4,603,298 | | | | — | | | | 4,603,298 | |
Convertible Bonds | | | — | | | | 34,670,667 | | | | — | | | | 34,670,667 | |
Corporate Bonds | | | — | | | | 3,608,705,305 | | | | 1,139,952 | | | | 3,609,845,257 | |
Escrows and Litigation Trusts | | | — | | | | 93,750 | | | | 580,000 | b | | | 673,750 | |
Short Term Investments | | | 51,056,576 | | | | — | | | | — | | | | 51,056,576 | |
| | | | |
Total Investments in Securities | | $ | 114,493,715 | | | $ | 3,652,328,134 | | | $ | 20,013,973 | | | $ | 3,786,835,822 | |
| | | | |
aIncludes common and convertible preferred stocks as well as other equity investments.
bIncludes securities determined to have no value at November 30, 2017.
A reconciliation of assets in which Level 3 inputs are used in determining fair value is presented when there are significant Level 3 financial instruments at the end of the period.
12. New Accounting Pronouncements
In March 2017, the Financial Accounting Standards Board issued Accounting Standards Update (ASU) No. 2017-08, Receivables—Nonrefundable Fees and Other Costs (Subtopic 310-20): Premium Amortization on Purchased Callable Debt Securities. The amendments in the ASU shorten the amortization period for certain callable debt securities acquired at a premium, to be amortized
| | | | |
| | | |
franklintempleton.com | | Semiannual Report | | 35 |
FRANKLIN HIGH INCOME TRUST
NOTES TO FINANCIAL STATEMENTS (UNAUDITED)
Franklin High Income Fund (continued)
12. New Accounting Pronouncements (continued)
to the earliest call date. The ASU does not require an accounting change for securities acquired at a discount, which continues to be amortized to maturity. The ASU is effective for fiscal years and interim periods within those fiscal years beginning after December 15, 2018. Management is currently evaluating the impact, if any, of applying this provision.
13. Subsequent Events
The Fund has evaluated subsequent events through the issuance of the financial statements and determined that no events have occurred that require disclosure.
Abbreviations
| | | | | | | | |
| Currency | | Selected Portfolio | | |
| USD | | United States Dollar | | FRN | | Floating Rate Note | | |
| | | | LIBOR | | London InterBank Offered Rate | | |
| | | | PIK | | Payment-In-Kind | | |
| | | | |
| | | |
36 | | Semiannual Report | | franklintempleton.com |
FRANKLIN HIGH INCOME TRUST
FRANKLIN HIGH INCOME FUND
Shareholder Information
Proxy Voting Policies and Procedures
The Fund’s investment manager has established Proxy Voting Policies and Procedures (Policies) that the Fund uses to determine how to vote proxies relating to portfolio securities. Shareholders may view the Fund’s complete Policies online at franklintempleton.com. Alternatively, shareholders may request copies of the Policies free of charge by calling the Proxy Group collect at (954) 527-7678 or by sending a written request to: Franklin Templeton Companies, LLC, 300 S.E. 2nd Street, Fort Lauderdale, FL 33301, Attention: Proxy Group. Copies of the Fund’s proxy voting records are also made available online at franklintempleton.com and posted on the US Securities and Exchange Commission’s website at sec.gov and reflect the most recent 12-month period ended June 30.
Quarterly Statement of Investments
The Trust, on behalf of the Fund, files a complete statement of investments with the US Securities and Exchange Commission for the first and third quarters for each fiscal year on Form N-Q. Shareholders may view the filed Form N-Q by visiting the Commission’s website at sec.gov. The filed form may also be viewed and copied at the Commission’s Public Reference Room in Washington, DC. Information regarding the operations of the Public Reference Room may be obtained by calling (800) SEC-0330.
| | | | |
| | | |
franklintempleton.com | | Semiannual Report | | 37 |
This page intentionally left blank.
This page intentionally left blank.
This page intentionally left blank.
| | | | | | |
| |  | | Semiannual Report and Shareholder Letter Franklin High Income Fund Investment Manager Franklin Advisers, Inc. Distributor Franklin Templeton Distributors, Inc. (800) DIAL BEN® / 342-5236 franklintempleton.com Shareholder Services (800) 632-2301 | | |
Authorized for distribution only when accompanied or preceded by a summary prospectus and/or prospectus. Investors should carefully consider a fund’s investment goals, risks, charges and expenses before investing. A prospectus contains this and other information; please read it carefully before investing.
To help ensure we provide you with quality service, all calls to and from our service areas are monitored and/or recorded.
| | |
| © 2017-2018 Franklin Templeton Investments. All rights reserved. | | 105 S 01/18 |
Item 2. Code of Ethics.
(a) The Registrant has adopted a code of ethics that applies to its principal executive officers and principal financial and accounting officer.
(c) N/A
(d) N/A
(f) Pursuant to Item 12(a)(1), the Registrant is attaching as an exhibit a copy of its code of ethics that applies to its principal executive officers and principal financial and accounting officer.
Item 3. Audit Committee Financial Expert.
(a) (1) The Registrant has an audit committee financial expert serving on its audit committee.
(2) The audit committee financial expert is John B. Wilson and he is “independent” as defined under the relevant Securities and Exchange Commission Rules and Releases.
| | | | | | |
Item 4. Principal Accountant Fees and Services. | | N/A | | |
| | | | | | |
Item 5. Audit Committee of Listed Registrants. | | N/A | | |
| | |
| Item 6. Schedule of Investments. | | N/A | | |
| | |
| Item 7. Disclosure of Proxy Voting Policies and Procedures for Closed-End Management Investment Companies. | | N/A | | |
| | |
| Item 8. Portfolio Managers of Closed-End Management Investment Companies. | | N/A | | |
| | |
| Item 9. Purchases of Equity Securities by Closed-End Management Investment Company and Affiliated Purchasers. | | N/A | | |
| | |
| Item 10. Submission of Matters to a Vote of Security Holders. | | | | |
There have been no changes to the procedures by which shareholders may recommend nominees to the Registrant’s Board of Trustees that would require disclosure herein.
Item 11. Controls and Procedures.
(a) Evaluation of Disclosure Controls and Procedures. The Registrant maintains disclosure controls and procedures that are designed to ensure that information required to be disclosed in the Registrant’s filings under the Securities Exchange Act of 1934 and the Investment Company Act of 1940 is recorded, processed, summarized and reported within the periods specified in the rules and forms of the Securities and Exchange Commission. Such information is accumulated and communicated to the Registrant’s management, including its principal executive officer and principal financial officer, as appropriate, to allow timely decisions regarding required disclosure. The Registrant’s management, including the principal executive officer and the principal financial officer, recognizes that any set of controls and procedures, no matter how well designed and operated, can provide only reasonable assurance of achieving the desired control objectives.
Within 90 days prior to the filing date of this Shareholder Report on Form N-CSR, the Registrant had carried out an evaluation, under the supervision and with the participation of the Registrant’s management, including the Registrant’s principal executive officer and the Registrant’s principal financial officer, of the effectiveness of the design and operation of the Registrant’s disclosure controls and procedures. Based on such evaluation, the Registrant’s principal executive officer and principal financial officer concluded that the Registrant’s disclosure controls and procedures are effective.
(b) Changes in Internal Controls. There have been no changes in the Registrant’s internal controls or in other factors that could materially affect the internal controls over financial reporting subsequent to the date of their evaluation in connection with the preparation of this Shareholder Report on Form N-CSR.
Item 12. Exhibits.
(a) (1) Code of Ethics
(a) (2) Certifications pursuant to Section 302 of the Sarbanes-Oxley Act of 2002 of Matthew T. Hinkle, Chief Executive Officer – Finance and Administration, and Gaston Gardey, Chief Financial Officer and Chief Accounting Officer
(b) Certifications pursuant to Section 906 of the Sarbanes-Oxley Act of 2002 of Matthew T. Hinkle, Chief Executive Officer – Finance and Administration, and Gaston Gardey, Chief Financial Officer and Chief Accounting Officer
SIGNATURES
Pursuant to the requirements of the Securities Exchange Act of 1934 and the Investment Company Act of 1940, the registrant has duly caused this report to be signed on its behalf by the undersigned, thereunto duly authorized.
| | |
| FRANKLIN HIGH INCOME TRUST |
| |
| By | | /s/ MATTHEW T. HINKLE |
| | Matthew T. Hinkle |
| | Chief Executive Officer – |
| | Finance and Administration |
| Date January 25, 2018 |
Pursuant to the requirements of the Securities Exchange Act of 1934 and the Investment Company Act of 1940, this report has been signed below by the following persons on behalf of the registrant and in the capacities and on the dates indicated.
| | |
| By | | /s/ MATTHEW T. HINKLE |
| | Matthew T. Hinkle |
| | Chief Executive Officer – |
| | Finance and Administration |
| Date January 25, 2018 |
| | |
| By | | /s/ GASTON GARDEY |
| | Gaston Gardey |
| | Chief Financial Officer and |
| | Chief Accounting Officer |
| Date January 25, 2018 |