UNITED STATES
SECURITIES AND EXCHANGE COMMISSION
Washington, DC 20549
FORMN-CSRS
CERTIFIED SHAREHOLDER REPORT OF REGISTERED MANAGEMENT INVESTMENT
COMPANIES
Investment Company Act file number811-01608
Franklin High Income Trust
(Exact name of registrant as specified in charter)
One Franklin Parkway, San Mateo, CA 94403-1906
(Address of principal executive offices) (Zip code)
Craig S. Tyle, One Franklin Parkway, San Mateo, CA 94403-1906
(Name and address of agent for service)
Registrant’s telephone number, including area code: 650312-2000
Date of fiscal year end: 5/31
Date of reporting period: 11/30/18
Item 1. Reports to Stockholders.
Beginning on January 1, 2021, as permitted by the Securities and Exchange Commission, paper copies of the Fund’s shareholder reports will no longer be sent by mail, unless you specifically request paper copies of the reports from the Fund or from your financial intermediary. Instead, the reports will be made available on a website, and you will be notified by mail each time a report is posted and provided with a website link to access the report.
If you already elected to receive shareholder reports electronically, you will not be affected by this change and you need not take any action. If you have not signed up for electronic delivery, we would encourage you to join fellow shareholders who have. You may elect to receive shareholder reports and other communications electronically from the Fund by calling(800) 632-2301 or by contacting your financial intermediary.
You may elect to continue to receive paper copies of all your future shareholder reports free of charge by contacting your financial intermediary or, if you invest directly with a Fund, calling(800) 632-2301 to let the Fund know of your request. Your election to receive reports in paper will apply to all funds held in your account.
Franklin Templeton Investments
Successful investing begins with ambition. And achievement only comes when you reach for it. That’s why we continually strive to deliver better outcomes for investors. No matter what your goals are, our deep, global investment expertise allows us to offer solutions that can help.
During our more than 70 years of experience, we’ve managed through all kinds of markets—up, down and those in between. We’re always preparing for what may come next. It’s because of this, combined with our strength as one of the world’s largest asset managers that we’ve earned the trust of millions of investors around the world.
Dear Shareholder:
During the six months ended November 30, 2018, the U.S. economy grew, particularly during 2018’s second quarter, while unemployment and annual inflation declined. With these factors in mind, the U.S. Federal Reserve (Fed) raised its target range for the federal funds rate 0.25% at both its June and September meetings. The Fed kept the federal funds rate unchanged at its November meeting, and comments by the chairman nearperiod-end suggested the pace of future rate increases could slow.
The10-year Treasury yield, which moves inversely to price, rose from 2.83% at the end of May to multi-year highs in October and November amid investor concerns about inflation and Fed actions. However, largely due to ongoing uncertainty about political tensions and economic turmoil in the U.S. and other countries, the10-year Treasury yield subsequently declined to end the period at 3.01%. Within this environment, investment-grade bonds, as measured by the Bloomberg Barclays U.S. Aggregate Bond Index, had a-0.30% total return.1 Below investment-grade bonds, as measured by the Credit Suisse High Yield Index, posted a +0.09% total return.1
We are committed to our long-term perspective and disciplined investment approach as we conduct a rigorous, fundamental analysis of securities with a regular emphasis on investment risk management.
We believe active, professional investment management serves investors well. We also recognize the important role of financial advisors in today’s markets and encourage investors to continue to seek their advice. Amid changing markets and
CFA® is a trademark owned by CFA Institute.
1. Source: Morningstar.
See www.franklintempletondatasources.com for additional data provider information.
economic conditions, we are confident investors with a well-diversified portfolio and a patient, long-term outlook should be well positioned for the years ahead.
In addition, Franklin High Income Fund’s semiannual report includes more detail about prevailing conditions and a discussion about investment decisions during the period. Please remember all securities markets fluctuate, as do mutual fund share prices.
We thank you for investing with Franklin Templeton, welcome your questions and comments, and look forward to serving your future investment needs.
Sincerely,

Christopher J. Molumphy, CFA
President and Chief Executive Officer –
Investment Management
Franklin High Income Trust
This letter reflects our analysis and opinions as of November 30, 2018, unless otherwise indicated. The information is not a complete analysis of every aspect of any market, country, industry, security or fund. Statements of fact are from sources considered reliable.
| Not FDIC Insured | May Lose Value | No Bank Guarantee |
franklintempleton.com | Not part of the semiannual report | 1 | ||
Semiannual Report
| 3 | ||||
| 6 | ||||
| 8 | ||||
| 9 | ||||
| 24 | ||||
| 28 | ||||
| 38 | |||
Visitfranklintempleton.comfor fund updates, to access your account, or to find helpful financial planning tools.
2 | Semiannual Report | franklintempleton.com | ||
Semiannual Report
This semiannual report for Franklin High Income Fund covers the period ended November 30, 2018.
Your Fund’s Goals and Main Investments
The Fund seeks a high level of current income, with a secondary goal of capital appreciation, by investing predominantly in high yield, lower rated debt securities including bonds, notes, debentures, convertible securities and senior and subordinated debt securities. The Fund may also invest in preferred stocks and foreign securities.
Performance Overview
The Fund’s Class A shares had a-0.45% cumulative total return for the six months under review. In comparison, the benchmark Credit Suisse (CS) High Yield Index, which tracks the high yield debt market, posted a +0.09% total return.1 The Fund’s peers had a-0.22% total return, as measured by the Lipper High Yield Funds Classification Average, which consists of funds chosen by Lipper that aim at high relative current yield from fixed income securities.2 You can find more of the Fund’s performance data in the Performance Summary beginning on page 6.
Performance data represent past performance, which does not guarantee future results. Investment return and principal value will fluctuate, and you may have a gain or loss when you sell your shares. Current performance may differ from figures shown. For most recentmonth-end performance, go tofranklintempleton.comor call(800)342-5236.
Economic and Market Overview
The U.S. economy grew during the six months under review. The economy grew faster in 2018’s second quarter, driven by consumer spending, business investment, exports and government spending, but moderated in the third quarter due to declines in exports and housing investment. The manufacturing and services sectors expanded during the period. The
Asset Allocation*
Based on Total Net Assets as of 11/30/18
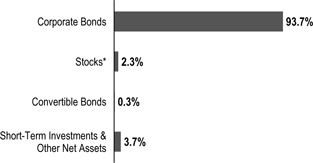
*Includes common, convertible preferred stocks, escrows and litigation trusts as well as other equity interests.
unemployment rate declined from 3.8% in May 2018 to a nearly49-year low of 3.7% atperiod-end.3 Annual inflation, as measured by the Consumer Price Index, decreased from 2.8% in May 2018 to 2.2% atperiod-end.3
The U.S. Federal Reserve (Fed) raised its target range for the federal funds rate 0.25% at its June 2018 meeting and continued to reduce its balance sheet as part of its ongoing plan to normalize monetary policy. In his congressional testimony in July 2018 and at the Fed symposium in August, Fed Chair Jerome Powell reiterated the Fed’s intention to gradually raise interest rates. At its September 2018 meeting, the Fed raised its target range for the federal funds rate 0.25% to 2.00%–2.25%, as widely expected. Furthermore, the Fed raised its forecast for U.S. economic growth in 2018 and 2019 and projected one more rate increase in 2018. At its November meeting, the Fed held its target range for the federal funds rate unchanged but suggested it would continue to gradually raise rates, leading financial markets to expect a December rate increase. However, nearperiod-end, the Fed Chair, in his speech at the Economic Club of New York, mentioned the Fed’s current policy rate was
1. Source: Credit Suisse Group.
2. Source: Lipper, a Thomson Reuters Company. For thesix-month period ended 11/30/18, this category consisted of 693 funds. Lipper calculations do not include sales charges or expense subsidization by a fund’s manager. Fund performance relative to the average may have differed if these or other factors had been considered. The indexes are unmanaged and include reinvestment of any income or distributions. They do not reflect any fees, expenses or sales charges. One cannot invest directly in an index, and an index is not representative of the Fund’s portfolio.
3. Source: Bureau of Labor Statistics.
See www.franklintempletondatasources.com for additional data provider information.
The dollar value, number of shares or principal amount, and names of all portfolio holdings are listed in the Fund’s Statement of Investments (SOI). The SOI begins on page 15.
franklintempleton.com | Semiannual Report | 3 | ||
FRANKLIN HIGH INCOME FUND
“just below” estimates of what it believed would be neutral for the economy, suggesting it might slow its pace of rate increases.
The10-year Treasury yield, which moves inversely to its price, increased during the period. The yield rose to multi-year highs in October and November 2018 amid investor concerns about higher inflation and the Fed’s interest-rate path. Expectations that other central banks might scale back monetary stimulus and better-than-expected U.S. economic reports also pushed the yield higher. However, some factors weighed on the Treasury yield at certain points during the period, including concerns about political turmoil in Italy, political uncertainties in the U.S., the Trump administration’s protectionist trade policies, U.S. trade disputes with its allies and China, economic turmoil in Turkey and Argentina, slowing global economic growth, and dovish comments from Fed officials. Overall, the10-year Treasury yield rose from 2.83% at the beginning of the period to 3.01% atperiod-end.
Investment Strategy
We are research driven, fundamental investors who rely on our team of analysts to providein-depth industry expertise and use qualitative and quantitative analysis to evaluate companies. Asbottom-up investors, we focus primarily on individual securities but consider sectors when choosing investments and, from time to time, may have significant investments in certain sectors. In selecting securities, we do not rely principally on the ratings assigned by rating agencies, but perform our own independent investment analysis to evaluate the creditwor-thiness of the issuer. We consider a variety of factors, including the issuer’s experience and managerial strength, its sensitivity to economic conditions, and its current and prospective financial condition.
Manager’s Discussion
Over the past six months, despite economic indicators revealing a relatively healthy global economy, financial markets experienced increased volatility. Trade disputes between the world’s two largest economies, the U.S. and China, unnerved financial markets, and concerns about an increasingly aggressive Fed suggested that rates would rise and disrupt global growth. Overall, U.S. stocks still generated modestly positive returns driven by continued strong corporate profits. Atperiod-end, the10-year U.S. Treasury yield reached 3.01%, slightly higher than the average over the past 10 years. The Fed moved to normalize policy and raised its benchmark rate 0.25% in June 2018, and then another 0.25% in September 2018, based on sustained economic growth and a continued low U.S. unemployment rate.
Dividend Distributions*
6/1/18–11/30/18
| Dividend per Share (cents) | ||||||||||||||||||||||||
| Month | Class A** | Class A1 | Class C | Class R | Class R6 | Advisor Class | ||||||||||||||||||
June | — | 0.83 | 0.75 | 0.78 | 0.86 | 0.86 | ||||||||||||||||||
July | — | 0.84 | 0.76 | 0.78 | 0.88 | 0.86 | ||||||||||||||||||
August | — | 0.92 | 0.84 | 0.86 | 0.96 | 0.94 | ||||||||||||||||||
September | 0.89 | 0.88 | 0.80 | 0.82 | 0.92 | 0.90 | ||||||||||||||||||
October | 0.94 | 0.92 | 0.82 | 0.87 | 0.96 | 0.95 | ||||||||||||||||||
November | 0.87 | 0.88 | 0.81 | 0.83 | 0.92 | 0.90 | ||||||||||||||||||
Total | 2.70 | 5.27 | 4.78 | 4.94 | 5.50 | 5.41 | ||||||||||||||||||
*The distribution amount is the sum of all estimatedtax-basis net investment income distributions for the period shown. A portion or all of the distribution may be reclassified as return of capital or short-term or long-term capital gains once final tax designations are known. All Fund distributions will vary depending upon current market conditions, and past distributions are not indicative of future trends.
**Effective 9/10/18, the Fund began offering Class A shares. See the prospectus for details.
Despite relatively strong economic growth, the credit default rate increased slightly during the period, driven primarily by energy- and retail-related default activity. We do not expect the default rate to increase meaningfully over the next year, as corporate balance sheets and earnings look robust and upcoming maturities are modest.
The technical trading environment continued to support high-yield returns as well. New issuance activity continued to be light, with much of the proceeds allocated toward refinancing existing debt. This trend resulted in an undersupplied high-yield market relative to investor demand. As a result, yield spreads to U.S. Treasuries with comparable maturities contracted over most of the period, and reached near-record lows in early October 2018, but increased over the course of the next two months as the broader financial markets sold off.
During thesix-month period, the Fund modestly underper-formed its benchmark, the CS High Yield Index, as well as its peers, as represented by the Lipper High Yield Funds Classification Average.
The Fund benefited from its security selection in the technology and retail sectors. The Fund’s exposure to the technology sector gained from a defensive mix of seasoned, well-established companies whose bond prices were relatively stable during a period of market weakness. In the retail sector, bonds rallied on better-than-expected first-quarter and second-quarter 2018 results.
Energy was the primary detractor from the Fund’s relative performance during the period as global oil producers,
4 | Semiannual Report | franklintempleton.com | ||
FRANKLIN HIGH INCOME FUND
Top 10 Holdings by Issuer*
11/30/18
| Company | % of Total | |||
| Sector/Industry | Net Assets | |||
CSC Holdings LLC | 2.7% | |||
Media & Entertainment | ||||
Navient Corp. | 2.0% | |||
Diversified Financials | ||||
CCO Holdings LLC/CCO Holdings Capital Corp. | 1.5% | |||
Media & Entertainment | ||||
Clearway Energy Operating LLC | 1.4% | |||
Utilities | ||||
T-Mobile USA Inc. | 1.3% | |||
Telecommunication Services | ||||
HCA Inc. | 1.3% | |||
Health Care Equipment & Services | ||||
Cheniere Corpus Christi Holdings LLC | 1.3% | |||
Energy | ||||
Cheniere Energy Partners LP | 1.2% | |||
Energy | ||||
Sprint Corp. | 1.2% | |||
Telecommunication Services | ||||
United Rentals North America Inc. | 1.2% | |||
Commercial & Professional Services | ||||
*Securities are listed by issuer, which may appear by another name in the SOI.
primarily Saudi Arabia, ramped up production ahead of sanctions against Iran, under the impression that waivers would not be permitted. However, the White House reversed course toward the end of the reporting period and granted waivers for the purchase of Iranian crude oil, which caused a glut of supply and pressured oil prices downward. The Fund held a slight overweighted allocation in the energy sector relative to its benchmark index, and it remains the Fund’s largest allocation in absolute terms. Additionally, concerns over global trade and a potential global economic slowdown pressured metals commodity prices, which in turn led to weaker trading prices in the metals and mining sector.
Subsequent to the semiannualperiod-end November 30, 2018, Christopher J. Molumphy, CFA, retired effective December 31, 2018. His responsibilities have been allocated to others in the portfolio management team.
Thank you for your continued participation in Franklin High Income Fund. We look forward to serving you future investment needs.
 |
Christopher J. Molumphy, CFA |
 |
Glenn I. Voyles, CFA |

Portfolio Management Team
The foregoing information reflects our analysis, opinions and portfolio holdings as of November 30, 2018, the end of the reporting period. The way we implement our main investment strategies and the resulting portfolio holdings may change depending on factors such as market and economic conditions. These opinions may not be relied upon as investment advice or an offer for a particular security. The information is not a complete analysis of every aspect of any market, country, industry, security or the Fund. Statements of fact are from sources considered reliable, but the investment manager makes no representation or warranty as to their completeness or accuracy. Although historical performance is no guarantee of future results, these insights may help you understand our investment management philosophy.
franklintempleton.com | Semiannual Report | 5 | ||
FRANKLIN HIGH INCOME FUND
Performance Summary as of November 30, 2018
The performance tables do not reflect any taxes that a shareholder would pay on Fund dividends, capital gain distributions, if any, or any realized gains on the sale of Fund shares. Total return reflects reinvestment of the Fund’s dividends and capital gain distributions, if any, and any unrealized gains or losses. Your dividend income will vary depending on dividends or interest paid by securities in the Fund’s portfolio, adjusted for operating expenses of each class. Capital gain distributions are net profits realized from the sale of portfolio securities.
Performance as of 11/30/181
Cumulative total return excludes sales charges. Average annual total return includes maximum sales charges. Sales charges will vary depending on the size of the investment and the class of share purchased. The maximum is 4.25% and the minimum is 0%.Class A:4.25% maximum initial sales charge;Advisor Class:no sales charges. For other share classes, visitfranklintempleton.com.
| Share Class | | Cumulative Total Return2 | | | Average Annual Total Return | 3 | ||
A4 | ||||||||
6-Month | -0.45% | -4.68% | ||||||
1-Year | -1.33% | -5.53% | ||||||
5-Year | +12.16% | +1.44% | ||||||
10-Year | +156.14% | +9.39% | ||||||
Advisor | ||||||||
6-Month | -0.37% | -0.37% | ||||||
1-Year | -0.65% | -0.65% | ||||||
5-Year | +13.59% | +2.58% | ||||||
10-Year | +161.23% | +10.08% |
| Distribution |
| 30-Day Standardized Yield6 | |||||||||
| Share Class | Rate | 5 | (with waiver) | (without waiver) | ||||||||
A | 5.67% | 5.98% | 5.97% | |||||||||
Advisor | 6.10% | 6.50% | 6.49% | |||||||||
Performance data represent past performance, which does not guarantee future results. Investment return and principal value will fluctuate, and you may have a gain or loss when you sell your shares. Current performance may differ from figures shown. For most recentmonth-end performance, go tofranklintempleton.comor call(800)342-5236.
See page 7 for Performance Summary footnotes.
6 | Semiannual Report | franklintempleton.com | ||
FRANKLIN HIGH INCOME FUND
PERFORMANCE SUMMARY
Distributions(6/1/18–11/30/18)
| Share Class | Net Investment Income | |||
A (9/10/18–11/30/18) |
|
$0.0270 |
| |
A1 |
|
$0.0527 |
| |
C |
|
$0.0478 |
| |
R |
|
$0.0494 |
| |
R6 |
|
$0.0550 |
| |
Advisor |
|
$0.0541 |
| |
Total Annual Operating Expenses7
| Share Class | With Waiver | Without Waiver | ||||||
A |
|
0.85 |
% |
|
0.86% |
| ||
Advisor |
|
0.60 |
% |
|
0.61% |
| ||
Each class of shares is available to certain eligible investors and has different annual fees and expenses, as described in the prospectus.
All investments involve risks, including possible loss of principal. The risks associated with higher-yielding, lower-rated securities include higher risk of default and loss of principal. Changes in the financial strength of a bond issuer or in a bond’s credit rating may affect its value. In addition, interest rate movements will affect the Fund’s share price and yield. Bond prices generally move in the opposite direction of interest rates. Thus, as prices of bonds in the Fund adjust to a rise in interest rates, the Fund’s share price may decline. Investment in foreign securities also involves special risks, including currency fluctuations, and political and economic uncertainty. The Fund is actively managed but there is no guarantee that the manager’s investment decisions will produce the desired results. The Fund’s prospectus also includes a description of the main investment risks.
1. The Fund has a fee waiver associated with any investment it makes in a Franklin Templeton money fund and/or other Franklin Templeton fund, contractually guaranteed through 9/30/19. Fund investment results reflect the fee waiver; without this waiver, the results would have been lower.
2. Cumulative total return represents the change in value of an investment over the periods indicated.
3. Average annual total return represents the average annual change in value of an investment over the periods indicated. Return for less than one year, if any, has not been annualized.
4. Effective 9/10/18, Class A shares closed to new investors, were renamed Class A1 shares, and a new Class A share with a different expense structure became available. Class A performance shown has been calculated as follows: (a) for periods prior to 9/10/18, a restated figure is used based on the Fund’s Class A1 performance that includes any Rule12b-1 rate differential that exists between Class A1 and Class A; and (b) for periods after 9/10/18, actual Class A performance is used, reflecting all charges and fees applicable to that class.
5. Distribution rate is based on an annualization of the respective class’s November dividend and the maximum offering price (NAV for Advisor class) per share on 11/30/18.
6. The Fund’s30-day standardized yield is calculated over a trailing30-day period using the yield to maturity on bonds and/or the dividends accrued on stocks. It may not equal the Fund’s actual income distribution rate, which reflects the Fund’s past dividends paid to shareholders.
7. Figures are as stated in the Fund’s current prospectus and may differ from the expense ratios disclosed in the Your Fund’s Expenses and Financial Highlights sections in this report. In periods of market volatility, assets may decline significantly, causing total annual Fund operating expenses to become higher than the figures shown.
franklintempleton.com | Semiannual Report | 7 | ||
FRANKLIN HIGH INCOME FUND
As a Fund shareholder, you can incur two types of costs: (1) transaction costs, including sales charges (loads) on Fund purchases and redemptions; and (2) ongoing Fund costs, including management fees, distribution and service(12b-1) fees, and other Fund expenses. All mutual funds have ongoing costs, sometimes referred to as operating expenses. The table below shows ongoing costs of investing in the Fund and can help you understand these costs and compare them with those of other mutual funds. The table assumes a $1,000 investment held for the six months indicated.
Actual Fund Expenses
The table below provides information about actual account values and actual expenses in the columns under the heading “Actual.” In these columns the Fund’s actual return, which includes the effect of Fund expenses, is used to calculate the “Ending Account Value” for each class of shares. You can estimate the expenses you paid during the period by following these steps (of course, your account value and expenses will differ from those in this illustration): Divide your account value by $1,000 (if your account had an $8,600 value, then $8,600 ÷ $1,000 = 8.6). Then multiply the result by the number in the row for your class of shares under the headings “Actual” and “Expenses Paid During Period” (if Actual Expenses Paid During Period were $7.50, then 8.6 x $7.50 = $64.50). In this illustration, the actual expenses paid this period are $64.50.
Hypothetical Example for Comparison with Other Funds
Under the heading “Hypothetical” in the table, information is provided about hypothetical account values and hypothetical expenses based on the Fund’s actual expense ratio and an assumed rate of return of 5% per year before expenses, which is not the Fund’s actual return. This information may not be used to estimate the actual ending account balance or expenses you paid for the period, but it can help you compare ongoing costs of investing in the Fund with those of other funds. To do so, compare this 5% hypothetical example for the class of shares you hold with the 5% hypothetical examples that appear in the shareholder reports of other funds.
Please note that expenses shown in the table are meant to highlight ongoing costs and do not reflect any transactional costs. Therefore, information under the heading “Hypothetical” is useful in comparing ongoing costs only, and will not help you compare total costs of owning different funds. In addition, if transactional costs were included, your total costs would have been higher.
| Actual | Hypothetical | |||||||||||||||||
| (actual return after expenses) | (5% annual return before expenses) | |||||||||||||||||
Expenses Paid During Period 6/1/18–11/30/182,3,4 |
Expenses Paid During Period 6/1/18–11/30/183,4 | Net Annualized Expense Ratio4 | ||||||||||||||||
Beginning Account Value 6/1/181 | Ending Account Value 11/30/18 | Ending Account Value 11/30/18 | ||||||||||||||||
Share Class | ||||||||||||||||||
|
|
| ||||||||||||||||
| A | $1,000 | $ 970.90 | $1.86 | $1,020.81 | $4.31 | 0.85% | ||||||||||||
| A1 | $1,000 | $1,001.00 | $3.76 | $1,021.31 | $3.80 | 0.75% | ||||||||||||
| C | $1,000 | $ 992.90 | $6.24 | $1,018.80 | $6.33 | 1.25% | ||||||||||||
| R | $1,000 | $ 993.80 | $5.50 | $1,019.55 | $5.57 | 1.10% | ||||||||||||
| R6 | $1,000 | $1,002.40 | $2.46 | $1,022.61 | $2.48 | 0.49% | ||||||||||||
| Advisor | $1,000 | $ 996.30 | $3.00 | $1,022.06 | $3.04 | 0.60% | ||||||||||||
1. For Classes A1, C, R, R6 and Advisor, 6/1/18 for Actual and Hypothetical. For Class A, 9/10/18 for Actual and 6/1/18 for Hypothetical.
2. For Classes A1, C, R, R6 and Advisor, 6/1/18–11/30/18. For Class A, 9/10/18–11/30/18.
3. Expenses are equal to the annualized expense ratio for thesix-month period as indicated above—in the far right column—multiplied by the simple average account value over the period indicated, and then multiplied by 183/365 to reflect theone-half year period. The multiplier is 81/365 for Actual Class A expenses to reflect the number of days since inception.
4. Reflects expenses after fee waivers and expense reimbursements. Does not include acquired fund fees and expenses.
8 | Semiannual Report | franklintempleton.com | ||
FRANKLIN HIGH INCOME TRUST
Franklin High Income Fund
| Period Ended November 30, 2018 (unaudited)a | ||||
Class A | ||||
Per share operating performance | ||||
(for a share outstanding throughout the period) | ||||
Net asset value, beginning of period | $ 1.84 | |||
|
| |||
Income from investment operationsb: | ||||
Net investment incomec | 0.02 | |||
Net realized and unrealized gains (losses) | (0.07) | |||
|
| |||
Total from investment operations | (0.05) | |||
|
| |||
Less distributions from net investment income | (0.03) | |||
|
| |||
Net asset value, end of period | $ 1.76 | |||
|
| |||
Total returnd | (2.91)% | |||
Ratios to average net assetse | ||||
Expenses before waiver and payments by affiliates | 0.86% | |||
Expenses net of waiver and payments by affiliatesf | 0.85% | |||
Net investment income | 5.16% | |||
Supplemental data | ||||
Net assets, end of period (000’s) | $114,715 | |||
Portfolio turnover rate | 7.18% | |||
aFor the period September 10, 2018 (effective date) to November 30, 2018.
bThe amount shown for a share outstanding throughout the period may not correlate with the Statement of Operations for the period due to the timing of sales and repurchases of the Fund’s shares in relation to income earned and/or fluctuating fair value of the investments of the Fund.
cBased on average daily shares outstanding.
dTotal return does not reflect sales commissions or contingent deferred sales charges, if applicable, and is not annualized for periods less than one year.
eRatios are annualized for periods less than one year.
fBenefit of expense reduction rounds to less than 0.01%.
franklintempleton.com | The accompanying notes are an integral part of these financial statements. | Semiannual Report | 9 | ||
FRANKLIN HIGH INCOME TRUST
FINANCIAL HIGHLIGHTS
Franklin High Income Fund(continued)
Six Months Ended (unaudited) | Year Ended May 31, | |||||||||||||||||||||||
2018 | 2017 | 2016 | 2015 | 2014 | ||||||||||||||||||||
Class A1 | ||||||||||||||||||||||||
Per share operating performance | ||||||||||||||||||||||||
(for a share outstanding throughout the period) | ||||||||||||||||||||||||
Net asset value, beginning of period | $ 1.82 | $ 1.91 | $ 1.73 | $ 2.01 | $ 2.15 | $ 2.12 | ||||||||||||||||||
|
| |||||||||||||||||||||||
Income from investment operationsa: | ||||||||||||||||||||||||
Net investment incomeb | 0.05 | 0.10 | 0.10 | 0.11 | 0.12 | 0.13 | ||||||||||||||||||
Net realized and unrealized gains (losses) | (0.05 | ) | (0.09 | ) | 0.18 | (0.27 | ) | (0.14 | ) | 0.03 | ||||||||||||||
|
| |||||||||||||||||||||||
Total from investment operations | — | 0.01 | 0.28 | (0.16 | ) | (0.02 | ) | 0.16 | ||||||||||||||||
|
| |||||||||||||||||||||||
Less distributions from net investment income | (0.05 | ) | (0.10 | ) | (0.10 | ) | (0.12 | ) | (0.12 | ) | (0.13 | ) | ||||||||||||
|
| |||||||||||||||||||||||
Net asset value, end of period | $ 1.77 | $ 1.82 | $ 1.91 | $ 1.73 | $ 2.01 | $ 2.15 | ||||||||||||||||||
|
| |||||||||||||||||||||||
Total returnc | 0.10% | 0.68% | 16.82% | (8.08)% | (0.83)% | 8.01% | ||||||||||||||||||
Ratios to average net assetsd | ||||||||||||||||||||||||
Expenses before waiver and payments by affiliates | 0.76% | 0.78% | 0.77% | 0.78% | 0.76% | 0.76% | ||||||||||||||||||
Expenses net of waiver and payments by affiliatese | 0.75% | 0.77% | 0.76% | 0.77% | 0.76% | f | 0.76% | f | ||||||||||||||||
Net investment income | 5.26% | 5.26% | 5.38% | 6.15% | 5.76% | 6.10% | ||||||||||||||||||
Supplemental data | ||||||||||||||||||||||||
Net assets, end of period (000’s) | $2,123,023 | $2,356,528 | $2,788,669 | $2,745,474 | $3,611,985 | $4,058,942 | ||||||||||||||||||
Portfolio turnover rate | 7.18% | 23.33% | 35.06% | 18.58% | 34.67% | 29.33% | ||||||||||||||||||
aThe amount shown for a share outstanding throughout the period may not correlate with the Statement of Operations for the period due to the timing of sales and repurchases of the Fund’s shares in relation to income earned and/or fluctuating fair value of the investments of the Fund.
bBased on average daily shares outstanding.
cTotal return does not reflect sales commissions or contingent deferred sales charges, if applicable, and is not annualized for periods less than one year.
dRatios are annualized for periods less than one year.
eBenefit of expense reduction rounds to less than 0.01%.
fBenefit of waiver and payments by affiliates rounds to less than 0.01%.
10 | Semiannual Report | The accompanying notes are an integral part of these financial statements. | franklintempleton.com | ||
FRANKLIN HIGH INCOME TRUST
FINANCIAL HIGHLIGHTS
Franklin High Income Fund(continued)
Six Months Ended (unaudited) | Year Ended May 31, | |||||||||||||||||||||||
| 2018 | 2017 | 2016 | 2015 | 2014 | ||||||||||||||||||||
Class C | ||||||||||||||||||||||||
Per share operating performance | ||||||||||||||||||||||||
(for a share outstanding throughout the period) | ||||||||||||||||||||||||
Net asset value, beginning of period | $ 1.85 | $ 1.93 | $ 1.75 | $ 2.03 | $ 2.17 | $ 2.13 | ||||||||||||||||||
|
| |||||||||||||||||||||||
Income from investment operationsa: | ||||||||||||||||||||||||
Net investment incomeb | 0.04 | 0.09 | 0.09 | 0.10 | 0.11 | 0.12 | ||||||||||||||||||
Net realized and unrealized gains (losses) | (0.05 | ) | (0.08 | ) | 0.18 | (0.27 | ) | (0.14 | ) | 0.04 | ||||||||||||||
|
| |||||||||||||||||||||||
Total from investment operations | (0.01 | ) | 0.01 | 0.27 | (0.17 | ) | (0.03 | ) | 0.16 | |||||||||||||||
|
| |||||||||||||||||||||||
Less distributions from net investment income | (0.05 | ) | (0.09 | ) | (0.09 | ) | (0.11 | ) | (0.11 | ) | (0.12 | ) | ||||||||||||
|
| |||||||||||||||||||||||
Net asset value, end of period | $ 1.79 | $ 1.85 | $ 1.93 | $ 1.75 | $ 2.03 | $ 2.17 | ||||||||||||||||||
|
| |||||||||||||||||||||||
Total returnc | (0.71)% | 0.70% | 16.02% | (8.46)% | (1.32)% | 7.90% | ||||||||||||||||||
Ratios to average net assetsd | ||||||||||||||||||||||||
Expenses before waiver and payments by affiliates | 1.26% | 1.28% | 1.27% | 1.28% | 1.26% | 1.26% | ||||||||||||||||||
Expenses net of waiver and payments by affiliatese | 1.25% | 1.27% | 1.26% | 1.27% | 1.26%f | 1.26% | f | |||||||||||||||||
Net investment income | 4.76% | 4.76% | 4.88% | 5.65% | 5.26% | 5.60% | ||||||||||||||||||
Supplemental data | ||||||||||||||||||||||||
Net assets, end of period (000’s) | $320,964 | $460,201 | $563,539 | $563,218 | $784,613 | $907,458 | ||||||||||||||||||
Portfolio turnover rate | 7.18% | 23.33% | 35.06% | 18.58% | 34.67% | 29.33% | ||||||||||||||||||
aThe amount shown for a share outstanding throughout the period may not correlate with the Statement of Operations for the period due to the timing of sales and repurchases of the Fund’s shares in relation to income earned and/or fluctuating fair value of the investments of the Fund.
bBased on average daily shares outstanding.
cTotal return does not reflect sales commissions or contingent deferred sales charges, if applicable, and is not annualized for periods less than one year.
dRatios are annualized for periods less than one year.
eBenefit of expense reduction rounds to less than 0.01%.
fBenefit of waiver and payments by affiliates rounds to less than 0.01%.
franklintempleton.com | The accompanying notes are an integral part of these financial statements. | Semiannual Report | 11 | ||
FRANKLIN HIGH INCOME TRUST
FINANCIAL HIGHLIGHTS
Franklin High Income Fund(continued)
Six Months Ended (unaudited) | Year Ended May 31, | |||||||||||||||||||||||
| 2018 | 2017 | 2016 | 2015 | 2014 | ||||||||||||||||||||
Class R | ||||||||||||||||||||||||
Per share operating performance | ||||||||||||||||||||||||
(for a share outstanding throughout the period) | ||||||||||||||||||||||||
Net asset value, beginning of period | $ 1.86 | $ 1.94 | $ 1.76 | $ 2.04 | $ 2.18 | $ 2.14 | ||||||||||||||||||
|
| |||||||||||||||||||||||
Income from investment operationsa: | ||||||||||||||||||||||||
Net investment incomeb | 0.05 | 0.09 | 0.09 | 0.10 | 0.11 | 0.12 | ||||||||||||||||||
Net realized and unrealized gains (losses) | (0.06 | ) | (0.07 | ) | 0.19 | (0.27 | ) | (0.14 | ) | 0.04 | ||||||||||||||
|
| |||||||||||||||||||||||
Total from investment operations | (0.01 | ) | 0.02 | 0.28 | (0.17 | ) | (0.03 | ) | 0.16 | |||||||||||||||
|
| |||||||||||||||||||||||
Less distributions from net investment income | (0.05 | ) | (0.10 | ) | (0.10 | ) | (0.11 | ) | (0.11 | ) | (0.12 | ) | ||||||||||||
|
| |||||||||||||||||||||||
Net asset value, end of period | $ 1.80 | $ 1.86 | $ 1.94 | $ 1.76 | $ 2.04 | $ 2.18 | ||||||||||||||||||
|
| |||||||||||||||||||||||
Total returnc | (0.62)% | 0.84% | 16.07% | (8.27)% | (1.16)% | 8.02% | ||||||||||||||||||
Ratios to average net assetsd | ||||||||||||||||||||||||
Expenses before waiver and payments by affiliates | 1.11% | 1.13% | 1.12% | 1.13% | 1.11% | 1.11% | ||||||||||||||||||
Expenses net of waiver and payments by affiliatese | 1.10% | 1.12% | 1.11% | 1.12% | 1.11%f | 1.11% | f | |||||||||||||||||
Net investment income | 4.91% | 4.91% | 5.03% | 5.80% | 5.41% | 5.75% | ||||||||||||||||||
Supplemental data | ||||||||||||||||||||||||
Net assets, end of period (000’s) | $108,198 | $127,333 | $187,180 | $227,440 | $323,397 | $363,756 | ||||||||||||||||||
Portfolio turnover rate | 7.18% | 23.33% | 35.06% | 18.58% | 34.67% | 29.33% | ||||||||||||||||||
aThe amount shown for a share outstanding throughout the period may not correlate with the Statement of Operations for the period due to the timing of sales and repurchases of the Fund’s shares in relation to income earned and/or fluctuating fair value of the investments of the Fund.
bBased on average daily shares outstanding.
cTotal return is not annualized for periods less than one year.
dRatios are annualized for periods less than one year.
eBenefit of expense reduction rounds to less than 0.01%.
fBenefit of waiver and payments by affiliates rounds to less than 0.01%.
12 | Semiannual Report | The accompanying notes are an integral part of these financial statements. | franklintempleton.com | ||
FRANKLIN HIGH INCOME TRUST
FINANCIAL HIGHLIGHTS
Franklin High Income Fund(continued)
Six Months Ended (unaudited) | Year Ended May 31, | |||||||||||||||||||||||
| 2018 | 2017 | 2016 | 2015 | 2014 | ||||||||||||||||||||
Class R6 | ||||||||||||||||||||||||
Per share operating performance | ||||||||||||||||||||||||
(for a share outstanding throughout the period) | ||||||||||||||||||||||||
Net asset value, beginning of period | $ 1.82 | $ 1.90 | $ 1.73 | $ 2.01 | $ 2.15 | $ 2.12 | ||||||||||||||||||
Income from investment operationsa: | ||||||||||||||||||||||||
Net investment incomeb | 0.05 | 0.11 | 0.10 | 0.11 | 0.12 | 0.13 | ||||||||||||||||||
Net realized and unrealized gains (losses) | (0.04 | ) | (0.08 | ) | 0.18 | (0.27 | ) | (0.13 | ) | 0.04 | ||||||||||||||
Total from investment operations | 0.01 | 0.03 | 0.28 | (0.16 | ) | (0.01 | ) | 0.17 | ||||||||||||||||
Less distributions from net investment income | (0.06 | ) | (0.11 | ) | (0.11 | ) | (0.12 | ) | (0.13 | ) | (0.14 | ) | ||||||||||||
Net asset value, end of period | $ 1.77 | $ 1.82 | $ 1.90 | $ 1.73 | $ 2.01 | $ 2.15 | ||||||||||||||||||
Total returnc | 0.24% | 1.48% | 16.56% | (7.78)% | (0.57)% | 8.27% | ||||||||||||||||||
Ratios to average net assetsd | ||||||||||||||||||||||||
Expenses before waiver and payments by affiliates | 0.54% | 0.51% | 0.49% | �� | 0.47% | 0.47% | 0.49% | |||||||||||||||||
Expenses net of waiver and payments by affiliatese | 0.49% | 0.48% | 0.48% | 0.46% | 0.47% | f | 0.49% | f | ||||||||||||||||
Net investment income | 5.52% | 5.55% | 5.66% | 6.46% | 6.05% | 6.37% | ||||||||||||||||||
Supplemental data | ||||||||||||||||||||||||
Net assets, end of period (000’s) | $60,061 | $68,312 | $33,371 | $37,872 | $81,133 | $35,633 | ||||||||||||||||||
Portfolio turnover rate | 7.18% | 23.33% | 35.06% | 18.58% | 34.67% | 29.33% | ||||||||||||||||||
aThe amount shown for a share outstanding throughout the period may not correlate with the Statement of Operations for the period due to the timing of sales and repurchases of the Fund’s shares in relation to income earned and/or fluctuating fair value of the investments of the Fund.
bBased on average daily shares outstanding.
cTotal return is not annualized for periods less than one year.
dRatios are annualized for periods less than one year.
eBenefit of expense reduction rounds to less than 0.01%.
fBenefit of waiver and payments by affiliates rounds to less than 0.01%.
franklintempleton.com | The accompanying notes are an integral part of these financial statements. | Semiannual Report | 13 | ||
FRANKLIN HIGH INCOME TRUST
FINANCIAL HIGHLIGHTS
Franklin High Income Fund(continued)
Six Months Ended (unaudited) | Year Ended May 31, | |||||||||||||||||||||||
| 2018 | 2017 | 2016 | 2015 | 2014 | ||||||||||||||||||||
Advisor Class | ||||||||||||||||||||||||
Per share operating performance | ||||||||||||||||||||||||
(for a share outstanding throughout the period) | ||||||||||||||||||||||||
Net asset value, beginning of period | $ 1.83 | $ 1.91 | $ 1.74 | $ 2.01 | $ 2.15 | $ 2.12 | ||||||||||||||||||
Income from investment operationsa: | ||||||||||||||||||||||||
Net investment incomeb | 0.05 | 0.10 | 0.10 | 0.11 | 0.12 | 0.13 | ||||||||||||||||||
Net realized and unrealized gains (losses) | (0.06 | ) | (0.07 | ) | 0.18 | (0.26 | ) | (0.14 | ) | 0.04 | ||||||||||||||
Total from investment operations | (0.01 | ) | 0.03 | 0.28 | (0.15 | ) | (0.02 | ) | 0.17 | |||||||||||||||
Less distributions from net investment income | (0.05 | ) | (0.11 | ) | (0.11 | ) | (0.12 | ) | (0.12 | ) | (0.14 | ) | ||||||||||||
Net asset value, end of period | $ 1.77 | $ 1.83 | $ 1.91 | $ 1.74 | $ 2.01 | $ 2.15 | ||||||||||||||||||
Total returnc | (0.37)% | 1.36% | 16.29% | (7.39)% | (0.69)% | 8.15% | ||||||||||||||||||
Ratios to average net assetsd | ||||||||||||||||||||||||
Expenses before waiver and payments by affiliates | 0.61% | 0.63% | 0.62% | 0.63% | 0.61% | 0.61% | ||||||||||||||||||
Expenses net of waiver and payments by affiliatese | 0.60% | 0.62% | 0.61% | 0.62% | 0.61% | f | 0.61%f | |||||||||||||||||
Net investment income | 5.41% | 5.41% | 5.53% | 6.30% | 5.91% | 6.25% | ||||||||||||||||||
Supplemental data | ||||||||||||||||||||||||
Net assets, end of period (000’s) | $305,298 | $356,721 | $488,699 | $526,634 | $1,443,439 | $1,720,196 | ||||||||||||||||||
Portfolio turnover rate | 7.18% | 23.33% | 35.06% | 18.58% | 34.67% | 29.33% | ||||||||||||||||||
aThe amount shown for a share outstanding throughout the period may not correlate with the Statement of Operations for the period due to the timing of sales and repurchases of the Fund’s shares in relation to income earned and/or fluctuating fair value of the investments of the Fund.
bBased on average daily shares outstanding.
cTotal return is not annualized for periods less than one year.
dRatios are annualized for periods less than one year.
eBenefit of expense reduction rounds to less than 0.01%.
fBenefit of waiver and payments by affiliates rounds to less than 0.01%.
14 | Semiannual Report | The accompanying notes are an integral part of these financial statements. | franklintempleton.com | ||
FRANKLIN HIGH INCOME TRUST
Statement of Investments, November 30, 2018 (unaudited)
Franklin High Income Fund
| Country | Shares/ Warrants | Value | ||||||||||
Common Stocks and Other Equity Interests 2.0% | ||||||||||||
Energy 1.7% | ||||||||||||
aBirch Permian Holdings Inc. | United States | 160,770 | $ | 1,768,470 | ||||||||
aBirch Permian Holdings Inc. | United States | 1,253,225 | 13,158,862 | |||||||||
aChaparral Energy Inc. | United States | 43,062 | 667,461 | |||||||||
a,bChaparral Energy Inc., A, 144A | United States | 5,033 | 50,078 | |||||||||
aContura Energy Inc. | United States | 30,901 | 1,983,844 | |||||||||
aContura Energy Inc., wts., 7/26/23 | United States | 5,033 | 161,056 | |||||||||
a,c,dEnergy XXI Gulf Coast Inc., wts., 12/30/21 | United States | 124,561 | — | |||||||||
a,eGoodrich Petroleum Corp. | United States | 1,564,885 | 22,565,642 | |||||||||
aHalcon Resources Corp. | United States | 1,889,580 | 5,290,824 | |||||||||
aHalcon Resources Corp., wts., 9/09/20 | United States | 145,844 | 10,209 | |||||||||
aMidstates Petroleum Co. Inc. | United States | 11,657 | 96,870 | |||||||||
a,cMidstates Petroleum Co. Inc., wts., 4/21/20 | United States | 82,587 | 1,272 | |||||||||
a,c,dNine Point Energy LLC | United States | 433,273 | 1,052,779 | |||||||||
aRiviera Resources Inc. | United States | 156,119 | 2,885,079 | |||||||||
aRoan Resources Inc. | United States | 156,119 | 1,606,465 | |||||||||
a,eTitan Energy LLC | United States | 289,137 | 187,939 | |||||||||
|
| |||||||||||
|
51,486,850 |
| ||||||||||
|
| |||||||||||
Materials 0.1% | ||||||||||||
aVerso Corp., A | United States | 83,362 | 2,102,390 | |||||||||
aVerso Corp., wts., 7/25/23 | United States | 8,775 | 54,405 | |||||||||
|
| |||||||||||
|
2,156,795 |
| ||||||||||
|
| |||||||||||
Pharmaceuticals, Biotechnology & Life Sciences 0.1% | ||||||||||||
aAdvanz Pharma Corp. | Canada | 83,080 | 1,650,800 | |||||||||
|
| |||||||||||
Transportation 0.1% | ||||||||||||
aCEVA Logistics AG | Switzerland | 108,515 | 3,242,577 | |||||||||
|
| |||||||||||
Total Common Stocks and Other Equity Interests | 58,537,022 | |||||||||||
|
| |||||||||||
Convertible Preferred Stocks (Cost $7,552,087) 0.3% | ||||||||||||
Energy 0.3% | ||||||||||||
a,c,dNine Point Energy Holdings Inc., cvt. pfd. | United States | 8,080 | 9,765,152 | |||||||||
|
| |||||||||||
| | Principal Amount | * | ||||||||||
Convertible Bonds (Cost $7,215,305) 0.3% | ||||||||||||
Energy 0.3% | ||||||||||||
e,fGoodrich Petroleum Corp., senior secured note, second lien, PIK, cvt., 13.50%, 8/30/19 | United States | $ | 8,250,000 | 8,564,210 | ||||||||
|
| |||||||||||
Corporate Bonds 93.7% | ||||||||||||
Automobiles & Components 0.1% | ||||||||||||
The Goodyear Tire & Rubber Co., senior bond, 5.00%, 5/31/26 | United States | 4,400,000 | 4,031,500 | |||||||||
|
| |||||||||||
Banks 2.8% | ||||||||||||
CIT Group Inc., | United States | 3,850,000 | 3,874,178 | |||||||||
senior note, 5.25%, 3/07/25 | United States | 8,200,000 | 8,259,860 | |||||||||
franklintempleton.com | Semiannual Report | 15 | ||
FRANKLIN HIGH INCOME TRUST
STATEMENT OF INVESTMENTS (UNAUDITED)
Franklin High Income Fund(continued)
| Country | | Principal Amount | * | Value | ||||||||
Corporate Bonds(continued) | ||||||||||||
Banks(continued) | ||||||||||||
gCitigroup Inc., junior sub. bond, M, 6.30% to 5/15/24, FRN thereafter, Perpetual | United States | $ | 35,000,000 | $ | 33,993,750 | |||||||
gJPMorgan Chase & Co., | ||||||||||||
junior sub. bond, R, 6.00% to 8/01/23, FRN thereafter, Perpetual | United States | 15,000,000 | 15,105,000 | |||||||||
junior sub. bond, V, 5.00% to 7/30/19, FRN thereafter, Perpetual | United States | 9,900,000 | 9,878,715 | |||||||||
Royal Bank of Scotland Group PLC, | ||||||||||||
sub. note, 6.125%, 12/15/22 | United Kingdom | 4,000,000 | 4,064,680 | |||||||||
sub. note, 5.125%, 5/28/24 | United Kingdom | 10,000,000 | 9,700,850 | |||||||||
|
| |||||||||||
|
84,877,033 |
| ||||||||||
|
| |||||||||||
Capital Goods 5.4% | ||||||||||||
Aircastle Ltd., senior note, 4.125%, 5/01/24 | United States | 13,000,000 | 12,570,485 | |||||||||
bBBA U.S. Holdings Inc., senior note, 144A, 5.375%, 5/01/26 | United States | 9,800,000 | 9,506,000 | |||||||||
bBeacon Roofing Supply Inc., senior note, 144A, 4.875%, 11/01/25 | United States | 14,400,000 | 13,122,000 | |||||||||
bBWX Technologies Inc., senior note, 144A, 5.375%, 7/15/26 | United States | 8,500,000 | 8,287,500 | |||||||||
bCloud Crane LLC, secured note, second lien, 144A, 10.125%, 8/01/24 | United States | 10,000,000 | 10,678,000 | |||||||||
CNH Industrial Capital LLC, senior note, 3.875%, 10/15/21 | United States | 5,300,000 | 5,253,625 | |||||||||
H&E Equipment Services Inc., senior note, 5.625%, 9/01/25 | United States | 19,700,000 | 18,444,125 | |||||||||
bHD Supply Inc., senior note, 144A, 5.375%, 10/15/26 | United States | 14,900,000 | 14,457,470 | |||||||||
bJeld-Wen Inc., | ||||||||||||
senior bond, 144A, 4.875%, 12/15/27 | United States | 7,800,000 | 6,825,000 | |||||||||
senior note, 144A, 4.625%, 12/15/25 | United States | 7,600,000 | 6,821,000 | |||||||||
bPisces Midco Inc., senior secured note, 144A, 8.00%, 4/15/26 | United States | 18,000,000 | 17,167,500 | |||||||||
bTerex Corp., senior note, 144A, 5.625%, 2/01/25 | United States | 10,400,000 | 9,584,120 | |||||||||
bVertiv Group Corp., senior note, 144A, 9.25%, 10/15/24 | United States | 31,500,000 | 30,870,000 | |||||||||
|
| |||||||||||
|
163,586,825 |
| ||||||||||
|
| |||||||||||
Commercial & Professional Services 2.1% | ||||||||||||
c,hGoss Graphic Systems Inc., senior sub. note, 12.25%, 11/19/05 | United States | 9,053,899 | 905 | |||||||||
United Rentals North America Inc., | ||||||||||||
senior bond, 5.75%, 11/15/24 | United States | 14,000,000 | 13,965,000 | |||||||||
senior bond, 5.875%, 9/15/26 | United States | 4,600,000 | 4,485,000 | |||||||||
senior bond, 5.50%, 5/15/27 | United States | 18,400,000 | 17,411,000 | |||||||||
bWest Corp., senior note, 144A, 8.50%, 10/15/25 | United States | 34,900,000 | 28,967,000 | |||||||||
|
| |||||||||||
|
64,828,905 |
| ||||||||||
|
| |||||||||||
Consumer Durables & Apparel 2.1% | ||||||||||||
bHanesbrands Inc., senior note, 144A, 4.625%, 5/15/24 | United States | 17,000,000 | 16,447,500 | |||||||||
KB Home, senior note, 7.00%, 12/15/21 | United States | 5,000,000 | 5,181,250 | |||||||||
PulteGroup Inc., senior bond, 5.00%, 1/15/27 | United States | 12,000,000 | 11,190,000 | |||||||||
bTaylor Morrison Communities Inc./Taylor Morrison Holdings II Inc., senior note, 144A, 5.625%, 3/01/24 | United States | 8,800,000 | 8,492,000 | |||||||||
Weekley Homes LLC/Weekley Finance Corp., senior note, 6.625%, 8/15/25 | United States | 25,000,000 | 23,312,500 | |||||||||
|
| |||||||||||
|
64,623,250 |
| ||||||||||
|
| |||||||||||
Consumer Services 5.2% | ||||||||||||
b1011778 BC ULC/New Red Finance Inc., | ||||||||||||
secured note, second lien, 144A, 5.00%, 10/15/25 | Canada | 7,400,000 | 6,993,000 | |||||||||
senior secured note, first lien, 144A, 4.25%, 5/15/24 | Canada | 19,100,000 | 18,121,125 |
16 | Semiannual Report | franklintempleton.com | ||
FRANKLIN HIGH INCOME TRUST
STATEMENT OF INVESTMENTS (UNAUDITED)
Franklin High Income Fund(continued)
| Country | | Principal Amount | * |
| Value |
| ||||
Corporate Bonds(continued) | ||||||||||
Consumer Services(continued) | ||||||||||
b24 Hour Holdings III LLC, senior note, 144A, 8.00%, 6/01/22 | United States | $ | 28,000,000 | $ | 27,440,000 | |||||
bDownstream Development Authority of the Quapaw Tribe of Oklahoma, | United States | 8,600,000 | 8,729,000 | |||||||
bGolden Nugget Inc., | ||||||||||
senior note, 144A, 6.75%, 10/15/24 | United States | 23,200,000 | 22,794,000 | |||||||
senior note, 144A, 8.75%, 10/01/25 | United States | 2,700,000 | 2,720,250 | |||||||
bInternational Game Technology PLC, senior secured note, first lien, 144A, 6.25%, 1/15/27 | United States | 13,500,000 | 13,533,750 | |||||||
bKFC Holding Co./Pizza Hut Holdings LLC/Taco Bell of America LLC, | ||||||||||
senior note, 144A, 5.00%, 6/01/24 | United States | 15,600,000 | 15,424,500 | |||||||
senior note, 144A, 5.25%, 6/01/26 | United States | 12,700,000 | 12,485,624 | |||||||
bStars Group Holdings BV/Stars Group U.S.Co-Borrower LLC, senior note, 144A, 7.00%, 7/15/26 | Canada | 11,000,000 | 10,986,250 | |||||||
bWynn Las Vegas LLC/Wynn Las Vegas Capital Corp., senior bond, 144A, 5.50%, 3/01/25 | United States | 20,000,000 | 19,100,000 | |||||||
|
| |||||||||
|
158,327,499 |
| ||||||||
|
| |||||||||
Diversified Financials 2.3% | ||||||||||
bMSCI Inc., senior note, 144A, 5.375%, 5/15/27 | United States | 11,300,000 | 11,225,081 | |||||||
Navient Corp., | ||||||||||
senior note, 5.00%, 10/26/20 | United States | 7,200,000 | 7,146,000 | |||||||
senior note, 5.875%, 3/25/21 | United States | 5,000,000 | 4,978,750 | |||||||
senior note, 6.625%, 7/26/21 | United States | 9,500,000 | 9,618,750 | |||||||
senior note, 6.50%, 6/15/22 | United States | 9,900,000 | 9,949,500 | |||||||
senior note, 7.25%, 9/25/23 | United States | 21,380,000 | 21,567,075 | |||||||
senior note, 6.125%, 3/25/24 | United States | 6,400,000 | 6,016,000 | |||||||
|
| |||||||||
|
70,501,156 |
| ||||||||
|
| |||||||||
Energy 13.2% | ||||||||||
bAker BP ASA, senior note, 144A, 5.875%, 3/31/25 | Norway | 18,800,000 | 18,744,220 | |||||||
California Resources Corp., | ||||||||||
bsecured note, second lien, 144A, 8.00%, 12/15/22 | United States | 13,382,000 | 10,237,230 | |||||||
senior bond, 6.00%, 11/15/24 | United States | 850,000 | 617,313 | |||||||
senior note, 5.50%, 9/15/21 | United States | 411,000 | 331,043 | |||||||
Callon Petroleum Co., senior note, 6.375%, 7/01/26 | United States | 18,000,000 | 17,415,000 | |||||||
Calumet Specialty Products Partners LP/Calumet Finance Corp., senior note, 7.75%, 4/15/23 | United States | 22,700,000 | 19,919,250 | |||||||
Cheniere Corpus Christi Holdings LLC, | ||||||||||
senior secured note, first lien, 7.00%, 6/30/24 | United States | 15,600,000 | 16,848,000 | |||||||
senior secured note, first lien, 5.875%, 3/31/25 | United States | 21,500,000 | 22,198,750 | |||||||
Cheniere Energy Partners LP, | ||||||||||
bsenior note, 144A, 5.625%, 10/01/26 | United States | 9,000,000 | 8,775,000 | |||||||
senior secured note, first lien, 5.25%, 10/01/25 | United States | 28,700,000 | 28,054,250 | |||||||
Chesapeake Energy Corp., senior note, 7.50%, 10/01/26 | United States | 23,400,000 | 21,820,500 | |||||||
Crestwood Midstream Partners LP/Crestwood Midstream Finance Corp., | ||||||||||
senior note, 6.25%, 4/01/23 | United States | 17,000,000 | 16,957,500 | |||||||
senior note, 5.75%, 4/01/25 | United States | 15,000,000 | 14,475,000 | |||||||
CSI Compressco LP/CSI Compressco Finance Inc., senior note, 7.25%, 8/15/22 | United States | 12,900,000 | 11,900,250 | |||||||
bDiamondback Energy Inc., senior note, 144A, 4.75%, 11/01/24 | United States | 18,900,000 | 18,380,250 | |||||||
Energy Transfer LP, | ||||||||||
senior secured bond, first lien, 5.875%, 1/15/24 | United States | 15,000,000 | 15,506,250 | |||||||
senior secured bond, first lien, 5.50%, 6/01/27 | United States | 17,900,000 | 17,900,000 |
franklintempleton.com | Semiannual Report | 17 | ||
FRANKLIN HIGH INCOME TRUST
STATEMENT OF INVESTMENTS (UNAUDITED)
Franklin High Income Fund(continued)
| Country | | Principal Amount | * | Value | ||||||||
Corporate Bonds(continued) | ||||||||||||
Energy(continued) | ||||||||||||
b,fEnQuest PLC, senior note, 144A, PIK, 7.00%, 4/15/22 | United Kingdom | $ | 22,955,575 | $ | 17,015,820 | |||||||
Ferrellgas LP/Ferrellgas Finance Corp., senior note, 6.75%, 6/15/23 | United States | 23,600,000 | 19,942,000 | |||||||||
c,e,f Goodrich Petroleum Corp., senior secured note, second lien, PIK, 13.50%, 8/30/19 | United States | 2,520,855 | 2,615,509 | |||||||||
Martin Midstream Partners LP/Martin Midstream Finance Corp., senior note, 7.25%, 2/15/21 | United States | 17,000,000 | 16,575,000 | |||||||||
b,fMurray Energy Corp., secured note, 1.5 lien, 144A, PIK, 12.00%, 4/15/24 | United States | 18,290,148 | 10,951,226 | |||||||||
Oceaneering International Inc., senior note, 6.00%, 2/01/28 | United States | 16,600,000 | 15,008,397 | |||||||||
QEP Resources Inc., | ||||||||||||
senior bond, 5.375%, 10/01/22 | United States | 14,000,000 | 13,842,500 | |||||||||
senior note, 5.625%, 3/01/26 | United States | 10,700,000 | 9,817,250 | |||||||||
Sanchez Energy Corp., | ||||||||||||
senior note, 7.75%, 6/15/21 | United States | 7,000,000 | 2,082,500 | |||||||||
senior note, 6.125%, 1/15/23 | United States | 8,000,000 | 2,040,000 | |||||||||
bSunoco LP/Sunoco Finance Corp., | ||||||||||||
senior note, 144A, 4.875%, 1/15/23 | United States | 6,500,000 | 6,353,750 | |||||||||
senior note, 144A, 5.50%, 2/15/26 | United States | 8,000,000 | 7,640,000 | |||||||||
Weatherford International Ltd., | ||||||||||||
senior note, 5.125%, 9/15/20 | United States | 5,300,000 | 4,478,500 | |||||||||
senior note, 4.50%, 4/15/22 | United States | 8,500,000 | 5,652,500 | |||||||||
senior note, 8.25%, 6/15/23 | United States | 9,600,000 | 6,384,000 | |||||||||
|
| |||||||||||
|
400,478,758 |
| ||||||||||
|
| |||||||||||
Food & Staples Retailing 0.3% | ||||||||||||
bAramark Services Inc., senior bond, 144A, 5.00%, 2/01/28 | United States | 8,300,000 | 7,905,750 | |||||||||
|
| |||||||||||
Food, Beverage & Tobacco 3.4% | ||||||||||||
B&G Foods Inc., senior note, 5.25%, 4/01/25 | United States | 17,300,000 | 16,415,105 | |||||||||
bCott Holdings Inc., senior note, 144A, 5.50%, 4/01/25 | Canada | 25,000,000 | 24,187,500 | |||||||||
bLamb Weston Holdings Inc., | ||||||||||||
senior note, 144A, 4.625%, 11/01/24 | United States | 13,900,000 | 13,465,625 | |||||||||
senior note, 144A, 4.875%, 11/01/26 | United States | 17,700,000 | 17,306,175 | |||||||||
bPost Holdings Inc., | ||||||||||||
senior bond, 144A, 5.00%, 8/15/26 | United States | 26,000,000 | 23,985,000 | |||||||||
senior note, 144A, 5.50%, 3/01/25 | United States | 7,500,000 | 7,181,250 | |||||||||
|
| |||||||||||
|
102,540,655 |
| ||||||||||
|
| |||||||||||
Health Care Equipment & Services 7.1% | ||||||||||||
bAvantor Inc., senior secured note, first lien, 144A, 6.00%, 10/01/24 | United States | 17,300,000 | 17,191,875 | |||||||||
bCentene Corp., senior note, 144A, 5.375%, 6/01/26 | United States | 25,550,000 | 25,773,562 | |||||||||
CHS/Community Health Systems Inc., | ||||||||||||
senior note, 6.875%, 2/01/22 | United States | 4,003,000 | 1,987,289 | |||||||||
bsenior note, 144A, 8.125%, 6/30/24 | United States | 13,747,000 | 10,550,823 | |||||||||
senior secured note, 5.125%, 8/01/21 | United States | 4,100,000 | 3,902,688 | |||||||||
senior secured note, first lien, 6.25%, 3/31/23 | United States | 14,200,000 | 13,223,750 | |||||||||
HCA Inc., | ||||||||||||
senior bond, 5.875%, 5/01/23 | United States | 16,000,000 | 16,600,000 | |||||||||
senior bond, 5.375%, 2/01/25 | United States | 7,000,000 | 7,061,250 | |||||||||
senior secured bond, first lien, 5.25%, 4/15/25 | United States | 11,000,000 | 11,137,500 | |||||||||
senior secured note, first lien, 5.00%, 3/15/24 | United States | 5,000,000 | 5,025,000 |
18 | Semiannual Report | franklintempleton.com | ||
FRANKLIN HIGH INCOME TRUST
STATEMENT OF INVESTMENTS (UNAUDITED)
Franklin High Income Fund(continued)
| Country | | Principal Amount | * | Value | ||||||||
Corporate Bonds(continued) | ||||||||||||
Health Care Equipment & Services(continued) | ||||||||||||
bMEDNAX Inc., senior note, 144A, 6.25%, 1/15/27 | United States | $ | 14,500,000 | $ | 14,481,875 | |||||||
bMPH Acquisition Holdings LLC, senior note, 144A, 7.125%, 6/01/24 | United States | 15,400,000 | 15,380,750 | |||||||||
b,fPolaris Intermediate Corp., senior note, 144A, PIK, 8.50%, 12/01/22 | United States | 7,000,000 | 6,991,250 | |||||||||
Tenet Healthcare Corp., | ||||||||||||
senior note, 8.125%, 4/01/22 | United States | 12,000,000 | 12,480,000 | |||||||||
senior note, 6.75%, 6/15/23 | United States | 13,700,000 | 13,580,125 | |||||||||
senior secured note, first lien, 6.00%, 10/01/20 | United States | 6,700,000 | 6,850,750 | |||||||||
WellCare Health Plans Inc., | ||||||||||||
senior note, 5.25%, 4/01/25 | United States | 29,500,000 | 29,352,500 | |||||||||
bsenior note, 144A, 5.375%, 8/15/26 | United States | 5,000,000 | 4,975,900 | |||||||||
|
| |||||||||||
|
216,546,887 |
| ||||||||||
|
| |||||||||||
Household & Personal Products 0.9% | ||||||||||||
bPrestige Brands Inc., senior note, 144A, 6.375%, 3/01/24 | United States | 17,800,000 | 17,722,125 | |||||||||
bResideo Funding Inc., senior note, 144A, 6.125%, 11/01/26 | United States | 9,300,000 | 9,288,375 | |||||||||
|
| |||||||||||
|
27,010,500 |
| ||||||||||
|
| |||||||||||
Materials 13.1% | ||||||||||||
fARD Finance SA, secured note, PIK, 7.125%, 9/15/23 | Luxembourg | 14,000,000 | 13,020,000 | |||||||||
bArdagh Packaging Finance PLC/Ardagh MP Holdings USA Inc., senior note, 144A, 6.00%, 2/15/25 | Luxembourg | 10,000,000 | 9,325,000 | |||||||||
bBWAY Holding Co., senior note, 144A, 7.25%, 4/15/25 | United States | 34,900,000 | 31,802,625 | |||||||||
bCemex SAB de CV, senior secured bond, first lien, 144A, 5.70%, 1/11/25 | Mexico | 25,000,000 | 23,726,000 | |||||||||
The Chemours Co., | ||||||||||||
senior note, 6.625%, 5/15/23 | United States | 8,791,000 | 8,944,842 | |||||||||
senior note, 5.375%, 5/15/27 | United States | 12,200,000 | 11,071,500 | |||||||||
bCrown Americas LLC/Crown Americas Capital Corp., senior note, 144A, 4.75%, 2/01/26 | United States | 13,900,000 | 13,431,570 | |||||||||
bEldorado Gold Corp., senior note, 144A, 6.125%, 12/15/20 | Canada | 21,700,000 | 20,072,500 | |||||||||
b First Quantum Minerals Ltd., | ||||||||||||
senior note, 144A, 7.00%, 2/15/21 | Zambia | 8,000,000 | 7,872,600 | |||||||||
senior note, 144A, 7.25%, 4/01/23 | Zambia | 17,000,000 | 15,810,000 | |||||||||
senior note, 144A, 6.875%, 3/01/26 | Zambia | 8,000,000 | 6,890,000 | |||||||||
b FMG Resources (August 2006) Pty. Ltd., | ||||||||||||
senior note, 144A, 4.75%, 5/15/22 | Australia | 5,000,000 | 4,808,250 | |||||||||
senior note, 144A, 5.125%, 5/15/24 | Australia | 3,600,000 | 3,359,988 | |||||||||
bGrinding Media Inc./MC Grinding Media Canada Inc., senior secured note, 144A, 7.375%, 12/15/23 | United States | 16,500,000 | 16,623,750 | |||||||||
bNew Enterprise Stone & Lime Co., senior note, 144A, 6.25%, 3/15/26 | United States | 17,400,000 | 16,051,500 | |||||||||
bNew Gold Inc., senior note, 144A, 6.375%, 5/15/25 | Canada | 16,600,000 | 13,072,500 | |||||||||
b Novelis Corp., | ||||||||||||
senior bond, 144A, 5.875%, 9/30/26 | United States | 15,700,000 | 14,679,500 | |||||||||
senior note, 144A, 6.25%, 8/15/24 | United States | 11,000,000 | 10,917,500 | |||||||||
bOCI NV, senior note, 144A, 6.625%, 4/15/23 | Netherlands | 9,600,000 | 9,768,000 | |||||||||
b Owens-Brockway Glass Container Inc., | ||||||||||||
senior note, 144A, 5.00%, 1/15/22 | United States | 10,000,000 | 9,987,500 | |||||||||
senior note, 144A, 5.875%, 8/15/23 | United States | 10,000,000 | 10,037,500 | |||||||||
bPetra Diamonds U.S. Treasury PLC, secured note, second lien, 144A, 7.25%, 5/01/22 | South Africa | 17,400,000 | 16,051,500 | |||||||||
b Platform Specialty Products Corp., | ||||||||||||
senior note, 144A, 6.50%, 2/01/22 | United States | 10,500,000 | 10,736,250 | |||||||||
senior note, 144A, 5.875%, 12/01/25 | United States | 20,000,000 | 19,600,000 |
franklintempleton.com | Semiannual Report | 19 | ||
FRANKLIN HIGH INCOME TRUST
STATEMENT OF INVESTMENTS (UNAUDITED)
Franklin High Income Fund(continued)
| Country | | Principal Amount | * | Value | ||||||||
Corporate Bonds(continued) | ||||||||||||
Materials(continued) | ||||||||||||
bReynolds Group Issuer Inc./Reynolds Group Issuer LLC/Reynolds Group Issuer Luxembourg SA, | ||||||||||||
senior secured note, first lien, 144A, 5.125%, 7/15/23 | United States | $ | 7,200,000 | $ | 7,038,000 | |||||||
isenior secured note, first lien, 144A, FRN, 5.936%,(3-month USD LIBOR + 3.50%), 7/15/21 | United States | 5,300,000 | 5,352,470 | |||||||||
bSealed Air Corp., senior bond, 144A, 5.50%, 9/15/25 | United States | 5,500,000 | 5,445,000 | |||||||||
Steel Dynamics Inc., | ||||||||||||
senior bond, 5.50%, 10/01/24 | United States | 10,000,000 | 10,000,000 | |||||||||
senior bond, 5.00%, 12/15/26 | United States | 15,000,000 | 14,456,250 | |||||||||
Summit Materials LLC/Summit Materials Finance Corp., senior note, 8.50%, 4/15/22 | United States | 5,000,000 | 5,287,500 | |||||||||
b SunCoke Energy Partners LP/SunCoke Energy Partners Finance Corp., senior note, 144A, 7.50%, 6/15/25 | United States | 31,600,000 | 31,126,000 | |||||||||
|
| |||||||||||
|
396,365,595 |
| ||||||||||
|
| |||||||||||
Media & Entertainment 12.0% | ||||||||||||
bAltice Luxembourg SA, senior secured note, 144A, 7.75%, 5/15/22 | Luxembourg | 30,900,000 | 29,548,125 | |||||||||
AMC Networks Inc., senior note, 5.00%, 4/01/24 | United States | 22,800,000 | 21,973,500 | |||||||||
CCO Holdings LLC/CCO Holdings Capital Corp., | ||||||||||||
senior bond, 5.125%, 2/15/23 | United States | 10,000,000 | 9,950,000 | |||||||||
bsenior bond, 144A, 5.375%, 5/01/25 | United States | 12,000,000 | 11,820,000 | |||||||||
bsenior bond, 144A, 5.75%, 2/15/26 | United States | 13,200,000 | 13,233,132 | |||||||||
bsenior bond, 144A, 5.00%, 2/01/28 | United States | 10,000,000 | 9,337,500 | |||||||||
Clear Channel Worldwide Holdings Inc., | ||||||||||||
senior note, 6.50%, 11/15/22 | United States | 3,500,000 | 3,550,330 | |||||||||
senior note, 6.50%, 11/15/22 | United States | 6,500,000 | 6,631,950 | |||||||||
senior sub. note, 7,625%, 3/15/20 | United States | 15,650,000 | 15,689,125 | |||||||||
CSC Holdings LLC, | ||||||||||||
bsenior bond, 144A, 5.50%, 4/15/27 | United States | 8,000,000 | 7,700,000 | |||||||||
bsenior bond, 144A, 5.375%, 2/01/28 | United States | 9,000,000 | 8,482,500 | |||||||||
senior note, 6.75%, 11/15/21 | United States | 5,000,000 | 5,250,000 | |||||||||
senior note, 5.25%, 6/01/24 | United States | 28,000,000 | 26,670,000 | |||||||||
bsenior note, 144A, 7.50%, 4/01/28 | United States | 10,000,000 | 10,331,250 | |||||||||
bsenior secured note, first lien, 144A, 5.50%, 5/15/26 | United States | 23,550,000 | 22,784,625 | |||||||||
DISH DBS Corp., | ||||||||||||
senior bond, 5.875%, 7/15/22 | United States | 10,000,000 | 9,575,000 | |||||||||
senior bond, 5.00%, 3/15/23 | United States | 5,000,000 | 4,393,750 | |||||||||
senior note, 5.875%, 11/15/24 | United States | 17,500,000 | 14,984,375 | |||||||||
bGray Escrow Inc., senior note, 144A, 7.00%, 5/15/27 | United States | 10,700,000 | 10,887,250 | |||||||||
Netflix Inc., | ||||||||||||
senior bond, 4.375%, 11/15/26 | United States | 15,700,000 | 14,524,384 | |||||||||
senior bond, 4.875%, 4/15/28 | United States | 4,700,000 | 4,347,500 | |||||||||
bsenior bond, 144A, 5.875%, 11/15/28 | United States | 11,100,000 | 11,044,500 | |||||||||
bNexstar Broadcasting Inc., senior note, 144A, 5.625%, 8/01/24 | United States | 12,800,000 | 12,384,000 | |||||||||
bUnitymedia KabelBW GmbH, senior bond, 144A, 6.125%, 1/15/25 | Germany | 23,500,000 | 24,087,500 | |||||||||
bUnivision Communications Inc., | ||||||||||||
senior secured note, first lien, 144A, 5.125%, 5/15/23 | United States | 5,000,000 | 4,693,750 | |||||||||
senior secured note, first lien, 144A, 5.125%, 2/15/25 | United States | 16,000,000 | 14,633,920 | |||||||||
bVirgin Media Secured Finance PLC, | ||||||||||||
senior secured bond, 144A, 5.25%, 1/15/26 | United Kingdom | 10,000,000 | 9,400,000 | |||||||||
senior secured bond, first lien, 144A, 5.50%, 1/15/25 | United Kingdom | 7,000,000 | 6,755,000 | |||||||||
senior secured bond, first lien, 144A, 5.50%, 8/15/26 | United Kingdom | 7,300,000 | 6,898,500 |
20 | Semiannual Report | franklintempleton.com | ||
FRANKLIN HIGH INCOME TRUST
STATEMENT OF INVESTMENTS (UNAUDITED)
Franklin High Income Fund(continued)
| Country | | Principal Amount | * | Value | ||||||||
Corporate Bonds(continued) | ||||||||||||
Media & Entertainment(continued) | ||||||||||||
��b WMG Acquisition Corp., | ||||||||||||
secured note, 144A, 4.875%, 11/01/24 | United States | $ | 2,600,000 | $ | 2,528,500 | |||||||
secured note, first lien, 144A, 5.00%, 8/01/23 | United States | 8,500,000 | 8,415,000 | |||||||||
|
| |||||||||||
|
362,504,966 |
| ||||||||||
|
| |||||||||||
Pharmaceuticals, Biotechnology & Life Sciences 4.4% | ||||||||||||
Advanz Pharma Corp., senior secured note, first lien, 8.00%, 9/06/24 | Canada | 7,106,000 | 6,875,055 | |||||||||
bBausch Health Cos. Inc., | ||||||||||||
senior note, 144A, 5.625%, 12/01/21 | United States | 15,000,000 | 15,037,500 | |||||||||
senior note, first lien, 144A, 7.00%, 3/15/24 | United States | 4,200,000 | 4,404,750 | |||||||||
b,fEagle Holdings Co. II LLC, senior note, 144A, PIK, 7.625%, 5/15/22 | United States | 14,200,000 | 14,217,750 | |||||||||
bEndo DAC/Endo Finance LLC/Endo Finco Inc., | ||||||||||||
senior bond, 144A, 6.00%, 2/01/25 | United States | 23,400,000 | 18,566,496 | |||||||||
senior note, 144A, 6.00%, 7/15/23 | United States | 16,200,000 | 13,529,268 | |||||||||
Horizon Pharma USA Inc., | ||||||||||||
senior note, 6.625%, 5/01/23 | United States | 24,000,000 | 23,940,000 | |||||||||
bsenior note, 144A, 8.75%, 11/01/24 | United States | 7,000,000 | 7,350,000 | |||||||||
bValeant Pharmaceuticals International, senior note, 144A, 9.25%, 4/01/26 | United States | 27,000,000 | 28,814,130 | |||||||||
|
| |||||||||||
|
132,734,949 |
| ||||||||||
|
| |||||||||||
Real Estate 1.7% | ||||||||||||
CyrusOne LP/CyrusOne Finance Corp., senior note, 5.375%, 3/15/27 | United States | 9,400,000 | 9,235,500 | |||||||||
bFive Point Operating Co. LP/Five Point Capital Corp., senior note, 144A, 7.875%, 11/15/25 | United States | 21,400,000 | 21,105,750 | |||||||||
MPT Operating Partnership LP/MPT Finance Corp., | ||||||||||||
senior bond, 5.25%, 8/01/26 | United States | 7,700,000 | 7,565,250 | |||||||||
senior bond, 5.00%, 10/15/27 | United States | 13,100,000 | 12,477,750 | |||||||||
|
| |||||||||||
|
50,384,250 |
| ||||||||||
|
| |||||||||||
Retailing 0.9% | ||||||||||||
bParty City Holdings Inc., senior note, 144A, 6.625%, 8/01/26 | United States | 7,300,000 | 7,064,210 | |||||||||
bPetSmart Inc., | ||||||||||||
senior note, 144A, 7.125%, 3/15/23 | United States | 12,700,000 | 8,572,500 | |||||||||
senior secured note, first lien, 144A, 5.875%, 6/01/25 | United States | 15,600,000 | 12,012,000 | |||||||||
|
| |||||||||||
|
27,648,710 |
| ||||||||||
|
| |||||||||||
Semiconductors & Semiconductor Equipment 0.8% | ||||||||||||
bQorvo Inc., senior note, 144A, 5.50%, 7/15/26 | United States | 23,700,000 | 23,048,250 | |||||||||
Software & Services 2.7% | ||||||||||||
bFirst Data Corp., | ||||||||||||
secured note, first lien, 144A, 5.00%, 1/15/24 | United States | 5,000,000 | 4,949,750 | |||||||||
secured note, second lien, 144A, 5.75%, 1/15/24 | United States | 30,000,000 | 30,225,000 | |||||||||
Infor (U.S.) Inc., senior note, 6.50%, 5/15/22 | United States | 34,000,000 | 33,957,500 | |||||||||
bSymantec Corp., senior note, 144A, 5.00%, 4/15/25 | United States | 12,600,000 | 12,229,435 | |||||||||
|
| |||||||||||
|
81,361,685 |
| ||||||||||
|
| |||||||||||
Technology Hardware & Equipment 2.1% | ||||||||||||
bBlackboard Inc., secured note, second lien, 144A, 9.75%, 10/15/21 | United States | 34,410,000 | 24,603,150 | |||||||||
bCommScope Inc., senior bond, 144A, 5.50%, 6/15/24 | United States | 7,000,000 | 6,483,050 | |||||||||
bCommScope Technologies LLC, senior bond, 144A, 6.00%, 6/15/25 | United States | 10,200,000 | 9,499,260 | |||||||||
bDell International LLC/EMC Corp., | ||||||||||||
senior note, 144A, 5.875%, 6/15/21 | United States | 4,500,000 | 4,574,412 | |||||||||
senior note, 144A, 7.125%, 6/15/24 | United States | 4,900,000 | 5,139,802 | |||||||||
senior secured bond, first lien, 144A, 6.02%, 6/15/26 | United States | 5,400,000 | 5,469,131 |
franklintempleton.com | Semiannual Report | 21 | ||
FRANKLIN HIGH INCOME TRUST
STATEMENT OF INVESTMENTS (UNAUDITED)
Franklin High Income Fund(continued)
| Country | | Principal Amount | * | Value | ||||||||
Corporate Bonds(continued) | ||||||||||||
Technology Hardware & Equipment(continued) | ||||||||||||
bDell International LLC/EMC Corp., (continued) | ||||||||||||
senior secured note, first lien, 144A, 5.45%, 6/15/23 | United States | $ | 7,000,000 | $ | 7,163,630 | |||||||
|
| |||||||||||
|
62,932,435 |
| ||||||||||
|
| |||||||||||
Telecommunication Services 5.8% | ||||||||||||
bBlock Communications Inc., senior note, 144A, 6.875%, 2/15/25 | United States | 8,700,000 | 8,852,250 | |||||||||
bDigicel Group Ltd., senior note, 144A, 8.25%, 9/30/20 | Bermuda | 15,000,000 | 10,031,250 | |||||||||
bDigicel Ltd., senior note, 144A, 6.00%, 4/15/21 | Bermuda | 22,000,000 | 19,716,290 | |||||||||
��bDKT Finance ApS, senior secured note, first lien, 144A, 9.375%, 6/17/23 | Denmark | 16,800,000 | 17,534,664 | |||||||||
Hughes Satellite Systems Corp., senior bond, 6.625%, 8/01/26 | United States | 22,650,000 | 21,149,437 | |||||||||
Sprint Communications Inc., senior note, 6.00%, 11/15/22 | United States | 6,500,000 | 6,513,650 | |||||||||
Sprint Corp., | ||||||||||||
senior note, 7.625%, 2/15/25 | United States | 20,000,000 | 20,625,000 | |||||||||
senior note, 7.625%, 3/01/26 | United States | 15,300,000 | 15,720,750 | |||||||||
bSprint Spectrum Co. LLC/Sprint Spectrum Co. II LLC, senior secured bond, | United States | 16,600,000 | 16,530,280 | |||||||||
T-Mobile USA Inc., | ||||||||||||
senior bond, 6.375%, 3/01/25 | United States | 22,400,000 | 23,100,000 | |||||||||
senior note, 6.00%, 4/15/24 | United States | 8,500,000 | 8,701,875 | |||||||||
senior note, 5.125%, 4/15/25 | United States | 9,000,000 | 8,955,000 | |||||||||
|
| |||||||||||
|
177,430,446 |
| ||||||||||
|
| |||||||||||
Transportation 1.5% | ||||||||||||
bAvolon Holdings Funding Ltd., senior note, 144A, 5.125%, 10/01/23 | Ireland | 9,700,000 | 9,627,250 | |||||||||
bDAE Funding LLC, | ||||||||||||
senior note, 144A, 4.50%, 8/01/22 | United Arab Emirates | 16,000,000 | 15,360,000 | |||||||||
senior note, 144A, 5.00%, 8/01/24 | United Arab Emirates | 12,000,000 | 11,310,000 | |||||||||
bPark Aerospace Holdings Ltd., senior note, 144A, 5.50%, 2/15/24 | Ireland | 8,900,000 | 8,902,759 | |||||||||
|
| |||||||||||
|
45,200,009 |
| ||||||||||
|
| |||||||||||
Utilities 3.8% | ||||||||||||
Calpine Corp., | ||||||||||||
senior bond, 5.75%, 1/15/25 | United States | 12,400,000 | 11,439,000 | |||||||||
senior note, 5.375%, 1/15/23 | United States | 18,300,000 | 17,385,000 | |||||||||
bsenior secured bond, first lien, 144A, 5.875%, 1/15/24 | United States | 5,000,000 | 5,012,500 | |||||||||
Clearway Energy Operating LLC, | ||||||||||||
senior bond, 5.375%, 8/15/24 | United States | 16,000,000 | 15,240,000 | |||||||||
senior bond, 5.00%, 9/15/26 | United States | 19,000,000 | 17,337,500 | |||||||||
bsenior note, 144A, 5.75%, 10/15/25 | United States | 11,200,000 | 10,808,000 | |||||||||
Ferrellgas Partners LP/Ferrellgas Partners Finance Corp., senior note, 8.625%, 6/15/20 | United States | 6,600,000 | 4,999,500 | |||||||||
bInterGen NV, secured bond, 144A, 7.00%, 6/30/23 | Netherlands | 5,800,000 | 5,321,500 | |||||||||
Talen Energy Supply LLC, senior note, 6.50%, 6/01/25 | United States | 39,650,000 | 28,994,063 | |||||||||
|
| |||||||||||
|
116,537,063 |
| ||||||||||
|
| |||||||||||
Total Corporate Bonds (Cost $2,999,459,260) |
|
2,841,407,076 |
| |||||||||
|
| |||||||||||
Shares
| ||||||||||||
Escrows and Litigation Trusts 0.0%† | ||||||||||||
a,cAlpha Natural Resources Inc., Escrow Account | United States | 25,000,000 | — | |||||||||
a,cMidstates Petroleum Co. Inc./Midstates Petroleum Co. LLC, Escrow Account | United States | 25,000,000 | — | |||||||||
a,cNewPage Corp., Litigation Trust | United States | 30,000,000 | — | |||||||||
22 | Semiannual Report | franklintempleton.com | ||
FRANKLIN HIGH INCOME TRUST
STATEMENT OF INVESTMENTS (UNAUDITED)
Franklin High Income Fund(continued) | ||||||||||
| Country | Shares | Value | ||||||||
| ||||||||||
Escrows and Litigation Trusts(continued) | ||||||||||
aPenn Virginia Corp., Escrow Account | United States | 25,000,000 | $ | 75,000 | ||||||
a,cT-Mobile USA Inc., Escrow Account | United States | 39,900,000 | — | |||||||
aVistra Energy Corp., Escrow Account | United States | 50,000,000 | 250,000 | |||||||
|
| |||||||||
Total Escrows and Litigation Trusts (Cost $1,442,951) | 325,000 | |||||||||
|
| |||||||||
Total Investments before Short Term Investments | 2,918,598,460 | |||||||||
|
| |||||||||
Short Term Investments (Cost $60,662,009) 2.0% | ||||||||||
Money Market Funds 2.0% | ||||||||||
j,kInstitutional Fiduciary Trust Money Market Portfolio, 1.91% | United States | 60,662,009 | 60,662,009 | |||||||
|
| |||||||||
Total Investments (Cost $3,270,493,094) 98.3% | 2,979,260,469 | |||||||||
Other Assets, less Liabilities 1.7% | 52,997,995 | |||||||||
|
| |||||||||
Net Assets 100.0% | $ | 3,032,258,464 | ||||||||
|
| |||||||||
See Abbreviations on page 37.
†Rounds to less than 0.1% of net assets.
*The principal amount is stated in U.S. dollars unless otherwise indicated.
aNon-income producing.
bSecurity was purchased pursuant to Rule 144A under the Securities Act of 1933 and may be sold in transactions exempt from registration only to qualified institutional buyers or in a public offering registered under the Securities Act of 1933. These securities have been deemed liquid under guidelines approved by the Trust’s Board of Trustees. At November 30, 2018, the aggregate value of these securities was $1,646,929,601, representing 54.3% of net assets.
cFair valued using significant unobservable inputs. See Note 11 regarding fair value measurements.
dSee Note 8 regarding restricted securities.
eSee Note 9 regarding holdings of 5% voting securities.
fIncome may be received in additional securities and/or cash.
gPerpetual security with no stated maturity date.
hSee Note 7 regarding defaulted securities.
iThe coupon rate shown represents the rate at period end.
jSee Note 3(f) regarding investments in affiliated management investment companies.
kThe rate shown is the annualizedseven-day effective yield at period end.
franklintempleton.com | The accompanying notes are an integral part of these financial statements. | Semiannual Report | 23 | ||
FRANKLIN HIGH INCOME TRUST
Statement of Assets and Liabilities
November 30, 2018 (unaudited)
Franklin High Income Fund
Assets: | ||||
Investments in securities: | ||||
Cost - Unaffiliated issuers | $3,178,770,283 | |||
Cost -Non-controlled affiliates (Note 3f and 9) | 91,722,811 | |||
|
| |||
Value - Unaffiliated issuers |
|
$2,884,665,160 |
| |
Value -Non-controlled affiliates (Note 3f and 9) | 94,595,309 | |||
Receivables: | ||||
Investment securities sold | 17,458,708 | |||
Capital shares sold | 927,551 | |||
Interest | 46,661,641 | |||
Other assets | 743 | |||
|
| |||
Total assets |
|
3,044,309,112 |
| |
|
| |||
Liabilities: | ||||
Payables: | ||||
Capital shares redeemed | 7,549,823 | |||
Management fees | 1,136,313 | |||
Distribution fees | 513,749 | |||
Transfer agent fees | 1,025,672 | |||
Distributions to shareholders | 1,636,072 | |||
Accrued expenses and other liabilities | 189,019 | |||
|
| |||
Total liabilities |
|
12,050,648 |
| |
|
| |||
Net assets, at value |
|
$3,032,258,464 |
| |
|
| |||
Net assets consist of: | ||||
Paid-in capital | $3,965,497,313 | |||
Total distributable earnings (loss) | (933,238,849 | ) | ||
|
| |||
Net assets, at value |
|
$3,032,258,464 |
| |
|
| |||
24 | Semiannual Report | The accompanying notes are an integral part of these financial statements. | franklintempleton.com | ||
FRANKLIN HIGH INCOME TRUST
FINANCIAL STATEMENTS
Statement of Assets and Liabilities(continued)
November 30, 2018 (unaudited)
Franklin High Income Fund
Class A: | ||||
Net assets, at value | $ 114,715,267 | |||
|
| |||
Shares outstanding | 65,066,432 | |||
|
| |||
Net asset value per sharea | $1.76 | |||
|
| |||
Maximum offering price per share (net asset value per share ÷ 95.75%) | $1.84 | |||
|
| |||
Class A1: | ||||
Net assets, at value | $2,123,022,519 | |||
|
| |||
Shares outstanding | 1,199,148,769 | |||
|
| |||
Net asset value per sharea | $1.77 | |||
|
| |||
Maximum offering price per share (net asset value per share ÷ 95.75%) | $1.85 | |||
|
| |||
Class C: | ||||
Net assets, at value | $ 320,964,238 | |||
|
| |||
Shares outstanding | 179,040,102 | |||
|
| |||
Net asset value and maximum offering price per sharea | $1.79 | |||
|
| |||
Class R: | ||||
Net assets, at value | $ 108,197,646 | |||
|
| |||
Shares outstanding | 59,987,623 | |||
|
| |||
Net asset value and maximum offering price per share | $1.80 | |||
|
| |||
Class R6: | ||||
Net assets, at value | $ 60,061,016 | |||
|
| |||
Shares outstanding | 33,987,131 | |||
|
| |||
Net asset value and maximum offering price per share | $1.77 | |||
|
| |||
Advisor Class: | ||||
Net assets, at value | $ 305,297,778 | |||
|
| |||
Shares outstanding | 172,292,936 | |||
|
| |||
Net asset value and maximum offering price per share | $1.77 | |||
|
|
aRedemption price is equal to net asset value less contingent deferred sales charges, if applicable.
franklintempleton.com | The accompanying notes are an integral part of these financial statements. | Semiannual Report | 25 | ||
FRANKLIN HIGH INCOME TRUST
FINANCIAL STATEMENTS
Statement of Operations
for the six months ended November 30, 2018 (unaudited)
Franklin High Income Fund
Investment income: | ||||
Dividends: | ||||
Unaffiliated issuers | $ | (1,639,774 | ) | |
Non-controlled affiliates (Note 3f and 9) | 833,127 | |||
Interest: | ||||
Unaffiliated issuers | 98,716,170 | |||
Non-controlled affiliates (Note 9) | 702,932 | |||
|
| |||
Total investment income |
|
98,612,455 |
| |
|
| |||
Expenses: | ||||
Management fees (Note 3a) | 7,393,992 | |||
Distribution fees: (Note 3c) | ||||
Class A | 35,213 | |||
Class A1 | 1,716,536 | |||
Class C | 1,376,746 | |||
Class R | 299,822 | |||
Transfer agent fees: (Note 3e) | ||||
Class A | 20,239 | |||
Class A1 | 1,647,304 | |||
Class C | 304,878 | |||
Class R | 86,312 | |||
Class R6 | 22,060 | |||
Advisor Class | 253,880 | |||
Custodian fees (Note 4) | 14,546 | |||
Reports to shareholders | 148,635 | |||
Registration and filing fees | 83,046 | |||
Professional fees | 49,525 | |||
Trustees’ fees and expenses | 47,136 | |||
Other | 44,180 | |||
|
| |||
Total expenses | 13,544,050 | |||
Expense reductions (Note 4) | (3,193) | |||
Expenses waived/paid by affiliates (Note 3f and 3g) | (189,415 | ) | ||
|
| |||
Net expenses |
|
13,351,442 |
| |
|
| |||
Net investment income |
|
85,261,013 |
| |
|
| |||
Realized and unrealized gains (losses): | ||||
Net realized gain (loss) from: | ||||
Investments: | ||||
Unaffiliated issuers | 9,047,353 | |||
|
| |||
Net change in unrealized appreciation (depreciation) on: | ||||
Investments: | ||||
Unaffiliated issuers | (96,405,672 | ) | ||
Non-controlled affiliates (Note 3f and 9) | 1,581,110 | |||
|
| |||
Net change in unrealized appreciation (depreciation) |
|
(94,824,562 |
) | |
|
| |||
Net realized and unrealized gain (loss) |
|
(85,777,209 |
) | |
|
| |||
Net increase (decrease) in net assets resulting from operations |
$ |
(516,196) |
| |
|
| |||
26 | Semiannual Report | The accompanying notes are an integral part of these financial statements. | franklintempleton.com | ||
FRANKLIN HIGH INCOME TRUST
FINANCIAL STATEMENTS
Statements of Changes in Net Assets
Franklin High Income Fund
| Six Months Ended November 30, 2018 (unaudited) | Year Ended May 31, 2018 | |||||||
| ||||||||
Increase (decrease) in net assets: | ||||||||
Operations: | ||||||||
Net investment income | $ 85,261,013 | $ | 195,679,743 | |||||
Net realized gain (loss) | 9,047,353 | (74,898,801 | ) | |||||
Net change in unrealized appreciation (depreciation) | (94,824,562 | ) | (76,008,060 | ) | ||||
|
| |||||||
Net increase (decrease) in net assets resulting from operations |
|
(516,196 |
) |
|
44,772,882 |
| ||
|
| |||||||
Distributions to shareholders: (Note 1d) | ||||||||
Class A | (1,196,482 | ) | — | |||||
Class A1 | (65,233,178 | ) | (142,972,505 | ) | ||||
Class M | — | (113 | ) | |||||
Class C | (10,493,431 | ) | (25,417,100 | ) | ||||
Class R | (3,128,656 | ) | (7,769,102 | ) | ||||
Class R6 | (1,937,179 | ) | (3,472,892 | ) | ||||
Advisor Class | (10,290,752 | ) | (24,192,543 | ) | ||||
|
| |||||||
Total distributions to shareholders |
|
(92,279,678 |
) |
|
(203,824,255 |
) | ||
|
| |||||||
Capital share transactions: (Note 2) | ||||||||
Class A | 118,538,314 | — | ||||||
Class A1 | (169,132,330 | ) | (321,385,660 | ) | ||||
Class M | (4,815 | ) | 5,000 | |||||
Class C | (129,732,930 | ) | (81,857,091 | ) | ||||
Class R | (15,899,491 | ) | (53,640,781 | ) | ||||
Class R6 | (6,407,489 | ) | 38,201,433 | |||||
Advisor Class | (41,407,119 | ) | (114,629,898 | ) | ||||
|
| |||||||
Total capital share transactions |
|
(244,045,860 |
) |
|
(533,306,997 |
) | ||
|
| |||||||
Net increase (decrease) in net assets | (336,841,734 | ) | (692,358,370 | ) | ||||
Net assets: | ||||||||
Beginning of period | 3,369,100,198 | 4,061,458,568 | ||||||
|
| |||||||
End of period (Note 1d) |
|
$3,032,258,464 |
|
$ |
3,369,100,198 |
| ||
|
| |||||||
franklintempleton.com | The accompanying notes are an integral part of these financial statements. | Semiannual Report | 27 | ||
FRANKLIN HIGH INCOME TRUST
Notes to Financial Statements (unaudited)
Franklin High Income Fund
1. Organization and Significant Accounting Policies
Franklin High Income Trust (Trust) is registered under the Investment Company Act of 1940 (1940 Act) as anopen-end management investment company, consisting of one fund, Franklin High Income Fund (Fund) and applies the specialized accounting and reporting guidance in U.S. Generally Accepted Accounting Principles (U.S. GAAP). The Fund offers six classes of shares: Class A, Class A1, Class C, Class R, Class R6 and Advisor Class. Beginning on October 19, 2018, Class C shares automatically convert to Class A shares after they have been held for 10 years. Each class of shares may differ by its initial sales load, contingent deferred sales charges, voting rights on matters affecting a single class, its exchange privilege and fees due to differing arrangements for distribution and transfer agent fees.
Class M was closed to investors effective at the close of market June 8, 2018.
Effective September 10, 2018, Class A shares were renamed A1, and the Fund began offering a new class of shares, Class A. Class A1 shares are only offered to existing Class A1 shareholders.
The following summarizes the Fund’s significant accounting policies.
a. Financial Instrument Valuation
The Fund’s investments in financial instruments are carried at fair value daily. Fair value is the price that would be received to sell an asset or paid to transfer a liability in an orderly transaction between market participants on the measurement date. The Fund calculates the net asset value (NAV) per share each business day as of 4 p.m. Eastern time or the regularly scheduled close of the New York Stock Exchange (NYSE), whichever is earlier. Under compliance policies and procedures approved by the Trust’s Board of Trustees (the Board), the Fund’s administrator has responsibility for oversight of valuation, including leading the cross-functional Valuation Committee (VC). The Fund may utilize independent pricing services, quotations from securities and financial instrument dealers, and other market sources to determine fair value.
Equity securities listed on an exchange or on the NASDAQ National Market System are valued at the last quoted sale price or the official closing price of the day, respectively. Foreign equity securities are valued as of the close of trading on the
foreign stock exchange on which the security is primarily traded, or as of 4 p.m. Eastern time. The value is then converted into its U.S. dollar equivalent at the foreign exchange rate in effect at 4 p.m. Eastern time on the day that the value of the security is determined.Over-the-counter (OTC) securities are valued within the range of the most recent quoted bid and ask prices. Securities that trade in multiple markets or on multiple exchanges are valued according to the broadest and most representative market. Certain equity securities are valued based upon fundamental characteristics or relationships to similar securities.
Debt securities generally trade in the OTC market rather than on a securities exchange. The Fund’s pricing services use multiple valuation techniques to determine fair value. In instances where sufficient market activity exists, the pricing services may utilize a market-based approach through which quotes from market makers are used to determine fair value. In instances where sufficient market activity may not exist or is limited, the pricing services also utilize proprietary valuation models which may consider market characteristics such as benchmark yield curves, credit spreads, estimated default rates, anticipated market interest rate volatility, coupon rates, anticipated timing of principal repayments, underlying collateral, and other unique security features in order to estimate the relevant cash flows, which are then discounted to calculate the fair value.
Investments inopen-end mutual funds are valued at the closing NAV.
The Fund has procedures to determine the fair value of financial instruments for which market prices are not reliable or readily available. Under these procedures, the Fund primarily employs a market-based approach which may use related or comparable assets or liabilities, recent transactions, market multiples, book values, and other relevant information for the investment to determine the fair value of the investment. An income-based valuation approach may also be used in which the anticipated future cash flows of the investment are discounted to calculate fair value. Discounts may also be applied due to the nature or duration of any restrictions on the disposition of the investments. Due to the inherent uncertainty of valuations of such investments, the fair values may differ significantly from the values that would have been used had an active market existed.
28 | Semiannual Report | franklintempleton.com | ||
FRANKLIN HIGH INCOME TRUST
NOTES TO FINANCIAL STATEMENTS (UNAUDITED)
Franklin High Income Fund(continued)
Trading in securities on foreign securities stock exchanges and OTC markets may be completed before 4 p.m. Eastern time. In addition, trading in certain foreign markets may not take place on every Fund’s business day. Occasionally, events occur between the time at which trading in a foreign security is completed and 4 p.m. Eastern time that might call into question the reliability of the value of a portfolio security held by the Fund. As a result, differences may arise between the value of the Fund’s portfolio securities as determined at the foreign market close and the latest indications of value at 4 p.m. Eastern time. In order to minimize the potential for these differences, the VC monitors price movements following the close of trading in foreign stock markets through a series of country specific market proxies (such as baskets of American Depositary Receipts, futures contracts and exchange traded funds). These price movements are measured against established trigger thresholds for each specific market proxy to assist in determining if an event has occurred that may call into question the reliability of the values of the foreign securities held by the Fund. If such an event occurs, the securities may be valued using fair value procedures, which may include the use of independent pricing services.
When the last day of the reporting period is anon-business day, certain foreign markets may be open on those days that the Fund’s NAV is not calculated, which could result in differences between the value of the Fund’s portfolio securities on the last business day and the last calendar day of the reporting period. Any significant security valuation changes due to an open foreign market are adjusted and reflected by the Fund for financial reporting purposes.
b. Foreign Currency Translation
Portfolio securities and other assets and liabilities denominated in foreign currencies are translated into U.S. dollars based on the exchange rate of such currencies against U.S. dollars on the date of valuation. The Fund may enter into foreign currency exchange contracts to facilitate transactions denominated in a foreign currency. Purchases and sales of securities, income and expense items denominated in foreign currencies are translated into U.S. dollars at the exchange rate in effect on the transaction date. Portfolio securities and assets and liabilities denominated in foreign currencies contain risks that those currencies will decline in value relative to the U.S. dollar. Occasionally, events may impact the availability or reliability of foreign exchange
rates used to convert the U.S. dollar equivalent value. If such an event occurs, the foreign exchange rate will be valued at fair value using procedures established and approved by the Board.
The Fund does not separately report the effect of changes in foreign exchange rates from changes in market prices on securities held. Such changes are included in net realized and unrealized gain or loss from investments in the Statement of Operations.
Realized foreign exchange gains or losses arise from sales of foreign currencies, currency gains or losses realized between the trade and settlement dates on securities transactions and the difference between the recorded amounts of dividends, interest, and foreign withholding taxes and the U.S. dollar equivalent of the amounts actually received or paid. Net unrealized foreign exchange gains and losses arise from changes in foreign exchange rates on foreign denominated assets and liabilities other than investments in securities held at the end of the reporting period.
c. Income and Deferred Taxes
It is the Fund’s policy to qualify as a regulated investment company under the Internal Revenue Code. The Fund intends to distribute to shareholders substantially all of its taxable income and net realized gains to relieve it from federal income and excise taxes. As a result, no provision for U.S. federal income taxes is required.
The Fund may be subject to foreign taxation related to income received, capital gains on the sale of securities and certain foreign currency transactions in the foreign jurisdictions in which it invests. Foreign taxes, if any, are recorded based on the tax regulations and rates that exist in the foreign markets in which the Fund invests. When a capital gain tax is determined to apply, the Fund records an estimated deferred tax liability in an amount that would be payable if the securities were disposed of on the valuation date.
The Fund may recognize an income tax liability related to its uncertain tax positions under U.S. GAAP when the uncertain tax position has a less than 50% probability that it will be sustained upon examination by the tax authorities based on its technical merits. As of November 30, 2018, the Fund has determined that no tax liability is required in its financial statements related to uncertain tax positions for any open tax years (or expected to be taken in future tax years). Open tax
franklintempleton.com | Semiannual Report | 29 | ||
FRANKLIN HIGH INCOME TRUST
NOTES TO FINANCIAL STATEMENTS (UNAUDITED)
Franklin High Income Fund(continued)
1. Organization and Significant Accounting Policies(continued)
c. Income and Deferred Taxes(continued)
years are those that remain subject to examination and are based on the statute of limitations in each jurisdiction in which the Fund invests.
d. Security Transactions, Investment Income, Expenses and Distributions
Security transactions are accounted for on trade date. Realized gains and losses on security transactions are determined on a specific identification basis. Interest income and estimated expenses are accrued daily. Amortization of premium and accretion of discount on debt securities are included in interest income. Dividend income is recorded on theex-dividend date except for certain dividends from securities where the dividend rate is not available. In such cases, the dividend is recorded as soon as the information is received by the Fund. Distributions to shareholders are recorded on theex-dividend date. Distributable earnings are determined according to income tax regulations (tax basis) and may differ from earnings recorded in accordance with U.S. GAAP. These differences may be permanent or temporary. Permanent differences are reclassified among capital accounts to reflect their tax character. These reclassifications have no impact on net assets or the results of operations. Temporary differences are not reclassified, as they may reverse in subsequent periods.*
Realized and unrealized gains and losses and net investment income, excluding class specific expenses, are allocated daily to each class of shares based upon the relative proportion of net assets of each class. Differences in per share distributions by class are generally due to differences in class specific expenses.
e. Accounting Estimates
The preparation of financial statements in accordance with U.S. GAAP requires management to make estimates and assumptions that affect the reported amounts of assets and liabilities at the date of the financial statements and the amounts of income and expenses during the reporting period. Actual results could differ from those estimates.
f. Guarantees and Indemnifications
Under the Trust’s organizational documents, its officers and trustees are indemnified by the Trust against certain liabilities arising out of the performance of their duties to the Trust. Additionally, in the normal course of business, the Trust, on behalf of the Fund, enters into contracts with service providers that contain general indemnification clauses. The Trust’s maximum exposure under these arrangements is unknown as this would involve future claims that may be made against the Trust that have not yet occurred. Currently, the Trust expects the risk of loss to be remote.
*Effective during the current reporting period, it is no longer required to present certain line items on the Statements of Changes in Net Assets. Such disclosure changes are included in the Statements of Changes in Net Assets, therefore prior period amounts are presented below.
For the year ended May 31, 2018, distributions to shareholders were as follows:
Distributions from net investment income: | ||||
Class A1 | $ | (142,972,505 | ) | |
Class M | (113 | ) | ||
Class C | (25,417,100 | ) | ||
Class R | (7,769,102 | ) | ||
Class R6 | (3,472,892 | ) | ||
Advisor Class | (24,192,543 | ) |
For the year ended May 31, 2018, distribution in excess of net investment income included in net assets was $(15,403,896).
30 | Semiannual Report | franklintempleton.com | ||
FRANKLIN HIGH INCOME TRUST
NOTES TO FINANCIAL STATEMENTS (UNAUDITED)
Franklin High Income Fund(continued)
2. Shares of Beneficial Interest
At November 30, 2018, there were an unlimited number of shares authorized (without par value). Transactions in the Fund’s shares were as follows:
Six Months Ended November 30, 2018 | Year Ended May 31, 2018 | |||||||||||||||
|
| |||||||||||||||
| Shares | Amount | Shares | Amount | |||||||||||||
Class A Sharesa: | ||||||||||||||||
Shares soldb | 83,318,190 | $ | 151,517,779 | — | $ | — | ||||||||||
Shares issued in reinvestment of distributions | 629,271 | 1,122,059 | — | — | ||||||||||||
Shares redeemed | (18,881,029 | ) | (34,101,524 | ) | — | — | ||||||||||
|
| |||||||||||||||
Net increase (decrease) | 65,066,432 | $ | 118,538,314 | — | $ | — | ||||||||||
|
| |||||||||||||||
Class A1 Shares: | ||||||||||||||||
Shares sold | 62,791,322 | $ | 115,287,652 | 166,477,222 | $ | 312,650,592 | ||||||||||
Shares issued in reinvestment of distributions | 31,398,060 | 57,139,747 | 66,589,510 | 125,005,399 | ||||||||||||
Shares redeemed | (186,527,851 | ) | (341,559,729 | ) | (404,056,682 | ) | (759,041,651) | |||||||||
|
| |||||||||||||||
Net increase (decrease) | (92,338,469 | ) | $ | (169,132,330 | ) | (170,989,950 | ) | $ | (321,385,660) | |||||||
|
| |||||||||||||||
Class M Sharesc,d: | ||||||||||||||||
Shares sold | — | $ | — | 2,618 | $ | 5,000 | ||||||||||
Shares redeemed | (2,618 | ) | (4,815 | ) | — | — | ||||||||||
|
| |||||||||||||||
Net increase (decrease) | (2,618 | ) | $ | (4,815 | ) | 2,618 | $ | 5,000 | ||||||||
|
| |||||||||||||||
Class C Shares: | ||||||||||||||||
Shares sold | 7,673,074 | $ | 14,238,495 | 20,932,640 | $ | 39,883,914 | ||||||||||
Shares issued in reinvestment of distributions | 5,210,161 | 9,626,200 | 12,249,454 | 23,266,943 | ||||||||||||
Shares redeemedb | (83,016,092 | ) | (153,597,625 | ) | (76,211,016 | ) | (145,007,948) | |||||||||
|
| |||||||||||||||
Net increase (decrease) | (70,132,857 | ) | $ | (129,732,930 | ) | (43,028,922 | ) | $ | (81,857,091) | |||||||
|
| |||||||||||||||
Class R Shares: | ||||||||||||||||
Shares sold | 3,152,983 | $ | 5,882,201 | 10,384,341 | $ | 19,876,809 | ||||||||||
Shares issued in reinvestment of distributions | 1,657,459 | 3,074,671 | 3,981,884 | 7,610,355 | ||||||||||||
Shares redeemed | (13,346,868 | ) | (24,856,363 | ) | (42,336,771 | ) | (81,127,945) | |||||||||
|
| |||||||||||||||
Net increase (decrease) | (8,536,426 | ) | $ | (15,899,491 | ) | (27,970,546 | ) | $ | (53,640,781) | |||||||
|
| |||||||||||||||
Class R6 Shares: | ||||||||||||||||
Shares sold | 3,843,292 | $ | 7,034,035 | 43,509,280 | $ | 82,338,570 | ||||||||||
Shares issued in reinvestment of distributions | 1,054,398 | 1,915,429 | 1,850,032 | 3,457,474 | ||||||||||||
Shares redeemed | (8,409,120 | ) | (15,356,953 | ) | (25,399,881 | ) | (47,594,611) | |||||||||
|
| |||||||||||||||
Net increase (decrease) | (3,511,430 | ) | $ | (6,407,489 | ) | 19,959,431 | $ | 38,201,433 | ||||||||
|
| |||||||||||||||
Advisor Class Shares: | ||||||||||||||||
Shares sold | 45,228,686 | $ | 83,056,493 | 70,264,816 | $ | 132,724,723 | ||||||||||
Shares issued in reinvestment of distributions | 5,073,813 | 9,263,388 | 11,359,471 | 21,366,154 | ||||||||||||
Shares redeemed | (73,220,834 | ) | (133,727,000 | ) | (142,324,218 | ) | (268,720,775) | |||||||||
|
| |||||||||||||||
Net increase (decrease) | (22,918,335 | ) | $ | (41,407,119 | ) | (60,699,931 | ) | $ | (114,629,898) | |||||||
|
| |||||||||||||||
aFor the period September 10, 2018 (effective date) to November 30, 2018.
bMay include a portion of Class C shares that were automatically converted to Class A.
cFor the period January 25, 2018 (effective date) to June 8, 2018.
dClass M was closed to investors on June 8, 2018.
franklintempleton.com | Semiannual Report | 31 | ||
FRANKLIN HIGH INCOME TRUST
NOTES TO FINANCIAL STATEMENTS (UNAUDITED)
Franklin High Income Fund(continued)
3. Transactions with Affiliates
Franklin Resources, Inc. is the holding company for various subsidiaries that together are referred to as Franklin Templeton Investments. Certain officers and trustees of the Fund are also officers, and/or directors of the following subsidiaries:
| Subsidiary | Affiliation | |
Franklin Advisers, Inc. (Advisers) | Investment manager | |
Franklin Templeton Services, LLC (FT Services) | Administrative manager | |
Franklin Templeton Distributors, Inc. (Distributors) | Principal underwriter | |
Franklin Templeton Investor Services, LLC (Investor Services) | Transfer agent |
a. Management Fees
The Fund pays an investment management fee to Advisers based on themonth-end net assets of the Fund as follows:
| Annualized Fee Rate | Net Assets | |||
0.625% | Up to and including $100 million | |||
0.500% | Over $100 million, up to and including $250 million | |||
0.450% | Over $250 million, up to and including $7.5 billion | |||
0.440% | Over $7.5 billion, up to and including $10 billion | |||
0.430% | Over $10 billion, up to and including $12.5 billion | |||
0.420% | Over $12.5 billion, up to and including $15 billion | |||
0.400% | Over $15 billion, up to and including $17.5 billion | |||
0.380% | Over $17.5 billion, up to and including $20 billion | |||
0.360% | Over $20 billion, up to and including $35 billion | |||
0.355% | Over $35 billion, up to and including $50 billion | |||
0.350% | In excess of $50 billion |
For the period ended November 30, 2018, the annualized gross effective investment management fee rate was 0.451% of the Fund’s average daily net assets.
b. Administrative Fees
Under an agreement with Advisers, FT Services provides administrative services to the Fund. The fee is paid by Advisers based on the Fund’s average daily net assets, and is not an additional expense of the Fund.
c. Distribution Fees
The Board has adopted distribution plans for each share class, with the exception of Class R6 and Advisor Class shares, pursuant to Rule12b-1 under the 1940 Act. Under the Fund’s Class A and Class A1 reimbursement distribution plans, the Fund reimburses Distributors for costs incurred in connection with the servicing, sale and distribution of the Fund’s shares up to the maximum annual plan rate. Under the Class A and Class A1 reimbursement distribution plans, costs exceeding the maximum for the current plan year cannot be reimbursed in subsequent periods. In addition, under the Fund’s Class C and R compensation distribution plans, the Fund pays Distributors for costs incurred in connection with the servicing, sale and distribution of the Fund’s shares up to the maximum annual plan rate for each class. The plan year, for purposes of monitoring compliance with the maximum annual plan rates, is February 1 through January 31.
32 | Semiannual Report | franklintempleton.com | ||
FRANKLIN HIGH INCOME TRUST
NOTES TO FINANCIAL STATEMENTS (UNAUDITED)
Franklin High Income Fund(continued)
The maximum annual plan rates, based on the average daily net assets, for each class, are as follows:
Class A | 0.25% | |
Class A1 | 0.15% | |
Class C | 0.65% | |
Class R | 0.50% |
d. Sales Charges/Underwriting Agreements
Front-end sales charges and contingent deferred sales charges (CDSC) do not represent expenses of the Fund. These charges are deducted from the proceeds of sales of Fund shares prior to investment or from redemption proceeds prior to remittance, as applicable. Distributors has advised the Fund of the following commission transactions related to the sales and redemptions of the Fund’s shares for the period:
Sales charges retained net of commissions paid to | $97,806 | |
CDSC retained | $12,636 |
Effective September 10, 2018, the Board approved changes to certainfront-end sales charges and dealer commissions on Class A and A1 shares. Further details are disclosed in the Fund’s Prospectus.
e. Transfer Agent Fees
Each class of shares pays transfer agent fees to Investor Services for its performance of shareholder servicing obligations. The fees are based on an annualized asset based fee of 0.02% plus a transaction based fee. In addition, each class reimburses Investor Services for out of pocket expenses incurred and, except for Class R6 reimburses shareholder servicing fees paid to third parties. These fees are allocated daily based upon their relative proportion of such classes’ aggregate net assets. Class R6 pays Investor Services transfer agent fees specific to that class.
For the period ended November 30, 2018, the Fund paid transfer agent fees of $2,334,673, of which $983,030 was retained by Investor Services.
f. Investments in Affiliated Management Investment Companies
The Fund invests in one or more affiliated management investment companies for purposes other than exercising a controlling influence over the management or policies. Management fees paid by the Fund are waived on assets invested in the affiliated management investment companies, as noted in the Statement of Operations, in an amount not to exceed the management and administrative fees paid directly or indirectly by each affiliate. During the period ended November 30, 2018, the Fund held investments in affiliated management investment companies as follows:
| Number of Shares Held at Beginning of Period | Gross Additions | Gross Reductions | Number of Shares Held at End of Period | Value at End of Period | Dividend Income | Realized Gain (Loss) | Net Change in Unrealized Appreciation (Depreciation) | |||||||||||||||||||||||||
Non-Controlled Affiliates | ||||||||||||||||||||||||||||||||
Institutional Fiduciary Trust Money Market Portfolio, 1.91% | 71,126,554 | 390,863,031 | (401,327,576 | ) | 60,662,009 | $ | 60,662,009 | $ | 833,127 | $ — | $ — | |||||||||||||||||||||
|
| |||||||||||||||||||||||||||||||
g. Waiver and Expense Reimbursements
Investor Services has contractually agreed in advance to waive or limit its fees so that the Class R6 transfer agent fees do not exceed 0.03% based on the average net assets of the class until September 30, 2019.
franklintempleton.com | Semiannual Report | 33 | ||
FRANKLIN HIGH INCOME TRUST
NOTES TO FINANCIAL STATEMENTS (UNAUDITED)
Franklin High Income Fund(continued)
4. Expense Offset Arrangement
The Fund has entered into an arrangement with its custodian whereby credits realized as a result of uninvested cash balances are used to reduce a portion of the Fund’s custodian expenses. During the period ended November 30, 2018, the custodian fees were reduced as noted in the Statement of Operations.
5. Income Taxes
For tax purposes, capital losses may be carried over to offset future capital gains.
At May 31, 2018, capital loss carryforwards were as follows:
Capital loss carryforwards not subject to expiration: | ||||
Short Term | $ | 4,117,122 | ||
Long Term | 624,508,259 | |||
|
| |||
Total capital loss carryforwards |
$ |
628,625,381 |
| |
|
|
At November 30, 2018, the cost of investments, net unrealized appreciation (depreciation) for income tax purposes were as follows:
Cost of investments | $ | 3,280,438,623 | ||
|
| |||
Unrealized appreciation | $ | 37,878,687 | ||
Unrealized depreciation | (339,056,841 | ) | ||
|
| |||
Net unrealized appreciation (depreciation) |
$ |
(301,178,154 |
) | |
|
| |||
Differences between income and/or capital gains as determined on a book basis and a tax basis are primarily due to differing treatments of defaulted securities and bond discounts and premiums.
6. Investment Transactions
Purchases and sales of investments (excluding short term securities) for the period ended November 30, 2018, aggregated $224,443,875 and $485,918,106, respectively.
7. Credit Risk and Defaulted Securities
At November 30, 2018, the Fund had 93.1% of its portfolio invested in high yield or other securities rated below investment grade and unrated securities, if any. These securities may be more sensitive to economic conditions causing greater price volatility and are potentially subject to a greater risk of loss due to default than higher rated securities.
The Fund held a defaulted security and/or other securities for which the income has been deemed uncollectible. At November 30, 2018, the value of this security represents less than 0.1% of the Fund’s net assets. The Fund discontinues accruing income on securities for which income has been deemed uncollectible and provides an estimate for losses on interest receivable. The security has been identified in the accompanying Statement of Investments.
8. Restricted Securities
The Fund invests in securities that are restricted under the Securities Act of 1933 (1933 Act). Restricted securities are often purchased in private placement transactions, and cannot be sold without prior registration unless the sale is pursuant to an exemption under the 1933 Act. Disposal of these securities may require greater effort and expense, and prompt sale at an acceptable price may be difficult. The Fund may have registration rights for restricted securities. The issuer generally incurs all registration costs.
34 | Semiannual Report | franklintempleton.com | ||
FRANKLIN HIGH INCOME TRUST
NOTES TO FINANCIAL STATEMENTS (UNAUDITED)
Franklin High Income Fund(continued)
At November 30, 2018, investments in restricted securities, excluding securities exempt from registration under the 1933 Act deemed to be liquid, were as follows:
| Shares/ Warrants | Issuer | Acquisition Date | Cost | Value | ||||||||||||
| 124,561 | Energy XXI Gulf Coast Inc., wts., 12/30/21 | 12/03/10 - 12/30/16 | $ | — | $ | — | ||||||||||
| 8,080 | Nine Point Energy Holdings Inc., cvt. pfd. | 3/24/17 | 7,552,087 | 9,765,152 | ||||||||||||
| 433,273 | Nine Point Energy LLC | 7/15/14 - 2/01/18 | 18,779,777 | 1,052,779 | ||||||||||||
|
| |||||||||||||||
Total Restricted Securities(Value is 0.4% of Net Assets) | $ | 26,331,864 | $ | 10,817,931 | ||||||||||||
|
| |||||||||||||||
9. Holdings of 5% Voting Securities of Portfolio Companies
The 1940 Act defines “affiliated companies” to include investments in portfolio companies in which a fund owns 5% or more of the outstanding voting securities. During the period ended November 30, 2018, investments in “affiliated companies” were as follows:
| Name of Issuer | Number of Shares/ Principal Amount Held at Beginning of Period | Gross Additions | Gross Reductions | Number of Shares/ Principal Amount Held at End of Period | Value at End of Period | Investment Income | Realized Gain (Loss) | Net Change in Unrealized Appreciation (Depreciation) | ||||||||||||||||||||||||
Non-Controlled Affiliates |
| |||||||||||||||||||||||||||||||
| Dividends | ||||||||||||||||||||||||||||||||
|
| |||||||||||||||||||||||||||||||
Goodrich Petroleum Corp. | 1,564,885 | — | — | 1,564,885 | $ | 22,565,642 | $ — | $ — | $2,269,084 | |||||||||||||||||||||||
Titan Energy LLC | 289,137 | — | — | 289,137 | 187,939 | — | — | (127,220 | ) | |||||||||||||||||||||||
|
| |||||||||||||||||||||||||||||||
| $ | 22,753,581 | $ — | $ — | $2,141,864 | ||||||||||||||||||||||||||||
|
| |||||||||||||||||||||||||||||||
| Interest | ||||||||||||||||||||||||||||||||
|
| |||||||||||||||||||||||||||||||
Goodrich Petroleum Corp., senior secured note, second lien, PIK, 13.50%, 8/30/19 | 1,829,041 | 691,814 | a | — | 2,520,855 | 2,615,509 | 146,057 | — | (25,580 | ) | ||||||||||||||||||||||
Goodrich Petroleum Corp., senior secured note, second lien, PIK, cvt., 13.50%, 8/30/19 | 8,250,000 | — | — | 8,250,000 | 8,564,210 | 556,875 | — | (535,174 | ) | |||||||||||||||||||||||
|
| |||||||||||||||||||||||||||||||
| $ | 11,179,719 | $702,932 | $ — | $ (560,754 | ) | |||||||||||||||||||||||||||
|
| |||||||||||||||||||||||||||||||
Total Affiliated Securities(Value is 1.1% of Net Assets) |
| $ | 33,933,300 | $702,932 | $ — | $1,581,110 | ||||||||||||||||||||||||||
|
| |||||||||||||||||||||||||||||||
aGross addition was the result of various corporate actions.
10. Credit Facility
The Fund, together with other U.S. registered and foreign investment funds (collectively, Borrowers), managed by Franklin Templeton Investments, are borrowers in a joint syndicated senior unsecured credit facility totaling $2 billion (Global Credit Facility) which matures on February 8, 2019. This Global Credit Facility provides a source of funds to the Borrowers for temporary and emergency purposes, including the ability to meet future unanticipated or unusually large redemption requests.
Under the terms of the Global Credit Facility, the Fund shall, in addition to interest charged on any borrowings made by the Fund and other costs incurred by the Fund, pay its share of fees and expenses incurred in connection with the implementation and maintenance of the Global Credit Facility, based upon its relative share of the aggregate net assets of all of the Borrowers, including an annual commitment fee of 0.15% based upon the unused portion of the Global Credit Facility. These fees are reflected in other expenses in the Statement of Operations. During the period ended November 30, 2018, the Fund did not use the Global Credit Facility.
franklintempleton.com | Semiannual Report | 35 | ||
FRANKLIN HIGH INCOME TRUST
NOTES TO FINANCIAL STATEMENTS (UNAUDITED)
Franklin High Income Fund(continued)
11. Fair Value Measurements
The Fund follows a fair value hierarchy that distinguishes between market data obtained from independent sources (observable inputs) and the Fund’s own market assumptions (unobservable inputs). These inputs are used in determining the value of the Fund’s financial instruments and are summarized in the following fair value hierarchy:
| • | Level 1 – quoted prices in active markets for identical financial instruments |
| • | Level 2 – other significant observable inputs (including quoted prices for similar financial instruments, interest rates, prepayment speed, credit risk, etc.) |
| • | Level 3 – significant unobservable inputs (including the Fund’s own assumptions in determining the fair value of financial instruments) |
The input levels are not necessarily an indication of the risk or liquidity associated with financial instruments at that level.
A summary of inputs used as of November 30, 2018, in valuing the Fund’s assets carried at fair value, is as follows:
| Level 1 | Level 2 | Level 3 | Total | |||||||||||||
| ||||||||||||||||
Assets: | ||||||||||||||||
Investments in Securities:a | ||||||||||||||||
Energy | $ | 34,838,006 | $ | 15,594,793 | $ | 10,819,203 | c | $ | 61,252,002 | |||||||
All Other Equity Investments | 7,050,172 | — | — | 7,050,172 | ||||||||||||
Convertible Bonds | — | 8,564,210 | — | 8,564,210 | ||||||||||||
Corporate Bonds: | ||||||||||||||||
Commercial & Professional Services | — | 64,828,000 | 905 | 64,828,905 | ||||||||||||
Energy | — | 397,863,249 | 2,615,509 | 400,478,758 | ||||||||||||
All Other Corporate Bonds | — | 2,376,099,413 | — | 2,376,099,413 | ||||||||||||
Escrows and Litigation Trusts | — | 325,000 | — | c | 325,000 | |||||||||||
Short Term Investments | 60,662,009 | — | — | 60,662,009 | ||||||||||||
|
| |||||||||||||||
Total Investments in Securities | $ | 102,550,187 | $ | 2,863,274,665 | $ | 13,435,617 | $ | 2,979,260,469 | ||||||||
|
| |||||||||||||||
aFor detailed categories, see the accompanying Statement of Investments.
bIncludes common and convertible preferred stocks as well as other equity interests.
cIncludes securities determined to have no value at November 30, 2018.
A reconciliation of assets in which Level 3 inputs are used in determining fair value is presented when there are significant Level 3 financial instruments at the end of the year.
12. New Accounting Pronouncements
In March 2017, the Financial Accounting Standards Board issued Accounting Standards Update (ASU)No. 2017-08, Receivables—Nonrefundable Fees and Other Costs (Subtopic310-20): Premium Amortization on Purchased Callable Debt Securities. The amendments in the ASU shorten the amortization period for certain callable debt securities acquired at a premium, to be amortized to the earliest call date. The ASU does not require an accounting change for securities acquired at a discount, which continues to be amortized to maturity. The ASU is effective for fiscal years and interim periods within those fiscal years beginning after December 15, 2018. Management has reviewed the requirements and believes the adoption of this ASU will not have a material impact on the financial statements.
36 | Semiannual Report | franklintempleton.com | ||
FRANKLIN HIGH INCOME TRUST
NOTES TO FINANCIAL STATEMENTS (UNAUDITED)
Franklin High Income Fund(continued)
13. Subsequent Events
The Fund has evaluated subsequent events through the issuance of the financial statements and determined that no events have occurred that require disclosure.
Abbreviations
| Currency | Selected Portfolio | |||||||
| USD United States Dollar | FRN | Floating Rate Note | ||||||
| LIBOR | London InterBank Offered Rate | |||||||
| PIK | Payment-In-Kind | |||||||
franklintempleton.com | Semiannual Report | 37 | ||
FRANKLIN HIGH INCOME TRUST
FRANKLIN HIGH INCOME FUND
Proxy Voting Policies and Procedures
The Fund’s investment manager has established Proxy Voting Policies and Procedures (Policies) that the Fund uses to determine how to vote proxies relating to portfolio securities. Shareholders may view the Fund’s complete Policies online at franklintempleton.com. Alternatively, shareholders may request copies of the Policies free of charge by calling the Proxy Group collect at (954)527-7678 or by sending a written request to: Franklin Templeton Companies, LLC, 300 S.E. 2nd Street, Fort Lauderdale, FL 33301, Attention: Proxy Group. Copies of the Fund’s proxy voting records are also made available online at franklintempleton.com and posted on the U.S. Securities and Exchange Commission’s website at sec.gov and reflect the most recent12-month period ended June 30.
Quarterly Statement of Investments
The Trust, on behalf of the Fund, files a complete statement of investments with the U.S. Securities and Exchange Commission for the first and third quarters for each fiscal year on FormN-Q. Shareholders may view the filed FormN-Q by visiting the Commission’s website at sec.gov. The filed form may also be viewed and copied at the Commission’s Public Reference Room in Washington, DC. Information regarding the operations of the Public Reference Room may be obtained by calling(800) SEC-0330.
38 | Semiannual Report | franklintempleton.com | ||
This page intentionally left blank.
This page intentionally left blank.
 | Semiannual Report and Shareholder Letter
Investment Manager Franklin Advisers, Inc.
Distributor Franklin Templeton Distributors, Inc. (800) DIAL BEN® /342-5236 franklintempleton.com
Shareholder Services (800)632-2301 |
Authorized for distribution only when accompanied or preceded by a summary prospectus and/or prospectus. Investors should carefully consider a fund’s investment goals, risks, charges and expenses before investing. A prospectus contains this and other information; please read it carefully before investing.
To help ensure we provide you with quality service, all calls to and from our service areas are monitored and/or recorded.
| © 2018-2019 Franklin Templeton Investments. All rights reserved. | 1105 S 01/19 | |||
Item 2. Code of Ethics.
(a) The Registrant has adopted a code of ethics that applies to its principal executive officers and principal financial and accounting officer.
(c) N/A
(d) N/A
(f) Pursuant to Item 12(a)(1), the Registrant is attaching as an exhibit a copy of its code of ethics that applies to its principal executive officers and principal financial and accounting officer.
Item 3. Audit Committee Financial Expert.
(a)(1) The Registrant has an audit committee financial expert serving on its audit committee.
(2) The audit committee financial expert is John B. Wilson and he is “independent” as defined under the relevant Securities and Exchange Commission Rules and Releases.
| Item 4. Principal Accountant Fees and Services. | N/A | |
| Item 5. Audit Committee of Listed Registrants. | N/A | |
| Item 6. Schedule of Investments. | N/A | |
| Item 7. Disclosure of Proxy Voting Policies and Procedures forClosed-End Management Investment Companies. | N/A | |
| Item 8. Portfolio Managers ofClosed-End Management Investment Companies. | N/A | |
| Item 9. Purchases of Equity Securities byClosed-End Management Investment Company and Affiliated Purchasers. | N/A | |
Item 10. Submission of Matters to a Vote of Security Holders.
There have been no changes to the procedures by which shareholders may recommend nominees to the Registrant’s Board of Trustees that would require disclosure herein.
Item 11. Controls and Procedures.
(a)Evaluation of Disclosure Controls and Procedures. The Registrant maintains disclosure controls and procedures that are designed to
provide reasonable assurance that information required to be disclosed in the Registrant’s filings under the Securities Exchange Act of 1934, as amended, and the Investment Company Act of 1940 is recorded, processed, summarized and reported within the periods specified in the rules and forms of the Securities and Exchange Commission. Such information is accumulated and communicated to the Registrant’s management, including its principal executive officer and principal financial officer, as appropriate, to allow timely decisions regarding required disclosure. The Registrant’s management, including the principal executive officer and the principal financial officer, recognizes that any set of controls and procedures, no matter how well designed and operated, can provide only reasonable assurance of achieving the desired control objectives.
Within 90 days prior to the filing date of this Shareholder Report onForm N-CSR, the Registrant had carried out an evaluation, under the supervision and with the participation of the Registrant’s management, including the Registrant’s principal executive officer and the Registrant’s principal financial officer, of the effectiveness of the design and operation of the Registrant’s disclosure controls and procedures. Based on such evaluation, the Registrant’s principal executive officer and principal financial officer concluded that the Registrant’s disclosure controls and procedures are effective.
(b)Changes in Internal Controls. There have been no changes in the Registrant’s internal control over financial reporting that occurred during the period covered by this report that has materially affected, or is reasonably likely to materially affect the internal control over financial reporting.
Item 12. Disclosure of Securities Lending Activities forClosed-End Management Investment Company. N/A
Item 13. Exhibits.
(a) (1) Code of Ethics
(a) (2) Certifications pursuant to Section 302 of the Sarbanes-Oxley Act of 2002 of Matthew T. Hinkle, Chief Executive Officer – Finance and Administration, and Gaston Gardey, Chief Financial Officer and Chief Accounting Officer
(b) Certifications pursuant to Section 906 of the Sarbanes-Oxley Act of 2002 of Matthew T. Hinkle, Chief Executive Officer – Finance and Administration, and Gaston Gardey, Chief Financial Officer and Chief Accounting Officer
SIGNATURES
Pursuant to the requirements of the Securities Exchange Act of 1934 and the Investment Company Act of 1940, the registrant has duly caused this report to be signed on its behalf by the undersigned, thereunto duly authorized.
FRANKLIN HIGH INCOME TRUST
| By | /s/ Matthew T. Hinkle | |
Matthew T. Hinkle | ||
Chief Executive Officer – | ||
Finance and Administration | ||
| Date | January 24, 2019 |
Pursuant to the requirements of the Securities Exchange Act of 1934 and the Investment Company Act of 1940, this report has been signed below by the following persons on behalf of the registrant and in the capacities and on the dates indicated.
| By | /s/ Matthew T. Hinkle | |
Matthew T. Hinkle | ||
Chief Executive Officer – | ||
Finance and Administration | ||
| Date | January 24, 2019 |
| By | /s/ Gaston Gardey | |
Gaston Gardey | ||
Chief Financial Officer and | ||
Chief Accounting Officer | ||
| Date | January 24, 2019 | |