UNITED STATES
SECURITIES AND EXCHANGE COMMISSION
Washington, D.C. 20549
FORM N-CSR
CERTIFIED SHAREHOLDER REPORT OF REGISTERED
MANAGEMENT INVESTMENT COMPANIES
Investment Company Act file number 811-02884
Barrett Opportunity Fund, Inc.
(Exact name of registrant as specified in charter)
90 Park Avenue
New York, NY 10016
(Address of principal executive offices) (Zip code)
Peter Shriver
90 Park Avenue
New York, NY 10016
(Name and address of agent for service)
(212) 983-5080
Registrant's telephone number, including area code
Date of fiscal year end: August 31
Date of reporting period: August 31, 2011
Item 1. Reports to Stockholders.
August 31, 2011
| INVESTMENT PRODUCTS: NOT FDIC INSURED • NO BANK GUARANTEE • MAY LOSE VALUE |
BARRETT
OPPORTUNITY FUND, INC.
Annual Report • August 31, 2011
| Fund Objectives | The Fund seeks to achieve above average long-term capital appreciation. Current income is a secondary objective. The Fund invests primarily in common stocks and securities convertible into or exchangeable for common stock such as convertible preferred stock or convertible debt securities. |
| What’s Inside | Letter from the Chairperson | 1 |
| | Manager Overview | 2 |
| | Fund at a Glance | 5 |
| | Fund Expenses | 6 |
| | Historical Performance | 7 |
| | Schedule of Investments | 8 |
| | Statement of Assets and Liabilities | 10 |
| | Statement of Operations | 11 |
| | Statements of Changes in Net Assets | 12 |
| | Financial Highlights | 13 |
| | Notes to Financial Statements | 14 |
| | Report of Independent Registered Public Accounting Firm | 22 |
| | Additional Information | 23 |
| | Important Tax Information | 25 |
| | | |
OPPORTUNITY FUND, INC.
Letter from the
Chairperson
Dear Shareholder,
We are pleased to provide the annual report of Barrett Opportunity Fund, Inc. (“the Fund”) for the 12 month period ended August 31, 2011.
The management team at Barrett Asset Management, LLC has prepared the enclosed Manager’s Overview, which includes a brief market overview, as well as a performance review. I urge you to read it as well as the accompanying financial statements. A detailed summary of the Fund’s performance and other pertinent information are also included in this report. I am sure you will find this report informative and useful.
On behalf of the Directors and officers of the Fund, and in these difficult economic times, I thank you for your ongoing confidence in the Fund and its investment policies.
Sincerely,
Rosalind A Kochman
Chairperson
September 30, 2011
Special Shareholder Notice
On December 6, 2010, Legg Mason, Inc. (“Legg Mason”), Barrett Associates and Barrett Asset Management, LLC (“Barrett Asset Management”) signed a definitive agreement under which Barrett Associates and its parent company, Legg Mason, agreed to sell substantially all of the property and assets of Barrett Associates to Barrett Asset Management, a newly-formed company controlled by the management team of Barrett Associates. The transaction was subject to certain regulatory approvals, as well as other customary conditions to closing. The transaction closed on April 29, 2011.
Under the Investment Company Act of 1940, consummation of the transaction resulted in the automatic termination of Barrett Opportunity Fund, Inc.’s investment management contract with Barrett Associates. Therefore, the Fund’s Board was asked to approve a new investment management arrangement between the Fund and Barrett Asset Management. In February 2011, the Board approved new investment advisory, distribution and other service provider agreements for the Fund. The new investment advisory agreement with Barrett Asset Management was approved by shareholders on April 28, 2011.
The portfolio managers responsible for managing the Fund’s assets did not change as a result of the transaction.
BARRETT
OPPORTUNITY FUND, INC.
| Manager | Market Overview |
| Overview | The United States stock market stood out among other global indices by advancing strongly over the past twelve months. Following a one hundred percent gain from the market bottom in March of 2009, global stock markets are once again trying to shake off the effects of the debt excesses that were built up over the prior decade. |
| | The United States in 2008 was the center of a financial crisis brought on by extreme real estate debt and overleveraged financial institutions. During the long economic expansion of the 1990s, consumers borrowed heavily on their credit cards and home equity lines, and also took out more auto loans and mortgages. Financial institutions became comfortable with carrying high debt relative to their capital. This increased use of credit was not unique to the United States. European countries, including Spain, Ireland, and Greece, also showed very little restraint. The financial crisis that emanated from the U.S. financial institutions was also felt in the weaker institutions of Europe, particularly in the U.K. and in unexpected places such as Iceland. Now, the global financial community is laser focused on European countries, such as Greece and Italy, and anxiously watching as the European Central Bank, the International Monetary Fund (“IMF”), and national political leaders attempt to weave a safety net for these countries and the banks that own their bonds. Many stock investors have a sense of déjà vu remembering vividly how quickly and severely the U.S. financial crisis unfolded. European and Asian markets have declined even more recently and are largely unchanged from a year ago. |
| | |
| | The stock markets have not only been troubled by the sovereign debt issues that have come to the fore in Europe, but also by the unusually slow, tepid economic recovery in the United States. When measured versus the prior ten recessions in the United States, going back to the 1950s, this recovery from the recession trough is weaker than almost all by every measure. Employment and disposable income growth, as well as personal consumption, are all recovering at unusually slow rates. Once again, this reflects a multitude of headwinds: the weak balance sheets of individuals, which have been hurt by falling house values; high unemployment; tightened lending standards by banks; lack of confidence by business leaders, and the acrimonious nature of our political climate. The housing market has been in decline for five years and while the descent is not over, it appears closer to the end than to the beginning. Despite the long list of negatives, it is unlikely that the U.S. is about to enter a recession similar to the 2008 experience. In fact, although this recovery will probably remain subpar by historical standards, it is likely to continue. A few positive factors to support the recovery are that auto sales have bottomed and are moving up as drivers replace their old, high mileage cars with new ones. We also note that commodity prices have turned down and interest rates are so low that homeowners with sufficient equity are refinancing again. |
| | |
| | With respect to Europe, we expect the situation in Greece to reach a boiling point before year end. Despite the complexity of getting differing countries with varying political pressures and finances to reach a consensus, the European Central Bank will |
OPPORTUNITY FUND, INC.
| | likely not stand by as depositors withdraw their money and banks stop lending to one another for fear of not getting their capital back. In the end, we expect a resolution that will involve a greater restructuring of Greek debt coincident with capital infusions into key banks in France and Germany. There are many financial options that the European Central Bank, the European Financial Stability Fund, and the IMF can employ to limit the contagious effect a Greek restructuring might have on other countries such as Italy and Spain. The complexity of arriving at an acceptable political agreement is the key step to reaching a resolution. |
| | |
| | Lost in the concerns about a double dip recession, political stalemates, and banking crises is the excellent operating performance of U.S. companies. Large, global companies are flush with ready money. During the period that consumers and governments took on record debt, corporations did not. Sitting on record levels of cash, many companies have decided to significantly raise their dividends. In a stock market with unprecedented levels of volatility, higher dividends have gone largely unnoticed. However, at current levels, as of October 17, 2011, the dividend yield of 2.5% on the S&P 500 exceeds the yield of 2.2% on the 10 year U.S. Treasury bond and nearly matches the 3.2% yield on the 30 year bond. Sooner or later, investors will wake up to the attractive yields in the market as well as the likelihood of substantial dividend hikes in the future. |
| | |
| | Portfolio and Performance Review |
| | |
| | During the twelve month period ended August 31, 2011, the Fund’s total return was 11.07%. The Fund underperformed the Lipper Large Cap Value Fund Index, which returned 13.81% over the same period, and the S&P 500, which returned 18.50%, over the past year primarily due to the performance of two holdings, Bank of New York Mellon and Philips Electronics. The financial sector, of which Bank of New York Mellon is a part, was the only sector of the market to post a negative return over the past 12 months. Fortunately, the Fund’s other major holdings in the financial sector, Chubb Corporation, Forest City Enterprises, Leucadia National and Rayonier, were strong absolute performers. Also adding to positive performance were Royal Dutch, General Dynamics, Alexander & Baldwin, Hershey Foods, Omnicom Group, Procter & Gamble, and Automatic Data Processing. One of the best performers during the year was Ameron, which was the subject of an acquisition offer at a healthy premium. Among the laggards for the period was Philips Electronics which was affected by the weaker economic environment in Europe, which is their base of operations. |
| | |
| | Without a doubt, the stock market is confronted with an array of challenges, including slower global growth, financial distress in Europe, and political paralysis in the United States. Nonetheless, corporations have produced strong earnings and higher dividends. The yield on the Fund is higher than the S&P 500 yield and the ten year U.S. treasury yield. We believe the market valuation is reasonable by almost all metrics. We think the Fund’s holdings are well positioned to grow despite the sluggish global economic environment. |
OPPORTUNITY FUND, INC.
| | Thank you for your continued interest in the Fund. |
| | |
| | Sincerely, |
| | | |
| |  |  |
| | | |
| | Robert Milnamow | E. Wells Beck, CFA |
| | Portfolio Manager | Portfolio Manager |
| | September 30, 2011 | |
| | |
| | Past performance is not a guarantee of future results.
The outlook, views and opinions presented are those of Barrett Asset Management, LLC (“Barrett” or the “Adviser”) as of August 31, 2011. These are not intended to be a forecast of future events, a guarantee of future results, or investment advice.
Must be preceded or accompanied by a prospectus.
The Fund is non-diversified, which means that it can invest a higher percentage of its assets in any one issuer. Investing in a non-diversified fund may entail greater risks than is normally associated with more widely diversified funds. The Fund may use derivatives, such as options and futures, which can be illiquid, may disproportionately increase losses, and have a potentially large impact on fund performance. Investing in foreign securities is subject to certain risks not associated with domestic investing, such as currency fluctuations, and changes in political and economic conditions. These risks are magnified in emerging or developing markets. The Fund may use leverage, which may adversely impact performance. Investments in debt securities typically decrease when interest rates rise. These risks are greater for longer-term debt securities.
Lipper Large-Cap Value Funds Index includes funds that, by portfolio practice, invest at least 75% of their equity assets in companies with market capitalizations (on a three-year weighted basis) above Lipper’s U.S. Diversified Equity large-cap floor. The S&P 500® Index is a market-value weighted index comprised of 500 widely held common stocks. It is not possible to invest directly in the Index.
Fund holdings and sector allocations are subject to change and should not be considered a recommendation to buy or sell any security. For a complete list of portfolio holdings, please refer the Schedule of Investments provided in this report. |
| | | |
BARRETT
OPPORTUNITY FUND, INC.
Fund at a Glance (Unaudited)
| Top Ten Holdings - as of 8/31/2011 |
| (As a percentage of Total Investments) |
| Chubb Corp. 18.9% |
| Royal Dutch Shell PLC - Class A - ADR | 16.2% |
| Bank of New York Mellon Corp. | 9.9% |
| General Dynamics Corp. | 9.5% |
| Koninklijke Philips Electronics N.V. | 8.6% |
| Murphy Oil Corp. | 7.3% |
| Leucadia National Corp. | 5.9% |
| Rayonier, Inc. | 5.8% |
| Ameron International Corp. | 5.2% |
| Forest City Enterprises, Inc. - Class B | 2.4% |
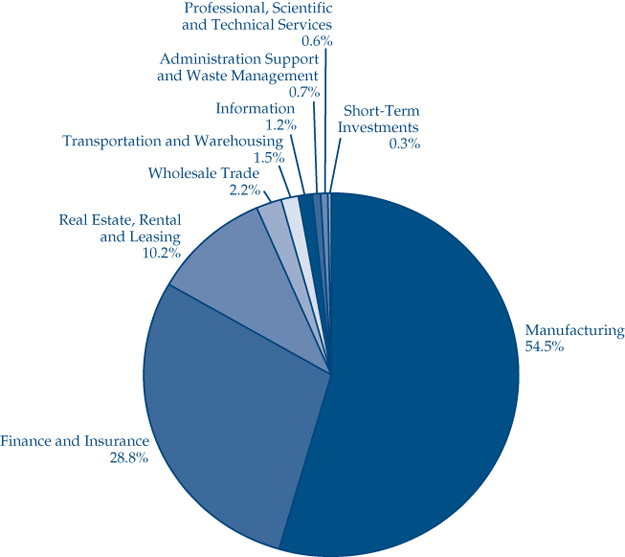
| Sector Weightings - as of 8/31/2011 |
| (As a percentage of Total Investments) |
| |
| |
 |
| |
BARRETT
OPPORTUNITY FUND, INC.
Fund Expenses (Unaudited)
Example
As a shareholder of the Fund, you may incur two types of costs: (1) transaction costs; and (2) ongoing costs, including management fees and other Fund expenses. This example is intended to help you understand your ongoing costs (in dollars) of investing in the Fund and to compare these costs with the ongoing costs of investing in other mutual funds.
This example is based on an investment of $1,000 invested on March 1, 2011 and held for the six months ended August 31, 2011.
Actual Expenses
The table below titled “Based on Actual Total Return” provides information about actual account values and actual expenses. You may use the information provided in this table, together with the amount you invested, to estimate the expenses that you paid over the period. To estimate the expenses you paid on your account, divide your ending account value by $1,000 (for example, an $8,600 ending account value divided by $1,000 = 8.6), then multiply the result by the number under the heading entitled “Expenses Paid During the Period”.
Hypothetical Example for Comparison Purposes
The table below titled “Based on Hypothetical Total Return” provides information about hypothetical account values and hypothetical expenses based on the actual expense ratio and an assumed rate of return of 5.00% per year before expenses, which is not the Fund’s actual return. The hypothetical account values and expenses may not be used to estimate the actual ending account balance or expenses you paid for the period. You may use the information provided in this table to compare the ongoing costs of investing in the Fund and other funds. To do so, compare the 5.00% hypothetical example relating to the Fund with the 5.00% hypothetical examples that appear in the shareholder reports of the other funds.
Please note that the expenses shown in the table below are meant to highlight your ongoing costs only and do not reflect any transactional costs. Therefore, the table is useful in comparing ongoing costs only, and will not help you determine the relative total costs of owning different funds. In addition, if these transaction costs were included, your costs would have been higher.
| | | | | | | | | Expenses Paid | |
| | | Beginning | | | Ending | | | During the Period* | |
| | | Account | | | Account | | | March 1, 2011 to | |
| | | Value | | | Value | | | August 31, 2011 | |
| Actual Barrett Opportunity Fund, Inc. Expenses | | $ | 1,000.00 | | | $ | 866.50 | | | $ | 5.36 | |
| Hypothetical Expenses | | | | | | | | | | | | |
| (5% return per year before expenses) | | $ | 1,000.00 | | | $ | 1,019.46 | | | $ | 5.80 | |
| * | Expenses are equal to the Fund’s annualized six-month expense ratio of 1.14% (which reflects fee waivers in place during the period), multiplied by the average account value over the period, multiplied by 184/365 (to reflect the one-half year period). |
As a result of a change in service providers, the expense ratio for the six-month period ended August 31, 2011 was higher than the expense ratio for the fiscal year. Therefore, this ratio noted above does not coincide with the annual rate disclosed in the financial highlights portion of the financial statements.
OPPORTUNITY FUND, INC.
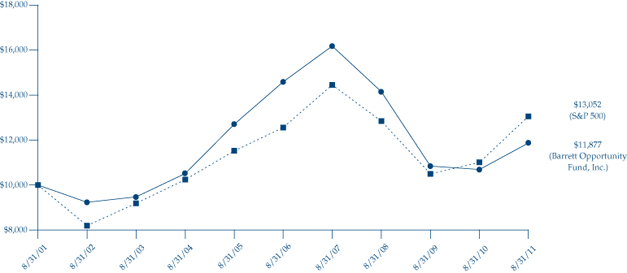
Historical Performance (Unaudited)
Value of $10,000 Invested in Barrett Opportunity Fund, Inc. vs.
the S&P 500® Index† (August 2001 – August 2011)
| † | Hypothetical illustration of $10,000 invested in Barrett Opportunity Fund, Inc. on August 31, 2001 assuming the reinvestment of all distributions, including returns of capital, if any, at net asset value through August 31, 2011. The S&P 500® Index is a market-value weighted index comprised of 500 widely held common stocks. The Index is unmanaged and it is not subject to the same management and trading expenses of a mutual fund. Please note that an investor cannot invest directly in an index. |
All figures represent past performance and are not a guarantee of future results. Investment returns and principal value of an investment will fluctuate so that an investor’s shares, when redeemed, may be worth more or less than their original cost. The returns shown do not reflect the deduction of taxes that a shareholder would pay on Fund distributions or the redemption of Fund shares. Performance figures may reflect compensating balance arrangements, fee waivers and/or expense reimbursements. In the absence of compensating balance arrangements, fee waivers and/or expense reimbursements, the total return would have been lower.
Fund Performance
Average Annual Total Returns1 (Unaudited)
| | | | | Since |
| | 12 Months | 5 Years | 10 Years | Inception |
| Barrett Opportunity Fund, Inc. | 11.07% | -4.03% | 1.74% | 10.79% |
| S&P 500 Index | 18.50% | 0.78% | 2.70% | 11.29% |
| 1 | Assumes the reinvestment of all distributions at net asset value. All figures represent past performance and are not a guarantee of future results. Investment return and principal value of an investment will fluctuate so that an investor’s shares, when redeemed, may be worth more or less than their original cost. Performance figures may reflect compensating balance arrangements, fee waivers and/or expense reimbursements. In the absence of compensating balance arrangements, fee waivers and/or expense reimbursements, the total return would have been lower. |
OPPORTUNITY FUND, INC.
Schedule of Investments
August 31, 2011
| Shares | | | | Value | |
| | | COMMON STOCKS - 93.80% | | | |
| | | Advertising Agencies - 0.62% | | | |
| | 9,800 | | Omnicom Group, Inc. | | $ | 397,390 | |
| | | | | | | | |
| | | | Chemical Manufacturing - 2.17% | | | | |
| | 20,242 | | Monsanto Co. | | | 1,395,281 | |
| | | | | | | | |
| | | | Computer and Electronic | | | | |
| | | | Product Manufacturing - 9.48% | | | | |
| | 7,000 | | 3M Co. | | | 580,860 | |
| | 260,210 | | Koninklijke Philips Electronics | | | | |
| | | | NV - NY Registered Shares | | | 5,508,646 | |
| | | | | | | 6,089,506 | |
| | | | Credit Intermediation and | | | | |
| | | | Related Activities - 9.91% | | | | |
| | 307,971 | | Bank of New York Mellon Corp. | | | 6,365,761 | |
| | | | | | | | |
| | | | Data Processing, Hosting | | | | |
| | | | and Related Services - 1.17% | | | | |
| | 15,000 | | Automatic Data Processing, Inc. | | | 750,450 | |
| | | | | | | | |
| | | | Food and Beverage Stores - 0.00% | | | | |
| | 96,000 | | FHC Delaware, Inc. (a)(b)(c) | | | — | |
| | | | | | | | |
| | | | Food Manufacturing - 0.91% | | | | |
| | 10,000 | | The Hershey Co. | | | 586,500 | |
| | | | | | | | |
| | | | Insurance Carriers and | | | | |
| | | | Related Activities - 18.83% | | | | |
| | 195,500 | | Chubb Corp. | | | 12,099,495 | |
| | | | | | | | |
| | | | Petroleum and Coal Products | | | | |
| | | | Manufacturing - 28.67% | | | | |
| | 39,500 | | Ameron International, Inc. | | | 3,338,145 | |
| | 87,300 | | Murphy Oil Corp. | | | 4,677,534 | |
| | 155,100 | | Royal Dutch Shell PLC - | | | | |
| | | | Class A - ADR | | | 10,399,455 | |
| | | | | | | 18,415,134 | |
| | | | | | | | |
| | | | Real Estate - 4.44% | | | | |
| | 100,400 | | Forest City Enterprises, | | | | |
| | | | Inc. - Class A (a) | | | 1,334,316 | |
| | 112,500 | | Forest City Enterprises, | | | | |
| | | | Inc. - Class B (a)(d) | | | 1,515,375 | |
| | | | | | | 2,849,691 | |
| | | | Transportation Equipment | | | | |
| | | | Manufacturing - 9.51% | | | | |
| | 95,300 | | General Dynamics Corp. | | | 6,106,824 | |
| | | | | | | | |
| | | | Waste Management and | | | | |
| | | | Remediation Services - 0.73% | | | | |
| | 93,850 | | TRC Cos., Inc. (a) | | | 472,065 | |
| | | | | | | | |
| | | | Water Transportation - 1.51% | | | | |
| | 22,800 | | Alexander & Baldwin, Inc. | | | 967,404 | |
| | | | | | | | |
| | | | Wood Product Manufacturing - 5.85% | | | | |
| | 126,800 | | Leucadia National Corp. | | | 3,757,084 | |
| | | | Total Common Stocks | | | | |
| | | | (Cost $7,447,516) | | | 60,252,585 | |
| | | | | | | | |
| | | | REAL ESTATE INVESTMENT | | | | |
| | | | TRUSTS (REITs) - 5.78% | | | | |
| | | | Real Estate - 5.78% | | | | |
| | 88,485 | | Rayonier, Inc. | | | 3,711,061 | |
| | | | Total Real Estate Investment | | | | |
| | | | Trusts (Cost $853,173) | | | 3,711,061 | |
The accompanying notes are an integral part of these financial statements.
OPPORTUNITY FUND, INC.
Schedule of Investments
August 31, 2011
| Shares | | | | Value | |
| | | SHORT-TERM | | | |
| | | INVESTMENTS - 0.30% | | | |
| | | Money Market Funds - 0.30% | | | |
| | 195,616 | | Fidelity Institutional Money | | | |
| | | | Market Fund - Government | | | |
| | | | Portfolio - Class I, 0.01% (e) | | $ | 195,616 | |
| | | | | | | | |
| | | | Total Short-Term Investments | | | | |
| | | | (Cost $195,616) | | | 195,616 | |
| | | | | | | | |
| | | | Total Investments | | | | |
| | | | (Cost $8,496,305) - 99.88% | | | 64,159,262 | |
| | | | Other Assets in Excess | | | | |
| | | | of Liabilities - 0.12% | | | 78,607 | |
| | | | | | | | |
| | | | Total Net Assets - 100.00% | | $ | 64,237,869 | |
Percentages are stated as a percent of net assets.
ADR - American Depository Receipt
| (a) | Non-income producing security. |
| (c) | Security is valued by management in good faith at fair value in accordance with procedures approved by the Board of Directors. |
| (d) | Convertible into Forest City Enterprises, Inc. - Class A shares on a 1 to 1 conversion by the shareholder at any time. |
| (e) | Variable rate security. The rate listed is as of August 31, 2011. |
The accompanying notes are an integral part of these financial statements.
OPPORTUNITY FUND, INC.
Statement of Assets & Liabilities
August 31, 2011
| ASSETS: | | | |
| Investments, at value (cost $8,496,305) | | $ | 64,159,262 | |
| Dividends and interest receivable | | | 149,233 | |
| Receivable for fund shares sold | | | 450 | |
| Other assets | | | 30,666 | |
| Total assets | | | 64,339,611 | |
| | | | | |
| LIABILITIES: | | | | |
| Payable to adviser | | | 34,822 | |
| Other accrued expenses | | | 66,920 | |
| Total liabilities | | | 101,742 | |
| | | | | |
| NET ASSETS | | $ | 64,237,869 | |
| | | | | |
| NET ASSETS CONSIST OF: | | | | |
| Capital stock | | $ | 5,888,797 | |
| Accumulated undistributed net investment income | | | 351,089 | |
| Accumulated undistributed net realized gain | | | 2,335,026 | |
| Net unrealized appreciation on investments | | | 55,662,957 | |
| Total net assets | | $ | 64,237,869 | |
| | | | | |
| Shares outstanding | | | 2,015,635 | |
| Net asset value, offering price and redemption price | | | | |
| per share (15,000,000 shares authorized, $0.01 par value) | | $ | 31.87 | |
The accompanying notes are an integral part of these financial statements.
OPPORTUNITY FUND, INC.
Statement of Operations
Year Ended August 31, 2011
| INVESTMENT INCOME: | | | |
| Dividend income* | | $ | 1,733,346 | |
| Interest income | | | 42 | |
| | | | 1,733,388 | |
| EXPENSES: | | | | |
| Investment advisory fees (Note 2) | | | 524,799 | |
| Legal fees | | | 70,408 | |
| Directors’ fees and expenses | | | 56,919 | |
| Reports to shareholders | | | 34,693 | |
| Federal and state registration fees | | | 24,997 | |
| Transfer agent fees and expenses | | | 33,021 | |
| Audit and tax fees | | | 19,534 | |
| Administration fees | | | 15,900 | |
| Fund accounting fees | | | 10,572 | |
| Custody fees | | | 1,953 | |
| Other | | | 8,207 | |
| Total expenses | | | 801,003 | |
| Less: Fees waived by adviser (Note 2) | | | (11,799 | ) |
| Net expenses | | | 789,204 | |
| Net investment income | | | 944,184 | |
| | | | | |
| REALIZED AND UNREALIZED GAIN ON INVESTMENTS: | | | | |
| Net realized gain on investments | | | 2,523,311 | |
| Change in net unrealized appreciation on investments | | | 3,962,451 | |
| Net realized and unrealized gain on investments | | | 6,485,762 | |
| NET INCREASE IN NET ASSETS RESULTING FROM OPERATIONS | | $ | 7,429,946 | |
| * | Net of $121,604 of foreign taxes withheld. |
The accompanying notes are an integral part of these financial statements.
OPPORTUNITY FUND, INC.
Statements of Changes in Net Assets
| | | Year Ended | | | Year Ended | |
| | | August 31, 2011 | | | August 31, 2010 | |
| OPERATIONS: | | | | | | |
| Net investment income | | $ | 944,184 | | | $ | 799,572 | |
| Net realized gain on investments | | | 2,523,311 | | | | 3,656,284 | |
| Change in net unrealized appreciation (depreciation) | | | | | | | | |
| on investments | | | 3,962,451 | | | | (5,120,732 | ) |
| Net increase (decrease) in net assets resulting from operations | | | 7,429,946 | | | | (664,876 | ) |
| | | | | | | | | |
| DIVIDENDS AND DISTRIBUTIONS TO SHAREHOLDERS: | | | | | | | | |
| Net investment income | | | (900,000 | ) | | | (1,000,003 | ) |
| Net realized gain on investments | | | (3,569,540 | ) | | | (2,850,011 | ) |
| Total dividends and distributions | | | (4,469,540 | ) | | | (3,850,014 | ) |
| | | | | | | | | |
| CAPITAL SHARE TRANSACTIONS: | | | | | | | | |
| Shares sold | | | 81,838 | | | | 103,345 | |
| Shares issued in reinvestment of dividends | | | 2,660,712 | | | | 2,241,652 | |
| Shares redeemed | | | (4,502,965 | ) | | | (4,442,673 | ) |
| Net (decrease) in net assets from capital share transactions | | | (1,760,415 | ) | | | (2,097,676 | ) |
| | | | | | | | | |
| TOTAL INCREASE (DECREASE) IN NET ASSETS | | | 1,199,991 | | | | (6,612,566 | ) |
| | | | | | | | | |
| NET ASSETS: | | | | | | | | |
| Beginning of year | | | 63,037,878 | | | | 69,650,444 | |
| End of year (including accumulated undistributed net | | | | | | | | |
| investment income of $351,089 and $306,905, respectively) | | $ | 64,237,869 | | | $ | 63,037,878 | |
The accompanying notes are an integral part of these financial statements.
OPPORTUNITY FUND, INC.
Financial Highlights
Per share data for a share of capital stock outstanding throughout each year.
| | | Year Ended August 31, | |
| | | 2011 | | | 2010 | | | 2009 | | | 2008 | | | 2007 | |
| Per Share Data: | | | | | | | | | | | | | | | |
| Net asset value, beginning of year | | $ | 30.53 | | | $ | 32.72 | | | $ | 50.14 | | | $ | 60.62 | | | $ | 56.71 | |
| | | | | | | | | | | | | | | | | | | | | |
| Income (loss) from investment operations: | | | | | | | | | | | | | | | | | | | | |
| Net investment income | | | 0.47 | | | | 0.39 | | | | 0.49 | | | | 0.48 | | | | 0.45 | |
| Net realized and unrealized | | | | | | | | | | | | | | | | | | | | |
| gain (loss) on investments | | | 3.09 | | | | (0.74 | ) | | | (13.02 | ) | | | (7.55 | ) | | | 5.67 | |
| Total from investment operations | | | 3.56 | | | | (0.35 | ) | | | (12.53 | ) | | | (7.07 | ) | | | 6.12 | |
| | | | | | | | | | | | | | | | | | | | | |
| Less distributions from: | | | | | | | | | | | | | | | | | | | | |
| Net investment income | | | (0.44 | ) | | | (0.48 | ) | | | (0.59 | ) | | | (0.37 | ) | | | (0.35 | ) |
| Net realized gain on investments | | | (1.78 | ) | | | (1.36 | ) | | | (4.30 | ) | | | (3.04 | ) | | | (1.86 | ) |
| Total distributions | | | (2.22 | ) | | | (1.84 | ) | | | (4.89 | ) | | | (3.41 | ) | | | (2.21 | ) |
| | | | | | | | | | | | | | | | | | | | | |
| Net asset value, end of year | | $ | 31.87 | | | $ | 30.53 | | | $ | 32.72 | | | $ | 50.14 | | | $ | 60.62 | |
| | | | | | | | | | | | | | | | | | | | | |
Total return1 | | | 11.07 | % | | | (1.38 | )% | | | (23.37 | )% | | | (12.55 | )% | | | 10.92 | % |
| | | | | | | | | | | | | | | | | | | | | |
| Supplemental data and ratios: | | | | | | | | | | | | | | | | | | | | |
| Net assets, end of year (000,000’s) | | $ | 64 | | | $ | 63 | | | $ | 70 | | | $ | 114 | | | $ | 148 | |
| Ratio of net expenses | | | | | | | | | | | | | | | | | | | | |
| to average net assets | | | 1.10 | %2 | | | 1.20 | % | | | 1.31 | % | | | 1.03 | % | | | 1.01 | % |
| Ratio of net investment income | | | | | | | | | | | | | | | | | | | | |
| to average net assets | | | 1.32 | %2 | | | 1.15 | % | | | 1.50 | % | | | 0.83 | % | | | 0.70 | % |
| Portfolio turnover rate | | | 0 | % | | | 3 | % | | | 0 | %3,4 | | | 3 | %3 | | | 6 | % |
| 1 | Performance figures may reflect compensating balance arrangements, fee waivers and/or expense reimbursements. In the absence of these compensating balance arrangements, fee waivers and/or expense reimbursements, the total returns would have been lower. |
| 2 | Such percentages are after advisory fee waiver. Effective April 29, 2011, the adviser voluntarily agreed to waive a portion of its advisory fee, equal to 0.02% of average net assets. In the absence of these waivers; ratio of net expenses to average net assets would be higher by 0.02% and the ratio of net investment income to average net assets would be lower by 0.02%. |
| 3 | Excludes the value of portfolio securities delivered as a result of in-kind redemptions of Fund’s capital shares. |
| 4 | Amount represents less than 1%. |
The accompanying notes are an integral part of these financial statements.
OPPORTUNITY FUND, INC.
Notes to Financial Statements
| 1. ORGANIZATION | Barrett Opportunity Fund, Inc. (the “Fund”), a Maryland corporation organized in 1978, is registered as a non-diversified, open-end management investment company under the Investment Company Act of 1940, as amended (the “1940 Act”). The Fund’s investment objective is to achieve above average long-term capital appreciation. The following are significant accounting policies consistently followed by the Fund and are in conformity with generally accepted accounting principles (“GAAP”) in the United States of America. |
| AND |
| SIGNIFICANT |
| ACCOUNTING |
| POLICIES |
| |
| |
| | Equity securities, including common stocks and REITs, for which market quotations are available are valued at the last reported sales price or official closing price on the primary market or exchange on which they trade. Debt securities are valued at the mean between the last quoted bid and asked prices provided by an independent pricing service, which are based on transactions in debt obligations, quotations from bond dealers, market transactions in comparable securities and various other relationships between securities. Short-term obligations with maturities of 60 days or less are valued at amortized cost, which approximates fair value. |
| | |
| | Redeemable securities issued by open-end, registered investment companies, including money market funds, are valued at the net asset value (“NAV”) of such companies for purchase and/or redemption orders placed on that day. |
| | |
| | When prices are not readily available, or are determined not to reflect fair value, such as when the value of a security has been significantly affected by events after the close of the exchange or market on which the security is principally traded, but before the Fund calculates its net asset value, the Fund values these securities at fair value as determined in accordance with procedures approved by the Fund’s Board of Directors. |
| | |
| | The Fund uses valuation techniques to measure fair value that are consistent with the market approach and/or income approach, depending on the type of the security and the particular circumstance. The market approach uses prices and other relevant information generated by market transactions involving identical or comparable securities. The income approach uses valuation techniques to discount estimated future cash flows to present value. |
| | |
| | Financial Accounting Standards Board (“FASB”) Accounting Standards Codification, “Fair Value Measurements and Disclosures” Topic 820 (“ASC Topic 820”), establishes a single definition of fair value, creates a three-tier hierarchy as a framework for measuring fair value based on inputs used to value the Fund’s investments, and requires additional disclosure about fair value. The hierarchy of inputs is summarized below. |
OPPORTUNITY FUND, INC.
| | • Level 1 – | quoted prices in active markets for identical investments |
| | • Level 2 – | other significant observable inputs (including quoted prices for similar investments, interest rates, prepayment speeds, credit risk, etc.) |
| | • Level 3 – | significant unobservable inputs (including the Fund’s own assumptions in determining the fair value of investments) |
| | Inputs refer broadly to the assumptions that market participants use to make valuation decisions, including assumptions about risk. Inputs may include price information, volatility statistics, specific and broad credit data, liquidity statistics, and other factors. A financial instrument’s level within the fair value hierarchy is based on the lowest level of input that is significant to the fair value measurement. However, the determination of what constitutes “observable” requires significant judgment by the Fund. The Fund considers observable data to be that market data which is readily available, regularly distributed or updated, reliable and verifiable, not proprietary, and provided by independent sources that are actively involved in the relevant market. The categorization of a financial instrument within the hierarchy is based upon the pricing transparency of the instrument and does not necessarily correspond to the Fund’s perceived risk of that instrument. |
| | |
| | Investments whose values are based on quoted market prices in active markets include active listed equities, REITs and certain money market securities, and are classified within Level 1. Investments that trade in markets that are not considered to be active, but are valued based on quoted market prices, dealer quotations or alternative pricing sources supported by observable inputs, are classified within Level 2. Investments classified within Level 3 have significant unobservable inputs, as they trade infrequently or not at all. |
| | |
| | The Fund held one Level 3 security as of August 31, 2011. As a result of the portfolio company’s declaration of bankruptcy, this security no longer trades; however, it is maintained in the Fund’s records because of possible receipt of money by the Fund as a result of the bankruptcy litigation. The potential for receipt of litigation proceeds is remote. |
| | |
| | The following is a summary of the inputs used in valuing the Fund’s assets carried at fair value as of August 31, 2011. The inputs and methodologies used to value securities may not be an indication of the risk associated with investing in these securities. |
| | |
OPPORTUNITY FUND, INC.
| | | | | | | Other | | | | | | | |
| | | | | | | Significant | | | Significant | | | | |
| | | | Quoted | | | Observable | | | Unobservable | | | | |
| | | | Prices | | | Inputs | | | Inputs | | | | |
| | Description | | (Level 1) | | | (Level 2) | | | (Level 3) | | | Total | |
| | Common Stocks† | | $ | 60,252,585 | | | $ | — | | | $ | 0 | * | | $ | 60,252,585 | |
| | REITs | | | 3,711,061 | | | | — | | | | — | | | | 3,711,061 | |
| | Money Market Funds | | | 195,616 | | | | — | | | | — | | | | 195,616 | |
| | Total Investments | | $ | 64,159,262 | | | $ | — | | | $ | 0 | * | | $ | 64,159,262 | |
| | | | | | | | | | | | | | | | | | |
| | † See Schedule of Investments for additional industry classifications. | | | | | | | | | | | | |
| | * Value is less than $1. | | | | | | | | | | | | | | | | |
| | The Fund did not hold any Level 3 securities during the fiscal year other than the holding discussed above, which was fair valued at $0 for the entire fiscal year. The Fund did not purchase or sell any Level 3 investments during the fiscal year. |
| | |
| | There were no transfers of securities between levels during the reporting period. It is the Fund’s policy to record transfers between levels as of the end of the reporting period. The Fund did not hold any derivative instruments during the reporting period. |
| | |
| | (b) Repurchase Agreements |
| | |
| | The Fund may enter into repurchase agreements with institutions that its investment adviser has determined are creditworthy. Each repurchase agreement is recorded at cost. Under the terms of a typical repurchase agreement, the Fund acquires a debt security subject to an obligation of the seller to repurchase, and of the Fund to resell, the security at an agreed-upon price and time, thereby determining the yield during the Fund’s holding period. When entering into repurchase agreements, it is the Fund’s policy that its custodian or a third party custodian, acting on the Fund’s behalf, take possession of the underlying collateral securities, the market value of which, at all times, at least equals the principal amount of the repurchase transaction, including accrued interest. To the extent that any repurchase transaction maturity exceeds one business day, the value of the collateral is marked to market and measured against the value of the agreement in an effort to ensure the adequacy of the collateral. If the counterparty defaults, the Fund generally has the right to use the collateral to satisfy the terms of the repurchase transaction. However, if the market value of the collateral declines during the period in which the Fund seeks to assert its rights or if bankruptcy proceedings are commenced with respect to the seller of the security, realization of the collateral by the Fund may be delayed or limited. The Fund did not hold repurchase agreements at August 31, 2011. |
| | |
| | (c) Security Transactions and Investment Income |
| | |
| | Security transactions are accounted for on a trade date basis. Interest income, adjusted for amortization of premium and accretion of discount, is recorded on |
OPPORTUNITY FUND, INC.
| | the accrual basis. Dividend income is recorded on the ex-dividend date. Under applicable tax laws, a withholding tax may be imposed on interest, dividends and capital gains at various rates. The cost of investments sold is determined by use of the specific identification method for computing the gain/loss on the transaction. To the extent any issuer defaults or a credit event occurs that impacts the issuer, the Fund may halt any additional interest income accruals and consider the realizability of interest accrued up to the date of default or credit event. |
| | |
| | (d) Distributions to Shareholders |
| | |
| | The Fund will distribute any net investment income and any net realized long or short-term capital gains at least annually. Distributions from net realized gains for book purposes may include short-term capital gains. All short-term capital gains are included in ordinary income for tax purposes. Distributions to shareholders are recorded on the ex-dividend date. The Fund may also pay a special distribution at the end of the calendar year to comply with federal tax requirements. |
| | |
| | (e) REIT Distributions |
| | |
| | The character of distributions received from REITs held by the Fund is generally comprised of net investment income, capital gains, and return of capital. It is the policy of the Fund to estimate the character of distributions received from underlying REITs based on historical data provided by the REITs. After each calendar year end, REITs report the actual tax character of these distributions. Differences between the estimated and actual amounts reported by the REITs are reflected in the Fund’s records in the year in which they are reported by the REITs by adjusting related investment cost basis, capital gains and income, as necessary. |
| | |
| | (f) Federal Income Taxes |
| | |
| | It is the Fund’s policy to comply with the federal income and excise tax requirements of subchapter M of the Internal Revenue Code of 1986, as amended (the “Code”), necessary to qualify as a regulated investment company. Accordingly, the Fund intends to distribute its taxable income and net realized gains, if any, to shareholders in accordance with timing requirements imposed by the Code. Therefore, no federal income tax provision is provided in the Fund’s financial statements. |
| | |
| | As of and during the year ended August 31, 2011, the Fund did not have a liability of any unrecognized tax benefits. The Fund recognizes interest and penalties, in any, related to uncertain tax benefits as income tax expense in the Statement of Operations. During the period, the Fund did not incur any interest or penalties. The Fund is not subject to examination by U.S. taxing authorities for tax periods prior to 2007. |
OPPORTUNITY FUND, INC.
| | (g) Use of Estimates |
| | |
| | The preparation of financial statements in conformity with GAAP requires management to make estimates and assumptions that affect the reported amounts of assets and liabilities and disclosure of contingent assets and liabilities at the date of the financial statements and the reported amounts of revenues and expenses during the reporting period. Actual results could differ from those estimates. |
| 2. INVESTMENT | Effective April 29, 2011, Barrett Asset Management, LLC (“Barrett”) became the Fund’s investment adviser. Under the Investment Advisory |
| ADVISER | Agreement, the Fund pays an advisory fee, calculated daily and paid monthly, in accordance with the following breakpoint | |
| AGREEMENT | schedule: | |
| AND OTHER | | |
| TRANSACTIONS | Average Daily Net Assets | Annual Rate |
| | First $1 billion | 0.700% |
| | | 0.675% |
| | Next $3 billion | 0.650% |
| | Next $5 billion | 0.625% |
| | Over $10 billion | 0.600% |
| | In addition, Barrett has voluntarily agreed to reduce its investment advisory fee by an additional 0.05% through April 29, 2012, which is not subject to recoupment by Barrett. For the fiscal year ended August 31, 2011, this advisory fee totaled $165,181. During the year ended August 31, 2011, Barrett voluntarily waived $11,799 of its advisory fee. Such waivers are not subject to recoupment. |
| | |
| | Prior to April 29, 2011, Barrett Associates, Inc. (“Barrett Associates”) was the Fund’s investment adviser. Barrett Associates was a wholly-owned subsidiary of Legg Mason, Inc. (“Legg Mason”), a financial services holding company. Under the Management Agreement between the Fund and Barrett Associates, the Fund paid an investment advisory fee, calculated daily and paid monthly, in accordance with the following breakpoint schedule: |
| | Average Daily Net Assets | Annual Rate |
| | First $1 billion | 0.750% |
| | Next $1 billion | 0.725% |
| | Next $3 billion | 0.700% |
| | Next $5 billion | 0.675% |
| | Over $10 billion | 0.650% |
| | During the year ended August 31, 2011 this advisory fee totaled $359,618. Prior to April 29, 2011, Legg Mason Partners Fund Advisor, LLC (“LMPFA”) served as the sub-administrator of the Fund, providing certain administrative services to the Fund pursuant to a sub-administration agreement between Barrett Associates and LMPFA. LMPFA is an affiliate of Legg Mason and Barrett Associates. Barrett Associates, and not the Fund, paid LMPFA for its services as |
OPPORTUNITY FUND, INC.
| | sub-administrator. Also, prior to April 29, 2011, Legg Mason Investor Services, LLC, a wholly-owned broker-dealer subsidiary of Legg Mason, served as the Fund’s sole and exclusive distributor. |
| | |
| | The officers of the Fund are also officers and employees of Barrett and do not receive compensation from the Fund. |
| | |
| 3. INVESTMENTS | During the year ended August 31, 2011, the aggregate cost of purchases and proceeds from sales of investments (excluding short-term investments) were as follows: |
| | | Purchases | | Sales |
| | | $0 | | $4,581,064 |
4. CAPITAL SHARES | At August 31, 2011, the Fund had 15,000,000 shares of capital stock authorized with a par value of $0.01 per share. Transactions in shares of the Fund were as follows: |
| | | | Year Ended | | | Year Ended | |
| | | | August 31, 2011 | | | August 31, 2010 | |
| | Shares sold | | | 2,333 | | | | 3,117 | |
| | Shares issued on reinvestment | | | 76,567 | | | | 69,315 | |
| | Shares redeemed | | | (127,953 | ) | | | (136,595 | ) |
| | Net decrease | | | (49,053 | ) | | | (64,163 | ) |
| 5. INCOME TAX | The tax character of distributions paid during the fiscal years ended August 31, were as follows: | | | | | | | | |
| INFORMATION | | | | | | | | | |
| AND | Distributions Paid From: | | | 2011 | | | | 2010 | |
| DISTRIBUTIONS | Ordinary income | | $ | 900,000 | | | $ | 1,000,003 | |
| TO | Net long-term capital gains | | | 3,569,540 | | | | 2,850,011 | |
| SHAREHOLDERS | Total distributions paid | | $ | 4,469,540 | | | $ | $3,850,014 | |
| | The Fund designated as long-term capital gain dividend, pursuant to Internal Revenue Code Section 852(b)(3), the amount necessary to reduce the earnings and profits of the Fund related to net capital gain to zero for the tax year ended August 31, 2011. The Fund utilized earnings and profits distributed to shareholders on redemption of shares as part of the dividend paid deduction. The amount designated as long-term capital gain for the fiscal year ended August 31, 2011 was $173,810. |
OPPORTUNITY FUND, INC.
| | At August 31, 2011, the aggregate gross unrealized appreciation and depreciation of investments for federal income tax purposes were as follows: | |
| | | | | |
| | Tax cost of investments | | $ | 8,496,305 | |
| | Gross unrealized appreciation | | | 55,899,350 | |
| | Gross unrealized depreciation | | | (236,393 | ) |
| | Net unrealized appreciation | | $ | 55,662,957 | |
| | As of August 31, 2011, the components of accumulated earnings on a tax basis were as follows: | |
| | | | | |
| | Undistributed operating income | | $ | 375,281 | |
| | Undistributed long-term gains | | | 2,335,026 | |
| | Distributable earnings | | | 2,710,307 | |
| | Unrealized appreciation | | | 55,662,957 | |
| | Other accumulated losses* | | | (24,192 | ) |
| | Total accumulated gain | | $ | 58,349,072 | |
| | | | | | |
| | * Other temporary differences are primarily attributable to timing of certain expenses. | | | | |
| | | | | | |
| | GAAP requires that certain components of net assets be reclassified to reflect permanent differences between financial and tax reporting. These reclassifications have no effect on net assets or net asset values per share. During the current year, accumulated net realized gain was decreased by $237,794 and paid-in-capital was increased by $237,794 for permanent book to tax differences. |
| | | | | | |
| 6. LEGAL MATTERS | Beginning in May 2004, class action lawsuits alleging violations of the federal securities laws were filed against Citigroup Global Markets Inc. (“CGM”), a former distributor of the Fund, and other affiliated funds (collectively, the “Funds”) and a number of its then affiliates, including Smith Barney Fund Management LLC (“SBFM”) and Salomon Brothers Asset Management Inc. (“SBAM”), which were then investment adviser or manager to certain of the Funds (collectively the “Managers”), substantially all of the mutual funds then managed by the Managers (the “Defendant Funds”), and Board members of the Defendant Funds (collectively, the “Defendants”). The complaints alleged, among other things, that CGM created various undisclosed incentives for its brokers to sell Smith Barney and Salomon Brothers funds. In addition, according to the complaints, the Managers caused the Defendant Funds to pay excessive brokerage commissions to CGM for steering clients towards proprietary funds. The complaints also alleged that the Defendants breached their fiduciary duty to the Defendant Funds by improperly charging Rule 12b-1 fees and by drawing on fund assets to make undisclosed payments of soft dollars and excessive brokerage commissions. The complaints also alleged that the Defendant Funds failed to adequately disclose certain of the allegedly |
OPPORTUNITY FUND, INC.
| | wrongful conduct. The complaints sought injunctive relief and compensatory and punitive damages, rescission of the Defendant Funds’ contracts with the Managers, recovery of all fees paid to the Managers pursuant to such contracts and an award of attorneys’ fees and litigation expenses. |
| | |
| | On December 15, 2004, a consolidated amended complaint (the “Complaint”) was filed alleging substantially similar causes of action. On May 27, 2005, all of the Defendants filed motions to dismiss the Complaint. On July 26, 2006, the court issued a decision and order (1) finding that plaintiffs lacked standing to sue on behalf of the shareholders of the Funds in which none of the plaintiffs had invested and dismissing those Funds from the case (although stating that they could be brought back into the case if standing as to them could be established), and (2) other than one stayed claim, dismissing all of the causes of action against the remaining Defendants, with prejudice, except for the cause of action under Section 36(b) of the 1940 Act, which the court granted plaintiffs leave to replead as a derivative claim. |
| | |
| | On October 16, 2006, plaintiffs filed their Second Consolidated Amended Complaint (“Second Amended Complaint”) which alleges derivative claims on behalf of nine funds identified in the Second Amended Complaint, under Section 36(b) of the 1940 Act, against Citigroup Asset Management, SBAM and SBFM as investment advisers to the identified funds, as well as CGM as a distributor for the identified funds (collectively, the “Second Amended Complaint Defendants”). The Fund was not identified in the Second Amended Complaint. The Second Amended Complaint alleges no claims against any of the funds or any of their Board Members. Under Section 36(b), the Second Amended Complaint alleges similar facts and seeks similar relief against the Second Amended Complaint Defendants as the Complaint. |
| | |
| | On December 3, 2007, the court granted the Defendants’ motion to dismiss, with prejudice. On January 2, 2008, the plaintiffs filed a notice of appeal to the Second Circuit Court of Appeals. The appeal was fully briefed and oral argument before the U.S. Court of Appeals for the Second Circuit took place on March 5, 2009. |
| | |
| | On June 9, 2011, the Second Circuit ruled, affirming the dismissal of all claims with one exception; the Section 36(b) excessive fee claim, but only as it relates to transfer agent fees. The Defendants are working to provide their counsel with the factual and statistical data they need to move for a dismissal of this one remaining claim. |
| | |
| | On September 30, 2011, Plaintiff’s counsel notified Defendant’s Counsel that Plaintiffs were willing to voluntarily dismiss the case provided that the Defendents made no claim for attorneys fees. Formal paperwork will be drafted to cause the case to be dismissed. This matter has been indemnified by Citigroup. |
OPPORTUNITY FUND, INC.
| REPORT OF | To the Shareholders and Board of Directors of |
| INDEPENDENT | Barrett Opportunity Fund, Inc. |
| REGISTERED | |
| PUBLIC | We have audited the accompanying statement of assets and liabilities, including the schedule of investments, of Barrett Opportunity Fund, Inc. (the |
| ACCOUNTING | “Fund”) as of August 31, 2011, and the related statements of operations and changes in net assets, and the financial highlights for the year then |
| FIRM | ended. These financial statements and financial highlights are the responsibility of Fund management. Our responsibility is to express an opinion on |
| | these financial statements and financial highlights based on our audit. The statement of changes in net assets for the year ended August 31, 2010 and the financial highlights for the years indicated prior to the year ended August 31, 2011, were audited by another independent registered public accounting firm, who expressed unqualified opinions on those statements and financial highlights. |
| | |
| | We conducted our audit in accordance with the standards of the Public Company Accounting Oversight Board (United States). Those standards require that we plan and perform the audit to obtain reasonable assurance about whether the financial statements and financial highlights are free of material misstatement. An audit includes examining, on a test basis, evidence supporting the amounts and disclosures in the financial statements. Our procedures included confirmation of securities owned as of August 31, 2011 by correspondence with the custodian. An audit also includes assessing the accounting principles used and significant estimates made by management, as well as evaluating the overall financial statement presentation. We believe that our audit provides a reasonable basis for our opinion.
In our opinion, the financial statements and financial highlights referred to above present fairly, in all material respects, the financial position of Barrett Opportunity Fund, Inc. as of August 31, 2011, the results of its operations, the changes in its net assets, and its financial highlights for the year then ended, in conformity with accounting principles generally accepted in the United States of America. |
| | |
| | |
| | COHEN FUND AUDIT SERVICES, LTD. |
| | |
| | Westlake, Ohio |
| | |
| | October 28, 2011 |
| | |
| | |
OPPORTUNITY FUND, INC.
Additional Information
(Unaudited)
1. INFORMATION ABOUT DIRECTORS AND OFFICERS
The business and affairs of the Fund are conducted by management under the supervision and subject to the direction of its Board of Directors. The business address of each Director is c/o Barrett Asset Management, LLC, the Fund’s investment manager (“Barrett Asset Management”), 90 Park Avenue, 34th Floor, New York, New York 10016. Information pertaining to the Directors and officers of the Fund is set forth below.
The Statement of Additional Information includes additional information about Directors and is available, without charge, upon request by calling the Fund at 1-877-363-6333.
| | | | | Number of | |
| | | | | Portfolios | |
| | | | | in Fund | Other Board |
| | Position(s) | Term of Office* | | Complex | Memberships |
| Name, Address | Held with | and Length of | Principal Occupation(s) | Overseen | Held by |
| and Birth Year | Fund | Time Served** | During Past 5 Years | by Director | Director |
INDEPENDENT DIRECTORS†: | | | | | |
| Barry Handel, CPA | Director | Since 2005 | Partner, Shalik, Morris & | 1 | None |
| Birth Year: 1951 | | | Company, LLP (accounting | | |
| | | | firm) (since 2010); formerly, | | |
| | | | Partner, Falk & Handel LLP | | |
| | | | (accounting firm) | | |
| | | | | | |
David H. Kochman(1) | Director | Since 2011 | Member, Harris Beach PLLC | 1 | None |
| Birth Year: 1959 | | | (law firm) | | |
| | | | | | |
Rosalind A. Kochman(2) | Director | Since 1990 | Retired (since 2002); formerly, | 1 | None |
| Birth Year: 1937 | | | Chief Executive Officer, | | |
| | Chairperson | Since 2005 | Brooklyn Eye Surgery Center, | | |
| | | | and Administrator, Kochman, | | |
| | | | Lebowitz & Mogil, MDs | | |
| | | | | | |
| William Morris, Jr., CPA | Director | Since 2005 | President, William Morris & | 1 | None |
| Birth Year: 1948 | | | Associates P.C. (accounting | | |
| | | | firm) | | |
| | | | | | |
| Irving Sonnenschein | Director | Since 1994 | Partner in the law firm of | 1 | None |
| Birth Year: 1920 | | | Sonnenschein, Sherman & | | |
| | | | Deutsch | | |
| OFFICERS: | | | | | |
| Peter H. Shriver, CFA | President | Since 2006 | President of Barrett Asset | N/A | N/A |
| Barrett Asset Management | and Chief | | Management (since 2011); | | |
| 90 Park Avenue | Executive | | President of Barrett | | |
| New York, NY 10016 | Officer | | Associates, Inc. (2004-2011) | | |
| Birth Year: 1952 | | | | | |
| (1) | Mr. Kochman is Ms. Kochman’s son. |
| (2) | Ms. Kochman is Mr. Kochman’s mother. |
OPPORTUNITY FUND, INC.
| | | | | Number of | |
| | | | | Portfolios | |
| | | | | in Fund | Other Board |
| | Position(s) | Term of Office* | | Complex | Memberships |
| Name, Address | Held with | and Length of | Principal Occupation(s) | Overseen | Held by |
| and Birth Year | Fund | Time Served** | During Past 5 Years | by Director | Director |
| OFFICERS (Continued): | | | | | |
| E. Wells Beck, CFA | Vice | Since 2010 | Managing Director, Barrett | N/A | N/A |
| Barrett Asset Management | President | | Asset Management (since | | |
| 90 Park Avenue | and | | 2011); Managing Director, | | |
| New York, NY 10016 | Investment | | Barrett Associates (2006-2011); | | |
| Birth Year: 1968 | Officer | | Analyst and Portfolio | | |
| | | | Manager at Haven Capital | | |
| | | | Management (2001-2006) | | |
| | | | | | |
| Robert J. Milnamow | Vice | Since 2006 | Managing Director, Barrett | N/A | N/A |
| Barrett Asset Management | President | | Asset Management (since | | |
| 90 Park Avenue | and | | 2011); Managing Director, | | |
| New York, NY 10016 | Investment | | Barrett Associates (2003-2011) | | |
| Birth Year: 1950 | Officer | | | | |
| | | | | | |
| Madeleine Morreale | Chief | Since 2011 | Chief Compliance Officer, | N/A | N/A |
| Barrett Asset Management | Compliance | | Barrett Asset Management | | |
| 90 Park Avenue | Officer | | (2011-Present); Compliance | | |
| New York, NY 10016 | and | | Officer, Barrett Associates | | |
| Birth Year: 1956 | Anti-Money | | (2010-2011); Head Trader, | | |
| | Laundering | | Barrett Associates | | |
| | Officer | | (2003-2010) | | |
| | | | | | |
| John G. Youngman | Chief | Since 2011 | Managing Director, | N/A | N/A |
| Barrett Asset Management | Financial | | Barrett Asset Management | | |
| 90 Park Avenue | Officer | | (2011-Present); Managing | | |
| New York, NY 10016 | and | | Director, Barrett Associates | | |
| Birth Year: 1968 | Treasurer | | (2010-2011); Managing | | |
| | | | Director, Griffin Asset | | |
| | | | Management (1994-2010) | | |
| † | Directors who are not “interested persons” of the Fund within the meaning of Section 2(a)(19) of the 1940 Act. |
| * | Each Director and officer serves until his respective successor has been duly elected and qualified or until his earlier death, resignation, retirement or removal. |
| ** | Indicates the earliest year in which the Director became a board member or the officer took such office. |
OPPORTUNITY FUND, INC.
2. IMPORTANT TAX INFORMATION (UNAUDITED)
The following information is provided with respect to the distributions paid during the taxable year ended August 31, 2011:
| | |
| Record Date: | 12/21/2010 |
| Payable Date: | 12/22/2011 |
| Ordinary Income: | |
| Qualified Dividend Income for Individuals | 100.00% |
| Dividends Qualifying for the Dividends | |
| Received Deduction for Corporations | 100.00% |
| Long-Term Capital Gain Dividend | $1.77700 |
Please retain this information for your records.
3. CONSIDERATION OF INVESTMENT ADVISORY AGREEMENT (UNAUDITED)
Section 15(c) under the Investment Company Act of 1940, as amended (the “1940 Act”), requires that a registered investment company’s board of directors, including a majority of independent directors voting separately, approve any new investment advisory contract for the fund and thereafter to review and approve the terms of the fund’s investment advisory agreement on an annual basis. In addition, Section 15(a) of the 1940 Act requires that any new investment advisory agreement be approved by the fund’s shareholders.
In reaching its decision to recommend the approval by the Fund’s shareholders of the proposed new investment advisory agreement (the “Investment Advisory Agreement”) with Barrett Asset Management, LLC (the “Investment Adviser”), the Board of Directors of the Fund (the “Board”), including a majority of its members who are not considered to be “interested persons” under the 1940 Act (the “Independent Directors”), met in person at a Special Meeting of the Board held on February 14, 2011 (the “Special Meeting”). To assist the Board in its consideration of the proposed new Investment Advisory Agreement, Barrett Associates, Inc. (the “Existing Manager”) and its affiliates provided a variety of information to the Board about the Investment Adviser as well as the new investment advisory and other service provider arrangements being proposed for the Fund, certain portions of which are discussed below. The Board also received and considered a variety of information relating to the Existing Manager’s management of the Fund at a regularly scheduled meeting held on December 16, 2010 (the “December Meeting”), where, among other things, the Board considered and approved the renewal of the Fund’s existing investment advisory agreement (the “Existing Agreement”) with the Existing Manager for an additional term of one year. At the December Meeting the Adviser informed the Board of their intent to acquire all of the Advisers assets and liabilities from Legg Mason, Inc., (the “Transaction”) and indicated it would seek the Board’s approval of the proposed new Investment Advisory Agreement at a special meeting. (The information provided to the Board relating to the renewal of the Existing Agreement at the December Meeting, together with the information provided to the Board at the Special Meeting, is referred to in this section as the “Contract Approval Information”).
In addition to the Contract Approval Information, the Board received performance and other information throughout the year relating to the Fund’s operations and the services provided to it by the Existing Manager and its affiliates. The Board’s evaluation of the new Investment Advisory Agreement took into account the information received throughout the year and also reflected the knowledge and familiarity gained as Board members of the Fund with respect to the services provided to the Fund by the Existing Manager.
OPPORTUNITY FUND, INC.
In its deliberations regarding the approval of the new Investment Advisory Agreement, the Board considered each of the factors below:
Nature, Extent and Quality of the Investment Advisory Services Provided to the Fund. The Board received and considered the Contract Approval Information regarding the nature, extent and quality of the investment advisory and other services provided to the Fund by the Existing Manager and its affiliates during the past year. The Board also considered the potential impact the Transaction might have on the Investment Adviser’s ability to continue to support the Fund, including the financial resources that would be available to the Investment Adviser.
The Board reviewed the qualifications, backgrounds and responsibilities of the Investment Adviser’s senior personnel and the portfolio management team primarily responsible for the day-to-day management of the Fund’s portfolio and the proposed compliance programs for the new Investment Adviser and the Fund subsequent to completion of the Transaction. Prior to the Special Meeting, the Board expressed its concern regarding the financial resources of the new Investment Adviser. In this regard, it was noted that prior to the Transaction, the Existing Manager has had access to the financial resources of Legg Mason, Inc. (“Legg Mason”) – its ultimate corporate parent – to support its activities in respect of the Fund. While those resources would no longer be available to the Investment Adviser following the Transaction, the Investment Adviser noted that it expected to retain nearly all of its clients and as a result it expected that it would have sufficient revenues, personnel and other resources to support the Fund. Moreover, the Board considered a summary provided by the Investment Adviser of the terms of the asset purchase agreement between the Investment Adviser and Legg Mason, including the consideration that the Investment Adviser has agreed to pay Legg Mason. The Board noted that, as part of this consideration, the Investment Adviser has agreed to make payments to Legg Mason for a period of time based on a share of its revenues from its investment advisory activities (including its advisory activities in respect of the Fund). However, the Board was advised that the financial terms under the contemplated arrangements would be more advantageous to the Investment Adviser than is presently the case under the Existing Manager’s current relationship with Legg Mason. The Board was advised that the reduced financial burden on the Investment Adviser could potentially increase the Investment Adviser’s ability to reinvest in its business following the Transaction. The Board considered the belief expressed by the Investment Adviser that it would have sufficient revenues and other financial resources to support its activities in respect of the Fund.
The Board noted that administrative and other non-advisory services required for the Fund’s operations provided by the Existing Manager and its affiliates under the management agreement between the Fund and the Existing Manager (the “Management Agreement”), would not be provided under the new Investment Advisory Agreement and that, following completion of the Transaction, those services would be provided by U.S. Bancorp and its affiliates under various new service provider arrangements with the Fund. The cost of the administrative services currently provided under the Management Agreement will be borne by the Fund under new agreements with U.S. Bancorp Fund Services (“USBFS”), but the Board noted that these fees would be offset by the reductions and waivers in the advisory fee being proposed by the Investment Adviser. The Board considered the belief expressed by the Investment Adviser that the quality of the services received by the Fund under the new service provider arrangements would be equal to or better than the quality of non-advisory services currently received by the Fund under the Management Agreement. The Board also noted that U.S. Bancorp is a substantial financial institution with significant financial resources.
The Board concluded that, overall, the expected nature, extent and quality of the investment advisory services to be provided to the Fund under the new Investment Advisory Agreement would be adequate under the circumstances.
Fund Performance. At the December Meeting, the Board received and considered performance information and analyses (the “Lipper Performance Information”) for the Fund, as well as for a group of funds (the “Performance Universe”) selected by Lipper, Inc. (“Lipper”), an independent provider of investment company data. The Board was provided with a description of the methodology Lipper used to determine the similarity of the Fund with the
OPPORTUNITY FUND, INC.
funds included in the Performance Universe. The Performance Universe consisted of the Fund and all retail and institutional large cap value funds, as classified by Lipper, regardless of asset size or primary channel of distribution.
The Lipper Performance Information comparing the Fund’s performance to that of the Performance Universe based on net asset value per share showed, among other things, that the Fund’s performance ranked in the fourth quintile of funds in the Performance Universe for the 1-, 5- and 10-year periods ended September 30, 2010, and in the fifth quintile of funds in the Performance Universe for the 3-year period ended September 30, 2010. At its December Meeting, the Board considered the Existing Manager’s explanations for the Fund’s relative underperformance for the 1-, 3- and 10-year periods that the Fund’s overweighting in the financial services sector and underweighting in the technology sector had negative impacts on Fund investment results. The Board also considered the Fund’s performance in relation to its benchmark and in absolute terms. In evaluating the Fund’s performance, the Board noted the adverse market conditions during 2008 and early 2009 and the fact that the Fund’s investment portfolio is managed in a tax-aware manner.
At the Special Meeting, the Board received and considered updated information relating to the Fund’s performance as of January 31, 2011, which showed a slight improvement in the Fund’s performance over the limited period of time covered.
Based on its review of the Fund’s performance and all of the other factors noted above, including the need to provide for continuation of investment advisory services and other services required for operation of the Fund to the Fund, following completion of the Transaction, the Board concluded that, under the circumstances, the Fund’s performance supported approval of the new Investment Advisory Agreement.
Investment Advisory Fees and Expense Ratios. The Board reviewed and considered the advisory fee (the “Advisory Fee”) proposed to be paid by the Fund to the Investment Adviser under the new Investment Advisory Agreement in light of the nature, extent and quality of investment advisory services provided by the Existing Manager under the existing Management Agreement and expected to be provided to the Fund by the Investment Adviser under the new Investment Advisory Agreement.
At its December Meeting, the Board received and considered information and analyses prepared as of September 30, 2010 by Lipper (the “Lipper Expense Information”) comparing the management fee paid by the Fund under the existing Management Contract (the “Management Fee”) and the Fund’s overall expenses for the Fund’s latest fiscal year with those of the funds in the expense universe (the “Expense Group”) selected and provided by Lipper. The comparison was based upon the constituent funds’ latest fiscal years. The Expense Group consisted of the Fund and ten other retail no-load large cap value funds, as classified by Lipper. The eleven funds in the Expense Group had average net assets ranging from $34.2 million to $349.7 million. Six of the Expense Group funds were larger than the Fund and four were smaller.
The Lipper Expense Information comparing the Management Fee as well as the Fund’s actual total expenses to the Fund’s Expense Group showed that the Fund’s contractual management fee was ranked fourth among the funds in the Expense Group. The Lipper Expense Information also showed that the Fund’s actual management fee (i.e., after giving effect to any voluntary fee waivers implemented by managers of the other Expense Group funds) was ranked seventh among the funds in the Expense Group, slightly higher than the median for the Expense Group. The Board noted that the proposed Advisory Fee under the new Investment Advisory Agreement will be 5 basis points lower than the Management Fee, and that, at the request of the Board, the Investment Adviser has voluntarily agreed to waive an additional 5 basis points of its Advisory Fee for a period of one year following the Transaction, but that the Management Fee also has encompassed administrative and other non-investment advisory services required for the Fund’s operations that will not be encompassed by the Advisory Fee.
At the December Meeting, the Board also reviewed information regarding fees charged by the Existing Manager to other U.S. clients investing primarily in an asset class similar to that of the Fund, including, where applicable,
OPPORTUNITY FUND, INC.
separate accounts. The Board was advised that while the fees paid by the Existing Manager’s clients for separate account advisory services are on average lower than the Management Fee and the proposed Advisory Fee, the fees charged to other clients range from higher to lower than the Management Fee and the proposed Advisory Fee depending, among other factors, on the assets under management in the account. The information discussed the significant differences in scope of services provided to the Fund and to these other clients, noting that under the new Investment Advisory Agreement, the Fund will be provided with office facilities and Fund officers (including the Fund’s chief executive, chief financial and chief compliance officers) and that the Investment Adviser will coordinate and oversee the provision of services to the Fund by other fund service providers. The Board considered the fee comparisons in light of the differences required to manage these different types of accounts. The Board also was advised in response to its inquiry at the Special Meeting that the advisory fees charged to the Adviser’s only other mutual fund client are higher than the proposed Advisory Fee but also include an expense limitation agreement. The Investment Adviser advised the Board that, under the circumstances, it would not be able to agree to provide similar expense limitations to the Fund.
The Lipper Expense Information presented to the Board at the December Meeting showed that the Fund’s actual total expenses ranked sixth among the funds in the Expense Group. In explaining the Fund’s actual total expenses, the Existing Manager noted that certain non-asset based expenses represented, and may continue to represent, a higher percentage of total average annual assets because of recent declines in the Fund’s asset level. The Board also noted that the small number of funds in the Expense Group, which included funds varying widely in size, made meaningful comparisons difficult.
The Board identified Fund expenses as another particular area of concern prior to the Special Meeting. At the Special Meeting and in later supplemental information, the Board received and considered financial projections (the “Financial Projections”) estimating the Fund’s annual operating expenses following the Transaction, after taking into account the reduced Advisory Fee under the proposed new Investment Advisory Agreement, the estimated fees that would be charged to the Fund for non-investment advisory services under the first year of the Fund’s new service provider arrangement with U.S. Bancorp, and certain other changes to the Fund’s expense structure that would result from the Fund no longer being a part of the larger Legg Mason funds complex. Comparative information relating to the Fund’s operating expenses for the past three fiscal years also was provided to the Board based on assets at August 31, 2010. The Board noted that the Investment Adviser was proposing a 5 basis point reduction in the Advisory Fee, but that the Financial Projections showed that the Fund’s total operating expenses would be approximately 4 basis points higher than the Fund’s current operating expenses, even after giving effect to that reduction. The Board also noted that the Fund’s total operating expenses for the prior year ended August 31, 2009 had been higher than shown in the Financial Projections. The Board expressed concerns with the projected increase in the Fund’s total operating expenses shown in the Financial Projections, and after further discussions, the Investment Adviser agreed to voluntarily waive an additional 5 basis points of its Advisory Fee for a period of one year following the Transaction. The Board also determined that the new Investment Advisory Agreement should extend for a period of one year, rather than two years as proposed by the Investment Adviser and permitted by law, to provide an opportunity for the Board to monitor expenses actually incurred by the Fund following completion of the Transaction and to consider any available and appropriate actions if actual expenses are significantly greater than projected at the Special Meeting.
Taking all of the above into consideration, the Board determined that the proposed Advisory Fee was acceptable under the circumstances, including most importantly the need to provide continuation of investment advisory and other services required for the Fund’s operations following completion of the Transaction.
Adviser Profitability. At the December Meeting, the Board received an analysis of the profitability of the Existing Manager and its affiliates in providing services to the Fund under the existing Management Agreement. The Board also received profitability information with respect to the Legg Mason fund complex as a whole. In addition, the
OPPORTUNITY FUND, INC.
Board received information with respect to the revenue and cost allocation methodologies used in preparing such profitability data. The Existing Manager noted that its methodologies were reviewed by an outside consultant in 2007 and the Board was assured at the December Meeting that there had been no significant changes in these methodologies since the report was rendered. The profitability analysis presented to the Board at its December Meeting indicated that the arrangements for providing advisory, administrative and other non-advisory services to the Fund pursuant to the Existing Management Contract were unprofitable to the Existing Manager and its affiliates, taken as a whole. At the December Meeting, the Existing Manager acknowledged that the arrangements for providing advisory services only to the Fund were profitable to the Existing Manager as a stand-alone entity.
At the Special Meeting, the Board received and considered a pro forma profitability study analyzing how the profitability study provided to the Board in December would change as a result of the proposed changes to the Fund’s expense structure. The Board noted that the results of this analysis showed that the Investment Adviser would realize a profit from managing the Fund under the proposed new expense structure. The Investment Adviser noted that its profitability under the new Investment Advisory Agreement will be derived only from investment advisory services provided to the Fund while the profitability information presented to the Board at the December Meeting reflected profitability to the Existing Manager and its affiliates from providing not only investment advisory services, but administrative and other non-advisory services encompassed by the Existing Agreement. The Board noted that responsibility for the costs of administrative and all other non-advisory services provided to the Fund pursuant to the Management Agreement, will be borne directly by the Fund following completion of the Transaction pursuant to arrangements between the Fund and new service providers, but that these costs would be offset by the reductions and waivers in the Advisory Fee being proposed by the Investment Adviser. In response to questions from the Board, the Existing Manager advised the Board that, although information regarding its own pre-Transaction profitability from providing investment advisory services under the Existing Management Contract was not available, it would expect that its own profitability under the proposed Investment Advisory Agreement after the Transaction would likely be somewhat less than its profitability as a stand alone entity under the Existing Management Contract.
The Board concluded that the profit margin that the pro forma profitability study suggested that the Investment Adviser would receive under the new Investment Advisory Agreement was not excessive under the circumstances.
Economies of Scale. The Board received and discussed Contract Approval Information concerning whether the Investment Adviser will realize economies of scale if the Fund’s assets grow. It was noted that the assets of the Funds have generally declined in recent years and that, because of limited marketability and distribution efforts, any future increase in assets likely will result from appreciation of the Fund’s investment portfolio rather than sales of additional Fund shares. The Board noted that, according to the Contract Approval Information, the Fund’s contractual Management Fee and actual Management Fee were ranked in the second and third quintiles of funds in the Fund’s Expense Group in the Lipper Expense Information, respectively. In addition, the Board noted that there are reductions in fees at higher Fund asset levels—or “breakpoints”—built into the new Investment Advisory Agreement’s fee schedule, should the assets of the Fund grow. The Board determined that the proposed Advisory Fee structure was appropriate under the present circumstances.
Other Benefits to the Manager. The Board considered other benefits received by the Investment Adviser as a result of its relationship with the Fund, including the opportunity to obtain research services from brokers who effect Fund portfolio transactions, but did not regard such benefits as excessive. The Board also considered the potential benefits that the Investment Adviser and Legg Mason may realize from approval of the new Investment Advisory Agreement and completion of the Transaction.
Other Alternatives to the New Investment Advisory Agreement. The Board considered the uncertainty that investment advisory arrangements for a single, relatively small fund like the Fund would be available other than the proposed investment advisory arrangements with the Investment Adviser and considered the disruptive effects to the Fund of
OPPORTUNITY FUND, INC.
a discontinuance of investment advisory and other services required for the Fund’s operations after completion of the Transaction. The Board was advised by the Existing Manager at the December Meeting that it wished to continue to manage the Fund’s assets following the Transaction, and that it was unlikely that any other affiliates of Legg Mason would consider providing the services received by the Fund under the Existing Management Contract. The Board also considered liquidation of the Fund but concluded that liquidation would result in significant tax consequences—taxable realized capital gains—to many investors, including those who otherwise would have elected to continue their investments in the Fund, and that liquidation under the Fund’s circumstances would not be in the interests of shareholders.
* * * * * *
In light of all of the foregoing and other relevant factors, including most importantly the need to provide for continuation of investment advisory and other services required for the Fund’s operations after completion of the Transaction and the fee reductions being proposed by the Investment Adviser, the Board determined that, under the circumstances, approval of the new Investment Advisory Agreement for an initial period not to exceed one year would be consistent with the best interests of the Fund and its shareholders and voted to approve the new Investment Advisory Agreement and to recommend that it be approved by the Fund’s shareholders.
The principal factor identified by the Board in determining whether to approve the new Investment Advisory Agreement was a need to provide for continuation of investment advisory and other services required for the Fund’s operations following completion of the Transaction. No other single factor reviewed by the Board was identified by the Board as a principal factor in determining whether to approve the new investment Advisory Agreement, and each Board member attributed different weights to the various other factors. The Independent Directors were advised by separate independent counsel throughout the process. Prior to the Special Meeting, the Independent Directors received a memorandum discussing their responsibilities in connection with the proposed approval of the new Investment Advisory Agreement from their independent counsel which was supplemented by his advice and guidance at the Special Meeting. Prior to voting, the Independent Directors also discussed the proposed approval of the new Investment Advisory Agreement in private sessions with their independent legal counsel at which no representatives of the Existing Manager, Investment Adviser or Legg Mason were present.
* * * * * *
The new Investment Advisory Agreement was subsequently approved by Fund shareholders.
4. RESULTS OF A SPECIAL MEETING OF SHAREHOLDERS (UNAUDITED)
A Special Meeting of Shareholders of Barrett Opportunity Fund, Inc. was held on March 30, 2011 (the “Special Meeting”) at the offices of Barrett Associates, Inc., the investment adviser to the Fund. As of the record date, February 18, 2011, there were 2,056,124 shares issued and outstanding and entitled to vote at the Special Meeting. A total of 1,309,219 shares were present in person or by proxy at the Special Meeting.
The purpose of the meeting was to consider and act upon the following proposal:
1.0) To approve an Investment Advisory Agreement between Barrett Asset Management, LLC and the Fund.
The tabulation of the shareholder votes rendered the following results (in shares):
| Proposal | | For | Against | Abstain |
| 1.0 | To Approve an Investment Advisory Agreement | 1,302,495 | 5,261 | 1,464 |
Accordingly, the proposal was approved by the Fund’s shareholders.
OPPORTUNITY FUND, INC.
5. CHANGE IN INDEPENDENT REGISTERED PUBLIC ACCOUNTING FIRM (UNAUDITED)
On February 14, 2011, KPMG LLP (“KPMG”) was dismissed as the independent registered public accounting firm for the Barrett Opportunity Fund, Inc. The opinions of KPMG on the Fund’s financial statements for the fiscal years ended August 31, 2009 and 2010 did not contain an adverse opinion or disclaimer of opinion, nor were they qualified or modified as to uncertainty, audit scope or accounting principles. The decision to replace KPMG was approved by the Audit Committee of the Fund’s Board of Directors and by the Fund’s Board of Directors.
During the two most recent fiscal years and through February 14, 2011, there were no disagreements with KPMG on any matter of accounting principles or practices, financial statement disclosure, or auditing scope or procedure, which disagreements, if not resolved to the satisfaction of KPMG, would have caused KPMG to make reference to the subject matter of the disagreements in connection with its opinions on the financial statements for such years. During the two most recent fiscal years and through February 14, 2011, there were no reportable events of the kind enumerated in paragraphs (1)(v)(A) through (D) of item 304(a) of Regulation S-K.
On February 14, 2011, the Fund’s Board of Directors engaged the firm Cohen Fund Audit Services, Ltd. to serve as the new independent registered public accounting firm to the Fund.
The Fund files its complete schedule of portfolio holdings with the Securities and Exchange Commission (“SEC”) for the first and third quarters of each fiscal year on Form N-Q. The Fund’s Forms N-Q are available on the SEC’s website at www.sec.gov. The Fund’s Forms N-Q may be reviewed and copied at the SEC’s Public Reference Room in Washington, D.C., and information on the operation of the Public Reference Room may be obtained by calling 1-800-SEC-0330. To obtain information on Form N-Q from the Fund, shareholders can call the Fund at 1-877-363-6333.
Information on how the Fund voted proxies relating to portfolio securities during the prior 12-month period ended June 30th of each year and a description of the policies and procedures that the Fund uses to determine how to vote proxies related to portfolio transactions are available (1) without charge, upon request, by calling the Fund at 1-877-363-6333 and (2) on the SEC’s website at www.sec.gov.
OPPORTUNITY FUND, INC.
NOTICE OF PRIVACY POLICY & PRACTICES
We collect non-public personal information about you from the following sources:
•information we receive about you on applications or other forms;
•information you give us orally; and
•information about your transactions with us or others.
We do not disclose any non-public personal information about our shareholders or former shareholders without the shareholder’s authorization, except as permitted by law or in response to inquiries from governmental authorities. We may share information with affiliated parties and unaffiliated third parties with whom we have contracts for servicing the Fund. We will provide unaffiliated third parties with only the information necessary to carry out their assigned responsibility. All shareholder records will be disposed of in accordance with applicable law. We maintain physical, electronic and procedural safeguards to protect your non-public personal information and require third parties to treat your nonpublic personal information with the same high degree of confidentiality.
In the event that you hold shares of the Fund through a financial intermediary, including, but not limited to, a broker-dealer, bank or trust company, the privacy policy of your financial intermediary would govern how your non-public personal information would be shared with unaffiliated third parties.
(This Page Intentionally Left Blank.)
BARRETT OPPORTUNITY FUND, INC.
c/o U.S. Bancorp Fund Services, LLC
615 E. Michigan Street
Milwaukee, WI 53202
DIRECTORS
Barry Handel, CPA
David H. Kochman
Rosalind A. Kochman, Chairperson
William Morris, Jr., CPA
Irving Sonnenschein
INVESTMENT MANAGER
Barrett Asset Management, LLC
90 Park Avenue
New York, NY 10016
ADMINISTRATOR, FUND ACCOUNTANT & TRANSFER AGENT
U.S. Bancorp Fund Services, LLC
615 E. Michigan Street
Milwaukee, WI 53202
DISTRIBUTOR
Quasar Distributors, LLC
615 E. Michigan Street
Milwaukee, WI 53202
CUSTODIAN
U.S. Bank, N.A.
Custody Operations
1555 River Center Drive, Suite 302
Milwaukee, WI 53212
INDEPENDENT REGISTERED PUBLIC ACCOUNTING FIRM
Cohen Fund Audit Services, Ltd.
800 Westpoint Parkway, Suite 1100
Westlake, OH 44145
This report is transmitted to the shareholders of Barrett Opportunity Fund, Inc. for their information. This is not a prospectus, circular or representation intended for use in the purchase of shares of the Fund or any securities mentioned in this report.
This report must be preceded or accompanied by a free prospectus. Investors should consider the Fund’s investment objective, risks, charges and expenses carefully before investing. The prospectus contains this and other important information about the Fund. Please read the prospectus carefully before investing.
Item 2. Code of Ethics.
The registrant has adopted a code of ethics that applies to the registrant’s principal executive officer and principal financial officer. The registrant has not made any amendments to its code of ethics during the period covered by this report. The registrant has not granted any waivers from any provisions of the code of ethics during the period covered by this report. A copy of the registrant’s Code of Ethics is filed herewith.
Item 3. Audit Committee Financial Expert.
The registrant’s board of directors has determined that there is at least one audit committee financial expert serving on its audit committee. Mr. William Morris is the “audit committee financial expert” and is considered to be “independent” as each term is defined in Item 3 of Form N-CSR.
Item 4. Principal Accountant Fees and Services.
The registrant has engaged its principal accountant to perform audit services, audit-related services, tax services and other services during the past two fiscal years. “Audit services” refer to performing an audit of the registrant's annual financial statements or services that are normally provided by the accountant in connection with statutory and regulatory filings or engagements for those fiscal years. “Audit-related services” refer to the assurance and related services by the principal accountant that are reasonably related to the performance of the audit. “Tax services” refer to professional services rendered by the principal accountant for tax compliance, tax advice, and tax planning. The following table details the aggregate fees billed or expected to be billed for each of the last two fiscal years for audit fees, audit-related fees, tax fees and other fees by the principal accountant.
| | FYE 8/31/2011 Cohen Fund Audit Services, Ltd. | FYE 8/31/2010 KPMG LLP |
| Audit Fees | $17,000 | $38,700 |
| Audit-Related Fees | 0 | 0 |
| Tax Fees | 2,500 | 3,400 |
| All Other Fees | 0 | 0 |
The audit committee has adopted pre-approval policies and procedures that require the audit committee to pre-approve all audit and non-audit services of the registrant, including services provided to any entity affiliated with the registrant.
The percentage of fees billed by Cohen Fund Audit Services, Ltd. for the fiscal year ended August 31, 2011 and KPMG LLP for the fiscal year ended August 31, 2010 applicable to non-audit services pursuant to waiver of pre-approval requirement were as follows:
| | FYE 8/31/2011 Cohen Fund Audit Services, Ltd. | FYE 8/31/2010 KPMG LLP |
| Audit-Related Fees | 0% | 0% |
| Tax Fees | 0% | 0% |
| All Other Fees | 0% | 0% |
All of the principal accountant’s hours spent on auditing the registrant’s financial statements were attributed to work performed by full-time permanent employees of the principal accountant. The following table indicates the non-audit fees billed or expected to be billed by the registrant’s accountant for services to the registrant and to the registrant’s investment adviser (and any other controlling entity, etc.—not sub-adviser) for the last two years. The audit committee of the board of directors has considered whether the provision of non-audit services that were rendered to the registrant's investment adviser is compatible with maintaining the principal accountant's independence and has concluded that the provision of such non-audit services by the accountant has not compromised the accountant’s independence.
| Non-Audit Related Fees | FYE 8/31/2011 Cohen Fund Audit Services, Ltd. | FYE 8/31/2010 KPMG LLP |
| Registrant | 0 | 0 |
| Registrant’s Investment Adviser | 0 | 0 |
Item 5. Audit Committee of Listed Registrants.
Not applicable to registrants who are not listed issuers (as defined in Rule 10A-3 under the Securities Exchange Act of 1934).
Item 6. Investments.
Schedule of Investments is included as part of the report to shareholders filed under Item 1 of this Form.
Item 7. Disclosure of Proxy Voting Policies and Procedures for Closed-End Management Investment Companies.
Not applicable to open-end investment companies.
Item 8. Portfolio Managers of Closed-End Management Investment Companies.
Not applicable to open-end investment companies.
Item 9. Purchases of Equity Securities by Closed-End Management Investment Company and Affiliated Purchasers.
Not applicable to open-end investment companies.
Item 10. Submission of Matters to a Vote of Security Holders.
Not Applicable.
Item 11. Controls and Procedures.
| (a) | The Registrant’s President/Chief Executive Officer and Treasurer/Chief Financial Officer have reviewed the Registrant's disclosure controls and procedures (as defined in Rule 30a-3(c) under the Investment Company Act of 1940 (the “Act”)) as of a date within 90 days of the filing of this report, as required by Rule 30a-3(b) under the Act and Rules 13a-15(b) or 15d-15(b) under the Securities Exchange Act of 1934. Based on their review, such officers have concluded that the disclosure controls and procedures are effective in ensuring that information required to be disclosed in this report is appropriately recorded, processed, summarized and reported and made known to them by others within the Registrant and by the Registrant’s service provider. |
| (b) | There were no changes in the Registrant's internal control over financial reporting (as defined in Rule 30a-3(d) under the Act) that occurred during the second fiscal quarter of the period covered by this report that has materially affected, or is reasonably likely to materially affect, the Registrant's internal control over financial reporting. |
Item 12. Exhibits.
| (a) | (1) Any code of ethics or amendment thereto, that is the subject of the disclosure required by Item 2, to the extent that the registrant intends to satisfy Item 2 requirements through filing an exhibit. Filed herewith. |
(2) A separate certification for each principal executive and principal financial officer pursuant to Section 302 of the Sarbanes-Oxley Act of 2002. Filed herewith.
(3) Any written solicitation to purchase securities under Rule 23c-1 under the Act sent or given during the period covered by the report by or on behalf of the registrant to 10 or more persons. Not applicable to open-end investment companies.
| (b) | Certifications pursuant to Section 906 of the Sarbanes-Oxley Act of 2002. Furnished herewith. |
SIGNATURES
Pursuant to the requirements of the Securities Exchange Act of 1934 and the Investment Company Act of 1940, the registrant has duly caused this report to be signed on its behalf by the undersigned, thereunto duly authorized.
(Registrant) Barrett Opportunity Fund, Inc.
By (Signature and Title)* /s/ Peter Shriver
Peter Shriver, President
Date Novermber 1, 2011
Pursuant to the requirements of the Securities Exchange Act of 1934 and the Investment Company Act of 1940, this report has been signed below by the following persons on behalf of the registrant and in the capacities and on the dates indicated.
By (Signature and Title)* /s/ Peter Shriver
Peter Shriver, President
Date November 1, 2011
By (Signature and Title)* /s/ John Youngman
John Youngman, Treasurer
Date November 1, 2011
* Print the name and title of each signing officer under his or her signature.