UNITED STATES
SECURITIES AND EXCHANGE COMMISSION
Washington, D.C. 20549
FORM N-CSR
CERTIFIED SHAREHOLDER REPORT OF REGISTERED
MANAGEMENT INVESTMENT COMPANIES
Investment Company Act file number 811-02884
Barrett Opportunity Fund, Inc.
(Exact name of registrant as specified in charter)
90 Park Avenue
New York, NY 10016
(Address of principal executive offices) (Zip code)
Peter Shriver
90 Park Avenue
New York, NY 10016
(Name and address of agent for service)
(212) 983-5080
Registrant's telephone number, including area code
Date of fiscal year end: August 31
Date of reporting period: August 31, 2012
Item 1. Reports to Stockholders.
August 31, 2012
| INVESTMENT PRODUCTS: NOT FDIC INSURED • NO BANK GUARANTEE • MAY LOSE VALUE |
OPPORTUNITY FUND, INC.
| Annual Report | August 31, 2012 | |
| | | |
| | | |
| | | |
| Fund Objectives | The Fund seeks to achieve above average long-term capital appreciation. Current income is a secondary objective. The Fund invests primarily in common stocks and securities convertible into or exchangeable for common stock such as convertible preferred stock or convertible debt securities. | |
| | | |
| | | |
| What’s Inside | Letter from the Chairperson | 1 |
| | Manager Overview | 1 |
| | Fund at a Glance | 4 |
| | Fund Expenses | 5 |
| | Historical Performance | 6 |
| | Schedule of Investments | 7 |
| | Statement of Assets & Liabilities | 9 |
| | Statement of Operations | 10 |
| | Statements of Changes in Net Assets | 11 |
| | Financial Highlights | 12 |
| | Notes to Financial Statements | 13 |
| | Report of Independent Registered Public Accounting Firm | 19 |
| | Additional Information | 20 |
| | Important Tax Information | 22 |
Letter from the
Chairperson
Dear Shareholder,
We are pleased to provide the annual report of the Barrett Opportunity Fund, Inc. (the “Fund”) for the twelve-month period ended August 31st, 2012.
The management team at Barrett Asset Management, LLC has prepared the Annual Shareholder’s Letter, which includes a brief market overview, as well as a portfolio and performance review. I urge you to read it as well as the accompanying financial statements. A detailed summary of the Fund’s performance and other pertinent information are also included in this report. I am sure you will find this report informative and useful.
On behalf of the Directors and the officers of the Fund, and in these difficult economic times, I thank you for your ongoing confidence in the Fund and its investment policies.
Sincerely,
Rosalind A. Kochman
Chairperson
September 26, 2012
| Manager | Market Overview |
| Overview | |
| | The broad market as represented by the 500 companies in the S&P Index continued to make significant progress over the past year in recapturing losses from the great bear market of 2008. By the end of August, the market was within 10% of the all time highs reached in late 2007. |
| | |
| | The stock market recovery from the recessionary lows of 2008 and 2009 has occurred despite a very subdued, uneven global economic backdrop. The stock market downturn caused many stocks to become unusually inexpensive. Part of the market recovery was simply a relief that the entire global financial system was not going to unravel. Another positive force was the aggressive actions of global central banks, particularly the United States Federal Reserve, to lower interest rates and absorb assets that were eating away at the balance sheets of financial institutions. In fact, it is hard to imagine what else the Federal Reserve could have done and continues to do, to prop up the economy which certainly plays a role in higher stock prices. Finally, large United States based companies have produced an earnings upturn very much in excess of the economic recovery. This has enabled companies with strong balance sheets to increase their dividends in a period when investors are desperately seeking high yielding assets. |
| | |
| | The tenuous economic recovery continues. During the past year most economists have reduced their forecast for growth as a result of the unstable European situation and slowing Chinese economy. It is our view that the excessive buildup of debt in Europe and the United States before 2008 set the stage for a period that would result in sluggish |
| | growth. Due to massive debt restructuring by individuals, banks and governments, the low interest rates engineered by the central banks have not been able to ignite a typical economic recovery in a period of debt repayment and denouement. In the United States, there are clear signs that low mortgage rates have finally started to help the housing market and this should serve as a powerful sedative to homeowners who have only seen a decline in their home equity. A stronger U.S. housing market should have a beneficial effect on many of the large domestic banks that are still under water on foreclosed properties, which ultimately constrain their willingness and capacity to lend. |
| | |
| | Another major issue that has faced investors has been an unclear political outlook. Not only will the United States elections be closely watched and interpreted, but even more importantly, the post election drama will center on the pending increases in taxes and reductions in defense spending. It is our best estimate that politicians will attempt to push as much of these contracting measures off because of the weak economy and because the measures are a crude short term remedy for a complex and long term problem. In Europe, although we have a new set of political leaders, who seem to be moving in the right direction, it is far from clear that they will retain their positions as austerity continues to bite. The Chinese economy appears to be in the early stages of trying to make a transition from a construction driven economy to a consumer economy during a time when the country will be experiencing a change in leadership for the first time in a decade. With global monetary policy near exhaustion, future leaders will have to pull all the fiscal policy levers as well if we are to see an improved global economy. |
| | |
| | Portfolio and Performance Review |
| | |
| | During the twelve month period ended August 31, 2012, the Fund’s total return was +9.40%. The Fund underperformed the Lipper Large Cap Value Fund Index which returned +14.22%. Since the Fund has fewer holdings than the typical value fund, performance can be driven by price changes in a small number of the larger positions. Over the past year, the holdings in Murphy Oil and Leucadia National, representing roughly 11% of the Fund, held back overall gains. Of the larger positions in the Fund, Chubb Corp and Rayonier were leaders. Several smaller positions, including Automatic Data, PepsiCo, Monsanto and Abbott Laboratories, also posted strong returns. Over the past several years, we have broadened the portfolio holdings to include companies that have “brand” value as opposed to hard asset value as represented by Fund holdings such as Royal Dutch, Rayonier and Forest City Enterprises. |
| | |
| | As we mentioned earlier in this letter, investors are interested in yield due to the abnormally low rates on money market funds and bonds. As of August 31, 2012 the Fund’s 12-Month Dividend Yield was 2.60% and its 30-day SEC Yield was 1.81%. In the past year, dividend increases by the companies in the portfolio who pay dividends, ranged from 5% to 13%. Many of the “brand” value companies, such as Tiffany, have posted larger increases, and should continue to do so. |
| | It is a rare environment when the stock market is not confronted with an array of headwinds. The current list of question marks includes slow and decelerating global growth, financial distress in Europe and political paralysis in the United States. Nonetheless, corporations have continued to produce strong earnings and rising dividends. The 2.60% dividend yield on the Fund is higher than the 10 year U.S. Treasury yield and should there be further dividend hikes there is the potential for the dividend yield to increase. We think the Fund’s holdings are well positioned to grow despite the sluggish global economic environment. |
| | |
| | Thank you for your continued interest in the Fund. |
| | |
| | Sincerely, |
| |  |  |
| | Robert Milnamow | E. Wells Beck, CFA |
| | Portfolio Manager | Portfolio Manager |
| | Past performance is not a guarantee of future results. |
| | |
| | The outlook, views, and opinions presented are those of the Adviser as of 08/31/2012. These are not intended to be a forecast of future events, a guarantee of future results, or investment advice. |
| | |
| | Must be preceded or accompanied by a prospectus. |
| | |
| | The Fund is non-diversified, which means that it can invest a higher percentage of its assets in any one issuer. Investing in a non-diversified fund may entail greater risks than is normally associated with more widely diversified funds. The Fund may use derivatives, such as options and futures, which can be illiquid, may disproportionately increase losses, and have a potentially large impact on fund performance. Investing in foreign securities is subject to certain risks not associated with domestic investing, such as currency fluctuations, and changes in political and economic conditions. These risks are magnified in emerging or developing markets. The Fund may use leverage, which may adversely impact performance. Investments in debt securities typically decrease when interest rates rise. These risks are greater for longer-term debt securities. |
| | |
| | Lipper Large-Cap Value Funds Index includes funds that, by portfolio practice, invest at least 75% of their equity assets in companies with market capitalizations (on a three-year weighted basis) above Lipper’s U.S. Diversified Equity large-cap floor. The S&P 500® Index is a market-value weighted index comprised of 500 widely held common stocks. It is not possible to invest directly in the Index. |
| | |
| | Fund holdings and sector allocations are subject to change and should not be considered a recommendation to buy or sell any security. For a complete list of portfolio holdings, please refer the Schedule of Investments provided in this report. |
| | |
| | The Barrett Opportunity Fund is distributed by Quasar Distributors, LLC. |
Fund at a Glance (Unaudited)
| Top Ten Holdings - as of 8/31/2012 |
| (As a percentage of Total Investments) |
| |
| Chubb Corp. | 21.4% |
| Royal Dutch Shell PLC - Class A - ADR | 15.5% |
| General Dynamics Corp. | 9.9% |
| Bank of New York Mellon Corp. | 9.6% |
| Murphy Oil Corp. | 7.3% |
| Rayonier, Inc. | 7.1% |
| Koninklijke Philips Elections N.V. | 6.6% |
| Leucadia National Corp. | 4.4% |
| Monsanto Co. | 2.9% |
| Forest City Enterprises, Inc. - Class B | 2.8% |
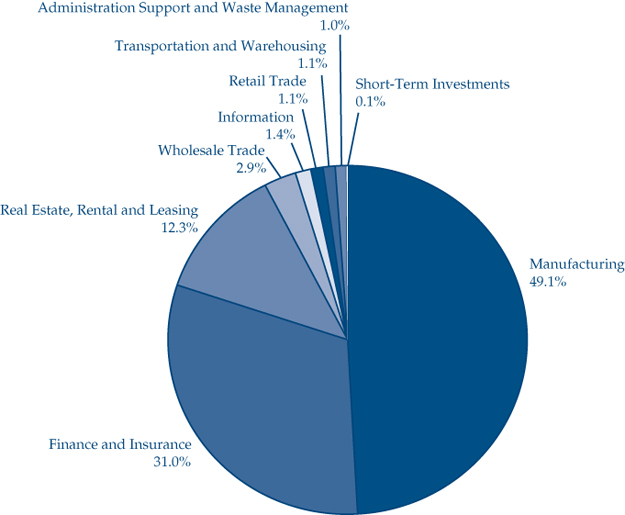
Sector Weightings - as of 8/31/2012
(As a percentage of Total Investments)
Fund Expenses (Unaudited)
Example
As a shareholder of the Fund, you may incur two types of costs: (1) transaction costs; and (2) ongoing costs, including management fees and other Fund expenses. This example is intended to help you understand your ongoing costs (in dollars) of investing in the Fund and to compare these costs with the ongoing costs of investing in other mutual funds.
This example is based on an investment of $1,000 invested on March 1, 2012 and held for the six months ended August 31, 2012.
Actual Expenses
The table below titled “Based on Actual Total Return” provides information about actual account values and actual expenses. You may use the information provided in this table, together with the amount you invested, to estimate the expenses that you paid over the period. To estimate the expenses you paid on your account, divide your ending account value by $1,000 (for example, an $8,600 ending account value divided by $1,000 = 8.6), then multiply the result by the number under the heading entitled “Expenses Paid During the Period”.
Hypothetical Example for Comparison Purposes
The table below titled “Based on Hypothetical Total Return” provides information about hypothetical account values and hypothetical expenses based on the actual expense ratio and an assumed rate of return of 5.00% per year before expenses, which is not the Fund’s actual return. The hypothetical account values and expenses may not be used to estimate the actual ending account balance or expenses you paid for the period. You may use the information provided in this table to compare the ongoing costs of investing in the Fund and other funds. To do so, compare the 5.00% hypothetical example relating to the Fund with the 5.00% hypothetical examples that appear in the shareholder reports of the other funds.
Please note that the expenses shown in the table below are meant to highlight your ongoing costs only and do not reflect any transactional costs. Therefore, the table is useful in comparing ongoing costs only, and will not help you determine the relative total costs of owning different funds. In addition, if these transaction costs were included, your costs would have been higher.
| | | | Expenses Paid |
| | Beginning | Ending | During the Period* |
| | Account | Account | March 1, 2012 to |
| | Value | Value | August 31, 2012 |
| Actual Barrett Opportunity Fund, Inc. Expenses | $1,000.00 | $1,004.80 | $5.90 |
| Hypothetical Expenses | | | |
| (5% return per year before expenses) | $1,000.00 | $1,019.25 | $5.94 |
| * | Expenses are equal to the Fund’s annualized six-month expense ratio of 1.17% (which reflects fee waivers in place during the period), multiplied by the average account value over the period, multiplied by 184/366 (to reflect the one-half year period). |
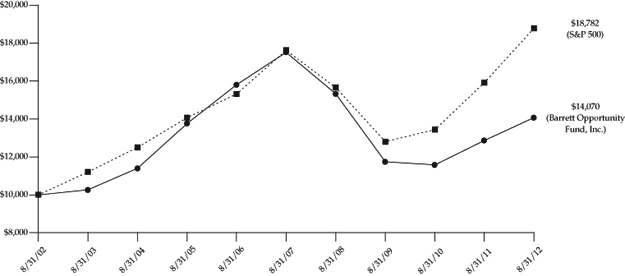
Historical Performance (Unaudited)
Value of $10,000 Invested in Barrett Opportunity Fund, Inc. vs.
the S&P 500® Index† (August 2002 – August 2012)
| † | Hypothetical illustration of $10,000 invested in Barrett Opportunity Fund, Inc. on August 31, 2002 assuming the reinvestment of all distributions, including returns of capital, if any, at net asset value through August 31, 2012. The S&P 500® Index is a market-value weighted index comprised of 500 widely held common stocks. The Index is unmanaged and it is not subject to the same management and trading expenses of a mutual fund. Please note that an investor cannot invest directly in an index. |
Fund Performance
Average Annual Total Returns* (Unaudited)
| | | | | Since |
| | 1 Year | 5 Years | 10 Years | Inception |
| Barrett Opportunity Fund, Inc. | 9.40% | -4.29% | 3.47% | 10.75% |
| S&P 500 Index | 18.00% | 1.28% | 6.51% | 11.48% |
| * | Assumes the reinvestment of all distributions at net asset value. All figures represent past performance and are not a guarantee of future results. Investment return and principal value of an investment will fluctuate so that an investor’s shares, when redeemed, may be worth more or less than their original cost. Performance figures may reflect compensating balance arrangements, fee waivers and/or expense reimbursements. In the absence of compensating balance arrangements, fee waivers and/or expense reimbursements, the total return would have been lower. |
Schedule of Investments
August 31, 2012
| Shares | | | | Value | |
| | | COMMON STOCKS - 92.76% | | | |
| | | Beverage and Tobacco | | | |
| | | Product Manufacturing - 1.18% | | | |
| | 10,000 | | PepsiCo, Inc. | | $ | 724,300 | |
| | | | | | | | |
| | | | Chemical Manufacturing - 1.83% | | | | |
| | 12,000 | | Abbott Laboratories | | | 786,480 | |
| | 5,000 | | Johnson & Johnson | | | 337,150 | |
| | | | | | | 1,123,630 | |
| | | | | | | | |
| | | | Clothing and Clothing | | | | |
| | | | Accessories Stores - 1.11% | | | | |
| | 11,000 | | Tiffany & Co. | | | 681,450 | |
| | | | | | | | |
| | | | Computer and Electronic | | | | |
| | | | Product Manufacturing - 6.59% | | | | |
| | 177,210 | | Koninklijke Philips Electronics | | | | |
| | | | NV - NY Registered | | | | |
| | | | Shares - ADR | | | 4,052,793 | |
| | | | | | | | |
| | | | Credit Intermediation and | | | | |
| | | | Related Activities - 9.61% | | | | |
| | 261,971 | | The Bank of New York | | | | |
| | | | Mellon Corp. | | | 5,904,826 | |
| | | | | | | | |
| | | | Data Processing, Hosting | | | | |
| | | | and Related Services - 1.42% | | | | |
| | 15,000 | | Automatic Data Processing, Inc. | | | 871,200 | |
| | | | | | | | |
| | | | Insurance Carriers and | | | | |
| | | | Related Activities - 21.40% | | | | |
| | 178,000 | | The Chubb Corp. | | | 13,152,420 | |
| | | | | | | | |
| | | | Merchant Wholesalers, | | | | |
| | | | Nondurable Goods - 2.87% | | | | |
| | 20,242 | | Monsanto Co. | | | 1,763,281 | |
| | | | | | | | |
| | | | Miscellaneous Manufacturing - 1.51% | | | | |
| | 10,000 | | 3M Co. | | | 926,000 | |
| | | | | | | | |
| | | | Petroleum and Coal Products | | | | |
| | | | Manufacturing - 22.79% | | | | |
| | 87,300 | | Murphy Oil Corp. | | | 4,481,109 | |
| | 136,100 | | Royal Dutch Shell PLC - | | | | |
| | | | Class A - ADR | | | 9,522,917 | |
| | | | | | | 14,004,026 | |
| | | | Real Estate - 6.32% | | | | |
| | 22,800 | | Alexander & Baldwin, Inc. (a) | | | 675,336 | |
| | 100,400 | | Forest City Enterprises, | | | | |
| | | | Inc. - Class A (a) | | | 1,514,032 | |
| | 112,500 | | Forest City Enterprises, | | | | |
| | | | Inc. - Class B (a)(b) | | | 1,693,687 | |
| | | | | | | 3,883,055 | |
| | | | Transportation - 0.84% | | | | |
| | 22,800 | | Matson, Inc. | | | 517,332 | |
| | | | | | | | |
| | | | Transportation Equipment | | | | |
| | | | Manufacturing - 9.87% | | | | |
| | 92,600 | | General Dynamics Corp. | | | 6,066,226 | |
| | | | | | | | |
| | | | Waste Management and | | | | |
| | | | Remediation Services - 1.01% | | | | |
| | 88,850 | | TRC Cos, Inc. (a) | | | 618,396 | |
| | | | | | | | |
| | | | Wood Product Manufacturing - 4.41% | | | | |
| | 126,800 | | Leucadia National Corp. | | | 2,710,984 | |
| | | | Total Common Stocks | | | | |
| | | | (Cost $8,002,830) | | | 56,999,919 | |
| | | | | | | | |
| | | | REAL ESTATE INVESTMENT | | | | |
| | | | TRUSTS (REITS) - 7.05% | | | | |
| | | | Real Estate - 7.05% | | | | |
| | 88,485 | | Rayonier, Inc. | | | 4,334,880 | |
| | | | Total Real Estate Investment | | | | |
| | | | Trusts (Cost $853,172) | | | 4,334,880 | |
The accompanying notes are an integral part of these financial statements.
Schedule of Investments
August 31, 2012
| Shares | | | | Value | |
| | | SHORT-TERM | | | |
| | | INVESTMENTS - 0.10% | | | |
| | | Money Market Fund - 0.10% | | | |
| | 60,790 | | Fidelity Institutional Money | | | |
| | | | Market Fund - Government | | | |
| | | | Portfolio - Class I, 0.01% (c) | | $ | 60,790 | |
| | | | | | | | |
| | | | Total Short-Term Investments | | | | |
| | | | (Cost $60,790) | | | 60,790 | |
| | | | | | | | |
| | | | Total Investments | | | | |
| | | | (Cost $8,916,792) - 99.91% | | | 61,395,589 | |
| | | | Other Assets in Excess | | | | |
| | | | of Liabilities - 0.09% | | | 54,083 | |
| | | | Total Net Assets - 100.00% | | $ | 61,449,672 | |
Percentages are stated as a percent of net assets.
ADR - American Depository Receipt
| (a) | Non-income producing security. |
| (b) | Convertible into Forest City Enterprises, Inc. - Class A shares. |
| (c) | Variable rate security. The rate listed is as of August 31, 2012. |
The accompanying notes are an integral part of these financial statements.
Statement of Assets & Liabilities
August 31, 2012
| ASSETS: | | | |
| Investments, at value (cost $8,916,792) | | $ | 61,395,589 | |
| Dividend and interest receivable | | | 142,066 | |
| Other assets | | | 26,096 | |
| Total Assets | | | 61,563,751 | |
| LIABILITIES: | | | | |
| Payable to adviser | | | 36,658 | |
| Payable to directors | | | 7,411 | |
| Other accrued expenses | | | 70,010 | |
| Total Liabilities | | | 114,079 | |
| | $ | 61,449,672 | |
| NET ASSETS CONSIST OF: | | | | |
| Capital stock | | $ | 3,725,024 | |
| Accumulated undistributed net investment income | | | 528,621 | |
| Accumulated undistributed net realized gain | | | 4,717,230 | |
| Net unrealized appreciation on investments | | | 52,478,797 | |
| Total Net Assets | | $ | 61,449,672 | |
| | | | | |
| Shares outstanding | | | 1,941,254 | |
| | | | | |
| Net asset value, offering price and redemption price | | | | |
| per share (15,000,000 shares authorized, $0.01 par value) | | $ | 31.65 | |
The accompanying notes are an integral part of these financial statements.
Statement of Operations
Year Ended August 31, 2012
| INVESTMENT INCOME: | | | |
| Dividend income* | | $ | 1,510,187 | |
| Interest income | | | 129 | |
| | | | 1,510,316 | |
| EXPENSES: | | | | |
| Investment advisory fees (see Note 2) | | | 434,432 | |
| Legal fees | | | 75,548 | |
| Directors’ fees and expenses | | | 54,276 | |
| Administration fees | | | 38,390 | |
| Federal and state registration fees | | | 28,585 | |
| Fund accounting fees | | | 26,194 | |
| Transfer agent fees and expenses | | | 21,443 | |
| Audit fees | | | 20,474 | |
| Reports to shareholders | | | 14,512 | |
| Custody fees | | | 5,286 | |
| Other | | | 37,120 | |
| Total expenses | | | 756,260 | |
| Less: Fees waived by adviser (Note 2) | | | (20,811 | ) |
| Net expenses | | | 735,449 | |
| Net investment income | | | 774,867 | |
| | | | | |
| REALIZED AND UNREALIZED GAIN ON INVESTMENTS: | | | | |
| Net realized gain on investments | | | 8,104,113 | |
| Change in net unrealized appreciation on investments | | | (3,184,160 | ) |
| Net realized and unrealized gain on investments | | | 4,919,953 | |
| NET INCREASE IN NET ASSETS RESULTING FROM OPERATIONS | | $ | 5,694,820 | |
| * | Net of $103,135 of foreign taxes withheld. |
The accompanying notes are an integral part of these financial statements.
Statements of Changes in Net Assets
| | | | | | Year Ended | |
| | | | | | August 31, 2011 | |
| OPERATIONS: | | | | | | |
| Net investment income | | $ | 774,867 | | | $ | 944,184 | |
| Net realized gain on investments | | | 8,104,113 | | | | 2,523,311 | |
| Change in net unrealized appreciation on investments | | | (3,184,160 | ) | | | 3,962,451 | |
| Net increase in net assets resulting from operations | | | 5,694,820 | | | | 7,429,946 | |
| | | | | | | | | |
| DIVIDENDS AND DISTRIBUTIONS TO SHAREHOLDERS: | | | | | | | | |
| Net investment income | | | (597,335 | ) | | | (900,000 | ) |
| Net realized gains on investment | | | (5,425,499 | ) | | | (3,569,540 | ) |
| Total dividends and distributions | | | (6,022,834 | ) | | | (4,469,540 | ) |
| | | | | | | | | |
| CAPITAL SHARE TRANSACTIONS: | | | | | | | | |
| Shares sold | | | 81,640 | | | | 81,838 | |
| Shares issued in reinvestment of dividends | | | 3,279,278 | | | | 2,660,712 | |
| Shares redeemed | | | (5,821,101 | ) | | | (4,502,965 | ) |
| Net decrease in net assets from capital share transactions | | | (2,460,183 | ) | | | (1,760,415 | ) |
| | | | | | | | | |
TOTAL INCREASE (DECREASE) IN NET ASSETS | | | (2,788,197 | ) | | | 1,199,991 | |
| | | | | | | | | |
| NET ASSETS: | | | | | | | | |
| Beginning of year | | | 64,237,869 | | | | 63,037,878 | |
| End of year (including accumulated undistributed net | | | | | | | | |
| investment income of $528,621 and $351,089, respectively) | | $ | 61,449,672 | | | $ | 64,237,869 | |
The accompanying notes are an integral part of these financial statements.
Financial Highlights
| | | Year Ended August 31, | |
| | | | | | | | | | | | | | | 2008 | |
| Per Share Data: | | | | | | | | | | | | | | | |
| Net asset value, beginning of year | | $ | 31.87 | | | $ | 30.53 | | | $ | 32.72 | | | $ | 50.14 | | | $ | 60.62 | |
| | | | | | | | | | | | | | | | | | | | | |
| Income (loss) from investment operations: | | | | | | | | | | | | | | | | | | | | |
| Net investment income | | | 0.40 | | | | 0.47 | | | | 0.39 | | | | 0.49 | | | | 0.48 | |
| Net realized and unrealized | | | | | | | | | | | | | | | | | | | | |
| gain (loss) on investments | | | 2.41 | | | | 3.09 | | | | (0.74 | ) | | | (13.02 | ) | | | (7.55 | ) |
| Total from investment operations | | | 2.81 | | | | 3.56 | | | | (0.35 | ) | | | (12.53 | ) | | | (7.07 | ) |
| | | | | | | | | | | | | | | | | | | | | |
| Less distributions: | | | | | | | | | | | | | | | | | | | | |
| Net investment income | | | (0.30 | ) | | | (0.44 | ) | | | (0.48 | ) | | | (0.59 | ) | | | (0.37 | ) |
| Net realized gain on investments | | | (2.73 | ) | | | (1.78 | ) | | | (1.36 | ) | | | (4.30 | ) | | | (3.04 | ) |
| Total distributions | | | (3.03 | ) | | | (2.22 | ) | | | (1.84 | ) | | | (4.89 | ) | | | (3.41 | ) |
| | | | | | | | | | | | | | | | | | | | | |
| Net asset value, end of year | | $ | 31.65 | | | $ | 31.87 | | | $ | 30.53 | | | $ | 32.72 | | | $ | 50.14 | |
| | | | | | | | | | | | | | | | | | | | | |
Total return1 | | | 9.40 | % | | | 11.07 | % | | | (1.38 | )% | | | (23.37 | )% | | | (12.55 | )% |
| | | | | | | | | | | | | | | | | | | | | |
| Supplemental data and ratios: | | | | | | | | | | | | | | | | | | | | |
| Net assets, end of year (000,000’s) | | $ | 61 | | | $ | 64 | | | $ | 63 | | | $ | 70 | | | $ | 114 | |
| Ratio of net expenses | | | | | | | | | | | | | | | | | | | | |
| to average net assets | | | 1.19 | %2 | | | 1.10 | %2 | | | 1.20 | % | | | 1.31 | % | | | 1.03 | % |
| Ratio of net investment income | | | | | | | | | | | | | | | | | | | | |
| to average net assets | | | 1.25 | %2 | | | 1.32 | %2 | | | 1.15 | % | | | 1.50 | % | | | 0.83 | % |
| Portfolio turnover rate | | | 4 | % | | | 0 | % | | | 3 | % | | | 0 | %3,4 | | | 3 | %3 |
| 1 | Performance figures may reflect compensating balance arrangements, fee waivers and/or expense reimbursements. In the absence of these arrangements, total returns would have been lower. |
| 2 | Such percentages are after the advisory fee waiver. Effective April 29, 2011, the Adviser voluntarily agreed to waive 0.05% of average net assets of its advisory fee through April 29, 2012. This equals 0.03% and 0.02% of average net assets for the years ended August 31, 2012 and August 31, 2011, respectively. In the absence of these waivers, the ratio of net expenses to average net assets would be 0.03% and 0.02% higher, and ratio of net investment income to average net assets 0.03% and 0.02% lower, for the years ended August 31, 2012 and August 31, 2011, respectively. |
| 3 | Excludes the value of portfolio securities delivered as a result of in-kind redemptions of Fund’s capital shares. |
| 4 | Amount represents less than 1%. |
The accompanying notes are an integral part of these financial statements.
Notes to Financial Statements
| 1. | ORGANIZATION | Barrett Opportunity Fund, Inc. (the “Fund”), a Maryland corporation organized in 1978, is registered as a non-diversified, |
| | AND | open-end management investment company under the Investment Company Act of 1940, as amended (the “1940 Act”). The Fund’s investment |
| | SIGNIFICANT | objective is to achieve above average long-term capital appreciation. |
| | ACCOUNTING | |
| | POLICIES | The following are significant accounting policies consistently followed by the Fund and are in conformity with generally accepted accounting principles in the United States of America (“GAAP”). |
| | | |
| | | (a) Investment Valuation |
| | | Equity securities, including common stocks and REITs, for which market quotations are available are valued at the last reported sales price or official closing price on the primary market or exchange on which they trade. |
| | | |
| | | Redeemable securities issued by open-end, registered investment companies, including money market funds, are valued at the net asset value (“NAV”) of such companies for purchase and/or redemption orders placed on that day. |
| | | |
| | | When prices are not readily available, or are determined not to reflect fair value, such as when the value of a security has been significantly affected by events after the close of the exchange or market on which the security is principally traded, but before the Fund calculates its net asset value, the Fund values these securities at fair value as determined in accordance with procedures approved by the Fund’s Board of Directors. |
| | | |
| | | The Fund uses valuation techniques to measure fair value that are consistent with the market approach and/or income approach, depending on the type of the security and the particular circumstance. The market approach uses prices and other relevant information generated by market transactions involving identical or comparable securities. The income approach uses valuation techniques to discount estimated future cash flows to present value. |
| | | |
| | | Financial Accounting Standards Board (“FASB”) Accounting Standards Codification, “Fair Value Measurements and Disclosures” Topic 820 (“ASC Topic 820”), establishes a single definition of fair value, creates a three-tier hierarchy as a framework for measuring fair value based on inputs used to value the Fund’s investments, and requires additional disclosure about fair value. The hierarchy of inputs is summarized below. |
| • | Level 1 – quoted prices in active markets for identical investments as of the measurement date |
| • | Level 2 – other significant observable inputs (including quoted prices for similar investments, interest rates, prepayment speeds, credit risk, etc. |
| • | Level 3 – significant unobservable inputs (including the Fund’s own assumptions in determining the fair value of investments) |
| | Inputs refer broadly to the assumptions that market participants use to make valuation decisions, including assumptions about risk. Inputs may include price information, volatility statistics, specific and broad credit data, liquidity statistics, and other factors. A financial instrument’s level within the fair value hierarchy is based on the lowest level of input that is significant to the fair value measurement. However, the determination of what constitutes “observable” requires significant judgment by the Fund. The Fund considers observable data to be that market data which is readily available, regularly distributed or updated, reliable and verifiable, not proprietary, and provided by independent sources that are actively involved in the relevant market. The categorization of a financial instrument within the hierarchy is based upon the pricing transparency of the instrument and does not necessarily correspond to the Fund’s perceived risk of that instrument. |
| | |
| | Investments whose values are based on quoted market prices in active markets include listed equities, including common stocks and REITs, and certain money market securities, and are classified within Level 1. Investments that trade in markets that are not considered to be active, but are valued based on quoted market prices, dealer quotations or alternative pricing sources supported by observable inputs, are classified within Level 2. Investments classified within Level 3 have significant unobservable inputs, as they trade infrequently or not at all. |
| | |
| | The following is a summary of the inputs used in valuing the Fund’s assets carried at fair value as of August 31, 2012. The inputs and methodologies used to value securities may not be an indication of the risk associated with investing in these securities. |
| | | | | | | Other | | | | | | | |
| | | | | | | Significant | | | Significant | | | | |
| | | | Quoted | | | Observable | | | Unobservable | | | | |
| | | | Prices | | | Inputs | | | Inputs | | | | |
| | Description | | (Level 1) | | | (Level 2) | | | (Level 3) | | | Total | |
| | Common Stocks† | | $ | 56,999,919 | | | $ | — | | | $ | — | | | $ | 56,999,919 | |
| | REITs | | | 4,334,880 | | | | — | | | | — | | | | 4,334,880 | |
| | Money Market Funds | | | 60,790 | | | | — | | | | — | | | | 60,790 | |
| | Total Fund | | $ | 61,395,589 | | | $ | — | | | $ | — | | | $ | 61,395,589 | |
| † | See Schedule of Investments for additional industry classifications. |
| | Below is a reconciliation of fair value measurements categorized within Level 3 of the fair value hierarchy for the current fiscal period: | |
| | Beginning Balance - September 1, 2011 | | $ | — | * |
| | Return of capital (cost adjustment) | | | (26,880 | ) |
| | Realized losses | | | (164,529 | ) |
| | Change in unrealized appreciation (depreciation) | | | 191,409 | |
| | Transfers in/(out) of Level 3 | | | — | |
| | Ending Balance - August 31, 2012 | | $ | — | |
| * | One Level 3 security was held at the beginning of the year with a fair value of $0. |
| | There were no transfers of securities between levels during the reporting period. It is the Fund’s policy to record transfers between levels as of the end of the reporting period. The Fund did not hold any derivative instruments during the reporting period. |
| | |
| | (b) Security Transactions and Investment Income |
| | |
| | Security transactions are accounted for on a trade date basis. Interest income, adjusted for amortization of premium and accretion of discount, is recorded on the accrual basis. Dividend income is recorded on the ex-dividend date. Under applicable tax laws, a withholding tax may be imposed on interest, dividends and capital gains at various rates and withholding taxes on foreign dividends have been provided for in accordance with the Fund’s understanding of the applicable country’s tax rules and rates. The cost of investments sold is determined by use of the specific identification method for computing the gain/loss on the transaction. It is the Fund’s policy to recognize a loss on a worthless security once it is determined beyond a reasonable doubt that there is no possibility of future worth. Proceeds from bankruptcy settlements will generally be recognized as a realized gain if the security is no longer held and as a return of capital if the security is still held. |
| | |
| | (c) Distributions to Shareholders |
| | |
| | The Fund will distribute any net investment income and any net realized long or short-term capital gains at least annually. Distributions from net realized gains for book purposes may include short-term capital gains. All short-term capital gains are included in ordinary income for tax purposes. Distributions to shareholders are recorded on the ex-dividend date. The Fund may also pay a special distribution at the end of the calendar year to comply with federal tax requirements. |
| | |
| | (d) REIT Distributions |
| | |
| | The character of distributions received from REITs held by the Fund is generally comprised of net investment income, capital gains, and return of capital. It is the policy of the Fund to estimate the character of distributions received from underlying REITs based on historical data provided by the REITs. After each calendar year end, REITs report the actual tax character of these distributions. Differences between the estimated and actual amounts reported by the REITs are reflected in the Fund’s records in the year in which they are reported by the REITs by adjusting related investment cost basis, capital gains and income, as necessary. |
| | (e) Federal Income Taxes |
| | |
| | It is the Fund’s policy to comply with the federal income and excise tax requirements of subchapter M of the Internal Revenue Code of 1986, as amended (the “Code”), necessary to qualify as a regulated investment company. Accordingly, the Fund intends to distribute its taxable income and net realized gains, if any, to shareholders in accordance with timing requirements imposed by the Code. Therefore, no federal income tax provision is provided in the Fund’s financial statements. |
| | |
| | As of and during the year ended August 31, 2012, the Fund did not have a liability of any unrecognized tax benefits. The Fund recognizes interest and penalties, in any, related to uncertain tax benefits as income tax expense in the Statement of Operations. During the period, the Fund did not incur any interest or penalties. The Fund is not subject to examination by U.S. taxing authorities for tax periods prior to 2008. |
| | |
| | (f) Use of Estimates |
| | |
| | The preparation of financial statements in conformity with GAAP requires management to make estimates and assumptions that affect the reported amounts of assets and liabilities and disclosure of contingent assets and liabilities at the date of the financial statements and the reported amounts of revenues and expenses during the reporting period. Actual results could differ from those estimates. |
| | |
| | (g) Indemnification |
| | |
| | In the normal course of business the Fund enters into contracts that contain general indemnification clauses. The Fund’s maximum exposure under these agreements is unknown, as this would involve future claims against the Fund that have not yet occurred. Based on experience, the Fund expects the risk of loss to be remote. |
| 2. | INVESTMENT | The Fund has an Investment Advisory Agreement with Barrett Asset Management, LLC (“Barrett”). Under the Investment Advisory Agreement, |
| | ADVISER | the Fund pays an advisory fee, calculated daily and paid monthly, in accordance with the following breakpoint schedule: |
| | AGREEMENT | | |
| | | Average Daily Net Assets | Annual Rate |
| | TRANSACTIONS | First $1 billion | 0.700% |
| | WITH AFFILIATES | Next $1 billion | 0.675% |
| | | Next $3 billion | 0.650% |
| | | Next $5 billion | 0.625% |
| | | Over $10 billion | 0.600% |
| | | |
| | | In addition, Barrett voluntarily agreed to reduce its investment advisory fee by an additional 0.05% for a one-year period ended April 29, 2012, which is not subject to recoupment by Barrett. For the fiscal year ended August 31, 2012, this advisory fee totaled $434,432. During the year ended August 31, 2012, Barrett voluntarily waived $20,811 of its advisory fee. Such waivers are not subject to recoupment. |
| | | The officers of the Fund are also officers and employees of Barrett and do not receive compensation from the Fund. |
| | | |
| 3. | INVESTMENTS | During the year ended August 31, 2012, the aggregate cost of purchases and proceeds from sales of investments (excluding short-term investments) were as follows: |
| | Purchases | Sales |
| | $2,478,076 | $9,858,348 |
| 4. | CAPITAL SHARES | At August 31, 2012, the Fund had 15,000,000 shares of capital stock authorized with a par value of $0.01 per share. Transactions in shares of the Fund were as follows:. |
| | | | | | | | |
| | | | Year Ended | | | Year Ended | |
| | | | August 31, 2012 | | | August 31, 2011 | |
| | Shares sold | | | 2,651 | | | | 2,333 | |
| | Shares issued on reinvestment | | | 109,932 | | | | 76,567 | |
| | Shares redeemed | | | (186,964 | ) | | | (127,953 | ) |
| | Net decrease | | | (74,381 | ) | | | (49,053 | ) |
| 5. | INCOME TAX | The tax character of distributions paid during the fiscal years ended August 31, were as follows: | |
| | INFORMATION | | | | | | | |
| | AND | | | | | | | |
| | DISTRIBUTIONS | | | | 2012 | | | | 2011 | |
| | TO | Distributions Paid From: | | | | | | | | |
| | SHAREHOLDERS | Ordinary income | | $ | 597,335 | | | $ | 900,000 | |
| | | Net long-term capital gains | | | 5,425,499 | | | | 3,569,540 | |
| | | Total distributions paid | | $ | 6,022,834 | | | $ | 4,469,540 | |
| | The Fund designated as long-term capital gain dividend, pursuant to Internal Revenue Code Section 852(b)(3), the amount necessary to reduce the earnings and profits of the Fund related to net capital gain to zero for the tax year ended August 31, 2012. The Fund utilized earnings and profits distributed to shareholders on redemption of shares as part of the dividend paid deduction. The amount designated as long-term capital gain for the fiscal years ended August 31, 2012 and 2011 was $296,410 and $173,810, respectively. |
| | |
| | At August 31, 2012, the aggregate gross unrealized appreciation and depreciation of investments for federal income tax purposes were as follows: |
| | Tax cost of investments | | $ | 8,916,792 | |
| | Gross unrealized appreciation | | $ | 52,478,797 | |
| | Gross unrealized depreciation | | | — | |
| | Net unrealized appreciation | | $ | 52,478,797 | |
| | As of August 31, 2012, the components of accumulated earnings on a tax basis were as follows: | | | |
| | Undistributed operating income | | $ | 559,134 | |
| | Undistributed long-term gains | | | 4,717,230 | |
| | Distributable earnings | | | 5,276,364 | |
| | Unrealized appreciation | | | 52,478,797 | |
| | Other accumulated losses* | | | (30,513 | ) |
| | Total accumulated gains | | $ | 57,724,648 | |
| * | Other temporary differences are primarily attributable to the timing of certain expenses. |
| | |
| | GAAP requires that certain components of net assets be reclassified to reflect permanent differences between financial and tax reporting. These reclassifications have no effect on net assets or net asset values per share. During the current year, accumulated net realized gain was decreased by $296,410 and paid-in-capital was increased by $296,410 for permanent book to tax differences. |
| | |
| REPORT OF | To the Shareholders and Board of Directors of |
| INDEPENDENT | Barrett Opportunity Fund, Inc. |
| REGISTERED | |
| We have audited the accompanying statement of assets and liabilities, including the schedule of investments, of Barrett Opportunity Fund, Inc. |
| (the “Fund”) as ofAugust 31, 2012, and the related statement of operations for the year then ended, and the statements of changes |
| FIRM | in net assets and the financial highlights for each of the two years in the period then ended. These financial statements and |
| | financial highlights are the responsibility of Fund management. Our responsibility is to express an opinion on these financial |
| | statements and financial highlights based on our audit. The financial highlights for the years indicated prior to the year ended August 31, 2011, |
| | were audited by another independent registered public accounting firm, who expressed unqualified opinions on those financial highlights. |
| | |
| | We conducted our audit in accordance with the standards of the Public Company Accounting Oversight Board (United States). Those standards require that we plan and perform the audit to obtain reasonable assurance about whether the financial statements and financial highlights are free of material misstatement. An audit includes examining, on a test basis, evidence supporting the amounts and disclosures in the financial statements. Our procedures included confirmation of securities owned as of August 31, 2012 by correspondence with the custodian. An audit also includes assessing the accounting principles used and significant estimates made by management, as well as evaluating the overall financial statement presentation. We believe that our audit provides a reasonable basis for our opinion. |
| | |
| | In our opinion, the financial statements and financial highlights referred to above present fairly, in all material respects, the financial position of Barrett Opportunity Fund, Inc. as of August 31, 2012, the results of its operations for the year then ended, the changes in its net assets and the financial highlights for each of the two years in the period then ended, in conformity with accounting principles generally accepted in the United States of America. |
| | |
| |  |
| | COHEN FUND AUDIT SERVICES, LTD. |
| | |
| | Cleveland, Ohio |
| | October 24, 2012 |
Additional Information
(Unaudited)
1. INFORMATION ABOUT DIRECTORS AND OFFICERS
The business and affairs of the Fund are conducted by management under the supervision and subject to the direction of its Board of Directors. The business address of each Director is c/o Barrett Asset Management, LLC, the Fund’s investment manager (“Barrett Asset Management”), 90 Park Avenue, 34th Floor, New York, New York 10016. Information pertaining to the Directors and officers of the Fund is set forth below.
The Statement of Additional Information includes additional information about Directors and is available, without charge, upon request by calling the Fund at 1-877-363-6333.
| | | | | Number of | |
| | | | | Portfolios | |
| | | | | in Fund | Other Board |
| | Position(s) | Term of Office* | | Complex | Memberships |
| Name, Address | Held with | and Length of | Principal Occupation(s) | Overseen | Held by |
| and Birth Year | Fund | Time Served** | During Past 5 Years | by Director | Director |
INDEPENDENT DIRECTORS†: | | | | | |
| Barry Handel, CPA | Director | Since 2005 | Partner, Shalik, Morris & | 1 | None |
| Birth Year: 1951 | | | Company, LLP (accounting | | |
| | | | firm) (since 2010); formerly, | | |
| | | | Partner, Falk & Handel LLP | | |
| | | | (accounting firm) | | |
| | | | | | |
David H. Kochman(1) | Director | Since 2011 | Member, Harris Beach PLLC | 1 | None |
| Birth Year: 1959 | | | (law firm) | | |
| | | | | | |
Rosalind A. Kochman(2) | Director | Since 1990 | Retired (since 2002); formerly, | 1 | None |
| Birth Year: 1937 | | | Chief Executive Officer, | | |
| | Chairperson | Since 2005 | Brooklyn Eye Surgery Center, | | |
| | | | and Administrator, Kochman, | | |
| | | | Lebowitz & Mogil, MDs | | |
| | | | | | |
| William Morris, Jr., CPA | Director | Since 2005 | President, William Morris & | 1 | None |
| Birth Year: 1948 | | | Associates P.C. (accounting | | |
| | | | firm) | | |
| | | | | | |
| Irving Sonnenschein | Director | Since 1994 | Partner in the law firm of | 1 | None |
| Birth Year: 1920 | | | Sonnenschein, Sherman & | | |
| | | | Deutsch | | |
| | | | | | |
| OFFICERS: | | | | | |
| Peter H. Shriver, CFA | President | Since 2006 | President and Chief | N/A | N/A |
| Barrett Asset Management | and Chief | | Executive Officer of Barrett | | |
| 90 Park Avenue | Executive | | Asset Management (since | | |
| New York, NY 10016 | Officer | | 2011); President of Barrett | | |
| Birth Year: 1952 | | | Associates, Inc. (2004-2011) | | |
| (1) | Mr. Kochman is Ms. Kochman’s son. |
| (2) | Ms. Kochman is Mr. Kochman’s mother. |
| | | | | Number of | |
| | | | | Portfolios | |
| | | | | in Fund | Other Board |
| | Position(s) | Term of Office* | | Complex | Memberships |
| Name, Address | Held with | and Length of | Principal Occupation(s) | Overseen | Held by |
| and Birth Year | Fund | Time Served** | During Past 5 Years | by Director | Director |
| OFFICERS (Continued): | | | | | |
| E. Wells Beck, CFA | Vice | Since 2010 | Managing Director and | N/A | N/A |
| Barrett Asset Management | President | | Director of Research, Barrett | | |
| 90 Park Avenue | and | | Asset Management (since | | |
| New York, NY 10016 | Investment | | 2011); Managing Director, | | |
| Birth Year: 1968 | Officer | | Barrett Associates (2006-2011); | | |
| | | | Analyst and Portfolio | | |
| | | | Manager at Haven Capital | | |
| | | | Management (2001-2006) | | |
| | | | | | |
| Robert J. Milnamow | Vice | Since 2006 | Executive Vice President | N/A | N/A |
| Barrett Asset Management | President | | and Chief Investment | | |
| 90 Park Avenue | and Chief | | Officer, Barrett Asset | | |
| New York, NY 10016 | Investment | | Management (since 2011); | | |
| Birth Year: 1950 | Officer | | Managing Director, Barrett | | |
| | | | Associates (2003-2011) | | |
| | | | | | |
| Madeleine Morreale | Chief | Since 2011 | Chief Compliance Officer, | N/A | N/A |
| Barrett Asset Management | Compliance | | Barrett Asset Management | | |
| 90 Park Avenue | Officer | | (2011-Present); Compliance | | |
| New York, NY 10016 | and | | Officer, Barrett Associates | | |
| Birth Year: 1956 | Anti-Money | | (2010-2011); Head Trader, | | |
| | Laundering | | Barrett Associates | | |
| | Officer | | (2003-2010) | | |
| | | | | | |
| John G. Youngman | Chief | Since 2011 | Managing Director, | N/A | N/A |
| Barrett Asset Management | Financial | | Barrett Asset Management | | |
| 90 Park Avenue | Officer | | (2011-Present); Managing | | |
| New York, NY 10016 | and | | Director, Barrett Associates | | |
| Birth Year: 1968 | Treasurer | | (2010-2011); Managing | | |
| | | | Director, Griffin Asset | | |
| | | | Management (1994-2010) | | |
| † | Directors who are not “interested persons” of the Fund within the meaning of Section 2(a)(19) of the 1940 Act. |
| * | Each Director and officer serves until his respective successor has been duly elected and qualified or until his earlier death, resignation, retirement or removal. |
| ** | Indicates the earliest year in which the Director became a board member or the officer took such office. |
2. IMPORTANT TAX INFORMATION (UNAUDITED)
The following information is provided with respect to the distributions paid during the taxable year ended August 31, 2012:
| Record Date: | 12/21/2011 |
| Payable Date: | 12/22/2011 |
| Ordinary Income: | |
| Qualified Dividend Income for Individuals | 100.00% |
| Dividends Qualifying for the Dividends | |
| Received Deduction for Corporations | 100.00% |
| Long-Term Capital Gain Dividend | $2.73131 |
Please retain this information for your records.
3. CONSIDERATION OF INVESTMENT ADVISORY AGREEMENT (UNAUDITED)
Section 15(c) under the Investment Company Act of 1940, as amended (the “1940 Act”), requires that a registered investment company’s board of directors, including a majority of independent directors voting separately, approve any new investment advisory contract for the fund and thereafter to review and approve the terms of the fund’s investment advisory agreement on an annual basis.
At a meeting (the “Contract Renewal Meeting”) held in-person on April 26, 2012, the Board of Directors (the “Board”) of The Barrett Opportunity Fund, Inc. (the “Fund”), including a majority of its members that are not considered to be “interested persons” under the 1940 Act (the “Independent Directors”), considered and approved continuation of the Investment Advisory Agreement (the “Agreement”) for an additional one-year term. To assist in its consideration of the renewal of the Agreement, the Board received and considered a variety of information about Barrett Asset Management, LLC (the “Investment Adviser” or “Barrett Asset”), certain portions of which are discussed below. (The information provided to the Board relating to the renewal of the Investment Advisory Agreement at the Meeting is referred to in this section as the “Contract Approval Information”).
In addition to the Contract Approval Information, the Board received performance and other information throughout the year relating to the Fund’s operations and the services provided to it by the Investment Adviser. The Board’s evaluation of the Agreement took into account the information received throughout the year and also reflected the knowledge and familiarity gained as Board members of the Fund with respect to the services provided to the Fund by the Investment Adviser.
In its deliberations regarding the approval of the Agreement, the Board considered each of the factors below:
Nature, Extent and Quality of the Investment Advisory Services Provided to the Fund. The Board received and considered the Contract Approval Information regarding the nature, extent and quality of the investment advisory and other services provided to the Fund by the Investment during the past year. The Board reviewed the qualifications, backgrounds and responsibilities of the Investment Adviser’s senior personnel and the portfolio management team provided to the Fund, including, but not limited to, making the day-to-day decisions for investing the Fund’s assets in accordance with the Fund’s objectives and policies and investment restrictions, subject to the supervision and direction of the Board. Based on the factors below and other factors, the Board concluded that the services provided to the Fund under the Investment Advisory Agreement continued to be satisfactory under the circumstances.
Fund Performance. At the Meeting, the Board reviewed the information comparing past investment performance of the Fund against the S&P 500® Index and the Lipper Large-Cap Value Funds Index. The Board noted that, according to the information provided by the Investment Advisor, the Fund has substantially underperformed both the S&P 500® Index and the Lipper Large-Cap Value Funds Index for each of the 1-, 3- and 5-year periods. In assessing the reasons for the Fund’s comparative performance, the Board took into consideration that the Fund is managed in a tax-aware manner in light of its substantial unrealized capital gains and that the Fund’s investment strategy is conservative. The Board concluded that, in light of the constraints upon the Fund’s investment program, Barrett Asset has appropriate expertise to continue to manage the Fund in accordance with its investment objectives and strategies under current and anticipated market conditions notwithstanding the comparative performance information provided to the Board by Barrett Asset.
Investment Advisory Fees and Expense Ratio. The Board reviewed and considered the advisory fee (the “Advisory Fee”) paid by the Fund to the Investment Adviser under the Agreement. The Board received and considered information and analyses prepared using data provided by Morningstar as of March 31, 2012 comparing the Fund’s Contractual Advisory Fee and the Fund’s overall expenses with those of the funds in the expense universe (the “Expense Group”). The comparison was based upon the constituent funds’ latest fiscal years. The Expense Group consisted large cap value funds, as classified by Morningstar®, with assets between $25 million and $100 million. The information provided showed, among other things, that the contractual investment advisory fee for the Fund ranked in the second quartile of its Morningstar® Large Value Category and was below both the category average and median. The Fund’s total expense ratio of 1.202% was ranked in the third quartile of its Morningstar® Large Value Category and was below (i.e., better than) the category average total expense ratio of 1.211% but above (i.e., worse than) the Morningstar® Large Value Category median of 1.2%.
The Board noted that no comparative information was provided with respect to the Fund’s actual Advisory Fee (i.e., giving effect to any voluntary waivers implemented by the Investment Adviser with respect to the Fund and by managers of the other Expense Group funds). The Board noted that a voluntary waiver reducing the Advisory Fee by 0.05% would expire on April 29, 2012 and that the Investment Adviser declined to extend the waiver beyond that expiration date. The Board determined that the current rate and structure of the Advisory Fee is appropriate in light of the nature, extent and quality of services provided to the Fund by the Investment Adviser and the absence of any realistic alternative to the Investment Advisory Agreement, as discussed below.
The Board discussed the Investment Adviser’s management of other accounts, none of which is as large as the Fund, and the variability of fees paid in those instances. The Investment Adviser advised the Board that it does not manage any other accounts with investment objectives or asset levels comparable to the Fund’s. Based upon the Investment Adviser’s advice and the absence of any realistic alternative to the Investment Advisory Agreement, the Board determined that a comparison of the services rendered to the other accounts by the Investment Adviser to those provided to the Fund would not be sufficiently probative to give significant weight in assessing the Advisory Fee.
Adviser Profitability. Barrett Asset did not provide information as to its costs of providing services to the Fund or its profitability from the relationship with the Fund as requested by the Board and the Board, consequently, was unable to consider such information. The Board considered Barrett Asset’s general confirmation that its relationship with the Fund was profitable, although Barrett Asset was not able to provide guidance as to the magnitude of the profitability. Given the need to assure continuity in the investment advisory services to the Fund and the absence of any alternative to the Management Agreement, the Board did not give significant weight to the Fund’s profitability to Barrett Asset.
Economies of Scale. The Board considered that, while the Agreement does contain breakpoints for the Adviser to pass on economies of scale to the Fund, economies of scale are not likely to be realized since the Fund has decreased in size in recent years and is not actively marketed. They considered that any future growth in assets will occur through appreciation in the Fund’s portfolio holdings.
Other Benefits to the Investment Adviser. The Board considered other benefits received by the Investment Adviser as a result of its relationship with the Fund, including the opportunity to obtain research services from brokers who effect Fund portfolio transactions, but did not regard such benefits as excessive as the Fund’s low turnover limits the amount of commission dollars.
Other Alternatives to the Investment Advisory Agreement. The Board considered possible alternatives to the Agreement from the standpoint of the Fund and its shareholders. The Board considered whether another investment adviser (or advisers) might possibly be identified to perform all or a part of the advisory, administrative, or operational tasks that Barrett Asset provides but concluded that no other investment adviser was likely to be interested in managing the Fund’s portfolio given the small size of the Fund and the various portfolio management, marketing and other difficulties presented by its unrealized capital gains. The Board considered that the only alternative to the Agreement could be liquidation of the Fund. Because of the Fund’s unrealized capital gains, liquidation would carry significant adverse tax consequences to all shareholders. The Board noted that if the Fund continued to operate, those shareholders willing to accept the resulting tax consequences could redeem their shares in the Fund at any time while other shareholders wishing to remain in the Fund could do so.
* * * * * *
The Directors, including the Independent Directors, concluded that, under the Fund’s circumstances, the terms of the Agreement are acceptable and that the fees stated therein are reasonable in light of the services to be provided to the Fund and the need to assure continuity of investment advisory services to the Fund in the absence of any realistic alternative to the Agreement. In considering whether to approve the continuation of the Agreement, the Board principally identified its determination that continuation of the Fund’s operations would be in the interests of shareholders and that continuity of investment advisory services to the Fund therefore must be assured. The Board also separately considered the operational, administrative, and other services provided to the Fund. The Independent Directors were satisfied with the non-investment advisory services provided by Barrett Asset to the Fund and concluded that the Fund’s investment performance and expense levels (including the advisory fees) under the circumstances were not such as to support termination of the Agreement.
The Fund files its complete schedule of portfolio holdings with the Securities and Exchange Commission (“SEC”) for the first and third quarters of each fiscal year on Form N-Q. The Fund’s Forms N-Q are available on the SEC’s website at www.sec.gov. The Fund’s Forms N-Q may be reviewed and copied at the SEC’s Public Reference Room in Washington, D.C., and information on the operation of the Public Reference Room may be obtained by calling 1-800-SEC-0330. To obtain information on Form N-Q from the Fund, shareholders can call the Fund at 1-877-363-6333.
Information on how the Fund voted proxies relating to portfolio securities during the prior 12-month period ended June 30th of each year and a description of the policies and procedures that the Fund uses to determine how to vote proxies related to portfolio transactions are available (1) without charge, upon request, by calling the Fund at 1-877-363-6333 and (2) on the SEC’s website at www.sec.gov.
(This Page Intentionally Left Blank.)
BARRETT OPPORTUNITY FUND, INC.c/o U.S. Bancorp Fund Services, LLC
615 E. Michigan Street
Milwaukee, WI 53202
DIRECTORS
Barry Handel, CPA
David H. Kochman
Rosalind A. Kochman, Chairperson
William Morris, Jr., CPA
Irving Sonnenschein
INVESTMENT MANAGER
Barrett Asset Management, LLC
90 Park Avenue
New York, NY 10016
ADMINISTRATOR, FUND ACCOUNTANT & TRANSFER AGENT
U.S. Bancorp Fund Services, LLC
615 E. Michigan Street
Milwaukee, WI 53202
DISTRIBUTOR
Quasar Distributors, LLC
615 E. Michigan Street
Milwaukee, WI 53202
CUSTODIAN
U.S. Bank, N.A.
Custody Operations
1555 River Center Drive, Suite 302
Milwaukee, WI 53212
LEGAL COUNSEL
Simpson Thatcher & Bartlett, LLP
425 Lexington Avenue
New York, NY 10017
INDEPENDENT REGISTERED PUBLIC ACCOUNTING FIRM
Cohen Fund Audit Services, Ltd.
1350 Euclid Avenue, Suite 800
Cleveland, OH 44115
This report is transmitted to the shareholders of Barrett Opportunity Fund, Inc. for their information. This is not a prospectus, circular or representation intended for use in the purchase of shares of the Fund or any securities mentioned in this report.
This report must be preceded or accompanied by a free prospectus. Investors should consider the Fund’s investment objective, risks, charges and expenses carefully before investing. The prospectus contains this and other important information about the Fund. Please read the prospectus carefully before investing.
Item 2. Code of Ethics.
The registrant has adopted a code of ethics that applies to the registrant’s principal executive officer and principal financial officer. The registrant has not made any amendments to its code of ethics during the period covered by this report. The registrant has not granted any waivers from any provisions of the code of ethics during the period covered by this report.
Incorporated by reference to the registrant’s N-CSR filed on November 7, 2011.
Item 3. Audit Committee Financial Expert.
The registrant’s board of directors has determined that there is at least one audit committee financial expert serving on its audit committee. Mr. William Morris is the “audit committee financial expert” and is considered to be “independent” as each term is defined in Item 3 of Form N-CSR.
Item 4. Principal Accountant Fees and Services.
The registrant has engaged its principal accountant to perform audit services, audit-related services, tax services and other services during the past two fiscal years. “Audit services” refer to performing an audit of the registrant's annual financial statements or services that are normally provided by the accountant in connection with statutory and regulatory filings or engagements for those fiscal years. “Audit-related services” refer to the assurance and related services by the principal accountant that are reasonably related to the performance of the audit. “Tax services” refer to professional services rendered by the principal accountant for tax compliance, tax advice, and tax planning. There were no “Other services” provided by the principal accountant. The following table details the aggregate fees billed or expected to be billed for each of the last two fiscal years for audit fees, audit-related fees, tax fees and other fees by the principal accountant.
| | FYE 08/31/2012 | FYE 08/31/2011 |
| Audit Fees | 14,500 | 17,000 |
| Audit-Related Fees | 0 | 0 |
| Tax Fees | 2,500 | 2,500 |
| All Other Fees | 0 | 0 |
The audit committee has adopted pre-approval policies and procedures that require the audit committee to pre-approve all audit and non-audit services of the registrant, including services provided to any entity affiliated with the registrant.
The percentage of fees billed by Cohen Fund Audit Services, Ltd. applicable to non-audit services pursuant to waiver of pre-approval requirement were as follows:
| | FYE 08/31/2012 | FYE 08/31/2011 |
| Audit-Related Fees | 0% | 0% |
| Tax Fees | 0% | 0% |
| All Other Fees | 0% | 0% |
All of the principal accountant’s hours spent on auditing the registrant’s financial statements were attributed to work performed by full-time permanent employees of the principal accountant. The following table indicates the non-audit fees billed or expected to be billed by the registrant’s accountant for services to the registrant and to the registrant’s investment adviser (and any other controlling entity, etc.—not sub-adviser) for the last two years. The audit committee of the board of directors has considered whether the provision of non-audit services that were rendered to the registrant's investment adviser is compatible with maintaining the principal accountant's independence and has concluded that the provision of such non-audit services by the accountant has not compromised the accountant’s independence.
| Non-Audit Related Fees | FYE 08/31/2012 | FYE 08/31/2011 |
| Registrant | 0 | 0 |
| Registrant’s Investment Adviser | 0 | 0 |
Item 5. Audit Committee of Listed Registrants.
Not applicable to registrants who are not listed issuers (as defined in Rule 10A-3 under the Securities Exchange Act of 1934).
Item 6. Investments.
Schedule of Investments is included as part of the report to shareholders filed under Item 1 of this Form.
Item 7. Disclosure of Proxy Voting Policies and Procedures for Closed-End Management Investment Companies.
Not applicable to open-end investment companies.
Item 8. Portfolio Managers of Closed-End Management Investment Companies.
Not applicable to open-end investment companies.
Item 9. Purchases of Equity Securities by Closed-End Management Investment Company and Affiliated Purchasers.
Not applicable to open-end investment companies.
Item 10. Submission of Matters to a Vote of Security Holders.
Not Applicable.
Item 11. Controls and Procedures.
| (a) | The Registrant’s President and Treasurer have reviewed the Registrant's disclosure controls and procedures (as defined in Rule 30a-3(c) under the Investment Company Act of 1940 (the “Act”)) as of a date within 90 days of the filing of this report, as required by Rule 30a-3(b) under the Act and Rules 13a-15(b) or 15d-15(b) under the Securities Exchange Act of 1934. Based on their review, such officers have concluded that the disclosure controls and procedures are effective in ensuring that information required to be disclosed in this report is appropriately recorded, processed, summarized and reported and made known to them by others within the Registrant and by the Registrant’s service provider. |
| (b) | There were no changes in the Registrant's internal control over financial reporting (as defined in Rule 30a-3(d) under the Act) that occurred during the second fiscal quarter of the period covered by this report that has materially affected, or is reasonably likely to materially affect, the Registrant's internal control over financial reporting. |
Item 12. Exhibits.
| (a) | (1) Any code of ethics or amendment thereto, that is the subject of the disclosure required by Item 2, to the extent that the registrant intends to satisfy Item 2 requirements through filing an exhibit. Incorporated by reference to the registrant’s November 7, 2011 N-CSR filing. |
(2) A separate certification for each principal executive and principal financial officer pursuant to Section 302 of the Sarbanes-Oxley Act of 2002. Filed herewith.
(3) Any written solicitation to purchase securities under Rule 23c-1 under the Act sent or given during the period covered by the report by or on behalf of the registrant to 10 or more persons. Not applicable to open-end investment companies.
| (b) | Certifications pursuant to Section 906 of the Sarbanes-Oxley Act of 2002. Furnished herewith. |
SIGNATURES
Pursuant to the requirements of the Securities Exchange Act of 1934 and the Investment Company Act of 1940, the registrant has duly caused this report to be signed on its behalf by the undersigned, thereunto duly authorized.
(Registrant) Barrett Opportunity Fund
By (Signature and Title)*/s/ Peter Shriver
Peter Shriver, President
Date November 5, 2012
Pursuant to the requirements of the Securities Exchange Act of 1934 and the Investment Company Act of 1940, this report has been signed below by the following persons on behalf of the registrant and in the capacities and on the dates indicated.
By (Signature and Title)*/s/ Peter Shriver
Peter Shriver, President
Date November 5, 2012
By (Signature and Title)* /s/ John Youngman
John Youngman, Treasurer
* Print the name and title of each signing officer under his or her signature.