UNITED STATES
SECURITIES AND EXCHANGE COMMISSION
Washington, D.C. 20549
FORM N-CSR
CERTIFIED SHAREHOLDER REPORT OF REGISTERED
MANAGEMENT INVESTMENT COMPANIES
Investment Company Act file number 811-02884
Barrett Opportunity Fund, Inc.
(Exact name of registrant as specified in charter)
55 Water Street, New York, NY 10041
(Address of principal executive offices) (Zip code)
Robert I. Frenkel, Esq.
Legg Mason & Co., LLC
100 First Stamford Place
Stamford, CT 06902
(Name and address of agent for service)
Registrant’s telephone number, including area code:
Funds Investor Services 1-800-822-5544
Or
Institutional Shareholder Services 1-888-425-6432
Date of fiscal year end: August 31
Date of reporting period: August 31, 2010
| ITEM 1. | REPORT TO STOCKHOLDERS. |
The Annual Report to Stockholders is filed herewith.

Annual Report
August 31, 2010
INVESTMENT PRODUCTS: NOT FDIC INSURED Ÿ NO BANK GUARANTEE Ÿ MAY LOSE VALUE

BARRETT
OPPORTUNITY FUND, INC.
Annual Report • August 31, 2010
Fund Objectives | The Fund seeks to achieve above average long-term capital appreciation. Current income is a secondary objective. The Fund invests primarily in common stocks and securities convertible into or exchangeable for common stock such as convertible preferred stock or convertible debt securities. |
BARRETT
OPPORTUNITY FUND, INC.
Letter from the Chairperson | Dear Shareholder, |
We are pleased to provide the annual report of Barrett Opportunity Fund, Inc. for the twelve-month reporting period ended August 31, 2010.
The management team at Barrett Associates, Inc. has prepared the enclosed Manager Overview, which includes a brief market overview as well as a performance review. I urge you to read it as well as the accompanying financial statements. A detailed summary of the Fund’s performance and other pertinent information are also included in this report. I am sure you will find this report informative and useful.
On behalf of the Directors and the officers of the Fund, and in these difficult economic times, I thank you for your ongoing confidence in the Fund and its investment policies.
Sincerely,

Rosalind A. Kochman
Chairperson
September 24, 2010
1
BARRETT
OPPORTUNITY FUND, INC.
Manager Overview | Market Overview |
Stock markets around the world posted modest gains over the past twelve months. In the United States, the bulk of the gains occurred in the first quarter of the Fund’s fiscal year, which ended November 30, 2009. The November quarter proved to be the last hurrah for the huge market advance that started in March of 2009. Since the November quarter, the market has made very little progress, with the last two fiscal quarters actually showing small declines.
One of the reasons that stock markets stalled after the 2009 recovery was that monetary and fiscal policies around the world diverged in 2010. Pro-growth economic policies of major economies were all in sync during the depths of the 2008/2009 recession but reversed direction in many regions as economies recovered. For example, many European countries changed from a very stimulative monetary and fiscal policy to a more restrictive fiscal policy as a result of concerns about budget deficits, particularly in Greece and Spain. China also changed from pro-growth policies to tighter monetary and lending policies as a result of speculative real estate markets and other inflationary pressures. Other strong economies, such as India and Australia, also adopted more restrictive policies. Only the United States kept its policies unchanged with low interest rates and higher deficit spending. Once economies and markets recovered by the end of 2009, investors became less certain that global growth would remain strong as fiscal stimulus dissipated. It also became evident that consumers in the United States and many parts of Europe continued to reduce high debt levels and constrain discretionary spending in light of weak housing and employment situations. As a result, stock investors lost their nerve in early 2010 which led to an inability to mount sustainable market gains through August 31, 2010.
Stock investors can hardly be blamed for losing their patience with equity investing. For the past ten years, the Unites States stock market average annual total return, as measured by the S&P 500 Index, was negative. During the same period, bond returns, as measured by the Barclays Capital U.S. Aggregate Index, were positive. Despite historically low current yields, bond mutual funds have experienced inflows. When we compare current dividend yields to bond yields, it is our view that money should be flowing into equities, not bonds. Nonetheless, we believe the flow of funds into bonds and not into equities will have to reverse before the stock market can regain a more positive direction.
What will it take to generate a greater appetite for equities? Stock markets normally respond to improving earnings and lower interest rates as long as stock valuations are not excessive and investor spirits improve. The market gain in 2009 did, in fact, reflect the improved corporate profit outlook, but investors remain nervous. We believe there is a paralysis in Washington D.C. which has dented the confidence of business leaders and investors alike. There is an unusual amount of uncertainty around taxes and new regulations and the ultimate effects of such large deficits. Despite ten years of negative stock returns, the tax rates on dividends and capital gains are due to increase at the end of this year — hardly a boost of confidence for stock investors. It appears that the market is unconvinced that policies emanating from our Capitol will support corporate profitability in the face of increasing global competition. We believe official Washington needs not only to address high unemployment with longer benefits but also needs to reduce impediments to hiring and recognize that higher profits can set the stage for employment growth. Higher stock prices frequently are not only a leading indicator of improved economic growth but also can support stronger economic growth.
2
BARRETT
OPPORTUNITY FUND, INC.
Performance Review
During the twelve-month period ended August 31, 2010, the Fund’s total return was -1.38%. The Fund underperformed its unmanaged benchmark, the S&P 500 Index, over the past year primarily due to its underperformance in the first fiscal quarter. Since that period, the Fund has performed in line with the broad market.
At the individual company level, performance was very mixed. Among the Fund’s top ten positions, Chubb Corp., Koninklijke Philips Electronics N.V., Rayonier Inc. and Forest City Enterprises Inc. were very positive performers, whereas Bank of New York Mellon Corp., Leucadia National Corp. and Ameron International Corp. were the weakest. Royal Dutch Shell PLC performed in line with the market, and General Dynamics Corp. and Murphy Oil Corp. underperformed slightly. A few of the stocks that have been purchased more recently, such as Hershey Co. and Procter & Gamble Co., outperformed the market over the past year.
From a historical perspective, stock markets have typically rebounded after sustained periods of poor performance. We expect that the stock market will generate stronger returns going forward and believe that the Fund’s holdings are well positioned to participate in the market’s recovery.
| | | | | | | | | | |
Total Returns for Periods Ended August 31, 2010 (unaudited) |
| | | Total Returns | | Average Annual Total Returns |
| | | 6 Months | | 1 Year | | 3 Year | | 5 Year | | 10 Year |
Barrett Opportunity Fund, Inc. | | -5.39% | | -1.38% | | -12.90% | | -3.39% | | +0.35% |
S&P 500® Index1 | | -4.04% | | +4.91% | | -8.66% | | -0.91% | | -1.81% |
Lipper Multi-Cap Value Funds Category Average2 | | -4.41% | | +4.73% | | -9.65% | | -1.74% | | +2.17% |
The performance data quoted represent past performance. Past performance does not guarantee future results and current performance may be lower or higher than the performance data shown above. The investment return and principal value of an investment will fluctuate. An investor’s shares, when redeemed, may be worth more or less than their original cost. As economic and market conditions change frequently, there can be no assurance that trends described will continue or that forecasts will come to pass. Fund returns assume the reinvestment of all distributions, including returns of capital, if any, at net asset value and the deduction of all Fund expenses. Returns have not been adjusted to include the deduction of taxes that a shareholder would pay on Fund distributions. Performance data current to the most recent month-end may be obtained by calling Funds Investor Services at 1-800-822-5544 or Institutional Shareholder Services at 1-888-425-6432. Shares of the Fund are distributed by Legg Mason Investor Services, LLC (“LMIS”) (Member SIPC/FINRA). LMIS and Barrett Associates, Inc., the Fund’s investment manager, are both wholly-owned subsidiaries of Legg Mason, Inc.
The Fund’s total annual operating expense ratio as of the Fund’s most current prospectus dated December 29, 2009 was 1.31%.
All investing entails risk, including the possible loss of principal. The Fund is non-diversified, which means that it can invest a higher percentage of its assets in any one issuer than a diversified fund. Being non-diversified may magnify the Fund’s losses from events affecting a particular issuer. Please see the Fund’s current prospectus for more information on this and other risks.
| | 1 | The S&P 500® Index is a market-value weighted index comprised of 500 widely held common stocks. It is not possible to invest directly in the Index. The Index does not reflect deductions for fees, expenses or taxes. |
| | 2 | Lipper Multi-Cap Value Funds Category Average includes funds which invest in a variety of market cap ranges, generally have between 25-75% of their equity assets in companies with market caps above 300% of the dollar-weighted median of the S&P MidCap 400 Index, invest in companies considered to be undervalued, and have below-average price-to-earnings ratios, price-to-book ratios, and three-year earnings growth figures. |
3
BARRETT
OPPORTUNITY FUND, INC.
Thank you for your continued interest in the Fund.
Sincerely,
| | |

Robert Milnamow Portfolio Manager | | 
E. Wells Beck, CFA Portfolio Manager |
September 14, 2010
The outlook and views presented above are those of the Fund’s portfolio managers as of September 14, 2010 and are subject to change. This information is intended for the shareholders of the Fund and is not for distribution to prospective investors unless preceded or accompanied by a current prospectus. Investors should consider the risks, investment objective, charges and expenses of the Fund carefully before investing. The prospectus, which contains this and other information about the Fund, is available at www.barrettassociates.com. Investors should read the prospectus carefully before investing.
4
BARRETT
OPPORTUNITY FUND, INC.
Fund at a Glance (Unaudited)
| | | | |
Top Ten Holdings - as of 8/31/2010
(As a percentage of Total Investments) | | | | Sector Weightings - as of 8/31/2010
(As a percentage of Total Investments) |
| | |
Chubb Corp. | | 17.7% | | 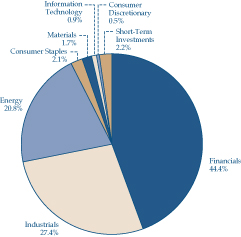 |
Royal Dutch Shell PLC, ADR, Class A Shares | | 12.9% | |
Bank of New York Mellon Corp. | | 12.6% | |
Koninklijke Philips Electronics N.V., New York Registered Shares | | 11.4% | |
General Dynamics Corp. | | 8.4% | |
Murphy Oil Corp. | | 7.4% | |
Rayonier Inc. | | 4.8% | |
Leucadia National Corp. | | 4.3% | |
Ameron International Corp. | | 3.5% | |
Forest City Enterprises Inc., Class B Shares | | 2.0% | |
| | | |
| | | |
| | | |
| | | |
| | | |
| | | |
5
BARRETT
OPPORTUNITY FUND, INC.
Fund Expenses (Unaudited)
Example
As a shareholder of the Fund, you may incur two types of costs: (1) transaction costs; and (2) ongoing costs, including management fees and other Fund expenses. This example is intended to help you understand your ongoing costs (in dollars) of investing in the Fund and to compare these costs with the ongoing costs of investing in other mutual funds.
This example is based on an investment of $1,000 invested on March 1, 2010 and held for the six months ended August 31, 2010.
Actual Expenses
The table below titled “Based on Actual Total Return” provides information about actual account values and actual expenses. You may use the information provided in this table, together with the amount you invested, to estimate the expenses that you paid over the period. To estimate the expenses you paid on your account, divide your ending account value by $1,000 (for example, an $8,600 ending account value divided by $1,000 = 8.6), then multiply the result by the number under the heading entitled “Expenses Paid During the Period”.
Based on Actual Total Return1
| | | | | | | | | | | | | | | | | | | | |
| | | Actual
Total Return2 | | | Beginning
Account
Value | | | Ending
Account
Value | | | Annualized
Expense
Ratio | | | Expenses
Paid During
the Period3 | |
Barrett Opportunity Fund, Inc. | | | -5.39% | | | $ | 1,000.00 | | | $ | 946.10 | | | | 1.08 | % | | $ | 5.30 | |
| 1 | | For the six months ended August 31, 2010. |
| 2 | | Assumes the reinvestment of all distributions, including returns of capital, if any, at net asset value. Total return is not annualized, as it may not be representative of the total return for the year. Performance figures may reflect compensating balance arrangements, fee waivers and/or expense reimbursements. In the absence of compensating balance arrangements, fee waivers and/or expense reimbursements, the total return would have been lower. Past performance is no guarantee of future results. |
| 3 | | Expenses (net of compensating balance arrangements, fee waivers and/or expense reimbursements) are equal to the Fund’s annualized expense ratio, multiplied by the average account value over the period, multiplied by the number of days in the most recent fiscal half-year (184), then divided by 365. |
6
BARRETT
OPPORTUNITY FUND, INC.
Fund Expenses (Unaudited) (Continued)
Hypothetical Example for Comparison Purposes
The table below titled “Based on Hypothetical Total Return” provides information about hypothetical account values and hypothetical expenses based on the actual expense ratio and an assumed rate of return of 5.00% per year before expenses, which is not the Fund’s actual return. The hypothetical account values and expenses may not be used to estimate the actual ending account balance or expenses you paid for the period. You may use the information provided in this table to compare the ongoing costs of investing in the Fund and other funds. To do so, compare the 5.00% hypothetical example relating to the Fund with the 5.00% hypothetical examples that appear in the shareholder reports of the other funds.
Please note that the expenses shown in the table below are meant to highlight your ongoing costs only and do not reflect any transactional costs. Therefore, the table is useful in comparing ongoing costs only, and will not help you determine the relative total costs of owning different funds. In addition, if these transaction costs were included, your costs would have been higher.
Based on Hypothetical Total Return1
| | | | | | | | | | | | | | | | | | | | |
| | | Hypothetical
Annualized
Total Return | | | Beginning
Account
Value | | | Ending
Account
Value | | | Annualized
Expense
Ratio | | | Expenses
Paid During
the Period2 | |
Barrett Opportunity Fund, Inc. | | | 5.00 | % | | $ | 1,000.00 | | | $ | 1,019.76 | | | | 1.08 | % | | $ | 5.50 | |
| 1 | | For the six months ended August 31, 2010. |
| 2 | | Expenses (net of compensating balance arrangements, fee waivers and/or expense reimbursements) are equal to the Fund’s annualized expense ratio, multiplied by the average account value over the period, multiplied by the number of days in the most recent fiscal half-year (184), then divided by 365. |
7
BARRETT
OPPORTUNITY FUND, INC.
Fund Performance
Average Annual Total Returns1 (Unaudited)
| | | | |
Twelve Months Ended 8/31/10 | | | -1.38 | % |
Five Years Ended 8/31/10 | | | -3.39 | |
Ten Years Ended 8/31/10 | | | 0.35 | |
2/28/79* through 8/31/10 | | | 10.78 | |
Cumulative Total Return1 (Unaudited)
| | | | |
8/31/00 through 8/31/10 | | | 3.55 | % |
| 1 | | Assumes the reinvestment of all distributions at net asset value. All figures represent past performance and are not a guarantee of future results. Investment return and principal value of an investment will fluctuate so that an investor’s shares, when redeemed, may be worth more or less than their original cost. Performance figures may reflect compensating balance arrangements, fee waivers and/or expense reimbursements. In the absence of compensating balance arrangements, fee waivers and/or expense reimbursements, the total return would have been lower. |
8
BARRETT
OPPORTUNITY FUND, INC.
Historical Performance (Unaudited)
Value of $10,000 Invested in Barrett Opportunity Fund, Inc. vs. the S&P 500® Index† (August 2000 – August 2010)
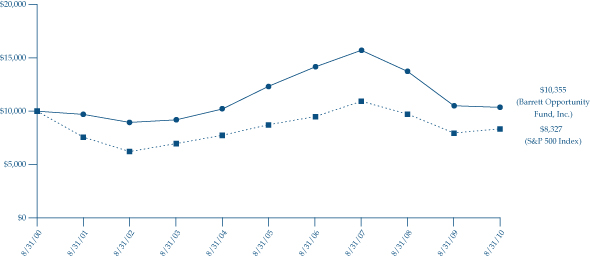
| † | | Hypothetical illustration of $10,000 invested in Barrett Opportunity Fund, Inc. on August 31, 2000 assuming the reinvestment of all distributions, including returns of capital, if any, at net asset value through August 31, 2010. The S&P 500® Index is a market-value weighted index comprised of 500 widely held common stocks. The Index is unmanaged and it is not subject to the same management and trading expenses of a mutual fund. Please note that an investor cannot invest directly in an index. |
All figures represent past performance and are not a guarantee of future results. Investment returns and principal value of an investment will fluctuate so that an investor’s shares, when redeemed, may be worth more or less than their original cost. The returns shown do not reflect the deduction of taxes that a shareholder would pay on Fund distributions or the redemption of Fund shares. Performance figures may reflect compensating balance arrangements, fee waivers and/or expense reimbursements. In the absence of compensating balance arrangements, fee waivers and/or expense reimbursements, the total return would have been lower.
9
BARRETT
OPPORTUNITY FUND, INC.
Schedule of Investments
August 31, 2010
| | | | | | | | |
Shares | | |
Security | | Value | |
| | | | COMMON STOCKS - 98.7% | |
| | | | CONSUMER DISCRETIONARY - 0.6% | |
| | | | Media - 0.6% | | | | |
| | 9,800 | | | Omnicom Group Inc. | | $ | 343,098 | |
| | | | | | | | |
| |
| | | | CONSUMER STAPLES - 2.1% | |
| | | | Food & Staples Retailing - 0.0% | |
| | 96,000 | | | FHC Delaware Inc.*(a)(b) | | | 0 | |
| | | | | | | | |
| | | | Food Products - 0.8% | | | | |
| | 10,000 | | | Hershey Co. | | | 464,700 | |
| | | | | | | | |
| | | | Household Products - 1.3% | | | | |
| | 14,100 | | | Procter & Gamble Co. | | | 841,347 | |
| | | | | | | | |
| | | | Total Consumer Staples | | | 1,306,047 | |
| | | | | | | | |
| | |
| | | | ENERGY - 20.9% | | | | |
| | | | Oil, Gas & Consumable Fuels - 20.9% | |
| | 87,300 | | | Murphy Oil Corp. | | | 4,675,788 | |
| | 9,100 | | | Overseas Shipholding Group Inc. | | | 293,020 | |
| | 155,100 | | | Royal Dutch Shell PLC, ADR, Class A Shares | | | 8,228,055 | |
| | | | | | | | |
| | | | Total Energy | | | 13,196,863 | |
| | | | | | | | |
| | | | FINANCIALS - 44.8% | | | | |
| | | | Capital Markets - 12.7% | | | | |
| | 329,971 | | | Bank of New York Mellon Corp. | | | 8,008,396 | |
| | | | | | | | |
| | | | Diversified Financial Services - 4.3% | |
| | 126,800 | | | Leucadia National Corp.* | | | 2,707,180 | |
| | | | | | | | |
| | | | Insurance - 19.2% | | | | |
| | 204,500 | | | Chubb Corp. | | | 11,272,040 | |
| | 24,000 | | | Loews Corp. | | | 843,360 | |
| | | | | | | | |
| | | | Total Insurance | | | 12,115,400 | |
| | | | | | | | |
| | | | Real Estate Investment Trusts
(REITs) - 4.8% | |
| | 63,990 | | | Rayonier Inc. | | | 3,026,727 | |
| | | | | | | | |
| | | | | | | | |
Shares | | |
Security | | Value | |
| | | | Real Estate Management & Development - 3.8% | | | | |
| | 100,400 | | | Forest City Enterprises Inc., Class A Shares* | | $ | 1,131,508 | |
| | 112,500 | | | Forest City Enterprises Inc., Class B Shares*(c) | | | 1,270,125 | |
| | | | | | | | |
| | | | Total Real Estate Management & Development | | | 2,401,633 | |
| | | | | | | | |
| | | | Total Financials | | | 28,259,336 | |
| | | | | | | | |
| | | | INDUSTRIALS - 27.7% | | | | |
| | | | Aerospace & Defense - 9.5% | | | | |
| | 95,300 | | | General Dynamics Corp. | | | 5,324,411 | |
| | 9,700 | | | Lockheed Martin Corp. | | | 674,344 | |
| | | | | | | | |
| | | | Total Aerospace & Defense | | | 5,998,755 | |
| | | | | | | | |
| | | | Building Products - 3.6% | | | | |
| | 39,500 | | | Ameron International Corp. | | | 2,226,220 | |
| | | | | | | | |
| | | | Commercial Services & Supplies - 0.4% | |
| | 93,850 | | | TRC Cos. Inc.* | | | 267,473 | |
| | | | | | | | |
| | | | Electrical Equipment - 0.6% | | | | |
| | 18,900 | | | ABB Ltd., ADR* | | | 366,093 | |
| | | | | | | | |
| | | | Industrial Conglomerates - 12.4% | |
| | 7,000 | | | 3M Co. | | | 549,850 | |
| | 260,210 | | | Koninklijke Philips Electronics N.V., New York Registered Shares | | | 7,262,461 | |
| | | | | | | | |
| | | | Total Industrial Conglomerates | | | 7,812,311 | |
| | | | | | | | |
| | | | Marine - 1.2% | | | | |
| | 22,800 | | | Alexander & Baldwin Inc. | | | 771,552 | |
| | | | | | | | |
| | | | Total Industrials | | | 17,442,404 | |
| | | | | | | | |
| | | | INFORMATION TECHNOLOGY - 0.9% | |
| | | | IT Services - 0.9% | | | | |
| | 15,000 | | | Automatic Data Processing Inc. | | | 579,150 | |
| | | | | | | | |
See Notes to Financial Statements.
10
BARRETT
OPPORTUNITY FUND, INC.
Schedule of Investments (Continued)
August 31, 2010
| | | | | | | | |
Shares | | |
Security | | Value | |
| | | | MATERIALS - 1.7% | | | | |
| | | | Chemicals - 1.7% | | | | |
| | 20,242 | | | Monsanto Co. | | $ | 1,065,741 | |
| | | | | | | | |
| | | | Total Investments Before Short-term Investments (Cost - $10,492,133) | | | 62,192,639 | |
| | | | | | | | |
Face
Amount | | | | | | |
| | | | SHORT-TERM INVESTMENTS - 2.2% | |
| | | | Repurchase Agreement - 2.2% | |
| | $1,386,000 | | | State Street Bank & Trust Co., repurchase agreement dated 8/31/10, 0.010% due 9/1/10; Proceeds at maturity - $1,386,000; (Fully collateralized by U.S. Treasury Notes,
2.500% due 4/30/15;
Market value - $1,416,982)
(Cost - $1,386,000) | | | 1,386,000 | |
| | | | | | | | |
| | | | Total Investments - 100.9% (Cost - $11,878,133#) | | | 63,578,639 | |
| | | | | | | | |
| | | | Liabilities in Excess of Other Assets - (0.9)% | | | (540,761 | ) |
| | | | | | | | |
| | | | Total Net Assets - 100.0% | | $ | 63,037,878 | |
| | | | | | | | |
| * | Non-income producing security. |
| (a) | Security is valued in good faith at fair value in accordance with procedures approved by the Board of Directors (See Note 1). |
| (c) | Convertible into Forest City Enterprises Inc., Class A Shares. |
| # | Aggregate cost for federal income tax purposes is substantially the same. |
| | Abbreviation used in this schedule: |
| | ADR—American Depositary Receipt |
See Notes to Financial Statements.
11
BARRETT
OPPORTUNITY FUND, INC.
Statement of Assets and Liabilities
August 31, 2010
| | | | |
ASSETS: | | | | |
Investments, at value
(Cost - $11,878,133) | | $ | 63,578,639 | |
Cash | | | 102 | |
Dividends receivable | | | 152,742 | |
Receivable for Fund shares sold | | | 450 | |
Prepaid expenses | | | 15,290 | |
| | | | |
Total assets | | | 63,747,223 | |
| | | | |
LIABILITIES: | | | | |
Payable for securities purchased | | | 563,266 | |
Investment management fee payable | | | 41,376 | |
Payable for Fund shares repurchased | | | 10,883 | |
Directors’ fees payable | | | 7,900 | |
Accrued expenses | | | 85,920 | |
| | | | |
Total liabilities | | | 709,345 | |
| | | | |
Total net assets | | $ | 63,037,878 | |
| | | | |
NET ASSETS: | | | | |
Par value (Note 5) | | $ | 20,647 | |
Paid-in capital in excess of par value | | | 7,390,771 | |
Undistributed net investment income | | | 306,905 | |
Accumulated net realized gain on investments | | | 3,619,049 | |
Net unrealized appreciation on investments | | | 51,700,506 | |
| | | | |
Total net assets | | $ | 63,037,878 | |
| | | | |
Shares outstanding | | | 2,064,688 | |
| | | | |
Net asset value | | | $30.53 | |
| | | | |
Statement of Operations
For the Year Ended August 31, 2010
| | | | |
INVESTMENT INCOME: | | | | |
Dividends | | $ | 1,743,856 | |
Interest | | | 73 | |
Less: Foreign taxes withheld | | | (116,015 | ) |
| | | | |
Total investment income | | | 1,627,914 | |
| | | | |
| |
EXPENSES: | | | | |
Investment management fee (Note 2) | | | 519,678 | |
Legal fees | | | 106,735 | |
Directors’ fees | | | 55,086 | |
Audit and tax | | | 44,200 | |
Shareholder reports | | | 40,978 | |
Transfer agent fees | | | 28,260 | |
Registration fees | | | 27,150 | |
Insurance | | | 2,689 | |
Custody fees | | | 346 | |
Miscellaneous expenses | | | 3,220 | |
| | | | |
Total expenses | | | 828,342 | |
| | | | |
Net investment income | | | 799,572 | |
| | | | |
| |
REALIZED AND UNREALIZED GAIN (LOSS) ON INVESTMENTS (NOTES 1, 3 AND 6): | | | | |
Net realized gain from investment transactions | | | 3,656,284 | |
Change in net unrealized appreciation (depreciation) from investments | | | (5,120,732 | ) |
| | | | |
Net loss on investments | | | (1,464,448 | ) |
| | | | |
Decrease in net assets from operations | | $ | (664,876 | ) |
| | | | |
See Notes to Financial Statements.
12
BARRETT
OPPORTUNITY FUND, INC.
Statements of Changes in Net Assets
For the Years Ended August 31,
| | | | | | | | |
| | | 2010 | | | 2009 | |
OPERATIONS: | | | | | | | | |
Net investment income | | $ | 799,572 | | | $ | 1,047,902 | |
Net realized gain | | | 3,656,284 | | | | 4,277,202 | |
Change in net unrealized appreciation (depreciation) | | | (5,120,732 | ) | | | (34,264,381 | ) |
| | | | | | | | |
Decrease in net assets from operations | | | (664,876 | ) | | | (28,939,277 | ) |
| | | | | | | | |
| | | | | | | | |
DISTRIBUTIONS TO SHAREHOLDERS FROM (NOTES 1 and 7): | | | | | | | | |
Net investment income | | | (1,000,003 | ) | | | (1,300,001 | ) |
Net realized gains | | | (2,850,011 | ) | | | (9,524,702 | ) |
| | | | | | | | |
Decrease in net assets from distributions to shareholders | | | (3,850,014 | ) | | | (10,824,703 | ) |
| | | | | | | | |
| | | | | | | | |
FUND SHARE TRANSACTIONS (NOTES 5 and 6): | | | | | | | | |
Net proceeds from sale of shares | | | 103,345 | | | | 293,562 | |
Reinvestment of distributions | | | 2,241,652 | | | | 5,697,627 | |
Cost of shares repurchased | | | (4,442,673 | ) | | | (10,340,451 | ) |
| | | | | | | | |
Decrease in net assets from fund share transactions | | | (2,097,676 | ) | | | (4,349,262 | ) |
| | | | | | | | |
Decrease in net assets | | | (6,612,566 | ) | | | (44,113,242 | ) |
| | | | | | | | |
NET ASSETS: | | | | | | | | |
Beginning of year | | | 69,650,444 | | | | 113,763,686 | |
| | | | | | | | |
End of year* | | $ | 63,037,878 | | | $ | 69,650,444 | |
| | | | | | | | |
*Includes undistributed net investment income of: | | | $306,905 | | | | $507,336 | |
| | | | | | | | |
See Notes to Financial Statements.
13
BARRETT
OPPORTUNITY FUND, INC.
Financial Highlights
For a share of capital stock outstanding throughout each year ended August 31:
| | | | | | | | | | | | | | | |
| | | 2010 | | | 2009 | | | 2008 | | | 2007 | | | 2006 | |
NET ASSET VALUE | | | | | | | | | | | | | | | |
Beginning of year | | $32.72 | | | $50.14 | | | $60.62 | | | $56.71 | | | $50.98 | |
| | | | | | | | | | | | | | | |
INCOME (LOSS) FROM OPERATIONS: | | | | | | | | | | | | | | | |
Net investment income | | 0.39 | | | 0.49 | | | 0.48 | | | 0.45 | | | 0.32 | |
Net realized and unrealized gain (loss) | | (0.74 | ) | | (13.02 | ) | | (7.55 | ) | | 5.67 | | | 7.04 | |
| | | | | | | | | | | | | | | |
Total Income (Loss) From Operations | | (0.35 | ) | | (12.53 | ) | | (7.07 | ) | | 6.12 | | | 7.36 | |
| | | | | | | | | | | | | | | |
LESS DISTRIBUTIONS FROM: | | | | | | | | | | | | | | | |
Net investment income | | (0.48 | ) | | (0.59 | ) | | (0.37 | ) | | (0.35 | ) | | (0.46 | ) |
Net realized gains | | (1.36 | ) | | (4.30 | ) | | (3.04 | ) | | (1.86 | ) | | (1.17 | ) |
| | | | | | | | | | | | | | | |
Total Distributions | | (1.84 | ) | | (4.89 | ) | | (3.41 | ) | | (2.21 | ) | | (1.63 | ) |
| | | | | | | | | | | | | | | |
NET ASSET VALUE | | | | | | | | | | | | | | | |
End of year | | $30.53 | | | $32.72 | | | $50.14 | | | $60.62 | | | $56.71 | |
| | | | | | | | | | | | | | | |
Total return1 | | (1.38 | )% | | (23.37 | )% | | (12.55 | )% | | 10.92 | % | | 14.79 | % |
Net Assets, end of year (millions) | | $63 | | | $70 | | | $114 | | | $148 | | | $158 | |
RATIOS TO AVERAGE NET ASSETS: | | | | | | | | | | | | | | | |
Gross expenses | | 1.20 | % | | 1.31 | % | | 1.03 | % | | 1.01 | % | | 1.04 | % |
Net expenses | | 1.20 | | | 1.31 | | | 1.03 | | | 1.01 | | | 1.04 | 2 |
Net investment income | | 1.15 | | | 1.50 | | | 0.83 | | | 0.70 | | | 0.66 | |
Portfolio Turnover Rate | | 3 | % | | 0 | %3,4 | | 3 | %3 | | 6 | % | | 0 | %3,4 |
| 1 | Performance figures may reflect compensating balance arrangements, fee waivers and/or expense reimbursements. In the absence of compensating balance arrangements, fee waivers and/or expense reimbursements, the total return would have been lower. Past performance is no guarantee of future results. |
| 2 | Reflects fee waivers and/or expense reimbursements. |
| 3 | Excludes the value of portfolio securities delivered as a result of in-kind redemptions of the Fund’s capital shares. |
| 4 | Amount represents less than 1%. |
See Notes to Financial Statements.
14
BARRETT
OPPORTUNITY FUND, INC.
Notes to Financial Statements
1. ORGANIZATION AND SIGNIFICANT ACCOUNTING POLICIES | Barrett Opportunity Fund, Inc. (the “Fund”) is registered as a non-diversified, open-end management investment company under the Investment Company Act of 1940, as amended (the “1940 Act”). |
The following are significant accounting policies consistently followed by the Fund and are in conformity with U.S. generally accepted accounting principles (“GAAP”). Estimates and assumptions are required to be made regarding assets, liabilities and changes in net assets resulting from operations when financial statements are prepared. Changes in the economic environment, financial markets and any other parameters used in determining these estimates could cause actual results to differ. Subsequent events have been evaluated through the date the financial statements were issued.
(a) Investment Valuation
Equity securities for which market quotations are available are valued at the last reported sales price or official closing price on the primary market or exchange on which they trade. Debt securities are valued at the mean between the last quoted bid and asked prices provided by an independent pricing service, which are based on transactions in debt obligations, quotations from bond dealers, market transactions in comparable securities and various other relationships between securities. When prices are not readily available, or are determined not to reflect fair value, such as when the value of a security has been significantly affected by events after the close of the exchange or market on which the security is principally traded, but before the Fund calculates its net asset value, the Fund values these securities at fair value as determined in accordance with procedures approved by the Fund’s Board of Directors. Short-term obligations with maturities of 60 days or less are valued at amortized cost, which approximates fair value.
The Fund has adopted Financial Accounting Standards Board Codification Topic 820 (formerly, Statement of Financial Accounting Standards No. 157) (“ASC Topic 820”). ASC Topic 820 establishes a single definition of fair value, creates a three-tier hierarchy as a framework for measuring fair value based on inputs used to value the Fund’s investments, and requires additional disclosure about fair value. The hierarchy of inputs is summarized below.
| | • | | Level 1 - quoted prices in active markets for identical investments |
| | • | | Level 2 - other significant observable inputs (including quoted prices for similar investments, interest rates, prepayment speeds, credit risk, etc.) |
| | • | | Level 3 - significant unobservable inputs (including the Fund’s own assumptions in determining the fair value of investments) |
The inputs or methodology used for valuing securities are not necessarily an indication of the risk associated with investing in those securities.
15
BARRETT
OPPORTUNITY FUND, INC.
The Fund uses valuation techniques to measure fair value that are consistent with the market approach and/or income approach, depending on the type of the security and the particular circumstance. The market approach uses prices and other relevant information generated by market transactions involving identical or comparable securities. The income approach uses valuation techniques to discount estimated future cash flows to present value.
The following is a summary of the inputs used in valuing the Fund’s assets carried at fair value:
| | | | | | | | | | | | | |
Description | | Quoted
Prices
(Level 1) | | Other
Significant
Observable
Inputs
(Level 2) | | Significant
Unobservable
Inputs
(Level 3) | | | Total |
Common stocks† | | $ | 62,192,639 | | | — | | $ | 0 | * | | $ | 62,192,639 |
Short-term investments† | | | — | | $ | 1,386,000 | | | — | | | | 1,386,000 |
| | | | | | | | | | | | | |
Total investments | | $ | 62,192,639 | | $ | 1,386,000 | | $ | 0 | * | | $ | 63,578,639 |
| | | | | | | | | | | | | |
| | † | See Schedule of Investments for additional detailed categorizations. |
The following is a reconciliation of investments in which significant unobservable inputs (Level 3) were used in determining fair value:
| | | | |
| | | Common
Stocks | |
| Investments in Securities | | Consumer
Staples | |
Balance as of August 31, 2009 | | $ | 0 | † |
Accrued premium/discounts | | | — | |
Realized gain (loss) | | | — | |
Change in unrealized appreciation (depreciation)‡ | | | 72,000 | |
Net purchases (sales) | | | (72,000 | ) |
Net transfers in and/or out of Level 3 | | | — | |
| | | | |
Balance as of August 31, 2010 | | $ | 0 | † |
| | | | |
Net change in unrealized appreciation (depreciation) for investments in securities still held at August 31, 2010‡ | | $ | 72,000 | |
| | | | |
| | ‡ | This amount is included in the change in net unrealized appreciation (depreciation) in the accompanying Statement of Operations. Change in unrealized appreciation (depreciation) includes net unrealized appreciation (depreciation) resulting from changes in investment values during the reporting period and the reversal of previously recorded unrealized appreciation (depreciation) when gains or losses are realized. |
(b) Repurchase Agreements
The Fund may enter into repurchase agreements with institutions that its investment adviser has determined are creditworthy. Each repurchase agreement
16
BARRETT
OPPORTUNITY FUND, INC.
is recorded at cost. Under the terms of a typical repurchase agreement, the Fund acquires a debt security subject to an obligation of the seller to repurchase, and of the Fund to resell, the security at an agreed-upon price and time, thereby determining the yield during the Fund’s holding period. When entering into repurchase agreements, it is the Fund’s policy that its custodian or a third party custodian, acting on the Fund’s behalf, take possession of the underlying collateral securities, the market value of which, at all times, at least equals the principal amount of the repurchase transaction, including accrued interest. To the extent that any repurchase transaction maturity exceeds one business day, the value of the collateral is marked to market and measured against the value of the agreement in an effort to ensure the adequacy of the collateral. If the counterparty defaults, the Fund generally has the right to use the collateral to satisfy the terms of the repurchase transaction. However, if the market value of the collateral declines during the period in which the Fund seeks to assert its rights or if bankruptcy proceedings are commenced with respect to the seller of the security, realization of the collateral by the Fund may be delayed or limited.
(c) Security Transactions and Investment Income
Security transactions are accounted for on a trade date basis. Interest income, adjusted for amortization of premium and accretion of discount, is recorded on the accrual basis. Dividend income is recorded on the ex-dividend date. Foreign dividend income is recorded on the ex-dividend date or as soon as practicable after the Fund determines the existence of a dividend declaration after exercising reasonable due diligence. The cost of investments sold is determined by use of the specific identification method. To the extent any issuer defaults or a credit event occurs that impacts the issuer, the Fund may halt any additional interest income accruals and consider the realizability of interest accrued up to the date of default or credit event.
(d) Distributions to Shareholders
Distributions from net investment income and distributions of net realized gains, if any, are declared at least annually. Distributions to shareholders of the Fund are recorded on the ex-dividend date and are determined in accordance with income tax regulations, which may differ from GAAP.
(e) REIT Distributions
The character of distributions received from Real Estate Investment Trusts (“REITs”) held by the Fund is generally comprised of net investment income, capital gains, and return of capital. It is the policy of the Fund to estimate the character of distributions received from underlying REITs based on historical data provided by the REITs. After each calendar year end, REITs report the actual tax character of these distributions. Differences between the estimated and actual amounts reported by the REITs are reflected in the Fund’s records in the year in which they are reported by the REITs by adjusting related investment cost basis, capital gains and income, as necessary.
17
BARRETT
OPPORTUNITY FUND, INC.
(f) Federal and Other Taxes
It is the Fund’s policy to comply with the federal income and excise tax requirements of the Internal Revenue Code of 1986 (the “Code”), as amended, applicable to regulated investment companies. Accordingly, the Fund intends to distribute its taxable income and net realized gains, if any, to shareholders in accordance with timing requirements imposed by the Code. Therefore, no federal income tax provision is required in the Fund’s financial statements.
Management has analyzed the Fund’s tax positions taken on federal income tax returns for all open tax years and has concluded that as of August 31, 2010, no provision for income tax is required in the Fund’s financial statements. The Fund’s federal and state income and federal excise tax returns for tax years for which the applicable statutes of limitations have not expired are subject to examination by Internal Revenue Service and state departments of revenue.
Under the applicable foreign tax laws, a withholding tax may be imposed on interest, dividends and capital gains at various rates.
(g) Reclassification
GAAP requires that certain components of net assets be reclassified to reflect permanent differences between financial and tax reporting. These reclassifications have no effect on net assets or net asset values per share. During the current year, the Fund had no reclassifications.
2. INVESTMENT MANAGEMENT AGREEMENT AND OTHER TRANSACTIONS WITH AFFILIATES | Barrett Associates, Inc. (“Barrett”) is the Fund’s investment manager. Barrett is a wholly-owned subsidiary of Legg Mason, Inc. (“Legg Mason”). Under the investment management agreement, the Fund pays an investment management fee, calculated daily and paid monthly, in accordance with the following breakpoint schedule: |
| | | |
Average Daily Net Assets | | Annual Rate | |
| First $1 billion | | 0.750 | % |
| Next $1 billion | | 0.725 | |
| Next $3 billion | | 0.700 | |
| Next $5 billion | | 0.675 | |
| Over $10 billion | | 0.650 | |
Legg Mason Fund Advisor, LLC (“LMPFA”) serves as the sub-administrator of the Fund, providing certain administrative services to the Fund pursuant to a sub-administration agreement between Barrett and LMPFA. LMPFA is an affiliate of Legg Mason and Barrett. Barrett, and not the Fund, pays LMPFA for its services as sub-administrator.
Legg Mason Investor Services, LLC, a wholly-owned broker-dealer subsidiary of Legg Mason, serves as the Fund’s sole and exclusive distributor.
The officers of the Fund are employees of Legg Mason or its affiliates and do not receive compensation from the Fund.
18
BARRETT
OPPORTUNITY FUND, INC.
3. INVESTMENTS | During the year ended August 31, 2010, the aggregate cost of purchases and proceeds from sales of investments (excluding short-term investments) were as follows: |
| | |
Purchases | | Sales |
| $1,752,691 | | $5,742,120 |
At August 31, 2010, the aggregate gross unrealized appreciation and depreciation of investments for federal income tax purposes were as follows:
| | | | |
Gross unrealized appreciation | | $ | 52,289,034 | |
Gross unrealized depreciation | | | (588,528 | ) |
| | | | |
Net unrealized appreciation | | $ | 51,700,506 | |
| | | | |
4. DERIVATIVE INSTRUMENTS AND HEDGING ACTIVITIES | Financial Accounting Standards Board Codification Topic 815 (formerly, Statement of Financial Accounting Standards No. 161) (“ASC Topic 815”) requires enhanced disclosure about an entity’s derivative and hedging activities. |
During the year ended August 31, 2010, the Fund did not invest in any derivative instruments.
5. CAPITAL SHARES | At August 31, 2010, the Fund had 15,000,000 shares of capital stock authorized with a par value of $0.01 per share. Transactions in shares of the Fund were as follows: |
| | | | | | |
| | | Year Ended
August 31, 2010 | | | Year Ended
August 31, 2009 | |
Shares sold | | 3,117 | | | 10,396 | |
Shares issued on reinvestment | | 69,315 | | | 203,052 | |
Shares repurchased | | (136,595 | ) | | (353,735 | ) |
| | | | | | |
Net Decrease | | (64,163 | ) | | (140,287 | ) |
| | | | | | |
6. REDEMPTIONS- IN-KIND | The Fund may make payment for Fund shares redeemed wholly or in part by distributing portfolio securities to shareholders. During the year ended August 31, 2010, the Fund did not have any redemptions-in-kind. For the year ended August 31, 2009, the Fund had redemptions-in-kind with total proceeds in the amount of $1,908,452. The net realized gains on these redemptions-in-kind amounted to $1,464,106, which were not realized by the Fund for tax purposes. |
7. INCOME TAX INFORMATION AND DISTRIBUTIONS TO SHAREHOLDERS | The tax character of distributions paid during the fiscal years ended August 31, were as follows: |
| | | | | | |
| | | 2010 | | 2009 |
Distributions Paid From: | | | | | | |
Ordinary income | | $ | 1,000,003 | | $ | 1,300,001 |
Net long-term capital gains | | | 2,850,011 | | | 9,524,702 |
| | | | | | |
Total distributions paid | | $ | 3,850,014 | | $ | 10,824,703 |
| | | | | | |
19
BARRETT
OPPORTUNITY FUND, INC.
As of August 31, 2010, the components of accumulated earnings on a tax basis were as follows:
| | | | |
Undistributed ordinary income - net | | $ | 364,747 | |
Undistributed long-term capital gains - net | | | 3,619,049 | |
| | | | |
Total undistributed earnings | | $ | 3,983,796 | |
Other book/tax temporary differences(a) | | | (57,842 | ) |
Unrealized appreciation (depreciation) | | | 51,700,506 | |
| | | | |
Total accumulated earnings (losses) - net | | $ | 55,626,460 | |
| | | | |
| | (a) | Other book/tax temporary differences are attributable primarily to the book/tax differences in the timing of the deductibility of various expenses. |
8. LEGAL MATTERS | Beginning in May 2004, class action lawsuits alleging violations of the federal securities laws were filed against Citigroup Global Markets Inc. (“CGM”), a former distributor of the Fund, and other affiliated funds (collectively, the “Funds”) and a number of its then affiliates, including Smith Barney Fund Management LLC (“SBFM”) and Salomon Brothers Asset Management Inc. (“SBAM”), which were then investment adviser or manager to certain of the Funds (the “Managers”), substantially all of the mutual funds then managed by the Managers (the “Defendant Funds”), and Board members of the Defendant Funds (collectively, the “Defendants”). The complaints alleged, among other things, that CGM created various undisclosed incentives for its brokers to sell Smith Barney and Salomon Brothers funds. In addition, according to the complaints, the Managers caused the Defendant Funds to pay excessive brokerage commissions to CGM for steering clients towards proprietary funds. The complaints also alleged that the Defendants breached their fiduciary duty to the Defendant Funds by improperly charging Rule 12b-1 fees and by drawing on fund assets to make undisclosed payments of soft dollars and excessive brokerage commissions. The complaints also alleged that the Defendant Funds failed to adequately disclose certain of the allegedly wrongful conduct. The complaints sought injunctive relief and compensatory and punitive damages, rescission of the Defendant Funds’ contracts with the Managers, recovery of all fees paid to the Managers pursuant to such contracts and an award of attorneys’ fees and litigation expenses. |
On December 15, 2004, a consolidated amended complaint (the “Complaint”) was filed alleging substantially similar causes of action. On May 27, 2005, all of the Defendants filed motions to dismiss the Complaint. On July 26, 2006, the court issued a decision and order (1) finding that plaintiffs lacked standing to sue on behalf of the shareholders of the Funds in which none of the plaintiffs had invested and dismissing those Funds from the case (although stating that they could be brought back into the case if standing as to them could be established), and (2) other than one stayed claim, dismissing all of the causes of action against the remaining Defendants, with prejudice, except for the cause of action under Section 36(b) of the 1940 Act, which the court granted plaintiffs leave to replead as a derivative claim.
20
BARRETT
OPPORTUNITY FUND, INC.
On October 16, 2006, plaintiffs filed their Second Consolidated Amended Complaint (“Second Amended Complaint”) which alleges derivative claims on behalf of nine funds identified in the Second Amended Complaint, under Section 36(b) of the 1940 Act, against Citigroup Asset Management, SBAM and SBFM as investment advisers to the identified funds, as well as CGM as a distributor for the identified funds (collectively, the “Second Amended Complaint Defendants”). The Fund was not identified in the Second Amended Complaint. The Second Amended Complaint alleges no claims against any of the funds or any of their Board Members. Under Section 36(b), the Second Amended Complaint alleges similar facts and seeks similar relief against the Second Amended Complaint Defendants as the Complaint.
On December 3, 2007, the court granted the Defendants’ motion to dismiss, with prejudice. On January 2, 2008, the plaintiffs filed a notice of appeal to the Second Circuit Court of Appeals. The appeal was fully briefed and oral argument before the U.S. Court of Appeals for the Second Circuit took place on March 5, 2009. The parties currently are awaiting a decision from the U.S. Court of Appeals for the Second Circuit.
Additional lawsuits arising out of these circumstances and presenting similar allegations and requests for relief may be filed in the future.
21
BARRETT
OPPORTUNITY FUND, INC.
| | |
| REPORT OF INDEPENDENT REGISTERED PUBLIC ACCOUNTING FIRM | | The Board of Directors and Shareholders Barrett Opportunity Fund, Inc.: We have audited the accompanying statement of assets and liabilities, including the schedule of investments, of Barrett Opportunity Fund, Inc. as of August 31, 2010, and the related statement of operations for the year then ended, the statements of changes in net assets for each of the years in the two-year period then ended, and the financial highlights for each of the years in the five-year period then ended. These financial statements and financial highlights are the responsibility of the Fund’s management. Our responsibility is to express an opinion on these financial statements and financial highlights based on our audits. We conducted our audits in accordance with the standards of the Public Company Accounting Oversight Board (United States). Those standards require that we plan and perform the audit to obtain reasonable assurance about whether the financial statements and financial highlights are free of material misstatement. An audit includes examining, on a test basis, evidence supporting the amounts and disclosures in the financial statements. Our procedures included confirmation of securities owned as of August 31, 2010, by correspondence with the custodian and brokers or by other appropriate auditing procedures. An audit also includes assessing the accounting principles used and significant estimates made by management, as well as evaluating the overall financial statement presentation. We believe that our audits provide a reasonable basis for our opinion. In our opinion, the financial statements and financial highlights referred to above present fairly, in all material respects, the financial position of Barrett Opportunity Fund, Inc. as of August 31, 2010, the results of its operations for the year then ended, the changes in its net assets for each of the years in the two-year period then ended, and the financial highlights for each of the years in the five-year period then ended, in conformity with U.S. generally accepted accounting principles. 
New York, New York October 20, 2010 |
22
BARRETT
OPPORTUNITY FUND, INC.
Additional Information
(Unaudited)
1. INFORMATION ABOUT DIRECTORS AND OFFICERS
The business and affairs of the Fund are conducted by management under the supervision and subject to the direction of its Board of Directors. The business address of each Director is c/o Barrett Associates, Inc, the Fund’s investment manager (“Barrett Associates”), 90 Park Avenue, 34th Floor, New York, New York 10016. Information pertaining to the Directors and officers of the Fund is set forth below.
The Statement of Additional Information includes additional information about Directors and is available, without charge, upon request by calling Funds Investor Services at 1-800-822-5544 or Institutional Shareholder Services at 1-888-425-6432.
| | | | | | | | | | |
Name, Address and
Birth Year | | Position(s)
Held with
Fund | | Term of Office*
and Length of
Time Served** | | Principal Occupation(s)
During Past 5 Years | | Number of
Portfolios
in Fund
Complex
Overseen
by Director | | Other Board
Memberships
Held by
Director |
INDEPENDENT DIRECTORS†: | | | | | | |
Barry Handel, CPA Birth Year: 1951 | | Director | | Since 2005 | | Partner, Shalik, Morris & Company, LLP (accounting firm) (since 2010); formerly, Partner, Falk & Handel LLP (accounting firm) | | 1 | | None |
| | | | | |
Rosalind A. Kochman Birth Year: 1937 | | Director Chairperson | | Since 1990 Since 2005 | | Retired (since 2002); formerly, Chief Executive Officer, Brooklyn Eye Surgery Center, and Administrator, Kochman, Lebowitz & Mobil, MDs (ophthalmic physicians) | | 1 | | None |
| | | | | |
William Morris, Jr., CPA Birth Year: 1948 | | Director | | Since 2005 | | President, William Morris & Associates P.C. (accounting firm) | | 1 | | None |
| | | | | |
Irving Sonnenschein Birth Year: 1920 | | Director | | Since 1994 | | Partner in the law firm of Sonnenschein, Sherman & Deutsch | | 1 | | None |
| | | |
INTERESTED DIRECTOR: | | | | | | |
Irving Brilliant Birth Year: 1918 | | Director | | Since 1978 | | Retired | | 1 | | None |
| | | | |
OFFICERS: | | | | | | | | |
Peter H. Shriver, CFA Barrett Associates 90 Park Avenue New York, NY 10016 Birth Year: 1952 | | President and Chief Executive Officer | | Since December 2006 | | President of Barrett Associates (since April 2004); Managing Director of Barrett Associates (1989-2004) | | N/A | | N/A |
23
BARRETT
OPPORTUNITY FUND, INC.
| | | | | | | | | | |
Name, Address and
Birth Year | | Position(s)
Held with
Fund | | Term of Office*
and Length of
Time Served** | | Principal Occupation(s)
During Past 5 Years | | Number of
Portfolios
in Fund
Complex
Overseen
by Director | | Other Board
Memberships
Held by
Director |
OFFICERS (Continued) | | | | | | | | |
E. Wells Beck, CFA Barrett Associates 90 Park Avenue New York, New York 10016 Birth Year: 1968 | | Vice President and Investment Officer | | Since June 2010 | | Managing Director, Barrett Associates (since 2006); Analyst and Portfolio Manager at Haven Capital Management (2001-2006); Research Analyst at Prudential Securities (2000-2001) | | N/A | | N/A |
| | | | | |
Robert J. Milnamow Barrett Associates 90 Park Avenue New York, NY 10016 Birth Year: 1950 | | Vice President and Investment Officer | | Since December 2006 | | Managing Director, Barrett Associates (since November 2003); Managing Member at Thayer Pond Capital, LLC (2001-2003); Senior Portfolio Manager at Rockefeller & Co. (investment firm) (1998-2001) | | N/A | | N/A |
| | | | | |
Kaprel Ozsolak Legg Mason & Co. 55 Water Street, New York, NY 10041 Birth Year: 1965 | | Chief Financial Officer | | Since 2010 | | Director of Legg Mason & Co., LLC (“Legg Mason & Co.”) (since 2005); Chief Financial Officer of certain mutual funds associated with Legg Mason & Co. or its affiliates (since 2007) and Legg Mason & Co. predecessors (prior to 2007); formerly, Treasurer of certain mutual funds associated with Legg Mason & Co. or its affiliates (prior to 2010) and Legg Mason & Co. predecessors (prior to 2005); formerly, Controller of certain mutual funds associated with Legg Mason & Co. predecessors (prior to 2004) | | N/A | | N/A |
| | | | | |
Fred Jensen Legg Mason & Co. 620 Eighth Avenue New York, NY 10018 Birth year: 1963 | | Chief Compliance Officer | | Since 2008 | | Director of Compliance, Legg Mason Office of the Chief Compliance Officer (since April 2006); Chief Compliance Officer of Legg Mason Global Asset Allocation, LLC (since December 2008); formerly, Vice President of Investment Advisory Compliance for Guardian Insurance Company of America and Chief Compliance Officer of Reserve Funds (prior to 2006) | | N/A | | N/A |
24
BARRETT
OPPORTUNITY FUND, INC.
| | | | | | | | | | |
Name, Address and
Birth Year | | Position(s)
Held with
Fund | | Term of Office*
and Length of
Time Served** | | Principal Occupation(s)
During Past 5 Years | | Number of
Portfolios
in Fund
Complex
Overseen
by Director | | Other Board
Memberships
Held by
Director |
OFFICERS (Continued) | | | | | | | | |
John Chiota Legg Mason & Co. 100 First Stamford Place, 2nd Floor Stamford, CT 06902 Birth Year: 1968 | | Chief Anti-Money Laundering Compliance Officer and Identity Theft Prevention Officer | | Since 2006 Since 2008 | | Identity Theft Prevention Officer of certain mutual funds associated with Legg Mason & Co. or its affiliates (since 2008); Chief Anti-Money Laundering Compliance Officer of certain mutual funds associated with Legg Mason & Co. or its affiliates (since 2006); Vice President of Legg Mason & Co. (since 2006) and Legg Mason & Co. predecessors (prior to 2006); formerly, Chief Anti-Money Laundering Compliance Officer of TD Waterhouse (prior to 2004) | | N/A | | N/A |
| | | | | |
Robert I. Frenkel Legg Mason & Co. 100 First Stamford Place, 2nd Floor Stamford, CT 06902 Birth Year: 1954 | | Secretary and Chief Legal Officer | | Since 2007 | | Vice President and Deputy General Counsel of Legg Mason (since 2006); Managing Director and General Counsel of Global Mutual Funds for Legg Mason & Co. (since 2006) and Legg Mason & Co. predecessors (since 1994); Secretary and Chief Legal Officer of certain mutual funds associated with Legg Mason & Co. or its affiliates (since 2006) and Legg Mason & Co. predecessors (prior to 2006) | | N/A | | N/A |
25
BARRETT
OPPORTUNITY FUND, INC.
| | | | | | | | | | |
Name, Address and
Birth Year | | Position(s)
Held with
Fund | | Term of Office*
and Length of
Time Served** | | Principal Occupation(s)
During Past 5 Years | | Number of
Portfolios
in Fund
Complex
Overseen
by Director | | Other Board
Memberships
Held by
Director |
OFFICERS (Continued) | | | | | | | | |
Steven Frank Legg Mason & Co. 55 Water Street, New York, NY 10041 Birth Year: 1967 | | Treasurer | | Since 2010 | | Vice President of Legg Mason & Co. and Legg Mason & Co. predecessors (since 2002); Treasurer of certain mutual funds associated with Legg Mason & Co. or its affiliates (since 2010); formerly, Controller of certain funds associated with Legg Mason & Co. or its affiliates (prior to 2010); formerly, Assistant Controller of certain mutual funds associated with Legg Mason & Co. predecessors (prior to 2005) | | N/A | | N/A |
| † | | Directors who are not “ interested persons” of the Fund within the meaning of Section 2(a)(19) of the 1940 Act. |
| * | | Each Director and officer serves until his respective successor has been duly elected and qualified or until his earlier death, resignation, retirement or removal. |
| * * | | Indicates the earliest year in which the Director became a board member for a fund in the Legg Mason fund complex or the officer took such office. |
26
BARRETT
OPPORTUNITY FUND, INC.
Important Tax Information (Unaudited)
The following information is provided with respect to the distributions paid during the taxable year ended August 31, 2010:
| | | | |
| | |
Record Date: | | | 12/21/2009 | |
Payable Date: | | | 12/22/2009 | |
Ordinary Income: | | | | |
Qualified Dividend Income for Individuals | | | 100.00% | |
Dividends Qualifying for the Dividends | | | | |
Received Deduction for Corporations | | | 100.00% | |
Long-Term Capital Gain Dividend | | | $1.363020 | |
Please retain this information for your records.
27
BARRETT OPPORTUNITY FUND, INC.
DIRECTORS
Irving G. Brilliant
Barry Handel, CPA
Rosalind A. Kochman
Chairperson
William Morris, Jr., CPA
Irving Sonnenschein
INVESTMENT MANAGER
Barrett Associates, Inc.
90 Park Avenue
New York, NY 10016
SUB-ADMINISTRATOR
Legg Mason Partners Fund Advisor, LLC
620 Eighth Avenue
New York, NY 10018
DISTRIBUTOR
Legg Mason Investor Services, LLC (LMIS)
100 International Drive
Baltimore, MD 21202
CUSTODIAN
State Street Bank and Trust Company
2 Avenue De Lafeyette
Boston, MA 02111
CO-TRANSFER AGENTS
Boston Financial Data Services, Inc.
2000 Crown Colony Drive
Quincy, MA 02169
BNY Mellon Asset Servicing
4400 Computer Drive
Westborough, MA 01581
INDEPENDENT REGISTERED PUBLIC ACCOUNTING FIRM
KPMG LLP
345 Park Avenue
New York, NY 10154
PRIVACY POLICY
We are committed to keeping nonpublic personal information about you secure and confidential. This notice is intended to help you understand how we fulfill this commitment. From time to time, we may collect a variety of personal information about you, including:
| | • | | Information we receive from you on applications and forms, via the telephone, and through our websites; |
| | • | | Information about your transactions with us, our affiliates, or others (such as your purchases, sales, or account balances); and |
| | • | | Information we receive from consumer reporting agencies. |
We do not disclose nonpublic personal information about our customers or former customers, except to our affiliates (such as broker-dealers or investment advisers within the Legg Mason family of companies) or as is otherwise permitted by applicable law or regulation. For example, we may share this information with others in order to process your transactions or service an account. We may also provide this information to companies that perform marketing services on our behalf, such as printing and mailing, or to other financial institutions with whom we have joint marketing agreements. When we enter into such agreements, we will require these companies to protect the confidentiality of this information and to use it only to perform the services for which we hired them.
With respect to our internal security procedures, we maintain physical, electronic, and procedural safeguards to protect your nonpublic personal information, and we restrict access to this information.
If you decide at some point either to close your account(s) or become an inactive customer, we will continue to adhere to our privacy policies and practices with respect to your nonpublic personal information.
NOT PART OF THE ANNUAL REPORT
Barrett Opportunity Fund, Inc.
55 Water Street
New York, New York 10041
This report is transmitted to the shareholders of Barrett Opportunity Fund, Inc. for their information. This is not a prospectus, circular or representation intended for use in the purchase of shares of the Fund or any securities mentioned in this report.
This report must be preceded or accompanied by a free prospectus. Investors should consider the Fund’s investment objectives, risks, charges and expenses carefully before investing. The prospectus contains this and other important information about the Fund. Please read the prospectus carefully before investing.
www.barrettassociates.com
©2010 Legg Mason
Investor Services, LLC
Member FINRA, SIPC
BARX010335
The Fund files its complete schedule of portfolio holdings with the Securities and Exchange Commission (“SEC”) for the first and third quarters of each fiscal year on Form N-Q. The Fund’s Forms N-Q are available on the SEC’s website at www.sec.gov. The Fund’s Forms N-Q may be reviewed and copied at the SEC’s Public Reference Room in Washington, D.C., and information on the operation of the Public Reference Room may be obtained by calling 1-800-SEC-0330. To obtain information on Form N-Q from the Fund, shareholders can call Funds Investor Services at 1-800-822-5544 or Institutional Shareholder Services at 1-888-425-6432.
Information on how the Fund voted proxies relating to portfolio securities during the prior 12-month period ended June 30th of each year and a description of the policies and procedures that the Fund uses to determine how to vote proxies related to portfolio transactions are available (1) without charge, upon request, by calling Funds Investor Services at 1-800-822-5544 or Institutional Shareholder Services at 1-888-425-6432 and (2) on the SEC’s website at www.sec.gov.
The registrant has adopted a code of ethics that applies to the registrant’s principal executive officer, principal financial officer, principal accounting officer or controller.
| ITEM 3. | AUDIT COMMITTEE FINANCIAL EXPERT. |
The Board of Directors of the registrant has determined that Mr. William Morris possesses the technical attributes identified in Instruction 2(b) of Item 3 to Form N-CSR to qualify as an “audit committee financial expert,” and has designated Mr. Morris as the Audit Committee’s financial expert. Mr. Morris is an “independent” Director pursuant to paragraph (a)(2) of Item 3 to Form N-CSR.
| ITEM 4. | PRINCIPAL ACCOUNTANT FEES AND SERVICES. |
a) Audit Fees. The aggregate fees billed in the last two fiscal years ending August 31, 2009 and August 31, 2010 (the “Reporting Periods”) for professional services rendered by the Registrant’s principal accountant (the “Auditor”) for the audit of the Registrant’s annual financial statements, or services that are normally provided by the Auditor in connection with the statutory and regulatory filings or engagements for the Reporting Periods, were $37,400 in 2009 and $38,700 in 2010.
b) Audit-Related Fees. There were no fees billed in the Reporting Periods for assurance and related services by the Auditor that are reasonably related to the performance of the audit of the Registrant’s financial statements and are not reported under paragraph (a) of this Item 4.
In addition, there were no Audit-Related Fees billed in the Reporting Period for assurance and related services by the Auditor to the Registrant’s investment adviser (not including any sub-adviser whose role is primarily portfolio management and is subcontracted with or overseen by another investment adviser), and any entity controlling, controlled by or under common control with the investment adviser that provides ongoing services to the Barrett Opportunity Fund, Inc. (“service affiliates”), that were reasonably related to the performance of the annual audit of the service affiliates. Accordingly, there were no such fees that required pre-approval by the Audit Committee for the Reporting.
(c) Tax Fees. The aggregate fees billed in the Reporting Periods for professional services rendered by the Auditor for tax compliance, tax advice and tax planning (“Tax Services”) were $3,200 in 2009 and $3,400 in 2010. These services consisted of (i) review or preparation of U.S. federal, state, local and excise tax returns; (ii) U.S. federal, state and local tax planning, advice and assistance regarding statutory, regulatory or administrative developments, and (iii) tax advice regarding tax qualification matters and/or treatment of various financial instruments held or proposed to be acquired or held.
There were no fees billed for tax services by the Auditors to service affiliates during the Reporting Periods that required pre-approval by the Audit Committee.
d) All Other Fees. There were no other fees billed in the Reporting Periods for products and services provided by the Auditor, other than the services reported in paragraphs (a) through (c) of this Item for the Barrett Opportunity Fund, Inc.
All Other Fees. There were no other non-audit services rendered by the Auditor to Legg Mason Partners Fund Advisor, LLC (“LMPFA”), and any entity controlling, controlled by or under common control with LMPFA that provided ongoing services to Barrett Opportunity Fund, Inc. requiring pre-approval by the Audit Committee in the Reporting Period.
(e) Audit Committee’s pre–approval policies and procedures described in paragraph (c) (7) of Rule 2-01 of Regulation S-X.
(1) The Charter for the Audit Committee (the “Committee”) of the Board of each registered investment company (the “Fund”) advised by LMPFA or one of their affiliates (each, an “Adviser”) requires that the Committee shall approve (a) all audit and permissible non-audit services to be provided to the Fund and (b) all permissible non-audit services to be provided by the Fund’s independent auditors to the Adviser and any Covered Service Providers if the engagement relates directly to the operations and financial reporting of the Fund. The Committee may implement policies and procedures by which such services are approved other than by the full Committee.
The Committee shall not approve non-audit services that the Committee believes may impair the independence of the auditors. As of the date of the approval of this Audit Committee Charter, permissible non-audit services include any professional services (including tax services), that are not prohibited services as described below, provided to the Fund by the independent auditors, other than those provided to the Fund in connection with an audit or a review of the financial statements of the Fund. Permissible non-audit services may not include: (i) bookkeeping or other services related to the accounting records or financial statements of the Fund; (ii) financial information systems design and implementation; (iii) appraisal or valuation services, fairness opinions or contribution-in-kind reports; (iv) actuarial services; (v) internal audit outsourcing services; (vi) management functions or human resources; (vii) broker or dealer, investment adviser or investment banking services; (viii) legal services and expert services unrelated to the audit; and (ix) any other service the Public Company Accounting Oversight Board determines, by regulation, is impermissible.
Pre-approval by the Committee of any permissible non-audit services is not required so long as: (i) the aggregate amount of all such permissible non-audit services provided to the Fund, the Adviser and any service providers controlling, controlled by or under common control with the Adviser that provide ongoing services to the Fund (“Covered Service Providers”) constitutes not more than 5% of the total amount of revenues paid to the independent auditors during the fiscal year in which the permissible non-audit services are provided to (a) the Fund, (b) the Adviser and (c) any entity controlling, controlled by or under common control with the Adviser that provides ongoing services to the Fund during the fiscal year in which the services are provided that would have to be approved by the Committee; (ii) the permissible non-audit services were not recognized by the Fund at the time of the engagement to be non-audit services; and (iii) such services are promptly brought to the attention of the Committee and approved by the Committee (or its delegate(s)) prior to the completion of the audit.
(2) For the Barrett Opportunity Fund Inc., the percentage of fees that were approved by the audit committee, with respect to: Audit-Related Fees were 100% and 100% for 2009 and 2010; Tax Fees were 100% and 100% for 2009 and 2010, and Other Fees were 100% and 100% for 2009 and 2010.
(f) N/A
(g) Non-audit fees billed by the Auditor for services rendered to Barrett Opportunity Fund, Inc., LMPFA and any entity controlling, controlled by, or under common control with LMPFA that provides ongoing services to Barrett Opportunity Fund, Inc. during the reporting period were $0 in 2010.
(h) Yes. Barrett Opportunity Fund, Inc.’s Audit Committee has considered whether the provision of non-audit services that were rendered to Service Affiliates, which were not pre-approved (not requiring pre-approval), is compatible with maintaining the Accountant’s independence. All services provided by the Auditor to the Barrett Opportunity Fund, Inc. or to Service Affiliates, which were required to be pre-approved, were pre-approved as required.
| ITEM 5. | AUDIT COMMITTEE OF LISTED REGISTRANTS. |
| | a) | The independent board members are acting as the registrant’s audit committee as specified in Section 3(a)(58)(B) of the Exchange Act. The Audit Committee consists of the following Board members: |
Barry Handel
Rosalind Kochman
William Morris
Irving Brilliant
Irving Sonnenschein
| ITEM 6. | SCHEDULE OF INVESTMENTS. |
Included herein under Item 1.
| ITEM 7. | DISCLOSURE OF PROXY VOTING POLICIES AND PROCEDURES FOR CLOSED-END MANAGEMENT INVESTMENT COMPANIES. |
Not applicable.
| ITEM 8. | PORTFOLIO MANAGERS OF CLOSED-END MANAGEMENT INVESTMENT COMPANIES. |
Not applicable.
| ITEM 9. | PURCHASES OF EQUITY SECURITIES BY CLOSED-END MANAGEMENT INVESTMENT COMPANY AND AFFILIATED PURCHASERS. |
Not applicable.
| ITEM 10. | SUBMISSION OF MATTERS TO A VOTE OF SECURITY HOLDERS. |
Not applicable.
| ITEM 11. | CONTROLS AND PROCEDURES. |
| | (a) | The registrant’s principal executive officer and principal financial officer have concluded that the registrant’s disclosure controls and procedures (as defined in Rule 30a- 3(c) under the Investment Company Act of 1940, as amended (the “1940 Act”)) are effective as of a date within 90 days of the filing date of this report that includes the disclosure required by this paragraph, based on their evaluation of the disclosure controls and procedures required by Rule 30a-3(b) under the 1940 Act and 15d-15(b) under the Securities Exchange Act of 1934. |
| | (b) | There were no changes in the registrant’s internal control over financial reporting (as defined in Rule 30a-3(d) under the 1940 Act) that occurred during the registrant’s last fiscal half-year (the registrant’s second fiscal half-year in the case of an annual report) that have materially affected, or are likely to materially affect the registrant’s internal control over financial reporting. |
| | (a) (1) | Code of Ethics attached hereto. |
Exhibit 99.CODE ETH
| | (a) (2) | Certifications pursuant to section 302 of the Sarbanes-Oxley Act of 2002 attached hereto. |
Exhibit 99.CERT
| | (b) | Certifications pursuant to Section 906 of the Sarbanes-Oxley Act of 2002 attached hereto. |
Exhibit 99.906CERT
SIGNATURES
Pursuant to the requirements of the Securities Exchange Act of 1934 and the Investment Company Act of 1940, the registrant has duly caused this Report to be signed on its behalf by the undersigned, there unto duly authorized.
| | |
| Barrett Opportunity Fund, Inc. |
| |
| By: | | /S/ PETER H. SHRIVER |
| | Peter H. Shriver |
| | Chief Executive Officer of Barrett Opportunity Fund, Inc. |
| |
| Date: | | October 26, 2010 |
Pursuant to the requirements of the Securities Exchange Act of 1934 and the Investment Company Act of 1940, this report has been signed below by the following persons on behalf of the registrant and in the capacities and on the dates indicated.
| | |
| By: | | /S/ PETER H. SHRIVER |
| | Peter H. Shriver |
| | Chief Executive Officer of Barrett Opportunity Fund, Inc. |
| |
| Date: | | October 26, 2010 |
| |
| By: | | /S/ KAPREL OZSOLAK |
| | Kaprel Ozsolak |
| | Chief Financial Officer of Barrett Opportunity Fund, Inc. |
| |
| Date: | | October 26, 2010 |