UNITED STATES
SECURITIES AND EXCHANGE COMMISSION
Washington, D.C. 20549
FORM N-CSR
CERTIFIED SHAREHOLDER REPORT OF REGISTERED
MANAGEMENT INVESTMENT COMPANIES
Investment Company Act file number 811-02884
Barrett Opportunity Fund, Inc.
(Exact name of registrant as specified in charter)
125 Broad Street, New York, NY 10004
(Address of principal executive offices) (Zip code)
Robert I. Frenkel, Esq.
Legg Mason & Co., LLC
300 First Stamford Place,4th Fl.
Stamford, CT 06902
(Name and address of agent for service)
Registrant’s telephone number, including area code: (800) 451-2010
Date of fiscal year end: August 31,
Date of reporting period: August 31, 2007
ITEM 1. REPORT TO STOCKHOLDERS.
The Annual Report to Stockholders is filed herewith.


Annual Report
August 31, 2007
INVESTMENT PRODUCTS: NOT FDIC INSURED Ÿ NO BANK GUARANTEE Ÿ MAY LOSE VALUE
BAR RETT
OPPORTUNITY FUND, INC.
Annual Report • August 31, 2007
Fund Objective | The Fund seeks to achieve above average long-term capital appreciation. Current income is a secondary objective. The Fund invests primarily in common stocks and securities convertible into or exchangeable for common stock such as convertible preferred stock or convertible debt securities. |
BARRETT
OPPORTUNITY FUND, INC.
Letter from the Chairperson |
Dear Shareholder,
We are pleased to provide the annual report of the Barrett Opportunity Fund, Inc.1 (the “Fund”) for the 12-month period ended August 31, 2007.
The management team at Barrett Associates, Inc. (“Barrett”) has prepared the enclosed Manager’s Overview, which includes a brief market overview, as well as a performance review. I urge you to read it as well as the accompanying financial statements. A detailed summary of the Fund’s performance and other pertinent information are also included in this report. I am sure you will find this report informative and useful.
On behalf of the Directors and the officers of the Fund, I thank you for your ongoing confidence in the Fund and its investment policies.
Sincerely,

Rosalind A. Kochman
Chairperson
September 28, 2007
1 | | The Fund was formerly known as Salomon Brothers Opportunity Fund Inc. The Fund’s name, investment manager and certain investment policies were changed effective December 1, 2006. |
1
BARRETT
OPPORTUNITY FUND, INC.
Market Overview
Manager Overview | For much of the reporting period, the global economic environment was relatively unchanged and equity investors worldwide were sanguine. The global growth trends that had been in place for several years continued through most of the reporting period. The developing economies of China, India and Russia continued to grow at significantly faster rates than the developed economies of the United States, Europe and Japan. Although there were pockets of inflation in specific geographic regions and sectors, such as commodities, the overall worldwide inflation rate remained relatively unchanged over the past twelve months. However, the period was also marked by the continued increase in short-term interest rates in Europe and the United States after years of historically low rates. Finally, in July, the impact of higher rates and leverage caused a credit contraction in the mortgage market that accelerated the downturn in housing, and caused increased volatility in equity and credit markets. As a result, many economic forecasts for domestic growth have been decreased for the remainder of 2007 and 2008. |
In addition to the increase in short-term interest rates in the developed economies, important price changes occurred for commodities, currencies and other investments. After a long, sustained ascent, crude oil prices generally declined in the fourth calendar quarter of 2006, which we believe led to rallies in global stock and bond markets. Stock markets finished calendar year 2006 generally in robust fashion. Merger and acquisition activity for much of the period ran high and investors began to bid up stocks that they suspected were potential acquisition targets for cash-rich private equity firms.
During the first quarter of 2007, U.S. economic growth sputtered to a sub-1% growth rate, as investors identified more serious problems in the housing industry. Despite the slower domestic growth, the equity market recovered quickly in the second quarter of 2007, when many global corporations, on the back of strong international growth, reported healthy profits. We believe the stock market environment resembled the end of 2006 in the period leading up to the Fourth of July, when problems in certain hedge funds were reported, which negatively impacted several markets. At this time, many investors learned that highly levered investments in mortgage-backed securities, especially those backed by sub-prime mortgages, were causing some companies to experience significant losses and creating serious liquidity problems for others. The losses and the liquidity crunch impacted markets and institutions worldwide. What had been an environment of excessive liquidity suddenly became one of credit unavailability.
Performance Review
During the 12-month period ended August 31, 2007, the Fund’s total return was 10.92%. The Fund underperformed both its Lipper peer group and its unmanaged benchmark, the S&P 500 Index, over the same time frame. The credit contraction in the markets that developed in 2007 clearly affected the performance of the Fund, which has holdings in several companies in the finance sector. The Fund’s largest holding, Forest City Enterprises, a real estate company, saw its stock price fall from the low $70s at the end of May 2007 to the low $50s by August 31, 2007.
During the reporting period, the Fund owned several sectors that contributed to the positive performance of the Fund. The Fund’s energy holdings generally performed well, particularly Diamond Offshore Drilling, which benefited from the search and development of reserves in deep water environments. The Fund also benefited from the merger and acquisition activity that marked much of the period. Companies such as Kronos Worldwide, Merchants Group and Sabre Group Holdings were acquired at attractive prices. Several companies with exposure to surging commodities prices, such as Monsanto and Newmont Mining, also contributed to the period’s positive returns. Additionally, companies involved in the growth of global trade, such as Overseas Shipholding and Alexander & Baldwin, contributed to performance.
2
BARRETT
OPPORTUNITY FUND, INC.
In addition to Forest City Enterprises, companies such as Chubb, General Dynamics, Rayonier and Popular were drags on performance during the period.
Total Returns for Periods Ended August 31, 2007
| | | | | | | | | | |
| | | Total
Return | | Average Annual Total Returns |
| | | Six Months
Ended
8/31/07 | | 1 Year | | 3 Year | | 5 Year | | 10 Year |
Barrett Opportunity Fund, Inc.* | | +2.47% | | +10.92% | | +15.42% | | +11.87% | | +7.83% |
Lipper Multi-Cap Value Funds Average1 | | +2.52% | | +12.83% | | +13.14% | | +13.36% | | +8.06% |
S&P 500® Index2 | | +5.69% | | +15.13% | | +12.15% | | +11.99% | | +6.75% |
| | | The performance data quoted represents past performance. Past performance does not guarantee future results and current performance may be lower or higher than the performance data shown above. The investment return and principal value of an investment will fluctuate. An investor’s shares, when redeemed, may be worth more or less than their original cost. As economic and market conditions change frequently, there can be no assurance that trends described will continue or that forecasts will come to pass. Performance data current to the most recent month-end may be obtained by calling (800) 451-2010. Shares of the Fund are distributed by Legg Mason Investor Services LLC (“LMIS”) (Member SIPC/FINRA) and Citigroup Global Markets Inc. (“CGM”). LMIS and Barrett Associates, Inc., the Fund’s investment manager, are both wholly-owned subsidiaries of Legg Mason, Inc. |
| | | The Fund’s total annual operating expenses as of the date of the Fund’s current Prospectus were 1.04%. |
| | | All investing entails risk, including the possible loss of principal. The Fund is not diversified, which means that it can invest a higher percentage of its assets in any one issuer than a diversified fund. Being non-diversified may magnify the Fund’s losses from events affecting a particular issuer. Please see the Fund’s prospectus for more information on this and other risks. |
| | * | On December 1, 2006, Barrett Associates, Inc. became the Fund’s investment manager, and certain changes to the Fund’s investment policies were made effective on that date. Prior to December 1, 2006, the Fund was known as Salomon Brothers Opportunity Fund Inc. |
| | 1 | Lipper Multi-Cap Value Funds Average includes funds which invest in a variety of market cap ranges, generally have between 25-75% of their equity assets in companies with market caps above 300% of the dollar-weighted median of the S&P MidCap 400 Index, invest in companies considered to be undervalued, and have below-average price-to-earnings ratios, price-to-book ratios, and 3-year earnings growth figures. |
| | 2 | The S&P 500® Index is a market-value weighted index comprised of 500 widely held common stocks. It is not possible to invest directly in the index. An index does not reflect deductions for fees, expenses or taxes. |
Thank you for your continued interest in the Fund.
Sincerely,
| | |

| |  |
Amy LaGuardia, CFA Portfolio Manager | | Robert Milnamow Portfolio Manager |
September 18, 2007
The outlook and views presented above are those of the Fund’s portfolio managers as of 9/18/07, and are subject to change. This information is intended for the shareholders of the Fund and is not for distribution to prospective investors unless preceded or accompanied by a current prospectus. Investors should consider the risks, investment objective, charges and expenses of the Fund carefully before investing. The prospectus, which contains this and other information about the Fund, is available at www.barrettassociates.com. Investors should read the prospectus carefully before investing.
3
BARRETT
OPPORTUNITY FUND, INC.
Fund at a Glance (Unaudited)
| | | | | | | | |
Top Ten Holdings - as of 8/31/2007
(As a percentage of Total Investments) | | | | Sector Weightings - as of 8/31/2007 (As a percentage of Total Investments) |
| 1. | | Bank of New York Mellon Corp. | | 11.0% | | | | 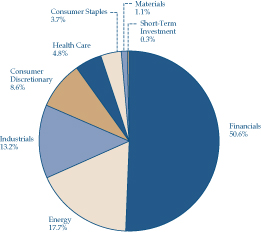
|
| 2. | | Royal Dutch Shell PLC, ADR,
Class A Shares | | 10.7% | | | |
| 3. | | Chubb Corp. | | 9.8% | | | |
| 4. | | Forest City Enterprises Inc., Class A Shares | | 9.4% | | | |
| 5. | | Koninklijke Philips
Enterprises NV, New York Registered Shares | | 8.2% | | | |
| 6. | | Forest City Enterprises Inc., Class B Shares | | 6.5% | | | |
| 7. | | General Dynamics Corp. | | 6.0% | | | |
| 8. | | Murphy Oil Corp. | | 4.6% | | | |
| 9. | | Leucadia National Corp. | | 4.2% | | | |
| 10. | | Wellpoint Inc. | | 3.2% | | | |
| | | | | | | |
| | | | | | | |
| | | | | | | |
| | | | | | | |
4
BARRETT
OPPORTUNITY FUND, INC.
Fund Expenses (Unaudited)
Example
As a shareholder of the Fund, you may incur two types of costs: (1) transaction costs; and (2) ongoing costs, including management fees and other Fund expenses. This example is intended to help you understand your ongoing costs (in dollars) of investing in the Fund and to compare these costs with the ongoing costs of investing in other mutual funds.
This example is based on an investment of $1,000 invested on March 1, 2007 and held for the six months ended August 31, 2007.
Actual Expenses
The table below titled “Based on Actual Total Return” provides information about actual account values and actual expenses. You may use the information provided in this table, together with the amount you invested, to estimate the expenses that you paid over the period. To estimate the expenses you paid on your account, divide your ending account value by $1,000 (for example, an $8,600 ending account value divided by $1,000 = 8.6), then multiply the result by the number under the heading entitled “Expenses Paid During the Period”.
Based on Actual Total Return1
| | | | | | | | | | | | | | | |
| | | Actual
Total Return2 | | | Beginning
Account
Value | | Ending
Account
Value | | Annualized
Expense
Ratio | | | Expenses
Paid During
the Period3 |
Barrett Opportunity Fund, Inc. | | 2.47 | % | | $ | 1,000.00 | | $ | 1,024.70 | | 1.04 | % | | $ | 5.31 |
1 | | For the six months ended August 31, 2007. |
2 | | Assumes reinvestment of all distributions, including returns of capital, if any, at net asset value. Total return is not annualized, as it may not be representative of the total return for the year. Performance figures may reflect fee waivers and/or expense reimbursements. In the absence of fee waivers and/or expense reimbursements, the total return would have been lower. Past performance is no guarantee of future results. |
3 | | Expenses (net of fee waivers and/or expense reimbursements) are equal to the Fund’s annualized expense ratio, multiplied by the average account value over the period, multiplied by the number of days in the most recent fiscal half-year, then divided by 365. |
5
BARRETT
OPPORTUNITY FUND, INC.
Fund Expenses (Unaudited) (Continued)
Hypothetical Example for Comparison Purposes
The table below titled “Based on Hypothetical Total Return” provides information about hypothetical account values and hypothetical expenses based on the actual expense ratio and an assumed rate of return of 5.00% per year before expenses, which is not the Fund’s actual return. The hypothetical account values and expenses may not be used to estimate the actual ending account balance or expenses you paid for the period. You may use the information provided in this table to compare the ongoing costs of investing in the Fund and other funds. To do so, compare the 5.00% hypothetical example relating to the Fund with the 5.00% hypothetical examples that appear in the shareholder reports of the other funds.
Please note that the expenses shown in the table below are meant to highlight your ongoing costs only and do not reflect any transactional costs. Therefore, the table is useful in comparing ongoing costs only, and will not help you determine the relative total costs of owning different funds. In addition, if these transaction costs were included, your costs would have been higher.
Based on Hypothetical Total Return1
| | | | | | | | | | | | | | | |
| | | Hypothetical
Annualized
Total Return | | | Beginning
Account
Value | | Ending
Account
Value | | Annualized
Expense
Ratio | | | Expenses
Paid During
the Period2 |
Barrett Opportunity Fund, Inc. | | 5.00 | % | | $ | 1,000.00 | | $ | 1,019.96 | | 1.04 | % | | $ | 5.30 |
1 | | For the six months ended August 31, 2007. |
2 | | Expenses (net of fee waivers and/or expense reimbursements) are equal to the Fund’s annualized expense ratio, multiplied by the average account value over the period, multiplied by the number of days in the most recent fiscal half-year, then divided by 365. |
6
BARRETT
OPPORTUNITY FUND, INC.
Fund Performance
Average Annual Total Returns(1) (Unaudited)
| | | |
Twelve Months Ended 8/31/07 | | 10.92 | % |
Five Years Ended 8/31/07 | | 11.87 | |
Ten Years Ended 8/31/07 | | 7.83 | |
2/28/79* through 8/31/07 | | 13.62 | |
Cumulative Total Return(1) (Unaudited)
| | | |
8/31/97 through 8/31/07 | | 112.54 | % |
(1) | | Assumes reinvestment of all distributions, including returns of capital, if any, at net asset value. All figures represent past performance and are not a guarantee of future results. Investment return and principal value of an investment will fluctuate so that an investor’s shares, when redeemed, may be worth more or less than their original cost. Performance figures may reflect fee waivers and/or expense reimbursements. In the absence of fee waivers and/or expense reimbursements, the total return would have been lower. |
7
BARRETT
OPPORTUNITY FUND, INC.
Historical Performance (Unaudited)
Value of $10,000 Invested in Barrett Opportunity Fund, Inc. vs. the S&P 500® Index† (August 1997 – August 2007)
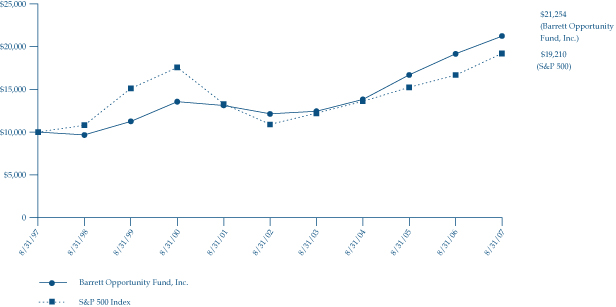
† | | Hypothetical illustration of $10,000 invested in the Fund on August 31, 1997 assuming the reinvestment of all distributions, including returns of capital, if any, at net asset value through August 31, 2007. The S&P 500® Index is a broad-based unmanaged index of widely held common stocks. The Index is unmanaged and it is not subject to the same management and trading expenses of a mutual fund. Please note that an investor cannot invest directly in an index. |
All figures represent past performance and are not a guarantee of future results. Investment returns and principal value will fluctuate so that an investor’s shares, when redeemed, may be worth more or less than their original cost. The returns shown do not reflect the deduction of taxes that a shareholder would pay on Fund distributions or the redemption of Fund shares. Performance figures may reflect fee waivers and/or expense reimbursements. In the absence of fee waivers and/or expense reimbursements, the total return would have been lower.
8
BARRETT
OPPORTUNITY FUND, INC.
Schedule of Investments
August 31, 2007
| | | | | |
| Shares | | Security | | Value |
| | | | | |
| | COMMON STOCKS - 99.7% |
| | CONSUMER DISCRETIONARY - 8.6% |
| | Household Durables - 8.3% |
| 306,010 | | Koninklijke Philips Electronics NV, New York Registered Shares | | $ | 12,102,695 |
| 14,850 | | Liberty Homes Inc., Class A Shares (a) | | | 54,203 |
| 22,050 | | Liberty Homes Inc., Class B Shares (a) | | | 122,378 |
| | | | | |
| | Total Household Durables | | | 12,279,276 |
| | | | | |
| | Media - 0.3% | | | |
| 19,400 | | News Corp., Class A Shares | | | 392,462 |
| | | | | |
| | Total Consumer Discretionary | | | 12,671,738 |
| | | | | |
| |
| | CONSUMER STAPLES - 3.7% |
| | Food & Staples Retailing - 1.1% |
| 96,000 | | FHC Delaware Inc. (a)(b)* | | | 0 |
| 35,000 | | Walgreen Co. | | | 1,577,450 |
| | | | | |
| | Total Food & Staples Retailing | | | 1,577,450 |
| | | | | |
| | Food Products - 1.2% | | | |
| 40,000 | | Hershey Co. | | | 1,860,000 |
| | | | | |
| | Household Products - 1.4% | | | |
| 32,000 | | Procter & Gamble Co. | | | 2,089,920 |
| | | | | |
| | Total Consumer Staples | | | 5,527,370 |
| | | | | |
| | |
| | ENERGY - 17.7% | | | |
| | Energy Equipment & Services - 1.0% |
| 14,200 | | Diamond Offshore Drilling Inc. | | | 1,493,272 |
| | | | | |
| | Oil, Gas & Consumable Fuels - 16.7% |
| 10,876 | | EnCana Corp. | | | 636,246 |
| 112,500 | | Murphy Oil Corp. | | | 6,855,750 |
| 20,900 | | Overseas Shipholding Group Inc. | | | 1,492,260 |
| 203,600 | | Royal Dutch Shell PLC, ADR, Class A Shares | | | 15,748,460 |
| | | | | |
| | Total Oil, Gas & Consumable Fuels | | | 24,732,716 |
| | | | | |
| | Total Energy | | | 26,225,988 |
| | | | | |
| | | | | |
| Shares | | Security | | Value |
| | | | | |
| | |
| | FINANCIALS - 50.6% | | | |
| | Capital Markets - 11.0% | | | |
| 401,771 | | Bank of New York Mellon Corp. | | $ | 16,243,601 |
| | | | | |
| | Commercial Banks - 2.0% | | | |
| 237,400 | | Popular Inc. | | | 2,929,516 |
| | | | | |
| | Diversified Financial Services - 4.2% |
| 139,900 | | Leucadia National Corp. | | | 6,208,762 |
| | | | | |
| | Insurance - 14.0% | | | |
| 283,600 | | Chubb Corp. | | | 14,500,468 |
| 81,900 | | CNA Financial Corp. | | | 3,436,524 |
| 26,400 | | Loews Corp. | | | 1,241,064 |
| 82,500 | | Old Republic International Corp. | | | 1,500,675 |
| | | | | |
| | Total Insurance | | | 20,678,731 |
| | | | | |
| | Real Estate Investment Trusts (REITs) - 2.0% |
| 70,490 | | Rayonier Inc. | | | 3,012,743 |
| | | | | |
| | Real Estate Management & Development - 15.8% |
| 249,700 | | Forest City Enterprises Inc., Class A Shares | | | 13,870,835 |
| 172,300 | | Forest City Enterprises Inc., Class B Shares (c) | | | 9,528,190 |
| | | | | |
| | Total Real Estate Management & Development | | | 23,399,025 |
| | | | | |
| | Thrifts & Mortgage Finance - 1.6% |
| 38,300 | | Freddie Mac | | | 2,359,663 |
| | | | | |
| | Total Financials | | | 74,832,041 |
| | | | | |
| |
| | HEALTH CARE - 4.8% |
| | Health Care Providers & Services - 3.8% |
| 13,900 | | Humana Inc. * | | | 890,851 |
| 59,208 | | WellPoint Inc. * | | | 4,771,572 |
| | | | | |
| | Total Health Care Providers & Services | | | 5,662,423 |
| | | | | |
See Accompanying Notes to the Financial Statements.
9
BARRETT
OPPORTUNITY FUND, INC.
Schedule of Investments (Continued)
August 31, 2007
| | | | | |
Shares | | Security | | Value |
| | | | | |
| | Pharmaceuticals - 1.0% | | | |
| 55,864 | | Pfizer Inc. | | $ | 1,387,662 |
| | | | | |
| | Total Health Care | | | 7,050,085 |
| | | | | |
| | |
| | INDUSTRIALS - 13.2% | | | |
| | Aerospace & Defense - 6.7% |
| 112,200 | | General Dynamics Corp. | | | 8,814,432 |
| 10,600 | | Lockheed Martin Corp. | | | 1,050,884 |
| | | | | |
| | Total Aerospace & Defense | | | 9,865,316 |
| | | | | |
| | Airlines - 0.9% | | | |
| 52,100 | | AMR Corp. * | | | 1,276,971 |
| | | | | |
| | Building Products - 2.8% | | | |
| 43,500 | | Ameron International Corp. | | | 4,154,250 |
| | | | | |
| | Commercial Services &
Supplies - 0.8% |
| 103,550 | | TRC Cos. Inc. * | | | 1,159,760 |
| | | | | |
| | Industrial Conglomerates - 1.1% |
| 44,100 | | General Electric Co. | | | 1,714,167 |
| | | | | |
| | Marine - 0.9% | | | |
| 25,000 | | Alexander & Baldwin Inc. | | | 1,297,750 |
| | | | | |
| | Total Industrials | | | 19,468,214 |
| | | | | |
| | |
| | MATERIALS - 1.1% | | | |
| | Chemicals - 1.1% | | | |
| 22,242 | | Monsanto Co. | | | 1,551,157 |
| | | | | |
| | Total Investments Before Short-term Investment (Cost - $21,113,648) | | | 147,326,593 |
| | | | | |
| | | | | |
Face
Amount | | Security | | Value |
| | | | | |
| | SHORT-TERM INVESTMENT - 0.3% |
| | Repurchase Agreement - 0.3% |
| $449,000 | | State Street Bank & Trust Co. dated 8/31/07, 4.640% due 9/4/07; Proceeds at maturity - $449,231; (Fully collateralized by U.S. Treasury Bond, 5.250% due 2/15/29; Market value - $462,000) (Cost - $449,000) | | $ | 449,000 |
| | | | | |
| | Total Investments - 100.0% (Cost - $21,562,648 #) | | | 147,775,593 |
| | | | | |
| | Other Assets in Excess of Liabilities - 0.0% | | | 15,094 |
| | | | | |
| | Total Net Assets - 100.0% | | $ | 147,790,687 |
| | | | | |
| * | Non-income producing security. |
| (b) | Security is valued in good faith at fair value by or under the direction of the Board of Directors (See Note 1). |
| (c) | Convertible into Forest City Enterprises Inc., Class A Shares. |
| # | Aggregate cost for federal income tax purposes is $21,592,065. |
Abbreviation used in this schedule:
ADR—American Depositary Receipt
See Accompanying Notes to the Financial Statements.
10
BARRETT
OPPORTUNITY FUND, INC.
Statement of Assets and Liabilities
August 31, 2007
| | | |
ASSETS: | | | |
Investments, at value
(Cost - $21,562,648) | | $ | 147,775,593 |
Cash | | | 904 |
Dividends and interest receivable | | | 250,235 |
Receivable for Fund shares sold | | | 1,000 |
Prepaid expenses | | | 13,370 |
| | | |
Total assets | | | 148,041,102 |
| | | |
LIABILITIES: | | | |
Investment management fee payable | | | 95,035 |
Payable for Fund shares repurchased | | | 58,386 |
Directors’ fees payable | | | 5,275 |
Accrued expenses and other | | | 91,719 |
| | | |
Total liabilities | | | 250,415 |
| | | |
Total net assets | | $ | 147,790,687 |
| | | |
NET ASSETS: | | | |
Par value (Note 4) | | $ | 24,382 |
Paid-in capital in excess of par value | | | 13,450,812 |
Undistributed net investment income | | | 605,853 |
Accumulated net realized gain on investments | | | 7,496,695 |
Net unrealized appreciation on investments | | | 126,212,945 |
| | | |
Total net assets | | $ | 147,790,687 |
| | | |
Shares outstanding | | | 2,438,166 |
| | | |
Net asset value | | | $60.62 |
| | | |
Statement of Operations
For the Year Ended August 31, 2007
| | | | |
INVESTMENT INCOME: | | | | |
Dividends | | $ | 2,596,478 | |
Interest | | | 205,351 | |
Less: Foreign taxes withheld | | | (138,352 | ) |
| | | | |
Total investment income | | | 2,663,477 | |
| | | | |
| | | | |
EXPENSES: | | | | |
Investment management fee (Note 2) | | | 1,164,432 | |
Legal fees | | | 188,915 | |
Shareholder reports | | | 49,207 | |
Directors’ fees | | | 48,165 | |
Transfer agent fees | | | 38,998 | |
Audit and tax | | | 35,475 | |
Registration fees | | | 31,066 | |
Insurance | | | 3,704 | |
Custody fees | | | 528 | |
Miscellaneous expenses | | | 9,434 | |
| | | | |
Total expenses | | | 1,569,924 | |
| | | | |
Net investment income | | | 1,093,553 | |
| | | | |
| | | | |
REALIZED AND UNREALIZED GAIN ON INVESTMENTS (NOTES 1 AND 3): | | | | |
Net realized gain from investment transactions | | | 7,628,829 | |
Change in net unrealized appreciation/depreciation from investments | | | 7,334,285 | |
| | | | |
Net gain on investments | | | 14,963,114 | |
| | | | |
Increase in net assets from operations | | $ | 16,056,667 | |
| | | | |
See Accompanying Notes to the Financial Statements.
11
BARRETT
OPPORTUNITY FUND, INC.
Statements of Changes in Net Assets
| | | | | | | | |
| | | Year Ended
August 31, 2007 | | | Year Ended
August 31, 2006 | |
OPERATIONS: | | | | | | | | |
Net investment income | | $ | 1,093,553 | | | $ | 923,921 | |
Net realized gain | | | 7,628,829 | | | | 6,471,248 | |
Change in net unrealized appreciation/depreciation | | | 7,334,285 | | | | 11,969,845 | |
| | | | | | | | |
Increase in net assets from operations | | | 16,056,667 | | | | 19,365,014 | |
| | | | | | | | |
| | | | | | | | |
DISTRIBUTIONS TO SHAREHOLDERS FROM (NOTES 1 and 5): | | | | | |
Net investment income | | | (900,000 | ) | | | (1,199,486 | ) |
Net realized gains | | | (4,731,882 | ) | | | (3,070,462 | ) |
| | | | | | | | |
Decrease in net assets from distributions to shareholders | | | (5,631,882 | ) | | | (4,269,948 | ) |
| | | | | | | | |
| | | | | | | | |
FUND SHARE TRANSACTIONS (NOTE 4): | | | | | | | | |
Net proceeds from sale of shares | | | 6,449,093 | | | | 12,287,794 | |
Reinvestment of distributions | | | 2,777,928 | | | | 2,092,345 | |
Cost of shares repurchased | | | (29,617,914 | ) | | | (8,557,079 | ) |
| | | | | | | | |
Increase (Decrease) in net assets from fund share transactions | | | (20,390,893 | ) | | | 5,823,060 | |
| | | | | | | | |
Increase (Decrease) in net assets | | | (9,966,108 | ) | | | 20,918,126 | |
| | | | | | | | |
NET ASSETS: | | | | | | | | |
Beginning of year | | | 157,756,795 | | | | 136,838,669 | |
| | | | | | | | |
End of year* | | $ | 147,790,687 | | | $ | 157,756,795 | |
| | | | | | | | |
*Includes undistributed net investment income of: | | | $605,853 | | | | $414,974 | |
| | | | | | | | |
See Accompanying Notes to the Financial Statements.
12
BARRETT
OPPORTUNITY FUND, INC.
Financial Highlights
For a share of capital stock outstanding throughout each year ended August 31:
| | | | | | | | | | | | | | | | | | | | |
| | | 2007 | | | 2006 | | | 2005 | | | 2004 | | | 2003 | |
NET ASSET VALUE | | | | | | | | | | | | | | | | | | | | |
Beginning of year | | $ | 56.71 | | | $ | 50.98 | | | $ | 42.92 | | | $ | 41.34 | | | $ | 41.86 | |
| | | | | | | | | | | | | | | | | | | | |
INCOME FROM OPERATIONS: | | | | | | | | | | | | | | | | | | | | |
Net investment income | | | 0.45 | | | | 0.32 | | | | 0.53 | | | | 0.49 | | | | 0.33 | |
Net realized and unrealized gain | | | 5.67 | | | | 7.04 | | | | 8.31 | | | | 3.99 | | | | 0.61 | |
| | | | | | | | | | | | | | | | | | | | |
Total Income From Operations | | | 6.12 | | | | 7.36 | | | | 8.84 | | | | 4.48 | | | | 0.94 | |
| | | | | | | | | | | | | | | | | | | | |
LESS DISTRIBUTIONS FROM: | | | | | | | | | | | | | | | | | | | | |
Net investment income | | | (0.35 | ) | | | (0.46 | ) | | | (0.56 | ) | | | (0.37 | ) | | | (0.19 | ) |
Net realized gains | | | (1.86 | ) | | | (1.17 | ) | | | (0.22 | ) | | | (2.53 | ) | | | (1.27 | ) |
| | | | | | | | | | | | | | | | | | | | |
Total Distributions | | | (2.21 | ) | | | (1.63 | ) | | | (0.78 | ) | | | (2.90 | ) | | | (1.46 | ) |
| | | | | | | | | | | | | | | | | | | | |
NET ASSET VALUE | | | | | | | | | | | | | | | | | | | | |
End of Year | | $ | 60.62 | | | $ | 56.71 | | | $ | 50.98 | | | $ | 42.92 | | | $ | 41.34 | |
| | | | | | | | | | | | | | | | | | | | |
Total Return1 | | | 10.92 | % | | | 14.79 | % | | | 20.77 | % | | | 11.09 | % | | | 2.57 | % |
| | | | | | | | | | | | | | | | | | | | |
Net Assets, End of Year (millions) | | | $148 | | | | $158 | | | | $137 | | | | $131 | | | | $146 | |
RATIOS TO AVERAGE NET ASSETS: | | | | | | | | | | | | | | | | | | | | |
Gross expenses | | | 1.01 | % | | | 1.04 | % | | | 0.96 | % | | | 1.06 | % | | | 1.12 | % |
Net expenses | | | 1.01 | | | | 1.04 | 2 | | | 0.96 | | | | 1.06 | | | | 1.12 | |
Net investment income | | | 0.70 | | | | 0.66 | | | | 1.06 | | | | 1.04 | | | | 0.82 | |
Portfolio Turnover Rate | | | 6 | % | | | 0 | %3,4 | | | 1 | %3 | | | 1 | %3 | | | 5 | % |
1 | | Performance figures may reflect fee waivers and/or expense reimbursements. In the absence of fee waivers and/or expense reimbursements, the total return would have been lower. Past performance is no guarantee of future results. |
2 | | Reflects fee waivers and/or expense reimbursements. |
3 | | Excludes the value of portfolio securities delivered as a result of in-kind redemptions of the Fund’s capital shares. |
4 | | Amount represents less than 1%. |
See Accompanying Notes to the Financial Statements.
13
BARRETT
OPPORTUNITY FUND, INC.
Notes to Financial Statements
1. ORGANIZATION AND SIGNIFICANT ACCOUNTING POLICIES | Barrett Opportunity Fund, Inc. (formerly known as Salomon Brothers Opportunity Fund Inc.) (the “Fund”), is registered as a non-diversified, open-end management investment company under the Investment Company Act of 1940, as amended (the “1940 Act”). |
The following are significant accounting policies consistently followed by the Fund and are in conformity with U.S. generally accepted accounting principles (“GAAP”). Estimates and assumptions are required to be made regarding assets, liabilities and changes in net assets resulting from operations when financial statements are prepared. Changes in the economic environment, financial markets and any other parameters used in determining these estimates could cause actual results to differ.
(a) Investment Valuation
Equity securities for which market quotations are available are valued at the last reported sales price or official closing price on the primary market or exchange on which they trade. Debt securities are valued at the mean between the last quoted bid and asked prices provided by an independent pricing service that are based on transactions in debt obligations, quotations from bond dealers, market transactions in comparable securities and various other relationships between securities. When prices are not readily available, or are determined not to reflect fair value, such as when the value of a security has been significantly affected by events after the close of the exchange or market on which the security is principally traded, but before the Fund calculates its net asset value, the Fund may value these securities at fair value as determined in accordance with the procedures approved by the Fund’s Board of Directors. Short-term obligations with maturities of 60 days or less are valued at amortized cost, which approximates fair value.
(b) Repurchase Agreements
When entering into repurchase agreements, it is the Fund’s policy that its custodian or a third party custodian take possession of the underlying collateral securities, the market value of which, at all times, at least equals the principal amount of the repurchase transaction, including accrued interest. To the extent that any repurchase transaction exceeds one business day, the value of the collateral is marked-to-market to ensure the adequacy of the collateral. If the seller defaults, and the market value of the collateral declines or if bankruptcy proceedings are commenced with respect to the seller of the security, realization of the collateral by the Fund may be delayed or limited.
(c) Security Transactions and Investment Income
Security transactions are accounted for on a trade date basis. Interest income, adjusted for amortization of premium and accretion of discount, is recorded on the accrual basis. Dividend income is recorded on the ex-dividend date. Foreign dividend income is recorded on the ex-dividend date or as soon as practical after
14
BARRETT
OPPORTUNITY FUND, INC.
the Fund determines the existence of a dividend declaration after exercising reasonable due diligence. The cost of investments sold is determined by use of the specific identification method. To the extent any issuer defaults on an expected interest payment, the Fund’s policy is to generally halt any additional interest income accruals and consider the realizability of interest accrued up to the date of default.
(d) Distributions to Shareholders
Distributions from net investment income and distributions of net realized gains, if any, are declared at least annually. Distributions to shareholders of the Fund are recorded on the ex-dividend date and are determined in accordance with income tax regulations, which may differ from GAAP.
(e) REIT Distributions
The character of distributions received from real estate investment trusts (“REITs”) held by the Fund is generally comprised of net investment income, capital gains, and return of capital. It is the policy of the Fund to estimate the character of distributions received from underlying REITs based on historical data provided by the REITs. After each calendar year end, REITs report the actual tax character of these distributions. Differences between the estimated and actual amounts reported by the REITs are reflected in the Fund’s records in the year in which they are reported by the REITs.
(f) Federal and Other Taxes
It is the Fund’s policy to comply with the federal income and excise tax requirements of the Internal Revenue Code of 1986, as amended, applicable to regulated investment companies. Accordingly, the Fund intends to distribute substantially all of its taxable income and net realized gains on investments, if any, to shareholders each year. Therefore, no federal income tax provision is required in the Fund’s financial statements. Under the applicable foreign tax laws, a withholding tax may be imposed on interest, dividends and capital gains at various rates.
(g) Reclassification
GAAP requires that certain components of net assets be adjusted to reflect permanent differences between financial and tax reporting. These reclassifications have no effect on net assets or net asset values per share. During the current year, the following reclassifications have been made:
| | | | | | | | |
| | | Undistributed Net
Investment Income | | | Accumulated Net
Realized Gain | | | Paid-in Capital |
| (a) | | — | | | $(14,991 | ) | | $14,991 |
| (b) | | $(2,674 | ) | | 2,674 | | | — |
| | (a) | | Reclassifications are primarily due to book/tax differences in the treatment of various items. |
| | (b) | | Reclassifications are primarily due to book/tax differences in the treatment of a partnership interest. |
15
BARRETT
OPPORTUNITY FUND, INC.
| 2. | | INVESTMENT MANAGEMENT AGREEMENT AND OTHER TRANSACTIONS WITH AFFILIATES |
Before December 1, 2006, ClearBridge Asset Management Inc. (“Clearbridge”), a wholly-owned subsidiary of Legg Mason, Inc. (“Legg Mason”), served as the investment manager of the Fund. Effective December 1, 2006, Barrett Associates, Inc. (“Barrett”), a wholly-owned subsidiary of Legg Mason, became the Fund’s investment manager pursuant to a new investment management agreement. Under the investment management agreement with Barrett, the Fund pays an investment management fee calculated daily and paid monthly in accordance with the following breakpoint schedule:
| | | |
| Average Daily Net Assets | | Annual Rate | |
| First $1 billion | | 0.750 | % |
| Next $1 billion | | 0.725 | |
| Next $3 billion | | 0.700 | |
| Next $5 billion | | 0.675 | |
| Over $10 billion | | 0.650 | |
Under the prior investment management agreement with ClearBridge, the Fund paid an investment management fee calculated daily and paid monthly in accordance with the same breakpoint schedule shown above.
Since December 1, 2006, Legg Mason Partners Fund Advisor, LLC (“LMPFA”) serves as the sub-administrator for the Fund, providing certain administrative services for the Fund pursuant to a sub-administration agreement between Barrett and LMPFA. LMPFA is an affiliate of Legg Mason and Barrett. Barrett, and not the Fund, pays LMPFA for its services as sub-administrator.
Citigroup Global Markets Inc. (“CGM”) and Legg Mason Investor Services, LLC (“LMIS”), serve as co-distributors of the Fund. LMIS is a wholly owned broker-dealer subsidiary of Legg Mason.
The officers of the Fund are employees of Legg Mason or its affiliates and do not receive compensation from the Fund.
During the year ended August 31, 2007, the aggregate cost of purchases and proceeds from sales of investments (excluding short-term investments) were as follows:
| | |
| Purchases | | Sales |
| $8,589,529 | | $18,339,306 |
At August 31, 2007, the aggregate gross unrealized appreciation and depreciation of investments for federal income tax purposes were as follows:
| | | | |
Gross unrealized appreciation | | $ | 126,876,996 | |
Gross unrealized depreciation | | | (693,468 | ) |
| | | | |
Net unrealized appreciation | | $ | 126,183,528 | |
| | | | |
16
BARRETT
OPPORTUNITY FUND, INC.
At August 31, 2007, the Fund had 15,000,000 shares of capital stock authorized with a par value of $0.01 per share.
Transactions in shares of the Fund were as follows:
| | | | | | |
| | | Year Ended
August 31, 2007 | | | Year Ended
August 31, 2006 | |
Shares sold | | 111,929 | | | 218,940 | |
Shares issued on reinvestment | | 47,381 | | | 40,890 | |
Shares repurchased | | (503,024 | ) | | (162,328 | ) |
| | | | | | |
Net increase (decrease) | | (343,714 | ) | | 97,502 | |
| | | | | | |
5. INCOME TAX INFORMATION AND DISTRIBUTIONS TO SHAREHOLDERS | The tax character of distributions paid during the fiscal years ended August 31, were as follows: |
| | | | | | |
| | | 2007 | | 2006 |
Distributions paid from: | | | | | | |
Ordinary income | | $ | 900,000 | | $ | 1,218,448 |
Net long-term capital gains | | | 4,731,882 | | | 3,051,500 |
| | | | | | |
Total taxable distributions | | $ | 5,631,882 | | $ | 4,269,948 |
| | | | | | |
As of August 31, 2007, the components of accumulated earnings on a tax basis were as follows:
| | | |
Undistributed ordinary income - net | | $ | 600,184 |
Undistributed long-term capital gains - net | | | 7,526,112 |
| | | |
Total undistributed earnings | | $ | 8,126,296 |
Other book/tax temporary differences (a) | | | 5,669 |
Unrealized appreciation (depreciation) (b) | | | 126,183,528 |
| | | |
Total accumulated earnings/(losses) - net | | $ | 134,315,493 |
| | | |
| | (a) | Other book/tax temporary differences are attributable primarily to the differences in the book/tax treatment of various items. |
| | (b) | The difference between book-base and tax-basis unrealized appreciation/(depreciation) is attributable primary to the tax deferral of losses on wash sales and book/tax differences in the treatment of corporate actions. |
6. LEGAL MATTERS | Beginning in June 2004, class action lawsuits alleging violations of the federal securities laws were filed against CGM and a number of its then affiliates, including Smith Barney Fund Management LLC (“SBFM”) and Salomon Brothers Asset Management Inc. (“SBAM”), which were then investment adviser or manager to certain of the Funds (the “Managers”), substantially all of the mutual funds then managed by the Managers (the “Defendant Funds”), and Board members of the Defendant Funds (collectively, the “Defendants”). The complaints alleged, among other things, that CGM created various undisclosed incentives for its brokers to sell Smith Barney and Salomon Brothers funds. In |
17
BARRETT
OPPORTUNITY FUND, INC.
addition, according to the complaints, the Managers caused the Defendant Funds to pay excessive brokerage commissions to CGM for steering clients towards proprietary funds. The complaints also alleged that the Defendants breached their fiduciary duty to the Defendant Funds by improperly charging Rule 12b-1 fees and by drawing on fund assets to make undisclosed payments of soft dollars and excessive brokerage commissions. The complaints also alleged that the Defendant Funds failed to adequately disclose certain of the allegedly wrongful conduct. The complaints sought injunctive relief and compensatory and punitive damages, rescission of the Defendant Funds’ contracts with the Managers, recovery of all fees paid to the Managers pursuant to such contracts and an award of attorneys’ fees and litigation expenses.
On December 15, 2004, a consolidated amended complaint (the “Complaint”) was filed alleging substantially similar causes of action. On May 27, 2005, all of the Defendants filed motions to dismiss the Complaint. On July 26, 2006, the court issued a decision and order (1) finding that plaintiffs lacked standing to sue on behalf of the shareholders of the Funds in which none of the plaintiffs had invested and dismissing those Funds from the case (although stating that they could be brought back into the case if standing as to them could be established), and (2) other than one stayed claim, dismissing all of the causes of action against the remaining Defendants, with prejudice, except for the cause of action under Section 36(b) of the 1940 Act, which the court granted plaintiffs leave to repeal as a derivative claim.
On October 16, 2006, plaintiffs filed their Second Consolidated Amended Complaint (“Second Amended Complaint”) which alleges derivative claims on behalf of nine funds identified in the Second Amended Complaint, under Section 36(b) of the 1940 Act, against CAM, SBAM, SBFM and CGM as investment advisers to the identified funds, as well as CGM as a distributor for the identified funds (collectively, the “Second Amended Complaint Defendants”). The Fund was not identified in the Second Amended Complaint. The Second Amended Complaint alleges no claims against any of the funds or any of their Board Members. Under Section 36(b), the Second Amended Complaint alleges similar facts and seeks similar relief against the Second Amended Complaint Defendants as the Complaint. The Defendants have filed a motion to dismiss the Second Amended Complaint. It is uncertain when the court will decide the motion. No assurances can be given as to the outcome of this matter.
Additional lawsuits arising out of these circumstances and presenting similar allegations and requests for relief may be filed in the future.
* * *
Beginning in August 2005, five class action lawsuits alleging violations of federal securities laws and state law were filed against CGM and SBFM, (collectively, the “Defendants”) based on the May 31, 2005 settlement order issued against the Defendants by the Securities and Exchange Commission (“SEC”) as previously
18
BARRETT
OPPORTUNITY FUND, INC.
described. The complaints seek injunctive relief and compensatory and punitive damages, removal of SBFM as the investment manager for the Smith Barney family of funds, rescission of the funds’ management and other contracts with SBFM, recovery of all fees paid to SBFM pursuant to such contracts, and an award of attorneys’ fees and litigation expenses.
On October 5, 2005, a motion to consolidate the five actions and any subsequently filed, related action was filed. That motion contemplates that a consolidated amended complaint alleging substantially similar causes of action will be filed in the future.
As of the date of this report, the Fund’s investment manager believes that resolution of the pending lawsuit will not have a material effect on the financial position or results of operations of the Fund or the ability of the Fund’s investment manager and its affiliates to continue to render services to the Fund under their respective contracts.
On September 26, 2007, the United States District Court for the Southern District of New York issued an order dismissing the consolidated complaint. The plaintiffs have the ability to appeal this order.
7. OTHER MATTERS | As previously disclosed, on September 16, 2005, the staff of the SEC informed SBFM and SBAM, former investment advisers and administrators to the various funds, including the Fund, that the staff was considering recommending administrative proceedings against SBFM and SBAM for alleged violations of Section 19(a) and 34(b) of the Investment Company Act (and related Rule 19a-1). On September 27, 2007, SBFM and SBAM, without admitting or denying any findings therein, consented to the entry of an order by the SEC relating to the written disclosure by certain other closed-end funds of the sources of distributions paid by the funds between 2001 and 2004. Each of SBFM and SBAM agreed to pay a fine of $450,000, for which they were indemnified by Citigroup, Inc., their former parent. It is not expected that this matter will adversely impact the Fund or its current investment adviser. |
* * *
On July 24, 2007, NYSE Regulation, Inc. (“NYSE Regulation”) and the New Jersey Bureau of Securities (“NJBS”) announced they had censured and fined CGM for failing to supervise trading of mutual fund shares and variable annuity mutual fund sub-accounts, failing to prevent deceptive market timing by certain brokers on behalf of hedge-fund customers, and failing to maintain adequate books and records during the period from January 2000 to September 2003. Under the settlement with NYSE Regulation and NJBS, CGM agreed to pay a total of $50 million in disgorgement and penalties and neither admitted nor denied guilt. CGM is a distributor of the Fund. LMPFA believes that this settlement will not have any effect on the financial position or results of operations of the Funds. The investment manager has been informed by CGM
19
BARRETT
OPPORTUNITY FUND, INC.
that the settlement will not affect the ability of CGM to continue to render services to the Fund under its contract.
8. RECENT ACCOUNTING PRONOUNCEMENTS | During June 2006, the Financial Accounting Standards Board (“FASB”) issued FASB Interpretation 48 (“FIN 48” or the “Interpretation”), Accounting for Uncertainty in Income Taxes — an interpretation of FASB Statement 109. FIN 48 supplements FASB Statement 109, Accounting for Income Taxes, by defining the confidence level that a tax position must meet in order to be recognized in the financial statements. FIN 48 prescribes a comprehensive model for how a fund should recognize, measure, present, and disclose in its financial statements uncertain tax positions that the fund has taken or expects to take on a tax return. FIN 48 requires that the tax effects of a position be recognized only if it is “more likely than not” to be sustained based solely on its technical merits. Management must be able to conclude that the tax law, regulations, case law, and other objective information regarding the technical merits sufficiently support the position’s sustainability with a likelihood of more than 50 percent. FIN 48 is effective for fiscal periods beginning after December 15, 2006, which for this Fund was September 1, 2007. At adoption, the financial statements must be adjusted to reflect only those tax positions that are more likely than not to be sustained as of the adoption date. Management of the Fund has determined that adopting FIN 48 will not have a material impact on the Fund’s financial statements. |
* * *
On September 20, 2006, FASB released Statement of Financial Accounting Standards No. 157 Fair Value Measurements (“FAS 157”). FAS 157 establishes an authoritative definition of fair value, sets out a framework for measuring fair value, and requires additional disclosures about fair value measurements. The application of FAS 157 is required for fiscal years beginning after November 15, 2007 and interim periods within those fiscal years. At this time, management is evaluating the implications of FAS 157 and its impact on the financial statements has not yet been determined.
20
BARRETT
OPPORTUNITY FUND, INC.
REPORT OF INDEPENDENT REGISTERED PUBLIC ACCOUNTING FIRM |
The Board of Directors and Shareholders
Barrett Opportunity Fund, Inc.:
We have audited the accompanying statement of assets and liabilities, including the schedule of investments, of Barrett Opportunity Fund, Inc. (formerly Salomon Brothers Opportunity Fund Inc) as of August 31, 2007, and the related statement of operations for the year then ended, and the statements of changes in net assets for each of the years in the two-year period then ended and the financial highlights for each of the years in the three-year period then ended. These financial statements and financial highlights are the responsibility of the Fund’s management. Our responsibility is to express an opinion on these financial statements and financial highlights based on our audits. The financial highlights for each of the years in the two-year period ended August 31, 2004 were audited by other independent registered public accountants whose report thereon, dated October 22, 2004, expressed an unqualified opinion on those financial highlights.
We conducted our audits in accordance with the standards of the Public Company Accounting Oversight Board (United States). Those standards require that we plan and perform the audit to obtain reasonable assurance about whether the financial statements and financial highlights are free of material misstatement. An audit includes examining, on a test basis, evidence supporting the amounts and disclosures in the financial statements. Our procedures included confirmation of securities owned as of August 31, 2007, by correspondence with the custodian and brokers or by other appropriate auditing procedures. An audit also includes assessing the accounting principles used and significant estimates made by management, as well as evaluating the overall financial statement presentation. We believe that our audits provide a reasonable basis for our opinion.
In our opinion, the financial statements and financial highlights referred to above present fairly, in all material respects, the financial position of Barrett Opportunity Fund, Inc. as of August 31, 2007, and the results of its operations for the year then ended, the changes in its net assets for each of the years in the two-year period then ended, and the financial highlights for each of the years in the three-year period then ended, in conformity with U.S. generally accepted accounting principles.

New York, New York
October 25, 2007
21
BARRETT
OPPORTUNITY FUND, INC.
Additional Information (Unaudited)
| 1. | INFORMATION ABOUT DIRECTORS AND OFFICERS |
The business and affairs of Barrett Opportunity Fund, Inc. (“Fund”) are managed under the direction of its Board of Directors. Information pertaining to the Directors and certain officers of the Fund is set forth below.
| | | | | | | | | | |
Name, Address and
Birth Year | | Position(s)
Held with
Fund | | Term of Office
and Length of
Time Served | | Principal Occupation(s)
During Past 5 Years | | Number of
Portfolios
in Fund
Complex
Overseen
by Director | | Other Board
Memberships
Held by
Director |
NON-INTERESTED DIRECTORS: | | | | | | |
Barry Handel, CPA 893 Lakeside Drive Woodmere, NY 11598 Birth Year: 1951 | | Director | | Since 2005 | | Partner, Falk & Handel LLP (accounting firm) | | 1 | | None |
| | | | | |
Rosalind A. Kochman 35 Prospect Park West, Apt. 15B Brooklyn, NY 11215 Birth Year: 1937 | | Director Chairperson | | Since 1990 Since 2005 | | Health care consultant and retired attorney, prior to 2002, Chief Executive Officer, Brooklyn Eye Surgery Center, and Administrator, Kochman, Lebowitz & Mobil, MDs | | 1 | | None |
| | | | | |
William Morris, Jr., CPA 22 Stonegate Drive Silver Spring, MD 20905 Birth Year: 1948 | | Director | | Since 2005 | | President, William Morris & Associates P.C. (accounting firm) (since 2001); formerly, President, Reese & Morris P.A. (accounting firm) (1980-2001) | | 1 | | None |
| | | | | |
Irving Sonnenschein Sonnenschein, Sherman & Deutsch 888 7th Avenue New York, NY 10106 Birth Year: 1920 | | Director | | Since 1994 | | Partner in the law firm of Sonnenschein, Sherman & Deutsch | | 1 | | None |
| | | | |
INTERESTED DIRECTOR: | | | | | | | | |
Irving Brilliant* 35 Prospect Park West, Apt. 11B Brooklyn, NY 11215 Birth Year: 1918 | | Director | | Since 1978 | | Retired; prior to April 2003, Director of SBAM and Citigroup Global Markets Inc. (“CGM”) and portfolio manager of the Fund | | 1 | | None |
22
BARRETT
OPPORTUNITY FUND, INC.
| | | | | | | | | | |
Name, Address and
Birth Year | | Position(s)
Held with
Fund | | Term of Office
and Length of
Time Served | | Principal Occupation(s)
During Past 5 Years | | Number of
Portfolios
in Fund
Complex
Overseen
by Director | | Other Board
Memberships
Held by
Director |
OFFICERS: | | | | | | | | |
Peter H. Shriver, CFA® Barrett Associates, Inc. (“Barrett Associates”) 90 Park Avenue New York, NY 10016 Birth Year: 1952 | | President and Chief Executive Officer | | Since December 2006 | | President of Barrett Associates (since April 2004); Managing Director of Barrett Associates (1989-2004) | | N/A | | N/A |
| | | | | |
Amy LaGuardia, CFA® Barrett Associates 90 Park Avenue New York, NY 10016 Birth Year: 1957 | | Vice President and Investment Officer | | Since December 2006 | | Senior Vice President and member of Seifert Group, Barrett Associates (since 2003); Portfolio Manager of Legg Mason Financial Services Fund (since 1998); Senior Vice President and Director of Research, Gray, Seifert & Co. (investment firm) (1982-2003) | | N/A | | N/A |
| | | | | |
Robert J. Milnamow Barrett Associates 90 Park Avenue New York, NY 10016 Birth Year: 1950 | | Vice President and Investment Officer | | Since December 2006 | | Managing Director, Barrett Associates (since November 2003); Managing Member at Thayer Pond Capital, LLC (2001-2003); Senior Portfolio Manager at Rockefeller & Co. (investment firm) (1998-2001) | | N/A | | N/A |
| | | | | |
Frances M. Guggino Legg Mason & Co., LLC (“Legg Mason”) 125 Broad Street, 10th Floor New York, NY 10004 Birth Year: 1957 | | Chief Financial Officer and Treasurer | | Since 2004 | | Director of Legg Mason; Chief Financial Officer and Treasurer of certain mutual funds associated with Legg Mason; Formerly Controller of certain mutual funds associated with Legg Mason (from 1999 to 2004) | | N/A | | N/A |
| | | | | |
Todd F. Kuehl Legg Mason 100 Light Street Baltimore, MD 21202 Birth Year: 1969 | | Chief Compliance Officer | | Since December 2006 | | Vice President, Legg Mason Office of the Chief Compliance Officer (since February 2006); Branch Chief, Office of Investment Company Regulation, Division of Investment Management, Securities and Exchange Commission (2002-2006); Vice President, Deutsche Asset Management (1998-2002) | | N/A | | N/A |
23
BARRETT
OPPORTUNITY FUND, INC.
| | | | | | | | | | |
Name, Address and
Birth Year | | Position(s)
Held with
Fund | | Term of Office
and Length of
Time Served | | Principal Occupation(s)
During Past 5 Years | | Number of
Portfolios
in Fund
Complex
Overseen
by Director | | Other Board
Memberships
Held by
Director |
John Chiota Legg Mason 300 First Stamford Place, 2nd Floor Stamford, CT 06902 Birth Year: 1968 | | Chief Anti-Money Laundering Compliance Officer | | Since 2006 | | Vice President of Legg Mason or its predecessors (since 2004); Chief Anti-Money Laundering Compliance Officer with certain mutual funds associated with Legg Mason (since 2006); Prior to August 2004, Chief AML Compliance Officer with
TD Waterhouse | | N/A | | N/A |
| | | | | |
David Castano Legg Mason 125 Broad Street, 10th Floor New York, NY 10004 Birth Year: 1971 | | Controller | | Since 2007 | | Controller of certain mutual funds associated with Legg Mason (since 2007); Formerly, Assistant Treasurer of Lord Abbett mutual funds (from 2004 to 2006); Supervisor at UBS Global Asset Management (from 2003 to 2004); Accounting Manager at Citigroup Asset Management (prior to 2003) | | N/A | | N/A |
| | | | | |
Matthew Plastina Legg Mason 125 Broad Street, 10th Floor New York, NY 10004 Birth Year: 1970 | | Controller | | Since 2007 | | Assistant Vice President of Legg Mason or its predecessor (since 1999); Controller of certain mutual funds associated with Legg Mason (since 2007); Formerly, Assistant Controller of certain mutual funds associated with Legg Mason (from 2002 to 2007) | | N/A | | N/A |
| | | | | |
Robert I. Frenkel Legg Mason 300 First Stamford Place, 2nd Floor Stamford, CT 06902 Birth Year: 1954 | | Secretary and Chief Legal Officer | | Since 2003 | | Managing Director and General Counsel of Global Mutual Funds for Legg Mason and its predecessors (since 1994); Secretary and Chief Legal Officer of mutual funds associated with Legg Mason & Co.; Formerly, Secretary of CFM (from 2001 to 2004) | | N/A | | N/A |
| * | | Mr. Brilliant is an “Interested Director” by virtue of his ownership of Citigroup Inc. securities. |
24
BARRETT
OPPORTUNITY FUND, INC.
Important Tax Information (Unaudited)
The following information is provided with respect to the distributions paid during the taxable year ended August 31, 2007.
| | |
| | | |
Record Date: | | 12/14/2006 |
Payable Date: | | 12/15/2006 |
Ordinary Income: | | |
Qualified Dividend Income for Individuals | | 100.00% |
Dividends Qualifying for the Dividends | | |
Received Deduction for Corporations | | 100.00% |
Long-Term Capital Gain Dividend | | $1.856412 |
Additionally, the Fund designates $14,991 paid in connection with the redemption of Fund shares as long-term capital gain dividends for the taxable year ended August 31, 2007.
Please retain this information for your records.
25
(This page intentionally left blank.)
(This page intentionally left blank.)
(This page intentionally left blank.)
BARRETT OPPORTUNITY FUND, INC.
DIRECTORS
Irving G. Brilliant
Barry Handel, CPA
Rosalind A. Kochman
Chairperson
William Morris, Jr., CPA
Irving Sonnenschein
INVESTMENT MANAGER
Barrett Associates, Inc.
90 Park Avenue
New York, NY 10016
SUB-ADMINISTRATOR
Legg Mason Partners Fund Advisor, LLC
620 Eighth Avenue
New York, NY 10018
DISTRIBUTORS
Legg Mason Investor Services, LLC (LMIS)
100 Light Street
Baltimore, MD 21202
Citigroup Global Markets Inc. (CGM)
388 Greenwich Street
New York, NY 10013
CUSTODIAN
State Street Bank and Trust Company
2 Avenue De Lafeyette
Boston, MA 02111
TRANSFER AGENT
PFPC Inc.
P.O. Box 9699
Providence, Rhode Island 02940-9699
INDEPENDENT REGISTERED PUBLIC ACCOUNTING FIRM
KPMG LLP
345 Park Avenue
New York, NY 10154
Barrett Opportunity Fund, Inc.
125 Broad Street
10th Floor, MF-2
New York, New York 10004
This report is transmitted to the shareholders of Barrett Opportunity Fund, Inc. for their information. This is not a prospectus, circular or representation intended for use in the purchase of shares of the Fund or any securities mentioned in this report.
This report must be preceded or accompanied by a free prospectus. Investors should consider the Fund’s investment objectives, risks, charges and expenses carefully before investing. The prospectus contains this and other important information about the Fund. Please read the prospectus carefully before investing.
www.barrettassociates.com
©2007 Legg Mason Investor Services, LLC Member FINRA, SIPC
BARX010335
The Fund files its complete schedule of portfolio holdings with the Securities and Exchange Commission (“SEC”) for the first and third quarters of each fiscal year on Form N-Q. The Fund’s Forms N-Q are available on the SEC’s website at www.sec.gov. The Fund’s Forms N-Q may be reviewed and copied at the SEC’s Public Reference Room in Washington, D.C., and information on the operation of the Public Reference Room may be obtained by calling 1-800-SEC-0330. To obtain information on Form N-Q from the Fund, shareholders can call 1-800-451-2010.
Information on how the Fund voted proxies relating to portfolio securities during the prior 12-month period ended June 30th of each year, and a description of the policies and procedures that the Fund uses to determine how to vote proxies related to portfolio transactions is available (1) without charge, upon request, by calling 1-800-451-2010 and (2) on the SEC’s website at www.sec.gov.
ITEM 2. CODE OF ETHICS.
The registrant has adopted a code of ethics that applies to the registrant’s principal executive officer, principal financial officer, principal accounting officer or controller.
ITEM 3. AUDIT COMMITTEE FINANCIAL EXPERT.
The Board of Directors of the registrant has determined that Mr. Barry Handel possesses the technical attributes identified in Instruction 2(b) of Item 3 to Form N-CSR to qualify as an “audit committee financial expert,” and has designated Mr. Handel as the Audit Committee’s financial expert. Mr. Handel is an “independent” Director pursuant to paragraph (a)(2) of Item 3 to Form N-CSR.
ITEM 4. PRINCIPAL ACCOUNTANT FEES AND SERVICES.
a) Audit Fees. The aggregate fees billed in the last two fiscal years ending August 31, 2006 and August 31, 2007 (the “Reporting Periods”) for professional services rendered by the Registrant’s principal accountant (the “Auditor”) for the audit of the Registrant’s annual financial statements, or services that are normally provided by the Auditor in connection with the statutory and regulatory filings or engagements for the Reporting Periods, were $32,000 in 2006 and $33,400 in 2007.
b) Audit-Related Fees. The aggregate fees billed in the Reporting Period for assurance and related services by the Auditor that are reasonably related to the performance of the Registrant’s financial statements were $4,912 in 2006 and $0 in 2007. These services consisted of procedures performed in connections with the Annual Registration Statement filed on Form N-1A on behalf of the Barrett Opportunity Fund, Inc. (formerly known as Salomon Brothers Opportunity Fund Inc.).
In addition, there were no Audit-Related Fees billed in the Reporting Period for assurance and related services by the Auditor to the Registrant’s investment adviser (not including any sub-adviser whose role is primarily portfolio management and is subcontracted with or overseen by another investment adviser), and any entity controlling, controlled by or under common control with the investment adviser that provides ongoing services to the Barrett Opportunity Fund, Inc. (“service affiliates”), that were reasonably related to the performance of the annual audit of the service affiliates. Accordingly, there were no such fees that required pre-approval by the Audit Committee for the Reporting Periods (prior to May 6, 2003 services provided by the Auditor were not required to be pre-approved).
(c) Tax Fees. The aggregate fees billed in the Reporting Periods for professional services rendered by the Auditor for tax compliance, tax advice and tax planning (“Tax Services”) were $3,713 in 2006 and $5,200 in 2007. These services consisted of (i) review or preparation of U.S. federal, state, local and excise tax returns; (ii) U.S. federal, state and local tax planning, advice and assistance regarding statutory, regulatory or administrative developments, and (iii) tax advice regarding tax qualification matters and/or treatment of various financial instruments held or proposed to be acquired or held.
There were no fees billed for tax services by the Auditors to service affiliates during the Reporting Periods that required pre-approval by the Audit Committee.
d) All Other Fees. There were no other fees billed in the Reporting Periods for products and services provided by the Auditor, other than the services reported in paragraphs (a) through (c) of this Item for the Barrett Opportunity Fund, Inc.
All Other Fees. There were no other non-audit services rendered by the Auditor to ClearBridge Asset Management Inc. (“ClearBridge”) and any entity controlling, controlled by or under common control with ClearBridge that provided ongoing services to Barrett Opportunity Fund, Inc. requiring pre-approval by the Audit Committee in the Reporting Period.
(e) Audit Committee’s pre-approval policies and procedures described in paragraph (c) (7) of Rule 2-01 of Regulation S-X.
(1) The Charter for the Audit Committee (the “Committee”) of the Board of each registered investment company (the “Fund”) advised by ClearBridge or one of their affiliates (each, an “Adviser”) requires that the Committee shall approve (a) all audit and permissible non-audit services to be provided to the Fund and (b) all permissible non-audit services to be provided by the Fund’s independent auditors to the Adviser and any Covered Service Providers if the engagement relates directly to the operations and financial reporting of the Fund. The Committee may implement policies and procedures by which such services are approved other than by the full Committee.
The Committee shall not approve non-audit services that the Committee believes may impair the independence of the auditors. As of the date of the approval of this Audit Committee Charter, permissible non-audit services include any professional services (including tax services), that are not prohibited services as described below, provided to the Fund by the independent auditors, other than those provided to the Fund in connection with an audit or a review of the financial statements of the Fund. Permissible non-audit services may not include: (i) bookkeeping or other services related to the accounting records or financial statements of the Fund; (ii) financial information systems design and implementation; (iii) appraisal or valuation services, fairness opinions or contribution-in-kind reports; (iv) actuarial services; (v) internal audit outsourcing services; (vi) management functions or human resources; (vii) broker or dealer, investment adviser or investment banking services; (viii) legal services and expert services unrelated to the audit; and (ix) any other service the Public Company Accounting Oversight Board determines, by regulation, is impermissible.
Pre-approval by the Committee of any permissible non-audit services is not required so long as: (i) the aggregate amount of all such permissible non-audit services provided to the Fund, the Adviser and any service providers controlling, controlled by or under common control with the Adviser that provide ongoing services to the Fund (“Covered Service Providers”) constitutes not more than 5% of the total amount of revenues paid to the independent auditors during the fiscal year in which the permissible non-audit services are provided to (a) the Fund, (b) the Adviser and (c) any entity controlling, controlled by or under common control with the Adviser that provides ongoing services to the Fund during the fiscal year in which the services are provided that would have to be approved by the Committee; (ii) the permissible non-audit services were not recognized by the Fund at the time of the engagement to be non-audit services; and (iii) such services are promptly brought to the attention of the Committee and approved by the Committee (or its delegate(s)) prior to the completion of the audit.
(2) For the Barrett Opportunity Fund, Inc., the percentage of fees that were approved by the audit committee, with respect to: Audit-Related Fees were 100% and 0% for 2006 and 2007; Tax Fees were 100% and 0% for 2006 and 2007; and Other Fees were 100% and 0% for 2006 and 2007.
(f) N/A
(g) Non-audit fees billed by the Auditor for services rendered to Barrett Opportunity Fund, Inc. and ClearBridge and any entity controlling, controlled by, or under common control with ClearBridge that provides ongoing services to Barrett Opportunity Fund, Inc. during the reporting period were $0 in 2007.
(h) Yes. Barrett Opportunity Fund, Inc.’s Audit Committee has considered whether the provision of non-audit services that were rendered to Service Affiliates, which were not pre-approved (not requiring pre-approval), is compatible with maintaining the Accountant’s independence. All services provided by the Auditor to the Barrett Opportunity Fund, Inc. or to Service Affiliates, which were required to be pre-approved, were pre-approved as required.
ITEM 5. AUDIT COMMITTEE OF LISTED REGISTRANTS.
| | a) | The entire board of directors is acting as the registrant’s audit committee as specified in Section 3(a)(58)(B) of the Exchange Act .The Audit Committee consists of the following Board members: |
Barry Handel
Rosalind Kochman
William Morris
Irving Sonnenschein
ITEM 6. SCHEDULE OF INVESTMENTS.
Included herein under Item 1.
ITEM 7. DISCLOSURE OF PROXY VOTING POLICIES AND PROCEDURES FOR CLOSED-END MANAGEMENT INVESTMENT COMPANIES.
Not applicable.
ITEM 8. PORTFOLIO MANAGERS OF CLOSED-END MANAGEMENT INVESTMENT COMPANIES.
Not applicable.
ITEM 9. PURCHASES OF EQUITY SECURITIES BY CLOSED-END MANAGEMENT INVESTMENT COMPANY AND AFFILIATED PURCHASERS.
Not applicable.
ITEM 10. SUBMISSION OF MATTERS TO A VOTE OF SECURITY HOLDERS.
Not applicable.
ITEM 11. CONTROLS AND PROCEDURES.
| | (a) | The registrant’s principal executive officer and principal financial officer have concluded that the registrant’s disclosure controls and procedures (as defined in Rule 30a- 3(c) under the Investment Company Act of 1940, as amended (the “1940 Act”)) are effective as of a date within 90 days of the filing date of this report that includes the disclosure required by this paragraph, based on their evaluation of the disclosure controls and procedures required by Rule 30a-3(b) under the 1940 Act and 15d-15(b) under the Securities Exchange Act of 1934. |
| | (b) | There were no changes in the registrant’s internal control over financial reporting (as defined in Rule 30a-3(d) under the 1940 Act) that occurred during the registrant’s last fiscal half-year (the registrant’s second fiscal half-year in the case of an annual report) that have materially affected, or are likely to materially affect the registrant’s internal control over financial reporting. |
ITEM 12. EXHIBITS.
(a)(1) Code of Ethics attached hereto.
Exhibit 99.CODE ETH
(a) (2) Certifications pursuant to section 302 of the Sarbanes-Oxley Act of 2002 attached hereto.
Exhibit 99.CERT
(b) Certifications pursuant to Section 906 of the Sarbanes-Oxley Act of 2002 attached hereto.
Exhibit 99.906CERT
SIGNATURES
Pursuant to the requirements of the Securities Exchange Act of 1934 and the Investment Company Act of 1940, the registrant has duly caused this Report to be signed on its behalf by the undersigned, there unto duly authorized.
| | |
| Barrett Opportunity Fund, Inc. |
| |
| By: | | /s/ Peter H. Shriver |
| | Peter H. Shriver Chief Executive Officer of |
| | Barrett Opportunity Fund, Inc. |
| |
| Date: | | November 7, 2007 |
Pursuant to the requirements of the Securities Exchange Act of 1934 and the Investment Company Act of 1940, this report has been signed below by the following persons on behalf of the registrant and in the capacities and on the dates indicated.
| | |
| By: | | /s/ Peter H. Shriver |
| | Peter H. Shriver |
| | Chief Executive Officer of |
| | Barrett Opportunity Fund, Inc. |
| |
| Date: | | November 7, 2007 |
| |
| By: | | /s/ Frances M. Guggino |
| | Frances M. Guggino |
| | Chief Financial Officer of |
| | Barrett Opportunity Fund, Inc. |
| |
| Date: | | November 7, 2007 |