UNITED STATES
SECURITIES AND EXCHANGE COMMISSION
Washington, D.C. 20549
FORM N-CSR
CERTIFIED SHAREHOLDER REPORT OF
REGISTERED MANAGEMENT INVESTMENT COMPANIES
Investment Company Act file number: 811-2884
Salomon Brothers Opportunity Fund Inc
(Exact name of registrant as specified in charter)
125 Broad Street, New York, NY 10004
(Address of principal executive offices) (Zip code)
Robert I. Frenkel, Esq.
Salomon Brothers Asset Management Inc
300 First Stamford Place
Stamford, CT 06902
(Name and address of agent for service)
Registrant’s telephone number, including area code: (800) 725-6666
Date of fiscal year end: August 31
Date of reporting period: August 31, 2004
ITEM 1. REPORT TO STOCKHOLDERS.
The Annual Report to Stockholders is filed herewith.

Salomon Brothers
Opportunity Fund Inc
Annual Report
August 31, 2004
PFPC Inc.
P.O. Box 9764
Providence, Rhode Island 02940-9764
OPANN 8/04
04-7261
SALOMON BROTHERS OPPORTUNITY FUND INC
Letter From the Chairman
Dear Shareholder,
We encourage you to read this annual report for the Salomon Brothers Opportunity Fund Inc in full. A detailed summary of the fund’s performance can be found in the appropriate sections that follow. We hope you find this report to be useful and informative.
Sincerely,

Irving G. Brilliant Chairman
September 16, 2004
SALOMON BROTHERS OPPORTUNITY FUND INC
Manager Overview
Market Overview
In the beginning of the period the market was led higher by a continuation of the run up in more richly valued speculative names, primarily in the technology sector. Economic indicators such as job creation, worker productivity and manufacturing activity supported investor confidence. As we closed out 2003, companies on average posted double-digit earnings gains. In March the market took a bit of a breather as investors began to question the sustainability of earnings growth rates, and as global terrorism concerns became headline news with the Madrid train bombing. As we approached the end of the period, it became clear that the Fed would take preemptive action against inflation and raise short-term interest rates, which it did from a multi-decade low of 1% to 1.75%. The period ended just months ahead of the Presidential election with a jittery market as investors concerned themselves with the sustainability of healthy economic growth.
Performance Review
For the 12 months ended August 31, 2004, the Salomon Brothers Opportunity Fund Inc returned 11.09%, underperforming its unmanaged benchmark, the S&P 500 Index,i which returned 11.45% for the same period. The fund’s Lipper multi-cap value funds category average returned 14.16%.1
Contributors to Fund Performance
Sector contributors to performance for the period include a large underweight position in the information technology sector, an overweight position in the financials sector, and securities held in the healthcare sector.
In terms of individual securities, the greatest single contributor to fund performance over the past 12 months was Forest City Enterprises, Inc. In the energy sector, Royal Dutch Petroleum Co., the large global energy concern, was another major contributor to performance of the fund. Popular, Inc., the second largest Puerto Rican based bank, also contributed to the performance of the fund. This security we believe continues to show solid earnings growth. The fund maintained its position in these securities during the period.
PERFORMANCE SNAPSHOT AS OF AUGUST 31, 2004
| | | | | | |
| | | 6 Months | | | 12 Months | |
| | | | | | | |
| Salomon Brothers Opportunity Fund Inc | | -2.19 | % | | 11.09 | % |
| | | | | | | |
| S&P 500 Index | | -2.74 | % | | 11.45 | % |
| | | | | | | |
| Lipper Multi-Cap Value Funds Category Average | | -2.20 | % | | 14.16 | % |
The performance shown represents past performance. Past performance is no guarantee of future results and current performance may be higher or lower than the performance shown above. Principal value and investment returns will fluctuate and investors’ shares, when redeemed may be worth more or less than their original cost.
Lipper, Inc. is a major independent mutual-fund tracking organization. Returns are based on the period ended August 31, 2004, calculated among the 492 funds for the six-month period and among the 466 funds for the 12-month period, in the fund’s Lipper category, including the reinvestment of dividends and capital gains, if any, and excluding sales charges.
| 1 | | Lipper, Inc. is a major independent mutual-fund tracking organization. Average annual returns are based on the 12-month period ended August 31, 2004, calculated among the 466 funds in the fund’s Lipper category, including the reinvestment of dividends and capital gains, if any, and excluding sales charges. |
SALOMON BROTHERS OPPORTUNITY FUND INC
Detractors from Fund Performance
One reason for the fund’s slight underperformance relative to the benchmark was its cash position. Other detractors from performance include the fund’s holdings in the industrials sector and an underweight position in the utilities sector, which was one of the best performing sectors during the period.
TRC Companies, Inc. was a primary detractor from performance during the past year. The company is currently working through a challenging period in its project management business. Another detractor from performance during the period was AMR Corp., the parent company of American Airlines. AMR Corp has been affected by high fuel prices and a recovering travel industry. Koninklijke Philips Electronics N.V., another holding that detracted from the fund’s performance, has been pressured for reasons including a weak U.S. dollar and soft valuations in the semiconductor industry, in which the company participates. All three of these companies are long-term holdings and the fund did not change its holdings in any of these securities during the period.
We will continue to invest in stocks that we believe have reasonable valuations, solid financials, strong management teams and good growth prospects.
Thank you for your investment in the Salomon Brothers Opportunity Fund Inc. As ever, we appreciate that you have chosen us to manage your assets and we remain focused on achieving the fund’s investment goals.
Sincerely,

George J. Williamson
Investment Officer
September 16, 2004
SALOMON BROTHERS OPPORTUNITY FUND INC
Information About Your Fund
In recent months several issues in the mutual fund industry have come under the scrutiny of federal and state regulators. The fund’s Adviser and some of its affiliates have received requests for information from various government regulators regarding market timing, late trading, fees, and other mutual fund issues in connection with various investigations. The regulators appear to be examining, among other things, the fund’s response to market timing and shareholder exchange activity, including compliance with prospectus disclosure related to these subjects. The fund has been informed that the Adviser and its affiliates are responding to those information requests, but are not in a position to predict the outcome of these requests and investigations.
In November 2003, Citigroup Asset Management (“CAM”) disclosed an investigation by the Securities and Exchange Commission (“SEC”) and the U.S. Attorney relating to CAM’s entry into the transfer agency business during 1997-1999. Citigroup has disclosed that the Staff of the SEC is considering recommending a civil injunctive action and/or an administrative proceeding against certain advisory and transfer agent entities affiliated with Citigroup, the former CEO of CAM, a former employee and a current employee of CAM, relating to the creation, operation and fees of its internal transfer agent unit that serves various CAM-managed funds. This internal transfer agent did not provide services to the fund. Citigroup is cooperating with the SEC and will seek to resolve this matter in discussion with the SEC Staff. Although there can be no assurance, Citigroup does not believe that this matter will have a material adverse effect on the fund.
The information provided is not intended to be a forecast of future events, a guarantee of future results or investment advice. Views expressed may differ from those of the firm as a whole.
Portfolio holdings and breakdowns are as of August 31, 2004 and are subject to change and may not be representative of the portfolio manager’s current or future investments. The fund’s top ten holdings as of this date were: The Bank of New York Co., Inc. (10.53%), Royal Dutch Petroleum Co., ADR (9.54%), The Chubb Corp. (9.36%), Forest City Enterprises, Inc. Class A (6.94%), Koninklijke Philips Electronics N.V. ADR (5.91%), General Dynamics Corp. (4.96%), Popular, Inc. (4.73%), Forest City Enterprises, Inc. Class B (4.04%), Murphy Oil Corp. (3.50%), Wellpoint Health Networks Inc. (3.14%). Please refer to pages 9 through 12 for a list and percentage breakdown of the fund’s holdings.
RISKS: Investments in small- and medium capitalization companies may involve a higher degree of risk and volatility than investments in larger, more established companies. The fund may invest in high yield and foreign securities, which involve risks beyond those inherent in higher-rated and domestic investments. High yield bonds involve greater credit and liquidity risks than investment grade bonds. Investing in foreign securities is subject to certain risks not associated with domestic investing, such as currency fluctuations and changes in political and economic conditions. The fund may use derivatives, such as options or futures, which can be illiquid, may disproportionately increase losses, and have a potentially large impact on fund performance.
All index performance reflects no deduction for fees, expenses or taxes. Please note an investor cannot invest directly in an index.
| i | | The S&P 500 Index is a market capitalization-weighted index of 500 widely held common stocks. |
SALOMON BROTHERS OPPORTUNITY FUND INC
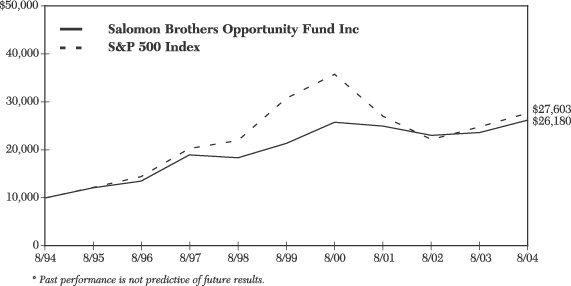
Results of an Investment in Salomon Brothers Opportunity Fund Inc
Set forth below are average annual total return figures for the periods indicated and a graph showing the value of a hypothetical $10,000 investment made in Salomon Brothers Opportunity Fund Inc on August 31, 1994. The average annual total return figures and the information in the graph represent past performance; they reflect changes in the price of the Fund’s shares and assume that any income dividends and/or capital gain distributions made by the Fund during the period were reinvested in additional shares of the Fund. Investment return and share price of the Fund will fluctuate. Shares when redeemed may be worth more or less than original cost.
AVERAGE ANNUAL TOTAL RETURN
The average annual total return over the periods indicated below shows the average annual percentage change in value of an investment in the Fund from the beginning of the measuring period to the end of the measuring period. When considering “average” total return for periods longer than one year, it is important to note that the Fund’s annual total return for any one year in the period might have been greater or less than the average for the entire period.
The Fund’s average annual total return for the periods indicated was as follows:
| | | |
One-year period ended August 31, 2004 | | 11.09 | % |
Five-year period ended August 31, 2004 | | 4.18 | % |
Ten-year period ended August 31, 2004 | | 10.10 | % |
PERFORMANCE COMPARISON — VALUE OF $10,000*
August 1994 — August 2004
(unaudited)
Page 5
SALOMON BROTHERS OPPORTUNITY FUND INC
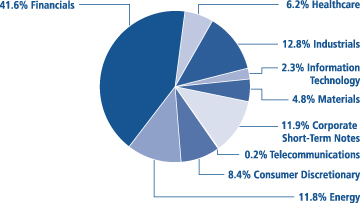
Fund at a Glance (unaudited)
Investment Breakdown as of February 29, 2004†
Investment Breakdown as of August 31, 2004†
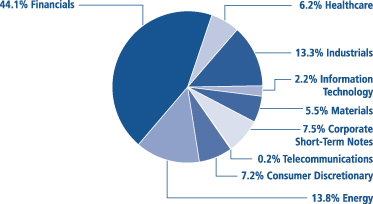
| † | | As a percentage of total investments. Please note that Portfolio holdings are subject to change. |
Page 6
SALOMON BROTHERS OPPORTUNITY FUND INC
Fund Expenses (unaudited)
Example
As a shareholder of the Fund, you may incur two types of costs: (1) transaction costs, including reinvested dividends, or other distributions; and (2) ongoing costs, including management fees; and other Fund expenses. This Example is intended to help you understand your ongoing costs (in dollars) of investing in the Fund and to compare these costs with the ongoing costs of investing in other mutual funds.
This Example is based on an investment of $1,000 invested on March 1, 2004 and held for the six months ended August 31, 2004.
Actual Expenses
The table below titled “Based on Actual Total Return” provides information about actual account values and actual expenses. You may use the information provided in this table, together with the amount you invested, to estimate the expenses that you paid over the period. To estimate the expenses you paid on your account, divide your ending account value by $1,000 (for example, an $8,600 ending account value divided by $1,000 = 8.6), then multiply the result by the number under the heading entitled “Expenses Paid During the Period”.
Based on Actual Total Return(1)
| | | | | | | | | | | | |
Actual
Total Return
Without
Sales Charges(2)
| | Beginning
Account
Value
| | Ending
Account
Value
| | Annualized
Expense
Ratio(3)
| | | Expenses
Paid During
the Period(3)
|
| (2.19)% | | $ | 1,000.00 | | $ | 978.10 | | 1.18 | % | | $ | 5.87 |
| (1) | | For the six months ended August 31, 2004. |
| (2) | | Assumes reinvestment of all dividends and capital gain distributions, if any, at net asset value. |
| (3) | | Expenses are equal to the Fund’s annualized expense ratio, multiplied by the average account value over the period, multiplied by the number of days in the most recent fiscal half-year, then divided by 366. |
Page 7
SALOMON BROTHERS OPPORTUNITY FUND INC
Fund Expenses (unaudited) (continued)
Hypothetical Example for Comparison Purposes
The table below titled “Based on Hypothetical Total Return” provides information about hypothetical account values and hypothetical expenses based on the actual expense ratio and an assumed rate of return of 5.00% per year before expenses, which is not the Fund’s actual return. The hypothetical account values and expenses may not be used to estimate the actual ending account balance or expenses you paid for the period. You may use the information provided in this table to compare the ongoing costs of investing in the Fund and other funds. To do so, compare the 5.00% hypothetical example relating to the Fund with the 5.00% hypothetical examples that appear in the shareholder reports of the other funds.
Please note that the expenses shown in the table below are meant to highlight your ongoing costs only and do not reflect any transactional costs, such as front-end or back-end sales charges (loads). Therefore, the table is useful in comparing ongoing costs only, and will not help you determine the relative total costs of owning different funds. In addition, if these transaction costs were included, your costs would have been higher.
Based on Hypothetical Total Return(1)
| | | | | | | | | | | | |
Hypothetical
Total Return
| | Beginning
Account
Value
| | Ending
Account
Value
| | Annualized
Expense
Ratio(2)
| | | Expenses
Paid During
the Period(2)
|
| 5.00% | | $ | 1,000.00 | | $ | 1,019.20 | | 1.18 | % | | $ | 5.99 |
| (1) | | For the six months ended August 31, 2004. |
| (2) | | Expenses are equal to the Fund’s annualized expense ratio, multiplied by the average account value over the period, multiplied by the number of days in the most recent fiscal half-year, then divided by 366. |
Page 8
SALOMON BROTHERS OPPORTUNITY FUND INC
Schedule of Investments
August 31, 2004
| | | | | |
| Shares | | Security† | | Value |
| Common Stock — 92.5% | | | |
| Consumer Discretionary — 7.2% | | | |
| Food Services — 0.4% | | | |
| 96,000 | | FHC (a)(b) . | | $ | 456,000 |
| | | | |
|
|
| Hotels, Restaurants & Leisure — 0.2% | | | |
| 7,600 | | Fairmont Hotels & Resorts, Inc. | | | 205,124 |
| | | | |
|
|
| Household Durables — 6.0% | | | |
| 333,110 | | Koninklijke Philips Electronics N.V., ADR | | | 7,728,152 |
| | | Liberty Homes, Inc.: | | | |
| 15,750 | | Class A Shares | | | 64,575 |
| 23,450 | | Class B Shares | | | 93,800 |
| | | | |
|
|
| | | | | | 7,886,527 |
| | | | |
|
|
| Media — 0.6% | | | |
| 10,400 | | News Corp. Ltd., ADR | | | 309,400 |
| 30,800 | | Time Warner Inc. (a) | | | 503,580 |
| | | | |
|
|
| | | | | | 812,980 |
| | | | |
|
|
| | |
| | | Total Consumer Discretionary | | | 9,360,631 |
| | | | |
|
|
| Energy — 13.8% | | | |
| Energy Equipment & Services — 0.6% | | | |
| 30,000 | | Diamond Offshore Drilling, Inc. | | | 762,600 |
| | | | |
|
|
| Oil & Gas — 13.2% | | | |
| 5,788 | | Encana Corp. | | | 237,887 |
| 60,600 | | Murphy Oil Corp. | | | 4,575,906 |
| 246,000 | | Royal Dutch Petroleum Co., ADR | | | 12,469,740 |
| | | | |
|
|
| | | | | | 17,283,533 |
| | | | |
|
|
| | |
| | | Total Energy | | | 18,046,133 |
| | | | |
|
|
| Financials — 44.0% | | | |
| Banks — 15.3% | | | |
| 461,976 | | The Bank of New York Co., Inc. | | | 13,766,885 |
| 255,600 | | Popular, Inc. | | | 6,185,520 |
| | | | |
|
|
| | | | | | 19,952,405 |
| | | | |
|
|
| Diversified Financials — 2.3% | | | |
| 45,400 | | Freddie Mac | | | 3,047,248 |
| | | | |
|
|
See Notes to Financial Statements.
Page 9
SALOMON BROTHERS OPPORTUNITY FUND INC
Schedule of Investments (continued)
August 31, 2004
| | | | | |
| Shares | | Security† | | Value |
| Insurance — 15.4% | | | |
| 180,000 | | The Chubb Corp. | | $ | 12,241,800 |
| 85,000 | | CNA Financial Corp. (a) | | | 2,048,500 |
| 50,200 | | Leucadia National Corp. | | | 2,710,800 |
| 9,500 | | Loews Corp. | | | 539,600 |
| 40,000 | | Merchants Group, Inc. | | | 966,000 |
| 71,100 | | Old Republic International Corp. | | | 1,674,405 |
| | | | |
|
|
| | | | | | 20,181,105 |
| | | | |
|
|
| Real Estate — 11.0% | | | |
| | | Forest City Enterprises, Inc.: | | | |
| 163,750 | | Class A Shares | | | 9,070,112 |
| 93,850 | | Class B Shares, Convertible (c) | | | 5,279,063 |
| 5,800 | | Harbor Global Co. Ltd. | | | 59,160 |
| | | | |
|
|
| | | | | | 14,408,335 |
| | | | |
|
|
| | |
| | | Total Financials | | | 57,589,093 |
| | | | |
|
|
| Healthcare — 6.2% | | | |
| Healthcare Providers & Services — 3.7% | | | |
| 11,300 | | Health Net, Inc. (a) | | | 293,122 |
| 25,600 | | Humana, Inc. (a) | | | 486,400 |
| 41,754 | | WellPoint Health Networks Inc. (a) | | | 4,099,408 |
| | | | |
|
|
| | | | | | 4,878,930 |
| | | | |
|
|
| Pharmaceuticals — 2.5% | | | |
| 22,800 | | Johnson & Johnson | | | 1,324,680 |
| 60,064 | | Pfizer, Inc. | | | 1,962,291 |
| | | | |
|
|
| | | | | | 3,286,971 |
| | | | |
|
|
| | |
| | | Total Healthcare | | | 8,165,901 |
| | | | |
|
|
| Industrials — 13.3% | | | |
| Aerospace & Defense — 5.4% | | | |
| 66,400 | | General Dynamics Corp. | | | 6,483,296 |
| 11,300 | | Lockheed Martin Corp. | | | 607,714 |
| | | | |
|
|
| | | | | | 7,091,010 |
| | | | |
|
|
| Air Freight & Couriers — 0.3% | | | |
| 69,300 | | ABX Air, Inc (a). | | | 404,712 |
| | | | |
|
|
| Airlines — 0.4% | | | |
| 56,300 | | AMR Corp. (a) | | | 503,322 |
| | | | |
|
|
See Notes to Financial Statements.
Page 10
SALOMON BROTHERS OPPORTUNITY FUND INC
Schedule of Investments (continued)
August 31, 2004
| | | | | |
| Shares | | Security† | | Value |
| Commercial Services & Supplies — 1.8% | | | |
| 6,700 | | National Processing Inc. (a) | | $ | 177,282 |
| 8,734 | | Sabre Holdings Corp. | | | 200,882 |
| 111,550 | | TRC Cos., Inc. (a) | | | 1,946,547 |
| | | | |
|
|
| | | | | | 2,324,711 |
| | | | |
|
|
| Electrical Equipment — 2.4% | | | |
| | | Tecumseh Products Co.: | | | |
| 38,700 | | Class A Shares | | | 1,551,870 |
| 38,000 | | Class B Shares | | | 1,563,700 |
| | | | |
|
|
| | | | | | 3,115,570 |
| | | | |
|
|
| Industrial Conglomerates — 1.4% | | | |
| 47,500 | | General Electric Co. | | | 1,557,525 |
| 8,903 | | Tyco International Ltd. | | | 278,842 |
| | | | |
|
|
| | | | | | 1,836,367 |
| | | | |
|
|
| Marine — 1.6% | | | |
| 33,600 | | Alexander & Baldwin, Inc. | | | 1,034,544 |
| 7,500 | | CP Ships Ltd. | | | 87,600 |
| 22,400 | | Overseas Shipholding Group, Inc. | | | 963,200 |
| | | | |
|
|
| | | | | | 2,085,344 |
| | | | |
|
|
| | |
| | | Total Industrials | | | 17,361,036 |
| | | | |
|
|
| Information Technology — 2.2% | | | |
| Computers & Peripherals — 1.2% | | | |
| 19,800 | | Hewlett Packard Co. | | | 354,222 |
| 14,200 | | International Business Machines Corp. | | | 1,202,598 |
| | | | |
|
|
| | | | | | 1,556,820 |
| | | | |
|
|
| Semiconductor Equipment & Products — 0.2% | | | |
| 22,600 | | National Semiconductor Corp. (a) | | | 301,258 |
| | | | |
|
|
| Software — 0.8% | | | |
| 37,900 | | Microsoft Corp. | | | 1,034,670 |
| | | | |
|
|
| | |
| | | Total Information Technology | | | 2,892,748 |
| | | | |
|
|
| Materials — 5.6% | | | |
| Chemicals — 0.6% | | | |
| 6,422 | | Kronos Worldwide Inc. | | | 207,366 |
| 12,021 | | Monsanto Co. | | | 439,969 |
| 12,300 | | NL Industries, Inc. | | | 177,858 |
| | | | |
|
|
| | | | | | 825,193 |
| | | | |
|
|
See Notes to Financial Statements.
Page 11
SALOMON BROTHERS OPPORTUNITY FUND INC
Schedule of Investments (continued)
August 31, 2004
| | | | | | |
| Shares | | Security† | | Value |
| | Construction Materials — 2.7% | | | |
| | 46,900 | | Ameron International Corp. | | $ | 1,704,815 |
| | 39,700 | | Lafarge North America, Inc. | | | 1,778,957 |
| | | | | |
|
|
| | | | | | | 3,483,772 |
| | | | | |
|
|
| | Metals & Mining — 0.3% | | | |
| | 7,677 | | Newmont Mining Corp. | | | 340,782 |
| | | | | |
|
|
| | Paper & Forest Products — 2.0% | | | |
| | 54,960 | | Rayonier, Inc. | | | 2,548,495 |
| | | | | |
|
|
| | |
| | | | Total Materials | | | 7,198,242 |
| | | | | |
|
|
| | Telecommunications — 0.2% | | | |
| | Diversified Telecommunications Services — 0.2% | | | |
| | 5,800 | | Verizon Communications, Inc. | | | 227,650 |
| | | | | |
|
|
| | |
| | | | Total Common Stock (Cost — $29,676,775) | | | 120,841,434 |
| | | | | |
|
|
Face
Amount
| | | | |
| | Corporate Short-Term Notes — 7.5% | | | |
| $ | 1,459,000 | | Bank of Ireland Governor & Co., 1.530% due 9/9/04 | | | 1,458,504 |
| | 4,500,000 | | Marsh & McLennan Cos. Inc., 1.510% due 9/1/04 | | | 4,500,000 |
| | 3,900,000 | | UBS Finance, 1.550% due 9/2/04 | | | 3,899,832 |
| | | | | |
|
|
| | |
| | | | Total Corporate Short-Term Notes (Cost — $9,858,336) | | | 9,858,336 |
| | | | | |
|
|
| | |
| | | | Total Investments —100.0% (Cost — $39,535,111*) | | | 130,699,770 |
| | |
| | | | Other Assets in Excess of Liabilities — 0.0% | | | 25,103 |
| | | | | |
|
|
| | |
| | | | Net Assets — 100.0% | | $ | 130,724,873 |
| | | | | |
|
|
| † | | Reduced by redemptions-in-kind (Note 5). |
| (a) | | Non-income producing security. |
| (b) | | Security is valued in accordance with fair valuation procedures. |
| (c) | | Convertible into Forest City Enterprises, Inc., Class A Shares. |
| * | | Aggregate cost for Federal income tax purposes is $39,645,037. |
Abbreviation used in this schedule:
ADR — American Depositary Receipt.
See Notes to Financial Statements.
Page 12
SALOMON BROTHERS OPPORTUNITY FUND INC
Statement of Assets and Liabilities
August 31, 2004
| | | |
| ASSETS: | | | |
Investments, at value (Cost — $29,676,775) | | $ | 120,841,434 |
Corporate short-term notes, at amortized cost | | | 9,858,336 |
Cash | | | 1,297 |
Dividends receivable | | | 279,659 |
Receivable for Fund shares sold | | | 6,769 |
Prepaid expenses | | | 8,410 |
| | |
|
|
Total Assets | | | 130,995,905 |
| | |
|
|
| |
| LIABILITIES: | | | |
Management fee payable | | | 83,188 |
Payable for Fund shares reacquired | | | 67,794 |
Accrued expenses | | | 120,050 |
| | |
|
|
Total Liabilities | | | 271,032 |
| | |
|
|
Total Net Assets | | $ | 130,724,873 |
| | |
|
|
| |
| NET ASSETS: | | | |
Par value of capital shares ($0.01 par value, 15,000,000 shares authorized; 3,045,660 shares outstanding) | | $ | 30,457 |
Capital paid in excess of par value | | | 38,165,418 |
Undistributed net investment income | | | 1,117,206 |
Accumulated net realized gain from investment transactions and foreign currencies | | | 247,133 |
Net unrealized appreciation of investments | | | 91,164,659 |
| | |
|
|
Total Net Assets | | $ | 130,724,873 |
| | |
|
|
Net Asset Value, per share ($130,724,873 ÷ 3,045,660 shares outstanding) | | | $42.92 |
| | |
|
|
See Notes to Financial Statements.
Page 13
SALOMON BROTHERS OPPORTUNITY FUND INC
Statement of Operations
For the Year Ended August 31, 2004
| | | | |
| INVESTMENT INCOME: | | | | |
Dividends | | $ | 2,827,225 | |
Interest | | | 231,579 | |
Less: Foreign withholding tax | | | (117,069 | ) |
| | |
|
|
|
Total Investment Income | | | 2,941,735 | |
| | |
|
|
|
| |
| EXPENSES: | | | | |
Management fee (Note 2) | | | 1,079,060 | |
Legal fees | | | 201,173 | |
Audit and tax services | | | 63,900 | |
Shareholder communications | | | 44,103 | |
Transfer agency services | | | 29,892 | |
Blue sky | | | 17,642 | |
Custody | | | 17,497 | |
Directors’ fees | | | 15,541 | |
Other | | | 11,625 | |
| | |
|
|
|
Total Expenses | | | 1,480,433 | |
| | |
|
|
|
Net Investment Income | | | 1,461,302 | |
| | |
|
|
|
| |
REALIZED AND UNREALIZED GAIN ON INVESTMENTS AND
FOREIGN CURRENCIES (NOTES 3 AND 5): | | | | |
Realized Gain From: | | | | |
Investment transactions | | | 4,553,167 | |
Foreign currency transactions | | | 9 | |
| | |
|
|
|
Net Realized Gain | | | 4,553,176 | |
| | |
|
|
|
Increase in Net Unrealized Appreciation of Investments | | | 8,827,065 | |
| | |
|
|
|
Increase in Net Assets From Operations | | $ | 14,841,543 | |
| | |
|
|
|
See Notes to Financial Statements.
Page 14
SALOMON BROTHERS OPPORTUNITY FUND INC
Statements of Changes in Net Assets
For the Years Ended August 31,
| | | | | | | | |
| | | 2004 | | | 2003 | |
| OPERATIONS: | | | | | | | | |
Net investment income | | $ | 1,461,302 | | | $ | 1,166,689 | |
Net realized gain | | | 4,553,176 | | | | 9,181,489 | |
Increase (decrease) in net unrealized appreciation | | | 8,827,065 | | | | (7,710,223 | ) |
| | |
|
|
| |
|
|
|
Increase in Net Assets From Operations | | | 14,841,543 | | | | 2,637,955 | |
| | |
|
|
| |
|
|
|
| | |
| DISTRIBUTIONS TO SHAREHOLDERS FROM: | | | | | | | | |
Net investment income | | | (1,200,206 | ) | | | (701,596 | ) |
Net realized gains | | | (8,285,776 | ) | | | (4,812,573 | ) |
| | |
|
|
| |
|
|
|
Decrease in Net Assets From Distributions to Shareholders | | | (9,485,982 | ) | | | (5,514,169 | ) |
| | |
|
|
| |
|
|
|
| | |
| FUND SHARE TRANSACTIONS (NOTES 4 AND 5): | | | | | | | | |
Net proceeds from sale of shares | | | 681,920 | | | | 1,310,952 | |
Net asset value of shares issued for reinvestment of dividends | | | 4,479,096 | | | | 3,492,308 | |
Cost of shares reacquired | | | (25,445,782 | ) | | | (16,547,404 | ) |
| | |
|
|
| |
|
|
|
Decrease in Net Assets From Fund Share Transactions | | | (20,284,766 | ) | | | (11,744,144 | ) |
| | |
|
|
| |
|
|
|
Decrease in Net Assets | | | (14,929,205 | ) | | | (14,620,358 | ) |
| | |
| NET ASSETS: | | | | | | | | |
Beginning of year | | | 145,654,078 | | | | 160,274,436 | |
| | |
|
|
| |
|
|
|
End of year* | | $ | 130,724,873 | | | $ | 145,654,078 | |
| | |
|
|
| |
|
|
|
* Includes undistributed net investment income of: | | | $1,117,206 | | | | $848,100 | |
| | |
|
|
| |
|
|
|
See Notes to Financial Statements.
Page 15
SALOMON BROTHERS OPPORTUNITY FUND INC
Financial Highlights
For a share of capital stock outstanding throughout each year ended August 31, unless otherwise noted:
| | | | | | | | | | | | | | | |
| | | 2004 | | | 2003 | | | 2002 | | | 2001 | | | 2000 | |
Net Asset Value, Beginning of Year | | $41.34 | | | $41.86 | | | $48.72 | | | $55.98 | | | $49.69 | |
| | |
|
| |
|
| |
|
| |
|
| |
|
|
Income (Loss) From Operations: | | | | | | | | | | | | | | | |
Net investment income | | 0.49 | | | 0.33 | | | 0.28 | | | 0.69 | | | 0.82 | |
Net realized and unrealized gain (loss) | | 3.99 | | | 0.61 | | | (3.74 | ) | | (2.23 | ) | | 8.79 | |
| | |
|
| |
|
| |
|
| |
|
| |
|
|
Total Income (Loss) From Operations | | 4.48 | | | 0.94 | | | (3.46 | ) | | (1.54 | ) | | 9.61 | |
| | |
|
| |
|
| |
|
| |
|
| |
|
|
Less Distributions From: | | | | | | | | | | | | | | | |
Net investment income | | (0.37 | ) | | (0.19 | ) | | (0.64 | ) | | (0.76 | ) | | (0.80 | ) |
Net realized gains | | (2.53 | ) | | (1.27 | ) | | (2.76 | ) | | (4.96 | ) | | (2.52 | ) |
| | |
|
| |
|
| |
|
| |
|
| |
|
|
Total Distributions | | (2.90 | ) | | (1.46 | ) | | (3.40 | ) | | (5.72 | ) | | (3.32 | ) |
| | |
|
| |
|
| |
|
| |
|
| |
|
|
Net Asset Value, End of Year | | $42.92 | | | $41.34 | | | $41.86 | | | $48.72 | | | $55.98 | |
| | |
|
| |
|
| |
|
| |
|
| |
|
|
Total Return | | 11.1 | % | | 2.6 | % | | (7.7 | )% | | (3.2 | )% | | 20.4 | % |
Net Assets, End of Year (millions) | | $131 | | | $146 | | | $160 | | | $185 | | | $212 | |
Ratios to Average Net Assets: | | | | | | | | | | | | | | | |
Expenses . | | 1.06 | % | | 1.12 | % | | 1.11 | % | | 1.10 | % | | 1.11 | % |
Net investment income | | 1.04 | % | | 0.82 | % | | 0.64 | % | | 1.30 | % | | 1.65 | % |
Portfolio Turnover Rate | | 1 | % | | 5 | % | | 1 | % | | 1 | % | | 3 | % |
See Notes to Financial Statements.
Page 16
SALOMON BROTHERS OPPORTUNITY FUND INC
Notes to Financial Statements
1. Organization and Significant Accounting Policies
Salomon Brothers Opportunity Fund Inc (“Fund”), is registered as a non-diversified, open-end management investment company under the Investment Company Act of 1940, as amended.
The following are significant accounting policies consistently followed by the fund and are in conformity with U.S. generally accepted accounting principles (“GAAP”). The preparation of financial statements in accordance with GAAP requires management to make estimates and assumptions regarding assets, liabilities and changes in net assets resulting from operations when financial statements are prepared. Changes in the economic environment, financial markets and any other parameters used in determining these estimates could cause actual results to differ.
(a) INVESTMENT VALUATION. Securities listed or traded on national securities exchanges or reported on the NASDAQ National Market System for which market quotations are available are valued at the official closing price. If there is no official closing price, the securities are valued at the last sale price or, if there have been no sales that day, at the mean of the current bid and asked prices which represents the current value of the security. Over-the-counter securities are valued at the mean of the current bid and asked prices. If no quotations are readily available (as may be the case for securities of limited marketability), or if “restricted” securities are being valued, such portfolio securities and other assets are valued at fair value determined pursuant to procedures established by the Board of Directors. Securities that are primarily traded on foreign exchanges generally are valued at the preceding closing values of such securities on their respective exchanges, except that when an occurrence subsequent to the time a value was so established is likely to have changed such value, then the fair value of those securities may be determined by consideration of other factors by or under the direction of the Board of Directors or its delegates. Securities may be valued by independent pricing services which use prices provided by market-makers or estimates of market values obtained from yield data relating to instruments or securities with similar characteristics. Short-term securities with less than 60 days remaining to maturity when acquired by the Fund are valued at amortized cost, which approximates market value.
(b) REPURCHASE AGREEMENTS. When entering into repurchase agreements, it is the Fund’s policy that the custodian take possession of the underlying collateral securities, the value of which at least equals the principal amount of the repurchase transaction, including accrued interest. To the extent that any repurchase transaction exceeds one business day, the value of the collateral is marked-to-market to ensure the adequacy of the collateral. If the seller defaults and the value of the collateral declines or if bankruptcy proceedings are commenced with respect to the seller of the security, realization of the collateral by the Fund may be delayed or limited.
Page 17
SALOMON BROTHERS OPPORTUNITY FUND INC
Notes to Financial Statements (continued)
(c) SECURITIES LENDING. The Fund has an agreement with its custodian whereby the custodian may lend securities owned by the Fund to brokers, dealers and other financial organizations, and receives a lenders fee. Fees earned by the Fund on securities lending are recorded in interest income. Loans of securities by the Fund are collateralized by cash, U.S. government securities or high quality money market instruments that are maintained at all times in an amount at least equal to the current market value of the loaned securities, plus a margin which may vary depending on the type of securities loaned. The Fund maintains exposure for the risk of any losses in the investment of amounts received as collateral. The Fund also maintains exposure for the risk of any loss in the investment securities loaned. The Fund has the right under the lending agreement to recover the securities from the borrower on demand.
(d) INVESTMENT TRANSACTIONSAND INVESTMENT INCOME. Securities transactions are recorded as of the trade date. Dividend income and dividends payable are recorded on the ex-dividend date. Interest income is recognized when earned. Gains or losses on sales of securities are calculated for financial accounting and Federal income tax purposes on the identified cost basis.
(e) FOREIGN CURRENCY TRANSLATION. The accounting records of the Fund are maintained in U.S. dollars. All assets and liabilities denominated in foreign currencies are translated into U.S. dollars based on the rate of exchange of such currencies against U.S. dollars on the date of valuation. Purchases and sales of securities, and income and expenses are translated at the rate of exchange quoted on the respective date that such transactions are recorded. The Fund does not isolate that portion of the results of operations resulting from changes in foreign exchange rates on investments from the fluctuations arising from changes in market prices of securities held at the date of the financial statements. Net unrealized appreciation or depreciation on investments and foreign currency translation arise from changes in the value of assets and liabilities, including investments in securities at the date of the financial statements, resulting from changes in the exchange rates and changes in market prices of securities held.
(f) DIVIDENDSAND DISTRIBUTIONSTO SHAREHOLDERS. The Fund declares and pays dividends from net investment income and distributions from net realized gains, if any, annually. Dividends and distributions to shareholders are recorded on the ex-dividend date. The amount of dividends and distributions from net investment income and net realized gains are determined in accordance with Federal income tax regulations, which may differ from GAAP. Permanent book/tax differences are reclassified within the capital accounts based on their Federal income tax basis treatment; temporary differences do not require reclassifications. Dividends and distributions which exceed net investment income and net realized gains for financial reporting purposes but not for tax purposes are reported as dividends in excess of net investment income and distributions in excess of net realized capital gains. To the extent they
Page 18
SALOMON BROTHERS OPPORTUNITY FUND INC
Notes to Financial Statements (continued)
exceed net investment income and net realized capital gains for tax purposes, they are reported as tax return of capital. The character of income and gains to be distributed are determined in accordance with income tax regulations which may differ from GAAP.
(g) FEDERAL INCOME TAXES. The Fund has complied and intends to continue to comply with the provisions of the Internal Revenue Code of 1986, as amended, applicable to regulated investment companies, and to distribute substantially all of its taxable income and capital gains, if any, to its shareholders. Therefore, no Federal income tax or excise tax provision is required.
(h) YEAR END TAX RECLASSIFICATIONS. At August 31, 2004, reclassifications were made to the Fund’s capital accounts to reflect permanent book/tax differences and income and gains available for distributions under income tax regulations. Accordingly, a portion of undistributed net investment income amounting to $8,001 and a redemption-in-kind of net realized gain amounting to $4,157,937 was reclassified to paid-in capital. Net investment income, net realized gains and net assets were not affected by these changes.
2. Management Fee and Other Transactions
The Fund retains Salomon Brothers Asset Management Inc (“SBAM”), an indirect wholly-owned subsidiary of Citigroup Inc. (“Citigroup”), to act as investment manager of the Fund. The management fee is payable monthly at an annual rate of 0.75% of the Fund’s average daily net assets. Prior to October 1, 2003 the Fund paid SBAM a management fee at an annual rate of 1.00% of the Fund’s average daily net assets. SBAM has delegated certain administrative responsibilities to Smith Barney Fund Management LLC (“SBFM”), another indirect wholly-owned subsidiary of Citigroup, pursuant to a Sub-Administration Agreement between SBAM and SBFM. SBFM has also entered into an agreement with State Street Bank & Trust (“SSB&T”) for the performance of certain Fund administrative functions. SBAM pays SBFM a fee calculated daily and paid monthly, at an annual rate of 0.05% of the Fund’s average daily net assets and SBFM pays SSB&T out of this fee.
Citigroup Global Markets Inc., another indirect wholly-owned subsidiary of Citigroup and an affiliate of SBAM, acts as the Fund’s distributor.
Certain officers and/or directors of the Fund are also officers and/or directors of SBAM.
The Fund has a concentration of several shareholders who may be a related party, holding a significant percentage of shares outstanding. Investment activities of these shareholders could have a material impact on the Fund.
Page 19
SALOMON BROTHERS OPPORTUNITY FUND INC
Notes to Financial Statements (continued)
3. Portfolio Activity
During the year ended August 31, 2004, the aggregate cost of purchases and proceeds from sales of investments (including maturities of long-term investments, but excluding short-term investments) were as follows:
| | | |
Purchases | | $ | 3,192,021 |
| | |
|
|
Sales | | $ | 1,209,275 |
| | |
|
|
At August 31, 2004, the aggregate gross unrealized appreciation and depreciation of investments for Federal income tax purposes were substantially as follows:
| | | | |
Gross unrealized appreciation | | $ | 92,199,134 | |
Gross unrealized depreciation | | | (1,144,401 | ) |
| | |
|
|
|
Net unrealized appreciation | | $ | 91,054,733 | |
| | |
|
|
|
At August 31, 2004, the Fund did not have any securities on loan however, income earned by the Fund from securities lending for the year ended August 31, 2004 was $1,870.
4. Shares of Capital Stock
At August 31, 2004, the Fund had 15,000,000 shares of capital stock authorized with a par value of $0.01 per share. Transactions in shares of the Fund were as follows:
| | | | | | | | | | | | | | |
| | | Year Ended
August 31, 2004
| | | Year Ended
August 31, 2003
| |
| | | Shares
| | | Amount
| | | Shares
| | | Amount
| |
Shares sold | | 15,854 | | | $ | 681,920 | | | 34,685 | | | $ | 1,310,952 | |
Shares issued on reinvestment | | 108,321 | | | | 4,479,096 | | | 92,610 | | | | 3,492,308 | |
Shares reacquired | | (601,671 | ) | | | (25,445,782 | ) | | (432,592 | ) | | | (16,547,404 | ) |
| | |
|
| |
|
|
| |
|
| |
|
|
|
Net Decrease | | (477,496 | ) | | $ | (20,284,766 | ) | | (305,297 | ) | | $ | (11,744,144 | ) |
| | |
|
| |
|
|
| |
|
| |
|
|
|
5. Redemptions-In-Kind
The Fund had redemptions-in-kind with total proceeds in the amount of $6,352,176. The net realized gains on these redemptions-in-kind amounted to $4,157,937, which will not be realized for tax purposes.
Page 20
SALOMON BROTHERS OPPORTUNITY FUND INC
Notes to Financial Statements (continued)
6. Income Tax Information & Distributions to Shareholders
The tax character of distributions paid during the fiscal years ended August 31, were as follows:
| | | | | | |
| | | 2004
| | 2003
|
Net long-term capital gains | | $ | 8,285,776 | | $ | 4,812,573 |
Ordinary income | | | 1,200,206 | | | 701,596 |
| | |
|
| |
|
|
Total distributions paid | | $ | 9,485,982 | | $ | 5,514,169 |
| | |
|
| |
|
|
As of August 31, 2004, the components of accumulated earnings on a tax basis were as follows:
| | | | |
Undistributed ordinary income — net | | $ | 1,095,409 | |
Undistributed long-term capital gains — net | | | 378,856 | |
| | |
|
|
|
Total undistributed earnings | | | 1,474,265 | |
Unrealized appreciation | | | 91,054,733 | * |
| | |
|
|
|
Total accumulated earnings | | $ | 92,528,998 | |
| | |
|
|
|
| * | | The difference between book-basis and tax-basis unrealized appreciation is attributable primarily to the tax deferral of losses on wash sales and other book/tax basis adjustments. |
7. Additional Information
In connection with an investigation previously disclosed by Citigroup, the Staff of the Securities and Exchange Commission (“SEC”) has notified Citigroup Asset Management (“CAM”), the Citigroup business unit that includes the funds’ investment manager and other investment advisory companies; Citicorp Trust Bank (“CTB”), an affiliate of CAM; Thomas W. Jones, the former CEO of CAM; and two other individuals, one of whom is an employee and the other of whom is a former employee of CAM, that the SEC Staff is considering recommending a civil injunctive action and/or an administrative proceeding against each of them relating to the creation and operation of an internal transfer agent unit to serve various CAM-managed funds.
In 1999, CTB entered the transfer agent business. CTB hired an unaffiliated subcontractor to perform some of the transfer agent services. The subcontractor, in exchange, had signed a separate agreement with CAM in 1998 that guaranteed investment management revenue to CAM and investment banking revenue to a CAM affiliate. The subcontractor’s business was later taken over by PFPC Inc., and at that time the revenue guarantee was eliminated and a one-time payment was made by the subcontractor to a CAM affiliate.
CAM did not disclose the revenue guarantee when the boards of various CAM-managed funds hired CTB as transfer agent. Nor did CAM disclose to the boards of the various CAM-managed funds the one-time payment received by the CAM affiliate when it was made.
In addition, the SEC Staff has indicated that it is considering recommending action based on the adequacy of the disclosures made to the fund boards that approved the transfer agency arrangement, CAM’s initiation and operation of, and compensation for, the transfer agent business and CAM’s retention of, and agreements with, the subcontractor.
Page 21
SALOMON BROTHERS OPPORTUNITY FUND INC
Notes to Financial Statements (continued)
Citigroup is cooperating fully in the investigation and will seek to resolve the matter in discussions with the SEC Staff. Although there can be no assurance, Citigroup does not believe that this matter will have a material adverse effect on the Fund. As previously disclosed, CAM has already agreed to pay the applicable funds, primarily through fee waivers, a total of approximately $17 million (plus interest) that is the amount of the revenue received by Citigroup relating to the revenue guarantee.
The Fund did not implement the contractual arrangement described above and therefore will not receive any portion of the payment.
8. Legal Matters
Class action lawsuits have been filed against Citigroup Global Markets Inc. (the “Distributor”) and a number of its affiliates, including Smith Barney Fund Management LLC and Salomon Brothers Asset Management Inc (the “Advisers”), substantially all of the mutual funds managed by the Advisers (the “Funds”), and directors or trustees of the Funds. The complaints allege, among other things, that the Distributor created various undisclosed incentives for its brokers to sell Smith Barney and Salomon Brothers funds. In addition, according to the complaints, the Advisers caused the Funds to pay excessive brokerage commissions to the Distributor for steering clients towards proprietary funds. The complaints also allege that the defendants breached their fiduciary duty to the Funds by improperly charging Rule 12b-1 fees and by drawing on Fund assets to make undisclosed payments of soft dollars and excessive brokerage commissions. The complaints seek injunctive relief and compensatory and punitive damages, rescission of the Funds’ contracts with the Advisers, recovery of all fees paid to the Advisers pursuant to such contracts and an award of attorneys’ fees and litigation expenses. Citigroup Asset Management believes that the suits are without merit and intends to defend the cases vigorously.
Additional lawsuits arising out of these circumstances and presenting similar allegations and requests for relief may be filed against the defendants in the future. Neither Citigroup Asset Management nor the Funds believe that any of the pending actions will have a material adverse effect on the Funds or the ability of the Distributor or the Advisers to perform under their respective contracts with the Funds.
Page 22
SALOMON BROTHERS OPPORTUNITY FUND INC
Report of Independent Registered Public Accounting Firm
To the Board of Directors and Shareholders of Salomon Brothers Opportunity Fund Inc
In our opinion, the accompanying statement of assets and liabilities, including the schedule of investments, and the related statements of operations and of changes in net assets and the financial highlights present fairly, in all material respects, the financial position of Salomon Brothers Opportunity Fund Inc (“Fund”) at August 31, 2004, the results of its operations for the year then ended, the changes in its net assets for each of the two years in the period then ended and the financial highlights for each of the five years in the period then ended, in conformity with accounting principles generally accepted in the United States of America. These financial statements and financial highlights (hereafter referred to as “financial statements”) are the responsibility of the Fund’s management; our responsibility is to express an opinion on these financial statements based on our audits. We conducted our audits of these financial statements in accordance with the standards of the Public Company Accounting Oversight Board (United States). Those standards require that we plan and perform the audit to obtain reasonable assurance about whether the financial statements are free of material misstatement. An audit includes examining, on a test basis, evidence supporting the amounts and disclosures in the financial statements, assessing the accounting principles used and significant estimates made by management, and evaluating the overall financial statement presentation. We believe that our audits, which included confirmation of securities at August 31, 2004 by correspondence with the custodian, provide a reasonable basis for our opinion.
PricewaterhouseCoopers LLP
New York, New York
October 22, 2004
Page 23
SALOMON BROTHERS OPPORTUNITY FUND INC
Additional Information (unaudited)
Information about Directors and Officers
The business and affairs of Salomon Brothers Opportunity Fund Inc (“Fund”) are managed under the direction of its Board of Directors. Information pertaining to the Directors and Officers of the Fund is set forth below. The Statement of Additional Information includes additional information about the Fund’s Directors and is available by contacting the Fund’s Transfer Agent at 1-800-SALOMON.
| | | | | | | | | | |
| Name, Address and Age | | Position(s)
Held with
Fund | | Term of
Office* and
Length of
Time Served | | Principal
Occupation(s)
During Past
5 Years | | Number of
Portfolios in
Fund Complex
Overseen by
Director | | Other Board
Memberships
Held by Director |
| Non-Interested Directors: | | | | | | | | |
| | | | | |
B. Alexander Gaguine
516 Bethany Avenue
Santa Cruz, CA 95060
Age 53 | | Director | | Since 1997 | | Chief Operating Officer and President, Appleton Foundation | | 1 | | None |
| | | | | |
Rosalind A. Kochman
1301 Avenue J
Brooklyn, NY 11230
Age 66 | | Director | | Since 1990 | | Chief Executive Officer, Brooklyn Eye Surgery Center; and Administrator, Kochman Lebowitz & Mobil, MDs | | 1 | | None |
| | | | | |
Irving Sonnenschein
888 7th Avenue
New York, NY 10016
Age 83 | | Director | | Since 1994 | | Partner in the law firm of Sonnenschein, Sherman & Deutsch | | 1 | | None |
| | | | | |
| Interested Director: | | | | | | | | | | |
| | | | | |
Irving G. Brilliant**
399 Park Avenue
New York, NY 10022
Age 85 | | Chairman and Director President | | Since 1978 2002- 2003 | | Prior to April 2003, he was a Director of Salomon Brothers Asset Management Inc (“SBAM”) and Citigroup Global Markets Inc. (“CGM”) | | 1 | | None |
Page 24
SALOMON BROTHERS OPPORTUNITY FUND INC
Additional Information (unaudited) (continued)
| | | | | | | | | | |
| Name, Address and Age | | Position(s)
Held with
Fund | | Term of
Office* and
Length of
Time Served | | Principal
Occupation(s)
During Past
5 Years | | Number of
Portfolios in
Fund Complex
Overseen by
Director | | Other Board
Memberships
Held by Director |
| Officers: | | | | | | | | | | |
| | | | | |
R. Jay Gerken, CFA Citigroup Asset Management (“CAM”)
399 Park Avenue
4th Floor
New York, NY 10022
Age 53 | | Executive Vice President | | Since
2002 | | Managing Director of Citigroup Global Markets Inc. (“CGM”); Chairman, President, Chief Executive Officer and Director of Smith Barney Fund Management LLC (“SBFM”), Travelers Investment Adviser, Inc. (“TIA”) and Citi Fund Management Inc. (“CFM”); President and Chief Executive Officer of certain mutual funds associated with Citigroup Inc. (“Citigroup”); Formerly Portfolio Manager of Smith Barney Allocation Series Inc. (from 1996 to 2001) and Smith Barney Growth and Income Fund (from 1996 to 2000) | | N/A | | N/A |
| | | | | |
Andrew B. Shoup CAM 125 Broad Street
11th Floor New York, NY 10004 Age 47 | | Senior Vice President and Chief Administrative Officer | | Since
2003 | | Director of CAM; Senior Vice President and Chief Administrative Officer of mutual funds associated with Citigroup; Treasurer of certain mutual funds associated with Citigroup, Head of International Funds Administration of CAM (from 2001 to 2003); Director of Global Funds Administration of CAM (from 2000 to 2001); Head of U.S. Citibank Funds Administration of CAM (from 1998 to 2000) | | N/A | | N/A |
Page 25
SALOMON BROTHERS OPPORTUNITY FUND INC
Additional Information (unaudited) (continued)
| | | | | | | | | | |
| Name, Address and Age | | Position(s)
Held with
Fund | | Term of
Office* and
Length of
Time Served | | Principal
Occupation(s)
During Past
5 Years | | Number of
Portfolios in
Fund Complex
Overseen by
Director | | Other Board
Memberships
Held by Director |
George J. Williamson
CAM
399 Park Avenue
4th Floor
New York, NY 10022
Age 69 | | Investment Officer President | | Since 2002 2000- 2002 | | Director of SBAM and CGM since January 1999; Prior to January 1999, he was a Vice President of SBAM and CGM | | N/A | | N/A |
| | | | | |
Frances M. Guggino
CAM
125 Broad Street
10th Floor
New York, NY 10004
Age 46 | | Chief Financial Officer and Treasurer | | Since
2004 | | Vice President of CGM; Chief Financial Officer and Treasurer of certain mutual funds associated with Citigroup; Controller of certain mutual funds associated with Citigroup (from 2002 to 2004) | | N/A | | N/A |
| | | | | |
Wendy S. Setnicka
CAM
125 Broad Street
10th Floor
New York, NY 10004
Age 40 | | Controller | | Since
2004 | | Vice President of CAM; Controller of certain mutual funds associated with Citigroup; Assistant Controller of CAM (from 2002 to 2004) | | N/A | | N/A |
| | | | | |
Robert I. Frenkel
CAM
300 First Stamford Place
4th Floor
Stamford, CT 06902
Age 48 | | Secretary and Chief Legal Officer | | Since
2003 | | Managing Director and General Counsel of Global Mutual Funds for CAM and its predecessor (since 1994); Secretary of CFM (from 2001 to 2004); Secretary and Chief Legal Officer of mutual funds associated with Citigroup | | N/A | | N/A |
Page 26
SALOMON BROTHERS OPPORTUNITY FUND INC
Additional Information (unaudited) (continued)
| | | | | | | | | | |
| Name, Address and Age | | Position(s)
Held with
Fund | | Term of
Office* and
Length of
Time Served | | Principal
Occupation(s)
During Past
5 Years | | Number of
Portfolios in
Fund Complex
Overseen by
Director | | Other Board
Memberships
Held by Director |
| | | | | |
Andrew Beagley CAM 399 Park Avenue, 4th Floor New York, NY 10022 Age 40 | | Chief Anti-Money Laundering Compliance Officer Chief Compliance Officer | | Since
2002 Since 2004 | | Director of CGM (since 2000); Director of Compliance, North America, CAM (since 2000); Chief Anti-Money Laundering Compliance Officer, Chief Compliance Officer and Vice President of certain mutual funds associated with Citigroup; Director of Compliance, Europe, the Middle East and Africa, Citigroup Asset Management (from 1999 to 2000); Compliance Officer, Salomon Brothers Asset Management Limited, Smith Barney Global Capital Management Inc., Salomon Brothers Asset Management Asia Pacific Limited (from 1997 to 1999) | | N/A | | N/A |
| * | | Officers are elected annually by the Board of Directors. |
| ** | | Mr. Brilliant is an “Interested Director” by virtue of his position with affiliates of SBAM as described in the table above. |
Page 27
SALOMON BROTHERS OPPORTUNITY FUND INC
Tax Information (unaudited)
The following information is provided with respect to the ordinary income distributions paid by Salomon Brothers Opportunity Fund Inc during the taxable year ended August 31, 2004:
| | |
Record Date | | December 15, 2003 |
Payable Date | | December 16, 2003 |
Long-term capital gain distributions of | | $8,285,776 |
Qualified Dividend Income for Individuals | | 100.00% |
Dividends Qualifying for the Dividends Received Deduction for Corporations | | 100.00% |
Please retain this information for your records.
Page 28
SALOMON BROTHERS OPPORTUNITY FUND INC
Directors
IRVING G. BRILLIANT
B. ALEXANDER GAGUINE
ROSALIND A. KOCHMAN
IRVING SONNENSCHEIN
Officers
IRVING G. BRILLIANT
Chairman
R. JAY GERKEN, CFA
Executive Vice President
ANDREW B. SHOUP
Senior Vice President and Chief Administrative Officer
FRANCES M. GUGGINO
Chief Financial Officer and Treasurer
GEORGE J. WILLIAMSON
Investment Officer
ANDREW BEAGLEY
Chief Anti-Money Laundering Compliance Officer and Chief Compliance Officer
WENDY S. SETNICKA
Controller
ROBERT I. FRENKEL
Secretary and Chief Legal Officer
Salomon Brothers Opportunity Fund Inc
125 Broad Street
10th Floor, MF-2
New York, New York 10004
1-888-777-0102, toll free
INVESTMENT MANAGER
Salomon Brothers Asset Management Inc 399 Park Avenue New York, New York 10022
DISTRIBUTOR
Citigroup Global Markets Inc. 388 Greenwich Street New York, New York 10013
CUSTODIAN
State Street Bank and Trust Company 225 Franklin Street Boston, Massachusetts 02110
TRANSFER AGENT
PFPC Inc. P.O. Box 9764 Providence, Rhode Island 02940-9764
LEGAL COUNSEL
Simpson Thacher & Bartlett LLP 425 Lexington Avenue New York, New York 10017-3909
INDEPENDENT REGISTERED PUBLIC ACCOUNTING FIRM
PricewaterhouseCoopers LLP 300 Madison Avenue New York, New York 10017
This report is transmitted to the shareholders of Salomon Brothers Opportunity Fund Inc for their information This is not a prospectus, circular or representation intended for use in the purchase of shares of the Fund or any securities mentioned in this report.
The Fund files its complete schedule of portfolio holdings with the Securities and Exchange Commission for the first and third quarters of each fiscal year on Form N-Q. The Fund’s Forms N-Q are available on the Commission’s website at www.sec.gov. The Fund’s Forms N-Q may be reviewed and copied at the Commission’s Public Reference Room in Washington D.C., and information on the operation of the Public Reference Room may be obtained by calling 1-800-SEC-0330. To obtain information on Form N-Q from the Fund, shareholders can call 1-800-446-1013.
Information on how the Fund voted proxies relating to portfolio securities during the 12 month period ended June 30, 2004 and a description of the policies and procedures that the Fund uses to determine how to vote proxies relating to portfolio securities is available (1) without charge, upon request, by calling 1-800-446-1013, (2) on the Fund’s website at www.citigroupAM.com and (3) on the SEC’s website at www.sec.gov.
Page 29
ITEM 2. CODE OF ETHICS.
The registrant has adopted a code of ethics that applies to the registrant’s principal executive officer, principal financial officer, principal accounting officer or controller.
ITEM 3. AUDIT COMMITTEE FINANCIAL EXPERT.
The Fund’s Board of Directors has determined that the Fund does not have an audit committee financial expert serving on its audit committee. Although no single Director possesses the attributes necessary for qualification as an audit committee financial expert, several Directors have significant experience in the management of their personal assets and the assets of the businesses with which they are or have been associated. The Board is considering various options for obtaining access to other sources of financial expertise, such as seeking an additional board member who would qualify as a financial expert or engaging an outside consultant to provide advice with respect to complicated financial or accounting issues.
ITEM 4. PRINCIPAL ACCOUNTANT FEES AND SERVICES
| | (a) | Audit Fees for Salomon Brothers Opportunity Fund Inc. were $46,000 and $44,000 for the years ended 8/31/04 and 8/31/03, respectively. |
| | (b) | Audit-Related Fees for Salomon Brothers Opportunity Fund Inc. were $0 and $0 for the years ended 8/31/04 and 8/31/03. |
In addition, there were no Audit-Related Fees billed in the years ended 8/31/04 and 8/31/03 for assurance and related services by the Accountant to the Registrant’s investment adviser (not including any sub-adviser whose role is primarily portfolio management and is subcontracted with or overseen by another investment adviser), and any entity controlling, controlled by or under common control with the investment adviser that provides ongoing services to the Salomon Brothers Opportunity Fund Inc. (“service affiliates”), that were reasonably related to the performance of the annual audit of the service affiliates. Accordingly, there were no such fees that required pre-approval by the Audit Committee for the period May 6, 2003 to August 31, 2004 (prior to May 6, 2003 services provided by the Accountant were not required to be pre-approved).
| | (c) | Tax Fees for Salomon Brothers Opportunity Fund Inc. were $3,650 and $3,650 for the years ended 8/31/04 and 8/31/03. These amounts represent aggregate fees paid for tax compliance and tax advice, which includes (the filing and amendment of federal, state and local income tax returns, timely RIC qualification review and tax distribution and analysis planning) rendered by the Accountant to Salomon Brothers Opportunity Fund Inc. |
There were no fees billed for tax services by the Accountants to service affiliates for the period May 6, 2003 through August 31, 2004 that required pre-approval by the Audit Committee.
| | (d) | There were no All Other Fees for Salomon Brothers Opportunity Fund Inc. for the years ended 8/31/04 and 8/31/03. |
All Other Fees. The aggregate fees billed for all other non-audit services rendered by the Accountant to Salomon Brothers Asset Management (“SBAM”), and any entity controlling, controlled by or under common control with SBAM that provided ongoing services to Salomon Brothers Opportunity Fund Inc., requiring pre-approval by the Audit Committee for the period May 6, 2003 through August 31, 2004, which included the issuance of reports on internal control under SAS No. 70 relating to various Citigroup Asset Management (“CAM”) entities, were $666,000; all of which were pre-approved by the Audit Committee.
| | (e) | (1) Audit Committee’s pre–approval policies and procedures described in paragraph (c) (7) of Rule 2-01 of Regulation S-X. |
The Charter for the Audit Committee (the “Committee”) of the Board of each registered investment company (the “Fund”) advised by Smith Barney Fund Management LLC or Salomon Brothers Asset Management Inc. or one of their affiliates (each, an “Adviser”) requires that the Committee shall approve (a) all audit and permissible non-audit services to be provided to the Fund and (b) all permissible non-audit services to be provided by the Fund’s independent auditors to the Adviser and any Covered Service Providers if the engagement relates directly to the operations and financial reporting of the Fund. The Committee may implement policies and procedures by which such services are approved other than by the full Committee.
The Committee shall not approve non-audit services that the Committee believes may impair the independence of the auditors. As of the date of the approval of this Audit Committee Charter, permissible non-audit services include any professional services (including tax services), that are not prohibited services as described below, provided to the Fund by the independent auditors, other than those provided to the Fund in connection with an audit or a review of the financial statements of the Fund. Permissible non-audit services may not include: (i) bookkeeping or other services related to the accounting records or financial statements of the Fund; (ii) financial information systems design and implementation; (iii) appraisal or valuation services, fairness opinions or contribution-in-kind reports; (iv) actuarial services; (v) internal audit outsourcing services; (vi) management functions or human resources; (vii) broker or dealer, investment adviser or investment banking services; (viii) legal services and expert services unrelated to the audit; and (ix) any other service the Public Company Accounting Oversight Board determines, by regulation, is impermissible.
Pre-approval by the Committee of any permissible non-audit services is not required so long as: (i) the aggregate amount of all such permissible non-audit services provided to the Fund, the Adviser and any service providers controlling, controlled by or under common control with the Adviser that provide ongoing services to the Fund (“Covered Service Providers”) constitutes not more than 5% of the total amount of revenues paid to the independent auditors during the fiscal year in which the permissible non-audit services are provided to (a) the Fund, (b) the Adviser and (c) any entity controlling, controlled by or under common control with the Adviser that provides ongoing services to the Fund during the fiscal year in which the services are provided that would have to be approved by the Committee; (ii) the permissible non-audit services were not recognized by the Fund at the time of the engagement to be non-audit services; and (iii) such services are promptly brought to the attention of the Committee and approved by the Committee (or its delegate(s)) prior to the completion of the audit.
(2) For the Salomon Brothers Opportunity Fund Inc., the percentage of fees that were approved by the audit committee, with respect to: Audit-Related Fees were 100% and 100% for the years ended 8/31/04 and 8/31/03; Tax Fees were 100% and 100% for the years ended 8/31/04 and 8/31/03. There were no All Other Fees paid by the Salomon Brothers Opportunity Fund Inc.
| | (g) | Non-audit fees billed by the Accountant for services rendered to Salomon Brothers Opportunity Fund Inc. and CAM and any entity controlling, controlled by, or under common control with CAM that provides ongoing services to Salomon Brothers Opportunity Fund Inc. were $2.8 million and $6.4 million for the years ended 8/31/04 and 8/31/03. |
| | (h) | Yes. The Salomon Brothers Opportunity Fund Inc.’s Audit Committee has considered whether the provision of non-audit services that were rendered to Service Affiliates which were not pre-approved (not requiring pre-approval) is compatible with maintaining the Auditor’s independence. All services provided by the Accountant to the Salomon Brothers Opportunity Fund Inc. or to Service Affiliates which were required to be pre-approved were pre-approved as required. |
ITEM 5. AUDIT COMMITTEE OF LISTED REGISTRANTS.
Not applicable.
ITEM 6. [RESERVED]
ITEM 7. DISCLOSURE OF PROXY VOTING POLICIES AND PROCEDURES FOR CLOSED-END MANAGEMENT INVESTMENT COMPANIES.
Not applicable.
ITEM 8. [RESERVED]
ITEM 9. SUBMISSION OF MATTERS TO A VOTE OF SECURITY HOLDERS.
Not applicable.
ITEM 10. CONTROLS AND PROCEDURES.
| | (a) | The registrant’s principal executive officer and principal financial officer have concluded that the registrant’s disclosure controls and procedures (as defined in Rule 30a- 3(c) under the Investment Company Act of 1940, as amended (the “1940 Act”)) are effective as of a date within 90 days of the filing date of this report that includes the disclosure required by this paragraph, based on their evaluation of the disclosure controls and procedures required by Rule 30a-3(b) under the 1940 Act and 15d-15(b) under the Securities Exchange Act of 1934. |
| | (b) | There were no changes in the registrant’s internal control over financial reporting (as defined in Rule 30a-3(d) under the 1940 Act) that occurred during the registrant’s last fiscal half-year (the registrant’s second fiscal half-year in the case of an annual report) that have materially affected, or are likely to materially affect the registrant’s internal control over financial reporting. |
ITEM 11. EXHIBITS.
| | (a) | Code of Ethics attached hereto. |
Exhibit 99.CODE ETH
| | |
| Exhibit 99.CERT | | Certifications pursuant to Section 302 of the Sarbanes-Oxley Act of 2002 |
| |
| Exhibit 99.906CERT | | Certifications pursuant to Section 906 of the Sarbanes-Oxley Act of 2002 |
SIGNATURES
Pursuant to the requirements of the Securities Exchange Act of 1934 and the Investment Company Act of 1940, the registrant has duly caused this Report to be signed on its behalf by the undersigned, there unto duly authorized.
| | |
| Salomon Brothers Opportunity Fund Inc |
| |
| By: | | /s/ R. Jay Gerken
|
| | | (R. Jay Gerken) |
| | | Executive Vice President |
| | | Salomon Brothers Opportunity Fund Inc |
|
| Date: November 9, 2004 |
Pursuant to the requirements of the Securities Exchange Act of 1934 and the Investment Company Act of 1940, this report has been signed below by the following persons on behalf of the registrant and in the capacities and on the dates indicated.
| | |
| By: | | /s/ R. Jay Gerken
|
| | | (R. Jay Gerken) |
| | | Executive Vice President |
| | | Salomon Brothers Opportunity Fund Inc |
| |
| Date: | | November 9, 2004 |
| |
| By: | | /s/ Frances M. Guggino
|
| | | Chief Financial Officer |
| | | Salomon Brothers Opportunity Fund Inc |
| |
| Date: | | November 9, 2004 |