Returns quoted are past performance and do not guarantee future results; current performance may be lower or higher. Investment returns and principal value will vary; there may be a gain or loss when shares are sold. For the most recent month-end performance call 800.668.0434 (or 800.525.3713 if you hold shares directly with Janus Henderson) or visit janushenderson.com/performance (or janushenderson.com/allfunds if you hold shares directly with Janus Henderson).
Maximum Offering Price (MOP) returns include the maximum sales charge of 5.75%. Net Asset Value (NAV) returns exclude this charge, which would have reduced returns.
CDSC returns include a 1% contingent deferred sales charge (CDSC) on Shares redeemed within 12 months of purchase. Net Asset Value (NAV) returns exclude this charge, which would have reduced returns.
Net expense ratios reflect the expense waiver, if any, contractually agreed to through February 1, 2020.
Performance may be affected by risks that include those associated with non-diversification, portfolio turnover, short sales, potential conflicts of interest, foreign and emerging markets, initial public offerings (IPOs), high-yield and high-risk securities, undervalued, overlooked and smaller capitalization companies, real estate related securities including Real Estate Investment Trusts (REITs), derivatives, and commodity-linked investments. Each product
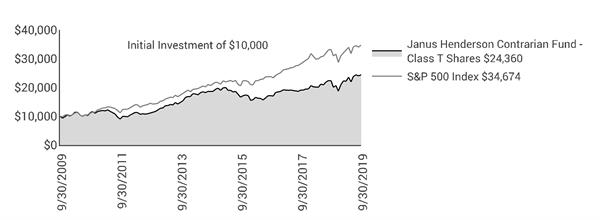
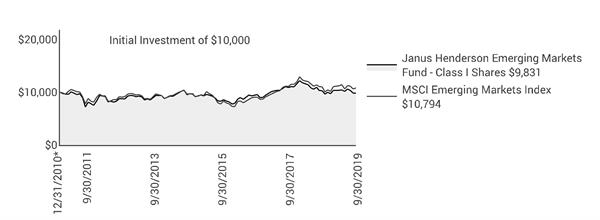
Janus Henderson Emerging Markets Fund (unaudited)
Performance
has different risks. Please see the prospectus for more information about risks, holdings and other details.
The Fund will normally invest at least 80% of its net assets, measured at the time of purchase, in the type of securities described by its name.
Returns include reinvestment of all dividends and distributions and do not reflect the deduction of taxes that a shareholder would pay on Fund distributions or redemptions of Fund shares. The returns do not include adjustments in accordance with generally accepted accounting principles required at the period end for financial reporting purposes.
Returns of the Fund shown prior to June 5, 2017 are those for Henderson Emerging Markets Fund (the “Predecessor Fund”), which merged into the Fund after the close of business on June 2, 2017. The Predecessor Fund was advised by Henderson Global Investors (North America) Inc. and subadvised by Henderson Investment Management Limited. Class A Shares, Class C Shares, Class I Shares, and Class R6 Shares of the Predecessor Fund were reorganized into Class A Shares, Class C Shares, Class I Shares, and Class N Shares, respectively, of the Fund. In connection with this reorganization, certain shareholders of the Predecessor Fund who held shares directly with the Predecessor Fund and not through an intermediary had the Class A Shares, Class C Shares, Class I Shares, and Class N Shares of the Fund received in the reorganization automatically exchanged for Class D Shares of the Fund following the reorganization. Class A Shares, Class C Shares and Class I Shares of the Predecessor Fund commenced operations with the Predecessor Fund’s inception on December 31, 2010. Class R6 Shares of the Predecessor Fund commenced operations on November 30, 2015. Class D Shares, Class S Shares, and Class T Shares commenced operations on June 5, 2017.
Performance of Class A Shares shown for periods prior to June 5, 2017, reflects the performance of Class A Shares of the Predecessor Fund, calculated using the fees and expenses of Class A Shares of the Predecessor Fund, in effect during the periods shown, net of any applicable fee and expense limitations or waivers.
Performance of Class C Shares shown for periods prior to June 5, 2017, reflects the performance of Class C Shares of the Predecessor Fund, calculated using the fees and expenses of Class C Shares of the Predecessor Fund, in effect during the periods shown, net of any applicable fee and expense limitations or waivers.
Performance of Class I Shares shown for periods prior to June 5, 2017, reflects the performance of Class I Shares of the Predecessor Fund, calculated using the fees and expenses of Class I Shares of the Predecessor Fund, in effect during the periods shown, net of any applicable fee and expense limitations or waivers.
Performance of Class N Shares shown for periods prior to June 5, 2017, reflects the performance of Class R6 Shares of the Predecessor Fund, calculated using the fees and expenses of Class R6 Shares of the Predecessor Fund, in effect during the periods shown, net of any applicable fee and expense limitations or waivers, except that for periods prior to November 30, 2015, performance for Class N Shares reflects the performance of Class I Shares of the Predecessor Fund, calculated using the estimated fees and expenses of Class N Shares, net of any applicable fee and expense limitations or waivers.
Performance of Class S Shares shown for periods prior to June 5, 2017, reflects the performance of Class I Shares of the Predecessor Fund, calculated using the estimated fees and expenses of Class S Shares, net of any applicable fee and expense limitations or waivers.
Performance of Class T Shares shown for periods prior to June 5, 2017, reflects the performance of Class I Shares of the Predecessor Fund, calculated using the estimated fees and expenses of Class T Shares, net of any applicable fee and expense limitations or waivers.
Performance of Class D Shares shown for periods prior to June 5, 2017, reflects the performance of Class I Shares of the Predecessor Fund, calculated using the estimated fees and expenses of Class D Shares, net of any applicable fee and expense limitations or waivers.
If each share class of the Fund had been available during periods prior to its commencement, the performance shown may have been different. The performance shown for periods following the Fund’s commencement of each share class reflects the fees and expenses of each respective share class, net of any applicable fee and expense limitations or waivers. Please refer to the Fund’s prospectuses for further details concerning historical performance.
Ranking is for the share class shown only; other classes may have different performance characteristics. When an expense waiver is in effect, it may have a material effect on the total return, and therefore the ranking for the period.
© 2019 Morningstar, Inc. All Rights Reserved.
There is no assurance that the investment process will consistently lead to successful investing.
See Notes to Schedule of Investments and Other Information for index definitions.
Index performance does not reflect the expenses of managing a portfolio as an index is unmanaged and not available for direct investment.
See “Useful Information About Your Fund Report.”
Effective on or about April 19, 2019, Glen Finegan is removed and Stephen Deane is added as Co-Portfolio Manager of the Fund.
Effective on or about September 16, 2019, Stephen Deane and Michael Cahoon are removed as Co-Portfolio Managers, and Daniel Graña is Portfolio Manager of the Fund.
*The Predecessor Fund’s inception date – December 31, 2010
‡ As stated in the prospectus. See Financial Highlights for actual expense ratios during the reporting period.
(1) Closed to certain new investors.
Janus Henderson Emerging Markets Fund (unaudited)
Expense Examples
As a shareholder of the Fund, you incur two types of costs: (1) transaction costs, such as sales charges (loads) on purchase payments (applicable to Class A Shares only); and (2) ongoing costs, including management fees; 12b-1 distribution and shareholder servicing fees; transfer agent fees and expenses payable pursuant to the Transfer Agency Agreement; and other Fund expenses. This example is intended to help you understand your ongoing costs (in dollars) of investing in the Fund and to compare these costs with the ongoing costs of investing in other mutual funds. To do so, compare this 5% hypothetical example with the 5% hypothetical examples that appear in the shareholder reports of the other funds. The example is based upon an investment of $1,000 invested at the beginning of the period and held for the six-months indicated, unless noted otherwise in the table and footnotes below.
Actual Expenses
The information in the table under the heading “Actual” provides information about actual account values and actual expenses. You may use the information in these columns, together with the amount you invested, to estimate the expenses that you paid over the period. Simply divide your account value by $1,000 (for example, an $8,600 account value divided by $1,000 = 8.6), then multiply the result by the number in the appropriate column for your share class under the heading entitled “Expenses Paid During Period” to estimate the expenses you paid on your account during the period.
Hypothetical Example for Comparison Purposes
The information in the table under the heading “Hypothetical (5% return before expenses)” provides information about hypothetical account values and hypothetical expenses based upon the Fund’s actual expense ratio and an assumed rate of return of 5% per year before expenses, which is not the Fund’s actual return. The hypothetical account values and expenses may not be used to estimate the actual ending account balance or expenses you paid for the period. You may use this information to compare the ongoing costs of investing in the Fund and other funds. To do so, compare this 5% hypothetical example with the 5% hypothetical examples that appear in the shareholder reports of the other funds. Additionally, for an analysis of the fees associated with an investment in any share class or other similar funds, please visit www.finra.org/fundanalyzer.
Please note that the expenses shown in the table are meant to highlight your ongoing costs only and do not reflect any transaction costs. These fees are fully described in the Fund’s prospectuses. Therefore, the hypothetical examples are useful in comparing ongoing costs only, and will not help you determine the relative total costs of owning different funds. In addition, if these transaction costs were included, your costs would have been higher.
| | | | | | | | | | | |
| | | | | | | | | |
| | | | Actual | | Hypothetical
(5% return before expenses) | |
| Beginning
Account
Value
(4/1/19) | Ending
Account
Value
(9/30/19) | Expenses
Paid During
Period
(4/1/19 - 9/30/19)† | | Beginning
Account
Value
(4/1/19) | Ending
Account
Value
(9/30/19) | Expenses
Paid During
Period
(4/1/19 - 9/30/19)† | Net Annualized
Expense Ratio
(4/1/19 - 9/30/19) |
Class A Shares | $1,000.00 | $949.90 | $5.72 | | $1,000.00 | $1,019.20 | $5.92 | 1.17% |
Class C Shares | $1,000.00 | $945.00 | $9.95 | | $1,000.00 | $1,014.84 | $10.30 | 2.04% |
Class D Shares | $1,000.00 | $949.20 | $5.47 | | $1,000.00 | $1,019.45 | $5.67 | 1.12% |
Class I Shares | $1,000.00 | $950.20 | $5.43 | | $1,000.00 | $1,019.50 | $5.62 | 1.11% |
Class N Shares | $1,000.00 | $950.30 | $4.69 | | $1,000.00 | $1,020.26 | $4.86 | 0.96% |
Class S Shares | $1,000.00 | $949.40 | $3.62 | | $1,000.00 | $1,021.36 | $3.75 | 0.74% |
Class T Shares | $1,000.00 | $950.20 | $5.92 | | $1,000.00 | $1,019.00 | $6.12 | 1.21% |
† | Expenses Paid During Period are equal to the Net Annualized Expense Ratio multiplied by the average account value over the period, multiplied by 183/365 (to reflect the one-half year period). Expenses in the examples include the effect of applicable fee waivers and/or expense reimbursements, if any. Had such waivers and/or reimbursements not been in effect, your expenses would have been higher. Please refer to the Notes to Financial Statements or the Fund’s prospectuses for more information regarding waivers and/or reimbursements. |
Janus Henderson Emerging Markets Fund
Schedule of Investments
September 30, 2019
| | | | | | | | |
Shares
| | | Value | |
Common Stocks – 91.6% | | | |
Automobiles – 1.2% | | | |
| | Maruti Suzuki India Ltd | | 9,439 | | | $894,571 | |
Banks – 7.2% | | | |
| | Abu Dhabi Commercial Bank PJSC | | 442,712 | | | 947,429 | |
| | Banco Bradesco SA | | 110,540 | | | 831,458 | |
| | Bank Tabungan Pensiunan Nasional Syariah Tbk PT* | | 3,405,100 | | | 791,884 | |
| | Commercial International Bank Egypt SAE | | 385,133 | | | 1,773,537 | |
| | HDFC Bank Ltd | | 55,429 | | | 960,134 | |
| | | 5,304,442 | |
Beverages – 4.7% | | | |
| | Fomento Economico Mexicano SAB de CV (ADR) | | 14,572 | | | 1,334,504 | |
| | Guinness Nigeria PLC | | 1,453,938 | | | 136,305 | |
| | Heineken Holding NV | | 19,540 | | | 1,945,269 | |
| | | 3,416,078 | |
Building Products – 0.9% | | | |
| | China Lesso Group Holdings Ltd | | 686,000 | | | 649,457 | |
Chemicals – 0.9% | | | |
| | UPL Ltd | | 75,453 | | | 643,085 | |
Commercial Services & Supplies – 2.8% | | | |
| | A-Living Services Co Ltd (144A) | | 328,500 | | | 757,803 | |
| | Sunny Friend Environmental Technology Co Ltd | | 150,000 | | | 1,310,402 | |
| | | 2,068,205 | |
Construction & Engineering – 1.9% | | | |
| | Samsung Engineering Co Ltd* | | 44,115 | | | 619,676 | |
| | Wijaya Karya Persero Tbk PT | | 5,589,400 | | | 758,252 | |
| | | 1,377,928 | |
Construction Materials – 0.8% | | | |
| | Grasim Industries Ltd | | 54,464 | | | 561,155 | |
Containers & Packaging – 0% | | | |
| | Nampak Ltd* | | 60,691 | | | 38,048 | |
Diversified Consumer Services – 1.0% | | | |
| | Fu Shou Yuan International Group Ltd | | 855,000 | | | 756,000 | |
Diversified Financial Services – 1.4% | | | |
| | Chailease Holding Co Ltd | | 265,000 | | | 1,067,043 | |
Electrical Equipment – 1.8% | | | |
| | KEI Industries Ltd | | 103,927 | | | 796,964 | |
| | Voltronic Power Technology Corp | | 27,000 | | | 555,607 | |
| | | 1,352,571 | |
Entertainment – 1.1% | | | |
| | NetEase Inc (ADR) | | 2,910 | | | 774,584 | |
Food & Staples Retailing – 4.5% | | | |
| | CP ALL PCL (NVDR) | | 371,900 | | | 988,125 | |
| | Jeronimo Martins SGPS SA | | 45,627 | | | 769,732 | |
| | Shoprite Holdings Ltd | | 92,648 | | | 750,609 | |
| | X5 Retail Group NV (GDR) (REG) | | 22,013 | | | 770,015 | |
| | | 3,278,481 | |
Hotels, Restaurants & Leisure – 0.8% | | | |
| | Sands China Ltd | | 132,400 | | | 599,706 | |
Household Durables – 1.2% | | | |
| | Haier Smart Home Co Ltd | | 421,195 | | | 902,649 | |
Information Technology Services – 2.8% | | | |
| | Infosys Ltd | | 121,845 | | | 1,385,304 | |
| | Pagseguro Digital Ltd* | | 14,205 | | | 657,833 | |
| | | 2,043,137 | |
Insurance – 5.7% | | | |
| | AIA Group Ltd | | 81,200 | | | 767,191 | |
| | IRB Brasil Resseguros S/A | | 105,394 | | | 955,360 | |
| | Ping An Insurance Group Co of China Ltd | | 213,500 | | | 2,453,037 | |
| | | 4,175,588 | |
| | |
See Notes to Schedule of Investments and Other Information and Notes to Financial Statements. |
| |
Janus Investment Fund | 7 |
Janus Henderson Emerging Markets Fund
Schedule of Investments
September 30, 2019
| | | | | | | | |
Shares
| | | Value | |
Common Stocks – (continued) | | | |
Interactive Media & Services – 8.0% | | | |
| | Tencent Holdings Ltd | | 117,500 | | | $4,950,367 | |
| | Yandex NV* | | 25,365 | | | 888,029 | |
| | | 5,838,396 | |
Internet & Direct Marketing Retail – 8.8% | | | |
| | Alibaba Group Holding Ltd (ADR)* | | 24,441 | | | 4,087,268 | |
| | MercadoLibre Inc* | | 1,146 | | | 631,710 | |
| | Naspers Ltd | | 11,309 | | | 1,714,597 | |
| | | 6,433,575 | |
Machinery – 2.1% | | | |
| | China Conch Venture Holdings Ltd | | 210,500 | | | 778,884 | |
| | Zhengzhou Yutong Bus Co Ltd | | 383,734 | | | 747,118 | |
| | | 1,526,002 | |
Metals & Mining – 0.9% | | | |
| | Ivanhoe Mines Ltd* | | 242,821 | | | 630,561 | |
Multiline Retail – 1.3% | | | |
| | Poya International Co Ltd | | 65,000 | | | 922,951 | |
Oil, Gas & Consumable Fuels – 6.4% | | | |
| | CNOOC Ltd | | 722,000 | | | 1,101,770 | |
| | Geopark Ltd* | | 40,342 | | | 742,696 | |
| | LUKOIL PJSC (ADR) | | 18,204 | | | 1,506,199 | |
| | Petroleo Brasileiro SA (ADR) | | 93,814 | | | 1,357,489 | |
| | | 4,708,154 | |
Personal Products – 4.3% | | | |
| | LG Household & Health Care Ltd | | 1,256 | | | 1,372,568 | |
| | Unilever PLC | | 29,573 | | | 1,777,717 | |
| | | 3,150,285 | |
Pharmaceuticals – 0.7% | | | |
| | Mega Lifesciences PCL | | 527,200 | | | 538,751 | |
Real Estate Management & Development – 2.0% | | | |
| | Ayala Land Inc | | 903,700 | | | 862,535 | |
| | Logan Property Holdings Co Ltd | | 420,000 | | | 598,048 | |
| | | 1,460,583 | |
Semiconductor & Semiconductor Equipment – 7.6% | | | |
| | MediaTek Inc | | 64,000 | | | 758,803 | |
| | Sino-American Silicon Products Inc | | 369,000 | | | 976,645 | |
| | Taiwan Semiconductor Manufacturing Co Ltd | | 440,000 | | | 3,853,532 | |
| | | 5,588,980 | |
Specialty Retail – 1.1% | | | |
| | Wilcon Depot Inc | | 2,500,300 | | | 796,274 | |
Technology Hardware, Storage & Peripherals – 5.7% | | | |
| | Samsung Electronics Co Ltd | | 102,693 | | | 4,211,615 | |
Thrifts & Mortgage Finance – 1.8% | | | |
| | Housing Development Finance Corp Ltd | | 48,689 | | | 1,358,437 | |
Wireless Telecommunication Services – 0.2% | | | |
| | Safaricom PLC | | 593,774 | | | 157,386 | |
Total Common Stocks (cost $64,511,500) | | 67,224,678 | |
Preferred Stocks – 1.1% | | | |
Electric Utilities – 1.1% | | | |
| | Cia Paranaense de Energia | | 64,529 | | | 770,540 | |
Oil, Gas & Consumable Fuels – 0% | | | |
| | International Petroleum Ltd¢ | | 955,965 | | | 0 | |
Total Preferred Stocks (cost $1,005,209) | | 770,540 | |
| | |
See Notes to Schedule of Investments and Other Information and Notes to Financial Statements. |
| |
8 | SEPTEMBER 30, 2019 |
Janus Henderson Emerging Markets Fund
Schedule of Investments
September 30, 2019
| | | | | | | | |
Shares
| | | Value | |
Investment Companies – 4.1% | | | |
Money Markets – 4.1% | | | |
| | Fidelity Investments Money Market Treasury Portfolio, 1.8200%ºº (cost $3,015,331) | | 3,015,331 | | | $3,015,331 | |
Total Investments (total cost $68,532,040) – 96.8% | | 71,010,549 | |
Cash, Receivables and Other Assets, net of Liabilities – 3.2% | | 2,351,502 | |
Net Assets – 100% | | $73,362,051 | |
| | | | | | |
Summary of Investments by Country - (Long Positions) (unaudited) |
| |
| | | | | % of | |
| | | | | Investment | |
Country | | Value | | Securities | |
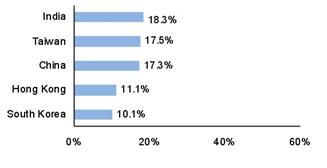
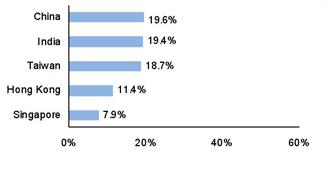
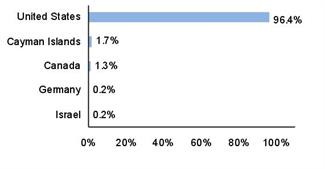
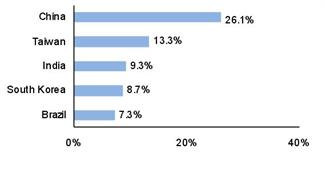
China | | $18,556,985 | | 26.1 | % |
Taiwan | | 9,444,983 | | 13.3 | |
India | | 6,599,650 | | 9.3 | |
South Korea | | 6,203,859 | | 8.7 | |
Brazil | | 5,204,390 | | 7.3 | |
Russia | | 3,164,243 | | 4.5 | |
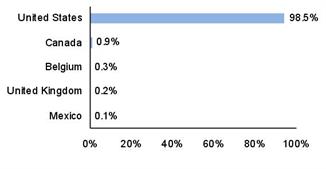
United States | | 3,015,331 | | 4.3 | |
South Africa | | 2,503,254 | | 3.5 | |
Netherlands | | 1,945,269 | | 2.7 | |
United Kingdom | | 1,777,717 | | 2.5 | |
Egypt | | 1,773,537 | | 2.5 | |
Philippines | | 1,658,809 | | 2.3 | |
Indonesia | | 1,550,136 | | 2.2 | |
Thailand | | 1,526,876 | | 2.2 | |
Hong Kong | | 1,366,897 | | 1.9 | |
Mexico | | 1,334,504 | | 1.9 | |
United Arab Emirates | | 947,429 | | 1.3 | |
Portugal | | 769,732 | | 1.1 | |
Chile | | 742,696 | | 1.1 | |
Canada | | 630,561 | | 0.9 | |
Kenya | | 157,386 | | 0.2 | |
Nigeria | | 136,305 | | 0.2 | |
| | |
See Notes to Schedule of Investments and Other Information and Notes to Financial Statements. |
| |
Janus Investment Fund | 9 |
Janus Henderson Emerging Markets Fund
Schedule of Investments
September 30, 2019
Schedules of Affiliated Investments – (% of Net Assets)
| | | | | | | | | | | |
| | Dividend Income | Realized Gain/(Loss) | Change in Unrealized Appreciation/ Depreciation | Value at 9/30/19 |
Common Stocks - N/A |
Wireless Telecommunication Services - N/A |
| | Vodafone Idea Ltd | $ | - | $ | (2,932,212) | $ | 1,711,977 | $ | - |
| |
| | | | | | | | | | | |
| | Share Balance at 9/30/18 | Purchases | Sales | Share Balance at 9/30/19 |
Common Stocks - N/A |
Wireless Telecommunication Services - N/A |
| | Vodafone Idea Ltd | | 2,185,834 | | 8,586,420Ð | | (10,772,254)Ð | | - |
| | |
See Notes to Schedule of Investments and Other Information and Notes to Financial Statements. |
| |
10 | SEPTEMBER 30, 2019 |
Janus Henderson Emerging Markets Fund
Notes to Schedule of Investments and Other Information
| | |
MSCI Emerging Markets IndexSM | MSCI Emerging Markets IndexSM reflects the equity market performance of emerging markets. |
| | |
ADR | American Depositary Receipt |
GDR | Global Depositary Receipt |
NVDR | Non-Voting Depositary Receipt |
PJSC | Private Joint Stock Company |
PLC | Public Limited Company |
REG | Registered |
| | |
144A | Securities sold under Rule 144A of the Securities Act of 1933, as amended, are subject to legal and/or contractual restrictions on resale and may not be publicly sold without registration under the 1933 Act. Unless otherwise noted, these securities have been determined to be liquid under guidelines established by the Board of Trustees. The total value of 144A securities as of the year ended September 30, 2019 is $757,803, which represents 1.0% of net assets. |
| | |
* | Non-income producing security. |
| | |
ºº | Rate shown is the 7-day yield as of September 30, 2019. |
| | |
¢ | Security is valued using significant unobservable inputs. |
| | |
Ð | All or a portion is the result of a corporate action. |
| | | | | | | | | | | | | |
The following is a summary of the inputs that were used to value the Fund’s investments in securities and other financial instruments as of September 30, 2019. See Notes to Financial Statements for more information. |
| |
Valuation Inputs Summary |
| | | | | | | |
| | | | | Level 2 - | | Level 3 - |
| | | Level 1 - | | Other Significant | | Significant |
| | | Quoted Prices | | Observable Inputs | | Unobservable Inputs |
| | | | | | | |
Assets | | | | | | |
Investments In Securities: | | | | | | |
Common Stocks | | | | | | |
Commercial Services & Supplies | $ | 757,803 | $ | 1,310,402 | $ | - |
Diversified Financial Services | | - | | 1,067,043 | | - |
Electrical Equipment | | 796,964 | | 555,607 | | - |
Household Durables | | - | | 902,649 | | - |
Machinery | | 778,884 | | 747,118 | | - |
Multiline Retail | | - | | 922,951 | | - |
Pharmaceuticals | | - | | 538,751 | | - |
Semiconductor & Semiconductor Equipment | | - | | 5,588,980 | | - |
All Other | | 53,257,526 | | - | | - |
Preferred Stocks | | - | | 770,540 | | 0 |
Investment Companies | | 3,015,331 | | - | | - |
Total Assets | $ | 58,606,508 | $ | 12,404,041 | $ | 0 |
| | | | | | | |
Janus Henderson Emerging Markets Fund
Statement of Assets and Liabilities
September 30, 2019
| |
See footnotes at the end of the Statement. |
| | | | | | | |
| | | | | | |
Assets: | | | | |
| | Investments, at value(1) | | $ | 71,010,549 | |
| | Cash denominated in foreign currency(2) | | | 2,560,510 | |
| | Non-interested Trustees' deferred compensation | | | 1,895 | |
| | Receivables: | | | | |
| | | Investments sold | | | 3,725,394 | |
| | | Dividends | | | 179,937 | |
| | | Foreign tax reclaims | | | 160,505 | |
| | | Fund shares sold | | | 116,117 | |
| | Other assets | | | 12,898 | |
Total Assets | | | 77,767,805 | |
Liabilities: | | | | |
| | Payables: | | | — | |
| | | Investments purchased | | | 4,155,318 | |
| | | Fund shares repurchased | | | 76,350 | |
| | | Professional fees | | | 58,044 | |
| | | Custodian fees | | | 46,589 | |
| | | Transfer agent fees and expenses | | | 12,481 | |
| | | 12b-1 Distribution and shareholder servicing fees | | | 3,962 | |
| | | Advisory fees | | | 3,324 | |
| | | Non-interested Trustees' deferred compensation fees | | | 1,895 | |
| | | Non-interested Trustees' fees and expenses | | | 829 | |
| | | Affiliated fund administration fees payable | | | 159 | |
| | | Accrued expenses and other payables | | | 46,803 | |
Total Liabilities | | | 4,405,754 | |
Net Assets | | $ | 73,362,051 | |
| | |
See Notes to Financial Statements. |
| |
12 | SEPTEMBER 30, 2019 |
Janus Henderson Emerging Markets Fund
Statement of Assets and Liabilities
September 30, 2019
| | | | | | | |
| | | | | | |
| | | | | | | |
Net Assets Consist of: | | | | |
| | Capital (par value and paid-in surplus) | | $ | 81,136,264 | |
| | Total distributable earnings (loss)(3) | | | (7,774,213) | |
Total Net Assets | | $ | 73,362,051 | |
Net Assets - Class A Shares | | $ | 4,858,922 | |
| | Shares Outstanding, $0.01 Par Value (unlimited shares authorized) | | | 557,417 | |
Net Asset Value Per Share(4) | | $ | 8.72 | |
Maximum Offering Price Per Share(5) | | $ | 9.25 | |
Net Assets - Class C Shares | | $ | 3,432,015 | |
| | Shares Outstanding, $0.01 Par Value (unlimited shares authorized) | | | 407,587 | |
Net Asset Value Per Share(4) | | $ | 8.42 | |
Net Assets - Class D Shares | | $ | 10,956,693 | |
| | Shares Outstanding, $0.01 Par Value (unlimited shares authorized) | | | 1,247,304 | |
Net Asset Value Per Share | | $ | 8.78 | |
Net Assets - Class I Shares | | $ | 34,499,164 | |
| | Shares Outstanding, $0.01 Par Value (unlimited shares authorized) | | | 3,929,065 | |
Net Asset Value Per Share | | $ | 8.78 | |
Net Assets - Class N Shares | | $ | 16,530,762 | |
| | Shares Outstanding, $0.01 Par Value (unlimited shares authorized) | | | 1,880,730 | |
Net Asset Value Per Share | | $ | 8.79 | |
Net Assets - Class S Shares | | $ | 76,569 | |
| | Shares Outstanding, $0.01 Par Value (unlimited shares authorized) | | | 8,694 | |
Net Asset Value Per Share | | $ | 8.81 | |
Net Assets - Class T Shares | | $ | 3,007,926 | |
| | Shares Outstanding, $0.01 Par Value (unlimited shares authorized) | | | 342,697 | |
Net Asset Value Per Share | | $ | 8.78 | |
| |
(1) Includes cost of $68,532,040. (2) Includes cost of $2,560,510. (3) Includes $157,135 of foreign capital gains tax on investments. (4) Redemption price per share may be reduced for any applicable contingent deferred sales charge. (5) Maximum offering price is computed at 100/94.25 of net asset value. |
| | |
See Notes to Financial Statements. |
| |
Janus Investment Fund | 13 |
Janus Henderson Emerging Markets Fund
Statement of Operations
For the year ended September 30, 2019
| |
See footnotes at the end of the Statement. |
| | | | | | |
| | | | | |
Investment Income: | | | |
| Dividends | $ | 3,557,859 | |
| | Interest | | 29,108 | |
| | Other income | | 78,550 | |
| | Foreign tax withheld | | (425,691) | |
Total Investment Income | | 3,239,826 | |
Expenses: | | | |
| | Advisory fees | | 1,232,554 | |
| | 12b-1 Distribution and shareholder servicing fees: | | | |
| | | Class A Shares | | 22,210 | |
| | | Class C Shares | | 45,578 | |
| | | Class S Shares | | 1,108 | |
| | Transfer agent administrative fees and expenses: | | | |
| | | Class D Shares | | 14,776 | |
| | | Class S Shares | | 1,219 | |
| | | Class T Shares | | 10,114 | |
| | Transfer agent networking and omnibus fees: | | | |
| | | Class A Shares | | 5,483 | |
| | | Class C Shares | | 3,652 | |
| | | Class I Shares | | 46,461 | |
| | Other transfer agent fees and expenses: | | | |
| | | Class A Shares | | 1,044 | |
| | | Class C Shares | | 556 | |
| | | Class D Shares | | 5,961 | |
| | | Class I Shares | | 4,450 | |
| | | Class N Shares | | 919 | |
| | | Class S Shares | | 18 | |
| | | Class T Shares | | 131 | |
| | Professional fees | | 123,322 | |
| | Registration fees | | 120,908 | |
| | Custodian fees | | 116,296 | |
| | Non-affiliated fund administration fees | | 75,419 | |
| | Shareholder reports expense | | 44,260 | |
| | Non-interested Trustees’ fees and expenses | | 3,560 | |
| | Affiliated fund administration fees | | 2,846 | |
| | Other expenses | | 25,217 | |
Total Expenses | | 1,908,062 | |
Less: Excess Expense Reimbursement and Waivers | | (462,646) | |
Net Expenses | | 1,445,416 | |
Net Investment Income/(Loss) | | 1,794,410 | |
| | | | | | |
| | |
See Notes to Financial Statements. |
| |
14 | SEPTEMBER 30, 2019 |
Janus Henderson Emerging Markets Fund
Statement of Operations
For the year ended September 30, 2019
| | | | | | |
| | | | | |
Net Realized Gain/(Loss) on Investments: | | | |
| | Investments and foreign currency transactions(1) | $ | (7,185,672) | |
| | Investments in affiliates | | (2,932,212) | |
| | Net payments from affiliates (Note 3) | | 228,182 | |
Total Net Realized Gain/(Loss) on Investments | | (9,889,702) | |
Change in Unrealized Net Appreciation/Depreciation: | | | |
| | Investments, foreign currency translations and non-interested Trustees’ deferred compensation(2) | | 1,199,963 | |
| | Investments in affiliates | | 1,711,977 | |
Total Change in Unrealized Net Appreciation/Depreciation | | 2,911,940 | |
Net Increase/(Decrease) in Net Assets Resulting from Operations | $ | (5,183,352) | |
| | | | | | |
| |
(1) Includes realized foreign capital gains tax on investments of $(178,063). (2) Includes change in unrealized appreciation/depreciation of $273,603 due to foreign capital gains tax on investments. |
| | |
See Notes to Financial Statements. |
| |
Janus Investment Fund | 15 |
Janus Henderson Emerging Markets Fund
Statements of Changes in Net Assets
| | | | | | | | | |
| | | | | | | | | |
| | | Year ended
September 30, 2019 | | Year ended
September 30, 2018 | |
| | | | | | | | | |
Operations: | | | | | | |
| | Net investment income/(loss) | $ | 1,794,410 | | $ | 2,146,633 | |
| | Net realized gain/(loss) on investments | | (9,889,702) | | | 4,021,591 | |
| | Change in unrealized net appreciation/depreciation | | 2,911,940 | | | (17,308,273) | |
Net Increase/(Decrease) in Net Assets Resulting from Operations | | (5,183,352) | | | (11,140,049) | |
Dividends and Distributions to Shareholders | | | | | | |
| | | Class A Shares | | (457,330) | | | (459,832) | |
| | | Class C Shares | | (116,611) | | | (200,053) | |
| | | Class D Shares | | (428,310) | | | (475,263) | |
| | | Class I Shares | | (2,922,779) | | | (3,741,499) | |
| | | Class N Shares | | (815,126) | | | (902,442) | |
| | | Class S Shares | | (13,840) | | | (9,313) | |
| | | Class T Shares | | (146,144) | | | (237,676) | |
Net Decrease from Dividends and Distributions to Shareholders | | (4,900,140) | | | (6,026,078) | |
Capital Share Transactions: | | | | | | |
| | | Class A Shares | | (10,008,606) | | | 1,667,423 | |
| | | Class C Shares | | (2,184,824) | | | (2,358,097) | |
| | | Class D Shares | | (1,182,282) | | | (1,628,266) | |
| | | Class I Shares | | (66,839,075) | | | 5,040,165 | |
| | | Class N Shares | | (7,083,972) | | | (13,936,642) | |
| | | Class S Shares | | (1,596,508) | | | 1,685,020 | |
| | | Class T Shares | | (1,543,913) | | | (2,295,108) | |
Net Increase/(Decrease) from Capital Share Transactions | | (90,439,180) | | | (11,825,505) | |
Net Increase/(Decrease) in Net Assets | | (100,522,672) | | | (28,991,632) | |
Net Assets: | | | | | | |
| | Beginning of period | | 173,884,723 | | | 202,876,355 | |
| End of period | $ | 73,362,051 | | $ | 173,884,723 | |
| | | | | | | | | |
| | |
See Notes to Financial Statements. |
| |
16 | SEPTEMBER 30, 2019 |
Janus Henderson Emerging Markets Fund
Financial Highlights
| | | | | | | | | | | | | |
Class A Shares | | | | | | | | | |
For a share outstanding during the year or period ended September 30 | | 2019 | | | 2018 | | | 2017(1) | |
| | Net Asset Value, Beginning of Period | | $9.48 | | | $10.36 | | | $10.19 | |
| | Income/(Loss) from Investment Operations: | | | | | | | | | |
| | | Net investment income/(loss)(2) | | 0.10 | | | 0.10 | | | 0.04 | |
| | | Net realized and unrealized gain/(loss) | | (0.55) | | | (0.67) | | | 0.13 | |
| | Total from Investment Operations | | (0.45) | | | (0.57) | | | 0.17 | |
| | Less Dividends and Distributions: | | | | | | | | | |
| | | Dividends (from net investment income) | | (0.13) | | | (0.10) | | | — | |
| | | Distributions (from capital gains) | | (0.18) | | | (0.21) | | | — | |
| | Total Dividends and Distributions | | (0.31) | | | (0.31) | | | — | |
| | Net Asset Value, End of Period | | $8.72 | | | $9.48 | | | $10.36 | |
| | Total Return* | | (4.66)%(3) | | | (5.80)% | | | 1.67% | |
| | Net Assets, End of Period (in thousands) | | $4,859 | | | $15,771 | | | $15,562 | |
| | Average Net Assets for the Period (in thousands) | | $8,932 | | | $16,103 | | | $15,471 | |
| | Ratios to Average Net Assets**: | | | | | | | | | |
| | | Ratio of Gross Expenses | | 1.65% | | | 1.51% | | | 1.75% | |
| | | Ratio of Net Expenses (After Waivers and Expense Offsets) | | 1.30% | | | 1.33% | | | 1.46% | |
| | | Ratio of Net Investment Income/(Loss) | | 1.11% | | | 0.93% | | | 2.18% | |
| | Portfolio Turnover Rate | | 68% | | | 26% | | | 2% | |
| | | | | | | | | | | | | |
| | | | | | | | | | | | | |
Class C Shares | | | | | | | | | |
For a share outstanding during the year or period ended September 30 | | 2019 | | | 2018 | | | 2017(1) | |
| | Net Asset Value, Beginning of Period | | $9.12 | | | $9.98 | | | $9.83 | |
| | Income/(Loss) from Investment Operations: | | | | | | | | | |
| | | Net investment income/(loss)(2) | | 0.05 | | | 0.01 | | | 0.02 | |
| | | Net realized and unrealized gain/(loss) | | (0.55) | | | (0.65) | | | 0.13 | |
| | Total from Investment Operations | | (0.50) | | | (0.64) | | | 0.15 | |
| | Less Dividends and Distributions: | | | | | | | | | |
| | | Dividends (from net investment income) | | (0.02) | | | (0.01) | | | — | |
| | | Distributions (from capital gains) | | (0.18) | | | (0.21) | | | — | |
| | Total Dividends and Distributions | | (0.20) | | | (0.22) | | | — | |
| | Net Asset Value, End of Period | | $8.42 | | | $9.12 | | | $9.98 | |
| | Total Return* | | (5.38)%(4) | | | (6.59)% | | | 1.53% | |
| | Net Assets, End of Period (in thousands) | | $3,432 | | | $5,985 | | | $9,017 | |
| | Average Net Assets for the Period (in thousands) | | $4,604 | | | $8,442 | | | $8,877 | |
| | Ratios to Average Net Assets**: | | | | | | | | | |
| | | Ratio of Gross Expenses | | 2.54% | | | 2.26% | | | 2.65% | |
| | | Ratio of Net Expenses (After Waivers and Expense Offsets) | | 2.11% | | | 2.07% | | | 2.35% | |
| | | Ratio of Net Investment Income/(Loss) | | 0.56% | | | 0.11% | | | 1.29% | |
| | Portfolio Turnover Rate | | 68% | | | 26% | | | 2% | |
| | | | | | | | | | | | | |
| |
* Total return includes adjustments in accordance with generally accepted accounting principles required at the year or period end and are not annualized for periods of less than one full year. ** Annualized for periods of less than one full year. (1) Period from August 1, 2017 through September 30, 2017. The Fund changed its fiscal year end from July 31 to September 30. (2) Per share amounts are calculated based on average shares outstanding during the year or period. (3) Total return without the effect of affiliated payments would have been (4.89)%. Please see Note 3 in the Notes to the Financial Statements. (4) Total return without the effect of affiliated payments would have been (5.61)%. Please see Note 3 in the Notes to the Financial Statements. |
| | |
See Notes to Financial Statements. |
| |
Janus Investment Fund | 17 |
Janus Henderson Emerging Markets Fund
Financial Highlights
| | | | | | | | | | | | | |
Class A Shares | | | | | | | | | |
For a share outstanding during the year ended July 31 | | 2017 | | | 2016 | | | 2015 | |
| | Net Asset Value, Beginning of Period | | $9.10 | | | $8.60 | | | $9.82 | |
| | Income/(Loss) from Investment Operations: | | | | | | | | | |
| | | Net investment income/(loss)(1) | | 0.10 | | | 0.13 | | | 0.02 | |
| | | Net realized and unrealized gain/(loss) | | 1.05 | | | 0.39 | | | (1.24) | |
| | Total from Investment Operations | | 1.15 | | | 0.52 | | | (1.22) | |
| | Less Dividends and Distributions: | | | | | | | | | |
| | | Dividends (from net investment income) | | (0.06) | | | (0.02) | | | — | |
| | Total Dividends and Distributions | | (0.06) | | | (0.02) | | | — | |
| | Net Asset Value, End of Period | | $10.19 | | | $9.10 | | | $8.60 | |
| | Total Return* | | 12.80% | | | 6.07% | | | (12.42)% | |
| | Net Assets, End of Period (in thousands) | | $15,124 | | | $6,510 | | | $8,272 | |
| | Average Net Assets for the Period (in thousands) | | $12,523 | | | $5,958 | | | $8,108 | |
| | Ratios to Average Net Assets**: | | | | | | | | | |
| | | Ratio of Gross Expenses | | 1.76% | | | 2.36%(2) | | | 2.13% | |
| | | Ratio of Net Expenses (After Waivers and Expense Offsets) | | 1.54% | | | 1.79% | | | 1.79% | |
| | | Ratio of Net Investment Income/(Loss) | | 1.05% | | | 1.64% | | | 0.21% | |
| | Portfolio Turnover Rate | | 32% | | | 86% | | | 148% | |
| | | | | | | | | | | | | |
| | | | | | | | | | | | | |
Class C Shares | | | | | | | | | |
For a share outstanding during the year ended July 31 | | 2017 | | | 2016 | | | 2015 | |
| | Net Asset Value, Beginning of Period | | $8.79 | | | $8.35 | | | $9.61 | |
| | Income/(Loss) from Investment Operations: | | | | | | | | | |
| | | Net investment income/(loss)(1) | | 0.03 | | | 0.06 | | | (0.06) | |
| | | Net realized and unrealized gain/(loss) | | 1.02 | | | 0.38 | | | (1.20) | |
| | Total from Investment Operations | | 1.05 | | | 0.44 | | | (1.26) | |
| | Less Dividends and Distributions: | | | | | | | | | |
| | | Dividends (from net investment income) | | (0.01) | | | — | | | — | |
| | Total Dividends and Distributions | | (0.01) | | | — | | | — | |
| | Net Asset Value, End of Period | | $9.83 | | | $8.79 | | | $8.35 | |
| | Total Return* | | 12.03% | | | 5.27% | | | (13.11)% | |
| | Net Assets, End of Period (in thousands) | | $8,530 | | | $3,553 | | | $3,049 | |
| | Average Net Assets for the Period (in thousands) | | $6,219 | | | $3,028 | | | $3,471 | |
| | Ratios to Average Net Assets**: | | | | | | | | | |
| | | Ratio of Gross Expenses | | 2.53% | | | 3.16%(2) | | | 2.90% | |
| | | Ratio of Net Expenses (After Waivers and Expense Offsets) | | 2.29% | | | 2.54% | | | 2.54% | |
| | | Ratio of Net Investment Income/(Loss) | | 0.37% | | | 0.70% | | | (0.62)% | |
| | Portfolio Turnover Rate | | 32% | | | 86% | | | 148% | |
| | | | | | | | | | | | | |
| |
* Total return not annualized for periods of less than one full year. ** Annualized for periods of less than one full year. (1) Per share amounts are calculated based on average shares outstanding during the year or period. (2) The Ratio of Gross Expenses include a reimbursement of prior period custodian out-of-pocket expenses. The Ratio of Gross Expenses would have been 0.07% higher had the custodian not reimbursed the Fund. |
| | |
See Notes to Financial Statements. |
| |
18 | SEPTEMBER 30, 2019 |
Janus Henderson Emerging Markets Fund
Financial Highlights
| | | | | | | | | | | | | |
Class D Shares | | | | | | | | | |
For a share outstanding during the year or period ended September 30 | | 2019 | | | 2018 | | | 2017(1) | |
| | Net Asset Value, Beginning of Period | | $9.53 | | | $10.41 | | | $10.24 | |
| | Income/(Loss) from Investment Operations: | | | | | | | | | |
| | | Net investment income/(loss)(2) | | 0.14 | | | 0.11 | | | 0.04 | |
| | | Net realized and unrealized gain/(loss) | | (0.59) | | | (0.67) | | | 0.13 | |
| | Total from Investment Operations | | (0.45) | | | (0.56) | | | 0.17 | |
| | Less Dividends and Distributions: | | | | | | | | | |
| | | Dividends (from net investment income) | | (0.12) | | | (0.11) | | | — | |
| | | Distributions (from capital gains) | | (0.18) | | | (0.21) | | | — | |
| | Total Dividends and Distributions | | (0.30) | | | (0.32) | | | — | |
| | Net Asset Value, End of Period | | $8.78 | | | $9.53 | | | $10.41 | |
| | Total Return* | | (4.59)%(3) | | | (5.64)% | | | 1.66% | |
| | Net Assets, End of Period (in thousands) | | $10,957 | | | $13,104 | | | $16,053 | |
| | Average Net Assets for the Period (in thousands) | | $12,337 | | | $15,607 | | | $16,501 | |
| | Ratios to Average Net Assets**: | | | | | | | | | |
| | | Ratio of Gross Expenses | | 1.80% | | | 1.38% | | | 1.80% | |
| | | Ratio of Net Expenses (After Waivers and Expense Offsets) | | 1.19% | | | 1.15% | | | 1.46% | |
| | | Ratio of Net Investment Income/(Loss) | | 1.51% | | | 1.08% | | | 2.18% | |
| | Portfolio Turnover Rate | | 68% | | | 26% | | | 2% | |
| | | | | | | | | | | | | |
| | | | | | | | | | | | | |
Class I Shares | | | | | | | | | |
For a share outstanding during the year or period ended September 30 | | 2019 | | | 2018 | | | 2017(1) | |
| | Net Asset Value, Beginning of Period | | $9.52 | | | $10.42 | | | $10.24 | |
| | Income/(Loss) from Investment Operations: | | | | | | | | | |
| | | Net investment income/(loss)(2) | | 0.14 | | | 0.12 | | | 0.04 | |
| | | Net realized and unrealized gain/(loss) | | (0.57) | | | (0.69) | | | 0.14 | |
| | Total from Investment Operations | | (0.43) | | | (0.57) | | | 0.18 | |
| | Less Dividends and Distributions: | | | | | | | | | |
| | | Dividends (from net investment income) | | (0.13) | | | (0.12) | | | — | |
| | | Distributions (from capital gains) | | (0.18) | | | (0.21) | | | — | |
| | Total Dividends and Distributions | | (0.31) | | | (0.33) | | | — | |
| | Net Asset Value, End of Period | | $8.78 | | | $9.52 | | | $10.42 | |
| | Total Return* | | (4.38)%(4) | | | (5.72)% | | | 1.76% | |
| | Net Assets, End of Period (in thousands) | | $34,499 | | | $107,276 | | | $112,952 | |
| | Average Net Assets for the Period (in thousands) | | $71,330 | | | $119,036 | | | $110,859 | |
| | Ratios to Average Net Assets**: | | | | | | | | | |
| | | Ratio of Gross Expenses | | 1.45% | | | 1.26% | | | 1.49% | |
| | | Ratio of Net Expenses (After Waivers and Expense Offsets) | | 1.13% | | | 1.09% | | | 1.20% | |
| | | Ratio of Net Investment Income/(Loss) | | 1.49% | | | 1.17% | | | 2.42% | |
| | Portfolio Turnover Rate | | 68% | | | 26% | | | 2% | |
| | | | | | | | | | | | | |
| |
* Total return includes adjustments in accordance with generally accepted accounting principles required at the year or period end and are not annualized for periods of less than one full year. ** Annualized for periods of less than one full year. (1) Period from August 1, 2017 through September 30, 2017. The Fund changed its fiscal year end from July 31 to September 30. (2) Per share amounts are calculated based on average shares outstanding during the year or period. (3) Total return without the effect of affiliated payments would have been (4.82)%. Please see Note 3 in the Notes to the Financial Statements. (4) Total return without the effect of affiliated payments would have been (4.61)%. Please see Note 3 in the Notes to the Financial Statements. |
| | |
See Notes to Financial Statements. |
| |
Janus Investment Fund | 19 |
Janus Henderson Emerging Markets Fund
Financial Highlights
| | | | | | | |
Class D Shares | | | |
For a share outstanding during the period ended July 31 | | 2017(1) | |
| | Net Asset Value, Beginning of Period | | $10.05 | |
| | Income/(Loss) from Investment Operations: | | | |
| | | Net investment income/(loss)(2) | | 0.07 | |
| | | Net realized and unrealized gain/(loss) | | 0.12 | |
| | Total from Investment Operations | | 0.19 | |
| | Less Dividends and Distributions: | | | |
| | | Dividends (from net investment income) | | — | |
| | Total Dividends and Distributions | | — | |
| | Net Asset Value, End of Period | | $10.24 | |
| | Total Return* | | 1.89% | |
| | Net Assets, End of Period (in thousands) | | $16,527 | |
| | Average Net Assets for the Period (in thousands) | | $14,711 | |
| | Ratios to Average Net Assets**: | | | |
| | | Ratio of Gross Expenses | | 1.35% | |
| | | Ratio of Net Expenses (After Waivers and Expense Offsets) | | 1.32% | |
| | | Ratio of Net Investment Income/(Loss) | | 4.63% | |
| | Portfolio Turnover Rate | | 32% | |
| | | | | | | |
| | | | | | | | | | | | | |
Class I Shares | | | | | | | | | |
For a share outstanding during the year ended July 31 | | 2017 | | | 2016 | | | 2015 | |
| | Net Asset Value, Beginning of Period | | $9.13 | | | $8.63 | | | $9.86 | |
| | Income/(Loss) from Investment Operations: | | | | | | | | | |
| | | Net investment income/(loss)(2) | | 0.15 | | | 0.13 | | | 0.03 | |
| | | Net realized and unrealized gain/(loss) | | 1.03 | | | 0.42 | | | (1.25) | |
| | Total from Investment Operations | | 1.18 | | | 0.55 | | | (1.22) | |
| | Less Dividends and Distributions: | | | | | | | | | |
| | | Dividends (from net investment income) | | (0.07) | | | (0.05) | | | (0.01) | |
| | Total Dividends and Distributions | | (0.07) | | | (0.05) | | | (0.01) | |
| | Net Asset Value, End of Period | | $10.24 | | | $9.13 | | | $8.63 | |
| | Total Return* | | 13.15% | | | 6.41% | | | (12.34)% | |
| | Net Assets, End of Period (in thousands) | | $107,513 | | | $36,815 | | | $12,652 | |
| | Average Net Assets for the Period (in thousands) | | $62,396 | | | $21,242 | | | $15,071 | |
| | Ratios to Average Net Assets**: | | | | | | | | | |
| | | Ratio of Gross Expenses | | 1.46% | | | 2.09%(3) | | | 1.85% | |
| | | Ratio of Net Expenses (After Waivers and Expense Offsets) | | 1.27% | | | 1.54% | | | 1.54% | |
| | | Ratio of Net Investment Income/(Loss) | | 1.63% | | | 1.52% | | | 0.37% | |
| | Portfolio Turnover Rate | | 32% | | | 86% | | | 148% | |
| | | | | | | | | | | | | |
| |
* Total return not annualized for periods of less than one full year. ** Annualized for periods of less than one full year. (1) Period from June 5, 2017 (inception date) through July 31, 2017. (2) Per share amounts are calculated based on average shares outstanding during the year or period. (3) The Ratio of Gross Expenses include a reimbursement of prior period custodian out-of-pocket expenses. The Ratio of Gross Expenses would have been 0.07% higher had the custodian not reimbursed the Fund. |
| | |
See Notes to Financial Statements. |
| |
20 | SEPTEMBER 30, 2019 |
Janus Henderson Emerging Markets Fund
Financial Highlights
| | | | | | | | | | | | | |
Class N Shares | | | | | | | | | |
For a share outstanding during the year or period ended September 30 | | 2019 | | | 2018 | | | 2017(1) | |
| | Net Asset Value, Beginning of Period | | $9.53 | | | $10.42 | | | $10.24 | |
| | Income/(Loss) from Investment Operations: | | | | | | | | | |
| | | Net investment income/(loss)(2) | | 0.15 | | | 0.12 | | | 0.05 | |
| | | Net realized and unrealized gain/(loss) | | (0.57) | | | (0.68) | | | 0.13 | |
| | Total from Investment Operations | | (0.42) | | | (0.56) | | | 0.18 | |
| | Less Dividends and Distributions: | | | | | | | | | |
| | | Dividends (from net investment income) | | (0.14) | | | (0.12) | | | — | |
| | | Distributions (from capital gains) | | (0.18) | | | (0.21) | | | — | |
| | Total Dividends and Distributions | | (0.32) | | | (0.33) | | | — | |
| | Net Asset Value, End of Period | | $8.79 | | | $9.53 | | | $10.42 | |
| | Total Return* | | (4.33)%(3) | | | (5.63)% | | | 1.76% | |
| | Net Assets, End of Period (in thousands) | | $16,531 | | | $25,134 | | | $41,206 | |
| | Average Net Assets for the Period (in thousands) | | $21,520 | | | $29,832 | | | $41,394 | |
| | Ratios to Average Net Assets**: | | | | | | | | | |
| | | Ratio of Gross Expenses | | 1.41% | | | 1.20% | | | 1.35% | |
| | | Ratio of Net Expenses (After Waivers and Expense Offsets) | | 1.03% | | | 1.03% | | | 1.05% | |
| | | Ratio of Net Investment Income/(Loss) | | 1.65% | | | 1.15% | | | 2.59% | |
| | Portfolio Turnover Rate | | 68% | | | 26% | | | 2% | |
| | | | | | | | | | | | | |
| | | | | | | | | | | | | |
Class S Shares | | | | | | | | | |
For a share outstanding during the year or period ended September 30 | | 2019 | | | 2018 | | | 2017(1) | |
| | Net Asset Value, Beginning of Period | | $9.51 | | | $10.41 | | | $10.23 | |
| | Income/(Loss) from Investment Operations: | | | | | | | | | |
| | | Net investment income/(loss)(2) | | 0.08 | | | 0.13 | | | 0.04 | |
| | | Net realized and unrealized gain/(loss) | | (0.52) | | | (0.73) | | | 0.14 | |
| | Total from Investment Operations | | (0.44) | | | (0.60) | | | 0.18 | |
| | Less Dividends and Distributions: | | | | | | | | | |
| | | Dividends (from net investment income) | | (0.08) | | | (0.09) | | | — | |
| | | Distributions (from capital gains) | | (0.18) | | | (0.21) | | | — | |
| | Total Dividends and Distributions | | (0.26) | | | (0.30) | | | — | |
| | Net Asset Value, End of Period | | $8.81 | | | $9.51 | | | $10.41 | |
| | Total Return* | | (4.49)%(4) | | | (5.98)% | | | 1.76% | |
| | Net Assets, End of Period (in thousands) | | $77 | | | $1,753 | | | $316 | |
| | Average Net Assets for the Period (in thousands) | | $488 | | | $1,189 | | | $311 | |
| | Ratios to Average Net Assets**: | | | | | | | | | |
| | | Ratio of Gross Expenses | | 2.25% | | | 1.85% | | | 1.91% | |
| | | Ratio of Net Expenses (After Waivers and Expense Offsets) | | 1.18% | | | 1.47% | | | 1.51% | |
| | | Ratio of Net Investment Income/(Loss) | | 0.89% | | | 1.28% | | | 2.11% | |
| | Portfolio Turnover Rate | | 68% | | | 26% | | | 2% | |
| | | | | | | | | | | | | |
| |
* Total return includes adjustments in accordance with generally accepted accounting principles required at the year or period end and are not annualized for periods of less than one full year. ** Annualized for periods of less than one full year. (1) Period from August 1, 2017 through September 30, 2017. The Fund changed its fiscal year end from July 31 to September 30. (2) Per share amounts are calculated based on average shares outstanding during the year or period. (3) Total return without the effect of affiliated payments would have been (4.56)%. Please see Note 3 in the Notes to the Financial Statements. (4) Total return without the effect of affiliated payments would have been (4.72)%. Please see Note 3 in the Notes to the Financial Statements. |
| | |
See Notes to Financial Statements. |
| |
Janus Investment Fund | 21 |
Janus Henderson Emerging Markets Fund
Financial Highlights
| | | | | | | | | | |
Class N Shares | | | | | | |
For a share outstanding during the year or period ended July 31 | | 2017 | | | 2016(1) | |
| | Net Asset Value, Beginning of Period | | $9.13 | | | $8.06 | |
| | Income/(Loss) from Investment Operations: | | | | | | |
| | | Net investment income/(loss)(2) | | 0.40 | | | 0.06 | |
| | | Net realized and unrealized gain/(loss) | | 0.79 | | | 1.06 | |
| | Total from Investment Operations | | 1.19 | | | 1.12 | |
| | Less Dividends and Distributions: | | | | | | |
| | | Dividends (from net investment income) | | (0.08) | | | (0.05) | |
| | Total Dividends and Distributions | | (0.08) | | | (0.05) | |
| | Net Asset Value, End of Period | | $10.24 | | | $9.13 | |
| | Total Return* | | 13.17% | | | 13.92% | |
| | Net Assets, End of Period (in thousands) | | $40,785 | | | $318 | |
| | Average Net Assets for the Period (in thousands) | | $6,417 | | | $282 | |
| | Ratios to Average Net Assets**: | | | | | | |
| | | Ratio of Gross Expenses | | 1.32% | | | 2.17%(3) | |
| | | Ratio of Net Expenses (After Waivers and Expense Offsets) | | 1.24% | | | 1.54% | |
| | | Ratio of Net Investment Income/(Loss) | | 4.20% | | | 1.07% | |
| | Portfolio Turnover Rate | | 32% | | | 86% | |
| | | | | | | | | | |
| | | | | | | |
Class S Shares | | | |
For a share outstanding during the period ended July 31 | | 2017(4) | |
| | Net Asset Value, Beginning of Period | | $10.05 | |
| | Income/(Loss) from Investment Operations: | | | |
| | | Net investment income/(loss)(2) | | 0.07 | |
| | | Net realized and unrealized gain/(loss) | | 0.11 | |
| | Total from Investment Operations | | 0.18 | |
| | Less Dividends and Distributions: | | | |
| | | Dividends (from net investment income) | | — | |
| | Total Dividends and Distributions | | — | |
| | Net Asset Value, End of Period | | $10.23 | |
| | Total Return* | | 1.79% | |
| | Net Assets, End of Period (in thousands) | | $304 | |
| | Average Net Assets for the Period (in thousands) | | $266 | |
| | Ratios to Average Net Assets**: | | | |
| | | Ratio of Gross Expenses | | 1.69% | |
| | | Ratio of Net Expenses (After Waivers and Expense Offsets) | | 1.59% | |
| | | Ratio of Net Investment Income/(Loss) | | 4.51% | |
| | Portfolio Turnover Rate | | 32% | |
| | | | | | | |
| |
* Total return not annualized for periods of less than one full year. ** Annualized for periods of less than one full year. (1) Period from November 30, 2015 (inception date) through July 31, 2016. (2) Per share amounts are calculated based on average shares outstanding during the year or period. (3) The Ratio of Gross Expenses include a reimbursement of prior period custodian out-of-pocket expenses. The Ratio of Gross Expenses would have been 0.07% higher had the custodian not reimbursed the Fund. (4) Period from June 5, 2017 (inception date) through July 31, 2017. |
| | |
See Notes to Financial Statements. |
| |
22 | SEPTEMBER 30, 2019 |
Janus Henderson Emerging Markets Fund
Financial Highlights
| | | | | | | | | | | | | |
Class T Shares | | | | | | | | | |
For a share outstanding during the year or period ended September 30 | | 2019 | | | 2018 | | | 2017(1) | |
| | Net Asset Value, Beginning of Period | | $9.52 | | | $10.42 | | | $10.24 | |
| | Income/(Loss) from Investment Operations: | | | | | | | | | |
| | | Net investment income/(loss)(2) | | 0.13 | | | 0.10 | | | 0.04 | |
| | | Net realized and unrealized gain/(loss) | | (0.57) | | | (0.68) | | | 0.14 | |
| | Total from Investment Operations | | (0.44) | | | (0.58) | | | 0.18 | |
| | Less Dividends and Distributions: | | | | | | | | | |
| | | Dividends (from net investment income) | | (0.12) | | | (0.11) | | | — | |
| | | Distributions (from capital gains) | | (0.18) | | | (0.21) | | | — | |
| | Total Dividends and Distributions | | (0.30) | | | (0.32) | | | — | |
| | Net Asset Value, End of Period | | $8.78 | | | $9.52 | | | $10.42 | |
| | Total Return* | | (4.56)%(3) | | | (5.86)% | | | 1.76% | |
| | Net Assets, End of Period (in thousands) | | $3,008 | | | $4,862 | | | $7,770 | |
| | Average Net Assets for the Period (in thousands) | | $4,046 | | | $7,275 | | | $7,786 | |
| | Ratios to Average Net Assets**: | | | | | | | | | |
| | | Ratio of Gross Expenses | | 1.73% | | | 1.45% | | | 1.62% | |
| | | Ratio of Net Expenses (After Waivers and Expense Offsets) | | 1.27% | | | 1.26% | | | 1.30% | |
| | | Ratio of Net Investment Income/(Loss) | | 1.41% | | | 0.93% | | | 2.34% | |
| | Portfolio Turnover Rate | | 68% | | | 26% | | | 2% | |
| | | | | | | | | | | | | |
| |
* Total return includes adjustments in accordance with generally accepted accounting principles required at the year or period end and are not annualized for periods of less than one full year. ** Annualized for periods of less than one full year. (1) Period from August 1, 2017 through September 30, 2017. The Fund changed its fiscal year end from July 31 to September 30. (2) Per share amounts are calculated based on average shares outstanding during the year or period. (3) Total return without the effect of affiliated payments would have been (4.79)%. Please see Note 3 in the Notes to the Financial Statements. |
| | |
See Notes to Financial Statements. |
| |
Janus Investment Fund | 23 |
Janus Henderson Emerging Markets Fund
Financial Highlights
| | | | | | | |
Class T Shares | | | |
For a share outstanding during the period ended July 31 | | 2017(1) | |
| | Net Asset Value, Beginning of Period | | $10.05 | |
| | Income/(Loss) from Investment Operations: | | | |
| | | Net investment income/(loss)(2) | | 0.08 | |
| | | Net realized and unrealized gain/(loss) | | 0.11 | |
| | Total from Investment Operations | | 0.19 | |
| | Less Dividends and Distributions: | | | |
| | | Dividends (from net investment income) | | — | |
| | Total Dividends and Distributions | | — | |
| | Net Asset Value, End of Period | | $10.24 | |
| | Total Return* | | 1.89% | |
| | Net Assets, End of Period (in thousands) | | $7,629 | |
| | Average Net Assets for the Period (in thousands) | | $6,024 | |
| | Ratios to Average Net Assets**: | | | |
| | | Ratio of Gross Expenses | | 1.42% | |
| | | Ratio of Net Expenses (After Waivers and Expense Offsets) | | 1.38% | |
| | | Ratio of Net Investment Income/(Loss) | | 5.01% | |
| | Portfolio Turnover Rate | | 32% | |
| | | | | | | |
| |
* Total return not annualized for periods of less than one full year. ** Annualized for periods of less than one full year. (1) Period from June 5, 2017 (inception date) through July 31, 2017. (2) Per share amounts are calculated based on average shares outstanding during the year or period. |
| | |
See Notes to Financial Statements. |
| |
24 | SEPTEMBER 30, 2019 |
Janus Henderson Emerging Markets Fund
Notes to Financial Statements
1. Organization and Significant Accounting Policies
Janus Henderson Emerging Markets Fund (the “Fund”) is a series of Janus Investment Fund (the “Trust”), which is organized as a Massachusetts business trust and is registered under the Investment Company Act of 1940, as amended (the “1940 Act”), as an open-end management investment company, and therefore has applied the specialized accounting and reporting guidance in Financial Accounting Standards Board (“FASB”) Accounting Standards Codification (“ASC”) Topic 946. The Trust offers 47 funds, each of which offers multiple share classes, with differing investment objectives and policies. The Fund seeks long-term growth of capital. The Fund is classified as diversified, as defined in the 1940 Act.
Pursuant to the Agreement and Plan of Reorganization, the Fund acquired all the assets and liabilities of the Henderson Emerging Markets Fund (the “Predecessor Fund”), a series of Henderson Global Funds, in exchange for Class A, Class C, Class I and Class N Fund shares having an aggregate net asset value equal to the value of the aggregate net assets of the same share class of the Predecessor Fund (except that Class R6 Predecessor Fund shares were exchanged for Class N Fund shares) (the “Reorganization”). The Reorganization occurred at the close of business on June 2, 2017.
The Predecessor Fund and the Fund had identical investment objectives and substantially similar investment policies and principal risks. For financial reporting purposes, the Predecessor Fund’s financial and performance history prior to the Reorganization is carried forward and reflected in the Fund’s financial highlights.
The last fiscal year end of the Predecessor Fund was July 31, 2016. The Fund's last fiscal year end was July 31, 2017. Subsequent to July 31, 2017, the Fund changed its fiscal year end to September 30, 2017, to reflect the fiscal year end of certain funds of the Trust.
The Fund offers multiple classes of shares in order to meet the needs of various types of investors. Each class represents an interest in the same portfolio of investments. Certain financial intermediaries may not offer all classes of shares. Class D Shares are closed to certain new investors.
Class A Shares are offered through financial intermediary platforms including, but not limited to, traditional brokerage platforms, mutual fund wrap fee programs, bank trust platforms, and retirement platforms.
Class C Shares are offered through financial intermediary platforms including, but not limited to, traditional brokerage platforms, mutual fund wrap fee programs, and bank trust platforms.
Class C Shares are closed to investments by new employer-sponsored retirement plans and existing employer-sponsored retirement plans are no longer able to make additional purchases or exchanges into Class C Shares.
The Funds have adopted an auto-conversion policy pursuant to which Class C Shares that have been held for ten years will be automatically converted to Class A Shares without the imposition of any sales charge, fee or other charge. The conversion will generally occur no later than ten business days in the month following the month of the tenth anniversary of the date of purchase. Class C Shares purchased through the reinvestment of dividends and other distributions on Class C Shares will convert to Class A Shares at the same time as the Class C Shares with respect to which they were purchased. For Class C Shares held in omnibus accounts on intermediary platforms, the Fund will rely on these intermediaries to implement this conversion feature. Your financial intermediary may have separate policies and procedures as to when and how Class C Shares may be converted to Class A Shares. Please contact your financial intermediary for additional information.
Class D Shares are generally no longer being made available to new investors who do not already have a direct account with the Janus Henderson funds. Class D Shares are available only to investors who hold accounts directly with the Janus Henderson funds, to immediate family members or members of the same household of an eligible individual investor, and to existing beneficial owners of sole proprietorships or partnerships that hold accounts directly with the Janus Henderson funds.
Class I Shares are available through certain financial intermediary platforms including, but not limited to, mutual fund wrap fee programs, managed account programs, asset allocation programs, bank trust platforms, as well as certain retirement platforms. Class I Shares are also available to certain direct institutional investors including, but not limited to, corporations, certain retirement plans, public plans, and foundations/endowments, who established Class I Share accounts before August 4, 2017.
Janus Henderson Emerging Markets Fund
Notes to Financial Statements
Class N Shares are generally available only to financial intermediaries purchasing on behalf of: 1) certain adviser-assisted, employer-sponsored retirement plans, including 401(k) plans, 457 plans, 403(b) plans, Taft-Hartley multi-employer plans, profit-sharing and money purchase pension plans, defined benefit plans and certain welfare benefit plans, such as health savings accounts, and nonqualified deferred compensation plans; and 2) retail investors purchasing in qualified or nonqualified accounts, whose accounts are held through an omnibus account at their financial intermediary, and where the financial intermediary requires no payment or reimbursement from the Fund, Janus Capital Management LLC (“Janus Capital”), or its affiliates. Class N Shares are also available to Janus Henderson proprietary products and to certain direct institutional investors approved by Janus Distributors LLC dba Janus Henderson Distributors (“Janus Henderson Distributors”) including, but not limited to, corporations, certain retirement plans, public plans, and foundations and endowments, subject to minimum investment requirements.
Class S Shares are offered through financial intermediary platforms including, but not limited to, retirement platforms and asset allocation, mutual fund wrap, or other discretionary or nondiscretionary fee-based investment advisory programs. In addition, Class S Shares may be available through certain financial intermediaries who have an agreement with Janus Capital or its affiliates to offer Class S Shares on their supermarket platforms.
Class T Shares are available through certain financial intermediary platforms including, but not limited to, mutual fund wrap fee programs, managed account programs, asset allocation programs, bank trust platforms, as well as certain retirement platforms. In addition, Class T Shares may be available through certain financial intermediaries who have an agreement with Janus Capital or its affiliates to offer Class T Shares on their supermarket platforms.
The following accounting policies have been followed by the Fund and are in conformity with accounting principles generally accepted in the United States of America.
Investment Valuation
Securities held by the Fund are valued in accordance with policies and procedures established by and under the supervision of the Trustees (the “Valuation Procedures”). Equity securities traded on a domestic securities exchange are generally valued at the closing prices on the primary market or exchange on which they trade. If such price is lacking for the trading period immediately preceding the time of determination, such securities are valued at their current bid price. Equity securities that are traded on a foreign exchange are generally valued at the closing prices on such markets. In the event that there is no current trading volume on a particular security in such foreign exchange, the bid price from the primary exchange is generally used to value the security. Securities that are traded on the over-the-counter (“OTC”) markets are generally valued at their closing or latest bid prices as available. Foreign securities and currencies are converted to U.S. dollars using the applicable exchange rate in effect at the close of the New York Stock Exchange (“NYSE”). The Fund will determine the market value of individual securities held by it by using prices provided by one or more approved professional pricing services or, as needed, by obtaining market quotations from independent broker-dealers. Most debt securities are valued in accordance with the evaluated bid price supplied by the pricing service that is intended to reflect market value. The evaluated bid price supplied by the pricing service is an evaluation that may consider factors such as security prices, yields, maturities and ratings. Certain short-term securities maturing within 60 days or less may be evaluated and valued on an amortized cost basis provided that the amortized cost determined approximates market value. Securities for which market quotations or evaluated prices are not readily available or deemed unreliable are valued at fair value determined in good faith under the Valuation Procedures. Circumstances in which fair value pricing may be utilized include, but are not limited to: (i) a significant event that may affect the securities of a single issuer, such as a merger, bankruptcy, or significant issuer-specific development; (ii) an event that may affect an entire market, such as a natural disaster or significant governmental action; (iii) a nonsignificant event such as a market closing early or not opening, or a security trading halt; and (iv) pricing of a nonvalued security and a restricted or nonpublic security. Special valuation considerations may apply with respect to “odd-lot” fixed-income transactions which, due to their small size, may receive evaluated prices by pricing services which reflect a large block trade and not what actually could be obtained for the odd-lot position. The Fund uses systematic fair valuation models provided by independent third parties to value international equity securities in order to adjust for stale pricing, which may occur between the close of certain foreign exchanges and the close of the NYSE.
Valuation Inputs Summary
FASB ASC 820, Fair Value Measurements and Disclosures (“ASC 820”), defines fair value, establishes a framework for measuring fair value, and expands disclosure requirements regarding fair value measurements. This standard emphasizes that fair value is a market-based measurement that should be determined based on the assumptions that
Janus Henderson Emerging Markets Fund
Notes to Financial Statements
market participants would use in pricing an asset or liability and establishes a hierarchy that prioritizes inputs to valuation techniques used to measure fair value. These inputs are summarized into three broad levels:
Level 1 – Unadjusted quoted prices in active markets the Fund has the ability to access for identical assets or liabilities.
Level 2 – Observable inputs other than unadjusted quoted prices included in Level 1 that are observable for the asset or liability either directly or indirectly. These inputs may include quoted prices for the identical instrument on an inactive market, prices for similar instruments, interest rates, prepayment speeds, credit risk, yield curves, default rates and similar data.
Assets or liabilities categorized as Level 2 in the hierarchy generally include: debt securities fair valued in accordance with the evaluated bid or ask prices supplied by a pricing service; securities traded on OTC markets and listed securities for which no sales are reported that are fair valued at the latest bid price (or yield equivalent thereof) obtained from one or more dealers transacting in a market for such securities or by a pricing service approved by the Fund’s Trustees; certain short-term debt securities with maturities of 60 days or less that are fair valued at amortized cost; and equity securities of foreign issuers whose fair value is determined by using systematic fair valuation models provided by independent third parties in order to adjust for stale pricing which may occur between the close of certain foreign exchanges and the close of the NYSE. Other securities that may be categorized as Level 2 in the hierarchy include, but are not limited to, preferred stocks, bank loans, swaps, investments in unregistered investment companies, options, and forward contracts.
Level 3 – Unobservable inputs for the asset or liability to the extent that relevant observable inputs are not available, representing the Fund’s own assumptions about the assumptions that a market participant would use in valuing the asset or liability, and that would be based on the best information available.
There have been no significant changes in valuation techniques used in valuing any such positions held by the Fund since the beginning of the fiscal year.
The inputs or methodology used for fair valuing securities are not necessarily an indication of the risk associated with investing in those securities. The summary of inputs used as of September 30, 2019 to fair value the Fund’s investments in securities and other financial instruments is included in the “Valuation Inputs Summary” in the Notes to Schedule of Investments and Other Information.
The Fund did not hold a significant amount of Level 3 securities as of September 30, 2019.
Investment Transactions and Investment Income
Investment transactions are accounted for as of the date purchased or sold (trade date). Dividend income is recorded on the ex-dividend date. Certain dividends from foreign securities will be recorded as soon as the Fund is informed of the dividend, if such information is obtained subsequent to the ex-dividend date. Dividends from foreign securities may be subject to withholding taxes in foreign jurisdictions. Interest income is recorded daily on an accrual basis and includes amortization of premiums and accretion of discounts. The Fund classifies gains and losses on prepayments received as an adjustment to interest income. Debt securities may be placed in non-accrual status and related interest income may be reduced by stopping current accruals and writing off interest receivables when collection of all or a portion of interest has become doubtful. Gains and losses are determined on the identified cost basis, which is the same basis used for federal income tax purposes. Income, as well as gains and losses, both realized and unrealized, are allocated daily to each class of shares based upon the ratio of net assets represented by each class as a percentage of total net assets.
Expenses
The Fund bears expenses incurred specifically on its behalf. Each class of shares bears a portion of general expenses, which are allocated daily to each class of shares based upon the ratio of net assets represented by each class as a percentage of total net assets. Expenses directly attributable to a specific class of shares are charged against the operations of such class.
Estimates
The preparation of financial statements in conformity with accounting principles generally accepted in the United States of America requires management to make estimates and assumptions that affect the reported amount of assets and
Janus Henderson Emerging Markets Fund
Notes to Financial Statements
liabilities and disclosure of contingent assets and liabilities at the date of the financial statements, and the reported amounts of income and expenses during the reporting period. Actual results could differ from those estimates.
Indemnifications
In the normal course of business, the Fund may enter into contracts that contain provisions for indemnification of other parties against certain potential liabilities. The Fund’s maximum exposure under these arrangements is unknown, and would involve future claims that may be made against the Fund that have not yet occurred. Currently, the risk of material loss from such claims is considered remote.
Foreign Currency Translations
The Fund does not isolate that portion of the results of operations resulting from the effect of changes in foreign exchange rates on investments from the fluctuations arising from changes in market prices of securities held at the date of the financial statements. Net unrealized appreciation or depreciation of investments and foreign currency translations arise from changes in the value of assets and liabilities, including investments in securities held at the date of the financial statements, resulting from changes in the exchange rates and changes in market prices of securities held.
Currency gains and losses are also calculated on payables and receivables that are denominated in foreign currencies. The payables and receivables are generally related to foreign security transactions and income translations.
Foreign currency-denominated assets and forward currency contracts may involve more risks than domestic transactions, including currency risk, counterparty risk, political and economic risk, regulatory risk and equity risk. Risks may arise from unanticipated movements in the value of foreign currencies relative to the U.S. dollar.
Dividends and Distributions
The Fund generally declares and distributes dividends of net investment income and realized capital gains (if any) annually. The Fund may treat a portion of the amount paid to redeem shares as a distribution of investment company taxable income and realized capital gains that are reflected in the net asset value. This practice, commonly referred to as “equalization,” has no effect on the redeeming shareholder or a Fund’s total return, but may reduce the amounts that would otherwise be required to be paid as taxable dividends to the remaining shareholders. It is possible that the Internal Revenue Service (IRS) could challenge the Funds’ equalization methodology or calculations, and any such challenge could result in additional tax, interest, or penalties to be paid by the Fund.
Federal Income Taxes
The Fund intends to continue to qualify as a regulated investment company and distribute all of its taxable income in accordance with the requirements of Subchapter M of the Internal Revenue Code. Management has analyzed the Fund’s tax positions taken for all open federal income tax years, generally a three-year period, and has concluded that no provision for federal income tax is required in the Fund’s financial statements. The Fund is not aware of any tax positions for which it is reasonably possible that the total amounts of unrecognized tax benefits will significantly change in the next twelve months.
2. Other Investments and Strategies
Additional Investment Risk
In the aftermath of the 2007-2008 financial crisis, the financial sector experienced reduced liquidity in credit and other fixed-income markets, and an unusually high degree of volatility, both domestically and internationally. In response to the crisis, the United States and certain foreign governments, along with the U.S. Federal Reserve and certain foreign central banks, took steps to support the financial markets. For example, the enactment of the Dodd-Frank Act in 2010 provided for widespread regulation of financial institutions, consumer financial products and services, broker-dealers, over-the-counter derivatives, investment advisers, credit rating agencies, and mortgage lending, which expanded federal oversight in the financial sector, including the investment management industry. The withdrawal of this support, a failure of measures put in place to respond to the crisis, or investor perception that such efforts were not sufficient could each negatively affect financial markets generally, and the value and liquidity of specific securities. In addition, policy and legislative changes in the United States and in other countries continue to impact many aspects of financial regulation.
A number of countries in the European Union (“EU”) have experienced, and may continue to experience, severe economic and financial difficulties. In particular, many EU nations are susceptible to economic risks associated with high levels of debt. Many non-governmental issuers, and even certain governments, have defaulted on, or been forced to restructure, their debts. Many other issuers have faced difficulties obtaining credit or refinancing existing obligations.
Janus Henderson Emerging Markets Fund
Notes to Financial Statements
Financial institutions have in many cases required government or central bank support, have needed to raise capital, and/or have been impaired in their ability to extend credit. As a result, financial markets in the EU experienced extreme volatility and declines in asset values and liquidity. Responses to these financial problems by European governments, central banks, and others, including austerity measures and reforms, may not work, may result in social unrest, and may limit future growth and economic recovery or have other unintended consequences. The risk of investing in securities in the European markets may also be heightened due to the referendum in which the United Kingdom voted to exit the EU (commonly known as “Brexit”). There is considerable uncertainty about how Brexit will be conducted, how negotiations of necessary treaties and trade agreements will conclude, or how financial markets will react.
Certain areas of the world have historically been prone to and economically sensitive to environmental events such as, but not limited to, hurricanes, earthquakes, typhoons, flooding, tidal waves, tsunamis, erupting volcanoes, wildfires or droughts, tornadoes, mudslides, or other weather-related phenomena. Such disasters, and the resulting physical or economic damage, could have a severe and negative impact on the Fund’s investment portfolio and, in the longer term, could impair the ability of issuers in which the Fund invests to conduct their businesses as they would under normal conditions. Adverse weather conditions may also have a particularly significant negative effect on issuers in the agricultural sector and on insurance companies that insure against the impact of natural disasters.
Emerging Market Investing
Within the parameters of its specific investment policies, the Fund may invest in securities of issuers or companies from or with exposure to one or more “developing countries” or “emerging market countries.” To the extent that the Fund invests a significant amount of its assets in one or more of these countries, its returns and net asset value may be affected to a large degree by events and economic conditions in such countries. The risks of foreign investing are heightened when investing in emerging markets, which may result in the price of investments in emerging markets experiencing sudden and sharp price swings. In many developing markets, there is less government supervision and regulation of business and industry practices (including the potential lack of strict finance and accounting controls and standards), stock exchanges, brokers, and listed companies, making these investments potentially more volatile in price and less liquid than investments in developed securities markets, resulting in greater risk to investors. There is a risk in developing countries that a future economic or political crisis could lead to price controls, forced mergers of companies, expropriation or confiscatory taxation, imposition or enforcement of foreign ownership limits, seizure, nationalization, sanctions or imposition of restrictions by various governmental entities on investment and trading, or creation of government monopolies, any of which may have a detrimental effect on the Fund’s investments. In addition, the Fund’s investments may be denominated in foreign currencies and therefore, changes in the value of a country’s currency compared to the U.S. dollar may affect the value of the Fund’s investments. To the extent that the Fund invests a significant portion of its assets in the securities of issuers in or companies of a single country or region, it is more likely to be impacted by events or conditions affecting that country or region, which could have a negative impact on the Fund’s performance. Additionally, foreign and emerging market risks, including, but not limited to, price controls, expropriation or confiscatory taxation, imposition or enforcement of foreign ownership limits, nationalization, and restrictions on repatriation of assets may be heightened to the extent the Fund invests in Chinese local market securities.
3. Investment Advisory Agreements and Other Transactions with Affiliates
The Fund pays Janus Capital an investment advisory fee which is calculated daily and paid monthly. The following table reflects the Fund’s contractual investment advisory fee rate (expressed as an annual rate).
| | |
Average Daily Net Assets of the Fund | Contractual Investment Advisory Fee (%) |
First $1 Billion | 1.00 |
Next $1 Billion | 0.90 |
Over $2 Billion | 0.85 |
The Fund’s actual investment advisory fee rate for the reporting period was 1.00% of average annual net assets before any applicable waivers.
Janus Capital has entered into a personnel-sharing arrangement with its foreign (non-U.S.) affiliates, Henderson Global Investors Limited, Henderson Global Investors (Japan) Ltd., and Henderson Global Investors (Singapore) Ltd. (collectively, “HGIL”), pursuant to which HGIL and certain employees of HGIL serve as “associated persons” of Janus
Janus Henderson Emerging Markets Fund
Notes to Financial Statements
Capital. In this capacity, such employees of HGIL are subject to the oversight and supervision of Janus Capital and may provide portfolio management, research, and related services to the Fund on behalf of Janus Capital.
Janus Capital has contractually agreed to waive the advisory fee payable by the Fund or reimburse expenses in an amount equal to the amount, if any, that the Fund’s total annual fund operating expenses, including the investment advisory fee, but excluding the fees payable pursuant to a Rule 12b-1 plan, shareholder servicing fees, such as transfer agency fees (including out-of-pocket costs), administrative services fees and any networking/omnibus/administrative fees payable by any share class, brokerage commissions, interest, dividends, taxes, acquired fund fees and expenses, and extraordinary expenses, exceed the annual rate of 1.03% of the Fund’s average daily net assets. Janus Capital has agreed to continue the waivers until at least February 1, 2020. If applicable, amounts waived and/or reimbursed to the Fund by Janus Capital are disclosed as “Excess Expense Reimbursement and Waivers” on the Statement of Operations.
Janus Services LLC (“Janus Services”), a wholly-owned subsidiary of Janus Capital, is the Fund’s transfer agent. In addition, Janus Services provides or arranges for the provision of certain other administrative services including, but not limited to, recordkeeping, accounting, order processing, and other shareholder services for the Fund. Janus Services is not compensated for its services related to the shares, except for out-of-pocket costs. These amounts are disclosed as “Other transfer agent fees and expenses” on the Statement of Operations.
Certain, but not all, intermediaries may charge administrative fees (such as networking and omnibus) to investors in Class A Shares, Class C Shares, and Class I Shares for administrative services provided on behalf of such investors. These administrative fees are paid by the Class A Shares, Class C Shares, and Class I Shares of the Fund to Janus Services, which uses such fees to reimburse intermediaries. Consistent with the Transfer Agency Agreement between Janus Services and the Fund, Janus Services may negotiate the level, structure, and/or terms of the administrative fees with intermediaries requiring such fees on behalf of the Fund. Janus Capital and its affiliates benefit from an increase in assets that may result from such relationships. The Funds’ Trustees have set limits on fees that the Funds may incur with respect to administrative fees paid for omnibus or networked accounts. Such limits are subject to change by the Trustees in the future. These amounts are disclosed as “Transfer agent networking and omnibus fees” on the Statement of Operations.
Effective July 1, 2019, the Board of Trustees of Janus Investment Fund approved a new administrative fee rate for Class D Shares detailed in the table below.
| | |
Average Daily Net Assets of Class D Shares of the Janus Henderson funds | Administrative Services Fee |
Under $40 billion | 0.12% |
$40 billion – $49.9 billion | 0.10% |
Over $49.9 billion | 0.08% |
The Fund’s actual Class D administrative fee rate was 0.12% for the reporting period.
Prior to July 1, 2019, the Fund’s Class D Shares paid an administrative services fee at an annual rate of 0.12% of the average daily net assets of Class D Shares for shareholder services provided by Janus Services. Janus Services provides or arranges for the provision of shareholder services including, but not limited to, recordkeeping, accounting, answering inquiries regarding accounts, transaction processing, transaction confirmations, and the mailing of prospectuses and shareholder reports. These amounts are disclosed as “Transfer agent administrative fees and expenses” on the Statement of Operations.
Janus Services receives an administrative services fee at an annual rate of up to 0.25% of the average daily net assets of the Fund’s Class S Shares and Class T Shares for providing or procuring administrative services to investors in Class S Shares and Class T Shares of the Fund. Janus Services expects to use all or a significant portion of this fee to compensate retirement plan service providers, broker-dealers, bank trust departments, financial advisors, and other financial intermediaries for providing these services. Janus Services or its affiliates may also pay fees for services provided by intermediaries to the extent the fees charged by intermediaries exceed the 0.25% of net assets charged to Class S Shares and Class T Shares of the Fund. Janus Services may keep certain amounts retained for reimbursement of out-of-pocket costs incurred for servicing clients of Class S Shares and Class T Shares. These amounts are disclosed as “Transfer agent administrative fees and expenses” on the Statement of Operations.
Services provided by these financial intermediaries may include, but are not limited to, recordkeeping, subaccounting, order processing, providing order confirmations, periodic statements, forwarding prospectuses, shareholder reports, and
Janus Henderson Emerging Markets Fund
Notes to Financial Statements
other materials to existing customers, answering inquiries regarding accounts, and other administrative services. Order processing includes the submission of transactions through the National Securities Clearing Corporation (“NSCC”) or similar systems, or those processed on a manual basis with Janus Capital. For all share classes, Janus Services also seeks reimbursement for costs it incurs as transfer agent and for providing servicing.
Janus Services is compensated for its services related to the Fund’s Class D Shares. These amounts are disclosed as “Other transfer agent fees and expenses” on the Statement of Operations.
Under a distribution and shareholder servicing plan (the “Plan”) adopted in accordance with Rule 12b-1 under the 1940 Act, the Fund pays the Trust’s distributor, Janus Henderson Distributors, a wholly-owned subsidiary of Janus Capital, a fee for the sale and distribution and/or shareholder servicing of the Shares at an annual rate of up to 0.25% of the Class A Shares’ average daily net assets, of up to 1.00% of the Class C Shares’ average daily net assets and of up to 0.25% of the Class S Shares’ average daily net assets. Under the terms of the Plan, the Trust is authorized to make payments to Janus Henderson Distributors for remittance to retirement plan service providers, broker-dealers, bank trust departments, financial advisors, and other financial intermediaries, as compensation for distribution and/or shareholder services performed by such entities for their customers who are investors in the Fund. These amounts are disclosed as “12b-1 Distribution and shareholder servicing fees” on the Statement of Operations. Payments under the Plan are not tied exclusively to actual 12b-1 distribution and shareholder service expenses, and the payments may exceed 12b-1 distribution and shareholder service expenses actually incurred. If any of the Fund’s actual 12b-1 distribution and shareholder service expenses incurred during a calendar year are less than the payments made during a calendar year, the Fund will be refunded the difference. Refunds, if any, are included in “12b-1 Distribution and shareholder servicing fees” in the Statement of Operations.
Janus Capital serves as administrator to the Fund pursuant to an administration agreement between Janus Capital and the Trust. Under the administration agreement, Janus Capital is obligated to provide or arrange for the provision of certain administration, compliance, and accounting services to the Fund, including providing office space for the Fund, and is reimbursed by the Fund for certain of its costs in providing these services (to the extent Janus Capital seeks reimbursement and such costs are not otherwise waived). In addition, employees of Janus Capital and/or its affiliates may serve as officers of the Trust. The Fund pays for some or all of the salaries, fees, and expenses of Janus Capital employees and Fund officers, with respect to certain specified administration functions they perform on behalf of the Fund. The Fund pays these costs based on out-of-pocket expenses incurred by Janus Capital, and these costs are separate and apart from advisory fees and other expenses paid in connection with the investment advisory services Janus Capital (or any subadvisor, as applicable) provides to the Fund. These amounts are disclosed as “Affiliated fund administration fees” on the Statement of Operations. In addition, some expenses related to compensation payable to the Fund’s Chief Compliance Officer and certain compliance staff, all of whom are employees of Janus Capital and/or its affiliates, are shared with the Fund. Total compensation of $484,142 was paid to the Chief Compliance Officer and certain compliance staff by the Trust during the year ended September 30, 2019. The Fund's portion is reported as part of “Other expenses” on the Statement of Operations.
The Board of Trustees has adopted a deferred compensation plan (the “Deferred Plan”) for independent Trustees to elect to defer receipt of all or a portion of the annual compensation they are entitled to receive from the Fund. All deferred fees are credited to an account established in the name of the Trustees. The amounts credited to the account then increase or decrease, as the case may be, in accordance with the performance of one or more of the Janus Henderson funds that are selected by the Trustees. The account balance continues to fluctuate in accordance with the performance of the selected fund or funds until final payment of all amounts are credited to the account. The fluctuation of the account balance is recorded by the Fund as unrealized appreciation/(depreciation) and is included as of September 30, 2019 on the Statement of Assets and Liabilities in the asset, “Non-interested Trustees’ deferred compensation,” and liability, “Non-interested Trustees’ deferred compensation fees.” Additionally, the recorded unrealized appreciation/(depreciation) is included in “Unrealized net appreciation/(depreciation) of investments, foreign currency translations and non-interested Trustees’ deferred compensation” on the Statement of Assets and Liabilities. Deferred compensation expenses for the year ended September 30, 2019 are included in “Non-interested Trustees’ fees and expenses” on the Statement of Operations. Trustees are allowed to change their designation of mutual funds from time to time. Amounts will be deferred until distributed in accordance with the Deferred Plan. Deferred fees of $475,338 were paid by the Trust to the Trustees under the Deferred Plan during the year ended September 30, 2019.
Janus Henderson Emerging Markets Fund
Notes to Financial Statements
Any purchases and sales, realized gains/losses and recorded dividends from affiliated investments during the year ended September 30, 2019 can be found in the “Schedules of Affiliated Investments” located in the Schedule of Investments.
Class A Shares include a 5.75% upfront sales charge of the offering price of the Fund. The sales charge is allocated between Janus Henderson Distributors and financial intermediaries. During the year ended September 30, 2019, Janus Henderson Distributors retained upfront sales charges of $602.
A contingent deferred sales charge (“CDSC”) of 1.00% will be deducted with respect to Class A Shares purchased without a sales load and redeemed within 12 months of purchase, unless waived. Any applicable CDSC will be 1.00% of the lesser of the original purchase price or the value of the redemption of the Class A Shares redeemed. During the year ended September 30, 2019, redeeming shareholders of Class A Shares paid CDSCs of $66 to Janus Henderson Distributors.
A CDSC of 1.00% will be deducted with respect to Class C Shares redeemed within 12 months of purchase, unless waived. Any applicable CDSC will be 1.00% of the lesser of the original purchase price or the value of the redemption of the Class C Shares redeemed. During the year ended September 30, 2019, redeeming shareholders of Class C Shares paid CDSCs of $515.
As of September 30, 2019, shares of the Fund were owned by affiliates of Janus Henderson Investors, and/or other funds advised by Janus Henderson, as indicated in the table below:
| | | | | | |
Class | % of Class Owned | | % of Fund Owned | | |
Class A Shares | - | % | - | % | |
Class C Shares | - | | - | | |
Class D Shares | - | | - | | |
Class I Shares | - | | - | | |
Class N Shares | 94 | | 21 | | |
Class S Shares | - | | - | | |
Class T Shares | - | | - | | |
| | | | | | |
In addition, other shareholders, including other funds, individuals, accounts, as well as the Fund’s portfolio manager(s) and/or investment personnel, may from time to time own (beneficially or of record) a significant percentage of the Fund’s Shares and can be considered to “control” the Fund when that ownership exceeds 25% of the Fund’s assets (and which may differ from control as determined in accordance with accounting principles generally accepted in the United States of America).
During the period ended September 30, 2019, Janus Capital made a contribution to the Fund to cover broker commission fees related to registration of foreign securities. The impact of the contribution on total return was 0.23%.
4. Federal Income Tax
The tax components of capital shown in the table below represent: (1) distribution requirements the Fund must satisfy under the income tax regulations; (2) losses or deductions the Fund may be able to offset against income and gains realized in future years; and (3) unrealized appreciation or depreciation of investments for federal income tax purposes (reduced by foreign tax liability).
Other book to tax differences primarily consist of deferred compensation. The Fund has elected to treat gains and losses on forward foreign currency contracts as capital gains and losses, if applicable. Other foreign currency gains and losses on debt instruments are treated as ordinary income for federal income tax purposes pursuant to Section 988 of the Internal Revenue Code.
| | | | | | | | |
| | | | Loss Deferrals | Other Book | Net Tax | |
Undistributed |