Returns quoted are past performance and do not guarantee future results; current performance may be lower or higher. Investment returns and principal value will vary; there may be a gain or loss when shares are sold. For the most recent month-end performance call 800.668.0434 (or 800.525.3713 if you hold shares directly with Janus Henderson) or visit janushenderson.com/performance (or janushenderson.com/allfunds if you hold shares directly with Janus Henderson).
Maximum Offering Price (MOP) returns include the maximum sales charge of 4.75%. Net Asset Value (NAV) returns exclude this charge, which would have reduced returns.
CDSC returns include a 1% contingent deferred sales charge (CDSC) on Shares redeemed within 12 months of purchase. Net Asset Value (NAV) returns exclude this charge, which would have reduced returns.
Net expense ratios reflect the expense waiver, if any, contractually agreed to through at least October 31, 2021.
Performance may be affected by risks that include those associated with non-diversification, portfolio turnover, short sales, potential conflicts of interest, foreign and emerging markets, initial public offerings (IPOs), high-yield and high-risk securities, undervalued, overlooked and smaller capitalization
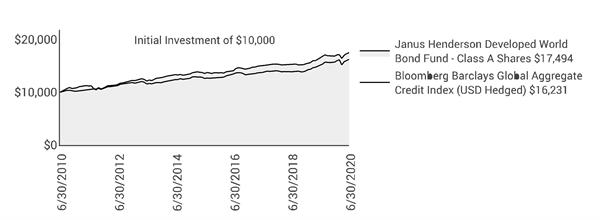
Janus Henderson Developed World Bond Fund (unaudited)
Performance
companies, real estate related securities including Real Estate Investment Trusts (REITs), derivatives, and commodity-linked investments. Each product has different risks. Please see the prospectus for more information about risks, holdings and other details.
The Fund will normally invest at least 80% of its net assets, measured at the time of purchase, in the type of securities described by its name.
Returns include reinvestment of all dividends and distributions and do not reflect the deduction of taxes that a shareholder would pay on Fund distributions or redemptions of Fund shares. The returns do not include adjustments in accordance with generally accepted accounting principles required at the period end for financial reporting purposes.
Returns of the Fund shown prior to June 5, 2017, are those for Henderson Strategic Income Fund (the “Predecessor Fund”), which merged into the Fund after the close of business on June 2, 2017. The Predecessor Fund was advised by Henderson Global Investors (North America) Inc. and subadvised by Henderson Investment Management Limited. Class A Shares, Class C Shares, Class I Shares, and Class R6 Shares of the Predecessor Fund were reorganized into Class A Shares, Class C Shares, Class I Shares, and Class N Shares, respectively, of the Fund. In connection with this reorganization, certain shareholders of the Predecessor Fund who held shares directly with the Predecessor Fund and not through an intermediary had the Class A Shares, Class C Shares, Class I Shares, and Class N Shares of the Fund received in the reorganization automatically exchanged for Class D Shares of the Fund following the reorganization. Class A Shares and Class C Shares of the Predecessor Fund commenced operations with the Predecessor Fund’s inception on September 30, 2003. Class I Shares and Class R6 Shares of the Predecessor Fund commenced operations on April 29, 2011 and November 30, 2015, respectively. Class D Shares, Class S Shares, and Class T Shares commenced operations on June 5, 2017.
Performance of Class A Shares shown for periods prior to June 5, 2017, reflects the performance of Class A Shares of the Predecessor Fund, calculated using the fees and expenses of Class A Shares of the Predecessor Fund, in effect during the periods shown, net of any applicable fee and expense limitations or waivers.
Performance of Class C Shares shown for periods prior to June 5, 2017, reflects the performance of Class C Shares of the Predecessor Fund, calculated using the fees and expenses of Class C Shares of the Predecessor Fund, in effect during the periods shown, net of any applicable fee and expense limitations or waivers.
Performance of Class D Shares shown for periods prior to June 5, 2017, reflects the performance of Class A Shares of the Predecessor Fund, calculated using the fees and expenses of Class A Shares of the Predecessor Fund (without sales charges), net of any applicable fee and expense limitations or waivers.
Performance of Class I Shares shown for periods prior to June 5, 2017, reflects the performance of Class I Shares of the Predecessor Fund, calculated using the fees and expenses of Class I Shares of the Predecessor Fund, in effect during the periods shown, net of any applicable fee and expense limitations or waivers, except that for periods prior to April 29, 2011, performance for Class I Shares reflects the performance of Class A Shares of the Predecessor Fund, calculated using the fees and expenses of Class A Shares of the Predecessor Fund (without sales charges), net of any applicable fee and expense limitations or waivers.
Performance of Class N Shares shown for periods prior to June 5, 2017, reflects the performance of Class R6 Shares of the Predecessor Fund, calculated using the fees and expenses of Class R6 Shares of the Predecessor Fund, in effect during the periods shown, net of any applicable fee and expense limitations or waivers, except that for periods prior to November 30, 2015, performance for Class N Shares reflects the performance of Class A Shares of the Predecessor Fund, calculated using the fees and expenses of Class A Shares of the Predecessor Fund (without sales charges), net of any applicable fee and expense limitations or waivers.
Performance of Class S Shares shown for periods prior to June 5, 2017, reflects the performance of Class A Shares of the Predecessor Fund, calculated using the fees and expenses of Class A Shares of the Predecessor Fund (without sales charges), net of any applicable fee and expense limitations or waivers.
Performance of Class T Shares shown for periods prior to June 5, 2017, reflects the performance of Class A Shares of the Predecessor Fund, calculated using the fees and expenses of Class A Shares of the Predecessor Fund (without sales charges), net of any applicable fee and expense limitations or waivers.
If each share class of the Fund had been available during periods prior to its commencement, the performance shown may have been different. The performance shown for periods following the Fund’s commencement of each share class reflects the fees and expenses of each respective share class, net of any applicable fee and expense limitations or waivers. Please refer to the Fund’s prospectuses for further details concerning historical performance.
Ranking is for the share class shown only; other classes may have different performance characteristics. When an expense waiver is in effect, it may have a material effect on the total return, and therefore the ranking for the period.
© 2020 Morningstar, Inc. All Rights Reserved.
There is no assurance that the investment process will consistently lead to successful investing.
See Notes to Schedule of Investments and Other Information for index definitions.
Index performance does not reflect the expenses of managing a portfolio as an index is unmanaged and not available for direct investment.
See “Useful Information About Your Fund Report.”
*The Predecessor Fund’s inception date – September 30, 2003
‡ As stated in the prospectus. See Financial Highlights for actual expense ratios during the reporting period.
(1) Closed to certain new investors during the reporting period. Effective July 6, 2020, Class D Shares are open to new investors.
Janus Henderson Developed World Bond Fund (unaudited)
Expense Examples
As a shareholder of the Fund, you incur two types of costs: (1) transaction costs, such as sales charges (loads) on purchase payments (applicable to Class A Shares only); and (2) ongoing costs, including management fees; 12b-1 distribution and shareholder servicing fees; transfer agent fees and expenses payable pursuant to the Transfer Agency Agreement; and other Fund expenses. This example is intended to help you understand your ongoing costs (in dollars) of investing in the Fund and to compare these costs with the ongoing costs of investing in other mutual funds. To do so, compare this 5% hypothetical example with the 5% hypothetical examples that appear in the shareholder reports of the other funds. The example is based upon an investment of $1,000 invested at the beginning of the period and held for the six-months indicated, unless noted otherwise in the table and footnotes below.
Actual Expenses
The information in the table under the heading “Actual” provides information about actual account values and actual expenses. You may use the information in these columns, together with the amount you invested, to estimate the expenses that you paid over the period. Simply divide your account value by $1,000 (for example, an $8,600 account value divided by $1,000 = 8.6), then multiply the result by the number in the appropriate column for your share class under the heading entitled “Expenses Paid During Period” to estimate the expenses you paid on your account during the period.
Hypothetical Example for Comparison Purposes
The information in the table under the heading “Hypothetical (5% return before expenses)” provides information about hypothetical account values and hypothetical expenses based upon the Fund’s actual expense ratio and an assumed rate of return of 5% per year before expenses, which is not the Fund’s actual return. The hypothetical account values and expenses may not be used to estimate the actual ending account balance or expenses you paid for the period. You may use this information to compare the ongoing costs of investing in the Fund and other funds. To do so, compare this 5% hypothetical example with the 5% hypothetical examples that appear in the shareholder reports of the other funds. Additionally, for an analysis of the fees associated with an investment in any share class or other similar funds, please visit www.finra.org/fundanalyzer.
Please note that the expenses shown in the table are meant to highlight your ongoing costs only and do not reflect any transaction costs. These fees are fully described in the Fund’s prospectuses. Therefore, the hypothetical examples are useful in comparing ongoing costs only, and will not help you determine the relative total costs of owning different funds. In addition, if these transaction costs were included, your costs would have been higher.
| | | | | | | | | | | |
| | | | | | | | |
| | | Actual | | Hypothetical
(5% return before expenses) | |
| Beginning
Account
Value
(1/1/20) | Ending
Account
Value
(6/30/20) | Expenses
Paid During
Period
(1/1/20 - 6/30/20)† | | Beginning
Account
Value
(1/1/20) | Ending
Account
Value
(6/30/20) | Expenses
Paid During
Period
(1/1/20 - 6/30/20)† | Net Annualized
Expense Ratio
(1/1/20 - 6/30/20) |
Class A Shares | $1,000.00 | $1,038.80 | $4.41 | | $1,000.00 | $1,020.54 | $4.37 | 0.87% |
Class C Shares | $1,000.00 | $1,035.40 | $8.10 | | $1,000.00 | $1,016.91 | $8.02 | 1.60% |
Class D Shares | $1,000.00 | $1,039.80 | $3.60 | | $1,000.00 | $1,021.33 | $3.57 | 0.71% |
Class I Shares | $1,000.00 | $1,040.30 | $3.20 | | $1,000.00 | $1,021.73 | $3.17 | 0.63% |
Class N Shares | $1,000.00 | $1,040.60 | $2.94 | | $1,000.00 | $1,021.98 | $2.92 | 0.58% |
Class S Shares | $1,000.00 | $1,037.90 | $5.47 | | $1,000.00 | $1,019.49 | $5.42 | 1.08% |
Class T Shares | $1,000.00 | $1,039.20 | $4.16 | | $1,000.00 | $1,020.79 | $4.12 | 0.82% |
† | Expenses Paid During Period are equal to the Net Annualized Expense Ratio multiplied by the average account value over the period, multiplied by 182/366 (to reflect the one-half year period). Expenses in the examples include the effect of applicable fee waivers and/or expense reimbursements, if any. Had such waivers and/or reimbursements not been in effect, your expenses would have been higher. Please refer to the Notes to Financial Statements or the Fund’s prospectuses for more information regarding waivers and/or reimbursements. |
Janus Henderson Developed World Bond Fund
Schedule of Investments
June 30, 2020
| | | | | | | | |
Shares or
Principal Amounts | | | Value | |
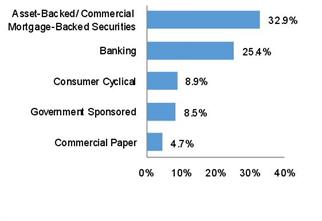
Asset-Backed/Commercial Mortgage-Backed Securities – 0.2% | | | |
| | Tesco Property Finance 3 PLC, 5.7440%, 4/13/40 | | 337,323 | GBP | | $558,765 | |
| | Ziggo BV, 4.2500%, 1/15/27 | | 2,025,000 | EUR | | 2,339,960 | |
Total Asset-Backed/Commercial Mortgage-Backed Securities (cost $2,829,769) | | 2,898,725 | |
Bank Loans and Mezzanine Loans – 1.2% | | | |
Consumer Cyclical – 0.5% | | | |
| | Loire Finco Luxembourg, | | | | | | |
| | Euro Interbank Offered Rate 3 Month + 3.2500%, 3.2500%, 4/21/27‡ | | 2,850,000 | EUR | | 3,068,036 | |
| | Loire Finco Luxembourg, ICE LIBOR USD 1 Month + 3.5000%, 3.6783%, 4/21/27‡ | | $4,840,000 | | | 4,640,350 | |
| | | 7,708,386 | |
Consumer Non-Cyclical – 0.2% | | | |
| | Froneri Lux FinCo SARL, | | | | | | |
| | Euro Interbank Offered Rate 3 Month + 2.6250%, 2.6250%, 1/29/27‡ | | 1,860,000 | EUR | | 2,009,611 | |
| | Froneri US Inc, ICE LIBOR USD 1 Month + 2.2500%, 2.4283%, 1/29/27‡ | | 1,252,987 | | | 1,175,465 | |
| | Froneri US Inc, ICE LIBOR USD 1 Month + 5.7500%, 5.9283%, 1/31/28‡ | | 262,857 | | | 249,057 | |
| | | 3,434,133 | |
Technology – 0.5% | | | |
| | Financial & Risk US Holdings Inc, | | | | | | |
| | Euro Interbank Offered Rate 3 Month + 3.2500%, 3.2500%, 10/1/25‡ | | 1,810,808 | EUR | | 1,990,353 | |
| | McAfee LLC, | | | | | | |
| | Euro Interbank Offered Rate 3 Month + 3.5000%, 3.5000%, 9/30/24‡ | | 972,675 | EUR | | 1,066,561 | |
| | McAfee LLC, ICE LIBOR USD 1 Month + 3.7500%, 3.9336%, 9/30/24‡ | | 2,115,917 | | | 2,055,380 | |
| | Refinitiv US Holdings Inc, | | | | | | |
| | ICE LIBOR USD 1 Month + 3.2500%, 3.4283%, 10/1/25‡ | | 3,089,476 | | | 3,014,556 | |
| | | 8,126,850 | |
Total Bank Loans and Mezzanine Loans (cost $19,918,230) | | 19,269,369 | |
Corporate Bonds – 77.4% | | | |
Banking – 7.2% | | | |
| | Bank of America Corp, | | | | | | |
| | Canada Bankers Acceptances 3 Month + 1.2020%, 3.4070%, 9/20/25‡ | | 2,500,000 | CAD | | 1,962,152 | |
| | Bank of America Corp, | | | | | | |
| | Euro Interbank Offered Rate 3 Month + 3.6700%, 3.6480%, 3/31/29‡ | | 8,000,000 | EUR | | 10,735,898 | |
| | Barclays Bank PLC, ICE LIBOR USD 3 Month + 1.5500%, 6.2780%‡,µ | | 7,600,000 | | | 8,301,480 | |
| | BNP Paribas SA, ICE LIBOR USD 3 Month + 1.2900%, 7.1950% (144A)‡,µ | | 2,100,000 | | | 2,268,000 | |
| | Credit Suisse Group AG, USD SWAP SEMI 30/360 5YR + 4.5980%, 7.5000%‡,µ | | 2,690,000 | | | 2,891,750 | |
| | Goldman Sachs Group Inc, 4.0000%, 5/2/24 | | 5,270,000 | AUD | | 3,915,523 | |
| | HBOS Sterling Finance Jersey LP, | | | | | | |
| | UK Govt Bonds 5 Year Note Generic Bid Yield + 4.4000%, 7.8810%‡,µ | | 909,000 | GBP | | 1,713,166 | |
| | JPMorgan Chase & Co, 4.5000%, 1/30/26 | | 6,950,000 | AUD | | 5,453,761 | |
| | Lloyds Banking Group PLC, 4.0000%, 3/7/25 | | 4,400,000 | AUD | | 3,256,144 | |
| | Lloyds Banking Group PLC, 1.8750%, 1/15/26 | | 6,000,000 | GBP | | 7,409,740 | |
| | Lloyds Banking Group PLC, 4.2500%, 11/22/27 | | 2,190,000 | AUD | | 1,635,589 | |
| | Lloyds Banking Group PLC, 4.3750%, 3/22/28 | | 3,000,000 | | | 3,480,901 | |
| | Lloyds Banking Group PLC, | | | | | | |
| | ICE LIBOR USD 3 Month + 1.2700%, 6.6570% (144A)‡,µ | | 5,486,000 | | | 6,178,607 | |
| | Nationwide Building Society, 4.0000%, 9/14/26 (144A) | | 7,500,000 | | | 8,104,103 | |
| | Nationwide Building Society, | | | | | | |
| | UK Govt Bonds 5 Year Note Generic Bid Yield + 5.6250%, 5.7500%‡,µ | | 4,870,000 | GBP | | 6,072,063 | |
| | RBS Capital Trust II, ICE LIBOR USD 3 Month + 1.9425%, 6.4250%‡,µ | | 2,514,000 | | | 3,676,725 | |
| | Royal Bank of Scotland Group PLC, 6.0000%, 12/19/23 | | 3,500,000 | | | 3,920,850 | |
| | Royal Bank of Scotland Group PLC, 5.1250%, 5/28/24 | | 2,600,000 | | | 2,844,083 | |
| | Royal Bank of Scotland Group PLC, | | | | | | |
| | UK Govt Bonds 5 Year Note Generic Bid Yield + 3.5500%, 3.6220%, 8/14/30‡ | | 7,210,000 | GBP | | 9,144,285 | |
| | Royal Bank of Scotland Group PLC, | | | | | | |
| | ICE LIBOR USD 3 Month + 2.5000%, 7.6480%‡,µ | | 971,000 | | | 1,404,552 | |
| | Stichting AK Rabobank Certificaten, 0%‡,µ | | 4,000,000 | EUR | | 4,763,242 | |
| | UBS Group AG, USD SWAP SA (VS 6M) 5Y + 4.8660%, 7.0000%‡,µ | | 3,730,000 | | | 4,099,083 | |
| | Wells Fargo & Co, 3.7000%, 7/27/26 | | 6,000,000 | AUD | | 4,527,073 | |
| | Wells Fargo & Co, 4.0000%, 4/27/27 | | 11,000,000 | AUD | | 8,417,379 | |
| | | 116,176,149 | |
| | |
See Notes to Schedule of Investments and Other Information and Notes to Financial Statements. |
| |
Janus Investment Fund | 7 |
Janus Henderson Developed World Bond Fund
Schedule of Investments
June 30, 2020
| | | | | | | | |
Shares or
Principal Amounts | | | Value | |
Corporate Bonds – (continued) | | | |
Basic Industry – 1.9% | | | |
| | Argentum Netherlands BV for Givaudan SA, 2.0000%, 9/17/30 | | 3,600,000 | EUR | | $4,506,756 | |
| | Firmenich Productions SAS, 1.7500%, 4/30/30 | | 4,030,000 | EUR | | 4,704,708 | |
| | International Flavors & Fragrances Inc, 1.8000%, 9/25/26 | | 390,000 | EUR | | 441,099 | |
| | International Flavors & Fragrances Inc, 4.4500%, 9/26/28 | | $1,212,000 | | | 1,378,962 | |
| | Smurfit Kappa Acquisitions ULC, 2.3750%, 2/1/24 | | 1,500,000 | EUR | | 1,722,509 | |
| | Smurfit Kappa Acquisitions ULC, 2.8750%, 1/15/26 | | 5,673,000 | EUR | | 6,572,242 | |
| | Smurfit Kappa Treasury ULC, 1.5000%, 9/15/27 | | 6,800,000 | EUR | | 7,284,903 | |
| | Symrise AG, 1.3750%, 7/1/27 | | 4,000,000 | EUR | | 4,529,466 | |
| | | 31,140,645 | |
Capital Goods – 1.6% | | | |
| | Ardagh Packaging Finance PLC / Ardagh Holdings USA Inc, | | | | | | |
| | 6.0000%, 2/15/25 (144A) | | 237,000 | | | 242,629 | |
| | Ardagh Packaging Finance PLC / Ardagh Holdings USA Inc, 2.1250%, 8/15/26 | | 1,500,000 | EUR | | 1,619,390 | |
| | Ardagh Packaging Finance PLC / Ardagh Holdings USA Inc, | | | | | | |
| | 5.2500%, 8/15/27 (144A) | | 9,208,000 | | | 9,038,757 | |
| | Ardagh Packaging Finance PLC / Ardagh Holdings USA Inc, | | | | | | |
| | 5.2500%, 8/15/27 (144A) | | 2,889,000 | | | 2,835,900 | |
| | Ball Corp, 4.8750%, 3/15/26 | | 1,730,000 | | | 1,879,922 | |
| | TransDigm Inc, 6.2500%, 3/15/26 (144A) | | 3,600,000 | | | 3,597,750 | |
| | Vertical Midco GmbH, 4.3750%, 7/15/27 (144A) | | 3,500,000 | EUR | | 3,931,922 | |
| | Vertical US Newco Inc, 5.2500%, 7/15/27 (144A) | | 2,492,000 | | | 2,492,000 | |
| | | 25,638,270 | |
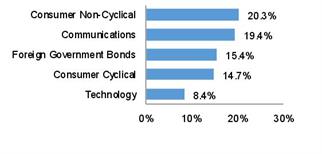
Communications – 19.4% | | | |
| | Altice France SA/France, 7.3750%, 5/1/26 (144A) | | 5,507,000 | | | 5,748,978 | |
| | Altice France SA/France, 5.8750%, 2/1/27 | | 4,910,000 | EUR | | 5,793,927 | |
| | Altice France SA/France, 5.5000%, 1/15/28 (144A) | | 6,693,000 | | | 6,759,930 | |
| | American Tower Corp, 3.6000%, 1/15/28 | | 7,580,000 | | | 8,462,846 | |
| | American Tower Corp, 3.8000%, 8/15/29 | | 8,686,000 | | | 9,869,973 | |
| | American Tower Corp, 2.9000%, 1/15/30 | | 8,127,000 | | | 8,672,223 | |
| | Arqiva Broadcast Finance PLC, 6.7500%, 9/30/23 | | 11,040,000 | GBP | | 14,156,673 | |
| | AT&T Inc, 2.7500%, 6/1/31 | | 14,880,000 | | | 15,393,157 | |
| | CCO Holdings LLC / CCO Holdings Capital Corp, 5.8750%, 5/1/27 (144A) | | 418,000 | | | 436,162 | |
| | CCO Holdings LLC / CCO Holdings Capital Corp, 5.3750%, 6/1/29 (144A) | | 3,068,000 | | | 3,236,740 | |
| | Cellnex Telecom SA, 1.8750%, 6/26/29 | | 3,300,000 | EUR | | 3,650,297 | |
| | Charter Communications Operating LLC / Charter Communications Operating Capital, 4.2000%, 3/15/28 | | 13,160,000 | | | 14,752,497 | |
| | Comcast Corp, 1.5000%, 2/20/29 | | 2,850,000 | GBP | | 3,614,098 | |
| | Comcast Corp, 1.8750%, 2/20/36 | | 2,460,000 | GBP | | 3,147,466 | |
| | Crown Castle International Corp, 3.6500%, 9/1/27 | | 2,810,000 | | | 3,129,754 | |
| | Crown Castle International Corp, 3.8000%, 2/15/28 | | 1,990,000 | | | 2,236,336 | |
| | Crown Castle International Corp, 3.1000%, 11/15/29 | | 5,601,000 | | | 6,002,835 | |
| | Crown Castle International Corp, 3.3000%, 7/1/30 | | 6,929,000 | | | 7,565,135 | |
| | Crown Castle International Corp, 2.2500%, 1/15/31 | | 3,581,000 | | | 3,606,849 | |
| | CSC Holdings LLC, 6.5000%, 2/1/29 (144A) | | 3,950,000 | | | 4,315,375 | |
| | Deutsche Telekom AG, 1.3750%, 7/5/34 | | 7,300,000 | EUR | | 8,389,068 | |
| | Deutsche Telekom International Finance BV, 1.5000%, 4/3/28 | | 2,800,000 | EUR | | 3,351,376 | |
| | Dolya Holdco, 4.8750%, 7/15/28 (144A) | | 2,180,000 | GBP | | 2,714,298 | |
| | Eircom Finance DAC, 3.5000%, 5/15/26 | | 16,775,000 | EUR | | 18,901,674 | |
| | Eircom Finance DAC, 2.6250%, 2/15/27 | | 4,275,000 | EUR | | 4,574,440 | |
| | Front Range BidCo Inc, 4.0000%, 3/1/27 (144A) | | 7,400,000 | | | 7,023,044 | |
| | Orange SA, 1.0000%, 5/12/25 | | 4,100,000 | EUR | | 4,742,136 | |
| | Orange SA, 2.0000%, 1/15/29 | | 3,100,000 | EUR | | 3,888,250 | |
| | Orange SA, 1.3750%, 1/16/30 | | 5,500,000 | EUR | | 6,626,939 | |
| | Orange SA, 3.2500%, 1/15/32 | | 2,900,000 | GBP | | 4,185,184 | |
| | RELX Capital Inc, 3.0000%, 5/22/30 | | 2,417,000 | | | 2,617,281 | |
| | Sirius XM Radio Inc, 5.3750%, 4/15/25 (144A) | | 2,315,000 | | | 2,377,505 | |
| | Sirius XM Radio Inc, 5.0000%, 8/1/27 (144A) | | 2,106,000 | | | 2,160,377 | |
| | Sirius XM Radio Inc, 5.5000%, 7/1/29 (144A) | | 5,100,000 | | | 5,394,627 | |
| | Sirius XM Radio Inc, 4.1250%, 7/1/30 (144A) | | 2,185,000 | | | 2,155,415 | |
| | |
See Notes to Schedule of Investments and Other Information and Notes to Financial Statements. |
| |
8 | JUNE 30, 2020 |
Janus Henderson Developed World Bond Fund
Schedule of Investments
June 30, 2020
| | | | | | | | |
Shares or
Principal Amounts | | | Value | |
Corporate Bonds – (continued) | | | |
Communications – (continued) | | | |
| | Sky Ltd, 2.5000%, 9/15/26 | | 1,015,000 | EUR | | $1,282,972 | |
| | T-Mobile USA Inc, 6.0000%, 3/1/23 | | $2,100,000 | | | 2,108,484 | |
| | T-Mobile USA Inc, 6.5000%, 1/15/26 | | 2,320,000 | | | 2,424,098 | |
| | T-Mobile USA Inc, 4.5000%, 2/1/26 | | 596,000 | | | 603,128 | |
| | T-Mobile USA Inc, 4.7500%, 2/1/28 | | 933,000 | | | 985,276 | |
| | T-Mobile USA Inc, 3.8750%, 4/15/30 (144A) | | 9,017,000 | | | 10,050,078 | |
| | T-Mobile USA Inc, 4.3750%, 4/15/40 (144A) | | 7,850,000 | | | 9,080,252 | |
| | Verizon Communications Inc, 4.5000%, 8/17/27 | | 12,840,000 | AUD | | 10,298,282 | |
| | Verizon Communications Inc, 4.0160%, 12/3/29 | | 3,420,000 | | | 4,088,033 | |
| | Verizon Communications Inc, 2.6500%, 5/6/30 | | 10,200,000 | AUD | | 7,021,989 | |
| | Virgin Media Finance PLC, 5.0000%, 7/15/30 (144A) | | 3,109,000 | | | 3,035,472 | |
| | Virgin Media Secured Finance PLC, 5.2500%, 5/15/29 | | 7,229,000 | GBP | | 9,354,523 | |
| | Virgin Media Secured Finance PLC, 4.1250%, 8/15/30 (144A) | | 2,500,000 | GBP | | 3,050,782 | |
| | Vodafone Group PLC, 3.2500%, 12/13/22 | | 3,600,000 | AUD | | 2,588,410 | |
| | Vodafone Group PLC, 4.3750%, 5/30/28 | | 9,700,000 | | | 11,534,001 | |
| | Vodafone Group PLC, 1.6000%, 7/29/31 | | 1,500,000 | EUR | | 1,784,639 | |
| | WMG Acquisition Corp, 2.7500%, 7/15/28 (144A) | | 4,310,000 | EUR | | 4,916,139 | |
| | WMG Acquisition Corp, 3.8750%, 7/15/30 (144A) | | 1,990,000 | | | 2,009,999 | |
| | Ziggo BV, 4.8750%, 1/15/30 (144A) | | 8,200,000 | | | 8,244,444 | |
| | Ziggo BV, 3.3750%, 2/28/30 | | 6,800,000 | EUR | | 7,180,812 | |
| | | 311,294,678 | |
Consumer Cyclical – 14.2% | | | |
| | Amazon.com Inc, 3.1500%, 8/22/27 | | 5,248,000 | | | 6,005,161 | |
| | Amazon.com Inc, 2.5000%, 6/3/50 | | 4,638,000 | | | 4,690,761 | |
| | Booking Holdings Inc, 1.8000%, 3/3/27 | | 6,010,000 | EUR | | 6,987,628 | |
| | Booking Holdings Inc, 4.6250%, 4/13/30 | | 10,041,000 | | | 11,743,097 | |
| | Boyd Gaming Corp, 8.6250%, 6/1/25 (144A) | | 3,276,000 | | | 3,423,420 | |
| | Boyd Gaming Corp, 6.3750%, 4/1/26 | | 1,800,000 | | | 1,710,000 | |
| | Compass Group PLC, 2.0000%, 7/3/29 | | 5,100,000 | GBP | | 6,534,738 | |
| | Co-operative Group Holdings 2011 Ltd, 6.8750%, 7/8/20Ç | | 2,509,000 | GBP | | 3,095,954 | |
| | Co-operative Group Holdings 2011 Ltd, 7.5000%, 7/8/26Ç | | 2,800,000 | GBP | | 3,953,742 | |
| | Co-Operative Group Ltd, 5.1250%, 5/17/24 | | 5,900,000 | GBP | | 7,732,796 | |
| | CPUK Finance Ltd, 4.2500%, 8/28/22 | | 850,000 | GBP | | 1,002,488 | |
| | CPUK Finance Ltd, 4.2500%, 8/28/22 (144A) | | 250,000 | GBP | | 294,849 | |
| | CPUK Finance Ltd, 4.8750%, 8/28/25 | | 3,150,000 | GBP | | 3,600,998 | |
| | CPUK Finance Ltd, 4.8750%, 8/28/25 (144A) | | 150,000 | GBP | | 171,476 | |
| | Experian Finance PLC, 4.2500%, 2/1/29 (144A) | | 8,562,000 | | | 9,956,099 | |
| | Experian Finance PLC, 2.7500%, 3/8/30 (144A) | | 9,263,000 | | | 9,869,902 | |
| | Experian Finance PLC, 3.2500%, 4/7/32 | | 830,000 | GBP | | 1,189,217 | |
| | GLP Capital LP / GLP Financing II Inc, 5.7500%, 6/1/28 | | 1,482,000 | | | 1,632,719 | |
| | GLP Capital LP / GLP Financing II Inc, 5.3000%, 1/15/29 | | 3,300,000 | | | 3,570,864 | |
| | GLP Capital LP / GLP Financing II Inc, 4.0000%, 1/15/30 | | 1,832,000 | | | 1,821,649 | |
| | IHS Markit Ltd, 5.0000%, 11/1/22 (144A) | | 1,400,000 | | | 1,501,243 | |
| | IHS Markit Ltd, 4.7500%, 2/15/25 (144A) | | 3,880,000 | | | 4,345,600 | |
| | IHS Markit Ltd, 4.0000%, 3/1/26 (144A) | | 1,439,000 | | | 1,591,548 | |
| | Levi Strauss & Co, 5.0000%, 5/1/25 (144A) | | 8,142,000 | | | 8,172,614 | |
| | Live Nation Entertainment Inc, 4.7500%, 10/15/27 (144A) | | 1,016,000 | | | 873,973 | |
| | Marriott International Inc, 5.7500%, 5/1/25 | | 7,051,000 | | | 7,684,325 | |
| | Mastercard Inc, 3.8500%, 3/26/50 | | 8,815,000 | | | 10,997,351 | |
| | McDonald's Corp, 3.4500%, 9/8/26 | | 9,200,000 | AUD | | 6,982,039 | |
| | McDonald's Corp, 2.6250%, 6/11/29 | | 3,900,000 | EUR | | 4,958,501 | |
| | McDonald's Corp, 1.6000%, 3/15/31 | | 3,000,000 | EUR | | 3,556,706 | |
| | Motion Bondco DAC, 4.5000%, 11/15/27 (144A) | | 375,000 | EUR | | 370,635 | |
| | Motion Bondco DAC, 6.6250%, 11/15/27 (144A)‡ | | 4,090,000 | | | 3,558,300 | |
| | Motion Finco Sarl, 7.0000%, 5/15/25 (144A) | | 3,090,000 | EUR | | 3,571,126 | |
| | NIKE Inc, 2.8500%, 3/27/30 | | 4,709,000 | | | 5,244,769 | |
| | NIKE Inc, 3.3750%, 3/27/50 | | 5,906,000 | | | 6,771,435 | |
| | Service Corp International/US, 4.6250%, 12/15/27 | | 6,882,000 | | | 7,140,075 | |
| | Service Corp International/US, 5.1250%, 6/1/29 | | 1,994,000 | | | 2,145,544 | |
| | |
See Notes to Schedule of Investments and Other Information and Notes to Financial Statements. |
| |
Janus Investment Fund | 9 |
Janus Henderson Developed World Bond Fund
Schedule of Investments
June 30, 2020
| | | | | | | | |
Shares or
Principal Amounts | | | Value | |
Corporate Bonds – (continued) | | | |
Consumer Cyclical – (continued) | | | |
| | Sodexo SA, 0.7500%, 4/14/27 | | 380,000 | EUR | | $424,770 | |
| | Sodexo SA, 1.7500%, 6/26/28 | | 6,400,000 | GBP | | 8,037,749 | |
| | Sodexo SA, 1.0000%, 4/27/29 | | 5,300,000 | EUR | | 5,861,360 | |
| | Stars Group Holdings BV / Stars Group US Co-Borrower LLC, | | | | | | |
| | 7.0000%, 7/15/26 (144A) | | $10,700,000 | | | 11,279,084 | |
| | Tesco Corporate Treasury Services, 2.7500%, 4/27/30 | | 3,200,000 | GBP | | 4,208,910 | |
| | VICI Properties LP / VICI Note Co Inc, 3.7500%, 2/15/27 (144A) | | 707,000 | | | 664,580 | |
| | VICI Properties LP / VICI Note Co Inc, 4.6250%, 12/1/29 (144A) | | 2,400,000 | | | 2,340,000 | |
| | VICI Properties LP / VICI Note Co Inc, 4.1250%, 8/15/30 (144A) | | 1,249,000 | | | 1,191,234 | |
| | Visa Inc, 2.7500%, 9/15/27 | | 11,990,000 | | | 13,217,560 | |
| | Visa Inc, 2.0500%, 4/15/30 | | 3,056,000 | | | 3,203,327 | |
| | Visa Inc, 2.7000%, 4/15/40 | | 1,313,000 | | | 1,406,615 | |
| | Walmart Inc, 3.7000%, 6/26/28 | | 6,620,000 | | | 7,843,366 | |
| | Yum! Brands Inc, 7.7500%, 4/1/25 (144A) | | 529,000 | | | 570,659 | |
| | | 228,702,556 | |
Consumer Non-Cyclical – 20.1% | | | |
| | Anheuser-Busch InBev Worldwide Inc, 4.1000%, 9/6/27 | | 2,840,000 | AUD | | 2,167,380 | |
| | Aramark Services Inc, 5.0000%, 4/1/25 (144A) | | 445,000 | | | 438,325 | |
| | Aramark Services Inc, 6.3750%, 5/1/25 (144A) | | 6,351,000 | | | 6,558,233 | |
| | Aramark Services Inc, 4.7500%, 6/1/26 | | 2,419,000 | | | 2,328,287 | |
| | Aramark Services Inc, 5.0000%, 2/1/28 (144A) | | 3,000,000 | | | 2,850,000 | |
| | Bacardi Ltd, 4.4500%, 5/15/25 (144A) | | 4,736,000 | | | 5,179,393 | |
| | Bacardi Ltd, 4.7000%, 5/15/28 (144A) | | 4,806,000 | | | 5,434,889 | |
| | Becton Dickinson and Co, 3.7000%, 6/6/27 | | 5,310,000 | | | 5,940,819 | |
| | Boston Scientific Corp, 4.0000%, 3/1/29 | | 893,000 | | | 1,021,585 | |
| | Campbell Soup Co, 2.3750%, 4/24/30 | | 1,372,000 | | | 1,420,714 | |
| | Catalent Pharma Solutions Inc, 4.8750%, 1/15/26 (144A) | | 1,639,000 | | | 1,663,913 | |
| | Clorox Co, 1.8000%, 5/15/30 | | 3,595,000 | | | 3,625,939 | |
| | Coca-Cola Co, 3.2500%, 6/11/24 | | 4,990,000 | AUD | | 3,700,351 | |
| | Coca-Cola Co, 2.1250%, 9/6/29 | | 5,330,000 | | | 5,677,525 | |
| | Constellation Brands Inc, 4.7500%, 11/15/24 | | 1,605,000 | | | 1,840,683 | |
| | Constellation Brands Inc, 3.5000%, 5/9/27 | | 4,000,000 | | | 4,425,410 | |
| | Constellation Brands Inc, 3.1500%, 8/1/29 | | 7,430,000 | | | 7,965,251 | |
| | Constellation Brands Inc, 2.8750%, 5/1/30 | | 2,382,000 | | | 2,523,289 | |
| | Cott Holdings Inc, 5.5000%, 4/1/25 (144A) | | 1,336,000 | | | 1,342,800 | |
| | DaVita Inc, 4.6250%, 6/1/30 (144A) | | 7,608,000 | | | 7,566,156 | |
| | DH Europe Finance II Sarl, 2.6000%, 11/15/29 | | 1,378,000 | | | 1,466,140 | |
| | DH Europe Finance II Sarl, 0.7500%, 9/18/31 | | 3,300,000 | EUR | | 3,566,447 | |
| | Diageo Capital PLC, 2.0000%, 4/29/30 | | 1,709,000 | | | 1,768,253 | |
| | Diageo Capital PLC, 2.1250%, 4/29/32 | | 1,371,000 | | | 1,421,151 | |
| | Diageo Finance PLC, 1.7500%, 10/12/26 | | 6,600,000 | GBP | | 8,560,335 | |
| | Elanco Animal Health Inc, 5.6500%, 8/28/28Ç | | 7,370,000 | | | 8,171,856 | |
| | Estee Lauder Cos Inc, 3.1500%, 3/15/27 | | 4,430,000 | | | 4,945,646 | |
| | Estee Lauder Cos Inc, 2.6000%, 4/15/30 | | 9,017,000 | | | 9,833,313 | |
| | Grifols SA, 1.6250%, 2/15/25 | | 5,850,000 | EUR | | 6,406,314 | |
| | Grifols SA, 2.2500%, 11/15/27 | | 8,310,000 | EUR | | 9,166,533 | |
| | Hasbro Inc, 3.5500%, 11/19/26 | | 2,697,000 | | | 2,850,013 | |
| | Hasbro Inc, 3.9000%, 11/19/29 | | 1,539,000 | | | 1,602,284 | |
| | HCA Inc, 5.0000%, 3/15/24 | | 67,000 | | | 74,509 | |
| | HCA Inc, 5.2500%, 6/15/26 | | 1,585,000 | | | 1,824,351 | |
| | HCA Inc, 4.1250%, 6/15/29 | | 9,349,000 | | | 10,310,585 | |
| | HCA Inc, 3.5000%, 9/1/30 | | 1,690,000 | | | 1,627,367 | |
| | HCA Inc, 5.1250%, 6/15/39 | | 5,610,000 | | | 6,537,208 | |
| | Heineken NV, 3.5000%, 1/29/28 (144A) | | 2,320,000 | | | 2,614,075 | |
| | Heineken NV, 1.5000%, 10/3/29 | | 2,650,000 | EUR | | 3,200,902 | |
| | Heineken NV, 2.2500%, 3/30/30 | | 1,800,000 | EUR | | 2,285,886 | |
| | Heineken NV, 2.0200%, 5/12/32 | | 2,800,000 | EUR | | 3,477,693 | |
| | IQVIA Inc, 3.2500%, 3/15/25 | | 1,500,000 | EUR | | 1,696,811 | |
| | IQVIA Inc, 5.0000%, 5/15/27 (144A) | | 4,000,000 | | | 4,091,760 | |
| | |
See Notes to Schedule of Investments and Other Information and Notes to Financial Statements. |
| |
10 | JUNE 30, 2020 |
Janus Henderson Developed World Bond Fund
Schedule of Investments
June 30, 2020
| | | | | | | | |
Shares or
Principal Amounts | | | Value | |
Corporate Bonds – (continued) | | | |
Consumer Non-Cyclical – (continued) | | | |
| | IQVIA Inc, 2.2500%, 1/15/28 | | 1,500,000 | EUR | | $1,615,683 | |
| | Keurig Dr Pepper Inc, 4.5970%, 5/25/28 | | $3,580,000 | | | 4,293,189 | |
| | Keurig Dr Pepper Inc, 3.2000%, 5/1/30 | | 929,000 | | | 1,027,719 | |
| | Kimberly-Clark Corp, 3.1000%, 3/26/30 | | 1,737,000 | | | 1,977,218 | |
| | Lamb Weston Holdings Inc, 4.8750%, 11/1/26 (144A) | | 1,360,000 | | | 1,407,600 | |
| | LVMH Moet Hennessy Louis Vuitton SE, 0.7500%, 5/26/24 | | 5,000,000 | EUR | | 5,737,723 | |
| | Mars Inc, 3.2000%, 4/1/30 (144A) | | 10,045,000 | | | 11,434,491 | |
| | McCormick & Co Inc/MD, 3.4000%, 8/15/27 | | 6,433,000 | | | 7,162,443 | |
| | Mondelez International Inc, 2.7500%, 4/13/30 | | 666,000 | | | 718,341 | |
| | Nestle Finance International Ltd, 2.2500%, 11/30/23 | | 6,600,000 | GBP | | 8,684,899 | |
| | Nestle Holdings Inc, 3.9000%, 9/24/38 (144A) | | 13,745,000 | | | 17,065,369 | |
| | PepsiCo Inc, 2.6250%, 7/29/29 | | 2,695,000 | | | 2,978,816 | |
| | PepsiCo Inc, 1.1250%, 3/18/31 | | 1,430,000 | EUR | | 1,696,995 | |
| | PepsiCo Inc, 3.3750%, 7/29/49 | | 4,090,000 | | | 4,689,086 | |
| | Procter & Gamble Co, 3.5500%, 3/25/40 | | 2,750,000 | | | 3,316,508 | |
| | Procter & Gamble Co, 3.6000%, 3/25/50 | | 2,750,000 | | | 3,423,444 | |
| | Sunshine Mid BV, 6.5000%, 5/15/26 | | 3,300,000 | EUR | | 3,660,900 | |
| | Sysco Corp, 3.5500%, 3/15/25 | | 3,088,000 | | | 3,317,881 | |
| | Sysco Corp, 5.9500%, 4/1/30 | | 8,316,000 | | | 10,420,536 | |
| | Tesco PLC, 5.5000%, 1/13/33 | | 3,691,000 | GBP | | 5,811,950 | |
| | Tesco PLC, 6.1500%, 11/15/37 (144A) | | 9,601,000 | | | 12,113,324 | |
| | Thermo Fisher Scientific Inc, 4.4970%, 3/25/30 | | 1,368,000 | | | 1,692,151 | |
| | Thermo Fisher Scientific Inc, 2.3750%, 4/15/32 | | 1,600,000 | EUR | | 2,047,522 | |
| | Unilever Capital Corp, 2.1250%, 9/6/29 | | 8,000,000 | | | 8,442,484 | |
| | Unilever PLC, 1.5000%, 7/22/26 | | 3,700,000 | GBP | | 4,841,017 | |
| | Upjohn Inc, 2.7000%, 6/22/30 (144A) | | 7,815,000 | | | 8,029,224 | |
| | Wm Morrison Supermarkets PLC, 3.5000%, 7/27/26 | | 1,997,000 | GBP | | 2,769,671 | |
| | Zoetis Inc, 3.9000%, 8/20/28 | | 2,450,000 | | | 2,884,888 | |
| | Zoetis Inc, 2.0000%, 5/15/30 | | 4,547,000 | | | 4,637,274 | |
| | Zoetis Inc, 3.0000%, 5/15/50 | | 3,411,000 | | | 3,506,594 | |
| | | 322,575,314 | |
Government Sponsored – 1.6% | | | |
| | Deutsche Bahn Finance GMBH, 1.6250%, 8/16/33 | | 5,990,000 | EUR | | 7,543,679 | |
| | Kreditanstalt fuer Wiederaufbau, 3.2000%, 9/11/26 | | 10,000,000 | AUD | | 7,846,068 | |
| | Kreditanstalt fuer Wiederaufbau, 3.2000%, 3/15/28 | | 13,660,000 | AUD | | 10,866,819 | |
| | | 26,256,566 | |
Industrial – 0.1% | | | |
| | Cintas Corp No 2, 3.7000%, 4/1/27 | | 2,000,000 | | | 2,271,075 | |
Insurance – 2.2% | | | |
| | Anthem Inc, 2.2500%, 5/15/30 | | 2,905,000 | | | 2,988,665 | |
| | Anthem Inc, 3.1250%, 5/15/50 | | 3,486,000 | | | 3,604,541 | |
| | BUPA Finance PLC, 4.1250%, 6/14/35 | | 5,700,000 | GBP | | 7,082,123 | |
| | BUPA Finance PLC, | | | | | | |
| | UK Govt Bonds 5 Year Note Generic Bid Yield + 2.6000%, 6.1250%‡,µ | | 1,414,000 | GBP | | 1,743,216 | |
| | Legal & General Group PLC, | | | | | | |
| | UK Govt Bonds 5 Year Note Generic Bid Yield + 5.2500%, 4.5000%, 11/1/50‡ | | 920,000 | GBP | | 1,171,823 | |
| | Legal & General Group PLC, | | | | | | |
| | UK Govt Bonds 5 Year Note Generic Bid Yield + 5.3780%, 5.6250%‡,µ | | 2,400,000 | GBP | | 2,936,928 | |
| | Phoenix Group Holdings PLC, 4.1250%, 7/20/22 | | 1,600,000 | GBP | | 2,044,734 | |
| | Phoenix Group Holdings PLC, 6.6250%, 12/18/25 | | 2,412,000 | GBP | | 3,434,419 | |
| | Prudential PLC, 3.1250%, 4/14/30 | | 5,084,000 | | | 5,460,475 | |
| | Scottish Widows Ltd, 5.5000%, 6/16/23 | | 2,500,000 | GBP | | 3,355,634 | |
| | Scottish Widows Ltd, 7.0000%, 6/16/43 | | 612,000 | GBP | | 1,053,998 | |
| | | 34,876,556 | |
Non-Agency Commercial Mortgage-Backed Securities – 0.1% | | | |
| | Nationwide Building Society, 10.2500%‡,µ | | 850,000 | GBP | | 1,632,246 | |
Real Estate Investment Trusts (REITs) – 0.6% | | | |
| | Digital Realty Trust LP, 4.7500%, 10/1/25 | | 1,900,000 | | | 2,192,144 | |
| | |
See Notes to Schedule of Investments and Other Information and Notes to Financial Statements. |
| |
Janus Investment Fund | 11 |
Janus Henderson Developed World Bond Fund
Schedule of Investments
June 30, 2020
| | | | | | | | |
Shares or
Principal Amounts | | | Value | |
Corporate Bonds – (continued) | | | |
Real Estate Investment Trusts (REITs) – (continued) | | | |
| | Public Storage, 3.3850%, 5/1/29 | | $6,240,000 | | | $7,206,020 | |
| | | 9,398,164 | |
Supranational – 0.5% | | | |
| | European Investment Bank, 2.7000%, 1/12/23 | | 10,000,000 | AUD | | 7,266,928 | |
Technology – 7.9% | | | |
| | Autodesk Inc, 2.8500%, 1/15/30 | | 10,745,000 | | | 11,828,454 | |
| | Broadcom Inc, 3.1500%, 11/15/25 (144A) | | 3,754,000 | | | 3,985,640 | |
| | Broadcom Inc, 4.1100%, 9/15/28 (144A) | | 3,754,000 | | | 4,105,957 | |
| | Dell International LLC / EMC Corp, 5.4500%, 6/15/23 (144A) | | 2,685,000 | | | 2,936,886 | |
| | Dell International LLC / EMC Corp, 6.0200%, 6/15/26 (144A) | | 9,310,000 | | | 10,673,686 | |
| | Dell International LLC / EMC Corp, 6.1000%, 7/15/27 (144A) | | 5,400,000 | | | 6,237,361 | |
| | Equinix Inc, 3.2000%, 11/18/29 | | 9,789,000 | | | 10,625,764 | |
| | Equinix Inc, 3.0000%, 7/15/50 | | 7,799,000 | | | 7,590,065 | |
| | Fidelity National Information Services Inc, 3.7500%, 5/21/29 | | 2,260,000 | | | 2,647,543 | |
| | Fiserv Inc, 2.2500%, 7/1/25 | | 1,310,000 | GBP | | 1,698,820 | |
| | Fiserv Inc, 3.5000%, 7/1/29 | | 6,240,000 | | | 7,006,963 | |
| | Fiserv Inc, 1.6250%, 7/1/30 | | 3,470,000 | EUR | | 4,018,869 | |
| | Global Payments Inc, 2.6500%, 2/15/25 | | 2,398,000 | | | 2,545,079 | |
| | Global Payments Inc, 3.2000%, 8/15/29 | | 3,880,000 | | | 4,155,480 | |
| | Global Payments Inc, 2.9000%, 5/15/30 | | 6,188,000 | | | 6,471,794 | |
| | Microsoft Corp, 3.4500%, 8/8/36 | | 1,325,000 | | | 1,597,592 | |
| | MSCI Inc, 4.0000%, 11/15/29 (144A) | | 2,026,000 | | | 2,066,520 | |
| | MSCI Inc, 3.6250%, 9/1/30 (144A) | | 4,598,000 | | | 4,575,010 | |
| | Oracle Corp, 2.9500%, 4/1/30 | | 5,490,000 | | | 6,116,095 | |
| | Oracle Corp, 3.6000%, 4/1/50 | | 5,103,000 | | | 5,751,149 | |
| | PayPal Holdings Inc, 2.8500%, 10/1/29 | | 2,440,000 | | | 2,670,017 | |
| | salesforce.com Inc, 3.7000%, 4/11/28 | | 5,072,000 | | | 5,917,116 | |
| | VMware Inc, 3.9000%, 8/21/27 | | 4,698,000 | | | 4,976,639 | |
| | VMware Inc, 4.7000%, 5/15/30 | | 6,880,000 | | | 7,604,753 | |
| | | 127,803,252 | |
Total Corporate Bonds (cost $1,193,460,822) | | 1,245,032,399 | |
Foreign Government Bonds – 15.4% | | | |
| | Australia Government Bond, 2.7500%, 4/21/24 | | 29,129,000 | AUD | | 21,946,040 | |
| | Australia Government Bond, 3.2500%, 4/21/29 | | 54,000,000 | AUD | | 44,998,254 | |
| | Canadian Government Bond, 1.7500%, 3/1/23 | | 30,000,000 | CAD | | 22,950,199 | |
| | European Investment Bank, 3.2500%, 1/29/24 | | 17,000,000 | | | 18,769,025 | |
| | Federal Republic of Germany Bond, 0%, 2/15/30 | | 30,000,000 | EUR | | 35,355,210 | |
| | New Zealand Government Bond, 2.7500%, 4/15/25 | | 66,000,000 | NZD | | 47,234,130 | |
| | New Zealand Government Bond, 3.0000%, 4/20/29 | | 20,000,000 | NZD | | 15,303,035 | |
| | United Kingdom Gilt, 0.5000%, 7/22/22 | | 33,000,000 | GBP | | 41,380,112 | |
Total Foreign Government Bonds (cost $245,691,774) | | 247,936,005 | |
Inflation-Indexed Bonds – 0.5% | | | |
| | United States Treasury Inflation Indexed Bonds, 0.1250%, 1/15/30ÇÇ (cost $7,143,665) | | 7,276,275 | | | 7,867,013 | |
Investment Companies – 4.2% | | | |
Money Markets – 4.2% | | | |
| | Fidelity Investments Money Market Treasury Portfolio, 0.0800%ºº (cost $67,435,423) | | 67,435,423 | | | 67,435,423 | |
Total Investments (total cost $1,536,479,683) – 98.9% | | 1,590,438,934 | |
Cash, Receivables and Other Assets, net of Liabilities – 1.1% | | 17,616,753 | |
Net Assets – 100% | | $1,608,055,687 | |
| | |
See Notes to Schedule of Investments and Other Information and Notes to Financial Statements. |
| |
12 | JUNE 30, 2020 |
Janus Henderson Developed World Bond Fund
Schedule of Investments
June 30, 2020
| | | | | | |
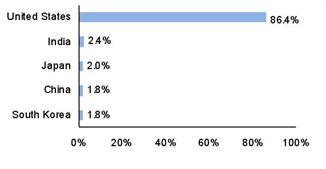
Summary of Investments by Country - (Long Positions) (unaudited) |
| |
| | | | | % of | |
| | | | | Investment | |
Country | | Value | | Securities | |
United States | | $806,049,534 | | 50.7 | % |
United Kingdom | | 303,207,983 | | 19.1 | |
Germany | | 84,305,608 | | 5.3 | |
Australia | | 66,944,294 | | 4.2 | |
New Zealand | | 62,537,165 | | 3.9 | |
France | | 60,074,946 | | 3.8 | |
Ireland | | 51,051,452 | | 3.2 | |
Netherlands | | 37,767,914 | | 2.4 | |
Canada | | 35,572,083 | | 2.2 | |
Luxembourg | | 26,035,953 | | 1.6 | |
Switzerland | | 24,887,196 | | 1.6 | |
Spain | | 19,223,144 | | 1.2 | |
Bermuda | | 10,614,282 | | 0.7 | |
Belgium | | 2,167,380 | | 0.1 | |
| | | | | | |
| | | | | | |
Total | | $1,590,438,934 | | 100.0 | % |
Schedules of Affiliated Investments – (% of Net Assets)
| | | | | | | | | | | |
| | Dividend Income | Realized Gain/(Loss) | Change in Unrealized Appreciation/ Depreciation | Value at 6/30/20 |
Investments Purchased with Cash Collateral from Securities Lending - N/A |
Investment Companies - N/A |
| | Janus Henderson Cash Collateral Fund LLC, 0.0368%ºº | $ | 423∆ | $ | - | $ | - | $ | - |
| |
| | | | | | | | | | | |
| | Value at 6/30/19 | Purchases | Sales Proceeds | Value at 6/30/20 |
Investments Purchased with Cash Collateral from Securities Lending - N/A |
Investment Companies - N/A |
| | Janus Henderson Cash Collateral Fund LLC, 0.0368%ºº | | - | | 6,325,280 | | (6,325,280) | | - |
| | |
See Notes to Schedule of Investments and Other Information and Notes to Financial Statements. |
| |
Janus Investment Fund | 13 |
Janus Henderson Developed World Bond Fund
Schedule of Investments
June 30, 2020
| | | | | | | |
Schedule of Forward Foreign Currency Exchange Contracts, Open | | | | | | |
| | | | | | | | | |
Counterparty/ Foreign Currency | Settlement Date | Foreign Currency Amount (Sold)/ Purchased | | USD Currency Amount (Sold)/ Purchased | | Market Value and Unrealized Appreciation/ (Depreciation) | |
BNP Paribas: | | | | | | | |
Australian Dollar | 7/29/20 | 58,500 | $ | (40,041) | $ | 325 | |
Australian Dollar | 7/29/20 | (213,396,686) | | 145,185,252 | | (2,062,126) | |
British Pound | 7/29/20 | (161,205,316) | | 201,627,282 | | 1,884,347 | |
British Pound | 7/29/20 | (6,577,578) | | 8,123,548 | | (26,460) | |
Canadian Dollar | 7/29/20 | (24,699,096) | | 18,057,490 | | (140,324) | |
Euro | 7/29/20 | (225,352,733) | | 253,739,557 | | 412,251 | |
Euro | 7/29/20 | (4,315,685) | | 4,821,254 | | (30,165) | |
New Zealand Dollar | 7/29/20 | (92,855,587) | | 59,620,169 | | (283,473) | |
Total | | | | | $ | (245,625) | |
Schedule of Futures
| | | | | | | | | | | | | | |
Description | | Number of Contracts | | Expiration Date | | Value and Notional Amount | | Unrealized Appreciation/ (Depreciation) | | Variation Margin Asset/(Liability) | |
Futures Sold: | | | | | | | | | | | |
10-Year US Treasury Note | | 800 | | 9/30/20 | $ | (111,337,500) | $ | (631,391) | $ | 125,762 | |
Euro-Bund | | 193 | | 9/10/20 | | (38,272,606) | | (447,810) | | 36,137 | |
US Treasury Long Bond | | 42 | | 9/30/20 | | (7,499,625) | | 7,875 | | 7,811 | |
Total | | | | | | | $ | (1,071,326) | $ | 169,710 | |
| | | | | | | | | | | |
Schedule of Centrally Cleared Credit Default Swaps - Sell Protection(1) |
Reference Asset Type/ Reference Asset | S&P Credit Rating | Maturity Date | Notional Amount(2) | | | Premiums Paid/(Received) | | Unrealized Appreciation/ (Depreciation) | | Variation Margin Asset/ (Liability) |
Credit Default Swap Index
| | | | | | | | | | | | | | |
| | iTraxx Crossover Index, Fixed Rate 5.00% Paid Quarterly(3) | NR | 6/20/25 | 56,800,000 | EUR | $ | (3,245,023) | $ | 6,630,464 | $ | 464,193 |
(1) | If a credit event occurs, the seller of protection will pay a net settlement amount equal to the notional amount of the swap less the recovery value of the reference asset from related offsetting purchase protection. |
(2) | If a credit event occurs, the notional amount represents the maximum potential amount the Fund could be required to make as a seller of credit protection or receive as a buyer of credit protection. |
(3) | For those index credit default swaps entered into by the Fund to sell protection, “Variation Margin” serves as an indicator of the current status of payment and performance risk and represents the likelihood of an expected gain or loss should the notional amount of the swap be closed or sold at period end. Increasing market values, in absolute terms when compared to the notional amount of the swap, represent a deterioration of the reference asset’s credit soundness and a greater likelihood or risk of default or other credit event occurring as defined under the terms of the swap agreement. |
| | |
See Notes to Schedule of Investments and Other Information and Notes to Financial Statements. |
| |
14 | JUNE 30, 2020 |
Janus Henderson Developed World Bond Fund
Schedule of Investments
June 30, 2020
| | | | | | | | | | |
Schedule of OTC Credit Default Swaps - Buy Protection |
Counterparty/ Reference Asset | Maturity Date | Notional Amount | | | Premiums Paid/(Received) | | Unrealized Appreciation/ (Depreciation) | | Swap Contracts, at Value Asset/(Liability) |
Barclays Capital, Inc:
| | | | | | | | | | |
Renault SA, Fixed Rate 1.00%, Paid Quarterly | 12/20/21 | 3,000,000 | EUR | $ | 10,704 | $ | 25,423 | $ | 36,127 |
JPMorgan Chase & Co:
| | | | | | | | | | |
Host Hotels & Resorts LP, Fixed Rate 1.00%, Paid Quarterly | 12/20/20 | 1,250,000 | USD | | 20,186 | | (23,874) | | (3,688) |
Host Hotels & Resorts LP, Fixed Rate 1.00%, Paid Quarterly | 12/20/20 | 1,250,000 | USD | | 20,186 | | (23,873) | | (3,687) |
| | | | | | 40,372 | | (47,747) | | (7,375) |
Total | | | | $ | 51,076 | $ | (22,324) | $ | 28,752 |
The following table, grouped by derivative type, provides information about the fair value and location of derivatives within the Statement of Assets and Liabilities as of June 30, 2020.
| | | | | | | | | | | | |
Fair Value of Derivative Instruments (not accounted for as hedging instruments) as of June 30, 2020 |
| | | | | | | | | | | |
| | | | | Credit
Contracts | | Currency
Contracts | | Interest Rate
Contracts | | Total |
Asset Derivatives: | | | | | | | | | |
Forward foreign currency exchange contracts | | | $ - | | $2,296,923 | | $ - | | $2,296,923 |
Outstanding swap contracts, at value | | | 36,127 | | - | | - | | 36,127 |
Variation margin receivable | | | 464,193 | | - | | 169,710 | | 633,903 |
| | | | | | | | | | |
Total Asset Derivatives | | | $500,320 | | $2,296,923 | | $ 169,710 | | $2,966,953 |
Liability Derivatives: | | | | | | | | | |
Forward foreign currency exchange contracts | | | $ - | | $2,542,548 | | $ - | | $2,542,548 |
Outstanding swap contracts, at value | | | 7,375 | | - | | - | | 7,375 |
| | | | | | | | | | |
Total Liability Derivatives | | | $ 7,375 | | $2,542,548 | | $ - | | $2,549,923 |
| | |
See Notes to Schedule of Investments and Other Information and Notes to Financial Statements. |
| |
Janus Investment Fund | 15 |
Janus Henderson Developed World Bond Fund
Schedule of Investments
June 30, 2020
The following tables provide information about the effect of derivatives and hedging activities on the Fund’s Statement of Operations for the year ended June 30, 2020.
| | | | | | | | | | | |
The effect of Derivative Instruments (not accounted for as hedging instruments) on the Statement of Operations for the year ended June 30, 2020 |
| | | | | | | | | | |
Amount of Realized Gain/(Loss) Recognized on Derivatives |
Derivative | | Credit
Contracts | | Currency
Contracts | | Interest Rate
Contracts | | Total |
Futures contracts | | $ - | | $ - | | $ (3,619,034) | | $ (3,619,034) |
Forward foreign currency exchange contracts | | - | | 23,523,124 | | - | | 23,523,124 |
Swap contracts | | (7,332,296) | | - | | - | | (7,332,296) |
| | | | | | | | | | | |
Total | | $(7,332,296) | | $23,523,124 | | $ (3,619,034) | | $12,571,794 |
| | | | | | | | | | | |
| | | | | | | | | | | |
Amount of Change in Unrealized Appreciation/Depreciation Recognized on Derivatives |
Derivative | | Credit
Contracts | | Currency
Contracts | | Interest Rate
Contracts | | Total |
Futures contracts | | $ - | | $ - | | $ (1,969,820) | | $ (1,969,820) |
Forward foreign currency exchange contracts | | - | | 11,102,806 | | - | | 11,102,806 |
Swap contracts | | 7,072,362 | | - | | - | | 7,072,362 |
| | | | | | | | | | | |
Total | | $ 7,072,362 | | $11,102,806 | | $ (1,969,820) | | $16,205,348 |
Please see the "Net Realized Gain/(Loss) on Investments" and "Change in Unrealized Net Appreciation/Depreciation" sections of the Fund’s Statement of Operations.
| | |
Average Ending Monthly Market Value of Derivative Instruments During the Year Ended June 30, 2020 |
| |
| Market Value(a) |
Credit default swaps, sell protection | $ 1,366,947 |
Credit default swaps, buy protection | (415,008) |
Forward foreign currency exchange contracts, purchased | 46,003,614 |
Forward foreign currency exchange contracts, sold | 815,014,722 |
Futures contracts, purchased | 102,182,135 |
Futures contracts, sold | 58,732,637 |
| | |
(a) Forward foreign currency exchange contracts are reported as the average ending monthly currency amount purchased or sold. |
| | |
See Notes to Schedule of Investments and Other Information and Notes to Financial Statements. |
| |
16 | JUNE 30, 2020 |
Janus Henderson Developed World Bond Fund
Notes to Schedule of Investments and Other Information
| | |
Bloomberg Barclays Global Aggregate Credit Index (USD Hedged) | Bloomberg Barclays Global Aggregate Credit Index (USD Hedged) measures the credit sector of the global investment grade fixed-rate bond market, including corporate, government and agency securities. |
| | |
ICE | Intercontinental Exchange |
LIBOR | London Interbank Offered Rate |
LLC | Limited Liability Company |
LP | Limited Partnership |
PLC | Public Limited Company |
ULC | Unlimited Liability Company |
| | |
144A | Securities sold under Rule 144A of the Securities Act of 1933, as amended, are subject to legal and/or contractual restrictions on resale and may not be publicly sold without registration under the 1933 Act. Unless otherwise noted, these securities have been determined to be liquid under guidelines established by the Board of Trustees. The total value of 144A securities as of the year ended June 30, 2020 is $307,516,239, which represents 19.1% of net assets. |
| | |
‡ | Variable or floating rate security. Rate shown is the current rate as of June 30, 2020. Certain variable rate securities are not based on a published reference rate and spread; they are determined by the issuer or agent and current market conditions. Reference rate is as of reset date and may vary by security, which may not indicate a reference rate and/or spread in their description. |
| | |
ÇÇ | Security is a U.S. Treasury Inflation-Protected Security (TIPS). |
| | |
ºº | Rate shown is the 7-day yield as of June 30, 2020. |
| | |
µ | Perpetual security. Perpetual securities have no stated maturity date, but they may be called/redeemed by the issuer. The date indicated, if any, represents the next call date. |
| | |
Ç | Step bond. The coupon rate will increase or decrease periodically based upon a predetermined schedule. The rate shown reflects the current rate. |
| | |
∆ | Net of income paid to the securities lending agent and rebates paid to the borrowing counterparties. |
Janus Henderson Developed World Bond Fund
Notes to Schedule of Investments and Other Information
| | | | | | | | | | | | | | |
The following is a summary of the inputs that were used to value the Fund’s investments in securities and other financial instruments as of June 30, 2020. See Notes to Financial Statements for more information. |
| |
Valuation Inputs Summary |
| | | | | | | |
| | | | | Level 2 - | | Level 3 - |
| | | Level 1 - | | Other Significant | | Significant |
| | | Quoted Prices | | Observable Inputs | | Unobservable Inputs |
| | | | | | | |
Assets | | | | | | |
Investments In Securities: | | | | | | |
Asset-Backed/Commercial Mortgage-Backed Securities | $ | - | $ | 2,898,725 | $ | - |
Bank Loans and Mezzanine Loans | | - | | 19,269,369 | | - |
Corporate Bonds | | - | | 1,245,032,399 | | - |
Foreign Government Bonds | | - | | 247,936,005 | | - |
Inflation-Indexed Bonds | | - | | 7,867,013 | | - |
Investment Companies | | 67,435,423 | | - | | - |
Total Investments in Securities | $ | 67,435,423 | $ | 1,523,003,511 | $ | - |
Other Financial Instruments(a): | | | | | | |
Forward Foreign Currency Exchange Contracts | | - | | 2,296,923 | | - |
Outstanding Swap Contracts, at Value | | - | | 36,127 | | - |
Variation Margin Receivable | | 169,710 | | 464,193 | | - |
Total Assets | $ | 67,605,133 | $ | 1,525,800,754 | $ | - |
Liabilities | | | | | | |
Other Financial Instruments(a): | | | | | | |
Forward Foreign Currency Exchange Contracts | $ | - | $ | 2,542,548 | $ | - |
Outstanding Swap Contracts, at Value | | - | | 7,375 | | - |
Total Liabilities | $ | - | $ | 2,549,923 | $ | - |
| | | | | | | |
(a) | Other financial instruments include forward foreign currency exchange, futures, written options, written swaptions, and swap contracts. Forward foreign currency exchange contracts are reported at their unrealized appreciation/(depreciation) at measurement date, which represents the change in the contract's value from trade date. Futures, certain written options on futures, and centrally cleared swap contracts are reported at their variation margin at measurement date, which represents the amount due to/from the Fund at that date. Written options, written swaptions, and other swap contracts are reported at their market value at measurement date. |
Janus Henderson Developed World Bond Fund
Statement of Assets and Liabilities
June 30, 2020
| |
See footnotes at the end of the Statement. |
| | | | | | | |
| | | | | | |
Assets: | | | | |
| Investments, at value(1) | | $ | 1,590,438,934 | |
| Cash | | | 7,841 | |
| Deposits with brokers for centrally cleared derivatives | | | 8,451,820 | |
| Deposits with brokers for futures | | | 1,030,200 | |
| Forward foreign currency exchange contracts | | | 2,296,923 | |
| Cash denominated in foreign currency(2) | | | 982,927 | |
| Outstanding swap contracts, at value(3) | | | 36,127 | |
| Variation margin receivable | | | 633,903 | |
| Non-interested Trustees' deferred compensation | | | 32,972 | |
| Receivables: | | | | |
| | Interest | | | 12,219,012 | |
| | Investments sold | | | 6,149,009 | |
| | Fund shares sold | | | 4,205,722 | |
| | Dividends | | | 6,485 | |
| | Foreign tax reclaims | | | 65 | |
| Other assets | | | 109,160 | |
Total Assets | | | 1,626,601,100 | |
Liabilities: | | | | |
| Forward foreign currency exchange contracts | | | 2,542,548 | |
| Outstanding swap contracts, at value(4) | | | 7,375 | |
| Payables: | | | — | |
| | Investments purchased | | | 11,407,630 | |
| | Fund shares repurchased | | | 2,843,119 | |
| | Advisory fees | | | 536,239 | |
| | Dividends | | | 325,438 | |
| | Transfer agent fees and expenses | | | 224,141 | |
| | Professional fees | | | 43,499 | |
| | 12b-1 Distribution and shareholder servicing fees | | | 42,549 | |
| | Non-interested Trustees' deferred compensation fees | | | 32,972 | |
| | Custodian fees | | | 26,270 | |
| | Non-interested Trustees' fees and expenses | | | 7,492 | |
| | Affiliated fund administration fees payable | | | 3,203 | |
| | Accrued expenses and other payables | | | 502,938 | |
Total Liabilities | | | 18,545,413 | |
Net Assets | | $ | 1,608,055,687 | |
| | |
See Notes to Financial Statements. |
| |
Janus Investment Fund | 19 |
Janus Henderson Developed World Bond Fund
Statement of Assets and Liabilities
June 30, 2020
| | | | | | | |
| | | | | | |
| | | | | | | |
Net Assets Consist of: | | | | |
| Capital (par value and paid-in surplus) | | $ | 1,562,067,275 | |
| Total distributable earnings (loss) | | | 45,988,412 | |
Total Net Assets | | $ | 1,608,055,687 | |
Net Assets - Class A Shares | | $ | 59,078,770 | |
| Shares Outstanding, $0.01 Par Value (unlimited shares authorized) | | | 5,945,034 | |
Net Asset Value Per Share(5) | | $ | 9.94 | |
Maximum Offering Price Per Share(6) | | $ | 10.44 | |
Net Assets - Class C Shares | | $ | 37,641,421 | |
| Shares Outstanding, $0.01 Par Value (unlimited shares authorized) | | | 3,813,886 | |
Net Asset Value Per Share(5) | | $ | 9.87 | |
Net Assets - Class D Shares | | $ | 30,219,358 | |
| Shares Outstanding, $0.01 Par Value (unlimited shares authorized) | | | 3,042,317 | |
Net Asset Value Per Share | | $ | 9.93 | |
Net Assets - Class I Shares | | $ | 1,348,740,452 | |
| Shares Outstanding, $0.01 Par Value (unlimited shares authorized) | | | 136,149,503 | |
Net Asset Value Per Share | | $ | 9.91 | |
Net Assets - Class N Shares | | $ | 31,829,254 | |
| Shares Outstanding, $0.01 Par Value (unlimited shares authorized) | | | 3,211,732 | |
Net Asset Value Per Share | | $ | 9.91 | |
Net Assets - Class S Shares | | $ | 223,582 | |
| Shares Outstanding, $0.01 Par Value (unlimited shares authorized) | | | 22,522 | |
Net Asset Value Per Share | | $ | 9.93 | |
Net Assets - Class T Shares | | $ | 100,322,850 | |
| Shares Outstanding, $0.01 Par Value (unlimited shares authorized) | | | 10,104,640 | |
Net Asset Value Per Share | | $ | 9.93 | |
| |
(1) Includes cost of $1,536,479,683. (2) Includes cost of $982,927. (3) Premiums paid $10,704. (4) Premiums paid $40,372. (5) Redemption price per share may be reduced for any applicable contingent deferred sales charge. (6) Maximum offering price is computed at 100/95.25 of net asset value. |
| | |
See Notes to Financial Statements. |
| |
20 | JUNE 30, 2020 |
Janus Henderson Developed World Bond Fund
Statement of Operations
For the year ended June 30, 2020
| | | | | | |
| | | | | |
Investment Income: | | | |
| Interest | $ | 33,124,706 | |
| Dividends | | 845,006 | |
| Affiliated securities lending income, net | | 423 | |
| Unaffiliated securities lending income, net | | 35 | |
| Other income | | 195,523 | |
Total Investment Income | | 34,165,693 | |
Expenses: | | | |
| Advisory fees | | 7,721,881 | |
| 12b-1 Distribution and shareholder servicing fees: | | | |
| | Class A Shares | | 149,644 | |
| | Class C Shares | | 363,091 | |
| | Class S Shares | | 411 | |
| Transfer agent administrative fees and expenses: | | | |
| | Class D Shares | | 25,746 | |
| | Class S Shares | | 502 | |
| | Class T Shares | | 266,797 | |
| Transfer agent networking and omnibus fees: | | | |
| | Class A Shares | | 52,654 | |
| | Class C Shares | | 23,391 | |
| | Class I Shares | | 1,057,268 | |
| Other transfer agent fees and expenses: | | | |
| | Class A Shares | | 4,793 | |
| | Class C Shares | | 2,775 | |
| | Class D Shares | | 3,542 | |
| | Class I Shares | | 54,019 | |
| | Class N Shares | | 613 | |
| | Class S Shares | | 14 | |
| | Class T Shares | | 1,420 | |
| Registration fees | | 224,118 | |
| Shareholder reports expense | | 114,025 | |
| Custodian fees | | 112,836 | |
| Professional fees | | 65,284 | |
| Affiliated fund administration fees | | 36,194 | |
| Non-interested Trustees’ fees and expenses | | 32,216 | |
| Other expenses | | 216,018 | |
Total Expenses | | 10,529,252 | |
Less: Excess Expense Reimbursement and Waivers | | (448,532) | |
Net Expenses | | 10,080,720 | |
Net Investment Income/(Loss) | | 24,084,973 | |
| | | | | |
| | |
See Notes to Financial Statements. |
| |
Janus Investment Fund | 21 |
Janus Henderson Developed World Bond Fund
Statement of Operations
For the year ended June 30, 2020
| | | | | | |
| | | | | |
Net Realized Gain/(Loss) on Investments: | | | |
| Investments and foreign currency transactions | $ | (10,397,426) | |
| Forward foreign currency exchange contracts | | 23,523,124 | |
| Futures contracts | | (3,619,034) | |
| Swap contracts | | (7,332,296) | |
Total Net Realized Gain/(Loss) on Investments | | 2,174,368 | |
Change in Unrealized Net Appreciation/Depreciation: | | | |
| Investments, foreign currency translations and non-interested Trustees’ deferred compensation | | 27,585,982 | |
| Forward foreign currency exchange contracts | | 11,102,806 | |
| Futures contracts | | (1,969,820) | |
| Swap contracts | | 7,072,362 | |
Total Change in Unrealized Net Appreciation/Depreciation | | 43,791,330 | |
Net Increase/(Decrease) in Net Assets Resulting from Operations | $ | 70,050,671 | |
| | | | | |
| | |
See Notes to Financial Statements. |
| |
22 | JUNE 30, 2020 |
Janus Henderson Developed World Bond Fund
Statements of Changes in Net Assets
| | | | | | | | | |
| | | | | | | | |
| | | Year ended
June 30, 2020 | | Year ended
June 30, 2019 | |
| | | | | | | | | |
Operations: | | | | | | |
| Net investment income/(loss) | $ | 24,084,973 | | $ | 18,923,584 | |
| Net realized gain/(loss) on investments | | 2,174,368 | | | 25,276,893 | |
| Change in unrealized net appreciation/depreciation | | 43,791,330 | | | 34,865,553 | |
Net Increase/(Decrease) in Net Assets Resulting from Operations | | 70,050,671 | | | 79,066,030 | |
Dividends and Distributions to Shareholders: | | | | | | |
| | Class A Shares | | (2,024,158) | | | (1,973,457) | |
| | Class C Shares | | (995,645) | | | (1,372,098) | |
| | Class D Shares | | (765,327) | | | (432,828) | |
| | Class I Shares | | (44,470,595) | | | (33,555,493) | |
| | Class N Shares | | (705,033) | | | (249,474) | |
| | Class S Shares | | (6,868) | | | (6,438) | |
| | Class T Shares | | (4,088,674) | | | (2,015,076) | |
Net Decrease from Dividends and Distributions to Shareholders | | (53,056,300) | | | (39,604,864) | |
Capital Share Transactions: | | | | | | |
| | Class A Shares | | 6,448,882 | | | 9,037,750 | |
| | Class C Shares | | (349,460) | | | (4,156,963) | |
| | Class D Shares | | 13,866,899 | | | 6,636,916 | |
| | Class I Shares | | 383,616,125 | | | 256,127,011 | |
| | Class N Shares | | 26,213,329 | | | 1,398,559 | |
| | Class S Shares | | 61,348 | | | 31,444 | |
| | Class T Shares | | 31,399,317 | | | 38,211,023 | |
Net Increase/(Decrease) from Capital Share Transactions | | 461,256,440 | | | 307,285,740 | |
Net Increase/(Decrease) in Net Assets | | 478,250,811 | | | 346,746,906 | |
Net Assets: | | | | | | |
| Beginning of period | | 1,129,804,876 | | | 783,057,970 | |
| End of period | $ | 1,608,055,687 | | $ | 1,129,804,876 | |
| | | | | | | | |
| | |
See Notes to Financial Statements. |
| |
Janus Investment Fund | 23 |
Janus Henderson Developed World Bond Fund
Financial Highlights
| | | | | | | | | | | | | | | | |
Class A Shares | | | | | | | | | | | | |
For a share outstanding during the year or period ended June 30 | | 2020 | | | 2019 | | | 2018 | | | 2017(1) | |
| Net Asset Value, Beginning of Period | | $9.69 | | | $9.35 | | | $9.46 | | | $9.34 | |
| Income/(Loss) from Investment Operations: | | | | | | | | | | | | |
| | Net investment income/(loss)(2) | | 0.14 | | | 0.18 | | | 0.21 | | | 0.26 | |
| | Net realized and unrealized gain/(loss) | | 0.44 | | | 0.58 | | | (0.12) | | | 0.11 | |
| Total from Investment Operations | | 0.58 | | | 0.76 | | | 0.09 | | | 0.37 | |
| Less Dividends and Distributions: | | | | | | | | | | | | |
| | Dividends (from net investment income) | | (0.30) | | | (0.42) | | | (0.20) | | | (0.12) | |
| | Distributions (from capital gains) | | (0.03) | | | — | | | — | | | — | |
| | Return of capital | | — | | | — | | | — | | | (0.13) | |
| Total Dividends and Distributions | | (0.33) | | | (0.42) | | | (0.20) | | | (0.25) | |
| Net Asset Value, End of Period | | $9.94 | | | $9.69 | | | $9.35 | | | $9.46 | |
| Total Return* | | 6.07% | | | 8.48% | | | 0.99% | | | 3.99% | |
| Net Assets, End of Period (in thousands) | | $59,079 | | | $51,463 | | | $40,600 | | | $43,047 | |
| Average Net Assets for the Period (in thousands) | | $59,858 | | | $43,495 | | | $43,700 | | | $60,131 | |
| Ratios to Average Net Assets**: | | | | | | | | | | | | |
| | Ratio of Gross Expenses | | 0.94% | | | 0.99% | | | 0.98% | | | 1.01% | |
| | Ratio of Net Expenses (After Waivers and Expense Offsets) | | 0.90% | | | 0.99% | | | 0.98% | | | 1.01% | |
| | Ratio of Net Investment Income/(Loss) | | 1.45% | | | 1.98% | | | 2.23% | | | 2.99% | |
| Portfolio Turnover Rate | | 88% | | | 42% | | | 125% | | | 112% | |
| | | | | | | | | | | | | | | | |
| | | | | | | | | | | | | | | | |
Class C Shares | | | | | | | | | | | | |
For a share outstanding during the year or period ended June 30 | | 2020 | | | 2019 | | | 2018 | | | 2017(1) | |
| Net Asset Value, Beginning of Period | | $9.63 | | | $9.30 | | | $9.41 | | | $9.29 | |
| Income/(Loss) from Investment Operations: | | | | | | | | | | | | |
| | Net investment income/(loss)(2) | | 0.07 | | | 0.12 | | | 0.14 | | | 0.19 | |
| | Net realized and unrealized gain/(loss) | | 0.43 | | | 0.57 | | | (0.12) | | | 0.11 | |
| Total from Investment Operations | | 0.50 | | | 0.69 | | | 0.02 | | | 0.30 | |
| Less Dividends and Distributions: | | | | | | | | | | | | |
| | Dividends (from net investment income) | | (0.23) | | | (0.36) | | | (0.13) | | | (0.08) | |
| | Distributions (from capital gains) | | (0.03) | | | — | | | — | | | — | |
| | Return of capital | | — | | | — | | | — | | | (0.10) | |
| Total Dividends and Distributions | | (0.26) | | | (0.36) | | | (0.13) | | | (0.18) | |
| Net Asset Value, End of Period | | $9.87 | | | $9.63 | | | $9.30 | | | $9.41 | |
| Total Return* | | 5.26% | | | 7.67% | | | 0.25% | | | 3.31% | |
| Net Assets, End of Period (in thousands) | | $37,641 | | | $37,165 | | | $40,085 | | | $39,923 | |
| Average Net Assets for the Period (in thousands) | | $37,191 | | | $36,574 | | | $39,996 | | | $46,079 | |
| Ratios to Average Net Assets**: | | | | | | | | | | | | |
| | Ratio of Gross Expenses | | 1.64% | | | 1.72% | | | 1.72% | | | 1.77% | |
| | Ratio of Net Expenses (After Waivers and Expense Offsets) | | 1.62% | | | 1.72% | | | 1.72% | | | 1.77% | |
| | Ratio of Net Investment Income/(Loss) | | 0.74% | | | 1.27% | | | 1.48% | | | 2.22% | |
| Portfolio Turnover Rate | | 88% | | | 42% | | | 125% | | | 112% | |
| | | | | | | | | | | | | | | | |
| |
* Total return includes adjustments in accordance with generally accepted accounting principles required at the year or period end and are not annualized for periods of less than one full year. ** Annualized for periods of less than one full year. (1) Period from August 1, 2016 through June 30, 2017. The Fund changed its fiscal year end from July 31 to June 30. (2) Per share amounts are calculated based on average shares outstanding during the year or period. |
| | |
See Notes to Financial Statements. |
| |
24 | JUNE 30, 2020 |
Janus Henderson Developed World Bond Fund
Financial Highlights
| | | | | | | | | | |
Class A Shares | | | | | | |
For a share outstanding during the year or period ended July 31 | | 2016 | | | 2015 | |
| Net Asset Value, Beginning of Period | | $9.09 | | | $9.13 | |
| Income/(Loss) from Investment Operations: | | | | | | |
| | Net investment income/(loss)(1) | | 0.25 | | | 0.32 | |
| | Net realized and unrealized gain/(loss) | | 0.24 | | | 0.01 | |
| Total from Investment Operations | | 0.49 | | | 0.33 | |
| Less Dividends and Distributions: | | | | | | |
| | Dividends (from net investment income) | | (0.24) | | | (0.37) | |
| Total Dividends and Distributions | | (0.24) | | | (0.37) | |
| Net Asset Value, End of Period | | $9.34 | | | $9.09 | |
| Total Return* | | 5.46% | | | 3.71% | |
| Net Assets, End of Period (in thousands) | | $66,863 | | | $28,200 | |
| Average Net Assets for the Period (in thousands) | | $47,477 | | | $20,111 | |
| Ratios to Average Net Assets**: | | | | | | |
| | Ratio of Gross Expenses | | 1.04%(2) | | | 1.15% | |
| | Ratio of Net Expenses (After Waivers and Expense Offsets) | | 1.04%(2) | | | 1.09% | |
| | Ratio of Net Investment Income/(Loss) | | 2.72%(3) | | | 3.52% | |
| Portfolio Turnover Rate | | 110% | | | 54% | |
| | | | | | | | | | |
| | | | | | | | | | |
Class C Shares | | | | | | |
For a share outstanding during the year or period ended July 31 | | 2016 | | | 2015 | |
| Net Asset Value, Beginning of Period | | $9.04 | | | $9.09 | |
| Income/(Loss) from Investment Operations: | | | | | | |
| | Net investment income/(loss)(1) | | 0.18 | | | 0.26 | |
| | Net realized and unrealized gain/(loss) | | 0.24 | | | —(4) | |
| Total from Investment Operations | | 0.42 | | | 0.26 | |
| Less Dividends and Distributions: | | | | | | |
| | Dividends (from net investment income) | | (0.17) | | | (0.31) | |
| Total Dividends and Distributions | | (0.17) | | | (0.31) | |
| Net Asset Value, End of Period | | $9.29 | | | $9.04 | |
| Total Return* | | 4.70% | | | 2.84% | |
| Net Assets, End of Period (in thousands) | | $50,531 | | | $30,034 | |
| Average Net Assets for the Period (in thousands) | | $40,443 | | | $25,216 | |
| Ratios to Average Net Assets**: | | | | | | |
| | Ratio of Gross Expenses | | 1.80%(2) | | | 1.92% | |
| | Ratio of Net Expenses (After Waivers and Expense Offsets) | | 1.80%(2) | | | 1.85% | |
| | Ratio of Net Investment Income/(Loss) | | 1.98%(3) | | | 2.84% | |
| Portfolio Turnover Rate | | 110% | | | 54% | |
| | | | | | | | | | |
| |
* Total return not annualized for periods of less than one full year. ** Annualized for periods of less than one full year. (1) Per share amounts are calculated based on average shares outstanding during the year or period. (2) The Ratio of Gross Expenses and Ratio of Net Expenses (After Waivers and Expense Offsets) include a reimbursement of prior period custodian out-of-pocket expenses. The Ratio of Gross Expenses and Ratio of Net Expenses (After Waivers and Expense Offsets) would have been 0.01% higher had the custodian not reimbursed the Fund. (3) The Ratio of Net Investment Income/(Loss) include a reimbursement of prior period custodian out-of-pocket expenses. The Ratio of Net Investment Income/(Loss) would have been 0.01% lower had the custodian not reimbursed the Fund. (4) Less than $0.005 on a per share basis. |
| | |
See Notes to Financial Statements. |
| |
Janus Investment Fund | 25 |
Janus Henderson Developed World Bond Fund
Financial Highlights
| | | | | | | | | | | | | | | | |
Class D Shares | | | | | | | | | | | | |
For a share outstanding during the year or period ended June 30 | | 2020 | | | 2019 | | | 2018 | | | 2017(1) | |
| Net Asset Value, Beginning of Period | | $9.69 | | | $9.34 | | | $9.45 | | | $9.49 | |
| Income/(Loss) from Investment Operations: | | | | | | | | | | | | |
| | Net investment income/(loss)(2) | | 0.16 | | | 0.20 | | | 0.22 | | | 0.02 | |
| | Net realized and unrealized gain/(loss) | | 0.43 | | | 0.59 | | | (0.11) | | | (0.03) | |
| Total from Investment Operations | | 0.59 | | | 0.79 | | | 0.11 | | | (0.01) | |
| Less Dividends and Distributions: | | | | | | | | | | | | |
| | Dividends (from net investment income) | | (0.32) | | | (0.44) | | | (0.22) | | | (0.01) | |
| | Distributions (from capital gains) | | (0.03) | | | — | | | — | | | — | |
| | Return of capital | | — | | | — | | | — | | | (0.02) | |
| Total Dividends and Distributions | | (0.35) | | | (0.44) | | | (0.22) | | | (0.03) | |
| Net Asset Value, End of Period | | $9.93 | | | $9.69 | | | $9.34 | | | $9.45 | |
| Total Return* | | 6.17% | | | 8.78% | | | 1.17% | | | (0.09)% | |
| Net Assets, End of Period (in thousands) | | $30,219 | | | $16,056 | | | $8,848 | | | $450 | |
| Average Net Assets for the Period (in thousands) | | $21,662 | | | $10,281 | | | $6,302 | | | $270 | |
| Ratios to Average Net Assets**: | | | | | | | | | | | | |
| | Ratio of Gross Expenses | | 0.75% | | | 0.86% | | | 0.79% | | | 0.90% | |
| | Ratio of Net Expenses (After Waivers and Expense Offsets) | | 0.73% | | | 0.81% | | | 0.79% | | | 0.89% | |
| | Ratio of Net Investment Income/(Loss) | | 1.65% | | | 2.13% | | | 2.39% | | | 3.54% | |
| Portfolio Turnover Rate | | 88% | | | 42% | | | 125% | | | 112% | |
| | | | | | | | | | | | | | | | |
| | | | | | | | | | | | | | | | |
Class I Shares | | | | | | | | | | | | |
For a share outstanding during the year or period ended June 30 | | 2020 | | | 2019 | | | 2018 | | | 2017(3) | |
| Net Asset Value, Beginning of Period | | $9.66 | | | $9.32 | | | $9.43 | | | $9.31 | |
| Income/(Loss) from Investment Operations: | | | | | | | | | | | | |
| | Net investment income/(loss)(2) | | 0.17 | | | 0.21 | | | 0.23 | | | 0.27 | |
| | Net realized and unrealized gain/(loss) | | 0.43 | | | 0.58 | | | (0.11) | | | 0.12 | |
| Total from Investment Operations | | 0.60 | | | 0.79 | | | 0.12 | | | 0.39 | |
| Less Dividends and Distributions: | | | | | | | | | | | | |
| | Dividends (from net investment income) | | (0.32) | | | (0.45) | | | (0.23) | | | (0.12) | |
| | Distributions (from capital gains) | | (0.03) | | | — | | | — | | | — | |
| | Return of capital | | — | | | — | | | — | | | (0.15) | |
| Total Dividends and Distributions | | (0.35) | | | (0.45) | | | (0.23) | | | (0.27) | |
| Net Asset Value, End of Period | | $9.91 | | | $9.66 | | | $9.32 | | | $9.43 | |
| Total Return* | | 6.36% | | | 8.77% | | | 1.25% | | | 4.26% | |
| Net Assets, End of Period (in thousands) | | $1,348,740 | | | $948,619 | | | $659,214 | | | $333,853 | |
| Average Net Assets for the Period (in thousands) | | $1,202,926 | | | $732,591 | | | $496,179 | | | $326,067 | |
| Ratios to Average Net Assets**: | | | | | | | | | | | | |
| | Ratio of Gross Expenses | | 0.68% | | | 0.74% | | | 0.72% | | | 0.76% | |
| | Ratio of Net Expenses (After Waivers and Expense Offsets) | | 0.65% | | | 0.74% | | | 0.72% | | | 0.76% | |
| | Ratio of Net Investment Income/(Loss) | | 1.71% | | | 2.23% | | | 2.47% | | | 3.21% | |
| Portfolio Turnover Rate | | 88% | | | 42% | | | 125% | | | 112% | |
| | | | | | | | | | | | | | | | |
| |
* Total return includes adjustments in accordance with generally accepted accounting principles required at the year or period end and are not annualized for periods of less than one full year. ** Annualized for periods of less than one full year. (1) Period from June 5, 2017 (inception date) through June 30, 2017. (2) Per share amounts are calculated based on average shares outstanding during the year or period. (3) Period from August 1, 2016 through June 30, 2017. The Fund changed its fiscal year end from July 31 to June 30. |
| | |
See Notes to Financial Statements. |
| |
26 | JUNE 30, 2020 |
Janus Henderson Developed World Bond Fund
Financial Highlights
| | | | | | | | | | |
Class I Shares | | | | | | |
For a share outstanding during the year or period ended July 31 | | 2016 | | | 2015 | |
| Net Asset Value, Beginning of Period | | $9.06 | | | $9.11 | |
| Income/(Loss) from Investment Operations: | | | | | | |
| | Net investment income/(loss)(1) | | 0.27 | | | 0.34 | |
| | Net realized and unrealized gain/(loss) | | 0.23 | | | 0.01 | |
| Total from Investment Operations | | 0.50 | | | 0.35 | |
| Less Dividends and Distributions: | | | | | | |
| | Dividends (from net investment income) | | (0.25) | | | (0.40) | |
| Total Dividends and Distributions | | (0.25) | | | (0.40) | |
| Net Asset Value, End of Period | | $9.31 | | | $9.06 | |
| Total Return* | | 5.70% | | | 3.86% | |
| Net Assets, End of Period (in thousands) | | $323,462 | | | $106,544 | |
| Average Net Assets for the Period (in thousands) | | $227,875 | | | $65,902 | |
| Ratios to Average Net Assets**: | | | | | | |
| | Ratio of Gross Expenses | | 0.79%(2) | | | 0.92% | |
| | Ratio of Net Expenses (After Waivers and Expense Offsets) | | 0.79%(2) | | | 0.84% | |
| | Ratio of Net Investment Income/(Loss) | | 2.96%(3) | | | 3.73% | |
| Portfolio Turnover Rate | | 110% | | | 54% | |
| | | | | | | | | | |
| |
* Total return not annualized for periods of less than one full year. ** Annualized for periods of less than one full year. (1) Per share amounts are calculated based on average shares outstanding during the year or period. (2) The Ratio of Gross Expenses and Ratio of Net Expenses (After Waivers and Expense Offsets) include a reimbursement of prior period custodian out-of-pocket expenses. The Ratio of Gross Expenses and Ratio of Net Expenses (After Waivers and Expense Offsets) would have been 0.01% higher had the custodian not reimbursed the Fund. (3) The Ratio of Net Investment Income/(Loss) include a reimbursement of prior period custodian out-of-pocket expenses. The Ratio of Net Investment Income/(Loss) would have been 0.01% lower had the custodian not reimbursed the Fund. |
| | |
See Notes to Financial Statements. |
| |
Janus Investment Fund | 27 |
Janus Henderson Developed World Bond Fund
Financial Highlights
| | | | | | | | | | | | | | | | |
Class N Shares | | | | | | | | | | | | |
For a share outstanding during the year or period ended June 30 | | 2020 | | | 2019 | | | 2018 | | | 2017(1) | |
| Net Asset Value, Beginning of Period | | $9.67 | | | $9.32 | | | $9.44 | | | $9.32 | |
| Income/(Loss) from Investment Operations: | | | | | | | | | | | | |
| | Net investment income/(loss)(2) | | 0.18 | | | 0.21 | | | 0.23 | | | 0.28 | |
| | Net realized and unrealized gain/(loss) | | 0.42 | | | 0.59 | | | (0.12) | | | 0.11 | |
| Total from Investment Operations | | 0.60 | | | 0.80 | | | 0.11 | | | 0.39 | |
| Less Dividends and Distributions: | | | | | | | | | | | | |
| | Dividends (from net investment income) | | (0.33) | | | (0.45) | | | (0.23) | | | (0.12) | |
| | Distributions (from capital gains) | | (0.03) | | | — | | | — | | | — | |
| | Return of capital | | — | | | — | | | — | | | (0.15) | |
| Total Dividends and Distributions | | (0.36) | | | (0.45) | | | (0.23) | | | (0.27) | |
| Net Asset Value, End of Period | | $9.91 | | | $9.67 | | | $9.32 | | | $9.44 | |
| Total Return* | | 6.32% | | | 8.94% | | | 1.19% | | | 4.31% | |
| Net Assets, End of Period (in thousands) | | $31,829 | | | $5,789 | | | $4,168 | | | $1,340 | |
| Average Net Assets for the Period (in thousands) | | $19,208 | | | $5,062 | | | $2,007 | | | $1,434 | |
| Ratios to Average Net Assets**: | | | | | | | | | | | | |
| | Ratio of Gross Expenses | | 0.61% | | | 0.71% | | | 0.67% | | | 0.70% | |
| | Ratio of Net Expenses (After Waivers and Expense Offsets) | | 0.59% | | | 0.67% | | | 0.67% | | | 0.70% | |
| | Ratio of Net Investment Income/(Loss) | | 1.82% | | | 2.31% | | | 2.51% | | | 3.25% | |
| Portfolio Turnover Rate | | 88% | | | 42% | | | 125% | | | 112% | |
| | | | | | | | | | | | | | | | |
| | | | | | | | | | | | | | | | | |
Class S Shares | | | | | | | | | | | | | |
For a share outstanding during the year or period ended June 30 | | | 2020 | | | 2019 | | | 2018 | | | 2017(3) | |
| Net Asset Value, Beginning of Period | | | $9.69 | | | $9.34 | | | $9.45 | | | $9.49 | |
| Income/(Loss) from Investment Operations: | | | | | | | | | | | | | |
| | Net investment income/(loss)(2) | | | 0.13 | | | 0.18 | | | 0.20 | | | —(4) | |
| | Net realized and unrealized gain/(loss) | | | 0.42 | | | 0.59 | | | (0.12) | | | (0.01) | |
| Total from Investment Operations | | | 0.55 | | | 0.77 | | | 0.08 | | | (0.01) | |
| Less Dividends and Distributions: | | | | | | | | | | | | | |
| | Dividends (from net investment income) | | | (0.28) | | | (0.42) | | | (0.19) | | | (0.01) | |
| | Distributions (from capital gains) | | | (0.03) | | | — | | | — | | | — | |
| | Return of capital | | | — | | | — | | | — | | | (0.02) | |
| Total Dividends and Distributions | | | (0.31) | | | (0.42) | | | (0.19) | | | (0.03) | |
| Net Asset Value, End of Period | | | $9.93 | | | $9.69 | | | $9.34 | | | $9.45 | |
| Total Return* | | | 5.83% | | | 8.51% | | | 0.85% | | | (0.11)% | |
| Net Assets, End of Period (in thousands) | | | $224 | | | $158 | | | $121 | | | $50 | |
| Average Net Assets for the Period (in thousands) | | | $201 | | | $141 | | | $70 | | | $50 | |
| Ratios to Average Net Assets**: | | | | | | | | | | | | | |
| | Ratio of Gross Expenses | | | 2.55% | | | 3.21% | | | 2.19% | | | 1.22% | |
| | Ratio of Net Expenses (After Waivers and Expense Offsets) | | | 1.06% | | | 1.06% | | | 1.05% | | | 1.22% | |
| | Ratio of Net Investment Income/(Loss) | | | 1.31% | | | 1.91% | | | 2.12% | | | (0.55)% | |
| Portfolio Turnover Rate | | | 88% | | | 42% | | | 125% | | | 112% | |
| | | | | | | | | | | | | | | | | |
| |
* Total return includes adjustments in accordance with generally accepted accounting principles required at the year or period end and are not annualized for periods of less than one full year. ** Annualized for periods of less than one full year. (1) Period from August 1, 2016 through June 30, 2017. The Fund changed its fiscal year end from July 31 to June 30. (2) Per share amounts are calculated based on average shares outstanding during the year or period. (3) Period from June 5, 2017 (inception date) through June 30, 2017. (4) Less than $0.005 on a per share basis. |
| | |
See Notes to Financial Statements. |
| |
28 | JUNE 30, 2020 |
Janus Henderson Developed World Bond Fund
Financial Highlights
| | | | | | | |
Class N Shares | | | |
For a share outstanding during the period ended July 31 | | 2016(1) | |
| Net Asset Value, Beginning of Period | | $8.99 | |
| Income/(Loss) from Investment Operations: | | | |
| | Net investment income/(loss)(2) | | 0.17 | |
| | Net realized and unrealized gain/(loss) | | 0.32 | |
| Total from Investment Operations | | 0.49 | |
| Less Dividends and Distributions: | | | |
| | Dividends (from net investment income) | | (0.16) | |
| Total Dividends and Distributions | | (0.16) | |
| Net Asset Value, End of Period | | $9.32 | |
| Total Return* | | 5.57% | |
| Net Assets, End of Period (in thousands) | | $1,528 | |
| Average Net Assets for the Period (in thousands) | | $1,413 | |
| Ratios to Average Net Assets**: | | | |
| | Ratio of Gross Expenses | | 0.73%(3) | |
| | Ratio of Net Expenses (After Waivers and Expense Offsets) | | 0.73%(3) | |
| | Ratio of Net Investment Income/(Loss) | | 2.77%(4) | |
| Portfolio Turnover Rate | | 110% | |
| | | | | | | |
| |
* Total return not annualized for periods of less than one full year. ** Annualized for periods of less than one full year. (1) Period from November 30, 2015 (inception date) through July 31, 2016. (2) Per share amounts are calculated based on average shares outstanding during the year or period. (3) The Ratio of Gross Expenses and Ratio of Net Expenses (After Waivers and Expense Offsets) include a reimbursement of prior period custodian out-of-pocket expenses. The Ratio of Gross Expenses and Ratio of Net Expenses (After Waivers and Expense Offsets) would have been 0.01% higher had the custodian not reimbursed the Fund. (4) The Ratio of Net Investment Income/(Loss) include a reimbursement of prior period custodian out-of-pocket expenses. The Ratio of Net Investment Income/(Loss) would have been 0.01% lower had the custodian not reimbursed the Fund. |
| | |
See Notes to Financial Statements. |
| |
Janus Investment Fund | 29 |
Janus Henderson Developed World Bond Fund
Financial Highlights
| | | | | | | | | | | | | | | | |
Class T Shares | | | | | | | | | | | | |
For a share outstanding during the year or period ended June 30 | | 2020 | | | 2019 | | | 2018 | | | 2017(1) | |
| Net Asset Value, Beginning of Period | | $9.68 | | | $9.34 | | | $9.45 | | | $9.49 | |
| Income/(Loss) from Investment Operations: | | | | | | | | | | | | |
| | Net investment income/(loss)(2) | | 0.15 | | | 0.19 | | | 0.21 | | | —(3) | |
| | Net realized and unrealized gain/(loss) | | 0.44 | | | 0.58 | | | (0.10) | | | (0.01) | |
| Total from Investment Operations | | 0.59 | | | 0.77 | | | 0.11 | | | (0.01) | |
| Less Dividends and Distributions: | | | | | | | | | | | | |
| | Dividends (from net investment income) | | (0.31) | | | (0.43) | | | (0.22) | | | (0.01) | |
| | Distributions (from capital gains) | | (0.03) | | | — | | | — | | | — | |
| | Return of capital | | — | | | — | | | — | | | (0.02) | |
| Total Dividends and Distributions | | (0.34) | | | (0.43) | | | (0.22) | | | (0.03) | |
| Net Asset Value, End of Period | | $9.93 | | | $9.68 | | | $9.34 | | | $9.45 | |
| Total Return* | | 6.17% | | | 8.59% | | | 1.11% | | | (0.10)% | |
| Net Assets, End of Period (in thousands) | | $100,323 | | | $70,554 | | | $30,023 | | | $55 | |
| Average Net Assets for the Period (in thousands) | | $106,719 | | | $45,901 | | | $19,756 | | | $53 | |
| Ratios to Average Net Assets**: | | | | | | | | | | | | |
| | Ratio of Gross Expenses | | 0.84% | | | 0.91% | | | 0.89% | | | 0.95% | |
| | Ratio of Net Expenses (After Waivers and Expense Offsets) | | 0.83% | | | 0.90% | | | 0.88% | | | 0.95% | |
| | Ratio of Net Investment Income/(Loss) | | 1.52% | | | 2.05% | | | 2.31% | | | (0.01)% | |
| Portfolio Turnover Rate | | 88% | | | 42% | | | 125% | | | 112% | |
| | | | | | | | | | | | | | | | |
| |
* Total return includes adjustments in accordance with generally accepted accounting principles required at the year or period end and are not annualized for periods of less than one full year. ** Annualized for periods of less than one full year. (1) Period from June 5, 2017 (inception date) through June 30, 2017. (2) Per share amounts are calculated based on average shares outstanding during the year or period. (3) Less than $0.005 on a per share basis. |
| | |
See Notes to Financial Statements. |
| |
30 | JUNE 30, 2020 |
Janus Henderson Developed World Bond Fund
Notes to Financial Statements
1. Organization and Significant Accounting Policies
Janus Henderson Developed World Bond Fund(the “Fund”) is a series of Janus Investment Fund (the “Trust”), which is organized as a Massachusetts business trust and is registered under the Investment Company Act of 1940, as amended (the “1940 Act”), as an open-end management investment company, and therefore has applied the specialized accounting and reporting guidance in Financial Accounting Standards Board (“FASB”) Accounting Standards Codification (“ASC”) Topic 946. The Trust offers 45 funds, each of which offers multiple share classes, with differing investment objectives and policies. The Fund seeks total return through current income and capital appreciation. The Fund is classified as diversified, as defined in the 1940 Act.
Pursuant to the Agreement and Plan of Reorganization, the Fund acquired all the assets and liabilities of the Henderson Strategic Income Fund (the “Predecessor Fund”), a series of Henderson Global Funds, in exchange for Class A, Class C, Class I and Class N Fund shares having an aggregate net asset value equal to the value of the aggregate net assets of the same share class of the Predecessor Fund (except that Class R6 Predecessor Fund shares were exchanged for Class N Fund shares) (the “Reorganization”). The Reorganization occurred at the close of business on June 2, 2017.
The Predecessor Fund and the Fund had identical investment objectives and substantially similar investment policies and principal risks. For financial reporting purposes, the Predecessor Fund’s financial and performance history prior to the Reorganization is carried forward and reflected in the Fund’s financial highlights.
The last fiscal year end of the Predecessor Fund was July 31, 2016. Subsequent to July 31, 2016, the Fund changed its fiscal year end to June 30, 2017, to reflect the fiscal year end of certain funds of the Trust.
The Fund offers multiple classes of shares in order to meet the needs of various types of investors. Each class represents an interest in the same portfolio of investments. Certain financial intermediaries may not offer all classes of shares. Class D Shares are closed to certain new investors.
Class A Shares are offered through financial intermediary platforms including, but not limited to, traditional brokerage platforms, mutual fund wrap fee programs, bank trust platforms, and retirement platforms.
Class C Shares are offered through financial intermediary platforms including, but not limited to, traditional brokerage platforms, mutual fund wrap fee programs, and bank trust platforms.
Class C Shares are closed to investments by new employer-sponsored retirement plans and existing employer-sponsored retirement plans are no longer able to make additional purchases or exchanges into Class C Shares.
The Funds have adopted an auto-conversion policy pursuant to which Class C Shares that have been held for ten years will be automatically converted to Class A Shares without the imposition of any sales charge, fee or other charge. The conversion will generally occur no later than ten business days in the month following the month of the tenth anniversary of the date of purchase. Class C Shares purchased through the reinvestment of dividends and other distributions on Class C Shares will convert to Class A Shares at the same time as the Class C Shares with respect to which they were purchased. For Class C Shares held in omnibus accounts on intermediary platforms, the Fund will rely on these intermediaries to implement this conversion feature. Your financial intermediary may have separate policies and procedures as to when and how Class C Shares may be converted to Class A Shares. Please contact your financial intermediary for additional information.
Class D Shares are generally no longer being made available to new investors who do not already have a direct account with the Janus Henderson funds. Class D Shares are available only to investors who hold accounts directly with the Janus Henderson funds, to immediate family members or members of the same household of an eligible individual investor, and to existing beneficial owners of sole proprietorships or partnerships that hold accounts directly with the Janus Henderson funds. Effective July 6, 2020, Class D Shares are open to new investors.
Class I Shares are available through certain financial intermediary platforms including, but not limited to, mutual fund wrap fee programs, managed account programs, asset allocation programs, bank trust platforms, as well as certain retirement platforms. Class I Shares are also available to certain direct institutional investors including, but not limited to, corporations, certain retirement plans, public plans, and foundations/endowments, who established Class I Share accounts before August 4, 2017.
Class N Shares are generally available only to financial intermediaries purchasing on behalf of: 1) certain adviser-assisted, employer-sponsored retirement plans, including 401(k) plans, 457 plans, 403(b) plans, Taft-Hartley multi-
Janus Henderson Developed World Bond Fund
Notes to Financial Statements
employer plans, profit-sharing and money purchase pension plans, defined benefit plans and certain welfare benefit plans, such as health savings accounts, and nonqualified deferred compensation plans; and 2) retail investors purchasing in qualified or nonqualified accounts, whose accounts are held through an omnibus account at their financial intermediary, and where the financial intermediary requires no payment or reimbursement from the Fund, Janus Capital Management LLC (“Janus Capital”), or its affiliates. Class N Shares are also available to Janus Henderson proprietary products and to certain direct institutional investors approved by Janus Distributors LLC dba Janus Henderson Distributors (“Janus Henderson Distributors”) including, but not limited to, corporations, certain retirement plans, public plans, and foundations and endowments, subject to minimum investment requirements.
Class S Shares are offered through financial intermediary platforms including, but not limited to, retirement platforms and asset allocation, mutual fund wrap, or other discretionary or nondiscretionary fee-based investment advisory programs. In addition, Class S Shares may be available through certain financial intermediaries who have an agreement with Janus Capital or its affiliates to offer Class S Shares on their supermarket platforms.
Class T Shares are available through certain financial intermediary platforms including, but not limited to, mutual fund wrap fee programs, managed account programs, asset allocation programs, bank trust platforms, as well as certain retirement platforms. In addition, Class T Shares may be available through certain financial intermediaries who have an agreement with Janus Capital or its affiliates to offer Class T Shares on their supermarket platforms.
The following accounting policies have been followed by the Fund and are in conformity with United States of America generally accepted accounting principles ("US GAAP").
Investment Valuation
Securities held by the Fund are valued in accordance with policies and procedures established by and under the supervision of the Trustees (the “Valuation Procedures”). Equity securities traded on a domestic securities exchange are generally valued at the closing prices on the primary market or exchange on which they trade. If such price is lacking for the trading period immediately preceding the time of determination, such securities are valued at their current bid price. Equity securities that are traded on a foreign exchange are generally valued at the closing prices on such markets. In the event that there is no current trading volume on a particular security in such foreign exchange, the bid price from the primary exchange is generally used to value the security. Securities that are traded on the over-the-counter (“OTC”) markets are generally valued at their closing or latest bid prices as available. Foreign securities and currencies are converted to U.S. dollars using the applicable exchange rate in effect at the close of the New York Stock Exchange (“NYSE”). The Fund will determine the market value of individual securities held by it by using prices provided by one or more approved professional pricing services or, as needed, by obtaining market quotations from independent broker-dealers. Most debt securities are valued in accordance with the evaluated bid price supplied by the pricing service that is intended to reflect market value. The evaluated bid price supplied by the pricing service is an evaluation that may consider factors such as security prices, yields, maturities and ratings. Certain short-term securities maturing within 60 days or less may be evaluated and valued on an amortized cost basis provided that the amortized cost determined approximates market value. Securities for which market quotations or evaluated prices are not readily available or deemed unreliable are valued at fair value determined in good faith under the Valuation Procedures. Circumstances in which fair value pricing may be utilized include, but are not limited to: (i) a significant event that may affect the securities of a single issuer, such as a merger, bankruptcy, or significant issuer-specific development; (ii) an event that may affect an entire market, such as a natural disaster or significant governmental action; (iii) a nonsignificant event such as a market closing early or not opening, or a security trading halt; and (iv) pricing of a nonvalued security and a restricted or nonpublic security. Special valuation considerations may apply with respect to “odd-lot” fixed-income transactions which, due to their small size, may receive evaluated prices by pricing services which reflect a large block trade and not what actually could be obtained for the odd-lot position. The Fund uses systematic fair valuation models provided by independent third parties to value international equity securities in order to adjust for stale pricing, which may occur between the close of certain foreign exchanges and the close of the NYSE.
Valuation Inputs Summary
FASB ASC 820, Fair Value Measurements and Disclosures (“ASC 820”), defines fair value, establishes a framework for measuring fair value, and expands disclosure requirements regarding fair value measurements. This standard emphasizes that fair value is a market-based measurement that should be determined based on the assumptions that market participants would use in pricing an asset or liability and establishes a hierarchy that prioritizes inputs to valuation techniques used to measure fair value. These inputs are summarized into three broad levels:
Janus Henderson Developed World Bond Fund
Notes to Financial Statements
Level 1 – Unadjusted quoted prices in active markets the Fund has the ability to access for identical assets or liabilities.
Level 2 – Observable inputs other than unadjusted quoted prices included in Level 1 that are observable for the asset or liability either directly or indirectly. These inputs may include quoted prices for the identical instrument on an inactive market, prices for similar instruments, interest rates, prepayment speeds, credit risk, yield curves, default rates and similar data.
Assets or liabilities categorized as Level 2 in the hierarchy generally include: debt securities fair valued in accordance with the evaluated bid or ask prices supplied by a pricing service; securities traded on OTC markets and listed securities for which no sales are reported that are fair valued at the latest bid price (or yield equivalent thereof) obtained from one or more dealers transacting in a market for such securities or by a pricing service approved by the Fund’s Trustees; certain short-term debt securities with maturities of 60 days or less that are fair valued at amortized cost; and equity securities of foreign issuers whose fair value is determined by using systematic fair valuation models provided by independent third parties in order to adjust for stale pricing which may occur between the close of certain foreign exchanges and the close of the NYSE. Other securities that may be categorized as Level 2 in the hierarchy include, but are not limited to, preferred stocks, bank loans, swaps, investments in unregistered investment companies, options, and forward contracts.
Level 3 – Unobservable inputs for the asset or liability to the extent that relevant observable inputs are not available, representing the Fund’s own assumptions about the assumptions that a market participant would use in valuing the asset or liability, and that would be based on the best information available.
There have been no significant changes in valuation techniques used in valuing any such positions held by the Fund since the beginning of the fiscal year.
The inputs or methodology used for fair valuing securities are not necessarily an indication of the risk associated with investing in those securities. The summary of inputs used as of June 30, 2020 to fair value the Fund’s investments in securities and other financial instruments is included in the “Valuation Inputs Summary” in the Notes to Schedule of Investments and Other Information.
Investment Transactions and Investment Income
Investment transactions are accounted for as of the date purchased or sold (trade date). Dividend income is recorded on the ex-dividend date. Certain dividends from foreign securities will be recorded as soon as the Fund is informed of the dividend, if such information is obtained subsequent to the ex-dividend date. Dividends from foreign securities may be subject to withholding taxes in foreign jurisdictions. Interest income is recorded daily on the accrual basis and includes amortization of premiums and accretion of discounts. The Fund classifies gains and losses on prepayments received as an adjustment to interest income. Debt securities may be placed in non-accrual status and related interest income may be reduced by stopping current accruals and writing off interest receivables when collection of all or a portion of interest has become doubtful. Gains and losses are determined on the identified cost basis, which is the same basis used for federal income tax purposes. Income, as well as gains and losses, both realized and unrealized, are allocated daily to each class of shares based upon the ratio of net assets represented by each class as a percentage of total net assets.
Expenses
The Fund bears expenses incurred specifically on its behalf. Each class of shares bears a portion of general expenses, which are allocated daily to each class of shares based upon the ratio of net assets represented by each class as a percentage of total net assets. Expenses directly attributable to a specific class of shares are charged against the operations of such class.
Estimates
The preparation of financial statements in conformity with US GAAP requires management to make estimates and assumptions that affect the reported amount of assets and liabilities and disclosure of contingent assets and liabilities at the date of the financial statements, and the reported amounts of income and expenses during the reporting period. Actual results could differ from those estimates.
Indemnifications
In the normal course of business, the Fund may enter into contracts that contain provisions for indemnification of other parties against certain potential liabilities. The Fund’s maximum exposure under these arrangements is unknown, and
Janus Henderson Developed World Bond Fund
Notes to Financial Statements
would involve future claims that may be made against the Fund that have not yet occurred. Currently, the risk of material loss from such claims is considered remote.
Foreign Currency Translations
The Fund does not isolate that portion of the results of operations resulting from the effect of changes in foreign exchange rates on investments from the fluctuations arising from changes in market prices of securities held at the date of the financial statements. Net unrealized appreciation or depreciation of investments and foreign currency translations arise from changes in the value of assets and liabilities, including investments in securities held at the date of the financial statements, resulting from changes in the exchange rates and changes in market prices of securities held.
Currency gains and losses are also calculated on payables and receivables that are denominated in foreign currencies. The payables and receivables are generally related to foreign security transactions and income translations.
Foreign currency-denominated assets and forward currency contracts may involve more risks than domestic transactions, including currency risk, counterparty risk, political and economic risk, regulatory risk and equity risk. Risks may arise from unanticipated movements in the value of foreign currencies relative to the U.S. dollar.
Dividends and Distributions
Dividends are declared and distributed monthly for the Fund. Realized capital gains, if any, are declared and distributed in December. The Fund may treat a portion of the amount paid to redeem shares as a distribution of investment company taxable income and realized capital gains that are reflected in the net asset value. This practice, commonly referred to as “equalization,” has no effect on the redeeming shareholder or the Fund’s total return, but may reduce the amounts that would otherwise be required to be paid as taxable dividends to the remaining shareholders. It is possible that the Internal Revenue Service (IRS) could challenge the Fund's equalization methodology or calculations, and any such challenge could result in additional tax, interest, or penalties to be paid by the Fund.
The Fund may make certain investments in real estate investment trusts (“REITs”) which pay dividends to their shareholders based upon funds available from operations. It is quite common for these dividends to exceed the REITs’ taxable earnings and profits, resulting in the excess portion of such dividends being designated as a return of capital. If the Fund distributes such amounts, such distributions could constitute a return of capital to shareholders for federal income tax purposes.
Federal Income Taxes
The Fund intends to continue to qualify as a regulated investment company and distribute all of its taxable income in accordance with the requirements of Subchapter M of the Internal Revenue Code. Management has analyzed the Fund’s tax positions taken for all open federal income tax years, generally a three-year period, and has concluded that no provision for federal income tax is required in the Fund’s financial statements. The Fund is not aware of any tax positions for which it is reasonably possible that the total amounts of unrecognized tax benefits will significantly change in the next twelve months.
2. Derivative Instruments
The Fund may invest in various types of derivatives, which may at times result in significant derivative exposure. A derivative is a financial instrument whose performance is derived from the performance of another asset. The Fund may invest in derivative instruments including, but not limited to: futures contracts, put options, call options, options on futures contracts, options on foreign currencies, options on recovery locks, options on security and commodity indices, swaps, forward contracts, structured investments, and other equity-linked derivatives. Each derivative instrument that was held by the Fund during the year ended June 30, 2020 is discussed in further detail below. A summary of derivative activity by the Fund is reflected in the tables at the end of the Schedule of Investments.
The Fund may use derivative instruments for hedging purposes (to offset risks associated with an investment, currency exposure, or market conditions), to adjust currency exposure relative to a benchmark index, or for speculative purposes (to earn income and seek to enhance returns). When the Fund invests in a derivative for speculative purposes, the Fund will be fully exposed to the risks of loss of that derivative, which may sometimes be greater than the derivative’s cost. The Fund may not use any derivative to gain exposure to an asset or class of assets that it would be prohibited by its investment restrictions from purchasing directly. The Fund’s ability to use derivative instruments may also be limited by tax considerations.
Janus Henderson Developed World Bond Fund
Notes to Financial Statements
Investments in derivatives in general are subject to market risks that may cause their prices to fluctuate over time. Investments in derivatives may not directly correlate with the price movements of the underlying instrument. As a result, the use of derivatives may expose the Fund to additional risks that it would not be subject to if it invested directly in the securities underlying those derivatives. The use of derivatives may result in larger losses or smaller gains than otherwise would be the case. Derivatives can be volatile and may involve significant risks.
In pursuit of its investment objective, the Fund may seek to use derivatives to increase or decrease exposure to the following market risk factors:
· Commodity Risk – the risk related to the change in value of commodities or commodity-linked investments due to changes in the overall market movements, volatility of the underlying benchmark, changes in interest rates, or other factors affecting a particular industry or commodity such as drought, floods, weather, livestock disease, embargoes, tariffs, and international economic, political, and regulatory developments.
· Counterparty Risk – the risk that the counterparty (the party on the other side of the transaction) on a derivative transaction will be unable to honor its financial obligation to the Fund.
· Credit Risk – the risk an issuer will be unable to make principal and interest payments when due, or will default on its obligations.
· Currency Risk – the risk that changes in the exchange rate between currencies will adversely affect the value (in U.S. dollar terms) of an investment.
· Equity Risk – the risk related to the change in value of equity securities as they relate to increases or decreases in the general market.
· Index Risk – if the derivative is linked to the performance of an index, it will be subject to the risks associated with changes in that index. If the index changes, the Fund could receive lower interest payments or experience a reduction in the value of the derivative to below what the Fund paid. Certain indexed securities, including inverse securities (which move in an opposite direction to the index), may create leverage, to the extent that they increase or decrease in value at a rate that is a multiple of the changes in the applicable index.
· Interest Rate Risk – the risk that the value of fixed-income securities will generally decline as prevailing interest rates rise, which may cause the Fund’s NAV to likewise decrease.
· Leverage Risk – the risk associated with certain types of leveraged investments or trading strategies pursuant to which relatively small market movements may result in large changes in the value of an investment. The Fund creates leverage by investing in instruments, including derivatives, where the investment loss can exceed the original amount invested. Certain investments or trading strategies, such as short sales, that involve leverage can result in losses that greatly exceed the amount originally invested.
· Liquidity Risk – the risk that certain securities may be difficult or impossible to sell at the time that the seller would like or at the price that the seller believes the security is currently worth.
Derivatives may generally be traded OTC or on an exchange. Derivatives traded OTC are agreements that are individually negotiated between parties and can be tailored to meet a purchaser’s needs. OTC derivatives are not guaranteed by a clearing agency and may be subject to increased credit risk.
In an effort to mitigate credit risk associated with derivatives traded OTC, the Fund may enter into collateral agreements with certain counterparties whereby, subject to certain minimum exposure requirements, the Fund may require the counterparty to post collateral if the Fund has a net aggregate unrealized gain on all OTC derivative contracts with a particular counterparty. Additionally, the Fund may deposit cash and/or treasuries as collateral with the counterparty and/or custodian daily (based on the daily valuation of the financial asset) if the Fund has a net aggregate unrealized loss on OTC derivative contracts with a particular counterparty. All liquid securities and restricted cash are considered to cover in an amount at all times equal to or greater than the Fund’s commitment with respect to certain exchange-traded derivatives, centrally cleared derivatives, forward foreign currency exchange contracts, short sales, and/or securities with extended settlement dates. There is no guarantee that counterparty exposure is reduced and these arrangements are dependent on Janus Capital's ability to establish and maintain appropriate systems and trading.
Janus Henderson Developed World Bond Fund
Notes to Financial Statements
Forward Foreign Currency Exchange Contracts
A forward foreign currency exchange contract (“forward currency contract”) is an obligation to buy or sell a specified currency at a future date at a negotiated rate (which may be U.S. dollars or a foreign currency). The Fund may enter into forward currency contracts for hedging purposes, including, but not limited to, reducing exposure to changes in foreign currency exchange rates on foreign portfolio holdings and locking in the U.S. dollar cost of firm purchase and sale commitments for securities denominated in or exposed to foreign currencies. The Fund may also invest in forward currency contracts for non-hedging purposes such as seeking to enhance returns. The Fund is subject to currency risk and counterparty risk in the normal course of pursuing its investment objective through its investments in forward currency contracts.
Forward currency contracts are valued by converting the foreign value to U.S. dollars by using the current spot U.S. dollar exchange rate and/or forward rate for that currency. Exchange and forward rates as of the close of the NYSE shall be used to value the forward currency contracts. The unrealized appreciation/(depreciation) for forward currency contracts is reported in the Statement of Assets and Liabilities as a receivable or payable and in the Statement of Operations for the change in unrealized net appreciation/depreciation (if applicable). The gain or loss arising from the difference between the U.S. dollar cost of the original contract and the value of the foreign currency in U.S. dollars upon closing a forward currency contract is reported on the Statement of Operations (if applicable).
During the year, the Fund entered into forward currency contracts with the obligation to purchase foreign currencies in the future at an agreed upon rate in order to take a positive outlook on the related currency. These forward contracts seek to increase exposure to currency risk.
During the year, the Fund entered into forward currency contracts with the obligation to sell foreign currencies in the future at an agreed upon rate in order to take a negative outlook on the related currency. These forward contracts seek to increase exposure to currency risk.
During the year, the Fund entered into forward currency contracts with the obligation to sell foreign currencies in the future at an agreed upon rate in order to decrease exposure to currency risk associated with foreign currency denominated securities held by the Fund.
Futures Contracts
A futures contract is an exchange-traded agreement to take or make delivery of an underlying asset at a specific time in the future for a specific predetermined negotiated price. The Fund may enter into futures contracts to gain exposure to the stock market or other markets pending investment of cash balances or to meet liquidity needs. The Fund is subject to interest rate risk, equity risk, and currency risk in the normal course of pursuing its investment objective through its investments in futures contracts. The Fund may also use such derivative instruments to hedge or protect from adverse movements in securities prices, currency rates or interest rates. The use of futures contracts may involve risks such as the possibility of illiquid markets or imperfect correlation between the values of the contracts and the underlying securities, or that the counterparty will fail to perform its obligations.
Futures contracts on commodities are valued at the settlement price on valuation date on the commodities exchange as reported by an approved vendor. Mini contracts, as defined in the description of the contract, shall be valued using the Actual Settlement Price or “ASET” price type as reported by an approved vendor. In the event that foreign futures trade when the foreign equity markets are closed, the last foreign futures trade price shall be used. Futures contracts are marked-to-market daily, and the daily variation margin is recorded as a receivable or payable on the Statement of Assets and Liabilities (if applicable). The change in unrealized net appreciation/depreciation is reported on the Statement of Operations (if applicable). When a contract is closed, a realized gain or loss is reported on the Statement of Operations (if applicable), equal to the difference between the opening and closing value of the contract. Securities held by the Fund that are designated as collateral for market value on futures contracts are noted on the Schedule of Investments (if applicable). Such collateral is in the possession of the Fund’s futures commission merchant.
With futures, there is minimal counterparty credit risk to the Fund since futures are exchange-traded and the exchange’s clearinghouse, as counterparty to all exchange-traded futures, guarantees the futures against default.
During the year, the Fund purchased interest rate futures to increase exposure to interest rate risk.
During the year, the Fund sold interest rate futures to decrease exposure to interest rate risk.
Janus Henderson Developed World Bond Fund
Notes to Financial Statements
Swaps
Swap agreements are two-party contracts entered into primarily by institutional investors for periods ranging from a day to more than one year to exchange one set of cash flows for another. The most significant factor in the performance of swap agreements is the change in value of the specific index, security, or currency, or other factors that determine the amounts of payments due to and from the Fund. The use of swaps is a highly specialized activity which involves investment techniques and risks different from those associated with ordinary portfolio securities transactions. Swap transactions may in some instances involve the delivery of securities or other underlying assets by the Fund or its counterparty to collateralize obligations under the swap. If the other party to a swap that is not collateralized defaults, the Fund would risk the loss of the net amount of the payments that it contractually is entitled to receive. Swap agreements entail the risk that a party will default on its payment obligations to the Fund. If the other party to a swap defaults, the Fund would risk the loss of the net amount of the payments that it contractually is entitled to receive. If the Fund utilizes a swap at the wrong time or judges market conditions incorrectly, the swap may result in a loss to the Fund and reduce the Fund’s total return.
Swap agreements also bear the risk that the Fund will not be able to meet its obligation to the counterparty. Swap agreements are typically privately negotiated and entered into in the OTC market. However, certain swap agreements are required to be cleared through a clearinghouse and traded on an exchange or swap execution facility. Swaps that are required to be cleared are required to post initial and variation margins in accordance with the exchange requirements. Regulations enacted require the Fund to centrally clear certain interest rate and credit default index swaps through a clearinghouse or central counterparty (“CCP”). To clear a swap with a CCP, the Fund will submit the swap to, and post collateral with, a futures clearing merchant (“FCM”) that is a clearinghouse member. Alternatively, the Fund may enter into a swap with a financial institution other than the FCM (the “Executing Dealer”) and arrange for the swap to be transferred to the FCM for clearing. The Fund may also enter into a swap with the FCM itself. The CCP, the FCM, and the Executing Dealer are all subject to regulatory oversight by the U.S. Commodity Futures Trading Commission (“CFTC”). A default or failure by a CCP or an FCM, or the failure of a swap to be transferred from an Executing Dealer to the FCM for clearing, may expose the Fund to losses, increase its costs, or prevent the Fund from entering or exiting swap positions, accessing collateral, or fully implementing its investment strategies. The regulatory requirement to clear certain swaps could, either temporarily or permanently, reduce the liquidity of cleared swaps or increase the costs of entering into those swaps.
Index swaps, interest rate swaps, and credit default swaps are valued using an approved vendor supplied price. Basket swaps are valued using a broker supplied price. Equity swaps that consist of a single underlying equity are valued either at the closing price, the latest bid price, or the last sale price on the primary market or exchange it trades. The market value of swap contracts are aggregated by positive and negative values and are disclosed separately as an asset or liability on the Fund’s Statement of Assets and Liabilities (if applicable). Realized gains and losses are reported on the Fund’s Statement of Operations (if applicable). The change in unrealized net appreciation or depreciation during the year is included in the Statement of Operations (if applicable).
The Fund’s maximum risk of loss from counterparty risk or credit risk is the discounted value of the payments to be received from/paid to the counterparty over the contract’s remaining life, to the extent that the amount is positive. The risk is mitigated by having a netting arrangement between the Fund and the counterparty and by the posting of collateral by the counterparty to cover the Fund’s exposure to the counterparty.
The Fund may enter into various types of credit default swap agreements, including OTC credit default swap agreements and index credit default swaps (“CDX”), for investment purposes and to add leverage to its portfolio. Credit default swaps are a specific kind of counterparty agreement that allow the transfer of third party credit risk from one party to the other. One party in the swap is a lender and faces credit risk from a third party, and the counterparty in the credit default swap agrees to insure this risk in exchange for regular periodic payments. Credit default swaps could result in losses if the Fund does not correctly evaluate the creditworthiness of the company or companies on which the credit default swap is based. Credit default swap agreements may involve greater risks than if the Fund had invested in the reference obligation directly since, in addition to risks relating to the reference obligation, credit default swaps are subject to liquidity risk, counterparty risk, and credit risk. The Fund will generally incur a greater degree of risk when it sells a credit default swap than when it purchases a credit default swap. As a buyer of a credit default swap, the Fund may lose its investment and recover nothing should no credit event occur and the swap is held to its termination date. As seller of a credit default swap, if a credit event were to occur, the value of any deliverable obligation received by the
Janus Henderson Developed World Bond Fund
Notes to Financial Statements
Fund, coupled with the upfront or periodic payments previously received, may be less than what it pays to the buyer, resulting in a loss of value to the Fund.
As a buyer of credit protection, the Fund is entitled to receive the par (or other agreed-upon) value of a referenced debt obligation from the counterparty to the contract in the event of a default or other credit event by a third party, such as a U.S. or foreign issuer, on the debt obligation. In return, the Fund as buyer would pay to the counterparty a periodic stream of payments over the term of the contract provided that no credit event has occurred. If no credit event occurs, the Fund would have spent the stream of payments and potentially received no benefit from the contract.
If the Fund is the seller of credit protection against a particular security, the Fund would receive an up-front or periodic payment to compensate against potential credit events. As the seller in a credit default swap contract, the Fund would be required to pay the par value (the “notional value”) (or other agreed-upon value) of a referenced debt obligation to the counterparty in the event of a default by a third party, such as a U.S. or foreign corporate issuer, on the debt obligation. In return, the Fund would receive from the counterparty a periodic stream of payments over the term of the contract provided that no event of default has occurred. If no default occurs, the Fund would keep the stream of payments and would have no payment obligations. As the seller, the Fund would effectively add leverage to its portfolio because, in addition to its total net assets, the Fund would be subject to investment exposure on the notional value of the swap. The maximum potential amount of future payments (undiscounted) that the Fund as a seller could be required to make in a credit default transaction would be the notional amount of the agreement.
The Fund may invest in single-name credit default swaps (“CDS”) to buy or sell credit protection to hedge its credit exposure, gain issuer exposure without owning the underlying security, or increase the Fund’s total return. Single-name CDS enable the Fund to buy or sell protection against a credit event of a specific issuer. When the Fund buys a single-name CDS, the Fund will receive a return on its investment only in the event of a credit event, such as default by the issuer of the underlying obligation (as opposed to a credit downgrade or other indication of financial difficulty). If a single-name CDS transaction is particularly large, or if the relevant market is illiquid, it may not be possible for the Fund to initiate a single-name CDS transaction or to liquidate its position at an advantageous time or price, which may result in significant losses. Moreover, the Fund bears the risk of loss of the amount expected to be received under a single-name CDS in the event of the default or bankruptcy of the counterparty. The risks associated with cleared single-name CDS may be lower than that for uncleared single-name CDS because for cleared single-name CDS, the counterparty is a clearinghouse (to the extent such a trading market is available). However, there can be no assurance that a clearinghouse or its members will satisfy their obligations to the Fund.
The Fund may invest in CDXs. A CDX is a swap on an index of credit default swaps. CDXs allow an investor to manage credit risk or take a position on a basket of credit entities (such as credit default swaps or commercial mortgage-backed securities) in a more efficient manner than transacting in a single-name CDS. If a credit event occurs in one of the underlying companies, the protection is paid out via the delivery of the defaulted bond by the buyer of protection in return for a payment of notional value of the defaulted bond by the seller of protection or it may be settled through a cash settlement between the two parties. The underlying company is then removed from the index. If the Fund holds a long position in a CDX, the Fund would indirectly bear its proportionate share of any expenses paid by a CDX. A Fund holding a long position in CDXs typically receives income from principal or interest paid on the underlying securities. By investing in CDXs, the Fund could be exposed to illiquidity risk, counterparty risk, and credit risk of the issuers of the underlying loan obligations and of the CDX markets. If there is a default by the CDX counterparty, the Fund will have contractual remedies pursuant to the agreements related to the transaction. CDXs also bear the risk that the Fund will not be able to meet its obligation to the counterparty.
During the year, the Fund purchased protection via the credit default swap market in order to reduce credit risk exposure to individual corporates, countries and/or credit indices where reducing this exposure via the cash bond market was less attractive.
During the year, the Fund sold protection via the credit default swap market in order to gain credit risk exposure to individual corporates, countries and/or credit indices where gaining this exposure via the cash bond market was less attractive.
Janus Henderson Developed World Bond Fund
Notes to Financial Statements
3. Other Investments and Strategies
Additional Investment Risk
The Fund may be invested in lower-rated debt securities that have a higher risk of default or loss of value since these securities may be sensitive to economic changes, political changes, or adverse developments specific to the issuer.
In the aftermath of the 2007-2008 financial crisis, the financial sector experienced reduced liquidity in credit and other fixed-income markets, and an unusually high degree of volatility, both domestically and internationally. In response to the crisis, the United States and certain foreign governments, along with the U.S. Federal Reserve and certain foreign central banks, took a number of unprecedented steps designed to support the financial markets. For example, the enactment of the Dodd-Frank Act in 2010 provided for widespread regulation of financial institutions, consumer financial products and services, broker-dealers, over-the-counter derivatives, investment advisers, credit rating agencies, and mortgage lending, which expanded federal oversight in the financial sector, including the investment management industry. More recently, in response to the COVID-19 pandemic, the U.S. government and the Federal Reserve, as well as certain foreign governments and central banks, have taken extraordinary actions to support local and global economies and the financial markets, including reducing interest rates to record low levels. The withdrawal of this support, a failure of measures put in place in response to such economic uncertainty, or investor perception that such efforts were not sufficient could each negatively affect financial markets generally, and the value and liquidity of specific securities. In addition, policy and legislative changes in the United States and in other countries continue to impact many aspects of financial regulation.
Widespread disease, including pandemics and epidemics, and natural or environmental disasters, such as earthquakes, fires, floods, hurricanes, tsunamis and weather-related phenomena generally, have been and can be highly disruptive to economies and markets, adversely impacting individual companies, sectors, industries, markets, currencies, interest and inflation rates, credit ratings, investor sentiment, and other factors affecting the value of a Fund’s investments. Economies and financial markets throughout the world have become increasingly interconnected, which increases the likelihood that events or conditions in one region or country will adversely affect markets or issuers in other regions or countries, including the United States. These disruptions could prevent a Fund from executing advantageous investment decisions in a timely manner and negatively impact a Fund’s ability to achieve its investment objective(s). Any such event(s) could have a significant adverse impact on the value of a Fund. In addition, these disruptions could also impair the information technology and other operational systems upon which the Fund’s service providers, including Janus Capital or the subadviser (as applicable), rely, and could otherwise disrupt the ability of employees of the Fund’s service providers to perform essential tasks on behalf of the Fund.
A number of countries in the European Union (“EU”) have experienced, and may continue to experience, severe economic and financial difficulties. In particular, many EU nations are susceptible to economic risks associated with high levels of debt. Many non-governmental issuers, and even certain governments, have defaulted on, or been forced to restructure, their debts. Many other issuers have faced difficulties obtaining credit or refinancing existing obligations. Financial institutions have in many cases required government or central bank support, have needed to raise capital, and/or have been impaired in their ability to extend credit. As a result, financial markets in the EU have experienced extreme volatility and declines in asset values and liquidity. Responses to these financial problems by European governments, central banks, and others, including austerity measures and reforms, may not work, may result in social unrest, and may limit future growth and economic recovery or have other unintended consequences. The risk of investing in securities in the European markets may also be heightened due to the referendum in which the United Kingdom voted to exit the EU (commonly known as “Brexit”). The United Kingdom formally left the EU on January 31, 2020 and entered into an eleven-month transition period, during which the United Kingdom will remain subject to EU laws and regulations. There is considerable uncertainty relating to the potential consequences of the United Kingdom’s exit and how negotiations for new trade agreements will be conducted or concluded.
Certain areas of the world have historically been prone to and economically sensitive to environmental events such as, but not limited to, hurricanes, earthquakes, typhoons, flooding, tidal waves, tsunamis, erupting volcanoes, wildfires or droughts, tornadoes, mudslides, or other weather-related phenomena. Such disasters, and the resulting physical or economic damage, could have a severe and negative impact on the Fund’s investment portfolio and, in the longer term, could impair the ability of issuers in which the Fund invests to conduct their businesses as they would under normal conditions. Adverse weather conditions may also have a particularly significant negative effect on issuers in the agricultural sector and on insurance and reinsurance companies that insure or reinsure against the impact of natural disasters.
Janus Henderson Developed World Bond Fund
Notes to Financial Statements
Counterparties
Fund transactions involving a counterparty are subject to the risk that the counterparty or a third party will not fulfill its obligation to the Fund (“counterparty risk”). Counterparty risk may arise because of the counterparty’s financial condition (i.e., financial difficulties, bankruptcy, or insolvency), market activities and developments, or other reasons, whether foreseen or not. A counterparty’s inability to fulfill its obligation may result in significant financial loss to the Fund. The Fund may be unable to recover its investment from the counterparty or may obtain a limited recovery, and/or recovery may be delayed. The extent of the Fund’s exposure to counterparty risk with respect to financial assets and liabilities approximates its carrying value. See the "Offsetting Assets and Liabilities" section of this Note for further details.
The Fund may be exposed to counterparty risk through participation in various programs, including, but not limited to, lending its securities to third parties, cash sweep arrangements whereby the Fund’s cash balance is invested in one or more types of cash management vehicles, as well as investments in, but not limited to, repurchase agreements, debt securities, and derivatives, including various types of swaps, futures and options. The Fund intends to enter into financial transactions with counterparties that Janus Capital believes to be creditworthy at the time of the transaction. There is always the risk that Janus Capital’s analysis of a counterparty’s creditworthiness is incorrect or may change due to market conditions. To the extent that the Fund focuses its transactions with a limited number of counterparties, it will have greater exposure to the risks associated with one or more counterparties.
Loans
The Fund may invest in various commercial loans, including bank loans, bridge loans, debtor-in-possession (“DIP”) loans, mezzanine loans, and other fixed and floating rate loans. These loans may be acquired through loan participations and assignments or on a when-issued basis. Commercial loans will comprise no more than 20% of the Fund’s total assets. Below are descriptions of the types of loans held by the Fund as of June 30, 2020.
· Bank Loans - Bank loans are obligations of companies or other entities entered into in connection with recapitalizations, acquisitions, and refinancings. The Fund’s investments in bank loans are generally acquired as a participation interest in, or assignment of, loans originated by a lender or other financial institution. These investments may include institutionally-traded floating and fixed-rate debt securities.
· Floating Rate Loans – Floating rate loans are debt securities that have floating interest rates, that adjust periodically, and are tied to a benchmark lending rate, such as London Interbank Offered Rate (“LIBOR”). In other cases, the lending rate could be tied to the prime rate offered by one or more major U.S. banks or the rate paid on large certificates of deposit traded in the secondary markets. If the benchmark lending rate changes, the rate payable to lenders under the loan will change at the next scheduled adjustment date specified in the loan agreement. Floating rate loans are typically issued to companies (‘‘borrowers’’) in connection with recapitalizations, acquisitions, and refinancings. Floating rate loan investments are generally below investment grade. Senior floating rate loans are secured by specific collateral of a borrower and are senior in the borrower’s capital structure. The senior position in the borrower’s capital structure generally gives holders of senior loans a claim on certain of the borrower’s assets that is senior to subordinated debt and preferred and common stock in the case of a borrower’s default. Floating rate loan investments may involve foreign borrowers, and investments may be denominated in foreign currencies. Floating rate loans often involve borrowers whose financial condition is troubled or uncertain and companies that are highly leveraged. The Fund may invest in obligations of borrowers who are in bankruptcy proceedings. While the Fund generally expects to invest in fully funded term loans, certain of the loans in which the Fund may invest include revolving loans, bridge loans, and delayed draw term loans.
Purchasers of floating rate loans may pay and/or receive certain fees. The Fund may receive fees such as covenant waiver fees or prepayment penalty fees. The Fund may pay fees such as facility fees. Such fees may affect the Fund’s return.
· Mezzanine Loans - Mezzanine loans are secured by the stock of the company that owns the assets. Mezzanine loans are a hybrid of debt and equity financing that is typically used to fund the expansion of existing companies. A mezzanine loan is composed of debt capital that gives the lender the right to convert to an ownership or equity interest in the company if the loan is not paid back in time and in full. Mezzanine loans typically are the most subordinated debt obligation in an issuer’s capital structure.
Janus Henderson Developed World Bond Fund
Notes to Financial Statements
Inflation-Linked Securities
The Fund may invest in inflation-indexed bonds, including municipal inflation-indexed bonds and corporate inflation-indexed bonds, or in derivatives that are linked to these securities. Inflation-linked bonds are fixed-income securities that have a principal value that is periodically adjusted according to the rate of inflation. If an index measuring inflation falls, the principal value of inflation-indexed bonds will typically be adjusted downward, and consequently the interest payable on these securities (calculated with respect to a smaller principal amount) will be reduced. Because of their inflation adjustment feature, inflation-linked bonds typically have lower yields than conventional fixed-rate bonds. In addition, inflation-linked bonds also normally decline in price when real interest rates rise. In the event of deflation, when prices decline over time, the principal and income of inflation-linked bonds would likely decline, resulting in losses to the Fund.
In the case of Treasury Inflation-Protected Securities, also known as TIPS, repayment of original bond principal upon maturity (as adjusted for inflation) is guaranteed by the U.S. Treasury. For inflation-linked bonds that do not provide a similar guarantee, the adjusted principal value of the inflation-linked bond repaid at maturity may be less than the original principal. Other non-U.S. sovereign governments also issue inflation-linked securities (sometimes referred to as “linkers”) that are tied to their own local consumer price indices. In certain of these non-U.S. jurisdictions, the repayment of the original bond principal upon the maturity of an inflation-linked bond is not guaranteed, allowing for the amount of the bond repaid at maturity to be less than par. Inflation-linked bonds may also be issued by, or related to, sovereign governments of other developed countries, emerging market countries, or companies or other entities not affiliated with governments.
Mortgage- and Asset-Backed Securities
Mortgage- and asset-backed securities represent interests in “pools” of commercial or residential mortgages or other assets, including consumer loans or receivables. The Fund may purchase fixed or variable rate commercial or residential mortgage-backed securities issued by the Government National Mortgage Association (“Ginnie Mae”), the Federal National Mortgage Association (“Fannie Mae”), the Federal Home Loan Mortgage Corporation (“Freddie Mac”), or other governmental or government-related entities. Ginnie Mae’s guarantees are backed by the full faith and credit of the U.S. Government, which means that the U.S. Government guarantees that the interest and principal will be paid when due. Fannie Mae and Freddie Mac securities are not backed by the full faith and credit of the U.S. Government. In September 2008, the Federal Housing Finance Agency (“FHFA”), an agency of the U.S. Government, placed Fannie Mae and Freddie Mac under conservatorship. Since that time, Fannie Mae and Freddie Mac have received capital support through U.S. Treasury preferred stock purchases, and Treasury and Federal Reserve purchases of their mortgage-backed securities. The FHFA and the U.S. Treasury have imposed strict limits on the size of these entities’ mortgage portfolios. The FHFA has the power to cancel any contract entered into by Fannie Mae and Freddie Mac prior to FHFA’s appointment as conservator or receiver, including the guarantee obligations of Fannie Mae and Freddie Mac.
The Fund may also purchase other mortgage- and asset-backed securities through single- and multi-seller conduits, collateralized debt obligations, structured investment vehicles, and other similar securities. Asset-backed securities may be backed by various consumer obligations, including automobile loans, equipment leases, credit card receivables, or other collateral. In the event the underlying loans are not paid, the securities’ issuer could be forced to sell the assets and recognize losses on such assets, which could impact your return. Unlike traditional debt instruments, payments on these securities include both interest and a partial payment of principal. Mortgage- and asset-backed securities are subject to both extension risk, where borrowers pay off their debt obligations more slowly in times of rising interest rates, and prepayment risk, where borrowers pay off their debt obligations sooner than expected in times of declining interest rates. These risks may reduce the Fund’s returns. In addition, investments in mortgage- and asset-backed securities, including those comprised of subprime mortgages, may be subject to a higher degree of credit risk, valuation risk, and liquidity risk than various other types of fixed-income securities. Additionally, although mortgage-backed securities are generally supported by some form of government or private guarantee and/or insurance, there is no assurance that guarantors or insurers will meet their obligations.
Offsetting Assets and Liabilities
The Fund presents gross and net information about transactions that are either offset in the financial statements or subject to an enforceable master netting arrangement or similar agreement with a designated counterparty, regardless of whether the transactions are actually offset in the Statement of Assets and Liabilities.
In order to better define its contractual rights and to secure rights that will help the Fund mitigate its counterparty risk, the Fund has entered into an International Swaps and Derivatives Association, Inc. Master Agreement (“ISDA Master
Janus Henderson Developed World Bond Fund
Notes to Financial Statements
Agreement”) or similar agreement with its derivative contract counterparties. An ISDA Master Agreement is a bilateral agreement between the Fund and a counterparty that governs OTC derivatives and forward foreign currency exchange contracts and typically contains, among other things, collateral posting terms and netting provisions in the event of a default and/or termination event. Under an ISDA Master Agreement, in the event of a default and/or termination event, the Fund may offset with each counterparty certain derivative financial instruments’ payables and/or receivables with collateral held and/or posted and create one single net payment.
The following tables present gross amounts of recognized assets and/or liabilities and the net amounts after deducting collateral that has been pledged by counterparties or has been pledged to counterparties (if applicable). For corresponding information grouped by type of instrument, see the “Fair Value of Derivative Instruments (not accounted for as hedging instruments) as of June 30, 2020” table located in the Fund’s Schedule of Investments.
| | | | | | | | | | |
Offsetting of Financial Assets and Derivative Assets |
| |
| | | Gross Amounts | | | | | | |
| | | of Recognized | | Offsetting Asset | | Collateral | | |
Counterparty | | Assets | | or Liability(a) | | Pledged(b) | | Net Amount |
| | | | | | | | | |
Barclays Capital, Inc | $ | 36,127 | $ | — | $ | — | $ | 36,127 |
BNP Paribas | | 2,296,923 | | (2,296,923) | | — | | — |
| | | | | | | | | |
Total | $ | 2,333,050 | $ | (2,296,923) | $ | — | $ | 36,127 |
Offsetting of Financial Liabilities and Derivative Liabilities |
| |
| | | Gross Amounts | | | | | | |
| | | of Recognized | | Offsetting Asset | | Collateral | | |
Counterparty | | Liabilities | | or Liability(a) | | Pledged(b) | | Net Amount |
| | | | | | | | | |
BNP Paribas | $ | 2,542,548 | $ | (2,296,923) | $ | — | $ | 245,625 |
JPMorgan Chase & Co | | 7,375 | | — | | — | | 7,375 |
| | | | | | | | | |
Total | $ | 2,549,923 | $ | (2,296,923) | $ | — | $ | 253,000 |
(a) | Represents the amount of assets or liabilities that could be offset with the same counterparty under master netting or similar agreements that management elects not to offset on the Statement of Assets and Liabilities. |
(b) | Collateral pledged is limited to the net outstanding amount due to/from an individual counterparty. The actual collateral amounts pledged may exceed these amounts and may fluctuate in value. |
The Fund generally does not exchange collateral on its forward foreign currency contracts with its counterparties; however, all liquid securities and restricted cash are considered to cover in an amount at all times equal to or greater than the Fund’s commitment with respect to these contracts. Certain securities may be segregated at the Fund’s custodian. These segregated securities are denoted on the accompanying Schedule of Investments and are evaluated daily to ensure their cover and/or market value equals or exceeds the Fund’s corresponding forward foreign currency exchange contract's obligation value.
The Fund may require the counterparty to pledge securities as collateral daily (based on the daily valuation of the financial asset) if the Fund has a net aggregate unrealized gain on OTC derivative contracts with a particular counterparty. The Fund may deposit cash as collateral with the counterparty and/or custodian daily (based on the daily valuation of the financial asset) if the Fund has a net aggregate unrealized loss on OTC derivative contracts with a particular counterparty. The collateral amounts are subject to minimum exposure requirements and initial margin requirements. Collateral amounts are monitored and subsequently adjusted up or down as valuations fluctuate by at least the minimum exposure requirement. Collateral may reduce the risk of loss.
Janus Henderson Developed World Bond Fund
Notes to Financial Statements
Real Estate Investing
The Fund may invest in equity and debt securities of real estate-related companies. Such companies may include those in the real estate industry or real estate-related industries. These securities may include common stocks, corporate bonds, preferred stocks, and other equity securities, including, but not limited to, mortgage-backed securities, real estate-backed securities, securities of REITs and similar REIT-like entities. A REIT is a trust that invests in real estate-related projects, such as properties, mortgage loans, and construction loans. REITs are generally categorized as equity, mortgage, or hybrid REITs. A REIT may be listed on an exchange or traded OTC.
Securities Lending
Under procedures adopted by the Trustees, the Fund may seek to earn additional income by lending securities to certain qualified broker-dealers and institutions. Effective December 16, 2019, JPMorgan Chase Bank, National Association replaced Deutsche Bank AG as securities lending agent for the Fund. JPMorgan Chase Bank, National Association acts as securities lending agent and a limited purpose custodian or subcustodian to receive and disburse cash balances and cash collateral, hold short-term investments, hold collateral, and perform other custodial functions in accordance with the Non-Custodial Securities Lending Agreement. The Fund may lend fund securities in an amount equal to up to 1/3 of its total assets as determined at the time of the loan origination. There is the risk of delay in recovering a loaned security or the risk of loss in collateral rights if the borrower fails financially. In addition, Janus Capital makes efforts to balance the benefits and risks from granting such loans. All loans will be continuously secured by collateral which may consist of cash, U.S. Government securities, domestic and foreign short-term debt instruments, letters of credit, time deposits, repurchase agreements, money market mutual funds or other money market accounts, or such other collateral as permitted by the Securities and Exchange Commission (the "SEC"). If the Fund is unable to recover a security on loan, the Fund may use the collateral to purchase replacement securities in the market. There is a risk that the value of the collateral could decrease below the cost of the replacement security by the time the replacement investment is made, resulting in a loss to the Fund. In certain circumstances individual loan transactions could yield negative returns.
Upon receipt of cash collateral, Janus Capital may invest it in affiliated or non-affiliated cash management vehicles, whether registered or unregistered entities, as permitted by the 1940 Act and rules promulgated thereunder. Janus Capital currently intends to primarily invest the cash collateral in a cash management vehicle for which Janus Capital serves as investment adviser, Janus Henderson Cash Collateral Fund LLC. An investment in Janus Henderson Cash Collateral Fund LLC is generally subject to the same risks that shareholders experience when investing in similarly structured vehicles, such as the potential for significant fluctuations in assets as a result of the purchase and redemption activity of the securities lending program, a decline in the value of the collateral, and possible liquidity issues. Such risks may delay the return of the cash collateral and cause the Fund to violate its agreement to return the cash collateral to a borrower in a timely manner. As adviser to the Fund and Janus Henderson Cash Collateral Fund LLC, Janus Capital has an inherent conflict of interest as a result of its fiduciary duties to both the Fund and Janus Henderson Cash Collateral Fund LLC. Additionally, Janus Capital receives an investment advisory fee of 0.05% for managing Janus Henderson Cash Collateral Fund LLC, but it may not receive a fee for managing certain other affiliated cash management vehicles in which the Fund may invest, and therefore may have an incentive to allocate preferred investment opportunities to investment vehicles for which it is receiving a fee.
The value of the collateral must be at least 102% of the market value of the loaned securities that are denominated in U.S. dollars and 105% of the market value of the loaned securities that are not denominated in U.S. dollars. Loaned securities and related collateral are marked-to-market each business day based upon the market value of the loaned securities at the close of business, employing the most recent available pricing information. Collateral levels are then adjusted based on this mark-to-market evaluation.
The cash collateral invested by Janus Capital is disclosed in the Schedule of Investments (if applicable).
Income earned from the investment of the cash collateral, net of rebates paid to, or fees paid by, borrowers and less the fees paid to the lending agent are included as “Affiliated securities lending income, net” on the Statement of Operations.
There were no securities on loan as of June 30, 2020.
Sovereign Debt
The Fund may invest in U.S. and non-U.S. government debt securities (“sovereign debt”). Some investments in sovereign debt, such as U.S. sovereign debt, are considered low risk. However, investments in sovereign debt, especially the debt of less developed countries, can involve a high degree of risk, including the risk that the governmental entity that
Janus Henderson Developed World Bond Fund
Notes to Financial Statements
controls the repayment of sovereign debt may not be willing or able to repay the principal and/or to pay the interest on its sovereign debt in a timely manner. A sovereign debtor’s willingness or ability to satisfy its debt obligation may be affected by various factors including, but not limited to, its cash flow situation, the extent of its foreign currency reserves, the availability of foreign exchange when a payment is due, the relative size of its debt position in relation to its economy as a whole, the sovereign debtor’s policy toward international lenders, and local political constraints to which the governmental entity may be subject. Sovereign debtors may also be dependent on expected disbursements from foreign governments, multilateral agencies, and other entities. The failure of a sovereign debtor to implement economic reforms, achieve specified levels of economic performance, or repay principal or interest when due may result in the cancellation of third party commitments to lend funds to the sovereign debtor, which may further impair such debtor’s ability or willingness to timely service its debts. The Fund may be requested to participate in the rescheduling of such sovereign debt and to extend further loans to governmental entities, which may adversely affect the Fund’s holdings. In the event of default, there may be limited or no legal remedies for collecting sovereign debt and there may be no bankruptcy proceedings through which the Fund may collect all or part of the sovereign debt that a governmental entity has not repaid. In addition, to the extent the Fund invests in non-U.S. sovereign debt, it may be subject to currency risk.
When-Issued, Delayed Delivery and Forward Commitment Transactions
The Fund may purchase or sell securities on a when-issued, delayed delivery, or forward commitment basis. When purchasing a security on a when-issued, delayed delivery, or forward commitment basis, the Fund assumes the rights and risks of ownership of the security, including the risk of price and yield fluctuations, and takes such fluctuations into account when determining its net asset value. Typically, no income accrues on securities the Fund has committed to purchase prior to the time delivery of the securities is made. Because the Fund is not required to pay for the security until the delivery date, these risks are in addition to the risks associated with the Fund’s other investments. If the other party to a transaction fails to deliver the securities, the Fund could miss a favorable price or yield opportunity. If the Fund remains substantially fully invested at a time when when-issued, delayed delivery, or forward commitment purchases are outstanding, the purchases may result in a form of leverage.
When the Fund has sold a security on a when-issued, delayed delivery, or forward commitment basis, the Fund does not participate in future gains or losses with respect to the security. If the other party to a transaction fails to pay for the securities, the Fund could suffer a loss. Additionally, when selling a security on a when-issued, delayed delivery, or forward commitment basis without owning the security, the Fund will incur a loss if the security’s price appreciates in value such that the security’s price is above the agreed upon price on the settlement date. The Fund may dispose of or renegotiate a transaction after it is entered into, and may purchase or sell when-issued, delayed delivery or forward commitment securities before the settlement date, which may result in a gain or loss.
4. Investment Advisory Agreements and Other Transactions with Affiliates
The Fund pays Janus Capital an investment advisory fee which is calculated daily and paid monthly. The following table reflects the Fund’s contractual investment advisory fee rate (expressed as an annual rate).
| | |
Average Daily Net Assets of the Fund | Contractual Investment Advisory Fee (%) |
First $1 Billion | 0.55 |
Next $500 Million | 0.50 |
Above $1.5 Billion | 0.45 |
The Fund’s actual investment advisory fee rate for the reporting period was 0.53% of average annual net assets before any applicable waivers.
Janus Capital has entered into a personnel-sharing arrangement with its foreign (non-U.S.) affiliates, Henderson Global Investors Limited, Henderson Global Investors (Japan) Ltd., and Henderson Global Investors (Singapore) Ltd. (collectively, “HGIL”), pursuant to which HGIL and certain employees of HGIL serve as “associated persons” of Janus Capital. In this capacity, such employees of HGIL are subject to the oversight and supervision of Janus Capital and may provide portfolio management, research, and related services to the Fund on behalf of Janus Capital.
Effective March 31, 2020, Janus Capital has contractually agreed to waive the advisory fee payable by the Fund or reimburse expenses in an amount equal to the amount, if any, that the Fund’s total annual fund operating expenses, including the investment advisory fee, networking/omnibus/administrative fees and out-of-pocket transfer agency fees, but excluding the fees payable pursuant to a Rule 12b-1 plan, shareholder servicing fees, such as transfer agency fees
Janus Henderson Developed World Bond Fund
Notes to Financial Statements
(but not including out-of-pocket costs), and administrative services fees, brokerage commissions, interest, dividends, taxes, acquired fund fees and expenses, and extraordinary expenses, exceed the annual rate of 0.57% of the Fund’s average daily net assets. Janus Capital has agreed to continue the waivers until at least October 31, 2021. Networking/omnibus/administrative fees and out-of-pocket transfer agency fees were not waived under the Fund’s prior expense limitation agreement. The previous expense limit (until March 30, 2020) was 0.64%. If applicable, amounts waived and/or reimbursed to the Fund by Janus Capital are disclosed as “Excess Expense Reimbursement and Waivers” on the Statement of Operations.
Janus Services LLC (“Janus Services”), a wholly-owned subsidiary of Janus Capital, is the Fund’s transfer agent. In addition, Janus Services provides or arranges for the provision of certain other administrative services including, but not limited to, recordkeeping, accounting, order processing, and other shareholder services for the Fund. Janus Services is not compensated for its services related to the shares, except for out-of-pocket costs. These amounts are disclosed as “Other transfer agent fees and expenses” on the Statement of Operations.
Certain, but not all, intermediaries may charge administrative fees (such as networking and omnibus) to investors in Class A Shares, Class C Shares, and Class I Shares for administrative services provided on behalf of such investors. These administrative fees are paid by the Class A Shares, Class C Shares, and Class I Shares of the Fund to Janus Services, which uses such fees to reimburse intermediaries. Consistent with the Transfer Agency Agreement between Janus Services and the Fund, Janus Services may negotiate the level, structure, and/or terms of the administrative fees with intermediaries requiring such fees on behalf of the Fund. Janus Capital and its affiliates benefit from an increase in assets that may result from such relationships. The Funds’ Trustees have set limits on fees that the Funds may incur with respect to administrative fees paid for omnibus or networked accounts. Such limits are subject to change by the Trustees in the future. These amounts are disclosed as “Transfer agent networking and omnibus fees” on the Statement of Operations.
Effective July 1, 2019, the Board of Trustees of Janus Investment Fund approved a new administrative fee rate for Class D Shares detailed in the table below.
| | |
Average Daily Net Assets of Class D Shares of the Janus Henderson funds | Administrative Services Fee |
Under $40 billion | 0.12% |
$40 billion – $49.9 billion | 0.10% |
Over $49.9 billion | 0.08% |
The Fund’s actual Class D administrative fee rate was 0.12% for the reporting period.
Prior to July 1, 2019, the Fund’s Class D Shares paid an administrative services fee at an annual rate of 0.12% of the average daily net assets of Class D Shares for shareholder services provided by Janus Services. Janus Services provides or arranges for the provision of shareholder services including, but not limited to, recordkeeping, accounting, answering inquiries regarding accounts, transaction processing, transaction confirmations, and the mailing of prospectuses and shareholder reports. These amounts are disclosed as “Transfer agent administrative fees and expenses” on the Statement of Operations.
Janus Services receives an administrative services fee at an annual rate of up to 0.25% of the average daily net assets of the Fund’s Class S Shares and Class T Shares for providing or procuring administrative services to investors in Class S Shares and Class T Shares of the Fund. Janus Services expects to use all or a significant portion of this fee to compensate retirement plan service providers, broker-dealers, bank trust departments, financial advisors, and other financial intermediaries for providing these services. Janus Services or its affiliates may also pay fees for services provided by intermediaries to the extent the fees charged by intermediaries exceed the 0.25% of net assets charged to Class S Shares and Class T Shares of the Fund. Janus Services may keep certain amounts retained for reimbursement of out-of-pocket costs incurred for servicing clients of Class S Shares and Class T Shares. These amounts are disclosed as “Transfer agent administrative fees and expenses” on the Statement of Operations.
Services provided by these financial intermediaries may include, but are not limited to, recordkeeping, subaccounting, order processing, providing order confirmations, periodic statements, forwarding prospectuses, shareholder reports, and other materials to existing customers, answering inquiries regarding accounts, and other administrative services. Order processing includes the submission of transactions through the National Securities Clearing Corporation (“NSCC”) or similar systems, or those processed on a manual basis with Janus Capital. For all share classes, Janus Services also seeks reimbursement for costs it incurs as transfer agent and for providing servicing.
Janus Henderson Developed World Bond Fund
Notes to Financial Statements
Janus Services is compensated for its services related to the Fund’s Class D Shares. These amounts are disclosed as “Other transfer agent fees and expenses” on the Statement of Operations.
Under a distribution and shareholder servicing plan (the “Plan”) adopted in accordance with Rule 12b-1 under the 1940 Act, the Fund pays the Trust’s distributor, Janus Henderson Distributors, a wholly-owned subsidiary of Janus Capital, a fee for the sale and distribution and/or shareholder servicing of the Shares at an annual rate of up to 0.25% of the Class A Shares’ average daily net assets, of up to 1.00% of the Class C Shares’ average daily net assets and of up to 0.25% of the Class S Shares’ average daily net assets. Under the terms of the Plan, the Trust is authorized to make payments to Janus Henderson Distributors for remittance to retirement plan service providers, broker-dealers, bank trust departments, financial advisors, and other financial intermediaries, as compensation for distribution and/or shareholder services performed by such entities for their customers who are investors in the Fund. These amounts are disclosed as “12b-1 Distribution and shareholder servicing fees” on the Statement of Operations. Payments under the Plan are not tied exclusively to actual 12b-1 distribution and shareholder service expenses, and the payments may exceed 12b-1 distribution and shareholder service expenses actually incurred. If any of the Fund’s actual 12b-1 distribution and shareholder service expenses incurred during a calendar year are less than the payments made during a calendar year, the Fund will be refunded the difference. Refunds, if any, are included in “12b-1 Distribution and shareholder servicing fees” in the Statement of Operations.
Janus Capital serves as administrator to the Fund pursuant to an administration agreement between Janus Capital and the Trust. Under the administration agreement, Janus Capital is obligated to provide or arrange for the provision of certain administration, compliance, and accounting services to the Fund, including providing office space for the Fund, and is reimbursed by the Fund for certain of its costs in providing these services (to the extent Janus Capital seeks reimbursement and such costs are not otherwise waived). In addition, employees of Janus Capital and/or its affiliates may serve as officers of the Trust. The Fund pays for some or all of the salaries, fees, and expenses of Janus Capital employees and Fund officers, with respect to certain specified administration functions they perform on behalf of the Fund. The Fund pays these costs based on out-of-pocket expenses incurred by Janus Capital, and these costs are separate and apart from advisory fees and other expenses paid in connection with the investment advisory services Janus Capital (or any subadvisor, as applicable) provides to the Fund. These amounts are disclosed as “Affiliated fund administration fees” on the Statement of Operations. In addition, some expenses related to compensation payable to the Fund’s Chief Compliance Officer and certain compliance staff, all of whom are employees of Janus Capital and/or its affiliates, are shared with the Fund. Total compensation of $473,267 was paid to the Chief Compliance Officer and certain compliance staff by the Trust during the year ended June 30, 2020. The Fund's portion is reported as part of “Other expenses” on the Statement of Operations.
The Board of Trustees has adopted a deferred compensation plan (the “Deferred Plan”) for independent Trustees to elect to defer receipt of all or a portion of the annual compensation they are entitled to receive from the Fund. All deferred fees are credited to an account established in the name of the Trustees. The amounts credited to the account then increase or decrease, as the case may be, in accordance with the performance of one or more of the Janus Henderson funds that are selected by the Trustees. The account balance continues to fluctuate in accordance with the performance of the selected fund or funds until final payment of all amounts are credited to the account. The fluctuation of the account balance is recorded by the Fund as unrealized appreciation/(depreciation) and is included as of June 30, 2020 on the Statement of Assets and Liabilities in the asset, “Non-interested Trustees’ deferred compensation,” and liability, “Non-interested Trustees’ deferred compensation fees.” Additionally, the recorded unrealized appreciation/(depreciation) is included in “Total distributable earnings (loss)” on the Statement of Assets and Liabilities. Deferred compensation expenses for the year ended June 30, 2020 are included in “Non-interested Trustees’ fees and expenses” on the Statement of Operations. Trustees are allowed to change their designation of mutual funds from time to time. Amounts will be deferred until distributed in accordance with the Deferred Plan. Deferred fees of $457,150 were paid by the Trust to the Trustees under the Deferred Plan during the year ended June 30, 2020.
Any purchases and sales, realized gains/losses and recorded dividends from affiliated investments during the year ended June 30, 2020 can be found in the “Schedules of Affiliated Investments” located in the Schedule of Investments.
Class A Shares include a 4.75% upfront sales charge of the offering price of the Fund. The sales charge is allocated between Janus Henderson Distributors and financial intermediaries. During the year ended June 30, 2020, Janus Henderson Distributors retained upfront sales charges of $9,458.
Janus Henderson Developed World Bond Fund
Notes to Financial Statements
A contingent deferred sales charge (“CDSC”) of 1.00% will be deducted with respect to Class A Shares purchased without a sales load and redeemed within 12 months of purchase, unless waived. Any applicable CDSC will be 1.00% of the lesser of the original purchase price or the value of the redemption of the Class A Shares redeemed. There were no CDSCs paid by redeeming shareholders of Class A Shares to Janus Henderson Distributors during the year ended June 30, 2020.
A CDSC of 1.00% will be deducted with respect to Class C Shares redeemed within 12 months of purchase, unless waived. Any applicable CDSC will be 1.00% of the lesser of the original purchase price or the value of the redemption of the Class C Shares redeemed. During the year ended June 30, 2020, redeeming shareholders of Class C Shares paid CDSCs of $5,954.
As of June 30, 2020, shares of the Fund were owned by affiliates of Janus Henderson Investors, and/or other funds advised by Janus Henderson, as indicated in the table below:
| | | | | | | |
Class | % of Class Owned | | % of Fund Owned | | |
Class A Shares | - | %* | - | %* | |
Class C Shares | -* | | -* | | |
Class D Shares | -* | | -* | | |
Class I Shares | -* | | -* | | |
Class N Shares | -* | | -* | | |
Class S Shares | 26 | | -* | | |
Class T Shares | -* | | -* | | |
| | | | | | |
* | Less than 0.50% | | | | | |
In addition, other shareholders, including other funds, individuals, accounts, as well as the Fund’s portfolio manager(s) and/or investment personnel, may from time to time own (beneficially or of record) a significant percentage of the Fund’s Shares and can be considered to “control” the Fund when that ownership exceeds 25% of the Fund’s assets (and which may differ from control as determined in accordance with US GAAP).
5. Federal Income Tax
The tax components of capital shown in the table below represent: (1) distribution requirements the Fund must satisfy under the income tax regulations; (2) losses or deductions the Fund may be able to offset against income and gains realized in future years; and (3) unrealized appreciation or depreciation of investments for federal income tax purposes.
Other book to tax differences primarily consist of deferred compensation, derivatives, and foreign currency contract adjustments. The Fund has elected to treat gains and losses on forward foreign currency contracts as capital gains and losses, if applicable. Other foreign currency gains and losses on debt instruments are treated as ordinary income for federal income tax purposes pursuant to Section 988 of the Internal Revenue Code.
| | | | | | | | |
| | | Loss Deferrals | Other Book | Net Tax | |
Undistributed
Ordinary Income | Undistributed
Long-Term Gains | Accumulated
Capital Losses | Late-Year
Ordinary Loss | Post-October
Capital Loss | to Tax
Differences | Appreciation/
(Depreciation) | |
$ 82,416,008 | $ - | $ (85,143,264) | $ - | $ - | $ 88,126 | $ 48,627,542 | |
Janus Henderson Developed World Bond Fund
Notes to Financial Statements
Accumulated capital losses noted below represent net capital loss carryovers, as of June 30, 2020, that may be available to offset future realized capital gains and thereby reduce future taxable gains distributions. The following table shows these capital loss carryovers.
| | | | | | |
| | | | | |
Capital Loss Carryover Schedule | | |
For the year ended June 30, 2020 | | |
| No Expiration | | | |
| Short-Term | Long-Term | Accumulated
Capital Losses | | |
| $(37,094,833) | $(48,048,431) | $ (85,143,264) | | |
The aggregate cost of investments and the composition of unrealized appreciation and depreciation of investment securities for federal income tax purposes as of June 30, 2020 are noted below. The primary differences between book and tax appreciation or depreciation of investments are wash sale loss deferrals and investments in partnerships.
| | | | |
Federal Tax Cost | Unrealized
Appreciation | Unrealized
(Depreciation) | Net Tax Appreciation/
(Depreciation) |
$ 1,541,811,392 | $61,316,089 | $(12,688,547) | $ 48,627,542 |
Information on the tax components of derivatives as of June 30, 2020 is as follows:
| | | | |
Federal Tax Cost | Unrealized
Appreciation | Unrealized
(Depreciation) | Net Tax Appreciation/
(Depreciation) |
$ 2,097,243 | $ - | $ - | $ - |
Tax cost of investments and unrealized appreciation/(depreciation) may also include timing differences that do not constitute adjustments to tax basis.
Income and capital gains distributions are determined in accordance with income tax regulations that may differ from US GAAP. These differences are due to differing treatments for items such as net short-term gains, deferral of wash sale losses, foreign currency transactions, and capital loss carryovers. Certain permanent differences such as tax returns of capital and net investment losses noted below have been reclassified to capital.
| | | | | |
For the year ended June 30, 2020 | |
Distributions | | |
From Ordinary Income | From Long-Term Capital Gains | Tax Return of Capital | Net Investment Loss | |
$ 49,183,244 | $ 3,873,056 | $ - | $ - | |
| | | | | |
For the year ended June 30, 2019 | |
Distributions | | |
From Ordinary Income | From Long-Term Capital Gains | Tax Return of Capital | Net Investment Loss | |
$ 39,604,864 | $ - | $ - | $ - | |
Janus Henderson Developed World Bond Fund
Notes to Financial Statements
Permanent book to tax basis differences may result in reclassifications between the components of net assets. These differences have no impact on the results of operations or net assets. The following reclassifications have been made to the Fund:
| | | |
| | |
Increase/(Decrease) to Capital | Increase/(Decrease) to Undistributed
Net Investment Income/Loss | Increase/(Decrease) to Undistributed
Net Realized Gain/Loss |
$ - | $ 97,535,244 | $ (97,535,244) |
6. Capital Share Transactions
| | | | | | | |
| | | | | | |
| | Year ended June 30, 2020 | | Year ended June 30, 2019 |
| | Shares | Amount | | Shares | Amount |
| | | | | | | |
Class A Shares: | | | | | |
Shares sold | 3,649,180 | $ 35,708,506 | | 2,714,859 | $ 25,387,242 |
Reinvested dividends and distributions | 188,803 | 1,833,350 | | 191,151 | 1,761,837 |
Shares repurchased | (3,202,078) | (31,092,974) | | (1,939,609) | (18,111,329) |
Net Increase/(Decrease) | 635,905 | $ 6,448,882 | | 966,401 | $ 9,037,750 |
Class C Shares: | | | | | |
Shares sold | 1,902,787 | $ 18,490,357 | | 1,394,794 | $ 12,946,996 |
Reinvested dividends and distributions | 92,453 | 889,160 | | 138,504 | 1,265,431 |
Shares repurchased | (2,040,062) | (19,728,977) | | (1,986,228) | (18,369,390) |
Net Increase/(Decrease) | (44,822) | $ (349,460) | | (452,930) | $ (4,156,963) |
Class D Shares: | | | | | |
Shares sold | 2,705,399 | $ 26,522,420 | | 1,093,219 | $ 10,214,052 |
Reinvested dividends and distributions | 76,724 | 745,010 | | 46,230 | 427,186 |
Shares repurchased | (1,396,780) | (13,400,531) | | (429,537) | (4,004,322) |
Net Increase/(Decrease) | 1,385,343 | $ 13,866,899 | | 709,912 | $ 6,636,916 |
Class I Shares: | | | | | |
Shares sold | 101,325,222 | $985,964,932 | | 53,728,431 | $500,759,655 |
Reinvested dividends and distributions | 4,018,988 | 38,927,774 | | 3,206,723 | 29,510,107 |
Shares repurchased | (67,365,757) | (641,276,581) | | (29,498,177) | (274,142,751) |
Net Increase/(Decrease) | 37,978,453 | $383,616,125 | | 27,436,977 | $256,127,011 |
Class N Shares: | | | | | |
Shares sold | 3,886,797 | $ 37,866,390 | | 411,227 | $ 3,834,769 |
Reinvested dividends and distributions | 64,923 | 629,285 | | 26,313 | 241,984 |
Shares repurchased | (1,338,783) | (12,282,346) | | (285,813) | (2,678,194) |
Net Increase/(Decrease) | 2,612,937 | $ 26,213,329 | | 151,727 | $ 1,398,559 |
Class S Shares: | | | | | |
Shares sold | 6,278 | $ 61,936 | | 2,902 | $ 26,903 |
Reinvested dividends and distributions | 709 | 6,868 | | 699 | 6,438 |
Shares repurchased | (781) | (7,456) | | (202) | (1,897) |
Net Increase/(Decrease) | 6,206 | $ 61,348 | | 3,399 | $ 31,444 |
Class T Shares: | | | | | |
Shares sold | 13,094,096 | $128,213,150 | | 6,290,721 | $ 58,863,242 |
Reinvested dividends and distributions | 419,488 | 4,065,526 | | 217,967 | 2,010,991 |
Shares repurchased | (10,695,753) | (100,879,359) | | (2,435,553) | (22,663,210) |
Net Increase/(Decrease) | 2,817,831 | $ 31,399,317 | | 4,073,135 | $ 38,211,023 |
Janus Henderson Developed World Bond Fund
Notes to Financial Statements
7. Purchases and Sales of Investment Securities
For the year ended June 30, 2020, the aggregate cost of purchases and proceeds from sales of investment securities (excluding any short-term securities, short-term options contracts, TBAs, and in-kind transactions, as applicable) was as follows:
| | | | |
Purchases of
Securities | Proceeds from Sales
of Securities | Purchases of Long-
Term U.S. Government
Obligations | Proceeds from Sales
of Long-Term U.S.
Government Obligations |
$1,580,916,667 | $1,118,462,161 | $ 57,401,636 | $ 84,156,082 |
8. Recent Accounting Pronouncements
The FASB issued Accounting Standards Update No. 2017-08, Receivables – Nonrefundable Fees and Other Costs (Subtopic 310-20), Premium Amortization on Purchased Callable Debt Securities ("ASU 2017-08") to amend the amortization period for certain purchased callable debt securities held at a premium. The guidance requires certain premiums on callable debt securities to be amortized to the earliest call date. The amortization period for callable debt securities purchased at a discount will not be impacted. The amendments are effective for fiscal years and interim periods within those fiscal years, beginning after December 15, 2018. Management has adopted the amendments as of the beginning of this fiscal period.
The FASB issued Accounting Standards Update 2018-13, Fair Value Measurement (Topic 820) in August 2018. The new guidance removes, modifies and enhances the disclosures to Topic 820. For public entities, the amendments are effective for financial statements issued for fiscal years beginning after December 15, 2019, and interim periods within those fiscal years. An entity is permitted, and Management has decided, to early adopt the removed and modified disclosures in these financial statements. Management is also evaluating the implications related to the new disclosure requirements and has not yet determined the impact to the financial statements.
9. Other Matters
An outbreak of infectious respiratory illness caused by a novel coronavirus known as COVID-19 was first detected in China in December 2019 and has now been declared a pandemic by the World Health Organization. The impact of COVID-19 has been, and may continue to be, highly disruptive to economies and markets, adversely impacting individual companies, sectors, industries, markets, currencies, interest and inflation rates, credit ratings, investor sentiment, and other factors affecting the value of a Fund's investments. This may impact liquidity in the marketplace, which in turn may affect the Fund's ability to meet redemption requests. Public health crises caused by the COVID-19 pandemic may exacerbate other pre-existing political, social, and economic risks in certain countries or globally. The duration of the COVID-19 pandemic and its effects cannot be determined with certainty, and could prevent a Fund from executing advantageous investment decisions in a timely manner and negatively impact a Fund's ability to achieve its investment objective.
10. Subsequent Event
Management has evaluated whether any events or transactions occurred subsequent to June 30, 2020 and through the date of issuance of the Fund’s financial statements and determined that there were no material events or transactions that would require recognition or disclosure in the Fund’s financial statements.
Janus Henderson Developed World Bond Fund
Report of Independent Registered Public Accounting Firm
To the Board of Trustees of Janus Investment Fund and Shareholders of Janus Henderson Developed World Bond Fund
Opinion on the Financial Statements
We have audited the accompanying statement of assets and liabilities, including the schedule of investments, of Janus Henderson Developed World Bond Fund (one of the funds constituting Janus Investment Fund, referred to hereafter as the “Fund”) as of June 30, 2020, the related statement of operations for the year ended June 30, 2020, the statements of changes in net assets for each of the two years in the period ended June 30, 2020, including the related notes, and the financial highlights for each of the periods indicated therein beginning on or after August 1, 2016 (collectively referred to as the “financial statements”). In our opinion, the financial statements present fairly, in all material respects, the financial position of the Fund as of June 30, 2020, the results of its operations for the year then ended, the changes in its net assets for each of the two years in the period ended June 30, 2020 and the financial highlights for each of the periods indicated therein beginning on or after August 1, 2016 in conformity with accounting principles generally accepted in the United States of America.
The financial statements of the Fund as of and for the year ended July 31, 2016 and the financial highlights for each of the periods ended on or prior to July 31, 2016 (not presented herein, other than the financial highlights) were audited by other auditors whose report dated September 23, 2016 expressed an unqualified opinion on those financial statements and financial highlights.
Basis for Opinion
These financial statements are the responsibility of the Fund’s management. Our responsibility is to express an opinion on the Fund’s financial statements based on our audits. We are a public accounting firm registered with the Public Company Accounting Oversight Board (United States) (PCAOB) and are required to be independent with respect to the Fund in accordance with the U.S. federal securities laws and the applicable rules and regulations of the Securities and Exchange Commission and the PCAOB.
We conducted our audits of these financial statements in accordance with the standards of the PCAOB. Those standards require that we plan and perform the audit to obtain reasonable assurance about whether the financial statements are free of material misstatement, whether due to error or fraud.
Our audits included performing procedures to assess the risks of material misstatement of the financial statements, whether due to error or fraud, and performing procedures that respond to those risks. Such procedures included examining, on a test basis, evidence regarding the amounts and disclosures in the financial statements. Our audits also included evaluating the accounting principles used and significant estimates made by management, as well as evaluating the overall presentation of the financial statements. Our procedures included confirmation of securities owned as of June 30, 2020 by correspondence with the custodian and brokers; when replies were not received from brokers, we performed other auditing procedures. We believe that our audits provide a reasonable basis for our opinion.

Denver, Colorado
August 17, 2020
We have served as the auditor of one or more investment companies in Janus Henderson Funds since 1990.
Janus Henderson Developed World Bond Fund
Additional Information (unaudited)
Proxy Voting Policies and Voting Record
A description of the policies and procedures that the Fund uses to determine how to vote proxies relating to its portfolio securities is available without charge: (i) upon request, by calling 1-800-525-1093; (ii) on the Fund’s website at janushenderson.com/proxyvoting; and (iii) on the SEC’s website at http://www.sec.gov. Additionally, information regarding the Fund’s proxy voting record for the most recent twelve-month period ended June 30 is also available, free of charge, through janushenderson.com/proxyvoting and from the SEC’s website at http://www.sec.gov.
Full Holdings
The Fund is required to disclose its complete holdings as an exhibit to Form N-PORT within 60 days of the end of the first and third fiscal quarters, and in the annual report and semiannual report to Fund shareholders. Historically, the Fund filed its complete portfolio holdings (schedule of investments) with the SEC for the first and third quarters each fiscal year on Form N-Q. The Fund’s Form N-PORT and Form N-Q filings: (i) are available on the SEC’s website at http://www.sec.gov; (ii) may be reviewed and copied at the SEC’s Public Reference Room in Washington, D.C. (information on the Public Reference Room may be obtained by calling 1-800-SEC-0330); and (iii) are available without charge, upon request, by calling a Janus Henderson representative at 1-877-335-2687 (toll free) (or 1-800-525-3713 if you hold Class D shares). Portfolio holdings consisting of at least the names of the holdings are generally available on a monthly basis with a 30-day lag. Holdings are generally posted approximately two business days thereafter under Full Holdings for the Fund at janushenderson.com/info (or janushenderson.com/reports if you hold Class D Shares).
APPROVAL OF ADVISORY AGREEMENTS DURING THE PERIOD
The Trustees of Janus Aspen Series, each of whom serves as an “independent” Trustee (the “Trustees”), oversee the management of each Portfolio of Janus Aspen Series (each, a “VIT Portfolio,” and collectively, the “VIT Portfolios”), as well as each Fund of Janus Investment Fund (together with the VIT Portfolios, the “Janus Henderson Funds,” and each, a “Janus Henderson Fund”). As required by law, the Trustees determine annually whether to continue the investment advisory agreement for each Janus Henderson Fund and the subadvisory agreements for the Janus Henderson Funds that utilize subadvisers.
In connection with their most recent consideration of those agreements for each Janus Henderson Fund, the Trustees received and reviewed information provided by Janus Capital and the respective subadvisers in response to requests of the Trustees and their independent legal counsel. They also received and reviewed information and analysis provided by, and in response to requests of, their independent fee consultant. Throughout their consideration of the agreements, the Trustees were advised by their independent legal counsel. The Trustees met with management to consider the agreements, and also met separately in executive session with their independent legal counsel and their independent fee consultant.
At a meeting held on December 5, 2019, based on the Trustees’ evaluation of the information provided by Janus Capital, the subadvisers, and the independent fee consultant, as well as other information, the Trustees determined that the overall arrangements between each Janus Henderson Fund and Janus Capital and each subadviser, as applicable, were fair and reasonable in light of the nature, extent and quality of the services provided by Janus Capital, its affiliates and the subadvisers, the fees charged for those services, and other matters that the Trustees considered relevant in the exercise of their business judgment. At that meeting, the Trustees unanimously approved the continuation of the investment advisory agreement for each Janus Henderson Fund, and the subadvisory agreement for each subadvised Janus Henderson Fund, for the period from February 1, 2020 through February 1, 2021, subject to earlier termination as provided for in each agreement.
In considering the continuation of those agreements, the Trustees reviewed and analyzed various factors that they determined were relevant, including the factors described below, none of which by itself was considered dispositive. However, the material factors and conclusions that formed the basis for the Trustees’ determination to approve the continuation of the agreements are discussed separately below. Also included is a summary of the independent fee consultant’s conclusions and opinions that arose during, and were included as part of, the Trustees’ consideration of the agreements. “Management fees,” as used herein, reflect actual annual advisory fees and, for the purpose of peer comparisons any administration fees (excluding out of pocket costs), net of any waivers, paid by a fund as a percentage of average net assets.
Janus Henderson Developed World Bond Fund
Additional Information (unaudited)
Nature, Extent and Quality of Services
The Trustees reviewed the nature, extent and quality of the services provided by Janus Capital and the subadvisers to the Janus Henderson Funds, taking into account the investment objective, strategies and policies of each Janus Henderson Fund, and the knowledge the Trustees gained from their regular meetings with management on at least a quarterly basis and their ongoing review of information related to the Janus Henderson Funds. In addition, the Trustees reviewed the resources and key personnel of Janus Capital and each subadviser, particularly noting those employees who provide investment and risk management services to the Janus Henderson Funds. The Trustees also considered other services provided to the Janus Henderson Funds by Janus Capital or the subadvisers, such as managing the execution of portfolio transactions and the selection of broker-dealers for those transactions. The Trustees considered Janus Capital’s role as administrator to the Janus Henderson Funds, noting that Janus Capital generally, does not receive a fee for its services but is reimbursed for its out-of-pocket costs. The Trustees considered the role of Janus Capital in monitoring adherence to the Janus Henderson Funds’ investment restrictions, providing support services for the Trustees and Trustee committees, and overseeing communications with shareholders and the activities of other service providers, including monitoring compliance with various policies and procedures of the Janus Henderson Funds and with applicable securities laws and regulations.
In this regard, the independent fee consultant noted that Janus Capital provides a number of different services for the Janus Henderson Funds and fund shareholders, ranging from investment management services to various other servicing functions, and that, in its view, Janus Capital is a capable provider of those services. The independent fee consultant also provided its belief that Janus Capital has developed a number of institutional competitive advantages that should enable it to provide superior investment and service performance over the long term.
The Trustees concluded that the nature, extent and quality of the services provided by Janus Capital or the subadviser to each Janus Henderson Fund were appropriate and consistent with the terms of the respective advisory and subadvisory agreements, and that, taking into account steps taken to address those Janus Henderson Funds whose performance lagged that of their peers for certain periods, the Janus Henderson Funds were likely to benefit from the continued provision of those services. They also concluded that Janus Capital and each subadviser had sufficient personnel, with the appropriate education and experience, to serve the Janus Henderson Funds effectively and had demonstrated its ability to attract well-qualified personnel.
Performance of the Funds
The Trustees considered the performance results of each Janus Henderson Fund over various time periods. They noted that they considered Janus Henderson Fund performance data throughout the year, including periodic meetings with each Janus Henderson Fund’s portfolio manager(s), and also reviewed information comparing each Janus Henderson Fund’s performance with the performance of comparable funds and peer groups identified by Broadridge Financial Solutions, Inc. (“Broadridge”), an independent data provider, and with the Janus Henderson Fund’s benchmark index. In this regard, the independent fee consultant found that the overall Janus Henderson Funds’ performance has been reasonable: for the 36 months ended September 30, 2019, approximately 69% of the Janus Henderson Funds were in the top two quartiles of performance, as reported by Morningstar, and for the 12 months ended September 30, 2019, approximately 71% of the Janus Henderson Funds were in the top two quartiles of performance, as reported by Morningstar.
The Trustees considered the performance of each Fund, noting that performance may vary by share class, and noted the following:
Alternative Fund
· For Janus Henderson Diversified Alternatives Fund, the Trustees noted that the Fund’s performance was in the third Broadridge quartile for the 36 months ended May 31, 2019 and the bottom Broadridge quartile for the 12 months ended May 31, 2019. The Trustees noted the reasons for the Fund’s underperformance, the steps Janus Capital had taken or was taking to improve performance.
Asset Allocation Funds
· For Janus Henderson Global Allocation Fund – Conservative, the Trustees noted that the Fund’s performance was in the third Broadridge quartile for the 36 months ended May 31, 2019 and the bottom Broadridge quartile for the 12 months ended May 31, 2019. The Trustees noted the reasons for the Fund’s underperformance, the steps Janus Capital had taken or was taking to improve performance.
Janus Henderson Developed World Bond Fund
Additional Information (unaudited)
· For Janus Henderson Global Allocation Fund – Growth, the Trustees noted that the Fund’s performance was in the third Broadridge quartile for the 36 months ended May 31, 2019 and the bottom Broadridge quartile for the 12 months ended May 31, 2019. The Trustees noted the reasons for the Fund’s underperformance, the steps Janus Capital had taken or was taking to improve performance.
· For Janus Henderson Global Allocation Fund – Moderate, the Trustees noted that the Fund’s performance was in the third Broadridge quartile for the 36 months ended May 31, 2019 and the bottom Broadridge quartile for the 12 months ended May 31, 2019. The Trustees noted the reasons for the Fund’s underperformance, the steps Janus Capital had taken or was taking to improve performance.
Fixed-Income Funds
· For Janus Henderson Absolute Return Income Opportunities Fund, the Trustees noted that the Fund’s performance was in the bottom Broadridge quartile for the 36 months ended May 31, 2019 and the third Broadridge quartile for the 12 months ended May 31, 2019. The Trustees noted the reasons for the Fund’s underperformance and the steps Janus Capital had taken or was taking to improve performance.
· For Janus Henderson Developed World Bond Fund, the Trustees noted the Fund’s performance was in the second Broadridge quartile for the 36 months ended May 31, 2019 and the first quartile for the 12 months ended May 31, 2019.
· For Janus Henderson Flexible Bond Fund, the Trustees noted that the Fund’s performance was in the bottom Broadridge quartile for the 36 months ended May 31, 2019 and the bottom Broadridge quartile for the 12 months ended May 31, 2019. The Trustees noted the reasons for the Fund’s underperformance and the steps Janus Capital had taken or was taking to improve performance.
· For Janus Henderson Global Bond Fund, the Trustees noted that the Fund’s performance was in the bottom Broadridge quartile for the 36 months ended May 31, 2019 and the bottom Broadridge quartile for the 12 months ended May 31, 2019. The Trustees noted the reasons for the Fund’s underperformance, the steps Janus Capital had taken or was taking to improve performance.
· For Janus Henderson High-Yield Fund, the Trustees noted that the Fund’s performance was in the second Broadridge quartile for the 36 months ended May 31, 2019 and the second Broadridge quartile for the 12 months ended May 31, 2019.
· For Janus Henderson Multi-Sector Income Fund, the Trustees noted that the Fund’s performance was in the first Broadridge quartile for the 36 months ended May 31, 2019 and the first Broadridge quartile for the 12 months ended May 31, 2019.
· For Janus Henderson Short-Term Bond Fund, the Trustees noted that the Fund’s performance was in the bottom Broadridge quartile for the 36 months ended May 31, 2019 and the third Broadridge quartile for the 12 months ended May 31, 2019. The Trustees noted the reasons for the Fund’s underperformance and the steps Janus Capital had taken or was taking to improve performance.
Global and International Equity Funds
· For Janus Henderson Asia Equity Fund, the Trustees noted that the Fund’s performance was in the first Broadridge quartile for the 36 months ended May 31, 2019 and the second Broadridge quartile for the 12 months ended May 31, 2019.
· For Janus Henderson Emerging Markets Fund, the Trustees noted that the Fund’s performance was in the bottom Broadridge quartile for the 36 months ended May 31, 2019 and the second Broadridge quartile for the 12 months ended May 31, 2019. The Trustees noted the reasons for the Fund’s underperformance and the steps Janus Capital had taken or was taking to improve performance, and that the performance trend was improving
· For Janus Henderson European Focus Fund, the Trustees noted that the Fund’s performance was in the bottom Broadridge quartile for the 36 months ended May 31, 2019 and the bottom Broadridge quartile for the 12 months ended May 31, 2019. The Trustees noted the reasons for the Fund’s underperformance and the steps Janus Capital had taken or was taking to improve performance.
· For Janus Henderson Global Equity Income Fund, the Trustees noted that the Fund’s performance was in the bottom Broadridge quartile for the 36 months ended May 31, 2019 and the bottom Broadridge quartile for the 12
Janus Henderson Developed World Bond Fund
Additional Information (unaudited)
months ended May 31, 2019. The Trustees noted the reasons for the Fund’s underperformance and the steps Janus Capital had taken or was taking to improve performance.
· For Janus Henderson Global Life Sciences Fund, the Trustees noted that the Fund’s performance was in the first Broadridge quartile for the 36 months ended May 31, 2019 and the second Broadridge quartile for the 12 months ended May 31, 2019.
· For Janus Henderson Global Real Estate Fund, the Trustees noted that the Fund’s performance was in the first Broadridge quartile for the 36 months ended May 31, 2019 and the first Broadridge quartile for the 12 months ended May 31, 2019.
· For Janus Henderson Global Research Fund, the Trustees noted that the Fund’s performance was in the third Broadridge quartile for the 36 months ended May 31, 2019 and the third Broadridge quartile for the 12 months ended May 31, 2019. The Trustees noted the reasons for the Fund’s underperformance, while also noting that the Fund has a performance fee structure that results in lower management fees during periods of underperformance, and the steps Janus Capital had taken or was taking to improve performance.
· For Janus Henderson Global Select Fund, the Trustees noted that the Fund’s performance was in the first Broadridge quartile for the 36 months ended May 31, 2019 and the bottom Broadridge quartile for the 12 months ended May 31, 2019.
· For Janus Henderson Global Technology Fund, the Trustees noted that the Fund’s performance was in the second Broadridge quartile for the 36 months ended May 31, 2019 and the first Broadridge quartile for the 12 months ended May 31, 2019.
· For Janus Henderson Global Value Fund, the Trustees noted that the Fund’s performance was in the second Broadridge quartile for the 36 months ended May 31, 2019 and the first Broadridge quartile for the 12 months ended May 31, 2019.
· For Janus Henderson International Opportunities Fund, the Trustees noted that the Fund’s performance was in the bottom Broadridge quartile for the 36 months ended May 31, 2019 and the bottom Broadridge quartile for the 12 months ended May 31, 2019. The Trustees noted the reasons for the Fund’s underperformance and the steps Janus Capital had taken or was taking to improve performance.
· For Janus Henderson International Small Cap Fund, the Trustees noted that the Fund’s performance was in the bottom Broadridge quartile for the 12 months ended May 31, 2019. The Trustees noted the reasons for the Fund’s underperformance, the steps Janus Capital had taken or was taking to improve performance, and its limited performance history.
· For Janus Henderson International Value Fund, the Trustees noted that the Fund’s performance was in the bottom Broadridge quartile for the 36 months ended May 31, 2019 and the second Broadridge quartile for the 12 months ended May 31, 2019. The Trustees noted the reasons for the Fund’s underperformance and the steps Janus Capital and Perkins had taken or were taking to improve performance, and that the performance trend was improving
· For Janus Henderson Overseas Fund, the Trustees noted that the Fund’s performance was in the second Broadridge quartile for the 36 months ended May 31, 2019 and the bottom Broadridge quartile for the 12 months ended May 31, 2019.
Money Market Funds
· For Janus Henderson Government Money Market Fund, the Trustees noted that the Fund’s performance was in the second Broadridge quartile for the 36 months ended May 31, 2019 and the third Broadridge quartile for the 12 months ended May 31, 2019.
· For Janus Henderson Money Market Fund, the Trustees noted that the Fund’s performance was in the third Broadridge quartile for the 36 months ended May 31, 2019 and the third Broadridge quartile for the 12 months ended May 31, 2019. The Trustees noted the reasons for the Fund’s underperformance and the steps Janus Capital had taken or was taking to improve performance.
Janus Henderson Developed World Bond Fund
Additional Information (unaudited)
Multi-Asset Funds
· For Janus Henderson Adaptive Global Allocation Fund, the Trustees noted that the Fund’s performance was in third quartile for the 36 months ended May 31, 2019 and the third Broadridge quartile for the 12 months ended May 31, 2019. The Trustees noted the reasons for the Fund’s underperformance and the steps Janus Capital had taken or was taking to improve performance.
· For Janus Henderson Dividend & Income Builder Fund, the Trustees noted that the Fund’s performance was in the third Broadridge quartile for the 36 months ended May 31, 2019 and the third Broadridge quartile for the 12 months ended May 31, 2019. The Trustees noted the reasons for the Fund’s underperformance and the steps Janus Capital had taken or was taking to improve performance.
· For Janus Henderson Value Plus Income Fund, the Trustees noted that the Fund’s performance was in the first Broadridge quartile for the 36 months ended May 31, 2019 and the first Broadridge quartile for the 12 months ended May 31, 2019.
Multi-Asset U.S. Equity Funds
· For Janus Henderson Balanced Fund, the Trustees noted that the Fund’s performance was in the first Broadridge quartile for the 36 months ended May 31, 2019 and the first Broadridge quartile for the 12 months ended May 31, 2019.
· For Janus Henderson Contrarian Fund, the Trustees noted that the Fund’s performance was in the second Broadridge quartile for the 36 months ended May 31, 2019 and the first Broadridge quartile for the 12 months ended May 31, 2019.
· For Janus Henderson Enterprise Fund, the Trustees noted that the Fund’s performance was in the first Broadridge quartile for the 36 months ended May 31, 2019 and the first Broadridge quartile for the 12 months ended May 31, 2019.
· For Janus Henderson Forty Fund, the Trustees noted that the Fund’s performance was in the second Broadridge quartile for the 36 months ended May 31, 2019 and the first Broadridge quartile for the 12 months ended May 31, 2019.
· For Janus Henderson Growth and Income Fund, the Trustees noted that the Fund’s performance was in the first Broadridge quartile for the 36 months ended May 31, 2019 and the second Broadridge quartile for the 12 months ended May 31, 2019.
· For Janus Henderson Research Fund, the Trustees noted that the Fund’s performance was in the third Broadridge quartile for the 36 months ended May 31, 2019 and the second Broadridge quartile for the 12 months ended May 31, 2019. The Trustees noted the reasons for the Fund’s underperformance, while also noting that the Fund has a performance fee structure that results in lower management fees during periods of underperformance, and the steps Janus Capital had taken or was taking to improve performance, and that the performance trend was improving.
· For Janus Henderson Triton Fund, the Trustees noted that the Fund’s performance was in the third Broadridge quartile for the 36 months ended May 31, 2019 and the second Broadridge quartile for the 12 months ended May 31, 2019. The Trustees noted the reasons for the Fund’s underperformance, and the steps Janus Capital had taken or was taking to improve performance, and that the performance trend was improving.
· For Janus Henderson U.S. Growth Opportunities Fund, the Trustees noted that the Fund’s performance was in the third Broadridge quartile for the 36 months ended May 31, 2019 and the first Broadridge quartile for the 12 months ended May 31, 2019. The Trustees noted the reasons for the Fund’s underperformance, and the steps Janus Capital and Geneva had taken or were taking to improve performance, and that the performance trend was improving.
· For Janus Henderson Venture Fund, the Trustees noted that the Fund’s performance was in the third Broadridge quartile for the 36 months ended May 31, 2019 and the second Broadridge quartile for the 12 months ended May 31, 2019. The Trustees noted the reasons for the Fund’s underperformance, and the steps Janus Capital had taken or was taking to improve performance, and that the performance trend was improving.
Janus Henderson Developed World Bond Fund
Additional Information (unaudited)
Quantitative Equity Funds
· For Janus Henderson Emerging Markets Managed Volatility Fund, the Trustees noted that the Fund’s performance was in the second Broadridge quartile for the 36 months ended May 31, 2019 and the first Broadridge quartile for the 12 months ended May 31, 2019.
· For Janus Henderson Global Income Managed Volatility Fund, the Trustees noted that the Fund’s performance was in the second Broadridge quartile for the 36 months ended May 31, 2019 and the first Broadridge quartile for the 12 months ended May 31, 2019.
· For Janus Henderson International Managed Volatility Fund, the Trustees noted that the Fund’s performance was in the third Broadridge quartile for the 36 months ended May 31, 2019 and the second Broadridge quartile for the 12 months ended May 31, 2019. The Trustees noted the reasons for the Fund’s underperformance, the steps Janus Capital and Intech had taken or were taking to improve performance, and that the performance trend was improving.
· For Janus Henderson U.S. Managed Volatility Fund, the Trustees noted that the Fund’s performance was in the second Broadridge quartile for the 36 months ended May 31, 2019 and the second Broadridge quartile for the 12 months ended May 31, 2019.
U.S. Equity Funds
· For Janus Henderson Large Cap Value Fund, the Trustees noted that the Fund’s performance was in the second Broadridge quartile for the 36 months ended May 31, 2019 and the first Broadridge quartile for the 12 months ended May 31, 2019.
· For Janus Henderson Mid Cap Value Fund, the Trustees noted that the Fund’s performance was in the second Broadridge quartile for the 36 months ended May 31, 2019 and the second Broadridge quartile for the 12 months ended May 31, 2019.
· For Janus Henderson Small Cap Value Fund, the Trustees noted that the Fund’s performance was in the second Broadridge quartile for the 36 months ended May 31, 2019 and the first Broadridge quartile for the 12 months ended May 31, 2019.
· For Janus Henderson Small-Mid Cap Value Fund, the Trustees noted that the Fund’s performance was in the third Broadridge quartile for the 36 months ended May 31, 2019 and the second Broadridge quartile for the 12 months ended May 31, 2019. The Trustees noted the reasons for the Fund’s underperformance, while also noting that the Fund has a performance fee structure that results in lower management fees during periods of underperformance, and the steps Janus Capital and Perkins had taken or were taking to improve performance, and that the performance trend was improving.
In consideration of each Janus Henderson Fund’s performance, the Trustees concluded that, taking into account the factors relevant to performance, as well as other considerations, including steps taken to improve performance, the Janus Henderson Fund’s performance warranted continuation of such Janus Henderson Fund’s investment advisory and subadvisory agreement(s).
Costs of Services Provided
The Trustees examined information regarding the fees and expenses of each Janus Henderson Fund in comparison to similar information for other comparable funds as provided by Broadridge, an independent data provider. They also reviewed an analysis of that information provided by their independent fee consultant and noted that the rate of management fees (investment advisory and any administration but excluding out-of-pocket costs) for many of the Janus Henderson Funds, after applicable waivers, was below the average management fee rate of the respective peer group of funds selected by an independent data provider. The Trustees also examined information regarding the subadvisory fees charged for subadvisory services, as applicable, noting that all such fees were paid by Janus Capital out of its management fees collected from such Janus Henderson Fund.
The independent fee consultant provided its belief that the management fees charged by Janus Capital to each of the Janus Henderson Funds under the current investment advisory and administration agreements are reasonable in relation to the services provided by Janus Capital. The independent fee consultant found: (1) the total expenses and management fees of the Janus Henderson Funds to be reasonable relative to other mutual funds; (2) the total expenses, on average, were 10% under the average total expenses of their respective Broadridge Expense Group
Janus Henderson Developed World Bond Fund
Additional Information (unaudited)
peers; and (3) and the management fees for the Janus Henderson Funds, on average, were 7% under the average management fees for their Expense Groups. The Trustees also considered the total expenses for each share class of each Janus Henderson Fund compared to the average total expenses for its Broadridge Expense Group peers and to average total expenses for its Broadridge Expense Universe.
For certain Janus Henderson Funds, the independent fee consultant also performed a systematic “focus list” analysis of expenses which assessed fund fees in the context of fund performance being delivered. Based on this analysis, the independent fee consultant found that the combination of service quality/performance and expenses on these individual Janus Henderson Funds was reasonable in light of performance trends, performance histories, and existence of performance fees, breakpoints, and/or expense waivers on such Janus Henderson Funds.
The Trustees considered the methodology used by Janus Capital and each subadviser in determining compensation payable to portfolio managers, the competitive environment for investment management talent, and the competitive market for mutual funds in different distribution channels.
The Trustees also reviewed management fees charged by Janus Capital and each subadviser to comparable separate account clients and to comparable non-affiliated funds subadvised by Janus Capital or by a subadviser (for which Janus Capital or the subadviser provides only or primarily portfolio management services). Although in most instances subadvisory and separate account fee rates for various investment strategies were lower than management fee rates for Janus Henderson Funds having a similar strategy, the Trustees considered that Janus Capital noted that, under the terms of the management agreements with the Janus Henderson Funds, Janus Capital performs significant additional services for the Janus Henderson Funds that it does not provide to those other clients, including administration services, oversight of the Janus Henderson Funds’ other service providers, trustee support, regulatory compliance and numerous other services, and that, in serving the Janus Henderson Funds, Janus Capital assumes many legal risks and other costs that it does not assume in servicing its other clients. Moreover, they noted that the independent fee consultant found that: (1) the management fees Janus Capital charges to the Janus Henderson Funds are reasonable in relation to the management fees Janus Capital charges to funds subadvised by Janus Capital and to the fees Janus Capital charges to its institutional separate account clients; (2) these subadvised and institutional separate accounts have different service and infrastructure needs; and (3) Janus Henderson mutual fund investors enjoy reasonable fees relative to the fees charged to Janus Henderson subadvised fund and separate account investors; (4) 11 of 12 Janus Henderson Funds have lower management fees than similar funds subadvised by Janus Capital; and (5) six of nine Janus Henderson Funds have lower management fees than similar separate accounts managed by Janus Capital.
The Trustees considered the fees for each Fund for its fiscal year ended in 2018, and noted the following with regard to each Fund’s total expenses, net of applicable fee waivers (the Fund’s “total expenses”):
Alternative Fund
· For Janus Henderson Diversified Alternatives Fund, the Trustees noted that, although the Fund’s total expenses exceeded the peer group average for certain share classes, overall the Fund’s total expenses were reasonable. The Trustees also noted that Janus Capital has contractually agreed to limit the Fund’s expenses.
Asset Allocation Funds
· For Janus Henderson Global Allocation Fund – Conservative, the Trustees noted that, although the Fund’s total expenses exceeded the peer group average for certain share classes, overall the Fund’s total expenses were reasonable. The Trustees also noted that Janus Capital has contractually agreed to limit the Fund’s expenses.
· For Janus Henderson Global Allocation Fund – Growth, the Trustees noted that, although the Fund’s total expenses exceeded the peer group average for certain share classes, overall the Fund’s total expenses were reasonable. The Trustees also noted that Janus Capital has contractually agreed to limit the Fund’s expenses.
· For Janus Henderson Global Allocation Fund – Moderate, the Trustees noted that, although the Fund’s total expenses exceeded the peer group average for certain share classes, overall the Fund’s total expenses were reasonable. The Trustees also noted that Janus Capital has contractually agreed to limit the Fund’s expenses.
Janus Henderson Developed World Bond Fund
Additional Information (unaudited)
Fixed-Income Funds
· For Janus Henderson Absolute Return Income Opportunities Fund, the Trustees noted that, although the Fund’s total expenses exceeded the peer group average for certain share classes, overall the Fund’s total expenses were reasonable. The Trustees also noted that Janus Capital has contractually agreed to limit the Fund’s expenses.
· For Janus Henderson Developed World Bond Fund, the Trustees noted that, although the Fund’s total expenses exceeded the peer group average for certain share classes, overall the Fund’s total expenses were reasonable. The Trustees also noted that Janus Capital has contractually agreed to limit the Fund’s expenses.
· For Janus Henderson Flexible Bond Fund, the Trustees noted that, although the Fund’s total expenses exceeded the peer group average for certain share classes, overall the Fund’s total expenses were reasonable. The Trustees also noted that Janus Capital has contractually agreed to limit the Fund’s expenses.
· For Janus Henderson Global Bond Fund, the Trustees noted that, although the Fund’s total expenses exceeded the peer group average for certain share classes, overall the Fund’s total expenses were reasonable. The Trustees also noted that Janus Capital has contractually agreed to limit the Fund’s expenses.
· For Janus Henderson High-Yield Fund, the Trustees noted that, although the Fund’s total expenses exceeded the peer group average for certain share classes, overall the Fund’s total expenses were reasonable. The Trustees also noted that Janus Capital has contractually agreed to limit the Fund’s expenses.
· For Janus Henderson Multi-Sector Income Fund, the Trustees noted that, although the Fund’s total expenses exceeded the peer group average for certain share classes, overall the Fund’s total expenses were reasonable. The Trustees also noted that Janus Capital has contractually agreed to limit the Fund’s expenses.
· For Janus Henderson Short-Term Bond Fund, the Trustees noted that, although the Fund’s total expenses exceeded the peer group average for all share classes, overall the Fund’s total expenses were reasonable. The Trustees also noted that Janus Capital has contractually agreed to limit the Fund’s expenses.
Global and International Equity Funds
· For Janus Henderson Asia Equity Fund, the Trustees noted that, although the Fund’s total expenses exceeded the peer group average for certain share classes, overall the Fund’s total expenses were reasonable. The Trustees also noted that Janus Capital has contractually agreed to limit the Fund’s expenses.
· For Janus Henderson Emerging Markets Fund, the Trustees noted that, although the Fund’s total expenses exceeded the peer group average for one share class, overall the Fund’s total expenses were reasonable. The Trustees also noted that Janus Capital has contractually agreed to limit the Fund’s expenses.
· For Janus Henderson European Focus Fund, the Trustees noted that, although the Fund’s total expenses exceeded the peer group average for certain share classes, overall the Fund’s total expenses were reasonable. The Trustees also noted that Janus Capital has contractually agreed to limit the Fund’s expenses.
· For Janus Henderson Global Equity Income Fund, the Trustees noted that the Fund’s total expenses were below the peer group average for all share classes.
· For Janus Henderson Global Life Sciences Fund, the Trustees noted that the Fund’s total expenses were below the peer group average for all share classes.
· For Janus Henderson Global Real Estate Fund, the Trustees noted although the Fund’s total expenses exceeded the peer group average for one share class, overall the Fund’s total expenses were reasonable. The Trustees also noted that Janus Capital has contractually agreed to limit the Fund’s expenses.
· For Janus Henderson Global Research Fund, the Trustees noted that the Fund’s total expenses were below the peer group average for all share classes.
· For Janus Henderson Global Select Fund, the Trustees noted that, although the Fund’s total expenses exceeded the peer group average for one share class, overall the Fund’s total expenses were reasonable. The Trustees also noted that Janus Capital has contractually agreed to limit the Fund’s expenses.
· For Janus Henderson Global Technology Fund, the Trustees noted that the Fund’s total expenses were below the peer group average for all share classes.
Janus Henderson Developed World Bond Fund
Additional Information (unaudited)
· For Janus Henderson Global Value Fund, the Trustees noted that although the Fund’s total expenses exceeded the peer group average for one share class, overall the Fund’s total expenses were reasonable.
· For Janus Henderson International Opportunities Fund, the Trustees noted that, although the Fund’s total expenses exceeded the peer group average for certain share classes, overall the Fund’s total expenses were reasonable. The Trustees also noted that Janus Capital has contractually agreed to limit the Fund’s expenses.
· For Janus Henderson International Small Cap Fund, the Trustees noted that the Fund’s total expenses were below the peer group average for all share classes.
· For Janus Henderson International Value Fund, the Trustees noted that, although the Fund’s total expenses exceeded the peer group average for certain share classes, overall the Fund’s total expenses were reasonable. The Trustees also noted that Janus Capital has contractually agreed to limit the Fund’s expenses.
· For Janus Henderson Overseas Fund, the Trustees noted that the Fund’s total expenses were below the peer group average for all share classes.
Money Market Funds
· For Janus Henderson Government Money Market Fund, the Trustees noted that the Fund’s total expenses were below the peer group average for both share classes.
· For Janus Henderson Money Market Fund, the Trustees noted that, although the Fund’s total expenses exceeded the peer group average for one share class, overall the Fund’s total expenses were reasonable.
Multi-Asset Funds
· For Janus Henderson Adaptive Global Allocation Fund, the Trustees noted that, although the Fund’s total expenses exceeded the peer group average for one share class, overall the Fund’s total expenses were reasonable. The Trustees also noted that Janus Capital has contractually agreed to limit the Fund’s expenses.
· For Janus Henderson Dividend & Income Builder Fund, the Trustees noted that the Fund’s total expenses were below the peer group average for all share classes.
· For Janus Henderson Value Plus Income Fund, the Trustees noted that the Fund’s total expenses were below the peer group average for all share classes.
Multi-Asset U.S. Equity Funds
· For Janus Henderson Balanced Fund, the Trustees noted that, although the Fund’s total expenses exceeded the peer group average for certain share classes, overall the Fund’s total expenses were reasonable. The Trustees also noted that Janus Capital has contractually agreed to limit the Fund’s expenses, although this limit did not apply because the Fund’s total expenses were already below the applicable fee limit.
· For Janus Henderson Contrarian Fund, the Trustees noted that the Fund’s total expenses exceeded the peer group average for one share class, overall the Fund’s total expenses were reasonable. The Trustees also noted that Janus Capital had contractually agreed to limit the Fund’s expenses.
· For Janus Henderson Enterprise Fund, the Trustees noted that the Fund’s total expenses were below the peer group average for all share classes.
· For Janus Henderson Forty Fund, the Trustees noted that, although the Fund’s total expenses exceeded the peer group average for certain share classes, overall the Fund’s total expenses were reasonable. The Trustees also noted that Janus Capital has contractually agreed to limit the Fund’s expenses, although this limit did not apply because the Fund’s total expenses were already below the applicable fee limit.
· For Janus Henderson Growth and Income Fund, the Trustees noted that, although the Fund’s total expenses exceeded the peer group average for certain share classes, overall the Fund’s total expenses were reasonable. The Trustees also noted that Janus Capital has contractually agreed to limit the Fund’s expenses, although this limit did not apply because the Fund’s total expenses were already below the applicable fee limit.
· For Janus Henderson Research Fund, the Trustees noted that the Fund’s total expenses were below the peer group average for all share classes.
Janus Henderson Developed World Bond Fund
Additional Information (unaudited)
· For Janus Henderson Triton Fund, the Trustees noted that, although the Fund’s expenses exceeded the peer group average for one share class, overall the Fund’s total expenses were reasonable. The Trustees also noted that Janus Capital had contractually agreed to limit the Fund’s expenses, although this limit did not apply because the Fund’s total expenses were already below the applicable fee limit.
· For Janus Henderson U.S. Growth Opportunities Fund, that Trustees noted that the Fund’s total expenses were below the peer group average for all share classes.
· For Janus Henderson Venture Fund, the Trustees noted that, although the Fund’s expenses exceeded the peer group average for one share class, overall the Fund’s total expenses were reasonable. The Trustees also noted that Janus Capital had contractually agreed to limit the Fund’s expenses, although this limit did not apply because the Fund’s total expenses were already below the applicable fee limit.
Quantitative Equity Funds
· For Janus Henderson Emerging Markets Managed Volatility Fund, the Trustees noted that, although the Fund’s total expenses exceeded the peer group average for certain share classes, overall the Fund’s total expenses were reasonable. The Trustees also noted that Janus Capital has contractually agreed to limit the Fund’s expenses.
· For Janus Henderson Global Income Managed Volatility Fund, the Trustees noted that the Fund’s total expenses were below the peer group average for all share classes.
· For Janus Henderson International Managed Volatility Fund, the Trustees noted that, although the Fund’s total expenses exceeded the peer group average for certain share classes, overall the Fund’s total expenses were reasonable. The Trustees also noted that Janus Capital has contractually agreed to limit the Fund’s expenses.
· For Janus Henderson U.S. Managed Volatility Fund, the Trustees noted that the Fund’s total expenses were below the peer group average for all share classes.
U.S. Equity Funds
· For Janus Henderson Large Cap Value Fund, the Trustees noted that the Fund’s total expenses were below the peer group average for all share classes.
· For Janus Henderson Mid Cap Value Fund, the Trustees noted that, although the Fund’s expenses exceeded the peer group average for certain share classes, overall the Fund’s total expenses were reasonable. The Trustees also noted that Janus Capital had contractually agreed to limit the Fund’s expenses, although this limit did not apply because the Fund’s total expenses were already below the applicable fee limit.
· For Janus Henderson Small Cap Value Fund, the Trustees noted that, although the Fund’s total expenses exceeded the peer group average for certain share classes, overall the Fund’s total expenses were reasonable. The Trustees also noted that Janus Capital has contractually agreed to limit the Fund’s expenses, although this limit did not apply because the Fund’s total expenses were already below the applicable fee limit.
· For Janus Henderson Small-Mid Cap Value Fund, the Trustees noted that, although the Fund’s total expenses exceeded the peer group average for certain share classes, overall the Fund’s total expenses were reasonable. The Trustees also noted that Janus Capital has contractually agreed to limit the Fund’s expenses.
The Trustees reviewed information on the overall profitability to Janus Capital and its affiliates of their relationship with the Janus Henderson Funds, and considered profitability data of other publicly traded mutual fund advisers. The Trustees recognized that profitability comparisons among fund managers are difficult because of the variation in the type of comparative information that is publicly available, and the profitability of any fund manager is affected by numerous factors, including the organizational structure of the particular fund manager, differences in complex size, difference in product mix, difference in types of business (mutual fund, institutional and other), differences in the types of funds and other accounts it manages, possible other lines of business, the methodology for allocating expenses, and the fund manager’s capital structure and cost of capital.
Additionally, the Trustees considered the estimated profitability to Janus Capital from the investment management services it provided to each Janus Henderson Fund. In their review, the Trustees considered whether Janus Capital and each subadviser receive adequate incentives and resources to manage the Janus Henderson Funds effectively. In reviewing profitability, the Trustees noted that the estimated profitability for an individual Janus Henderson Fund is
Janus Henderson Developed World Bond Fund
Additional Information (unaudited)
necessarily a product of the allocation methodology utilized by Janus Capital to allocate its expenses as part of the estimated profitability calculation. In this regard, the Trustees noted that the independent fee consultant found that (1) the expense allocation methodology and rationales utilized by Janus Capital were reasonable and (2) no clear correlation between expense allocations and operating margins. The Trustees also considered that the estimated profitability for an individual Janus Henderson Fund was influenced by a number of factors, including not only the allocation methodology selected, but also the presence of fee waivers and expense caps, and whether the Janus Henderson Fund’s investment management agreement contained breakpoints or a performance fee component. The Trustees determined, after taking into account these factors, among others, that Janus Capital’s estimated profitability with respect to each Janus Henderson Fund was not unreasonable in relation to the services provided, and that the variation in the range of such estimated profitability among the Janus Henderson Funds was not a material factor in the Board’s approval of the reasonableness of any Janus Henderson Fund’s investment management fees.
The Trustees concluded that the management fees payable by each Janus Henderson Fund to Janus Capital and its affiliates, as well as the fees paid by Janus Capital to the subadvisers of subadvised Janus Henderson Funds, were reasonable in relation to the nature, extent, and quality of the services provided, taking into account the fees charged by other advisers for managing comparable mutual funds with similar strategies, the fees Janus Capital and the subadvisers charge to other clients, and, as applicable, the impact of fund performance on management fees payable by the Janus Henderson Funds. The Trustees also concluded that each Janus Henderson Fund’s total expenses were reasonable, taking into account the size of the Janus Henderson Fund, the quality of services provided by Janus Capital and any subadviser, the investment performance of the Janus Henderson Fund, and any expense limitations agreed to or provided by Janus Capital.
Economies of Scale
The Trustees considered information about the potential for Janus Capital to realize economies of scale as the assets of the Janus Henderson Funds increase. They noted that their independent fee consultant published a report to the Trustees in November 2019 which provided its research and analysis into economies of scale. They also noted that, although many Janus Henderson Funds pay advisory fees at a base fixed rate as a percentage of net assets, without any breakpoints or performance fees, their independent fee consultant concluded that 64% of these Janus Henderson Funds’ share classes have contractual management fees (gross of waivers) below their Broadridge expense group averages. They also noted the following: (1) that for those Janus Henderson Funds whose expenses are being reduced by the contractual expense limitations of Janus Capital, Janus Capital is subsidizing certain of these Janus Henderson Funds because they have not reached adequate scale; (2) as the assets of some of the Janus Henderson Funds have declined in the past few years, certain Janus Henderson Funds have benefited from having advisory fee rates that have remained constant rather than increasing as assets declined; (3) performance fee structures have been implemented for various Janus Henderson Funds that have caused the effective rate of advisory fees payable by such a Janus Henderson Fund to vary depending on the investment performance of the Janus Henderson Fund relative to its benchmark index over the measurement period; and (4) a few Janus Henderson Funds have fee schedules with breakpoints and reduced fee rates above certain asset levels. The Trustees also noted that the Janus Henderson Funds share directly in economies of scale through the lower charges of third-party service providers that are based in part on the combined scale of all of the Janus Henderson Funds.
The Trustees also considered the independent fee consultant’s conclusion that, given the limitations of various analytical approaches to economies of scale and their conflicting results, it is difficult to analytically confirm or deny the existence of economies of scale in the Janus Henderson complex. In this regard, the independent consultant concluded that (1) to the extent there were economies of scale at Janus Capital, Janus Capital’s general strategy of setting fixed management fees below peers appeared to share any such economies with investors even on smaller Janus Henderson Funds which have not yet achieved those economies and (2) by setting lower fixed fees from the start on these Janus Henderson Funds, Janus Capital appeared to be investing to increase the likelihood that these Janus Henderson Funds will grow to a level to achieve any scale economies that may exist. Further, the independent fee consultant provided its belief that Janus Henderson Fund investors are well-served by the fee levels and performance fee structures in place on the Janus Henderson Funds in light of any economies of scale that may be present at Janus Capital.
Based on all of the information reviewed, including the recent and past research and analysis conducted by the Trustees’ independent fee consultant, the Trustees concluded that the current fee structure of each Janus Henderson Fund was reasonable and that the current rates of fees do reflect a sharing between Janus Capital and the Janus
Janus Henderson Developed World Bond Fund
Additional Information (unaudited)
Henderson Fund of any economies of scale that may be present at the current asset level of the Janus Henderson Fund.
Other Benefits to Janus Capital
The Trustees also considered benefits that accrue to Janus Capital and its affiliates and subadvisers to the Janus Henderson Funds from their relationships with the Janus Henderson Funds. They recognized that two affiliates of Janus Capital separately serve the Janus Henderson Funds as transfer agent and distributor, respectively, and the transfer agent receives compensation directly from the non-money market funds for services provided, and that such compensation contributes to the overall profitability of Janus Capital and its affiliates that results from their relationship with the Janus Henderson Funds. The Trustees also considered Janus Capital’s past and proposed use of commissions paid by the Janus Henderson Funds on portfolio brokerage transactions to obtain proprietary and third-party research products and services benefiting the Janus Henderson Fund and/or other clients of Janus Capital and/or Janus Capital, and/or a subadviser to a Janus Henderson Fund. The Trustees concluded that Janus Capital’s and the subadvisers’ use of these types of client commission arrangements to obtain proprietary and third-party research products and services was consistent with regulatory requirements and guidelines and was likely to benefit each Janus Henderson Fund. The Trustees also concluded that, other than the services provided by Janus Capital and its affiliates and subadvisers pursuant to the agreements and the fees to be paid by each Janus Henderson Fund therefor, the Janus Henderson Funds and Janus Capital and the subadvisers may potentially benefit from their relationship with each other in other ways. They concluded that Janus Capital and its affiliates share directly in economies of scale through the lower charges of third-party service providers that are based in part on the combined scale of the Janus Henderson Funds and other clients serviced by Janus Capital and its affiliates. They also concluded that Janus Capital and/or the subadvisers benefit from the receipt of research products and services acquired through commissions paid on portfolio transactions of the Janus Henderson Funds and that the Janus Henderson Funds benefit from Janus Capital’s and/or the subadvisers’ receipt of those products and services as well as research products and services acquired through commissions paid by other clients of Janus Capital and/or other clients of the subadvisers. They further concluded that the success of any Janus Henderson Fund could attract other business to Janus Capital, the subadvisers or other Janus Henderson funds, and that the success of Janus Capital and the subadvisers could enhance Janus Capital’s and the subadvisers’ ability to serve the Janus Henderson Funds.
LIQUIDITY RISK MANAGEMENT PROGRAM
Janus Henderson Funds (other than the money market funds) have adopted and implemented a written liquidity risk management program (the “LRMP”) as required by Rule 22e-4 under the Investment Company Act of 1940, as amended (the “Liquidity Rule”). Rule 22e-4, requires open-end funds to adopt and implement a written liquidity risk management program that is reasonably designed to assess and manage liquidity risk, which is the risk that a fund could not meet redemption requests without significant dilution of remaining investors’ interest in the fund. The LRMP incorporates the following elements: (i) assessment, management, and periodic review of liquidity risk; (ii) classification of portfolio investments; (iii) the establishment and monitoring of a highly liquid investment minimum, as applicable; (iv) a 15% limitation on a Fund’s illiquid investments; (v) redemptions in-kind; and (vi) board oversight.
The Trustees have designated Janus Capital Management LLC, the Fund’s investment adviser (“Janus Capital”), as the Program Administrator for the LRMP responsible for administering the LRMP and carrying out the specific responsibilities of the LRMP. A working group comprised of various groups within Janus Capital’s business is responsible for administering the LRMP and carrying out the specific responsibilities of different aspects of the LRMP.
The Liquidity Rule requires the Trustees to review at least annually a written report provided by the Program Administrator that addresses the operation of the LRMP and assesses its adequacy and the effectiveness of its implementation, including, if applicable, the operation of the highly liquid investment minimum, and any material changes to the LRMP (the “Program Administrator Report”). During the annual period ended June 30, 2020, the Program Administrator provided the Program Administrator Report to the Trustees which covered the operation of the LRMP from December 1, 2018 through December 31, 2019 (the “Reporting Period”). No significant liquidity events impacting the Fund were noted in the Program Administrator Report, and the Fund was able to process redemptions during the normal course of business during the Reporting Period. In addition, the Program Administrator expressed its belief in the Program Administrator Report that:
Janus Henderson Developed World Bond Fund
Additional Information (unaudited)
· the LRMP is reasonably designed and adequate to assess and manage the Fund’s liquidity risk, taking into account the Fund’s particular risks and circumstances, and includes policies and procedures reasonably designed to implement each required component of the Liquidity Rule; and
· the LRMP, including the Highly Liquid Investment Minimum where applicable, was implemented and operated effectively to achieve the goal of assessing and managing the Fund’s liquidity risk.
There can be no assurance that the LRMP will achieve its objectives in the future. Please refer to your Fund’s prospectus for more information regarding the risks to which an investment in the Fund may be subject.
Janus Henderson Developed World Bond Fund
Useful Information About Your Fund Report (unaudited)
Management Commentary
The Management Commentary in this report includes valuable insight as well as statistical information to help you understand how your Fund’s performance and characteristics stack up against those of comparable indices.
If the Fund invests in foreign securities, this report may include information about country exposure. Country exposure is based primarily on the country of risk. A company may be allocated to a country based on other factors such as location of the company’s principal office, the location of the principal trading market for the company’s securities, or the country where a majority of the company’s revenues are derived.
Please keep in mind that the opinions expressed in the Management Commentary are just that: opinions. They are a reflection based on best judgment at the time this report was compiled, which was June 30, 2020. As the investing environment changes, so could opinions. These views are unique and are not necessarily shared by fellow employees or by Janus Henderson in general.
Performance Overviews
Performance overview graphs compare the performance of a hypothetical $10,000 investment in the Fund with one or more widely used market indices. When comparing the performance of the Fund with an index, keep in mind that market indices are not available for investment and do not reflect deduction of expenses.
Average annual total returns are quoted for a Fund with more than one year of performance history. Average annual total return is calculated by taking the growth or decline in value of an investment over a period of time, including reinvestment of dividends and distributions, then calculating the annual compounded percentage rate that would have produced the same result had the rate of growth been constant throughout the period. Average annual total return does not reflect the deduction of taxes that a shareholder would pay on Fund distributions or redemptions of Fund shares.
Cumulative total returns are quoted for a Fund with less than one year of performance history. Cumulative total return is the growth or decline in value of an investment over time, independent of the period of time involved. Cumulative total return does not reflect the deduction of taxes that a shareholder would pay on Fund distributions or redemptions of Fund shares.
Pursuant to federal securities rules, expense ratios shown in the performance chart reflect subsidized (if applicable) and unsubsidized ratios. The total annual fund operating expenses ratio is gross of any fee waivers, reflecting the Fund’s unsubsidized expense ratio. The net annual fund operating expenses ratio (if applicable) includes contractual waivers of Janus Capital and reflects the Fund’s subsidized expense ratio. Ratios may be higher or lower than those shown in the “Financial Highlights” in this report.
Schedule of Investments
Following the performance overview section is the Fund’s Schedule of Investments. This schedule reports the types of securities held in the Fund on the last day of the reporting period. Securities are usually listed by type (common stock, corporate bonds, U.S. Government obligations, etc.) and by industry classification (banking, communications, insurance, etc.). Holdings are subject to change without notice.
The value of each security is quoted as of the last day of the reporting period. The value of securities denominated in foreign currencies is converted into U.S. dollars.
If the Fund invests in foreign securities, it will also provide a summary of investments by country. This summary reports the Fund exposure to different countries by providing the percentage of securities invested in each country. The country of each security represents the country of risk. The Fund’s Schedule of Investments relies upon the industry group and country classifications published by Barclays and/or MSCI Inc.
Tables listing details of individual forward currency contracts, futures, written options, swaptions, and swaps follow the Fund’s Schedule of Investments (if applicable).
Statement of Assets and Liabilities
This statement is often referred to as the “balance sheet.” It lists the assets and liabilities of the Fund on the last day of the reporting period.
Janus Henderson Developed World Bond Fund
Useful Information About Your Fund Report (unaudited)
The Fund’s assets are calculated by adding the value of the securities owned, the receivable for securities sold but not yet settled, the receivable for dividends declared but not yet received on securities owned, and the receivable for Fund shares sold to investors but not yet settled. The Fund’s liabilities include payables for securities purchased but not yet settled, Fund shares redeemed but not yet paid, and expenses owed but not yet paid. Additionally, there may be other assets and liabilities such as unrealized gain or loss on forward currency contracts.
The section entitled “Net Assets Consist of” breaks down the components of the Fund’s net assets. Because the Fund must distribute substantially all earnings, you will notice that a significant portion of net assets is shareholder capital.
The last section of this statement reports the net asset value (“NAV”) per share on the last day of the reporting period. The NAV is calculated by dividing the Fund’s net assets for each share class (assets minus liabilities) by the number of shares outstanding.
Statement of Operations
This statement details the Fund’s income, expenses, realized gains and losses on securities and currency transactions, and changes in unrealized appreciation or depreciation of Fund holdings.
The first section in this statement, entitled “Investment Income,” reports the dividends earned from securities and interest earned from interest-bearing securities in the Fund.
The next section reports the expenses incurred by the Fund, including the advisory fee paid to the investment adviser, transfer agent fees and expenses, and printing and postage for mailing statements, financial reports and prospectuses. Expense offsets and expense reimbursements, if any, are also shown.
The last section lists the amounts of realized gains or losses from investment and foreign currency transactions, and changes in unrealized appreciation or depreciation of investments and foreign currency-denominated assets and liabilities. The Fund will realize a gain (or loss) when it sells its position in a particular security. A change in unrealized gain (or loss) refers to the change in net appreciation or depreciation of the Fund during the reporting period. “Net Realized and Unrealized Gain/(Loss) on Investments” is affected both by changes in the market value of Fund holdings and by gains (or losses) realized during the reporting period.
Statements of Changes in Net Assets
These statements report the increase or decrease in the Fund’s net assets during the reporting period. Changes in the Fund’s net assets are attributable to investment operations, dividends and distributions to investors, and capital share transactions. This is important to investors because it shows exactly what caused the Fund’s net asset size to change during the period.
The first section summarizes the information from the Statement of Operations regarding changes in net assets due to the Fund’s investment operations. The Fund’s net assets may also change as a result of dividend and capital gains distributions to investors. If investors receive their dividends and/or distributions in cash, money is taken out of the Fund to pay the dividend and/or distribution. If investors reinvest their dividends and/or distributions, the Fund’s net assets will not be affected. If you compare the Fund’s “Net Decrease from Dividends and Distributions” to “Reinvested Dividends and Distributions,” you will notice that dividends and distributions have little effect on the Fund’s net assets. This is because the majority of the Fund’s investors reinvest their dividends and/or distributions.
The reinvestment of dividends and distributions is included under “Capital Share Transactions.” “Capital Shares” refers to the money investors contribute to the Fund through purchases or withdrawals via redemptions. The Fund’s net assets will increase and decrease in value as investors purchase and redeem shares from the Fund.
Financial Highlights
This schedule provides a per-share breakdown of the components that affect the Fund’s NAV for current and past reporting periods as well as total return, asset size, ratios, and portfolio turnover rate.
The first line in the table reflects the NAV per share at the beginning of the reporting period. The next line reports the net investment income/(loss) per share. Following is the per share total of net gains/(losses), realized and unrealized. Per share dividends and distributions to investors are then subtracted to arrive at the NAV per share at the end of the period. The next line reflects the total return for the period. The total return may include adjustments in accordance with generally accepted accounting principles required at the period end for financial reporting purposes. As a result, the
Janus Henderson Developed World Bond Fund
Useful Information About Your Fund Report (unaudited)
total return may differ from the total return reflected for individual shareholder transactions. Also included are ratios of expenses and net investment income to average net assets.
The Fund’s expenses may be reduced through expense offsets and expense reimbursements. The ratios shown reflect expenses before and after any such offsets and reimbursements.
The ratio of net investment income/(loss) summarizes the income earned less expenses, divided by the average net assets of the Fund during the reporting period. Do not confuse this ratio with the Fund’s yield. The net investment income ratio is not a true measure of the Fund’s yield because it does not take into account the dividends distributed to the Fund’s investors.
The next figure is the portfolio turnover rate, which measures the buying and selling activity in the Fund. Portfolio turnover is affected by market conditions, changes in the asset size of the Fund, fluctuating volume of shareholder purchase and redemption orders, the nature of the Fund’s investments, and the investment style and/or outlook of the portfolio manager(s) and/or investment personnel. A 100% rate implies that an amount equal to the value of the entire portfolio was replaced once during the fiscal year; a 50% rate means that an amount equal to the value of half the portfolio is traded in a year; and a 200% rate means that an amount equal to the value of the entire portfolio is traded every six months.
Janus Henderson Developed World Bond Fund
Designation Requirements (unaudited)
For federal income tax purposes, the Fund designated the following for the year ended June 30, 2020:
| | |
| | |
Capital Gain Distributions | $3,873,056 |
Dividends Received Deduction Percentage | 1% |
Qualified Dividend Income Percentage | 1% |
Janus Henderson Developed World Bond Fund
Trustees and Officers (unaudited)
The Fund’s Statement of Additional Information includes additional information about the Trustees and officers and is available, without charge, by calling 1-877-335-2687.
The following are the Trustees and officers of the Trust, together with a brief description of their principal occupations during the last five years (principal occupations for certain Trustees may include periods over five years).
Each Trustee has served in that capacity since he or she was originally elected or appointed. The Trustees do not serve a specified term of office. Each Trustee will hold office until the termination of the Trust or his or her earlier death, resignation, retirement, incapacity, or removal. Under the Fund’s Governance Procedures and Guidelines, the policy is for Trustees to retire no later than the end of the calendar year in which the Trustee turns 75. The Trustees review the Fund’s Governance Procedures and Guidelines from time to time and may make changes they deem appropriate. The Fund’s Nominating and Governance Committee will consider nominees for the position of Trustee recommended by shareholders. Shareholders may submit the name of a candidate for consideration by the Committee by submitting their recommendations to the Trust’s Secretary. Each Trustee is currently a Trustee of one other registered investment company advised by Janus Capital: Janus Aspen Series. Collectively, these two registered investment companies consist of 56 series or funds referred to herein as the Fund Complex.
The Trust’s officers are elected annually by the Trustees for a one-year term. Certain officers also serve as officers of Janus Aspen Series. Certain officers of the Fund may also be officers and/or directors of Janus Capital. Except as otherwise disclosed, Fund officers receive no compensation from the Fund, except for the Fund’s Chief Compliance Officer, as authorized by the Trustees.
Janus Henderson Developed World Bond Fund
Trustees and Officers (unaudited)
| | | | | | |
TRUSTEES |
Name, Address, and Age | Positions Held with the Trust | Length of Time Served | Principal Occupations During the Past Five Years | Number of Portfolios/Funds in Fund Complex Overseen by Trustee | Other Directorships Held by Trustee During the Past Five Years |
Independent Trustees | | | | |
William F. McCalpin
151 Detroit Street
Denver, CO 80206
DOB: 1957 | Chairman
Trustee | 1/08-Present
6/02-Present | Independent Consultant. Formerly, Managing Partner, Impact Investments, Athena Capital Advisors LLC (independent registered investment advisor) (2016-2019), Managing Director, Holos Consulting LLC (provides consulting services to foundations and other nonprofit organizations) (2009-2016), Chief Executive Officer, Imprint Capital Advisors (impact investment firm) (2013-2015), and Executive Vice President and Chief Operating Officer of The Rockefeller Brothers Fund (a private family foundation) (1998-2006). | 56 | Director of Mutual Fund Directors Forum (a non-profit organization serving independent directors of U.S. mutual funds) (since 2016), Chairman of the Board and Trustee of The Investment Fund for Foundations Investment Program (TIP) (consisting of 2 funds) (since 2008), and Director of the F.B. Heron Foundation (a private grantmaking foundation) (since 2006). |
Janus Henderson Developed World Bond Fund
Trustees and Officers (unaudited)
| | | | | | |
TRUSTEES |
Name, Address, and Age | Positions Held with the Trust | Length of Time Served | Principal Occupations During the Past Five Years | Number of Portfolios/Funds in Fund Complex Overseen by Trustee | Other Directorships Held by Trustee During the Past Five Years |
Independent Trustees | | | | |
Alan A. Brown
151 Detroit Street
Denver, CO 80206
DOB: 1962 | Trustee | 1/13-Present | Principal, Curam Holdings LLC (since 2018). Formerly, Executive Vice President, Institutional Markets, of Black Creek Group (private equity real estate investment management firm) (2012-2018), Executive Vice President and Co-Head, Global Private Client Group (2007-2010), Executive Vice President, Mutual Funds (2005-2007), and Chief Marketing Officer (2001-2005) of Nuveen Investments, Inc. (asset management). | 56 | Advisory Board Member of AEW Core Property Trust (open-end property fund) (since 2020), and Director of WTTW (PBS affiliate) (since 2003). Formerly, Director of MotiveQuest LLC (strategic social market research company) (2003-2016), Director of Nuveen Global Investors LLC (2007-2011), Director of Communities in Schools (2004-2010), and Director of Mutual Fund Education Alliance (until 2010). |
Janus Henderson Developed World Bond Fund
Trustees and Officers (unaudited)
| | | | | | |
TRUSTEES |
Name, Address, and Age | Positions Held with the Trust | Length of Time Served | Principal Occupations During the Past Five Years | Number of Portfolios/Funds in Fund Complex Overseen by Trustee | Other Directorships Held by Trustee During the Past Five Years |
Independent Trustees | | | | |
William D. Cvengros
151 Detroit Street
Denver, CO 80206
DOB: 1948 | Trustee | 1/11-Present | Chief Executive Officer of SJC Capital, LLC (a personal investment company and consulting firm) (since 2002). Formerly, Venture Partner for The Edgewater Funds (a middle market private equity firm) (2002-2004), Chief Executive Officer and President of PIMCO Advisors Holdings L.P. (a publicly traded investment management firm) (1994-2000), and Chief Investment Officer (1987-1994) and Vice Chairman and Director (1990-1994) of Pacific Life Insurance Company (a mutual life insurance and annuity company) (1987-1994). | 56 | Advisory Board Member, RevOZ Fund LP and related funds (real estate investments for opportunity zones) (since 2020), and Advisory Board Member, Innovate Partners Emerging Growth and Equity Fund I (early stage venture capital fund) (since 2014). Formerly, Managing Trustee of National Retirement Partners Liquidating Trust (2013-2016), Chairman, National Retirement Partners, Inc. (formerly a network of advisors to 401(k) plans) (2005-2013), Director of Prospect Acquisition Corp. (a special purpose acquisition corporation) (2007-2009), Director of RemedyTemp, Inc. (temporary help services company) (1996-2006), and Trustee of PIMCO Funds Multi-Manager Series (1990-2000) and Pacific Life Variable Life & Annuity Trusts (1987-1994). |
Janus Henderson Developed World Bond Fund
Trustees and Officers (unaudited)
| | | | | | |
TRUSTEES |
Name, Address, and Age | Positions Held with the Trust | Length of Time Served | Principal Occupations During the Past Five Years | Number of Portfolios/Funds in Fund Complex Overseen by Trustee | Other Directorships Held by Trustee During the Past Five Years |
Independent Trustees | | | | |
Raudline Etienne
151 Detroit Street
Denver, CO 80206
DOB: 1965 | Trustee | 6/16-Present | Founder, Daraja Capital (advisory and investment firm) (since 2016), and Senior Advisor, Albright Stonebridge Group LLC (global strategy firm) (since 2016). Formerly, Senior Vice President (2011-2015), Albright Stonebridge Group LLC, and Deputy Comptroller and Chief Investment Officer, New York State Common Retirement Fund (public pension fund) (2008-2011). | 56 | Board Member, Van Alen Institute (nonprofit architectural and design organization) (since 2019) and Director of Brightwood Capital Advisors, LLC (since 2014). |
William M. Fitzgerald, Sr.
151 Detroit Street
Denver, CO 80206
DOB: 1964 | Trustee | 9/19-Present | Founder, Fitzgerald Asset Management LLC (since 2012). Formerly, Founder and Chief Investment Officer, Global Infrastructure Asset Management LLC (2008-2017), Chief Investment Officer of Nuveen Asset Management (2000-2007), and Managing Director, Nuveen Investment LLC (1988-2007). | 56 | Board of Directors, Municipal Securities Rulemaking Board (since 2017). Formerly, Board of Directors of Syncora Holdings Ltd, Syncora Guarantee Inc., and Syncora Capital Assurance Inc. (2009-2016), and Trustee, Destra Investment Trust (2010-2014). |
Janus Henderson Developed World Bond Fund
Trustees and Officers (unaudited)
| | | | | | |
TRUSTEES |
Name, Address, and Age | Positions Held with the Trust | Length of Time Served | Principal Occupations During the Past Five Years | Number of Portfolios/Funds in Fund Complex Overseen by Trustee | Other Directorships Held by Trustee During the Past Five Years |
Independent Trustees | | | | |
Gary A. Poliner
151 Detroit Street
Denver, CO 80206
DOB: 1953 | Trustee | 6/16-Present | Retired. Formerly, President (2010-2013) of Northwestern Mutual Life Insurance Company. | 56 | Director of MGIC Investment Corporation (private mortgage insurance) (since 2013) and West Bend Mutual Insurance Company (property/casualty insurance) (since 2013). Formerly, Trustee of Northwestern Mutual Life Insurance Company (2010-2013), and Director of Frank Russell Company (global asset management firm) (2008-2013). |
Diane L. Wallace
151 Detroit Street
Denver, CO 80206
DOB: 1958 | Trustee | 6/17-Present | Retired. | 56 | Formerly, Independent Trustee, Henderson Global Funds (13 portfolios) (2015-2017), Independent Trustee, State Farm Associates’ Funds Trust, State Farm Mutual Fund Trust, and State Farm Variable Product Trust (28 portfolios) (2013-2017), Chief Operating Officer, Senior Vice President-Operations, and Chief Financial Officer for Driehaus Capital Management, LLC (1988-2006), and Treasurer for Driehaus Mutual Funds (1996-2002). |
Janus Henderson Developed World Bond Fund
Trustees and Officers (unaudited)
| | | | | | |
TRUSTEES |
Name, Address, and Age | Positions Held with the Trust | Length of Time Served | Principal Occupations During the Past Five Years | Number of Portfolios/Funds in Fund Complex Overseen by Trustee | Other Directorships Held by Trustee During the Past Five Years |
Independent Trustees | | | | |
Linda S. Wolf
151 Detroit Street
Denver, CO 80206
DOB: 1947 | Trustee | 11/05-Present | Retired. Formerly, Chairman and Chief Executive Officer of Leo Burnett (Worldwide) (advertising agency) (2001-2005). | 56 | Director of Chicago Community Trust (Regional Community Foundation), Lurie Children’s Hospital (Chicago, IL), Shirley Ryan Ability Lab and Wrapports, LLC (digital communications company). Formerly, Director of Chicago Council on Global Affairs (until 2019), InnerWorkings (until 2019), Director of Walmart (until 2017), Director of Chicago Convention & Tourism Bureau (until 2014), and The Field Museum of Natural History (Chicago, IL) (until 2014). |
Janus Henderson Developed World Bond Fund
Trustees and Officers (unaudited)
| | | | |
OFFICERS |
Name, Address, and Age | Positions Held with the Trust | Term of Office* and Length of Time Served | Principal Occupations During the Past Five Years |
Jenna Barnard
151 Detroit Street
Denver, CO 80206
DOB: 1980 | Executive Vice President and Co-Portfolio Manager
Janus Henderson Developed World Bond Fund | 2/08-Present | Co-Head of Strategic Fixed Income of Janus Henderson Investors and Portfolio Manager for other Janus Henderson accounts. |
John Pattullo
151 Detroit Street
Denver, CO 80206
DOB: 1970 | Executive Vice President and Co-Portfolio Manager
Janus Henderson Developed World Bond Fund | 08/12-Present | Co-Head of Strategic Fixed Income of Janus Henderson Investors and Portfolio Manager for other Janus Henderson accounts. |
Bruce L. Koepfgen
151 Detroit Street
Denver, CO 80206
DOB: 1952 | President and Chief Executive Officer | 7/14-Present | Executive Vice President and Head of North America at Janus Henderson Investors (since 2017), President and Head of North America at Janus Capital Management LLC (since 2013 and 2017, respectively), President at Janus Capital Group Inc. (since 2013), President and Director at Janus International Holding LLC (since 2019 and 2011, respectively), President at Janus Holdings LLC (since 2019), President and Director at Janus Management Holdings Corporation (since 2017 and 2012, respectively), Executive Vice President and Head of North America at Janus Distributors LLC (since 2011 and 2019, respectively), Vice President and Director at Intech Investment Management LLC (since 2012), and Executive Vice President at Perkins Investment Management LLC (since 2011). Formerly, Executive Vice President at Janus Capital Group Inc., Janus International Holding LLC, and Janus Management Holdings Corporation (2011-2019), Director at Perkins Investment Management LLC (2011-2019), and Chief Financial Officer at Janus Capital Group Inc. (2011-2013). |
Janus Henderson Developed World Bond Fund
Trustees and Officers (unaudited)
| | | | |
OFFICERS |
Name, Address, and Age | Positions Held with the Trust | Term of Office* and Length of Time Served | Principal Occupations During the Past Five Years |
Kristin Mariani
151 Detroit Street
Denver, CO 80206
DOB: 1966 | Vice President, Chief Compliance Officer, and Anti-Money Laundering Officer | 7/20-Present | Chief Compliance Officer for Janus Capital Management LLC (since September 2017), and Global Head of Investment Management Compliance for Janus Henderson Investors (since 2019). Formerly, Vice President, Head of Global Distribution Compliance and Chief Compliance Officer of Janus Henderson Distributors (May 2017-September 2017), and Vice President, Compliance at Janus Capital Group Inc., Janus Capital Management LLC, and Janus Distributors LLC (2009-2017). |
Jesper Nergaard
151 Detroit Street
Denver, CO 80206
DOB: 1962 | Chief Financial Officer
Vice President, Treasurer, and Principal Accounting Officer | 3/05-Present
2/05-Present | Vice President of Janus Capital and Janus Services LLC. |
Byron D. Hittle
151 Detroit Street
Denver, CO 80206
DOB: 1974 | Interim Vice President, Chief Legal Officer, and Secretary | 8/20-Present | Managing Counsel (2017-present). Formerly, Assistant Vice President and Senior Legal Counsel, Janus Capital Management LLC (2012-2016). |
* Officers are elected at least annually by the Trustees for a one-year term and may also be elected from time to time by the Trustees for an interim period. |
Knowledge Shared
At Janus Henderson, we believe in the sharing of expert insight for better investment and business decisions. We call this ethos Knowledge Shared.
Learn more by visiting janushenderson.com.
| | | | | | | | | |
| | | | | |

| | | | |
This report is submitted for the general information of shareholders of the Fund. It is not an offer or solicitation for the Fund and is not authorized for distribution to prospective investors unless preceded or accompanied by an effective prospectus. |
Janus Henderson, Janus, Henderson, Perkins, Intech and Knowledge Shared are trademarks of Janus Henderson Group plc or one of its subsidiaries. © Janus Henderson Group plc Janus Henderson Distributors |
| | | | | 125-02-93077 08-20 |
| | | |
| | | |
| | | ANNUAL REPORT June 30, 2020 |
| | |
| | Janus Henderson Emerging Markets Managed Volatility Fund |
| | |
| | Janus Investment Fund |
Beginning on January 1, 2021, as permitted by regulations adopted by the Securities and Exchange Commission, paper copies of the Fund’s shareholder reports will no longer be sent by mail, unless you specifically request paper copies of the reports from the Fund or your plan sponsor, broker-dealer, or financial intermediary, or if you invest directly with the Fund, by contacting a Janus Henderson representative. Instead, the reports will be made available on a website, and you will be notified by mail each time a report is posted and provided with a website link to access the report. If you already elected to receive shareholder reports electronically, you will not be affected by this change and you need not take any action. You may elect to receive shareholder reports and other communications from the Fund electronically by contacting your plan sponsor, broker-dealer, or financial intermediary, or if you invest directly with the Fund, by visiting janushenderson.com/edelivery. You may elect to receive all future reports in paper free of charge. If you do not invest directly with the Fund, you should contact your plan sponsor, broker-dealer, or financial intermediary, to request to continue receiving paper copies of your shareholder reports. If you invest directly with the Fund, you can call 1-800-525-3713 to let the Fund know that you wish to continue receiving paper copies of your shareholder reports. Your election to receive reports in paper will apply to all Janus Henderson mutual funds where held (i.e., all Janus Henderson mutual funds held in your account if you invest through your financial intermediary or all Janus Henderson mutual funds held with the fund complex if you invest directly with a fund). |
| | | |
| | | HIGHLIGHTS · Portfolio management perspective · Investment strategy behind your fund · Fund performance, characteristics
and holdings |
| | | |
| | | 
|
Table of Contents
Janus Henderson Emerging Markets Managed Volatility Fund
Janus Henderson Emerging Markets Managed Volatility Fund (unaudited)
| | | | | | |
FUND SNAPSHOT Intech’s active approach focuses on adding value by selecting stocks with unique volatility characteristics and low correlations to one another. | | | | | sub-advised by Intech Investment Management LLC |
| | | |
Performance Overview
For the 12-month period ended June 30, 2020, Janus Henderson Emerging Markets Managed Volatility Fund’s Class I Shares returned -4.96%. This compares to the -3.39% return posted by the MSCI Emerging Markets IndexSM, the Fund’s benchmark.
Investment Strategy
Intech’s mathematical investment process is designed to determine potentially more efficient equity weightings of the securities in the benchmark Index, utilizing a specific mathematical optimization and disciplined rebalancing routine. Rather than trying to predict the future direction of stock prices, the process seeks to use the volatility and correlation characteristics of stocks to construct portfolios.
The investment process begins with the stocks in the MSCI Emerging Markets Index. Intech’s investment process aims to capture stocks’ natural volatility through a rebalancing mechanism based on estimates of relative volatility and correlation in order to outperform the benchmark index over the long term. Within specific risk constraints, the investment process will tend to favor stocks with higher relative volatility and lower correlation as they offer more potential to capture volatility through periodic rebalancing. Once the target proportions are determined and the portfolio is constructed, it is then rebalanced to those target proportions and re-optimized on a periodic basis. The Janus Henderson Emerging Markets Managed Volatility Fund focuses on seeking an excess return above the benchmark, while also reducing or managing the standard deviation of the portfolio depending on the market conditions, a strategy designed to manage the absolute risk of the portfolio.
Performance Review
Emerging markets experienced an uptick in volatility and a significant drawdown amid concerns over the global economic impact of the COVID-19 coronavirus. Despite a recovery of over 18% in the second quarter of 2020, emerging markets have declined by nearly 10% year to date, and are in negative territory for the trailing one-year period. Despite the brief but significant market sell-off in the first quarter, risk taking was generally rewarded over the past 12 months and defensive segments of the market tended to lag on average during the period, particularly during the market rally.
Despite providing some downside protection during the market drawdown, the Fund’s defensive positioning acted as a headwind to relative performance over the entire period. More specifically, an average underweight to higher-beta stocks was a detractor as higher-beta stocks strongly outperformed lower-beta stocks and the overall broad market in the risk on environment during the period.
The Fund was also negatively impacted by its smaller size positioning as larger-capitalization stocks outperformed the smaller-capitalization stocks within the Index over the past 12 months. From a sector perspective, while the Fund benefited from an average overweight to communication services, which was among the strongest-performing sectors during the period, overall active sector positioning was a detractor to relative performance. An average underweight to information technology and overweight to the defensive utilities sector detracted from the Fund’s relative performance.
Outlook
Because Intech does not conduct traditional economic or fundamental analysis, Intech has no view on individual stocks, sectors, economic or market conditions.
Managing downside exposure potentially allows for returns to compound and improve risk-adjusted returns over time. The Fund’s long-term investment objective is to produce an excess return over the benchmark with lower absolute risk. Going forward, we will continue building portfolios in a disciplined and deliberate manner, with risk management remaining the hallmark of our investment process. As Intech’s ongoing research efforts yield
Janus Henderson Emerging Markets Managed Volatility Fund (unaudited)
modest improvements, we will continue implementing changes that aim to improve the long-term results for our fund shareholders.
Thank you for your investment in Janus Henderson Emerging Markets Managed Volatility Fund.
Janus Henderson Emerging Markets Managed Volatility Fund (unaudited)
| | |
5 Largest Equity Holdings - (% of Net Assets) |
Chunghwa Telecom Co Ltd | |
Diversified Telecommunication Services | 5.8% |
Alibaba Group Holding Ltd (ADR) | |
Internet & Direct Marketing Retail | 3.4% |
Taiwan Mobile Co Ltd | |
Wireless Telecommunication Services | 3.1% |
Tencent Holdings Ltd | |
Interactive Media & Services | 2.9% |
China Resources Gas Group Ltd | |
Gas Utilities | 2.2% |
| | 17.4% |
| | | | | | |
Asset Allocation - (% of Net Assets) |
Common Stocks | | 99.7% |
Investments Purchased with Cash Collateral from Securities Lending | | 0.4% |
Preferred Stocks | | 0.3% |
Corporate Bonds | | 0.0% |
Other | | (0.4)% |
| | | 100.0% |
Emerging markets comprised 100.0% of total net assets.
| | |
Top Country Allocations - Long Positions - (% of Investment Securities) |
As of June 30, 2020 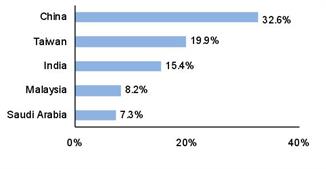
| As of June 30, 2019 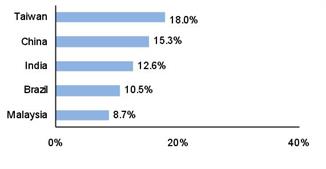
|
Janus Henderson Emerging Markets Managed Volatility Fund (unaudited)
Performance