UNITED STATES
SECURITIES AND EXCHANGE COMMISSION
Washington, D.C. 20549
FORM N-CSR
CERTIFIED SHAREHOLDER REPORT OF REGISTERED MANAGEMENT
INVESTMENT COMPANIES
Investment Company Act file number 811-173
DODGE & COX FUNDS
(Exact name of registrant as specified in charter)
555 California Street, 40th Floor
San Francisco, CA 94104
(Address of principal executive offices) (Zip code)
Thomas M. Mistele, Esq.
555 California Street, 40th Floor
San Francisco, CA 94104
(Name and address of agent for service)
Registrant’s telephone number, including area code: 415-981-1710
Date of fiscal year end: DECEMBER 31, 2005
Date of reporting period: June 30, 2005
Form N-CSR is to be used by management investment companies to file reports with the Commission not later than 10 days after the transmission to stockholders of any report that is required to be transmitted to stockholders under Rule 30e-1 under the Investment Company Act of 1940 (17 CFR 270.30e-1). The Commission may use the information provided on Form N-CSR in its regulatory, disclosure review, inspection, and policymaking roles.
A registrant is required to disclose the information specified by Form N-CSR, and the Commission will make this information public. A registrant is not required to respond to the collection of information contained in Form N-CSR unless the Form displays a currently valid Office of Management and Budget (“OMB”) control number. Please direct comments concerning the accuracy of the information collection burden estimate and any suggestions for reducing the burden to Secretary, Securities and Exchange Commission, 450 Fifth Street, NW, Washington, DC 20549-0609. The OMB has reviewed this collection of information under the clearance requirements of 44 U.S.C. ss. 3507.
| ITEM 1. | REPORTS TO STOCKHOLDERS. |
The following are the June 30, 2005 semi-annual reports for the Dodge & Cox Funds, a Delaware statutory trust, consisting of four series: Dodge & Cox Stock Fund, Dodge & Cox International Stock Fund, Dodge & Cox Balanced Fund, and Dodge & Cox Income Fund. The reports of each series were transmitted to their respective shareholders on August 9, 2005.

Stock Fund
Established 1965
(Closed to New Investors)

Semi-Annual Report
June 30, 2005
2005
Stock Fund
www.dodgeandcox.com
For Fund literature, transactions and account
information, please visit the Funds’ web site.
or write or call:
Dodge & Cox Funds
c/o Boston Financial Data Services
P.O. Box 8422
Boston, Massachusetts 02266-8422
(800) 621-3979
Investment Manager
Dodge & Cox
555 California Street, 40th Floor
San Francisco, California 94104
(415) 981-1710
This report is submitted for the general information of the shareholders of the Fund. The report is not authorized for distribution to prospective investors in the Fund unless it is accompanied by a current prospectus.
This report reflects our views, opinions and portfolio holdings as of June 30, 2005, the end of the reporting period. Any such views are subject to change at any time based upon market or other conditions and Dodge & Cox disclaims any responsibility to update such views. These views may not be relied on as investment advice and, because investment decisions for a Dodge & Cox Fund are based on numerous factors, may not be relied on as an indication of trading intent on behalf of any Dodge & Cox Fund.
06/05 SF SAR  Printed on recycled paper
To Our Shareholders
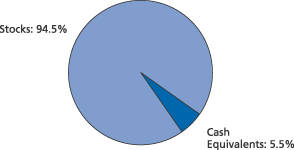
The Dodge & Cox Stock Fund had a total return of 0.7% for the six months ended June 30, 2005, compared to a total return of -0.8% for the Standard & Poor’s 500 (S&P 500). Longer-term results for the Fund can be found on the following page. On June 30, the Fund had net assets of $46.3 billion and a cash position of 5.5%.
Semi-Annual Performance Review
The Fund outperformed the S&P 500 for the six months ended June 30, 2005. During this period, the Fund benefited from a higher relative weighting (10% versus 8%) in Energy stocks. Strong performers in the Fund’s Energy holdings included Unocal (up 52%) and ConocoPhillips (up 34%). In addition, the Fund’s investments in the Health Care sector performed better than those in the S&P 500 (e.g., HCA up 43% and WellPoint up 21%). Conversely, the weak performance from the Fund’s Consumer Discretionary holdings, combined with a higher weighting (21% versus 11%) than the S&P 500 in this sector, detracted from relative results. Particularly weak stocks included Delphi (down 48%), Time Warner, (down 14%) and McDonald’s (down 13 %).
Morningstar® Address
In June, I, Harry Hagey, in my capacity as Chairman and CEO of Dodge & Cox was invited to speak at Morningstar’s Investment Conference. I thought it would be helpful to share an excerpt of that speech with our shareholders:
So, how did the small, local firm founded in the 1930s, which I joined in the late 1960s, become the firm we are today? What I would like to do now is to summarize for you what I think are the key components that make Dodge & Cox a successful money management firm.
First and Most Important—Our Current Clients
We are in the business of providing continuous high-quality investment management service to our existing clients. We decided a long time ago that we are not in business to provide a series of financial products to the investment market place. Another way to look at this is that we are in the investment business and not in the money gathering business. We do not advertise, we do not have a marketing department and no one at our firm is paid commissions or compensated directly for bringing in new business. We concluded that if we did a good job, the word would get around. We
have relatively low expense ratios with no 12b-1 or other fees. In general, our firm’s investment objective is to first preserve and then enhance the future purchasing power of our clients’ wealth over the long-term*. Please note that I did not say to beat a particular benchmark or to have low tracking error. If we believe that a significant part of the market is unattractive, we will not be in it. Finally, ethical considerations are paramount—we work hard to maintain our reputation.
Second—Our Employees
With regard to our own people, we insist on respect for each individual employee as well as for the entire firm. We work within a collegial and team-work environment with the goal of having everyone at the firm think as owners, not just as employees. Dodge & Cox has a long history, but it is still a small firm and its vitality is maintained by diplomatic entrepreneurship.
We also want all of our employees to share in the firm’s success. Our compensation structure provides salary and bonus for each member of our firm. The bonus is based on how well the firm has done and an employee’s contribution over time. We avoid any quantitative measurement of our research analysts’ performance because we make decisions as a group—we don’t believe in a “star system” or the reliance on any one individual. We try to create an environment where our analysts will not overly worry about making bad recommendations, and will be rewarded for sharing information with their peers.
Importantly, our independence, culture and compensation structure have led to low employee turnover which, in our opinion, is crucial to maintaining a consistent investment approach in difficult investment environments.
Third—Dodge & Cox
With regard to the firm, probably the most important characteristic is our independence. We require that shareholders of the firm be active employees. The firm is held widely with about one-third of employees being shareholders. We also believe it is important to have control of the investment service to our clients so we have no joint ventures. The only planning that we do is to make sure that we have assets in place, most important being people, so that we can continue to do a good job for our existing clients.
| | |
| 1 / Dodge & Cox Stock Fund | | |
For Dodge & Cox, issues of ethics, independence, a focused teamwork investment approach, respect for the individual, and an absence of a marketing mindset are all key determinants in what makes us who we are.
One of my individual clients recently sent me a book by James P. Owen, called Cowboy Ethics—What Wall Street Can Learn from the Code of the West. The pictures in the book are fantastic and I also believe that the book has real wisdom. In the book Mr. Owen summarized the Code with ten rules. The ones that resonated with me most are: 1) Take Pride in Your Work, 2) Ride for the Brand, 3) Remember That Some Things Aren’t for Sale, and 4) Know Where to Draw the Line.
I think Dodge & Cox as a firm has lived by this Code.
In Closing
In spite of rising short-term interest rates and energy prices, we continue to be optimistic about the long-term prospects for the global economy. We are also optimistic about corporate earnings over the next three-to-five years; nevertheless, we are cautious about returns from the broad market given current valuations.
As always, Dodge & Cox’s investment approach remains focused on intensive “bottom-up” fundamental analysis, while maintaining a strong price discipline and long-term view. Increasingly, this approach has led us to find selected opportunities in global companies that are domiciled outside the U.S. The Fund’s 19 foreign investments are all listed on U.S. exchanges and now represent almost 17% of the Fund—near the 20% maximum limit allowed by the Fund’s prospectus.
Thank you for your continued confidence in the Dodge & Cox Stock Fund. As always, we welcome your comments and questions.
For the Board of Trustees,
| | |
 | | 
|
| |
| Harry R. Hagey, Chairman | | John A. Gunn, President |
August 3, 2005
Ten Years of Investment Performance
through June 30, 2005 (in thousands)
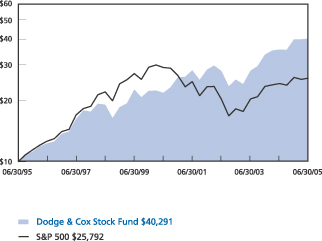
Average annual total return for periods ended June 30, 2005
| | | | | | | | | | | | |
| | | 1 Year | | | 5 Years | | | 10 Years | | | 20 Years | |
| Dodge & Cox Stock Fund | | 13.12 | % | | 13.00 | % | | 14.94 | % | | 15.23 | % |
| S&P 500 | | 6.29 | | | (2.37 | ) | | 9.94 | | | 12.28 | |
Past performance does not guarantee future results. Investment return and share price will fluctuate with market conditions, and investors may have a gain or loss when shares are sold. Mutual fund performance changes over time and currently may be significantly lower than stated above. Performance is updated and published monthly. Visit the Fund’s web site at www.dodgeandcox.com or call 800-621-3979 for current performance figures.
The Fund’s total returns include the reinvestment of dividend and capital gain distributions, but have not been adjusted for any income taxes payable by shareholders on these distributions. The Standard & Poor’s 500 (S&P 500) is a broad-based unmanaged measure of common stocks. Index returns include dividends and/or interest income and, unlike Fund returns, do not reflect fees or expenses.
Standard & Poor’s, Standard & Poor’s 500, and S&P 500® are trademarks of The McGraw-Hill Companies, Inc.
| * | | Please refer to the Fund’s prospectus for its investment objectives, policies and restrictions. |
| | |
| | | Dodge & Cox Stock Fund / 2 |
Fund Expenses
As a Fund shareholder, you incur ongoing costs, which include costs for portfolio management, administrative services, and shareholder reports (like this one). Operating expenses, which are deducted from a Fund’s gross income, directly reduce the investment return of the Fund. The following example is intended to help you understand the ongoing costs (in dollars) of investing in the Fund and to compare these costs with those of other mutual funds. The example is based on an investment of $1,000 made at the beginning of the most recent six-month period and held for the entire period.
The table below illustrates the Fund’s costs in two ways:
Actual Fund Expenses
The first line of the table below provides information about actual account values and actual expenses. You may use the information in this line, together with your account balance, to estimate the expenses that you paid on your account over the period. Simply divide your account value by $1,000 (for example, an $8,600 account value divided by $1,000 = 8.6), then multiply the result by the number under the heading “Expenses Paid During Period”.
Hypothetical Example for Comparison
Information on the second line of the table can help you compare ongoing costs of investing in the Fund with those of other mutual funds. This information may not be used to estimate the actual ending account balance or expenses you paid during the period. The hypothetical “Ending Account Value” is based on the actual expense ratio of the Fund and an assumed 5% annual rate of return before expenses (not the Fund’s actual return). The amount under the heading “Expense Paid During the Period” shows the hypothetical expense your account would have incurred under this scenario. You can compare this figure with the 5% hypothetical examples that appear in shareholder reports of other funds.
| | | | | | |
Six Months Ended
June 30, 2005 | | Beginning Account
Value 1/1/05 | | Ending Account
Value 6/30/05 | | Expenses Paid
During Period* |
| Based on Actual Fund Return | | $1,000.00 | | $1,006.80 | | $2.62 |
| Based on Hypothetical 5% Yearly Return | | 1,000.00 | | 1,022.39 | | 2.64 |
| * | | Expenses are equal to the Fund’s annualized expense ratio of 0.53%, multiplied by the average account value over the period, multiplied by 181/365 (to reflect the one-half year period). |
The expenses shown in the table highlight ongoing costs only and do not reflect any transactional costs or account maintenance fees. While other mutual funds may charge such fees, please note that the Fund does not charge transaction fees (e.g., redemption fees, sales loads) or universal account maintenance fees (e.g., small account fees).
| | |
| 3 / Dodge & Cox Stock Fund | | |
Fund Information | June 30, 2005 |
General Information
| | |
Net Asset Value Per Share | | $129.49 |
Total Net Assets (millions) | | $46,346 |
2004 Expense Ratio | | 0.53% |
2004 Portfolio Turnover | | 11% |
30-Day SEC Yield1 | | 1.26% |
Fund Inception | | 1965 |
Investment Manager: Dodge & Cox, San Francisco. Managed by the Investment Policy Committee, whose nine members’ average tenure at Dodge & Cox is 22 years.
Asset Allocation
| | | | |
| Stock Characteristics | | Fund | | S&P 500 |
Number of Stocks | | 93 | | 500 |
Median Market Capitalization (billions) | | $17 | | $11 |
Weighted-Avg. Market Capitalization (billions) | | $43 | | $89 |
Price-to-Earnings Ratio2 | | 15.4x | | 16.2x |
Price-to-Book Value Ratio | | 2.0x | | 2.8x |
Foreign Stocks3 (% of Fund) | | 16.8% | | 0.0% |
| | |
| Ten Largest Holdings4 | | % of Fund |
Hewlett-Packard | | 3.3 |
Comcast Class A | | 3.1 |
Cardinal Health | | 2.5 |
Time Warner, Inc. | | 2.5 |
HCA, Inc. | | 2.5 |
News Corp. Class A | | 2.4 |
McDonald’s | | 2.2 |
Union Pacific | | 2.1 |
Sony ADR (Japan) | | 2.1 |
Matsushita Electric Industrial ADR (Japan) | | 2.1 |
| | | | | | |
| Sector Diversification | | Fund | | | S&P 500 | |
Consumer Discretionary | | 20.3 | % | | 11.4 | % |
Financials | | 18.4 | | | 20.4 | |
Health Care | | 14.7 | | | 13.4 | |
Information Technology | | 12.4 | | | 15.1 | |
Energy | | 9.5 | | | 8.8 | |
Materials | | 7.2 | | | 2.9 | |
Industrials | | 6.0 | | | 11.2 | |
Utilities | | 3.0 | | | 3.5 | |
Consumer Staples | | 2.0 | | | 10.1 | |
Telecommunication Services | | 1.0 | | | 3.2 | |
| 1 | | SEC Yield is an annualization of the Fund’s total net investment income per share for the 30-day period ended on the last day of the month. |
| 2 | | The Fund’s price-to-earnings (P/E) ratio is calculated using Dodge & Cox’s estimated forward earnings and excludes extraordinary items. The S&P 500’s P/E ratio is calculated by Standard & Poor’s and uses an aggregated estimate of forward earnings. |
| 3 | | Foreign stocks are U.S. dollar-denominated. |
| 4 | | The Fund’s portfolio holdings are subject to change without notice. The mention of specific securities is not a recommendation or solicitation for any person to buy, sell or hold any particular security. |
| | |
| | | Dodge & Cox Stock Fund / 4 |
Portfolio of Investments (unaudited) | June 30, 2005 |
| | | | | |
| COMMON STOCKS: 94.5% |
| | |
| | | SHARES | | VALUE |
| CONSUMER DISCRETIONARY: 20.3% | | | |
| AUTOMOBILES & COMPONENTS: 0.7% | | | |
Delphi Corp.(c) | | 36,051,632 | | $ | 167,640,089 |
Honda Motor Co., Ltd. ADR(b) (Japan) | | 7,670,400 | | | 188,768,544 |
| | | | |
|
|
| | | | | | 356,408,633 |
| CONSUMER DURABLES & APPAREL: 5.5% | | | |
Matsushita Electric Industrial Co., Ltd. ADR(b) (Japan) | | 62,884,200 | | | 954,582,156 |
Sony Corp. ADR(b) (Japan) | | 27,840,800 | | | 958,837,152 |
Thomson S.A. ADR(b) (France) | | 5,200,000 | | | 124,540,000 |
VF Corp. | | 3,467,900 | | | 198,433,238 |
Whirlpool Corp.(c) | | 4,388,050 | | | 307,646,185 |
| | | | |
|
|
| | | | | | 2,544,038,731 |
| CONSUMER SERVICES: 2.2% | | | |
McDonald’s Corp. | | 36,530,400 | | | 1,013,718,600 |
| | | | |
|
|
| MEDIA: 8.9% | | | |
Comcast Corp. Class A(a) | | 46,214,330 | | | 1,418,779,931 |
Interpublic Group of Companies, Inc.(a) | | 5,728,200 | | | 69,769,476 |
Liberty Media Corp. Series A(a) | | 33,502,700 | | | 341,392,513 |
News Corp. Ltd., Class A | | 69,579,238 | | | 1,125,792,071 |
Time Warner, Inc.(a) | | 70,114,600 | | | 1,171,614,966 |
| | | | |
|
|
| | | | | | 4,127,348,957 |
| RETAILING: 3.0% | | | |
Dillard’s, Inc. Class A(c) | | 5,177,500 | | | 121,257,050 |
Gap, Inc. | | 8,972,500 | | | 177,206,875 |
Genuine Parts Co.(c) | | 8,953,800 | | | 367,911,642 |
May Department Stores Co.(c) | | 17,894,400 | | | 718,639,104 |
| | | | |
|
|
| | | | | | 1,385,014,671 |
| | | | |
|
|
| | | | | | 9,426,529,592 |
| CONSUMER STAPLES: 2.0% | | | |
| FOOD & STAPLES RETAILING: 0.2% | | | |
Wal-Mart Stores, Inc. | | 2,023,300 | | | 97,523,060 |
| | | | |
|
|
| FOOD, BEVERAGE & TOBACCO: 1.8% | | | |
Unilever N.V.(b) (Netherlands) | | 12,564,000 | | | 814,524,120 |
| | | | |
|
|
| | | | | | 912,047,180 |
| ENERGY: 9.5% | | | |
Amerada Hess Corp. | | 3,571,400 | | | 380,389,814 |
Baker Hughes, Inc. | | 9,717,750 | | | 497,160,090 |
ChevronTexaco Corp. | | 13,960,128 | | | 780,650,358 |
ConocoPhillips | | 11,286,800 | | | 648,878,132 |
Occidental Petroleum Corp. | | 5,153,100 | | | 396,427,983 |
Schlumberger Ltd.(b) (Netherlands Antilles) | | 3,170,400 | | | 240,760,176 |
Shell Transport & Trading Co. PLC ADR(b) (United Kingdom) | | 12,111,400 | | | 703,187,884 |
Unocal Corp. | | 11,456,400 | | | 745,238,820 |
| | | | |
|
|
| | | | | | 4,392,693,257 |
| | | | | |
| | |
| | | SHARES | | VALUE |
| FINANCIALS: 18.4% | | | |
| BANKS: 3.8% | | | |
Golden West Financial Corp. | | 8,898,600 | | $ | 572,891,868 |
Wachovia Corp. | | 16,600,300 | | | 823,374,880 |
Wells Fargo & Co. | | 6,046,600 | | | 372,349,628 |
| | | | |
|
|
| | | | | | 1,768,616,376 |
| DIVERSIFIED FINANCIALS: 4.7% | | | |
Capital One Financial Corp. | | 10,876,000 | | | 870,188,760 |
CIT Group, Inc. | | 8,507,403 | | | 365,563,107 |
Citigroup, Inc. | | 11,557,400 | | | 534,298,602 |
JPMorgan Chase & Co. | | 11,317,128 | | | 399,720,961 |
| | | | |
|
|
| | | | | | 2,169,771,430 |
| INSURANCE: 7.4% | | | |
AEGON N.V. ADR(b) (Netherlands) | | 33,899,542 | | | 436,287,106 |
Chubb Corp. | | 5,738,750 | | | 491,294,387 |
Genworth Financial, Inc. Class A | | 8,869,300 | | | 268,118,939 |
Loews Corp. | | 7,518,900 | | | 582,714,750 |
MBIA, Inc. | | 1,767,000 | | | 104,800,770 |
Safeco Corp. | | 5,058,600 | | | 274,884,324 |
St. Paul Travelers Companies, Inc. | | 22,806,550 | | | 901,542,921 |
Torchmark Corp. | | 3,125,434 | | | 163,147,655 |
UnumProvident Corp. | | 11,748,800 | | | 215,238,016 |
| | | | |
|
|
| | | | | | 3,438,028,868 |
| REAL ESTATE: 2.5% | | | |
Equity Office Properties Trust(c) | | 23,060,300 | | | 763,295,930 |
Equity Residential Properties Trust | | 11,143,500 | | | 410,303,670 |
| | | | |
|
|
| | | | | | 1,173,599,600 |
| | | | |
|
|
| | | | | | 8,550,016,274 |
| HEALTH CARE: 14.7% | | | |
| HEALTH CARE EQUIPMENT & SERVICES: 7.8% | | | |
Becton, Dickinson & Co. | | 4,222,350 | | | 221,546,704 |
Cardinal Health, Inc. | | 20,507,450 | | | 1,180,818,971 |
HCA, Inc.(c) | | 20,539,000 | | | 1,163,945,130 |
Thermo Electron Corp.(a),(c) | | 8,633,400 | | | 231,979,458 |
WellPoint, Inc.(a) | | 11,611,900 | | | 808,652,716 |
| | | | |
|
|
| | | | | | 3,606,942,979 |
| PHARMACEUTICALS & BIOTECHNOLOGY: 6.9% | | | |
Bristol-Myers Squibb Co. | | 8,105,050 | | | 202,464,149 |
GlaxoSmithKline PLC ADR(b)
(United Kingdom) | | 13,198,900 | | | 640,278,639 |
Pfizer, Inc. | | 27,167,925 | | | 749,291,372 |
sanofi-aventis ADR(b) (France) | | 10,250,000 | | | 420,147,500 |
Schering-Plough Corp. | | 37,202,100 | | | 709,072,026 |
Wyeth | | 10,868,800 | | | 483,661,600 |
| | | | |
|
|
| | | | | | 3,204,915,286 |
| | | | |
|
|
| | | | | | 6,811,858,265 |
| | |
| 5 / Dodge & Cox Stock Fund | | See accompanying Notes to Financial Statements |
Portfolio of Investments (unaudited) | June 30, 2005 |
| | | | | |
| COMMON STOCKS (continued) |
| | |
| | | SHARES | | VALUE |
| INDUSTRIALS: 6.0% | | | |
| CAPITAL GOODS: 1.7% | | | |
American Power Conversion Corp. | | 4,862,281 | | $ | 114,701,209 |
Fluor Corp.(c) | | 4,375,550 | | | 251,987,925 |
Masco Corp. | | 9,510,900 | | | 302,066,184 |
Volvo A.B. ADR(b) (Sweden) | | 3,360,200 | | | 136,279,631 |
| | | | |
|
|
| | | | | | 805,034,949 |
| COMMERCIAL SERVICES & SUPPLIES: 0.6% | | | |
Pitney Bowes, Inc. | | 6,157,150 | | | 268,143,882 |
| | | | |
|
|
| TRANSPORTATION: 3.7% | | | |
FedEx Corp. | | 9,129,900 | | | 739,613,199 |
Union Pacific Corp.(c) | | 14,860,950 | | | 962,989,560 |
| | | | |
|
|
| | | | | | 1,702,602,759 |
| | | | |
|
|
| | | | | | 2,775,781,590 |
| INFORMATION TECHNOLOGY: 12.4% | | | |
| SEMICONDUCTORS & SEMICONDUCTOR EQUIPMENT: 0.3% |
Freescale Semiconductor, Inc.
Class A(a) | | 5,982,700 | | | 125,696,527 |
Freescale Semiconductor, Inc.
Class B(a) | | 1,621,547 | | | 34,344,366 |
| | | | |
|
|
| | | | | | 160,040,893 |
| SOFTWARE & SERVICES: 3.6% | | | |
BMC Software, Inc.(a),(c) | | 15,487,600 | | | 278,002,420 |
Compuware Corp.(a),(c) | | 19,357,100 | | | 139,177,549 |
Computer Sciences Corp.(a),(c) | | 12,893,600 | | | 563,450,320 |
Electronic Data Systems Corp.(c) | | 34,804,400 | | | 669,984,700 |
| | | | |
|
|
| | | | | | 1,650,614,989 |
| TECHNOLOGY, HARDWARE & EQUIPMENT: 8.5% | | | |
Avaya, Inc.(a),(c) | | 30,646,400 | | | 254,978,048 |
Hewlett-Packard Co. | | 66,027,163 | | | 1,552,298,602 |
Hitachi Ltd. ADR(b) (Japan) | | 470,200 | | | 28,503,524 |
Motorola, Inc. | | 37,292,900 | | | 680,968,354 |
NCR Corp.(a) | | 7,423,800 | | | 260,723,856 |
Storage Technology Corp.(a),(c) | | 7,511,200 | | | 272,581,448 |
Xerox Corp.(a),(c) | | 64,316,500 | | | 886,924,535 |
| | | | |
|
|
| | | | | | 3,936,978,367 |
| | | | |
|
|
| | | | | | 5,747,634,249 |
| MATERIALS: 7.2% | | | |
Akzo Nobel N.V. ADR(b),(c) (Netherlands) | | 17,856,759 | | | 701,592,061 |
Alcoa, Inc. | | 3,671,983 | | | 95,948,916 |
Bayer A.G. ADR(b) (Germany) | | 116,900 | | | 3,890,432 |
Dow Chemical Co. | | 17,793,114 | | | 792,327,366 |
Engelhard Corp.(c) | | 8,291,100 | | | 236,710,905 |
International Paper Co. | | 5,989,300 | | | 180,936,753 |
Lubrizol Corp. | | 929,100 | | | 39,031,491 |
NOVA Chemicals Corp.(b),(c) (Canada) | | 4,752,570 | | | 145,238,539 |
| | | | | | |
| | |
| | | SHARES | | VALUE |
Rio Tinto PLC ADR(b) (United Kingdom) | | | 4,630,831 | | $ | 564,590,916 |
Rohm and Haas Co. | | | 6,784,500 | | | 314,393,730 |
Syngenta A.G. ADR(b) (Switzerland) | | | 12,651,800 | | | 257,970,202 |
| | | | | |
|
|
| | | | | | | 3,332,631,311 |
| TELECOMMUNICATION SERVICES: 1.0% | | | |
AT&T Corp.(c) | | | 13,024,550 | | | 247,987,432 |
Vodafone Group PLC ADR(b)
(United Kingdom) | | | 8,673,000 | | | 210,927,360 |
| | | | | |
|
|
| | | | | | | 458,914,792 |
| UTILITIES: 3.0% | | | |
American Electric Power Co., Inc. | | | 7,630,910 | | | 281,351,652 |
Duke Energy Corp. | | | 23,919,300 | | | 711,120,788 |
FirstEnergy Corp. | | | 4,486,500 | | | 215,845,515 |
Scottish Power PLC ADR(b)
(United Kingdom) | | | 4,586,800 | | | 163,290,080 |
| | | | | |
|
|
| | | | | | | 1,371,608,035 |
| | | | | |
|
|
TOTAL COMMON STOCKS (Cost $34,038,805,499) | | | 43,779,714,545 |
| | | | | |
|
|
| |
| SHORT-TERM INVESTMENTS: 5.5% | | |
| | |
| | | PAR VALUE | | VALUE |
SSgA Prime Money Market Fund | | $ | 232,852,792 | | $ | 232,852,792 |
State Street Repurchase Agreement, 2.65%, 7/1/05, maturity value $1,453,731,003 (collateralized by U.S. Treasury Securities, value $1,482,704,155 2.25%-7.00%, 11/15/05-6/30/07) | | | 1,453,624,000 | | | 1,453,624,000 |
U.S. Treasury Bills | | | | | | |
8/4/05 | | | 225,000,000 | | | 224,393,431 |
9/1/05 | | | 125,000,000 | | | 124,373,542 |
9/8/05 | | | 200,000,000 | | | 198,876,833 |
9/15/05 | | | 350,000,000 | | | 347,812,889 |
| | | | | |
|
|
TOTAL SHORT-TERM INVESTMENTS
(Cost $2,581,933,487) | | | 2,581,933,487 |
| | | | | |
|
|
| | | | | | | |
| | | | | | | | |
TOTAL INVESTMENTS
(Cost $36,620,738,986) | | 100.0 | % | | | 46,361,648,032 | |
OTHER ASSETS LESS LIABILITIES | | — | | | | (15,193,257 | ) |
| | |
|
| |
|
|
|
TOTAL NET ASSETS | | 100.0 | % | | $ | 46,346,454,775 | |
| | |
|
| |
|
|
|
| (b) | | Foreign security denominated in U.S. dollars |
| (c) | | See Note 5 regarding holdings of 5% voting securities |
| | |
| See accompanying Notes to Financial Statements | | Dodge & Cox Stock Fund / 6 |
Statement of Assets and Liabilities (unaudited)
| | | | |
|
| June 30, 2005 | |
| Assets: | | | | |
Investments, at value | | | | |
Unaffiliated issuers (cost $28,824,468,001) | | $ | 38,458,838,113 | |
Affiliated issuers (cost $7,796,270,985) | | | 7,902,809,919 | |
| | |
|
|
|
| | | | 46,361,648,032 | |
Receivable for investments sold | | | 53,216,139 | |
Receivable for Fund shares sold | | | 95,201,428 | |
Dividends and interest receivable | | | 66,494,983 | |
Prepaid expenses and other assets | | | 87,085 | |
| | |
|
|
|
| | | | 46,576,647,667 | |
| | |
|
|
|
| Liabilities: | | | | |
Payable for investments purchased | | | 179,317,029 | |
Payable for Fund shares redeemed | | | 28,808,722 | |
Management fees payable | | | 19,104,334 | |
Accounts payable | | | 2,962,807 | |
| | |
|
|
|
| | | | 230,192,892 | |
| | |
|
|
|
| Net Assets | | $ | 46,346,454,775 | |
| | |
|
|
|
| Net Assets Consist of: | | | | |
Paid in capital | | $ | 36,403,025,838 | |
Undistributed net investment income | | | 24,494,959 | |
Undistributed net realized gain on investments | | | 178,024,932 | |
Net unrealized appreciation on investments | | | 9,740,909,046 | |
| | |
|
|
|
| | | $ | 46,346,454,775 | |
| | |
|
|
|
Fund shares outstanding (par value
$0.01 each, unlimited shares authorized) | | | 357,918,177 | |
Net asset value per share | | | $129.49 | |
|
| Statement of Operations (unaudited) | |
|
Six Months Ended
June 30, 2005 | |
| Investment Income: | | | | |
Dividends (net of foreign taxes of $8,748,135) | | | | |
Unaffiliated issuers | | $ | 302,849,945 | |
Affiliated issuers | | | 94,926,706 | |
Interest | | | 33,173,065 | |
| | |
|
|
|
| | | | 430,949,716 | |
| | |
|
|
|
| Expenses: | | | | |
Management fees | | | 110,855,237 | |
Custody and fund accounting fees | | | 338,316 | |
Transfer agent fees | | | 3,878,742 | |
Professional services | | | 56,265 | |
Shareholder reports | | | 763,730 | |
Registration fees | | | 561,339 | |
Trustees’ fees | | | 58,126 | |
Miscellaneous | | | 175,628 | |
| | |
|
|
|
| | | | 116,687,383 | |
| | |
|
|
|
| Net Investment Income | | | 314,262,333 | |
| | |
|
|
|
Realized and Unrealized Gain (Loss) on Investments: | | | | |
Net realized gain (loss) | | | | |
Unaffiliated issuers | | | 216,588,294 | |
Affiliated issuers | | | (38,563,362 | ) |
Net change in unrealized appreciation | | | (154,643,387 | ) |
| | |
|
|
|
Net realized and unrealized gain | | | 23,381,545 | |
| | |
|
|
|
| Net Increase in Net Assets from Operations | | $ | 337,643,878 | |
| | |
|
|
|
Statement of Changes in Net Assets (unaudited)
| | | | | | | | |
| | |
| | | Six Months Ended June 30, 2005 | | | Year Ended
December 31, 2004 | |
| Operations: | | | | | | | | |
Net investment income | | $ | 314,262,333 | | | $ | 474,852,317 | |
Net realized gain | | | 178,024,932 | | | | 1,417,766,177 | |
Net change in unrealized appreciation | | | (154,643,387 | ) | | | 4,726,648,936 | |
| | |
|
|
| |
|
|
|
Net increase in net assets from operations | | | 337,643,878 | | | | 6,619,267,430 | |
| | |
|
|
| |
|
|
|
| | |
Distributions to
Shareholders from: | | | | | | | | |
Net investment income | | | (298,690,274 | ) | | | (469,055,741 | ) |
Net realized gain | | | (259,138,331 | ) | | | (1,173,587,700 | ) |
| | |
|
|
| |
|
|
|
Total distributions | | | (557,828,605 | ) | | | (1,642,643,441 | ) |
| | |
|
|
| |
|
|
|
| | |
| Fund Share Transactions: | | | | | | | | |
Proceeds from sale of shares | | | 5,220,551,916 | | | | 11,863,567,462 | |
Reinvestment of distributions | | | 512,402,310 | | | | 1,513,787,692 | |
Cost of shares redeemed | | | (2,432,658,120 | ) | | | (4,524,858,539 | ) |
| | |
|
|
| |
|
|
|
Net increase from Fund
share transactions | | | 3,300,296,106 | | | | 8,852,496,615 | |
| | |
|
|
| |
|
|
|
Total increase in net assets | | | 3,080,111,379 | | | | 13,829,120,604 | |
| | |
| Net Assets: | | | | | | | | |
Beginning of period | | | 43,266,343,396 | | | | 29,437,222,792 | |
| | |
|
|
| |
|
|
|
End of period (including undistributed net investment income of $24,494,959 and
$8,922,900, respectively) | | $ | 46,346,454,775 | | | $ | 43,266,343,396 | |
| | |
|
|
| |
|
|
|
| | |
| Share Information: | | | | | | | | |
Shares sold | | | 40,552,063 | | | | 99,334,591 | |
Distributions reinvested | | | 4,004,565 | | | | 11,920,322 | |
Shares redeemed | | | (18,884,680 | ) | | | (37,725,900 | ) |
| | |
|
|
| |
|
|
|
Net increase in
shares outstanding | | | 25,671,948 | | | | 73,529,013 | |
| | |
|
|
| |
|
|
|
| | |
| 7 / Dodge & Cox Stock Fund | | See accompanying Notes to Financial Statements |
Notes to Financial Statements (unaudited)
Note 1 — Organization and Significant Accounting Policies
Dodge & Cox Stock Fund (the “Fund”) is one of the series constituting the Dodge & Cox Funds (the “Trust” or the “Funds”). The Trust is organized as a Delaware statutory trust and is registered under the Investment Company Act of 1940, as amended, as a diversified, open-end management investment company. The Fund commenced operations on January 4, 1965, and seeks long-term growth of principal and income. Risk considerations and investment strategies of the Fund are discussed in the Fund’s Prospectus. The Fund is closed to new investors.
The financial statements have been prepared in conformity with accounting principles generally accepted in the United States of America, which require the use of estimates and assumptions by management. Significant accounting policies are as follows:
Security valuation. The Fund’s net assets are valued as of the close of trading on the New York Stock Exchange (the “NYSE”), generally 4:00 p.m. Eastern Time, each day that the NYSE is open for business. Stocks are valued at the official quoted close price or the last sale of the day at the close of the NYSE or, if not available, at the mean between the exchange listed bid and ask prices for the day. A security that is listed or traded on more than one exchange is valued at the quotation on the exchange determined to be the primary market for such security. Security values are not discounted based on the size of the Fund’s position. Securities for which market quotations are not readily available are valued at fair value as determined in good faith by or at the direction of the Board of Trustees. Short-term securities are valued at amortized cost which approximates current value. All securities held by the Fund are denominated in U.S. dollars.
Security transactions, investment income, expenses, and distributions. Security transactions are recorded on the trade date. Realized gains and losses on securities sold are determined on the basis of identified cost.
Dividend income and corporate action transactions are recorded on the ex-dividend date, except for certain dividends or corporate actions from foreign securities where the ex-dividend date may have passed, which are recorded as soon as the Fund is informed of the ex-dividend date. Withholding taxes on foreign dividends have been provided for in accordance with the Fund’s understanding of the applicable country’s tax rules and rates. Non-cash dividends included in dividend income, if any, are recorded at the fair market value of the securities received. Distributions received in excess of income are recorded as a reduction of cost of investments and/or realized gain. The Fund may estimate the character of distributions received from Real Estate Investment Trusts (“REITs”). Interest income is recorded on the accrual basis.
Expenses are recorded on the accrual basis. Most expenses of the Trust can be directly attributed to a specific series. Expenses which cannot be directly attributed are apportioned among the Funds in the Trust.
Distributions to shareholders are recorded on the ex-dividend date.
Repurchase agreements. The Fund may enter into repurchase agreements secured by U.S. government securities which involve the purchase of securities from a counterparty with a simultaneous commitment to resell the securities at an agreed-upon date and price. It is the Fund’s policy that its custodian take possession of the underlying collateral securities, the fair value of which exceeds the principal amount of the repurchase transaction, including accrued interest, at all times. In the event of default by the counterparty, the Fund has the contractual right to liquidate the securities and to apply the proceeds in satisfaction of the obligation.
Note 2 — Related Party Transactions
Management fees. Under a written agreement, the Fund pays an annual management fee of 0.50% of the Fund’s average daily net assets to Dodge & Cox, investment manager of the Fund. The agreement further provides that Dodge & Cox shall waive its fee to the extent that such fee plus all other ordinary operating expenses of the Fund exceed 0.75% of the average daily net assets for the year.
Fund officers and trustees. All officers and three of the trustees of the Trust are officers or employees of Dodge & Cox. The Trust pays a fee only to those trustees who are not affiliated with Dodge & Cox.
Indemnifications. Under the Trust’s organizational documents, its officers and trustees are indemnified against certain liabilities arising out of the performance of their duties to the Trust. In addition, in the normal course of business the Trust enters into contracts that provide general indemnifications to other parties. The Trust’s maximum exposure under these arrangements is unknown as this would involve future claims that may be made against the Trust that have not yet occurred.
Note 3 — Income Tax Information
A provision for federal income taxes is not required since the Fund intends to continue to qualify as a regulated investment company under Subchapter M of the Internal Revenue Code and distribute all of its taxable income to shareholders. Distributions are determined in accordance with income tax regulations, which may differ from net investment income and realized gains for financial reporting purposes. Financial reporting records are adjusted for permanent book/tax differences to reflect tax character. Financial records are not adjusted for temporary differences.
| | |
| | | Dodge & Cox Stock Fund / 8 |
Notes to Financial Statements (unaudited) (continued)
Book/tax differences are primarily due to differing treatment of short-term realized gains. At June 30, 2005, the cost of investments for federal income tax purposes was equal to the cost for financial reporting purposes.
Distributions during the period ended June 30, 2005 were characterized as follows for federal income tax purposes:
| | | |
Ordinary income ($0.996 per share) | | $ | 348,999,029 |
Long-term capital gain ($0.604 per share) | | | 208,829,576 |
| | |
|
|
Total distributions ($1.600 per share) | | $ | 557,828,605 |
| | |
|
|
At June 30, 2005, the tax basis components of net assets were as follows:
| | | | |
Unrealized appreciation | | $ | 10,169,974,745 | |
Unrealized depreciation | | | (429,065,699 | ) |
| | |
|
|
|
Net unrealized appreciation | | | 9,740,909,046 | |
Undistributed ordinary income | | | 53,904,369 | |
Undistributed long-term capital gain | | | 148,615,522 | |
Paid-in capital | | | 36,403,025,838 | |
| | |
|
|
|
Net assets | | $ | 46,346,454,775 | |
| | |
|
|
|
Note 4 — Purchase and Sales of Investments
For the period ended June 30, 2005, purchases and sales of securities, other than short-term securities, aggregated $5,567,704,152 and $2,322,351,504, respectively.
Note 5 — Holdings of 5% Voting Securities
Each of the companies listed below is considered to be an affiliate of the Fund because the Fund owned 5% or more of the company’s voting securities during the period ended June 30, 2005. Transactions during the period in securities of affiliated companies were as follows:
| | | | | | | | | | | | | | | |
| | | Shares at
Beginning
of Period | | Additions | | Reductions | | | Shares at
End of
Period | | Dividend
Income 1 | | Value at
June 30, 2005 |
AT&T Corp. | | 52,008,200 | | — | | (38,983,650 | ) | | 13,024,550 | | $ | 12,245,210 | | | $— 3 |
| | | | | | |
Akzo Nobel N.V. ADR (Netherlands) | | 18,186,723 | | — | | (329,964 | ) | | 17,856,759 | | | 15,758,795 | | | 701,592,061 |
| | | | | | |
Avaya Inc. | | 12,229,400 | | 18,417,000 | | — | | | 30,646,400 | | | — 2 | | | 254,978,048 |
| | | | | | |
BMC Software, Inc. | | 11,787,600 | | 3,700,000 | | — | | | 15,487,600 | | | — 2 | | | 278,002,420 |
| | | | | | |
Computer Science Corp. | | 12,893,600 | | — | | — | | | 12,893,600 | | | — 2 | | | 563,450,320 |
| | | | | | |
Compuware Corp. | | 19,357,100 | | — | | — | | | 19,357,100 | | | — 2 | | | — 3 |
| | | | | | |
Delphi Corp. | | 36,051,632 | | — | | — | | | 36,051,632 | | | 1,622,323 | | | 167,640,089 |
| | | | | | |
Dillard's Inc. Class A | | 5,177,500 | | — | | — | | | 5,177,500 | | | 414,200 | | | 121,257,050 |
| | | | | | |
Electronic Data Systems Corp. | | 33,204,400 | | 1,600,000 | | — | | | 34,804,400 | | | 3,400,440 | | | 669,984,700 |
| | | | | | |
Engelhard Corp. | | 6,266,100 | | 2,025,000 | | — | | | 8,291,100 | | | 1,866,864 | | | 236,710,905 |
| | | | | | |
Equity Office Properties Trust | | 22,260,300 | | 800,000 | | — | | | 23,060,300 | | | 23,060,300 | | | 763,295,930 |
| | | | | | |
Fluor Corp. | | 4,375,550 | | — | | — | | | 4,375,550 | | | 1,400,176 | | | 251,987,925 |
| | | | | | |
Genuine Parts Co. | | 8,953,800 | | — | | — | | | 8,953,800 | | | 5,596,125 | | | 367,911,642 |
| | | | | | |
HCA, Inc. | | 26,418,400 | | 200,000 | | (6,079,400 | ) | | 20,539,000 | | | 7,453,152 | | | — 3 |
| | | | | | |
May Department Stores Co. | | 17,894,400 | | — | | — | | | 17,894,400 | | | 8,768,256 | | | 718,639,104 |
| | | | | | |
NOVA Chemicals Corp. (Canada) | | 4,752,570 | | — | | — | | | 4,752,570 | | | 650,572 | | | 145,238,539 |
| | | | | | |
Storage Technology Corp. | | 7,511,200 | | — | | — | | | 7,511,200 | | | — 2 | | | 272,581,448 |
| | | | | | |
Thermo Electron | | 7,433,400 | | 1,200,000 | | — | | | 8,633,400 | | | — 2 | | | 231,979,458 |
| | | | | | |
Union Pacific Corp. | | 13,860,950 | | 1,000,000 | | — | | | 14,860,950 | | | 8,916,570 | | | 962,989,560 |
| | | | | | |
Whirlpool Corp. | | 4,388,050 | | — | | — | | | 4,388,050 | | | 3,773,723 | | | 307,646,185 |
| | | | | | |
Xerox Corp. | | 45,764,500 | | 18,552,000 | | — | | | 64,316,500 | | | — 2 | | | 886,924,535 |
| | | | | | | | | | | |
|
| |
|
|
| | | | | | | | | | | | $ | 94,926,706 | | $ | 7,902,809,919 |
| | | | | | | | | | | |
|
| |
|
|
| 1 | | Net of foreign taxes, if any |
| 3 | | Company was not an affiliate at the end of the period |
| | |
| 9 / Dodge & Cox Stock Fund | | |
Financial Highlights (unaudited)
| | | | | | | | | | | | | | | | | | | | | | |
SELECTED DATA AND RATIOS
(for a share outstanding throughout each period) | | | | Six Months
Ended June 30, | | | | | Year Ended December 31, | |
| | | | | 2005 | | | | | 2004 | | | 2003 | | | 2002 | | | 2001 | | | 2000 | |
Net asset value, beginning of period | | | | $130.22 | | | | | $113.78 | | | $ 88.05 | | | $100.51 | | | $ 96.67 | | | $100.52 | |
| | | | | | | | |
Income from investment operations: | | | | | | | | | | | | | | | | | | | | | | |
Net investment income | | | | 0.89 | | | | | 1.54 | | | 1.60 | | | 1.53 | | | 1.72 | | | 2.06 | |
Net realized and unrealized gain (loss) | | | | (0.02 | ) | | | | 20.08 | | | 26.59 | | | (12.06 | ) | | 7.05 | | | 13.28 | |
| | | | |
|
|
Total from investment operations | | | | 0.87 | | | | | 21.62 | | | 28.19 | | | (10.53 | ) | | 8.77 | | | 15.34 | |
| | | | |
|
|
Distributions to shareholders from: | | | | | | | | | | | | | | | | | | | | | | |
Net investment income | | | | (0.85 | ) | | | | (1.53 | ) | | (1.62 | ) | | (1.51 | ) | | (1.73 | ) | | (2.09 | ) |
Net realized gain | | | | (0.75 | ) | | | | (3.65 | ) | | (0.84 | ) | | (0.42 | ) | | (3.20 | ) | | (17.10 | ) |
| | | | |
|
|
Total distributions | | | | (1.60 | ) | | | | (5.18 | ) | | (2.46 | ) | | (1.93 | ) | | (4.93 | ) | | (19.19 | ) |
| | | | |
|
|
Net asset value, end of period | | | | $129.49 | | | | | $130.22 | | | $113.78 | | | $ 88.05 | | | $100.51 | | | $ 96.67 | |
| | | | |
|
|
Total return | | | | 0.68 | % | | | | 19.16 | % | | 32.35 | % | | (10.52 | )% | | 9.33 | % | | 16.30 | % |
Ratios/supplemental data: | | | | | | | | | | | | | | | | | | | | | | |
Net assets, end of period (millions) | | | | $46,346 | | | | | $43,266 | | | $29,437 | | | $14,036 | | | $9,396 | | | $5,728 | |
Ratios of expenses to average net assets | | 0.53 | %* | | | | 0.53 | % | | 0.54 | % | | 0.54 | % | | 0.54 | % | | 0.54 | % |
Ratios of net investment income to average net assets | | 1.42 | %* | | | | 1.32 | % | | 1.72 | % | | 1.74 | % | | 1.80 | % | | 2.13 | % |
Portfolio turnover rate | | | | 6 | % | | | | 11 | % | | 8 | % | | 13 | % | | 10 | % | | 32 | % |
Fund’s Holdings
The Funds provide a complete list of their holdings four times in each fiscal year, as of the end of each quarter. The lists appear in the Funds’ First Quarter, Semi-Annual, Third Quarter and Annual Reports to shareholders. The Funds file the lists with the Securities and Exchange Commission (SEC) on Form N-CSR (second and fourth quarters) and Form N-Q (first and third quarters). Shareholders may view the Funds’ Forms N-CSR and N-Q on the SEC’s website at www.sec.gov. Forms N-CSR and N-Q may also be reviewed and copied at the SEC’s Public Reference Room in Washington, DC. Information regarding the operations of the Public Reference Room may be obtained by calling 1-202-942-8090 (direct) or 1-800/SEC-0330 (general SEC number). A complete list of the Funds’ quarter-end holdings are also available at www.dodgeandcox.com on or about 15 days following each quarter-end and remains available on the web site until the list is updated for the subsequent quarter.
Proxy Voting
For a free copy of the Fund’s proxy voting policies and procedures, please call (800) 621-3979, visit www.dodgeandcox.com, or visit the Securities and Exchange Commission’s web site at www.sec.gov. Beginning August 31, 2005, information regarding how Dodge & Cox, on behalf of the Fund, voted proxies relating to the Fund’s portfolio securities for the most recent twelve-month period ending June 30 will be available at www.dodgeandcox.com or the SEC’s web site at www.sec.gov.
| | |
| | | Dodge & Cox Stock Fund / 10 |
Officers and Trustees
Harry R. Hagey, Chairman & Trustee
Chairman & Chief Executive Officer, Dodge & Cox
John A. Gunn, President & Trustee
President, Dodge & Cox
Dana M. Emery, Vice President & Trustee
Senior Vice President, Dodge & Cox
William F. Ausfahl, Trustee
Former Chief Financial Officer and member of Board of Directors, The Clorox Company
L. Dale Crandall, Trustee
Former President, Kaiser Foundation Health Plan and Hospitals
Thomas A. Larsen, Trustee
Director, Howard, Rice, Nemerovski, Canady, Falk & Rabkin
Will C. Wood, Trustee
Principal, Kentwood Associates, Financial Advisers
A. Horton Shapiro, Executive Vice President
Senior Vice President, Dodge & Cox
Katherine Herrick Drake, Vice President
Vice President, Dodge & Cox
Kenneth E. Olivier, Vice President
Executive Vice President, Dodge & Cox
Diana S. Strandberg, Vice President
Vice President, Dodge & Cox
John M. Loll, Treasurer & Asst. Secretary
Vice President & Treasurer, Dodge & Cox
Thomas M. Mistele, Secretary & Asst. Treasurer
Chief Operating Officer, Secretary & General Counsel, Dodge & Cox
Marcia P. Venegas, Chief Compliance Officer
Chief Compliance Officer, Dodge & Cox

International
Stock Fund
Established 2001

Semi-Annual Report
June 30, 2005
2005
International Stock Fund
www.dodgeandcox.com
For Fund literature, transactions and account
information, please visit the Funds’ web site.
or write or call:
Dodge & Cox Funds
c/o Boston Financial Data Services
P.O. Box 8422
Boston, Massachusetts 02266-8422
(800) 621-3979
Investment Manager
Dodge & Cox
555 California Street, 40th Floor
San Francisco, California 94104
(415) 981-1710
This report is submitted for the general information of the shareholders of the Fund. The report is not authorized for distribution to prospective investors in the Fund unless it is accompanied by a current prospectus.
This report reflects our views, opinions and portfolio holdings as of June 30, 2005, the end of the reporting period. Any such views are subject to change at any time based upon market or other conditions and Dodge & Cox disclaims any responsibility to update such views. These views may not be relied on as investment advice and, because investment decisions for a Dodge & Cox Fund are based on numerous factors, may not be relied on as an indication of trading intent on behalf of any Dodge & Cox Fund.

06/05 ISF SAR  Printed on recycled paper
To Our Shareholders
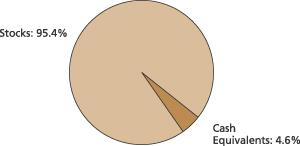
The Dodge & Cox International Stock Fund had a total return of 1.7% for the six months ended June 30, 2005, compared to a total return of -1.2% for the Morgan Stanley Capital International Europe, Australasia, Far East Index (MSCI EAFE) benchmark. Longer-term results for the Fund can be found on the following page. On June 30, the Fund had net assets of $8.2 billion and a cash position of 4.6%.
Performance Review
The stronger U.S. dollar was a detriment to the performance of both the Fund and the market for the first six months of 2005. The EAFE was up 8.1% in local currency terms, but the stronger dollar more than offset this, resulting in a return of -1.2%. There was a similar currency headwind in the Fund as well. During the first half of 2005 the Fund benefited from its investments in Energy stocks which were up an average of 19%, compared to a 12% return for the Energy sector of the MSCI EAFE. Strong individual performers included Petrobras (up 32%) and Norsk Hydro (up 19%). The Fund’s investments in Latin America also contributed strongly to results as investments were up an average of 20%, including Corporacion Geo (up 25%.) Latin American stocks represented 8.4% of the Fund, but are not included in the MSCI EAFE. Additional strong performers included Rinker (up 29%), LG.Philips LCD (up 27%) and Fresenius Medical (up 22%).
Conversely, the biggest area of disappointment during this period was in the Financials sector as the Fund’s investments returned -5% (e.g., Shinsei Bank down 21%) compared to -3% on average for the MSCI EAFE’s Financial stocks. Additional detractors from performance included Nova Chemicals (down 35%) and Seiko Epson (down 25%).
A Home for Fallen Angels
Four years ago, companies in the Technology, Media and Telecom (TMT) sectors were trading at extremely rich valuations based on the expectation that their strong growth would continue indefinitely. Due to our concerns about these high expectations, on June 30, 2001 (the Fund’s first quarter-end) only 13% of the Fund was invested in the TMT sectors compared to 22% for the MSCI EAFE.
With the collapse of the TMT “bubble” and intensified concerns about the lack of European and Japanese economic growth, valuations have generally become more reasonable. Some of the very same attributes that were viewed as desirable competitive advantages several years ago are today greeted with skepticism as investors have recognized that high growth and profitability are difficult to sustain. Given the dramatic shift in valuations, we have selectively been finding more opportunities in these sectors on a bottom-up basis. The Fund’s weighting in TMT stocks has gradually increased since 2001 to 24%, compared to 17% for the MSCI EAFE.
One example of a former darling that we recently added to the Fund is Nokia, a leader in cellular phones and wireless networks. During the height of the internet bubble, Nokia was valued above 100 times earnings. After the collapse of the TMT bubble and several operational missteps, Nokia lost over 80% of its market value.
Clearly, the competitive environment has intensified for Nokia and there are legitimate concerns behind Nokia’s lower valuation. However, we believe that the current valuation of 19 times earnings does not accurately reflect the company’s global leadership position, strong balance sheet, healthy cash flow generation, nor a management that has learned from its mistakes and is intent on fixing them. Of course, we discuss Nokia to illustrate our investment approach, not because we think it is more attractive than the Fund’s other holdings.
Morningstar® Address
In June, I, Harry Hagey, in my capacity as Chairman and CEO of Dodge & Cox, was invited to speak at Morningstar’s Investment Conference. I thought it would be helpful to share an excerpt of that speech with all of our shareholders:
So, how did the small, local firm founded in the 1930s, which I joined in the late 1960s, become the firm we are today? What I would like to do now is to summarize for you what I think are the key components that make Dodge & Cox a successful money management firm.
First and Most Important—Our Current Clients
We are in the business of providing continuous high-quality investment management service to our existing clients. We decided a long time ago that we are not in business to provide a series of financial products to the investment market place. Another way to look at this is that we are in the investment business and not in the money gathering business. We do not advertise, we do not have a marketing department and no one at our firm is paid commissions or compensated directly for bringing in new business. We concluded that if we did a good job, the word would get around. We have relatively low expense ratios with no 12b-1 or other fees. In general, our firm’s investment objective is to first preserve and then enhance the future purchasing power of our clients’ wealth over the long-term1. Please note that I did not say to beat a particular benchmark or to have low tracking error. If we believe that a significant part of the market is unattractive, we will not be in it. Finally, ethical considerations are paramount—we work hard to maintain our reputation.
Second—Our Employees
With regard to our own people, we insist on respect for each individual employee as well as for the entire firm. We work within a collegial and team-work environment with the goal of having everyone at the firm think as owners, not just as employees. Dodge & Cox has a long history, but it is still a small firm and its vitality is maintained by diplomatic entrepreneurship.
We also want all of our employees to share in the firm’s success. Our compensation structure provides salary and bonus for each member of our firm. The bonus is based on how well the firm has done and an employee’s contribution over time. We avoid any quantitative measurement of our research analysts’ performance because we make decisions as a group—we don’t believe in a “star system” or the reliance on any one individual. We try to create an
| | |
| 1 / Dodge & Cox International Stock Fund | | |
environment where our analysts will not overly worry about making bad recommendations, and will be rewarded for sharing information with their peers.
Importantly, our independence, culture and compensation structure have led to low employee turnover which, in our opinion, is crucial to maintaining a consistent investment approach in difficult investment environments.
Third—Dodge & Cox
With regard to the firm, probably the most important characteristic is our independence. We require that shareholders of the firm be active employees. The firm is held widely with about one-third of employees being shareholders. We also believe it is important to have control of the investment service to our clients so we have no joint ventures. The only planning that we do is to make sure that we have assets in place, most important being people, so that we can continue to do a good job for our existing clients.
For Dodge & Cox, issues of ethics, independence, a focused teamwork investment approach, respect for the individual, and an absence of a marketing mindset are all key determinants in what makes us who we are.
One of my individual clients recently sent me a book by James P. Owen, called Cowboy Ethics—What Wall Street Can Learn from the Code of the West. The pictures in the book are fantastic and I also believe that the book has real wisdom. In the book Mr. Owen summarized the Code with ten rules. The ones that resonated with me most are: 1) Take Pride in Your Work, 2) Ride for the Brand, 3) Remember That Some Things Aren’t for Sale, and 4) Know Where to Draw the Line.
I think Dodge & Cox as a firm has lived by this Code.
In Closing
We continue to caution shareholders that the Fund’s future returns are likely to be more in line with those of the broader market. Returns over the past two years have been high and uncharacteristic of historical long-term international equity returns. Moreover, the value of the U.S. dollar can be highly volatile and difficult to forecast in the short term, adding an additional layer of uncertainty to returns.
Thank you for your confidence in our firm as a shareholder of the Dodge & Cox International Stock Fund. As always, we welcome your comments and questions.
Sincerely,
| | |
 | |  |
Harry R. Hagey
Chairman August 3, 2005 | | Diana S. Strandberg Vice President |
Total return for periods ended June 30, 2005
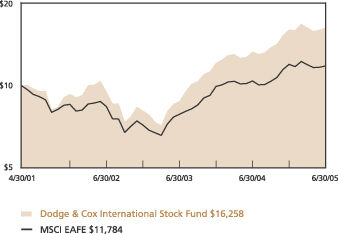
Average Annual Total return for periods ending June 30, 2005
| | | | | | | | | |
| | | 1 Year | | | 3 Years | | | Since
Inception
(5/1/01) | |
| Dodge & Cox International Stock Fund* | | 22.45 | % | | 19.60 | % | | 12.37 | % |
| MSCI EAFE | | 13.65 | | | 12.06 | | | 4.02 | |
Past performance does not guarantee future results. Investment return and share price will fluctuate with market conditions, and investors may have a gain or loss when shares are sold. Mutual fund performance changes over time and currently may be significantly lower than stated above. Performance is updated and published monthly. Visit the Fund’s web site at www.dodgeandcox.com or call 800-621-3979 for current performance figures.
| * | | Expense reimbursements were paid by Dodge & Cox from the Fund’s inception through June 30, 2003 to maintain operating expenses at 0.90%. Accordingly, without the expense reimbursements, the Fund’s returns prior to June 30, 2003 would have been lower. |
The Fund’s total returns include the reinvestment of dividend and capital gain distributions, but have not been adjusted for any income taxes payable on these distributions. The Morgan Stanley Capital International Europe, Australasia, Far East Index (MSCI EAFE) is a widely recognized benchmark of the world’s stock markets, excluding the United States. Index returns include dividends and, unlike Fund returns, do not reflect fees or expenses.
Morgan Stanley®, Morgan Stanley Capital International, and EAFE® are trademarks of Morgan Stanley.
| 1 | | Please refer to the Fund’s prospectus for its investment objectives, policies and restrictions. |
Risks of International Investing: Foreign investing, especially in developing countries,
has special risks such as currency and market volatility and political and social instability.
These and other risk considerations are
discussed in the Fund’s prospectus.
| | |
| | | Dodge & Cox International Stock Fund / 2 |
Fund Expenses
As a Fund shareholder, you incur ongoing costs, which include costs for portfolio management, administrative services, and shareholder reports (like this one). Operating expenses, which are deducted from a Fund’s gross income, directly reduce the investment return of the Fund. The following example is intended to help you understand the ongoing costs (in dollars) of investing in the Fund and to compare these costs with those of other mutual funds. The example is based on an investment of $1,000 made at the beginning of the most recent six-month period and held for the entire period.
The table below illustrates the Fund’s costs in two ways:
Actual Fund Expenses
The first line of the table below provides information about actual account values and actual expenses. You may use the information in this line, together with your account balance, to estimate the expenses that you paid on your account over the period. Simply divide your account value by $1,000 (for example, an $8,600 account value divided by $1,000 = 8.6), then multiply the result by the number under the heading “Expenses Paid During Period”.
Hypothetical Example for Comparison
Information on the second line of the table can help you compare ongoing costs of investing in the Fund with those of other mutual funds. This information may not be used to estimate the actual ending account balance or expenses you paid during the period. The hypothetical “Ending Account Value” is based on the actual expense ratio of the Fund and an assumed 5% annual rate of return before expenses (not the Fund’s actual return). The amount under the heading “Expense Paid During the Period” shows the hypothetical expense your account would have incurred under this scenario. You can compare this figure with the 5% hypothetical examples that appear in shareholder reports of other funds.
| | | | | | |
Six Months Ended
June 30, 2005 | | Beginning Account
Value 1/1/05 | | Ending Account
Value 6/30/05 | | Expenses Paid
During Period* |
| Based on Actual Fund Return | | $1,000.00 | | $1,017.30 | | $3.60 |
| Based on Hypothetical 5% Yearly Return | | 1,000.00 | | 1,021.43 | | 3.61 |
| * | | Expenses are equal to the Fund’s annualized expense ratio of 0.72%, multiplied by the average account value over the period, multiplied by 181/365 (to reflect the one-half year period). |
The expenses shown in the table highlight ongoing costs only and do not reflect any transactional costs or account maintenance fees. While other mutual funds may charge such fees, please note that the Fund does not charge transaction fees (e.g., redemption fees, sales loads) or universal account maintenance fees (e.g., small account fees).
| | |
| 3 / Dodge & Cox International Stock Fund | | |
Fund Information | June 30, 2005 |
General Information
| | |
Net Asset Value Per Share | | $31.17 |
Total Net Assets (millions) | | $8,231 |
2004 Expense Ratio | | 0.77% |
2004 Turnover Ratio | | 6% |
30-Day SEC Yield1 | | 1.38% |
Fund Inception Date | | May 1, 2001 |
Investment Manager: Dodge & Cox, San Francisco. Managed by the International Investment Policy Committee, whose seven members’ average tenure at Dodge & Cox is 16 years.
Asset Allocation
| | | | |
| Portfolio Characteristics | | Fund | | MSCI
EAFE |
Number of Stocks | | 73 | | 1,147 |
Median Market Capitalization (billions) | | $12 | | $3 |
Weighted-Avg Market Capitalization (billions) | | $39 | | $44 |
Price-to-Earnings Ratio2 | | 14x | | 16x |
Price-to-Book Value Ratio | | 1.7x | | 2.1x |
Countries Represented | | 21 | | 21 |
Emerging Markets (South Africa, Mexico, Brazil, South Korea, Israel) | | 15.1% | | 0.0% |
| | |
| Ten Largest Holdings4 | | % of Fund |
Matsushita Electric Industrial (Japan) | | 3.0 |
Royal Dutch Petroleum (Netherlands) | | 2.9 |
News Corp. Class A (United States)3 | | 2.8 |
GlaxoSmithKline PLC ADR (United Kingdom) | | 2.8 |
Sony ADR (Japan) | | 2.7 |
Seiko Epson (Japan) | | 2.5 |
Norsk Hydro A.S.A. ADR (Norway) | | 2.4 |
Mitsubishi Tokyo Financial Group ADR (Japan) | | 2.4 |
KT Corp. ADR (South Korea) | | 2.4 |
sanofi-aventis (France) | | 2.3 |
| | | | | | |
| Region Diversification | | Fund | | | MSCI
EAFE | |
Europe (excluding United Kingdom) | | 38.8 | % | | 44.9 | % |
Japan | | 23.1 | | | 21.8 | |
United Kingdom | | 11.0 | | | 25.0 | |
Latin America | | 8.4 | | | 0.0 | |
Pacific (excluding Japan) | | 8.4 | | | 8.3 | |
United States3 | | 2.8 | | | 0.0 | |
Africa | | 1.3 | | | 0.0 | |
Middle East | | 1.0 | | | 0.0 | |
Canada | | 0.6 | | | 0.0 | |
| | | | | | |
| Sector Diversification | | Fund | | | MSCI
EAFE | |
Consumer Discretionary | | 18.9 | % | | 12.1 | % |
Financials | | 18.8 | | | 27.3 | |
Materials | | 12.3 | | | 7.2 | |
Energy | | 10.6 | | | 9.0 | |
Information Technology | | 8.9 | | | 6.0 | |
Health Care | | 7.9 | | | 8.2 | |
Consumer Staples | | 6.3 | | | 8.1 | |
Telecommunication Services | | 4.6 | | | 6.7 | |
Industrials | | 4.3 | | | 10.0 | |
Utilities | | 2.8 | | | 5.4 | |
| 1 | | SEC Yield is an annualization of the Fund’s total net investment income per share for the 30-day period ended on the last day of the month. |
| 2 | | The Fund’s price-to-earnings (P/E) ratio is calculated using fiscal year-end earnings and excludes extraordinary items. |
| 3 | | In the fourth quarter of 2004 News Corp. reincorporated as a Delaware corporation (formerly New South Wales, Australia) headquartered in New York, NY (formerly Sydney, Australia). |
| 4 | | The Fund’s portfolio holdings are subject to change without notice. The mention of specific securities is not a recommendation or solicitation for any person to buy, sell or hold any particular security |
Dodge & Cox International Stock Fund / 4
Portfolio of Investments (unaudited) | June 30, 2005 |
| | | | | |
| COMMON STOCKS: 89.4% |
| | |
| | | SHARES | | VALUE |
| CONSUMER DISCRETIONARY: 18.9% |
| AUTOMOBILES & COMPONENTS: 2.8% |
Fiat SPA ADR(a),(b) (Italy) | | 4,960,700 | | $ | 35,717,040 |
Honda Motor Co., Ltd. ADR(b) (Japan) | | 6,801,700 | | | 167,389,837 |
Suzuki Motor Corp. (Japan) | | 1,893,000 | | | 29,774,841 |
| | | | |
|
|
| | | | | | 232,881,718 |
| CONSUMER DURABLES & APPAREL: 12.6% |
Consorcio Ara S.A. de C.V. (a),(c) (Mexico) | | 20,068,100 | | | 69,419,130 |
Corporacion Geo S.A. de C.V. Series B(a),(c)
(Mexico) | | 42,105,400 | | | 106,457,674 |
Electrolux A.B. Series B (Sweden) | | 6,783,100 | | | 144,578,083 |
Makita Corp. (Japan) | | 1,383,000 | | | 27,206,966 |
Matsushita Electric Industrial Co., Ltd. (Japan) | | 15,991,000 | | | 242,862,907 |
Sony Corp. ADR(b) (Japan) | | 6,376,500 | | | 219,606,660 |
Thomson S.A. (France) | | 5,851,000 | | | 140,160,837 |
Yamaha Corp. (Japan) | | 5,232,100 | | | 81,681,478 |
| | | | |
|
|
| | | | | | 1,031,973,735 |
| CONSUMER SERVICES: 0.7% |
Elior (France) | | 5,000,321 | | | 59,709,912 |
| | | | |
|
|
| MEDIA: 2.8% |
News Corp., Class A (United States) | | 14,142,492 | | | 228,825,521 |
| | | | |
|
|
| | | | | | 1,553,390,886 |
| CONSUMER STAPLES: 6.3% |
| FOOD, BEVERAGE & TOBACCO: 5.5% |
Fomento Economico Mexicano, S.A. de C.V. ADR(b) (Mexico) | | 2,714,058 | | | 161,676,435 |
Kikkoman Corp. (Japan) | | 2,891,000 | | | 25,592,844 |
Nestle S.A. (Switzerland) | | 546,000 | | | 139,737,827 |
Tiger Brands (South Africa) | | 307,407 | | | 5,267,854 |
Unilever N.V.(b) (Netherlands) | | 1,943,900 | | | 126,023,037 |
| | | | |
|
|
| | | | | | 458,297,997 |
| HOUSEHOLD & PERSONAL PRODUCTS: 0.8% |
Aderans Co.(c) (Japan) | | 2,733,200 | | | 64,744,394 |
| | | | |
|
|
| | | | | | 523,042,391 |
| ENERGY: 8.6% |
Norsk Hydro A.S.A. ADR(b) (Norway) | | 2,186,500 | | | 198,359,280 |
Royal Dutch Petroleum Co.(b) (Netherlands) | | 3,615,000 | | | 234,613,500 |
Schlumberger Ltd.(b) (Netherlands Antilles) | | 1,900,000 | | | 144,286,000 |
Total S.A. (France) | | 538,500 | | | 126,587,232 |
| | | | |
|
|
| | | | | | 703,846,012 |
| FINANCIALS: 17.4% |
| BANKS: 13.5% |
Banco Santander Central Hispano, S.A. (Spain) | | 14,320,000 | | | 166,147,198 |
DBS Group Holdings Ltd. (Singapore) | | 20,142,000 | | | 170,907,613 |
Kookmin Bank ADR(a),(b) (South Korea) | | 1,947,900 | | | 88,785,282 |
Mitsubishi Tokyo Financial Group, Inc. ADR(b) (Japan) | | 23,249,200 | | | 197,153,216 |
Royal Bank of Scotland Group PLC
(United Kingdom) | | 5,920,972 | | | 178,756,407 |
| | | | | |
| | |
| | | SHARES | | VALUE |
Shinsei Bank, Ltd. (Japan) | | 31,215,000 | | $ | 168,448,044 |
Standard Bank Group Limited
(South Africa) | | 10,096,234 | | | 98,116,727 |
Standard Chartered PLC (United Kingdom) | | 2,555,000 | | | 46,666,165 |
| | | | |
|
|
| | | | | | 1,114,980,652 |
| DIVERSIFIED FINANCIALS: 2.0% |
Credit Suisse Group (Switzerland) | | 4,075,000 | | | 160,729,752 |
| | | | |
|
|
| INSURANCE: 1.9% |
AEGON N.V. (Netherlands) | | 7,666,666 | | | 99,340,744 |
Converium Holdings A.G.(c) (Switzerland) | | 7,389,852 | | | 59,967,588 |
| | | | |
|
|
| | | | | | 159,308,332 |
| | | | |
|
|
| | | | | | 1,435,018,736 |
| HEALTH CARE: 6.3% |
| HEALTH CARE EQUIPMENT & SERVICES: 1.2% |
MEDICEO Holdings Co., Ltd. (Japan) | | 7,596,000 | | | 101,380,535 |
| | | | |
|
|
| PHARMACEUTICALS & BIOTECHNOLOGY: 5.1% |
GlaxoSmithKline PLC ADR(b) (United Kingdom) | | 4,705,000 | | | 228,239,550 |
sanofi-aventis (France) | | 2,309,000 | | | 189,681,556 |
| | | | |
|
|
| | | | | | 417,921,106 |
| | | | |
|
|
| | | | | | 519,301,641 |
| INDUSTRIALS: 4.3% |
| CAPITAL GOODS: 2.9% |
CNH Global N.V.(b) (Netherlands) | | 1,108,520 | | | 20,939,943 |
Nexans S.A.(c) (France) | | 1,616,440 | | | 65,514,253 |
Sulzer A.G. (Switzerland) | | 170,500 | | | 70,376,482 |
Volvo A.B. (Sweden) | | 1,986,600 | | | 80,871,883 |
| | | | |
|
|
| | | | | | 237,702,561 |
| TRANSPORTATION: 1.4% |
Central Japan Railway Co. (Japan) | | 15,550 | | | 120,257,636 |
| | | | |
|
|
| | | | | | 357,960,197 |
| INFORMATION TECHNOLOGY: 8.9% |
| TECHNOLOGY, HARDWARE & EQUIPMENT: 8.9% |
Brother Industries, Ltd.(c) (Japan) | | 16,113,000 | | | 147,876,379 |
Canon, Inc. (Japan) | | 1,114,700 | | | 58,745,188 |
EPCOS A.G.(a) (Germany) | | 2,770,000 | | | 34,719,297 |
Hitachi Ltd. (Japan) | | 6,230,000 | | | 37,892,163 |
LG.Philips LCD Co., Ltd. ADR(a),(b) (South Korea) | | 3,400,000 | | | 77,724,000 |
Nokia Oyj (Finland) | | 4,200,000 | | | 70,376,953 |
Oce N.V.(c) (Netherlands) | | 6,622,000 | | | 97,581,583 |
Seiko Epson Corp. (Japan) | | 6,270,000 | | | 209,348,915 |
| | | | |
|
|
| | | | | | 734,264,478 |
| MATERIALS: 12.3% |
Akzo Nobel N.V. (Netherlands) | | 1,591,100 | | | 62,716,231 |
BASF A.G. (Germany) | | 1,975,400 | | | 131,446,532 |
Bayer A.G. (Germany) | | 2,772,000 | | | 92,528,670 |
BHP Billiton Ltd. (Australia) | | 6,785,078 | | | 93,624,138 |
| | |
| 5 / Dodge & Cox International Stock Fund | | See accompanying Notes to Financial Statements |
Portfolio of Investments (unaudited) | June 30, 2005 |
| | | | | |
| COMMON STOCKS (continued) |
| | |
| | | SHARES | | VALUE |
Givaudan S.A. (Switzerland) | | 43,100 | | $ | 25,071,044 |
Imperial Chemical Industries PLC (United Kingdom) | | 13,978,000 | | | 63,575,501 |
Kemira GrowHow Oyj(a) (Finland) | | 1,757,393 | | | 14,351,724 |
Kemira Oyj (Finland) | | 2,672,990 | | | 34,408,866 |
Lafarge S.A. (France) | | 1,192,825 | | | 108,740,515 |
LANXESS A.G.(a) (Germany) | | 2,844,700 | | | 63,739,529 |
Makhteshim-Agan Industries, Ltd. (Israel) | | 14,800,000 | | | 80,963,897 |
NOVA Chemicals Corp. (Canada) | | 1,587,900 | | | 48,396,594 |
Rinker Group Ltd. (Australia) | | 6,550,000 | | | 69,714,914 |
Rio Tinto PLC (United Kingdom) | | 1,884,400 | | | 57,633,103 |
Yara International A.S.A.(a) (Norway) | | 4,118,710 | | | 65,523,357 |
| | | | |
|
|
| | | | | | 1,012,434,615 |
| TELECOMMUNICATION SERVICES: 4.6% |
KT Corp. ADR(b) (South Korea) | | 9,088,400 | | | 195,400,600 |
Vodafone Group PLC ADR(b) (United Kingdom) | | 7,455,000 | | | 181,305,600 |
| | | | |
|
|
| | | | | | 376,706,200 |
| UTILITIES: 1.8% |
National Grid Transco PLC (United Kingdom) | | 8,300,000 | | | 80,405,618 |
Scottish Power PLC ADR(b) (United Kingdom) | | 1,840,600 | | | 65,525,360 |
| | | | |
|
|
| | | | | | 145,930,978 |
| | | | |
|
|
TOTAL COMMON STOCKS (cost $6,918,759,795) | | | 7,361,896,134 |
| | | | |
|
|
|
| PREFERRED STOCKS: 6.0% |
| ENERGY: 2.0% |
Petroleo Brasileiro S.A. ADR(b) (Brazil) | | 3,645,700 | | | 167,848,028 |
|
| FINANCIALS: 1.4% |
| BANKS: 1.4% |
Uniao de Bancos Brasileiros Sponsored GDR(b) (Brazil) | | 2,916,500 | | | 112,635,230 |
|
| HEALTH CARE: 1.6% |
| HEALTH CARE EQUIPMENT & SERVICES: 1.6% |
Fresenius Medical Care A.G. (Germany) | | 1,892,275 | | | 131,867,609 |
|
| UTILITIES: 1.0% |
Ultrapar Participacoes S.A. ADR(b) (Brazil) | | 4,665,085 | | | 81,872,242 |
| | | | |
|
|
TOTAL PREFERRED STOCKS (cost $337,541,841) | | | 494,223,109 |
| | | | |
|
|
| | | | | | | | |
| SHORT-TERM INVESTMENTS: 4.6% | |
| | |
| | | PAR VALUE | | | VALUE | |
SSgA Prime Money Market Fund | | $ | 40,982,790 | | | $ | 40,982,789 | |
State Street Repurchase Agreement, 2.65%, 7/1/05, maturity value $334,661,633 (collateralized by U.S. Treasury Securities, value $341,331,109 3.625%-4.75%, 6/30/07-5/15/13) | | | 334,637,000 | | | | 334,637,000 | |
| | | | | | |
|
|
|
TOTAL SHORT-TERM INVESTMENTS
(cost $375,619,789) | | | | 375,619,789 | |
| | | | | | |
|
|
|
TOTAL INVESTMENTS (Cost $7,631,921,425) | | | 100.0 | % | | | 8,231,739,032 | |
OTHER ASSETS LESS LIABILITIES | | | — | | | | (454,942 | ) |
| | |
|
|
| |
|
|
|
TOTAL NET ASSETS | | | 100.0 | % | | $ | 8,231,284,090 | |
| | |
|
|
| |
|
|
|
| (b) | | Foreign security denominated in U.S. dollars |
| (c) | | See Note 5 regarding holdings of 5% voting securities |
| | |
| See accompanying Notes to Financial Statements | | Dodge & Cox International Stock Fund / 6 |
| | | | |
Statement of Assets and Liabilities (unaudited)
| |
|
| June 30, 2005 | |
| Assets: | | | | |
Investments, at value | | | | |
Unaffiliated issuers (cost $7,071,550,394) | | $ | 7,620,178,031 | |
Affiliated issuers (cost $560,371,031) | | | 611,561,001 | |
| | |
|
|
|
| | | | 8,231,739,032 | |
Cash denominated in foreign currency (cost $25,873,501) | | | 25,873,501 | |
Receivable for investment sold | | | 3,958,429 | |
Receivable for Fund shares sold | | | 39,326,472 | |
Dividends and interest receivable | | | 18,755,063 | |
Prepaid expenses and other assets | | | 3,588 | |
| | |
|
|
|
| | | | 8,319,656,085 | |
| | |
|
|
|
| Liabilities: | | | | |
Payable for investments purchased | | | 78,511,586 | |
Payable for Fund shares redeemed | | | 4,185,527 | |
Management fees payable | | | 3,905,881 | |
Accounts payable | | | 1,769,001 | |
| | |
|
|
|
| | | | 88,371,995 | |
| | |
|
|
|
| Net Assets | | $ | 8,231,284,090 | |
| | |
|
|
|
| Net Assets Consist of: | | | | |
Paid in capital | | $ | 7,459,131,772 | |
Undistributed net investment income | | | 86,159,797 | |
Undistributed net realized gain on investments | | | 86,147,627 | |
Net unrealized appreciation on investments | | | 599,844,894 | |
| | |
|
|
|
| | | $ | 8,231,284,090 | |
| | |
|
|
|
Fund shares outstanding (par value $0.01 each, unlimited shares authorized) | | | 264,088,938 | |
Net asset value per share | | | $31.17 | |
|
Statement of Operations (unaudited)
| |
Six Months Ended June 30, 2005 | |
| Investment Income: | | | | |
Dividends (net of foreign taxes of $11,492,672) | | | | |
Unaffiliated issuers | | $ | 96,917,558 | |
Affiliated issuers | | | 5,066,921 | |
Interest | | | 4,765,862 | |
| | |
|
|
|
| | | | 106,750,341 | |
| | |
|
|
|
| Expenses: | | | | |
Management fees | | | 18,917,753 | |
Custody and fund accounting fees | | | 1,020,597 | |
Transfer agent fees | | | 1,407,137 | |
Professional services | | | 62,150 | |
Shareholder reports | | | 336,177 | |
Registration fees | | | 924,767 | |
Trustees’ fees | | | 58,126 | |
Miscellaneous | | | 9,633 | |
| | |
|
|
|
| | | | 22,736,340 | |
| | |
|
|
|
| Net Investment Income | | | 84,014,001 | |
| | |
|
|
|
| Realized and Unrealized Gain (Loss) on Investments and Foreign Currency: | | | | |
Net realized gain (loss) | | | | |
Investments in unaffiliated issuers | | | 86,386,861 | |
Investments in affiliated issuers | | | — | |
Foreign currency transactions | | | (2,888,555 | ) |
Net change in unrealized appreciation | | | (79,915,183 | ) |
| | |
|
|
|
Net realized and unrealized gain | | | 3,583,123 | |
| | |
|
|
|
| Net Increase in Net Assets from Operations | | $ | 87,597,124 | |
| | |
|
|
|
| | | | | | | | |
Statement of Changes in Net Assets (unaudited)
| |
| | |
| | | Six Months Ended
June 30, 2005 | | | Year Ended
December 31, 2004 | |
| Operations: | | | | | | | | |
Net investment income | | $ | 84,014,001 | | | $ | 34,239,272 | |
Net realized gain | | | 83,498,306 | | | | 37,799,449 | |
Net change in unrealized appreciation | | | (79,915,183 | ) | | | 579,342,103 | |
| | |
|
|
| |
|
|
|
Net increase in net assets from operations | | | 87,597,124 | | | | 651,380,824 | |
| | |
|
|
| |
|
|
|
| Distributions to | | | | | | | | |
| Shareholders from: | | | | | | | | |
Net investment income | | | — | | | | (32,093,476 | ) |
Net realized gain | | | — | | | | (27,805,906 | ) |
| | |
|
|
| |
|
|
|
Total distributions | | | — | | | | (59,899,382 | ) |
| | |
|
|
| |
|
|
|
| | |
| Fund Share Transactions: | | | | | | | | |
Proceeds from sale of shares | | | 4,382,086,289 | | | | 3,130,085,912 | |
Reinvestment of distributions | | | — | | | | 55,967,564 | |
Cost of shares redeemed | | | (441,329,029 | ) | | | (229,499,144 | ) |
| | |
|
|
| |
|
|
|
Net increase from Fund share transactions | | | 3,940,757,260 | | | | 2,956,554,332 | |
| | |
|
|
| |
|
|
|
Total increase in net assets | | | 4,028,354,384 | | | | 3,548,035,774 | |
| | |
| Net Assets: | | | | | | | | |
Beginning of period | | | 4,202,929,706 | | | | 654,893,932 | |
| | |
|
|
| |
|
|
|
End of period (including undistributed net investment income of $86,159,797 and $2,145,796, respectively) | | $ | 8,231,284,090 | | | $ | 4,202,929,706 | |
| | |
|
|
| |
|
|
|
| | |
| Share Information: | | | | | | | | |
Shares sold | | | 141,264,865 | | | | 116,358,049 | |
Distributions reinvested | | | — | | | | 1,836,809 | |
Shares redeemed | | | (14,332,445 | ) | | | (8,933,703 | ) |
| | |
|
|
| |
|
|
|
Net increase in
shares outstanding | | | 126,932,420 | | | | 109,261,155 | |
| | |
|
|
| |
|
|
|
| | |
| 7 / Dodge & Cox International Stock Fund | | See accompanying Notes to Financial Statements |
Notes to Financial Statements (unaudited)
Note 1 — Organization and Significant Accounting Policies
Dodge & Cox International Stock Fund (the “Fund”) is one of the series constituting the Dodge & Cox Funds (the “Trust” or the “Funds”). The Trust is organized as a Delaware statutory trust and is registered under the Investment Company Act of 1940, as amended, as a diversified, open-end management investment company. The Fund’s predecessor, Dodge & Cox International Equity Fund, L.L.C. (the “LLC”), was organized on October 25, 1999 as a private investment company that converted into, and had the same investment manager as, the Fund. The Fund was capitalized on April 30, 2001 upon the transfer of assets from the LLC and commenced operations on May 1, 2001. The Fund seeks long-term growth of principal and income, and the Fund invests primarily in a diversified portfolio of foreign stocks. Foreign investing, especially in developing countries, has special risks such as currency and market volatility and political and social instability. These and other risk considerations are discussed in the Fund’s Prospectus.
The financial statements have been prepared in conformity with accounting principles generally accepted in the United States of America, which require the use of estimates and assumptions by management. Significant accounting policies are as follows:
Security valuation. The Fund’s net assets are valued as of the close of trading on the New York Stock Exchange (the “NYSE”), generally 4:00 p.m. Eastern Time, each day that the NYSE is open for business. Listed securities are valued at market, using as a price the official quoted close price or the last sale on the date of determination on the principal exchange on which such securities are traded or, if not available, at the mean between the exchange listed bid and ask prices for the day. A security that is listed or traded on more than one exchange is valued at the quotation on the exchange determined to be the primary market for such security. Security values are not discounted based on the size of the Fund’s position. Short-term securities are valued at amortized cost which approximates current value. Foreign securities are converted to U.S. dollars using prevailing exchange rates.
If market quotations are not readily available or if a security’s value has materially changed after the close of the security’s primary market but before the close of trading on the NYSE, the security is valued at fair value as determined in good faith by or at the
direction of the Board of Trustees. The Fund may use fair value pricing in calculating its NAV when, for example, (i) the primary market for a security is closed or if trading of a security is suspended or limited, (ii) the Fund determines that the price provided by a pricing service is inaccurate or unreliable, or (iii) the Fund determines that a significant event affecting the value of a security has occurred before the close of the NYSE but after the close of the security’s primary market. An event is considered significant if there is both an affirmative expectation that the security’s value will change in response to the event and a reasonable basis for quantifying a resulting change in value. For securities that do not trade during NYSE hours, fair value determinations are based on analyses of market movements after the close of those securities’ primary markets, and include reviews of developments in foreign markets, the performance of U.S. securities markets, and the performance of instruments trading in U.S. markets that represent foreign securities and baskets of foreign securities. Pricing services are used to obtain closing market prices and to compute certain fair value adjustments utilizing computerized pricing models. When fair value pricing is employed, the prices of securities used by the Fund to calculate its net asset value may differ from quoted or published prices for the same securities.
Foreign currency translation. Assets (including investments) and liabilities denominated in a foreign currency are translated into U.S. dollars at the prevailing rates of exchange at the end of the reporting period. Purchases and sales of securities, income receipts, and expenses are translated into U.S. dollars at the exchange rate in effect on the transaction date. Realized foreign currency gains and losses may arise from sales and maturities of foreign currency contracts, sales of foreign currencies, the difference between the amount of net investment income accrued and the U.S. dollar amount actually received, and from currency gains and losses between trade and settlement date on security transactions. The effects of exchange rate changes on investment securities are included with the net realized and unrealized gain (loss) on investments.
Foreign currency contracts. When the Fund purchases or sells foreign securities, it may enter into foreign exchange contracts to minimize foreign exchange risk from the trade date to the settlement date of the transaction. Losses from these transactions may arise from changes in the value of the foreign currency or if the counterparties do not perform under the contract’s terms.
| | |
| | | Dodge & Cox International Stock Fund / 8 |
Notes to Financial Statements (unaudited) (continued)
Security transactions, investment income, expenses, and distributions. Security transactions are recorded on the trade date. Realized gains and losses on securities sold are determined on the basis of identified cost.
Dividend income and corporate action transactions are recorded on the ex-dividend date, except for certain dividends or corporate actions from foreign securities where the ex-dividend date may have passed, which are recorded as soon as the Fund is informed of the ex-dividend date. Withholding taxes on foreign dividends have been provided for in accordance with the Fund’s understanding of the applicable country’s tax rules and rates. Non-cash dividends included in dividend income, if any, are recorded at the fair market value of the securities received. Distributions received in excess of income are recorded as a reduction of cost of investments and/or realized gain. Interest income is recorded on the accrual basis.
Expenses are recorded on the accrual basis. Most expenses of the Trust can be directly attributed to a specific series. Expenses which cannot be directly attributed are apportioned among the Funds in the Trust.
Distributions to shareholders are recorded on the ex-dividend date.
Repurchase agreements. The Fund may enter into repurchase agreements secured by U.S. government securities which involve the purchase of securities from a counterparty with a simultaneous commitment to resell the securities at an agreed-upon date and price. It is the Fund’s policy that its custodian take possession of the underlying collateral securities, the fair value of which exceeds the principal amount of the repurchase transaction, including accrued interest, at all times. In the event of default by the counterparty, the Fund has the contractual right to liquidate the securities and to apply the proceeds in satisfaction of the obligation.
Note 2 — Related Party Transactions
Management fees. Under a written agreement, the Fund pays an annual management fee of 0.60% of the Fund’s average daily net assets to Dodge & Cox, investment manager of the Fund.
Fund officers and trustees. All officers and three of the trustees of the Trust are officers or employees of Dodge & Cox. The Trust pays a fee only to those trustees who are not affiliated with Dodge & Cox.
Indemnifications. Under the Trust’s organizational documents, its officers and trustees are indemnified against certain liabilities arising out of the performance of their duties to the Trust. In addition, in the normal course of business the Trust enters into contracts that provide general indemnifications to other parties. The Trust’s maximum exposure under these arrangements is unknown as this would involve future claims that may be made against the Trust that have not yet occurred.
Note 3 — Income Tax Information and Distributions to Shareholders
A provision for federal income taxes is not required since the Fund intends to continue to qualify as a regulated investment company under Subchapter M of the Internal Revenue Code and distribute all of its taxable income to shareholders. Distributions are determined in accordance with income tax regulations, which may differ from net investment income and realized gains for financial reporting purposes. Financial reporting records are adjusted for permanent book/tax differences to reflect tax character. Financial records are not adjusted for temporary differences.
Book/tax differences are primarily due to differing treatments of short-term realized gains and foreign currency realized gains (losses). At June 30, 2005, the cost of investments for federal income tax purposes was equal to the cost for financial reporting purposes.
At June 30, 2005, the tax basis components of net assets were as follows:
| | | | |
Unrealized appreciation | | $ | 740,656,177 | |
Unrealized depreciation | | | (140,811,283 | ) |
| | |
|
|
|
Net unrealized appreciation | | | 599,844,894 | |
Undistributed ordinary income | | | 93,501,405 | |
Undistributed long-term capital gain | | | 78,806,019 | |
Paid-in capital | | | 7,459,131,772 | |
| | |
|
|
|
Net assets | | $ | 8,231,284,090 | |
| | |
|
|
|
Note 4 — Purchase and Sales of Investments
For the period ended June 30, 2005, purchases and sales of securities, other than short-term securities, aggregated $4,191,839,134 and $213,437,763, respectively.
| | |
| 9 / Dodge & Cox International Stock Fund | | |
Notes to Financial Statements (unaudited) (continued)
Note 5 — Holdings of 5% Voting Securities
Each of the companies listed below is considered to be an affiliate of the Fund because the Fund owned 5% or more of the company’s voting securities during the period ended June 30, 2005. Transactions during the period in securities of affiliated companies were as follows:
| | | | | | | | | | | | | | |
| | | Shares at
Beginning
of Period | | Additions | | Reductions | | Shares
at End of
Period | |
| Dividend
Income1 | |
| Value at
June 30, 2005 |
| | | | | | |
Aderans Co. (Japan) | | 2,233,200 | | 500,000 | | — | | 2,733,200 | | $ | 376,605 | | $ | 64,744,394 |
| | | | | | |
Brother Industries, Ltd. (Japan) | | 8,000,000 | | 8,113,000 | | — | | 16,113,000 | | | 698,964 | | | 147,876,379 |
| | | | | | |
Consorcio Ara S.A. de C.V. (Mexico) | | 18,217,700 | | 1,850,400 | | — | | 20,068,100 | | | 729,868 | | | 69,419,130 |
| | | | | | |
Converium Holdings AG (Switzerland) | | 4,233,328 | | 3,156,524 | | — | | 7,389,852 | | | —2 | | | 59,967,588 |
| | | | | | |
Corporacion Geo S.A. de C.V. Series B (Mexico) | | 7,191,600 | | 34,913,800 | | — | | 42,105,400 | | | —2 | | | 106,457,674 |
| | | | | | |
Nexans S.A. (France) | | 1,166,440 | | 450,000 | | — | | 1,616,440 | | | 856,537 | | | 65,514,253 |
| | | | | | |
Oce N.V. (Netherlands) | | 3,649,767 | | 2,972,233 | | — | | 6,622,000 | | | 2,404,947 | | | 97,581,583 |
| | | | | | | | | | |
|
| |
|
|
| | | | | | |
| | | | | | | | | | | $ | 5,066,921 | | $ | 611,561,001 |
| | | | | | | | | | |
|
| |
|
|
| 1 | | Net of foreign taxes, if any |
Financial Highlights (unaudited)
| | | | | | | | | | | | | | | | | | | | | |
SELECTED DATA AND RATIOS
(for a share outstanding throughout each period) | | | | Six Months
Ended June 30, | | | | | Year Ended December 31, | | | | | May 1, 2001
through
December 31, | |
| | | | | 2005 | | | | | 2004 | | | 2003 | | | 2002 | | | | | 2001 | |
Net asset value, beginning of period | | | | $30.64 | | | | | $23.48 | | | $15.81 | | | $18.42 | | | | | $20.00 | |
| | | | | | | | |
Income from investment operations: | | | | | | | | | | | | | | | | | | | | | |
Net investment income | | | | 0.31 | | | | | 0.26 | | | 0.14 | | | 0.13 | | | | | 0.14 | |
Net realized and unrealized gain (loss) | | | | 0.22 | | | | | 7.36 | | | 7.67 | | | (2.55 | ) | | | | (1.56 | ) |
| | | | |
|
|
Total from investment operations | | | | 0.53 | | | | | 7.62 | | | 7.81 | | | (2.42 | ) | | | | (1.42 | ) |
| | | | |
|
|
Distributions to shareholders from: | | | | | | | | | | | | | | | | | | | | | |
Net investment income | | | | — | | | | | (0.24 | ) | | (0.14 | ) | | (0.13 | ) | | | | (0.14 | ) |
Net realized gain | | | | — | | | | | (0.22 | ) | | — | | | (0.06 | ) | | | | (0.02 | ) |
| | | | |
|
|
Total distributions | | | | — | | | | | (0.46 | ) | | (0.14 | ) | | (0.19 | ) | | | | (0.16 | ) |
| | | | |
|
|
Net asset value, end of period | | | | $31.17 | | | | | $30.64 | | | $23.48 | | | $15.81 | | | | | $18.42 | |
| | | | |
|
|
Total return | | | | 1.73 | % | | | | 32.46 | % | | 49.42 | %† | | (13.11 | )%† | | | | (7.09 | )%† |
Ratios/supplemental data: | | | | | | | | | | | | | | | | | | | | | |
Net assets, end of period (millions) | | | | $8,231 | | | | | $4,203 | | | $655 | | | $117 | | | | | $25 | |
Ratio of expenses to average net assets | | | | 0.72 | %* | | | | 0.77 | % | | 0.82 | % | | 0.90 | % | | | | 0.90 | %* |
Ratio of expenses to average net assets,
before reimbursement by investment manager | | | | 0.72 | %* | | | | 0.77 | % | | 0.84 | % | | 1.03 | % | | | | 2.47 | %* |
Ratio of net investment income to average net assets | | | | 2.66 | %* | | | | 1.90 | % | | 1.53 | % | | 1.30 | % | | | | 1.74 | %* |
Portfolio turnover rate | | | | 4 | % | | | | 6 | % | | 11 | % | | 12 | % | | | | 23 | % |
| † | | From inception through June 30, 2003, Dodge & Cox reimbursed the Fund for all ordinary expenses to the extent necessary to maintain total Fund operating expenses at 0.90%. Without the expense reimbursements, returns for the Fund for this period would have been lower. |
| | |
| | | Dodge & Cox International Stock Fund / 10 |
Fund’s Holdings
The Funds provide a complete list of their holdings four times in each fiscal year, as of the end of each quarter. The lists appear in the Funds’ First Quarter, Semi-Annual, Third Quarter and Annual Reports to shareholders. The Funds file the lists with the Securities and Exchange Commission (SEC) on Form N-CSR (second and fourth quarters) and Form N-Q (first and third quarters). Shareholders may view the Funds’ Forms N-CSR and N-Q on the SEC’s website at www.sec.gov. Forms N-CSR and N-Q may also be reviewed and copied at the SEC’s Public Reference Room in Washington, DC. Information regarding the operations of the Public Reference Room may be obtained by calling 1-202-942-8090 (direct) or 1-800/SEC-0330 (general SEC number). A complete list of the Funds’ quarter-end holdings are also available at www.dodgeandcox.com on or about 15 days following each quarter-end and remains available on the web site until the list is updated for the subsequent quarter.
Proxy Voting
For a free copy of the Fund’s proxy voting policies and procedures, please call (800) 621-3979, visit www.dodgeandcox.com, or visit the Securities and Exchange Commission’s web site at www.sec.gov. Beginning August 31, 2005, information regarding how Dodge & Cox, on behalf of the Fund, voted proxies relating to the Fund’s portfolio securities for the most recent twelve-month period ending June 30 will be available at www.dodgeandcox.com or the SEC’s web site at www.sec.gov.
Officers and Trustees
Harry R. Hagey, Chairman & Trustee
Chairman & Chief Executive Officer, Dodge & Cox
John A. Gunn, President & Trustee
President, Dodge & Cox
Dana M. Emery, Vice President & Trustee
Senior Vice President, Dodge & Cox
William F. Ausfahl, Trustee
Former Chief Financial Officer and member of Board of Directors, The Clorox Company
L. Dale Crandall, Trustee
Former President, Kaiser Foundation Health Plan and Hospitals
Thomas A. Larsen, Trustee
Director, Howard, Rice, Nemerovski, Canady, Falk & Rabkin
Will C. Wood, Trustee
Principal, Kentwood Associates, Financial Advisers
A. Horton Shapiro, Executive Vice President
Senior Vice President, Dodge & Cox
Katherine Herrick Drake, Vice President
Vice President, Dodge & Cox
Kenneth E. Olivier, Vice President
Executive Vice President, Dodge & Cox
Diana S. Strandberg, Vice President
Vice President, Dodge & Cox
John M. Loll, Treasurer & Asst. Secretary
Vice President & Treasurer, Dodge & Cox
Thomas M. Mistele, Secretary & Asst. Treasurer
Chief Operating Officer, Secretary & General Counsel, Dodge & Cox
Marcia P. Venegas, Chief Compliance Officer
Chief Compliance Officer, Dodge & Cox
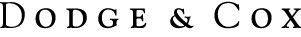
Balanced Fund
Established 1931
(Closed to New Investors)

Semi-Annual Report
June 30, 2005
2005
Balanced Fund
www.dodgeandcox.com
For Fund literature, transactions and account
information, please visit the Funds’ web site.
or write or call:
Dodge & Cox Funds
c/o Boston Financial Data Services
P.O. Box 8422
Boston, Massachusetts 02266-8422
(800) 621-3979
Investment Manager
Dodge & Cox
555 California Street, 40th Floor
San Francisco, California 94104
(415) 981-1710
This report is submitted for the general information of the shareholders of the Fund. The report is not authorized for distribution to prospective investors in the Fund unless it is accompanied by a current prospectus.
This report reflects our views, opinions and portfolio holdings as of June 30, 2005, the end of the reporting period. Any such views are subject to change at any time based upon market or other conditions and Dodge & Cox disclaims any responsibility to update such views. These views may not be relied on as investment advice and, because investment decisions for a Dodge & Cox Fund are based on numerous factors, may not be relied on as an indication of trading intent on behalf of any Dodge & Cox Fund.
06/05 BF SAR  Printed on recycled paper
To Our Shareholders
The Dodge & Cox Balanced Fund had a total return of 1.0% for the six months ended June 30, 2005, compared to a total return of 0.5% for the Combined Index1. Longer-term results for the Fund can be found on the following page. On June 30, the Fund’s net assets of $22.5 billion were invested in 58.8% stocks, 33.7% fixed-income securities and 7.5% cash equivalents.
Equity Performance Review
The equity portion of the Fund outperformed the S&P 500’s -0.8% return for the six months ended June 30, 2005. During this period, the equity portfolio benefited from strong performers in Energy holdings including Unocal (up 52%) and Occidental Petroleum (up 33%). In addition, the portfolio’s investments in the Health Care sector performed better than those in the S&P 500 (e.g., HCA. up 43% and WellPoint. up 21%). Conversely, the weak performance from the portfolio’s Consumer Discretionary holdings detracted from relative results. Particularly weak stocks included Delphi (down 48%), Time Warner (down 14%) and McDonald’s (down 13%) underperformed in this sector.
Fixed-Income Performance Review
The fixed-income portfolio’s modest first half performance lagged that of the LBAG for two primary reasons: the portfolio’s shorter “defensive” duration2 positioning (i.e., less sensitivity to changes in interest rates because of a high weighting in short and intermediate maturity securities) and the portfolio’s holdings of Ford Motor Credit Company (FMCC) and General Motors Acceptance Corporation (GMAC). The shorter-than-LBAG duration positioning (2.9 years versus 4.3 years for the LBAG at the beginning of the year) detracted from relative returns in light of the strong performance of long-term bonds during the period. For instance, 10-year Treasury yields declined by 30 basis points (1 basis point = 1/100 of 1%) and 30-year Treasury yields declined by 64 basis points. As bond prices move in the opposite direction of interest rates, the fixed-income portfolio experienced less price appreciation than the LBAG. In addition, the portfolio’s holdings of FMCC and GMAC (which together comprised 4.3% of the portfolio at the beginning of the year) performed poorly: the portfolio’s 2011 maturity bonds from these issuers returned -6.9% and -6.6%, respectively.
Morningstar® Address
In June, I, Harry Hagey, in my capacity as Chairman and CEO of Dodge & Cox, was invited to speak at Morningstar’s Investment Conference. I thought it would be helpful to share an excerpt of that speech with all of our shareholders:
So, how did the small, local firm founded in the 1930s, which I joined in the late 1960s, become the firm we are today? What I would like to do now is to summarize for you what I think are the key components that make Dodge & Cox a successful money management firm.
First and Most Important—Our Current Clients
We are in the business of providing continuous high-quality investment management service to our existing clients. We decided a long time ago that we are not in business to provide a series of financial products to the investment market place. Another way to look at this is that we are in the investment business and not in the money gathering business. We do not advertise, we do not have a marketing department and no one at our firm is paid commissions or compensated directly for bringing in new business. We concluded that if we did a good job, the word would get around. We have relatively low expense ratios with no 12b-1 or other fees. In general, our firm’s investment objective is to first preserve and then enhance the future purchasing power of our clients’ wealth over the long-term3. Please note that I did not say to beat a particular benchmark or to have low tracking error. If we believe that a significant part of the market is unattractive, we will not be in it. Finally, ethical considerations are paramount—we work hard to maintain our reputation.
Second—Our Employees
With regard to our own people, we insist on respect for each individual employee as well as for the entire firm. We work within a collegial and team-work environment with the goal of having everyone at the firm think as owners, not just as employees. Dodge & Cox has a long history, but it is still a small firm and its vitality is maintained by diplomatic entrepreneurship.
We also want all of our employees to share in the firm’s success. Our compensation structure provides salary and bonus for each member of our firm. The bonus is based on how well the firm has done and an employee’s contribution over time. We avoid any quantitative measurement of our research analysts’ performance because we make decisions as a group—we don’t believe in a “star system” or the reliance on any one individual. We try to create an environment where our analysts will not overly worry about making bad recommendations, and will be rewarded for sharing information with their peers.
Importantly, our independence, culture and compensation structure have led to low employee turnover which, in our opinion, is crucial to maintaining a consistent investment approach in difficult investment environments.
Third—Dodge & Cox
With regard to the firm, probably the most important characteristic is our independence. We require that shareholders of the firm be active employees. The firm is held widely with about one-third of employees being shareholders. We also believe it is important to have control of the investment service to our clients so we have no joint ventures. The only planning that we do is to make sure that we have assets in place, most important being people, so that we can continue to do a good job for our existing clients.
| | |
| 1 / Dodge & Cox Balanced Fund | | |
For Dodge & Cox, issues of ethics, independence, a focused teamwork investment approach, respect for the individual, and an absence of a marketing mindset are all key determinants in what makes us who we are.
One of my individual clients recently sent me a book by James P. Owen, called Cowboy Ethics—What Wall Street Can Learn from the Code of the West. The pictures in the book are fantastic and I also believe that the book has real wisdom. In the book Mr. Owen summarized the Code with ten rules. The ones that resonated with me most are: 1) Take Pride in Your Work, 2) Ride for the Brand, 3) Remember That Some Things Aren’t for Sale, and 4) Know Where to Draw the Line.
I think Dodge & Cox as a firm has lived by this Code.
In Closing
In spite of rising short-term interest rates and energy prices, we continue to be optimistic about the long-term prospects for the global economy. We are also optimistic about corporate earnings over the next three-to-five years; nevertheless, we are cautious about returns from the broad market given current valuations.
As always, Dodge & Cox’s equity investment approach remains focused on intensive “bottom-up” fundamental analysis, while maintaining a strong price discipline and long-term view. Increasingly, this approach has led to opportunities in global companies that are domiciled outside the U.S. The Fund’s 19 foreign investments are all listed on US exchanges and now represents over 10% of the Fund.
With regards to the fixed-income portfolio, we remain focused on building long-term total return potential by investing in corporate and mortgage holdings at attractive valuations. For example, during the quarter we added to several corporate bond positions as yield premiums widened. This strategy allows us to build portfolio yield while maintaining a well diversified, high average quality (AA+)4 portfolio.
Thank you for your continued confidence in the Dodge & Cox Balanced Fund. As always, we welcome your comments and questions.
For the Board of Trustees,
| | |
 | | 
|
| |
| Harry R. Hagey, Chairman | | John A. Gunn, President |
August 3, 2005
Ten Years of Investment Performance
through June 30, 2005 (in thousands)
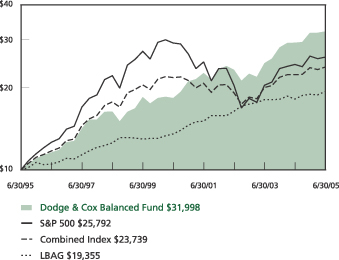
Average annual total return for periods ended June 30, 2005
| | | | | | | | | | | | |
| | | 1 Year | | | 5 Years | | | 10 Years | | | 20 Years | |
| | |
| Dodge & Cox Balanced Fund | | 9.69 | % | | 11.83 | % | | 12.33 | % | | 13.15 | % |
| Combined Index | | 6.59 | | | 1.79 | | | 9.03 | | | 11.03 | |
| S&P 500 | | 6.29 | | | (2.37 | ) | | 9.94 | | | 12.28 | |
Lehman Brothers Aggregate Bond Index (LBAG) | | 6.81 | | | 7.41 | | | 6.83 | | | 8.41 | |
Past performance does not guarantee future results. Investment return and share price will fluctuate with market conditions, and investors may have a gain or loss when shares are sold. Mutual fund performance changes over time and currently may be significantly lower than stated above. Performance is updated and published monthly. Visit the Fund’s web site at www.dodgeandcox.com or call 800-621-3979 for current performance figures.
The Fund’s total returns include the reinvestment of dividend and capital gain distributions, but have not been adjusted for any income taxes payable by shareholders on these distributions. Index returns include dividends and/or interest income and, unlike Fund returns, do not reflect fees or expenses.
Lehman Brothers® is a trademark of Lehman Brothers, Inc.; Standard & Poor’s, Standard & Poor’s 500, and S&P 500® are trademarks of The McGraw-Hill Companies, Inc.
| 1 | | The Combined Index reflects an unmanaged portfolio of 60% of the Standard & Poor’s 500 Index (S&P 500) and 40% of the Lehman Brothers Aggregate Bond Index (LBAG). The Fund may, however, invest up to 75% of its total assets in stocks. |
| 2 | | Duration is a measure of a bond’s price sensitivity to changes in interest rates. |
| 3 | | Please refer to the Fund’s prospectus for its investment objectives, policies and restrictions. |
| 4 | | The Fund may invest in securities rated below AA. As of June 30, 2005, 8.9% of the Fund was rated below AA, which includes 3.9% rated below investment grade (below BBB). |
| | |
| | | Dodge & Cox Balanced Fund / 2 |
Fund Expenses
As a Fund shareholder, you incur ongoing costs, which include costs for portfolio management, administrative services, and shareholder reports (like this one). Operating expenses, which are deducted from a Fund’s gross income, directly reduce the investment return of the Fund. The following example is intended to help you understand the ongoing costs (in dollars) of investing in the Fund and to compare these costs with those of other mutual funds. The example is based on an investment of $1,000 made at the beginning of the most recent six-month period and held for the entire period.
The table below illustrates the Fund’s costs in two ways:
Actual Fund Expenses
The first line of the table below provides information about actual account values and actual expenses. You may use the information in this line, together with your account balance, to estimate the expenses that you paid on your account over the period. Simply divide your account value by $1,000 (for example, an $8,600 account value divided by $1,000 = 8.6), then multiply the result by the number under the heading “Expenses Paid During Period”.
Hypothetical Example for Comparison
Information on the second line of the table can help you compare ongoing costs of investing in the Fund with those of other mutual funds. This information may not be used to estimate the actual ending account balance or expenses you paid during the period. The hypothetical “Ending Account Value” is based on the actual expense ratio of the Fund and an assumed 5% annual rate of return before expenses (not the Fund’s actual return). The amount under the heading “Expense Paid During the Period” shows the hypothetical expense your account would have incurred under this scenario. You can compare this figure with the 5% hypothetical examples that appear in shareholder reports of other funds.
| | | | | | |
Six Months Ended
June 30, 2005 | | Beginning Account
Value 1/1/05 | | Ending Account
Value 6/30/05 | | Expenses Paid
During Period* |
| Based on Actual Fund Return | | $1,000.00 | | $1,009.70 | | $2.67 |
| Based on Hypothetical 5% Yearly Return | | 1,000.00 | | 1,022.34 | | 2.69 |
| * | | Expenses are equal to the Fund’s annualized expense ratio of 0.54%, multiplied by the average account value over the period, multiplied by 181/365 (to reflect the one-half year period). |
The expenses shown in the table highlight ongoing costs only and do not reflect any transactional costs or account maintenance fees. While other mutual funds may charge such fees, please note that the Fund does not charge transaction fees (e.g., redemption fees, sales loads) or universal account maintenance fees (e.g., small account fees).
| | |
| 3 / Dodge & Cox Balanced Fund | | |
Fund Information | June 30, 2005 |
General Information
| | |
Net Asset Value Per Share | | $79.03 |
Total Net Assets (millions) | | $22,490 |
30-Day SEC Yield1 | | 2.24% |
2004 Expense Ratio | | 0.54% |
2004 Portfolio Turnover | | 18% |
Fund Inception | | 1931 |
| Investment Manager: Dodge & Cox, San Francisco. Managed by the Investment Policy Committee, whose nine members’ average tenure at Dodge & Cox is 22 years (twelve members, 21 years average tenure for certain fixed-income decisions), and by the Fixed-Income Strategy Committee, whose nine members’ average tenure is 15 years. |
Asset Allocation
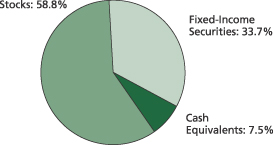
Stock Portfolio (58.8% of Fund)
| | |
Number of Stocks | | 93 |
Median Market Capitalization (billions) | | $17 |
Price-to-Earnings Ratio2 | | 15.4x |
Price-to-Book Value Ratio | | 2.0x |
Foreign Stocks3 (% of Fund) | | 10.3% |
| Five Largest Sectors | | % of Fund |
Consumer Discretionary | | 12.9 |
Financials | | 11.4 |
Health Care | | 9.0 |
Information Technology | | 7.8 |
Energy | | 5.8 |
| | |
| Ten Largest Stock Holdings4 | | % of Fund |
Hewlett-Packard | | 2.2 |
Comcast Class A | | 1.9 |
Cardinal Health | | 1.6 |
Time Warner, Inc. | | 1.5 |
News Corp. Class A | | 1.5 |
HCA, Inc. | | 1.5 |
McDonald’s | | 1.4 |
Sony ADR (Japan) | | 1.3 |
Matsushita Electric Industrial ADR (Japan) | | 1.2 |
Union Pacific | | 1.2 |
Fixed-Income Portfolio (33.7% of Fund)
| | |
Number of Fixed-Income Securities | | 252 |
Average Quality | | AA+ |
Average Maturity | | 4.7 years |
Effective Duration | | 2.9 years |
| Credit Quality Diversification5 | | % of Fund |
U.S. Government & Government Agencies | | 24.7 |
Aaa/AAA | | 0.1 |
Aa/AA | | 0.06 |
A/A | | 1.0 |
Baa/BBB | | 4.0 |
Ba/BB | | 3.8 |
B/B and below | | 0.1 |
| | |
| Sector Diversification | | % of Fund |
U.S. Treasury & Government Agency | | 12.5 |
Mortgage-Related Securities | | 12.2 |
Corporate | | 9.0 |
| Five Largest Corporate Fixed-Income Issuers4 | | % of Fund |
GMAC | | 0.9 |
Ford Motor Credit | | 0.8 |
AT&T | | 0.7 |
Time Warner, Inc. | | 0.7 |
HCA, Inc. | | 0.6 |
| 1 | | SEC Yield is an annualization of the Fund’s total net investment income per share for the 30-day period ended on the last day of the month. |
| 2 | | Price-to-earnings (P/E) ratio is calculated using Dodge & Cox’s estimated forward earnings and excludes extraordinary items. |
| 3 | | Foreign stocks are U.S. dollar-denominated. |
| 4 | | The Fund’s portfolio holdings are subject to change without notice. The mention of specific securities is not a recommendation or solicitation for any person to buy, sell or hold any particular security. |
| 5 | | For presentation purposes only: when a security is split-rated, the lower of either Moody’s or Standard & Poor’s rating is reported. |
| | |
| | | Dodge & Cox Balanced Fund / 4 |
Portfolio of Investments (unaudited) | June 30, 2005 |
| | | | | |
| COMMON STOCKS: 58.8% |
| | |
| | | SHARES | | VALUE |
| CONSUMER DISCRETIONARY: 12.9% |
| AUTOMOBILES & COMPONENTS: 0.6% | | | | | |
Delphi Corp. | | 12,515,664 | | $ | 58,197,838 |
Honda Motor Co., Ltd. ADR(b) (Japan) | | 2,863,300 | | | 70,465,813 |
| | | | |
|
|
| | | | | | 128,663,651 |
| CONSUMER DURABLES & APPAREL: 3.4% | | | |
Matsushita Electric Industrial Co., Ltd. ADR(b) (Japan) | | 18,348,200 | | | 278,525,676 |
Sony Corp. ADR(b) (Japan) | | 8,243,600 | | | 283,909,584 |
Thomson S.A. ADR(b) (France) | | 1,500,000 | | | 35,925,000 |
VF Corp. | | 1,051,700 | | | 60,178,274 |
Whirlpool Corp. | | 1,474,900 | | | 103,405,239 |
| | | | |
|
|
| | | | | | 761,943,773 |
| CONSUMER SERVICES: 1.4% | | | | | |
McDonald’s Corp. | | 11,129,850 | | | 308,853,338 |
| | | | |
|
|
| MEDIA: 5.5% | | | | | |
Comcast Corp. Class A(a) | | 13,873,216 | | | 425,907,731 |
Interpublic Group of Companies, Inc.(a) | | 1,655,500 | | | 20,163,990 |
Liberty Media Corp. Series A(a) | | 10,289,200 | | | 104,846,948 |
News Corp. Ltd., Class A | | 20,817,900 | | | 336,833,622 |
Time Warner, Inc.(a) | | 20,484,600 | | | 342,297,666 |
| | | | |
|
|
| | | | | | 1,230,049,957 |
| RETAILING: 2.0% | | | | | |
Dillard’s, Inc. Class A | | 1,461,500 | | | 34,228,330 |
Gap, Inc. | | 3,552,800 | | | 70,167,800 |
Genuine Parts Co. | | 3,335,750 | | | 137,065,967 |
May Department Stores Co. | | 5,534,950 | | | 222,283,592 |
| | | | |
|
|
| | | | | | 463,745,689 |
| | | | |
|
|
| | | | | | 2,893,256,408 |
| CONSUMER STAPLES: 1.2% | | | | | |
| FOOD & STAPLES RETAILING: 0.1% | | | | | |
Wal-Mart Stores, Inc. | | 579,300 | | | 27,922,260 |
| | | | |
|
|
| FOOD, BEVERAGE & TOBACCO: 1.1% | | | | | |
Unilever N.V.(b) (Netherlands) | | 3,890,400 | | | 252,214,632 |
| | | | |
|
|
| | | | | | 280,136,892 |
| ENERGY: 5.8% | | | | | |
Amerada Hess Corp. | | 1,014,300 | | | 108,033,093 |
Baker Hughes, Inc. | | 2,984,400 | | | 152,681,904 |
ChevronTexaco Corp. | | 3,843,016 | | | 214,901,455 |
ConocoPhillips | | 3,366,600 | | | 193,545,834 |
Occidental Petroleum Corp. | | 1,462,500 | | | 112,510,125 |
Schlumberger Ltd.(b) (Netherlands Antilles) | | 1,050,000 | | | 79,737,000 |
Shell Transport & Trading Co. PLC ADR(b) (United Kingdom) | | 3,615,000 | | | 209,886,900 |
Unocal Corp. | | 3,542,100 | | | 230,413,605 |
| | | | |
|
|
| | | | | | 1,301,709,916 |
| | | | | |
| | |
| | | SHARES | | VALUE |
| FINANCIALS: 11.4% | | | | | |
| BANKS: 2.4% | | | | | |
Golden West Financial Corp. | | 3,025,700 | | $ | 194,794,566 |
Wachovia Corp. | | 5,109,500 | | | 253,431,200 |
Wells Fargo & Co. | | 1,560,950 | | | 96,123,301 |
| | | | |
|
|
| | | | | | 544,349,067 |
| DIVERSIFIED FINANCIALS: 2.8% | | | | | |
Capital One Financial Corp. | | 3,300,500 | | | 264,073,005 |
CIT Group, Inc. | | 2,391,100 | | | 102,745,567 |
Citigroup, Inc. | | 3,552,900 | | | 164,250,567 |
JPMorgan Chase & Co. | | 3,170,088 | | | 111,967,508 |
| | | | |
|
|
| | | | | | 643,036,647 |
| INSURANCE: 4.7% | | | | | |
AEGON N.V. ADR(b) (Netherlands) | | 9,669,964 | | | 124,452,437 |
Chubb Corp. | | 1,784,612 | | | 152,780,633 |
Genworth Financial, Inc. Class A | | 2,570,000 | | | 77,691,100 |
Loews Corp. | | 2,241,500 | | | 173,716,250 |
MBIA, Inc. | | 562,750 | | | 33,376,703 |
Safeco Corp. | | 1,800,200 | | | 97,822,868 |
St. Paul Travelers Companies, Inc. | | 6,652,900 | | | 262,989,137 |
Torchmark Corp. | | 1,084,100 | | | 56,590,020 |
UnumProvident Corp. | | 3,795,400 | | | 69,531,728 |
| | | | |
|
|
| | | | | | 1,048,950,876 |
| REAL ESTATE: 1.5% | | | | | |
Equity Office Properties Trust | | 6,755,500 | | | 223,607,050 |
Equity Residential Properties Trust | | 2,901,000 | | | 106,814,820 |
| | | | |
|
|
| | | | | | 330,421,870 |
| | | | |
|
|
| | | | | | 2,566,758,460 |
| HEALTH CARE: 9.0% | | | | | |
| HEALTH CARE EQUIPMENT & SERVICES: 4.8% | | | |
Becton, Dickinson & Co. | | 1,317,900 | | | 69,150,213 |
Cardinal Health, Inc. | | 6,276,400 | | | 361,395,112 |
HCA, Inc. | | 5,903,800 | | | 334,568,346 |
Thermo Electron Corp.(a) | | 3,335,850 | | | 89,634,289 |
WellPoint, Inc.(a) | | 3,273,000 | | | 227,931,720 |
| | | | |
|
|
| | | | | | 1,082,679,680 |
| PHARMACEUTICALS & BIOTECHNOLOGY: 4.2% | | | |
Bristol-Myers Squibb Co. | | 2,189,650 | | | 54,697,457 |
GlaxoSmithKline PLC ADR(b)
(United Kingdom) | | 3,875,400 | | | 187,995,654 |
Pfizer, Inc. | | 7,886,367 | | | 217,506,002 |
sanofi-aventis ADR(b) (France) | | 3,000,000 | | | 122,970,000 |
Schering-Plough Corp. | | 10,734,550 | | | 204,600,523 |
Wyeth | | 3,266,800 | | | 145,372,600 |
| | | | |
|
|
| | | | | | 933,142,236 |
| | | | |
|
|
| | | | | | 2,015,821,916 |
| INDUSTRIALS: 3.7% | | | | | |
| CAPITAL GOODS: 1.2% | | | | | |
American Power Conversion Corp. | | 1,475,700 | | | 34,811,763 |
Fluor Corp. | | 1,840,300 | | | 105,982,877 |
| | |
| 5 / Dodge & Cox Balanced Fund | | See accompanying Notes to Financial Statements |
Portfolio of Investments (unaudited) | June 30, 2005 |
| | | | | |
| COMMON STOCKS (continued) |
| | |
| | | SHARES | | VALUE |
Masco Corp. | | 2,459,000 | | $ | 78,097,840 |
Volvo A.B. ADR(b) (Sweden) | | 1,029,700 | | | 41,761,543 |
| | | | |
|
|
| | | | | | 260,654,023 |
| COMMERCIAL SERVICES & SUPPLIES: 0.3% | | | |
Pitney Bowes, Inc. | | 1,603,450 | | | 69,830,248 |
| | | | |
|
|
| TRANSPORTATION: 2.2% | | | | | |
FedEx Corp. | | 2,775,250 | | | 224,823,002 |
Union Pacific Corp. | | 4,273,700 | | | 276,935,760 |
| | | | |
|
|
| | | | | | 501,758,762 |
| | | | |
|
|
| | | | | | 832,243,033 |
| INFORMATION TECHNOLOGY: 7.8% | | | | | |
| SEMICONDUCTORS & SEMICONDUCTOR EQUIPMENT: 0.3% |
Freescale Semiconductor, Inc. Class A(a) | | 2,300,400 | | | 48,331,404 |
Freescale Semiconductor, Inc. Class B(a) | | 469,693 | | | 9,948,098 |
| | | | |
|
|
| | | | | | 58,279,502 |
| SOFTWARE & SERVICES: 2.2% | | | | | |
BMC Software, Inc.(a) | | 4,525,100 | | | 81,225,545 |
Computer Sciences Corp.(a) | | 3,916,400 | | | 171,146,680 |
Compuware Corp.(a) | | 6,938,700 | | | 49,889,253 |
Electronic Data Systems Corp. | | 10,083,700 | | | 194,111,225 |
| | | | |
|
|
| | | | | | 496,372,703 |
| TECHNOLOGY, HARDWARE & EQUIPMENT: 5.3% | | | |
Avaya, Inc.(a) | | 9,488,250 | | | 78,942,240 |
Hewlett-Packard Co. | | 20,651,431 | | | 485,515,143 |
Hitachi Ltd. ADR(b) (Japan) | | 229,500 | | | 13,912,290 |
Motorola, Inc. | | 10,500,600 | | | 191,740,956 |
NCR Corp.(a) | | 2,231,850 | | | 78,382,572 |
Storage Technology Corp.(a) | | 2,742,500 | | | 99,525,325 |
Xerox Corp.(a) | | 18,304,050 | | | 252,412,849 |
| | | | |
|
|
| | | | | | 1,200,431,375 |
| | | | |
|
|
| | | | | | 1,755,083,580 |
| MATERIALS: 4.6% | | | | | |
Akzo Nobel N.V. ADR(b) (Netherlands) | | 5,364,217 | | | 210,760,086 |
Alcoa, Inc. | | 1,115,550 | | | 29,149,322 |
Bayer A.G. ADR(b) (Germany) | | 39,500 | | | 1,314,560 |
Dow Chemical Co. | | 5,528,659 | | | 246,191,185 |
Engelhard Corp. | | 2,354,500 | | | 67,220,975 |
International Paper Co. | | 2,372,900 | | | 71,685,309 |
Lubrizol Corp. | | 321,400 | | | 13,502,014 |
NOVA Chemicals Corp.(b) (Canada) | | 1,442,870 | | | 44,094,107 |
Rio Tinto PLC ADR(b) (United Kingdom) | | 1,455,600 | | | 177,466,752 |
Rohm and Haas Co. | | 2,102,800 | | | 97,443,752 |
Syngenta A.G. ADR(b) (Switzerland) | | 3,434,400 | | | 70,027,416 |
| | | | |
|
|
| | | | | | 1,028,855,478 |
| TELECOMMUNICATION SERVICES: 0.6% | | | |
AT&T Corp. | | 3,604,909 | | | 68,637,467 |
Vodafone Group PLC ADR(b)
(United Kingdom) | | 2,800,400 | | | 68,105,728 |
| | | | |
|
|
| | | | | | 136,743,195 |
| | | | | | |
| | |
| | | SHARES | | VALUE |
| UTILITIES: 1.8% | | | | | | |
American Electric Power Co., Inc. | | | 2,519,080 | | $ | 92,878,479 |
Duke Energy Corp. | | | 6,762,300 | | | 201,043,179 |
FirstEnergy Corp. | | | 1,300,100 | | | 62,547,811 |
Scottish Power PLC ADR(b)
(United Kingdom) | | | 1,357,600 | | | 48,330,560 |
| | | | | |
|
|
| | | | | | | 404,800,029 |
| | | | | |
|
|
TOTAL COMMON STOCKS (Cost $9,904,211,572) | | | 13,215,408,907 |
| | | | | |
|
|
| |
| FIXED-INCOME SECURITIES: 33.7% | | |
| | |
| | | PAR VALUE | | VALUE |
| U.S. TREASURY AND GOVERNMENT AGENCY: 12.5% |
| U.S. TREASURY: 11.7% | | | | | | |
U.S. Treasury Notes | | | | | | |
2.00%, 8/31/05 | | $ | 350,000,000 | | $ | 349,302,800 |
1.625%, 10/31/05 | | | 350,000,000 | | | 348,113,150 |
1.875%, 11/30/05 | | | 250,000,000 | | | 248,545,000 |
1.875%, 1/31/06 | | | 275,000,000 | | | 272,572,300 |
2.25%, 4/30/06 | | | 300,000,000 | | | 296,918,100 |
3.50%, 11/15/06 | | | 8,500,000 | | | 8,490,370 |
2.875%, 11/30/06 | | | 350,000,000 | | | 346,431,750 |
3.125%, 1/31/07 | | | 400,000,000 | | | 396,843,600 |
3.625%, 7/15/09 | | | 375,000,000 | | | 373,755,000 |
| | | | | |
|
|
| | | | | | | 2,640,972,070 |
| GOVERNMENT AGENCY: 0.8% | | | | | | |
Arkansas Dev. Fin. Auth. GNMA Guaranteed Bonds 9.75%, 11/15/14 | | | 4,935,000 | | | 5,781,501 |
Small Business Administration (504) | | | | | | |
Series 96-20L, 6.70%, 12/1/16 | | | 3,410,192 | | | 3,588,074 |
Series 97-20F, 7.20%, 6/1/17 | | | 5,447,769 | | | 5,796,788 |
Series 97-20I, 6.90%, 9/1/17 | | | 7,539,924 | | | 7,982,959 |
Series 98-20D, 6.15%, 4/1/18 | | | 9,112,971 | | | 9,545,672 |
Series 98-20I, 6.00%, 9/1/18 | | | 4,698,402 | | | 4,915,023 |
Series 99-20F, 6.80%, 6/1/19 | | | 6,482,981 | | | 6,958,682 |
Series 00-20D, 7.47%, 4/1/20 | | | 18,177,388 | | | 19,895,362 |
Series 00-20E, 8.03%, 5/1/20 | | | 7,500,749 | | | 8,366,466 |
Series 00-20G, 7.39%, 7/1/20 | | | 13,104,882 | | | 14,340,146 |
Series 00-20I, 7.21%, 9/1/20 | | | 7,439,945 | | | 8,145,157 |
Series 01-20G, 6.625%, 7/1/21 | | | 12,837,283 | | | 13,974,408 |
Series 03-20J, 4.92%, 10/1/23 | | | 24,185,739 | | | 24,690,751 |
Series 2008-20F, 4.57%, 6/1/25 | | | 48,351,001 | | | 48,357,518 |
| | | | | |
|
|
| | | | | | | 182,338,507 |
| | | | | |
|
|
| | | | | | | 2,823,310,577 |
| MORTGAGE-RELATED SECURITIES: 12.2% | | | |
| FEDERAL AGENCY CMO & REMIC: 1.9% | | | |
Dept. of Veterans Affairs | | | | | | |
Trust 1995 1A-1, 7.216%, 2/15/25 | | | 1,758,693 | | | 1,865,592 |
Trust 1995-2C 3A, 8.793%, 6/15/25 | | | 1,102,083 | | | 1,221,032 |
| | |
| See accompanying Notes to Financial Statements | | Dodge & Cox Balanced Fund / 6 |
Portfolio of Investments (unaudited) | June 30, 2005 |
| | | | | | |
| FIXED-INCOME SECURITIES (continued) | | |
| | |
| | | PAR VALUE | | VALUE |
Fannie Mae | | | | | | |
SMBS I-1, 6.50%, 4/1/09 | | $ | 90,463 | | $ | 92,084 |
SMBS L-1, 5.00%, 1/1/06 | | | 20,445 | | | 20,409 |
Trust (GN) 1994-13J, 7.00%, 6/17/22 | | | 2,443,514 | | | 2,477,555 |
Trust 1992-4H, 7.50%, 2/25/07 | | | 893,678 | | | 909,637 |
Trust 1993-207 G, 6.15%, 4/25/23 | | | 8,074,021 | | | 8,201,099 |
Trust 2001-69 OD, 5.50%, 11/25/13 | | | 515,629 | | | 514,501 |
Trust 2001-T7 A1, 7.50%, 2/25/41 | | | 9,036,695 | | | 9,622,024 |
Trust 2001-T8 A1, 7.50%, 7/25/41 | | | 9,869,446 | | | 10,427,442 |
Trust 2001-W3 A, 7.00%, 9/25/41 | | | 3,983,489 | | | 4,184,649 |
Trust 2002-33 A1, 7.00%, 6/25/32 | | | 9,113,441 | | | 9,600,435 |
Trust 2002-73 PM, 5.00%, 12/25/26 | | | 39,788,333 | | | 39,997,070 |
Trust 2002-W6 2A1, 7.00%, 6/25/42 | | | 9,282,418 | | | 9,812,651 |
Trust 2002-W8 A2, 7.00%, 6/25/42 | | | 10,163,193 | | | 10,745,825 |
Trust 2003-37 HA, 5.00%, 7/25/13 | | | 84,822,920 | | | 85,218,321 |
Trust 2003-W2 1A1, 6.50%, 7/25/42 | | | 19,853,319 | | | 20,829,962 |
Trust 2003-W2 1A2, 7.00%, 7/25/42 | | | 8,331,932 | | | 8,767,761 |
Trust 2003-W4 4A, 7.50%, 10/25/42 | | | 12,251,811 | | | 12,987,787 |
Trust 2004-W2 5A, 7.50%, 3/25/44 | | | 47,541,628 | | | 51,086,693 |
Freddie Mac | | | | | | |
Series (GN) 16 PK, 7.00%, 8/25/23 | | | 21,471,767 | | | 22,378,365 |
Series 1655 HB, 6.50%, 10/15/08 | | | 2,262,223 | | | 2,268,481 |
Series 2100 GS, 6.50%, 12/15/13 | | | 14,866,567 | | | 15,500,126 |
Series 2430 UC, 6.00%, 9/15/16 | | | 26,505,629 | | | 27,189,607 |
Series 2547 HA, 5.00%, 8/15/12 | | | 26,170,939 | | | 26,207,049 |
Series 2550 QP, 5.00%, 3/15/26 | | | 40,000,000 | | | 40,139,696 |
Series 1078 GZ, 6.50%, 5/15/21 | | | 1,885,123 | | | 1,944,386 |
Series 1236 H, 7.25%, 4/15/07 | | | 1,186,849 | | | 1,212,825 |
Series 1512 I, 6.50%, 5/15/08 | | | 2,877,878 | | | 2,931,334 |
Series 1539 PL, 6.50%, 5/15/08 | | | 1,908,984 | | | 1,932,949 |
| | | | | |
|
|
| | | | | | | 430,287,347 |
| FEDERAL AGENCY MORTGAGE PASS-THROUGH: 10.2% | | | |
Fannie Mae | | | | | | |
Pool 107047, 8.00%, 1/1/09 | | | 203,266 | | | 210,497 |
Pool 124668, 7.50%, 7/1/19 | | | 202,430 | | | 207,550 |
Pool 169231, 7.50%, 8/1/10 | | | 126,591 | | | 134,801 |
Pool 303787 15 Year, 6.50%, 3/1/11 | | | 1,462,948 | | | 1,523,098 |
Pool 313524 15 Year, 6.50%, 6/1/11 | | | 5,685,725 | | | 5,919,499 |
Pool 313958 15 Year, 6.50%, 1/1/13 | | | 3,690,232 | | | 3,841,855 |
Pool 323531 15 Year, 6.50%, 1/1/13 | | | 3,367,346 | | | 3,505,768 |
Pool 323623 15 Year, 6.00%, 3/1/14 | | | 7,359,666 | | | 7,615,864 |
Pool 362446 15 Year, 7.00%, 12/1/07 | | | 913,393 | | | 937,416 |
Pool 44047, 7.00%, 12/1/07 | | | 547,366 | | | 556,618 |
Pool 535493 15 Year, 7.50%, 9/1/15 | | | 4,908,954 | | | 5,198,226 |
Pool 535672 15 Year, 6.00%, 1/1/16 | | | 4,949,931 | | | 5,121,509 |
Pool 535691 15 Year, 7.50%, 1/1/16 | | | 3,673,747 | | | 3,890,232 |
Pool 535849 15 Year, 7.00%, 7/1/11 | | | 997,699 | | | 1,028,588 |
Pool 535863 15 Year, 6.00%, 3/1/16 | | | 5,925,605 | | | 6,131,003 |
Pool 545033 15 Year, 7.50%, 12/1/15 | | | 9,005,032 | | | 9,535,676 |
Pool 545058 15 Year, 6.50%, 8/1/11 | | | 3,753,663 | | | 3,907,999 |
Pool 545302 15 Year, 5.50%, 11/1/16 | | | 20,852,943 | | | 21,422,218 |
Pool 545343 15 Year, 7.50%, 12/1/16 | | | 5,669,071 | | | 6,003,135 |
Pool 545348 15 Year, 5.50%, 12/1/16 | | | 8,997,108 | | | 9,242,725 |
Pool 545469 15 Year, 6.50%, 8/1/15 | | | 2,861,939 | | | 2,980,601 |
Pool 545705 15 Year, 6.50%, 6/1/17 | | | 24,893,371 | | | 25,923,942 |
Pool 545833 15 Year, 6.00%, 7/1/17 | | | 25,738,695 | | | 26,620,632 |
Pool 545961 15 Year, 5.50%, 2/1/14 | | | 12,519,456 | | | 12,863,482 |
Pool 545977 15 Year, 5.50%, 8/1/15 | | | 12,719,919 | | | 13,069,454 |
Pool 555066 15 Year, 5.50%, 9/1/14 | | | 15,997,256 | | | 16,436,850 |
| | | | | | |
| | |
| | | PAR VALUE | | VALUE |
Fannie Mae (continued) | | | | | | |
Pool 555243 15 Year, 6.00%, 3/1/17 | | $ | 6,965,326 | | $ | 7,207,797 |
Pool 555364 15 Year, 6.00%, 3/1/18 | | | 11,288,224 | | | 11,675,352 |
Pool 555382 15 Year, 5.50%, 8/1/15 | | | 8,773,229 | | | 9,014,311 |
Pool 555439 15 Year, 6.00%, 3/1/18 | | | 10,507,478 | | | 10,867,830 |
Pool 555603 15 Year, 6.00%, 5/1/18 | | | 27,458,572 | | | 28,400,260 |
Pool 555803 20 Year, 6.50%, 1/1/22 | | | 15,071,667 | | | 15,598,071 |
Pool 555931 15 Year, 6.00%, 5/1/18 | | | 11,899,951 | | | 12,307,703 |
Pool 555961 15 Year, 6.00%, 3/1/18 | | | 9,727,571 | | | 10,060,887 |
Pool 563313,15 Year, 6.00%, 11/1/14 | | | 14,331,794 | | | 14,830,701 |
Pool 589416 15 Year, 6.00%, 7/1/16 | | | 5,898,319 | | | 6,100,425 |
Pool 629568 10 Year, 6.00%, 1/1/12 | | | 11,822,328 | | | 12,210,580 |
Pool 634364 10 Year, 6.00%, 3/1/12 | | | 11,450,531 | | | 11,828,958 |
Pool 638431 10 Year, 6.00%, 3/1/12 | | | 10,027,162 | | | 10,359,593 |
Pool 643517 10 Year, 6.00%, 4/1/12 | | | 9,510,731 | | | 9,827,031 |
Pool 70255, 7.50%, 9/1/07 | | | 345,535 | | | 353,531 |
Pool 725058 15 Year, 5.50%, 4/1/18 | | | 27,752,901 | | | 28,510,542 |
Pool 725073 15 Year, 5.50%, 6/1/18 | | | 30,600,650 | | | 31,436,033 |
Pool 725074 15 Year, 6.50%, 11/1/18 | | | 23,323,573 | | | 24,289,156 |
Pool 725135 15 Year, 6.00%, 5/1/18 | | | 15,738,055 | | | 16,277,320 |
Pool 725160 15 Year, 6.50%, 4/1/18 | | | 31,246,109 | | | 32,539,680 |
Pool 725172 15 Year, 6.00%, 12/1/17 | | | 22,537,115 | | | 23,315,896 |
Pool 725194 15 Year, 6.00%, 12/1/18 | | | 3,596,645 | | | 3,719,884 |
Pool 725224 15 Year, 6.50%, 3/1/16 | | | 10,089,107 | | | 10,503,931 |
Pool 725226 15 Year, 6.50%, 7/1/18 | | | 74,591,837 | | | 77,679,895 |
Pool 725240 15 Year, 6.00%, 3/1/18 | | | 12,905,174 | | | 13,347,370 |
Pool 725255 15 Year, 6.00%, 3/1/16 | | | 42,885,014 | | | 44,366,927 |
Pool 725273 15 Year, 6.00%, 12/1/15 | | | 58,650,239 | | | 60,676,928 |
Pool 725336 15 Year, 6.00%, 4/1/16 | | | 9,410,792 | | | 9,738,393 |
Pool 725343 15 Year, 6.50%, 12/1/14 | | | 22,360,183 | | | 23,278,911 |
Pool 725344 15 Year, 6.50%, 12/1/14 | | | 30,215,108 | | | 31,456,577 |
Pool 725354 15 Year, 6.50%, 10/1/18 | | | 21,353,752 | | | 22,239,130 |
Pool 725432 15 Year, 7.00%, 11/1/18 | | | 37,087,013 | | | 38,870,420 |
Pool 725513 15 Year, 6.00%, 12/1/18 | | | 69,621,062 | | | 72,044,654 |
Pool 725514 15 Year, 6.00%, 5/1/16 | | | 56,964,049 | | | 58,947,036 |
Pool 725518 15 Year, 7.50%, 8/1/17 | | | 81,975,912 | | | 86,788,408 |
Pool 725574 15 Year, 6.50%, 7/1/15 | | | 16,842,855 | | | 17,534,376 |
Pool 725679 15 Year, 6.00%, 6/1/17 | | | 21,167,060 | | | 21,902,774 |
Pool 725729 15 Year, 6.00%, 12/1/16 | | | 21,722,069 | | | 22,472,686 |
Pool 725790 15 Year, 6.00%, 11/1/17 | | | 17,671,840 | | | 18,287,017 |
Pool 725860 15 Year, 5.50%, 7/1/16 | | | 64,205,160 | | | 65,976,237 |
Pool 725862 15 Year, 6.00%, 8/1/17 | | | 14,466,514 | | | 14,966,411 |
Pool 725868 15 Year, 6.50%, 9/1/16 | | | 35,248,919 | | | 36,696,142 |
Pool 725952 15 Year, 6.00%, 12/1/13 | | | 50,200,990 | | | 51,935,711 |
Pool 725958 15 Year, 6.00%, 11/1/17 | | | 59,765,070 | | | 61,845,563 |
Pool 735005 10 Year, 6.00%, 10/1/14 | | | 12,656,030 | | | 13,169,332 |
Pool 735492 15 Year, 6.00%, 11/1/17 | | | 201,427,303 | | | 208,439,227 |
Pool 786844 15 Year, 6.50%, 9/1/16 | | | 17,726,059 | | | 18,459,707 |
Pool 735728 15 Year, 6.00%, 7/1/20 | | | 92,810,101 | | | 95,884,900 |
Fannie Mae Multifamily DUS | | | | | | |
Pool 323350, 5.614%, 11/1/08 | | | 3,157,217 | | | 3,261,555 |
Pool 323492, 6.038%, 1/1/09 | | | 7,764,060 | | | 8,128,366 |
Pool 380735, 5.965%, 10/1/08 | | | 20,714,545 | | | 21,574,043 |
Pool 381130, 5.57%, 1/1/06 | | | 5,890,189 | | | 5,883,621 |
Pool 545316, 5.636%, 12/1/11 | | | 5,266,888 | | | 5,605,582 |
Pool 545387, 5.836%, 1/1/12 | | | 10,922,459 | | | 11,743,156 |
Pool 545685, 6.017%, 4/1/12 | | | 30,824,604 | | | 33,332,333 |
| | |
| 7 / Dodge & Cox Balanced Fund | | See accompanying Notes to Financial Statements |
Portfolio of Investments (unaudited) | June 30, 2005 |
| | | | | | |
| FIXED-INCOME SECURITIES (continued) | | |
| | |
| | | PAR VALUE | | VALUE |
Freddie Mac | | | | | | |
Group 18-0468, 8.00%, 2/1/08 | | $ | 77,846 | | $ | 79,963 |
Group 25-3827, 7.50%, 2/1/08 | | | 814 | | | 815 |
Group 27-2784, 7.25%, 1/1/08 | | | 524 | | | 532 |
Group 30-9878, 8.75%, 5/1/10 | | | 64,745 | | | 67,848 |
Group 55-5062, 8.00%, 11/1/10 | | | 361,701 | | | 372,563 |
Group 55-5098, 8.25%, 2/1/17 | | | 34,307 | | | 35,228 |
Freddie Mac Gold | | | | | | |
Group (GN) G80063 15 Year,
7.75%, 7/25/21 | | | 1,932,830 | | | 2,066,283 |
Group (GN) G80126 15 Year,
7.47%, 3/17/23 | | | 667,225 | | | 711,285 |
Group D64097, 8.50%, 1/1/23 | | | 402,871 | | | 420,798 |
Group E00210 15 Year, 7.00%, 5/1/08 | | | 1,513,443 | | | 1,577,524 |
Group E00573 15 Year, 6.00%, 10/1/13 | | | 6,050,560 | | | 6,256,244 |
Group E00659 15 Year, 6.00%, 4/1/14 | | | 20,803,019 | | | 21,510,202 |
Group E61328 15 Year, 7.00%, 8/1/09 | | | 1,661,072 | | | 1,737,118 |
Group E78398 15 Year, 6.50%, 7/1/14 | | | 6,275,005 | | | 6,529,976 |
Group G10569 15 Year, 7.00%, 12/1/08 | | | 2,244,327 | | | 2,324,529 |
Group G11122 15 Year, 6.50%, 5/1/16 | | | 9,163,324 | | | 9,534,371 |
Group G11152 15 Year, 7.00%, 4/1/15 | | | 1,232,459 | | | 1,284,556 |
Group G11265 15 Year, 6.00%, 9/1/15 | | | 4,612,918 | | | 4,769,752 |
Group G11281 15 Year, 6.00%, 5/1/16 | | | 6,040,298 | | | 6,245,792 |
Group G11323 15 Year, 6.50%, 8/1/17 | | | 10,535,009 | | | 10,963,007 |
Group G11334 15 Year, 6.50%, 11/1/17 | | | 11,671,644 | | | 12,144,260 |
Group G11346 15 Year, 6.50%, 3/1/17 | | | 15,880,924 | | | 16,526,107 |
Group G11409 15 Year, 6.00%, 5/1/17 | | | 30,389,548 | | | 31,421,804 |
Group G11421 15 Year, 6.50%, 12/1/17 | | | 16,478,726 | | | 17,148,196 |
Group G11431 15 Year, 6.00%, 2/1/18 | | | 23,693,728 | | | 24,498,544 |
Group G11459 15 Year, 6.50%, 8/1/17 | | | 4,607,988 | | | 4,795,194 |
Group G11465 15 Year, 6.50%, 9/1/18 | | | 8,163,889 | | | 8,495,558 |
Group G11477 15 Year, 5.50%, 8/1/14 | | | 26,750,142 | | | 27,422,777 |
Group G11498 15 Year, 6.50%, 3/1/18 | | | 15,890,479 | | | 16,536,051 |
Group G11572 15 Year, 6.00%, 10/1/14 | | | 21,361,388 | | | 22,086,315 |
Group G11589 15 Year, 6.00%, 10/1/18 | | | 18,941,469 | | | 19,584,272 |
Group G11593 15 Year, 6.00%, 6/1/16 | | | 76,249,716 | | | 78,841,766 |
Group G11608 15 Year, 5.50%, 1/1/17 | | | 28,990,472 | | | 29,719,441 |
Group G11610 15 Year, 6.00%, 10/1/16 | | | 54,566,287 | | | 56,421,225 |
Group P60086 15 Year, 6.50%, 11/1/14 | | | 27,954,311 | | | 28,574,617 |
Ginnie Mae | | | | | | |
Pool 288558, 7.97%, 4/15/20 | | | 632,937 | | | 677,099 |
Pool 288564, 7.97%, 5/15/20 | | | 553,387 | | | 599,061 |
Pool 294442, 7.97%, 8/15/20 | | | 400,609 | | | 431,204 |
Pool 294443, 7.97%, 8/15/20 | | | 631,574 | | | 679,526 |
Pool 299080, 7.97%, 10/15/20 | | | 724,648 | | | 781,479 |
Pool 299084, 7.97%, 1/15/21 | | | 596,660 | | | 643,103 |
Pool 780729, 7.50%, 1/15/08 | | | 1,248,693 | | | 1,272,268 |
Pool 781321, 7.50%, 11/15/24 | | | 5,453,960 | | | 5,855,819 |
Pool 781322, 7.50%, 10/15/25 | | | 2,542,444 | | | 2,716,537 |
| | | | | |
|
|
| | | | | | | 2,295,958,707 |
| PRIVATE LABEL CMO & REMIC SECURITIES: 0.1% | | | |
Union Planters Mortgage Finance Corp. 7.70%, 12/25/24 | | | 6,868,696 | | | 7,204,821 |
| | | | | |
|
|
| | | | | | | 2,733,450,875 |
| | | | | | |
| | |
| | | PAR VALUE | | VALUE |
| CORPORATE: 9.0% | | | | | | |
| FINANCIALS: 1.7% | | | | | | |
BankAmerica Capital II(c) 8.00%, 12/15/26, Callable 2006 | | $ | 14,615,000 | | $ | 15,800,233 |
BankAmerica Capital Trust VI(c) 5.625%, 3/8/35 | | | 10,000,000 | | | 10,285,010 |
Boston Properties, Inc. | | | | | | |
6.25%, 1/15/13 | | | 44,290,000 | | | 48,257,720 |
5.625%, 4/15/15 | | | 29,500,000 | | | 30,976,622 |
Citicorp Capital Trust I(c) 7.933%, 2/15/27, Callable 2007 | | | 12,540,000 | | | 13,601,937 |
Citigroup, Inc. (First Nationwide) 10.00%, 10/1/06 | | | 4,945,000 | | | 5,283,999 |
EOP Operating Limited Partnership(e) | | | | | | |
8.10%, 8/1/10 | | | 10,000,000 | | | 11,523,700 |
7.00%, 7/15/11 | | | 25,340,000 | | | 28,098,690 |
6.75%, 2/15/12 | | | 19,933,000 | | | 21,942,187 |
5.875%, 1/15/13 | | | 31,215,000 | | | 32,882,724 |
4.75%, 3/15/14 | | | 15,000,000 | | | 14,706,075 |
JPMorgan Chase (Bank One) 6.50%, 2/1/06 | | | 12,275,000 | | | 12,462,734 |
JPMorgan Chase (Bank One) Capital III(c) 8.75%, 9/1/30 | | | 23,760,000 | | | 33,711,424 |
Safeco Corp. 7.25%, 9/1/12 | | | 13,672,000 | | | 15,791,926 |
St. Paul Travelers Companies, Inc. 8.125%, 4/15/10 | | | 19,885,000 | | | 22,965,087 |
UnumProvident Corp. | | | | | | |
7.19%, 2/1/28 | | | 6,000,000 | | | 5,596,320 |
6.75%, 12/15/28 | | | 21,495,000 | | | 20,315,849 |
7.625%, 3/1/11 | | | 21,150,000 | | | 22,728,636 |
7.375%, 6/15/32 | | | 4,795,000 | | | 4,820,442 |
UnumProvident Corp. (Provident Companies, Inc.) 7.25%, 3/15/28 | | | 7,520,000 | | | 7,445,409 |
| | | | | |
|
|
| | | | | | | 379,196,724 |
| INDUSTRIALS: 7.0% | | | | | | |
Amerada Hess Corp. | | | | | | |
6.65%, 8/15/11 | | | 2,010,000 | | | 2,211,846 |
7.875%, 10/1/29 | | | 26,780,000 | | | 33,836,610 |
AT&T Corp. | | | | | | |
9.05%, 11/15/11 | | | 27,972,000 | | | 32,237,730 |
9.75%, 11/15/31 | | | 97,500,000 | | | 126,871,875 |
CIGNA Corp. | | | | | | |
7.00%, 1/15/11 | | | 14,705,000 | | | 16,481,982 |
6.375%, 10/15/11 | | | 17,820,000 | | | 19,587,512 |
7.65%, 3/1/23 | | | 9,745,000 | | | 11,907,513 |
7.875%, 5/15/27 | | | 12,157,000 | | | 15,674,908 |
8.30%, 1/15/33 | | | 9,050,000 | | | 11,851,084 |
Comcast Corp. 5.30%, 1/15/14 | | | 58,050,000 | | | 59,675,864 |
Cox Communications, Inc. | | | | | | |
5.45%, 12/15/14 | | | 35,270,000 | | | 35,999,207 |
5.50%, 10/1/15 | | | 15,265,000 | | | 15,575,002 |
Dillard’s, Inc. | | | | | | |
7.375%, 6/1/06 | | | 25,275,000 | | | 25,843,688 |
7.13%, 8/1/18 | | | 3,500,000 | | | 3,412,500 |
Dow Chemical Co. | | | | | | |
4.027%, 9/30/09(d) | | | 24,425,000 | | | 23,981,857 |
6.00%, 10/1/12 | | | 5,800,000 | | | 6,355,884 |
7.375%, 11/1/29 | | | 30,170,000 | | | 38,965,189 |
Electronic Data Systems Corp. 6.50%, 8/1/13 | | | 40,160,000 | | | 41,056,652 |
| | |
| See accompanying Notes to Financial Statements | | Dodge & Cox Balanced Fund / 8 |
Portfolio of Investments (unaudited) | June 30, 2005 |
| | | | | | |
| FIXED-INCOME SECURITIES (continued) | | |
| | |
| | | PAR VALUE | | VALUE |
Ford Motor Credit Co. | | | | | | |
7.375%, 2/1/11 | | $ | 52,310,000 | | $ | 50,955,380 |
7.25%, 10/25/11 | | | 130,900,000 | | | 125,960,881 |
GMAC | | | | | | |
6.125%, 1/22/08 | | | 5,465,000 | | | 5,290,218 |
5.125%, 5/9/08 | | | 9,065,000 | | | 8,520,465 |
7.75%, 1/19/10 | | | 35,100,000 | | | 34,311,794 |
6.875%, 9/15/11 | | | 158,745,000 | | | 146,535,605 |
HCA, Inc. | | | | | | |
8.75%, 9/1/10 | | | 27,750,000 | | | 31,538,152 |
7.875%, 2/1/11 | | | 23,798,000 | | | 26,184,678 |
6.95%, 5/1/12 | | | 10,000,000 | | | 10,625,170 |
6.25%, 2/15/13 | | | 27,250,000 | | | 27,852,579 |
6.75%, 7/15/13 | | | 16,250,000 | | | 17,139,558 |
5.75%, 3/15/14 | | | 11,685,000 | | | 11,633,399 |
Health Net, Inc. 9.875%, 4/15/11 | | | 37,280,000 | | | 44,349,071 |
Hewlett-Packard Co. 5.50%, 7/1/07 | | | 21,210,000 | | | 21,734,099 |
International Paper Co. 5.25%, 4/1/16 | | | 24,500,000 | | | 24,319,460 |
Lockheed Martin Corp. | | | | | | |
7.65%, 5/1/16 | | | 18,500,000 | | | 22,992,984 |
7.75%, 5/1/26 | | | 8,500,000 | | | 11,194,466 |
May Department Stores Co. | | | | | | |
7.625%, 8/15/13 | | | 5,900,000 | | | 6,883,607 |
7.45%, 10/15/16 | | | 9,300,000 | | | 10,961,408 |
7.875%, 3/1/30 | | | 13,440,000 | | | 16,995,552 |
6.90%, 1/15/32 | | | 54,484,000 | | | 62,179,974 |
8.125%, 8/15/35, Callable 2015 | | | 12,825,000 | | | 15,046,559 |
7.875%, 8/15/36, Callable 2016 | | | 10,440,000 | | | 12,232,799 |
Raytheon Co. 6.75%, 8/15/07 | | | 20,476,000 | | | 21,480,921 |
Time Warner, Inc. (AOL Time Warner) | | | | | | |
7.625%, 4/15/31 | | | 86,000,000 | | | 107,404,454 |
7.70%, 5/1/32 | | | 33,575,000 | | | 42,473,147 |
Wyeth | | | | | | |
5.50%, 3/15/13 | | | 24,500,000 | | | 25,785,050 |
5.50%, 2/1/14 | | | 75,500,000 | | | 79,554,123 |
Wyeth (American Home Products) 6.95%, 3/15/11 | | | 7,950,000 | | | 8,884,689 |
Xerox Corp. 7.20%, 4/1/16 | | | 10,000,000 | | | 10,800,000 |
| | | | | |
|
|
| | | | | | | 1,563,347,145 |
| TRANSPORTATION: 0.3% | | | | | | |
Consolidated Rail Corp. 6.76%, 5/25/15, Callable 2005 | | | 4,437,291 | | | 4,750,387 |
CSX Transportation, Inc. 9.75%, 6/15/20 | | | 5,351,000 | | | 7,738,573 |
Fedex Corp. 6.72%, 1/15/22 | | | 5,852,358 | | | 6,679,413 |
Norfolk Southern Corp. 9.75%, 6/15/20 | | | 7,389,000 | | | 10,739,417 |
Union Pacific Corp. 6.33%, 1/2/20 | | | 39,301,227 | | | 43,171,612 |
| | | | | |
|
|
| | | | | | | 73,079,402 |
| | | | | |
|
|
| | | | | | | 2,015,623,271 |
| | | | | |
|
|
TOTAL FIXED-INCOME SECURITIES
(Cost $7,451,179,291) | | | 7,572,384,723 |
| | | | | |
|
|
| | | | | | | | |
| SHORT-TERM INVESTMENTS: 7.7% | | | | |
| | |
| | | PAR VALUE | | | VALUE | |
SSgA Prime Money Market Fund | | $ | 112,760,434 | | | $ | 112,760,434 | |
State Street Repurchase Agreement, 2.65%, 7/1/05, maturity value $563,748,495 (collateralized by U.S. Treasury Securities, value $574,981,515 2.50%-3.625%, 10/31/06-6/30/07) | | | 563,707,000 | | | | 563,707,000 | |
U.S. Treasury Bills | | | | | | | | |
7/7/05 | | | 100,000,000 | | | | 99,955,000 | |
8/4/05 | | | 275,000,000 | | | | 274,258,375 | |
8/18/05 | | | 200,000,000 | | | | 199,253,333 | |
9/1/05 | | | 125,000,000 | | | | 124,373,542 | |
9/8/05 | | | 200,000,000 | | | | 198,876,833 | |
9/15/05 | | | 175,000,000 | | | | 173,906,445 | |
| | | | | | |
|
|
|
TOTAL SHORT-TERM INVESTMENTS
(Cost $1,747,090,962) | | | | | | | 1,747,090,962 | |
| | | | | | |
|
|
|
TOTAL INVESTMENTS (Cost $19,102,481,825) | | | 100.2 | % | | | 22,534,884,592 | |
OTHER ASSETS LESS LIABILITIES | | | (0.2 | %) | | | (44,922,275 | ) |
| | |
|
|
| |
|
|
|
TOTAL NET ASSETS | | | 100.0 | % | | $ | 22,489,962,317 | |
| | |
|
|
| |
|
|
|
| (b) | | Foreign security denominated in U.S. dollars |
| (c) | | Cumulative preferred security |
| (d) | | Security exempt from registration under Rule 144A of the Securities Act of 1933. The security may be resold in transactions exempt from registration, normally to qualified institutional buyers. As of June 30, 2005, the security represented $23,981,857 or 0.1% of total net assets. |
| (e) | | EOP Operating LP is the operating partnership of Equity Office Properties Trust. |
When two issuers are identified, the first name refers to the acquirer or successor obligor, and the second name (within the parentheses) refers to the original issuer of the instrument.
CMO: Collateralized Mortgage Obligation
REMIC: Real Estate Mortgage Investment Conduit
| | |
| 9 / Dodge & Cox Balanced Fund | | See accompanying Notes to Financial Statements |
Statement of Assets and Liabilities (unaudited)
| | | | |
| |
| | | June 30, 2005 | |
| Assets: | | | | |
Investments, at value
(cost $19,102,481,825) | | $ | 22,534,884,592 | |
Receivable for investments sold | | | 19,419,588 | |
Receivable for paydowns on
mortgage-backed securities | | | 29,702 | |
Receivable for Fund shares sold | | | 55,777,794 | |
Dividends and interest receivable | | | 92,823,203 | |
Prepaid expenses and other assets | | | 41,223 | |
| | |
|
|
|
| | | | 22,702,976,102 | |
| | |
|
|
|
| Liabilities: | | | | |
Payable for investments purchased | | | 160,326,562 | |
Payable for Fund shares redeemed | | | 41,664,144 | |
Management fees payable | | | 9,237,477 | |
Accounts payable | | | 1,785,602 | |
| | |
|
|
|
| | | | 213,013,785 | |
| | |
|
|
|
| Net Assets | | $ | 22,489,962,317 | |
| | |
|
|
|
| Net Assets Consist of: | | | | |
Paid in capital | | $ | 18,958,847,761 | |
Undistributed net investment income | | | 14,719,910 | |
Undistributed net realized gain on investments | | | 83,991,879 | |
Net unrealized appreciation on investments | | | 3,432,402,767 | |
| | |
|
|
|
| | | $ | 22,489,962,317 | |
| | |
|
|
|
Fund shares outstanding (par value
$0.01 each, unlimited shares authorized) | | | 284,565,324 | |
Net asset value per share | | | $79.03 | |
|
| Statement of Operations (unaudited) | |
|
Six Months Ended
June 30, 2005 | |
| Investment Income: | | | | |
Dividends (net of foreign taxes of $2,708,184) | | $ | 119,515,356 | |
Interest | | | 173,356,256 | |
| | |
|
|
|
| | | | 292,871,612 | |
| | |
|
|
|
| Expenses: | | | | |
Management fees | | | 53,845,225 | |
Custody and fund accounting fees | | | 190,597 | |
Transfer agent fees | | | 2,528,222 | |
Professional services | | | 56,265 | |
Shareholder reports | | | 563,680 | |
Registration fees | | | 395,565 | |
Trustees’ fees | | | 58,126 | |
Miscellaneous | | | 83,901 | |
| | |
|
|
|
| | | | 57,721,581 | |
| | |
|
|
|
| Net Investment Income | | | 235,150,031 | |
| | |
|
|
|
Realized and Unrealized Gain (Loss) on Investments: | | | | |
Net realized gain | | | 103,764,644 | |
Net change in unrealized appreciation | | | (113,927,302 | ) |
| | |
|
|
|
Net realized and unrealized loss | | | (10,162,658 | ) |
| | |
|
|
|
| Net Increase in Net Assets from Operations | | $ | 224,987,373 | |
| | |
|
|
|
Statement of Changes in Net Assets (unaudited)
| | | | | | | | |
| | |
| | | Six Months Ended June 30, 2005 | | | Year Ended December 31, 2004 | |
| | | | | | | |
| Operations: | | | | | | | | |
Net investment income | | $ | 235,150,031 | | | $ | 335,315,614 | |
Net realized gain | | | 103,764,644 | | | | 481,678,527 | |
Net change in unrealized appreciation | | | (113,927,302 | ) | | | 1,431,190,315 | |
| | |
|
|
| |
|
|
|
Net increase in net assets from operations | | | 224,987,373 | | | | 2,248,184,456 | |
| | |
|
|
| |
|
|
|
| | |
Distributions to
Shareholders from: | | | | | | | | |
Net investment income | | | (242,910,785 | ) | | | (375,772,802 | ) |
Net realized gain | | | (57,902,358 | ) | | | (421,379,430 | ) |
| | |
|
|
| |
|
|
|
| Total distributions | | | (300,813,143 | ) | | | (797,152,232 | ) |
| | |
|
|
| |
|
|
|
| | |
| Fund Share Transactions: | | | | | | | | |
Proceeds from sale of shares | | | 2,691,506,295 | | | | 7,695,755,433 | |
Reinvestment of distributions | | | 288,104,611 | | | | 764,041,016 | |
Cost of shares redeemed | | | (1,154,469,143 | ) | | | (2,365,810,731 | ) |
| | |
|
|
| |
|
|
|
Net increase from Fund share transactions | | | 1,825,141,763 | | | | 6,093,985,718 | |
| | |
|
|
| |
|
|
|
Total increase in net assets | | | 1,749,315,993 | | | | 7,545,017,942 | |
| |
| Net Assets: | | | | | |
Beginning of period | | | 20,740,646,324 | | | | 13,195,628,382 | |
| | |
|
|
| |
|
|
|
End of period (including undistributed net investment income of $14,719,910 and $2,707,898 respectively) | | $ | 22,489,962,317 | | | $ | 20,740,646,324 | |
| | |
|
|
| |
|
|
|
| | |
| Share Information: | | | | | | | | |
Shares sold | | | 34,158,981 | | | | 102,173,318 | |
Distributions reinvested | | | 3,673,221 | | | | 9,851,544 | |
Shares redeemed | | | (14,652,608 | ) | | | (31,310,833 | ) |
| | |
|
|
| |
|
|
|
Net increase in shares outstanding | | | 23,179,594 | | | | 80,714,029 | |
| | |
|
|
| |
|
|
|
| | |
| See accompanying Notes to Financial Statements | | Dodge & Cox Balanced Fund / 10 |
Notes to Financial Statements (unaudited)
Note 1 — Organization and Significant Accounting Policies
Dodge & Cox Balanced Fund (the “Fund”) is one of the series constituting the Dodge & Cox Funds (the “Trust” or the “Funds”). The Trust is organized as a Delaware statutory trust and is registered under the Investment Company Act of 1940, as amended, as a diversified, open-end management investment company. The Fund commenced operations on June 26, 1931, and seeks regular income, conservation of principal and an opportunity for long-term growth of principal and income. Risk considerations and investment strategies of the Fund are discussed in the Fund’s Prospectus. The Fund is closed to new investors.
The financial statements have been prepared in conformity with accounting principles generally accepted in the United States of America, which require the use of estimates and assumptions by management. Significant accounting policies are as follows:
Security valuation. The Fund’s net assets are valued as of the close of trading on the New York Stock Exchange (the “NYSE”), generally 4:00 p.m. Eastern Time, each day that the NYSE is open for business. Stocks are valued at market, using as a price the official quoted close price or the last sale of the day at the close of the NYSE or, if not available, at the mean between the exchange-listed bid and ask prices for the day. A security that is listed or traded on more than one exchange is valued at the quotation on the exchange determined to be the primary market for such security. Fixed-income securities with original maturities of one year or more are priced on the basis of valuations furnished by pricing services which utilize both dealer-supplied valuations and electronic data processing techniques. Valuations of fixed-income securities take into account appropriate factors such as institutional-size trading markets in similar groups of securities, yield, quality, coupon rate, maturity, type of issue, trading characteristics and other market data and do not rely exclusively upon exchange or over-the-counter listed prices. Security values are not discounted based on the size of the Fund’s position. Securities for which market quotations are not readily available are valued at fair value as determined in good faith by or at the direction of the Board of Trustees. Short-term securities are valued at amortized cost which approximates current value. All securities held by the Fund are denominated in U.S. dollars.
Security transactions, investment income, expenses, and distributions. Security transactions are recorded on the trade date Realized gains and losses on securities sold are determined on the basis of identified cost.
Dividend income and corporate action transactions are recorded on the ex-dividend date, except for certain dividends or corporate actions from foreign securities where the ex-dividend date may have passed, which are recorded as soon as the Fund is informed of the ex-dividend date. Withholding taxes on foreign dividends have been provided for in accordance with the Fund’s understanding of the applicable country’s tax rules and rates. Non-cash dividends included in dividend income, if any, are recorded at the fair market value of the securities received. Distributions received in excess of income are recorded as a reduction of cost of investments and/or realized gain. The Fund may estimate the character of distributions received from Real Estate Investment Trusts (“REITs”). Interest income is recorded on the accrual basis.
Interest income includes coupon interest, amortization of premium and accretion of discount on debt securities, and paydown gains and losses. The ability of the issuers of the debt securities held by the Fund to meet their obligations may be affected by economic developments in a specific industry, state or region. Debt obligations may be placed on non-accrual status and related interest income may be reduced by ceasing current accruals and writing off interest receivables when the collection of all or a portion of interest has become doubtful based on consistently applied procedures. A debt obligation is removed from non-accrual status when the issuer resumes interest payments or when collectibility of interest is reasonably assured.
Expenses are recorded on the accrual basis. Most expenses of the Trust can be directly attributed to a specific series. Expenses which cannot be directly attributed are apportioned among the Funds in the Trust.
Distributions to shareholders are recorded on the ex-dividend date.
Repurchase agreements. The Fund may enter into repurchase agreements secured by U.S. government securities which involve the purchase of securities from a counterparty with a simultaneous commitment to resell the securities at an agreed-upon date and
| | |
| 11 / Dodge & Cox Balanced Fund | | |
Notes to Financial Statements (unaudited) (continued)
price. It is the Fund’s policy that its custodian take possession of the underlying collateral securities, the fair value of which exceeds the principal amount of the repurchase transaction, including accrued interest, at all times. In the event of default by the counterparty, the Fund has the contractual right to liquidate the securities and to apply the proceeds in satisfaction of the obligation.
Note 2 — Related Party Transactions
Management fees. Under a written agreement, the Fund pays an annual management fee of 0.50% of the Fund’s average daily net assets to Dodge & Cox, investment manager of the Fund.
Fund officers and trustees. All officers and three of the trustees of the Trust are officers or employees of Dodge & Cox. The Trust pays a fee only to those trustees who are not affiliated with Dodge & Cox.
Indemnifications. Under the Trust’s organizational documents, its officers and trustees are indemnified against certain liabilities arising out of the performance of their duties to the Trust. In addition, in the normal course of business the Trust enters into contracts that provide general indemnifications to other parties. The Trust’s maximum exposure under these arrangements is unknown as this would involve future claims that may be made against the Trust that have not yet occurred.
Note 3 — Income Tax Information and Distributions to Shareholders
A provision for federal income taxes is not required since the Fund intends to continue to qualify as a regulated investment company under Subchapter M of the Internal Revenue Code and distribute all of its taxable income to shareholders. Distributions are determined in accordance with income tax regulations, which may differ from net investment income and realized gains for financial reporting
purposes. Financial reporting records are adjusted for permanent book/tax differences to reflect tax character. Financial records are not adjusted for temporary differences.
Book/tax differences are primarily due to differing treatment of short-term realized gains and paydown losses. At June 30, 2005, the cost of investments for federal income tax purposes was equal to the cost for financial reporting purposes.
Distributions during the period ended June 30, 2005 were characterized as follows for federal income tax purposes:
| | | |
Ordinary income ($0.876 per share) | | $ | 244,528,051 |
Long-term capital gain ($0.204 per share) | | | 56,285,092 |
| | |
|
|
Total distributions ($1.080 per share) | | $ | 300,813,143 |
| | |
|
|
At June 30, 2005, the tax basis components of net assets were as follows:
| | |
| Unrealized appreciation | | $3,625,155,199 |
| Unrealized depreciation | | (192,752,432) |
| | |
|
| Net unrealized appreciation | | 3,432,402,767 |
| Undistributed ordinary income | | 19,862,674 |
| Undistributed long-term capital gain | | 78,849,115 |
| Paid-in capital | | 18,958,847,761 |
| | |
|
| Net assets | | $22,489,962,317 |
| | |
|
Note 4 — Purchase and Sales of Investments
For the period ended June 30, 2005, purchases and sales of securities, other than short-term securities and U.S. government securities, aggregated $2,008,072,893 and $1,039,627,275, respectively. For the period ended June 30, 2005, purchases and sales of U.S. government securities aggregated $2,341,894,478 and $1,449,497,973, respectively.
| | |
| | | Dodge & Cox Balanced Fund / 12 |
Financial Highlights (unaudited)
| | | | | | | | | | | | | | | | | | | | | | |
SELECTED DATA AND RATIOS
(for a share outstanding throughout each
period) | | | | Six Months
Ended June 30, | | | | | Year Ended December 31, | |
| | | | | 2005 | | | | | 2004 | | | 2003 | | | 2002 | | | 2001 | | | 2000 | |
Net asset value, beginning of period | | | | $79.35 | | | | | $73.04 | | | $60.75 | | | $65.42 | | | $63.42 | | | $65.71 | |
| | | | | | | | |
Income from investment operations: | | | | | | | | | | | | | | | | | | | | | | |
Net investment income | | | | 0.91 | | | | | 1.60 | | | 1.66 | | | 1.89 | | | 2.12 | | | 2.45 | |
Net realized and unrealized gain (loss) | | | | (0.15 | ) | | | | 7.99 | | | 12.96 | | | (3.80 | ) | | 4.07 | | | 6.95 | |
| | | | |
|
|
Total from investment operations | | | | 0.76 | | | | | 9.59 | | | 14.62 | | | (1.91 | ) | | 6.19 | | | 9.40 | |
| | | | |
|
|
Distributions to shareholders from: | | | | | | | | | | | | | | | | | | | | | | |
Net investment income | | | | (0.87 | ) | | | | (1.60 | ) | | (1.66 | ) | | (1.88 | ) | | (2.14 | ) | | (2.47 | ) |
Net realized gain | | | | (0.21 | ) | | | | (1.68 | ) | | (0.67 | ) | | (0.88 | ) | | (2.05 | ) | | (9.22 | ) |
| | | | |
|
|
Total distributions | | | | (1.08 | ) | | | | (3.28 | ) | | (2.33 | ) | | (2.76 | ) | | (4.19 | ) | | (11.69 | ) |
| | | | |
|
|
Net asset value, end of period | | | | $79.03 | | | | | $79.35 | | | $73.04 | | | $60.75 | | | $65.42 | | | $63.42 | |
| | | | |
|
|
Total return | | | | 0.97 | % | | | | 13.31 | % | | 24.44 | % | | (2.94 | )% | | 10.06 | % | | 15.13 | % |
Ratios/supplemental data: | | | | | | | | | | | | | | | | | | | | | | |
Net assets, end of period (millions) | | | | $22,490 | | | | | $20,741 | | | $13,196 | | | $7,885 | | | $6,040 | | | $4,909 | |
Ratio of expenses to average net assets | | | | 0.54 | %* | | | | 0.54 | % | | 0.54 | % | | 0.53 | % | | 0.53 | % | | 0.53 | % |
Ratio of net investment income to average net assets | | | | 2.18 | %* | | | | 1.97 | % | | 2.40 | % | | 3.05 | % | | 3.28 | % | | 3.70 | % |
Portfolio turnover rate | | | | 9 | % | | | | 18 | % | | 19 | % | | 25 | % | | 21 | % | | 23 | % |
| | |
| 13 / Dodge & Cox Balanced Fund | | |
Fund’s Holdings
The Funds provide a complete list of their holdings four times in each fiscal year, as of the end of each quarter. The lists appear in the Funds’ First Quarter, Semi-Annual, Third Quarter and Annual Reports to shareholders. The Funds file the lists with the Securities and Exchange Commission (SEC) on Form N-CSR (second and fourth quarters) and Form N-Q (first and third quarters). Shareholders may view the Funds’ Forms N-CSR and N-Q on the SEC’s website at www.sec.gov. Forms N-CSR and N-Q may also be reviewed and copied at the SEC’s Public Reference Room in Washington, DC. Information regarding the operations of the Public Reference Room may be obtained by calling 1-202-942-8090 (direct) or 1-800/SEC-0330 (general SEC number). A complete list of the Funds’ quarter-end holdings are also available at www.dodgeandcox.com on or about 15 days following each quarter-end and remains available on the web site until the list is updated for the subsequent quarter.
Proxy Voting
For a free copy of the Fund’s proxy voting policies and procedures, please call (800) 621-3979, visit www.dodgeandcox.com, or visit the Securities and Exchange Commission’s web site at www.sec.gov. Beginning August 31, 2005, information regarding how Dodge & Cox, on behalf of the Fund, voted proxies relating to the Fund’s portfolio securities for the most recent twelve-month period ending June 30 will be available at www.dodgeandcox.com or the SEC’s web site at www.sec.gov.
| | |
| | | Dodge & Cox Balanced Fund / 14 |
Officers and Trustees
Harry R. Hagey, Chairman & Trustee
Chairman & Chief Executive Officer, Dodge & Cox
John A. Gunn, President & Trustee
President, Dodge & Cox
Dana M. Emery, Vice President & Trustee
Senior Vice President, Dodge & Cox
William F. Ausfahl, Trustee
Former Chief Financial Officer and member of Board of Directors, The Clorox Company
L. Dale Crandall, Trustee
Former President, Kaiser Foundation Health Plan and Hospitals
Thomas A. Larsen, Trustee
Director, Howard, Rice, Nemerovski, Canady, Falk & Rabkin
Will C. Wood, Trustee
Principal, Kentwood Associates, Financial Advisers
A. Horton Shapiro, Executive Vice President
Senior Vice President, Dodge & Cox
Katherine Herrick Drake, Vice President
Vice President, Dodge & Cox
Kenneth E. Olivier, Vice President
Executive Vice President, Dodge & Cox
Diana S. Strandberg, Vice President
Vice President, Dodge & Cox
John M. Loll, Treasurer & Asst. Secretary
Vice President & Treasurer, Dodge & Cox
Thomas M. Mistele, Secretary & Asst. Treasurer
Chief Operating Officer, Secretary & General Counsel, Dodge & Cox
Marcia P. Venegas, Chief Compliance Officer
Chief Compliance Officer, Dodge & Cox

Income Fund
Established 1989

Semi-Annual Report
June 30, 2005
2005
Income Fund
www.dodgeandcox.com
For Fund literature, transactions and account
information, please visit the Funds’ web site.
or write or call:
Dodge & Cox Funds
c/o Boston Financial Data Services
P.O. Box 8422
Boston, Massachusetts 02266-8422
(800) 621-3979
Investment Manager
Dodge & Cox
555 California Street, 40th Floor
San Francisco, California 94104
(415) 981-1710
This report is submitted for the general information of the shareholders of the Fund. The report is not authorized for distribution to prospective investors in the Fund unless it is accompanied by a current prospectus.
This report reflects our views, opinions and portfolio holdings as of June 30, 2005, the end of the reporting period. Any such views are subject to change at any time based upon market or other conditions and Dodge & Cox disclaims any responsibility to update such views. These views may not be relied on as investment advice and, because investment decisions for a Dodge & Cox Fund are based on numerous factors, may not be relied on as an indication of trading intent on behalf of any Dodge & Cox Fund.

06/05 IF SAR  Printed on recycled paper
To Our Shareholders
For the first six months of 2005 the Dodge & Cox Income Fund’s total return was 1.7%, compared to 2.5% for the Lehman Brothers Aggregate Bond Index (LBAG). For the year ended June 30, 2005, the Fund’s total return was 5.6% compared to 6.8% for the LBAG. Longer-term results for the Fund can be found on page three. The Fund had net assets of $9.0 billion as of June 30th and a cash position of 4.7%.
Fund Performance Review
The Fund’s first half performance lagged that of the LBAG for two primary reasons: the Fund’s shorter duration¹ positioning (i.e., less sensitivity to changes in interest rates because of a high weighting in short and intermediate maturity securities) and the Fund’s holdings of Ford Motor Credit Company (FMCC) and General Motors Acceptance Corporation (GMAC). The shorter-than-LBAG duration positioning (3.3 years versus 4.3 years for the LBAG at the beginning of the year) detracted from relative returns in light of the strong performance of long-term bonds during the period. For instance, 10-year Treasury yields declined by 30 basis points (1 basis point = 1/100 of 1%) and 30-year Treasury yields declined by 64 basis points (bps). As bond prices move in the opposite direction of interest rates, the Fund experienced less price appreciation than the LBAG. In addition, the Fund’s holdings of FMCC and GMAC (which together comprised 4.2% of the Fund at the beginning of the year) performed poorly: the Fund’s 2011 maturity bonds from these issuers returned -6.9% and -6.6%, respectively.
Thoughts on the Fund’s Defensive Duration Position
We have positioned the Fund “defensively” (i.e., with less exposure to the negative price effects of a potential rise in rates) for some time in response to historically low nominal and real (inflation-adjusted) interest rates. Over this timeframe, the 10-year U.S. Treasury yield has risen from 3.1% to 4.8%, before falling back to 3.9%. Given the Fund’s positioning, you might think that we are trying to forecast interest rates, the history and practice of which is fraught with error. On the contrary, our strategy is not based on guesswork regarding the near-term direction of interest rates, but rather on the poor risk-return profile of long maturity bonds in the current environment.
In our view, long-term bond yields offer too little margin of safety for the risks assumed. We believe the Fund’s defensive position is appropriate in the face of the low longer-term return prospects of long bonds (and potentially negative returns over shorter time periods). These limited prospects arise from a combination of low current income levels and the potential for significant price declines if rates rise from these levels. For example, if interest rates were to rise by one percentage point (100 basis points), a 10-year Treasury (currently yielding around 3.9%) would experience a price decline of 7 1/2%. If rates were to rise by 200 bps to a yield close to 6% (a level that is not difficult to imagine, given the current economic environment), the bond’s price would decline by 14 1/2%!
When the Federal Reserve started its “measured pace” tightening in June 2004 (incrementally raising the Federal Funds target rate from 1% to its current 3.25% level), we expected longer-term interest rates (10 years and longer) to follow suit. However, to our (and Fed Chairman
Greenspan’s) surprise, longer term rates have actually declined—atypical for a Fed tightening cycle. Even with a backdrop of rising inflation, the 10-year U.S. Treasury yield has fallen by 67 bps to 3.9% and the 30-year has fallen by 110 bps to 4.2% over the past year.
We believe that this “conundrum,” as Mr. Greenspan has aptly named the situation, is a reflection of his credibility—that is, the market’s confidence in the ability of the Federal Reserve to achieve a “soft landing” (reasonable growth with contained inflation). Furthermore, the bond market has experienced predominantly declining interest and inflation rates over much of the past two decades and appears to be incorporating this experience into current market valuations. For example, as inflation has increased over the past couple of years (accompanied by solid economic growth, lower unemployment, greater resource utilization, and rising commodity prices—all harbingers of rising rates in past cycles), the market has paradoxically responded by maintaining long (30-year) rates at historically low levels. The result is that, collectively, market participants appear to be satisfied with a historically low inflation risk premium for long-term interest rates. Ten year “real” interest rates—what a bond investor would earn after accounting for the effect of inflation on purchasing power—hover around 2% (assuming current inflation rates). This potentially risky situation has left us wondering if the bond market “vigilantes” of the past are all on vacation!
On the theory that they are not all on vacation, we have considered the many other explanations for this “conundrum.” Many fall in the “supply/demand” camp—e.g., long rates will stay low due to insatiable demand for long-term debt by foreign central banks and U.S. pension funds and low supply. Others fall into the macroeconomic camp—e.g., rising short term interest rates and a flatter yield curve (the 40 bps difference between short and long-maturity yields is at its narrowest since 2000) will significantly slow the economy and dampen inflation, keeping a lid on long interest rates.
Regarding the former argument: technical “supply and demand” theories of investing are often invoked to rationalize market levels in periods when valuations seem to stray far from investing fundamentals. For example, the “insatiable demand of the baby boomer generation for equity investments to fund their approaching retirements”—oft cited to support the stretched valuations of the late ‘90s stock market bubble—stands as a telling recent example. While many of these types of arguments have a certain intuitive appeal, we believe they are generally unreliable forecasting tools as fundamentals prevail over the long-term. For example, we believe that the significant foreign purchases of U.S. Treasury debt in recent years, one “demand” reason quoted to explain low long-term rates, will not continue indefinitely; eventually, developing countries with large current account surpluses will invest in their own infrastructures and diversify reserves into securities and currencies of other countries.
Regarding the latter (macroeconomic) argument: despite the flatter yield curve, we believe that interest rates in the 3% to 4% range are still too low to significantly slow the economy. In addition, given the strong liquidity position of corporate America, business spending and hiring seem likely to increase, raising incomes and consumer purchasing power. In short,
| | |
| 1 / Dodge & Cox Income Fund | | |
the current condition of the U.S. economy is unlikely to exert tremendous downward pressure on inflation. A few other items give us cause for concern on the inflation front: 1) record large trade and current account deficits which put pressure on the U.S. dollar and import prices; 2) the recent rise in unit labor costs and slowing growth of productivity from previous lofty levels; and 3) the disconnect between rapidly escalating home prices and the lagging “cost of shelter” component within CPI. Given the apparent expectations for lower inflation built into bond yields, the possibility of a negative surprise on the inflation front clearly exists.
While we don’t know how long it will take for this “conundrum” to be resolved, we do know that the reduced yield differential between short-maturity and long-maturity bonds makes the foregone income associated with the Fund’s shorter duration positioning less costly than it once was. In fact, the Fund now enjoys a slight nominal yield advantage over the LBAG for the first time since we significantly shortened the Fund’s duration a year and a half ago.
Morningstar® Address
In June, I, Harry Hagey, in my capacity as Chairman and CEO of Dodge & Cox, was invited to speak at Morningstar’s Investment Conference. I thought it would be helpful to share an excerpt of that speech with all of our shareholders:
So, how did the small, local firm founded in the 1930s, which I joined in the late 1960s, become the firm we are today? What I would like to do now is to summarize for you what I think are the key components that make Dodge & Cox a successful money management firm.
First and Most Important—Our Current Clients
We are in the business of providing continuous high-quality investment management service to our existing clients. We decided a long time ago that we are not in business to provide a series of financial products to the investment market place. Another way to look at this is that we are in the investment business and not in the money gathering business. We do not advertise, we do not have a marketing department and no one at our firm is paid commissions or compensated directly for bringing in new business. We concluded that if we did a good job, the word would get around. We have relatively low expense ratios with no 12b-1 or other fees. In general, our firm’s investment objective is to first preserve and then enhance the future purchasing power of our clients’ wealth over the long-term². Please note that I did not say to beat a particular benchmark or to have low tracking error. If we believe that a significant part of the market is unattractive, we will not be in it. Finally, ethical considerations are paramount—we work hard to maintain our reputation.
Second—Our Employees
With regard to our own people, we insist on respect for each individual employee as well as for the entire firm. We work within a collegial and team-work environment with the goal of having everyone at the firm think as owners, not just as employees. Dodge & Cox has a long history, but it is still a small firm and its vitality is maintained by diplomatic entrepreneurship.
We also want all of our employees to share in the firm’s success. Our compensation structure provides salary and bonus for each member of our firm. The bonus is based on how well the firm has done and an employee’s contribution over time. We avoid any quantitative measurement of our research analysts’ performance because we make decisions as a group—we don’t believe in a “star system” or the reliance on any one individual. We try to create an environment where our analysts will not overly worry about making bad recommendations, and will be rewarded for sharing information with their peers.
Importantly, our independence, culture and compensation structure have led to low employee turnover which, in our opinion, is crucial to maintaining a consistent investment approach in difficult investment environments.
Third—Dodge & Cox
With regard to the firm, probably the most important characteristic is our independence. We require that shareholders of the firm be active employees. The firm is held widely with about one-third of employees being shareholders. We also believe it is important to have control of the investment service to our clients so we have no joint ventures. The only planning that we do is to make sure that we have assets in place, most important being people, so that we can continue to do a good job for our existing clients.
For Dodge & Cox, issues of ethics, independence, a focused teamwork investment approach, respect for the individual, and an absence of a marketing mindset are all key determinants in what makes us who we are.
One of my individual clients recently sent me a book by James P. Owen, called Cowboy Ethics—What Wall Street Can Learn from the Code of the West. The pictures in the book are fantastic and I also believe that the book has real wisdom. In the book Mr. Owen summarized the Code with ten rules. The ones that resonated with me most are: 1) Take Pride in Your Work, 2) Ride for the Brand, 3) Remember That Some Things Aren’t for Sale, and 4) Know Where to Draw the Line.
I think Dodge & Cox as a firm has lived by this Code.
In Closing
Thank you for your continued confidence in the Dodge & Cox Income Fund. As always, we welcome your comments and questions.
For the Board of Trustees,
| | |

Harry R. Hagey, Chairman | | 
Dana M. Emery, Vice President |
August 3, 2005
| 1 | | Duration is a measure of price sensitivity to changes in interest rates. |
| 2 | | Please refer to the Fund’s prospectus for its investment objectives, policies and restrictions. |
| | |
| | | Dodge & Cox Income Fund / 2 |
Ten Years of Investment Performance | |
through June 30, 2005 (in thousands)
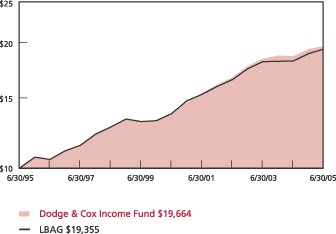
Average annual total return for periods ended June 30, 2005
| | | | | | | | | |
| | | 1 Year | | | 5 Years | | | 10 Years | |
| Dodge & Cox Income Fund | | 5.63 | % | | 7.86 | % | | 6.99 | % |
Lehman Brothers
Aggregate Bond Index (LBAG) | | 6.81 | | | 7.41 | | | 6.83 | |
Past performance does not guarantee future results. Investment return and share price will fluctuate with market conditions, and investors may have a gain or loss when shares are sold. Mutual fund performance changes over time and currently may be significantly lower than stated above. Performance is updated and published monthly. Visit the Fund’s web site at www.dodgeandcox.com or call 800-621-3979 for current performance figures.
The Fund’s total returns include the reinvestment of dividend and capital gain distributions, but have not been adjusted for any income taxes payable by shareholders on these distributions. The Lehman Brothers Aggregate Bond Index is an unmanaged index of investment-grade fixed-income securities. Index returns include dividends and/or interest income and, unlike Fund returns, do not reflect fees or expenses.
Lehman Brothers® is a trademark of Lehman Brothers, Inc.
Fund Expenses
As a Fund shareholder, you incur ongoing costs, which include costs for portfolio management, administrative services, and shareholder reports (like this one). Operating expenses, which are deducted from a Fund’s gross income, directly reduce the investment return of the Fund. The following example is intended to help you understand the ongoing costs (in dollars) of investing in the Fund and to compare these costs with those of other mutual funds. The example is based on an investment of $1,000 made at the beginning of the most recent six-month period and held for the entire period.
The table below illustrates the Fund’s costs in two ways:
Actual Fund Expenses
The first line of the table below provides information about actual account values and actual expenses. You may use the information in this line, together with your account balance, to estimate the expenses that you paid on your account over the period. Simply divide your account value by $1,000 (for example, an $8,600 account value divided by $1,000 = 8.6), then multiply the result by the number under the heading “Expenses Paid During Period”.
Hypothetical Example for Comparison
Information on the second line of the table can help you compare ongoing costs of investing in the Fund with those of other mutual funds. This information may not be used to estimate the actual ending account balance or expenses you paid during the period. The hypothetical “Ending Account Value” is based on the actual expense ratio of the Fund and an assumed 5% annual rate of return before expenses (not the Fund’s actual return). The amount under the heading “Expense Paid During the Period” shows the hypothetical expense your account would have incurred under this scenario. You can compare this figure with the 5% hypothetical examples that appear in shareholder reports of other funds.
| | | | | | |
Six Months Ended
June 30, 2005 | | Beginning Account
Value 1/1/05 | | Ending Account
Value 6/30/05 | | Expenses Paid
During Period* |
| Based on Actual Fund Return | | $1,000.00 | | $1,016.60 | | $2.20 |
| Based on Hypothetical 5% Yearly Return | | 1,000.00 | | 1,022.81 | | 2.21 |
| * | | Expenses are equal to the Fund’s annualized expense ratio of 0.44%, multiplied by the average account value over the period, multiplied by 181/365 (to reflect the one-half year period). |
The expenses shown in the table highlight ongoing costs only and do not reflect any transactional costs or account maintenance fees. While other mutual funds may charge such fees, please note that the Fund does not charge transaction fees (e.g., redemption fees, sales loads) or universal account maintenance fees (e.g., small account fees).
| | |
| 3 / Dodge & Cox Income Fund | | |
Fund Information | June 30, 2005 |
General Information
| | |
Net Asset Value Per Share | | $12.79 |
Total Net Assets (millions) | | $8,967 |
30-Day SEC Yield1 | | 4.26% |
2004 Expense Ratio | | 0.44% |
2004 Portfolio Turnover | | 30% |
Fund Inception | | 1989 |
|
| Investment Manager: Dodge & Cox, San Francisco. Managed by the Fixed-Income Strategy Committee, whose nine members’ average tenure at Dodge & Cox is 15 years, and by the Investment Policy Committee, whose twelve members’ (for fixed income decisions) average tenure at Dodge & Cox is 21 years. |
Asset Allocation
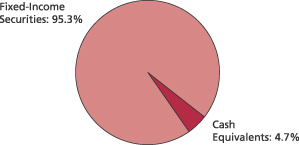
| | | | |
| Fixed-Income Characteristics | | Fund | | LBAG |
Number of Fixed-Income Securities | | 287 | | 5,979 |
Average Quality | | AA+ | | AA+ |
Average Maturity (years) | | 5.0 | | 6.8 |
Effective Duration (years) | | 3.2 | | 4.2 |
| | |
| Five Largest Corporate Issuers3 | | % of Fund |
GMAC | | 2.5 |
Ford Motor Credit | | 2.3 |
AT&T | | 2.1 |
Time Warner, Inc. | | 1.9 |
Xerox | | 1.9 |
| | | | | | |
| Credit Quality Diversification4 | | Fund | | | LBAG | |
U.S. Government & Government Agencies | | 66.3 | % | | 71.0 | % |
Aaa/AAA | | 0.5 | | | 6.8 | |
Aa/AA | | 0.1 | | | 4.8 | |
A/A | | 2.5 | | | 9.0 | |
Baa/BBB | | 11.6 | | | 8.4 | |
Ba/BB | | 13.5 | | | 0.0 | |
B/B and below | | 0.8 | | | 0.0 | |
Cash Equivalents | | 4.7 | | | 0.0 | |
| | | | | | |
| Sector Diversification | | Fund | | | LBAG | |
U.S. Treasury & Government Agency | | 34.8 | % | | 36.6 | % |
Mortgage-Related Securities | | 31.8 | | | 34.4 | |
Asset-Backed Securities/CMBS2 | | 0.1 | | | 4.7 | |
Corporate | | 28.6 | | | 20.1 | |
Non-Corporate Yankee | | 0.0 | | | 4.2 | |
Cash Equivalents | | 4.7 | | | 0.0 | |
| | | | | | |
| Maturity Diversification | | Fund | | | LBAG | |
0-1 Years to Maturity | | 19.8 | % | | 0.0 | % |
1-5 | | 52.8 | | | 50.7 | |
5-10 | | 17.8 | | | 36.3 | |
10-15 | | 1.4 | | | 3.4 | |
15-20 | | 0.2 | | | 2.9 | |
20-25 | | 3.2 | | | 3.7 | |
25 and Over | | 4.8 | | | 3.0 | |
| 1 | | SEC Yield is an annualization of the Fund’s total net investment income per share for the 30-day period ended on the last day of the month. |
| 2 | | CMBS refers to commercial mortgage-backed securities, which are a component of the LBAG but not held by the Fund. |
| 3 | | The Fund’s portfolio holdings are subject to change without notice. The mention of specific securities is not a recommendation or solicitation for any person to buy, sell or hold any particular security. |
| 4 | | For presentation purposes only: when a security is split-rated, the lower of either the Moody’s or Standard & Poor’s rating is reported. |
| | |
| | | Dodge & Cox Income Fund / 4 |
Portfolio of Investments (unaudited) | June 30, 2005 |
| | | | | | |
| FIXED-INCOME SECURITIES: 95.3% | | |
| | |
| | | PAR VALUE | | VALUE |
| U.S. TREASURY AND GOVERNMENT AGENCY: 34.8% |
| U.S. TREASURY: 32.9% | | | | | | |
U.S. Treasury Notes | | | | | | |
2.00%, 8/31/05 | | $ | 75,000,000 | | $ | 74,850,600 |
1.875%, 1/31/06 | | | 425,000,000 | | | 421,248,100 |
1.625%, 2/28/06 | | | 350,000,000 | | | 345,857,400 |
4.625%, 5/15/06 | | | 450,000,000 | | | 454,218,750 |
6.625%, 5/15/07 | | | 465,000,000 | | | 489,884,940 |
3.00%, 11/15/07 | | | 475,000,000 | | | 468,097,775 |
3.25%, 1/15/09 | | | 400,000,000 | | | 394,296,800 |
3.625%, 7/15/09 | | | 300,000,000 | | | 299,004,000 |
| | | | | |
|
|
| | | | | | | 2,947,458,365 |
| GOVERNMENT AGENCY: 1.9% | | | | | | |
Small Business Administration (504) | | | | | | |
Series 91-20K, 8.25%, 11/1/11 | | | 786,232 | | | 832,441 |
Series 92-20B, 8.10%, 2/1/12 | | | 661,818 | | | 697,312 |
Series 92-20C, 8.20%, 3/1/12 | | | 1,396,645 | | | 1,475,372 |
Series 92-20D, 8.20%, 4/1/12 | | | 797,087 | | | 843,372 |
Series 92-20G, 7.60%, 7/1/12 | | | 2,002,111 | | | 2,098,314 |
Series 92-20H, 7.40%, 8/1/12 | | | 1,038,406 | | | 1,087,330 |
Series 92-20I, 7.05%, 9/1/12 | | | 1,405,353 | | | 1,467,228 |
Series 92-20J, 7.00%, 10/1/12 | | | 1,991,595 | | | 2,080,228 |
Series 92-20K, 7.55%, 11/1/12 | | | 2,298,625 | | | 2,420,552 |
Series 92-20L, 7.45%, 12/1/12 | | | 1,105,896 | | | 1,164,555 |
Series 93-20B, 7.00%, 2/1/13 | | | 1,437,489 | | | 1,499,809 |
Series 93-20C, 6.50%, 3/1/13 | | | 4,697,912 | | | 4,874,580 |
Series 93-20D, 6.75%, 4/1/13 | | | 1,719,337 | | | 1,791,677 |
Series 93-20E, 6.55%, 5/1/13 | | | 5,098,882 | | | 5,303,280 |
Series 93-20F, 6.65%, 6/1/13 | | | 2,246,637 | | | 2,342,124 |
Series 93-20L, 6.30%, 12/1/13 | | | 3,408,820 | | | 3,537,577 |
Series 94-20L, 6.50%, 1/1/14 | | | 3,982,464 | | | 4,131,948 |
Series 94-20D, 7.70%, 4/1/14 | | | 1,231,092 | | | 1,304,409 |
Series 94-20E, 7.75%, 5/1/14 | | | 3,174,541 | | | 3,362,251 |
Series 94-20F, 7.60%, 6/1/14 | | | 2,011,251 | | | 2,128,768 |
Series 94-20G, 8.00%, 7/1/14 | | | 1,349,135 | | | 1,426,409 |
Series 94-20H, 7.95%, 8/1/14 | | | 1,629,792 | | | 1,724,754 |
Series 94-20I, 7.85%, 9/1/14 | | | 2,085,050 | | | 2,207,155 |
Series 94-20K, 8.65%, 11/1/14 | | | 1,307,051 | | | 1,400,857 |
Series 94-20L, 8.40%, 12/1/14 | | | 1,504,960 | | | 1,610,908 |
Series 95-20A, 8.50%, 1/1/15 | | | 769,297 | | | 818,346 |
Series 95-20C, 8.10%, 3/1/15 | | | 1,344,197 | | | 1,428,423 |
Series 97-20E, 7.30%, 5/1/17 | | | 2,237,015 | | | 2,381,375 |
Series 97-20J, 6.55%, 10/1/17 | | | 3,017,665 | | | 3,177,170 |
Series 98-20C, 6.35%, 3/1/18 | | | 12,041,784 | | | 12,659,363 |
Series 98-20H, 6.15%, 8/1/18 | | | 4,217,056 | | | 4,424,262 |
Series 98-20L, 5.80%, 12/1/18 | | | 2,359,780 | | | 2,460,618 |
Series 99-20C, 6.30%, 3/1/19 | | | 2,965,237 | | | 3,134,222 |
Series 99-20G, 7.00%, 7/1/19 | | | 7,559,786 | | | 8,141,883 |
Series 99-20I, 7.30%, 9/1/19 | | | 2,489,720 | | | 2,707,146 |
Series 01-20G, 6.625%, 7/1/21 | | | 15,124,038 | | | 16,463,723 |
Series 02-20L, 5.10%, 12/1/22 | | | 8,508,730 | | | 8,752,224 |
Series 04-20L, 4.87%, 12/1/24 | | | 9,003,430 | | | 9,158,383 |
Series 05-20B, 4.625%, 2/1/25 | | | 12,000,000 | | | 12,050,830 |
| | | | | | |
| | |
| | | PAR VALUE | | VALUE |
Small Business Administration (continued) | | | | | | |
Series 05-20C, 4.95%, 3/1/25 | | $ | 8,000,000 | | $ | 8,167,186 |
Series 05-20E, 4.84%, 5/1/25 | | | 22,999,999 | | | 23,342,304 |
| | | | | |
|
|
| | | | | | | 172,080,668 |
| | | | | |
|
|
| | | | | | | 3,119,539,033 |
| MORTGAGE-RELATED SECURITIES: 31.8% | | | |
| FEDERAL AGENCY CMO & REMIC: 6.2% | | | |
Dept. of Veterans Affairs | | | | | | |
Trust 1995-2D-4A, 9.293%, 5/15/25 | | | 688,153 | | | 748,048 |
Trust 1997-2Z, 7.50%, 6/15/27 | | | 41,765,830 | | | 45,323,593 |
Trust 1998-1 1A, 8.148%, 10/15/27 | | | 1,890,909 | | | 2,028,027 |
Fannie Mae | | | | | | |
Trust 1994-28 H, 6.25%, 3/25/23 | | | 1,729,734 | | | 1,736,297 |
Trust 1994-72 J, 6.00%, 6/25/23 | | | 9,000,000 | | | 9,203,124 |
Trust 1998-58 PC, 6.50%, 10/25/28 | | | 28,272,778 | | | 29,656,123 |
Trust 1998-58 PX, 6.50%, 9/25/28 | | | 5,064,133 | | | 5,311,722 |
Trust 2001-79 BA, 7.00%, 3/25/45 | | | 4,699,625 | | | 4,950,776 |
Trust 2001-T10 A1, 7.00%, 12/25/41 | | | 14,437,992 | | | 15,241,073 |
Trust 2001-T4 A1, 7.50%, 7/25/41 | | | 8,382,909 | | | 9,015,370 |
Trust 2002-33 A1, 7.00%, 6/25/32 | | | 9,902,038 | | | 10,431,173 |
Trust 2002-47 QC, 5.50%, 11/25/14 | | | 11,298,025 | | | 11,318,791 |
Trust 2002-90 A1, 6.50%, 6/25/42 | | | 19,123,654 | | | 19,972,425 |
Trust 2002-W6 2A1, 7.00%, 6/25/42 | | | 16,384,211 | | | 17,320,113 |
Trust 2002-W8 A2, 7.00%, 6/25/42 | | | 8,172,843 | | | 8,641,373 |
Trust 2003-07 A1, 6.50%, 12/25/42 | | | 23,059,370 | | | 24,217,460 |
Trust 2003-W1 1A1, 6.50%, 12/25/42 | | | 33,028,482 | | | 34,372,216 |
Trust 2003-W1 2A, 7.50%, 12/25/42 | | | 14,901,511 | | | 15,910,600 |
Trust 2003-W2 1A2, 7.00%, 7/25/42 | | | 53,860,254 | | | 56,677,587 |
Trust 2003-W4 3A, 7.00%, 10/25/42 | | | 15,928,814 | | | 16,822,277 |
Trust 2004-W2 5A, 7.50%, 3/25/44 | | | 75,170,422 | | | 80,775,700 |
Trust 2004-W8 3A, 7.50%, 6/25/44 | | | 39,107,446 | | | 41,757,398 |
Trust 2005-W1 1A3, 7.00%, 10/25/44 | | | 39,068,809 | | | 41,249,665 |
Freddie Mac | | | | | | |
Series (GN) 37 I, 6.00%, 6/17/22 | | | 7,095,361 | | | 7,154,624 |
Series 1565 G, 6.00%, 8/15/08 | | | 3,965,377 | | | 4,042,498 |
Series 1601 PJ, 6.00%, 10/15/08 | | | 18,488,840 | | | 18,856,276 |
Series 2374 QG, 6.00%, 2/15/30 | | | 7,669,685 | | | 7,715,175 |
Series 2394 MB, 6.00%, 1/15/15 | | | 1,537,458 | | | 1,535,300 |
Series T-48 1A, 7.108%, 7/25/33 | | | 14,638,386 | | | 15,423,040 |
Ginnie Mae | | | | | | |
Series 1999-29PB, 7.25%, 7/16/28 | | | 7,672,425 | | | 7,929,270 |
| | | | | |
|
|
| | | | | | | 565,337,114 |
| FEDERAL AGENCY MORTGAGE PASS-THROUGH: 25.3% | | | |
Fannie Mae | | | | | | |
Pool 151777, 8.00%, 1/1/12 | | | 257,607 | | | 267,965 |
Pool 254307 15 Year, 6.00%, 5/1/17 | | | 6,200,137 | | | 6,412,769 |
Pool 260892, 8.00%, 8/1/22 | | | 136,627 | | | 141,936 |
Pool 313839 15 Year, 6.50%, 11/1/12 | | | 2,991,421 | | | 3,084,585 |
Pool 323099 15 Year, 6.00%, 4/1/13 | | | 4,221,886 | | | 4,368,855 |
Pool 323623 15 Year, 6.00%, 3/1/14 | | | 5,168,485 | | | 5,348,406 |
Pool 323787 15 Year, 6.00%, 6/1/14 | | | 4,085,000 | | | 4,226,597 |
Pool 340181 15 Year, 7.00%, 12/1/10 | | | 1,893,025 | | | 1,978,568 |
Pool 353892 15 Year, 8.00%, 8/1/10 | | | 131,723 | | | 135,907 |
| | |
| 5 / Dodge & Cox Income Fund | | See accompanying Notes to Financial Statements |
Portfolio of Investments (unaudited) | June 30, 2005 |
| | | | | | |
| FIXED-INCOME SECURITIES: (continued) | | |
| | |
| | | PAR VALUE | | VALUE |
Fannie Mae (continued) | | | | | | |
Pool 362447 15 Year, 7.00%, 7/1/08 | | $ | 784,406 | | $ | 808,677 |
Pool 535170 15 Year, 5.50%, 9/1/14 | | | 38,533,379 | | | 39,592,251 |
Pool 535829 15 Year, 7.50%, 11/1/14 | | | 1,412,214 | | | 1,474,406 |
Pool 535867 15 Year, 7.00%, 12/1/11 | | | 1,163,425 | | | 1,218,440 |
Pool 545404 15 Year, 6.00%, 1/1/17 | | | 24,044,831 | | | 24,868,728 |
Pool 545415 15 Year, 6.00%, 1/1/17 | | | 19,034,547 | | | 19,686,766 |
Pool 545723, 7.00%, 4/1/32 | | | 6,923,790 | | | 7,303,438 |
Pool 545774 15 Year, 6.50%, 7/1/17 | | | 26,641,202 | | | 27,746,330 |
Pool 545833 15 Year, 6.00%, 7/1/17 | | | 42,756,399 | | | 44,221,448 |
Pool 545900 15 Year, 5.50%, 7/1/17 | | | 15,234,278 | | | 15,650,167 |
Pool 545977 15 Year, 5.50%, 8/1/15 | | | 13,147,375 | | | 13,508,656 |
Pool 555066 15 Year, 5.50%, 9/1/14 | | | 17,450,682 | | | 17,930,215 |
Pool 555143 15 Year, 6.00%, 11/1/17 | | | 24,674,347 | | | 25,519,814 |
Pool 555155 15 Year, 6.00%, 1/1/18 | | | 6,982,427 | | | 7,221,680 |
Pool 555341 15 Year, 6.00%, 2/1/18 | | | 28,270,584 | | | 29,240,120 |
Pool 555382 15 Year, 5.50%, 8/1/15 | | | 7,123,862 | | | 7,319,621 |
Pool 555439 15 Year, 6.00%, 3/1/18 | | | 17,121,877 | | | 17,709,069 |
Pool 555932 15 Year, 6.00%, 4/1/18 | | | 23,462,036 | | | 24,265,641 |
Pool 589416 15 Year, 6.00%, 7/1/16 | | | 8,759,574 | | | 9,059,721 |
Pool 70255, 7.50%, 9/1/07 | | | 391,306 | | | 400,361 |
Pool 725049 15 Year, 5.50%, 2/1/18 | | | 28,715,746 | | | 29,499,672 |
Pool 725074 15 Year, 6.50%, 11/1/18 | | | 23,327,336 | | | 24,293,075 |
Pool 725197 15 Year, 6.50%, 1/1/18 | | | 36,561,188 | | | 38,074,800 |
Pool 725240 15 Year, 6.00%, 3/1/18 | | | 28,530,667 | | | 29,508,271 |
Pool 725255 15 Year, 6.00%, 3/1/16 | | | 42,175,629 | | | 43,633,029 |
Pool 725271 15 Year, 6.00%, 2/1/19 | | | 99,226,863 | | | 102,626,872 |
Pool 725272 15 Year, 6.00%, 1/1/19 | | | 43,213,108 | | | 44,693,805 |
Pool 725273 15 Year, 6.00%, 12/1/15 | | | 26,467,942 | | | 27,382,555 |
Pool 725417 15 Year, 6.50%, 4/1/18 | | | 89,875,302 | | | 93,596,087 |
Pool 725511 15 Year, 6.50%, 6/1/18 | | | 62,185,013 | | | 64,759,436 |
Pool 725512 15 Year, 6.50%, 3/1/17 | | | 26,725,370 | | | 27,831,784 |
Pool 725513 15 Year, 6.00%, 12/1/18 | | | 19,495,668 | | | 20,174,335 |
Pool 725518 15 Year, 7.50%, 8/1/17 | | | 35,785,100 | | | 37,885,908 |
Pool 725582 20 Year, 6.50%, 5/1/22 | | | 11,577,690 | | | 11,941,210 |
Pool 725678 15 Year, 6.00%, 2/1/19 | | | 44,718,330 | | | 46,250,604 |
Pool 725680 15 Year, 6.50%, 7/1/17 | | | 42,194,212 | | | 43,941,028 |
Pool 725767 15 Year, 6.00%, 7/1/19 | | | 36,765,828 | | | 38,025,610 |
Pool 725810 15 Year, 6.00%, 8/1/19 | | | 29,358,832 | | | 30,364,813 |
Pool 725879 15 Year, 6.00%, 8/1/19 | | | 49,508,568 | | | 51,204,300 |
Pool 735067 15 Year, 6.00%, 1/1/19 | | | 43,303,633 | | | 44,787,433 |
Pool 735070 20 Year, 6.50%, 10/1/24 | | | 42,113,892 | | | 43,768,851 |
Pool 735369 20 Year, 6.50%, 4/1/19 | | | 52,131,214 | | | 54,271,343 |
Pool 735481 15 Year, 6.00%, 8/1/18 | | | 10,033,949 | | | 10,378,062 |
Pool 735482 15 Year, 6.00%, 2/1/19 | | | 14,362,149 | | | 14,854,268 |
Pool 735492 15 Year, 6.00%, 11/1/17 | | | 94,935,819 | | | 98,240,648 |
Pool 735523 15 Year, 6.00%, 12/1/19 | | | 97,744,465 | | | 101,093,680 |
Pool 735593 15 Year, 6.00%, 8/1/19 | | | 27,004,680 | | | 27,929,996 |
Pool 789278 15 Year, 6.50%, 6/1/17 | | | 19,405,424 | | | 20,202,748 |
Fannie Mae Multifamily DUS | | | | | | |
Pool 160329, 7.15%, 10/1/15 | | | 5,799,255 | | | 6,557,175 |
Pool 323822, 6.512%, 7/1/09 | | | 7,889,586 | | | 8,430,772 |
Pool 545059, 6.227%, 5/1/11 | | | 39,752,199 | | | 43,160,161 |
Pool 545209, 6.124%, 10/1/11 | | | 43,865,752 | | | 47,570,512 |
Pool 545685, 6.017%, 4/1/12 | | | 29,363,141 | | | 31,751,972 |
| | | | | | |
| | |
| | | PAR VALUE | | VALUE |
Fannie Mae Multifamily DUS (continued) | | | | | | |
Pool 555191, 4.828%, 2/1/13 | | $ | 25,231,605 | | $ | 25,903,673 |
Freddie Mac | | | | | | |
Group 18-8028, 8.00%, 1/1/08 | | | 23,821 | | | 24,558 |
Group 26-0671, 8.25%, 5/1/09 | | | 1,000 | | | 1,015 |
Group 27-2784, 7.25%, 1/1/08 | | | 679 | | | 689 |
Group 29-0537, 8.00%, 5/1/09 | | | 27,812 | | | 28,292 |
Group 29-2668, 8.00%, 8/1/09 | | | 21,801 | | | 22,123 |
Group 53-0142, 7.50%, 10/1/08 | | | 10,722 | | | 10,968 |
Freddie Mac Gold | | | | | | |
Group (GN) G80061, 7.90%, 2/17/21 | | | 4,037,321 | | | 4,332,618 |
Group C90457 20 Year, 6.50%, 7/1/21 | | | 4,731,565 | | | 4,920,675 |
Group C90544 20 Year, 6.50%, 4/1/22 | | | 3,408,916 | | | 3,543,122 |
Group E00543 15 Year, 6.00%, 4/1/13 | | | 1,970,246 | | | 2,037,223 |
Group E00549 15 Year, 6.00%, 5/1/13 | | | 1,260,374 | | | 1,303,219 |
Group E00592 15 Year, 6.00%, 12/1/13 | | | 12,945,588 | | | 13,385,663 |
Group E00593 15 Year, 5.50%, 11/1/13 | | | 28,670,199 | | | 29,452,910 |
Group E00659 15 Year, 6.00%, 4/1/14 | | | 7,015,646 | | | 7,254,137 |
Group E01007 15 Year, 6.00%, 8/1/16 | | | 17,894,959 | | | 18,502,806 |
Group E01127 15 Year, 6.50%, 2/1/17 | | | 4,753,184 | | | 4,946,289 |
Group E01138 15 Year, 6.50%, 3/1/17 | | | 5,195,233 | | | 5,406,779 |
Group E78398 15 Year, 6.50%, 7/1/14 | | | 10,495,988 | | | 10,922,469 |
Group E81526 15 Year, 6.50%, 11/1/14 | | | 1,494,428 | | | 1,555,150 |
Group E85740 15 Year, 5.50%, 10/1/16 | | | 7,951,273 | | | 8,165,567 |
Group G01635, 7.00%, 4/1/31 | | | 38,479,974 | | | 40,653,799 |
Group G10139 15 Year, 7.00%, 11/1/08 | | | 298,888 | | | 308,469 |
Group G10446 15 Year, 6.50%, 2/1/11 | | | 1,162,639 | | | 1,209,313 |
Group G10692 15 Year, 6.50%, 6/1/12 | | | 2,385,204 | | | 2,481,078 |
Group G11029 15 Year, 6.50%, 4/1/12 | | | 2,634,699 | | | 2,740,470 |
Group G11068 15 Year, 7.00%, 12/1/11 | | | 2,042,346 | | | 2,138,769 |
Group G11090 15 Year, 6.00%, 2/1/15 | | | 5,225,977 | | | 5,403,630 |
Group G11115 15 Year, 7.00%, 3/1/12 | | | 985,899 | | | 1,032,445 |
Group G11122 15 Year, 6.50%, 5/1/16 | | | 20,073,420 | | | 20,886,246 |
Group G11185 15 Year, 5.50%, 10/1/16 | | | 10,527,933 | | | 10,811,670 |
Group G11191 15 Year, 6.00%, 12/1/13 | | | 2,210,013 | | | 2,285,013 |
Group G11283 15 Year, 6.50%, 5/1/17 | | | 15,035,132 | | | 15,645,954 |
Group G11287 15 Year, 6.00%, 8/1/17 | | | 35,889,097 | | | 37,110,953 |
Group G11288 15 Year, 6.50%, 6/1/17 | | | 20,814,742 | | | 21,660,368 |
Group G11336 15 Year, 6.00%, 6/1/17 | | | 8,601,117 | | | 8,893,945 |
Group G11375 15 Year, 5.50%, 7/1/14 | | | 17,529,133 | | | 18,007,687 |
Group G11392 15 Year, 6.00%, 1/1/18 | | | 20,824,516 | | | 21,533,493 |
Group G11409 15 Year, 6.00%, 5/1/17 | | | 37,472,807 | | | 38,745,663 |
Group G11421 15 Year, 6.50%, 12/1/17 | | | 5,380,171 | | | 5,598,747 |
Group G11430 15 Year, 6.50%, 12/1/17 | | | 30,771,358 | | | 32,021,484 |
Group G11431 15 Year, 6.00%, 2/1/18 | | | 9,342,956 | | | 9,660,312 |
Group G11459 15 Year, 6.50%, 8/1/17 | | | 8,604,545 | | | 8,954,116 |
Group G11493 15 Year, 6.50%, 9/1/18 | | | 12,689,218 | | | 13,206,682 |
Group G11521 15 Year, 6.00%, 12/1/17 | | | 35,343,626 | | | 36,544,159 |
Group G11601 15 Year, 6.00%, 2/1/19 | | | 24,479,637 | | | 25,310,466 |
Ginnie Mae | | | | | | |
Pool 289199, 7.80%, 6/15/20 | | | 258,615 | | | 278,949 |
Pool 289202, 7.80%, 7/15/20 | | | 266,929 | | | 287,886 |
Pool 289205, 7.80%, 7/15/20 | | | 244,515 | | | 260,250 |
Pool 296207, 7.80%, 8/15/20 | | | 730,418 | | | 787,820 |
Pool 296211, 7.80%, 9/15/20 | | | 358,031 | | | 386,024 |
| | |
| See accompanying Notes to Financial Statements | | Dodge & Cox Income Fund / 6 |
Portfolio of Investments (unaudited) | June 30, 2005 |
| | | | | | |
| FIXED-INCOME SECURITIES (continued) |
| | |
| | | PAR VALUE | | VALUE |
Ginnie Mae (continued) | | | | | | |
Pool 296214, 7.80%, 10/15/20 | | $ | 273,075 | | $ | 290,910 |
Pool 303672, 7.80%, 11/15/20 | | | 309,858 | | | 334,059 |
Pool 303676, 7.80%, 1/15/21 | | | 792,520 | | | 849,132 |
Pool 307695, 7.80%, 1/15/21 | | | 442,785 | | | 477,386 |
Pool 780139, 7.50%, 5/15/25 | | | 4,289,568 | | | 4,583,491 |
Pool 780337, 7.25%, 2/15/06 | | | 10,358 | | | 10,372 |
Pool 780490 15 Year, 7.00%, 4/15/09 | | | 1,453,254 | | | 1,499,205 |
Pool 780710, 7.50%, 9/15/17 | | | 888,091 | | | 952,053 |
Pool 781321, 7.50%, 11/15/24 | | | 6,817,450 | | | 7,319,774 |
Pool 781454, 7.00%, 5/15/28 | | | 3,497,213 | | | 3,720,231 |
| | | | | |
|
|
| | | | | | | 2,265,998,370 |
| PRIVATE LABEL CMO & REMIC SECURITIES: 0.3% | | | |
GSMPS Mortgage Loan Trust, Series 2004-4 1A4 8.50%, 6/25/34(b) | | | 22,081,560 | | | 23,863,239 |
| | | | | |
|
|
| | | | | | | 2,855,198,723 |
| ASSET-BACKED SECURITIES: 0.1% | | |
CA Infrastructure and Econ. Dev. Bank Special Purpose Trust PGE-1 Rate Reduction Ctf. 1997-1 A-7 6.42%, 9/25/08 | | | 6,313,947 | | | 6,422,504 |
CA Infrastructure and Econ. Dev. Bank Special Purpose Trust SCE-1 Rate Reduction Ctf. 1997-1 A-6 6.38%, 9/25/08 | | | 5,334,742 | | | 5,430,440 |
| | | | | |
|
|
| | | | | | | 11,852,944 |
| CORPORATE: 28.6% | | | | | | |
| FINANCIALS: 5.2% | | | | | | |
BankAmerica Capital II(a) 8.00%, 12/15/26, Callable 2006 | | | 7,640,000 | | | 8,259,581 |
BankAmerica Capital Trust VI(a) 5.625%, 3/8/35 | | | 21,450,000 | | | 22,061,347 |
Boston Properties, Inc. | | | | | | |
6.25%, 1/15/13 | | | 50,036,000 | | | 54,518,475 |
5.625%, 4/15/15 | | | 34,195,000 | | | 35,906,631 |
Citicorp Capital Trust I(a)
7.933%, 2/15/27, Callable 2007 | | | 6,375,000 | | | 6,914,861 |
Citicorp Capital Trust II(a)
8.015%, 2/15/27 | | | 10,300,000 | | | 11,188,972 |
Citigroup, Inc. (First Nationwide)
10.00%, 10/1/06 | | | 4,065,000 | | | 4,343,672 |
EOP Operating Limited Partnership(c) | | | | | | |
6.80%, 1/15/09 | | | 17,240,000 | | | 18,477,315 |
7.00%, 7/15/11 | | | 20,463,000 | | | 22,690,745 |
5.875%, 1/15/13 | | | 37,700,000 | | | 39,714,198 |
4.75%, 3/15/14 | | | 46,900,000 | | | 45,980,995 |
JPMorgan Chase (Bank One)
7.625%, 8/1/05 | | | 12,905,000 | | | 12,943,483 |
JPMorgan Chase (Bank One) Capital III(a) 8.75%, 9/1/30 | | | 19,130,000 | | | 27,142,237 |
| | | | | | |
| | |
| | | PAR VALUE | | VALUE |
Safeco Corp. | | | | | | |
7.25%, 9/1/12 | | $ | 17,873,000 | | $ | 20,644,316 |
4.875%, 2/1/10 | | | 15,115,000 | | | 15,364,125 |
St. Paul Travelers Companies, Inc.
8.125%, 4/15/10 | | | 21,425,000 | | | 24,743,625 |
UnumProvident Corp. | | | | | | |
7.19%, 2/1/28 | | | 9,060,000 | | | 8,450,443 |
7.625%, 3/1/11 | | | 40,405,000 | | | 43,420,829 |
7.375%, 6/15/32 | | | 25,470,000 | | | 25,605,144 |
UnumProvident Corp. (Provident Companies, Inc.) 7.25%, 3/15/28 | | | 15,370,000 | | | 15,217,545 |
| | | | | |
|
|
| | | | | | | 463,588,539 |
| INDUSTRIALS: 22.5% | | | | | | |
Amerada Hess Corp. | | | | | | |
6.65%, 8/15/11 | | | 1,850,000 | | | 2,035,779 |
7.875%, 10/1/29 | | | 30,120,000 | | | 38,056,710 |
AT&T Corp. | | | | | | |
9.05%, 11/15/11 | | | 37,705,000 | | | 43,455,012 |
9.75%, 11/15/31 | | | 113,325,000 | | | 147,464,156 |
CIGNA Corp. | | | | | | |
7.00%, 1/15/11 | | | 13,565,000 | | | 15,204,222 |
6.375%, 10/15/11 | | | 28,650,000 | | | 31,491,708 |
7.65%, 3/1/23 | | | 1,140,000 | | | 1,392,977 |
7.875%, 5/15/27 | | | 27,615,000 | | | 35,606,035 |
Comcast Corp. 5.30%, 1/15/14 | | | 66,930,000 | | | 68,804,575 |
Cox Communications, Inc.
5.45%, 12/15/14 | | | 57,715,000 | | | 58,908,258 |
Dillard’s, Inc. | | | | | | |
7.375%, 6/1/06 | | | 4,875,000 | | | 4,984,688 |
6.625%, 11/15/08 | | | 3,335,000 | | | 3,368,350 |
7.13%, 8/1/18 | | | 21,715,000 | | | 21,172,125 |
7.75%, 7/15/26 | | | 19,600,000 | | | 19,257,000 |
7.75%, 5/15/27 | | | 11,423,000 | | | 11,223,098 |
7.00%, 12/1/28 | | | 8,425,000 | | | 7,793,125 |
Dow Chemical Co. | | | | | | |
4.027%, 9/30/09(b) | | | 37,862,000 | | | 37,175,070 |
7.375%, 11/1/29 | | | 10,400,000 | | | 13,431,818 |
Electronic Data Systems Corp.
6.50%, 8/1/13 | | | 50,815,000 | | | 51,949,546 |
Ford Motor Credit Co. | | | | | | |
5.80%, 1/12/09 | | | 30,250,000 | | | 28,716,204 |
7.375%, 10/28/09 | | | 10,100,000 | | | 9,869,589 |
7.375%, 2/1/11 | | | 19,465,000 | | | 18,960,934 |
7.25%, 10/25/11 | | | 152,995,000 | | | 147,222,193 |
General Electric Co. 5.00%, 2/1/13 | | | 9,155,000 | | | 9,452,629 |
GMAC | | | | | | |
6.125%, 1/22/08 | | | 4,510,000 | | | 4,365,761 |
5.125%, 5/9/08 | | | 2,030,000 | | | 1,908,058 |
7.75%, 1/19/10 | | | 27,875,000 | | | 27,249,039 |
6.875%, 9/15/11 | | | 204,090,000 | | | 188,393,030 |
| | |
| 7 / Dodge & Cox Income Fund | | See accompanying Notes to Financial Statements |
Portfolio of Investments (unaudited) | June 30, 2005 |
| | | | | | |
| FIXED-INCOME SECURITIES (continued) |
| | |
| | | PAR VALUE | | VALUE |
HCA, Inc. | | | | | | |
8.75%, 9/1/10 | | $ | 54,595,000 | | $ | 62,047,763 |
7.875%, 2/1/11 | | | 33,675,000 | | | 37,052,232 |
6.25%, 2/15/13 | | | 24,895,000 | | | 25,445,503 |
6.75%, 7/15/13 | | | 15,025,000 | | | 15,847,499 |
5.75%, 3/15/14 | | | 28,675,000 | | | 28,548,371 |
Health Net, Inc. 9.875%, 4/15/11 | | | 55,368,000 | | | 65,866,936 |
Hewlett-Packard Co. 5.50%, 7/1/07 | | | 35,945,000 | | | 36,833,201 |
International Paper Co.
5.25%, 4/1/16 | | | 26,725,000 | | | 26,528,063 |
Lockheed Martin Corp.
7.65%, 5/1/16 | | | 15,025,000 | | | 18,674,032 |
May Department Stores Co. | | | | | | |
7.625%, 8/15/13 | | | 7,105,000 | | | 8,289,496 |
7.60%, 6/1/25 | | | 13,500,000 | | | 16,043,076 |
6.70%, 9/15/28 | | | 17,350,000 | | | 19,178,534 |
8.75%, 5/15/29 | | | 31,677,000 | | | 43,007,008 |
7.875%, 3/1/30 | | | 35,505,000 | | | 44,897,848 |
6.90%, 1/15/32 | | | 25,465,000 | | | 29,061,982 |
7.875%, 8/15/36, Callable 2016 | | | 7,825,000 | | | 9,168,740 |
Raytheon Co.
6.75%, 8/15/07 | | | 6,756,000 | | | 7,087,571 |
6.15%, 11/1/08 | | | 3,024,000 | | | 3,190,870 |
6.55%, 3/15/10 | | | 10,150,000 | | | 10,989,963 |
Time Warner, Inc.
(AOL Time Warner) | | | | | | |
7.625%, 4/15/31 | | | 79,305,000 | | | 99,043,142 |
7.70%, 5/1/32 | | | 58,790,000 | | | 74,370,702 |
Wyeth | | | | | | |
5.50%, 3/15/13 | | | 10,070,000 | | | 10,598,182 |
5.50%, 2/1/14 | | | 87,215,000 | | | 91,898,184 |
Wyeth (American Home Products)
6.95%, 3/15/11 | | | 8,155,000 | | | 9,113,792 |
Xerox Corp. | | | | | | |
9.75%, 1/15/09 | | | 44,100,000 | | | 50,108,625 |
7.125%, 6/15/10 | | | 72,640,000 | | | 77,270,800 |
6.875%, 8/15/11 | | | 25,150,000 | | | 26,659,000 |
7.20%, 4/1/16 | | | 17,346,000 | | | 18,733,680 |
| | | | | |
|
|
| | | | | | | 2,014,466,484 |
| TRANSPORTATION: 0.9% | | | | | | |
Burlington Northern Santa Fe Railway 7.57%, 1/2/21 | | | 12,590,628 | | | 15,017,346 |
CSX Transportation, Inc. 9.75%, 6/15/20 | | | 10,072,000 | | | 14,566,046 |
Fedex Corp. 6.72%, 1/15/22 | | | 8,360,511 | | | 9,542,019 |
Norfolk Southern Corp. 9.75%, 6/15/20 | | | 13,908,000 | | | 20,214,346 |
Union Pacific Corp. | | | | | | |
6.70%, 2/23/19 | | | 13,675,253 | | | 15,212,077 |
6.85%, 1/2/19 | | | 6,224,335 | | | 7,030,262 |
| | | | | |
|
|
| | | | | | | 81,582,096 |
| | | | | |
|
|
| | | | | | | 2,559,637,119 |
| | | | | |
|
|
TOTAL FIXED-INCOME SECURITIES
(Cost $8,394,141,912) | | | 8,546,227,819 |
| | | | | |
|
|
| | | | | | | |
| SHORT-TERM INVESTMENTS: 4.6% | | | | | |
| | |
| | | PAR VALUE | | | VALUE |
SSgA Prime Money Market Fund | | $ | 44,688,589 | | | $ | 44,688,589 |
State Street Repurchase Agreement,
2.65%, 7/1/05, maturity value $243,613,931 (collateralized by U.S. Treasury Securities, value $248,471,013 3.625%-8.875%, 5/15/13-8/15/17) | | | 243,596,000 | | | | 243,596,000 |
U.S. Treasury Bills, 9/15/05 | | | 125,000,000 | | | | 124,226,806 |
| | | | | | |
|
|
TOTAL SHORT-TERM INVESTMENTS
(Cost $412,511,395) | | | | | | | 412,511,395 |
| | | | | | |
|
|
TOTAL INVESTMENTS
(Cost $8,806,653,307) | | | 99.9 | % | | | 8,958,739,214 |
OTHER ASSETS LESS LIABILITIES | | | 0.1 | % | | | 8,400,350 |
| | |
|
|
| |
|
|
TOTAL NET ASSETS | | | 100.0 | % | | $ | 8,967,139,564 |
| | |
|
|
| |
|
|
| (a) | | Cumulative Preferred Securities |
| (b) | | Security exempt from registration under Rule 144A of the Securities Act of 1933. The security may be resold in transactions exempt from registration, normally to qualified institutional buyers. As of June 30, 2005, all such securities in total represented $61,038,309 or 0.7% of total net assets. |
| (c) | | EOP Operating LP is operating partnership of Equity Office Properties Trust. |
When two issuers are identified, the first name refers to the acquirer or successor obligor, and the second name (within the parentheses) refers to the original issuer of the instrument.
CMO: Collateralized Mortgage Obligation
REMIC: Real Estate Mortgage Investment Conduit
| | |
| See accompanying Notes to Financial Statements | | Dodge & Cox Income Fund / 8 |
| | | | |
| Statement of Assets and Liabilities (unaudited) | |
| June 30, 2005 | |
| Assets: | |
Investments, at value (cost $8,806,653,307) | | $ | 8,958,739,214 | |
Receivable for investments sold | | | 2,311,353 | |
Receivable for paydowns on
mortgage-backed securities | | | 5,998 | |
Receivable for Fund shares sold | | | 15,373,960 | |
Dividends and interest receivable | | | 88,818,473 | |
Prepaid expenses and other assets | | | 16,115 | |
| | |
|
|
|
| | | | 9,065,265,113 | |
| | |
|
|
|
| Liabilities: | |
Payable for investments purchased | | | 90,170,908 | |
Payable for Fund shares redeemed | | | 4,370,246 | |
Management fees payable | | | 2,930,735 | |
Accounts payable | | | 653,660 | |
| | |
|
|
|
| | | | 98,125,549 | |
| | |
|
|
|
| Net Assets | | $ | 8,967,139,564 | |
| | |
|
|
|
| Net Assets Consist of: | |
Paid in capital | | $ | 8,857,622,097 | |
Undistributed net investment income | | | 11,613,819 | |
Undistributed net realized loss on investments | | | (54,182,259 | ) |
Net unrealized appreciation on investments | | | 152,085,907 | |
| | |
|
|
|
| | | $ | 8,967,139,564 | |
| | |
|
|
|
Fund shares outstanding (par value $0.01 each, unlimited shares authorized) | | | 701,053,778 | |
Net asset value per share | | | $12.79 | |
|
| Statement of Operations (unaudited) | |
Six Months Ended
June 30, 2005 | |
| Investment Income: | |
Interest | | $ | 182,238,736 | |
| | |
|
|
|
| Expenses: | |
Management fees | | | 16,818,580 | |
Custody and fund accounting fees | | | 86,161 | |
Transfer agent fees | | | 972,717 | |
Professional services | | | 54,145 | |
Shareholder reports | | | 231,891 | |
Registration fees | | | 227,649 | |
Trustees’ fees | | | 58,126 | |
Miscellaneous | | | 33,684 | |
| | |
|
|
|
| | | | 18,482,953 | |
| | |
|
|
|
| Net Investment Income | | | 163,755,783 | |
| | |
|
|
|
Realized and Unrealized Gain (Loss) on Investments: | | | | |
Net realized gain | | | 19,844,210 | |
Net change in unrealized appreciation | | | (36,568,350 | ) |
| | |
|
|
|
Net realized and unrealized loss | | | (16,724,140 | ) |
| | |
|
|
|
| Net Increase in Net Assets from Operations | | $ | 147,031,643 | |
| | |
|
|
|
| | | | | | | | |
| Statement of Changes in Net Assets (unaudited) | |
| | | Six Months Ended
June 30, 2005 | | | Year Ended
December 31, 2004 | |
| Operations: | | | | | |
Net investment income | | $ | 163,755,783 | | | $ | 242,536,193 | |
Net realized gain | | | 19,844,210 | | | | 16,364,800 | |
Net change in unrealized appreciation | | | (36,568,350 | ) | | | (14,505,944 | ) |
| | |
|
|
| |
|
|
|
Net increase in net assets from operations | | | 147,031,643 | | | | 244,395,049 | |
| | |
|
|
| |
|
|
|
| |
Distributions to
Shareholders from: | | | | | |
Net investment income | | | (175,781,549 | ) | | | (289,903,700 | ) |
Net realized gain | | | — | | | | — | |
| | |
|
|
| |
|
|
|
Total distributions | | | (175,781,549 | ) | | | (289,903,700 | ) |
| | |
|
|
| |
|
|
|
| |
| Fund Share Transactions: | | | | | |
Proceeds from sale of shares | | | 1,709,536,090 | | | | 3,644,938,350 | |
Reinvestment of distributions | | | 150,821,380 | | | | 249,578,904 | |
Cost of shares redeemed | | | (734,664,518 | ) | | | (1,676,183,293 | ) |
| | |
|
|
| |
|
|
|
Net increase from Fund share transactions | | | 1,125,692,952 | | | | 2,218,333,961 | |
| | |
|
|
| |
|
|
|
Total increase in net assets | | | 1,096,943,046 | | | | 2,172,825,310 | |
| |
| Net Assets: | | | | | |
Beginning of period | | | 7,870,196,518 | | | | 5,697,371,208 | |
| | |
|
|
| |
|
|
|
End of period (including undistributed net investment income of $11,613,819 and $2,334,451, respectively) | | $ | 8,967,139,564 | | | $ | 7,870,196,518 | |
| | |
|
|
| |
|
|
|
| | |
| Share Information: | | | | | | | | |
Shares sold | | | 133,368,983 | | | | 282,927,918 | |
Distributions reinvested | | | 11,869,302 | | | | 19,509,574 | |
Shares redeemed | | | (57,334,343 | ) | | | (130,172,563 | ) |
| | |
|
|
| |
|
|
|
Net increase in
shares outstanding | | | 87,903,942 | | | | 172,264,929 | |
| | |
|
|
| |
|
|
|
| | |
| 9 / Dodge & Cox Income Fund | | See accompanying Notes to Financial Statements |
Notes to Financial Statements (unaudited)
Note 1 — Organization and Significant Accounting Policies
Dodge & Cox Income Fund (the “Fund”) is one of the series constituting the Dodge & Cox Funds (the “Trust” or the “Funds”). The Trust is organized as a Delaware statutory trust and is registered under the Investment Company Act of 1940, as amended, as a diversified, open-end management investment company. The Fund commenced operations on January 3, 1989, and seeks high and stable current income consistent with long-term preservation of capital. Risk considerations and investment strategies of the Fund are discussed in the Fund’s Prospectus.
The financial statements have been prepared in conformity with accounting principles generally accepted in the United States of America, which require the use of estimates and assumptions by management. Significant accounting policies are as follows:
Security valuation. The Fund’s net assets are valued as of the close of trading on the New York Stock Exchange (the “NYSE”), generally 4:00 p.m. Eastern Time, each day that the NYSE is open for business. Fixed-income securities with original maturities of one year or more are priced on the basis of valuations furnished by pricing services which utilize both dealer-supplied valuations and electronic data processing techniques. Valuations of fixed-income securities take into account appropriate factors such as institutional-size trading markets in similar groups of securities, yield, quality, coupon rate, maturity, type of issue, trading characteristics and other market data and do not rely exclusively upon exchange or over-the-counter listed prices. Security values are not discounted based on the size of the Fund’s position. Securities for which market quotations are not readily available are valued at fair value as determined in good faith by or at the direction of the Board of Trustees. Short-term securities are valued at amortized cost which approximates current value. All securities held by the Fund are denominated in U.S. dollars.
Security transactions, investment income, expenses, and distributions. Security transactions are recorded on the trade date. Realized gains and losses on securities sold are determined on the basis of identified cost.
Interest income is recorded on the accrual basis. Interest income includes coupon interest, amortization of premium and accretion of
discount on debt securities, and paydown gains and losses. The ability of the issuers of the debt securities held by the Fund to meet their obligations may be affected by economic developments in a specific industry, state or region. Debt obligations may be placed on non-accrual status and related interest income may be reduced by ceasing current accruals and writing off interest receivables when the collection of all or a portion of interest has become doubtful based on consistently applied procedures. A debt obligation is removed from non-accrual status when the issuer resumes interest payments or when collectibility of interest is reasonably assured.
Expenses are recorded on the accrual basis. Most expenses of the Trust can be directly attributed to a specific series. Expenses which cannot be directly attributed are apportioned among the Funds in the Trust.
Distributions to shareholders are recorded on the ex-dividend date.
Repurchase agreements. The Fund may enter into repurchase agreements secured by U.S. government securities which involve the purchase of securities from a counterparty with a simultaneous commitment to resell the securities at an agreed-upon date and price. It is the Fund’s policy that its custodian take possession of the underlying collateral securities, the fair value of which exceeds the principal amount of the repurchase transaction, including accrued interest, at all times. In the event of default by the counterparty, the Fund has the contractual right to liquidate the securities and to apply the proceeds in satisfaction of the obligation.
Note 2 — Related Party Transactions
Management fees. Under a written agreement, the Fund pays an annual management fee of 0.50% of the Fund’s average daily net assets up to $100 million and 0.40% of the Fund’s average daily net assets in excess of $100 million to Dodge & Cox, investment manager of the Fund. The agreement further provides that Dodge & Cox shall waive its fee to the extent that such fee plus all other ordinary operating expenses of the Fund exceed 1% of the average daily net assets for the year.
Fund officers and trustees. All officers and three of the trustees of the Trust are officers or employees of Dodge & Cox. The Trust pays a fee only to those trustees who are not affiliated with Dodge & Cox.
| | |
| | | Dodge & Cox Income Fund / 10 |
Notes to Financial Statements (unaudited) (continued)
Indemnifications. Under the Trust’s organizational documents, its officers and trustees are indemnified against certain liabilities arising out of the performance of their duties to the Trust. In addition, in the normal course of business the Trust enters into contracts that provide general indemnifications to other parties. The Trust’s maximum exposure under these arrangements is unknown as this would involve future claims that may be made against the Trust that have not yet occurred.
Note 3 — Income Tax Information and Distributions to Shareholders
A provision for federal income taxes is not required since the Fund intends to continue to qualify as a regulated investment company under Subchapter M of the Internal Revenue Code and distribute all of its taxable income to shareholders. Distributions are determined in accordance with income tax regulations, which may differ from net investment income and realized gains for financial reporting purposes. Financial reporting records are adjusted for permanent book/tax differences to reflect tax character. Financial records are not adjusted for temporary differences.
Book/tax differences are primarily due to differing treatments of short-term realized gains and paydown losses. At June 30, 2005, the cost of investments for federal income tax purposes was equal to the cost for financial reporting purposes.
Distributions during the period ended June 30, 2005 were characterized as follows for federal income tax purposes:
| | | |
Ordinary income ($0.26 per share) | | $ | 175,781,549 |
Long-term capital gain | | | — |
| | |
|
|
Total distributions ($0.26 per share) | | $ | 175,781,549 |
| | |
|
|
At June 30, 2005, the tax basis components of net assets were as follows:
| | | | |
Unrealized appreciation | | $ | 204,155,625 | |
Unrealized depreciation | | | (52,069,718 | ) |
| | |
|
|
|
Net unrealized appreciation | | | 152,085,907 | |
Undistributed ordinary income | | | 11,613,819 | |
Accumulated capital loss | | | (54,182,259 | ) |
Paid-in capital | | | 8,857,622,097 | |
| | |
|
|
|
Net assets | | $ | 8,967,139,564 | |
| | |
|
|
|
Accumulated capital loss consists of the following components:
| | | |
Capital loss carry forward | | | |
Expiring in 2011 | | $ | 14,093,589 |
Expiring in 2012 | | | 32,528,048 |
Capital loss realized during the period ended June 30, 2005 | | | 7,560,622 |
| | |
|
|
| | | $ | 54,182,259 |
| | |
|
|
Note 4 — Purchase and Sales of Investments
For the period ended June 30, 2005, purchases and sales of securities, other than short-term securities and U.S. government securities, aggregated $445,348,272 and $377,188,560, respectively. For the period ended June 30, 2005, purchases and sales of U.S. government securities aggregated $2,260,890,144 and $442,488,691, respectively.
| | |
| 11 / Dodge & Cox Income Fund | | |
Financial Highlights (unaudited)
| | | | | | | | | | | | | | | | | | | | | | |
SELECTED DATA AND RATIOS
(for a share outstanding throughout each period) | | | | Six Months
Ended June 30, | | | | | Year Ended December 31, | |
| | | | | 2005 | | | | | 2004 | | | 2003 | | | 2002 | | | 2001 | | | 2000 | |
Net asset value, beginning of period | | | | $12.84 | | | | | $12.92 | | | $12.77 | | | $12.20 | | | $11.80 | | | $11.40 | |
| | | | | | | | |
Income from investment operations: | | | | | | | | | | | | | | | | | | | | | | |
Net investment income | | | | 0.27 | | | | | 0.54 | | | 0.60 | | | 0.66 | | | 0.74 | | | 0.77 | |
Net realized and unrealized gain (loss) | | | | (0.06 | ) | | | | (0.08 | ) | | 0.15 | | | 0.62 | | | 0.46 | | | 0.41 | |
| | | | |
|
|
Total from investment operations | | | | 0.21 | | | | | 0.46 | | | 0.75 | | | 1.28 | | | 1.20 | | | 1.18 | |
| | | | |
|
|
Distributions to shareholders from: | | | | | | | | | | | | | | | | | | | | | | |
Net investment income | | | | (0.26 | ) | | | | (0.54 | ) | | (0.60 | ) | | (0.66 | ) | | (0.74 | ) | | (0.78 | ) |
Net realized gain | | | | — | | | | | — | | | — | | | (0.05 | ) | | (0.06 | ) | | — | |
| | | | |
|
|
Total distributions | | | | (0.26 | ) | | | | (0.54 | ) | | (0.60 | ) | | (0.71 | ) | | (0.80 | ) | | (0.78 | ) |
| | | | |
|
|
Net asset value, end of period | | | | $12.79 | | | | | $12.84 | | | $12.92 | | | $12.77 | | | $12.20 | | | $11.80 | |
| | | | |
|
|
Total return | | | | 1.66 | % | | | | 3.64 | % | | 5.97 | % | | 10.75 | % | | 10.32 | % | | 10.70 | % |
Ratios/supplemental data: | | | | | | | | | | | | | | | | | | | | | | |
Net assets, end of period (millions) | | | | $8,967 | | | | | $7,870 | | | $5,697 | | | $3,405 | | | $1,512 | | | $1,021 | |
Ratio of expenses to average net assets | | | | 0.44 | %* | | | | 0.44 | % | | 0.45 | % | | 0.45 | % | | 0.45 | % | | 0.46 | % |
Ratio of net investment income to average net assets | | | | 3.91 | %* | | | | 3.61 | % | | 3.93 | % | | 5.38 | % | | 6.18 | % | | 6.67 | % |
Portfolio turnover rate | | | | 14 | % | | | | 30 | % | | 41 | % | | 31 | % | | 40 | % | | 34 | % |
| | |
| | | Dodge & Cox Income Fund / 12 |
Fund’s Holdings
The Funds provide a complete list of their holdings four times in each fiscal year, as of the end of each quarter. The lists appear in the Funds’ First Quarter, Semi-Annual, Third Quarter and Annual Reports to shareholders. The Funds file the lists with the Securities and Exchange Commission (SEC) on Form N-CSR (second and fourth quarters) and Form N-Q (first and third quarters). Shareholders may view the Funds’ Forms N-CSR and N-Q on the SEC’s website at www.sec.gov. Forms N-CSR and N-Q may also be reviewed and copied at the SEC’s Public Reference Room in Washington, DC. Information regarding the operations of the Public Reference Room may be obtained by calling 1-202-942-8090 (direct) or 1-800/SEC-0330 (general SEC number). A complete list of the Funds’ quarter-end holdings are also available at www.dodgeandcox.com on or about 15 days following each quarter-end and remains available on the web site until the list is updated for the subsequent quarter.
Proxy Voting
For a free copy of the Fund’s proxy voting policies and procedures, please call (800) 621-3979, visit www.dodgeandcox.com, or visit the Securities and Exchange Commission’s web site at www.sec.gov. Beginning August 31, 2005, information regarding how Dodge & Cox, on behalf of the Fund, voted proxies relating to the Fund’s portfolio securities for the most recent twelve-month period ending June 30 will be available at www.dodgeandcox.com or the SEC’s web site at www.sec.gov.
| | |
| 13 / Dodge & Cox Income Fund | | |
THIS PAGE INTENTIONALLY LEFT BLANK
| | |
| | | Dodge & Cox Income Fund / 14 |
Officers and Trustees
Harry R. Hagey, Chairman & Trustee
Chairman & Chief Executive Officer, Dodge & Cox
John A. Gunn, President & Trustee
President, Dodge & Cox
Dana M. Emery, Vice President & Trustee
Senior Vice President, Dodge & Cox
William F. Ausfahl, Trustee
Former Chief Financial Officer and member of Board of Directors, The Clorox Company
L. Dale Crandall, Trustee
Former President, Kaiser Foundation Health Plan and Hospitals
Thomas A. Larsen, Trustee
Director, Howard, Rice, Nemerovski, Canady, Falk & Rabkin
Will C. Wood, Trustee
Principal, Kentwood Associates, Financial Advisers
A. Horton Shapiro, Executive Vice President
Senior Vice President, Dodge & Cox
Katherine Herrick Drake, Vice President
Vice President, Dodge & Cox
Kenneth E. Olivier, Vice President
Executive Vice President, Dodge & Cox
Diana S. Strandberg, Vice President
Vice President, Dodge & Cox
John M. Loll, Treasurer & Asst. Secretary
Vice President & Treasurer, Dodge & Cox
Thomas M. Mistele, Secretary & Asst. Treasurer
Chief Operating Officer, Secretary & General Counsel, Dodge & Cox
Marcia P. Venegas, Chief Compliance Officer
Chief Compliance Officer, Dodge & Cox
A code of ethics, as defined in Item 2 of Form N-CSR, applicable to the registrant’s principal executive officer and principal financial officer, is filed as an exhibit to the registrant’s annual Form N-CSR. No substantive amendments were approved or waivers were granted to this code of ethics during the period covered by this report.
| ITEM 3. | AUDIT COMMITTEE FINANCIAL EXPERT. |
The Board of Trustees of the registrant has determined that William F. Ausfahl and L. Dale Crandall, members of the registrant’s Audit Committee, are each an “audit committee financial expert” and are “independent,” as defined in Item 3 of Form N-CSR.
| ITEM 4. | PRINCIPAL ACCOUNTANT FEES AND SERVICES. |
Not applicable. Disclosure required in registrant’s annual Form N-CSR.
| ITEM 5. | AUDIT COMMITTEE OF LISTED REGISTRANTS. |
Not applicable.
| ITEM 6. | SCHEDULE OF INVESTMENTS. |
Not applicable. The complete schedule of investments is included in Item 1 of this Form N-CSR.
| ITEM 7. | DISCLOSURE OF PROXY VOTING POLICIES AND PROCEDURES FOR CLOSED-END MANAGEMENT INVESTMENT COMPANIES. |
Not applicable.
| ITEM 8. | PORTFOLIO MANAGERS OF CLOSED-END MANAGEMENT INVESTMENT COMPANIES. |
Not applicable.
| ITEM 9. | PURCHASES OF EQUITY SECURITIES BY CLOSED-END MANAGEMENT INVESTMENT COMPANY AND AFFILIATED PURCHASERS. |
Not applicable.
| ITEM 10. | SUBMISSION OF MATTERS TO A VOTE OF SECURITY HOLDERS. |
As of the end of the reporting period, the registrant did not have in place formal written procedures by which shareholders may recommend nominees to the registrant’s Board of Trustees; however, the registrant’s Statement of Additional Information provides that the registrant’s Governance Committee will consider shareholder recommendations for trustee nominees, and shareholders may send recommendations to the Secretary of the registrant.
| ITEM 11. | CONTROLS AND PROCEDURES. |
(a) An evaluation was performed within 90 days of the filing of this report, under the supervision and with the participation of the registrant’s management, including the principal executive officer and principal financial officer, of the effectiveness of the design and operation of the registrant’s disclosure controls and procedures. Based on that evaluation, the principal executive officer and principal financial officer concluded that the registrant’s disclosure controls and procedures were effective.
(b) The registrant’s principal executive officer and principal financial officer are aware of no changes in the registrant’s internal control over financial reporting that occurred during the registrant’s second fiscal quarter of the period covered by this report that has materially affected, or is reasonably likely to materially affect, the registrant’s internal control over financial reporting.
(a)(1) The registrant’s code of ethics pursuant to Item 2 of Form N-CSR is filed as an exhibit to the registrant’s annual Form N-CSR.
(a)(2) Certifications pursuant to Section 302 of the Sarbanes-Oxley Act of 2002 are attached. (EX.99A)
(a)(3) Not applicable.
(b) Certifications pursuant to Section 906 of the Sarbanes-Oxley Act of 2002 are attached. (EX.99B)
SIGNATURES
Pursuant to the requirements of the Securities Exchange Act of 1934 and the Investment Company Act of 1940, the registrant has duly caused this report to be signed on its behalf by the undersigned, thereunto duly authorized.
Dodge & Cox Funds
| | |
| By | | /s/ Harry R. Hagey |
| | | Harry R. Hagey |
| | | Chairman - Principal Executive Officer |
|
| Date August 19, 2005 |
Pursuant to the requirements of the Securities Exchange Act of 1934 and the Investment Company Act of 1940, this report has been signed below by the following persons on behalf of the registrant and in the capacities and on the dates indicated.
| | |
| Dodge & Cox Funds |
| |
| By | | /s/ Harry R. Hagey |
| | | Harry R. Hagey |
| | | Chairman - Principal Executive Officer |
| |
| By | | /s/ John M. Loll |
| | | John M. Loll |
| | | Treasurer – Principal Financial Officer |
|
| Date August 19, 2005 |