UNITED STATES
SECURITIES AND EXCHANGE COMMISSION
Washington, D.C. 20549
FORM N-CSR
CERTIFIED SHAREHOLDER REPORT OF REGISTERED MANAGEMENT
INVESTMENT COMPANIES
Investment Company Act file number 811-173
DODGE & COX FUNDS
(Exact name of registrant as specified in charter)
555 California Street, 40th Floor
San Francisco, CA 94104
(Address of principal executive offices) (Zip code)
Thomas M. Mistele, Esq.
555 California Street, 40th Floor
San Francisco, CA 94104
(Name and address of agent for service)
Registrant’s telephone number, including area code: 415-981-1710
Date of fiscal year end: DECEMBER 31, 2006
Date of reporting period: June 30, 2006
Form N-CSR is to be used by management investment companies to file reports with the Commission not later than 10 days after the transmission to stockholders of any report that is required to be transmitted to stockholders under Rule 30e-1 under the Investment Company Act of 1940 (17 CFR 270.30e-1). The Commission may use the information provided on Form N-CSR in its regulatory, disclosure review, inspection, and policymaking roles.
A registrant is required to disclose the information specified by Form N-CSR, and the Commission will make this information public. A registrant is not required to respond to the collection of information contained in Form N-CSR unless the Form displays a currently valid Office of Management and Budget (“OMB”) control number. Please direct comments concerning the accuracy of the information collection burden estimate and any suggestions for reducing the burden to Secretary, Securities and Exchange Commission, 450 Fifth Street, NW, Washington, DC 20549-0609. The OMB has reviewed this collection of information under the clearance requirements of 44 U.S.C. ss. 3507.
ITEM 1. REPORTS TO STOCKHOLDERS.
The following are the June 30, 2006 semi-annual reports for the Dodge & Cox Funds, a Delaware statutory trust, consisting of four series: Dodge & Cox Stock Fund, Dodge & Cox International Stock Fund, Dodge & Cox Balanced Fund and Dodge & Cox Income Fund. The reports of each series were transmitted to their respective shareholders on August 7, 2006.

Stock Fund
Established 1965
(Closed to New Investors)

Semi-Annual Report
June 30, 2006
2006
Stock Fund
www.dodgeandcox.com
For Fund literature, transactions and account
information, please visit the Funds’ web site.
or write or call:
Dodge & Cox Funds
c/o Boston Financial Data Services
P.O. Box 8422
Boston, Massachusetts 02266-8422
(800) 621-3979
Investment Manager
Dodge & Cox
555 California Street, 40th Floor
San Francisco, California 94104
(415) 981-1710
This report is submitted for the general information of the shareholders of the Fund. The report is not authorized for distribution to prospective investors in the Fund unless it is accompanied by a current prospectus.
This report reflects our views, opinions and portfolio holdings as of June 30, 2006, the end of the reporting period. Any such views are subject to change at any time based upon market or other conditions and Dodge & Cox disclaims any responsibility to update such views. These views may not be relied on as investment advice and, because investment decisions for a Dodge & Cox Fund are based on numerous factors, may not be relied on as an indication of trading intent on behalf of any Dodge & Cox Fund.
06/06 SF SAR  Printed on recycled paper
To Our Shareholders
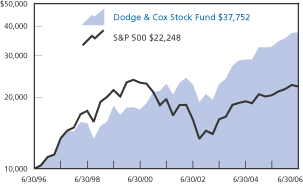
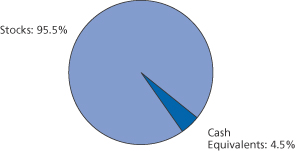
The Dodge & Cox Stock Fund had a total return of 6.2% for the six months ended June 30, 2006, compared to a total return of 2.7% for the Standard & Poor’s 500 Index (S&P 500). Longer term results can be found on the following page. At quarter end, the Fund had net assets of $57.3 billion with a cash position of 4.5%.
Digging into the Fund: What Helped and What Hurt Over the First Six Months of 2006
The Fund outperformed the S&P 500 Index by 3.5% for the first six months of the year. Key contributors to the Fund’s performance included:
| • | | The Fund’s holdings in the Consumer Discretionary sector, in combination with a higher overall weighting, provided the largest contribution to returns. Selected Media stocks, including Comcast (up 26%) and News Corp. (up 24%), performed well in the first half of 2006 (after a disappointing 2005). |
| • | | Holdings in the Information Technology sector also performed better than the corresponding S&P 500 sector (up 2% versus down 5%). Technology was the weakest area of the market during the first half of the year. Approximately 12% of the Fund is invested in a wide array of technology stocks with price-to-sales valuations of 1.3 times or less, indicating investors’ modest expectations for the future growth in revenues and profit margins. While we have increased the Fund’s exposure to certain companies whose valuations have declined dramatically, we continue to avoid technology companies where valuations remain much higher, indicating that revenue and margin expectations are still quite high. |
| • | | Energy holdings continued to perform well, rising 18% in the aggregate, with 9% of the Fund invested in the sector, compared to 10% for the S&P 500. Over the long term, we expect the demand for oil in the developing world will continue to rise. Despite the rapid appreciation of energy companies over the past few years, the fundamental outlook remains positive and we want to retain some ownership in this area. |
Conversely, the Fund’s single Telecom holding, Vodafone, was up only 2% versus the S&P 500 sector return of 14%. Additionally, a number of individual holdings which detracted from returns year-to-date included Dow Chemical (down 9%), HCA (down 14%), WellPoint (down 9%) and Cardinal Health (down 6%).
Current Strategy: It’s All Relative
Changes in the Fund’s holdings occur gradually over time—which should come as no surprise—given our long-term investment
horizon. In fact, the current Fund holdings remain quite similar to those at year-end 2005. When we do make changes, they can be in response to changes in company fundamentals, or may be in response to changes in the relative valuations within our investment universe. In concept, we are “re-buying” the entire portfolio each day. It is a “bottom-up” process—a security-by-security analysis.
For example, the valuations of a number of the Fund’s holdings in the Industrials, Energy and Materials sectors have increased significantly during these recent years of economic expansion. On a price-to-sales measure, several companies were selling at or near their five-year highs during the first half of 2006, and we made the decision to sell Fluor, Rio Tinto and Amerada Hess. We continue to believe that these companies have attractive business opportunities ahead—a negative fundamental outlook is not the reason we decided to sell these positions. Rather, since a more optimistic outlook for future earnings is now incorporated in the higher stock prices, we look for more compelling relative valuations and investment opportunities elsewhere. We assess these trade-offs continually. The valuation of each company drives our individual security decisions, and relative valuation between companies is a key component in the evolution of the Fund’s overall portfolio structure.
So where did we redeploy the proceeds from the trims and sales? A number of opportunities came into view (again, we are merely responding to changes in company valuations, as presented to us by prices in the stock market each day). Many of the Fund’s new purchases and additions were in Technology, Media and Health Care. For example, we started positions in Dell Computer and Echostar Communications, and added to the Fund’s holdings in Pfizer and Sanofi-Aventis. These companies are in sectors which have had some of the most dramatic re-valuations since the speculative equity market peaked in 2000. It has taken some years for those high valuations to decline to attractive levels, but we now believe that the lower investor expectations are more reasonable for some of these former “growth” companies.
This discussion is not so much to highlight specific buys and sells, but rather to try to communicate the process by which we develop the Fund’s strategy over time. The daily assessment of trade-offs between alternative investments, considering both fundamentals and price, results in periodic changes in the Fund’s holdings. These individual decisions cumulate over time to determine the overall equity strategy. While we are reassessing the portfolio daily, changes are made incrementally. For the first six months of the year, the Fund’s turnover ratio was just 7%.
| | |
| 1 / Dodge & Cox Stock Fund | | |
In Conclusion: A Focus on Long-Term Growth Opportunities
While we focus our efforts on a company’s long-term fundamentals in relation to its current valuation, many market participants are decidedly more short-term in orientation. The first half of 2006 (and the second quarter in particular) was marked by volatile market conditions. Rising interest rates, elevated oil prices and heightened conflict in the Middle East have led to greater uncertainty and gyrating returns for some public companies. For example, at the close of the market on Monday, June 27, the Fund had a total return of 3.0% year-to-date (versus the S&P 500’s 0.1%). Three days later, at the end of the second quarter, the Fund had a year-to-date return of 6.2% (versus the S&P 500’s 2.7%). It is during these short-term fluctuations that we like to remind you of our unwavering focus on long-term fundamentals when investing in individual companies.
Going forward, we are encouraged by the long-term economic prospects for both the United States and the developing world. Currently, the U.S. consumer represents about 20% of global GDP. Given the many years of high spending and consumption, the U.S. consumer clearly is not a source of “pent up” purchasing power, yet some of the worries about consumer spending appear to be exaggerated. While we expect the domestic consumer to continue spending apace, we believe that the incremental purchasing power gains of the consumer in the developing world will be even more conspicuous over the coming years. The developing world is home to roughly 5.5 billion people, many of whom enjoy increasing individual economic freedoms, often leading to growing per capita income and increasing prosperity. In our view, the consumer in the developing world is a powerful source of future economic growth, and many of the Fund’s holdings are positioned to take advantage of this opportunity. We will address this investment theme further in upcoming shareholder letters.
Thank you for your continued confidence in our firm as a shareholder of the Dodge & Cox Stock Fund. As always, we welcome your comments and questions.
For the Board of Trustees,
| | |
 | | 
|
| |
| Harry R. Hagey, Chairman | | John A. Gunn, President |
August 4, 2006
Growth of $10,000 Over 10 Years
For an investment made on June 30, 1996
Average Annual Total Return
for periods ended June 30, 2006
| | | | | | | | | | | | |
| | | 1 Year | | | 5 Years | | | 10 Years | | | 20 Years | |
Dodge & Cox Stock Fund | | 15.31 | % | | 10.58 | % | | 14.21 | % | | 14.25 | % |
S&P 500 | | 8.67 | | | 2.50 | | | 8.32 | | | 11.03 | |
Past performance does not guarantee future results. Investment return and share price will fluctuate with market conditions, and investors may have a gain or loss when shares are sold. Mutual fund performance changes over time and currently may be significantly lower than stated above. Performance is updated and published monthly. Visit the Fund’s web site at www.dodgeandcox.com or call 1-800-621-3979 for current performance figures.
The Fund’s total returns include the reinvestment of dividend and capital gain distributions, but have not been adjusted for any income taxes payable by shareholders on these distributions. The Standard & Poor’s 500 Index (S&P 500) is a broad-based unmanaged measure of common stocks. Index returns include dividends and/or interest income but, unlike Fund returns, do not reflect fees or expenses.
Standard & Poor’s, Standard & Poor’s 500, and S&P 500® are trademarks of The McGraw-Hill Companies, Inc.
| | |
| | | Dodge & Cox Stock Fund / 2 |
Fund Expense Example
As a Fund shareholder, you incur ongoing Fund costs, including management fees and other Fund expenses. All mutual funds have ongoing costs, sometimes referred to as operating expenses.
The following example shows ongoing costs of investing in the Fund and can help you understand these costs and compare them with those of other mutual funds. The example assumes a $1,000 investment held for the six months indicated.
Actual Expenses
The first line of the table below provides information about actual account values and expenses based on the Fund’s actual returns. You may use the information in this line, together with your account balance, to estimate the expenses that you paid over the period. Simply divide your account value by $1,000 (for example, an $8,600 account value divided by $1,000 = 8.6), then multiply the result by the number in the first line under the heading “Expenses Paid During Period” to estimate the expenses you paid on your account during this period.
Hypothetical Example for Comparison with Other Mutual Funds
Information on the second line of the table can help you compare ongoing costs of investing in the Fund with those of other mutual funds. This information may not be used to estimate the actual ending account balance or expenses you paid during the period. The hypothetical “Ending Account Value” is based on the actual expense ratio of the Fund and an assumed 5% annual rate of return before expenses (not the Fund’s actual return). The amount under the heading “Expenses Paid During the Period” shows the hypothetical expenses your account would have incurred under this scenario. You can compare this figure with the 5% hypothetical examples that appear in shareholder reports of other mutual funds.
| | | | | | | | | |
Six Months Ended
June 30, 2006 | | Beginning Account
Value 1/1/2006 | | Ending Account
Value 6/30/2006 | | Expenses Paid
During Period* |
Based on Actual Fund Return | | $ | 1,000.00 | | $ | 1,061.50 | | $ | 2.66 |
Based on Hypothetical 5% Yearly Return | | | 1,000.00 | | | 1,022.21 | | | 2.61 |
| * | | Expenses are equal to the Fund’s annualized six-month expense ratio of 0.52%, multiplied by the average account value over the period, multiplied by 181/365 (to reflect the one-half year period). |
The expenses shown in the table highlight ongoing costs only and do not reflect any transactional costs or account maintenance fees. While other mutual funds may charge such fees, please note that the Fund does not charge transaction fees (e.g., redemption fees, sales loads) or universal account maintenance fees (e.g., small account fees).
| | |
| 3 / Dodge & Cox Stock Fund | | |
Fund Information | June 30, 2006 |
General Information
| | |
Net Asset Value Per Share | | $144.48 |
Total Net Assets (billions) | | $57.3 |
Expense Ratio (annualized) | | 0.52% |
2005 Portfolio Turnover Rate | | 12% |
30-Day SEC Yield(a) | | 1.28% |
Fund Inception | | 1965 |
Investment Manager: Dodge & Cox, San Francisco. Managed by the Investment Policy Committee, whose ten members’ average tenure at Dodge & Cox is 22 years.
| | | | |
| Portfolio Characteristics | | Fund | | S&P 500 |
Number of Stocks | | 83 | | 500 |
Median Market Capitalization (billions) | | $22 | | $12 |
Weighted Avg. Market Capitalization (billions) | | $63 | | $86 |
Price-to-Earnings Ratio | | 14.4x | | 14.8x |
Foreign Stocks(b) (% of Fund) | | 16.9% | | 0.0% |
| | | |
| Ten Largest Holdings(c) | | Fund | |
Hewlett-Packard Co. | | 3.8 | % |
Comcast Corp. Class A | | 3.5 | |
News Corp. Class A | | 3.1 | |
Pfizer, Inc. | | 2.9 | |
Sony Corp. ADR (Japan) | | 2.8 | |
Sanofi-Aventis ADR (France) | | 2.6 | |
Chevron Corp. | | 2.6 | |
Time Warner, Inc. | | 2.4 | |
Union Pacific Corp. | | 2.4 | |
FedEx Corp. | | 2.4 | |
Asset Allocation
| | | | | | |
| Sector Diversification | | Fund | | | S&P 500 | |
Consumer Discretionary | | 20.8 | % | | 10.2 | % |
Health Care | | 16.3 | | | 12.3 | |
Financials | | 16.1 | | | 21.4 | |
Information Technology | | 12.9 | | | 14.8 | |
Energy | | 9.2 | | | 10.2 | |
Industrials | | 8.1 | | | 11.7 | |
Materials | | 5.1 | | | 3.1 | |
Consumer Staples | | 4.3 | | | 9.6 | |
Utilities | | 1.6 | | | 3.4 | |
Telecommunication Services | | 1.1 | | | 3.3 | |
(a) SEC Yield is an annualization of the Fund’s total net investment income per share for the 30-day period ended on the last day of the month.
(b) Foreign stocks are U.S. dollar-denominated.
(c) The Fund’s portfolio holdings are subject to change without notice. The mention of specific securities is not a recommendation or solicitation for any person to buy, sell or hold any particular security.
| | |
| | | Dodge & Cox Stock Fund / 4 |
Portfolio of Investments (unaudited) | June 30, 2006 |
| | | | | |
| COMMON STOCKS: 95.5% | | | | |
| | |
| | | SHARES | | VALUE |
| CONSUMER DISCRETIONARY: 20.8% | | | | | |
| AUTOMOBILES & COMPONENTS: 0.5% | | | | | |
Honda Motor Co., Ltd. ADR(b) (Japan) | | 8,550,300 | | $ | 272,070,546 |
| | | | |
|
|
| CONSUMER DURABLES & APPAREL: 5.8% | | | |
Matsushita Electric Industrial Co., Ltd. ADR(b) (Japan) | | 63,864,700 | | | 1,349,461,111 |
Sony Corp. ADR(b) (Japan) | | 36,617,700 | | | 1,612,643,508 |
Thomson ADR(b) (France) | | 6,586,000 | | | 108,669,000 |
VF Corp. | | 3,458,900 | | | 234,928,488 |
| | | | |
|
|
| | | | | | 3,305,702,107 |
| CONSUMER SERVICES: 2.1% | | | | | |
McDonald’s Corp. | | 36,733,900 | | | 1,234,259,040 |
| | | | |
|
|
| MEDIA: 10.4% | | | | | |
Comcast Corp., Class A(a) | | 60,418,191 | | | 1,978,091,573 |
Discovery Holdings Co., Series A(a) | | 1,119,213 | | | 16,374,086 |
EchoStar Communications Corp.(a) | | 7,473,898 | | | 230,270,797 |
Interpublic Group of Companies, Inc.(a),(c) | | 26,699,200 | | | 222,938,320 |
Liberty Capital, Series A(a) | | 2,396,380 | | | 200,744,753 |
Liberty Interactive, Series A(a) | | 8,853,900 | | | 152,818,314 |
News Corp., Class A | | 91,295,238 | | | 1,751,042,665 |
Time Warner, Inc. | | 80,528,400 | | | 1,393,141,320 |
| | | | |
|
|
| | | | | | 5,945,421,828 |
| RETAILING: 2.0% | | | | | |
Federated Department Stores, Inc. | | 11,119,006 | | | 406,955,620 |
Gap, Inc. | | 22,553,600 | | | 392,432,640 |
Genuine Parts Co.(c) | | 8,931,300 | | | 372,077,958 |
| | | | |
|
|
| | | | | | 1,171,466,218 |
| | | | |
|
|
| | | | | | 11,928,919,739 |
| CONSUMER STAPLES: 4.3% | | | | | |
| FOOD & STAPLES RETAILING: 2.3% | | | | | |
Wal-Mart Stores, Inc. | | 27,098,900 | | | 1,305,354,013 |
| | | | |
|
|
| FOOD, BEVERAGE & TOBACCO: 1.5% | | | | | |
Unilever NV(b) (Netherlands) | | 38,041,400 | | | 857,833,570 |
| | | | |
|
|
| HOUSEHOLD & PERSONAL PRODUCTS: 0.5% | | | |
Avon Products, Inc. | | 9,117,600 | | | 282,645,600 |
| | | | |
|
|
| | | | | | 2,445,833,183 |
| ENERGY: 9.2% | | | | | |
Baker Hughes, Inc. | | 9,691,350 | | | 793,236,997 |
Chevron Corp. | | 23,696,971 | | | 1,470,634,020 |
ConocoPhillips | | 11,456,900 | | | 750,770,657 |
Exxon Mobil Corp. | | 9,203,500 | | | 564,634,725 |
Occidental Petroleum Corp. | | 5,138,900 | | | 526,994,195 |
Royal Dutch Shell PLC ADR(b) (United Kingdom) | | 10,407,864 | | | 727,197,458 |
Schlumberger, Ltd. | | 6,323,700 | | | 411,736,107 |
| | | | |
|
|
| | | | | | 5,245,204,159 |
| | | | | |
| | |
| | | SHARES | | VALUE |
| FINANCIALS: 16.1% | | | | | |
| BANKS: 3.6% | | | | | |
Golden West Financial Corp. | | 9,075,700 | | $ | 673,416,940 |
Wachovia Corp. | | 18,456,200 | | | 998,111,296 |
Wells Fargo & Co. | | 6,030,500 | | | 404,525,940 |
| | | | |
|
|
| | | | | | 2,076,054,176 |
| DIVERSIFIED FINANCIALS: 3.7% | | | | | |
Capital One Financial Corp. | | 11,997,500 | | | 1,025,186,375 |
Citigroup, Inc. | | 22,153,100 | | | 1,068,665,544 |
| | | | |
|
|
| | | | | | 2,093,851,919 |
| INSURANCE: 6.9% | | | | | |
Aegon NV(b) (Netherlands) | | 35,029,314 | | | 597,950,390 |
Chubb Corp. | | 11,446,600 | | | 571,185,340 |
Genworth Financial, Inc., Class A | | 8,845,000 | | | 308,159,800 |
Loews Corp. | | 22,495,900 | | | 797,479,655 |
MBIA, Inc. | | 2,912,726 | | | 170,540,107 |
Safeco Corp. | | 5,545,000 | | | 312,460,750 |
St. Paul Travelers Companies, Inc. | | 22,745,350 | | | 1,013,987,703 |
UnumProvident Corp. | | 11,719,700 | | | 212,478,161 |
| | | | |
|
|
| | | | | | 3,984,241,906 |
| REAL ESTATE: 1.9% | | | | | |
Equity Office Properties Trust(c) | | 23,341,200 | | | 852,187,212 |
Equity Residential Properties Trust | | 4,804,050 | | | 214,885,157 |
| | | | |
|
|
| | | | | | 1,067,072,369 |
| | | | |
|
|
| | | | | | 9,221,220,370 |
| HEALTH CARE: 16.3% | | | | | |
| HEALTH CARE EQUIPMENT & SERVICES: 7.1% | | | |
Becton, Dickinson & Co. | | 4,210,850 | | | 257,409,261 |
Cardinal Health, Inc. | | 20,452,350 | | | 1,315,699,676 |
HCA, Inc.(c) | | 23,884,800 | | | 1,030,629,120 |
Health Management Associates, Inc. | | 10,779,802 | | | 212,469,897 |
Thermo Electron Corp.(a),(c) | | 9,111,300 | | | 330,193,512 |
WellPoint, Inc.(a) | | 12,480,700 | | | 908,220,539 |
| | | | |
|
|
| | | | | | 4,054,622,005 |
| PHARMACEUTICALS & BIOTECHNOLOGY: 9.2% | | | |
Bristol-Myers Squibb Co. | | 12,784,650 | | | 330,611,049 |
GlaxoSmithKline PLC ADR(b) (United Kingdom) | | 13,163,800 | | | 734,540,040 |
Pfizer, Inc. | | 71,009,345 | | | 1,666,589,327 |
Sanofi-Aventis ADR(b) (France) | | 30,679,000 | | | 1,494,067,300 |
Schering-Plough Corp. | | 30,454,000 | | | 579,539,620 |
Wyeth | | 11,339,900 | | | 503,604,959 |
| | | | |
|
|
| | | | | | 5,308,952,295 |
| | | | |
|
|
| | | | | | 9,363,574,300 |
| | |
| 5 / Dodge & Cox Stock Fund | | See accompanying Notes to Financial Statements |
Portfolio of Investments (unaudited) | June 30, 2006 |
| | | | | |
| COMMON STOCKS (continued) |
| | |
| | | SHARES | | VALUE |
| INDUSTRIALS: 8.1% | | | | | |
| CAPITAL GOODS: 2.7% | | | | | |
American Power Conversion Corp.(c) | | 11,031,985 | | $ | 215,013,388 |
Masco Corp. | | 12,308,500 | | | 364,823,940 |
Tyco International, Ltd. | | 29,565,500 | | | 813,051,250 |
Volvo AB ADR(b) (Sweden) | | 3,751,400 | | | 183,856,114 |
| | | | |
|
|
| | | | | | 1,576,744,692 |
| COMMERCIAL SERVICES & SUPPLIES: 0.6% | | | |
Pitney Bowes, Inc. | | 8,297,850 | | | 342,701,205 |
| | | | |
|
|
| TRANSPORTATION: 4.8% | | | | | |
FedEx Corp. | | 11,556,300 | | | 1,350,469,218 |
Union Pacific Corp.(c) | | 14,820,650 | | | 1,377,727,624 |
| | | | |
|
|
| | | | | | 2,728,196,842 |
| | | | |
|
|
| | | | | | 4,647,642,739 |
| INFORMATION TECHNOLOGY: 12.9% | | | | | |
| SOFTWARE & SERVICES: 3.4% | | | | | |
BMC Software, Inc.(a),(c) | | 15,445,500 | | | 369,147,450 |
Computer Sciences Corp.(a),(c) | | 12,858,900 | | | 622,885,116 |
Compuware Corp.(a),(c) | | 19,312,600 | | | 129,394,420 |
Electronic Data Systems Corp.(c) | | 34,711,300 | | | 835,153,878 |
| | | | |
|
|
| | | | | | 1,956,580,864 |
| TECHNOLOGY, HARDWARE & EQUIPMENT: 9.5% | | | |
Avaya, Inc.(a),(c) | | 31,094,924 | | | 355,104,032 |
Dell, Inc.(a) | | 15,748,000 | | | 384,408,680 |
Hewlett-Packard Co. | | 67,549,134 | | | 2,139,956,565 |
Hitachi, Ltd. ADR(b) (Japan) | | 4,422,900 | | | 292,221,003 |
Lexmark International, Inc.(a) | | 140,900 | | | 7,866,447 |
Motorola, Inc. | | 29,338,200 | | | 591,164,730 |
NCR Corp.(a) | | 7,404,000 | | | 271,282,560 |
Sun Microsystems, Inc.(a) | | 113,073,300 | | | 469,254,195 |
Xerox Corp.(a),(c) | | 64,145,600 | | | 892,265,296 |
| | | | |
|
|
| | | | | | 5,403,523,508 |
| | | | |
|
|
| | | | | | 7,360,104,372 |
| MATERIALS: 5.1% | | | | | |
Akzo Nobel NV ADR(b),(c) (Netherlands) | | 12,807,223 | | | 688,644,381 |
Alcoa, Inc. | | 7,860,683 | | | 254,371,702 |
Dow Chemical Co. | | 30,319,180 | | | 1,183,357,595 |
International Paper Co. | | 6,923,400 | | | 223,625,820 |
Nova Chemicals Corp.(b),(c) (Canada) | | 4,740,470 | | | 136,478,131 |
Rohm and Haas Co. | | 8,567,100 | | | 429,383,052 |
| | | | |
|
|
| | | | | | 2,915,860,681 |
| TELECOMMUNICATION SERVICES: 1.1% | | | |
Vodafone Group PLC ADR(b) (United Kingdom) | | 29,485,300 | | | 628,036,890 |
| | | | |
|
|
| | | | | | 628,036,890 |
| | | | | | | | |
| | |
| | | SHARES | | | VALUE | |
| UTILITIES: 1.6% | | | | | | | | |
Duke Energy Corp. | | | 23,855,700 | | | $ | 700,641,909 | |
FirstEnergy Corp. | | | 4,474,700 | | | | 242,573,487 | |
| | | | | | |
|
|
|
| | | | | | | | 943,215,396 | |
TOTAL COMMON STOCKS
(Cost $41,145,158,478) | | | | | | | 54,699,611,829 | |
| | | | | | |
|
|
|
|
| SHORT-TERM INVESTMENTS: 4.6% | |
| | |
| | | PAR VALUE | | | VALUE | |
SSgA Prime Money Market Fund | | $ | 285,161,764 | | | $ | 285,161,764 | |
State Street Repurchase Agreement 4.3%, 7/3/06, maturity value $1,276,442,228 (collateralized by U.S. Treasury Securities, value $1,301,514,725, 4.125%, 8/15/08) | | | 1,275,985,000 | | | | 1,275,985,000 | |
United States Treasury Bills | | | | | | | | |
7/20/06 | | | 200,000,000 | | | | 199,512,333 | |
8/10/06 | | | 300,000,000 | | | | 298,436,667 | |
9/14/06 | | | 300,000,000 | | | | 297,021,875 | |
10/5/06 | | | 300,000,000 | | | | 296,160,000 | |
| | | | | | |
|
|
|
TOTAL SHORT-TERM INVESTMENTS
(Cost $2,652,277,639) | | | | 2,652,277,639 | |
| | | | | | |
|
|
|
TOTAL INVESTMENTS
(Cost $43,797,436,117) | | | 100.1 | % | | | 57,351,889,468 | |
OTHER ASSETS LESS LIABILITIES | | | (0.1 | %) | | | (63,527,219 | ) |
| | |
|
|
| |
|
|
|
TOTAL NET ASSETS | | | 100.0 | % | | $ | 57,288,362,249 | |
| | |
|
|
| |
|
|
|
| (b) | | Foreign security denominated in U.S. dollars |
| (c) | | See Note 5 regarding holdings of 5% voting securities |
ADR: American Depository Receipt
| | |
| See accompanying Notes to Financial Statements | | Dodge & Cox Stock Fund / 6 |
Statement of Assets and Liabilities (unaudited)
| | | |
| |
| | | June 30, 2006 |
| Assets: | | | |
Investments, at value | | | |
Unaffiliated issuers (cost $37,468,113,627) | | $ | 49,610,694,011 |
Affiliated issuers (cost $6,329,322,490) | | | 7,741,195,457 |
| | |
|
|
| | | | 57,351,889,468 |
| |
Receivable for investments sold | | | 8,660,899 |
Receivable for Fund shares sold | | | 52,587,171 |
Dividends and interest receivable | | | 113,403,855 |
Prepaid expenses and other assets | | | 87,059 |
| | |
|
|
| | | | 57,526,628,452 |
| | |
|
|
| Liabilities: | | | |
Payable for investments purchased | | | 174,266,364 |
Payable for Fund shares redeemed | | | 38,046,643 |
Management fees payable | | | 23,153,201 |
Accrued expenses | | | 2,799,995 |
| | |
|
|
| | | | 238,266,203 |
| | |
|
|
| Net Assets | | $ | 57,288,362,249 |
| | |
|
|
| Net Assets Consist of: | | | |
Paid in capital | | $ | 41,839,595,854 |
Undistributed net investment income | | | 34,894,136 |
Undistributed net realized gain on investments | | | 1,859,418,908 |
Net unrealized appreciation on investments | | | 13,554,453,351 |
| | |
|
|
| | | $ | 57,288,362,249 |
| | |
|
|
Fund shares outstanding (par value $0.01 each, unlimited shares authorized) | | | 396,516,376 |
Net asset value per share | | | $144.48 |
| | |
| |
| Statement of Operations (unaudited) | | |
| | | |
| | | Six Months Ended
June 30, 2006 |
| Investment Income: | | | |
Dividends (net of foreign taxes of $12,117,571) | | | |
Unaffiliated issuers | | $ | 403,162,722 |
Affiliated issuers | | | 56,217,874 |
Interest | | | 75,648,858 |
| | |
|
|
| | | | 535,029,454 |
| | |
|
|
| Expenses: | | | |
Management fees | | | 139,145,549 |
Custody and fund accounting fees | | | 385,205 |
Transfer agent fees | | | 3,709,325 |
Professional services | | | 37,998 |
Shareholder reports | | | 1,102,859 |
Registration fees | | | 351,631 |
Trustees’ fees | | | 82,500 |
Miscellaneous | | | 174,596 |
| | |
|
|
| | | | 144,989,663 |
| | |
|
|
| Net Investment Income | | | 390,039,791 |
| | |
|
|
| Realized and Unrealized Gain on Investments: | | | |
Net realized gain | | | |
Unaffiliated issuers | | | 1,292,161,577 |
Affiliated issuers | | | 567,257,331 |
Net change in unrealized appreciation | | | 1,001,064,131 |
| | |
|
|
Net realized and unrealized gain | | | 2,860,483,039 |
| | |
|
|
| Net Increase in Net Assets from Operations | | $ | 3,250,522,830 |
| | |
|
|
Statement of Changes in Net Assets (unaudited)
| | | | | | | | |
| | |
| | | Six Months Ended
June 30, 2006 | | | Year Ended
December 31, 2005 | |
| Operations: | | | | | |
Net investment income | | $ | 390,039,791 | | | $ | 605,010,646 | |
Net realized gain | | | 1,859,418,908 | | | | 1,130,060,343 | |
Net change in unrealized appreciation | | | 1,001,064,131 | | | | 2,657,836,787 | |
| | |
|
|
| |
|
|
|
Net increase in net assets from operations | | | 3,250,522,830 | | | | 4,392,907,776 | |
| | |
|
|
| |
|
|
|
| | |
| Distributions to Shareholders from: | | | | | | | | |
Net investment income | | | (357,818,445 | ) | | | (611,260,756 | ) |
Net realized gain | | | (101,086,348 | ) | | | (1,222,133,564 | ) |
| | |
|
|
| |
|
|
|
Total distributions | | | (458,904,793 | ) | | | (1,833,394,320 | ) |
| | |
|
|
| |
|
|
|
| | |
| Fund Share Transactions: | | | | | | | | |
Proceeds from sale of shares | | | 5,321,638,486 | | | | 9,806,907,602 | |
Reinvestment of distributions | | | 422,688,806 | | | | 1,700,707,781 | |
Cost of shares redeemed | | | (3,431,792,395 | ) | | | (5,149,262,920 | ) |
| | |
|
|
| |
|
|
|
Net increase from Fund share transactions | | | 2,312,534,897 | | | | 6,358,352,463 | |
| | |
|
|
| |
|
|
|
Total increase in net assets | | | 5,104,152,934 | | | | 8,917,865,919 | |
| | |
| Net Assets: | | | | | | | | |
Beginning of period | | | 52,184,209,315 | | | | 43,266,343,396 | |
| | |
|
|
| |
|
|
|
End of period (including undistributed net investment income of $34,894,136 and $2,672,790, respectively) | | $ | 57,288,362,249 | | | $ | 52,184,209,315 | |
| | |
|
|
| |
|
|
|
| | |
| Share Information: | | | | | | | | |
Shares sold | | | 37,152,113 | | | | 74,426,365 | |
Distributions reinvested | | | 2,934,514 | | | | 12,641,751 | |
Shares redeemed | | | (23,878,985 | ) | | | (39,005,611 | ) |
| | |
|
|
| |
|
|
|
Net increase in shares outstanding | | | 16,207,642 | | | | 48,062,505 | |
| | |
|
|
| |
|
|
|
| | |
| 7 / Dodge & Cox Stock Fund | | See accompanying Notes to Financial Statements |
Notes to Financial Statements (unaudited)
Note 1 — Organization and Significant Accounting Policies
Dodge & Cox Stock Fund (the “Fund”) is one of the series constituting the Dodge & Cox Funds (the “Trust” or the “Funds”). The Trust is organized as a Delaware statutory trust and is registered under the Investment Company Act of 1940, as amended, as a diversified, open-end management investment company. The Fund commenced operations on January 4, 1965, and seeks long-term growth of principal and income. Risk considerations and investment strategies of the Fund are discussed in the Fund’s Prospectus. The Fund is closed to new investors.
The financial statements have been prepared in conformity with accounting principles generally accepted in the United States of America, which require the use of estimates and assumptions by management. Significant accounting policies are as follows:
Security valuation. The Fund’s net assets are valued as of the close of trading on the New York Stock Exchange (NYSE), generally 4:00 p.m. Eastern Time, each day that the NYSE is open for business. Stocks are valued at the official quoted close price or the last sale of the day at the close of the NYSE or, if not available, at the mean between the exchange listed bid and ask prices for the day. A security that is listed or traded on more than one exchange is valued at the quotation on the exchange determined to be the primary market for such security. Security values are not discounted based on the size of the Fund’s position. Securities for which market quotations are not readily available are valued at fair value as determined in good faith by or at the direction of the Board of Trustees. Short-term securities are valued at amortized cost which approximates current value. All securities held by the Fund are denominated in U.S. dollars.
Security transactions, investment income, expenses, and distributions. Security transactions are recorded on the trade date. Realized gains and losses on securities sold are determined on the basis of identified cost.
Dividend income and corporate action transactions are recorded on the ex-dividend date, except for certain dividends or corporate actions from foreign securities where the ex-dividend date may have passed, which are recorded as soon as the Fund is informed of the ex-dividend date. Withholding taxes on foreign dividends have been provided for in accordance with the Fund’s understanding of the applicable country’s tax rules and rates. Non-cash dividends included in dividend income, if any, are recorded at the fair market value of the securities received. Distributions received in excess of income are recorded as a reduction of cost of investments and/or realized gain. The Fund may estimate the character of distributions received from Real Estate Investment Trusts (“REITs”). Interest income is recorded on the accrual basis.
Expenses are recorded on the accrual basis. Most expenses of the Trust can be directly attributed to a specific series. Expenses which cannot be directly attributed are apportioned among the Funds in the Trust.
Distributions to shareholders are recorded on the ex-dividend date.
Repurchase agreements. The Fund may enter into repurchase agreements secured by U.S. government securities which involve the purchase of securities from a counterparty with a simultaneous commitment to resell the securities at an agreed-upon date and price. It is the Fund’s policy that its custodian take possession of the underlying collateral securities, the fair value of which exceeds the principal amount of the repurchase transaction, including accrued interest, at all times. In the event of default by the counterparty, the Fund has the contractual right to liquidate the securities and to apply the proceeds in satisfaction of the obligation.
Note 2 — Related Party Transactions
Management fees. Under a written agreement, the Fund pays an annual management fee of 0.50% of the Fund’s average daily net assets to Dodge & Cox, investment manager of the Fund. The agreement further provides that Dodge & Cox shall waive its fee to the extent that such fee plus all other ordinary operating expenses of the Fund exceed 0.75% of the average daily net assets for the year.
Fund officers and trustees. All officers and four of the trustees of the Trust are officers or employees of Dodge & Cox. The Trust pays a fee only to those trustees who are not affiliated with Dodge & Cox.
Indemnification. Under the Trust’s organizational documents, its officers and trustees are indemnified against certain liabilities arising out of the performance of their duties to the Trust. In addition, in the normal course of business the Trust enters into contracts that provide general indemnities to other parties. The Trust’s maximum exposure under these arrangements is unknown as this would involve future claims that may be made against the Trust that have not yet occurred.
Note 3 — Income Tax Information
A provision for federal income taxes is not required since the Fund intends to continue to qualify as a regulated investment company under Subchapter M of the Internal Revenue Code and distribute all of its taxable income to shareholders.
Distributions are determined in accordance with income tax regulations, which may differ from net investment income and realized gains for financial reporting purposes. Financial reporting records are adjusted for permanent book/tax differences to reflect tax character. Financial records are not adjusted for temporary differences.
| | |
| | | Dodge & Cox Stock Fund / 8 |
Notes to Financial Statements (unaudited) (continued)
Book/tax differences are primarily due to differing treatments of net short-term realized gain. At June 30, 2006, the cost of investments for federal income tax purposes was equal to the cost for financial reporting purposes.
Distributions during the period ended June 30, 2006 were characterized as follows for federal income tax purposes:
| | | |
| Ordinary income ($.91 per share) | | $ | 357,818,445 |
| Long-term capital gain ($.258 per share) | | | 101,086,348 |
| | |
|
|
| Total distributions ($1.168 per share) | | $ | 458,904,793 |
| | |
|
|
At June 30, 2006, the tax basis components of distributable earnings were as follows:
| | | | |
Unrealized appreciation | | $ | 13,791,213,425 | |
Unrealized depreciation | | | (236,760,074 | ) |
| | |
|
|
|
Net unrealized appreciation | | | 13,554,453,351 | |
Undistributed ordinary income | | | 121,508,122 | |
Undistributed long-term capital gain | | | 1,772,804,922 | |
Note 4 — Purchase and Sales of Investments
For the period ended June 30, 2006, purchases and sales of securities, other than short-term securities, aggregated $5,892,029,696 and $3,815,261,375, respectively.
Note 5 — Holdings of 5% Voting Securities
Each of the companies listed below is considered to be an affiliate of the Fund because the Fund owned 5% or more of the company’s voting securities during the period ended June 30, 2006. Transactions during the period in securities of affiliated companies were as follows:
| | | | | | | | | | | | | | | | | |
| | | Shares at
Beginning of Period | | Additions | | Reductions | | | Shares at
End of Period | | Dividend
Income(a) | | | Value at End of Period | |
| | | | | | |
Akzo Nobel NV ADR (Netherlands) | | 16,294,523 | | 4,500 | | (3,491,800 | ) | | 12,807,223 | | $ | 11,000,100 | | | $ | — | (c) |
| | | | | | |
American Power Conversion Corp. | | 6,347,281 | | 4,684,704 | | — | | | 11,031,985 | | | 1,460,153 | | | | 215,013,388 | |
| | | | | | |
Avaya, Inc. | | 31,552,500 | | 13,800 | | (471,376 | ) | | 31,094,924 | | | — | (b) | | | 355,104,032 | |
| | | | | | |
BMC Software, Inc. | | 15,440,000 | | 5,500 | | — | | | 15,445,500 | | | — | (b) | | | 369,147,450 | |
| | | | | | |
Computer Sciences Corp. | | 12,853,900 | | 5,000 | | — | | | 12,858,900 | | | — | (b) | | | 622,885,116 | |
| | | | | | |
Compuware Corp. | | 19,297,600 | | 15,000 | | — | | | 19,312,600 | | | — | (b) | | | 129,394,420 | |
| | | | | | |
Dillard's, Inc. Class A | | 5,161,600 | | — | | (5,161,600 | ) | | — | | | 138,245 | | | | — | (c) |
| | | | | | |
Electronic Data Systems Corp. | | 34,697,300 | | 14,000 | | — | | | 34,711,300 | | | 3,469,730 | | | | 835,153,878 | |
| | | | | | |
Engelhard Corp. | | 8,265,600 | | — | | (8,265,600 | ) | | — | | | 991,872 | | | | — | (c) |
| | | | | | |
Equity Office Properties Trust | | 23,332,200 | | 9,000 | | — | | | 23,341,200 | | | 15,402,222 | | | | 852,187,212 | |
| | | | | | |
Fluor Corp. | | 4,362,050 | | — | | (4,362,050 | ) | | — | | | — | | | | — | (c) |
| | | | | | |
Genuine Parts Co. | | 8,926,300 | | 5,000 | | — | | | 8,931,300 | | | 6,025,252 | | | | 372,077,958 | |
| | | | | | |
HCA, Inc. | | 20,475,800 | | 3,409,000 | | — | | | 23,884,800 | | | 6,603,256 | | | | 1,030,629,120 | |
| | | | | | |
Interpublic Group of Companies, Inc. | | 17,478,300 | | 9,220,900 | | — | | | 26,699,200 | | | — | (b) | | | 222,938,320 | |
| | | | | | |
Nova Chemicals Corp. (Canada) | | 4,737,970 | | 2,500 | | — | | | 4,740,470 | | | 707,631 | | | | 136,478,131 | |
| | | | | | |
Thermo Electron Corp. | | 8,906,800 | | 204,500 | | — | | | 9,111,300 | | | — | (b) | | | 330,193,512 | |
| | | | | | |
Union Pacific Corp. | | 14,815,250 | | 5,400 | | — | | | 14,820,650 | | | 8,889,150 | | | | 1,377,727,624 | |
| | | | | | |
Whirlpool Corp. | | 3,558,750 | | — | | (3,558,750 | ) | | — | | | 1,530,263 | | | | — | (c) |
| | | | | | |
Xerox Corp. | | 64,118,600 | | 27,000 | | — | | | 64,145,600 | | | — | (b) | | | 892,265,296 | |
| | | | | | | | | | | |
|
|
| |
|
|
|
| | | | | | | | | | | | $ | 56,217,874 | | | $ | 7,741,195,457 | |
| | | | | | | | | | | |
|
|
| |
|
|
|
| (a) | | Net of foreign taxes, if any |
| (c) | | Company was not an affiliate at the end of the period |
| | |
| 9 / Dodge & Cox Stock Fund | | |
Financial Highlights (unaudited)
| | | | | | | | | | | | | | | | | | | | | | |
SELECTED DATA AND RATIOS (for a share outstanding throughout each year) | | | | Six Months
Ended June 30, | | | | | Year Ended December 31, | |
| | | | | 2006 | | | | | 2005 | | | 2004 | | | 2003 | | | 2002 | | | 2001 | |
Net asset value, beginning of period | | | | $137.22 | | | | | $130.22 | | | $113.78 | | | $ 88.05 | | | $100.51 | | | $ 96.67 | |
| | | | | | | | |
Income from investment operations: | | | | | | | | | | | | | | | | | | | | | | |
Net investment income | | | | 0.99 | | | | | 1.68 | | | 1.54 | | | 1.60 | | | 1.53 | | | 1.72 | |
Net realized and unrealized gain (loss) | | | | 7.44 | | | | | 10.36 | | | 20.08 | | | 26.59 | | | (12.06 | ) | | 7.05 | |
| | | | |
|
| | | |
|
|
Total from investment operations | | | | 8.43 | | | | | 12.04 | | | 21.62 | | | 28.19 | | | (10.53 | ) | | 8.77 | |
| | | | |
|
| | | |
|
|
Distributions to shareholders from: | | | | | | | | | | | | | | | | | | | | | | |
Net investment income | | | | (0.91 | ) | | | | (1.70 | ) | | (1.53 | ) | | (1.62 | ) | | (1.51 | ) | | (1.73 | ) |
Net realized gain | | | | (0.26 | ) | | | | (3.34 | ) | | (3.65 | ) | | (0.84 | ) | | (0.42 | ) | | (3.20 | ) |
| | | | |
|
| | | |
|
|
Total distributions | | | | (1.17 | ) | | | | (5.04 | ) | | (5.18 | ) | | (2.46 | ) | | (1.93 | ) | | (4.93 | ) |
| | | | |
|
| | | |
|
|
Net asset value, end of period | | | | $144.48 | | | | | $137.22 | | | $130.22 | | | $113.78 | | | $ 88.05 | | | $100.51 | |
| | | | |
|
| | | |
|
|
Total return | | | | 6.15 | % | | | | 9.36 | % | | 19.16 | % | | 32.35 | % | | (10.52 | )% | | 9.33 | % |
Ratios/supplemental data: | | | | | | | | | | | | | | | | | | | | | | |
Net assets, end of period (millions) | | | | $57,288 | | | | | $52,184 | | | $43,266 | | | $29,437 | | | $14,036 | | | $9,396 | |
Ratio of expenses to average net assets | | | | 0.52 | %* | | | | 0.52 | % | | 0.53 | % | | 0.54 | % | | 0.54 | % | | 0.54 | % |
Ratio of net investment income to average net assets | | | | 1.40 | %* | | | | 1.29 | % | | 1.32 | % | | 1.72 | % | | 1.74 | % | | 1.80 | % |
Portfolio turnover rate | | | | 7 | % | | | | 12 | % | | 11 | % | | 8 | % | | 13 | % | | 10 | % |
See accompanying Notes to Financial Statements.
Fund Holdings
The Fund provides a complete list of its holdings four times each fiscal year, as of the end of each quarter. The lists appear in the Fund’s First Quarter, Semi-Annual, Third Quarter and Annual Reports to shareholders. The Fund files the lists with the Securities and Exchange Commission (SEC) on Form N-CSR (second and fourth quarters) and Form N-Q (first and third quarters). Shareholders may view the Fund’s Forms N-CSR and N-Q on the SEC’s website at www.sec.gov. Forms N-CSR and N-Q may also be reviewed and copied at the SEC’s Public Reference Room in Washington, DC. Information regarding the operations of the Public Reference Room may be obtained by 1-202-942-8090 (direct) or 1-800-732-0330 (general SEC number). A complete list of the Fund’s quarter-end holdings are also available at www.dodgeandcox.com on or about 15 days following each quarter end and remains available on the web site until the list is updated in the subsequent quarter.
Proxy Voting
For a free copy of the Fund’s proxy voting policies and procedures, please call 1-800-621-3979, visit the Fund’s web site at www.dodgeandcox.com or visit the SEC’s web site at www.sec.gov. Information regarding how the Fund voted proxies relating to portfolio securities during the most recent 12-month period ending June 30 is also available at www.dodgeandcox.com or at www.sec.gov.
| | |
| | | Dodge & Cox Stock Fund / 10 |
Officers and Trustees
Harry R. Hagey, Chairman & Trustee
Chairman, Dodge & Cox
John A. Gunn, President & Trustee
Chief Executive Officer & Chief Investment Officer, Dodge & Cox
Kenneth E. Olivier, Vice President & Trustee
President, Dodge & Cox
Dana M. Emery, Vice President & Trustee
Executive Vice President, Dodge & Cox
William F. Ausfahl, Trustee
Former Chief Financial Officer and member of Board of Directors, The Clorox Company
L. Dale Crandall, Trustee
Former President, Kaiser Foundation Health Plan and Hospitals
Thomas A. Larsen, Trustee
Director, Howard, Rice, Nemerovski, Canady, Falk & Rabkin
John B. Taylor, Trustee
Professor of Economics, Stanford University; Senior Fellow, Hoover Institute and former Under Secretary for International Affairs, United States Treasury
Will C. Wood, Trustee
Principal, Kentwood Associates, Financial Advisers
Katherine Herrick Drake, Vice President
Vice President, Dodge & Cox
Diana S. Strandberg, Vice President
Vice President, Dodge & Cox
John M. Loll, Treasurer & Assistant Secretary
Vice President & Treasurer, Dodge & Cox
Thomas M. Mistele, Secretary & Assistant Treasurer
Chief Operating Officer, Secretary & General Counsel, Dodge & Cox
Marcia P. Venegas, Chief Compliance Officer
Chief Compliance Officer, Dodge & Cox
David H. Longhurst, Assistant Treasurer
Fund Administration and Accounting Senior Manager, Dodge & Cox

International
Stock Fund
Established 2001

Semi-Annual Report
June 30, 2006
2006
International Stock Fund
www.dodgeandcox.com
For Fund literature, transactions and account
information, please visit the Funds’ web site.
or write or call:
Dodge & Cox Funds
c/o Boston Financial Data Services
P.O. Box 8422
Boston, Massachusetts 02266-8422
(800) 621-3979
Investment Manager
Dodge & Cox
555 California Street, 40th Floor
San Francisco, California 94104
(415) 981-1710
This report is submitted for the general information of the shareholders of the Fund. The report is not authorized for distribution to prospective investors in the Fund unless it is accompanied by a current prospectus.
This report reflects our views, opinions and portfolio holdings as of June 30, 2006, the end of the reporting period. Any such views are subject to change at any time based upon market or other conditions and Dodge & Cox disclaims any responsibility to update such views. These views may not be relied on as investment advice and, because investment decisions for a Dodge & Cox Fund are based on numerous factors, may not be relied on as an indication of trading intent on behalf of any Dodge & Cox Fund.
06/06 ISF SAR  Printed on recycled paper
To Our Shareholders
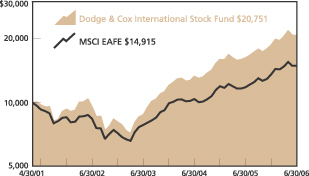
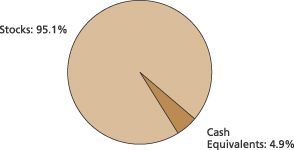
The Dodge & Cox International Stock Fund had a total return of 11.2% for the six months ended June 30, 2006, compared to a total return of 10.2% for the Morgan Stanley Capital International Europe, Australasia, Far East Index (MSCI EAFE). Longer-term results can be found on the following page. At quarter end, the Fund had net assets of $21.2 billion with a cash position of 4.9%.
Performance Review
For the first six months of 2006, the Fund performed well on an absolute basis and relative to the MSCI EAFE. The following factors contributed to performance:
| • | | The Fund’s investments in the Energy sector averaged a total return of 24% compared to 12% for the MSCI EAFE Energy sector. Notable performers included Schlumberger, Norsk Hydro and Petrobras, which had total returns of 34%, 32% and 27%, respectively. |
| • | | The Fund’s investments in the Industrials sector averaged a total return of 18% compared to 8% for the MSCI EAFE Industrials sector. Notable performers included Nexans and Sulzer, which had total returns of 52% and 43%, respectively. |
In contrast, the Fund’s holdings in emerging markets, except for Brazil, detracted from results as these markets declined significantly in the period following the market peak of May 9, 2006. Weak performers year-to-date included LG.Philips (down 16%), Standard Bank Group (down 8%) and Kasikornbank (down 9%).
Changes in foreign currencies had a positive effect on the Fund’s performance, as developed and emerging market currencies appreciated against the U.S. dollar. As always, we focus on the medium and long-term effects of currency changes on a company’s operations and finances, not on predicting short-term currency fluctuations.
A Wild Ride
International equity markets advanced until May of this year, continuing the upward trend of the past three years as global economic growth continued at a healthy pace. By May 9th, developed markets were up 19% and emerging markets were up 26%. Then equity markets tumbled from May 9th to June 13th— developed markets were down 15% and emerging markets were
down 24%. Markets then sharply rebounded over the next two weeks—developed markets were up 8% and emerging markets were up 13%. This equity market volatility reflects uncertainty about continued global economic growth, the outlook for inflation and geopolitical stability.
In our experience, it seems unlikely that long-term company earnings and cash flow prospects have changed as dramatically, up or down, as the recent market volatility would suggest. While we do not dismiss current concerns, we remain optimistic that the underpinnings for long-term global growth remain intact. The participation of a greater portion of the world in free market economies, significant economic improvement in the developing world, and economic expansion in Japan after years of low or no growth are some of the elements that give us confidence in the global economy’s long-term prospects.
In determining which investments we want to own in the Fund, we are guided by an individual company’s long-term earnings and cash flow prospects in relation to its current valuation. Our focus on the three-to-five year investment horizon enables us to respond to opportunities presented by short-term fluctuations in a company’s share price. When we take a step back and review the individual investment decisions over the past six months, two themes emerge:
| • | | Adding selectively to holdings in emerging markets. |
Since May 9th, we have found opportunities to add selectively to holdings in emerging markets whose long-term earnings and cash flow prospects have remained intact, and where market declines provided lower valuations. For example, we added to the Fund’s holdings in Grupo Televisa (a leading television and media company in Mexico), Standard Bank Group (one of the largest banks in South Africa) and Kookmin Bank (the largest bank in South Korea).
| • | | Continuing to add to dominant companies at low-to-reasonable valuations. |
The largest fifty companies represented in the MSCI EAFE (representing about a third of global market value outside the U.S.) can be considered a proxy of investors’ perceptions of dominant companies. As valuations have declined, we have increased the Fund’s exposure: 29% of the Fund is now invested in a selection from this group, up from only 19% three years
| | |
| 1 / Dodge & Cox International Stock Fund | | |
ago. Current holdings in this group include Nokia, GlaxoSmithKline and Vodafone.
One new holding in the Fund, HSBC Holdings, exemplifies this theme. Headquartered in the U.K., HSBC is one of the largest banks in the world and is present in 76 countries through 9,500 branches. The company has a global franchise with strengths in the United Kingdom, Mexico, U.S., Hong Kong and the Middle East. Given its size, geographic footprint and history of conservative management, we have followed HSBC closely for many years, though we had not owned it in light of its historic premium valuation. Recently, HSBC’s valuation has declined to the point where it no longer trades at a premium to its global peers, partly reflecting general skepticism about management’s ability to grow such a large enterprise. We believe HSBC’s current valuation does not reflect the attractive growth opportunities provided by its conservative balance sheet and global presence.
Outlook
Despite the recent market volatility, we remain persistent investors when a company’s current valuation appears attractive in relation to its longer-term fundamentals. We caution you that future returns for the Fund and the market are unlikely to keep pace with the returns of the past three years. We focus on the long-term growth prospects of international investing and urge you to share this perspective.
In Closing
Thank you for your continued confidence in the Dodge & Cox International Stock Fund. As always, we welcome your comments and questions.
Sincerely,
| | |
 | |  |
Harry R. Hagey
Chairman | | Diana S. Strandberg Vice President |
August 4, 2006
Growth of $10,000 Since Inception
For an investment made on April 30, 2001
Average Annual Total Return
for periods ended June 30, 2006
| | | | | | | | | | | | |
| | | 1 Year | | | 3 Years | | | 5 Years | | | Since
Inception
(5/1/01) | |
Dodge & Cox International Stock Fund | | 27.64 | % | | 33.39 | % | | 16.39 | %* | | 15.17 | %* |
MSCI EAFE | | 26.57 | | | 23.94 | | | 10.02 | | | 8.04 | |
Past performance does not guarantee future results. Investment return and share price will fluctuate with market conditions, and investors may have a gain or loss when shares are sold. Mutual fund performance changes over time and currently may be significantly lower than stated above. Performance is updated and published monthly. Visit the Fund’s web site at www.dodgeandcox.com or call 1-800-621-3979 for current performance figures.
| * | | Expense reimbursements were paid by Dodge & Cox from the Fund’s inception through June 30, 2003 to maintain operating expenses at 0.90%. Accordingly, without the expense reimbursements, the Fund’s returns prior to June 30, 2003 would have been lower. |
The Fund’s total returns include the reinvestment of dividend and capital gain distributions, but have not been adjusted for any income taxes payable on these distributions. The Morgan Stanley Capital International Europe, Australasia, Far East Index (MSCI EAFE) is a widely recognized benchmark of the world’s stock markets, excluding the United States. Index returns include dividends but, unlike Fund returns, do not reflect fees or expenses.
Morgan Stanley®, Morgan Stanley Capital International, and EAFE® are trademarks of Morgan Stanley.
Risks of International Investing: Foreign investing, especially in developing countries,
has special risks such as currency and market volatility and political and social instability.
These and other risk considerations are
discussed in the Fund’s prospectus.
| | |
| | | Dodge & Cox International Stock Fund / 2 |
Fund Expense Example
As a Fund shareholder, you incur ongoing Fund costs, including management fees and other Fund expenses. All mutual funds have ongoing costs, sometimes referred to as operating expenses.
The following example shows ongoing costs of investing in the Fund and can help you understand these costs and compare them with those of other mutual funds. The example assumes a $1,000 investment held for the six months indicated.
Actual Expenses
The first line of the table below provides information about actual account values and expenses based on the Fund’s actual returns. You may use the information in this line, together with your account balance, to estimate the expenses that you paid over the period. Simply divide your account value by $1,000 (for example, an $8,600 account value divided by $1,000 = 8.6), then multiply the result by the number in the first line under the heading “Expenses Paid During Period” to estimate the expenses you paid on your account during this period.
Hypothetical Example for Comparison with Other Mutual Funds
Information on the second line of the table can help you compare ongoing costs of investing in the Fund with those of other mutual funds. This information may not be used to estimate the actual ending account balance or expenses you paid during the period. The hypothetical “Ending Account Value” is based on the actual expense ratio of the Fund and an assumed 5% annual rate of return before expenses (not the Fund’s actual return). The amount under the heading “Expenses Paid During the Period” shows the hypothetical expenses your account would have incurred under this scenario. You can compare this figure with the 5% hypothetical examples that appear in shareholder reports of other mutual funds.
| | | | | | | | | |
Six Months Ended June 30, 2006 | | Beginning Account Value 1/1/2006 | | Ending Account Value 6/30/2006 | | Expenses Paid During Period* |
Based on Actual Fund Return | | $ | 1,000.00 | | $ | 1,112.20 | | $ | 3.49 |
Based on Hypothetical 5% Yearly Return | | | 1,000.00 | | | 1,021.49 | | | 3.34 |
| * | | Expenses are equal to the Fund’s annualized six-month expense ratio of 0.67%, multiplied by the average account value over the period, multiplied by 181/365 (to reflect the one-half year period). |
The expenses shown in the table highlight ongoing costs only and do not reflect any transactional costs or account maintenance fees. While other mutual funds may charge such fees, please note that the Fund does not charge transaction fees (e.g., redemption fees, sales loads) or universal account maintenance fees (e.g., small account fees).
| | |
| 3 / Dodge & Cox International Stock Fund | | |
Fund Information | June 30, 2006 |
General Information
| | |
Net Asset Value Per Share | | $38.96 |
Total Net Assets (billions) | | $21.2 |
Expense Ratio (annualized) | | 0.67% |
2005 Portfolio Turnover Rate | | 7% |
30-Day SEC Yield(a) | | 1.50% |
Fund Inception Date | | May 1, 2001 |
Investment Manager: Dodge & Cox, San Francisco. Managed by the International Investment Policy Committee, whose eight members’ average tenure at Dodge & Cox is 16 years.
| | | | |
| Portfolio Characteristics | | Fund | | MSCI
EAFE |
Number of Stocks | | 79 | | 1,171 |
Median Market Capitalization (billions) | | $13 | | $3 |
Weighted Avg. Market Capitalization (billions) | | $53 | | $49 |
Price-to-Earnings Ratio | | 12.7x | | 13.4x |
Countries Represented | | 19 | | 21 |
Emerging Markets (Brazil, Israel, Mexico, South Africa, South Korea, Thailand) | | 14.2% | | 0.0% |
| | | |
Ten Largest Holdings(b) | | Fund | |
Sanofi-Aventis (France) | | 3.3 | % |
News Corp. Class A (United States) | | 3.1 | |
GlaxoSmithKline PLC ADR (United Kingdom) | | 2.5 | |
Royal Bank of Scotland Group PLC (United Kingdom) | | 2.4 | |
Hitachi, Ltd. (Japan) | | 2.4 | |
Mitsubishi UFJ Financial Group ADR (Japan) | | 2.3 | |
Sony Corp. (Japan) | | 2.3 | |
Royal Dutch Shell PLC ADR (United Kingdom) | | 2.2 | |
Central Japan Railway Co. (Japan) | | 2.1 | |
Infineon Technologies AG (Germany) | | 2.1 | |
Asset Allocation
| | | | | | |
| Region Diversification | | Fund | | | MSCI
EAFE | |
Europe (excluding United Kingdom) | | 35.4 | % | | 43.4 | % |
Japan | | 22.3 | | | 24.5 | |
United Kingdom | | 14.8 | | | 24.2 | |
Pacific (excluding Japan) | | 7.4 | | | 7.9 | |
Latin America | | 7.3 | | | 0.0 | |
United States | | 5.2 | | | 0.0 | |
Africa | | 1.4 | | | 0.0 | |
Middle East | | 0.9 | | | 0.0 | |
Canada | | 0.4 | | | 0.0 | |
| | | | | | |
| Sector Diversification | | Fund | | | MSCI
EAFE | |
Financials | | 21.2 | % | | 29.3 | % |
Consumer Discretionary | | 14.8 | | | 11.9 | |
Information Technology | | 11.3 | | | 5.7 | |
Materials | | 10.9 | | | 8.5 | |
Industrials | | 9.1 | | | 10.8 | |
Energy | | 8.1 | | | 8.1 | |
Consumer Staples | | 7.6 | | | 7.6 | |
Health Care | | 7.2 | | | 7.8 | |
Telecommunication Services | | 3.9 | | | 5.2 | |
Utilities | | 1.0 | | | 5.1 | |
| (a) | | SEC Yield is an annualization of the Fund’s total net investment income per share for the 30-day period ended on the last day of the month. |
| (b) | | The Fund’s portfolio holdings are subject to change without notice. The mention of specific securities is not a recommendation or solicitation for any person to buy, sell or hold any particular security. |
| | |
| | | Dodge & Cox International Stock Fund / 4 |
Portfolio of Investments (unaudited) | June 30, 2006 |
| | | | | |
| COMMON STOCKS: 91.9% | | | | |
| | |
| | | SHARES | | VALUE |
| CONSUMER DISCRETIONARY: 14.8% | | | | | |
| AUTOMOBILES & COMPONENTS: 2.1% | | | | | |
Honda Motor Co., Ltd. ADR(b) (Japan) | | 13,730,800 | | $ | 436,914,056 |
| | | | |
|
|
| CONSUMER DURABLES & APPAREL: 8.1% | | | | | |
Consorcio Ara SA de CV(c) (Mexico) | | 20,679,800 | | | 85,153,458 |
Corporacion Geo SA de CV, Series B(a),(c) (Mexico) | | 42,105,400 | | | 139,519,095 |
Electrolux AB, Series B (Sweden) | | 197,800 | | | 2,858,401 |
Husqvarna AB, Series B(a) (Sweden) | | 2,698,100 | | | 32,523,038 |
Matsushita Electric Industrial Co., Ltd. (Japan) | | 21,291,000 | | | 449,298,890 |
Sony Corp. (Japan) | | 10,837,600 | | | 478,240,825 |
Thomson(c) (France) | | 13,868,792 | | | 229,363,776 |
Yamaha Corp.(c) (Japan) | | 16,151,400 | | | 303,438,570 |
| | | | |
|
|
| | | | | | 1,720,396,053 |
| MEDIA: 4.6% | | | | | |
Grupo Televisa SA de CV ADR(b) (Mexico) | | 16,131,720 | | | 311,503,513 |
News Corp., Class A (United States) | | 34,773,192 | | | 666,949,823 |
| | | | |
|
|
| | | | | | 978,453,336 |
| | | | |
|
|
| | | | | | 3,135,763,445 |
| CONSUMER STAPLES: 7.2% | | | | | |
| FOOD, BEVERAGE & TOBACCO: 6.4% | | | | | |
Cott Corp.(a),(b) (Canada) | | 2,205,100 | | | 28,798,606 |
Fomento Economico Mexicano SA de CV ADR(b) (Mexico) | | 2,714,058 | | | 227,220,936 |
Nestle SA (Switzerland) | | 1,321,000 | | | 414,922,907 |
Tesco PLC (United Kingdom) | | 71,164,379 | | | 439,534,862 |
Tiger Brands, Ltd. (South Africa) | | 3,703,360 | | | 74,118,851 |
Unilever NV(b) (Netherlands) | | 7,451,700 | | | 168,035,835 |
| | | | |
|
|
| | | | | | 1,352,631,997 |
| HOUSEHOLD & PERSONAL PRODUCTS: 0.8% | | | |
Aderans Co., Ltd.(c) (Japan) | | 2,733,200 | | | 73,799,266 |
Avon Products, Inc. (United States) | | 3,450,000 | | | 106,950,000 |
| | | | |
|
|
| | | | | | 180,749,266 |
| | | | |
|
|
| | | | | | 1,533,381,263 |
| ENERGY: 6.5% | | | | | |
Norsk Hydro ASA ADR(b) (Norway) | | 11,800,500 | | | 315,191,355 |
Royal Dutch Shell PLC ADR(b)
(United Kingdom) | | 6,851,600 | | | 458,920,168 |
Schlumberger, Ltd. (United States) | | 5,100,000 | | | 332,061,000 |
Total SA (France) | | 4,202,000 | | | 276,521,622 |
| | | | |
|
|
| | | | | | 1,382,694,145 |
| FINANCIALS: 20.5% | | | | | |
| BANKS: 14.3% | | | | | |
DBS Group Holdings, Ltd. (Singapore) | | 35,642,000 | | | 407,568,752 |
Grupo Financiero Banorte SA (Mexico) | | 43,834,600 | | | 101,651,051 |
HSBC Holdings PLC (United Kingdom) | | 22,500,000 | | | 395,890,890 |
Kasikornbank PLC Foreign (Thailand) | | 51,743,400 | | | 82,800,299 |
Kasikornbank PLC NVDR (Thailand) | | 60,787,500 | | | 94,083,486 |
Kookmin Bank ADR(b) (South Korea) | | 2,768,600 | | | 229,959,916 |
| | | | | |
| | |
| | | SHARES | | VALUE |
Mitsubishi UFJ Financial Group ADR(b) (Japan) | | 35,314,400 | | $ | 492,635,880 |
Royal Bank of Scotland Group PLC
(United Kingdom) | | 15,750,972 | | | 517,873,053 |
Shinsei Bank, Ltd. (Japan) | | 63,453,000 | | | 401,987,286 |
Standard Bank Group, Ltd. (South Africa) | | 20,196,234 | | | 216,891,216 |
Standard Chartered PLC (United Kingdom) | | 3,455,000 | | | 84,334,676 |
| | | | |
|
|
| | | | | | 3,025,676,505 |
| DIVERSIFIED FINANCIALS: 1.9% | | | | | |
Credit Suisse Group (Switzerland) | | 7,195,000 | | | 402,550,407 |
| | | | |
|
|
| INSURANCE: 4.3% | | | | | |
Aegon NV (Netherlands) | | 11,144,125 | | | 190,574,615 |
Converium Holdings AG(c) (Switzerland) | | 8,918,646 | | | 97,389,820 |
Swiss Life Holding (Switzerland) | | 1,051,770 | | | 246,478,349 |
Swiss Reinsurance(a) (Switzerland) | | 5,450,000 | | | 380,927,160 |
| | | | |
|
|
| | | | | | 915,369,944 |
| | | | |
|
|
| | | | | | 4,343,596,856 |
| HEALTH CARE: 7.2% | | | | | |
| HEALTH CARE EQUIPMENT & SERVICES: 1.5% | | | |
Fresenius Medical Care AG & Co. KGAA (Germany) | | 1,392,275 | | | 160,057,400 |
Mediceo Paltac Holdings Co., Ltd. (Japan) | | 8,459,700 | | | 151,171,675 |
| | | | |
|
|
| | | | | | 311,229,075 |
| PHARMACEUTICALS & BIOTECHNOLOGY: 5.7% | | | |
GlaxoSmithKline PLC ADR(b)
(United Kingdom) | | 9,327,200 | | | 520,457,760 |
Sanofi-Aventis (France) | | 7,159,000 | | | 698,657,893 |
| | | | |
|
|
| | | | | | 1,219,115,653 |
| | | | |
|
|
| | | | | | 1,530,344,728 |
| INDUSTRIALS: 9.1% | | | | | |
| CAPITAL GOODS: 5.1% | | | | | |
CNH Global NV(b) (Netherlands) | | 2,108,520 | | | 50,435,798 |
Nexans SA(c) (France) | | 1,866,440 | | | 133,090,352 |
Sulzer AG(c) (Switzerland) | | 290,121 | | | 217,374,206 |
Toto, Ltd.(c) (Japan) | | 28,657,000 | | | 273,949,301 |
Volvo AB, Series B (Sweden) | | 8,411,600 | | | 413,757,099 |
| | | | |
|
|
| | | | | | 1,088,606,756 |
| TRANSPORTATION: 4.0% | | | | | |
Central Japan Railway Co. (Japan) | | 45,550 | | | 453,748,689 |
Nippon Yusen Kabushiki Kaisha (Japan) | | 11,134,000 | | | 72,384,621 |
TNT NV (Netherlands) | | 8,700,000 | | | 311,354,131 |
| | | | |
|
|
| | | | | | 837,487,441 |
| | | | |
|
|
| | | | | | 1,926,094,197 |
| INFORMATION TECHNOLOGY: 11.3% | | | | | |
| SEMICONDUCTORS & SEMICONDUCTOR EQUIPMENT: 2.2% |
Infineon Technologies AG(a),(c) (Germany) | | 40,527,800 | | | 451,501,142 |
| | | | |
|
|
| TECHNOLOGY, HARDWARE & EQUIPMENT: 9.1% | | | |
Brother Industries, Ltd.(c) (Japan) | | 19,244,000 | | | 189,682,209 |
Canon, Inc. (Japan) | | 1,672,050 | | | 81,966,100 |
| | |
| 5 / Dodge & Cox International Stock Fund | | See accompanying Notes to Financial Statements |
Portfolio of Investments (unaudited) | June 30, 2006 |
| | | | | |
| COMMON STOCKS (continued) |
| | |
| | | SHARES | | VALUE |
Epcos AG(a),(c) (Germany) | | 5,178,100 | | $ | 72,986,022 |
Hitachi, Ltd. (Japan) | | 75,298,000 | | | 497,424,747 |
LG.Philips LCD Co., Ltd. ADR(a),(b)
(South Korea) | | 13,574,400 | | | 245,968,128 |
Nokia Oyj (Finland) | | 18,212,500 | | | 371,783,508 |
Oce NV(c) (Netherlands) | | 7,318,524 | | | 107,461,540 |
Seiko Epson Corp.(c) (Japan) | | 13,427,200 | | | 366,068,368 |
| | | | |
|
|
| | | | | | 1,933,340,622 |
| | | | |
|
|
| | | | | | 2,384,841,764 |
| MATERIALS: 10.9% | | | | | |
Akzo Nobel NV (Netherlands) | | 3,721,100 | | | 200,659,448 |
Arkema(a) (France) | | 2,893,611 | | | 112,919,780 |
BASF AG (Germany) | | 4,940,400 | | | 396,708,123 |
Bayer AG (Germany) | | 6,797,000 | | | 312,451,786 |
BHP Billiton, Ltd. (Australia) | | 3,785,078 | | | 81,568,047 |
Imperial Chemical Industries PLC
(United Kingdom) | | 26,945,762 | | | 180,876,144 |
Lafarge SA (France) | | 3,321,025 | | | 416,917,493 |
Lanxess AG(a) (Germany) | | 3,863,846 | | | 152,511,783 |
Makhteshim-Agan Industries, Ltd.(c) (Israel) | | 24,096,802 | | | 127,990,022 |
Nova Chemicals Corp. (Canada) | | 1,587,900 | | | 45,604,295 |
Rinker Group, Ltd. (Australia) | | 9,122,265 | | | 111,103,788 |
Yara International ASA (Norway) | | 13,468,710 | | | 179,585,685 |
| | | | |
|
|
| | | | | | 2,318,896,394 |
| TELECOMMUNICATION SERVICES: 3.9% | | | |
Bezeq Israeli Telecommunication Corp., Ltd. (Israel) | | 60,000,000 | | | 70,519,202 |
KT Corp. ADR(b) (South Korea) | | 14,958,400 | | | 320,857,680 |
Vodafone Group PLC ADR(b)
(United Kingdom) | | 20,167,500 | | | 429,567,750 |
| | | | |
|
|
| | | | | | 820,944,632 |
| UTILITIES: 0.5% | | | | | |
Centrica PLC (United Kingdom) | | 20,500,000 | | | 108,134,359 |
| | | | |
|
|
| | | | | | 108,134,359 |
| | | | |
|
|
TOTAL COMMON STOCKS (Cost $16,722,196,036) | | | 19,484,691,783 |
| | | | |
|
|
| | |
| PREFERRED STOCKS: 3.2% | | | | |
| CONSUMER STAPLES: 0.4% | | | | | |
| FOOD & STAPLES RETAILING: 0.4% | | | | | |
Sadia SA ADR(b) (Brazil) | | 3,126,100 | | | 81,872,559 |
| | | | |
|
|
| | | | | | 81,872,559 |
| ENERGY: 1.6% | | | | | |
Petroleo Brasileiro SA ADR(b) (Brazil) | | 4,136,000 | | | 330,218,240 |
| | | | |
|
|
| | | | | | 330,218,240 |
| | | | | | | |
| | |
| | | SHARES | | | VALUE |
| FINANCIALS: 0.7% | | | | | | | |
| BANKS: 0.7% | | | | | | | |
Uniao de Bancos Brasileiros SA GDR(b) (Brazil) | | | 2,316,500 | | | $ | 153,792,435 |
| | | | | | |
|
|
| | | | | | | | 153,792,435 |
| UTILITIES: 0.5% | | | | | | | |
Ultrapar Participacoes SA ADR(b) (Brazil) | | | 6,819,785 | | | | 107,275,218 |
| | | | | | |
|
|
| | | | | | | | 107,275,218 |
| | | | | | |
|
|
TOTAL PREFERRED STOCKS (Cost $381,232,655) | | | | 673,158,452 |
| | | | | | |
|
|
| |
| SHORT-TERM INVESTMENTS: 4.1% | | | |
| | |
| | | PAR VALUE | | | VALUE |
SSgA Prime Money Market Fund | | $ | 104,138,328 | | | $ | 104,138,328 |
State Street Repurchase Agreement 4.3%, 7/3/06, maturity value $767,944,081 (collateralized by U.S. Treasury Securities, value $783,030,175, 4.125%, 8/15/08) | | | 767,669,000 | | | | 767,669,000 |
| | | | | | |
|
|
TOTAL SHORT-TERM INVESTMENTS (Cost $871,807,328) | | | | | | | 871,807,328 |
| | | | | | |
|
|
TOTAL INVESTMENTS
(Cost $17,975,236,019) | | | 99.2 | % | | | 21,029,657,563 |
OTHER ASSETS LESS LIABILITIES | | | 0.8 | % | | | 157,375,571 |
| | |
|
|
| |
|
|
TOTAL NET ASSETS | | | 100.0 | % | | $ | 21,187,033,134 |
| | |
|
|
| |
|
|
| (b) | | Foreign security denominated in U.S. dollars |
| (c) | | See Note 5 regarding holdings of 5% voting securities |
ADR: American Depository Receipt
GDR: Global Depository Receipt
NVDR: Non Voting Depository Receipt
| | |
| See accompanying Notes to Financial Statements | | Dodge & Cox International Stock Fund / 6 |
| | | |
| Statement of Assets and Liabilities (unaudited) |
| |
| | | June 30, 2006 |
| Assets: | | | |
Investments, at value | | | |
Unaffiliated issuers (cost $15,394,738,867) | | $ | 18,160,890,416 |
Affiliated issuers (cost $2,580,497,152) | | | 2,868,767,147 |
| | |
|
|
| | | | 21,029,657,563 |
Cash denominated in foreign currency
(cost $55,274,838) | | | 55,345,666 |
Receivable for investments sold | | | 169,708,024 |
Receivable for Fund shares sold | | | 117,240,233 |
Dividends and interest receivable | | | 41,099,321 |
Prepaid expenses and other assets | | | 14,051 |
| | |
|
|
| | | | 21,413,064,858 |
| | |
|
|
| Liabilities: | | | |
Payable for investments purchased | | | 194,434,846 |
Payable for Fund shares redeemed | | | 19,628,842 |
Management fees payable | | | 9,959,720 |
Accrued expenses | | | 2,008,316 |
| | |
|
|
| | | | 226,031,724 |
| | |
|
|
| Net Assets | | $ | 21,187,033,134 |
| | |
|
|
| Net Assets Consist of: | | | |
Paid in capital | | $ | 17,618,192,328 |
Undistributed net investment income | | | 203,304,500 |
Undistributed net realized gain on investments | | | 309,977,548 |
Net unrealized appreciation on investments | | | 3,055,558,758 |
| | |
|
|
| | | $ | 21,187,033,134 |
| | |
|
|
Fund shares outstanding (par value $0.01 each, unlimited shares authorized) | | | 543,822,098 |
Net asset value per share | | | $38.96 |
|
| Statement of Operations (unaudited) |
| | | Six Months Ended
June 30, 2006 |
| Investment Income: | | | |
Dividends (net of foreign taxes of $28,442,914) | | | |
Unaffiliated issuers | | $ | 215,361,342 |
Affiliated issuers | | | 23,367,642 |
Interest | | | 22,339,033 |
| | |
|
|
| | | | 261,068,017 |
| | |
|
|
| Expenses: | | | |
Management fees | | | 53,665,560 |
Custody and fund accounting fees | | | 2,020,310 |
Transfer agent fees | | | 2,675,593 |
Professional services | | | 44,979 |
Shareholder reports | | | 516,890 |
Registration fees | | | 498,839 |
Trustees’ fees | | | 82,500 |
Miscellaneous | | | 28,582 |
| | |
|
|
| | | | 59,533,253 |
| | |
|
|
| Net Investment Income | | | 201,534,764 |
| | |
|
|
| Realized and Unrealized Gain on Investments: | | | |
Net realized gain | | | |
Investments in unaffiliated issuers | | | 241,457,269 |
Investments in affiliated issuers | | | 37,686,554 |
Foreign currency transactions | | | 3,102,537 |
Net change in unrealized appreciation (including net decrease in accrued foreign capital gain tax of $3,186,994) | | | 1,140,830,177 |
| | |
|
|
Net realized and unrealized gain | | | 1,423,076,537 |
| | |
|
|
| Net Increase in Net Assets from Operations | | $ | 1,624,611,301 |
| | |
|
|
| | | | | | | | |
| Statement of Changes in Net Assets (unaudited) | |
| | |
| | | Six Months Ended
June 30, 2006 | | | Year Ended
December 31, 2005 | |
| Operations: | | | | | | | | |
Net investment income | | $ | 201,534,764 | | | $ | 130,392,600 | |
Net realized gain | | | 282,246,360 | | | | 168,969,892 | |
Net change in unrealized appreciation | | | 1,140,830,177 | | | | 1,234,968,504 | |
| | |
|
|
| |
|
|
|
Net increase in net assets from operations | | | 1,624,611,301 | | | | 1,534,330,996 | |
| | |
|
|
| |
|
|
|
Distributions to
Shareholders from: | | | | | | | | |
Net investment income | | | — | | | | (132,300,734 | ) |
Net realized gain | | | — | | | | (142,355,951 | ) |
| | |
|
|
| |
|
|
|
Total distributions | | | — | | | | (274,656,685 | ) |
| | |
|
|
| |
|
|
|
| | |
| Fund Share Transactions: | | | | | | | | |
Proceeds from sale of shares | | | 7,458,874,146 | | | | 8,778,424,267 | |
Reinvestment of distributions | | | — | | | | 246,458,696 | |
Cost of shares redeemed | | | (1,253,697,160 | ) | | | (1,130,242,133 | ) |
| | |
|
|
| |
|
|
|
Net increase from Fund share transactions | | | 6,205,176,986 | | | | 7,894,640,830 | |
| | |
|
|
| |
|
|
|
Total increase in net assets | | | 7,829,788,287 | | | | 9,154,315,141 | |
| | |
| Net Assets: | | | | | | | | |
Beginning of period | | | 13,357,244,847 | | | | 4,202,929,706 | |
| | |
|
|
| |
|
|
|
End of period (including undistributed net investment income of $203,304,500 and $1,769,736, respectively) | | $ | 21,187,033,134 | | | $ | 13,357,244,847 | |
| | |
|
|
| |
|
|
|
| | |
| Share Information: | | | | | | | | |
Shares sold | | | 195,330,745 | | | | 272,160,308 | |
Distributions reinvested | | | — | | | | 7,035,645 | |
Shares redeemed | | | (32,853,452 | ) | | | (35,007,666 | ) |
| | |
|
|
| |
|
|
|
Net increase in shares outstanding | | | 162,477,293 | | | | 244,188,287 | |
| | |
|
|
| |
|
|
|
| | |
| 7 / Dodge & Cox International Stock Fund | | See accompanying Notes to Financial Statements |
Notes to Financial Statements (unaudited)
Note 1 — Organization and Significant Accounting Policies
Dodge & Cox International Stock Fund (the “Fund”) is one of the series constituting the Dodge & Cox Funds (the “Trust” or the “Funds”). The Trust is organized as a Delaware statutory trust and is registered under the Investment Company Act of 1940, as amended, as a diversified, open-end management investment company. The Fund commenced operations on May 1, 2001, and seeks long-term growth of principal and income, and the Fund invests primarily in a diversified portfolio of foreign stocks. Foreign investing, especially in developing countries, has special risks such as currency and market volatility and political and social instability. These and other risk considerations are discussed in the Fund’s Prospectus.
The financial statements have been prepared in conformity with accounting principles generally accepted in the United States of America, which require the use of estimates and assumptions by management. Significant accounting policies are as follows:
Security valuation. The Fund’s net assets are valued as of the close of trading on the New York Stock Exchange (NYSE), generally 4:00 p.m. Eastern Time, each day that the NYSE is open for business. Listed securities are valued at market, using as a price the official quoted close price or the last sale on the date of determination on the principal exchange on which such securities are traded or, if not available, at the mean between the exchange listed bid and ask prices for the day. A security that is listed or traded on more than one exchange is valued at the quotation on the exchange determined to be the primary market for such security. Security values are not discounted based on the size of the Fund’s position. Short-term securities are valued at amortized cost which approximates current value.
Investments initially valued in currencies other than the U.S. dollar are converted to the U.S. dollar using prevailing exchange rates. As a result, the Fund’s net asset value (NAV) may be affected by changes in the value of currencies in relation to the U.S. dollar.
If market quotations are not readily available or if a security’s value has materially changed after the close of the security’s primary market but before the close of trading on the NYSE, the security is valued at fair value as determined in good faith by or at the direction of the Board of Trustees. The Fund may use fair value pricing in calculating its NAV when, for example, (i) the primary market for a security is closed or if trading of a security is
suspended or limited, (ii) the Fund determines that the price provided by a pricing service is inaccurate or unreliable, or (iii) the Fund determines that a significant event affecting the value of a security has occurred before the close of the NYSE but after the close of the security’s primary market. An event is considered significant if there is both an affirmative expectation that the security’s value will change in response to the event and a reasonable basis for quantifying a resulting change in value. For securities that do not trade during NYSE hours, fair value determinations are based on analyses of market movements after the close of those securities’ primary markets, and include reviews of developments in foreign markets, the performance of U.S. securities markets, and the performance of instruments trading in U.S. markets that represent foreign securities and baskets of foreign securities. Pricing services are used to obtain closing market prices and to compute certain fair value adjustments utilizing computerized pricing models. When fair value pricing is employed, the prices of securities used by the Fund to calculate its net asset value may differ from quoted or published prices for the same securities. In addition, fair values may not reflect the price that the Fund could obtain for a security if it were to dispose of that security at the time of pricing.
Foreign currency translation. The Fund’s accounting records are maintained in U.S. dollars. The market values of foreign securities, currency holdings, and other assets and liabilities are translated into U.S. dollars at the prevailing rates of exchange at the end of each business day. Purchases and sales of securities, income receipts, and expenses are translated into U.S. dollars at the exchange rate in effect on the transaction date. Realized foreign currency gains and losses may arise from sales and maturities of foreign currency contracts, sales of foreign currencies, the difference between the amount of net investment income accrued and the U.S. dollar amount actually received, and from currency gains and losses between trade and settlement date on security transactions. The effects of exchange rate changes on investment securities are included with realized and unrealized gain (loss) on investments.
Foreign currency contracts. When the Fund purchases or sells foreign securities, it may enter into foreign exchange contracts to minimize foreign exchange risk from the trade date to the settlement date of the transaction. Losses from these transactions may arise from changes in the value of the foreign currency or if the counterparties do not perform under the contract’s terms.
| | |
| | | Dodge & Cox International Stock Fund / 8 |
Notes to Financial Statements (unaudited) (continued)
Security transactions, investment income, expenses, and distributions. Security transactions are recorded on the trade date. Realized gains and losses on securities sold are determined on the basis of identified cost.
Dividend income and corporate action transactions are recorded on the ex-dividend date, except for certain dividends or corporate actions from foreign securities where the ex-dividend date may have passed, which are recorded as soon as the Fund is informed of the ex-dividend date. Withholding taxes on foreign dividends have been provided for in accordance with the Fund’s understanding of the applicable country’s tax rules and rates. Non-cash dividends included in dividend income, if any, are recorded at the fair market value of the securities received. Distributions received in excess of income are recorded as a reduction of cost of investments and/or realized gain. Interest income is recorded on the accrual basis.
Expenses are recorded on the accrual basis. Most expenses of the Trust can be directly attributed to a specific series. Expenses which cannot be directly attributed are apportioned among the Funds in the Trust.
Distributions to shareholders are recorded on the ex-dividend date.
Repurchase agreements. The Fund may enter into repurchase agreements secured by U.S. government securities which involve the purchase of securities from a counterparty with a simultaneous commitment to resell the securities at an agreed-upon date and price. It is the Fund’s policy that its custodian take possession of the underlying collateral securities, the fair value of which exceeds the principal amount of the repurchase transaction, including accrued interest, at all times. In the event of default by the counterparty, the Fund has the contractual right to liquidate the securities and to apply the proceeds in satisfaction of the obligation.
Note 2 — Related Party Transactions
Management fees. Under a written agreement, the Fund pays an annual management fee of 0.60% of the Fund’s average daily net assets to Dodge & Cox, investment manager of the Fund.
Fund officers and trustees. All officers and four of the trustees of the Trust are officers or employees of Dodge & Cox. The Trust pays a fee only to those trustees who are not affiliated with Dodge & Cox.
Indemnification. Under the Trust’s organizational documents, its officers and trustees are indemnified against certain liabilities arising out of the performance of their duties to the Trust. In addition, in the normal course of business the Trust enters into contracts that provide general indemnities to other parties. The Trust’s maximum exposure under these arrangements is unknown as this would involve future claims that may be made against the Trust that have not yet occurred.
Note 3 — Income Tax Information and Distributions to Shareholders
A provision for federal income taxes is not required since the Fund intends to continue to qualify as a regulated investment company under Subchapter M of the Internal Revenue Code and distribute all of its taxable income to shareholders. Distributions are determined in accordance with income tax regulations, which may differ from net investment income and realized gains for financial reporting purposes. Financial reporting records are adjusted for permanent book/tax differences to reflect tax character. Financial records are not adjusted for temporary differences.
Certain foreign countries impose a tax on capital gains which is accrued by the Fund based on unrealized appreciation, if any, on affected securities. The tax is paid when the gain is realized.
Book/tax differences are primarily due to differing treatments of net short-term realized gain and foreign currency realized gain (loss). At June 30, 2006, the cost of investments for federal income tax purposes was equal to the cost for financial reporting purposes.
At June 30, 2006, the tax basis components of distributable earnings were as follows:
| | | | |
Unrealized appreciation | | $ | 3,284,575,418 | |
Unrealized depreciation | | | (229,016,660 | ) |
| | |
|
|
|
Net unrealized appreciation | | | 3,055,558,758 | |
Undistributed ordinary income | | | 277,318,810 | |
Undistributed long-term capital gain | | | 235,963,238 | |
Note 4 — Purchase and Sales of Investments
For the period ended June 30, 2006, purchases and sales of securities, other than short-term securities, aggregated $7,343,564,351 and $1,119,690,915, respectively.
| | |
| 9 / Dodge & Cox International Stock Fund | | |
Notes to Financial Statements (unaudited) (continued)
Note 5 — Holdings of 5% Voting Securities
Each of the companies listed below is considered to be an affiliate of the Fund because the Fund owned 5% or more of the company’s voting securities during the period ended June 30, 2006. Transactions during the period in securities of affiliated companies were as follows:
| | | | | | | | | | | | | | | | | |
| | | Shares at
Beginning of Period | | Additions | | Reductions | | | Shares at
End of Period | | Dividend
Income(a) | | | Value at End of Period | |
Aderans Co. (Japan) | | 2,733,200 | | — | | — | | | 2,733,200 | | $ | 477,266 | | | $ | 73,799,266 | |
Brother Industries, Ltd. (Japan) | | 19,244,000 | | — | | — | | | 19,244,000 | | | 1,072,452 | | | | 189,682,209 | |
Consorcio Ara SA de CV (Mexico) | | 20,679,800 | | — | | — | | | 20,679,800 | | | 7,163,631 | | | | 85,153,458 | |
Converium Holdings AG (Switzerland) | | 8,918,646 | | — | | — | | | 8,918,646 | | | 454,837 | | | | 97,389,820 | |
Corporacion Geo SA de CV Series B (Mexico) | | 42,105,400 | | — | | — | | | 42,105,400 | | | — | (b) | | | 139,519,095 | |
Elior (France) | | 6,958,147 | | 1,307,812 | | (8,265,959 | ) | | — | | | 1,271,406 | | | | — | (c) |
Epcos AG (Germany) | | 2,796,500 | | 2,381,600 | | — | | | 5,178,100 | | | — | (b) | | | 72,986,022 | |
Infineon Technologies AG (Germany) | | 20,500,000 | | 20,027,800 | | — | | | 40,527,800 | | | — | (b) | | | 451,501,142 | |
Makhteshim-Agan Industries, Ltd. (Israel) | | 19,300,000 | | 4,796,802 | | — | | | 24,096,802 | | | 1,667,447 | | | | 127,990,022 | |
Nexans SA (France) | | 1,616,440 | | 250,000 | | — | | | 1,866,440 | | | 1,853,699 | | | | 133,090,352 | |
Oce NV (Netherlands) | | 6,718,524 | | 600,000 | | — | | | 7,318,524 | | | 2,918,772 | | | | 107,461,540 | |
Seiko Epson Corp. (Japan) | | 9,254,100 | | 4,173,100 | | — | | | 13,427,200 | | | 1,573,231 | | | | 366,068,368 | |
Sulzer AG (Switzerland) | | 290,121 | | — | | — | | | 290,121 | | | 2,071,399 | | | | 217,374,206 | |
Thomson (France) | | 8,240,015 | | 5,628,777 | | — | | | 13,868,792 | | | — | | | | 229,363,776 | |
Toto, Ltd. (Japan) | | 15,654,000 | | 13,003,000 | | — | | | 28,657,000 | | | 1,356,401 | | | | 273,949,301 | |
Yamaha Corp. (Japan) | | 10,576,000 | | 8,275,000 | | (2,699,600 | ) | | 16,151,400 | | | 1,487,101 | | | | 303,438,570 | |
| | | | | | | | | | | |
|
|
| |
|
|
|
| | | | | | | | | | | | $ | 23,367,642 | | | $ | 2,868,767,147 | |
| | | | | | | | | | | |
|
|
| |
|
|
|
| (a) | | Net of foreign taxes, if any |
| (c) | | Company was not an affiliate at the end of the period |
Financial Highlights (unaudited)
| | | | | | | | | | | | | | | | | | | | | | | | |
SELECTED DATA AND RATIOS
(for a share outstanding throughout each period) | | | | Six Months Ended June 30, | | | | | Year Ended December 31, | | | | | May 1, 2001
through
December 31, | |
| | | | | 2006 | | | | | 2005 | | | 2004 | | | 2003 | | | 2002 | | | | | 2001 | |
Net asset value, beginning of period | | | | $35.03 | | | | | $30.64 | | | $23.48 | | | $15.81 | | | $18.42 | | | | | $20.00 | |
| | | | | | | | | |
Income from investment operations: | | | | | | | | | | | | | | | | | | | | | | | | |
Net investment income | | | | 0.37 | | | | | 0.33 | | | 0.26 | | | 0.14 | | | 0.13 | | | | | 0.14 | |
Net realized and unrealized gain (loss) | | | | 3.56 | | | | | 4.80 | | | 7.36 | | | 7.67 | | | (2.55 | ) | | | | (1.56 | ) |
| | | | |
|
|
Total from investment operations | | | | 3.93 | | | | | 5.13 | | | 7.62 | | | 7.81 | | | (2.42 | ) | | | | (1.42 | ) |
| | | | |
|
|
Distributions to shareholders from: | | | | | | | | | | | | | | | | | | | | | | | | |
Net investment income | | | | — | | | | | (0.35 | ) | | (0.24 | ) | | (0.14 | ) | | (0.13 | ) | | | | (0.14 | ) |
Net realized gain | | | | — | | | | | (0.39 | ) | | (0.22 | ) | | — | | | (0.06 | ) | | | | (0.02 | ) |
| | | | |
|
|
Total distributions | | | | — | | | | | (0.74 | ) | | (0.46 | ) | | (0.14 | ) | | (0.19 | ) | | | | (0.16 | ) |
| | | | |
|
|
Net asset value, end of period | | | | $38.96 | | | | | $35.03 | | | $30.64 | | | $23.48 | | | $15.81 | | | | | $18.42 | |
| | | | |
|
|
Total return | | | | 11.22 | % | | | | 16.74 | % | | 32.46 | % | | 49.42 | %† | | (13.11 | )%† | | | | (7.09 | )%† |
Ratios/supplemental data: | | | | | | | | | | | | | | | | | | | | | | | | |
Net assets, end of period (millions) | | | | $21,187 | | | | | $13,357 | | | $4,203 | | | $655 | | | $117 | | | | | $25 | |
Ratio of expenses to average net assets | | | | 0.67 | %* | | | | 0.70 | % | | 0.77 | % | | 0.82 | % | | 0.90 | % | | | | 0.90 | %* |
Ratio of expenses to average net assets, before reimbursement by investment manager | | | | 0.67 | %* | | | | 0.70 | % | | 0.77 | % | | 0.84 | % | | 1.03 | % | | | | 2.47 | %* |
Ratio of net investment income to
average net assets | | | | 2.25 | %* | | | | 1.54 | % | | 1.90 | % | | 1.53 | % | | 1.30 | % | | | | 1.74 | %* |
Portfolio turnover rate | | | | 7 | % | | | | 7 | % | | 6 | % | | 11 | % | | 12 | % | | | | 23 | % |
| † | | Expense reimbursements were paid by Dodge & Cox from the Fund’s inception through June 30, 2003 to maintain operating expenses at 0.90%. Accordingly, without the expense reimbursements, the Fund’s returns prior to June 30, 2003 would have been lower. |
| | |
| See accompanying Notes to Financial Statements | | Dodge & Cox International Stock Fund / 10 |
Fund’s Holdings
The Fund provides a complete list of its holdings four times each fiscal year, as of the end of each quarter. The lists appear in the Fund’s First Quarter, Semi-Annual, Third Quarter and Annual Reports to shareholders. The Fund files the lists with the Securities and Exchange Commission (SEC) on Form N-CSR (second and fourth quarters) and Form N-Q (first and third quarters). Shareholders may view the Fund’s Forms N-CSR and N-Q on the SEC’s website at www.sec.gov. Forms N-CSR and N-Q may also be reviewed and copied at the SEC’s Public Reference Room in Washington, DC. Information regarding the operations of the Public Reference Room may be obtained by 1-202-942-8090 (direct) or 1-800-732-0330 (general SEC number). A complete list of the Fund’s quarter-end holdings are also available at www.dodgeandcox.com on or about 15 days following each quarter end and remains available on the web site until the list is updated in the subsequent quarter.
Proxy Voting
For a free copy of the Fund’s proxy voting policies and procedures, please call 1-800-621-3979, visit the Fund’s web site at www.dodgeandcox.com or visit the SEC’s web site at www.sec.gov. Information regarding how the Fund voted proxies relating to portfolio securities during the most recent 12-month period ending June 30 is also available at www.dodgeandcox.com or at www.sec.gov.
Officers and Trustees
Harry R. Hagey, Chairman & Trustee
Chairman, Dodge & Cox
John A. Gunn, President & Trustee
Chief Executive Officer & Chief Investment Officer, Dodge & Cox
Kenneth E. Olivier, Vice President & Trustee
President, Dodge & Cox
Dana M. Emery, Vice President & Trustee
Executive Vice President, Dodge & Cox
William F. Ausfahl, Trustee
Former Chief Financial Officer and member of Board of Directors, The Clorox Company
L. Dale Crandall, Trustee
Former President, Kaiser Foundation Health Plan and Hospitals
Thomas A. Larsen, Trustee
Director, Howard, Rice, Nemerovski, Canady, Falk & Rabkin
John B. Taylor, Trustee
Professor of Economics, Stanford University; Senior Fellow, Hoover Institute and former Under Secretary for International Affairs, United States Treasury
Will C. Wood, Trustee
Principal, Kentwood Associates, Financial Advisers
Katherine Herrick Drake, Vice President
Vice President, Dodge & Cox
Diana S. Strandberg, Vice President
Vice President, Dodge & Cox
John M. Loll, Treasurer & Assistant Secretary
Vice President & Treasurer, Dodge & Cox
Thomas M. Mistele, Secretary & Assistant Treasurer
Chief Operating Officer, Secretary & General Counsel, Dodge & Cox
Marcia P. Venegas, Chief Compliance Officer
Chief Compliance Officer, Dodge & Cox
David H. Longhurst, Assistant Treasurer
Fund Administration and Accounting Senior Manager, Dodge & Cox
| | |
| 11 / Dodge & Cox International Stock Fund | | |

Balanced Fund
Established 1931
(Closed to New Investors)

Semi-Annual Report
June 30, 2006
2006
Balanced Fund
www.dodgeandcox.com
For Fund literature, transactions and account
information, please visit the Funds’ web site.
or write or call:
Dodge & Cox Funds
c/o Boston Financial Data Services
P.O. Box 8422
Boston, Massachusetts 02266-8422
(800) 621-3979
Investment Manager
Dodge & Cox
555 California Street, 40th Floor
San Francisco, California 94104
(415) 981-1710
This report is submitted for the general information of the shareholders of the Fund. The report is not authorized for distribution to prospective investors in the Fund unless it is accompanied by a current prospectus.
This report reflects our views, opinions and portfolio holdings as of June 30, 2006, the end of the reporting period. Any such views are subject to change at any time based upon market or other conditions and Dodge & Cox disclaims any responsibility to update such views. These views may not be relied on as investment advice and, because investment decisions for a Dodge & Cox Fund are based on numerous factors, may not be relied on as an indication of trading intent on behalf of any Dodge & Cox Fund.
06/06 BF SAR  Printed on recycled paper
To Our Shareholders
The Dodge & Cox Balanced Fund had a total return of 4.1% for the six months ended June 30, 2006, compared to a total return of 1.4% for the Combined Index1. Longer-term results can be found on the following page. At quarter end, the Fund’s net assets of $24.7 billion consisted of 63.3% stocks, 34.7% fixed-income securities and 2.0% cash equivalents.
Performance Review
The Fund’s first half performance was driven by the Fund’s equity holdings as rising interest rates in the bond market resulted in a minimal contribution from the fixed-income portfolio. Nevertheless, relative to returns from the respective components of the Combined Index, both the fixed-income and equity portfolios contributed to the Fund’s overall performance.
Equity Portfolio
The equity portion of the Fund handily outperformed the Standard & Poor’s 500 Index (S&P 500) over the first six months of the year. Key contributors to the portfolio’s performance included:
| • | | The portfolio’s holdings in the Consumer Discretionary sector, in combination with a higher overall weighting, provided the largest contribution to returns. Selected Media stocks, including Comcast (up 26%) and News Corp. (up 24%), performed well in the first half of 2006 (after a disappointing 2005). |
| • | | Holdings in the Information Technology sector also performed better than the corresponding S&P 500 sector, though technology was the weakest area of the market during the first half of the year. |
| • | | Energy holdings continued to perform well, with 9% of the equity portfolio invested in the sector, compared to 10% for the S&P 500. Over the long term, we expect the demand for oil in the developing world will continue to rise. Despite the rapid appreciation of energy companies over the past few years, the fundamental outlook remains positive and we want to retain some ownership in this area. |
Conversely, the portfolio’s single Telecom holding, Vodafone, was up only 2% versus the S&P 500 sector return of 14%. Additionally, a number of individual holdings which detracted from returns year-to-date include Dow Chemical (down 9%), HCA (down 14%), WellPoint (down 9%) and Cardinal Health (down 6%).
Fixed-Income Portfolio
For the first six months of 2006, the fixed-income portfolio’s return was essentially flat as price declines associated with generally rising yields largely offset the income earned during the period. Solid U.S. economic growth and higher inflation were the primary factors behind the significant rise in interest rates. Despite a small absolute return, the fixed-income portfolio outperformed the LBAG’s - -0.7% return. There were three primary drivers of this relative outperformance:
| • | | Several corporate bond holdings performed well; for example, the largest General Motors Acceptance Corp. (GMAC) holding returned 8.4%, and the largest Ford Motor Credit (FMCC) holding returned 6.9%. These two issuers together comprised 5.1% of the fixed-income portfolio as of quarter-end. |
| • | | The portfolio holds a relatively high percentage of short-maturity securities, whose prices are less sensitive to interest rate increases. |
| • | | The portfolio’s higher yield resulted in higher earned income relative to the LBAG. |
Current Strategy
Changes in the Fund’s holdings occur gradually over time—which should come as no surprise—given our long-term investment horizon. In fact, the current Fund holdings remain quite similar to those at year-end 2005. When we do make changes, they can be in response to changes in company fundamentals, or may be in response to changes in the relative valuations within our investment universe. In concept, we are “re-buying” the entire portfolio each day. It is a “bottom-up” process—a security-by-security analysis.
In the equity portfolio, the valuations of a number of holdings in the Industrials, Energy and Materials sectors have increased significantly during these recent years of economic expansion. On a price-to-sales measure, several companies were selling at or near their five-year highs during the first half of 2006, and we made the decision to sell Fluor, Rio Tinto and Amerada Hess. We continue to believe that these companies have attractive business opportunities ahead—a negative fundamental outlook is not the reason we decided to sell these positions. Rather, since a more optimistic outlook for future earnings is now incorporated in the higher stock prices, we look for more compelling relative valuations and investment opportunities elsewhere. We assess these trade-offs continually. The valuation of each company drives our individual security decisions, and relative valuation between companies is a key component in the evolution of the equity portfolio’s overall structure.
So where did we redeploy the proceeds from the trims and sales? A number of opportunities came into view in the Technology, Media and Health Care areas. For example, we started positions in Dell Computer and Echostar Communications, and added to the Fund’s holdings in Pfizer and Sanofi-Aventis. These companies are in sectors which have had some of the most dramatic re-valuations since the speculative equity market peaked in 2000. It has taken some years for those high valuations to decline to attractive levels, but we now believe that the lower investor expectations are more reasonable for some of these former “growth” companies.
We invest the fixed-income portfolio with a three-to-five year investment horizon and a focus on establishing a high and stable
| | |
| 1 / Dodge & Cox Balanced Fund | | |
rate of current income, consistent with the long-term preservation of capital. We also look to take advantage of opportunities in securities which have the potential for strong relative price performance. To that end, we rely upon a patient, disciplined approach to specific security selection that utilizes our independent, fundamental research capabilities. As with the equity portfolio, we employ a strong price discipline and typically make incremental adjustments to the fixed-income portfolio’s positioning as valuations, and fundamental conditions in the economy, markets, or specific companies/securities, change.
During the first half of 2006, the following changes were made to the fixed-income portion of the Fund:
| • | | Taking advantage of lower valuations, we increased the fixed-income portfolio’s Mortgage-Backed Securities (MBS) weighting from 34.4% to 44.1%, primarily through purchases of two types of Agency mortgage pass-through securities: slightly seasoned, low coupon, 30-year MBS and slightly seasoned, 30-year “Hybrid” ARM (Adjustable-Rate Mortgage) MBS. |
| • | | Within the Corporate sector, we initiated positions in three issuers and added to several existing portfolio holdings. The fixed-income portfolio’s Corporate weighting rose from 30.3% to 32.8%. |
| • | | Prompted by the higher yields and better relative return potential of the intermediate-maturity securities, we lengthened the portfolio’s duration2 from 3.3 years at the beginning of the period to 4.0 years by the end of June. |
In Closing
Balanced Fund investors typically seek the potential for capital appreciation historically provided by stocks, and the relative price stability and higher income provided by bonds. The return difference between these two areas has been stark as of late: the Fund’s stock portfolio has returned on average over six times the return of the Fund’s fixed-income portfolio over the last three years. We caution investors that it is not realistic to expect the Fund’s stocks to maintain such a pace. On the other hand, recent interest rate increases have significantly raised the fixed-income portfolio’s yield and the fixed-income holdings may, over time, have a more meaningful impact on future Fund returns than they have in the recent past. As always, we invest in both areas with an extended, three-to-five year investment horizon, and urge you to adopt a similar, long-term perspective to investing.
Thank you for continued confidence in our firm as a shareholder of the Dodge & Cox Balanced Fund. As always we welcome your comments and questions.
For the Board of Trustees,
| | |
 | | 
|
| |
| Harry R. Hagey, Chairman | | John A. Gunn, President |
August 4, 2006
Growth of $10,000 Over 10 Years
For an investment made on June 30, 1996
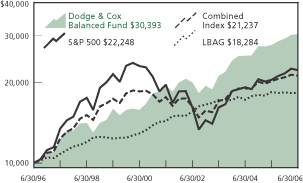
Average Annual Total Return
for periods ended June 30, 2006
| | | | | | | | | | | | |
| | | 1 Year | | | 5 Years | | | 10 Years | | | 20 Years | |
| | |
Dodge & Cox Balanced Fund | | 9.88 | % | | 9.27 | % | | 11.75 | % | | 12.11 | % |
Combined Index | | 4.84 | | | 3.77 | | | 7.82 | | | 9.87 | |
S&P 500 | | 8.67 | | | 2.50 | | | 8.32 | | | 11.03 | |
Lehman Brothers Aggregate Bond Index (LBAG) | | (0.81 | ) | | 4.97 | | | 6.22 | | | 7.38 | |
Past performance does not guarantee future results. Investment return and share price will fluctuate with market conditions, and investors may have a gain or loss when shares are sold. Mutual fund performance changes over time and currently may be significantly lower than stated above. Performance is updated and published monthly. Visit the Fund’s web site at www.dodgeandcox.com or call 1-800-621-3979 for current performance figures.
The Fund’s total returns include the reinvestment of dividend and capital gain distributions, but have not been adjusted for any income taxes payable by shareholders on these distributions. Index returns include dividends and/or interest income but, unlike Fund returns, do not reflect fees or expenses.
Lehman Brothers® is a trademark of Lehman Brothers, Inc.; Standard & Poor’s, Standard & Poor’s 500, and S&P 500® are trademarks of The McGraw-Hill Companies, Inc.
| 1 | | The Combined Index reflects an unmanaged portfolio of 60% of the Standard & Poor’s 500 Index (S&P 500) and 40% of the Lehman Brothers Aggregate Bond Index (LBAG). The Fund may, however, invest up to 75% of its total assets in stocks. |
| 2 | | Duration is a measure of a bond’s price sensitivity to changes in interest rates. |
| | |
| | | Dodge & Cox Balanced Fund / 2 |
Fund Expense Example
As a Fund shareholder, you incur ongoing Fund costs, including management fees and other Fund expenses. All mutual funds have ongoing costs, sometimes referred to as operating expenses.
The following example shows ongoing costs of investing in the Fund and can help you understand these costs and compare them with those of other mutual funds. The example assumes a $1,000 investment held for the six months indicated.
Actual Expenses
The first line of the table below provides information about actual account values and expenses based on the Fund’s actual returns. You may use the information in this line, together with your account balance, to estimate the expenses that you paid over the period. Simply divide your account value by $1,000 (for example, an $8,600 account value divided by $1,000 = 8.6), then multiply the result by the number in the first line under the heading “Expenses Paid During Period” to estimate the expenses you paid on your account during this period.
Hypothetical Example for Comparison with Other Mutual Funds
Information on the second line of the table can help you compare ongoing costs of investing in the Fund with those of other mutual funds. This information may not be used to estimate the actual ending account balance or expenses you paid during the period. The hypothetical “Ending Account Value” is based on the actual expense ratio of the Fund and an assumed 5% annual rate of return before expenses (not the Fund’s actual return). The amount under the heading “Expenses Paid During the Period” shows the hypothetical expenses your account would have incurred under this scenario. You can compare this figure with the 5% hypothetical examples that appear in shareholder reports of other mutual funds.
| | | | | | | | | |
Six Months Ended
June 30, 2006 | | Beginning Account
Value 1/1/2006 | | Ending Account
Value 6/30/2006 | | Expenses Paid
During Period* |
Based on Actual Fund Return | | $ | 1,000.00 | | $ | 1,040.90 | | $ | 2.67 |
Based on Hypothetical 5% Yearly Return | | | 1,000.00 | | | 1,022.18 | | | 2.65 |
| * | | Expenses are equal to the Fund’s annualized six-month expense ratio of 0.53%, multiplied by the average account value over the period, multiplied by 181/365 (to reflect the one-half year period). |
The expenses shown in the table highlight ongoing costs only and do not reflect any transactional costs or account maintenance fees. While other mutual funds may charge such fees, please note that the Fund does not charge transaction fees (e.g., redemption fees, sales loads) or universal account maintenance fees (e.g., small account fees).
| | |
| 3 / Dodge & Cox Balanced Fund | | |
Fund Information | June 30, 2006 |
General Information
| | |
Net Asset Value Per Share | | $83.57 |
Total Net Assets (billions) | | $24.7 |
Expense Ratio (annualized) | | 0.53% |
2005 Portfolio Turnover Rate | | 18% |
30-Day SEC Yield(a) | | 2.69% |
Fund Inception | | 1931 |
|
| Investment Manager: Dodge & Cox, San Francisco. Managed by the Investment Policy Committee, whose ten members’ average tenure at Dodge & Cox is 22 years (13 members, 21 years average tenure for certain fixed-income decisions), and by the Fixed-Income Strategy Committee, whose nine members’ average tenure is 16 years. |
| | |
Stock Portfolio (63.3% of Fund)
|
Number of Stocks | | 83 |
Median Market Capitalization (billions) | | $22 |
Price-to-Earnings Ratio | | 14.4x |
Foreign Stocks(b) (% of Fund) | | 11.2% |
| | |
| Five Largest Sectors | | % of Fund |
Consumer Discretionary | | 13.7 |
Health Care | | 10.9 |
Financials | | 10.8 |
Information Technology | | 8.6 |
Energy | | 6.1 |
| | |
Fixed-Income Portfolio (34.7% of Fund)
|
Number of Fixed-Income Securities | | 307 |
Average Maturity | | 6.2 years |
Effective Duration | | 4.0 years |
| |
| Credit Quality(d) | | % of Fund |
U.S. Government & Government Agencies | | 23.3 |
Aaa | | 0.0(e) |
Aa | | 0.7 |
A | | 1.6 |
Baa | | 4.8 |
Ba | | 4.1 |
B | | 0.2 |
Average Quality | | Aa |
Asset Allocation
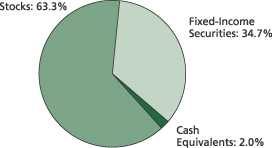
| | |
| |
| Ten Largest Stock Holdings(c) | | % of Fund |
Hewlett-Packard Co. | | 2.5 |
Comcast Corp. Class A | | 2.2 |
News Corp. Class A | | 1.9 |
Pfizer, Inc. | | 1.8 |
Sony Corp. ADR (Japan) | | 1.8 |
Chevron Corp. | | 1.7 |
Sanofi-Aventis ADR (France) | | 1.7 |
Union Pacific Corp. | | 1.6 |
Time Warner, Inc. | | 1.6 |
Cardinal Health, Inc. | | 1.6 |
| | |
| Sector Diversification | | % of Fund |
U.S. Treasury & Government Agency | | 8.0 |
Mortgage-Related Securities | | 15.3 |
Corporate | | 11.4 |
| | |
| Five Largest Corporate Fixed-Income Issuers(c) | | % of Fund |
Ford Motor Credit Co. | | 1.1 |
Time Warner, Inc. (AOL Time Warner) | | 0.8 |
GMAC | | 0.7 |
Xerox Corp. | | 0.7 |
HCA, Inc. | | 0.7 |
| (a) | | SEC Yield is an annualization of the Fund’s total net investment income per share for the 30-day period ended on the last day of the month. |
| (b) | | Foreign stocks are U.S. dollar-denominated. |
| (c) | | The Fund’s portfolio holdings are subject to change without notice. The mention of specific securities is not a recommendation or solicitation for any person to buy, sell or hold any particular security. |
| (d) | | Credit quality ratings are from Moody’s Investor Services. If no Moody’s rating is available, the Standard & Poor’s rating is reported. If unrated, the investment manager determines a comparable rating, which is included in the portfolio breakdown. In calculating average quality, the investment manager assigns ratings to U.S. Government and Government Agency securities that are higher than the ratings assigned to securities rated Aaa. The credit quality of the investments in the portfolio does not apply to the stability or safety of the Fund or its shares. |
| | |
| | | Dodge & Cox Balanced Fund / 4 |
Portfolio of Investments (unaudited) | June 30, 2006 |
| | | | | |
| COMMON STOCKS: 63.3% | | | | |
| | |
| | | SHARES | | VALUE |
| CONSUMER DISCRETIONARY: 13.7% | | | | | |
| AUTOMOBILES & COMPONENTS: 0.4% | | | | | |
Honda Motor Co., Ltd. ADR(b) (Japan) | | 2,863,300 | | $ | 91,110,206 |
| | | | |
|
|
| CONSUMER DURABLES & APPAREL: 3.8% | | | | | |
Matsushita Electric Industrial Co., Ltd. ADR(b) (Japan) | | 18,008,200 | | | 380,513,266 |
Sony Corp. ADR(b) (Japan) | | 10,293,600 | | | 453,330,144 |
Thomson ADR(b) (France) | | 1,900,000 | | | 31,350,000 |
VF Corp. | | 1,051,700 | | | 71,431,464 |
| | | | |
|
|
| | | | | | 936,624,874 |
| CONSUMER SERVICES: 1.5% | | | | | |
McDonald’s Corp. | | 10,869,850 | | | 365,226,960 |
| | | | |
|
|
| MEDIA: 6.6% | | | | | |
Comcast Corp., Class A(a) | | 16,681,716 | | | 546,159,382 |
Discovery Holdings Co., Series A(a) | | 396,378 | | | 5,799,010 |
EchoStar Communications Corp.(a) | | 2,117,286 | | | 65,233,582 |
Interpublic Group of Companies, Inc.(a) | | 6,817,000 | | | 56,921,950 |
Liberty Capital, Series A(a) | | 683,129 | | | 57,225,716 |
Liberty Interactive, Series A(a) | | 2,697,300 | | | 46,555,398 |
News Corp., Class A | | 25,007,900 | | | 479,651,522 |
Time Warner, Inc. | | 22,184,600 | | | 383,793,580 |
| | | | |
|
|
| | | | | | 1,641,340,140 |
| RETAILING: 1.4% | | | | | |
Federated Department Stores, Inc. | | 3,448,272 | | | 126,206,755 |
Gap, Inc. | | 6,102,800 | | | 106,188,720 |
Genuine Parts Co. | | 2,945,750 | | | 122,719,945 |
| | | | |
|
|
| | | | | | 355,115,420 |
| | | | |
|
|
| | | | | | 3,389,417,600 |
| CONSUMER STAPLES: 2.8% | | | | | |
| FOOD & STAPLES RETAILING: 1.5% | | | | | |
Wal-Mart Stores, Inc. | | 7,418,300 | | | 357,339,511 |
| | | | |
|
|
| FOOD, BEVERAGE & TOBACCO: 1.0% | | | | | |
Unilever NV(b) (Netherlands) | | 11,116,200 | | | 250,670,310 |
| | | | |
|
|
| HOUSEHOLD & PERSONAL PRODUCTS: 0.3% | | | |
Avon Products, Inc. | | 2,467,700 | | | 76,498,700 |
| | | | |
|
|
| | | | | | 684,508,521 |
| ENERGY: 6.1% | | | | | |
Baker Hughes, Inc. | | 2,802,400 | | | 229,376,440 |
Chevron Corp. | | 6,686,802 | | | 414,982,932 |
ConocoPhillips | | 3,366,600 | | | 220,613,298 |
Exxon Mobil Corp. | | 2,500,000 | | | 153,375,000 |
Occidental Petroleum Corp. | | 1,462,500 | | | 149,979,375 |
Royal Dutch Shell PLC ADR(b)
(United Kingdom) | | 3,116,127 | | | 217,723,794 |
Schlumberger, Ltd. | | 1,896,300 | | | 123,468,093 |
| | | | |
|
|
| | | | | | 1,509,518,932 |
| | | | | |
| | | SHARES | | VALUE |
| FINANCIALS: 10.8% | | | | | |
| BANKS: 2.5% | | | | | |
Golden West Financial Corp. | | 3,025,700 | | $ | 224,506,940 |
Wachovia Corp. | | 5,309,500 | | | 287,137,760 |
Wells Fargo & Co. | | 1,560,950 | | | 104,708,526 |
| | | | |
|
|
| | | | | | 616,353,226 |
| DIVERSIFIED FINANCIALS: 2.4% | | | | | |
Capital One Financial Corp. | | 3,507,500 | | | 299,715,875 |
Citigroup, Inc. | | 6,074,300 | | | 293,024,232 |
| | | | |
|
|
| | | | | | 592,740,107 |
| INSURANCE: 4.6% | | | | | |
Aegon NV(b) (Netherlands) | | 9,829,924 | | | 167,796,803 |
Chubb Corp. | | 3,384,224 | | | 168,872,778 |
Genworth Financial, Inc., Class A | | 2,448,000 | | | 85,288,320 |
Loews Corp. | | 6,649,500 | | | 235,724,775 |
MBIA, Inc. | | 787,068 | | | 46,082,831 |
Safeco Corp. | | 1,410,200 | | | 79,464,770 |
St. Paul Travelers Companies, Inc. | | 6,652,900 | | | 296,586,282 |
UnumProvident Corp. | | 3,795,400 | | | 68,810,602 |
| | | | |
|
|
| | | | | | 1,148,627,161 |
| REAL ESTATE: 1.3% | | | | | |
Equity Office Properties Trust | | 6,961,400 | | | 254,160,714 |
Equity Residential Properties Trust | | 1,379,800 | | | 61,718,454 |
| | | | |
|
|
| | | | | | 315,879,168 |
| | | | |
|
|
| | | | | | 2,673,599,662 |
| HEALTH CARE: 10.9% | | | | | |
| HEALTH CARE EQUIPMENT & SERVICES: 4.8% | | | |
Becton, Dickinson & Co. | | 1,317,900 | | | 80,563,227 |
Cardinal Health, Inc. | | 5,941,400 | | | 382,210,262 |
HCA, Inc. | | 6,803,800 | | | 293,583,970 |
Health Management Associates, Inc. | | 2,700,000 | | | 53,217,000 |
Thermo Electron Corp.(a) | | 3,335,850 | | | 120,891,204 |
WellPoint, Inc.(a) | | 3,523,000 | | | 256,368,710 |
| | | | |
|
|
| | | | | | 1,186,834,373 |
| PHARMACEUTICALS & BIOTECHNOLOGY: 6.1% | | | |
Bristol-Myers Squibb Co. | | 3,539,650 | | | 91,535,349 |
GlaxoSmithKline PLC ADR(b)
(United Kingdom) | | 3,875,400 | | | 216,247,320 |
Pfizer, Inc. | | 19,436,367 | | | 456,171,533 |
Sanofi-Aventis ADR(b) (France) | | 8,450,000 | | | 411,515,000 |
Schering-Plough Corp. | | 8,694,650 | | | 165,459,190 |
Wyeth | | 3,366,800 | | | 149,519,588 |
| | | | |
|
|
| | | | | | 1,490,447,980 |
| | | | |
|
|
| | | | | | 2,677,282,353 |
| | |
| 5 / Dodge & Cox Balanced Fund | | See accompanying Notes to Financial Statements |
Portfolio of Investments (unaudited) | June 30, 2006 |
| | | | | |
| COMMON STOCKS: (continued) | | |
| | |
| | | SHARES | | VALUE |
| INDUSTRIALS: 5.2% | | | | | |
| CAPITAL GOODS: 1.7% | | | | | |
American Power Conversion Corp. | | 2,876,659 | | $ | 56,066,084 |
Masco Corp. | | 3,051,000 | | | 90,431,640 |
Tyco International, Ltd. | | 8,065,600 | | | 221,804,000 |
Volvo AB ADR(b) (Sweden) | | 1,029,700 | | | 50,465,597 |
| | | | |
|
|
| | | | | | 418,767,321 |
| COMMERCIAL SERVICES & SUPPLIES: 0.4% | | | |
Pitney Bowes, Inc. | | 2,262,750 | | | 93,451,575 |
| | | | |
|
|
| TRANSPORTATION: 3.1% | | | | | |
FedEx Corp. | | 3,225,250 | | | 376,902,715 |
Union Pacific Corp. | | 4,273,700 | | | 397,283,152 |
| | | | |
|
|
| | | | | | 774,185,867 |
| | | | |
|
|
| | | | | | 1,286,404,763 |
| INFORMATION TECHNOLOGY: 8.6% | | | | | |
| SOFTWARE & SERVICES: 2.4% | | | | | |
BMC Software, Inc.(a) | | 4,525,100 | | | 108,149,890 |
Computer Sciences Corp.(a) | | 3,916,400 | | | 189,710,416 |
Compuware Corp.(a) | | 6,938,700 | | | 46,489,290 |
Electronic Data Systems Corp. | | 10,083,700 | | | 242,613,822 |
| | | | |
|
|
| | | | | | 586,963,418 |
| TECHNOLOGY, HARDWARE & EQUIPMENT: 6.2% | | | |
Avaya, Inc.(a) | | 9,335,100 | | | 106,606,842 |
Dell, Inc.(a) | | 4,265,400 | | | 104,118,414 |
Hewlett-Packard Co. | | 19,412,431 | | | 614,985,814 |
Hitachi, Ltd. ADR(b) (Japan) | | 1,090,000 | | | 72,016,300 |
Lexmark International, Inc.(a) | | 69,500 | | | 3,880,185 |
Motorola, Inc. | | 8,227,700 | | | 165,788,155 |
NCR Corp.(a) | | 2,231,850 | | | 81,774,984 |
Sun Microsystems, Inc.(a) | | 30,892,500 | | | 128,203,875 |
Xerox Corp.(a) | | 18,304,050 | | | 254,609,335 |
| | | | |
|
|
| | | | | | 1,531,983,904 |
| | | | |
|
|
| | | | | | 2,118,947,322 |
| MATERIALS: 3.4% | | | | | |
Akzo Nobel NV ADR(b) (Netherlands) | | 3,527,051 | | | 189,649,532 |
Alcoa, Inc. | | 2,275,650 | | | 73,640,034 |
Dow Chemical Co. | | 8,120,259 | | | 316,933,709 |
International Paper Co. | | 2,372,900 | | | 76,644,670 |
Nova Chemicals Corp.(b) (Canada) | | 1,442,870 | | | 41,540,227 |
Rohm and Haas Co. | | 2,802,800 | | | 140,476,336 |
| | | | |
|
|
| | | | | | 838,884,508 |
| TELECOMMUNICATION SERVICES: 0.7% | | | |
Vodafone Group PLC ADR(b) (United Kingdom) | | 7,800,400 | | | 166,148,520 |
| | | | |
|
|
| | | | | | 166,148,520 |
| UTILITIES: 1.1% | | | | | |
Duke Energy Corp. | | 6,762,300 | | | 198,608,751 |
FirstEnergy Corp. | | 1,245,100 | | | 67,496,871 |
| | | | |
|
|
| | | | | | 266,105,622 |
| | | | |
|
|
TOTAL COMMON STOCKS (Cost $11,262,455,848) | | | 15,610,817,803 |
| | | | |
|
|
| | | | | | |
| FIXED-INCOME SECURITIES: 34.7% | | |
| | |
| | | PAR VALUE | | VALUE |
| U.S. TREASURY AND GOVERNMENT AGENCY: 8.0% |
| U.S. TREASURY: 7.0% | | | | | | |
U.S. Treasury Notes | | | | | | |
3.50%, 11/15/06 | | $ | 28,500,000 | | $ | 28,318,541 |
2.875%, 11/30/06 | | | 213,000,000 | | | 210,936,456 |
3.125%, 1/31/07 | | | 400,000,000 | | | 395,046,800 |
3.375%, 2/15/08 | | | 200,000,000 | | | 194,390,600 |
3.75%, 5/15/08 | | | 350,000,000 | | | 341,154,450 |
3.625%, 7/15/09 | | | 375,000,000 | | | 359,340,750 |
3.375%, 9/15/09 | | | 210,000,000 | | | 199,327,800 |
| | | | | |
|
|
| | | | | | | 1,728,515,397 |
| GOVERNMENT AGENCY: 1.0% | | | | | | |
Arkansas Dev. Fin. Auth. GNMA Guaranteed Bonds 9.75%, 11/15/14 | | | 4,086,630 | | | 4,433,013 |
Small Business Administration (504) | | | | | | |
Series 96-20L, 6.70%, 12/1/16 | | | 2,779,830 | | | 2,838,853 |
Series 97-20F, 7.20%, 6/1/17 | | | 4,312,867 | | | 4,452,637 |
Series 97-20I, 6.90%, 9/1/17 | | | 6,216,008 | | | 6,382,245 |
Series 98-20D, 6.15%, 4/1/18 | | | 7,907,868 | | | 7,997,512 |
Series 98-20I, 6.00%, 9/1/18 | | | 3,932,074 | | | 3,963,829 |
Series 99-20F, 6.80%, 6/1/19 | | | 5,409,310 | | | 5,576,688 |
Series 00-20D, 7.47%, 4/1/20 | | | 14,490,306 | | | 15,176,706 |
Series 00-20E, 8.03%, 5/1/20 | | | 6,143,042 | | | 6,567,025 |
Series 00-20G, 7.39%, 7/1/20 | | | 10,118,389 | | | 10,593,199 |
Series 00-20I, 7.21%, 9/1/20 | | | 6,276,448 | | | 6,577,819 |
Series 01-20E, 6.34%, 5/1/21 | | | 14,002,640 | | | 14,328,718 |
Series 01-20G, 6.625%, 7/1/21 | | | 11,390,302 | | | 11,773,254 |
Series 03-20J, 4.92%, 10/1/23 | | | 21,690,842 | | | 20,650,827 |
Series 05-20F, 4.57%, 6/1/25 | | | 46,370,013 | | | 42,674,731 |
Series 05-20K, 5.36%, 11/1/25 | | | 37,697,559 | | | 36,587,351 |
Series 06-20D, 5.64%, 4/1/26 | | | 52,785,000 | | | 52,436,603 |
| | | | | |
|
|
| | | | | | | 253,011,010 |
| | | | | |
|
|
| | | | | | | 1,981,526,407 |
| MORTGAGE-RELATED SECURITIES: 15.3% | | | |
| FEDERAL AGENCY CMO & REMIC: 1.7% | | | | | | |
Dept. of Veterans Affairs | | | | | | |
Trust 1995-1A 1, 7.213%, 2/15/25 | | | 1,420,796 | | | 1,457,372 |
Trust 1995-2C 3A, 8.793%, 6/15/25 | | | 784,229 | | | 837,155 |
Fannie Mae | | | | | | |
Trust 1992-4H, 7.50%, 2/25/07 | | | 248,195 | | | 248,389 |
SMBS I-1, 6.50%, 4/1/09 | | | 50,893 | | | 50,829 |
Trust 2003-37 HA, 5.00%, 7/25/13 | | | 26,340,606 | | | 26,218,883 |
Trust (GN) 1994-13J, 7.00%, 6/17/22 | | | 565,273 | | | 565,019 |
Trust 1993-207 G, 6.15%, 4/25/23 | | | 4,399,241 | | | 4,399,137 |
Trust 2002-73 PM, 5.00%, 12/25/26 | | | 28,291,594 | | | 28,033,795 |
Trust 2002-33 A1, 7.00%, 6/25/32 | | | 6,621,743 | | | 6,753,762 |
Trust 2005-W4 1A2, 6.50%, 8/25/35 | | | 42,371,344 | | | 42,764,707 |
Trust 2001-T7 A1, 7.50%, 2/25/41 | | | 6,495,291 | | | 6,675,087 |
Trust 2001-T8 A1, 7.50%, 7/25/41 | | | 6,992,761 | | | 7,183,107 |
Trust 2001-W3 A, 7.00%, 9/25/41 | | | 2,748,561 | | | 2,791,300 |
Trust 2002-W6 2A1, 7.00%, 6/25/42 | | | 6,653,784 | | | 6,775,986 |
Trust 2002-W8 A2, 7.00%, 6/25/42 | | | 7,361,459 | | | 7,478,018 |
| | |
| See accompanying Notes to Financial Statements | | Dodge & Cox Balanced Fund / 6 |
Portfolio of Investments (unaudited) | June 30, 2006 |
| | | | | | |
| FIXED-INCOME SECURITIES: (continued) | | |
| | |
| | | PAR VALUE | | VALUE |
Fannie Mae (continued) | | | | | | |
Trust 2003-W2 1A1, 6.50%, 7/25/42 | | $ | 14,319,455 | | $ | 14,429,751 |
Trust 2003-W2 1A2, 7.00%, 7/25/42 | | | 5,701,711 | | | 5,765,098 |
Trust 2003-W4 4A, 7.50%, 10/25/42 | | | 8,482,436 | | | 8,710,725 |
Trust 2004-T1 1A2, 6.50%, 1/25/44 | | | 12,515,314 | | | 12,627,198 |
Trust 2004-W2 5A, 7.50%, 3/25/44 | | | 32,836,845 | | | 33,926,963 |
Freddie Mac | | | | | | |
Series 1236 H, 7.25%, 4/15/07 | | | 369,631 | | | 370,780 |
Series 1512 I, 6.50%, 5/15/08 | | | 1,463,793 | | | 1,465,086 |
Series 1539 PL, 6.50%, 5/15/08 | | | 401,542 | | | 401,413 |
Series 2100 GS, 6.50%, 12/15/13 | | | 10,807,768 | | | 10,966,618 |
Series 2430 UC, 6.00%, 9/15/16 | | | 18,673,768 | | | 18,743,961 |
Series 1078 GZ, 6.50%, 5/15/21 | | | 1,402,472 | | | 1,415,936 |
Series (GN) 16 PK, 7.00%, 8/25/23 | | | 16,013,769 | | | 16,245,072 |
Series 2550 QP, 5.00%, 3/15/26 | | | 16,269,661 | | | 16,171,931 |
Series T-48 1A4, 5.538%, 7/25/33 | | | 105,649,497 | | | 103,748,514 |
Series T-051 1A, 6.50%, 9/25/43 | | | 688,300 | | | 692,969 |
Series T-59 1A1, 6.50%, 10/25/43 | | | 41,119,888 | | | 41,228,922 |
| | | | | |
|
|
| | | | | | | 429,143,483 |
| FEDERAL AGENCY MORTGAGE PASS-THROUGH: 13.6% |
Fannie Mae, 10 Year | | | | | | |
6.00%, 1/1/12-10/1/14 | | | 39,345,783 | | | 39,472,888 |
Fannie Mae, 15 Year | | | | | | |
5.50%, 1/1/14-12/1/19 | | | 303,316,057 | | | 298,291,647 |
6.00%, 12/1/13-6/1/19 | | | 613,120,172 | | | 615,206,132 |
6.50%, 1/1/13-11/1/18 | | | 222,257,498 | | | 225,328,957 |
7.00%, 12/1/07-11/1/18 | | | 24,517,624 | | | 25,025,127 |
7.50%, 9/1/15-8/1/17 | | | 74,049,340 | | | 76,893,983 |
Fannie Mae, 20 Year
6.50%, 1/1/22 | | | 11,440,578 | | | 11,518,307 |
Fannie Mae, 30 Year | | | | | | |
3.857%, 6/1/34 | | | 72,411,174 | | | 69,367,662 |
4.774%, 1/1/35 | | | 13,889,965 | | | 13,560,998 |
4.848%, 8/1/35 | | | 14,452,407 | | | 14,221,460 |
5.00%, 3/1/34 | | | 263,277,453 | | | 247,296,886 |
5.049%, 7/1/35 | | | 160,424,812 | | | 157,770,051 |
5.312%, 1/1/36 | | | 64,281,117 | | | 63,553,764 |
5.50%, 6/1/33 | | | 63,034,761 | | | 60,809,659 |
6.00%, 4/1/35-6/1/35 | | | 445,152,243 | | | 439,688,387 |
6.50%, 12/1/32 | | | 238,241,676 | | | 240,414,673 |
7.50%, 9/1/07-7/1/19 | | | 276,127 | | | 278,498 |
8.00%, 1/1/09 | | | 108,688 | | | 109,843 |
Fannie Mae Multifamily DUS | | | | | | |
Pool 555728, 4.019%, 8/1/13 | | | 426,866 | | | 389,414 |
Pool 555162, 4.834%, 1/1/13 | | | 17,757,743 | | | 16,997,837 |
Pool 555316, 4.874%, 2/1/13 | | | 5,931,932 | | | 5,697,586 |
Pool 760762, 4.89%, 4/1/12 | | | 16,115,000 | | | 15,398,247 |
Pool 735387, 4.925%, 4/1/15 | | | 14,023,274 | | | 13,331,983 |
Pool 555148, 4.964%, 1/1/13 | | | 5,378,584 | | | 5,186,608 |
Pool 555806, 5.105%, 10/1/13 | | | 3,936,609 | | | 3,808,699 |
Pool 461628, 5.32%, 4/1/14 | | | 10,637,130 | | | 10,365,836 |
Pool 462086, 5.355%, 11/1/15 | | | 28,857,196 | | | 28,060,610 |
Pool 545316, 5.636%, 12/1/11 | | | 5,189,968 | | | 5,166,937 |
Pool 323350, 5.65%, 11/1/08 | | | 2,020,663 | | | 2,008,939 |
| | | | | | |
| | |
| | | PAR VALUE | | VALUE |
Fannie Mae Multifamily DUS (continued) | | | |
Pool 545387, 5.878%, 1/1/12 | | $ | 8,092,496 | | $ | 8,140,471 |
Pool 545258, 5.937%, 11/1/11 | | | 1,318,653 | | | 1,328,940 |
Pool 380735, 5.965%, 10/1/08 | | | 20,358,623 | | | 20,356,009 |
Pool 545685, 6.017%, 4/1/12 | | | 30,546,619 | | | 30,807,848 |
Pool 323492, 6.02%, 1/1/09 | | | 4,355,422 | | | 4,360,817 |
Freddie Mac, 30 Year | | | | | | |
7.25%, 1/1/08 | | | 183 | | | 183 |
8.00%, 2/1/08-11/1/10 | | | 182,549 | | | 183,825 |
8.25%, 2/1/17 | | | 13,517 | | | 13,554 |
8.75%, 5/1/10 | | | 41,873 | | | 43,031 |
Freddie Mac Gold, 15 Year | | | | | | |
5.50%, 8/1/14-1/1/17 | | | 40,160,100 | | | 39,451,797 |
6.00%, 10/1/13-10/1/18 | | | 192,702,712 | | | 192,856,374 |
6.50%, 7/1/14-9/1/18 | | | 91,137,056 | | | 92,116,332 |
7.00%, 5/1/08-4/1/15 | | | 3,499,680 | | | 3,534,920 |
7.75%, 7/25/21 | | | 1,599,169 | | | 1,666,834 |
Freddie Mac Gold, 30 Year | | | | | | |
3.806%, 5/1/34 | | | 25,181,266 | | | 24,312,316 |
5.42%, 11/1/35 | | | 72,419,186 | | | 71,659,214 |
6.50%, 12/1/32-4/1/33 | | | 133,687,850 | | | 134,990,211 |
7.47%, 3/17/23 | | | 482,518 | | | 500,637 |
8.50%, 1/1/23 | | | 145,564 | | | 150,752 |
Ginnie Mae, 30 Year | | | | | | |
7.50%, 1/15/08-10/15/25 | | | 6,290,436 | | | 6,531,091 |
7.97%, 4/15/20-1/15/21 | | | 2,798,103 | | | 2,944,542 |
| | | | | |
|
|
| | | | | | | 3,341,171,316 |
| PRIVATE LABEL CMO & REMIC SECURITIES: 0.0%(e) | | | |
Union Planters Mortgage Finance Corp.
7.70%, 12/25/24 | | | 5,029,559 | | | 5,148,487 |
| | | | | |
|
|
| | | | | | | 3,775,463,286 |
| CORPORATE: 11.4% | | | | | | |
| FINANCIALS: 2.3% | | | | | | |
BankAmerica Capital II(c)
8.00%, 12/15/26, callable 2006 | | | 17,355,000 | | | 18,175,961 |
BankAmerica Capital VI(c)
5.625%, 3/8/35 | | | 10,000,000 | | | 8,569,520 |
BankAmerica Capital XI(c)
6.625%, 5/23/36 | | | 15,000,000 | | | 14,817,780 |
Boston Properties, Inc. | | | | | | |
6.25%, 1/15/13 | | | 49,070,000 | | | 49,505,251 |
5.625%, 4/15/15 | | | 29,500,000 | | | 28,421,627 |
5.00%, 6/1/15 | | | 2,890,000 | | | 2,651,188 |
Citicorp Capital I(c)
7.933%, 2/15/27, callable 2007 | | | 12,540,000 | | | 13,160,567 |
Citigroup, Inc. (First Nationwide)
10.00%, 10/1/06 | | | 4,945,000 | | | 4,992,793 |
EOP Operating Limited Partnership(f) | | | | | | |
8.10%, 8/1/10 | | | 10,000,000 | | | 10,753,290 |
7.00%, 7/15/11 | | | 40,675,000 | | | 42,255,793 |
6.75%, 2/15/12 | | | 19,933,000 | | | 20,567,527 |
5.875%, 1/15/13 | | | 41,205,000 | | | 40,382,095 |
4.75%, 3/15/14 | | | 15,000,000 | | | 13,605,075 |
| | |
| 7 / Dodge & Cox Balanced Fund | | See accompanying Notes to Financial Statements |
Portfolio of Investments (unaudited) | June 30, 2006 |
| | | | | | |
| FIXED-INCOME SECURITIES: (continued) | | |
| | |
| | | PAR VALUE | | VALUE |
HSBC Holdings PLC 6.50%, 5/2/36 | | $ | 23,000,000 | | $ | 22,610,794 |
JPMorgan Chase (Bank One) Capital III(c)
8.75%, 9/1/30 | | | 23,760,000 | | | 29,316,941 |
Kaupthing Bank(d) 7.125%, 5/19/16 | | | 65,000,000 | | | 65,019,500 |
Safeco Corp. | | | | | | |
4.875%, 2/1/10 | | | 15,131,000 | | | 14,686,890 |
7.25%, 9/1/12 | | | 13,672,000 | | | 14,605,989 |
St. Paul Travelers Companies, Inc. | | | | | | |
8.125%, 4/15/10 | | | 19,885,000 | | | 21,358,817 |
5.00%, 3/15/13 | | | 10,250,000 | | | 9,746,131 |
5.50%, 12/1/15 | | | 9,160,000 | | | 8,651,904 |
6.25%, 6/20/16 | | | 22,000,000 | | | 21,905,576 |
UnumProvident Corp. | | | | | | |
7.625%, 3/1/11 | | | 15,330,000 | | | 15,973,645 |
6.85%, 11/15/15(d) | | | 10,200,000 | | | 10,027,243 |
7.19%, 2/1/28 | | | 8,500,000 | | | 7,677,574 |
6.75%, 12/15/28 | | | 27,430,000 | | | 24,667,662 |
7.375%, 6/15/32 | | | 19,470,000 | | | 18,870,674 |
UnumProvident Corp.
(Provident Companies, Inc.)
7.25%, 3/15/28 | | | 12,130,000 | | | 11,558,022 |
| | | | | |
|
|
| | | | | | | 564,535,829 |
| INDUSTRIALS: 8.5% | | | | | | |
AT&T Corp. | | | | | | |
7.30%, 11/15/11 | | | 27,972,000 | | | 29,693,201 |
8.00%, 11/15/31 | | | 97,500,000 | | | 111,940,042 |
CIGNA Corp. | | | | | | |
7.00%, 1/15/11 | | | 14,705,000 | | | 15,278,304 |
6.375%, 10/15/11 | | | 17,820,000 | | | 18,065,185 |
7.65%, 3/1/23 | | | 9,745,000 | | | 10,334,378 |
7.875%, 5/15/27 | | | 12,970,000 | | | 14,250,813 |
8.30%, 1/15/33 | | | 9,050,000 | | | 10,252,546 |
Comcast Corp. | | | | | | |
5.30%, 1/15/14 | | | 63,050,000 | | | 59,319,710 |
5.85%, 11/15/15 | | | 26,500,000 | | | 25,520,984 |
5.90%, 3/15/16 | | | 22,880,000 | | | 21,982,578 |
Cox Communications, Inc. | | | | | | |
5.45%, 12/15/14 | | | 75,530,000 | | | 69,834,887 |
5.50%, 10/1/15 | | | 15,265,000 | | | 14,105,822 |
Dillard’s, Inc. | | | | | | |
6.30%, 2/15/08 | | | 6,000,000 | | | 6,000,000 |
7.85%, 10/1/12 | | | 14,000,000 | | | 14,420,000 |
7.13%, 8/1/18 | | | 10,831,000 | | | 10,235,295 |
7.875%, 1/1/23 | | | 8,860,000 | | | 8,483,450 |
7.75%, 7/15/26 | | | 50,000 | | | 47,375 |
7.75%, 5/15/27 | | | 550,000 | | | 521,125 |
7.00%, 12/1/28 | | | 15,486,000 | | | 13,705,110 |
Dow Chemical Co. | | | | | | |
4.027%, 9/30/09(d) | | | 33,950,000 | | | 32,071,037 |
6.00%, 10/1/12 | | | 5,800,000 | | | 5,842,752 |
7.375%, 11/1/29 | | | 35,170,000 | | | 39,061,279 |
| | | | | | |
| | |
| | | PAR VALUE | | VALUE |
Electronic Data Systems Corp.
6.50%, 8/1/13 | | $ | 44,885,000 | | $ | 44,279,771 |
Federated Department Stores, Inc.
(May Department Stores Co.) | | | | | | |
7.625%, 8/15/13 | | | 5,900,000 | | | 6,361,952 |
7.45%, 10/15/16 | | | 9,300,000 | | | 9,903,161 |
8.50%, 6/1/19 | | | 3,339,000 | | | 3,864,993 |
7.875%, 3/1/30 | | | 14,335,000 | | | 15,755,111 |
6.90%, 1/15/32 | | | 54,484,000 | | | 54,547,528 |
6.70%, 7/15/34 | | | 13,025,000 | | | 12,719,277 |
8.125%, 8/15/35, callable 2015 | | | 12,825,000 | | | 13,519,115 |
7.875%, 8/15/36, callable 2016 | | | 10,440,000 | | | 10,860,680 |
Ford Motor Credit Co. | | | | | | |
7.375%, 2/1/11 | | | 124,555,000 | | | 111,528,789 |
7.25%, 10/25/11 | | | 163,640,000 | | | 145,160,953 |
GMAC | | | | | | |
7.75%, 1/19/10 | | | 13,145,000 | | | 13,077,211 |
6.875%, 9/15/11 | | | 173,670,000 | | | 165,708,967 |
HCA, Inc. | | | | | | |
8.75%, 9/1/10 | | | 27,750,000 | | | 29,255,854 |
7.875%, 2/1/11 | | | 23,798,000 | | | 24,310,419 |
6.95%, 5/1/12 | | | 14,090,000 | | | 13,753,658 |
6.30%, 10/1/12 | | | 11,400,000 | | | 10,721,939 |
6.25%, 2/15/13 | | | 47,740,000 | | | 44,578,180 |
6.75%, 7/15/13 | | | 27,400,000 | | | 26,165,027 |
5.75%, 3/15/14 | | | 13,420,000 | | | 12,000,030 |
6.50%, 2/15/16 | | | 12,000,000 | | | 11,095,512 |
Health Net, Inc. 8.375%, 4/15/11 | | | 57,745,000 | | | 64,597,079 |
Hess Corp. (Amerada Hess) 7.875%, 10/1/29 | | | 26,780,000 | | | 29,877,723 |
Hewlett-Packard Co. 5.50%, 7/1/07 | | | 21,210,000 | | | 21,168,025 |
Liberty Media Corp. | | | | | | |
8.50%, 7/15/29 | | | 32,630,000 | | | 31,735,024 |
4.00%, 11/15/29, exchangeable | | | 18,975,000 | | | 11,669,625 |
8.25%, 2/1/30 | | | 4,440,000 | | | 4,249,693 |
3.75%, 2/15/30, exchangeable | | | 35,755,000 | | | 20,112,188 |
Lockheed Martin Corp. | | | | | | |
7.65%, 5/1/16 | | | 18,500,000 | | | 20,764,548 |
7.75%, 5/1/26 | | | 8,500,000 | | | 9,872,342 |
8.50%, 12/1/29 | | | 7,000,000 | | | 8,810,480 |
Raytheon Co. 6.75%, 8/15/07 | | | 20,476,000 | | | 20,674,863 |
Time Warner, Inc. (AOL Time Warner) | | | | | | |
7.625%, 4/15/31 | | | 101,940,000 | | | 109,761,346 |
7.70%, 5/1/32 | | | 79,490,000 | | | 86,393,865 |
Wellpoint, Inc. 5.25%, 1/15/16 | | | 70,045,000 | | | 65,645,754 |
Wyeth | | | | | | |
5.50%, 3/15/13 | | | 24,500,000 | | | 23,851,387 |
5.50%, 2/1/14 | | | 70,724,000 | | | 68,336,641 |
Wyeth (American Home Products)
6.95%, 3/15/11 | | | 7,950,000 | | | 8,293,456 |
| | |
| See accompanying Notes to Financial Statements | | Dodge & Cox Balanced Fund / 8 |
Portfolio of Investments (unaudited) | June 30, 2006 |
| | | | | | |
| FIXED-INCOME SECURITIES: (continued) | | |
| | |
| | | PAR VALUE | | VALUE |
Xerox Corp. | | | | | | |
7.125%, 6/15/10 | | $ | 18,425,000 | | $ | 18,563,188 |
6.875%, 8/15/11 | | | 135,655,000 | | | 134,807,156 |
6.40%, 3/15/16 | | | 10,000,000 | | | 9,437,500 |
7.20%, 4/1/16 | | | 10,100,000 | | | 10,125,250 |
| | | | | |
|
|
| | | | | | | 2,088,881,133 |
| TRANSPORTATION: 0.6% | | | | | | |
Burlington Northern Santa Fe Railway | | | | | | |
4.30%, 7/1/13 | | | 7,320,000 | | | 6,692,573 |
8.251%, 1/15/21 | | | 1,444,871 | | | 1,650,100 |
4.967%, 4/1/23 | | | 11,459,767 | | | 10,801,783 |
5.72%, 1/15/24 | | | 27,550,000 | | | 27,348,050 |
Consolidated Rail Corp.
6.76%, 5/25/15, callable 2005 | | | 3,911,184 | | | 4,014,478 |
CSX Transportation, Inc. 9.75%, 6/15/20 | | | 5,351,000 | | | 6,935,720 |
FedEx Corp. 6.72%, 1/15/22 | | | 5,591,956 | | | 5,813,565 |
Norfolk Southern Corp. | | | | | | |
7.70%, 5/15/17 | | | 13,000,000 | | | 14,700,309 |
9.75%, 6/15/20 | | | 7,389,000 | | | 9,658,029 |
Union Pacific Corp. | | | | | | |
6.125%, 1/15/12 | | | 11,225,000 | | | 11,347,173 |
6.50%, 4/15/12 | | | 3,550,000 | | | 3,656,777 |
5.375%, 5/1/14 | | | 2,935,000 | | | 2,845,259 |
4.875%, 1/15/15 | | | 8,320,000 | | | 7,731,851 |
6.33%, 1/2/20 | | | 36,400,666 | | | 37,025,666 |
| | | | | |
|
|
| | | | | | | 150,221,333 |
| | | | | |
|
|
| | | | | | | 2,803,638,295 |
| | | | | |
|
|
TOTAL FIXED-INCOME SECURITIES
(Cost $8,733,348,949) | | | 8,560,627,988 |
| | | | | |
|
|
| | | | | | | | |
| SHORT-TERM INVESTMENTS: 2.4% | | | | |
| | |
| | | PAR VALUE | | | VALUE | |
SSgA Prime Money Market Fund | | $ | 122,550,594 | | | $ | 122,550,594 | |
State Street Repurchase Agreement 4.30%, 7/3/06, maturity value $463,980,200 (collateralized by
U.S. Treasury Securities, value $473,092,650, 4.125%, 8/15/08) | | | 463,814,000 | | | | 463,814,000 | |
| | | | | | |
|
|
|
TOTAL SHORT-TERM INVESTMENTS
(Cost $586,364,594) | | | | | | | 586,364,594 | |
| | | | | | |
|
|
|
TOTAL INVESTMENTS
(Cost $20,582,169,391) | | | 100.4 | % | | | 24,757,810,385 | |
OTHER ASSETS LESS LIABILITIES | | | (0.4 | %) | | | (98,075,250 | ) |
| | |
|
|
| |
|
|
|
TOTAL NET ASSETS | | | 100.0 | % | | $ | 24,659,735,135 | |
| | |
|
|
| |
|
|
|
| (b) | | Foreign security denominated in U.S. dollars |
| (c) | | Cumulative preferred security |
| (d) | | Security exempt from registration under Rule 144A of the Securities Act of 1933. The security may be resold in transactions exempt from registration, normally to qualified institutional buyers. As of June 30, 2006, all such securities in total represented $107,117,780 or 0.4% of total net assets. |
| (f) | | EOP Operating LP is the operating partnership of Equity Office Properties Trust. |
When two issuers are identified, the first name refers to the acquirer or successor obligor, and the second name (within the parentheses) refers to the original issuer of the instrument.
ADR: American Depository Receipt
CMO: Collateralized Mortgage Obligation
REMIC: Real Estate Mortgage Investment Conduit
| | |
| 9 / Dodge & Cox Balanced Fund | | See accompanying Notes to Financial Statements |
Statement of Assets and Liabilities (unaudited)
| | | |
| |
| | | June 30, 2006 |
| Assets: | | | |
Investments, at value (cost $20,582,169,391) | | $ | 24,757,810,385 |
Receivable for investments sold | | | 2,492,593 |
Receivable for paydowns on
mortgage-backed securities | | | 67,160 |
Receivable for Fund shares sold | | | 19,734,835 |
Dividends and interest receivable | | | 125,994,657 |
Prepaid expenses and other assets | | | 42,283 |
| | |
|
|
| | | | 24,906,141,913 |
| | |
|
|
| Liabilities: | | | |
Payable for investments purchased | | | 175,915,485 |
Payable for Fund shares redeemed | | | 58,948,337 |
Management fees payable | | | 10,048,762 |
Accrued expenses | | | 1,494,194 |
| | |
|
|
| | | | 246,406,778 |
| | |
|
|
| Net Assets | | $ | 24,659,735,135 |
| | |
|
|
| Net Assets Consist of: | | | |
Paid in capital | | $ | 19,827,197,623 |
Undistributed net investment income | | | 12,653,958 |
Undistributed net realized gain on investments | | | 644,242,560 |
Net unrealized appreciation on investments | | | 4,175,640,994 |
| | |
|
|
| | | $ | 24,659,735,135 |
| | |
|
|
Fund shares outstanding (par value $0.01 each, unlimited shares authorized) | | | 295,090,623 |
Net asset value per share | | | $83.57 |
|
| Statement of Operations (unaudited) |
| | | Six Months Ended
June 30, 2006 |
| Investment Income: | | | |
Dividends (net of foreign taxes of $3,495,767) | | $ | 132,158,546 |
Interest | | | 226,407,793 |
| | |
|
|
| | | | 358,566,339 |
| | |
|
|
| Expenses: | | | |
Management fees | | | 60,721,603 |
Custody and fund accounting fees | | | 190,412 |
Transfer agent fees | | | 2,205,737 |
Professional services | | | 43,398 |
Shareholder reports | | | 620,110 |
Registration fees | | | 119,406 |
Trustees’ fees | | | 82,500 |
Miscellaneous | | | 85,043 |
| | |
|
|
| | | | 64,068,209 |
| | |
|
|
| Net Investment Income | | | 294,498,130 |
| | |
|
|
| Realized and Unrealized Gain on Investments: | | | |
Net realized gain | | | 656,479,038 |
Net change in unrealized appreciation | | | 14,676,120 |
| | |
|
|
Net realized and unrealized gain | | | 671,155,158 |
| | |
|
|
| Net Increase in Net Assets from Operations | | $ | 965,653,288 |
| | |
|
|
Statement of Changes in Net Assets (unaudited)
| | | | | | | | |
| | |
| | | Six Months Ended
June 30, 2006 | | | Year Ended
December 31, 2005 | |
| Operations: | | | | | | | | |
Net investment income | | $ | 294,498,130 | | | $ | 484,455,297 | |
Net realized gain | | | 656,479,038 | | | | 380,394,201 | |
Net change in unrealized appreciation | | | 14,676,120 | | | | 614,634,805 | |
| | |
|
|
| |
|
|
|
Net increase in net assets from operations | | | 965,653,288 | | | | 1,479,484,303 | |
| | |
|
|
| |
|
|
|
| | |
Distributions to
Shareholders from: | | | | | | | | |
Net investment income | | | (295,936,250 | ) | | | (521,701,708 | ) |
Net realized gain | | | (23,614,154 | ) | | | (378,288,293 | ) |
| | |
|
|
| |
|
|
|
Total distributions | | | (319,550,404 | ) | | | (899,990,001 | ) |
| | |
|
|
| |
|
|
|
| | |
| Fund Share Transactions: | | | | | | | | |
Proceeds from sale of shares | | | 1,786,957,146 | | | | 4,371,007,401 | |
Reinvestment of distributions | | | 303,841,493 | | | | 863,011,478 | |
Cost of shares redeemed | | | (1,688,284,282 | ) | | | (2,943,041,611 | ) |
| | |
|
|
| |
|
|
|
Net increase from Fund
share transactions | | | 402,514,357 | | | | 2,290,977,268 | |
| | |
|
|
| |
|
|
|
Total increase in net assets | | | 1,048,617,241 | | | | 2,870,471,570 | |
| | |
| Net Assets: | | | | | | | | |
Beginning of period | | | 23,611,117,894 | | | | 20,740,646,324 | |
| | |
|
|
| |
|
|
|
End of period (including undistributed net investment income of $12,653,958 and $1,855,600, respectively) | | $ | 24,659,735,135 | | | $ | 23,611,117,894 | |
| | |
|
|
| |
|
|
|
| Share Information: | | | | | | | | |
Shares sold | | | 21,320,045 | | | | 54,872,290 | |
Distributions reinvested | | | 3,636,532 | | | | 10,731,145 | |
Shares redeemed | | | (20,153,130 | ) | | | (36,701,989 | ) |
| | |
|
|
| |
|
|
|
Net increase in
shares outstanding | | | 4,803,447 | | | | 28,901,446 | |
| | |
|
|
| |
|
|
|
| | |
| See accompanying Notes to Financial Statements | | Dodge & Cox Balanced Fund / 10 |
Notes to Financial Statements (unaudited)
Note 1 — Organization and Significant Accounting Policies
Dodge & Cox Balanced Fund (the “Fund”) is one of the series constituting the Dodge & Cox Funds (the “Trust” or the “Funds”). The Trust is organized as a Delaware statutory trust and is registered under the Investment Company Act of 1940, as amended, as a diversified, open-end management investment company. The Fund commenced operations on June 26, 1931, and seeks regular income, conservation of principal and an opportunity for long-term growth of principal and income. Risk considerations and investment strategies of the Fund are discussed in the Fund’s Prospectus. The Fund is closed to new investors.
The financial statements have been prepared in conformity with accounting principles generally accepted in the United States of America, which require the use of estimates and assumptions by management. Significant accounting policies are as follows:
Security valuation. The Fund’s net assets are valued as of the close of trading on the New York Stock Exchange (NYSE), generally 4:00 p.m. Eastern Time, each day that the NYSE is open for business. Stocks are valued at the official quoted close price or the last sale of the day at the close of the NYSE or, if not available, at the mean between the exchange-listed bid and ask prices for the day. A security that is listed or traded on more than one exchange is valued at the quotation on the exchange determined to be the primary market for such security. Fixed-income securities with original maturities of one year or more are priced on the basis of valuations furnished by pricing services which utilize both dealer-supplied valuations and electronic data processing techniques. Under certain circumstances, fixed-income securities that are not valued by pricing services are temporarily valued by the investment manager utilizing both dealer-supplied valuations and electronic data processing techniques. Valuations of fixed-income securities take into account appropriate factors such as institutional-size trading markets in similar groups of securities, yield, quality, coupon rate, maturity, type of issue, trading characteristics and other market data and do not rely exclusively upon exchange or over-the-counter listed prices. Security values are not discounted based on the size of the Fund’s position. Securities for which market quotations are not readily available are valued at fair value as
determined in good faith by or at the direction of the Board of
Trustees. Short-term securities are valued at amortized cost which approximates current value. All securities held by the Fund are denominated in U.S. dollars.
Security transactions, investment income, expenses, and distributions. Security transactions are recorded on the trade date. Realized gains and losses on securities sold are determined on the basis of identified cost.
Dividend income and corporate action transactions are recorded on the ex-dividend date, except for certain dividends or corporate actions from foreign securities where the ex-dividend date may have passed, which are recorded as soon as the Fund is informed of the ex-dividend date. Withholding taxes on foreign dividends have been provided for in accordance with the Fund’s understanding of the applicable country’s tax rules and rates. Non-cash dividends included in dividend income, if any, are recorded at the fair market value of the securities received. Distributions received in excess of income are recorded as a reduction of cost of investments and/or realized gain. The Fund may estimate the character of distributions received from Real Estate Investment Trusts (“REITs”).
Interest income is recorded on the accrual basis. Interest income includes coupon interest, amortization of premium and accretion of discount on debt securities, and gains and losses on paydowns of mortgage-backed securities. The ability of the issuers of the debt securities held by the Fund to meet their obligations may be affected by economic developments in a specific industry, state or region. Debt obligations may be placed on non-accrual status and related interest income may be reduced by ceasing current accruals and writing off interest receivables when the collection of all or a portion of interest has become doubtful based on consistently applied procedures. A debt obligation is removed from non-accrual status when the issuer resumes interest payments or when collectibility of interest is reasonably assured.
Expenses are recorded on the accrual basis. Most expenses of the Trust can be directly attributed to a specific series. Expenses which cannot be directly attributed are apportioned among the Funds in the Trust.
Distributions to shareholders are recorded on the ex-dividend date.
| | |
| 11 / Dodge & Cox Balanced Fund | | |
Notes to Financial Statements (unaudited) (continued)
Repurchase agreements. The Fund may enter into repurchase agreements secured by U.S. government securities which involve the purchase of securities from a counterparty with a simultaneous commitment to resell the securities at an agreed-upon date and price. It is the Fund’s policy that its custodian take possession of the underlying collateral securities, the fair value of which exceeds the principal amount of the repurchase transaction, including accrued interest, at all times. In the event of default by the counterparty, the Fund has the contractual right to liquidate the securities and to apply the proceeds in satisfaction of the obligation.
Note 2 — Related Party Transactions
Management fees. Under a written agreement, the Fund pays an annual management fee of 0.50% of the Fund’s average daily net assets to Dodge & Cox, investment manager of the Fund.
Fund officers and trustees. All officers and four of the trustees of the Trust are officers or employees of Dodge & Cox. The Trust pays a fee only to those trustees who are not affiliated with Dodge & Cox.
Indemnification. Under the Trust’s organizational documents, its officers and trustees are indemnified against certain liabilities arising out of the performance of their duties to the Trust. In addition, in the normal course of business the Trust enters into contracts that provide general indemnities to other parties. The Trust’s maximum exposure under these arrangements is unknown as this would involve future claims that may be made against the Trust that have not yet occurred.
Note 3 — Income Tax Information and Distributions to Shareholders
A provision for federal income taxes is not required since the Fund intends to continue to qualify as a regulated investment company under Subchapter M of the Internal Revenue Code and distribute all
of its taxable income to shareholders. Distributions are determined in accordance with income tax regulations, which may differ from net investment income and realized gains for financial reporting purposes. Financial reporting records are adjusted for permanent book/tax differences to reflect tax character. Financial records are not adjusted for temporary differences.
Book/tax differences are primarily due to differing treatments of net short-term realized gain and paydown loss. At June 30, 2006, the cost of investments for federal income tax purposes was equal to the cost for financial reporting purposes.
Distributions during the period ended June 30, 2006 were characterized as follows for federal income tax purposes:
| | | |
Ordinary income ($1.01 per share) | | $ | 295,936,250 |
Long-term capital gain ($0.081 per share) | | | 23,614,154 |
| | |
|
|
Total distributions ($1.091 per share) | | $ | 319,550,404 |
| | |
|
|
At June 30, 2006, the tax basis components of distributable earnings were as follows:
| | | | |
Unrealized appreciation | | $ | 4,453,710,592 | |
Unrealized depreciation | | | (278,069,598 | ) |
| | |
|
|
|
Net unrealized appreciation | | | 4,175,640,994 | |
Undistributed ordinary income | | | 37,742,981 | |
Undistributed long-term capital gain | | | 619,153,537 | |
Note 4 — Purchase and Sales of Investments
For the period ended June 30, 2006, purchases and sales of securities, other than short-term securities and U.S. government securities, aggregated $2,003,318,699 and $1,499,522,007, respectively. For the period ended June 30, 2006, purchases and sales of U.S. government securities aggregated $1,611,403,146 and $1,262,545,482, respectively.
| | |
| | | Dodge & Cox Balanced Fund / 12 |
Financial Highlights (unaudited)
| | | | | | | | | | | | | | | | | | | | | | |
SELECTED DATA AND RATIOS (for a share outstanding throughout each year) | | | | Six Months
Ended June 30, | | | | | Year Ended December 31, | |
| | | | | 2006 | | | | | 2005 | | | 2004 | | | 2003 | | | 2002 | | | 2001 | |
Net asset value, beginning of period | | | | $81.34 | | | | | $79.35 | | | $73.04 | | | $60.75 | | | $65.42 | | | $63.42 | |
| | | | | | | | |
Income from investment operations: | | | | | | | | | | | | | | | | | | | | | | |
Net investment income | | | | 1.05 | | | | | 1.84 | | | 1.60 | | | 1.66 | | | 1.89 | | | 2.12 | |
Net realized and unrealized gain (loss) | | | | 2.27 | | | | | 3.31 | | | 7.99 | | | 12.96 | | | (3.80 | ) | | 4.07 | |
| | | | |
|
|
Total from investment operations | | | | 3.32 | | | | | 5.15 | | | 9.59 | | | 14.62 | | | (1.91 | ) | | 6.19 | |
| | | | |
|
|
Distributions to shareholders from: | | | | | | | | | | | | | | | | | | | | | | |
Net investment income | | | | (1.01 | ) | | | | (1.84 | ) | | (1.60 | ) | | (1.66 | ) | | (1.88 | ) | | (2.14 | ) |
Net realized gain | | | | (0.08 | ) | | | | (1.32 | ) | | (1.68 | ) | | (0.67 | ) | | (0.88 | ) | | (2.05 | ) |
| | | | |
|
|
Total distributions | | | | (1.09 | ) | | | | (3.16 | ) | | (3.28 | ) | | (2.33 | ) | | (2.76 | ) | | (4.19 | ) |
| | | | |
|
|
Net asset value, end of period | | | | $83.57 | | | | | $81.34 | | | $79.35 | | | $73.04 | | | $60.75 | | | $65.42 | |
| | | | |
|
|
Total return | | | | 4.09 | % | | | | 6.59 | % | | 13.31 | % | | 24.44 | % | | (2.94 | )% | | 10.06 | % |
Ratios/supplemental data: | | | | | | | | | | | | | | | | | | | | | | |
Net assets, end of period (millions) | | | | $24,660 | | | | | $23,611 | | | $20,741 | | | $13,196 | | | $7,885 | | | $6,040 | |
Ratio of expenses to average net assets | | | | 0.53 | %* | | | | 0.53 | % | | 0.54 | % | | 0.54 | % | | 0.53 | % | | 0.53 | % |
Ratio of net investment income to
average net assets | | | | 2.42 | %* | | | | 2.15 | % | | 1.97 | % | | 2.40 | % | | 3.05 | % | | 3.28 | % |
Portfolio turnover rate | | | | 10 | % | | | | 18 | % | | 18 | % | | 19 | % | | 25 | % | | 21 | % |
See accompanying Notes to Financial Statements
Fund Holdings
The Fund provides a complete list of its holdings four times each fiscal year, as of the end of each quarter. The lists appear in the Fund’s First Quarter, Semi-Annual, Third Quarter and Annual Reports to shareholders. The Fund files the lists with the Securities and Exchange Commission (SEC) on Form N-CSR (second and fourth quarters) and Form N-Q (first and third quarters). Shareholders may view the Fund’s Forms N-CSR and N-Q on the SEC’s website at www.sec.gov. Forms N-CSR and N-Q may also be reviewed and copied at the SEC’s Public Reference Room in Washington, DC. Information regarding the operations of the Public Reference Room may be obtained by 1-202-942-8090 (direct) or 1-800-732-0330 (general SEC number). A complete list of the Fund’s quarter-end holdings are also available at www.dodgeandcox.com on or about 15 days following each quarter end and remains available on the web site until the list is updated in the subsequent quarter.
Proxy Voting
For a free copy of the Fund’s proxy voting policies and procedures, please call 1-800-621-3979, visit the Fund’s web site at www.dodgeandcox.com or visit the SEC’s web site at www.sec.gov. Information regarding how the Fund voted proxies relating to portfolio securities during the most recent 12-month period ending June 30 is also available at www.dodgeandcox.com or at www.sec.gov.
| | |
| 13 / Dodge & Cox Balanced Fund | | |
THIS PAGE INTENTIONALLY LEFT BLANK
| | |
| | | Dodge & Cox Balanced Fund / 14 |
Officers and Trustees
Harry R. Hagey, Chairman & Trustee
Chairman, Dodge & Cox
John A. Gunn, President & Trustee
Chief Executive Officer & Chief Investment Officer, Dodge & Cox
Kenneth E. Olivier, Vice President & Trustee
President, Dodge & Cox
Dana M. Emery, Vice President & Trustee
Executive Vice President, Dodge & Cox
William F. Ausfahl, Trustee
Former Chief Financial Officer and member of Board of Directors, The Clorox Company
L. Dale Crandall, Trustee
Former President, Kaiser Foundation Health Plan and Hospitals
Thomas A. Larsen, Trustee
Director, Howard, Rice, Nemerovski, Canady, Falk & Rabkin
John B. Taylor, Trustee
Professor of Economics, Stanford University; Senior Fellow, Hoover Institute and former Under Secretary for International Affairs, United States Treasury
Will C. Wood, Trustee
Principal, Kentwood Associates, Financial Advisers
Katherine Herrick Drake, Vice President
Vice President, Dodge & Cox
Diana S. Strandberg, Vice President
Vice President, Dodge & Cox
John M. Loll, Treasurer & Assistant Secretary
Vice President & Treasurer, Dodge & Cox
Thomas M. Mistele, Secretary & Assistant Treasurer
Chief Operating Officer, Secretary & General Counsel, Dodge & Cox
Marcia P. Venegas, Chief Compliance Officer
Chief Compliance Officer, Dodge & Cox
David H. Longhurst, Assistant Treasurer
Fund Administration and Accounting Senior Manager, Dodge & Cox

Income Fund
Established 1989

Semi-Annual Report
June 30, 2006
2006
Income Fund
www.dodgeandcox.com
For Fund literature, transactions and account
information, please visit the Funds’ web site.
or write or call:
Dodge & Cox Funds
c/o Boston Financial Data Services
P.O. Box 8422
Boston, Massachusetts 02266-8422
(800) 621-3979
Investment Manager
Dodge & Cox
555 California Street, 40th Floor
San Francisco, California 94104
(415) 981-1710
This report is submitted for the general information of the shareholders of the Fund. The report is not authorized for distribution to prospective investors in the Fund unless it is accompanied by a current prospectus.
This report reflects our views, opinions and portfolio holdings as of June 30, 2006, the end of the reporting period. Any such views are subject to change at any time based upon market or other conditions and Dodge & Cox disclaims any responsibility to update such views. These views may not be relied on as investment advice and, because investment decisions for a Dodge & Cox Fund are based on numerous factors, may not be relied on as an indication of trading intent on behalf of any Dodge & Cox Fund.

06/06 IF SAR  Printed on recycled paper
To Our Shareholders
The Dodge & Cox Income Fund generated a total return of 0.1% for the six months ended June 30, 2006, compared to
-0.7% for the Lehman Brothers Aggregate Bond Index (LBAG). Longer-term results can be found on the following page. At quarter end, the Fund had net assets of $10.3 billion with a cash position of 1.7%.
Market Commentary
Solid U.S. economic growth and higher inflation drove Treasury yields significantly higher across all maturities over the first half of the year. With increases of between 0.65% and 0.75%, interest rates on U.S. Treasuries were above 5% as of June 30th, for all maturities greater than 2 years. In general, the U.S. economy is healthy: first quarter (annualized) GDP growth was 5.6%, marking a strong recovery from the 1.7% GDP growth rate of the fourth quarter of 2005. In addition, the manufacturing and service sectors remain solid. However, nascent signs of a slowdown emerged in June, and future GDP growth is expected to decelerate to a range of 2.5% to 3.5%. The monthly pace of job creation has slowed from 2005/early 2006 levels, and the housing market is softening (albeit from record highs) as housing starts and building permits declined by over 15% since January. These and other indicators portend a more moderate pace of economic expansion over the intermediate term.
The Federal Reserve has raised the target Fed Funds rate 17 consecutive times—by 0.25%—since June 2004 (including four times thus far in 2006). The rate is now 5.25%—its highest level since 2001. Fed Chairman Ben Bernanke has indicated that future policy moves will depend upon incoming economic data, although he and other Fed officials noted publicly that core inflation is outside their “comfort zone” (presumably 1% to 2%).
Most broad measures of inflation have risen appreciably: for example, the Consumer Price Index (CPI, year-over-year) rose to 4.3%, compared to 2.5% a year earlier. While broad price measures have been significantly influenced by higher commodity prices—particularly crude oil which topped $75 a barrel this year—core inflation (CPI, excluding food and energy) showed a meaningful increase as well, rising to 2.6% versus 2.0% a year ago.
As interest rates rose during the first six months of the year, price declines generally overwhelmed the income earned, resulting in negative returns for the broad sectors of the bond market. U.S. Treasuries returned -1.3%, the Corporate sector returned -1.6% and the shorter-duration Mortgage-Backed Security (MBS) sector returned -0.1%.
Performance Review
For the first six months of 2006, the Fund provided a total return of 0.1%, outpacing the LBAG return by 0.8%. There were three
primary drivers of this relative outperformance. First, several corporate holdings performed well. For example, the largest General Motors Acceptance Corp. (GMAC) holding returned 8.4%, and the largest Ford Motor Credit (FMCC) holding returned 6.9%. These two issuers together comprised 5.1% of the Fund as of quarter end. Second, the Fund held a relatively high percentage of short-maturity securities, whose prices are less sensitive to interest rate increases. And third, the Fund’s higher yield translated into higher earned income than the LBAG.
Current Strategy
We invest the Fund’s assets with a three-to-five year investment horizon and a focus on establishing a high and stable rate of current income, consistent with the long-term preservation of capital. We also look to take advantage of opportunities in securities which have the potential for strong relative price performance. To that end, we rely upon a patient, disciplined approach to specific security selection that utilizes our independent, fundamental research capabilities. We employ a strong price discipline and typically make incremental adjustments to the Fund’s positioning as valuations, and fundamental conditions in the economy, markets, or specific companies/securities, change.
During the first half of 2006 we made the following changes:
| • | | We increased the Fund’s MBS weighting from 33.6% to 43.7%, primarily through purchases of two types of Agency mortgage pass-through securities: slightly seasoned, low coupon, 30-year MBS and slightly seasoned, 30-year “Hybrid” ARM (Adjustable-Rate Mortgage) MBS. |
| • | | Within the Corporate sector, we initiated positions in three issuers and added to several existing Fund holdings. The Fund’s Corporate weighting was 32.9% on June 30, an increase of over 3%. |
| • | | Prompted by the higher yields and better relative return potential of certain intermediate-maturity securities, we modestly lengthened the Fund’s duration1 from 3.5 years at the beginning of the period to 4.1 years by the end of June. |
Opportunities in Mortgage-Backed Securities (MBS)
We conduct intensive, fundamental research on MBS securities, similar to our approach to corporate credit research. In MBS-related research, the key to security valuation is understanding the propensity of the homeowners underlying the mortgage loans to prepay their loans across a broad range of environments, and the effect of this prepayment profile on the security’s current valuation and prospective total return.
| | |
| 1 / Dodge & Cox Income Fund | | |
As a result of the rise in interest rates and the flattening of the yield curve, the yield premiums of slightly seasoned, deep-discount, 30-year MBS grew; as our analysis indicated that they offered attractive yields and good total return potential versus other high-quality, intermediate-duration alternatives, we added to the Fund’s holdings. We also introduced a new type of Agency MBS to the Fund—slightly seasoned, 30-year, Hybrid ARMs. These securities combine attributes of normal fixed-rate mortgages with those of ARMs. Hybrid ARM borrowers pay a fixed rate on their loan for the first several years (3, 5, 7 or 10 years, depending upon the loan type); thereafter, the rate on the loan resets annually at a fixed margin to either LIBOR2 or U.S. Treasury yields. We have focused on “5/1 ARMs” (rate is fixed for the first five years, then resets annually for the remaining 25 years) that are trading at discounts to par as we believe they offer attractive expected returns relative to other high-quality, short-duration alternatives over a broad range of scenarios.
Duration Positioning
We have moderated somewhat our defensive duration position in light of generally higher yields across the board and the specific opportunities in MBS and corporates described above; nevertheless, we remain concerned that long-term (10+ years to maturity) interest rates could rise further given our expectations for continued U.S. economic growth and rising inflation. As a result, we continue to target a duration position shorter than that of the LBAG. In today’s flat yield curve environment, this positioning (holding a greater proportion of short-term securities) does not adversely affect the Fund’s yield.
In Closing
We will continue to utilize our bottom-up research process as we closely monitor existing holdings and identify new opportunities in our efforts to add to the Fund’s yield and total return potential over our extended investment horizon while maintaining a high average quality portfolio (currently, Aa average)3. Thank you for your continued confidence in the Dodge & Cox Income Fund.
For the Board of Trustees,
| | |

| | 
|
| Harry R. Hagey, Chairman | | Dana M. Emery, Vice President |
August 4, 2006
Growth of $10,000 Over 10 Years
For an investment made on June 30, 1996
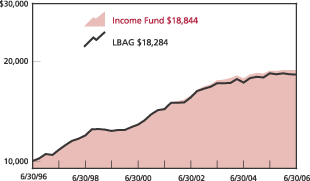
Average Annual Total Return
for periods ended June 30, 2006
| | | | | | | | | |
| | | 1 Year | | | 5 Years | | | 10 Years | |
Dodge & Cox Income Fund | | 0.40 | % | | 5.42 | % | | 6.53 | % |
Lehman Brothers
Aggregate Bond Index (LBAG) | | (0.81 | ) | | 4.97 | | | 6.22 | |
Past performance does not guarantee future results. Investment return and share price will fluctuate with market conditions, and investors may have a gain or loss when shares are sold. Mutual fund performance changes over time and currently may be significantly lower than stated above. Performance is updated and published monthly. Visit the Fund’s web site at www.dodgeandcox.com or call 1-800-621-3979 for current performance figures.
The Fund’s total returns include the reinvestment of dividend and capital gain distributions, but have not been adjusted for any income taxes payable by shareholders on these distributions. The Lehman Brothers Aggregate Bond Index is an unmanaged index of investment-grade fixed-income securities. Index returns include dividends and/or interest income and, unlike Fund returns, do not reflect fees or expenses.
Lehman Brothers® is a trademark of Lehman Brothers, Inc.
| 1 | | Duration is a measure of a bond’s price sensitivity to changes in interest rates. |
| 2 | | LIBOR (London Interbank Offered Rate) is the rate of interest at which banks borrow funds from other banks in the London interbank market. It is a widely and internationally used reference rate for short term interest rates. |
| 3 | | The Fund may invest in securities rated below Aa. As of June 30, 2006, 30.9% of the Fund was rated below Aa [which includes 12.5% rated below investment grade (below Baa)]. |
| | |
| | | Dodge & Cox Income Fund / 2 |
Fund Expense Example
As a Fund shareholder, you incur ongoing Fund costs, including management fees and other Fund expenses. All mutual funds have ongoing costs, sometimes referred to as operating expenses.
The following example shows ongoing costs of investing in the Fund and can help you understand these costs and compare them with those of other mutual funds. The example assumes a $1,000 investment held for the six months indicated.
Actual Expenses
The first line of the table below provides information about actual account values and expenses based on the Fund’s actual returns. You may use the information in this line, together with your account balance, to estimate the expenses that you paid over the period. Simply divide your account value by $1,000 (for example, an $8,600 account value divided by $1,000 = 8.6), then multiply the result by the number in the first line under the heading “Expenses Paid During Period” to estimate the expenses you paid on your account during this period.
Hypothetical Example for Comparison with Other Mutual Funds
Information on the second line of the table can help you compare ongoing costs of investing in the Fund with those of other mutual funds. This information may not be used to estimate the actual ending account balance or expenses you paid during the period. The hypothetical “Ending Account Value” is based on the actual expense ratio of the Fund and an assumed 5% annual rate of return before expenses (not the Fund’s actual return). The amount under the heading “Expenses Paid During the Period” shows the hypothetical expenses your account would have incurred under this scenario. You can compare this figure with the 5% hypothetical examples that appear in shareholder reports of other mutual funds.
| | | | | | | | | |
Six Months Ended June 30, 2006 | | Beginning Account
Value 1/1/2006 | | Ending Account
Value 6/30/2006 | | Expenses Paid
During Period* |
Based on Actual Fund Return | | $ | 1,000.00 | | $ | 1,000.90 | | $ | 2.19 |
Based on Hypothetical 5% Yearly Return | | | 1,000.00 | | | 1,022.61 | | | 2.21 |
| * | | Expenses are equal to the Fund’s annualized six-month expense ratio of 0.44%, multiplied by the average account value over the period, multiplied by 181/365 (to reflect the one-half year period). |
The expenses shown in the table highlight ongoing costs only and do not reflect any transactional costs or account maintenance fees. While other mutual funds may charge such fees, please note that the Fund does not charge transaction fees (e.g., redemption fees, sales loads) or universal account maintenance fees (e.g., small account fees).
| | |
| 3 / Dodge & Cox Income Fund | | |
Fund Information | June 30, 2006 |
General Information
| | |
Net Asset Value Per Share | | $12.25 |
Total Net Assets (billions) | | $10.3 |
Expense Ratio (annualized) | | 0.44% |
2005 Portfolio Turnover Rate | | 24% |
30-Day SEC Yield(a) | | 5.51% |
Fund Inception | | 1989 |
|
| Investment Manager: Dodge & Cox, San Francisco. Managed by the Fixed-Income Strategy Committee, whose nine members’ average tenure at Dodge & Cox is 16 years, and by the Investment Policy Committee, whose 13 members’ (for fixed-income decisions) average tenure at Dodge & Cox is 21 years. |
| | | | |
| Portfolio Characteristics | | Fund | | LBAG |
Number of Fixed-Income Securities | | 367 | | 6,824 |
Average Maturity (years) | | 6.4 | | 7.2 |
Effective Duration (years) | | 4.1 | | 4.8 |
| | | |
| Five Largest Corporate Issuers(c) | | Fund | |
Ford Motor Credit Co. | | 3.0 | % |
Time Warner, Inc. (AOL Time Warner) | | 2.2 | |
GMAC | | 2.1 | |
Xerox Corp. | | 2.0 | |
HCA, Inc. | | 1.9 | |
| | | | | | |
| Credit Quality(d) | | Fund | | | LBAG | |
U.S. Government & Government Agencies | | 65.2 | % | | 71.3 | % |
Aaa | | 0.5 | | | 7.6 | |
Aa | | 1.7 | | | 5.3 | |
A | | 4.7 | | | 8.3 | |
Baa | | 13.7 | | | 7.5 | |
Ba | | 11.7 | | | 0.0 | |
B | | 0.8 | | | 0.0 | |
Cash Equivalents | | 1.7 | | | 0.0 | |
| | |
Average Quality | | Aa | | | AA+ | |
Asset Allocation
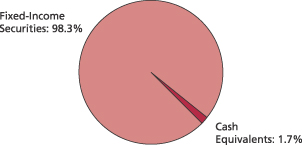
| | | | | | |
| Sector Diversification | | Fund | | | LBAG | |
U.S. Treasury & Government Agency | | 21.7 | % | | 36.4 | % |
Mortgage-Related Securities | | 43.7 | | | 34.9 | |
Asset-Backed Securities/CMBS(b) | | 0.0(e) | | | 5.7 | |
Corporate | | 32.9 | | | 19.2 | |
Non-Corporate Yankee | | 0.0 | | | 3.8 | |
Cash Equivalents | | 1.7 | | | 0.0 | |
| | | | | | |
| Maturity Diversification | | Fund | | | LBAG | |
0-1 Years to Maturity | | 4.1 | % | | 0.0 | % |
1-5 | | 50.8 | | | 41.6 | |
5-10 | | 34.5 | | | 46.7 | |
10-15 | | 0.9 | | | 3.1 | |
15-20 | | 0.5 | | | 2.5 | |
20-25 | | 5.7 | | | 3.4 | |
25 and Over | | 3.5 | | | 2.7 | |
| (a) | | SEC Yield is an annualization of the Fund’s total net investment income per share for the 30-day period ended on the last day of the month. |
| (b) | | CMBS refers to Commercial Mortgage-Backed Securities, which are a component of the LBAG but not currently held by the Fund. |
| (c) | | The Fund’s portfolio holdings are subject to change without notice. The mention of specific securities is not a recommendation or solicitation for any person to buy, sell or hold any particular security. |
| (d) | | The Fund’s credit quality ratings are from Moody’s Investor Services. If no Moody’s rating is available, the Standard & Poor’s rating is reported. If unrated, the investment manager determines a comparable rating, which is included in the portfolio breakdown. The LBAG’s credit quality ratings are from Lehman Brothers and reference Moody’s, Standard & Poor’s and Fitch ratings. In calculating average quality for the Fund, the investment manager assigns ratings to U.S. Government and Government Agency securities that are higher than the ratings assigned to securities rated Aaa while Lehman Brothers’ methodology assigns the same ratings to these three categories of securities. The credit quality of the investments in the portfolio does not apply to the stability or safety of the Fund or its shares. |
| | |
| | | Dodge & Cox Income Fund / 4 |
Portfolio of Investments (unaudited) | June 30, 2006 |
| | | | | | |
| FIXED-INCOME SECURITIES: 98.3% | | | | |
| | |
| | | PAR VALUE | | VALUE |
| U.S. TREASURY AND GOVERNMENT AGENCY: 21.7% |
| U.S. TREASURY: 19.1% |
U.S. Treasury Notes | | | | | | |
6.625%, 5/15/07 | | $ | 240,000,000 | | $ | 242,596,800 |
3.00%, 11/15/07 | | | 475,000,000 | | | 461,176,550 |
3.125%, 10/15/08 | | | 125,000,000 | | | 119,599,625 |
3.25%, 1/15/09 | | | 400,000,000 | | | 382,218,800 |
3.625%, 7/15/09 | | | 435,000,000 | | | 416,835,270 |
3.375%, 9/15/09 | | | 275,000,000 | | | 261,024,500 |
3.50%, 11/15/09 | | | 100,000,000 | | | 95,050,800 |
| | | | | |
|
|
| | | | | | | 1,978,502,345 |
| GOVERNMENT AGENCY: 2.6% | | | | | | |
Small Business Administration (504) | | | | | | |
Series 91-20K, 8.25%, 11/1/11 | | | 562,760 | | | 583,894 |
Series 92-20B, 8.10%, 2/1/12 | | | 348,047 | | | 360,579 |
Series 92-20C, 8.20%, 3/1/12 | | | 1,055,193 | | | 1,095,432 |
Series 92-20D, 8.20%, 4/1/12 | | | 626,670 | | | 651,050 |
Series 92-20G, 7.60%, 7/1/12 | | | 1,233,344 | | | 1,270,610 |
Series 92-20H, 7.40%, 8/1/12 | | | 916,931 | | | 942,415 |
Series 92-20I, 7.05%, 9/1/12 | | | 1,064,062 | | | 1,088,486 |
Series 92-20J, 7.00%, 10/1/12 | | | 1,591,568 | | | 1,627,489 |
Series 92-20K, 7.55%, 11/1/12 | | | 1,480,802 | | | 1,527,653 |
Series 92-20L, 7.45%, 12/1/12 | | | 820,288 | | | 845,372 |
Series 93-20B, 7.00%, 2/1/13 | | | 1,154,580 | | | 1,180,682 |
Series 93-20C, 6.50%, 3/1/13 | | | 3,528,574 | | | 3,581,201 |
Series 93-20D, 6.75%, 4/1/13 | | | 1,309,002 | | | 1,334,170 |
Series 93-20E, 6.55%, 5/1/13 | | | 4,305,837 | | | 4,375,468 |
Series 93-20F, 6.65%, 6/1/13 | | | 1,472,696 | | | 1,499,367 |
Series 93-20L, 6.30%, 12/1/13 | | | 2,495,172 | | | 2,525,848 |
Series 94-20A, 6.50%, 1/1/14 | | | 2,817,085 | | | 2,859,299 |
Series 94-20D, 7.70%, 4/1/14 | | | 932,606 | | | 960,430 |
Series 94-20E, 7.75%, 5/1/14 | | | 2,501,538 | | | 2,593,534 |
Series 94-20F, 7.60%, 6/1/14 | | | 1,592,601 | | | 1,648,128 |
Series 94-20G, 8.00%, 7/1/14 | | | 1,107,706 | | | 1,150,470 |
Series 94-20H, 7.95%, 8/1/14 | | | 1,231,730 | | | 1,279,128 |
Series 94-20I, 7.85%, 9/1/14 | | | 1,597,641 | | | 1,657,634 |
Series 94-20K, 8.65%, 11/1/14 | | | 1,077,334 | | | 1,132,502 |
Series 94-20L, 8.40%, 12/1/14 | | | 1,019,753 | | | 1,068,877 |
Series 95-20A, 8.50%, 1/1/15 | | | 420,025 | | | 439,413 |
Series 95-20C, 8.10%, 3/1/15 | | | 897,741 | | | 935,276 |
Series 97-20E, 7.30%, 5/1/17 | | | 1,835,509 | | | 1,897,559 |
Series 97-20J, 6.55%, 10/1/17 | | | 2,460,817 | | | 2,509,194 |
Series 98-20C, 6.35%, 3/1/18 | | | 10,203,963 | | | 10,366,808 |
Series 98-20H, 6.15%, 8/1/18 | | | 3,625,499 | | | 3,668,451 |
Series 98-20L, 5.80%, 12/1/18 | | | 2,017,806 | | | 2,023,286 |
Series 99-20C, 6.30%, 3/1/19 | | | 2,475,338 | | | 2,516,506 |
Series 99-20G, 7.00%, 7/1/19 | | | 5,899,535 | | | 6,111,402 |
Series 99-20I, 7.30%, 9/1/19 | | | 1,929,120 | | | 2,015,378 |
Series 01-20G, 6.625%, 7/1/21 | | | 13,419,300 | | | 13,870,469 |
Series 01-20L, 5.78%, 12/1/21 | | | 30,610,009 | | | 30,672,980 |
Series 02-20L, 5.10%, 12/1/22 | | | 7,429,538 | | | 7,169,769 |
Series 04-20L, 4.87%, 12/1/24 | | | 8,473,371 | | | 7,990,139 |
Series 05-20B, 4.625%, 2/1/25 | | | 11,343,034 | | | 10,516,912 |
| | | | | | |
| | |
| | | PAR VALUE | | VALUE |
Small Business Administration (504) (continued) | | | |
Series 05-20C, 4.95%, 3/1/25 | | $ | 7,697,146 | | $ | 7,399,074 |
Series 05-20E, 4.84%, 5/1/25 | | | 22,174,634 | | | 20,824,815 |
Series 05-20G, 4.75%, 7/1/25 | | | 19,613,096 | | | 18,306,225 |
Series 05-20I, 4.76%, 9/1/25 | | | 23,051,788 | | | 21,496,129 |
Series 06-20A, 5.21%, 1/1/26 | | | 22,492,000 | | | 21,612,462 |
Series 06-20B, 5.35%, 2/1/26 | | | 6,430,000 | | | 6,232,976 |
Series 06 20C, 5.57%, 3/1/26 | | | 33,230,000 | | | 32,661,820 |
| | | | | |
|
|
| | | | | | | 270,076,761 |
| | | | | |
|
|
| | | | | | | 2,248,579,106 |
| MORTGAGE-RELATED SECURITIES: 43.7% | | | |
| FEDERAL AGENCY CMO & REMIC: 4.3% | | | | | | |
Dept. of Veterans Affairs | | | | | | |
Trust 1995-2D 4A, 9.293%, 5/15/25 | | | 498,319 | | | 522,963 |
Trust 1997-2Z, 7.50%, 6/15/27 | | | 41,136,746 | | | 42,523,347 |
Trust 1998-1 1A, 8.161%, 10/15/27 | | | 1,416,569 | | | 1,474,490 |
Fannie Mae | | | | | | |
Trust 1994-72 J, 6.00%, 6/25/23 | | | 9,000,000 | | | 9,002,052 |
Trust 1998-58 PX, 6.50%, 9/25/28 | | | 3,746,697 | | | 3,807,864 |
Trust 1998-58 PC, 6.50%, 10/25/28 | | | 20,845,647 | | | 21,169,614 |
Trust 2002-33 A1, 7.00%, 6/25/32 | | | 7,194,731 | | | 7,338,174 |
Trust 2001-T4 A1, 7.50%, 7/25/41 | | | 6,093,634 | | | 6,255,021 |
Trust 2001-T10 A1, 7.00%, 12/25/41 | | | 10,283,247 | | | 10,469,170 |
Trust 2002-90 A1, 6.50%, 6/25/42 | | | 13,500,628 | | | 13,547,817 |
Trust 2002-W6 2A1, 7.00%, 6/25/42 | | | 11,744,462 | | | 11,960,157 |
Trust 2002-W8 A2, 7.00%, 6/25/42 | | | 5,919,798 | | | 6,013,531 |
Trust 2003-W2 1A2, 7.00%, 7/25/42 | | | 36,857,668 | | | 37,267,418 |
Trust 2003-W4 3A, 7.00%, 10/25/42 | | | 10,865,756 | | | 11,034,999 |
Trust 2003-07 A1, 6.50%, 12/25/42 | | | 15,574,571 | | | 15,694,240 |
Trust 2003-W1 1A1, 6.50%, 12/25/42 | | | 22,961,581 | | | 23,121,860 |
Trust 2003-W1 2A, 7.50%, 12/25/42 | | | 10,502,463 | | | 10,785,909 |
Trust 2004-W2 5A, 7.50%, 3/25/44 | | | 51,919,962 | | | 53,643,600 |
Trust 2004-W8 3A, 7.50%, 6/25/44 | | | 28,855,663 | | | 29,783,073 |
Trust 2005-W1 1A3, 7.00%, 10/25/44 | | | 26,863,087 | | | 27,330,497 |
Trust 2001-79 BA, 7.00%, 3/25/45 | | | 3,361,135 | | | 3,423,644 |
Trust 2006-W1 1A1, 6.50%, 12/25/45 | | | 3,622,622 | | | 3,655,984 |
Trust 2006-W1 1A2, 7.00%, 12/25/45 | | | 23,869,728 | | | 24,424,532 |
Trust 2006-W1 1A3, 7.50%, 12/25/45 | | | 376,616 | | | 390,560 |
Trust 2006-W1 1A4, 8.00%, 12/25/45 | | | 28,070,477 | | | 29,424,665 |
Freddie Mac | | | | | | |
Series 1565 G, 6.00%, 8/15/08 | | | 2,176,424 | | | 2,176,391 |
Series 1601 PJ, 6.00%, 10/15/08 | | | 10,272,915 | | | 10,274,665 |
Series (GN) 37 I, 6.00%, 6/17/22 | | | 1,856,787 | | | 1,854,143 |
Series 2374 QG, 6.00%, 2/15/30 | | | 205,146 | | | 204,759 |
Series 2439 LG, 6.00%, 9/15/30 | | | 13,589,522 | | | 13,608,638 |
Series T-48 1A, 7.10%, 7/25/33 | | | 10,375,219 | | | 10,611,496 |
Ginnie Mae 7.25%, 7/16/28 | | | 4,468,685 | | | 4,541,460 |
| | | | | |
|
|
| | | | | | | 447,336,733 |
| FEDERAL AGENCY MORTGAGE PASS-THROUGH: 39.2% |
Fannie Mae, 10 Year 5.881%, 9/1/12 | | | 25,552,163 | | | 25,726,077 |
Fannie Mae, 15 Year | | | | | | |
5.50%, 9/1/14-12/1/18 | | | 357,652,804 | | | 351,684,396 |
| | |
| 5 / Dodge & Cox Income Fund | | See accompanying Notes to Financial Statements |
Portfolio of Investments (unaudited) | June 30, 2006 |
| | | | | | |
| FIXED-INCOME SECURITIES (continued) | | |
| | |
| | | PAR VALUE | | VALUE |
Fannie Mae, 15 Year (continued) | | | | | | |
6.00%, 4/1/13-12/1/20 | | $ | 814,079,923 | | $ | 816,976,969 |
6.50%, 11/1/12-11/1/18 | | | 243,125,637 | | | 246,615,789 |
7.00%, 7/1/08-12/1/11 | | | 2,446,999 | | | 2,477,477 |
7.50%, 11/1/14-8/1/17 | | | 26,042,832 | | | 27,007,417 |
8.00%, 8/1/10 | | | 46,002 | | | 46,286 |
Fannie Mae, 20 Year | | | | | | |
6.50%, 4/1/19-10/1/24 | | | 78,872,620 | | | 79,798,159 |
Fannie Mae, 30 Year | | | | | | |
4.219%, 9/1/34 | | | 24,089,053 | | | 23,232,723 |
4.50%, 9/1/33-10/1/33 | | | 61,900,468 | | | 56,403,734 |
4.501%, 1/1/35 | | | 77,443,455 | | | 75,580,117 |
4.603%, 10/1/34 | | | 28,998,014 | | | 28,417,216 |
4.714%, 8/1/34 | | | 6,406,483 | | | 6,272,980 |
4.799%, 1/1/36 | | | 44,535,039 | | | 43,831,749 |
4.854%, 8/1/35 | | | 63,515,723 | | | 62,073,164 |
5.00%, 3/1/34 | | | 191,240,923 | | | 179,632,871 |
5.002%, 9/1/35 | | | 28,343,204 | | | 27,697,444 |
5.046%, 7/1/35 | | | 157,698,047 | | | 155,088,409 |
5.062%, 4/1/35 | | | 36,612,251 | | | 36,073,190 |
5.50%, 5/1/34 | | | 223,102,741 | | | 215,227,304 |
6.00%, 2/1/34-7/1/35 | | | 707,595,353 | | | 698,928,240 |
6.50%, 12/1/32-1/1/34 | | | 226,875,050 | | | 228,944,373 |
7.00%, 4/1/32 | | | 4,838,412 | | | 4,960,102 |
7.50%, 9/1/07 | | | 129,329 | | | 129,774 |
8.00%, 1/1/12-8/1/22 | | | 263,063 | | | 269,276 |
Fannie Mae Multifamily DUS | | | | | | |
Pool 760744, 4.75%, 3/1/15 | | | 13,570,000 | | | 12,735,451 |
Pool 555162, 4.834%, 1/1/13 | | | 17,377,220 | | | 16,633,598 |
Pool 555191, 4.843%, 2/1/13 | | | 19,557,062 | | | 18,720,986 |
Pool 555172, 5.578%, 12/1/12 | | | 3,668,469 | | | 3,641,807 |
Pool 545685, 6.017%, 4/1/12 | | | 29,098,335 | | | 29,347,179 |
Pool 545708, 6.055%, 5/1/12 | | | 2,563,157 | | | 2,595,119 |
Pool 545209, 6.126%, 10/1/11 | | | 43,884,627 | | | 44,502,314 |
Pool 545059, 6.224%, 5/1/11 | | | 22,866,702 | | | 23,245,410 |
Pool 323822, 6.511%, 7/1/09 | | | 6,235,038 | | | 6,324,500 |
Pool 160329, 7.15%, 10/1/15 | | | 6,061,619 | | | 6,397,392 |
Freddie Mac, 30 Year | | | | | | |
7.25%, 1/1/08 | | | 237 | | | 237 |
7.50%, 10/1/08 | | | 4,407 | | | 4,419 |
8.00%, 1/1/08 - 8/1/09 | | | 20,009 | | | 20,089 |
8.25%, 5/1/09 | | | 35 | | | 35 |
Freddie Mac Gold, 15 Year | | | | | | |
4.16%, 3/1/35 | | | 13,737,544 | | | 13,168,976 |
5.50%, 11/1/13-11/1/18 | | | 83,476,666 | | | 82,030,675 |
6.00%, 4/1/13-2/1/19 | | | 165,132,669 | | | 165,411,557 |
6.50%, 2/1/11-9/1/18 | | | 91,918,817 | | | 93,015,971 |
7.00%, 11/1/08-3/1/12 | | | 2,235,929 | | | 2,272,151 |
Freddie Mac Gold, 20 Year | | | | | | |
6.50%, 7/1/21-4/1/22 | | | 5,779,704 | | | 5,852,151 |
Freddie Mac Gold, 30 Year | | | | | | |
4.321%, 8/1/34 | | | 17,807,456 | | | 17,274,100 |
4.706%, 8/1/35 | | | 20,413,388 | | | 19,765,396 |
6.50%, 5/1/17-12/1/32 | | | 53,190,733 | | | 53,735,232 |
| | | | | | |
| | |
| | | PAR VALUE | | VALUE |
Freddie Mac Gold, 30 Year (continued) | | | | | | |
7.00%, 4/1/31 | | $ | 28,253,011 | | $ | 28,996,160 |
7.90%, 2/17/21 | | | 3,354,543 | | | 3,507,072 |
Ginnie Mae, 15 Year 7.00%, 4/15/09 | | | 760,295 | | | 768,955 |
Ginnie Mae, 30 Year | | | | | | |
7.00%, 5/15/28 | | | 2,622,629 | | | 2,705,326 |
7.50%, 9/15/17-5/15/25 | | | 8,776,089 | | | 9,122,341 |
7.80%, 6/15/20-1/15/21 | | | 2,279,398 | | | 2,330,119 |
| | | | | |
|
|
| | | | | | | 4,057,219,954 |
| PRIVATE LABEL CMO & REMIC SECURITIES: 0.2% | | | |
GSMPS Mortgage Loan Trust, Series 2004-4 1A4 8.50%, 6/25/34(b) | | | 17,034,474 | | | 17,810,147 |
| | | | | |
|
|
| | | | | | | 4,522,366,834 |
| ASSET-BACKED SECURITIES: 0.0%(d) | | | | | | |
| PRIVATE LABEL CMO & REMIC SECURITIES: 0.0%(d) | | | |
CA Infrastructure and Econ. Dev. Bank Special Purpose Trust SCE-1 Rate Reduction Ctf. 1997-1 A-6 6.38%, 9/25/08 | | | 1,063,169 | | | 1,065,543 |
CA Infrastructure and Econ. Dev. Bank Special Purpose Trust PGE-1 Rate Reduction Ctf. 1997-1 A-7 6.42%, 9/25/08 | | | 745,030 | | | 746,717 |
| | | | | |
|
|
| | | | | | | 1,812,260 |
| CORPORATE: 32.9% | | | | | | |
| FINANCIALS: 6.3% | | | | | | |
BankAmerica Capital II(a) 8.00%, 12/15/26, callable 2006 | | | 14,250,000 | | | 14,924,082 |
BankAmerica Capital VI(a) 5.625%, 3/8/35 | | | 21,450,000 | | | 18,381,620 |
BankAmerica Capital XI(a) 6.625%, 5/23/36 | | | 10,000,000 | | | 9,878,520 |
Boston Properties, Inc. | | | | | | |
6.25%, 1/15/13 | | | 50,036,000 | | | 50,479,819 |
5.625%, 4/15/15 | | | 34,195,000 | | | 32,945,002 |
5.00%, 6/1/15 | | | 15,309,000 | | | 14,043,956 |
Citicorp Capital I(a)
7.933%, 2/15/27, callable 2007 | | | 6,375,000 | | | 6,690,480 |
Citicorp Capital II(a)
8.015%, 2/15/27, callable 2007 | | | 10,300,000 | | | 10,818,657 |
Citigroup, Inc. (First Nationwide)
10.00%, 10/1/06 | | | 4,065,000 | | | 4,104,288 |
EOP Operating Limited Partnership(c) | | | | | | |
7.00%, 7/15/11 | | | 33,470,000 | | | 34,770,778 |
5.875%, 1/15/13 | | | 37,700,000 | | | 36,947,093 |
4.75%, 3/15/14 | | | 83,475,000 | | | 75,712,242 |
HSBC Holdings PLC 6.50%, 5/2/36 | | | 27,500,000 | | | 27,034,645 |
JPMorgan Chase (Bank One) Capital III(a) 8.75%, 9/1/30 | | | 19,130,000 | | | 23,604,086 |
Kaupthing Bank(b) 7.125%, 5/19/16 | | | 76,000,000 | | | 76,022,800 |
Safeco Corp. | | | | | | |
4.875%, 2/1/10 | | | 15,115,000 | | | 14,671,360 |
7.25%, 9/1/12 | | | 17,873,000 | | | 19,093,976 |
| | |
| See accompanying Notes to Financial Statements | | Dodge & Cox Income Fund / 6 |
Portfolio of Investments (unaudited) | June 30, 2006 |
| | | | | | |
| FIXED-INCOME SECURITIES (continued) | | |
| | |
| | | PAR VALUE | | VALUE |
St. Paul Travelers Companies, Inc. | | | | | | |
8.125%, 4/15/10 | | $ | 21,425,000 | | $ | 23,012,957 |
5.00%, 3/15/13 | | | 16,295,000 | | | 15,493,970 |
5.50%, 12/1/15 | | | 11,135,000 | | | 10,517,353 |
6.25%, 6/20/16 | | | 26,000,000 | | | 25,888,408 |
UnumProvident Corp. | | | | | | |
7.625%, 3/1/11 | | | 20,734,000 | | | 21,604,538 |
6.85%, 11/15/15(b) | | | 11,700,000 | | | 11,501,837 |
7.19%, 2/1/28 | | | 11,640,000 | | | 10,513,760 |
6.75%, 12/15/28 | | | 12,755,000 | | | 11,470,508 |
7.375%, 6/15/32 | | | 29,670,000 | | | 28,756,698 |
UnumProvident Corp. (Provident Companies, Inc.) 7.25%, 3/15/28 | | | 23,905,000 | | | 22,777,784 |
| | | | | |
|
|
| | | | | | | 651,661,217 |
| INDUSTRIALS: 24.7% | | | | | | |
AT&T Corp. | | | | | | |
7.30%, 11/15/11 | | | 37,705,000 | | | 40,025,102 |
8.00%, 11/15/31 | | | 113,325,000 | | | 130,108,772 |
CIGNA Corp. | | | | | | |
7.00%, 1/15/11 | | | 13,565,000 | | | 14,093,859 |
6.375%, 10/15/11 | | | 28,650,000 | | | 29,044,195 |
7.65%, 3/1/23 | | | 3,330,000 | | | 3,531,398 |
7.875%, 5/15/27 | | | 27,615,000 | | | 30,342,036 |
8.30%, 1/15/33 | | | 4,925,000 | | | 5,579,424 |
Comcast Corp. | | | | | | |
5.30%, 1/15/14 | | | 74,525,000 | | | 70,115,803 |
5.85%, 11/15/15 | | | 24,700,000 | | | 23,787,483 |
5.90%, 3/15/16 | | | 33,675,000 | | | 32,354,165 |
Cox Communications, Inc. 5.45%, 12/15/14 | | | 104,495,000 | | | 96,615,868 |
Dillard’s, Inc. | | | | | | |
6.625%, 11/15/08 | | | 4,985,000 | | | 4,997,463 |
7.13%, 8/1/18 | | | 23,715,000 | | | 22,410,675 |
7.75%, 7/15/26 | | | 21,666,000 | | | 20,528,535 |
7.75%, 5/15/27 | | | 12,803,000 | | | 12,130,843 |
7.00%, 12/1/28 | | | 28,825,000 | | | 25,510,125 |
Dow Chemical Co. | | | | | | |
4.027%, 9/30/09(b) | | | 54,087,000 | | | 51,093,555 |
6.00%, 10/1/12 | | | 9,600,000 | | | 9,670,762 |
7.375%, 11/1/29 | | | 29,514,000 | | | 32,779,488 |
Electronic Data Systems Corp. 6.50%, 8/1/13 | | | 60,340,000 | | | 59,526,375 |
Federated Department Stores, Inc. (May Department Stores Co.) | | | | | | |
7.625%, 8/15/13 | | | 7,105,000 | | | 7,661,300 |
7.60%, 6/1/25 | | | 13,500,000 | | | 14,384,655 |
6.70%, 9/15/28 | | | 12,950,000 | | | 12,627,532 |
8.75%, 5/15/29 | | | 39,997,000 | | | 47,863,530 |
7.875%, 3/1/30 | | | 34,645,000 | | | 38,077,142 |
6.90%, 1/15/32 | | | 15,465,000 | | | 15,483,032 |
6.70%, 7/15/34 | | | 12,350,000 | | | 12,060,121 |
7.875%, 8/15/36, callable 2016 | | | 7,825,000 | | | 8,140,308 |
| | | | | | |
| | |
| | | PAR VALUE | | VALUE |
Ford Motor Credit Co. | | | | | | |
5.80%, 1/12/09 | | $ | 30,250,000 | | $ | 27,635,432 |
7.375%, 10/28/09 | | | 10,100,000 | | | 9,337,834 |
7.375%, 2/1/11 | | | 75,465,000 | | | 67,572,719 |
7.25%, 10/25/11 | | | 227,020,000 | | | 201,383,766 |
General Electric Co. 5.00%, 2/1/13 | | | 34,994,000 | | | 33,518,618 |
GMAC 6.875%, 9/15/11 | | | 227,230,000 | | | 216,813,777 |
HCA, Inc. | | | | | | |
8.75%, 9/1/10 | | | 54,595,000 | | | 57,557,598 |
7.875%, 2/1/11 | | | 33,675,000 | | | 34,400,090 |
6.25%, 2/15/13 | | | 39,655,000 | | | 37,028,649 |
6.75%, 7/15/13 | | | 28,883,000 | | | 27,581,185 |
5.75%, 3/15/14 | | | 28,675,000 | | | 25,640,898 |
6.50%, 2/15/16 | | | 19,690,000 | | | 18,205,886 |
Health Net, Inc. 8.375%, 4/15/11 | | | 66,020,000 | | | 73,853,999 |
Hess Corp. (Amerada Hess) 7.875%, 10/1/29 | | | 33,870,000 | | | 37,787,845 |
Hewlett-Packard Co. 5.50%, 7/1/07 | | | 35,945,000 | | | 35,873,865 |
Liberty Media Corp. | | | | | | |
8.50%, 7/15/29 | | | 16,375,000 | | | 15,925,867 |
4.00%, 11/15/29, exchangeable | | | 25,500,000 | | | 15,682,500 |
8.25%, 2/1/30 | | | 23,150,000 | | | 22,157,745 |
3.75%, 2/15/30, exchangeable | | | 38,285,000 | | | 21,535,313 |
Lockheed Martin Corp. | | | | | | |
7.65%, 5/1/16 | | | 15,025,000 | | | 16,864,180 |
8.50%, 12/1/29 | | | 16,684,000 | | | 20,999,150 |
Raytheon Co. | | | | | | |
6.75%, 8/15/07 | | | 6,756,000 | | | 6,821,614 |
6.55%, 3/15/10 | | | 10,150,000 | | | 10,387,409 |
7.20%, 8/15/27 | | | 4,905,000 | | | 5,402,328 |
Time Warner, Inc. (AOL Time Warner) | | | | | | |
7.625%, 4/15/31 | | | 119,983,000 | | | 129,188,696 |
7.70%, 5/1/32 | | | 95,449,000 | | | 103,738,937 |
Wellpoint, Inc. | | | | | | |
5.00%, 12/15/14 | | | 14,225,000 | | | 13,230,559 |
5.25%, 1/15/16 | | | 71,020,000 | | | 66,559,518 |
Wyeth | | | | | | |
5.50%, 3/15/13 | | | 10,070,000 | | | 9,803,407 |
5.50%, 2/1/14 | | | 110,215,000 | | | 106,494,582 |
Wyeth (American Home Products)
6.95%, 3/15/11 | | | 8,155,000 | | | 8,507,312 |
Xerox Corp. | | | | | | |
9.75%, 1/15/09 | | | 28,850,000 | | | 30,797,375 |
7.125%, 6/15/10 | | | 77,640,000 | | | 78,222,300 |
6.875%, 8/15/11 | | | 52,550,000 | | | 52,221,562 |
6.40%, 3/15/16 | | | 22,795,000 | | | 21,512,781 |
7.20%, 4/1/16 | | | 24,396,000 | | | 24,456,990 |
| | | | | |
|
|
| | | | | | | 2,555,245,832 |
| | |
| 7 / Dodge & Cox Income Fund | | See accompanying Notes to Financial Statements |
Portfolio of Investments (unaudited) | June 30, 2006 |
| | | | | | |
| FIXED-INCOME SECURITIES (continued) | | |
| | |
| | | PAR VALUE | | VALUE |
| TRANSPORTATION: 1.9% | | | | | | |
Burlington Northern Santa Fe Railway | | | | | | |
4.30%, 7/1/13 | | $ | 6,283,000 | | $ | 5,744,459 |
4.875%, 1/15/15 | | | 3,085,000 | | | 2,877,429 |
7.57%, 1/2/21 | | | 11,945,760 | | | 13,090,642 |
8.251%, 1/15/21 | | | 1,173,957 | | | 1,340,706 |
5.72%, 1/15/24 | | | 30,250,000 | | | 30,028,258 |
CSX Transportation, Inc. 9.75%, 6/15/20 | | | 10,072,000 | | | 13,054,863 |
FedEx Corp. 6.72%, 1/15/22 | | | 7,988,508 | | | 8,305,093 |
Norfolk Southern Corp. | | | | | | |
7.70%, 5/15/17 | | | 13,515,000 | | | 15,282,667 |
9.75%, 6/15/20 | | | 13,908,000 | | | 18,178,896 |
Union Pacific Corp. | | | | | | |
6.50%, 4/15/12 | | | 12,337,000 | | | 12,708,072 |
5.375%, 5/1/14 | | | 22,886,000 | | | 22,186,238 |
4.875%, 1/15/15 | | | 9,885,000 | | | 9,186,219 |
6.85%, 1/2/19 | | | 7,570,951 | | | 7,944,350 |
6.70%, 2/23/19 | | | 12,515,007 | | | 13,036,132 |
7.60%, 1/2/20 | | | 1,347,506 | | | 1,490,180 |
4.698%, 1/2/24 | | | 6,273,458 | | | 5,754,329 |
5.082%, 1/2/29 | | | 10,923,461 | | | 10,145,501 |
| | | | | |
|
|
| | | | | | | 190,354,034 |
| | | | | |
|
|
| | | | | | | 3,397,261,083 |
| | | | | |
|
|
TOTAL FIXED-INCOME SECURITIES
(Cost $10,389,116,163) | | | 10,170,019,283 |
| | | | | |
|
|
| | | | | | | |
| SHORT-TERM INVESTMENTS: 1.0% |
| | |
| | | PAR VALUE | | | VALUE |
SSgA Prime Money Market Fund | | $ | 51,040,145 | | | $ | 51,040,145 |
State Street Repurchase Agreement 4.30%, 7/3/06, maturity value $50,578,117 (collateralized by U.S. Treasury Securities, value $51,575,825, 4.125%, 8/15/08) | | | 50,560,000 | | | | 50,560,000 |
| | | | | | |
|
|
TOTAL SHORT-TERM INVESTMENTS
(Cost $101,600,145) | | | | 101,600,145 |
| | | | | | |
|
|
TOTAL INVESTMENTS
(Cost $10,490,716,308) | | | 99.3 | % | | | 10,271,619,428 |
OTHER ASSETS LESS LIABILITIES | | | 0.7 | % | | | 70,009,154 |
| | |
|
|
| |
|
|
TOTAL NET ASSETS | | | 100.0 | % | | $ | 10,341,628,582 |
| | |
|
|
| |
|
|
| (a) | | Cumulative preferred security |
| (b) | | Security exempt from registration under Rule 144A of the Securities Act of 1933. The security may be resold in transactions exempt from registration, normally to qualified institutional buyers. As of June 30, 2006, all such securities in total represented $156,428,339 or 1.5% of total net assets. |
| (c) | | EOP Operating LP is the operating partnership of Equity Office Properties Trust. |
When two issuers are identified, the first name refers to the acquirer or successor obligor, and the second name (within the parentheses) refers to the original issuer of the instrument.
CMO: Collateralized Mortgage Obligation
REMIC: Real Estate Mortgage Investment Conduit
| | |
| See accompanying Notes to Financial Statements | | Dodge & Cox Income Fund / 8 |
| | |
| Statement of Assets and Liabilities (unaudited) |
| | | | |
| |
| | | June 30, 2006 | |
| Assets: | | | | |
Investments, at value (cost $10,490,716,308) | | $ | 10,271,619,428 | |
Receivable for paydowns on
mortgage-backed securities | | | 775,399 | |
Receivable for Fund shares sold | | | 15,424,646 | |
Interest receivable | | | 109,523,406 | |
Prepaid expenses and other assets | | | 16,732 | |
| | |
|
|
|
| | | | 10,397,359,611 | |
| | |
|
|
|
| Liabilities: | | | | |
Payable for investments purchased | | | 23,436,913 | |
Payable for Fund shares redeemed | | | 28,167,366 | |
Management fees payable | | | 3,401,427 | |
Accrued expenses | | | 725,323 | |
| | |
|
|
|
| | | | 55,731,029 | |
| | |
|
|
|
| Net Assets | | $ | 10,341,628,582 | |
| | |
|
|
|
| Net Assets Consist of: | | | | |
Paid in capital | | $ | 10,652,136,038 | |
Undistributed net investment income | | | 6,741,612 | |
Undistributed net realized loss on investments | | | (98,152,188 | ) |
Net unrealized depreciation on investments | | | (219,096,880 | ) |
| | |
|
|
|
| | | $ | 10,341,628,582 | |
| | |
|
|
|
Fund shares outstanding (par value $0.01 each, unlimited shares authorized) | | | 844,055,254 | |
Net asset value per share | | | $12.25 | |
| | |
| Statement of Operations (unaudited) |
| | | | |
| |
| | | Six Months Ended June 30, 2006 | |
| Investment Income: | | | | |
Interest | | $ | 251,796,972 | |
| | |
|
|
|
| Expenses: | | | | |
Management fees | | | 19,908,385 | |
Custody and fund accounting fees | | | 93,349 | |
Transfer agent fees | | | 1,198,696 | |
Professional services | | | 45,498 | |
Shareholder reports | | | 301,120 | |
Registration fees | | | 230,775 | |
Trustees’ fees | | | 82,500 | |
Miscellaneous | | | 33,941 | |
| | |
|
|
|
| | | | 21,894,264 | |
| | |
|
|
|
| Net Investment Income | | | 229,902,708 | |
| | |
|
|
|
| Realized and Unrealized Loss on Investments: | | | | |
Net realized loss | | | (9,055,410 | ) |
Net change in unrealized depreciation | | | (207,714,454 | ) |
| | |
|
|
|
Net realized and unrealized loss | | | (216,769,864 | ) |
| | |
|
|
|
| Net Increase in Net Assets from Operations | | $ | 13,132,844 | |
| | |
|
|
|
| | | | |
| Statement of Changes in Net Assets (unaudited) |
| | | | | | | | |
| | |
| | | Six Months Ended June 30, 2006 | | | Year Ended
December 31, 2005 | |
| Operations: | | | | | | | | |
Net investment income | | $ | 229,902,708 | | | $ | 353,678,523 | |
Net realized gain (loss) | | | (9,055,410 | ) | | | 20,155,850 | |
Net change in unrealized appreciation/depreciation | | | (207,714,454 | ) | | | (200,036,683 | ) |
| | |
|
|
| |
|
|
|
Net increase in net assets
from operations | | | 13,132,844 | | | | 173,797,690 | |
| | |
|
|
| |
|
|
|
| | |
Distributions to
Shareholders from: | | | | | | | | |
Net investment income | | | (245,119,141 | ) | | | (390,586,222 | ) |
Net realized gain | | | — | | | | — | |
| | |
|
|
| |
|
|
|
Total distributions | | | (245,119,141 | ) | | | (390,586,222 | ) |
| | |
|
|
| |
|
|
|
| | |
| Fund Share Transactions: | | | | | | | | |
Proceeds from sale of shares | | | 1,930,148,037 | | | | 3,244,793,643 | |
Reinvestment of distributions | | | 209,644,555 | | | | 334,969,730 | |
Cost of shares redeemed | | | (1,175,943,684 | ) | | | (1,623,405,388 | ) |
| | |
|
|
| |
|
|
|
Net increase from Fund share transactions | | | 963,848,908 | | | | 1,956,357,985 | |
| | |
|
|
| |
|
|
|
Total increase in net assets | | | 731,862,611 | | | | 1,739,569,453 | |
| | |
| Net Assets: | | | | | | | | |
Beginning of period | | | 9,609,765,971 | | | | 7,870,196,518 | |
| | |
|
|
| |
|
|
|
End of period (including undistributed net
investment income of $6,741,612 and $6,670,694, respectively) | | $ | 10,341,628,582 | | | $ | 9,609,765,971 | |
| | |
|
|
| |
|
|
|
| | |
| Share Information: | | | | | | | | |
Shares sold | | | 154,703,809 | | | | 254,312,934 | |
Distributions reinvested | | | 17,040,499 | | | | 26,493,475 | |
Shares redeemed | | | (94,295,822 | ) | | | (127,349,477 | ) |
| | |
|
|
| |
|
|
|
Net increase in
shares outstanding | | | 77,448,486 | | | | 153,456,932 | |
| | |
|
|
| |
|
|
|
| | |
| 9 / Dodge & Cox Income Fund | | See accompanying Notes to Financial Statements |
Notes to Financial Statements (unaudited)
Note 1 — Organization and Significant Accounting Policies
Dodge & Cox Income Fund (the “Fund”) is one of the series constituting the Dodge & Cox Funds (the “Trust” or the “Funds”). The Trust is organized as a Delaware statutory trust and is registered under the Investment Company Act of 1940, as amended, as a diversified, open-end management investment company. The Fund commenced operations on January 3, 1989, and seeks high and stable current income consistent with long-term preservation of capital. Risk considerations and investment strategies of the Fund are discussed in the Fund’s Prospectus.
The financial statements have been prepared in conformity with accounting principles generally accepted in the United States of America, which require the use of estimates and assumptions by management. Significant accounting policies are as follows:
Security valuation. The Fund’s net assets are valued as of the close of trading on the New York Stock Exchange (NYSE), generally 4:00 p.m. Eastern Time, each day that the NYSE is open for business. Fixed-income securities with original maturities of one year or more are priced on the basis of valuations furnished by pricing services which utilize both dealer-supplied valuations and electronic data processing techniques. Under certain circumstances, fixed-income securities that are not valued by pricing services are temporarily valued by the investment manager utilizing both dealer-supplied valuations and electronic data processing techniques. Valuations of fixed-income securities take into account appropriate factors such as institutional-size trading markets in similar groups of securities, yield, quality, coupon rate, maturity, type of issue, trading characteristics and other market data and do not rely exclusively upon exchange or over-the-counter listed prices. Security values are not discounted based on the size of the Fund’s position. Securities for which market quotations are not readily available are valued at fair value as determined in good faith by or at the direction of the Board of Trustees. Short-term securities are valued at amortized cost which approximates current value. All securities held by the Fund are denominated in U.S. dollars.
Security transactions, investment income, expenses, and distributions. Security transactions are recorded on the trade
date. Realized gains and losses on securities sold are determined on the basis of identified cost.
Interest income is recorded on the accrual basis. Interest income includes coupon interest, amortization of premium and accretion of discount on debt securities, and gains and losses on paydowns of mortgage-backed securities. The ability of the issuers of the debt securities held by the Fund to meet their obligations may be affected by economic developments in a specific industry, state or region. Debt obligations may be placed on non-accrual status and related interest income may be reduced by ceasing current accruals and writing off interest receivables when the collection of all or a portion of interest has become doubtful based on consistently applied procedures. A debt obligation is removed from non-accrual status when the issuer resumes interest payments or when collectibility of interest is reasonably assured.
Expenses are recorded on the accrual basis. Most expenses of the Trust can be directly attributed to a specific series. Expenses which cannot be directly attributed are apportioned among the Funds in the Trust.
Distributions to shareholders are recorded on the ex-dividend date.
Repurchase agreements. The Fund may enter into repurchase agreements secured by U.S. government securities which involve the purchase of securities from a counterparty with a simultaneous commitment to resell the securities at an agreed-upon date and price. It is the Fund’s policy that its custodian take possession of the underlying collateral securities, the fair value of which exceeds the principal amount of the repurchase transaction, including accrued interest, at all times. In the event of default by the counterparty, the Fund has the contractual right to liquidate the securities and to apply the proceeds in satisfaction of the obligation.
Note 2 — Related Party Transactions
Management fees. Under a written agreement, the Fund pays an annual management fee of 0.50% of the Fund’s average daily net assets up to $100 million and 0.40% of the Fund’s average daily net assets in excess of $100 million to Dodge & Cox, investment manager of the Fund. The agreement further provides that Dodge & Cox shall waive its fee to the extent that such fee plus all other
| | |
| | | Dodge & Cox Income Fund / 10 |
Notes to Financial Statements (unaudited) (continued)
ordinary operating expenses of the Fund exceed 1% of the average daily net assets for the year.
Fund officers and trustees. All officers and four of the trustees of the Trust are officers or employees of Dodge & Cox. The Trust pays a fee only to those trustees who are not affiliated with Dodge & Cox.
Indemnification. Under the Trust’s organizational documents, its officers and trustees are indemnified against certain liabilities arising out of the performance of their duties to the Trust. In addition, in the normal course of business the Trust enters into contracts that provide general indemnities to other parties. The Trust’s maximum exposure under these arrangements is unknown as this would involve future claims that may be made against the Trust that have not yet occurred.
Note 3 — Income Tax Information and Distributions to Shareholders
A provision for federal income taxes is not required since the Fund intends to continue to qualify as a regulated investment company under Subchapter M of the Internal Revenue Code and distribute all of its taxable income to shareholders. Distributions are determined in accordance with income tax regulations, which may differ from net investment income and realized gains for financial reporting purposes. Financial reporting records are adjusted for permanent book/tax differences to reflect tax character. Financial records are not adjusted for temporary differences.
Book/tax differences are primarily due to differing treatments of net short-term realized gain and paydown loss. At June 30, 2006, the cost of investments for federal income tax purposes was equal to the cost for financial reporting purposes.
Distributions during the period ended June 30, 2006 were characterized as follows for federal income tax purposes:
| | | |
Ordinary income ($0.30 per share) | | $ | 245,119,141 |
Long-term capital gain | | | — |
| | |
|
|
Total distributions ($0.30 per share) | | $ | 245,119,141 |
| | |
|
|
At June 30, 2006, the tax basis components of distributable earnings were as follows:
| | | | |
Unrealized appreciation | | $ | 55,320,985 | |
Unrealized depreciation | | | (274,417,865 | ) |
| | |
|
|
|
Net unrealized depreciation | | | (219,096,880 | ) |
Undistributed ordinary income | | | 6,741,612 | |
Accumulated capital loss | | | (31,567,532 | ) |
Capital loss carryforward† | | | (66,584,656 | ) |
| † | | Represents accumulated capital loss which may be carried forward to offset future capital gains. This carryforward expires as follows: |
| | | |
Expiring in 2011 | | $ | 14,093,589 |
Expiring in 2012 | | | 32,528,048 |
Expiring in 2013 | | | 19,963,019 |
| | |
|
|
| | | $ | 66,584,656 |
| | |
|
|
Note 4 — Purchase and Sales of Investments
For the period ended June 30, 2006, purchases and sales of securities, other than short-term securities and U.S. government securities, aggregated $801,079,957 and $135,267,946, respectively. For the period ended June 30, 2006, purchases and sales of U.S. government securities aggregated $1,889,432,538 and $1,469,160,278, respectively.
| | |
| 11 / Dodge & Cox Income Fund | | |
Financial Highlights (unaudited)
| | | | | | | | | | | | | | | | | | | | | | |
SELECTED DATA AND RATIOS (for a share outstanding throughout each year) | | | | Six months
ended June 30, | | | | | Year Ended December 31, | |
| | | | | 2006 | | | | | 2005 | | | 2004 | | | 2003 | | | 2002 | | | 2001 | |
Net asset value, beginning of period | | | | $12.54 | | | | | $12.84 | | | $12.92 | | | $12.77 | | | $12.20 | | | $11.80 | |
| | | | | | | | |
Income from investment operations: | | | | | | | | | | | | | | | | | | | | | | |
Net investment income | | | | 0.30 | | | | | 0.55 | | | 0.54 | | | 0.60 | | | 0.66 | | | 0.74 | |
Net realized and unrealized gain (loss) | | | | (0.29 | ) | | | | (0.30 | ) | | (0.08 | ) | | 0.15 | | | 0.62 | | | 0.46 | |
| | | | |
|
|
Total from investment operations | | | | 0.01 | | | | | 0.25 | | | 0.46 | | | 0.75 | | | 1.28 | | | 1.20 | |
| | | | |
|
|
Distributions to shareholders from: | | | | | | | | | | | | | | | | | | | | | | |
Net investment income | | | | (0.30 | ) | | | | (0.55 | ) | | (0.54 | ) | | (0.60 | ) | | (0.66 | ) | | (0.74 | ) |
Net realized gain | | | | — | | | | | — | | | — | | | — | | | (0.05 | ) | | (0.06 | ) |
| | | | |
|
|
Total distributions | | | | (0.30 | ) | | | | (0.55 | ) | | (0.54 | ) | | (0.60 | ) | | (0.71 | ) | | (0.80 | ) |
| | | | |
|
|
Net asset value, end of period | | | | $12.25 | | | | | $12.54 | | | $12.84 | | | $12.92 | | | $12.77 | | | $12.20 | |
| | | | |
|
|
Total return | | | | 0.09 | % | | | | 1.98 | % | | 3.64 | % | | 5.97 | % | | 10.75 | % | | 10.32 | % |
Ratios/supplemental data: | | | | | | | | | | | | | | | | | | | | | | |
Net assets, end of period (millions) | | | | $10,342 | | | | | $9,610 | | | $7,870 | | | $5,697 | | | $3,405 | | | $1,512 | |
Ratio of expenses to average net assets | | | | 0.44 | %* | | | | 0.44 | % | | 0.44 | % | | 0.45 | % | | 0.45 | % | | 0.45 | % |
Ratio of net investment income to average net assets | | | | 4.63 | %* | | | | 3.99 | % | | 3.61 | % | | 3.93 | % | | 5.38 | % | | 6.18 | % |
Portfolio turnover rate | | | | 16 | % | | | | 24 | % | | 30 | % | | 41 | % | | 31 | % | | 40 | % |
See accompanying Notes to Financial Statements
Fund Holdings
The Fund provides a complete list of its holdings four times each fiscal year, as of the end of each quarter. The lists appear in the Fund’s First Quarter, Semi-Annual, Third Quarter and Annual Reports to shareholders. The Fund files the lists with the Securities and Exchange Commission (SEC) on Form N-CSR (second and fourth quarters) and Form N-Q (first and third quarters). Shareholders may view the Funds’ Forms N-CSR and N-Q on the SEC’s website at www.sec.gov. Forms N-CSR and N-Q may also be reviewed and copied at the SEC’s Public Reference Room in Washington, DC. Information regarding the operations of the Public Reference Room may be obtained by 1-202-942-8090 (direct) or 1-800-732-0330 (general SEC number). A complete list of the Fund’s quarter-end holdings are also available at www.dodgeandcox.com on or about 15 days following each quarter end and remains available on the web site until the list is updated in the subsequent quarter.
Proxy Voting
For a free copy of the Fund’s proxy voting policies and procedures, please call 1-800-621-3979, visit the Fund’s web site at www.dodgeandcox.com or visit the SEC’s web site at www.sec.gov. Information regarding how the Fund voted proxies relating to portfolio securities during the most recent 12-month period ending June 30 is also available at www.dodgeandcox.com or at www.sec.gov.
| | |
| | | Dodge & Cox Income Fund / 12 |
THIS PAGE INTENTIONALLY LEFT BLANK
| | |
| 13 / Dodge & Cox Income Fund | | |
THIS PAGE INTENTIONALLY LEFT BLANK
| | |
| | | Dodge & Cox Income Fund / 14 |
Officers and Trustees
Harry R. Hagey, Chairman & Trustee
Chairman, Dodge & Cox
John A. Gunn, President & Trustee
Chief Executive Officer, Dodge & Cox
Kenneth E. Olivier, Vice President and Trustee
President, Dodge & Cox
Dana M. Emery, Vice President & Trustee
Executive Vice President, Dodge & Cox
William F. Ausfahl, Trustee
Former Chief Financial Officer and member of Board of Directors, The Clorox Company
L. Dale Crandall, Trustee
Former President, Kaiser Foundation Health Plan and Hospitals
Thomas A. Larsen, Trustee
Director, Howard, Rice, Nemerovski, Canady, Falk & Rabkin
John B. Taylor, Trustee
Professor of Economics, Stanford University; Senior Fellow, Hoover Institute and former Under Secretary for International Affairs, United States Treasury
Will C. Wood, Trustee
Principal, Kentwood Associates, Financial Advisers
Katherine Herrick Drake, Vice President
Vice President, Dodge & Cox
Diana S. Strandberg, Vice President
Vice President, Dodge & Cox
John M. Loll, Treasurer & Asst. Secretary
Vice President & Treasurer, Dodge & Cox
Thomas M. Mistele, Secretary & Asst. Treasurer
Chief Operating Officer, Secretary & General Counsel, Dodge & Cox
Marcia P. Venegas, Chief Compliance Officer
Chief Compliance Officer, Dodge & Cox
David H. Longhurst, Assistant Treasurer
Fund Administration and Accounting Senior Manager, Dodge & Cox
A code of ethics, as defined in Item 2 of Form N-CSR, adopted by the registrant and applicable to the registrant’s principal executive officer and principal financial officer, is filed as an exhibit to this Form N-CSR. No substantive amendments were approved or waivers were granted to this code of ethics during the period covered by this report.
| ITEM 3. | AUDIT COMMITTEE FINANCIAL EXPERT. |
The Board of Trustees of the registrant has determined that William F. Ausfahl and L. Dale Crandall, members of the registrant’s Audit Committee, are each an “audit committee financial expert” and are “independent,” as defined in Item 3 of Form N-CSR.
| ITEM 4. | PRINCIPAL ACCOUNTANT FEES AND SERVICES. |
Not applicable. Disclosure required in registrant’s annual Form N-CSR.
| ITEM 5. | AUDIT COMMITTEE OF LISTED REGISTRANTS. |
Not applicable.
| ITEM 6. | SCHEDULE OF INVESTMENTS. |
Not applicable. The complete schedule of investments is included in Item 1 of this Form N-CSR.
| ITEM 7. | DISCLOSURE OF PROXY VOTING POLICIES AND PROCEDURES FOR CLOSED-END MANAGEMENT INVESTMENT COMPANIES. |
Not applicable.
| ITEM 8. | PORTFOLIO MANAGERS OF CLOSED-END MANAGEMENT INVESTMENT COMPANIES. |
Not applicable.
| ITEM 9. | PURCHASES OF EQUITY SECURITIES BY CLOSED-END MANAGEMENT INVESTMENT COMPANY AND AFFILIATED PURCHASERS. |
Not applicable.
| ITEM 10. | SUBMISSION OF MATTERS TO A VOTE OF SECURITY HOLDERS. |
The registrant has adopted the following procedures by which shareholders may recommend nominees to the registrant’s Board of Trustees.
1. The shareholder must submit any such recommendation in writing to the registrant to the attention of the Secretary at the address of the principal executive offices of the registrant. The shareholder’s recommendation is then considered by the registrant’s Nominating Committee.
2. The shareholder recommendation must include:
(i) A statement in writing setting forth (a) the name, date of birth, business address and residence address of the person recommended by the shareholder (the “candidate”); and (b) whether the recommending shareholder believes that the
candidate is or will be an “interested person” of the registrant (as defined in the Investment Company Act of 1940) and, if not an “interested person,” information regarding the candidate that will be sufficient for the registrant to make such determination and, if applicable, similar information regarding whether the candidate would satisfy the standards for independence of a Board member under listing standards of the New York Stock Exchange or other applicable securities exchange.
(ii) The written and manually signed consent of the candidate to be named as a nominee and to serve as a Trustee if elected;
(iii) The recommending shareholder’s name as it appears on the registrant’s books and the number of all shares of the registrant owned beneficially and of record by the recommending shareholder (as evidenced to the Nominating Committee’s satisfaction by a recent brokerage or account statement); and
(iv) A description of all arrangements or understandings between the recommending shareholder and the candidate and any other person or persons (including their names) pursuant to which the recommendation is being made by the recommending shareholder.
In addition, the Nominating Committee may require the candidate to furnish such other information as it may reasonably require or deem necessary to determine the eligibility of such candidate to serve on the Board or to satisfy applicable law and information regarding the candidate that would be required to be disclosed if the candidate were a nominee in a proxy statement or other filing required to be made in connection with solicitation of proxies for election of Trustees.
| ITEM 11. | CONTROLS AND PROCEDURES. |
(a) An evaluation was performed within 90 days of the filing of this report, under the supervision and with the participation of the registrant’s management, including the principal executive officer and principal financial officer, of the effectiveness of the design and operation of the registrant’s disclosure controls and procedures. Based on that evaluation, the principal executive officer and principal financial officer concluded that the registrant’s disclosure controls and procedures were effective.
(b) The registrant‘s principal executive officer and principal financial officer are aware of no changes in the registrant‘s internal control over financial reporting that occurred during the registrant‘s second fiscal quarter of the period covered by this report that has materially affected, or is reasonably likely to materially affect, the registrant’s internal control over financial reporting.
(a)(1) The registrant‘s code of ethics pursuant to Item 2 of Form N-CSR is attached. (EX.99A)
(a)(2) Certifications pursuant to Section 302 of the Sarbanes-Oxley Act of 2002 are attached. (EX.99B)
(a)(3) Not applicable.
(b) Certifications pursuant to Section 906 of the Sarbanes-Oxley Act of 2002 are attached. (EX.99C)
SIGNATURES
Pursuant to the requirements of the Securities Exchange Act of 1934 and the Investment Company Act of 1940, the registrant has duly caused this report to be signed on its behalf by the undersigned, thereunto duly authorized.
| | |
| DODGE & COX FUNDS |
| |
| By: | | /S/ HARRY R. HAGEY |
| | Harry R. Hagey Chairman—Principal Executive Officer |
Date August 11, 2006
Pursuant to the requirements of the Securities Exchange Act of 1934 and the Investment Company Act of 1940, this report has been signed below by the following persons on behalf of the registrant and in the capacities and on the dates indicated.
| | |
| DODGE & COX FUNDS |
| |
| By: | | /S/ HARRY R. HAGEY |
| | Harry R. Hagey Chairman—Principal Executive Officer |
| | |
| |
| By: | | /S/ JOHN M. LOLL |
| | John M. Loll Treasurer—Principal Financial Officer |
Date August 11, 2006