UNITED STATES
SECURITIES AND EXCHANGE COMMISSION
Washington, D.C. 20549
FORM N-CSR
CERTIFIED SHAREHOLDER REPORT OF REGISTERED MANAGEMENT
INVESTMENT COMPANIES
Investment Company Act file number 811-173
DODGE & COX FUNDS
(Exact name of registrant as specified in charter)
555 California Street, 40th Floor
San Francisco, CA 94104
(Address of principal executive offices) (Zip code)
Thomas M. Mistele, Esq.
555 California Street, 40th Floor
San Francisco, CA 94104
(Name and address of agent for service)
Registrant’s telephone number, including area code: 415-981-1710
Date of fiscal year end: DECEMBER 31, 2009
Date of reporting period: JUNE 30, 2009
Form N-CSR is to be used by management investment companies to file reports with the Commission not later than 10 days after the transmission to stockholders of any report that is required to be transmitted to stockholders under Rule 30e-1 under the Investment Company Act of 1940 (17 CFR 270.30e-1). The Commission may use the information provided on Form N-CSR in its regulatory, disclosure review, inspection, and policymaking roles.
A registrant is required to disclose the information specified by Form N-CSR, and the Commission will make this information public. A registrant is not required to respond to the collection of information contained in Form N-CSR unless the Form displays a currently valid Office of Management and Budget (“OMB”) control number. Please direct comments concerning the accuracy of the information collection burden estimate and any suggestions for reducing the burden to Secretary, Securities and Exchange Commission, 450 Fifth Street, NW, Washington, DC 20549-0609. The OMB has reviewed this collection of information under the clearance requirements of 44 U.S.C. ss. 3507.
| ITEM 1. | REPORTS TO STOCKHOLDERS. |
The following are the June 30, 2009 semi-annual reports for the Dodge & Cox Funds, a Delaware statutory trust, consisting of five series: Dodge & Cox Stock Fund, Dodge & Cox Global Stock Fund, Dodge & Cox International Stock Fund, Dodge & Cox Balanced Fund and Dodge & Cox Income Fund. The reports of each series were transmitted to their respective shareholders on August 11, 2009.
| | | | |
 | | | |  |
www.dodgeandcox.com
For Fund literature, transactions, and account
information, please visit the Funds’ web site.
or write or call:
DODGE & COX FUNDS
c/o Boston Financial Data Services
P.O. Box 8422
Boston, Massachusetts 02266-8422
(800) 621-3979
INVESTMENT MANAGER
Dodge & Cox
555 California Street, 40th Floor
San Francisco, California 94104
(415) 981-1710
This report is submitted for the general information of the shareholders of the Fund. The report is not authorized for distribution to prospective investors in the Fund unless it is accompanied by a current prospectus.
This report reflects our views, opinions, and portfolio holdings as of June 30, 2009, the end of the reporting period. Any such views are subject to change at any time based upon market or other conditions and Dodge & Cox disclaims any responsibility to update such views. These views may not be relied on as investment advice and, because investment decisions for a Dodge & Cox Fund are based on numerous factors, may not be relied on as an indication of trading intent on behalf of any Dodge & Cox Fund.
6/09 SF SAR  Printed on recycled paper
Semi-Annual Report
June 30, 2009
Stock Fund
ESTABLISHED 1965
TICKER: DODGX
TO OUR SHAREHOLDERS
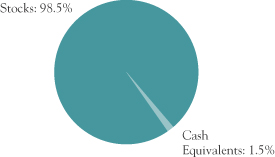
The Dodge & Cox Stock Fund had a total return of 4.8% for the six months ending June 30, 2009, compared to a total return of 3.2% for the Standard & Poor’s 500 Index (S&P 500). Longer-term results can be found on page three. As of June 30, the Fund had net assets of $33.5 billion with a cash position of 1.5%. While the six-month results were solid, the Fund is still down 29.4% from one year ago, compared to down 26.2% for the S&P 500.
MARKET COMMENTARY
VOLATILE MARKETS REQUIRE PERSISTENCE
The first half of 2009 illustrates the importance of persistence for long-term investors. The S&P 500 fell 25% from January 1 through the recent market trough on March 9 (and the Fund fell 29%). During this time, the U.S. government and others around the world pledged fiscal and monetary stimulus. Management at many companies took dramatic actions to reduce costs and inventories in response to rapidly shrinking demand. Some companies even increased productivity in this time period. With capital markets stabilizing and the rate of economic decline moderating, investors began to anticipate the nadir and eventual upturn of the economy. We do not know why the shift in investor sentiment began on March 10, but since then the S&P 500 rose by 37% (and the Fund rose 47%) through June 30.1
Our investment experience and belief in the favorable long-term prospects of the individual companies in our diversified portfolio lead us to be optimistic and persistent in staying fully invested. Looking back over the last six months, it would be difficult to identify the time to invest by observing daily news reports. Even now, the recent signs of potential improvement (such as increased consumer confidence, increasing auto sales, and increasing new home starts) are balanced by countervailing forces (such as increased unemployment, continued decline in housing prices, and increased foreclosures).
Underlying the Fund’s fully invested position is our optimism for economic recovery and the prospects for long-term growth in the global economy. There are three reasons for our view:
| 1. | The pace of technological innovation remains rapid. Companies have the opportunity not only to create |
| | new products and services, but also to improve the old ones and cut costs through increasing productivity. |
| 2. | The developing world is likely to lead global growth. The powerful tools of increased computing power, the internet, and wireless communication enable the citizens in the developing world to plug into the global economy. Multinational companies in the U.S. will benefit from opportunities provided by increased demand from the developing world. |
| 3. | The U.S. economy is resilient and has recovered from many past challenges. In the first 50 years of the S&P 500 from 1956 to 2006, corporate profits increased 25-fold. Behind that performance were companies innovating and achieving productivity gains. Overall, the Fund is positioned to take advantage of innovation and economic growth. For example, consumer electronics and technology companies represent 23% of the Fund’s holdings, and pharmaceutical and biotechnology companies 18%. |
INVESTMENT STRATEGY
TRAVELING ON THE MARKET ROLLERCOASTER
While we continue to be encouraged by the broad investment backdrop of low valuations and strong long-term growth drivers, the “story” year-to-date has been volatility and the re-introduction of some investor confidence. Within the Fund’s diversified portfolio of 81 stocks, the companies that experienced the greatest drop and subsequent rise during the first six months were those companies with significant operational and financial leverage: two examples are Dow Chemical Company and SLM Corporation (also known as Sallie Mae).
Dow is an asset-intensive, multinational chemical company that experienced a rapid increase in energy costs during 2008 and a dramatic drop in demand into early 2009. The company faced additional distress when financial markets froze as it was completing the $16 billion purchase of Rohm and Haas. The stock dropped 58% from the end of 2008 through March 9, then rallied 162% through midyear, and ended the six-month period up 10%. Although the near-term profit outlook is bleak, we hold it in the Fund because this multinational is well positioned to participate in global growth over the next
PAGE 1 § DODGE & COX STOCK FUND
five years. As investors turn from fear of operational and financial risks toward confidence in the future earnings of this strong, global franchise, we believe it remains an attractive long-term investment opportunity.
Sallie Mae is the largest student loan lender in the United States and is subject to credit risk, as well as financing and regulatory risks. Liquidity and funding were difficult for Sallie Mae to obtain during the financial crisis of the last year. In addition, Congress and the White House are taking steps to change the roles of participants in the student lending industry and replace the Federal Family Educational Loan Program with the government-run Direct Loan Program. With regulatory uncertainty and increasing credit losses, the stock dropped 64% from year-end 2008 through March 9. Sallie Mae’s business must transition away from lending and more toward loan servicing which will utilize the skills and scale it has established. It has proven successful in financing itself during the capital market challenges of the last year. From March 10, the stock rallied 222% to finish the first half up 15%. We continue to believe in its long-term investment potential due to the value of its current portfolio and the prospect of increased servicing revenue, as student loan volume grows in the future.
Both Dow and Sallie Mae hold significant market share, have capable and experienced management, and trade at attractive valuations. We use these examples to illustrate our long-term thinking and persistence in the face of dramatic short-term volatility in the stock market, not to imply that we think Sallie Mae and Dow are more attractive than the Fund’s other holdings. We cannot predict whether Sallie Mae or Dow will ultimately prove profitable for the Fund.
We have found in decades of investing that share prices can change much more in the short term than underlying business fundamentals. In a difficult environment, when companies are under pressure and share prices are down, we often see indiscriminate selling of companies perceived as risky. We believe our investment process gives us the tools to make informed decisions: an independent research team with detailed knowledge of the companies the Fund holds, an eye on long-term value across economic cycles, and the patience to hold on to investments that we believe are sound.
IN CLOSING
Despite a strong rebound since March, the S&P 500 is still down significantly from its peak nearly two years ago. While there is much consideration of the short-term macroeconomic data by many investors, we continue to focus on long-term investment opportunities. The Fund remains fully invested in a diversified portfolio of companies that should broadly benefit when economic expansion resumes.
We appreciate the confidence you have placed in our firm and the patience you have demonstrated as a shareholder of the Dodge & Cox Stock Fund. As always, we welcome your comments and questions.
For the Board of Trustees,
| | |
 | |  |
John A. Gunn, Chairman | | Kenneth E. Olivier, President |
August 11, 2009
| 1 | | Past performance does not guarantee future results. |
| | | | | | |
| | DODGE & COX STOCK FUND § | | PAGE | | 2 |
PERFORMANCE REVIEW
Key Contributors to Relative Results
| | § | | Returns from holdings in the Energy sector (up 12% versus down 2% for the S&P 500 sector) contributed to relative returns. Schlumberger (up 29%) and Occidental Petroleum (up 11%) were strong. | |
| | § | | Sprint Nextel was a standout performer (up 163%) in relation to the Telecommunication Services S&P 500 sector return (down 4%). | |
| | § | | A lower average weighting in the Consumer Staples sector (2% versus 13% for the S&P 500 sector) was beneficial, as the sector was weak. | |
| | § | | Individual contributors included Motorola (up 50%), Maxim Integrated Products (up 41%), Wyeth (up 23%, being acquired by Pfizer), WellPoint (up 21%), and Sony (up 19%). | |
Key Detractors from Relative Results
| | § | | Weak returns from holdings in the Financials sector (down 13% versus down 2% for the S&P 500 sector) detracted. Citigroup (down 45% to date of sale) and Capital One (down 29%) were weak. | |
| | § | | A higher average weighting in the Health Care sector (28% versus 15% for the S&P 500 sector) hurt relative results, as the sector was weak. Novartis (down 15%) and Amgen (down 8%) lagged. | |
| | § | | Individual detractors included General Electric (down 25%), Xerox (down 17%), Comcast (down 14%), and FedEx (down 13%). | |
GROWTH OF $10,000 OVER 10 YEARS
FOR AN INVESTMENT MADE ON JUNE 30, 1999
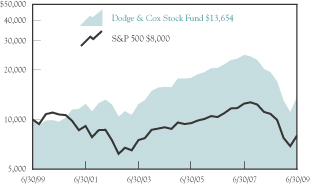
AVERAGE ANNUAL TOTAL RETURN
FOR PERIODS ENDED JUNE 30, 2009
| | | | | | | | | | | | |
| | | 1 Year | | | 5 Years | | | 10 Years | | | 20 Years | |
Dodge & Cox Stock Fund | | -29.38 | % | | -2.82 | % | | 3.16 | % | | 9.87 | % |
S&P 500 | | -26.22 | | | -2.24 | | | -2.22 | | | 7.77 | |
Past performance does not guarantee future results. Investment return and share price will fluctuate with market conditions, and investors may have a gain or loss when shares are sold. Mutual fund performance changes over time and currently may be significantly lower than stated. Performance is updated and published monthly. Visit the Fund’s web site at www.dodgeandcox.com or call 1-800-621-3979 for current performance figures.
The Fund’s total returns include the reinvestment of dividend and capital gain distributions, but have not been adjusted for any income taxes payable by shareholders on these distributions. The Standard & Poor’s 500 (S&P 500) is a broad-based unmanaged measure of common stocks. Index returns include dividends and/or interest income but, unlike Fund returns, do not reflect fees or expenses.
Standard & Poor’s, Standard & Poor’s 500, and S&P 500® are trademarks of The McGraw-Hill Companies, Inc.
PAGE 3 § DODGE & COX STOCK FUND
FUND EXPENSE EXAMPLE
As a Fund shareholder, you incur ongoing Fund costs, including management fees and other Fund expenses. All mutual funds have ongoing costs, sometimes referred to as operating expenses. The following example shows ongoing costs of investing in the Fund and can help you understand these costs and compare them with those of other mutual funds. The example assumes a $1,000 investment held for the six months indicated.
ACTUAL EXPENSES
The first line of the table below provides information about actual account values and expenses based on the Fund’s actual returns. You may use the information in this line, together with your account balance, to estimate the expenses that you paid over the period. Simply divide your account value by $1,000 (for example, an $8,600 account value divided by $1,000 = 8.6), then multiply the result by the number in the first line under the heading “Expenses Paid During Period” to estimate the expenses you paid on your account during this period.
HYPOTHETICAL EXAMPLE FOR COMPARISON WITH OTHER MUTUAL FUNDS
Information on the second line of the table can help you compare ongoing costs of investing in the Fund with those of other mutual funds. This information may not be used to estimate the actual ending account balance or expenses you paid during the period. The hypothetical “Ending Account Value” is based on the actual expense ratio of the Fund and an assumed 5% annual rate of return before expenses (not the Fund’s actual return). The amount under the heading “Expense Paid During the Period” shows the hypothetical expenses your account would have incurred under this scenario. You can compare this figure with the 5% hypothetical examples that appear in shareholder reports of other mutual funds.
| | | | | | | | | |
Six Months Ended
June 30, 2009 | | Beginning Account Value
1/1/2009 | | Ending Account Value
6/30/2009 | | Expenses Paid
During Period* |
Based on Actual Fund Return | | $ | 1,000.00 | | $ | 1,048.00 | | $ | 2.68 |
Based on Hypothetical 5% Yearly Return | | | 1,000.00 | | | 1,022.17 | | | 2.65 |
| * | | Expenses are equal to the Fund’s annualized expense ratio of 0.53%, multiplied by the average account value over the period, multiplied by 181/365 (to reflect the one-half year period). |
The expenses shown in the table highlight ongoing costs only and do not reflect any transactional fees or account maintenance fees. While other mutual funds may charge such fees, please note that the Fund does not charge transaction fees (e.g., redemption fees, sales loads) or universal account maintenance fees (e.g., small account fees).
DODGE & COX STOCK FUND §PAGE 4
| | |
| FUND INFORMATION | | June 30, 2009 |
| | |
| GENERAL INFORMATION |
Net Asset Value Per Share | | $77.13 |
Total Net Assets (billions) | | $33.5 |
Expense Ratio (1/1/09 to 6/30/09, annualized) | | 0.53% |
Portfolio Turnover Rate (1/1/09 to 6/30/09, unannualized) | | 12% |
30-Day SEC Yield(a) | | 1.38% |
Fund Inception | | 1965 |
No sales charges or distribution fees | | |
Investment Manager: Dodge & Cox, San Francisco. Managed by the Investment Policy Committee, whose nine members’ average tenure at Dodge & Cox is 23 years.
| | | | |
| PORTFOLIO CHARACTERISTICS | | Fund | | S&P 500 |
Number of Stocks | | 81 | | 500 |
Median Market Capitalization (billions) | | $14 | | $7 |
Weighted Average Market
Capitalization (billions) | | $48 | | $71 |
Price-to-Earnings Ratio(b) | | 12.1x | | 20.9x |
Foreign Stocks(c) | | 18.1% | | 0.0% |
| | | |
| TEN LARGEST HOLDINGS(d) | | Fund | |
Hewlett-Packard Co. | | 4.8 | % |
Schlumberger, Ltd. | | 4.0 | |
Wells Fargo & Co. | | 3.2 | |
Comcast Corp. | | 3.2 | |
Novartis AG (Switzerland) | | 3.2 | |
WellPoint, Inc. | | 3.0 | |
GlaxoSmithKline PLC (United Kingdom) | | 2.9 | |
Amgen, Inc. | | 2.9 | |
Merck & Co., Inc. | | 2.9 | |
Motorola, Inc. | | 2.9 | |
| | | | | | |
| SECTOR DIVERSIFICATION | | Fund | | | S&P 500 | |
Health Care | | 26.9 | % | | 14.0 | % |
Information Technology | | 19.6 | | | 18.4 | |
Consumer Discretionary | | 17.2 | | | 9.0 | |
Financials | | 11.2 | | | 13.6 | |
Energy | | 11.0 | | | 12.4 | |
Industrials | | 6.9 | | | 9.8 | |
Materials | | 2.2 | | | 3.2 | |
Telecommunication Services | | 1.8 | | | 3.5 | |
Consumer Staples | | 1.7 | | | 12.0 | |
Utilities | | 0.0 | | | 4.1 | |
| (a) | SEC yield is an annualization of the Fund’s total net investment income per share for the 30-day period ended on the last day of the month. |
| (b) | Price-to-earnings (P/E) ratios are calculated using 12-month forward earnings estimates. |
| (c) | Foreign stocks are U.S. dollar-denominated. |
| (d) | The Fund’s portfolio holdings are subject to change without notice. The mention of specific securities is not a recommendation or solicitation for any person to buy, sell, or hold any particular security. |
PAGE 5 § DODGE & COX STOCK FUND
| | |
| PORTFOLIO OF INVESTMENTS (unaudited) | | June 30, 2009 |
| | | | | |
| COMMON STOCKS: 98.5% | | | | |
| | |
| | | SHARES | | VALUE |
| CONSUMER DISCRETIONARY: 17.2% | | | |
CONSUMER DURABLES & APPAREL: 3.4% |
Panasonic Corp. ADR(b) (Japan) | | 34,433,474 | | $ | 461,064,217 |
Sony Corp. ADR(b) (Japan) | | 26,779,350 | | | 692,513,991 |
| | | | | |
| | | | | 1,153,578,208 |
MEDIA: 10.7% |
Comcast Corp., Class A | | 74,495,497 | | | 1,079,439,751 |
DISH Network Corp., Class A(a) | | 6,842,870 | | | 110,922,923 |
Interpublic Group of Companies, Inc.(a) | | 20,421,293 | | | 103,127,529 |
Liberty Entertainment, Series A(a) | | 3,647,500 | | | 97,570,625 |
Liberty Global, Inc., Series A(a) | | 764,210 | | | 12,143,297 |
Liberty Global, Inc., Series C(a) | | 1,301,653 | | | 20,579,134 |
News Corp., Class A | | 93,207,526 | | | 849,120,562 |
Time Warner Cable, Inc.(a) | | 13,185,610 | | | 417,588,269 |
Time Warner, Inc. | | 35,222,732 | | | 887,260,619 |
| | | | | |
| | | | | 3,577,752,709 |
RETAILING: 3.1% |
CarMax, Inc.(a),(c) | | 11,807,200 | | | 173,565,840 |
Genuine Parts Co. | | 1,090,118 | | | 36,584,360 |
Home Depot, Inc. | | 21,005,300 | | | 496,355,239 |
Liberty Interactive, Series A(a) | | 37,923,375 | | | 189,996,109 |
Macy’s, Inc. | | 11,090,092 | | | 130,419,482 |
| | | | | |
| | | | | 1,026,921,030 |
| | | | | |
| | | | | 5,758,251,947 |
| CONSUMER STAPLES: 1.7% | | | | | |
FOOD & STAPLES RETAILING: 1.5% |
Wal-Mart Stores, Inc. | | 7,922,950 | | | 383,787,698 |
Walgreen Co. | | 4,512,075 | | | 132,655,005 |
| | | | | |
| | | | | 516,442,703 |
HOUSEHOLD & PERSONAL PRODUCTS: 0.2% |
Avon Products, Inc. | | 2,120,680 | | | 54,671,130 |
| | | | | |
| | | | | 571,113,833 |
| ENERGY: 11.0% | | | | | |
Baker Hughes, Inc.(c) | | 15,854,194 | | | 577,726,830 |
Chevron Corp. | | 8,830,680 | | | 585,032,550 |
Occidental Petroleum Corp. | | 13,826,900 | | | 909,948,289 |
Royal Dutch Shell PLC ADR(b) (United Kingdom) | | 5,312,564 | | | 270,197,005 |
Schlumberger, Ltd. | | 24,558,012 | | | 1,328,834,029 |
| | | | | |
| | | | | 3,671,738,703 |
| FINANCIALS: 11.2% | | | | | |
BANKS: 4.8% |
BB&T Corp. | | 12,062,844 | | | 265,141,311 |
HSBC Holdings PLC ADR(b) (United Kingdom) | | 6,129,229 | | | 256,017,895 |
Wells Fargo & Co. | | 44,911,741 | | | 1,089,558,837 |
| | | | | |
| | | | | 1,610,718,043 |
| | | | | |
| | |
| | | SHARES | | VALUE |
DIVERSIFIED FINANCIALS: 4.6% |
Bank of New York Mellon Corp. | | 7,056,624 | | $ | 206,829,650 |
Capital One Financial Corp.(c) | | 31,943,611 | | | 698,926,209 |
Credit Suisse Group AG ADR(b) (Switzerland) | | 4,202,700 | | | 192,189,471 |
Legg Mason, Inc. | | 4,656,700 | | | 113,530,346 |
SLM Corp.(a),(c) | | 26,185,882 | | | 268,929,008 |
State Street Corp. | | 1,263,975 | | | 59,659,620 |
| | | | | |
| | | | | 1,540,064,304 |
INSURANCE: 1.8% |
AEGON NV(a),(b) (Netherlands) | | 26,858,988 | | | 165,451,366 |
Genworth Financial, Inc., Class A(a) | | 6,905,200 | | | 48,267,348 |
Loews Corp. | | 3,908,000 | | | 107,079,200 |
The Travelers Companies, Inc. | | 6,511,750 | | | 267,242,220 |
| | | | | |
| | | | | 588,040,134 |
| | | | | |
| | | | | 3,738,822,481 |
| HEALTH CARE: 26.9% |
HEALTH CARE EQUIPMENT & SERVICES: 8.9% |
Boston Scientific Corp.(a) | | 47,269,500 | | | 479,312,730 |
Cardinal Health, Inc.(c) | | 21,269,750 | | | 649,790,863 |
Covidien PLC(b) (Ireland) | | 5,563,291 | | | 208,289,615 |
Health Management Associates, Inc.(a),(c) | | 6,989,060 | | | 34,525,956 |
UnitedHealth Group, Inc. | | 24,788,500 | | | 619,216,730 |
WellPoint, Inc.(a) | | 19,574,849 | | | 996,164,066 |
| | | | | |
| | | | | 2,987,299,960 |
PHARMACEUTICALS, BIOTECHNOLOGY & LIFE SCIENCES: 18.0% |
Amgen, Inc.(a) | | 18,161,300 | | | 961,459,222 |
GlaxoSmithKline PLC ADR(b) (United Kingdom) | | 27,824,300 | | | 983,310,762 |
Merck & Co., Inc. | | 34,380,900 | | | 961,289,964 |
Novartis AG ADR(b) (Switzerland) | | 26,065,500 | | | 1,063,211,745 |
Pfizer, Inc. | | 51,012,864 | | | 765,192,960 |
Sanofi-Aventis ADR(b) (France) | | 19,368,600 | | | 571,180,014 |
Thermo Fisher Scientific, Inc.(a) | | 614,115 | | | 25,037,468 |
Wyeth | | 14,861,400 | | | 674,558,946 |
| | | | | |
| | | | | 6,005,241,081 |
| | | | | |
| | | | | 8,992,541,041 |
| INDUSTRIALS: 6.9% | | | | | |
CAPITAL GOODS: 4.3% |
Caterpillar, Inc. | | 4,500,200 | | | 148,686,608 |
Eaton Corp. | | 5,798,200 | | | 258,657,702 |
General Electric Co. | | 63,198,175 | | | 740,682,611 |
Koninklijke Philips Electronics NV(b) (Netherlands) | | 2,508,600 | | | 46,208,412 |
Tyco International, Ltd.(b) (Switzerland) | | 9,660,775 | | | 250,986,934 |
| | | | | |
| | | | | 1,445,222,267 |
| | |
| See accompanying Notes to Financial Statements | | DODGE & COX STOCK FUND §PAGE 6 |
| | |
| PORTFOLIO OF INVESTMENTS (unaudited) | | June 30, 2009 |
| | | | | |
| COMMON STOCKS (continued) |
| | |
| | | SHARES | | VALUE |
COMMERCIAL SERVICES & SUPPLIES: 0.6% |
Pitney Bowes, Inc. | | 10,286,950 | | $ | 225,592,814 |
|
TRANSPORTATION: 2.0% |
FedEx Corp. | | 11,883,599 | | | 660,965,776 |
| | | | | |
| | | | | 2,331,780,857 |
| INFORMATION TECHNOLOGY: 19.6% |
SEMICONDUCTORS & SEMICONDUCTOR EQUIPMENT: 1.1% |
Maxim Integrated Products, Inc.(c) | | 24,348,800 | | | 382,032,672 |
|
SOFTWARE & SERVICES: 6.7% |
Adobe Systems, Inc.(a) | | 2,848,579 | | | 80,614,786 |
Autodesk, Inc.(a) | | 1,880,700 | | | 35,695,686 |
BMC Software, Inc.(a) | | 8,050,940 | | | 272,041,263 |
Cadence Design Systems, Inc.(a),(c) | | 23,282,600 | | | 137,367,340 |
Citrix Systems, Inc.(a),(c) | | 12,427,022 | | | 396,297,731 |
Computer Sciences Corp.(a),(c) | | 11,781,972 | | | 521,941,360 |
Compuware Corp.(a),(c) | | 22,088,112 | | | 151,524,448 |
EBay, Inc.(a) | | 29,173,300 | | | 499,738,629 |
Symantec Corp.(a) | | 442,317 | | | 6,882,452 |
Synopsys, Inc.(a) | | 6,822,369 | | | 133,104,419 |
| | | | | |
| | | | | 2,235,208,114 |
TECHNOLOGY, HARDWARE & EQUIPMENT: 11.8% |
Hewlett-Packard Co. | | 41,553,595 | | | 1,606,046,447 |
Hitachi, Ltd. ADR(a),(b) (Japan) | | 6,105,000 | | | 189,071,850 |
Kyocera Corp. ADR(b) (Japan) | | 549,848 | | | 41,073,646 |
Molex, Inc. | | 2,547,600 | | | 39,615,180 |
Molex, Inc., Class A | | 8,724,330 | | | 125,455,865 |
Motorola, Inc.(a),(c) | | 143,005,211 | | | 948,124,549 |
Telefonaktiebolaget LM Ericsson ADR(b) (Sweden) | | 17,020,500 | | | 166,460,490 |
Tyco Electronics, Ltd.(b) (Switzerland) | | 20,289,775 | | | 377,186,917 |
Xerox Corp.(c) | | 67,997,300 | | | 440,622,504 |
| | | | | |
| | | | | 3,933,657,448 |
| | | | | |
| | | | | 6,550,898,234 |
| MATERIALS: 2.2% | | | | | |
Cemex SAB de CV ADR(a),(b) (Mexico) | | 13,650,591 | | | 127,496,520 |
Domtar Corp.(a) | | 1,370,959 | | | 22,730,500 |
Dow Chemical Co. | | 30,845,345 | | | 497,843,868 |
Vulcan Materials Co. | | 2,046,548 | | | 88,206,219 |
| | | | | |
| | | | | 736,277,107 |
| TELECOMMUNICATION SERVICES: 1.8% |
Sprint Nextel Corp.(a),(c) | | 127,825,739 | | | 614,841,805 |
| | | | | |
TOTAL COMMON STOCKS
(Cost $42,322,276,320) | | | | $ | 32,966,266,008 |
| | | | | |
| | | | | | | |
| SHORT-TERM INVESTMENTS: 1.3% |
| | |
| | | PAR VALUE | | | VALUE |
MONEY MARKET FUND: 0.3% |
SSgA Prime Money Market Fund | | $ | 101,333,086 | | | $ | 101,333,086 |
|
REPURCHASE AGREEMENT: 1.0% |
Fixed Income Clearing Corporation(d) 0.03%, 7/1/09, maturity value $331,944,277 | | | 331,944,000 | | | | 331,944,000 |
| | | | | | | |
TOTAL SHORT-TERM INVESTMENTS (Cost $433,277,086) | | | | 433,277,086 |
| | | | | | | |
TOTAL INVESTMENTS (Cost $42,755,553,406) | | | 99.8 | % | | $ | 33,399,543,094 |
OTHER ASSETS LESS LIABILITIES | | | 0.2 | % | | | 65,274,267 |
| | | | | | | |
| NET ASSETS | | | 100.0 | % | | $ | 33,464,817,361 |
| | | | | | | |
| (b) | Security denominated in U.S. dollars |
| (c) | See Note 8 regarding holdings of 5% voting securities |
| (d) | Repurchase agreement is collateralized by Fannie Mae 2.00%-2.05%, 4/1/11; and Freddie Mac, 2.00%-2.125, 3/9/11-3/16/11. Total collateral value is $338,586,117. |
ADR: American Depositary Receipt
| | |
| PAGE 7 § DODGE & COX STOCK FUND | | See accompanying Notes to Financial Statements |
| | | | |
STATEMENT OF ASSETS AND LIABILITIES (unaudited) | |
| |
| | | June 30, 2009 | |
ASSETS: | | | | |
Investments, at value | | | | |
Unaffiliated issuers (cost $34,428,042,317) | | $ | 28,052,693,740 | |
Affiliated issuers (cost $8,327,511,089) | | | 5,346,849,354 | |
| | | | |
| | | 33,399,543,094 | |
Receivable for investments sold | | | 45,037,403 | |
Receivable for Fund shares sold | | | 28,326,760 | |
Dividends and interest receivable | | | 72,441,733 | |
Prepaid expenses and other assets | | | 102,343 | |
| | | | |
| | | 33,545,451,333 | |
| | | | |
LIABILITIES: | | | | |
Payable for investments purchased | | | 388,435 | |
Payable for Fund shares redeemed | | | 63,895,779 | |
Management fees payable | | | 13,888,472 | |
Accrued expenses | | | 2,461,286 | |
| | | | |
| | | 80,633,972 | |
| | | | |
NET ASSETS | | $ | 33,464,817,361 | |
| | | | |
NET ASSETS CONSIST OF: | | | | |
Paid in capital | | $ | 49,418,984,791 | |
Undistributed net investment income | | | 8,033,729 | |
Accumulated net realized loss on investments | | | (6,606,190,847 | ) |
Net unrealized depreciation on investments | | | (9,356,010,312 | ) |
| | | | |
| | $ | 33,464,817,361 | |
| | | | |
Fund shares outstanding (par value $0.01 each, unlimited shares authorized) | | | 433,887,302 | |
Net asset value per share | | | $77.13 | |
|
STATEMENT OF OPERATIONS
(unaudited) | |
| |
| | | Six Months Ended
June 30, 2009 | |
INVESTMENT INCOME: | | | | |
Dividends (net of foreign taxes of $13,114,560) | | | | |
Unaffiliated issuers | | $ | 338,041,185 | |
Affiliated issuers | | | 37,602,434 | |
Interest | | | 703,095 | |
| | | | |
| | | 376,346,714 | |
| | | | |
EXPENSES: | | | | |
Management fees | | | 75,450,253 | |
Custody and fund accounting fees | | | 221,598 | |
Transfer agent fees | | | 2,315,666 | |
Professional services | | | 68,393 | |
Shareholder reports | | | 1,100,498 | |
Registration fees | | | 91,056 | |
Trustees’ fees | | | 73,000 | |
Miscellaneous | | | 436,174 | |
| | | | |
| | | 79,756,638 | |
| | | | |
NET INVESTMENT INCOME | | | 296,590,076 | |
| | | | |
REALIZED AND UNREALIZED GAIN/ (LOSS) ON INVESTMENTS: | | | | |
Net realized loss | | | | |
Unaffiliated issuers | | | (5,583,132,045 | ) |
Affiliated issuers | | | (523,122,740 | ) |
Net change in unrealized depreciation | | | 7,158,127,372 | |
| | | | |
Net realized and unrealized gain | | | 1,051,872,587 | |
| | | | |
NET INCREASE IN NET ASSETS FROM OPERATIONS | | $ | 1,348,462,663 | |
| | | | |
| | | | | | | | |
STATEMENT OF CHANGES IN NET ASSETS | |
| | | Six Months Ended
June 30, 2009
(unaudited) | | | Year Ended
December 31, 2008 | |
OPERATIONS: | | | | | | | | |
Net investment income | | $ | 296,590,076 | | | $ | 871,266,747 | |
Net realized loss | | | (6,106,254,785 | ) | | | (490,239,002 | ) |
Net change in unrealized appreciation/depreciation | | | 7,158,127,372 | | | | (27,280,798,157 | ) |
| | | | | | | | |
Net increase/(decrease) in net assets from operations | | | 1,348,462,663 | | | | (26,899,770,412 | ) |
| | | | | | | | |
| |
DISTRIBUTIONS TO SHAREHOLDERS FROM: | | | | | |
Net investment income | | | (318,530,089 | ) | | | (841,293,005 | ) |
Net realized gain | | | — | | | | (1,851,869,071 | ) |
| | | | | | | | |
Total distributions | | | (318,530,089 | ) | | | (2,693,162,076 | ) |
| | | | | | | | |
| | |
FUND SHARE TRANSACTIONS: | | | | | | | | |
Proceeds from sale of shares | | | 3,104,421,927 | | | | 10,316,815,718 | |
Reinvestment of distributions | | | 300,702,027 | | | | 2,558,867,110 | |
Cost of shares redeemed | | | (3,691,437,518 | ) | | | (13,852,190,915 | ) |
| | | | | | | | |
Net decrease from Fund share transactions | | | (286,313,564 | ) | | | (976,508,087 | ) |
| | | | | | | | |
| | | | | | | | |
Total increase/(decrease) in net assets | | | 743,619,010 | | | | (30,569,440,575 | ) |
| | |
NET ASSETS: | | | | | | | | |
Beginning of period | | | 32,721,198,351 | | | | 63,290,638,926 | |
| | | | | | | | |
End of period (including undistributed net investment income of $8,033,729 and $29,973,742, respectively) | | $ | 33,464,817,361 | | | $ | 32,721,198,351 | |
| | | | | | | | |
| | |
SHARE INFORMATION: | | | | | | | | |
Shares sold | | | 44,861,727 | | | | 96,421,753 | |
Distributions reinvested | | | 4,276,915 | | | | 22,845,911 | |
Shares redeemed | | | (55,216,615 | ) | | | (137,061,296 | ) |
| | | | | | | | |
Net decrease in shares outstanding | | | (6,077,973 | ) | | | (17,793,632 | ) |
| | | | | | | | |
| | |
| See accompanying Notes to Financial Statements | | DODGE & COX STOCK FUND §PAGE 8 |
NOTES TO FINANCIAL STATEMENTS (unaudited)
NOTE 1—ORGANIZATION AND SIGNIFICANT ACCOUNTING POLICIES
Dodge & Cox Stock Fund (the “Fund”) is one of the series constituting the Dodge & Cox Funds (the “Trust” or the “Funds”). The Trust is organized as a Delaware statutory trust and is registered under the Investment Company Act of 1940, as amended, as a diversified, open-end management investment company. The Fund commenced operations on January 4, 1965, and seeks long-term growth of principal and income. Risk considerations and investment strategies of the Fund are discussed in the Fund’s Prospectus.
The financial statements have been prepared in conformity with accounting principles generally accepted in the United States of America, which require the use of estimates and assumptions by management. Significant accounting policies are as follows:
Security valuation The Fund’s net assets are valued as of the close of trading on the New York Stock Exchange (NYSE), generally 4:00 p.m. Eastern Time, each day that the NYSE is open for business. Stocks are valued at the official quoted close price or the last sale of the day at the close of the NYSE or, if not available, at the mean between the exchange listed bid and ask prices for the day. A security that is listed or traded on more than one exchange is valued at the quotation on the exchange determined to be the primary market for such security. Security values are not discounted based on the size of the Fund’s position. Securities for which market quotations are not readily available are valued at fair value as determined in good faith by or at the direction of the Board of Trustees. Short-term securities are valued at amortized cost which approximates current value. All securities held by the Fund are denominated in U.S. dollars.
Security transactions, investment income, expenses, and distributions Security transactions are recorded on the trade date. Realized gains and losses on securities sold are determined on the basis of identified cost.
Dividend income and corporate action transactions are recorded on the ex-dividend date, except for certain dividends or corporate actions from foreign securities where the ex-dividend date may have passed, which are recorded as soon as the Fund is informed of the ex-dividend date.
Withholding taxes on foreign dividends have been provided for in accordance with the Fund’s understanding of the applicable country’s tax rules and rates. Non-cash dividends included in dividend income, if any, are recorded at the fair market value of the securities received. Distributions received in excess of income are recorded as a reduction of cost of investments and/or realized gain. Interest income is recorded on the accrual basis.
Expenses are recorded on the accrual basis. Most expenses of the Trust can be directly attributed to a specific series. Expenses which cannot be directly attributed are allocated among the Funds in the Trust.
Distributions to shareholders are recorded on the ex-dividend date.
Repurchase agreements The Fund may enter into repurchase agreements, secured by U.S. government or agency securities, which involve the purchase of securities from a counterparty with a simultaneous commitment to resell the securities at an agreed-upon date and price. It is the Fund’s policy that its custodian take possession of the underlying collateral securities, the fair value of which exceeds the principal amount of the repurchase transaction, including accrued interest, at all times. In the event of default by the counterparty, the Fund has the contractual right to liquidate the collateral securities and to apply the proceeds in satisfaction of the obligation.
NOTE 2—VALUATION MEASUREMENTS
Various inputs are used in determining the value of the Fund’s investments. These inputs are summarized in the three broad levels listed below.
| § | | Level 1: Quoted prices in active markets for identical securities |
| § | | Level 2: Other significant observable inputs (including quoted prices for similar securities, market indices, interest rates, credit risk, etc.) |
| § | | Level 3: Significant unobservable inputs (including the Fund’s own assumptions in determining the fair value of investments) |
The inputs or methodology used for valuing securities are not necessarily an indication of the risk associated with investing in those securities.
PAGE 9 § DODGE & COX STOCK FUND
NOTES TO FINANCIAL STATEMENTS (unaudited)
The following is a summary of the inputs used to value the Fund’s holdings as of June 30, 2009:
| | | | | | |
| Security Classification(a) | | LEVEL 1
(Quoted Prices) | | LEVEL 2
(Other Significant
Observable Inputs) |
Common Stocks(b) | | $ | 32,966,266,008 | | $ | — |
Money Market Investments | | | 101,333,086 | | | — |
Repurchase Agreements | | | — | | | 331,944,000 |
| | | | | | |
Total | | $ | 33,067,599,094 | | $ | 331,944,000 |
| | | | | | |
| | | | | | | |
| (a) | At June 30, 2009 the Fund held no securities that were considered to be “Level 3” securities (those valued using significant unobservable inputs). |
| (b) | All common stocks held in the Fund are Level 1 securities. For a detailed break-out of common stocks by major industry classification, please refer to the Portfolio of Investments. |
NOTE 3—RELATED PARTY TRANSACTIONS
Management fees Under a written agreement approved by a unanimous vote of the Board of Trustees, the Fund pays an annual management fee of 0.50% of the Fund’s average daily net assets to Dodge & Cox, investment manager of the Fund. The agreement further provides that Dodge & Cox shall waive its fee to the extent that such fee plus all other ordinary operating expenses of the Fund exceed 0.75% of the average daily net assets for the year.
Fund officers and trustees All officers and three of the trustees of the Trust are officers or employees of Dodge & Cox. The Trust pays a fee only to those trustees who are not affiliated with Dodge & Cox.
Indemnification Under the Trust’s organizational documents, its officers and trustees are indemnified against certain liabilities arising out of the performance of their duties to the Trust. In addition, in the normal course of business the Trust enters into contracts that provide general indemnities to other parties. The Trust’s maximum exposure under these arrangements is unknown as this would involve future claims that may be made against the Trust that have not yet occurred.
NOTE 4—INCOME TAX INFORMATION
A provision for federal income taxes is not required since the Fund intends to continue to qualify as a regulated investment company under Subchapter M of the Internal
Revenue Code and distribute all of its taxable income to shareholders. Distributions are determined in accordance with income tax regulations, which may differ from net investment income and realized gains for financial reporting purposes. Financial reporting records are adjusted for permanent book/tax differences to reflect tax character.
Book/tax differences are primarily due to differing treatments of wash sales, in-kind redemptions and net short-term realized gain/(loss). During the period, the Fund recognized net capital gain of $9,265,340 from the delivery of appreciated securities in an in-kind redemption transaction. For federal income tax purposes, this gain is not recognized as taxable income to the Fund and therefore will not be distributed to shareholders. At June 30, 2009, the cost of investments for federal income tax purposes was $42,827,213,185.
Distributions during the six months ended June 30, 2009 and for the year ended December 31, 2008 were characterized as follows for federal income tax purposes:
| | | | |
| | | Six Months Ended June 30, 2009 | | Year Ended December 31, 2008 |
Ordinary income | | $318,530,089 | | $863,451,970 |
| | ($0.740 per share) | | ($1.889 per share) |
| | |
Long-term capital gain | | — | | $1,829,710,106 |
| | | | ($4.079 per share) |
At June 30, 2009, the tax basis components of distributable earnings were as follows:
| | | | |
Unrealized appreciation | | $ | 2,977,006,166 | |
Unrealized depreciation | | | (12,404,676,257 | ) |
| | | | |
Net unrealized depreciation | | | (9,427,670,091 | ) |
Undistributed ordinary income | | | 8,033,729 | |
Accumulated capital loss(a) | | | (6,504,450,990 | ) |
Capital loss carryforward(b) | | | (30,080,078 | ) |
| (a) | Represents capital loss realized for tax purposes during the period from January 1, 2009 to June 30, 2009. |
| (b) | Represents accumulated capital loss as of December 31, 2008 which may be carried forward to offset future capital gains. If not utilized, the capital loss carryforward will expire in 2016. |
Fund management has reviewed the tax positions for open periods (for Federal purposes, three years from the date of filing and for State purposes, four years from the date of filing) as applicable to the Fund, and has determined that no provision for income tax is required in the Fund’s financial statements.
DODGE & COX STOCK FUND §PAGE 10
NOTES TO FINANCIAL STATEMENTS (unaudited)
NOTE 5—COMMITTED LINE OF CREDIT
The Fund participates with the Funds in a $200 million committed credit facility (“Line of Credit”) with State Street Bank and Trust Company to be utilized for temporary or emergency purposes to fund shareholder redemptions or for other short-term liquidity purposes. Interest on borrowings is charged at the prevailing rate. There were no borrowings on the Line of Credit during the period.
NOTE 6—PURCHASES AND SALES OF INVESTMENTS
For the six months ended June 30, 2009, purchases and sales
of securities, other than short-term securities, aggregated $3,434,582,301 and $3,537,640,022, respectively.
NOTE 7—SUBSEQUENT EVENTS
Fund management has determined that no material events or transactions occurred subsequent to June 30, 2009 and through August 11, 2009, the date of the Fund’s financial statements issuance, which require additional disclosure in the Fund’s financial statements.
NOTE 8—HOLDINGS OF 5% VOTING SECURITIES
Each of the companies listed below was considered to be an affiliate of the Fund because the Fund owned 5% or more of the company’s voting securities during all or part of the six-month period ended June 30, 2009. Purchase and sale transactions and dividend income earned during the period on these securities were as follows:
| | | | | | | | | | | | | | | | | |
| | | Shares at
Beginning of Period | | Additions | | Reductions | | | Shares at
End of Period | | Dividend
Income(a) | | | Value at
End of Period | |
Baker Hughes, Inc. | | 15,061,494 | | 808,500 | | (15,800 | ) | | 15,854,194 | | $ | 4,638,448 | | | $ | 577,726,830 | |
Cadence Design Systems, Inc. | | 23,293,600 | | 12,300 | | (23,300 | ) | | 23,282,600 | | | — | (b) | | | 137,367,340 | |
Capital One Financial Corp. | | 26,304,011 | | 5,665,900 | | (26,300 | ) | | 31,943,611 | | | 11,177,890 | | | | 698,926,209 | |
Cardinal Health, Inc. | | 21,868,375 | | 10,900 | | (609,525 | ) | | 21,269,750 | | | 6,701,413 | | | | 649,790,863 | |
CarMax, Inc. | | 11,812,400 | | 6,600 | | (11,800 | ) | | 11,807,200 | | | — | (b) | | | 173,565,840 | |
Citrix Systems, Inc. | | 12,014,741 | | 424,681 | | (12,400 | ) | | 12,427,022 | | | — | (b) | | | 396,297,731 | |
Computer Sciences Corp. | | 13,462,172 | | 5,700 | | (1,685,900 | ) | | 11,781,972 | | | — | (b) | | | 521,941,360 | |
Compuware Corp. | | 22,096,012 | | 14,200 | | (22,100 | ) | | 22,088,112 | | | — | (b) | | | 151,524,448 | |
Health Management Associates, Inc. | | 15,334,500 | | — | | (8,345,440 | ) | | 6,989,060 | | | — | (b) | | | — | (c) |
Maxim Integrated Products, Inc. | | 24,360,200 | | 12,900 | | (24,300 | ) | | 24,348,800 | | | 9,739,220 | | | | 382,032,672 | |
Motorola, Inc. | | 155,139,211 | | 20,900 | | (12,154,900 | ) | | 143,005,211 | | | — | (b) | | | 948,124,549 | |
SLM Corp. | | 26,195,782 | | 16,200 | | (26,100 | ) | | 26,185,882 | | | — | (b) | | | 268,929,008 | |
Sprint Nextel Corp. | | 109,849,239 | | 30,069,100 | | (12,092,600 | ) | | 127,825,739 | | | — | (b) | | | — | (c) |
Xerox Corp. | | 57,778,300 | | 10,278,600 | | (59,600 | ) | | 67,997,300 | | | 5,345,463 | | | | 440,622,504 | |
| | | | | | | | | | | | | | | | | |
| | | | | | | | | | | $ | 37,602,434 | | | $ | 5,346,849,354 | |
| | | | | | | | | | | | | | | | | |
| | | | | | | | | | | | | | | | | | |
| (a) | Net of foreign taxes, if any |
| (c) | Company was not an affiliate at the end of the period |
PAGE 11 § DODGE & COX STOCK FUND
FINANCIAL HIGHLIGHTS
| | | | | | | | | | | | | | | | | | |
SELECTED DATA AND RATIOS (for a share outstanding throughout each period) | | Six Months
Ended June 30, | | | Year Ended December 31, | |
| | | 2009(a) | | | 2008 | | | 2007 | | | 2006 | | | 2005 | | | 2004 | |
| | | | | | |
Net asset value, beginning of period | | $74.37 | | | $138.26 | | | $153.46 | | | $137.22 | | | $130.22 | | | $113.78 | |
Income from investment operations: | | | | | | | | | | | | | | | | | | |
Net investment income | | 0.69 | | | 1.91 | | | 2.30 | | | 2.15 | | | 1.68 | | | 1.54 | |
Net realized and unrealized gain/(loss) | | 2.81 | | | (59.83 | ) | | (1.90 | ) | | 23.12 | | | 10.36 | | | 20.08 | |
| | | | | | |
Total from investment operations | | 3.50 | | | (57.92 | ) | | 0.40 | | | 25.27 | | | 12.04 | | | 21.62 | |
| | | | | | |
Distributions to shareholders from: | | | | | | | | | | | | | | | | | | |
Net investment income | | (0.74 | ) | | (1.84 | ) | | (2.34 | ) | | (2.12 | ) | | (1.70 | ) | | (1.53 | ) |
Net realized gain | | — | | | (4.13 | ) | | (13.26 | ) | | (6.91 | ) | | (3.34 | ) | | (3.65 | ) |
| | | | | | |
Total distributions | | (0.74 | ) | | (5.97 | ) | | (15.60 | ) | | (9.03 | ) | | (5.04 | ) | | (5.18 | ) |
| | | | | | |
Net asset value, end of period | | $77.13 | | | $74.37 | | | $138.26 | | | $153.46 | | | $137.22 | | | $130.22 | |
| | | | | | |
Total return | | 4.80 | % | | (43.31 | )% | | 0.14 | % | | 18.54 | % | | 9.36 | % | | 19.16 | % |
Ratios/supplemental data: | | | | | | | | | | | | | | | | | | |
Net assets, end of period (millions) | | $33,465 | | | $32,721 | | | $63,291 | | | $66,185 | | | $52,184 | | | $43,266 | |
Ratio of expenses to average net assets | | 0.53 | %(b) | | 0.52 | % | | 0.52 | % | | 0.52 | % | | 0.52 | % | | 0.53 | % |
Ratio of net investment income to average net assets | | 1.97 | %(b) | | 1.75 | % | | 1.44 | % | | 1.48 | % | | 1.29 | % | | 1.32 | % |
Portfolio turnover rate | | 12 | % | | 31 | % | | 27 | % | | 14 | % | | 12 | % | | 11 | % |
See accompanying Notes to Financial Statements
DODGE & COX STOCK FUND §PAGE 12
FUND HOLDINGS
The Fund provides a complete list of its holdings four times each fiscal year, as of the end of each quarter. The lists appear in the Fund’s First Quarter, Semi-Annual, Third Quarter and Annual Reports to shareholders. The Fund files the lists with the Securities and Exchange Commission (SEC) on Form N-CSR (second and fourth quarters) and Form N-Q (first and third quarters). Shareholders may view the Fund’s Forms N-CSR and N-Q on the SEC’s website at www.sec.gov. Forms N-CSR and N-Q may also be reviewed and copied at the SEC’s Public Reference Room in Washington, DC. Information regarding the operations of the Public Reference Room may be obtained by 1-202-942-8090 (direct) or 1-800-732-0330 (general SEC number). A complete list of the Fund’s quarter-end holdings is also available at www.dodgeandcox.com on or about 15 days following each quarter end and remains available on the web site until the list is updated in the subsequent quarter.
PROXY VOTING
For a free copy of the Fund’s proxy voting policies and procedures, please call 1-800-621-3979, visit the Fund’s web site at www.dodgeandcox.com or visit the SEC’s web site at www.sec.gov. Information regarding how the Fund voted proxies relating to portfolio securities during the most recent 12-month period ending June 30 is also available at www.dodgeandcox.com or at www.sec.gov.
PAGE 13 § DODGE & COX STOCK FUND
THIS PAGE INTENTIONALLY LEFT BLANK
DODGE & COX STOCK FUND §PAGE 14
DODGE & COX FUNDS—EXECUTIVE OFFICER & TRUSTEE INFORMATION
| | | | | | |
Name (Age) and
Address* | | Position with Trust
(Year of Election or
Appointment) | | Principal Occupation During Past 5 Years | | Other Directorships Held by Trustees |
| INTERESTED TRUSTEES & OFFICERS |
| John A. Gunn (65) | | Chairman and Trustee
(Trustee since 1985) | | Chairman (since 2007), Chief Executive Officer (since 2005) and Director of Dodge & Cox, Portfolio Manager and member of Investment Policy Committee (IPC), Global Investment Policy Committee (GIPC) (since 2008), and International Investment Policy Committee (IIPC) | | — |
| Kenneth E. Olivier (57) | | President and Trustee
(Trustee since 2005) | | President (since 2005) and Director of Dodge & Cox, Portfolio Manager, and member of IPC | | — |
| Dana M. Emery (47) | | Senior Vice President and Trustee (Trustee since 1993) | | Executive Vice President (since 2005) and Director of Dodge & Cox, Manager of the Fixed Income Department, Portfolio Manager, and member of Fixed Income Investment Policy Committee (FIIPC) | | — |
| Charles F. Pohl (51) | | Senior Vice President (Officer since 2004) | | Senior Vice President and Director of Dodge & Cox, Chief Investment Officer (since 2007), Director of Credit Research, Portfolio Manager, Investment Analyst, and member of IPC, GIPC (since 2008), IIPC (since 2007), and FIIPC | | — |
| Diana S. Strandberg (49) | | Senior Vice President
(Officer since 2005) | | Vice President of Dodge & Cox, Portfolio Manager, and member of IPC, GIPC (since 2008), and IIPC | | — |
| David H. Longhurst (52) | | Treasurer (Officer since 2006) | | Vice President and Assistant Treasurer of Dodge & Cox (since 2008); Vice President, Treasurer, Controller and Secretary of Safeco Mutual Funds, Safeco Asset Management Company, Safeco Services, Safeco Securities, and Safeco Investment Services (2000-2004) | | — |
| Thomas M. Mistele (55) | | Secretary
(Officer since 2000) | | Chief Operating Officer (since 2004), Director (since 2005), Secretary, and General Counsel of Dodge & Cox | | — |
| Marcia P. Venegas (40) | | Chief Compliance Officer
(Officer since 2004) | | Associate Chief Compliance Officer of Dodge & Cox (since 2008), Chief Compliance Officer of Dodge & Cox (2005-2008), Compliance Officer of Dodge & Cox (2003-2004) | | — |
| INDEPENDENT TRUSTEES |
| William F. Ausfahl (69) | | Trustee (Since 2002) | | CFO, The Clorox Co. (1982-1997); Director, The Clorox Co. (1984-1997) | | — |
| L. Dale Crandall (67) | | Trustee (Since 1999) | | President, Kaiser Foundation Health Plan, Inc. and Kaiser Foundation Hospitals (2000-2002); Senior Vice President—Finance and Administration & CFO, Kaiser Foundation Health Plan, Inc. and Kaiser Foundation Hospitals (1998-2000) | | Director, Ansell Limited (medical equipment and supplies) (2002-Present); Director, Coventry Health Care, Inc. (managed health care) (2004-Present); Director, Metavante Technologies, Inc. (software) (2007 to present) |
| Thomas A. Larsen (59) | | Trustee (Since 2002) | | Director in Howard, Rice, Nemerovski, Canady, Falk & Rabkin (law firm) | | — |
John B. Taylor (62) | | Trustee (Since 2005) | | Professor of Economics, Stanford University; Senior Fellow, Hoover Institution; Under Secretary for International Affairs, United States Treasury (2001-2005) | | — |
| Will C. Wood (69) | | Trustee (Since 1992) | | Principal, Kentwood Associates, Financial Advisers | | Director, Banco Latinoamericano de Exportaciones S.A. (Latin American foreign trade bank) (1999-Present) |
| * | | The address for each Officer and Trustee is 555 California Street, 40th Floor, San Francisco, California 94104. Each Officer and Trustee oversees all five series in the Dodge & Cox Funds complex and serves for an indefinite term. |
Additional information about the Trust’s Trustees and Officers is available in the Trust’s Statement of Additional Information (SAI). You can get a free copy of the SAI by visiting the Funds’ website at www.dodgeandcox.com or calling 1-800-621-3979.
PAGE 15 § DODGE & COX STOCK FUND
| | | | |
| | | | |
www.dodgeandcox.com
For Fund literature, transactions, and account information, please visit the Funds’ web site.
or write or call:
DODGE & COX FUNDS
c/o Boston Financial Data Services
P.O. Box 8422
Boston, Massachusetts 02266-8422
(800) 621-3979
INVESTMENT MANAGER
Dodge & Cox
555 California Street, 40th Floor
San Francisco, California 94104
(415) 981-1710
This report is submitted for the general information of the shareholders of the Fund. The report is not authorized for distribution to prospective investors in the Fund unless it is accompanied by a current prospectus.
This report reflects our views, opinions, and portfolio holdings as of June 30, 2009, the end of the reporting period. Any such views are subject to change at any time based upon market or other conditions and Dodge & Cox disclaims any responsibility to update such views. These views may not be relied on as investment advice and, because investment decisions for a Dodge & Cox Fund are based on numerous factors, may not be relied on as an indication of trading intent on behalf of any Dodge & Cox Fund.
6/09 GSF SAR Printed on recycled paper
Semi-Annual Report
June 30, 2009
Global Stock
Fund
ESTABLISHED 2008
TICKER: DODWX
TO OUR SHAREHOLDERS
The Dodge & Cox Global Stock Fund had a total return of 13.5% for the first half of 2009, compared to a return of 6.4% for the MSCI World Index (MSCI World). Returns since the inception of the Fund appear on page three. At June 30, the Fund had net assets of $515 million with a cash position of 2.1%. While the six-month results were solid, the Fund is still down 30.2% from one year ago, compared to down 29.5% for the MSCI World.
MARKET COMMENTARY
The last six months have been volatile ones in the financial markets. Global stock markets (as measured by the MSCI World) fell 25% from the start of the year to their low on March 9, and then rallied to rise 42% to June 30. Returns for individual investments have been even more tumultuous, with some stocks falling and then rising by dramatic amounts. Throughout this turbulence, Dodge & Cox has remained steady in our focus on the fundamentals of the individual companies in which we invest and the long-term outlook for their growth and profitability.
INVESTMENT STRATEGY
For us, a long-term perspective means viewing the Fund as part-owner of a business. We focus our research efforts on the issues that would matter to a business owner—competitive position, management, growth prospects, and risks in relation to current valuation. We do not let short-term issues dictate our long-term strategy, though we do pay close attention to immediate risks. For example, with the length of the current downturn uncertain, we want to have a great degree of confidence that the companies the Fund holds are able to withstand a difficult external environment. In a recent commentary, we highlighted how our fixed income and equity research teams work together to analyze and stress-test the debt levels and access to cash for many of the Fund’s holdings.
Historically our investment team has found that share prices can change much more in the short term than underlying business fundamentals. In a difficult environment, when companies are under pressure and share prices are down, we often see indiscriminate selling of companies perceived as risky. We believe our
investment process gives us the tools to make more informed decisions: an independent research team with detailed knowledge of the companies the Fund holds, an eye on long-term value across economic cycles, and the patience to hold on to investments that appear sound. In some cases, selling by other investors has provided the opportunity for the Fund to increase its holdings in companies where we see an attractive future. In other cases, where our analysis indicates that the risks outweigh the potential returns, the Fund has sold positions. Sales in the first half included Citigroup and American International Group (AIG).
PERSISTENCE MATTERS
One of the lessons we hope investors take to heart watching the current year unfold is that persistence matters greatly to long-term returns. The holdings that have helped the portfolio—selected Financials, construction materials, and information technology companies—are essentially the same ones that caused the greatest concern in the first months of 2009. For example, there were 24 companies in the Fund whose total returns exceeded 100% between March 9 and June 30. Of those 24, 18 declined at least 40% between December 31 and March 9. Without persistence, the Fund would not have benefited from the sharp appreciation in those investments.
One example of our investment process is Capital One, a leading U.S. credit card company. Capital One has historically grown market share in the credit card business while achieving a high return on capital through an innovative, information-based strategy. In 2005 and 2006, the company diversified its business and strengthened its sources of funding by acquiring two retail banks. In the current recession, Capital One’s business has come under pressure as defaults have risen, consumer spending has dropped, and traditional funding sources have dried up. In addition, regulatory changes recently passed by Congress are likely to affect the future profitability of the credit card business. Our analysis of the company recognizes all these challenges, but also the strengths of the company: a strong capital base, stable funding sources, and a talented, prudent management team led by founder Richard
PAGE 1 § DODGE & COX GLOBAL STOCK FUND
Fairbanks. Our investment analysis also takes into account the valuation the market places on the company, which fell as low as 0.2 times book value during the February–April period before rebounding sharply by the end of June (though still down 29% for the six-month period). The Fund significantly increased its holding of Capital One during the first half of the year. Importantly, we use this example to illustrate our investment process, not to imply that we think it is more attractive than the Fund’s other holdings.
LOOKING FORWARD
Despite the recent rebound, stock markets are still down significantly over the last two years. The MSCI World is 40% below the peak it reached on October 31, 2007. We believe valuation levels are attractive and continue to find opportunities for new investments that we think will provide good returns in the years ahead. Two areas that we find particularly attractive at present are companies positioned to take advantage of growth in the developing world and companies that benefit from research-driven innovation. Some of our holdings in the first group include Net Servicos, a Brazilian pay-TV operator, and Standard Chartered, a British bank with operations throughout Asia. Examples of companies benefiting from innovation include Roche, a Swiss pharmaceutical company added to the Fund during 2009, and Philips Electronics, a Dutch manufacturer of advanced lighting and medical systems.
IN CLOSING
Thank you for your continued confidence in our firm as a shareholder of the Dodge & Cox Global Stock Fund. As always, we welcome your comments and questions.
For the Board of Trustees,
| | |
| |  |
John A. Gunn, Chairman | | Diana S. Strandberg, Senior Vice President |
August 11, 2009
PERFORMANCE REVIEW
Key Contributors to Relative Results
| | § | | A strong relative return from the Fund’s Energy holdings (up 20%) versus the MSCI World sector (up 6%) contributed to relative performance. In particular, Petrobras (up 65%), Lukoil Holdings (up 42%), and Schlumberger (up 29%) helped performance. | |
| | § | | A strong relative return from the Fund’s Telecommunication Services holdings (up 51%) versus the MSCI World sector (down 4%) contributed to relative performance. In particular, Sprint Nextel (up 163%) was a strong performer. | |
| | § | | Lower average weightings in Utilities (0% versus 5% in the MSCI World sector) and Consumer Staples (2% versus 11% in the MSCI World sector) were beneficial, as these sectors underperformed other areas of the market. | |
| | § | | Notable contributors included Credit Suisse (up 71%) and Naspers (up 46%). | |
Key Detractors from Relative Results
| | § | | A poor return from the Fund’s Industrial holdings (down 4%) versus the MSCI World sector (up 2%) detracted from relative performance. In particular, General Electric (down 25%) and FedEx (down 13%) hurt performance. | |
| | § | | The Fund’s higher average weighting in the Health Care sector (15% versus 11% for the MSCI World) detracted from results, as the Health Care sector underperformed other sectors. Weak returns from Novartis (down 15%) and Amgen (down 8%) detracted from performance. | |
| | § | | Capital One (down 29%) and Swiss Re (down 30%) hindered the Fund’s relative performance. | |
DODGE & COX GLOBAL STOCK FUND §PAGE 2
GROWTH OF $10,000 SINCE INCEPTION
FOR AN INVESTMENT MADE ON MAY 1, 2008
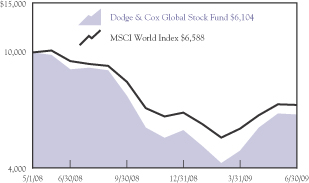
AVERAGE ANNUAL TOTAL RETURN
FOR PERIODS ENDED JUNE 30, 2009
| | | | |
| | | 1 Year | | Since Inception
(05/01/08) |
Dodge & Cox Global Stock Fund | | -30.16% | | -34.50% |
MSCI World Index | | -29.49 | | -30.08 |
Past performance does not guarantee future results. Investment return and share price will fluctuate with market conditions, and investors may have a gain or loss when shares are sold. Mutual fund performance changes over time and currently may be significantly lower than stated. Performance is updated and published monthly. Visit the Fund’s web site at www.dodgeandcox.com or call 1-800-621-3979 for current performance figures.
The Fund’s total returns include the reinvestment of dividend and capital gain distributions, but have not been adjusted for any income taxes payable by shareholders on these distributions. The MSCI World Index is a widely recognized benchmark of the world’s stock markets, including the United States. Index returns include dividends and/or interest income but, unlike Fund returns, do not reflect fees or expenses.
MSCI World Index® is a trademark of MSCI Barra.
Risks of international investing: Foreign investing, especially in developing countries, has special risks such as currency and market volatility and political and social instability. These and other risk considerations are discussed in the Fund’s prospectus.
FUND EXPENSE EXAMPLE
As a Fund shareholder, you incur ongoing Fund costs, including management fees and other Fund expenses. All mutual funds have ongoing costs, sometimes referred to as operating expenses. The following example shows ongoing costs of investing in the Fund and can help you understand these costs and compare them with those of other mutual funds. The example assumes a $1,000 investment held for the six months indicated.
ACTUAL EXPENSES
The first line of the table below provides information about actual account values and expenses based on the Fund’s actual returns. You may use the information in this line, together with your account balance, to estimate the expenses that you paid over the period. Simply divide your account value by $1,000 (for example, an $8,600 account value divided by $1,000 = 8.6), then multiply the result by the number in the first line under the heading “Expenses Paid During Period” to estimate the expenses you paid on your account during this period.
HYPOTHETICAL EXAMPLE FOR COMPARISON WITH OTHER MUTUAL FUNDS
Information on the second line of the table can help you compare ongoing costs of investing in the Fund with those of other mutual funds. This information may not be used to estimate the actual ending account balance or expenses you paid during the period. The hypothetical “Ending Account Value” is based on the actual expense ratio of the Fund and an assumed 5% annual rate of return before expenses (not the Fund’s actual return). The amount under the heading “Expense Paid During the Period” shows the hypothetical expenses your account would have incurred under this scenario. You can compare this figure with the 5% hypothetical examples that appear in shareholder reports of other mutual funds.
| | | | | | | | | |
Six Months Ended June 30, 2009 | | Beginning Account Value
1/1/2009 | | Ending Account Value
6/30/2009 | | Expenses Paid During Period* |
Based on Actual Fund Return | | $ | 1,000.00 | | $ | 1,134.80 | | $ | 4.33 |
Based on Hypothetical 5% Yearly Return | | | 1,000.00 | | | 1,020.74 | | | 4.10 |
| * | | Expenses are equal to the Fund’s annualized six-month expense ratio of 0.82%, multiplied by the average account value over the period, multiplied by 181/365 (to reflect the one-half year period). |
The expenses shown in the table highlight ongoing costs only and do not reflect any transactional fees or account maintenance fees. While other mutual funds may charge such fees, please note that the Fund does not charge transaction fees (e.g., redemption fees, sales loads) or universal account maintenance fees (e.g., small account fees).
PAGE 3 § DODGE & COX GLOBAL STOCK FUND
| | |
| FUND INFORMATION | | June 30, 2009 |
| | |
| GENERAL INFORMATION |
Net Asset Value Per Share | | $6.06 |
Total Net Assets (millions) | | $515 |
Expense Ratio (1/1/09 to 6/30/09, annualized) | | 0.82% |
Portfolio Turnover Rate (1/1/09 to 6/30/09, unannualized) | | 15% |
30-Day SEC Yield(a) | | 1.34% |
Fund Inception Date | | May 1, 2008 |
No sales charges or distribution fees | | |
Investment Manager: Dodge & Cox, San Francisco. Managed by the Global Investment Policy Committee, whose six members’ average tenure at Dodge & Cox is 18 years.
| | | | |
| PORTFOLIO CHARACTERISTICS | | Fund | | MSCI
World |
Number of Stocks | | 91 | | 1,656 |
Median Market Capitalization (billions) | | $17 | | $5 |
Weighted Average Market
Capitalization (billions) | | $41 | | $53 |
Price-to-Earnings Ratio(b) | | 12.0x | | 13.9x |
Countries Represented | | 23 | | 23 |
Emerging Markets (Brazil, India, Indonesia, Mexico, Russia, South Africa, Thailand, Turkey) | | 13.2% | | 0.0% |
| | | |
| TEN LARGEST HOLDINGS(c) | | Fund | |
Schlumberger, Ltd. (United States) | | 3.0 | % |
Hewlett-Packard Co. (United States) | | 2.8 | |
Novartis AG (Switzerland) | | 2.4 | |
Capital One Financial Corp. (United States) | | 2.4 | |
Lafarge SA (France) | | 2.2 | |
Naspers, Ltd. (South Africa) | | 2.1 | |
Swiss Reinsurance Co. (Switzerland) | | 2.1 | |
Unicredit SPA (Italy) | | 1.9 | |
Schneider Electric SA (France) | | 1.9 | |
Merck & Co., Inc. (United States) | | 1.9 | |

| | | | | | |
| REGION DIVERSIFICATION | | Fund | | | MSCI
World | |
United States | | 38.6 | % | | 48.2 | % |
Europe (excluding United Kingdom) | | 36.2 | | | 20.5 | |
United Kingdom | | 7.0 | | | 9.9 | |
Latin America | | 4.8 | | | 0.0 | |
Japan | | 4.6 | | | 11.3 | |
Pacific (excluding Japan) | | 4.1 | | | 5.4 | |
Africa | | 2.6 | | | 0.0 | |
Canada | | 0.0 | | | 4.7 | |
| | | | | | |
| SECTOR DIVERSIFICATION | | Fund | | | MSCI
World | |
Financials | | 20.9 | % | | 19.7 | % |
Health Care | | 14.7 | | | 10.7 | |
Information Technology | | 13.7 | | | 11.7 | |
Consumer Discretionary | | 12.9 | | | 9.3 | |
Energy | | 11.5 | | | 11.4 | |
Materials | | 9.8 | | | 6.8 | |
Industrials | | 9.5 | | | 10.3 | |
Telecommunication Services | | 3.3 | | | 4.6 | |
Consumer Staples | | 1.6 | | | 10.5 | |
Utilities | | 0.0 | | | 5.0 | |
| (a) | SEC yield is an annualization of the Fund’s total net investment income per share for the 30-day period ended on the last day of the month. |
| (b) | Price-to-earnings (P/E) ratios are calculated using 12-month forward earnings estimates. |
| (c) | The Fund’s portfolio holdings are subject to change without notice. The mention of specific securities is not a recommendation or solicitation for any person to buy, sell, or hold any particular security. |
DODGE & COX GLOBAL STOCK FUND §PAGE 4
| | |
| PORTFOLIO OF INVESTMENTS (unaudited) | | June 30, 2009 |
| | | | | |
| COMMON STOCKS: 95.0% | | | | |
| | |
| | | SHARES | | VALUE |
| CONSUMER DISCRETIONARY: 11.8% | | | |
AUTOMOBILES & COMPONENTS: 1.0% | | | |
Bayerische Motoren Werke AG (Germany) | | 73,300 | | $ | 2,768,327 |
Yamaha Motor Co., Ltd. (Japan) | | 211,400 | | | 2,334,697 |
| | | | | |
| | | | | 5,103,024 |
CONSUMER DURABLES & APPAREL: 1.9% | | | |
Panasonic Corp. (Japan) | | 273,300 | | | 3,665,795 |
Sony Corp. (Japan) | | 246,600 | | | 6,370,276 |
| | | | | |
| | | | | 10,036,071 |
MEDIA: 7.7% | | | | | |
Comcast Corp., Class A (United States) | | 593,300 | | | 8,596,917 |
Grupo Televisa SA ADR (Mexico) | | 190,500 | | | 3,238,500 |
Naspers, Ltd. (South Africa) | | 414,100 | | | 10,913,856 |
News Corp., Class A (United States) | | 617,100 | | | 5,621,781 |
Television Broadcasts, Ltd. (Hong Kong) | | 366,700 | | | 1,432,033 |
Time Warner Cable, Inc.(a) (United States) | | 75,671 | | | 2,396,501 |
Time Warner, Inc. (United States) | | 286,466 | | | 7,216,079 |
| | | | | |
| | | | | 39,415,667 |
RETAILING: 1.2% | | | | | |
Liberty Interactive, Series A(a) (United States) | | 887,057 | | | 4,444,155 |
Macy’s, Inc. (United States) | | 164,700 | | | 1,936,872 |
| | | | | |
| | | | | 6,381,027 |
| | | | | |
| | | | | 60,935,789 |
| CONSUMER STAPLES: 1.6% | | | | | |
FOOD, BEVERAGE & TOBACCO: 1.5% | | | | | |
Anadolu Efes Biracilik ve Malt Sanayii AS (Turkey) | | 881,700 | | | 7,923,175 |
| |
HOUSEHOLD & PERSONAL PRODUCTS: 0.1% | | | |
Avon Products, Inc. (United States) | | 9,600 | | | 247,488 |
| | | | | |
| | | | | 8,170,663 |
| ENERGY: 9.7% | | | | | |
Baker Hughes, Inc. (United States) | | 167,987 | | | 6,121,446 |
Chevron Corp. (United States) | | 61,100 | | | 4,047,875 |
OAO Lukoil ADR (Russia) | | 141,100 | | | 6,304,099 |
Occidental Petroleum Corp. (United States) | | 118,900 | | | 7,824,809 |
Royal Dutch Shell PLC ADR (United Kingdom) | | 127,600 | | | 6,404,244 |
Schlumberger, Ltd. (United States) | | 289,100 | | | 15,643,201 |
Total SA (France) | | 64,000 | | | 3,466,378 |
| | | | | |
| | | | | 49,812,052 |
| FINANCIALS: 20.9% | | | | | |
BANKS: 9.7% | | | | | |
HSBC Holdings PLC (United Kingdom) | | 1,023,207 | | | 8,494,273 |
ICICI Bank, Ltd. ADR (India) | | 172,400 | | | 5,085,800 |
Kasikornbank PCL Foreign (Thailand) | | 1,641,100 | | | 3,459,978 |
Royal Bank of Scotland Group PLC(a) (United Kingdom) | | 4,896,684 | | | 3,113,927 |
Standard Bank Group, Ltd. (South Africa) | | 240,500 | | | 2,770,772 |
| | | | | |
| | |
| | | SHARES | | VALUE |
Standard Chartered PLC (United Kingdom) | | 455,954 | | $ | 8,587,707 |
Unicredit SPA (Italy) | | 3,928,608 | | | 10,064,960 |
Wells Fargo & Co. (United States) | | 341,573 | | | 8,286,561 |
| | | | | |
| | | | | 49,863,978 |
DIVERSIFIED FINANCIALS: 5.9% | | | | | |
Bank of New York Mellon Corp. (United States) | | 73,600 | | | 2,157,216 |
Capital One Financial Corp. (United States) | | 564,700 | | | 12,355,636 |
Credit Suisse Group AG (Switzerland) | | 149,000 | | | 6,801,800 |
Haci Omer Sabanci Holding AS (Turkey) | | 1,120,788 | | | 3,004,554 |
Legg Mason, Inc. (United States) | | 233,700 | | | 5,697,606 |
State Street Corp. (United States) | | 9,800 | | | 462,560 |
| | | | | |
| | | | | 30,479,372 |
INSURANCE: 4.0% | | | | | |
AEGON NV(a) (Netherlands) | | 1,278,374 | | | 7,862,814 |
Swiss Reinsurance Co. (Switzerland) | | 328,400 | | | 10,865,258 |
Tokio Marine Holdings, Inc. (Japan) | | 71,300 | | | 1,958,232 |
| | | | | |
| | | | | 20,686,304 |
REAL ESTATE: 1.3% | | | | | |
Hang Lung Group, Ltd. (Hong Kong) | | 1,127,500 | | | 5,329,165 |
Hang Lung Properties, Ltd. (Hong Kong) | | 381,700 | | | 1,237,892 |
| | | | | |
| | | | | 6,567,057 |
| | | | | |
| | | | | 107,596,711 |
| HEALTH CARE: 14.7% | | | | | |
HEALTH CARE EQUIPMENT & SERVICES: 2.5% | | | |
Covidien PLC (Ireland) | | 158,700 | | | 5,941,728 |
UnitedHealth Group, Inc. (United States) | | 146,400 | | | 3,657,072 |
WellPoint, Inc.(a) (United States) | | 62,900 | | | 3,200,981 |
| | | | | |
| | | | | 12,799,781 |
PHARMACEUTICALS, BIOTECHNOLOGY & LIFE SCIENCES: 12.2% |
Amgen, Inc.(a) (United States) | | 139,900 | | | 7,406,306 |
Bayer AG (Germany) | | 92,000 | | | 4,940,035 |
GlaxoSmithKline PLC ADR (United Kingdom) | | 264,700 | | | 9,354,498 |
Merck & Co., Inc. (United States) | | 350,200 | | | 9,791,592 |
Novartis AG ADR (Switzerland) | | 306,000 | | | 12,481,740 |
Roche Holding AG (Switzerland) | | 39,700 | | | 5,401,135 |
Sanofi-Aventis (France) | | 110,100 | | | 6,475,112 |
Thermo Fisher Scientific, Inc.(a) (United States) | | 4,500 | | | 183,465 |
Wyeth (United States) | | 156,500 | | | 7,103,535 |
| | | | | |
| | | | | 63,137,418 |
| | | | | |
| | | | | 75,937,199 |
| INDUSTRIALS: 9.5% | | | | | |
CAPITAL GOODS: 8.3% | | | | | |
Eaton Corp. (United States) | | 31,900 | | | 1,423,059 |
General Electric Co. (United States) | | 720,700 | | | 8,446,604 |
| | |
| PAGE 5 § DODGE & COX GLOBAL STOCK FUND | | See accompanying Notes to Financial Statements |
| | |
| PORTFOLIO OF INVESTMENTS (unaudited) | | June 30, 2009 |
| | | | | |
| COMMON STOCKS (continued) |
| | |
| | | SHARES | | VALUE |
Koninklijke Philips Electronics NV (Netherlands) | | 322,700 | | $ | 5,967,146 |
Mitsubishi Electric Corp.(a) (Japan) | | 1,082,000 | | | 6,808,105 |
Schneider Electric SA (France) | | 130,389 | | | 9,972,103 |
Tyco International, Ltd. (Switzerland) | | 321,600 | | | 8,355,168 |
Wienerberger AG(a) (Austria) | | 161,200 | | | 2,004,078 |
| | | | | |
| | | | | 42,976,263 |
TRANSPORTATION: 1.2% | | | | | |
FedEx Corp. (United States) | | 109,400 | | | 6,084,828 |
| | | | | |
| | | | | 49,061,091 |
| INFORMATION TECHNOLOGY: 13.7% | | | |
SEMICONDUCTORS & SEMICONDUCTOR EQUIPMENT: 1.0% |
Infineon Technologies AG(a) (Germany) | | 590,200 | | | 2,142,621 |
Maxim Integrated Products, Inc. (United States) | | 200,000 | | | 3,138,000 |
| | | | | |
| | | | | 5,280,621 |
SOFTWARE & SERVICES: 3.2% | | | | | |
Cadence Design Systems, Inc.(a) (United States) | | 670,000 | | | 3,953,000 |
Computer Sciences Corp.(a) (United States) | | 58,500 | | | 2,591,550 |
Compuware Corp.(a) (United States) | | 171,400 | | | 1,175,804 |
EBay, Inc.(a) (United States) | | 352,400 | | | 6,036,612 |
Symantec Corp.(a) (United States) | | 8,700 | | | 135,372 |
Synopsys, Inc.(a) (United States) | | 118,900 | | | 2,319,739 |
| | | | | |
| | | | | 16,212,077 |
TECHNOLOGY, HARDWARE & EQUIPMENT: 9.5% |
Alcatel-Lucent(a) (France) | | 2,234,400 | | | 5,630,252 |
Hewlett-Packard Co. (United States) | | 372,000 | | | 14,377,800 |
Kyocera Corp. (Japan) | | 32,600 | | | 2,445,471 |
Motorola, Inc.(a) (United States) | | 779,100 | | | 5,165,433 |
Nokia Oyj (Finland) | | 515,800 | | | 7,527,412 |
Telefonaktiebolaget LM Ericsson (Sweden) | | 206,700 | | | 2,021,786 |
Tyco Electronics, Ltd. (Switzerland) | | 398,800 | | | 7,413,692 |
Xerox Corp. (United States) | | 694,200 | | | 4,498,416 |
| | | | | |
| | | | | 49,080,262 |
| | | | | |
| | | | | 70,572,960 |
| MATERIALS: 9.8% | | | | | |
Akzo Nobel NV (Netherlands) | | 140,000 | | | 6,160,707 |
Arkema (France) | | 255,916 | | | 6,013,180 |
Cemex SAB de CV ADR(a) (Mexico) | | 746,593 | | | 6,973,179 |
Domtar Corp.(a) (United States) | | 480,916 | | | 7,973,587 |
Dow Chemical Co. (United States) | | 119,100 | | | 1,922,274 |
Lafarge SA (France) | | 172,808 | | | 11,617,684 |
Lanxess AG (Germany) | | 115,800 | | | 2,872,610 |
Norsk Hydro ASA(a) (Norway) | | 1,361,500 | | | 7,024,630 |
| | | | | |
| | | | | 50,557,851 |
| | | | | | | |
| | |
| | | SHARES | | | VALUE |
| TELECOMMUNICATION SERVICES: 3.3% |
PT Telekomunik Indonesia ADR (Indonesia) | | | 145,300 | | | $ | 4,356,094 |
Sprint Nextel Corp.(a) (United States) | | | 1,104,400 | | | | 5,312,164 |
Telefonica SA ADR (Spain) | | | 108,000 | | | | 7,332,120 |
| | | | | | | |
| | | | | | | 17,000,378 |
| | | | | | | |
TOTAL COMMON STOCKS
(Cost $568,688,390) | | | | | | $ | 489,644,694 |
| | | | | | | |
| | |
| PREFERRED STOCKS: 2.9% | | | | | |
| CONSUMER DISCRETIONARY: 1.1% |
MEDIA: 1.1% | | | | | | | |
Net Servicos de Comunicacao SA ADR(a) (Brazil) | | | 572,700 | | | $ | 5,578,098 |
| | |
| ENERGY: 1.8% | | | | | | | |
Petroleo Brasileiro SA ADR (Brazil) | | | 134,800 | | | | 4,496,928 |
Ultrapar Participacoes SA ADR (Brazil) | | | 147,800 | | | | 4,674,914 |
| | | | | | | |
| | | | | | | 9,171,842 |
| | | | | | | |
TOTAL PREFERRED STOCKS
(Cost $11,241,489) | | | | | | $ | 14,749,940 |
| | | | | | | |
| |
| SHORT-TERM INVESTMENTS: 2.0% | | | |
| | |
| | | PAR VALUE | | | VALUE |
MONEY MARKET FUND: 0.3% | | | | | | | |
SSgA Prime Money Market Fund | | $ | 1,557,501 | | | $ | 1,557,501 |
| | |
REPURCHASE AGREEMENT: 1.7% | | | | | | | |
Fixed Income Clearing Corporation(b) 0.03%, 7/1/09, maturity value $8,855,007 | | | 8,855,000 | | | | 8,855,000 |
| | | | | | | |
TOTAL SHORT-TERM INVESTMENTS
(Cost $10,412,501) | | | $ | 10,412,501 |
| | | | | | | |
TOTAL INVESTMENTS
(Cost $590,342,380) | | | 99.9 | % | | $ | 514,807,135 |
OTHER ASSETS LESS
LIABILITIES | | | 0.1 | % | | | 548,533 |
| | | | | | | |
| NET ASSETS | | | 100.0 | % | | $ | 515,355,668 |
| | | | | | | |
| (b) | Repurchase agreement is collateralized by Fannie Mae 1.00%-1.75%, 4/15/11-5/18/11; and Federal Home Loan Bank 1.625%-3.375%, 8/13/10-7/27/11. Total collateral value is $9,033,263. |
ADR: American Depositary Receipt
| | |
| See accompanying Notes to Financial Statements | | DODGE & COX GLOBAL STOCK FUND §PAGE 6 |
| | | | |
STATEMENT OF ASSETS AND LIABILITIES (unaudited) | |
| |
| | | June 30, 2009 | |
ASSETS: | | | | |
Investments, at value (cost $590,342,380) | | $ | 514,807,135 | |
Cash denominated in foreign currency (cost $21,068) | | | 21,002 | |
Receivable for investments sold | | | 26,320 | |
Receivable for Fund shares sold | | | 203,086 | |
Dividends and interest receivable | | | 1,113,301 | |
Prepaid expenses and other assets | | | 445 | |
| | | | |
| | | 516,171,289 | |
| | | | |
LIABILITIES: | | | | |
Payable for investments purchased | | | 43,345 | |
Payable for Fund shares redeemed | | | 142,431 | |
Management fees payable | | | 258,827 | |
Accrued foreign capital gain tax | | | 166,559 | |
Accrued expenses | | | 204,459 | |
| | | | |
| | | 815,621 | |
| | | | |
NET ASSETS | | $ | 515,355,668 | |
| | | | |
NET ASSETS CONSIST OF: | | | | |
Paid in capital | | $ | 680,782,096 | |
Undistributed net investment income | | | 4,313,016 | |
Accumulated net realized loss on investments | | | (94,040,900 | ) |
Net unrealized depreciation on investments (net of accrued foreign capital gain tax of $166,559) | | | (75,698,544 | ) |
| | | | |
| | $ | 515,355,668 | |
| | | | |
Fund shares outstanding (par value $0.01 each, unlimited shares authorized) | | | 85,007,245 | |
Net asset value per share | | | $6.06 | |
| |
STATEMENT OF OPERATIONS (unaudited) | | | | |
| |
| | | Six Months Ended
June 30, 2009 | |
INVESTMENT INCOME: | | | | |
Dividends (net of foreign taxes of $533,694) | | $ | 6,101,747 | |
Interest | | | 8,320 | |
| | | | |
| | | 6,110,067 | |
| | | | |
EXPENSES: | | | | |
Management fees | | | 1,330,915 | |
Custody and fund accounting fees | | | 31,653 | |
Transfer agent fees | | | 143,193 | |
Professional services | | | 77,750 | |
Shareholder reports | | | 66,739 | |
Registration fees | | | 81,327 | |
Trustees’ fees | | | 73,000 | |
Miscellaneous | | | 8,573 | |
| | | | |
| | | 1,813,150 | |
| | | | |
NET INVESTMENT INCOME | | | 4,296,917 | |
| | | | |
REALIZED AND UNREALIZED GAIN/(LOSS) ON INVESTMENTS: | | | | |
Net realized loss | | | | |
Investments | | | (66,877,202 | ) |
Foreign currency transactions | | | (1,325 | ) |
Net change in unrealized depreciation | | | | |
Investments (including net increase in accrued foreign capital gain tax of $166,559) | | | 120,280,354 | |
Foreign currency transactions | | | 3,263 | |
| | | | |
Net realized and unrealized gain | | | 53,405,090 | |
| | | | |
NET INCREASE IN NET ASSETS FROM OPERATIONS | | $ | 57,702,007 | |
| | | | |
| | | | | | | | |
STATEMENT OF CHANGES IN NET ASSETS | |
| | | Six Months Ended
June 30, 2009
(unaudited) | | | Period Ended
December 31, 2008* | |
OPERATIONS: | | | | | | | | |
Net investment income | | $ | 4,296,917 | | | $ | 3,219,547 | |
Net realized loss | | | (66,878,527 | ) | | | (27,303,338 | ) |
Net change in unrealized appreciation/depreciation | | | 120,283,617 | | | | (195,982,161 | ) |
| | | | | | | | |
Net increase/(decrease) in net assets from operations | | | 57,702,007 | | | | (220,065,952 | ) |
| | | | | | | | |
| | |
DISTRIBUTIONS TO SHAREHOLDERS FROM: | | | | | | | | |
Net investment income | | | — | | | | (3,126,483 | ) |
Net realized gain | | | — | | | | — | |
| | | | | | | | |
Total distributions | | | — | | | | (3,126,483 | ) |
| | | | | | | | |
| | |
FUND SHARE TRANSACTIONS: | | | | | | | | |
Proceeds from sale of shares | | | 66,103,600 | | | | 824,035,034 | |
Reinvestment of distributions | | | — | | | | 3,011,686 | |
Cost of shares redeemed | | | (76,665,905 | ) | | | (135,638,319 | ) |
| | | | | | | | |
Net increase/(decrease) from Fund share transactions | | | (10,562,305 | ) | | | 691,408,401 | |
| | | | | | | | |
Total increase in net assets | | | 47,139,702 | | | | 468,215,966 | |
| | |
NET ASSETS: | | | | | | | | |
Beginning of period | | | 468,215,966 | | | | — | |
| | | | | | | | |
End of period (including undistributed net investment income of $4,313,016 and $16,099, respectively) | | $ | 515,355,668 | | | $ | 468,215,966 | |
| | | | | | | | |
| | |
SHARE INFORMATION: | | | | | | | | |
Shares sold | | | 12,947,390 | | | | 109,860,232 | |
Distributions reinvested | | | — | | | | 588,220 | |
Shares redeemed | | | (15,698,722 | ) | | | (22,689,875 | ) |
| | | | | | | | |
Net increase/(decrease) in shares outstanding | | | (2,751,332 | ) | | | 87,758,577 | |
| | | | | | | | |
| * | | For the period from May 1, 2008 (inception) to December 31, 2008. |
| | |
| PAGE 7 § DODGE & COX GLOBAL STOCK FUND | | See accompanying Notes to Financial Statements |
NOTES TO FINANCIAL STATEMENTS (unaudited)
NOTE 1—ORGANIZATION AND SIGNIFICANT ACCOUNTING POLICIES
Dodge & Cox Global Stock Fund (the “Fund”) is one of the series constituting the Dodge & Cox Funds (the “Trust” or the “Funds”). The Trust is organized as a Delaware statutory trust and is registered under the Investment Company Act of 1940, as amended, as a diversified, open-end management investment company. The Fund commenced operations on May 1, 2008. It seeks long-term growth of principal and income, and invests primarily in a diversified portfolio of U.S. and foreign stocks. Foreign investing, especially in developing countries, has special risks such as currency and market volatility and political and social instability. These and other risk considerations are discussed in the Fund’s Prospectus.
The financial statements have been prepared in conformity with accounting principles generally accepted in the United States of America, which require the use of estimates and assumptions by management. Significant accounting policies are as follows:
Security valuation The Fund’s net assets are valued as of the close of trading on the New York Stock Exchange (NYSE), generally 4:00 p.m. Eastern Time, each day that the NYSE is open for business. Listed securities are valued at market, using the official quoted close price or the last sale on the date of determination on the principal exchange on which such securities are traded or, if not available, at the mean between the exchange listed bid and ask prices for the day. A security that is listed or traded on more than one exchange is valued at the quotation on the exchange determined to be the primary market for such security. Security values are not discounted based on the size of the Fund’s position. Short-term securities are valued at amortized cost which approximates current value.
Investments initially valued in currencies other than the U.S. dollar are converted to the U.S. dollar using prevailing exchange rates. As a result, the Fund’s net asset value (NAV) may be affected by changes in the value of currencies in relation to the U.S. dollar.
If market quotations are not readily available or if a security’s value has materially changed after the close of the security’s primary market but before the close of trading on the NYSE, the security is valued at fair value as
determined in good faith by or at the direction of the Board of Trustees. The Fund may use fair value pricing in calculating its NAV when, for example, (i) the primary market for a security is closed or if trading of a security is suspended or limited, (ii) the Fund determines that the price provided by a pricing service is inaccurate or unreliable, or (iii) the Fund determines that a significant event affecting the value of a security has occurred before the close of the NYSE but after the close of the security’s primary market. An event is considered significant if there is both an affirmative expectation that the security’s value will change in response to the event and a reasonable basis for quantifying a resulting change in value. For securities that do not trade during NYSE hours, fair value determinations are based on analyses of market movements after the close of those securities’ primary markets, and include reviews of developments in foreign markets, the performance of U.S. securities markets, and the performance of instruments trading in U.S. markets that represent foreign securities and baskets of foreign securities. Pricing services are used to obtain closing market prices and to compute certain fair value adjustments utilizing pricing models. When fair value pricing is employed, the prices of securities used by the Fund to calculate its net asset value may differ from quoted or published prices for the same securities. In addition, fair values may not reflect the price that the Fund could obtain for a security if it were to dispose of that security at the time of pricing.
Security transactions, investment income, expenses, and distributions Security transactions are recorded on the trade date. Realized gains and losses on securities sold are determined on the basis of identified cost.
Dividend income and corporate action transactions are recorded on the ex-dividend date, except for certain dividends or corporate actions from foreign securities where the ex-dividend date may have passed, which are recorded as soon as the Fund is informed of the ex-dividend date. Withholding taxes on foreign dividends have been provided for in accordance with the Fund’s understanding of the applicable country’s tax rules and rates. Non-cash dividends included in dividend income, if
DODGE & COX GLOBAL STOCK FUND §PAGE 8
NOTES TO FINANCIAL STATEMENTS (unaudited)
any, are recorded at the fair market value of the securities received. Distributions received in excess of income are recorded as a reduction of cost of investments and/or realized gain. Interest income is recorded on the accrual basis.
Expenses are recorded on the accrual basis. Most expenses of the Trust can be directly attributed to a specific series. Expenses which cannot be directly attributed are allocated among the Funds in the Trust.
Distributions to shareholders are recorded on the ex-dividend date.
Repurchase agreements The Fund may enter into repurchase agreements, secured by U.S. government or agency securities, which involve the purchase of securities from a counterparty with a simultaneous commitment to resell the securities at an agreed-upon date and price. It is the Fund’s policy that its custodian take possession of the underlying collateral securities, the fair value of which exceeds the principal amount of the repurchase transaction, including accrued interest, at all times. In the event of default by the counterparty, the Fund has the contractual right to liquidate the collateral securities and to apply the proceeds in satisfaction of the obligation.
Foreign currency The Fund may enter forward foreign currency contracts to hedge portfolio positions. It may also enter spot foreign currency contracts to facilitate security transactions in foreign currency-denominated securities. Losses from these transactions may arise from unfavorable changes in currency values or if the counterparties do not perform under the contracts’ terms.
Foreign currency-denominated assets (including investment securities) and liabilities are translated into U.S. dollars each business day at the prevailing exchange rate. Purchases and sales of securities, income receipts, and expenses denominated in foreign currencies are translated into U.S. dollars at the exchange rate in effect on the transaction date.
Net realized gains and losses on foreign currency transactions arise from sales of foreign currencies and from changes in currency values between the date recorded and the related settlement/cash payment on securities transactions, dividends, and foreign currency contracts. The effects of currency rate changes on investment
securities are included with realized and unrealized gain (loss) on investments.
The Fund did not enter into any forward foreign currency contracts during the period ended June 30, 2009.
NOTE 2—VALUATION MEASUREMENTS
Various inputs are used in determining the value of the Fund’s investments and other financial instruments. These inputs are summarized in the three broad levels listed below.
| § | | Level 1: Quoted prices in active markets for identical securities |
| § | | Level 2: Other significant observable inputs (including quoted prices for similar securities, market indices, interest rates, credit risk, etc.) |
| § | | Level 3: Significant unobservable inputs (including the Fund’s own assumptions in determining the fair value of investments) |
The inputs or methodology used for valuing securities are not necessarily an indication of the risk associated with investing in those securities.
The following is a summary of the inputs used to value the Fund’s holdings as of June 30, 2009:
| | | | | | |
| Security Classification(a) | | LEVEL 1
(Quoted Prices) | | LEVEL 2
(Other Significant
Observable Inputs) |
Common Stocks | | | | | | |
Consumer Discretionary | | $ | 33,450,805 | | $ | 27,484,984 |
Consumer Staples | | | 247,488 | | | 7,923,175 |
Energy | | | 40,041,575 | | | 9,770,477 |
Financials | | | 34,045,379 | | | 73,551,332 |
Health Care | | | 59,120,917 | | | 16,816,282 |
Industrials | | | 24,309,659 | | | 24,751,432 |
Information Technology | | | 50,805,418 | | | 19,767,542 |
Materials | | | 16,869,040 | | | 33,688,811 |
Telcommunication Services | | | 17,000,378 | | | — |
Preferred Stocks | | | 14,749,940 | | | — |
Money Market Investments | | | 1,557,501 | | | — |
Repurchase Agreements | | | — | | | 8,855,000 |
| | | | | | |
Total | | $ | 292,198,100 | | $ | 222,609,035 |
| | | | | | |
| | | | | | | |
| (a) | At June 30, 2009 the Fund held no securities that were considered to be “Level 3” securities (those valued using significant unobservable inputs). |
PAGE 9 § DODGE & COX GLOBAL STOCK FUND
NOTES TO FINANCIAL STATEMENTS (unaudited)
NOTE 3—RELATED PARTY TRANSACTIONS
Management fees Under a written agreement approved by a unanimous vote of the Board of Trustees, the Fund pays an annual management fee of 0.60% of the Fund’s average daily net assets to Dodge & Cox, investment manager of the Fund. Dodge & Cox has contractually agreed to reimburse the Fund for all ordinary operating expenses to the extent necessary to maintain the Fund’s total operating expenses at 0.90% for the fiscal periods ending December 31, 2008 & 2009. The agreement is renewable annually thereafter and is subject to termination upon 30 days’ written notice.
Fund officers and trustees All officers and three of the trustees of the Trust are officers or employees of Dodge & Cox. The Trust pays a fee only to those trustees who are not affiliated with Dodge & Cox.
Indemnification Under the Trust’s organizational documents, its officers and trustees are indemnified against certain liabilities arising out of the performance of their duties to the Trust. In addition, in the normal course of business the Trust enters into contracts that provide general indemnities to other parties. The Trust’s maximum exposure under these arrangements is unknown as this would involve future claims that may be made against the Trust that have not yet occurred.
NOTE 4—INCOME TAX INFORMATION AND DISTRIBUTIONS TO SHAREHOLDERS
A provision for federal income taxes is not required since the Fund intends to qualify as a regulated investment company under Subchapter M of the Internal Revenue Code and distribute all of its taxable income to shareholders. Distributions are determined in accordance with income tax regulations, which may differ from net investment income and realized gains for financial reporting purposes. Financial reporting records are adjusted for permanent book/tax differences to reflect tax character.
Certain foreign countries impose a tax on capital gains which is accrued by the Fund based on unrealized appreciation, if any, on affected securities. The tax is paid when a gain is realized on the sale of affected securities.
Book/tax differences are primarily due to differing treatments of wash sales, net short-term realized gain/
(loss) on investments, foreign currency realized gain/(loss), and offering costs. At June 30, 2009, the cost of investments for federal income tax purposes was $593,800,854.
Distributions during six months ended June 30, 2009 and for the period ended December 31, 2008 were characterized as follows for federal income tax purposes:
| | | | |
| | | Six Months Ended
June 30, 2009 | | Period Ended
December 31, 2008 |
Ordinary income | | — | | $3,126,483 |
| | | | ($0.037 per share) |
| | |
Long-term capital gain | | — | | — |
At June 30, 2009, the tax basis components of distributable earnings were as follows:
| | | | |
Unrealized appreciation | | $ | 35,859,707 | |
Unrealized depreciation | | | (115,016,725 | ) |
| | | | |
Net unrealized depreciation | | | (79,157,018 | ) |
Undistributed ordinary income | | | 4,313,016 | |
Accumulated capital loss(a) | | | (77,219,485 | ) |
Capital loss carryforward(b) | | | (13,362,941 | ) |
| (a) | Represent capital loss realized for tax purposes during the period from January 1, 2009 to June 30, 2009. |
| (b) | Represents accumulated capital loss as of December 31, 2008 which may be carried forward to offset future capital gains. If not utilized, the capital loss carryforward will expire in 2016. |
Fund management has reviewed the tax positions for open periods (for Federal purposes, three years from the date of filing and for State purposes, four years from the date of filing) as applicable to the Fund, and has determined that no provision for income tax is required in the Fund’s financial statements.
NOTE 5—COMMITTED LINE OF CREDIT
The Fund participates with the Funds in a $200 million committed credit facility (“Line of Credit”) with State Street Bank and Trust Company to be utilized for temporary or emergency purposes to fund shareholder redemptions or for other short-term liquidity purposes. Interest on borrowings is charged at the prevailing rate. There were no borrowings on the Line of Credit during the period.
DODGE & COX GLOBAL STOCK FUND §PAGE 10
NOTES TO FINANCIAL STATEMENTS (unaudited)
NOTE 6—PURCHASES AND SALES OF INVESTMENTS
For the six months ended June 30, 2009, purchases and sales of securities, other than short-term securities, aggregated $65,387,479 and $66,740,410, respectively.
NOTE 7—SUBSEQUENT EVENTS
Fund management has determined that no material events or transactions occurred subsequent to June 30, 2009 and through August 11, 2009, the date of the Fund’s financial statements issuance, which require additional disclosure in the Fund’s financial statements.
PAGE 11 § DODGE & COX GLOBAL STOCK FUND
FINANCIAL HIGHLIGHTS
| | | | | | |
SELECTED DATA AND RATIOS (for a share outstanding throughout the period) | | Six Months Ended
June 30, 2009(a) | | |
May 1, 2008 (inception)
through December 31, 2008 | |
Net asset value, beginning of period | | $5.34 | | | $10.00 | |
Income from investment operations: | | | | | | |
Net investment income | | 0.05 | | | 0.04 | |
Net realized and unrealized gain/(loss) | | 0.67 | | | (4.66 | ) |
| | | | | | |
Total from investment operations | | 0.72 | | | (4.62 | ) |
| | | | | | |
Distributions to shareholders from: | | | | | | |
Net investment income | | — | | | (0.04 | ) |
Net realized gain | | — | | | — | |
| | | | | | |
Total distributions | | — | | | (0.04 | ) |
| | | | | | |
Net asset value, end of period | | $6.06 | | | $5.34 | |
| | | | | | |
Total return | | 13.48 | % | | (46.21 | )% |
Ratios/supplemental data: | | | | | | |
Net assets, end of period (millions) | | $515 | | | $468 | |
Ratio of expenses to average net assets | | 0.82 | %(b) | | 0.87 | %(b) |
Ratio of net investment income to average net assets | | 1.94 | %(b) | | 1.39 | %(b) |
Portfolio turnover rate | | 15 | % | | 10 | % |
See accompanying Notes to Financial Statements
DODGE & COX GLOBAL STOCK FUND §PAGE 12
FUND HOLDINGS
The Fund provides a complete list of its holdings four times each fiscal year, as of the end of each quarter. The lists appear in the Fund’s First Quarter, Semi-Annual, Third Quarter and Annual Reports to shareholders. The Fund files the lists with the Securities and Exchange Commission (SEC) on Form N-CSR (second and fourth quarters) and Form N-Q (first and third quarters). Shareholders may view the Fund’s Forms N-CSR and N-Q on the SEC’s website at www.sec.gov. Forms N-CSR and N-Q may also be reviewed and copied at the SEC’s Public Reference Room in Washington, DC. Information regarding the operations of the Public Reference Room may be obtained by 1-202-942-8090 (direct) or 1-800-732-0330 (general SEC number). A complete list of the Fund’s quarter-end holdings is also available at www.dodgeandcox.com on or about 15 days following each quarter end and remains available on the web site until the list is updated in the subsequent quarter.
PROXY VOTING
For a free copy of the Fund’s proxy voting policies and procedures, please call 1-800-621-3979, visit the Fund’s web site at www.dodgeandcox.com or visit the SEC’s web site at www.sec.gov. Information regarding how the Fund voted proxies relating to portfolio securities during the most recent 12-month period ending June 30 is also available at www.dodgeandcox.com or at www.sec.gov.
PAGE 13 § DODGE & COX GLOBAL STOCK FUND
THIS PAGE INTENTIONALLY LEFT BLANK
DODGE & COX GLOBAL STOCK FUND §PAGE 14
DODGE & COX FUNDS—EXECUTIVE OFFICER & TRUSTEE INFORMATION
| | | | | | |
Name (Age) and
Address* | | Position with Trust
(Year of Election or
Appointment) | | Principal Occupation During Past 5 Years | | Other Directorships Held by Trustees |
| INTERESTED TRUSTEES & OFFICERS |
| John A. Gunn (65) | | Chairman and Trustee
(Trustee since 1985) | | Chairman (since 2007), Chief Executive Officer (since 2005) and Director of Dodge & Cox, Portfolio Manager and member of Investment Policy Committee (IPC), Global Investment Policy Committee (GIPC) (since 2008), and International Investment Policy Committee (IIPC) | | — |
| Kenneth E. Olivier (57) | | President and Trustee (Trustee since 2005) | | President (since 2005) and Director of Dodge & Cox, Portfolio Manager, and member of IPC | | — |
| Dana M. Emery (47) | | Senior Vice President and Trustee (Trustee since 1993) | | Executive Vice President (since 2005) and Director of Dodge & Cox, Manager of the Fixed Income Department, Portfolio Manager, and member of Fixed Income Investment Policy Committee (FIIPC) | | — |
| Charles F. Pohl (51) | | Senior Vice President
(Officer since 2004) | | Senior Vice President and Director of Dodge & Cox, Chief Investment Officer (since 2007), Director of Credit Research, Portfolio Manager, Investment Analyst, and member of IPC, GIPC (since 2008), IIPC (since 2007), and FIIPC | | — |
| Diana S. Strandberg (49) | | Senior Vice President
(Officer since 2005) | | Vice President of Dodge & Cox, Portfolio Manager, and member of IPC, GIPC (since 2008), and IIPC | | — |
| David H. Longhurst (52) | | Treasurer
(Officer since 2006) | | Vice President and Assistant Treasurer of Dodge & Cox (since 2008); Vice President, Treasurer, Controller and Secretary of Safeco Mutual Funds, Safeco Asset Management Company, Safeco Services, Safeco Securities, and Safeco Investment Services (2000-2004) | | — |
| Thomas M. Mistele (55) | | Secretary
(Officer since 2000) | | Chief Operating Officer (since 2004), Director (since 2005), Secretary, and General Counsel of Dodge & Cox | | — |
| Marcia P. Venegas (40) | | Chief Compliance Officer
(Officer since 2004) | | Associate Chief Compliance Officer of Dodge & Cox (since 2008), Chief Compliance Officer of Dodge & Cox (2005-2008), Compliance Officer of Dodge & Cox (2003-2004) | | — |
| INDEPENDENT TRUSTEES |
| William F. Ausfahl (69) | | Trustee (Since 2002) | | CFO, The Clorox Co. (1982-1997); Director, The Clorox Co. (1984-1997) | | — |
| L. Dale Crandall (67) | | Trustee (Since 1999) | | President, Kaiser Foundation Health Plan, Inc. and Kaiser Foundation Hospitals (2000-2002); Senior Vice President—Finance and Administration & CFO, Kaiser Foundation Health Plan, Inc. and Kaiser Foundation Hospitals (1998-2000) | | Director, Ansell Limited (medical equipment and supplies) (2002-Present); Director, Coventry Health Care, Inc. (managed health care) (2004-Present); Director, Metavante Technologies, Inc. (software) (2007 to present) |
| Thomas A. Larsen (59) | | Trustee (Since 2002) | | Director in Howard, Rice, Nemerovski, Canady, Falk & Rabkin (law firm) | | — |
John B. Taylor (62) | | Trustee (Since 2005) | | Professor of Economics, Stanford University; Senior Fellow, Hoover Institution; Under Secretary for International Affairs, United States Treasury (2001-2005) | | — |
| Will C. Wood (69) | | Trustee (Since 1992) | | Principal, Kentwood Associates, Financial Advisers | | Director, Banco Latinoamericano de Exportaciones S.A. (Latin American foreign trade bank) (1999-Present) |
| * | | The address for each Officer and Trustee is 555 California Street, 40th Floor, San Francisco, California 94104. Each Officer and Trustee oversees all five series in the Dodge & Cox Funds complex and serves for an indefinite term. |
Additional information about the Trust’s Trustees and Officers is available in the Trust’s Statement of Additional Information (SAI). You can get a free copy of the SAI by visiting the Fund’s website at www.dodgeandcox.com or calling 1-800-621-3979.
PAGE 15 § DODGE & COX GLOBAL STOCK FUND
| | | | |
| | | | |
www.dodgeandcox.com
For Fund literature, transactions, and account information, please visit the Funds’ web site.
or write or call:
DODGE & COX FUNDS
c/o Boston Financial Data Services
P.O. Box 8422
Boston, Massachusetts 02266-8422
(800) 621-3979
INVESTMENT MANAGER
Dodge & Cox
555 California Street, 40th Floor
San Francisco, California 94104
(415) 981-1710
This report is submitted for the general information of the shareholders of the Fund. The report is not authorized for distribution to prospective investors in the Fund unless it is accompanied by a current prospectus.
This report reflects our views, opinions, and portfolio holdings as of June 30, 2009, the end of the reporting period. Any such views are subject to change at any time based upon market or other conditions and Dodge & Cox disclaims any responsibility to update such views. These views may not be relied on as investment advice and, because investment decisions for a Dodge & Cox Fund are based on numerous factors, may not be relied on as an indication of trading intent on behalf of any Dodge & Cox Fund.
6/09 ISF SAR Printed on recycled paper
Semi-Annual Report
June 30, 2009
International Stock Fund
ESTABLISHED 2001
TICKER: DODFX
TO OUR SHAREHOLDERS
The Dodge & Cox International Stock Fund had a total return of 16.1% for the first half of 2009, compared to a return of 8.0% for the MSCI EAFE Index (MSCI EAFE). Longer-term results can be found on page three. At June 30, the Fund had net assets of $27.9 billion with a cash position of 3.2%. While the six-month results were solid, the Fund is still down 30.0% from one year ago, compared to down 31.4% for the MSCI EAFE.
World equity markets were extremely volatile in the first half of the year. From January 1 to the recent market trough on March 9, the MSCI EAFE fell 26.0%, and then rebounded sharply to rise 45.9% from March 9 to June 30. During these same periods, the Fund declined 27.9% and then rallied 60.9%.1 The holdings that helped the portfolio—selected financials, construction materials companies, and technology companies—are essentially the same ones that caused concern in the first months of 2009. For example, there were 19 companies in the Fund whose share prices more than doubled between March 9 and June 30. Twelve of those 19 had share price declines of at least 40% between January 1 and March 9. The rebound in the markets reflects the belief that the worst of the financial crisis may be over and that fears of a prolonged economic meltdown have ebbed.
INVESTMENT STRATEGY
THE IMPORTANCE OF BEING PERSISTENT
Share prices can fluctuate much more wildly than underlying business fundamentals, and this year shows it is nearly impossible to predict the bottom. One of the lessons we hope investors take to heart is that persistence matters greatly to long-term returns. Our investment process gives us the patience to hold or add to investments we believe are sound, even in a difficult environment. We are able to stay the course because we have an independent research team with detailed knowledge of the companies the Fund holds and who are focused on long-term value across economic cycles. As share prices and fundamentals change, we ask ourselves: “Would we invest in this company today?” When we answer this question affirmatively, price declines provide the opportunity to increase Fund holdings in companies where we see an attractive future. Significant
additions to existing holdings during the period include Nokia, Lafarge, and HSBC Holdings.
One of our largest holdings is Lafarge, a global cement company based in France. Lafarge has strong market positions and low-cost production facilities around the globe, especially in some of the world’s most promising developing countries. A large acquisition in 2007 financed partially with debt left Lafarge vulnerable to the economic downturn, and it was one of the worst-performing stocks in the Fund last year. As part of our ongoing investment process, we conducted a series of in-depth reviews, including a liquidity and financial stress test with our Fixed Income team, and concluded that Lafarge had the ability to withstand the weak economic environment and therefore remained an attractive long-term opportunity. When management decided to raise additional equity to strengthen the company’s balance sheet, we saw an opportunity to increase the Fund’s holding at what appeared to be an attractive price2.
LOOKING FORWARD
In this difficult economic environment, attention has been focused on what could go wrong. Given the Fund’s objective of long-term growth of principal and income, it is equally important to focus on how things could go right and to identify companies poised for growth over the long haul. A critical ingredient in our research process for identifying these opportunities is interviewing senior management of current and potential investments, their competitors, and customers to assess a company’s growth strategy and upside potential. Over the past year, our team of global industry analysts and portfolio managers has increased the number of research trips abroad, especially to the developing world, to meet with management teams and conduct site visits.
A recent trip to China and Hong Kong allowed us to increase our knowledge of real estate investments in the region, including Hang Lung, the leading developer and operator of premier shopping malls in mainland China. We started the Fund’s investment in Hang Lung in 2007, based on the thesis that the company possessed a prime portfolio of shopping centers targeting the growing number of affluent mainland Chinese consumers and had
PAGE 1 § DODGE & COX INTERNATIONAL STOCK FUND
a reasonable valuation. The trip confirmed our view that the management team is disciplined in its approach to buying land, is proactively targeting an extensive pipeline of new projects, and is building a business that we believe is poised to prosper in the decades to come as the purchasing power of Chinese consumers increases.
As we look at the Fund today, roughly half of the portfolio is exposed to long-term global growth driven by attractive demographics, technological innovation, and increased adoption of free market principles in the developing world. However, it is important not to overpay for these opportunities and to be flexible enough to identify companies that can benefit, wherever they are domiciled. For example, we see growing penetration of financial services in the developing world. ICICI, a major bank in India, and Standard Chartered, a U.K. bank with a strong presence in Asia, are two companies poised to capitalize on this trend.
The other half of the Fund is invested in companies that would benefit from a return to benign economic conditions, since their share prices reflect expectations that business conditions will remain mired in the current slump for the foreseeable future. For example Cemex, the cement company based in Mexico, and Schneider, the electrical goods manufacturer based in France, are both global leaders in their industries coping with severe declines in construction activity. We think the economy will grow in the long run. Our analysis shows these companies are likely to survive the current difficult environment and, with patience, we believe these investments could generate attractive returns for shareholders.
IN CLOSING
Markets can be highly volatile, and jumping in and out can be detrimental to long-term returns. Our experience over decades, and borne out this year, is that things can turn on a dime, making it notoriously difficult to time the market. We encourage our shareholders to take a long-term view of equity investing.
Thank you for your continued confidence in our firm as a shareholder of the Dodge & Cox International Stock Fund. As always, we welcome your comments and questions.
For the Board of Trustees,
| | |
| | |
John A. Gunn, Chairman | | Diana S. Strandberg, Senior Vice President |
August 11, 2009
| 1 | | Past performance does not guarantee future results. |
| 2 | | We discuss these examples to illustrate our long-term thinking and persistence, not to imply that they are more attractive than the Fund’s other holdings. |
DODGE & COX INTERNATIONAL STOCK FUND §PAGE 2
PERFORMANCE REVIEW
Key Contributors to Relative Results:
| | § | | The Fund’s holdings and overweight position in both the Information Technology sector (up 28% versus up 9% for the MSCI EAFE Information Technology sector) and Media industry (up 28% versus down 10% for the MSCI EAFE Media industry) significantly helped performance. Notable contributors include Infineon Technologies (up 171%), Net Servicos (up 68%), Fujifilm Holdings (up 48%), and Naspers (up 46%). | |
| | § | | The Fund’s holdings in the Financials sector (up 25% compared to up 13% for the MSCI EAFE Financials sector) positively impacted performance. Notable performers include Credit Suisse (up 71%), ICICI Bank (up 66%), Standard Chartered (up 55%), and Hang Lung (up 55%). | |
| | § | | The Fund’s holdings in the Energy sector (up 23% vs. up 11% for the MSCI EAFE Energy sector) aided performance. Petrobras (up 65%), Lukoil Holdings (up 42%), and Schlumberger (up 29%) were especially strong. | |
| | § | | Strong returns from the Fund’s Emerging Market holdings (up 35%) positively impacted absolute and relative performance. | |
Key Detractors from Relative Results:
| | § | | The Fund’s overweight position and selection of holdings in the Health Care sector (down 6% versus down 5% for the MSCI EAFE Health Care sector), the worst-performing sector of the Fund, detracted from results. Novartis (down 15%), Sanofi-Aventis (down 3%), and GlaxoSmithKline (down 3%) were especially weak. | |
| | § | | The Fund’s underweight position and stock selection in the Metals & Mining industry (up 26% compared to up 39% for the MSCI EAFE Metals & Mining industry) hurt performance. | |
| | § | | Selected additional detractors include Swiss Re (down 30%), Wienerberger (down 25%), and Accor (down 16%). | |
GROWTH OF $10,000 SINCE INCEPTION
FOR AN INVESTMENT MADE ON MAY 1, 2001
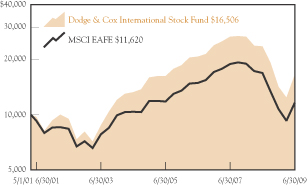
AVERAGE ANNUAL TOTAL RETURN
FOR PERIODS ENDED JUNE 30, 2009
| | | | | | | | | | | | |
| | | 1 Year | | | 3 Years | | | 5 Years | | | Since
Inception
(5/1/01) | |
Dodge & Cox International
Stock Fund | | -30.04 | % | | -7.34 | % | | 4.46 | % | | 6.33 | % |
MSCI EAFE | | -31.36 | | | -7.98 | | | 2.31 | | | 1.86 | |
Past performance does not guarantee future results. Investment return and share price will fluctuate with market conditions, and investors may have a gain or loss when shares are sold. Mutual fund performance changes over time and currently may be significantly lower than stated. Performance is updated and published monthly. Visit the Fund’s web site at www.dodgeandcox.com or call 1-800-621-3979 for current performance figures.
The Fund’s total returns include the reinvestment of dividend and capital gain distributions, but have not been adjusted for any income taxes payable by shareholders on these distributions. The MSCI EAFE Index is an unmanaged index of the world’s stock markets, excluding the United States. Index returns include dividends and/or interest income but, unlike Fund returns, do not reflect fees or expenses.
MSCI EAFE® is a trademark of MSCI Barra.
Risks of international investing: Foreign investing, especially in developing countries, has special risks such as currency and market volatility and political and social instability. These and other risk considerations are discussed in the Fund’s prospectus.
PAGE 3 § DODGE & COX INTERNATIONAL STOCK FUND
FUND EXPENSE EXAMPLE
As a Fund shareholder, you incur ongoing Fund costs, including management fees and other Fund expenses. All mutual funds have ongoing costs, sometimes referred to as operating expenses. The following example shows ongoing costs of investing in the Fund and can help you understand these costs and compare them with those of other mutual funds. The example assumes a $1,000 investment held for the six months indicated.
ACTUAL EXPENSES
The first line of the table below provides information about actual account values and expenses based on the Fund’s actual returns. You may use the information in this line, together with your account balance, to estimate the expenses that you paid over the period. Simply divide your account value by $1,000 (for example, an $8,600 account value divided by $1,000 = 8.6), then multiply the result by the number in the first line under the heading “Expenses Paid During Period” to estimate the expenses you paid on your account during this period.
HYPOTHETICAL EXAMPLE FOR COMPARISON WITH OTHER MUTUAL FUNDS
Information on the second line of the table can help you compare ongoing costs of investing in the Fund with those of other mutual funds. This information may not be used to estimate the actual ending account balance or expenses you paid during the period. The hypothetical “Ending Account Value” is based on the actual expense ratio of the Fund and an assumed 5% annual rate of return before expenses (not the Fund’s actual return). The amount under the heading “Expense Paid During the Period” shows the hypothetical expenses your account would have incurred under this scenario. You can compare this figure with the 5% hypothetical examples that appear in shareholder reports of other mutual funds.
| | | | | | | | | |
Six Months Ended June 30, 2009 | | Beginning Account Value
1/1/2009 | | Ending Account Value
6/30/2009 | | Expenses Paid During Period* |
Based on Actual Fund Return | | $ | 1,000.00 | | $ | 1,160.70 | | $ | 3.51 |
Based on Hypothetical 5% Yearly Return | | | 1,000.00 | | | 1,021.54 | | | 3.29 |
| * | | Expenses are equal to the Fund’s annualized expense ratio of 0.66%, multiplied by the average account value over the period, multiplied by 181/365 (to reflect the one-half year period). |
The expenses shown in the table highlight ongoing costs only and do not reflect any transactional fees or account maintenance fees. While other mutual funds may charge such fees, please note that the Fund does not charge transaction fees (e.g., redemption fees, sales loads) or universal account maintenance fees (e.g., small account fees).
DODGE & COX INTERNATIONAL STOCK FUND §PAGE 4
| | |
| FUND INFORMATION | | June 30, 2009 |
| | |
| GENERAL INFORMATION | | |
Net Asset Value Per Share | | $25.42 |
Total Net Assets (billions) | | $27.9 |
Expense Ratio (1/1/09 to 6/30/09, annualized) | | 0.66% |
Portfolio Turnover Rate (1/1/09 to 6/30/09, unannualized) | | 9% |
30-Day SEC Yield(a) | | 1.69% |
Fund Inception | | 2001 |
No sales charges or distribution fees | | |
Investment Manager: Dodge & Cox, San Francisco. Managed by the International Investment Policy Committee, whose nine members’ average tenure at Dodge & Cox is 19 years.
| | | | |
| PORTFOLIO CHARACTERISTICS | | Fund | | MSCI
EAFE |
Number of Stocks | | 91 | | 957 |
Median Market Capitalization (billions) | | $11 | | $5 |
Weighted Average Market
Capitalization (billions) | | $40 | | $42 |
Price-to-Earnings Ratio(b) | | 12.1x | | 14.1x |
Countries Represented | | 27 | | 21 |
Emerging Markets (Brazil, India, Indonesia, Israel, Mexico, Russia, South Africa, South Korea, Thailand, Turkey) | | 22.0% | | 0.0% |
| | | |
| TEN LARGEST HOLDINGS(c) | | Fund | |
Lafarge SA (France) | | 3.3 | % |
Naspers, Ltd. (South Africa) | | 3.3 | |
Novartis AG (Switzerland) | | 3.1 | |
Standard Chartered PLC (United Kingdom) | | 2.5 | |
Schneider Electric SA (France) | | 2.5 | |
Schlumberger, Ltd. (United States) | | 2.5 | |
HSBC Holdings PLC (United Kingdom) | | 2.4 | |
Credit Suisse Group AG (Switzerland) | | 2.3 | |
Standard Bank Group, Ltd. (South Africa) | | 2.3 | |
Nokia Oyj (Finland) | | 2.2 | |
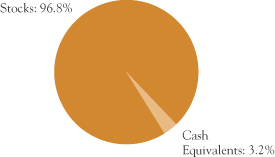
| | | | | | |
| REGION DIVERSIFICATION | | Fund | | | MSCI
EAFE | |
Europe (excluding United Kingdom) | | 45.6 | % | | 45.5 | % |
Japan | | 15.0 | | | 24.1 | |
United Kingdom | | 11.0 | | | 19.1 | |
Pacific (excluding Japan) | | 7.6 | | | 11.3 | |
Latin America | | 6.9 | | | 0.0 | |
Africa | | 6.2 | | | 0.0 | |
United States | | 4.2 | | | 0.0 | |
Middle East | | 0.3 | | | 0.0 | |
| | | | | | |
| SECTOR DIVERSIFICATION | | Fund | | | MSCI
EAFE | |
Financials | | 23.4 | % | | 24.6 | % |
Consumer Discretionary | | 16.8 | | | 10.0 | |
Information Technology | | 11.8 | | | 5.2 | |
Health Care | | 11.6 | | | 8.4 | |
Energy | | 10.1 | | | 8.7 | |
Industrials | | 9.2 | | | 11.3 | |
Materials | | 9.0 | | | 9.4 | |
Telecommunication Services | | 3.4 | | | 6.0 | |
Consumer Staples | | 1.5 | | | 10.0 | |
Utilities | | 0.0 | | | 6.4 | |
| (a) | SEC yield is an annualization of the Fund’s total net investment income per share for the 30-day period ended on the last day of the month. |
| (b) | Price-to-earnings (P/E) ratios are calculated using 12-month forward earnings estimates. |
| (c) | The Fund’s portfolio holdings are subject to change without notice. The mention of specific securities is not a recommendation or solicitation for any person to buy, sell, or hold any particular security. |
PAGE 5 § DODGE & COX INTERNATIONAL STOCK FUND
| | |
| PORTFOLIO OF INVESTMENTS (unaudited) | | June 30, 2009 |
| | | | | |
| COMMON STOCKS: 94.0% | | | | |
| | |
| | | SHARES | | VALUE |
| CONSUMER DISCRETIONARY: 16.1% | | | |
AUTOMOBILES & COMPONENTS: 3.4% | | | |
Bayerische Motoren Werke AG (Germany) | | 6,221,100 | | $ | 234,952,812 |
Honda Motor Co., Ltd. ADR (Japan) | | 10,428,400 | | | 285,425,308 |
NGK Spark Plug Co., Ltd.(b) (Japan) | | 16,918,000 | | | 160,780,603 |
Yamaha Motor Co., Ltd.(b) (Japan) | | 23,980,000 | | | 264,834,524 |
| | | | | |
| | | | | 945,993,247 |
CONSUMER DURABLES & APPAREL: 4.1% | | | |
Consorcio Ara SAB de CV(a),(b) (Mexico) | | 113,420,000 | | | 49,353,301 |
Corporacion Geo SAB de CV, Series B(a),(b) (Mexico) | | 47,605,400 | | | 91,969,804 |
LG Electronics, Inc. (South Korea) | | 1,913,487 | | | 174,817,430 |
Panasonic Corp. (Japan) | | 29,743,072 | | | 398,946,206 |
Sony Corp. (Japan) | | 17,008,800 | | | 439,378,570 |
| | | | | |
| | | | | 1,154,465,311 |
CONSUMER SERVICES: 0.6% | | | | | |
Accor SA (France) | | 4,500,000 | | | 178,944,541 |
| | |
MEDIA: 7.4% | | | | | |
Grupo Televisa SA ADR(b) (Mexico) | | 31,930,592 | | | 542,820,064 |
Liberty Global, Inc., Series A(a) (United States) | | 3,201,805 | | | 50,876,681 |
Liberty Global, Inc., Series C(a) (United States) | | 3,534,971 | | | 55,887,892 |
Naspers, Ltd.(b) (South Africa) | | 35,140,895 | | | 926,159,589 |
News Corp., Class A (United States) | | 41,644,892 | | | 379,384,966 |
Television Broadcasts, Ltd.(b) (Hong Kong) | | 27,299,300 | | | 106,608,940 |
| | | | | |
| | | | | 2,061,738,132 |
RETAILING: 0.6% | | | | | |
Belle International Holdings, Ltd. (Hong Kong) | | 81,406,000 | | | 70,524,976 |
Li & Fung, Ltd. (Hong Kong) | | 33,046,000 | | | 87,698,035 |
| | | | | |
| | | | | 158,223,011 |
| | | | | |
| | | | | 4,499,364,242 |
| CONSUMER STAPLES: 1.5% | | | | | |
FOOD, BEVERAGE & TOBACCO: 1.4% | | | |
Anadolu Efes Biracilik ve Malt Sanayii AS(b) (Turkey) | | 28,306,443 | | | 254,368,736 |
Tiger Brands, Ltd. (South Africa) | | 7,072,043 | | | 132,305,013 |
| | | | | |
| | | | | 386,673,749 |
HOUSEHOLD & PERSONAL PRODUCTS: 0.1% |
Aderans Holdings Co., Ltd.(b) (Japan) | | 3,537,000 | | | 41,645,514 |
| | | | | |
| | | | | 428,319,263 |
| ENERGY: 8.0% | | | | | |
OAO Lukoil ADR (Russia) | | 11,226,500 | | | 501,580,239 |
Royal Dutch Shell PLC ADR (United Kingdom) | | 9,518,400 | | | 477,728,496 |
Schlumberger, Ltd. (United States) | | 12,750,396 | | | 689,923,928 |
| | | | | |
| | |
| | | SHARES | | VALUE |
StatoilHydro ASA ADR (Norway) | | 5,007,289 | | $ | 98,994,103 |
Total SA (France) | | 8,682,000 | | | 470,235,796 |
| | | | | |
| | | | | 2,238,462,562 |
| FINANCIALS: 23.4% | | | | | |
BANKS: 15.2% | | | | | |
Bangkok Bank PCL Foreign (Thailand) | | 38,571,900 | | | 125,840,336 |
Bangkok Bank PCL NVDR (Thailand) | | 5,075,000 | | | 15,968,999 |
Grupo Financiero Banorte SAB de CV (Mexico) | | 54,228,000 | | | 131,366,977 |
HSBC Holdings PLC (United Kingdom) | | 81,665,764 | | | 677,957,954 |
ICICI Bank, Ltd. (India) | | 15,195,668 | | | 229,458,159 |
ICICI Bank, Ltd. ADR (India) | | 4,300,000 | | | 126,850,000 |
Kasikornbank PCL Foreign (Thailand) | | 108,446,527 | | | 228,640,904 |
Mitsubishi UFJ Financial Group (Japan) | | 25,799,900 | | | 158,596,963 |
Royal Bank of Scotland Group PLC(a) (United Kingdom) | | 344,885,647 | | | 219,321,600 |
Standard Bank Group, Ltd. (South Africa) | | 54,929,417 | | | 632,835,408 |
Standard Chartered PLC (United Kingdom) | | 37,638,851 | | | 708,912,326 |
The Bank of Yokohama, Ltd.(b) (Japan) | | 30,265,000 | | | 161,197,854 |
Unicredit SPA (Italy) | | 239,139,310 | | | 612,666,770 |
Yapi ve Kredi Bankasi AS(a) (Turkey) | | 143,779,068 | | | 211,350,004 |
| | | | | |
| | | | | 4,240,964,254 |
DIVERSIFIED FINANCIALS: 3.2% | | | | | |
Credit Suisse Group AG (Switzerland) | | 14,063,000 | | | 641,971,245 |
Haci Omer Sabanci Holding AS (Turkey) | | 88,489,354 | | | 237,217,974 |
| | | | | |
| | | | | 879,189,219 |
INSURANCE: 3.1% | | | | | |
AEGON NV(a) (Netherlands) | | 42,517,075 | | | 261,507,075 |
Swiss Life Holding (Switzerland) | | 1,520,000 | | | 131,949,098 |
Swiss Reinsurance Co. (Switzerland) | | 12,091,868 | | | 400,064,775 |
Tokio Marine Holdings, Inc. (Japan) | | 3,001,500 | | | 82,435,233 |
| | | | | |
| | | | | 875,956,181 |
REAL ESTATE: 1.9% | | | | | |
Hang Lung Group, Ltd. (Hong Kong) | | 51,796,500 | | | 244,817,799 |
Hang Lung Properties, Ltd. (Hong Kong) | | 76,679,000 | | | 248,677,812 |
Link Real Estate Investment Co. (Hong Kong) | | 18,729,500 | | | 39,930,587 |
| | | | | |
| | | | | 533,426,198 |
| | | | | |
| | | | | 6,529,535,852 |
| | |
| See accompanying Notes to Financial Statements | | DODGE & COX INTERNATIONAL STOCK FUND §PAGE 6 |
| | |
| PORTFOLIO OF INVESTMENTS (unaudited) | | June 30, 2009 |
| | | | | |
| COMMON STOCKS: (continued) |
| | |
| | | SHARES | | VALUE |
| HEALTH CARE: 11.6% | | | | | |
HEALTH CARE EQUIPMENT & SERVICES: 1.5% |
Covidien PLC (Ireland) | | 6,949,974 | | $ | 260,207,026 |
Mediceo Paltac Holdings Co., Ltd.(b) (Japan) | | 12,777,200 | | | 146,206,403 |
| | | | | |
| | | | | 406,413,429 |
PHARMACEUTICALS, BIOTECHNOLOGY & LIFE
SCIENCES: 10.1% |
Adcock Ingram Holdings, Ltd.(a) (South Africa) | | 7,047,217 | | | 38,960,809 |
Bayer AG (Germany) | | 9,417,000 | | | 505,655,547 |
GlaxoSmithKline PLC ADR (United Kingdom) | | 17,213,749 | | | 608,333,890 |
Novartis AG ADR (Switzerland) | | 20,820,000 | | | 849,247,800 |
Roche Holding AG (Switzerland) | | 2,750,000 | | | 374,134,069 |
Sanofi-Aventis (France) | | 7,655,500 | | | 450,229,037 |
| | | | | |
| | | | | 2,826,561,152 |
| | | | | |
| | | | | 3,232,974,581 |
| INDUSTRIALS: 9.2% | | | | | |
CAPITAL GOODS: 8.2% | | | | | |
Koninklijke Philips Electronics NV (Netherlands) | | 25,035,000 | | | 462,929,947 |
Mitsubishi Electric Corp.(a) (Japan) | | 56,110,000 | | | 353,052,472 |
Nexans SA (France) | | 932,619 | | | 49,714,852 |
Schneider Electric SA (France) | | 9,196,165 | | | 703,319,360 |
Toto, Ltd.(b) (Japan) | | 16,637,000 | | | 115,981,423 |
Tyco International, Ltd. (Switzerland) | | 8,820,020 | | | 229,144,120 |
Volvo AB, Class B (Sweden) | | 42,607,200 | | | 264,023,895 |
Wienerberger AG(a),(b) (Austria) | | 9,167,876 | | | 113,977,302 |
| | | | | |
| | | | | 2,292,143,371 |
COMMERCIAL SERVICES & SUPPLIES: 0.4% | | | |
Experian PLC (United Kingdom) | | 14,904,238 | | | 111,696,319 |
| | |
TRANSPORTATION: 0.6% | | | | | |
TNT NV (Netherlands) | | 8,396,195 | | | 163,536,797 |
| | | | | |
| | | | | 2,567,376,487 |
| INFORMATION TECHNOLOGY: 11.8% |
SEMICONDUCTORS & SEMICONDUCTOR
EQUIPMENT: 1.5% |
Chartered Semiconductor Manufacturing, Ltd.(a),(b) (Singapore) | | 78,361,836 | | | 110,393,616 |
Infineon Technologies AG(a),(b) (Germany) | | 84,902,800 | | | 308,225,148 |
| | | | | |
| | | | | 418,618,764 |
TECHNOLOGY, HARDWARE & EQUIPMENT: 10.3% |
Alcatel-Lucent(a) (France) | | 94,519,072 | | | 238,169,604 |
Brother Industries, Ltd.(b) (Japan) | | 23,101,000 | | | 203,923,526 |
Fujifilm Holdings Corp. (Japan) | | 14,186,100 | | | 447,548,508 |
Fujitsu, Ltd. (Japan) | | 41,981,000 | | | 227,483,973 |
Hitachi, Ltd.(a) (Japan) | | 26,658,000 | | | 82,565,961 |
Kyocera Corp. (Japan) | | 7,253,900 | | | 544,147,401 |
| | | | | |
| | |
| | | SHARES | | VALUE |
Murata Manufacturing Co., Ltd. (Japan) | | 1,901,000 | | $ | 80,572,960 |
Nokia Oyj (Finland) | | 43,192,500 | | | 630,336,864 |
Telefonaktiebolaget LM Ericsson (Sweden) | | 28,943,000 | | | 283,098,909 |
Tyco Electronics, Ltd. (Switzerland) | | 6,999,097 | | | 130,113,213 |
| | | | | |
| | | | | 2,867,960,919 |
| | | | | |
| | | | | 3,286,579,683 |
| MATERIALS: 9.0% | | | | | |
Akzo Nobel NV (Netherlands) | | 5,876,290 | | | 258,586,445 |
Arkema(b) (France) | | 7,042,821 | | | 165,483,001 |
BHP Billiton PLC (United Kingdom) | | 12,106,000 | | | 273,450,598 |
Cemex SAB de CV ADR(a) (Mexico) | | 33,105,882 | | | 309,208,938 |
Lafarge SA(b) (France) | | 13,834,291 | | | 930,063,080 |
Lanxess AG(b) (Germany) | | 9,589,784 | | | 237,890,384 |
Makhteshim-Agan Industries, Ltd. (Israel) | | 11,450,458 | | | 56,449,528 |
Norsk Hydro ASA(a) (Norway) | | 32,634,600 | | | 168,377,514 |
Norsk Hydro ASA ADR(a) (Norway) | | 21,990,500 | | | 112,811,265 |
| | | | | |
| | | | | 2,512,320,753 |
| TELECOMMUNICATION SERVICES: 3.4% |
Bezeq Israeli Telecommunication Corp., Ltd. (Israel) | | 20,575,685 | | | 37,967,317 |
Millicom International Cellular SA(a) (Luxembourg) | | 318,000 | | | 17,890,680 |
PT Telekomunik Indonesia ADR (Indonesia) | | 10,003,047 | | | 299,891,349 |
Telefonica SA ADR (Spain) | | 8,667,400 | | | 588,429,786 |
| | | | | |
| | | | | 944,179,132 |
| | | | | |
TOTAL COMMON STOCKS
(Cost $37,355,989,917) | | | | $ | 26,239,112,555 |
| | | | | |
| |
| PREFERRED STOCKS: 2.8% | | |
| CONSUMER DISCRETIONARY: 0.7% | | | |
MEDIA: 0.7% | | | | | |
Net Servicos de Comunicacao SA ADR(a) (Brazil) | | 21,930,988 | | | 213,607,823 |
| | |
| ENERGY: 2.1% | | | | | |
Petroleo Brasileiro SA ADR (Brazil) | | 11,841,800 | | | 395,042,448 |
Ultrapar Participacoes SA ADR (Brazil) | | 5,914,832 | | | 187,086,136 |
| | | | | |
| | | | | 582,128,584 |
| | | | | |
TOTAL PREFERRED STOCKS
(Cost $454,911,800) | | | | $ | 795,736,407 |
| | | | | |
| | |
| PAGE 7 § DODGE & COX INTERNATIONAL STOCK FUND | | See accompanying Notes to Financial Statements |
| | |
| PORTFOLIO OF INVESTMENTS (unaudited) | | June 30, 2009 |
| | | | | | | |
| SHORT-TERM INVESTMENTS: 2.8% | | | |
| | |
| | | PAR VALUE | | | VALUE |
MONEY MARKET FUND: 0.3% | | | | | | | |
SSgA Prime Money Market Fund | | $ | 84,254,477 | | | $ | 84,254,477 |
| |
REPURCHASE AGREEMENT: 2.5% | | | | |
Fixed Income Clearing Corporation(c) 0.03%, 7/1/09, maturity value $690,330,575 | | | 690,330,000 | | | | 690,330,000 |
| | | | | | | |
TOTAL SHORT-TERM INVESTMENTS
(Cost $774,584,477) | | | $ | 774,584,477 |
| | | | | | | |
TOTAL INVESTMENTS
(Cost $38,585,486,194) | | | 99.6 | % | | $ | 27,809,433,439 |
OTHER ASSETS LESS LIABILITIES | | | 0.4 | % | | | 100,000,669 |
| | | | | | | |
| NET ASSETS | | | 100.0 | % | | $ | 27,909,434,108 |
| | | | | | | |
| (b) | See Note 8 regarding holdings of 5% voting securities |
| (c) | Repurchase agreement is collateralized by Federal Home Loan Bank 1.25%-5.125%, 8/13/10-1/21/11; and Freddie Mac, 1.45%-6.875%, 9/10/10-2/24/11. Total collateral value is $704,138,425. |
ADR: American Depositary Receipt
NVDR: Non Voting Depositary Receipt
| | |
| See accompanying Notes to Financial Statements | | DODGE & COX INTERNATIONAL STOCK FUND §PAGE 8 |
| | | | |
STATEMENT OF ASSETS AND LIABILITIES (unaudited) | |
| |
| | | June 30, 2009 | |
ASSETS: | | | | |
Investments, at value | | | | |
Unaffiliated issuers (cost $31,843,375,007) | | $ | 23,154,729,904 | |
Affiliated issuers (cost $6,742,111,187) | | | 4,654,703,535 | |
| | | | |
| | | 27,809,433,439 | |
Cash denominated in foreign currency (cost $9,470,856) | | | 9,494,356 | |
Receivable for investments sold | | | 60,997,061 | |
Receivable for Fund shares sold | | | 29,105,614 | |
Dividends and interest receivable | | | 68,835,090 | |
Prepaid expenses and other assets | | | 297,122 | |
| | | | |
| | | 27,978,162,682 | |
| | | | |
LIABILITIES: | | | | |
Payable for investments purchased | | | 18,212,985 | |
Payable for Fund shares redeemed | | | 25,303,626 | |
Management fees payable | | | 13,917,382 | |
Accrued foreign capital gain tax | | | 7,897,502 | |
Accrued expenses | | | 3,397,079 | |
| | | | |
| | | 68,728,574 | |
| | | | |
NET ASSETS | | $ | 27,909,434,108 | |
| | | | |
NET ASSETS CONSIST OF: | | | | |
Paid in capital | | $ | 44,527,545,610 | |
Undistributed net investment income | | | 355,987,612 | |
Accumulated net realized loss on investments | | | (6,189,427,260 | ) |
Net unrealized depreciation on investments (net of accrued foreign capital gain tax of $7,897,502) | | | (10,784,671,854 | ) |
| | | | |
| | $ | 27,909,434,108 | |
| | | | |
Fund shares outstanding (par value $0.01 each, unlimited shares authorized) | | | 1,097,767,614 | |
Net asset value per share | | | $25.42 | |
|
STATEMENT OF OPERATIONS (unaudited) | |
| | | Six Months Ended
June 30, 2009 | |
INVESTMENT INCOME: | | | | |
Dividends ( net of foreign taxes of $45,559,560) | | | | |
Unaffiliated issuers | | $ | 347,039,998 | |
Affiliated issuers | | | 47,901,419 | |
Interest | | | 714,385 | |
| | | | |
| | | 395,655,802 | |
| | | | |
EXPENSES: | | | | |
Management fees | | | 71,189,159 | |
Custody and fund accounting fees | | | 1,216,893 | |
Transfer agent fees | | | 3,252,934 | |
Professional services | | | 98,328 | |
Shareholder reports | | | 988,740 | |
Registration fees | | | 106,046 | |
Trustees’ fees | | | 73,000 | |
Miscellaneous | | | 916,432 | |
| | | | |
| | | 77,841,532 | |
| | | | |
NET INVESTMENT INCOME | | | 317,814,270 | |
| | | | |
REALIZED AND UNREALIZED GAIN/(LOSS) ON INVESTMENTS: | | | | |
Net realized gain/(loss) | | | | |
Investments in unaffiliated issuers | | | (3,625,683,174 | ) |
Investments in affiliated issuers | | | (678,273,479 | ) |
Foreign currency transactions | | | 5,250,369 | |
Net change in unrealized depreciation | | | | |
Investments (including net increase in accrued foreign capital gain tax of $7,897,502) | | | 7,601,069,089 | |
Foreign currency transactions | | | (201,350 | ) |
| | | | |
Net realized and unrealized gain | | | 3,302,161,455 | |
| | | | |
NET INCREASE IN NET ASSETS
FROM OPERATIONS | | $ | 3,619,975,725 | |
| | | | |
| | | | | | | | |
STATEMENT OF CHANGES IN NET ASSETS | |
| | | Six Months Ended
June 30, 2009
(unaudited) | | | Year Ended
December 31, 2008 | |
OPERATIONS: | | | | | |
Net investment income | | $ | 317,814,270 | | | $ | 1,033,080,930 | |
Net realized loss | | | (4,298,706,284 | ) | | | (1,623,823,574 | ) |
Net change in unrealized appreciation/depreciation | | | 7,600,867,739 | | | | (24,747,752,434 | ) |
| | | | | | | | |
Net increase/(decrease) in net assets from operations | | | 3,619,975,725 | | | | (25,338,495,078 | ) |
| | | | | | | | |
| |
DISTRIBUTIONS TO
SHAREHOLDERS FROM: | | | | | |
Net investment income | | | — | | | | (998,288,562 | ) |
Net realized gain | | | — | | | | (1,634,354,213 | ) |
| | | | | | | | |
Total distributions | | | — | | | | (2,632,642,775 | ) |
| | | | | | | | |
| |
FUND SHARE
TRANSACTIONS: | | | | | |
Proceeds from sale of shares | | | 3,043,602,334 | | | | 11,196,443,003 | |
Reinvestment of distributions | | | — | | | | 2,367,976,717 | |
Cost of shares redeemed | | | (3,774,506,410 | ) | | | (14,051,916,960 | ) |
| | | | | | | | |
Net decrease from Fund share transactions | | | (730,904,076 | ) | | | (487,497,240 | ) |
| | | | | | | | |
Total increase/(decrease) in net assets | | | 2,889,071,649 | | | | (28,458,635,093 | ) |
| |
NET ASSETS: | | | | | |
Beginning of period | | | 25,020,362,459 | | | | 53,478,997,552 | |
| | | | | | | | |
End of period (including undistributed net investment income of $355,987,612 and $38,173,342, respectively) | | $ | 27,909,434,108 | | | $ | 25,020,362,459 | |
| | | | | | | | |
| |
SHARE INFORMATION: | | | | | |
Shares sold | | | 141,137,951 | | | | 301,746,094 | |
Distributions reinvested | | | — | | | | 112,975,990 | |
Shares redeemed | | | (185,691,409 | ) | | | (434,440,065 | ) |
| | | | | | | | |
Net decrease in shares outstanding | | | (44,553,458 | ) | | | (19,717,981 | ) |
| | | | | | | | |
| | |
| PAGE 9 § DODGE & COX INTERNATIONAL STOCK FUND | | See accompanying Notes to Financial Statements |
NOTES TO FINANCIAL STATEMENTS (unaudited)
NOTE 1—ORGANIZATION AND SIGNIFICANT ACCOUNTING POLICIES
Dodge & Cox International Stock Fund (the “Fund”) is one of the series constituting the Dodge & Cox Funds (the “Trust” or the “Funds”). The Trust is organized as a Delaware statutory trust and is registered under the Investment Company Act of 1940, as amended, as a diversified, open-end management investment company. The Fund commenced operations on May 1, 2001, and seeks long-term growth of principal and income, and the Fund invests primarily in a diversified portfolio of foreign stocks. Foreign investing, especially in developing countries, has special risks such as currency and market volatility and political and social instability. These and other risk considerations are discussed in the Fund’s Prospectus.
The financial statements have been prepared in conformity with accounting principles generally accepted in the United States of America, which require the use of estimates and assumptions by management. Significant accounting policies are as follows:
Security valuation The Fund’s net assets are valued as of the close of trading on the New York Stock Exchange (NYSE), generally 4:00 p.m. Eastern Time, each day that the NYSE is open for business. Listed securities are valued at market, using the official quoted close price or the last sale on the date of determination on the principal exchange on which such securities are traded or, if not available, at the mean between the exchange listed bid and ask prices for the day. A security that is listed or traded on more than one exchange is valued at the quotation on the exchange determined to be the primary market for such security. Security values are not discounted based on the size of the Fund’s position. Short-term securities are valued at amortized cost which approximates current value.
Investments initially valued in currencies other than the U.S. dollar are converted to the U.S. dollar using prevailing exchange rates. As a result, the Fund’s net asset value (NAV) may be affected by changes in the value of currencies in relation to the U.S. dollar.
If market quotations are not readily available or if a security’s value has materially changed after the close of
the security’s primary market but before the close of trading on the NYSE, the security is valued at fair value as determined in good faith by or at the direction of the Board of Trustees. The Fund may use fair value pricing in calculating its NAV when, for example, (i) the primary market for a security is closed or if trading of a security is suspended or limited, (ii) the Fund determines that the price provided by a pricing service is inaccurate or unreliable, or (iii) the Fund determines that a significant event affecting the value of a security has occurred before the close of the NYSE but after the close of the security’s primary market. An event is considered significant if there is both an affirmative expectation that the security’s value will change in response to the event and a reasonable basis for quantifying a resulting change in value. For securities that do not trade during NYSE hours, fair value determinations are based on analyses of market movements after the close of those securities’ primary markets, and include reviews of developments in foreign markets, the performance of U.S. securities markets, and the performance of instruments trading in U.S. markets that represent foreign securities and baskets of foreign securities. Pricing services are used to obtain closing market prices and to compute certain fair value adjustments utilizing pricing models. When fair value pricing is employed, the prices of securities used by the Fund to calculate its net asset value may differ from quoted or published prices for the same securities. In addition, fair values may not reflect the price that the Fund could obtain for a security if it were to dispose of that security at the time of pricing.
Security transactions, investment income, expenses, and distributions Security transactions are recorded on the trade date. Realized gains and losses on securities sold are determined on the basis of identified cost.
Dividend income and corporate action transactions are recorded on the ex-dividend date, except for certain dividends or corporate actions from foreign securities where the ex-dividend date may have passed, which are recorded as soon as the Fund is informed of the ex-dividend date. Withholding taxes on foreign dividends
DODGE & COX INTERNATIONAL STOCK FUND §PAGE 10
NOTES TO FINANCIAL STATEMENTS (unaudited)
have been provided for in accordance with the Fund’s understanding of the applicable country’s tax rules and rates. Non-cash dividends included in dividend income, if any, are recorded at the fair market value of the securities received. Distributions received in excess of income are recorded as a reduction of cost of investments and/or realized gain. Interest income is recorded on the accrual basis.
Expenses are recorded on the accrual basis. Most expenses of the Trust can be directly attributed to a specific series. Expenses which cannot be directly attributed are allocated among the Funds in the Trust.
Distributions to shareholders are recorded on the ex-dividend date.
Repurchase agreements The Fund may enter into repurchase agreements, secured by U.S. government or agency securities, which involve the purchase of securities from a counterparty with a simultaneous commitment to resell the securities at an agreed-upon date and price. It is the Fund’s policy that its custodian take possession of the underlying collateral securities, the fair value of which exceeds the principal amount of the repurchase transaction, including accrued interest, at all times. In the event of default by the counterparty, the Fund has the contractual right to liquidate the collateral securities and to apply the proceeds in satisfaction of the obligation.
Foreign currency The Fund may enter forward foreign currency contracts to hedge portfolio positions. It may also enter spot foreign currency contracts to facilitate security transactions in foreign currency-denominated securities. Losses from these transactions may arise from unfavorable changes in currency values or if the counterparties do not perform under the contracts’ terms.
Foreign currency-denominated assets (including investment securities) and liabilities are translated into U.S. dollars each business day at the prevailing exchange rate. Purchases and sales of securities, income receipts, and expenses denominated in foreign currencies are translated into U.S. dollars at the exchange rate in effect on the transaction date.
Net realized gains and losses on foreign currency transactions arise from sales of foreign currencies and from changes in currency values between the date recorded and the related settlement/cash payment on securities transactions, dividends, and foreign currency contracts. The effects of currency rate changes on investment
securities are included with realized and unrealized gain (loss) on investments.
The Fund did not enter into any forward foreign currency contracts during the period ended June 30, 2009.
NOTE 2—VALUATION MEASUREMENTS
Various inputs are used in determining the value of the Fund’s investments and other financial instruments. These inputs are summarized in the three broad levels listed below.
| § | | Level 1: Quoted prices in active markets for identical securities |
| § | | Level 2: Other significant observable inputs (including quoted prices for similar securities, market indices, interest rates, credit risk, etc.) |
| § | | Level 3: Significant unobservable inputs (including the Fund’s own assumptions in determining the fair value of investments) |
The inputs or methodology used for valuing securities are not necessarily an indication of the risk associated with investing in those securities.
The following is a summary of the inputs used to value the Fund’s holdings as of June 30, 2009:
| | | | | | |
| Security Classification(a) | | LEVEL 1
(Quoted Prices) | | LEVEL 2
(Other Significant
Observable Inputs) |
Common Stocks | | | | | | |
Consumer Discretionary | | $ | 1,455,718,016 | | $ | 3,043,646,226 |
Consumer Staples | | | — | | | 428,319,263 |
Energy | | | 1,266,646,527 | | | 971,816,035 |
Financials | | | 258,216,977 | | | 6,271,318,875 |
Health Care | | | 1,717,788,716 | | | 1,515,185,865 |
Industrials | | | 229,144,120 | | | 2,338,232,367 |
Information Technology | | | 130,113,213 | | | 3,156,466,470 |
Materials | | | 422,020,203 | | | 2,090,300,550 |
Telcommunication Services | | | 906,211,815 | | | 37,967,317 |
Preferred Stocks | | | 795,736,407 | | | — |
Money Market Investments | | | 84,254,477 | | | — |
Repurchase Agreements | | | — | | | 690,330,000 |
| | | | | | |
Total | | $ | 7,265,850,471 | | $ | 20,543,582,968 |
| | | | | | |
| | | | | | | |
| (a) | At June 30, 2009 the Fund held no securities that were considered to be “Level 3” securities (those valued using significant unobservable inputs). |
PAGE 11 § DODGE & COX INTERNATIONAL STOCK FUND
NOTES TO FINANCIAL STATEMENTS (unaudited)
NOTE 3—RELATED PARTY TRANSACTIONS
Management fees Under a written agreement approved by a unanimous vote of the Board of Trustees, the Fund pays an annual management fee of 0.60% of the Fund’s average daily net assets to Dodge & Cox, investment manager of the Fund.
Fund officers and trustees All officers and three of the trustees of the Trust are officers or employees of Dodge & Cox. The Trust pays a fee only to those trustees who are not affiliated with Dodge & Cox.
Indemnification Under the Trust’s organizational documents, its officers and trustees are indemnified against certain liabilities arising out of the performance of their duties to the Trust. In addition, in the normal course of business the Trust enters into contracts that provide general indemnities to other parties. The Trust’s maximum exposure under these arrangements is unknown as this would involve future claims that may be made against the Trust that have not yet occurred.
NOTE 4—INCOME TAX INFORMATION AND DISTRIBUTIONS TO SHAREHOLDERS
A provision for federal income taxes is not required since the Fund intends to continue to qualify as a regulated investment company under Subchapter M of the Internal Revenue Code and distribute all of its taxable income to shareholders. Distributions are determined in accordance with income tax regulations, which may differ from net investment income and realized gains for financial reporting purposes. Financial reporting records are adjusted for permanent book/tax differences to reflect tax character.
Certain foreign countries impose a tax on capital gains which is accrued by the Fund based on unrealized appreciation, if any, on affected securities. The tax is paid when a gain is realized on the sale of affected securities.
Book/tax differences are primarily due to differing treatments of wash sales, net short-term realized gain (loss) on investments, and foreign currency realized gain/(loss). At June 30, 2009, the cost of investments for federal income tax purposes was $38,672,341,304.
Distributions during the six months ended June 30, 2009 and for the year ended December 31, 2008 were characterized as follows for federal income tax purpose.
| | | | |
| | | Six Months Ended
June 30, 2009 | | Year Ended
December 31, 2008 |
Ordinary income | | — | | $1,043,595,329 |
| | | | ($1.000 per share) |
Long-term capital gain | | — | | $1,589,047,446 |
| | | | ($1.522 per share) |
At June 30, 2009, the tax basis components of distributable earnings were as follows:
| | | | |
Unrealized appreciation | | $ | 1,523,570,281 | |
Unrealized depreciation | | | (12,395,097,246 | ) |
| | | | |
Net unrealized depreciation | | | (10,871,526,965 | ) |
Undistributed ordinary income | | | 355,987,612 | |
Accumulated capital loss(a) | |
| (6,102,572,149
| )
|
| (a) | Represents capital loss realized for tax purposes during the period from January 1, 2009 to June 30, 2009. |
Fund management has reviewed the tax positions for open periods (for Federal purposes, three years from the date of filing and for State purposes, four years from the date of filing) as applicable to the Fund, and has determined that no provision for income tax is required in the Fund’s financial statements.
NOTE 5—COMMITTED LINE OF CREDIT
The Fund participates with the Funds in a $200 million committed credit facility (“Line of Credit”) with State Street Bank and Trust Company to be utilized for temporary or emergency purposes to fund shareholder redemptions or for other short-term liquidity purposes. Interest on borrowings is charged at the prevailing rate. There were no borrowings on the Line of Credit during the period.
NOTE 6—PURCHASES AND SALES OF INVESTMENTS
For the six months ended June 30, 2009, purchases and sales of securities, other than short-term securities, aggregated $2,186,720,201 and $2,952,640,845, respectively.
DODGE & COX INTERNATIONAL STOCK FUND §PAGE 12
NOTES TO FINANCIAL STATEMENTS (unaudited)
NOTE 7—SUBSEQUENT EVENTS
Fund management has determined that no material events or transactions occurred subsequent to June 30, 2009 and through August 11, 2009, the date of the Fund’s financial
statements issuance, which require additional disclosure in the Fund’s financial statements.
NOTE 8—HOLDINGS OF 5% VOTING SECURITIES
Each of the companies listed below was considered to be an affiliate of the Fund because the Fund owned 5% or more of the company’s voting securities during all or part of the six-month period ended June 30, 2009. Purchase and sale transactions and dividend income earned during the period on these securities were as follows:
| | | | | | | | | | | | | | | | | |
| | | Shares at
Beginning of Period | | Additions | | Reductions | | | Shares at
End of Period | | Dividend
Income(a) | | | Value at
End of Period | |
Aderans Holdings Co., Ltd. (Japan) | | 4,037,000 | | — | | (500,000 | ) | | 3,537,000 | | | 577,741 | | | $ | 41,645,514 | |
Anadolu Efes Biracilik ve Malt Sanayii AS (Turkey) | | 29,464,582 | | — | | (1,158,139 | ) | | 28,306,443 | | | 3,972,230 | | | | 254,368,736 | |
Arkema (France) | | 6,626,740 | | 416,081 | | — | | | 7,042,821 | | | 4,818,561 | | | | 165,483,001 | |
Brother Industries, Ltd. (Japan) | | 23,601,000 | | — | | (500,000 | ) | | 23,101,000 | | | 2,611,631 | | | | 203,923,526 | |
Chartered Semiconductor Manufacturing, Ltd. (Singapore) | | 200,000,000 | | 583,618,364 | | (705,256,528 | )(d) | | 78,361,836 | | | — | (b) | | | 110,393,616 | |
Consorcio Ara SAB de CV (Mexico) | | 113,420,000 | | — | | — | | | 113,420,000 | | | — | (b) | | | 49,353,301 | |
Corporacion Geo SAB de CV, Series B (Mexico) | | 47,605,400 | | — | | — | | | 47,605,400 | | | — | (b) | | | 91,969,804 | |
Grupo Televisa SA, ADR (Mexico) | | 32,779,396 | | — | | (848,804 | ) | | 31,930,592 | | | 20,903,075 | | | | 542,820,064 | |
Infineon Technologies AG (Germany) | | 84,902,800 | | — | | — | | | 84,902,800 | | | — | (b) | | | 308,225,148 | |
Lafarge SA (France) | | 9,120,225 | | 4,714,066 | | — | | | 13,834,291 | | | — | | | | 930,063,080 | |
Lanxess AG (Germany) | | 8,912,359 | | 677,425 | | — | | | 9,589,784 | | | 5,436,389 | | | | 237,890,384 | |
Mediceo Paltac Holdings Co., Ltd. (Japan) | | 19,438,000 | | — | | (6,660,800 | ) | | 12,777,200 | | | 1,000,462 | | | | 146,206,403 | |
Naspers, Ltd. (South Africa) | | 37,040,895 | | — | | (1,900,000 | ) | | 35,140,895 | | | — | | | | 926,159,589 | |
NGK Spark Plug Co., Ltd. (Japan) | | 17,500,000 | | — | | (582,000 | ) | | 16,918,000 | | | — | | | | 160,780,603 | |
Television Broadcasts, Ltd. (Hong Kong) | | 27,299,300 | | — | | — | | | 27,299,300 | | | 4,931,423 | | | | 106,608,940 | |
The Bank of Yokohama, Ltd. (Japan) | | 70,029,000 | | — | | (39,764,000 | ) | | 30,265,000 | | | 2,470,532 | | | | — | (c) |
Thomson (France) | | 25,015,792 | | — | | (25,015,792 | ) | | — | | | — | | | | — | |
Toto, Ltd. (Japan) | | 28,511,000 | | — | | (11,874,000 | ) | | 16,637,000 | | | 1,179,375 | | | | — | (c) |
Wienerberger AG (Austria) | | 9,397,376 | | — | | (229,500 | ) | | 9,167,876 | | | — | (b) | | | 113,977,302 | |
Yamaha Motor Co., Ltd. (Japan) | | 23,253,000 | | 1,000,000 | | (273,000 | ) | | 23,980,000 | | | — | | | | 264,834,524 | |
| | | | | | | | | | | | | | | | | |
| | | | | | | | | | | $ | 47,901,419 | | | $ | 4,654,703,535 | |
| | | | | | | | | | | | | | | | | |
| | | | | | | | | | | | | | | | | | |
| (a) | Net of foreign taxes, if any |
| (c) | Company was not an affiliate at the end of the period |
| (d) | Represents a reduction in shares resulting from a 1 for 10 reverse stock split on May 18, 2009. |
PAGE 13 § DODGE & COX INTERNATIONAL STOCK FUND
FINANCIAL HIGHLIGHTS
| | | | | | | | | | | | | | | | | | |
SELECTED DATA AND RATIOS (for a share outstanding throughout each period) | | Six Months
Ended June 30, | | | Year Ended December 31, | |
| | | 2009(a) | | | 2008 | | | 2007 | | | 2006 | | | 2005 | | | 2004 | |
| | | | | | |
Net asset value, beginning of period | | $21.90 | | | $46.02 | | | $43.66 | | | $35.03 | | | $30.64 | | | $23.48 | |
Income from investment operations: | | | | | | | | | | | | | | | | | | |
Net investment income | | 0.29 | | | 0.97 | | | 1.25 | | | 0.57 | | | 0.33 | | | 0.26 | |
Net realized and unrealized gain/(loss) | | 3.23 | | | (22.57 | ) | | 3.87 | | | 9.24 | | | 4.80 | | | 7.36 | |
| | | | | | |
Total from investment operations | | 3.52 | | | (21.60 | ) | | 5.12 | | | 9.81 | | | 5.13 | | | 7.62 | |
| | | | | | |
Distributions to shareholders from: | | | | | | | | | | | | | | | | | | |
Net investment income | | — | | | (0.94 | ) | | (1.26 | ) | | (0.56 | ) | | (0.35 | ) | | (0.24 | ) |
Net realized gain | | — | | | (1.58 | ) | | (1.50 | ) | | (0.62 | ) | | (0.39 | ) | | (0.22 | ) |
| | | | | | |
Total distributions | | — | | | (2.52 | ) | | (2.76 | ) | | (1.18 | ) | | (0.74 | ) | | (0.46 | ) |
| | | | | | |
Net asset value, end of period | | $25.42 | | | $21.90 | | | $46.02 | | | $43.66 | | | $35.03 | | | $30.64 | |
| | | | | | |
Total return | | 16.07 | % | | (46.68 | )% | | 11.71 | % | | 28.00 | % | | 16.74 | % | | 32.46 | % |
Ratios/supplemental data: | | | | | | | | | | | | | | | | | | |
Net assets, end of period (millions) | | $27,909 | | | $25,020 | | | $53,479 | | | $30,899 | | | $13,357 | | | $4,203 | |
Ratio of expenses to average net assets | | 0.66 | %(b) | | 0.64 | % | | 0.65 | % | | 0.66 | % | | 0.70 | % | | 0.77 | % |
Ratio of net investment income to average net assets | | 2.68 | %(b) | | 2.37 | % | | 3.11 | % | | 1.82 | % | | 1.54 | % | | 1.90 | % |
Portfolio turnover rate | | 9 | % | | 35 | % | | 16 | % | | 9 | % | | 7 | % | | 6 | % |
See accompanying Notes to Financial Statements
FUND HOLDINGS
The Fund provides a complete list of its holdings four times each fiscal year, as of the end of each quarter. The lists appear in the Fund’s First Quarter, Semi-Annual, Third Quarter and Annual Reports to shareholders. The Fund files the lists with the Securities and Exchange Commission (SEC) on Form N-CSR (second and fourth quarters) and Form N-Q (first and third quarters). Shareholders may view the Fund’s Forms N-CSR and N-Q on the SEC’s website at www.sec.gov. Forms N-CSR and N-Q may also be reviewed and copied at the SEC’s Public Reference Room in Washington, DC. Information regarding the operations of the Public Reference Room may be obtained by 1-202-942-8090 (direct) or
1-800-732-0330 (general SEC number). A complete list of the Fund’s quarter-end holdings is also available at www.dodgeandcox.com on or about 15 days following each quarter end and remains available on the web site until the list is updated in the subsequent quarter.
PROXY VOTING
For a free copy of the Fund’s proxy voting policies and procedures, please call 1-800-621-3979, visit the Fund’s web site at www.dodgeandcox.com or visit the SEC’s web site at www.sec.gov. Information regarding how the Fund voted proxies relating to portfolio securities during the most recent 12-month period ending June 30 is also available at www.dodgeandcox.com or at www.sec.gov.
DODGE & COX INTERNATIONAL STOCK FUND §PAGE 14
DODGE & COX FUNDS—EXECUTIVE OFFICER & TRUSTEE INFORMATION
| | | | | | |
Name (Age) and
Address* | | Position with Trust
(Year of Election or
Appointment) | | Principal Occupation During Past 5 Years | | Other Directorships Held by Trustees |
| INTERESTED TRUSTEES & OFFICERS |
| John A. Gunn (65) | | Chairman and Trustee
(Trustee since 1985) | | Chairman (since 2007), Chief Executive Officer (since 2005) and Director of Dodge & Cox, Portfolio Manager and member of Investment Policy Committee (IPC), Global Investment Policy Committee (GIPC) (since 2008), and International Investment Policy Committee (IIPC) | | — |
| Kenneth E. Olivier (57) | | President and Trustee (Trustee since 2005) | | President (since 2005) and Director of Dodge & Cox, Portfolio Manager, and member of IPC | | — |
| Dana M. Emery (47) | | Senior Vice President and Trustee (Trustee since 1993) | | Executive Vice President (since 2005) and Director of Dodge & Cox, Manager of the Fixed Income Department, Portfolio Manager, and member of Fixed Income Investment Policy Committee (FIIPC) | | — |
| Charles F. Pohl (51) | | Senior Vice President
(Officer since 2004) | | Senior Vice President and Director of Dodge & Cox, Chief Investment Officer (since 2007), Director of Credit Research, Portfolio Manager, Investment Analyst, and member of IPC, GIPC (since 2008), IIPC (since 2007), and FIIPC | | — |
| Diana S. Strandberg (49) | | Senior Vice President
(Officer since 2005) | | Vice President of Dodge & Cox, Portfolio Manager, and member of IPC, GIPC (since 2008), and IIPC | | — |
| David H. Longhurst (52) | | Treasurer
(Officer since 2006) | | Vice President and Assistant Treasurer of Dodge & Cox (since 2008); Vice President, Treasurer, Controller and Secretary of Safeco Mutual Funds, Safeco Asset Management Company, Safeco Services, Safeco Securities, and Safeco Investment Services (2000-2004) | | — |
| Thomas M. Mistele (55) | | Secretary
(Officer since 2000) | | Chief Operating Officer (since 2004), Director (since 2005), Secretary, and General Counsel of Dodge & Cox | | — |
| Marcia P. Venegas (40) | | Chief Compliance Officer
(Officer since 2004) | | Associate Chief Compliance Officer of Dodge & Cox (since 2008), Chief Compliance Officer of Dodge & Cox (2005-2008), Compliance Officer of Dodge & Cox (2003-2004) | | — |
| INDEPENDENT TRUSTEES |
| William F. Ausfahl (69) | | Trustee (Since 2002) | | CFO, The Clorox Co. (1982-1997); Director, The Clorox Co. (1984-1997) | | — |
| L. Dale Crandall (67) | | Trustee (Since 1999) | | President, Kaiser Foundation Health Plan, Inc. and Kaiser Foundation Hospitals (2000-2002); Senior Vice President—Finance and Administration & CFO, Kaiser Foundation Health Plan, Inc. and Kaiser Foundation Hospitals (1998-2000) | | Director, Ansell Limited (medical equipment and supplies) (2002-Present); Director, Coventry Health Care, Inc. (managed health care) (2004-Present); Director, Metavante Technologies, Inc. (software) (2007 to present) |
| Thomas A. Larsen (59) | | Trustee (Since 2002) | | Director in Howard, Rice, Nemerovski, Canady, Falk & Rabkin (law firm) | | — |
John B. Taylor (62) | | Trustee (Since 2005) | | Professor of Economics, Stanford University; Senior Fellow, Hoover Institution; Under Secretary for International Affairs, United States Treasury (2001-2005) | | — |
| Will C. Wood (69) | | Trustee (Since 1992) | | Principal, Kentwood Associates, Financial Advisers | | Director, Banco Latinoamericano de Exportaciones S.A. (Latin American foreign trade bank) (1999-Present) |
| * | | The address for each Officer and Trustee is 555 California Street, 40th Floor, San Francisco, California 94104. Each Officer and Trustee oversees all five series in the Dodge & Cox Funds complex and serves for an indefinite term. |
Additional information about the Trust’s Trustees and Officers is available in the Trust’s Statement of Additional Information (SAI). You can get a free copy of the SAI by visiting the Fund’s website at www.dodgeandcox.com or calling 1-800-621-3979.
PAGE 15 § DODGE & COX INTERNATIONAL STOCK FUND
| | | | |
| | | | |
www.dodgeandcox.com
For Fund literature, transactions, and account information, please visit the Funds’ web site.
or write or call:
DODGE & COX FUNDS
c/o Boston Financial Data Services
P.O. Box 8422
Boston, Massachusetts 02266-8422
(800) 621-3979
INVESTMENT MANAGER
Dodge & Cox
555 California Street, 40th Floor
San Francisco, California 94104
(415) 981-1710
This report is submitted for the general information of the shareholders of the Fund. The report is not authorized for distribution to prospective investors in the Fund unless it is accompanied by a current prospectus.
This report reflects our views, opinions, and portfolio holdings as of June 30, 2009, the end of the reporting period. Any such views are subject to change at any time based upon market or other conditions and Dodge & Cox disclaims any responsibility to update such views. These views may not be relied on as investment advice and, because investment decisions for a Dodge & Cox Fund are based on numerous factors, may not be relied on as an indication of trading intent on behalf of any Dodge & Cox Fund.
6/09 BF SAR Printed on recycled paper
Semi-Annual Report
June 30, 2009
Balanced Fund
ESTABLISHED 1931
TICKER: DODBX
TO OUR SHAREHOLDERS
The Dodge & Cox Balanced Fund had a total return of 6.6% in the first half of 2009, compared to 3.1% for the Combined Index (a 60/40 blend of stocks and fixed income securities1). Longer-term results can be found on page four. As of June 30, the Fund’s net assets of $14.1 billion were invested 70.5% in common stocks, 27.7% in fixed income securities, and 1.8% in cash. While the six-month results have improved, the Fund is still down 20.1% from one year ago, compared to down 13.9% for the Combined Index.
MARKET COMMENTARY
Broad U.S. economic conditions remained extremely weak during the first half of 2009, though nascent signs of stabilization emerged during the second quarter. The labor market continued its decline: 500,000 jobs on average were lost per month, and the unemployment rate reached a 26-year high of 9.5%. Retail sales and manufacturing sector indicators, despite recent improvements, lingered at recessionary levels. Housing market indicators recovered from all-time lows as new and existing home sales improved somewhat and lower mortgage rates prompted a surge in refinancings. Undoubtedly, the economy remains in recession. However, after a steady drumbeat of dismal economic news, the small improvements toward the end of the period raised hopes that the worst of the recession may be behind us.
U.S. policymakers worked aggressively to stabilize the financial system, improve the flow of credit, and provide a foundation for economic recovery through the implementation of several new and targeted programs. Initial investor uncertainty about the government’s plans for addressing the capital adequacy of major U.S. banks later gave way to a meaningful rally in equity and credit markets as the results of the government’s “stress tests” of bank balance sheets were better than expected. Reflecting this increased confidence and cost-cutting efforts by company managements, the S&P 500 rallied 37% from its lows on March 9. Within fixed income markets, U.S. Treasuries posted a negative return (-4.3%2) as their prices were pushed lower by a sharp reversal of the “flight to quality” that prevailed in the second half of 2008, as well as concerns over the potential effects of aggressive
fiscal and monetary policy stimulus on future inflation. In contrast, the gradual dissipation of the financial crisis and historically attractive valuations lured investors to investment-grade corporate bonds, which returned 8.3% in the first half of 2009.
INVESTMENT STRATEGY
The Fund’s margin of outperformance in the first half represents a meaningful reversal of recent performance results, particularly in 2008 when the Fund significantly lagged the Combined Index. The strong recent results were not driven by a major change in the Fund’s investment strategy, but rather by the dramatic reversal in market conditions noted above. The performance recovery does, however, serve to illustrate several hallmarks of Dodge & Cox’s investment approach, namely: a focus on valuation and fundamental analysis of the risks and opportunities of specific securities, persistence to maintain positions in the face of negative market feedback, and the importance of a long-term investment perspective.
The valuation component of our approach was particularly important as we managed the Fund through the challenges of the last two years. The Fund’s strong first half performance was driven largely by events of the second quarter, specifically a surge in the prices of corporate bonds and a strong recovery in equity markets (both areas in which the Fund holds a greater weighting than the Combined Index). It was not intuitive that equities and corporate bonds would excel in the second quarter given the U.S. economy’s struggles. However, with capital markets stabilizing and the pace of economic decline moderating, investors began to anticipate the nadir and eventual upturn of the economy. The S&P 500 fell 25% from January 1 through the recent market trough on March 9, and the equity portion of the Fund lagged the Index. We do not know why the shift in investor sentiment began on March 10, but since then the Fund’s equity portfolio has outperformed the rapidly rising S&P 500.3 This provides an excellent example of the importance of our emphasis on valuation. In this case, the valuation of equities—i.e., investor’s expectations for their future performance—at the end of the first quarter of
PAGE 1 § DODGE & COX BALANCED FUND
2009 was far too pessimistic, even considering the difficult corporate operating environment that continues now.
While we continue to be encouraged by the broad investment backdrop of low valuations and strong long-term growth drivers, the “story” year-to-date has been volatility and the re-introduction of some investor confidence. Within the Fund’s diversified portfolio of 81 common stocks, the companies that experienced the greatest drop and subsequent rise during the first six months were those companies with significant operational and financial leverage. One example is Dow Chemical Company. Dow is an asset-intensive, multinational chemical company that experienced a rapid increase in energy costs during 2008 and a dramatic drop in demand into early 2009. The company faced additional distress when financial markets froze as it was completing the $16 billion purchase of Rohm and Haas. Its stock dropped 58% from the end of 2008 through March 9, then rallied 162% through midyear, and ended the six-month period up 10%. Although the near-term profit outlook is bleak, we hold it in the Fund because this multinational is well positioned to participate in global growth over the next five years. As investors turn from fear of operational and financial risks toward more confidence in the future earnings of this strong, global franchise, we believe it remains an attractive long-term investment opportunity. The Fund holds both the common stock and several debt securities issued by Dow. We use this example to illustrate our long-term thinking and persistence in the face of dramatic short-term market volatility, not to imply that we think Dow is more attractive than the Fund’s other holdings or that it will ultimately prove profitable for the Fund.
We continue to favor equities in the Fund. In our view as long-term investors, current valuations are still compelling despite the recent run-up in prices. The equity portfolio remains well diversified, and is currently invested in many companies in the broadly defined Technology, Media, and Health Care areas. Together these holdings comprise over 60% of the equity portfolio, and we believe the holdings in these sectors offer long-term value across economic cycles. Notable investments include industry leaders Hewlett-Packard, Sony, Comcast, Time Warner, GlaxoSmithKline, Merck, Amgen, and WellPoint.
In the fixed income portfolio, we have slightly reduced the Corporate weighting in light of much higher valuations, but Corporates remain a significant portion of the fixed income portfolio at 55%. Meanwhile, Government Sponsored Enterprise (GSE)-guaranteed4 mortgage-backed securities (MBS) comprise just over one-third of the fixed income portfolio. We believe that both Corporate and GSE-MBS securities continue to offer more compelling long-term return potential than their U.S. Treasury counterparts, particularly given our concerns over potentially higher inflation with the significant monetary and fiscal policy measures in place.
IN CLOSING
Dodge & Cox’s experienced team of investment professionals is working hard to take advantage of what we believe are attractive opportunities being created during this period of economic stress. Although it is impossible to predict the short-term direction of stock and bond prices, decades of experience have taught us that persistence in the face of significant market dislocations can potentially be rewarding for patient investors with long-term investment horizons.
We appreciate the confidence you have placed in our firm and the patience you have demonstrated as a shareholder of the Dodge & Cox Balanced Fund. As always, we welcome your comments and questions.
For the Board of Trustees,
| | |

| |
|
John A. Gunn, Chairman | | Kenneth E. Olivier, President |
August 11, 2009
DODGE & COX BALANCED FUND §PAGE 2
PERFORMANCE REVIEW
The Fund outperformed the Combined Index by 3.5 percentage points in the first half. The primary driver for the Fund’s relative performance over the period was its bond holdings, which produced a 10% return despite a generally modest period for the bond market (the BCAG returned 1.9%). In the strong equity rally in the second quarter, the Fund’s higher allocation to equities than the Combined Index also benefited relative performance, and its equity portfolio significantly outperformed the S&P 500.
Equity Portfolio
| | § | | Returns from Fund holdings in the Energy sector (up 11% versus down 2% for the S&P 500 sector) contributed to relative returns. Schlumberger (up 29%) and Occidental Petroleum (up 11%) were strong. | |
| | § | | Sprint Nextel was a standout performer (up 163%) in relation to the Telecommunication Services sector return (down 4%) within the S&P 500. | |
| | § | | Individual contributors included Motorola (up 50%), Maxim Integrated Products (up 41%), Wyeth (up 23%, being acquired by Pfizer), WellPoint (up 21%), and Sony (up 19%). | |
| | § | | Weak returns from holdings in the Financials sector (down 13% versus down 2% for the S&P 500 sector) detracted, with notably poor performance from Citigroup (down 45% to date of sale) and Capital One (down 29%). | |
| | § | | A higher average weighting in the Health Care sector (28% of the equity portfolio versus 15% for the S&P 500 sector) hurt relative results, as the sector was weak. Novartis (down 15%) and Amgen (down 8%) lagged. | |
| | § | | Individual detractors included General Electric (down 25%), Xerox (down 17%), and Comcast (down 14%). | |
Fixed Income Portfolio
| | § | | A higher weighting in the Corporate sector (57% at the beginning of the year versus 18% for the BCAG) significantly added to relative returns given the sector’s very strong performance. Notably strong individual contributors included GMAC, Ford Motor Credit, Xerox, HCA, Macy’s, Boston Properties, and Dillard’s, offset somewhat from poor performance from certain financial sector holdings including Bank of America cumulative capital securities. | |
| | § | | The Fund had no holdings in the poor-performing U.S. Treasury sector (down 4.3% year-to-date) and also benefited from its substantial nominal yield advantage versus the BCAG. | |
| 1 | | The Combined Index reflects an unmanaged portfolio of 60% of the Standard & Poor’s 500 Index (S&P 500), which is a widely recognized, unmanaged index of common stock prices, and 40% of the Barclays Capital Aggregate Bond Index (BCAG), which is a widely recognized, unmanaged index of U.S. dollar-denominated investment-grade fixed-income securities. |
| 2 | | References to sector returns are measured by the Barclays Capital Indices. |
| 3 | | Past performance does not guarantee future results. |
| 4 | | The U.S. Government does not guarantee the Fund’s shares, yield and asset value. The guarantee does not eliminate market risk. |
PAGE 3 § DODGE & COX BALANCED FUND
GROWTH OF $10,000 OVER 10 YEARS
FOR AN INVESTMENT MADE ON JUNE 30, 1999
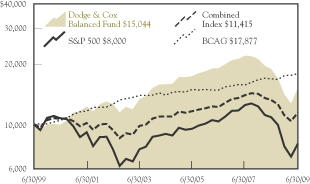
AVERAGE ANNUAL TOTAL RETURN
FOR PERIODS ENDED JUNE 30, 2009
| | | | | | | | | | | | |
| | | 1 Year | | | 5 Years | | | 10 Years | | | 20 Years | |
| | | | | | | | | | | | |
Dodge & Cox Balanced Fund | | -20.13 | % | | -1.02 | % | | 4.16 | % | | 9.03 | % |
Combined Index | | -13.91 | | | 0.89 | | | 1.33 | | | 7.77 | |
S&P 500 | | -26.22 | | | -2.24 | | | -2.22 | | | 7.77 | |
Barclays Capital Aggregate
Bond Index (BCAG) | | 6.06 | | | 5.02 | | | 5.98 | | | 7.06 | |
Past performance does not guarantee future results. Investment return and share price will fluctuate with market conditions, and investors may have a gain or loss when shares are sold. Mutual fund performance changes over time and currently may be significantly lower than stated. Performance is updated and published monthly. Visit the Fund’s web site at www.dodgeandcox.com or call 1-800-621-3979 for current performance figures.
The Fund’s total returns include the reinvestment of dividend and capital gain distributions, but have not been adjusted for any income taxes payable by shareholders on these distributions. Index returns include dividends and/or interest income but, unlike Fund returns, do not reflect fees or expenses.
Standard & Poor’s, Standard & Poor’s 500, and S&P 500® are trademarks of The McGraw-Hill Companies, Inc. Barclays Capital® is a trademark of Barclays PLC.
FUND EXPENSE EXAMPLE
As a Fund shareholder, you incur ongoing Fund costs, including management fees and other Fund expenses. All mutual funds have ongoing costs, sometimes referred to as operating expenses. The following example shows ongoing costs of investing in the Fund and can help you understand these costs and compare them with those of other mutual funds. The example assumes a $1,000 investment held for the six months indicated.
ACTUAL EXPENSES
The first line of the table below provides information about actual account values and expenses based on the Fund’s actual returns. You may use the information in this line, together with your account balance, to estimate the expenses that you paid over the period. Simply divide your account value by $1,000 (for example, an $8,600 account value divided by $1,000 = 8.6), then multiply the result by the number in the first line under the heading “Expenses Paid During Period” to estimate the expenses you paid on your account during this period.
HYPOTHETICAL EXAMPLE FOR COMPARISON WITH OTHER MUTUAL FUNDS
Information on the second line of the table can help you compare ongoing costs of investing in the Fund with those of other mutual funds. This information may not be used to estimate the actual ending account balance or expenses you paid during the period. The hypothetical “Ending Account Value” is based on the actual expense ratio of the Fund and an assumed 5% annual rate of return before expenses (not the Fund��s actual return). The amount under the heading “Expense Paid During the Period” shows the hypothetical expenses your account would have incurred under this scenario. You can compare this figure with the 5% hypothetical examples that appear in shareholder reports of other mutual funds.
| | | | | | | | | |
Six Months Ended
June 30, 2009 | | Beginning Account Value
1/1/2009 | | Ending Account Value
6/30/2009 | | Expenses Paid
During Period* |
Based on Actual Fund Return | | $ | 1,000.00 | | $ | 1,066.20 | | $ | 2.76 |
Based on Hypothetical 5% Yearly Return | | | 1,000.00 | | | 1,022.13 | | | 2.70 |
| * | | Expenses are equal to the Fund’s annualized expense ratio of 0.54%, multiplied by the average account value over the period, multiplied by 181/365 (to reflect the one-half year period). |
The expenses shown in the table highlight ongoing costs only and do not reflect any transactional fees or account maintenance fees. While other mutual funds may charge such fees, please note that the Fund does not charge transaction fees (e.g., redemption fees, sales loads) or universal account maintenance fees (e.g., small account fees).
DODGE & COX BALANCED FUND §PAGE 4
| | |
| FUND INFORMATION | | June 30, 2009 |
| | |
| GENERAL INFORMATION | | |
Net Asset Value Per Share | | $53.75 |
Total Net Assets (billions) | | $14.1 |
30-Day SEC Yield(a) | | 2.80% |
Expense Ratio (1/1/09 to 6/30/09, annualized) | | 0.54% |
Portfolio Turnover Rate (1/1/09 to 6/30/09, unannualized) | | 11% |
Fund Inception | | 1931 |
No sales charges or distribution fees | | |
Investment Manager: Dodge & Cox, San Francisco. Managed by the Investment Policy Committee, whose nine members’ average tenure at Dodge & Cox is 23 years, and by the Fixed Income Investment Policy Committee, whose nine members’ average tenure is 15 years.
| | |
| STOCK PORTFOLIO (70.5%) | | Fund |
Number of Stocks | | 81 |
Median Market Capitalization (billions) | | $14 |
Price-to-Earnings Ratio(b) | | 12.0x |
Foreign Stocks(c) | | 13.5% |
| | | |
| SECTOR DIVERSIFICATION (FIVE LARGEST) | |
Health Care | | 19.4 | % |
Information Technology | | 13.8 | |
Consumer Discretionary | | 12.7 | |
Financials | | 8.1 | |
Energy | | 7.6 | |
| | | |
| TEN LARGEST STOCKS(d) | | | |
Hewlett-Packard Co. | | 3.5 | % |
Comcast Corp. | | 2.4 | |
Schlumberger, Ltd. | | 2.4 | |
Wells Fargo & Co. | | 2.4 | |
Novartis AG (Switzerland) | | 2.4 | |
Amgen, Inc. | | 2.1 | |
Motorola, Inc. | | 2.1 | |
GlaxoSmithKline PLC (United Kingdom) | | 2.1 | |
Merck & Co., Inc. | | 2.0 | |
WellPoint, Inc. | | 2.0 | |
| | |
| FIXED INCOME PORTFOLIO (27.7%)(f) | | Fund |
Number of Fixed Income Securities(f) | | 262 |
Effective Maturity | | 6.7 years |
Effective Duration | | 4.0 years |
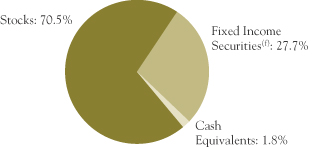
| | | |
| SECTOR DIVERSIFICATION | | | |
U.S. Treasury & Government Related | | 1.8 | % |
Mortgage-Related Securities | | 10.3 | |
Asset-Backed Securities | | 0.1 | |
Corporate(f) | | 15.5 | |
| | | |
| CREDIT QUALITY(e,f) | | | |
U.S. Government & Government Related | | 11.7 | % |
Aaa | | 0.1 | |
Aa | | 2.8 | |
A | | 2.9 | |
Baa | | 5.8 | |
Ba | | 1.7 | |
B | | 0.2 | |
Caa | | 1.5 | |
Ca | | 0.9 | |
C | | 0.1 | |
Average Quality | | A1 | |
| | | |
| CORPORATE ISSUERS (FIVE LARGEST)(d) | | | |
General Electric Co. | | 1.2 | % |
GMAC, Inc., and subsidiaries(f) | | 1.0 | |
Wells Fargo & Co. | | 1.0 | |
Ford Motor Credit Co. | | 0.9 | |
Burlington Northern Santa Fe Corp. | | 0.7 | |
| (a) | | SEC yield is an annualization of the Fund’s total net investment income per share for the 30-day period ended on the last day of the month. |
| (b) | | Price-to-earnings (P/E) ratio is calculated using 12-month forward earnings estimates. |
| (c) | | Foreign stocks are U.S. dollar-denominated. |
| (d) | | The Fund’s portfolio holdings are subject to change without notice. The mention of specific securities is not a recommendation or solicitation for any person to buy, sell, or hold any particular security. |
| (e) | | The Fund’s credit quality ratings are from Moody’s Investor Services. If no Moody’s rating is available, the Standard & Poor’s or Fitch rating is reported. If unrated, the investment manager determines a comparable rating. In calculating average quality, the investment manager assigns ratings to U.S. Government and Government Related securities that are higher than the ratings assigned to securities rated Aaa. The credit quality of the investments in the portfolio does not apply to the stability or safety of the Fund or its shares. |
| (f) | | Includes cumulative preferred stock (Preferred Blocker, Inc., a subsidiary of GMAC, Inc.) representing 0.1% of the Fund’s net assets. |
PAGE 5 § DODGE & COX BALANCED FUND
| | |
| PORTFOLIO OF INVESTMENTS (unaudited) | | June 30, 2009 |
| | | | | |
| COMMON STOCKS: 70.5% |
| | |
| | | SHARES | | VALUE |
| CONSUMER DISCRETIONARY: 12.7% |
CONSUMER DURABLES & APPAREL: 2.5% |
Panasonic Corp. ADR(b) (Japan) | | 10,598,928 | | $ | 141,919,646 |
Sony Corp. ADR(b) (Japan) | | 8,157,900 | | | 210,963,294 |
| | | | | |
| | | | | 352,882,940 |
MEDIA: 7.9% |
Comcast Corp., Class A | | 23,766,974 | | | 344,383,453 |
DISH Network Corp., Class A(a) | | 1,806,165 | | | 29,277,935 |
Interpublic Group of Companies, Inc.(a) | | 7,484,200 | | | 37,795,210 |
Liberty Entertainment, Series A(a) | | 1,958,579 | | | 52,391,988 |
Liberty Global, Inc., Series A(a) | | 264,621 | | | 4,204,828 |
Liberty Global, Inc., Series C(a) | | 391,368 | | | 6,187,528 |
News Corp., Class A | | 28,484,800 | | | 259,496,528 |
Time Warner Cable, Inc.(a) | | 3,715,583 | | | 117,672,514 |
Time Warner, Inc. | | 10,564,166 | | | 266,111,341 |
| | | | | |
| | | | | 1,117,521,325 |
RETAILING: 2.3% |
CarMax, Inc.(a) | | 3,550,000 | | | 52,185,000 |
Genuine Parts Co. | | 277,950 | | | 9,328,002 |
Home Depot, Inc. | | 6,602,200 | | | 156,009,986 |
Liberty Interactive, Series A(a) | | 10,852,250 | | | 54,369,772 |
Macy’s, Inc. | | 3,944,266 | | | 46,384,568 |
| | | | | |
| | | | | 318,277,328 |
| | | | | |
| | | | | 1,788,681,593 |
| CONSUMER STAPLES: 1.3% |
FOOD & STAPLES RETAILING: 1.2% |
Wal-Mart Stores, Inc. | | 2,388,800 | | | 115,713,472 |
Walgreen Co. | | 1,730,199 | | | 50,867,851 |
| | | | | |
| | | | | 166,581,323 |
HOUSEHOLD & PERSONAL PRODUCTS: 0.1% |
Avon Products, Inc. | | 627,516 | | | 16,177,362 |
| | | | | |
| | | | | 182,758,685 |
| ENERGY: 7.6% |
Baker Hughes, Inc. | | 4,474,510 | | | 163,051,145 |
Chevron Corp. | | 2,567,679 | | | 170,108,734 |
Occidental Petroleum Corp. | | 4,217,700 | | | 277,566,837 |
Royal Dutch Shell PLC ADR(b) (United Kingdom) | | 2,400,127 | | | 122,070,459 |
Schlumberger, Ltd. | | 6,325,421 | | | 342,268,530 |
| | | | | |
| | | | | 1,075,065,705 |
| FINANCIALS: 8.1% |
BANKS: 3.6% |
BB&T Corp. | | 3,599,184 | | | 79,110,064 |
HSBC Holdings PLC ADR(b) (United Kingdom) | | 2,263,361 | | | 94,540,589 |
Wells Fargo & Co. | | 13,909,706 | | | 337,449,468 |
| | | | | |
| | | | | 511,100,121 |
| | | | | |
| | |
| | | SHARES | | VALUE |
DIVERSIFIED FINANCIALS: 3.3% |
Bank of New York Mellon Corp. | | 2,132,000 | | $ | 62,488,920 |
Capital One Financial Corp. | | 9,552,059 | | | 208,999,051 |
Credit Suisse Group AG ADR(b) (Switzerland) | | 1,300,300 | | | 59,462,719 |
Legg Mason, Inc. | | 1,350,300 | | | 32,920,314 |
SLM Corp.(a) | | 8,096,000 | | | 83,145,920 |
State Street Corp. | | 388,600 | | | 18,341,920 |
| | | | | |
| | | | | 465,358,844 |
INSURANCE: 1.2% |
AEGON NV(a),(b) (Netherlands) | | 8,172,900 | | | 50,345,064 |
Genworth Financial, Inc., Class A(a) | | 1,949,000 | | | 13,623,510 |
Loews Corp. | | 1,183,108 | | | 32,417,159 |
The Travelers Companies, Inc. | | 1,840,219 | | | 75,522,588 |
| | | | | |
| | | | | 171,908,321 |
| | | | | |
| | | | | 1,148,367,286 |
| HEALTH CARE: 19.4% |
HEALTH CARE EQUIPMENT & SERVICES: 6.4% |
Boston Scientific Corp.(a) | | 14,777,700 | | | 149,845,878 |
Cardinal Health, Inc. | | 6,493,300 | | | 198,370,315 |
Covidien PLC(b) (Ireland) | | 2,103,200 | | | 78,743,808 |
Health Management Associates, Inc.(a) | | 1,647,563 | | | 8,138,961 |
UnitedHealth Group, Inc. | | 7,598,800 | | | 189,818,024 |
WellPoint, Inc.(a) | | 5,633,400 | | | 286,683,726 |
| | | | | |
| | | | | 911,600,712 |
PHARMACEUTICALS, BIOTECHNOLOGY & LIFE SCIENCES: 13.0% |
Amgen, Inc.(a) | | 5,721,600 | | | 302,901,504 |
GlaxoSmithKline PLC ADR(b) (United Kingdom) | | 8,300,500 | | | 293,339,670 |
Merck & Co., Inc. | | 10,308,400 | | | 288,222,864 |
Novartis AG ADR(b) (Switzerland) | | 8,218,300 | | | 335,224,457 |
Pfizer, Inc. | | 14,657,117 | | | 219,856,755 |
Sanofi-Aventis ADR(b) (France) | | 5,739,100 | | | 169,246,059 |
Thermo Fisher Scientific, Inc.(a) | | 225,050 | | | 9,175,289 |
Wyeth | | 4,772,800 | | | 216,637,392 |
| | | | | |
| | | | | 1,834,603,990 |
| | | | | |
| | | | | 2,746,204,702 |
| INDUSTRIALS: 4.8% |
CAPITAL GOODS: 2.9% |
Caterpillar, Inc. | | 1,300,000 | | | 42,952,000 |
Eaton Corp. | | 1,650,000 | | | 73,606,500 |
General Electric Co. | | 17,749,700 | | | 208,026,484 |
Koninklijke Philips Electronics NV(b) (Netherlands) | | 650,600 | | | 11,984,052 |
Tyco International, Ltd.(b) (Switzerland) | | 2,839,134 | | | 73,760,701 |
| | | | | |
| | | | | 410,329,737 |
COMMERCIAL SERVICES & SUPPLIES: 0.5% |
Pitney Bowes, Inc. | | 3,144,550 | | | 68,959,982 |
| | |
| See accompanying Notes to Financial Statements | | DODGE & COX BALANCED FUND §PAGE 6 |
| | |
| PORTFOLIO OF INVESTMENTS (unaudited) | | June 30, 2009 |
| | | | | |
| COMMON STOCKS (continued) |
| | |
| | | SHARES | | VALUE |
TRANSPORTATION: 1.4% |
FedEx Corp. | | 3,497,254 | | $ | 194,517,267 |
| | | | | |
| | | | | 673,806,986 |
| INFORMATION TECHNOLOGY: 13.8% |
SEMICONDUCTORS & SEMICONDUCTOR EQUIPMENT: 0.8% |
Maxim Integrated Products, Inc. | | 7,042,000 | | | 110,488,980 |
SOFTWARE & SERVICES: 4.6% |
Adobe Systems, Inc.(a) | | 934,000 | | | 26,432,200 |
Autodesk, Inc.(a) | | 518,943 | | | 9,849,538 |
BMC Software, Inc.(a) | | 2,370,560 | | | 80,101,222 |
Cadence Design Systems, Inc.(a) | | 9,739,500 | | | 57,463,050 |
Citrix Systems, Inc.(a) | | 2,642,610 | | | 84,272,833 |
Computer Sciences Corp.(a) | | 3,410,500 | | | 151,085,150 |
Compuware Corp.(a) | | 6,949,488 | | | 47,673,488 |
EBay, Inc.(a) | | 7,569,200 | | | 129,660,396 |
Symantec Corp.(a) | | 27,100 | | | 421,676 |
Synopsys, Inc.(a) | | 2,989,500 | | | 58,325,145 |
| | | | | |
| | | | | 645,284,698 |
TECHNOLOGY, HARDWARE & EQUIPMENT: 8.4% |
Hewlett-Packard Co. | | 12,860,912 | | | 497,074,249 |
Hitachi, Ltd. ADR(a),(b) (Japan) | | 1,920,245 | | | 59,469,988 |
Kyocera Corp. ADR(b) (Japan) | | 184,800 | | | 13,804,560 |
Molex, Inc. | | 800,000 | | | 12,440,000 |
Molex, Inc., Class A | | 2,527,928 | | | 36,351,604 |
Motorola, Inc.(a) | | 45,509,600 | | | 301,728,648 |
Telefonaktiebolaget LM Ericsson ADR(b) (Sweden) | | 2,412,300 | | | 23,592,294 |
Tyco Electronics, Ltd.(b) (Switzerland) | | 5,797,900 | | | 107,782,961 |
Xerox Corp. | | 20,721,050 | | | 134,272,404 |
| | | | | |
| | | | | 1,186,516,708 |
| | | | | |
| | | | | 1,942,290,386 |
| MATERIALS: 1.5% |
Cemex SAB de CV ADR(a),(b) (Mexico) | | 3,914,083 | | | 36,557,535 |
Domtar Corp.(a) | | 550,091 | | | 9,120,509 |
Dow Chemical Co. | | 8,960,259 | | | 144,618,580 |
Vulcan Materials Co. | | 444,656 | | | 19,164,674 |
| | | | | |
| | | | | 209,461,298 |
| TELECOMMUNICATION SERVICES: 1.3% |
Sprint Nextel Corp.(a) | | 38,764,400 | | | 186,456,764 |
| | | | | |
| | | | | 186,456,764 |
| | | | | |
TOTAL COMMON STOCKS
(Cost $12,514,745,822) | | | | $ | 9,953,093,405 |
| | | | | |
| | | | | | |
| PREFERRED STOCKS: 0.1% |
| | |
| | | SHARES | | VALUE |
| FINANCIALS: 0.1% |
DIVERSIFIED FINANCIALS: 0.1% |
Preferred Blocker, Inc.
(a subsidiary of GMAC, Inc.)(d) | | | 12,287 | | $ | 5,284,178 |
| | | | | | |
TOTAL PREFERRED STOCKS
(Cost $2,457,400) | | | | | $ | 5,284,178 |
| | | | | | |
|
| FIXED INCOME SECURITIES: 27.6% |
| | |
| | | PAR VALUE | | VALUE |
| U.S. TREASURY AND GOVERNMENT RELATED: 1.8% |
GOVERNMENT RELATED: 1.8% |
Arkansas Dev. Fin. Auth. GNMA Guaranteed Bonds
9.75%, 11/15/14 | | $ | 1,638,895 | | $ | 1,645,287 |
California Taxable General Obligation
5.45%, 4/1/15 | | | 14,850,000 | | | 14,512,905 |
7.50%, 4/1/34 | | | 24,500,000 | | | 22,402,065 |
5.65%, 4/1/39 (mandatory put 4/1/13) | | | 5,075,000 | | | 4,995,881 |
7.55%, 4/1/39 | | | 22,900,000 | | | 20,847,931 |
Small Business Administration — 504 Program | | | |
Series 96-20L, 6.70%, 12/1/16 | | | 1,208,005 | | | 1,307,769 |
Series 97-20F, 7.20%, 6/1/17 | | | 1,916,287 | | | 2,089,256 |
Series 97-20I, 6.90%, 9/1/17 | | | 2,643,318 | | | 2,861,870 |
Series 98-20D, 6.15%, 4/1/18 | | | 3,166,416 | | | 3,381,079 |
Series 98-20I, 6.00%, 9/1/18 | | | 2,005,879 | | | 2,132,061 |
Series 99-20F, 6.80%, 6/1/19 | | | 2,526,740 | | | 2,714,269 |
Series 00-20D, 7.47%, 4/1/20 | | | 7,525,341 | | | 8,188,604 |
Series 00-20E, 8.03%, 5/1/20 | | | 3,260,943 | | | 3,594,548 |
Series 00-20G, 7.39%, 7/1/20 | | | 4,355,106 | | | 4,736,969 |
Series 00-20I, 7.21%, 9/1/20 | | | 3,070,085 | | | 3,323,050 |
Series 01-20E, 6.34%, 5/1/21 | | | 7,760,476 | | | 8,312,339 |
Series 01-20G, 6.625%, 7/1/21 | | | 7,225,762 | | | 7,789,933 |
Series 03-20J, 4.92%, 10/1/23 | | | 15,672,148 | | | 16,295,371 |
Series 05-20K, 5.36%, 11/1/25 | | | 29,101,227 | | | 30,790,041 |
Series 06-20D, 5.64%, 4/1/26 | | | 39,672,092 | | | 42,369,314 |
Series 06-20F, 5.82%, 6/1/26 | | | 43,961,970 | | | 47,002,617 |
Series 07-20F, 5.71%, 6/1/27 | | | 10,752,767 | | | 11,499,834 |
| | | | | | |
| | | | | | 262,792,993 |
| MORTGAGE-RELATED SECURITIES: 10.3% |
FEDERAL AGENCY CMO & REMIC: 2.5% |
Dept. of Veterans Affairs
Trust 1995-1A 1, 7.213%, 2/15/25 | | | 990,969 | | | 1,071,176 |
Trust 1995-2C 3A, 8.793%, 6/15/25 | | | 432,901 | | | 488,514 |
Fannie Mae
Trust 2001-T5 A3, 7.50%, 6/19/30 | | | 1,268,157 | | | 1,370,402 |
Trust 2002-33 A1, 7.00%, 6/25/32 | | | 3,940,919 | | | 4,275,898 |
Series 2002-86, 6.00%, 8/25/32 | | | 19,044,280 | | | 20,103,564 |
Trust 2005-W4 1A2, 6.50%, 8/25/35 | | | 24,792,295 | | | 26,399,922 |
Trust 2001-T7 A1, 7.50%, 2/25/41 | | | 3,772,691 | | | 4,152,318 |
| | |
| PAGE 7 § DODGE & COX BALANCED FUND | | See accompanying Notes to Financial Statements |
| | |
| PORTFOLIO OF INVESTMENTS (unaudited) | | June 30, 2009 |
| | | | | | |
| FIXED INCOME SECURITIES (continued) |
| | |
| | | PAR VALUE | | VALUE |
Trust 2001-T8 A1, 7.50%, 7/25/41 | | $ | 4,020,791 | | $ | 4,344,967 |
Trust 2001-T4 A1, 7.50%, 7/25/41 | | | 3,362,067 | | | 3,633,133 |
Trust 2001-W3 A, 7.00%, 9/25/41 | | | 3,207,676 | | | 3,432,213 |
Trust 2001-T10 A2, 7.50%, 12/25/41 | | | 4,021,858 | | | 4,346,121 |
Trust 2002-W6 2A1, 7.00%, 6/25/42 | | | 3,765,100 | | | 4,085,133 |
Trust 2002-W8 A2, 7.00%, 6/25/42 | | | 4,447,039 | | | 4,869,508 |
Trust 2003-W2 1A1, 6.50%, 7/25/42 | | | 8,097,869 | | | 8,622,966 |
Trust 2003-W2 1A2, 7.00%, 7/25/42 | | | 3,247,068 | | | 3,523,069 |
Trust 2003-W4 4A, 7.50%, 10/25/42 | | | 4,811,795 | | | 5,199,746 |
Trust 2004-T1 1A2, 6.50%, 1/25/44 | | | 7,842,162 | | | 8,350,678 |
Trust 2004-W2 5A, 7.50%, 3/25/44 | | | 16,303,369 | | | 17,617,828 |
Trust 2004-W8 3A, 7.50%, 6/25/44 | | | 2,253,034 | | | 2,434,685 |
Series 2009-11 MP, 7.00%, 3/25/49 | | | 109,943,385 | | | 118,267,363 |
Freddie Mac
Series 2100 GS, 6.50%, 12/15/13 | | | 3,901,245 | | | 4,151,001 |
Series 2430 UC, 6.00%, 9/15/16 | | | 5,137,373 | | | 5,286,966 |
Series 1078 GZ, 6.50%, 5/15/21 | | | 775,436 | | | 816,969 |
Series (GN) 16 PK, 7.00%, 8/25/23 | | | 9,528,267 | | | 10,242,795 |
Series T-48 1A4, 5.538%, 7/25/33 | | | 60,855,887 | | | 63,575,384 |
Series T-051 1A, 6.50%, 9/25/43 | | | 386,227 | | | 411,271 |
Series T-59 1A1, 6.50%, 10/25/43 | | | 24,450,728 | | | 26,161,362 |
| | | | | | |
| | | | | | 357,234,952 |
FEDERAL AGENCY MORTGAGE PASS-THROUGH: 7.8% |
Fannie Mae, 10 Year
6.00%, 1/1/12-10/1/14 | | | 11,473,250 | | | 12,083,611 |
Fannie Mae, 15 Year
6.00%, 3/1/14-3/1/22 | | | 90,621,986 | | | 96,466,622 |
6.50%, 1/1/13-11/1/18 | | | 90,667,294 | | | 96,233,327 |
7.00%, 7/1/11-11/1/18 | | | 6,708,374 | | | 7,052,820 |
7.50%, 9/1/15-8/1/17 | | | 31,210,411 | | | 33,226,584 |
Fannie Mae, 20 Year
6.50%, 1/1/22-10/1/26 | | | 20,604,373 | | | 22,012,850 |
Fannie Mae, 30 Year
6.50%, 12/1/28-11/1/37 | | | 335,159,486 | | | 357,729,322 |
7.00%, 8/1/37 | | | 21,623,748 | | | 23,487,369 |
7.50%, 8/1/10 | | | 3,487 | | | 3,581 |
Fannie Mae, Hybrid ARM
4.71%, 9/1/34 | | | 10,880,044 | | | 11,171,982 |
4.737%, 1/1/35 | | | 8,194,187 | | | 8,384,498 |
4.741%, 12/1/34 | | | 13,342,914 | | | 13,758,532 |
4.822%, 8/1/35 | | | 8,964,985 | | | 9,319,924 |
4.924%, 1/1/35 | | | 6,333,917 | | | 6,575,311 |
Fannie Mae, Multifamily DUS
Pool 555728, 4.02%, 8/1/13 | | | 323,876 | | | 332,136 |
Pool 555162, 4.826%, 1/1/13 | | | 14,680,276 | | | 15,431,429 |
Pool 760762, 4.89%, 4/1/12 | | | 16,115,000 | | | 16,673,530 |
Pool 555316, 4.918%, 2/1/13 | | | 4,228,461 | | | 4,429,486 |
Pool 735387, 4.921%, 4/1/15 | | | 12,020,373 | | | 12,608,563 |
Pool 555148, 4.976%, 1/1/13 | | | 3,621,459 | | | 3,813,367 |
Pool 555806, 5.098%, 10/1/13 | | | 3,045,178 | | | 3,224,770 |
Pool 461628, 5.32%, 4/1/14 | | | 10,129,236 | | | 10,839,016 |
Pool 462086, 5.355%, 11/1/15 | | | 20,738,667 | | | 22,081,784 |
| | | | | | |
| | |
| | | PAR VALUE | | VALUE |
Pool 545316, 5.629%, 12/1/11 | | $ | 4,656,136 | | $ | 4,952,381 |
Pool 545387, 5.896%, 1/1/12 | | | 5,460,770 | | | 5,840,565 |
Pool 545685, 5.932%, 4/1/12 | | | 22,831,956 | | | 24,185,701 |
Pool 545258, 5.942%, 11/1/11 | | | 845,711 | | | 898,688 |
Freddie Mac, 30 Year
8.75%, 5/1/10 | | | 624 | | | 630 |
Freddie Mac Gold, 15 Year
6.00%, 10/1/13-10/1/18 | | | 30,088,871 | | | 31,762,226 |
6.50%, 7/1/14-3/1/18 | | | 37,198,207 | | | 39,366,990 |
7.00%, 4/1/15 | | | 153,347 | | | 160,536 |
7.75%, 7/25/21 | | | 1,148,584 | | | 1,247,889 |
Freddie Mac Gold, 20 Year 6.50%, 10/1/26 | | | 36,993,136 | | | 39,681,627 |
Freddie Mac Gold, 30 Year
6.50%, 9/1/18-4/1/33 | | | 45,942,792 | | | 49,264,784 |
7.00%, 8/1/38-9/1/38 | | | 87,364,368 | | | 94,023,390 |
7.47%, 3/17/23 | | | 330,699 | | | 358,663 |
8.50%, 1/1/23 | | | 10,379 | | | 11,220 |
Freddie Mac Gold, Hybrid ARM
4.158%, 5/1/34 | | | 12,015,034 | | | 12,416,706 |
Ginnie Mae, 30 Year
7.50%, 11/15/24-10/15/25 | | | 3,309,848 | | | 3,610,732 |
7.97%, 4/15/20-1/15/21 | | | 1,804,527 | | | 1,979,381 |
| | | | | | |
| | | | | | 1,096,702,523 |
PRIVATE LABEL CMO & REMIC SECURITIES: 0.0%(e) |
Union Planters Mortgage Finance Corp. Series 2000-1 A1,
7.70%, 12/25/24 | | | 2,765,175 | | | 2,975,156 |
| | | | | | |
| | | | | | 1,456,912,631 |
| ASSET-BACKED SECURITIES: 0.1% |
STUDENT LOAN: 0.1% |
SLM Student Loan Trust Series 2006-09 A2, 1.092%, 4/25/17 | | | 7,388,075 | | | 7,349,272 |
Series 2006-10 A2, 1.102%, 10/25/17 | | | 5,020,423 | | | 5,020,821 |
| | | | | | |
| | | | | | 12,370,093 |
| CORPORATE: 15.4% |
FINANCIALS: 6.9% |
American International Group, Inc.(d)
8.25%, 8/15/18 | | | 29,000,000 | | | 16,856,250 |
Bank of America Corp.
5.30%, 3/15/17 | | | 42,000,000 | | | 35,634,774 |
8.00%, 12/15/26(c) | | | 17,355,000 | | | 14,578,200 |
5.625%, 3/8/35(c) | | | 10,000,000 | | | 6,502,220 |
6.625%, 5/23/36(c) | | | 41,040,000 | | | 30,948,428 |
Boston Properties, Inc.
6.25%, 1/15/13 | | | 21,375,000 | | | 21,275,863 |
5.625%, 4/15/15 | | | 29,500,000 | | | 27,431,153 |
5.00%, 6/1/15 | | | 2,890,000 | | | 2,585,197 |
Capital One Financial Corp.
6.75%, 9/15/17 | | | 45,630,000 | | | 42,828,193 |
CIGNA Corp.
8.50%, 5/1/19 | | | 7,500,000 | | | 7,604,003 |
| | |
| See accompanying Notes to Financial Statements | | DODGE & COX BALANCED FUND §PAGE 8 |
| | |
| PORTFOLIO OF INVESTMENTS (unaudited) | | June 30, 2009 |
| | | | | | |
| FIXED INCOME SECURITIES (continued) |
| | |
| | | PAR VALUE | | VALUE |
7.65%, 3/1/23 | | $ | 9,745,000 | | $ | 8,734,950 |
7.875%, 5/15/27 | | | 12,970,000 | | | 11,349,438 |
8.30%, 1/15/33 | | | 9,050,000 | | | 7,517,735 |
6.15%, 11/15/36 | | | 5,500,000 | | | 3,938,044 |
Citigroup, Inc.
6.125%, 11/21/17 | | | 35,000,000 | | | 31,036,122 |
General Electric Co.
1.158%, 11/1/12 | | | 190,000,000 | | | 171,397,421 |
GMAC, Inc.(d)
6.875%, 9/15/11 | | | 147,385,000 | | | 128,961,875 |
Health Net, Inc.
6.375%, 6/1/17 | | | 18,675,000 | | | 14,146,312 |
HSBC Holdings PLC(b) (United Kingdom)
6.50%, 5/2/36 | | | 23,000,000 | | | 22,309,533 |
6.50%, 9/15/37 | | | 35,000,000 | | | 33,855,955 |
JPMorgan Chase & Co.
8.75%, 9/1/30(c) | | | 28,187,000 | | | 26,479,319 |
5.85%, 8/1/35(c) | | | 5,955,000 | | | 4,497,541 |
Kaupthing Bank HF(b),(d),(g) (Iceland)
7.125%, 5/19/16 | | | 65,060,000 | | | 6,506 |
Liberty Mutual Group, Inc.(d)
4.875%, 2/1/10 | | | 15,131,000 | | | 14,859,183 |
SLM Corp.
8.45%, 6/15/18 | | | 50,000,000 | | | 42,774,250 |
Travelers Cos., Inc.
5.00%, 3/15/13 | | | 9,750,000 | | | 9,802,954 |
6.25%, 6/20/16 | | | 9,735,000 | | | 10,310,449 |
Unum Group
7.625%, 3/1/11 | | | 8,426,000 | | | 8,420,473 |
6.85%, 11/15/15(d) | | | 10,200,000 | | | 8,407,013 |
7.19%, 2/1/28 | | | 8,500,000 | | | 5,299,987 |
7.25%, 3/15/28 | | | 12,130,000 | | | 8,082,558 |
6.75%, 12/15/28 | | | 11,633,000 | | | 7,669,044 |
WellPoint, Inc.
5.00%, 12/15/14 | | | 13,070,000 | | | 12,804,512 |
5.25%, 1/15/16 | | | 40,000,000 | | | 37,896,800 |
Wells Fargo & Co.
1.23%, 4/23/12 | | | 90,000,000 | | | 84,977,407 |
6.00%, 11/15/17 | | | 46,000,000 | | | 44,344,127 |
| | | | | | |
| | | | | | 966,123,789 |
INDUSTRIALS: 6.9% |
AT&T, Inc.
4.95%, 1/15/13 | | | 10,000,000 | | | 10,400,060 |
BHP Billiton, Ltd.(b) (Australia)
5.50%, 4/1/14 | | | 20,000,000 | | | 21,454,860 |
Boston Scientific Corp.
5.45%, 6/15/14 | | | 19,385,000 | | | 17,834,200 |
6.25%, 11/15/15 | | | 1,075,000 | | | 994,375 |
6.40%, 6/15/16 | | | 21,905,000 | | | 20,371,650 |
Comcast Corp.
5.30%, 1/15/14 | | | 38,175,000 | | | 39,478,562 |
| | | | | | |
| | |
| | | PAR VALUE | | VALUE |
5.85%, 11/15/15 | | $ | 26,500,000 | | $ | 27,462,533 |
5.90%, 3/15/16 | | | 3,180,000 | | | 3,289,468 |
Cox Communications, Inc.
5.45%, 12/15/14 | | | 53,185,000 | | | 52,796,058 |
5.50%, 10/1/15 | | | 4,815,000 | | | 4,665,047 |
5.875%, 12/1/16(d) | | | 25,145,000 | | | 24,660,330 |
8.375%, 3/1/39(d) | | | 6,400,000 | | | 7,135,891 |
Dillard’s, Inc.
7.85%, 10/1/12 | | | 14,000,000 | | | 11,847,500 |
7.13%, 8/1/18 | | | 10,831,000 | | | 6,119,515 |
7.875%, 1/1/23 | | | 8,860,000 | | | 4,618,275 |
7.75%, 7/15/26 | | | 50,000 | | | 24,000 |
7.75%, 5/15/27 | | | 550,000 | | | 261,250 |
7.00%, 12/1/28 | | | 15,490,000 | | | 7,512,650 |
Dow Chemical Co.
4.027%, 9/30/09(d) | | | 33,950,000 | | | 33,879,452 |
8.55%, 5/15/19 | | | 28,060,000 | | | 28,109,947 |
7.375%, 11/1/29 | | | 18,170,000 | | | 16,513,368 |
9.40%, 5/15/39 | | | 12,165,000 | | | 12,522,383 |
Ford Motor Credit Co.(h)
7.375%, 2/1/11 | | | 142,325,000 | | | 128,843,264 |
HCA, Inc.
7.875%, 2/1/11 | | | 8,008,000 | | | 7,877,870 |
6.95%, 5/1/12 | | | 50,090,000 | | | 46,834,150 |
6.30%, 10/1/12 | | | 8,400,000 | | | 7,707,000 |
6.25%, 2/15/13 | | | 18,390,000 | | | 16,091,250 |
Hewlett-Packard Co.
6.125%, 3/1/14 | | | 25,605,000 | | | 28,223,751 |
Lafarge SA(b) (France)
6.50%, 7/15/16 | | | 33,715,000 | | | 31,000,201 |
Liberty Media Corp.
8.50%, 7/15/29 | | | 9,682,000 | | | 6,680,580 |
8.25%, 2/1/30 | | | 7,461,000 | | | 5,138,764 |
Macy’s, Inc.
7.625%, 8/15/13 | | | 5,900,000 | | | 5,103,500 |
7.45%, 10/15/16 | | | 11,675,000 | | | 9,883,751 |
6.65%, 7/15/24 | | | 12,895,000 | | | 8,539,972 |
6.90%, 4/1/29 | | | 5,355,000 | | | 3,748,500 |
6.90%, 1/15/32 | | | 55,984,000 | | | 36,722,257 |
6.70%, 7/15/34 | | | 8,380,000 | | | 5,591,647 |
Reed Elsevier PLC(b) (United Kingdom)
8.625%, 1/15/19 | | | 23,000,000 | | | 26,132,048 |
Sprint Nextel Corp.
6.00%, 12/1/16 | | | 25,585,000 | | | 20,915,738 |
6.875%, 11/15/28 | | | 10,085,000 | | | 7,160,350 |
Time Warner Cable, Inc.
8.75%, 2/14/19 | | | 8,000,000 | | | 9,319,536 |
8.25%, 4/1/19 | | | 19,665,000 | | | 22,312,243 |
Time Warner, Inc.
7.625%, 4/15/31 | | | 66,505,000 | | | 64,653,235 |
7.70%, 5/1/32 | | | 30,690,000 | | | 30,158,020 |
| | |
| PAGE 9 § DODGE & COX BALANCED FUND | | See accompanying Notes to Financial Statements |
| | |
| PORTFOLIO OF INVESTMENTS (unaudited) | | June 30, 2009 |
| | | | | | | |
| FIXED INCOME SECURITIES (continued) |
| | |
| | | PAR VALUE | | | VALUE |
Xerox Corp.
6.875%, 8/15/11 | | $ | 87,085,000 | | | $ | 90,132,975 |
| | | | | | | |
| | | | | | | 970,721,976 |
TRANSPORTATION: 1.6% |
Burlington Northern Santa Fe Corp.
8.251%, 1/15/21 | | | 1,253,469 | | | | 1,468,367 |
4.967%, 4/1/23 | | | 11,670,322 | | | | 11,663,979 |
5.72%, 1/15/24 | | | 21,546,435 | | | | 21,607,464 |
5.629%, 4/1/24 | | | 25,029,348 | | | | 24,958,111 |
5.342%, 4/1/24 | | | 16,355,943 | | | | 16,110,594 |
5.996%, 4/1/24 | | | 22,301,806 | | | | 22,755,639 |
CSX Corp.
9.75%, 6/15/20 | | | 5,351,000 | | | | 6,229,356 |
FedEx Corp.
7.375%, 1/15/14 | | | 9,000,000 | | | | 9,719,973 |
8.00%, 1/15/19 | | | 7,125,000 | | | | 8,119,600 |
6.72%, 7/15/23 | | | 15,409,032 | | | | 15,948,280 |
Norfolk Southern Corp.
7.70%, 5/15/17 | | | 5,955,000 | | | | 6,526,936 |
9.75%, 6/15/20 | | | 7,389,000 | | | | 9,820,831 |
Union Pacific Corp.
6.50%, 4/15/12 | | | 3,550,000 | | | | 3,740,724 |
6.33%, 1/2/20 | | | 26,685,286 | | | | 27,971,841 |
5.866%, 7/2/30 | | | 36,014,966 | | | | 33,233,897 |
6.176%, 1/2/31 | | | 11,971,951 | | | | 12,163,306 |
| | | | | | | |
| | | | | | | 232,038,898 |
| | | | | | | |
| | | | | | | 2,168,884,663 |
| | | | | | | |
TOTAL FIXED INCOME SECURITIES
(Cost $4,070,144,675) | | | $ | 3,900,960,380 |
| | | | | | | |
|
| SHORT-TERM INVESTMENTS: 1.6% |
MONEY MARKET FUND: 0.3% |
SSgA Prime Money Market Fund | | | 42,864,877 | | | | 42,864,877 |
REPURCHASE AGREEMENT: 1.3% |
Fixed Income Clearing Corporation(f) 0.03%, 7/1/09, maturity value $180,066,150 | | | 180,066,000 | | | | 180,066,000 |
| | | | | | | |
TOTAL SHORT-TERM INVESTMENTS
(Cost $222,930,877) | | | $ | 222,930,877 |
| | | | | | | |
TOTAL INVESTMENTS
(Cost $16,810,278,774) | | | 99.8 | % | | $ | 14,082,268,840 |
OTHER ASSETS LESS LIABILITIES | | | 0.2 | % | | | 33,170,878 |
| | | | | | | |
| NET ASSETS | | | 100.0 | % | | $ | 14,115,439,718 |
| | | | | | | |
| (b) | Security denominated in U.S. dollars |
| (c) | Cumulative preferred security |
| (d) | Security exempt from registration under Rule 144A of the Securities Act of 1933. The security may be resold in transactions exempt from registration, normally to qualified institutional buyers. As of June 30, 2009, all such securities in total represented $240,050,678 or 1.7% of net assets. |
| (f) | Repurchase agreement is collateralized by Fannie Mae 2.00%, 3/2/11; and Freddie Mac 4.13%, 2/24/11. Total collateral value is $183,672,525. |
| (g) | Non-income producing / security in default. On October 9, 2008, Kaupthing Bank requested protection under the Icelandic Financial Supervisory Authority, which has appointed a resolution committee to oversee the affairs of Kaupthing, including supervision of its assets and business operations. |
| (h) | Subsidiary (see Note below) |
| | Note: Fixed income securities are grouped by parent company unless otherwise noted. Actual securities may be issued by the listed parent company or one of its subsidiaries. |
ADR: American Depositary Receipt
ARM: Adjustable Rate Mortgage
CMO: Collateralized Mortgage Obligation
DUS: Delegated Underwriting and Servicing
REMIC: Real Estate Mortgage Investment Conduit
| | |
| See accompanying Notes to Financial Statements | | DODGE & COX BALANCED FUND §PAGE 10 |
| | | | |
STATEMENT OF ASSETS AND LIABILITIES
(unaudited) | |
| |
| | | June 30, 2009 | |
ASSETS: | | | | |
Investments, at value (cost $16,810,278,774) | | $ | 14,082,268,840 | |
Receivable for investments sold | | | 55,132,035 | |
Receivable for paydowns on mortgage-backed securities | | | 300,482 | |
Receivable for Fund shares sold | | | 6,415,062 | |
Dividends and interest receivable | | | 70,705,131 | |
Prepaid expenses and other assets | | | 43,593 | |
| | | | |
| | | 14,214,865,143 | |
| | | | |
LIABILITIES: | | | | |
Payable for investments purchased | | | 67,890,400 | |
Payable for Fund shares redeemed | | | 24,076,137 | |
Management fees payable | | | 5,898,760 | |
Accrued expenses | | | 1,560,128 | |
| | | | |
| | | 99,425,425 | |
| | | | |
NET ASSETS | | $ | 14,115,439,718 | |
| | | | |
NET ASSETS CONSIST OF: | | | | |
Paid in capital | | $ | 18,981,354,839 | |
Undistributed net investment income | | | 3,975,118 | |
Accumulated net realized loss on investments | | | (2,141,880,305 | ) |
Net unrealized depreciation on investments | | | (2,728,009,934 | ) |
| | | | |
| | $ | 14,115,439,718 | |
| | | | |
Fund shares outstanding (par value $0.01 each, unlimited shares authorized) | | | 262,627,590 | |
Net asset value per share | | | $53.75 | |
|
STATEMENT OF OPERATIONS
(unaudited) | |
| |
| | | Six Months Ended
June 30, 2009 | |
INVESTMENT INCOME: | | | | |
Dividends (net of foreign taxes of $3,807,612) | | $ | 116,820,589 | |
Interest | | | 133,824,116 | |
| | | | |
| | | 250,644,705 | |
| | | | |
EXPENSES: | | | | |
Management fees | | | 33,592,687 | |
Custody and fund accounting fees | | | 123,466 | |
Transfer agent fees | | | 1,475,727 | |
Professional services | | | 68,392 | |
Shareholder reports | | | 575,275 | |
Registration fees | | | 82,856 | |
Trustees’ fees | | | 73,000 | |
Miscellaneous | | | 160,190 | |
| | | | |
| | | 36,151,593 | |
| | | | |
NET INVESTMENT INCOME | | | 214,493,112 | |
| | | | |
REALIZED AND UNREALIZED GAIN/ (LOSS) ON INVESTMENTS: | | | | |
Net realize gain/(loss) | | | (1,823,527,973 | ) |
Net change in unrealized depreciation | | | 2,404,750,265 | |
| | | | |
Net realized and unrealized gain | | | 581,222,292 | |
| | | | |
NET INCREASE IN NET ASSETS
FROM OPERATIONS | | $ | 795,715,404 | |
| | | | |
| | | | | | | | |
STATEMENT OF CHANGES IN NET ASSETS
| |
| | | Six Months Ended
June 30, 2009
(unaudited) | | | Year Ended
December 31, 2008 | |
OPERATIONS: | | | | | | | | |
Net investment income | | $ | 214,493,112 | | | $ | 611,368,682 | |
Net realized loss | | | (1,823,527,973 | ) | | | (308,295,854 | ) |
Net change in unrealized appreciation/depreciation | | | 2,404,750,265 | | | | (8,641,036,762 | ) |
| | | | | | | | |
Net increase/(decrease) in net assets from operations | | | 795,715,404 | | | | (8,337,963,934 | ) |
| | | | | | | | |
| | |
DISTRIBUTIONS TO SHAREHOLDERS FROM: | | | | | | | | |
Net investment income | | | (224,929,335 | ) | | | (607,013,818 | ) |
Net realized gain | | | — | | | | (433,264,664 | ) |
| | | | | | | | |
Total distributions | | | (224,929,335 | ) | | | (1,040,278,482 | ) |
| | | | | | | | |
| | |
FUND SHARE TRANSACTIONS: | | | | | | | | |
Proceeds from sale of shares | | | 779,566,439 | | | | 2,553,747,909 | |
Reinvestment of distributions | | | 213,664,143 | | | | 994,817,279 | |
Cost of shares redeemed | | | (2,124,358,694 | ) | | | (6,426,914,208 | ) |
| | | | | | | | |
Net decrease from Fund
share transactions | | | (1,131,128,112 | ) | | | (2,878,349,020 | ) |
| | | | | | | | |
Total decrease in net assets | | | (560,342,043 | ) | | | (12,256,591,436 | ) |
| | |
NET ASSETS: | | | | | | | | |
Beginning of period | | | 14,675,781,761 | | | | 26,932,373,197 | |
| | | | | | | | |
End of period (including undistributed net investment income of $3,975,118 and $12,638,299, respectively) | | $ | 14,115,439,718 | | | $ | 14,675,781,761 | |
| | | | | | | | |
| | |
SHARE INFORMATION: | | | | | | | | |
Shares sold | | | 15,923,115 | | | | 37,021,532 | |
Distributions reinvested | | | 4,272,207 | | | | 14,719,733 | |
Shares redeemed | | | (43,849,175 | ) | | | (97,962,966 | ) |
| | | | | | | | |
Net decrease in shares outstanding | | | (23,653,853 | ) | | | (46,221,701 | ) |
| | | | | | | | |
| | |
| PAGE 11 § DODGE & COX BALANCED FUND | | See accompanying Notes to Financial Statements |
NOTES TO FINANCIAL STATEMENTS (unaudited)
NOTE 1—ORGANIZATION AND SIGNIFICANT ACCOUNTING POLICIES
Dodge & Cox Balanced Fund (the “Fund”) is one of the series constituting the Dodge & Cox Funds (the “Trust” or the “Funds”). The Trust is organized as a Delaware statutory trust and is registered under the Investment Company Act of 1940, as amended, as a diversified, open-end management investment company. The Fund commenced operations on June 26, 1931, and seeks regular income, conservation of principal and an opportunity for long-term growth of principal and income. Risk considerations and investment strategies of the Fund are discussed in the Fund’s Prospectus.
The financial statements have been prepared in conformity with accounting principles generally accepted in the United States of America, which require the use of estimates and assumptions by management. Significant accounting policies are as follows:
Security valuation The Fund’s net assets are valued as of the close of trading on the New York Stock Exchange (NYSE), generally 4:00 p.m. Eastern Time, each day that the NYSE is open for business. Stocks are valued at the official quoted close price or the last sale of the day at the close of the NYSE or, if not available, at the mean between the exchange-listed bid and ask prices for the day. A security that is listed or traded on more than one exchange is valued at the quotation on the exchange determined to be the primary market for such security. Fixed income securities with original maturities of one year or more are priced on the basis of valuations furnished by pricing services which utilize both dealer-supplied valuations and pricing models. Under certain circumstances, fixed income securities that are not valued by pricing services are temporarily valued by the investment manager utilizing both dealer-supplied valuations and pricing models. Valuations of fixed income securities take into account appropriate factors such as institutional-size trading markets in similar groups of securities, yield, quality, coupon rate, maturity, type of issue, trading characteristics and other market data and do not rely exclusively upon exchange or over-the-counter listed prices. Security values are not discounted based on the size of the Fund’s position. Securities for which market quotations are not readily available are valued at fair value as determined in good faith by or at the direction of the Board of Trustees. Short-term securities are valued at amortized cost which approximates current value. All securities held by the Fund are denominated in U.S. dollars.
Security transactions, investment income, expenses, and distributions Security transactions are recorded on the trade date. Realized gains and losses on securities sold are determined on the basis of identified cost.
Dividend income and corporate action transactions are recorded on the ex-dividend date, except for certain
dividends or corporate actions from foreign securities where the ex-dividend date may have passed, which are recorded as soon as the Fund is informed of the ex-dividend date. Withholding taxes on foreign dividends have been provided for in accordance with the Fund’s understanding of the applicable country’s tax rules and rates. Non-cash dividends included in dividend income, if any, are recorded at the fair market value of the securities received. Distributions received in excess of income are recorded as a reduction of cost of investments and/or realized gain.
Interest income is recorded on the accrual basis. Interest income includes coupon interest, amortization of premium and accretion of discount on debt securities, and gain/loss on paydowns of mortgage-backed securities. The ability of the issuers of the debt securities held by the Fund to meet their obligations may be affected by economic developments in a specific industry, state or region. Debt obligations may be placed on non-accrual status and related interest income may be reduced by ceasing current accruals and writing off interest receivables when the collection of all or a portion of interest has become doubtful. A debt obligation is removed from non-accrual status when the issuer resumes interest payments or when collectibility of interest is reasonably assured.
Expenses are recorded on the accrual basis. Most expenses of the Trust can be directly attributed to a specific series. Expenses which cannot be directly attributed are allocated among the Funds in the Trust.
Distributions to shareholders are recorded on the ex-dividend date.
Repurchase agreements The Fund may enter into repurchase agreements, secured by U.S. government or agency securities, which involve the purchase of securities from a counterparty with a simultaneous commitment to resell the securities at an agreed-upon date and price. It is the Fund’s policy that its custodian take possession of the underlying collateral securities, the fair value of which exceeds the principal amount of the repurchase transaction, including accrued interest, at all times. In the event of default by the counterparty, the Fund has the contractual right to liquidate the collateral securities and to apply the proceeds in satisfaction of the obligation.
NOTE 2—VALUATION MEASUREMENTS
Various inputs are used in determining the value of the Fund’s investments. These inputs are summarized in the three broad levels listed below.
| § | | Level 1: Quoted prices in active markets for identical securities |
| § | | Level 2: Other significant observable inputs (including quoted prices for similar securities, market indices, interest rates, credit risk, etc.) |
| § | | Level 3: Significant unobservable inputs (including the Fund’s own assumptions in determining the fair value of investments) |
DODGE & COX BALANCED FUND §PAGE 12
NOTES TO FINANCIAL STATEMENTS (unaudited)
The inputs or methodology used for valuing securities are not necessarily an indication of the risk associated with investing in those securities.
The following is a summary of the inputs used to value the Fund’s holdings as of June 30, 2009:
| | | | | | |
| Security Classification(a) | | LEVEL 1 (Quoted
Prices) | | LEVEL 2
(Other Significant
Observable Inputs) |
Common Stocks(b) | | $ | 9,953,093,405 | | $ | — |
Preferred Stocks | | | 5,284,178 | | | — |
Fixed Income Securities(c) | | | — | | | 3,900,960,380 |
Money Market Investments | | | 42,864,877 | | | — |
Repurchase Agreements | | | — | | | 180,066,000 |
| | | | | | |
Total | | $ | 10,001,242,460 | | $ | 4,081,026,380 |
| | | | | | |
| | | | | | | |
| (a) | At June 30, 2009 the Fund held no securities that were considered to be “Level 3” securities (those valued using significant unobservable inputs). |
| (b) | All common stocks held in the Fund are Level 1 securities. For a detailed break-out of common stocks by major industry classification, please refer to the Portfolio of Investments. |
| (c) | All fixed income securities held in the Fund are Level 2 securities. For a detailed break-out of fixed income securities by sector, please refer to the Portfolio of Investments. |
NOTE 3—RELATED PARTY TRANSACTIONS
Management fees Under a written agreement approved by a unanimous vote of the Board of Trustees, the Fund pays an annual management fee of 0.50% of the Fund’s average daily net assets to Dodge & Cox, investment manager of the Fund.
Fund officers and trustees All officers and three of the trustees of the Trust are officers or employees of Dodge & Cox. The Trust pays a fee only to those trustees who are not affiliated with Dodge & Cox.
Indemnification Under the Trust’s organizational documents, its officers and trustees are indemnified against certain liabilities arising out of the performance of their duties to the Trust. In addition, in the normal course of business the Trust enters into contracts that provide general indemnities to other parties. The Trust’s maximum exposure under these arrangements is unknown as this would involve future claims that may be made against the Trust that have not yet occurred.
NOTE 4—INCOME TAX INFORMATION AND DISTRIBUTIONS TO SHAREHOLDERS
A provision for federal income taxes is not required since the Fund intends to continue to qualify as a regulated investment company under Subchapter M of the Internal Revenue Code and distribute all of its taxable income to
shareholders. Distributions are determined in accordance with income tax regulations, which may differ from net investment income and realized gains for financial reporting purposes. Financial reporting records are adjusted for permanent book/tax differences to reflect tax character.
Book/tax differences are primarily due to differing treatments of wash sales, net short-term realized gain/(loss), paydown loss, and defaulted fixed income securities. At June 30, 2009, the cost of investments for federal income tax purposes was $16,820,055,463.
Distributions during the six months ended June 30, 2009 and for the year ended December 31, 2008 were characterized as follows for federal income tax purposes:
| | | | |
| | | Six Months Ended
June 30, 2009 | | Year Ended
December 31, 2008 |
Ordinary income | | $224,929,335 | | $611,773,389 |
| | ($0.840 per share) | | ($1.965 per share) |
| | |
Long-term capital gain | | — | | $428,505,093 |
| | | | ($1.328 per share) |
At June 30, 2009, the tax basis components of distributable earnings were as follows:
| | | | |
Unrealized appreciation | | $ | 1,084,909,907 | |
Unrealized depreciation | | | (3,822,696,530 | ) |
| | | | |
Net unrealized depreciation | | | (2,737,786,623 | ) |
Undistributed ordinary income | | | 3,975,118 | |
Accumulated capital loss(a) | | | (2,098,208,515 | ) |
Capital loss carryforward(b) | | | (32,015,139 | ) |
| (a) | Represents capital loss realized for tax purposes during the period from January 1, 2009 to June 30, 2009. |
| (b) | Represents accumulated capital loss as of December 31, 2008 which may be carried forward to offset future capital gains. If not utilized, the capital loss carryforward will expire in 2016. |
Fund management has reviewed the tax positions for open periods (for Federal purposes, three years from the date of filing and for State purposes, four years from the date of filing) as applicable to the Fund, and has determined that no provision for income tax is required in the Fund’s financial statements.
NOTE 5—COMMITTED LINE OF CREDIT
The Fund participates with the Funds in a $200 million committed credit facility (“Line of Credit”) with State Street Bank and Trust Company to be utilized for temporary or emergency purposes to fund shareholder redemptions or for other short-term liquidity purposes. Interest on borrowings is charged at the prevailing rate. There were no borrowings on the Line of Credit during the period.
PAGE 13 § DODGE & COX BALANCED FUND
NOTES TO FINANCIAL STATEMENTS (unaudited)
NOTE 6—PURCHASES AND SALES OF INVESTMENTS
For the six months ended June 30, 2009, purchases and sales of securities, other than short-term securities and U.S. government securities, aggregated $660,021,893 and $1,228,933,265, respectively. For the six months ended June 30, 2009, purchases and sales of U.S. government securities aggregated $250,773,242 and $80,543,754, respectively.
NOTE 7—SUBSEQUENT EVENTS
Fund management has determined that no material events or transactions occurred subsequent to June 30, 2009 and through August 11, 2009, the date of the Fund’s financial statements issuance, which require additional disclosure in the Fund’s financial statements.
FINANCIAL HIGHLIGHTS
| | | | | | | | | | | | | | | | | | |
SELECTED DATA AND RATIOS (for a share outstanding throughout each period) | | Six Months
Ended June 30, | | | Year Ended December 31, | |
| | | 2009(a) | | | 2008 | | | 2007 | | | 2006 | | | 2005 | | | 2004 | |
Net asset value, beginning of period | | $51.26 | | | $81.00 | | | $87.08 | | | $81.34 | | | $79.35 | | | $73.04 | |
Income from investment operations: | | | | | | | | | | | | | | | | | | |
Net investment income | | 0.81 | | | 1.99 | | | 2.35 | | | 2.21 | | | 1.84 | | | 1.60 | |
Net realized and unrealized gain/(loss) | | 2.52 | | | (28.44 | ) | | (0.78 | ) | | 8.93 | | | 3.31 | | | 7.99 | |
| | | | | | |
Total from investment operations | | 3.33 | | | (26.45 | ) | | 1.57 | | | 11.14 | | | 5.15 | | | 9.59 | |
| | | | | | |
Distributions to shareholders from: | | | | | | | | | | | | | | | | | | |
Net investment income | | (0.84 | ) | | (1.95 | ) | | (2.37 | ) | | (2.20 | ) | | (1.84 | ) | | (1.60 | ) |
Net realized gain | | — | | | (1.34 | ) | | (5.28 | ) | | (3.20 | ) | | (1.32 | ) | | (1.68 | ) |
| | | | | | |
Total distributions | | (0.84 | ) | | (3.29 | ) | | (7.65 | ) | | (5.40 | ) | | (3.16 | ) | | (3.28 | ) |
| | | | | | |
Net asset value, end of period | | $53.75 | | | $51.26 | | | $81.00 | | | $87.08 | | | $81.34 | | | $79.35 | |
| | | | | | |
Total return | | 6.62 | % | | (33.57 | )% | | 1.74 | % | | 13.84 | % | | 6.59 | % | | 13.31 | % |
Ratios/supplemental data: | | | | | | | | | | | | | | | | | | |
Net assets, end of period (millions) | | $14,115 | | | $14,676 | | | $26,932 | | | $27,458 | | | $23,611 | | | $20,741 | |
Ratio of expenses to average net assets | | 0.54 | %(b) | | 0.53 | % | | 0.53 | % | | 0.52 | % | | 0.53 | % | | 0.54 | % |
Ratio of net investment income to average net assets | | 3.19 | %(b) | | 2.85 | % | | 2.59 | % | | 2.52 | % | | 2.15 | % | | 1.97 | % |
Portfolio turnover rate | | 11 | % | | 27 | % | | 27 | % | | 20 | % | | 18 | % | | 18 | % |
See accompanying Notes to Financial Statements
FUND HOLDINGS
The Fund provides a complete list of its holdings four times each fiscal year, as of the end of each quarter. The lists appear in the Fund’s First Quarter, Semi-Annual, Third Quarter and Annual Reports to shareholders. The Fund files the lists with the Securities and Exchange Commission (SEC) on Form N-CSR (second and fourth quarters) and Form N-Q (first and third quarters). Shareholders may view the Fund’s Forms N-CSR and N-Q on the SEC’s website at www.sec.gov. Forms N-CSR and N-Q may also be reviewed and copied at the SEC’s Public Reference Room in Washington, DC. Information regarding the operations of the Public Reference Room may be obtained by 1-202-942-8090 (direct) or 1-800-732-0330 (general SEC number). A complete list of
the Fund’s quarter-end holdings is also available at www.dodgeandcox.com on or about 15 days following each quarter end and remains available on the web site until the list is updated in the subsequent quarter.
PROXY VOTING
For a free copy of the Fund’s proxy voting policies and procedures, please call 1-800-621-3979, visit the Fund’s web site at www.dodgeandcox.com or visit the SEC’s web site at www.sec.gov. Information regarding how the Fund voted proxies relating to portfolio securities during the most recent 12-month period ending June 30 is also available at www.dodgeandcox.com or at www.sec.gov.
DODGE & COX BALANCED FUND §PAGE 14
DODGE & COX FUNDS—EXECUTIVE OFFICER & TRUSTEE INFORMATION
| | | | | | |
Name (Age) and
Address* | | Position with Trust
(Year of Election or
Appointment) | | Principal Occupation During Past 5 Years | | Other Directorships Held by Trustees |
| INTERESTED TRUSTEES & OFFICERS |
| John A. Gunn (65) | | Chairman and Trustee
(Trustee since 1985) | | Chairman (since 2007), Chief Executive Officer (since 2005) and Director of Dodge & Cox, Portfolio Manager and member of Investment Policy Committee (IPC), Global Investment Policy Committee (GIPC) (since 2008), and International Investment Policy Committee (IIPC) | | — |
| Kenneth E. Olivier (57) | | President and Trustee (Trustee since 2005) | | President (since 2005) and Director of Dodge & Cox, Portfolio Manager, and member of IPC | | — |
| Dana M. Emery (47) | | Senior Vice President and Trustee (Trustee since 1993) | | Executive Vice President (since 2005) and Director of Dodge & Cox, Manager of the Fixed Income Department, Portfolio Manager, and member of Fixed Income Investment Policy Committee (FIIPC) | | — |
| Charles F. Pohl (51) | | Senior Vice President (Officer since 2004) | | Senior Vice President and Director of Dodge & Cox, Chief Investment Officer (since 2007), Director of Credit Research, Portfolio Manager, Investment Analyst, and member of IPC, GIPC (since 2008), IIPC (since 2007), and FIIPC | | — |
| Diana S. Strandberg (49) | | Senior Vice President (Officer since 2005) | | Vice President of Dodge & Cox, Portfolio Manager, and member of IPC, GIPC (since 2008), and IIPC | | — |
| David H. Longhurst (52) | | Treasurer (Officer since 2006) | | Vice President and Assistant Treasurer of Dodge & Cox (since 2008); Vice President, Treasurer, Controller and Secretary of Safeco Mutual Funds, Safeco Asset Management Company, Safeco Services, Safeco Securities, and Safeco Investment Services (2000-2004) | | — |
| Thomas M. Mistele (55) | | Secretary
(Officer since 2000) | | Chief Operating Officer (since 2004), Director (since 2005), Secretary, and General Counsel of Dodge & Cox | | — |
| Marcia P. Venegas (40) | | Chief Compliance Officer
(Officer since 2004) | | Associate Chief Compliance Officer of Dodge & Cox (since 2008), Chief Compliance Officer of Dodge & Cox (2005-2008), Compliance Officer of Dodge & Cox (2003-2004) | | — |
| INDEPENDENT TRUSTEES |
| William F. Ausfahl (69) | | Trustee (Since 2002) | | CFO, The Clorox Co. (1982-1997); Director, The Clorox Co. (1984-1997) | | — |
| L. Dale Crandall (67) | | Trustee (Since 1999) | | President, Kaiser Foundation Health Plan, Inc. and Kaiser Foundation Hospitals (2000-2002); Senior Vice President—Finance and Administration & CFO, Kaiser Foundation Health Plan, Inc. and Kaiser Foundation Hospitals (1998-2000) | | Director, Ansell Limited (medical equipment and supplies) (2002-Present); Director, Coventry Health Care, Inc. (managed health care) (2004-Present); Director, Metavante Technologies, Inc. (software) (2007 to present) |
| Thomas A. Larsen (59) | | Trustee (Since 2002) | | Director in Howard, Rice, Nemerovski, Canady, Falk & Rabkin (law firm) | | — |
John B. Taylor (62) | | Trustee (Since 2005) | | Professor of Economics, Stanford University; Senior Fellow, Hoover Institution; Under Secretary for International Affairs, United States Treasury (2001-2005) | | — |
| Will C. Wood (69) | | Trustee (Since 1992) | | Principal, Kentwood Associates, Financial Advisers | | Director, Banco Latinoamericano de Exportaciones S.A. (Latin American foreign trade bank) (1999-Present) |
| * | | The address for each Officer and Trustee is 555 California Street, 40th Floor, San Francisco, California 94104. Each Officer and Trustee oversees all five series in the Dodge & Cox Funds complex and serves for an indefinite term. |
Additional information about the Trust’s Trustees and Officers is available in the Trust’s Statement of Additional Information (SAI). You can get a free copy of the SAI by visiting the Fund’s website at www.dodgeandcox.com or calling
1-800-621-3979.
PAGE 15 § DODGE & COX BALANCED FUND
| | | | |
| | | | |
www.dodgeandcox.com
For Fund literature, transactions, and account
information, please visit the Funds’ web site.
or write or call:
DODGE & COX FUNDS
c/o Boston Financial Data Services
P.O. Box 8422
Boston, Massachusetts 02266-8422
(800) 621-3979
INVESTMENT MANAGER
Dodge & Cox
555 California Street, 40th Floor
San Francisco, California 94104
(415) 981-1710
This report is submitted for the general information of the shareholders of the Fund. The report is not authorized for distribution to prospective investors in the Fund unless it is accompanied by a current prospectus.
This report reflects our views, opinions, and portfolio holdings as of June 30, 2009, the end of the reporting period. Any such views are subject to change at any time based upon market or other conditions and Dodge & Cox disclaims any responsibility to update such views. These views may not be relied on as investment advice and, because investment decisions for a Dodge & Cox Fund are based on numerous factors, may not be relied on as an indication of trading intent on behalf of any Dodge & Cox Fund.
6/09 IF SAR Printed on recycled paper
Semi-Annual Report
June 30, 2009
Income Fund
ESTABLISHED 1989
TICKER: DODIX
TO OUR SHAREHOLDERS
The Dodge & Cox Income Fund (the Fund) had a total return of 7.8% for the first half of 2009, compared to a return of 1.9% for the Barclays Capital Aggregate Bond Index (BCAG). Longer-term results can be found on page four. At June 30, the Fund had net assets of $15.0 billion with a cash position of 4.1%.
MARKET COMMENTARY
Broad U.S. economic conditions remained extremely weak during the first half of 2009, though nascent signs of stabilization emerged during the second quarter. The labor market continued its decline: 500,000 jobs on average were lost per month, and the unemployment rate reached a 26-year high of 9.5%. Retail sales and manufacturing sector indicators, despite recent improvements, lingered at recessionary levels. Housing market indicators recovered from all-time lows as new and existing home sales improved somewhat and lower mortgage rates prompted a surge in refinancings. Undoubtedly, the economy remains in recession. However, after a steady drumbeat of dismal economic news, the small improvements toward the end of the period raised hopes that the worst of the “Great Recession” may be behind us.
U.S. policymakers worked aggressively to stabilize the financial system, improve the flow of credit, and provide a foundation for economic recovery through the implementation of several new and targeted programs. Initial investor uncertainty about the government’s plans for addressing the capital adequacy of major U.S. banks later gave way to a meaningful rally in equity and credit markets as the results of the U.S. government’s “stress tests” of bank balance sheets were better than expected. Reflecting this increased confidence, the S&P 500 Index rallied 37% from its lows on March 9.
The changes in financial market sentiment had significant effects on the fixed income market. In a turnabout from 2008, U.S. Treasuries posted a negative return (-4.3%1) and underperformed all other fixed income market sectors in the first half of the year. Treasury prices were pushed lower by a sharp reversal of the “flight to quality” that prevailed in the second half of 2008, as well as concerns over the potential effects of aggressive fiscal and monetary policy stimulus on future
inflation. In contrast, a perceived moderation in the rate of economic decline, gradual dissipation of the financial crisis, and historically attractive valuations lured investors to corporate bonds. Investment-grade corporate bonds rebounded dramatically and returned 8.3% over the first half of 2009.
More moderate outperformance was recorded by the Government Sponsored Enterprise (GSE)–guaranteed2 Mortgage-backed Securities (MBS) sector, which returned 2.9%, outperforming comparable short-duration U.S. Treasuries by 3.0%. The beleaguered Commercial Mortgage-Backed Securities (CMBS) and asset-backed Securities (ABS) sectors—though they represent only a small portion of the BCAG—had a strong recovery, posting returns of 10.4% and 15.8%, respectively.
INVESTMENT STRATEGY
The Fund outperformed the BCAG by nearly six percentage points in the first half of 2009. This margin of outperformance represents a significant reversal of recent performance results, particularly in calendar year 2008 when the Fund lagged the BCAG by over five percentage points. The improved results were not driven by a major change in our investment strategy, but rather by the dramatic reversal in market conditions noted above. The performance recovery does, however, serve to illustrate several hallmarks of Dodge & Cox’s investment approach, namely: a focus on valuation and fundamental analysis of the risks and opportunities of specific securities, the conviction to maintain positions in the face of negative market feedback, and the importance of a long-term investment perspective.
The valuation component of our approach was particularly important as we managed the Fund through the challenges of the last two years. The Fund’s strong first-half performance was driven largely by a dramatic surge in the prices of corporate bonds, of which the Fund has a significant overweighting. That corporate bonds would excel in the most recent period was not intuitively obvious: the U.S. economy could charitably be described as “struggling.” Furthermore, prices of U.S. Treasury securities—the backbone of the fixed income market—were falling. Despite these factors, the Fund’s corporate
PAGE 1 § DODGE & COX INCOME FUND
holdings returned over 10% in the first half. This provides a near-clinical example of the importance of the often nebulous concept of “valuation.” In this case, the valuation of corporate securities, i.e., the market’s expectations for their future performance including the rate of default, severity of loss in event of default, and future price changes, was far too pessimistic at the end of 2008, even considering the difficult corporate operating environment that continues even now.
Since the end of 2008, we have made a number of notable changes to the Fund. We increased the Fund’s Corporate weighting by six percentage points (and 18 percentage points since the onset of the credit crisis), to over 49%. This is the highest allocation to corporate bonds in the Fund’s 20-year history. Our focus in this environment has been on companies that we believe have strong, defendable franchises, the ability to withstand a significant business downturn, and whose securities appear to be priced attractively. The Fund’s Corporate holdings have performed extremely well of late, outpacing the strong returns of the Corporate portion of the BCAG. Despite recent gains, corporate yield premiums remain wide by historical standards—particularly within the financial sector—and offer attractive long-term total return potential in our opinion.
We further reduced the Fund’s holdings of GSE-MBS to 37% at June 30; this weighting peaked in the fall of 2008 at 53%. Like the Fund’s Corporates, the GSE-MBS holdings have posted strong first-half relative returns (versus the MBS component of the BCAG). This was achieved through security selection: in particular, focusing the Fund’s holdings on mortgage securities backed by generally higher-rate mortgages. After significant research and analysis, we developed an insight that, despite very low current mortgage rates, many higher-rate mortgage loans would not be refinanced as fast as the market was expecting due to borrower credit issues, capacity constraints in the mortgage finance industry, and confusion associated with the bevy of new policies and regulations coming out of Washington. This has largely come to pass, rewarding the holders of these higher-
coupon mortgage securities with good performance. Nevertheless, MBS investors are now faced with considerably higher valuations and increased prepayment risk.3 In conjunction with more compelling opportunities within the corporate universe, these factors prompted the further reduction in the Fund’s MBS weighting this period.
We also established a new position in State of California General Obligation (GO) taxable municipal securities in the second quarter. On April 22, the state issued $6.9 billion in GO bonds with maturities ranging from 2014 through 2039. The long-dated maturities were issued under the U.S. government’s Build America Bonds (BAB) program, which provides a generous subsidy to the issuer. The BAB structure provided California with a cost-effective way to finance infrastructure projects that were at risk of being shut down or delayed. Despite a plethora of bad economic news and a (recently resolved) budgetary stalemate, we believe these bonds offer a compelling investment opportunity to the investor with a long-term horizon. California is an enormous and diversified economy in its own right and has a deep tax base. The servicing of California GO debt is backed by the full faith, credit, and taxing authority of the state. Per the state constitution, GO debt service is mandatory and has a claim on general fund revenues that is subordinated only to certain public education expenditures.4 We believe the bonds were offered at attractive valuations (yields of 5.1% for shorter-maturity bonds and 7.4% for the longer bonds) for the risks assumed, and we purchased a 1.5% position between several maturities for the Fund.
The Fund’s duration5 remains shorter than the BCAG, due to our concerns over the low absolute level of U.S. Treasury rates and the potential for future inflation in light of the substantial monetary and fiscal stimulus in place. Furthermore, the Fund’s significant nominal yield advantage, a result of the Fund’s focus on the higher-yielding Corporate and GSE-MBS sectors, could provide an important defensive element in a period of rising rates.
DODGE & COX INCOME FUND §PAGE 2
IN CLOSING
Markets can be highly volatile, and jumping in and out can be detrimental to long-term returns. Our experience over decades, and borne out this year, is that things can turn on a dime, making it notoriously difficult to time the market. We encourage our shareholders to take a long-term view of investing.
We appreciate the confidence you have placed in our firm and the patience you have demonstrated as a shareholder of the Dodge & Cox Income Fund. As always, we welcome your comments and questions.
For the Board of Trustees,
| | |
| | 
|
John A. Gunn, Chairman | | Dana M. Emery, Senior Vice President |
August 11, 2009
| 1 | | References to sector returns are as measured by the Barclays Capital Indices. |
| 2 | | The U.S. Government does not guarantee the Fund’s shares, yield and net asset value. The guarantee does not eliminate market risk. |
| 3 | | Prepayment would most likely be reinvested at lower interest rates. |
| 4 | | The State of California does not guarantee the Fund’s shares, yield and net asset value. The guarantee does not eliminate market risk. |
| 5 | | Duration is a measure of a bond’s price sensitivity to changes in interest rates. |
PERFORMANCE REVIEW
Key Contributors to Relative Results
| | § | | The Fund’s overweighting of the Corporate sector (44% at the beginning of the year versus 18% for the BCAG) significantly added to relative returns, given the sector’s unprecedented outperformance, particularly during the second quarter. We added approximately six percentage points to this weighting year-to-date, which further benefited relative returns. | |
| | § | | A strong recovery among many of the Fund’s Corporate holdings boosted returns: notably strong individual contributors included GMAC, Ford Motor Credit, HCA, Macy’s, SLM Corp., Boston Properties, and Cox Communications, offset slightly by poor performance from certain financial sector holdings including Bank of America cumulative capital securities and AIG. | |
| | § | | The Fund’s GSE-MBS holdings performed well relative to comparable U.S. Treasuries and the MBS sector of the BCAG. | |
| | § | | The Fund’s substantial nominal yield advantage enhanced returns, as did its underweight to U.S. Treasuries (both on a market value and duration basis). | |
Key Detractors from Relative Results
| | § | | The Fund holds no CMBS and very little ABS, both of which posted strong returns during the period. | |
PAGE 3 § DODGE & COX INCOME FUND
GROWTH OF $10,000 OVER 10 YEARS
FOR AN INVESTMENT MADE ON JUNE 30, 1999
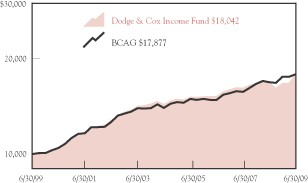
AVERAGE ANNUAL TOTAL RETURN
FOR PERIODS ENDED JUNE 30, 2009
| | | | | | | | | | | | |
| | | 1 Year | | | 5 Years | | | 10 Years | | | 20 Years | |
| | | | | | | | | | | | |
Dodge & Cox Income Fund | | 7.19 | % | | 4.65 | % | | 6.07 | % | | 7.24 | % |
Barclays Capital
Aggregate Bond Index (BCAG) | | 6.06 | | | 5.02 | | | 5.98 | | | 7.06 | |
Past performance does not guarantee future results. Investment return and share price will fluctuate with market conditions, and investors may have a gain or loss when shares are sold. Mutual fund performance changes over time and currently may be significantly lower than stated. Performance is updated and published monthly. Visit the Fund’s web site at www.dodgeandcox.com or call 1-800-621-3979 for current performance figures.
The Fund’s total returns include the reinvestment of dividend and capital gain distributions, but have not been adjusted for any income taxes payable by shareholders on these distributions. The Barclays Capital Aggregate Bond Index is a widely-recognized, unmanaged index of U.S. dollar-denominated investment-grade fixed income securities. Index returns include dividends and/or interest income but, unlike Fund returns, do not reflect fees or expenses.
Barclays Capital® is a trademark of Barclays PLC.
FUND EXPENSE EXAMPLE
As a Fund shareholder, you incur ongoing Fund costs, including management fees and other Fund expenses. All mutual funds have ongoing costs, sometimes referred to as operating expenses. The following example shows ongoing costs of investing in the Fund and can help you understand these costs and compare them with those of other mutual funds. The example assumes a $1,000 investment held for the six months indicated.
ACTUAL EXPENSES
The first line of the table below provides information about actual account values and expenses based on the Fund’s actual returns. You may use the information in this line, together with your account balance, to estimate the expenses that you paid over the period. Simply divide your account value by $1,000 (for example, an $8,600 account value divided by $1,000 = 8.6), then multiply the result by the number in the first line under the heading “Expenses Paid During Period” to estimate the expenses you paid on your account during this period.
HYPOTHETICAL EXAMPLE FOR COMPARISON WITH OTHER MUTUAL FUNDS
Information on the second line of the table can help you compare ongoing costs of investing in the Fund with those of other mutual funds. This information may not be used to estimate the actual ending account balance or expenses you paid during the period. The hypothetical “Ending Account Value” is based on the actual expense ratio of the Fund and an assumed 5% annual rate of return before expenses (not the Fund’s actual return). The amount under the heading “Expense Paid During the Period” shows the hypothetical expenses your account would have incurred under this scenario. You can compare this figure with the 5% hypothetical examples that appear in shareholder reports of other mutual funds.
| | | | | | | | | |
Six Months Ended June 30, 2009 | | Beginning Account Value
1/1/2009 | | Ending Account Value
6/30/2009 | | Expenses Paid
During Period* |
Based on Actual Fund Return | | $ | 1,000.00 | | $ | 1,077.50 | | $ | 2.26 |
Based on Hypothetical 5% Yearly Return | | | 1,000.00 | | | 1,022.62 | | | 2.20 |
| * | | Expenses are equal to the Fund’s annualized expense ratio of 0.44%, multiplied by the average account value over the period, multiplied by 181/365 (to reflect the one-half year period). |
The expenses shown in the table highlight ongoing costs only and do not reflect any transactional fees or account maintenance fees. While other mutual funds may charge such fees, please note that the Fund does not charge transaction fees (e.g., redemption fees, sales loads) or universal account maintenance fees (e.g., small account fees).
DODGE & COX INCOME FUND §PAGE 4
| | |
| FUND INFORMATION | | June 30, 2009 |
| | |
| GENERAL INFORMATION | | |
Net Asset Value Per Share | | $12.33 |
Total Net Assets (billions) | | $15.0 |
30-Day SEC Yield(a) | | 5.85% |
Expense Ratio (1/1/09 to 6/30/09, annualized) | | 0.44% |
Portfolio Turnover Rate (1/1/09 to 6/30/09, unannualized) | | 10% |
Fund Inception | | 1989 |
No sales charges or distribution fees | | |
Investment Manager: Dodge & Cox, San Francisco. Managed by the Fixed Income Investment Policy Committee, whose nine members’ average tenure at Dodge & Cox is 15 years.
| | | | | |
| PORTFOLIO CHARACTERISTICS | | Fund | | | BCAG |
Number of Fixed Income Securities | | 493 | (e) | | 8,820 |
Effective Maturity (years) | | 6.5 | | | 6.7 |
Effective Duration (years) | | 3.7 | | | 4.3 |
| | | |
| FIVE LARGEST CORPORATE ISSUERS(c) | | Fund | |
Wells Fargo & Co. | | 3.1 | % |
Ford Motor Credit Co. | | 2.9 | |
GMAC, Inc., and subsidiaries(e) | | 2.8 | |
Cox Communications, Inc. | | 2.4 | |
Time Warner, Inc. | | 2.3 | |
| | | | | | |
| CREDIT QUALITY(d,e) | | Fund | | | BCAG | |
U.S. Government & Government Related | | 43.2 | % | | 73.2 | % |
Aaa | | 1.7 | | | 5.8 | |
Aa | | 3.6 | | | 3.8 | |
A | | 15.2 | | | 9.6 | |
Baa | | 19.6 | | | 7.6 | |
Ba | | 4.6 | | | 0.0 | |
B | | 0.3 | | | 0.0 | |
Caa | | 4.9 | | | 0.0 | |
Ca | | 2.5 | | | 0.0 | |
C | | 0.3 | | | 0.0 | |
Cash Equivalents | | 4.1 | | | 0.0 | |
Average Quality | | A1 | | | Aa1 | |
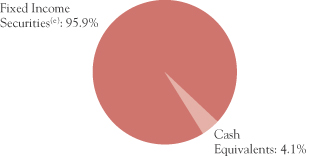
| | | | | | |
| SECTOR DIVERSIFICATION | | Fund | | | BCAG | |
U.S. Treasury & Government Related | | 7.4 | % | | 35.3 | % |
Mortgage-Related Securities | | 37.4 | | | 38.1 | |
Asset-Backed Securities/CMBS(b) | | 1.7 | | | 3.8 | |
Corporate(e) | | 49.4 | | | 18.7 | |
Non-Corporate Yankee | | 0.0 | | | 4.1 | |
Cash Equivalents | | 4.1 | | | 0.0 | |
| | | | | | |
| MATURITY DIVERSIFICATION | | Fund | | | BCAG | |
0-1 Years to Maturity | | 8.8 | % | | 0.0 | % |
1-5 | | 50.6 | | | 49.5 | |
5-10 | | 29.1 | | | 37.7 | |
10-15 | | 1.2 | | | 4.9 | |
15-20 | | 1.3 | | | 1.9 | |
20-25 | | 5.1 | | | 1.9 | |
25 and Over | | 3.6 | | | 4.1 | |
Preferred Stock (no maturity) | | 0.3 | | | 0.0 | |
| (a) | SEC yield is an annualization of the Fund’s total net investment income per share for the 30-day period ended on the last day of the month. |
| (b) | CMBS refers to commercial mortgage-backed securities, which are a component of the BCAG but not currently held by the Fund. |
| (c) | The Fund’s portfolio holdings are subject to change without notice. The mention of specific securities is not a recommendation or solicitation for any person to buy, sell, or hold any particular security. |
| (d) | The Fund’s credit quality ratings are from Moody’s Investor Services. If no Moody’s rating is available, the Standard & Poor’s or Fitch rating is reported. If unrated, the investment manager determines a comparable rating. The BCAG’s credit quality ratings are from Barclays Capital and reference Moody’s, Standard & Poor’s and Fitch ratings. The BCAG’s methodology for calculating average credit quality differs from that used by the Fund. Applying the BCAG methodology, the Fund’s average credit quality would be A1. The credit quality of the investments in the portfolio does not apply to the stability or safety of the Fund or its shares. |
| (e) | Includes cumulative preferred stock (Preferred Blocker, Inc., a subsidiary of GMAC, Inc.) representing 0.3% of the Fund’s net assets. |
PAGE 5 § DODGE & COX INCOME FUND
| | |
| PORTFOLIO OF INVESTMENTS (unaudited) | | June 30, 2009 |
| | | | | | |
| FIXED INCOME SECURITIES: 95.6% | | |
| | |
| | | PAR VALUE | | VALUE |
| U.S. TREASURY AND GOVERNMENT RELATED: 7.4% |
U.S. TREASURY: 3.3% | | | | | | |
U.S. Treasury Notes | | | | | | |
3.625%, 7/15/09 | | $ | 240,000,000 | | $ | 240,300,000 |
3.50%, 12/15/09 | | | 125,000,000 | | | 126,782,250 |
2.125%, 4/30/10 | | | 125,000,000 | | | 126,713,875 |
| | | | | | |
| | | | | | 493,796,125 |
GOVERNMENT RELATED: 4.1% | | | | | | |
California Taxable General Obligation | | | |
5.25%, 4/1/14 | | | 35,700,000 | | | 35,078,106 |
7.50%, 4/1/34 | | | 93,500,000 | | | 85,493,595 |
5.65%, 4/1/39 (mandatory put 4/1/13) | | | 18,650,000 | | | 18,359,246 |
7.55%, 4/1/39 | | | 93,450,000 | | | 85,075,945 |
Small Business Administration — 504 Program | | | |
Series 91-20K, 8.25%, 11/1/11 | | | 90,831 | | | 93,992 |
Series 92-20B, 8.10%, 2/1/12 | | | 163,791 | | | 167,983 |
Series 92-20C, 8.20%, 3/1/12 | | | 318,742 | | | 328,113 |
Series 92-20D, 8.20%, 4/1/12 | | | 173,086 | | | 178,787 |
Series 92-20G, 7.60%, 7/1/12 | | | 516,474 | | | 526,313 |
Series 92-20H, 7.40%, 8/1/12 | | | 352,699 | | | 362,268 |
Series 92-20I, 7.05%, 9/1/12 | | | 384,233 | | | 395,795 |
Series 92-20J, 7.00%, 10/1/12 | | | 483,395 | | | 499,358 |
Series 92-20K, 7.55%, 11/1/12 | | | 572,342 | | | 593,763 |
Series 92-20L, 7.45%, 12/1/12 | | | 236,685 | | | 246,248 |
Series 93-20B, 7.00%, 2/1/13 | | | 369,410 | | | 380,319 |
Series 93-20C, 6.50%, 3/1/13 | | | 1,450,430 | | | 1,497,156 |
Series 93-20D, 6.75%, 4/1/13 | | | 363,675 | | | 376,698 |
Series 93-20E, 6.55%, 5/1/13 | | | 1,812,928 | | | 1,882,498 |
Series 93-20F, 6.65%, 6/1/13 | | | 609,169 | | | 634,647 |
Series 93-20L, 6.30%, 12/1/13 | | | 938,713 | | | 983,479 |
Series 94-20A, 6.50%, 1/1/14 | | | 1,257,421 | | | 1,303,470 |
Series 94-20D, 7.70%, 4/1/14 | | | 268,092 | | | 283,260 |
Series 94-20E, 7.75%, 5/1/14 | | | 1,149,425 | | | 1,220,922 |
Series 94-20F, 7.60%, 6/1/14 | | | 618,654 | | | 651,956 |
Series 94-20G, 8.00%, 7/1/14 | | | 559,398 | | | 588,424 |
Series 94-20H, 7.95%, 8/1/14 | | | 444,061 | | | 471,627 |
Series 94-20I, 7.85%, 9/1/14 | | | 442,128 | | | 471,471 |
Series 94-20K, 8.65%, 11/1/14 | | | 435,913 | | | 458,945 |
Series 94-20L, 8.40%, 12/1/14 | | | 366,548 | | | 392,948 |
Series 95-20A, 8.50%, 1/1/15 | | | 160,055 | | | 170,787 |
Series 95-20C, 8.10%, 3/1/15 | | | 330,469 | | | 356,996 |
Series 97-20E, 7.30%, 5/1/17 | | | 742,933 | | | 810,687 |
Series 97-20J, 6.55%, 10/1/17 | | | 1,087,107 | | | 1,170,969 |
Series 98-20C, 6.35%, 3/1/18 | | | 4,909,605 | | | 5,260,846 |
Series 98-20H, 6.15%, 8/1/18 | | | 1,678,164 | | | 1,788,499 |
Series 98-20L, 5.80%, 12/1/18 | | | 1,055,498 | | | 1,110,410 |
Series 99-20C, 6.30%, 3/1/19 | | | 1,330,567 | | | 1,414,261 |
Series 99-20G, 7.00%, 7/1/19 | | | 3,087,633 | | | 3,321,449 |
Series 99-20I, 7.30%, 9/1/19 | | | 853,316 | | | 923,275 |
Series 01-20G, 6.625%, 7/1/21 | | | 8,512,915 | | | 9,177,583 |
Series 01-20L, 5.78%, 12/1/21 | | | 18,943,664 | | | 20,083,442 |
| | | | | | |
| | |
| | | PAR VALUE | | VALUE |
Series 02-20L, 5.10%, 12/1/22 | | $ | 5,052,920 | | $ | 5,273,646 |
Series 04-20L, 4.87%, 12/1/24 | | | 5,892,484 | | | 6,120,674 |
Series 05-20B, 4.625%, 2/1/25 | | | 8,340,942 | | | 8,598,806 |
Series 05-20E, 4.84%, 5/1/25 | | | 16,306,224 | | | 16,925,043 |
Series 05-20G, 4.75%, 7/1/25 | | | 15,435,098 | | | 16,041,110 |
Series 05-20I, 4.76%, 9/1/25 | | | 16,907,298 | | | 17,507,032 |
Series 06-20A, 5.21%, 1/1/26 | | | 17,545,456 | | | 18,313,868 |
Series 06-20B, 5.35%, 2/1/26 | | | 5,164,496 | | | 5,467,671 |
Series 06-20C, 5.57%, 3/1/26 | | | 26,162,979 | | | 27,914,601 |
Series 06-20G, 6.07%, 7/1/26 | | | 45,916,075 | | | 49,457,463 |
Series 06-20J, 5.37%, 10/1/26 | | | 15,204,640 | | | 16,119,622 |
Series 06-20L, 5.12%, 12/1/26 | | | 11,701,697 | | | 12,287,030 |
Series 07-20A, 5.32%, 1/1/27 | | | 24,960,023 | | | 26,436,551 |
Series 07-20C, 5.23%, 3/1/27 | | | 37,821,656 | | | 39,799,782 |
Series 07-20D, 5.32%, 4/1/27 | | | 38,158,034 | | | 40,420,630 |
Series 07-20G, 5.82%, 7/1/27 | | | 27,712,340 | | | 29,991,494 |
| | | | | | |
| | | | | | 621,261,559 |
| | | | | | |
| | | | | | 1,115,057,684 |
| MORTGAGE-RELATED SECURITIES: 37.4% |
FEDERAL AGENCY CMO & REMIC: 3.0% |
Dept. of Veterans Affairs | | | | | | |
Trust 1995-2D 4A, 9.293%, 5/15/25 | | | 319,670 | | | 353,849 |
Trust 1997-2Z, 7.50%, 6/15/27 | | | 24,343,230 | | | 26,556,954 |
Trust 1998-1 1A, 8.193%, 3/15/28 | | | 824,343 | | | 893,639 |
Fannie Mae | | | | | | |
Trust 1994-72 J, 6.00%, 6/25/23 | | | 706,667 | | | 708,695 |
Trust 1998-58 PX, 6.50%, 9/25/28 | | | 2,146,495 | | | 2,267,700 |
Trust 1998-58 PC, 6.50%, 10/25/28 | | | 12,249,072 | | | 13,041,838 |
Series 2001-69 PQ, 6.00%, 12/25/31 | | | 17,923,574 | | | 18,680,325 |
Trust 2002-33 A1, 7.00%, 6/25/32 | | | 4,519,354 | | | 4,903,500 |
Series 2008-24 GD, 6.50%, 3/25/37 | | | 44,698,225 | | | 47,060,410 |
Trust 2001-T4 A1, 7.50%, 7/25/41 | | | 3,882,260 | | | 4,195,267 |
Trust 2001-T10 A1, 7.00%, 12/25/41 | | | 6,232,413 | | | 6,668,682 |
Trust 2002-90 A1, 6.50%, 6/25/42 | | | 8,266,562 | | | 8,802,597 |
Trust 2002-W6 2A1, 7.00%, 6/25/42 | | | 6,721,004 | | | 7,292,290 |
Trust 2002-W8 A2, 7.00%, 6/25/42 | | | 3,576,135 | | | 3,915,868 |
Trust 2003-W2 1A2, 7.00%, 7/25/42 | | | 20,990,076 | | | 22,774,233 |
Trust 2003-W4 3A, 7.00%, 10/25/42 | | | 6,469,222 | | | 7,083,798 |
Trust 2003-07 A1, 6.50%, 12/25/42 | | | 8,436,018 | | | 8,928,682 |
Trust 2003-W1 1A1, 6.50%, 12/25/42 | | | 13,328,631 | | | 14,192,910 |
Trust 2003-W1 2A, 7.50%, 12/25/42 | | | 6,090,874 | | | 6,581,951 |
Trust 2004-W2 5A, 7.50%, 3/25/44 | | | 25,816,253 | | | 27,897,689 |
Trust 2004-W8 3A, 7.50%, 6/25/44 | | | 16,355,524 | | | 17,674,188 |
Trust 2005-W1 1A3, 7.00%, 10/25/44 | | | 14,714,436 | | | 16,112,308 |
Trust 2001-79 BA, 7.00%, 3/25/45 | | | 1,880,999 | | | 2,059,694 |
Trust 2006-W1 1A1, 6.50%, 12/25/45 | | | 1,971,986 | | | 2,099,857 |
Trust 2006-W1 1A2, 7.00%, 12/25/45 | | | 13,141,827 | | | 14,390,301 |
Trust 2006-W1 1A3, 7.50%, 12/25/45 | | | 209,218 | | | 230,270 |
Trust 2006-W1 1A4, 8.00%, 12/25/45 | | | 15,234,518 | | | 16,772,260 |
Trust 2007-W10 1A, 6.145%, 8/25/47 | | | 86,475,212 | | | 91,720,799 |
Trust 2007-W10 2A, 6.137%, 8/25/47 | | | 23,784,764 | | | 24,951,844 |
| | |
| See accompanying Notes to Financial Statements | | DODGE & COX INCOME FUND §PAGE 6 |
| | |
| PORTFOLIO OF INVESTMENTS (unaudited) | | June 30, 2009 |
| | | | | | |
| FIXED INCOME SECURITIES (continued) | | |
| | |
| | | PAR VALUE | | VALUE |
Freddie Mac | | | | | | |
Series 2439 LG, 6.00%, 9/15/30 | | $ | 948,410 | | $ | 952,422 |
Series 3312 AB, 6.50%, 6/15/32 | | | 25,807,855 | | | 27,597,332 |
Series T-48 1A, 7.071%, 7/25/33 | | | 5,976,292 | | | 6,498,993 |
Ginnie Mae | | | | | | |
Series 1999-29 PB, 7.25%, 7/16/28 | | | 773,877 | | | 785,982 |
| | | | | | |
| | | | | | 454,647,127 |
FEDERAL AGENCY MORTGAGE PASS-THROUGH: 34.3% |
Fannie Mae, 10 Year | | | | | | |
6.00%, 11/1/16 | | | 11,850,622 | | | 12,265,742 |
Fannie Mae, 15 Year | | | | | | |
5.50%, 9/1/14-1/1/22 | | | 302,819,543 | | | 319,270,173 |
6.00%, 4/1/13-3/1/23 | | | 926,605,520 | | | 984,739,521 |
6.50%, 11/1/12-11/1/18 | | | 115,334,696 | | | 122,418,680 |
7.00%, 12/1/10-12/1/11 | | | 300,291 | | | 310,782 |
7.50%, 11/1/14-8/1/17 | | | 10,635,780 | | | 11,327,749 |
Fannie Mae, 20 Year | | | | | | |
6.00%, 2/1/28 | | | 49,786,578 | | | 52,305,310 |
6.50%, 4/1/19-10/1/24 | | | 43,033,485 | | | 46,236,650 |
Fannie Mae, 30 Year | | | | | | |
6.00%, 11/1/28-3/1/36 | | | 275,922,696 | | | 291,284,277 |
6.50%, 12/1/32-5/1/38 | | | 680,924,339 | | | 725,801,270 |
7.00%, 4/1/32-12/1/37 | | | 277,048,298 | | | 300,954,066 |
8.00%, 1/1/12 | | | 41,246 | | | 43,831 |
Fannie Mae, Hybrid ARM | | | | | | |
3.932%, 10/1/33 | | | 14,930,828 | | | 15,201,443 |
4.151%, 12/1/36 | | | 21,563,848 | | | 22,020,182 |
4.201%, 9/1/34 | | | 12,131,912 | | | 12,265,974 |
4.208%, 1/1/35 | | | 12,607,126 | | | 12,888,455 |
4.479%, 7/1/34 | | | 13,988,275 | | | 14,358,835 |
4.488%, 8/1/34 | | | 15,326,222 | | | 15,892,868 |
4.491%, 1/1/35 | | | 9,644,664 | | | 9,891,992 |
4.50%, 6/1/35-7/1/35 | | | 16,101,710 | | | 16,691,137 |
4.595%, 10/1/34 | | | 15,927,524 | | | 16,384,724 |
4.616%, 8/1/34 | | | 3,373,549 | | | 3,417,140 |
4.643%, 8/1/35 | | | 16,168,151 | | | 16,703,541 |
4.704%, 1/1/36 | | | 22,448,763 | | | 23,268,568 |
4.716%, 7/1/35 | | | 13,010,601 | | | 13,502,982 |
4.743%, 1/1/36 | | | 20,196,759 | | | 20,926,367 |
4.749%, 7/1/35 | | | 12,117,571 | | | 12,584,979 |
4.755%, 10/1/35 | | | 22,317,367 | | | 23,162,004 |
4.787%, 8/1/35 | | | 41,656,805 | | | 43,140,035 |
4.805%, 11/1/36 | | | 15,483,357 | | | 16,036,757 |
4.861%, 12/1/35 | | | 14,556,785 | | | 15,043,618 |
4.914%, 10/1/35 | | | 11,474,549 | | | 11,867,625 |
4.981%, 4/1/35 | | | 20,156,861 | | | 20,823,104 |
5.00%, 9/1/35 | | | 15,868,144 | | | 16,504,501 |
5.085%, 7/1/35 | | | 14,403,472 | | | 14,916,143 |
5.228%, 1/1/37 | | | 24,959,339 | | | 25,867,859 |
5.269%, 11/1/35 | | | 13,869,504 | | | 14,272,717 |
Fannie Mae, Multifamily DUS | | | | | | |
Pool 760744, 4.75%, 3/1/15 | | | 13,590,000 | | | 14,127,105 |
| | | | | | |
| | |
| | | PAR VALUE | | VALUE |
Pool 555162, 4.826%, 1/1/13 | | $ | 14,365,698 | | $ | 15,100,755 |
Pool 555191, 4.858%, 2/1/13 | | | 14,509,217 | | | 15,265,835 |
Pool 545892, 5.235%, 10/1/12 | | | 42,697,681 | | | 45,291,285 |
Pool 888559, 5.424%, 6/1/17 | | | 36,425,148 | | | 38,945,052 |
Pool 888015, 5.548%, 11/1/16 | | | 47,645,148 | | | 51,372,656 |
Pool 555172, 5.677%, 12/1/12 | | | 2,494,427 | | | 2,652,193 |
Pool 545987, 5.835%, 9/1/12 | | | 18,705,283 | | | 20,127,125 |
Pool 545685, 5.932%, 4/1/12 | | | 21,749,442 | | | 23,039,002 |
Pool 545708, 6.047%, 5/1/12 | | | 1,848,657 | | | 1,979,012 |
Pool 545547, 6.095%, 3/1/12 | | | 12,323,651 | | | 13,268,180 |
Pool 545527, 6.113%, 2/1/12 | | | 8,694,934 | | | 9,353,267 |
Pool 545209, 6.13%, 10/1/11 | | | 23,437,159 | | | 25,097,284 |
Pool 545059, 6.224%, 5/1/11 | | | 21,879,537 | | | 23,108,429 |
Pool 545179, 6.253%, 9/1/11 | | | 16,463,541 | | | 17,512,552 |
Freddie Mac Gold, 10 Year | | | | | | |
6.00%, 9/1/16 | | | 5,931,591 | | | 6,316,774 |
Freddie Mac Gold, 15 Year | | | | | | |
5.50%, 11/1/13-10/1/20 | | | 106,027,802 | | | 111,549,909 |
6.00%, 4/1/13-11/1/23 | | | 287,004,668 | | | 304,152,668 |
6.50%, 2/1/11-9/1/18 | | | 41,495,484 | | | 43,986,644 |
7.00%, 12/1/11-3/1/12 | | | 434,014 | | | 447,738 |
Freddie Mac Gold, 20 Year | | | | | | |
5.50%, 11/1/23 | | | 52,793,420 | | | 54,929,616 |
6.00%, 7/1/25 | | | 12,378,893 | | | 13,053,860 |
6.50%, 7/1/21-10/1/26 | | | 30,234,393 | | | 32,445,064 |
Freddie Mac Gold, 30 Year | | | | | | |
6.00%, 2/1/33 | | | 29,910,127 | | | 31,509,033 |
6.50%, 5/1/17-3/1/38 | | | 368,232,231 | | | 391,762,158 |
7.00%, 4/1/31 | | | 15,956,998 | | | 17,458,011 |
7.90%, 2/17/21 | | | 1,868,318 | | | 2,035,280 |
Freddie Mac Gold, Hybrid ARM | | | | | | |
4.147%, 1/1/35 | | | 11,506,060 | | | 11,866,797 |
4.265%, 3/1/35 | | | 6,737,632 | | | 6,829,967 |
4.318%, 8/1/34 | | | 6,819,536 | | | 6,921,983 |
4.39%, 9/1/35 | | | 24,537,946 | | | 25,331,067 |
4.528%, 4/1/35 | | | 5,576,239 | | | 5,647,572 |
4.653%, 4/1/36 | | | 23,497,443 | | | 24,248,858 |
4.678%, 8/1/35 | | | 10,546,115 | | | 10,765,690 |
4.734%, 2/1/34 | | | 40,033,664 | | | 41,254,291 |
4.74%, 8/1/35 | | | 13,765,584 | | | 14,263,573 |
4.832%, 2/1/35 | | | 8,357,754 | | | 8,653,214 |
4.845%, 10/1/35-1/1/36 | | | 34,493,468 | | | 35,746,143 |
5.14%, 1/1/36 | | | 54,142,966 | | | 56,328,671 |
5.148%, 9/1/33 | | | 40,169,126 | | | 41,020,633 |
5.156%, 5/1/37 | | | 22,244,958 | | | 23,163,826 |
5.30%, 1/1/37 | | | 20,940,028 | | | 21,713,552 |
5.325%, 7/1/37 | | | 58,694,224 | | | 60,987,407 |
5.429%, 3/1/37 | | | 37,174,516 | | | 38,839,925 |
5.528%, 4/1/37 | | | 52,589,780 | | | 55,054,247 |
5.863%, 8/1/36 | | | 21,985,530 | | | 22,567,465 |
5.962%, 1/1/36 | | | 16,168,326 | | | 16,696,383 |
Ginnie Mae, 30 Year | | | | | | |
7.00%, 5/15/28 | | | 1,536,205 | | | 1,669,796 |
| | |
| PAGE 7 § DODGE & COX INCOME FUND | | See accompanying Notes to Financial Statements |
| | |
| PORTFOLIO OF INVESTMENTS (unaudited) | | June 30, 2009 |
| | | | | | |
| FIXED INCOME SECURITIES (continued) | | |
| | |
| | | PAR VALUE | | VALUE |
7.50%, 9/15/17-5/15/25 | | $ | 5,081,102 | | $ | 5,543,004 |
7.80%, 6/15/20-1/15/21 | | | 1,372,322 | | | 1,495,892 |
| | | | | | |
| | | | | | 5,157,088,044 |
PRIVATE LABEL CMO & REMIC SECURITIES: 0.1% |
GSMPS Mortgage Loan Trust(b) | | | | | | |
Series 2004-4 1A4, 8.50%, 6/25/34 | | | 10,022,908 | | | 11,033,296 |
| | | | | | |
| | | | | | 5,622,768,467 |
| ASSET-BACKED SECURITIES: 1.7% | | | |
STUDENT LOAN: 1.7% | | | | | | |
SLM Student Loan Trust | | | | | | |
Series 2008-3 A1, 1.592%, 1/25/14 | | | 8,751,462 | | | 8,726,069 |
Series 2007-8 A1, 1.322%, 7/27/15 | | | 3,322,653 | | | 3,322,394 |
Series 2006-7 A2, 1.082%, 10/25/16 | | | 3,056,119 | | | 3,056,316 |
Series 2006-8 A2, 1.092%, 10/25/16 | | | 14,420,935 | | | 14,296,496 |
Series 2005-2 A4, 1.172%, 4/25/17 | | | 27,677,167 | | | 27,335,700 |
Series 2007-2 A2, 1.092%, 7/25/17 | | | 133,175,000 | | | 129,400,687 |
Series 2007-3 A2, 1.102%, 10/25/17 | | | 10,000,000 | | | 9,657,523 |
Series 2006-3A 4, 1.172%, 7/25/19 | | | 56,000,000 | | | 53,627,442 |
| | | | | | |
| | | | | | 249,422,627 |
| CORPORATE: 49.1% | | | | | | |
FINANCIALS: 17.1% | | | | | | |
American International Group, Inc.(b) | | | | | | |
8.25%, 8/15/18 | | | 78,800,000 | | | 45,802,500 |
Bank of America Corp. | | | | | | |
7.375%, 5/15/14 | | | 74,185,000 | | | 76,634,292 |
5.30%, 3/15/17 | | | 105,000,000 | | | 89,086,935 |
7.625%, 6/1/19 | | | 37,940,000 | | | 38,109,250 |
8.00%, 12/15/26(a) | | | 14,615,000 | | | 12,276,600 |
5.625%, 3/8/35(a) | | | 21,450,000 | | | 13,947,262 |
6.625%, 5/23/36(a) | | | 64,470,000 | | | 48,617,085 |
Boston Properties, Inc. | | | | | | |
6.25%, 1/15/13 | | | 74,643,000 | | | 74,296,806 |
5.625%, 4/15/15 | | | 35,160,000 | | | 32,694,214 |
5.00%, 6/1/15 | | | 17,444,000 | | | 15,604,212 |
2.875%, 2/15/37 | | | 27,250,000 | | | 23,877,812 |
Capital One Financial Corp. | | | | | | |
7.375%, 5/23/14 | | | 32,050,000 | | | 33,049,319 |
6.75%, 9/15/17 | | | 134,408,000 | | | 126,154,981 |
CIGNA Corp. | | | | | | |
7.00%, 1/15/11 | | | 13,665,000 | | | 14,127,533 |
6.375%, 10/15/11 | | | 28,755,000 | | | 29,529,315 |
8.50%, 5/1/19 | | | 46,685,000 | | | 47,332,381 |
7.65%, 3/1/23 | | | 3,597,000 | | | 3,224,178 |
7.875%, 5/15/27 | | | 27,840,000 | | | 24,361,477 |
8.30%, 1/15/33 | | | 7,445,000 | | | 6,184,480 |
6.15%, 11/15/36 | | | 38,000,000 | | | 27,208,304 |
Citigroup, Inc. | | | | | | |
6.125%, 11/21/17 | | | 77,115,000 | | | 68,381,445 |
2.583%, 5/15/18 | | | 161,000,000 | | | 126,391,572 |
General Electric Capital Corp. | | | | | | |
5.90%, 5/13/14 | | | 29,165,000 | | | 29,933,614 |
| | | | | | |
| | |
| | | PAR VALUE | | VALUE |
GMAC, Inc.(b) | | | | | | |
6.875%, 9/15/11 | | $ | 365,615,000 | | $ | 319,913,125 |
6.875%, 8/28/12 | | | 35,495,000 | | | 29,638,325 |
8.00%, 11/1/31 | | | 38,745,000 | | | 27,121,500 |
Health Net, Inc. | | | | | | |
6.375%, 6/1/17 | | | 46,160,000 | | | 34,966,200 |
HSBC Holdings PLC(c) (United Kingdom) | | | |
6.50%, 5/2/36 | | | 41,875,000 | | | 40,617,899 |
6.50%, 9/15/37 | | | 78,475,000 | | | 75,909,888 |
JPMorgan Chase & Co. | | | | | | |
8.75%, 9/1/30(a) | | | 26,480,000 | | | 24,875,736 |
5.875%, 3/15/35(a) | | | 14,625,000 | | | 11,691,894 |
5.85%, 8/1/35(a) | | | 22,090,000 | | | 16,683,573 |
Kaupthing Bank HF(b),(c),(e) (Iceland) | | | | | | |
7.125%, 5/19/16 | | | 118,913,000 | | | 11,891 |
Liberty Mutual Group, Inc.(b) | | | | | | |
4.875%, 2/1/10 | | | 15,225,000 | | | 14,951,495 |
7.25%, 9/1/12 | | | 18,122,000 | | | 16,200,290 |
SLM Corp. | | | | | | |
8.45%, 6/15/18 | | | 124,500,000 | | | 106,507,882 |
Travelers Cos., Inc. | | | | | | |
8.125%, 4/15/10 | | | 21,575,000 | | | 22,494,397 |
5.00%, 3/15/13 | | | 17,118,000 | | | 17,210,971 |
5.50%, 12/1/15 | | | 14,152,000 | | | 14,437,891 |
6.25%, 6/20/16 | | | 44,360,000 | | | 46,982,178 |
5.75%, 12/15/17 | | | 36,040,000 | | | 37,193,821 |
Unum Group | | | | | | |
7.625%, 3/1/11 | | | 11,496,000 | | | 11,488,459 |
6.85%, 11/15/15(b) | | | 21,150,000 | | | 17,432,190 |
7.19%, 2/1/28 | | | 11,640,000 | | | 7,257,864 |
7.25%, 3/15/28 | | | 25,730,000 | | | 17,144,617 |
6.75%, 12/15/28 | | | 8,005,000 | | | 5,277,288 |
WellPoint, Inc. | | | | | | |
6.375%, 1/15/12 | | | 7,662,000 | | | 7,981,482 |
5.00%, 12/15/14 | | | 15,685,000 | | | 15,366,395 |
5.25%, 1/15/16 | | | 128,485,000 | | | 121,729,259 |
7.00%, 2/15/19 | | | 34,760,000 | | | 35,933,741 |
Wells Fargo & Co. | | | | | | |
1.23%, 4/23/12 | | | 154,790,000 | | | 146,151,698 |
2.798%, 5/1/13 | | | 166,000,000 | | | 158,994,133 |
6.00%, 11/15/17 | | | 80,000,000 | | | 77,120,222 |
5.75%, 2/1/18 | | | 84,060,000 | | | 82,555,830 |
| | | | | | |
| | | | | | 2,568,667,701 |
INDUSTRIALS: 28.1% | | | | | | |
AT&T, Inc. | | | | | | |
4.95%, 1/15/13 | | | 14,792,000 | | | 15,383,769 |
8.00%, 11/15/31 | | | 160,005,000 | | | 184,674,731 |
BHP Billiton, Ltd.(c) (Australia) 5.50%, 4/1/14 | | | 73,575,000 | | | 78,927,066 |
Boston Scientific Corp.
5.45%, 6/15/14 | | | 51,258,000 | | | 47,157,360 |
6.25%, 11/15/15 | | | 15,000,000 | | | 13,875,000 |
6.40%, 6/15/16 | | | 79,562,000 | | | 73,992,660 |
| | |
| See accompanying Notes to Financial Statements | | DODGE & COX INCOME FUND §PAGE 8 |
| | |
| PORTFOLIO OF INVESTMENTS (unaudited) | | June 30, 2009 |
| | | | | | |
| FIXED INCOME SECURITIES (continued) | | |
| | |
| | | PAR VALUE | | VALUE |
Comcast Corp.
5.30%, 1/15/14 | | $ | 47,975,000 | | $ | 49,613,202 |
5.85%, 11/15/15 | | | 24,985,000 | | | 25,892,505 |
5.90%, 3/15/16 | | | 41,765,000 | | | 43,202,718 |
6.50%, 1/15/17 | | | 42,020,000 | | | 44,577,463 |
6.30%, 11/15/17 | | | 31,370,000 | | | 33,201,036 |
5.875%, 2/15/18 | | | 58,260,000 | | | 59,056,647 |
6.45%, 3/15/37 | | | 3,120,000 | | | 3,074,882 |
6.95%, 8/15/37 | | | 10,674,000 | | | 11,129,556 |
Covidien PLC(c) (Ireland)
6.00%, 10/15/17 | | | 32,700,000 | | | 34,774,750 |
Cox Communications, Inc. | | | | | | |
5.45%, 12/15/14 | | | 114,974,000 | | | 114,133,195 |
5.875%, 12/1/16(b) | | | 78,390,000 | | | 76,879,033 |
9.375%, 1/15/19(b) | | | 88,095,000 | | | 106,078,009 |
8.375%, 3/1/39(b) | | | 57,000,000 | | | 63,554,031 |
Dillard’s, Inc. | | | | | | |
9.50%, 9/1/09 | | | 550,000 | | | 545,875 |
7.85%, 10/1/12 | | | 1,900,000 | | | 1,607,875 |
7.13%, 8/1/18 | | | 24,015,000 | | | 13,568,475 |
7.75%, 7/15/26 | | | 21,666,000 | | | 10,399,680 |
7.75%, 5/15/27 | | | 12,903,000 | | | 6,128,925 |
7.00%, 12/1/28 | | | 28,825,000 | | | 13,980,125 |
Dow Chemical Co. | | | | | | |
4.027%, 9/30/09(b) | | | 54,087,000 | | | 53,974,607 |
6.00%, 10/1/12 | | | 9,875,000 | | | 10,151,202 |
8.55%, 5/15/19 | | | 106,100,000 | | | 106,288,858 |
7.375%, 11/1/29 | | | 48,884,000 | | | 44,427,050 |
9.40%, 5/15/39 | | | 44,090,000 | | | 45,385,276 |
Ford Motor Credit Co.(f) | | | | | | |
7.375%, 2/1/11 | | | 305,048,000 | | | 276,152,328 |
7.25%, 10/25/11 | | | 186,055,000 | | | 162,332,987 |
7.80%, 6/1/12 | | | 525,000 | | | 448,875 |
General Electric Co.
5.00%, 2/1/13 | | | 31,739,000 | | | 33,024,937 |
HCA, Inc. | | | | | | |
8.75%, 9/1/10 | | | 28,685,000 | | | 28,756,712 |
7.875%, 2/1/11 | | | 54,800,000 | | | 53,909,500 |
6.95%, 5/1/12 | | | 147,133,000 | | | 137,569,355 |
6.30%, 10/1/12 | | | 27,100,000 | | | 24,864,250 |
6.25%, 2/15/13 | | | 39,655,000 | | | 34,698,125 |
6.75%, 7/15/13 | | | 9,603,000 | | | 8,450,640 |
5.75%, 3/15/14 | | | 17,175,000 | | | 13,740,000 |
Hewlett-Packard Co.
6.125%, 3/1/14 | | | 195,625,000 | | | 215,632,547 |
Lafarge SA(c) (France)
6.50%, 7/15/16 | | | 69,585,000 | | | 63,981,877 |
Liberty Media Corp. | | | | | | |
8.50%, 7/15/29 | | | 12,043,000 | | | 8,309,670 |
8.25%, 2/1/30 | | | 29,445,000 | | | 20,280,244 |
Macy’s, Inc. | | | | | | |
8.00%, 7/15/12 | | | 11,372,000 | | | 10,822,061 |
7.625%, 8/15/13 | | | 7,155,000 | | | 6,189,075 |
| | | | | | |
| | |
| | | PAR VALUE | | VALUE |
8.875%, 7/15/15 | | $ | 70,935,000 | | $ | 68,274,937 |
6.65%, 7/15/24 | | | 6,735,000 | | | 4,460,388 |
7.00%, 2/15/28 | | | 31,350,000 | | | 22,993,187 |
6.70%, 9/15/28 | | | 20,550,000 | | | 14,616,188 |
6.90%, 4/1/29 | | | 31,755,000 | | | 22,228,500 |
6.90%, 1/15/32 | | | 35,070,000 | | | 23,003,886 |
6.70%, 7/15/34 | | | 71,317,000 | | | 47,587,053 |
6.375%, 3/15/37 | | | 8,025,000 | | | 5,455,732 |
Nordstrom, Inc. | | | | | | |
6.75%, 6/1/14 | | | 44,265,000 | | | 46,013,999 |
6.25%, 1/15/18 | | | 16,725,000 | | | 16,432,814 |
6.95%, 3/15/28 | | | 12,620,000 | | | 11,431,371 |
Pfizer, Inc.
4.45%, 3/15/12 | | | 93,630,000 | | | 98,240,248 |
Reed Elsevier PLC(c) (United Kingdom) | | | |
7.75%, 1/15/14 | | | 6,275,000 | | | 6,625,747 |
8.625%, 1/15/19 | | | 83,775,000 | | | 95,183,144 |
Roche Holding AG(b),(c) (Switzerland) | | | |
4.50%, 3/1/12 | | | 112,425,000 | | | 118,191,840 |
6.00%, 3/1/19 | | | 65,675,000 | | | 70,028,005 |
Sprint Nextel Corp. | | | | | | |
6.00%, 12/1/16 | | | 91,530,000 | | | 74,825,775 |
6.90%, 5/1/19 | | | 16,110,000 | | | 13,331,025 |
6.875%, 11/15/28 | | | 24,290,000 | | | 17,245,900 |
Time Warner Cable, Inc. | | | | | | |
8.75%, 2/14/19 | | | 39,074,000 | | | 45,518,944 |
8.25%, 4/1/19 | | | 67,095,000 | | | 76,127,128 |
Time Warner, Inc. | | | | | | |
7.625%, 4/15/31 | | | 197,133,000 | | | 191,644,029 |
7.70%, 5/1/32 | | | 155,313,000 | | | 152,620,804 |
Wyeth | | | | | | |
5.50%, 2/1/14 | | | 110,715,000 | | | 118,490,847 |
5.50%, 2/15/16 | | | 15,000,000 | | | 15,514,930 |
5.45%, 4/1/17 | | | 47,445,000 | | | 49,543,777 |
Xerox Corp. | | | | | | |
7.125%, 6/15/10 | | | 77,900,000 | | | 80,596,442 |
6.875%, 8/15/11 | | | 52,650,000 | | | 54,492,750 |
8.25%, 5/15/14 | | | 29,200,000 | | | 30,364,000 |
6.40%, 3/15/16 | | | 38,716,000 | | | 35,618,720 |
7.20%, 4/1/16 | | | 25,591,000 | | | 24,055,540 |
6.75%, 2/1/17 | | | 46,321,000 | | | 42,152,110 |
6.35%, 5/15/18 | | | 63,074,000 | | | 56,348,361 |
| | | | | | |
| | | | | | 4,234,056,865 |
TRANSPORTATION: 3.9% | | | | | | |
Burlington Northern Santa Fe Corp. | | | |
4.30%, 7/1/13 | | | 7,883,000 | | | 7,880,091 |
4.875%, 1/15/15 | | | 13,135,000 | | | 13,293,881 |
7.57%, 1/2/21 | | | 20,428,842 | | | 22,999,416 |
8.251%, 1/15/21 | | | 6,639,468 | | | 7,777,754 |
5.72%, 1/15/24 | | | 26,121,631 | | | 26,195,618 |
5.629%, 4/1/24 | | | 37,337,692 | | | 37,231,425 |
5.342%, 4/1/24 | | | 8,813,154 | | | 8,680,951 |
5.996%, 4/1/24 | | | 48,568,891 | | | 49,557,249 |
| | |
| PAGE 9 § DODGE & COX INCOME FUND | | See accompanying Notes to Financial Statements |
| | |
| PORTFOLIO OF INVESTMENTS (unaudited) | | June 30, 2009 |
| | | | | | |
| FIXED INCOME SECURITIES (continued) | | |
| | |
| | | PAR VALUE | | VALUE |
CSX Corp. | | | | | | |
9.75%, 6/15/20 | | $ | 10,272,000 | | $ | 11,958,128 |
6.251%, 1/15/23 | | | 22,073,281 | | | 21,812,188 |
FedEx Corp. | | | | | | |
7.375%, 1/15/14 | | | 22,680,000 | | | 24,494,332 |
8.00%, 1/15/19 | | | 18,485,000 | | | 21,065,377 |
6.72%, 7/15/23 | | | 22,399,130 | | | 23,182,999 |
7.65%, 7/15/24 | | | 2,669,229 | | | 2,910,252 |
Norfolk Southern Corp. | | | | | | |
7.70%, 5/15/17 | | | 29,475,000 | | | 32,305,867 |
9.75%, 6/15/20 | | | 14,188,000 | | | 18,857,484 |
Union Pacific Corp. | | | | | | |
6.50%, 4/15/12 | | | 12,337,000 | | | 12,999,805 |
5.375%, 5/1/14 | | | 22,886,000 | | | 23,489,161 |
4.875%, 1/15/15 | | | 10,764,000 | | | 10,823,137 |
6.85%, 1/2/19 | | | 6,851,499 | | | 7,306,679 |
7.875%, 1/15/19 | | | 13,425,000 | | | 15,367,383 |
6.70%, 2/23/19 | | | 8,477,208 | | | 9,026,093 |
7.60%, 1/2/20 | | | 1,524,212 | | | 1,701,700 |
6.125%, 2/15/20 | | | 47,300,000 | | | 49,045,323 |
6.061%, 1/17/23 | | | 16,040,251 | | | 16,187,716 |
4.698%, 1/2/24 | | | 5,845,024 | | | 5,451,043 |
5.082%, 1/2/29 | | | 10,617,815 | | | 10,173,700 |
5.866%, 7/2/30 | | | 59,703,067 | | | 55,092,809 |
6.176%, 1/2/31 | | | 41,075,347 | | | 41,731,879 |
| | | | | | |
| | | | | | 588,599,440 |
| | | | | | |
| | | | | | 7,391,324,006 |
| | | | | | |
TOTAL FIXED INCOME SECURITIES
(Cost $14,555,395,015) | | $ | 14,378,572,784 |
| | | | | | |
|
| PREFERRED STOCKS: 0.3% |
| FINANCIALS: 0.3% | | | |
DIVERSIFIED FINANCIALS: 0.3% | | | |
Preferred Blocker, Inc.
(a subsidiary of GMAC, Inc.)(b) | | | 116,113 | | | 49,935,847 |
| | | | | | |
TOTAL PREFERRED STOCKS
(Cost $23,222,600) | | $ | 49,935,847 |
| | | | | | |
| | | | | | | |
| SHORT-TERM INVESTMENTS: 2.7% |
| | |
| | | PAR VALUE | | | VALUE |
COMMERCIAL PAPER: 0.2% | | | | |
CIGNA Corp.(b) 7/27/09 | | $ | 30,000,000 | | | $ | 29,976,167 |
| |
MONEY MARKET FUND: 0.3% | | | | |
SSgA Prime Money Market Fund | | | 45,111,262 | | | | 45,111,262 |
| |
REPURCHASE AGREEMENT: 2.2% | | | | |
Fixed Income Clearing Corporation(d) 0.03%, 7/1/09, maturity value $335,223,279 | | | 335,223,000 | | | | 335,223,000 |
| | | | | | | |
TOTAL SHORT-TERM INVESTMENTS
(Cost $410,310,429) | | | $ | 410,310,429 |
| | | | | | | |
TOTAL INVESTMENTS
(Cost $14,988,928,044) | | | 98.6 | % | | $ | 14,838,819,060 |
OTHER ASSETS LESS LIABILITIES | | | 1.4 | % | | | 210,310,274 |
| | | | | | | |
| NET ASSETS | | | 100.0 | % | | $ | 15,049,129,334 |
| | | | | | | |
| (a) | Cumulative preferred security |
| (b) | Security exempt from registration under Rule 144A of the Securities Act of 1933. The security may be resold in transactions exempt from registration, normally to qualified institutional buyers. As of June 30, 2009, all such securities in total represented $1,050,722,151 or 7.0% of net assets. |
| (c) | Security denominated in U.S. dollars |
| (d) | Repurchase agreement is collateralized by Fannie Mae 2.00%, 3/2/11; and Freddie Mac 2.05%, 3/9/11. Total collateral value is $341,928,327. |
| (e) | Non-income producing / security in default. On October 9, 2008, Kaupthing Bank requested protection under the Icelandic Financial Supervisory Authority, which has appointed a resolution committee to oversee the affairs of Kaupthing, including supervision of its assets and business operations. |
| (f) | Subsidiary (see Note below) |
| | Note: Fixed income securities are grouped by parent company unless otherwise noted. Actual securities may be issued by the listed parent company or one of its subsidiaries. |
ARM: Adjustable Rate Mortgage
CMO: Collateralized Mortgage Obligation
DUS: Delegated Underwriting and Servicing
REMIC: Real Estate Mortgage Investment Conduit
| | |
| See accompanying Notes to Financial Statements | | DODGE & COX INCOME FUND §PAGE 10 |
| | | | |
STATEMENT OF ASSETS AND LIABILITIES
(unaudited) | |
| |
| | | June 30, 2009 | |
ASSETS: | | | | |
Investments, at value (cost $14,988,928,044) | | $ | 14,838,819,060 | |
Receivable for investments sold | | | 23,477,614 | |
Receivable for paydowns on mortgage-backed securities | | | 13,739,228 | |
Receivable for Fund shares sold | | | 26,859,955 | |
Interest receivable | | | 178,561,484 | |
Prepaid expenses and other assets | | | 29,065 | |
| | | | |
| | | 15,081,486,406 | |
| | | | |
LIABILITIES: | | | | |
Payable for investments purchased | | | 9,330,331 | |
Payable for Fund shares redeemed | | | 16,605,743 | |
Management fees payable | | | 4,901,686 | |
Accrued expenses | | | 1,519,312 | |
| | | | |
| | | 32,357,072 | |
| | | | |
NET ASSETS | | $ | 15,049,129,334 | |
| | | | |
NET ASSETS CONSIST OF: | | | | |
Paid in capital | | $ | 15,496,794,497 | |
Undistributed net investment income | | | 5,030,007 | |
Accumulated net realized loss on investments | | | (302,586,186 | ) |
Net unrealized depreciation on investments | | | (150,108,984 | ) |
| | | | |
| | $ | 15,049,129,334 | |
| | | | |
Fund shares outstanding (par value $0.01 each, unlimited shares authorized) | | | 1,220,495,413 | |
Net asset value per share | | | $12.33 | |
|
STATEMENT OF OPERATIONS
(unaudited) | |
| |
| | | Six Months Ended
June 30, 2009 | |
INVESTMENT INCOME: | | | | |
Dividends | | $ | 3,151,307 | |
Interest | | | 436,253,551 | |
EXPENSES: | | | | |
Management fees | | | 27,950,455 | |
Custody and fund accounting fees | | | 152,423 | |
Transfer agent fees | | | 1,735,933 | |
Professional services | | | 70,172 | |
Shareholder reports | | | 483,946 | |
Registration fees | | | 96,515 | |
Trustees’ fees | | | 73,000 | |
Miscellaneous | | | 66,136 | |
| | | | |
| | | 30,628,580 | |
| | | | |
NET INVESTMENT INCOME | | | 408,776,278 | |
| | | | |
REALIZED AND UNREALIZED GAIN/(LOSS) ON INVESTMENTS: | | | | |
Net realized loss | | | (3,296,655 | ) |
Net change in unrealized depreciation | | | 659,293,452 | |
| | | | |
Net realized and unrealized gain | | | 655,996,797 | |
| | | | |
NET INCREASE IN NET ASSETS
FROM OPERATIONS | | $ | 1,064,773,075 | |
| | | | |
| | | | | | | | |
STATEMENT OF CHANGES IN NET ASSETS
| |
| | | Six Months Ended
June 30, 2009
(unaudited) | | | Year Ended
December 31, 2008 | |
OPERATIONS: | | | | | | | | |
Net investment income | | $ | 408,776,278 | | | $ | 832,200,651 | |
Net realized loss | | | (3,296,655 | ) | | | (171,591,954 | ) |
Net change in unrealized depreciation | | | 659,293,452 | | | | (783,334,610 | ) |
| | | | | | | | |
Net increase/(decrease) in net assets from operations | | | 1,064,773,075 | | | | (122,725,913 | ) |
| | | | | | | | |
| |
DISTRIBUTIONS TO
SHAREHOLDERS FROM: | | | | | |
Net investment income | | | (425,806,252 | ) | | | (842,066,629 | ) |
Net realized gain | | | — | | | | — | |
| | | | | | | | |
Total distributions | | | (425,806,252 | ) | | | (842,066,629 | ) |
| | | | | | | | |
| | |
FUND SHARE TRANSACTIONS: | | | | | | | | |
Proceeds from sale of shares | | | 2,596,022,332 | | | | 4,677,916,833 | |
Reinvestment of distributions | | | 353,889,261 | | | | 708,378,627 | |
Cost of shares redeemed | | | (2,348,056,049 | ) | | | (6,545,585,784 | ) |
| | | | | | | | |
Net increase from Fund
share transactions | | | 601,855,544 | | | | (1,159,290,324 | ) |
| | | | | | | | |
Total increase/(decrease) in net assets | | | 1,240,822,367 | | | | (2,124,082,866 | ) |
| | |
NET ASSETS: | | | | | | | | |
Beginning of period | | | 13,808,306,967 | | | | 15,932,389,833 | |
| | | | | | | | |
End of period (including undistributed net investment income of $5,030,007 and $12,291,572, respectively) | | $ | 15,049,129,334 | | | $ | 13,808,306,967 | |
| | | | | | | | |
| | |
SHARE INFORMATION: | | | | | | | | |
Shares sold | | | 217,060,951 | | | | 383,415,743 | |
Distributions reinvested | | | 29,583,826 | | | | 59,473,610 | |
Shares redeemed | | | (196,984,833 | ) | | | (545,459,961 | ) |
| | | | | | | | |
Net increase in shares outstanding | | | 49,659,944 | | | | (102,570,608 | ) |
| | | | | | | | |
| | |
| PAGE 11 § DODGE & COX INCOME FUND | | See accompanying Notes to Financial Statements |
NOTES TO FINANCIAL STATEMENTS (unaudited)
NOTE 1—ORGANIZATION AND SIGNIFICANT ACCOUNTING POLICIES
Dodge & Cox Income Fund (the “Fund”) is one of the series constituting the Dodge & Cox Funds (the “Trust” or the “Funds”). The Trust is organized as a Delaware statutory trust and is registered under the Investment Company Act of 1940, as amended, as a diversified, open-end management investment company. The Fund commenced operations on January 3, 1989, and seeks high and stable current income consistent with long-term preservation of capital. Risk considerations and investment strategies of the Fund are discussed in the Fund’s Prospectus.
The financial statements have been prepared in conformity with accounting principles generally accepted in the United States of America, which require the use of estimates and assumptions by management. Significant accounting policies are as follows:
Security valuation The Fund’s net assets are valued as of the close of trading on the New York Stock Exchange (NYSE), generally 4:00 p.m. Eastern Time, each day that the NYSE is open for business. Fixed income securities with original maturities of one year or more are priced on the basis of valuations furnished by pricing services which utilize both dealer-supplied valuations and pricing models. Under certain circumstances, fixed income securities that are not valued by pricing services are temporarily valued by the investment manager utilizing both dealer-supplied valuations and pricing models. Valuations of fixed income securities take into account appropriate factors such as institutional-size trading markets in similar groups of securities, yield, quality, coupon rate, maturity, type of issue, trading characteristics and other market data and do not rely exclusively upon exchange or over-the-counter listed prices. Security values are not discounted based on the size of the Fund’s position. Securities for which market quotations are not readily available are valued at fair value as determined in good faith by or at the direction of the Board of Trustees. Short-term securities are valued at amortized cost which approximates current value. All securities held by the Fund are denominated in U.S. dollars.
Security transactions, investment income, expenses, and distributions Security transactions are recorded on the trade date. Realized gains and losses on securities sold are determined on the basis of identified cost.
Interest income is recorded on the accrual basis. Interest income includes coupon interest, amortization of premium and accretion of discount on debt securities, and gain/loss on paydowns of mortgage-backed securities. The ability of the issuers of the debt securities held by the Fund to meet their obligations may be affected by economic developments in a specific industry, state or region. Debt obligations may be placed on non-accrual status and related interest income may be reduced by ceasing current accruals and writing off interest receivables when the collection of all or a portion of interest has become doubtful. A debt obligation is removed from non-accrual status when the issuer resumes interest payments or when collectibility of interest is reasonably assured. Dividend Income is recorded on the ex-dividend date.
Expenses are recorded on the accrual basis. Most expenses of the Trust can be directly attributed to a specific series. Expenses which cannot be directly attributed are allocated among the Funds in the Trust.
Distributions to shareholders are recorded on the ex-dividend date.
Repurchase agreements The Fund may enter into repurchase agreements, secured by U.S. government or agency securities, which involve the purchase of securities from a counterparty with a simultaneous commitment to resell the securities at an agreed-upon date and price. It is the Fund’s policy that its custodian take possession of the underlying collateral securities, the fair value of which exceeds the principal amount of the repurchase transaction, including accrued interest, at all times. In the event of default by the counterparty, the Fund has the contractual right to liquidate the securities and to apply the proceeds in satisfaction of the obligation.
NOTE 2—VALUATION MEASUREMENTS
Various inputs are used in determining the value of the Fund’s investments. These inputs are summarized in the three broad levels listed below.
| § | | Level 1: Quoted prices in active markets for identical securities |
| § | | Level 2: Other significant observable inputs (including quoted prices for similar securities, market indices, interest rates, credit risk, etc.) |
| § | | Level 3: Significant unobservable inputs (including the Fund’s own assumptions in determining the fair value of investments) |
DODGE & COX INCOME FUND §PAGE 12
NOTES TO FINANCIAL STATEMENTS (unaudited)
The inputs or methodology used for valuing securities are not necessarily an indication of the risk associated with investing in those securities.
The following is a summary of the inputs used to value the Fund’s holdings as of June 30, 2009:
| | | | | | |
| Security Classification(a) | | LEVEL 1
(Quoted
Prices) | | LEVEL 2
(Other Significant
Observable Inputs) |
Fixed Income Securities | | | | | | |
U.S. Treasury Notes | | $ | 493,796,125 | | $ | — |
All other Fixed Income Securities(b) | | | — | | | 13,884,776,659 |
Preferred Stocks | | | 49,935,847 | | | — |
Commercial Paper | | | — | | | 29,976,167 |
Money Market Investments | | | 45,111,262 | | | — |
Repurchase Agreements | | | — | | | 335,223,000 |
| | | | | | |
Total | | $ | 588,843,234 | | $ | 14,249,975,826 |
| | | | | | |
| | | | | | | |
| (a) | At June 30, 2009 the Fund held no securities that were considered to be “Level 3” securities (those valued using significant unobservable inputs). |
| (b) | Fixed Income securities, other than U.S. Treasury Notes, are Level 2 securities. For a detailed break-out of fixed income securities by sector, please refer to the Portfolio of Investments. |
NOTE 3—RELATED PARTY TRANSACTIONS
Management fees Under a written agreement approved by a unanimous vote of the Board of Trustees, the Fund pays an annual management fee of 0.50% of the Fund’s average daily net assets up to $100 million and 0.40% of the Fund’s average daily net assets in excess of $100 million to Dodge & Cox, investment manager of the Fund. The agreement further provides that Dodge & Cox shall waive its fee to the extent that such fee plus all other ordinary operating expenses of the Fund exceed 1% of the average daily net assets for the year.
Fund officers and trustees All officers and three of the trustees of the Trust are officers or employees of Dodge & Cox. The Trust pays a fee only to those trustees who are not affiliated with Dodge & Cox.
Indemnification Under the Trust’s organizational documents, its officers and trustees are indemnified against certain liabilities arising out of the performance of their duties to the Trust. In addition, in the normal course of business the Trust enters into contracts that provide general indemnities to other parties. The Trust’s maximum exposure under these arrangements is unknown as this would involve future claims that may be made against the Trust that have not yet occurred.
NOTE 4—INCOME TAX INFORMATION AND DISTRIBUTIONS TO SHAREHOLDERS
A provision for federal income taxes is not required since the Fund intends to continue to qualify as a regulated investment company under Subchapter M of the Internal Revenue Code and distribute all of its taxable income to shareholders. Distributions are determined in accordance with income tax regulations, which may differ from net investment income and realized gains for financial reporting purposes. Financial reporting records are adjusted for permanent book/tax differences to reflect tax character.
Book/tax differences are primarily due to differing treatments of net short-term realized gain/(loss), paydown loss, and defaulted fixed income securities. At June 30, 2009, the cost of investments for federal income tax purposes was equal to the cost for financial reporting purposes.
Distributions during the six months ended June 30, 2009 and for the year ended December 31, 2008 were characterized as follows for federal income tax purposes:
| | | | | | | | |
| | | Six Months Ended June 30, 2009 | | | Year Ended December 31, 2008 | |
Ordinary income | | $ | 425,806,252 | | | $ | 842,066,629 | |
| | ($ | 0.360 per share | ) | | ($ | 0.675 per share | ) |
Long-term capital gain | | | — | | | | — | |
At June 30, 2009, the tax basis components of distributable earnings were as follows:
| | | | |
Unrealized appreciation | | $ | 481,205,106 | |
Unrealized depreciation | | | (631,314,090 | ) |
| | | | |
Net unrealized depreciation | | | (150,108,984 | ) |
Undistributed ordinary income | | | 5,030,007 | |
Accumulated capital loss(a) | | | (204,160,791 | ) |
Capital loss carryforward(b) | | | (94,989,305 | ) |
| (a) | Represents capital loss realized for tax purposes during the period from January 1, 2009 to June 30, 2009. |
| (b) | Represents accumulated capital loss as of December 31, 2008 which may be carried forward to offset future capital gains. During 2008, the Fund utilized $4,267,673 of this capital loss carryforward. If not utilized, the remaining carryforward expires as follows: |
| | | |
Expiring in 2011 | | $ | 3,015,471 |
Expiring in 2012 | | | 32,528,048 |
Expiring in 2013 | | | 19,963,019 |
Expiring in 2014 | | | 39,482,767 |
| | | |
| | $ | 94,989,305 |
| | | |
Fund management has reviewed the tax positions for open periods (for Federal purposes, three years from the date of filing and for State purposes, four years from the date of filing) as applicable to the Fund, and has determined that no provision for income tax is required in the Fund’s financial statements.
PAGE 13 § DODGE & COX INCOME FUND
NOTES TO FINANCIAL STATEMENTS (unaudited)
NOTE 5—COMMITTED LINE OF CREDIT
The Fund participates with the Funds in a $200 million committed credit facility (“Line of Credit”) with State Street Bank and Trust Company to be utilized for temporary or emergency purposes to fund shareholder redemptions or for other short-term liquidity purposes. Interest on borrowings is charged at the prevailing rate. There were no borrowings on the Line of Credit during the period.
NOTE 6—PURCHASES AND SALES OF INVESTMENTS
For the six months ended June 30, 2009, purchases and sales of securities, other than short-term securities and U.S.
government securities, aggregated $1,251,437,053 and $427,152,569, respectively. For the ended June 30, 2009, purchases and sales of U.S. government securities aggregated $497,286,703 and $953,935,716, respectively.
NOTE 7—SUBSEQUENT EVENTS
Fund management has determined that no material events or transactions occurred subsequent to June 30, 2009 and through August 11, 2009, the date of the Fund’s financial statements issuance, which require additional disclosure in the Fund’s financial statements.
FINANCIAL HIGHLIGHTS
| | | | | | | | | | | | | | | | | | |
SELECTED DATA AND RATIOS (for a share outstanding throughout each period) | | Six Months
Ended June 30, | | | Year Ended December 31, | |
| | | 2009(a) | | | 2008 | | | 2007 | | | 2006 | | | 2005 | | | 2004 | |
Net asset value, beginning of period | | $11.79 | | | $12.51 | | | $12.57 | | | $12.54 | | | $12.84 | | | $12.92 | |
Income from investment operations: | | | | | | | | | | | | | | | | | | |
Net investment income | | 0.35 | | | 0.68 | | | 0.63 | | | 0.61 | | | 0.55 | | | 0.54 | |
Net realized and unrealized gain (loss) | | 0.55 | | | (0.72 | ) | | (0.05 | ) | | 0.04 | | | (0.30 | ) | | (0.08 | ) |
| | | | | | |
Total from investment operations | | 0.90 | | | (0.04 | ) | | 0.58 | | | 0.65 | | | 0.25 | | | 0.46 | |
| | | | | | |
Distributions to shareholders from: | | | | | | | | | | | | | | | | | | |
Net investment income | | (0.36 | ) | | (0.68 | ) | | (0.64 | ) | | (0.62 | ) | | (0.55 | ) | | (0.54 | ) |
Net realized gain | | — | | | — | | | — | | | — | | | — | | | — | |
| | | | | | |
Total distributions | | (0.36 | ) | | (0.68 | ) | | (0.64 | ) | | (0.62 | ) | | (0.55 | ) | | (0.54 | ) |
| | | | | | |
Net asset value, end of period | | $12.33 | | | $11.79 | | | $12.51 | | | $12.57 | | | $12.54 | | | $12.84 | |
| | | | | | |
Total return | | 7.75 | % | | (0.29 | )% | | 4.68 | % | | 5.30 | % | | 1.98 | % | | 3.64 | % |
Ratios/supplemental data: | | | | | | | | | | | | | | | | | | |
Net assets, end of period (millions) | | $15,049 | | | $13,808 | | | $15,932 | | | $11,972 | | | $9,610 | | | $7,870 | |
Ratio of expenses to average net assets | | 0.44 | %(b) | | 0.43 | % | | 0.44 | % | | 0.44 | % | | 0.44 | % | | 0.44 | % |
Ratio of net investment income to average net assets | | 5.86 | %(b) | | 5.40 | % | | 5.07 | % | | 4.77 | % | | 3.99 | % | | 3.61 | % |
Portfolio turnover rate | | 10 | % | | 24 | % | | 27 | % | | 30 | % | | 24 | % | | 30 | % |
See accompanying Notes to Financial Statements
FUND HOLDINGS
The Fund provides a complete list of its holdings four times each fiscal year, as of the end of each quarter. The lists appear in the Fund’s First Quarter, Semi-Annual, Third Quarter and Annual Reports to shareholders. The Fund files the lists with the Securities and Exchange Commission (SEC) on Form N-CSR (second and fourth quarters) and Form N-Q (first and third quarters). Shareholders may view the Fund’s Forms N-CSR and N-Q on the SEC’s website at www.sec.gov. Forms N-CSR and N-Q may also be reviewed and copied at the SEC’s Public Reference Room in Washington, DC. Information regarding the operations of the Public Reference Room may be obtained by 1-202-942- 8090 (direct) or 1-800-732-0330 (general SEC number). A complete list of
the Fund’s quarter-end holdings is also available at www.dodgeandcox.com on or about 15 days following each quarter end and remains available on the web site until the list is updated in the subsequent quarter.
PROXY VOTING
For a free copy of the Fund’s proxy voting policies and procedures, please call 1-800-621-3979, visit the Fund’s web site at www.dodgeandcox.com or visit the SEC’s web site at www.sec.gov. Information regarding how the Fund voted proxies relating to portfolio securities during the most recent 12-month period ending June 30 is also available at www.dodgeandcox.com or at www.sec.gov.
DODGE & COX INCOME FUND §PAGE 14
DODGE & COX FUNDS—EXECUTIVE OFFICER & TRUSTEE INFORMATION
| | | | | | |
Name (Age) and
Address* | | Position with Trust
(Year of Election or
Appointment) | | Principal Occupation During Past 5 Years | | Other Directorships Held by Trustees |
| INTERESTED TRUSTEES & OFFICERS |
| John A. Gunn (65) | | Chairman and Trustee
(Trustee since 1985) | | Chairman (since 2007), Chief Executive Officer (since 2005) and Director of Dodge & Cox, Portfolio Manager and member of Investment Policy Committee (IPC), Global Investment Policy Committee (GIPC) (since 2008), and International Investment Policy Committee (IIPC) | | — |
| Kenneth E. Olivier (57) | | President and Trustee
(Trustee since 2005) | | President (since 2005) and Director of Dodge & Cox, Portfolio Manager, and member of IPC | | — |
| Dana M. Emery (47) | | Senior Vice President and Trustee (Trustee since 1993) | | Executive Vice President (since 2005) and Director of Dodge & Cox, Manager of the Fixed Income Department, Portfolio Manager, and member of Fixed Income Investment Policy Committee (FIIPC) | | — |
Charles F. Pohl (51) | | Senior Vice President (Officer since 2004) | | Senior Vice President and Director of Dodge & Cox, Chief Investment Officer (since 2007), Director of Credit Research, Portfolio Manager, Investment Analyst, and member of IPC, GIPC (since 2008), IIPC (since 2007), and FIIPC | | — |
| Diana S. Strandberg (49) | | Senior Vice President
(Officer since 2005) | | Vice President of Dodge & Cox, Portfolio Manager, and member of IPC, GIPC (since 2008), and IIPC | | — |
| David H. Longhurst (52) | | Treasurer
(Officer since 2006) | | Vice President and Assistant Treasurer of Dodge & Cox (since 2008); Vice President, Treasurer, Controller and Secretary of Safeco Mutual Funds, Safeco Asset Management Company, Safeco Services, Safeco Securities, and Safeco Investment Services (2000-2004) | | — |
| Thomas M. Mistele (55) | | Secretary (Officer since 2000) | | Chief Operating Officer (since 2004), Director (since 2005), Secretary, and General Counsel of Dodge & Cox | | — |
Marcia P. Venegas
(40) | | Chief Compliance Officer
(Officer since 2004) | | Associate Chief Compliance Officer of Dodge & Cox (since 2008), Chief Compliance Officer of Dodge & Cox (2005-2008), Compliance Officer of Dodge & Cox (2003-2004) | | — |
| INDEPENDENT TRUSTEES |
| William F. Ausfahl (69) | | Trustee (Since 2002) | | CFO, The Clorox Co. (1982-1997); Director, The Clorox Co. (1984-1997) | | — |
| L. Dale Crandall (67) | | Trustee (Since 1999) | | President, Kaiser Foundation Health Plan, Inc. and Kaiser Foundation Hospitals (2000-2002); Senior Vice President—Finance and Administration & CFO, Kaiser Foundation Health Plan, Inc. and Kaiser Foundation Hospitals (1998-2000) | | Director, Ansell Limited (medical equipment and supplies) (2002-Present); Director, Coventry Health Care, Inc. (managed health care) (2004-Present); Director, Metavante Technologies, Inc. (software) (2007 to present) |
| Thomas A. Larsen (59) | | Trustee (Since 2002) | | Director in Howard, Rice, Nemerovski, Canady, Falk & Rabkin (law firm) | | — |
John B. Taylor (62) | | Trustee (Since 2005) | | Professor of Economics, Stanford University; Senior Fellow, Hoover Institution; Under Secretary for International Affairs, United States Treasury (2001-2005) | | — |
| Will C. Wood (69) | | Trustee (Since 1992) | | Principal, Kentwood Associates, Financial Advisers | | Director, Banco Latinoamericano de Exportaciones S.A. (Latin American foreign trade bank) (1999-Present) |
| * | | The address for each Officer and Trustee is 555 California Street, 40th Floor, San Francisco, California 94104. Each Officer and Trustee oversees all five series in the Dodge & Cox Funds complex and serves for an indefinite term. |
Additional information about the Trust’s Trustees and Officers is available in the Trust’s Statement of Additional Information (SAI). You can get a free copy of the SAI by visiting the Fund’s website at www.dodgeandcox.com or calling 1-800-621-3979.
PAGE 15 § DODGE & COX INCOME FUND
Not applicable for semi-annual report filings.
| ITEM 3. | AUDIT COMMITTEE FINANCIAL EXPERT. |
Not applicable for semi-annual report filings.
| ITEM 4. | PRINCIPAL ACCOUNTANT FEES AND SERVICES. |
Not applicable for semi-annual report filings.
| ITEM 5. | AUDIT COMMITTEE OF LISTED REGISTRANTS. |
Not applicable.
| ITEM 6. | SCHEDULE OF INVESTMENTS. |
Not applicable. The complete schedule of investments is included in Item 1 of this Form N-CSR.
| ITEM 7. | DISCLOSURE OF PROXY VOTING POLICIES AND PROCEDURES FOR CLOSED-END MANAGEMENT INVESTMENT COMPANIES. |
Not applicable.
| ITEM 8. | PORTFOLIO MANAGERS OF CLOSED-END MANAGEMENT INVESTMENT COMPANIES. |
Not applicable.
| ITEM 9. | PURCHASES OF EQUITY SECURITIES BY CLOSED-END MANAGEMENT INVESTMENT COMPANY AND AFFILIATED PURCHASERS. |
Not applicable.
| ITEM 10. | SUBMISSION OF MATTERS TO A VOTE OF SECURITY HOLDERS. |
During the reporting period, there were no material changes to the procedures by which shareholders may recommend nominees to the registrant’s board.
| ITEM 11. | CONTROLS AND PROCEDURES. |
(a) An evaluation was performed within 90 days of the filing of this report, under the supervision and with the participation of the registrant’s management, including the principal executive officer and principal financial officer, of the effectiveness of the design and operation of the registrant’s disclosure controls and procedures. Based on that evaluation, the principal executive officer and principal financial officer concluded that the registrant’s disclosure controls and procedures were effective.
(b) The registrant‘s principal executive officer and principal financial officer are aware of no changes in the registrant‘s internal control over financial reporting that occurred during the registrant‘s second fiscal quarter of the period covered by this report that have materially affected, or are reasonably likely to materially affect, the registrant’s internal control over financial reporting.
(a) (1) Not applicable for semi-annual report filings.
(a) (2) Certifications pursuant to Section 302 of the Sarbanes-Oxley Act of 2002 are attached. (EX.99A)
(a) (3) Not applicable.
(b) Certifications pursuant to Section 906 of the Sarbanes-Oxley Act of 2002 are attached. (EX.99B)
SIGNATURES
Pursuant to the requirements of the Securities Exchange Act of 1934 and the Investment Company Act of 1940, the registrant has duly caused this report to be signed on its behalf by the undersigned, thereunto duly authorized.
| | |
| Dodge & Cox Funds |
| |
| By | | /s/ John A. Gunn |
| | John A. Gunn |
| | Chairman - Principal Executive Officer |
| |
| Date | | August 17, 2009 |
Pursuant to the requirements of the Securities Exchange Act of 1934 and the Investment Company Act of 1940, this report has been signed below by the following persons on behalf of the registrant and in the capacities and on the dates indicated.
| | |
| Dodge & Cox Funds |
| |
| By | | /s/ John A. Gunn |
| | John A. Gunn |
| | Chairman - Principal Executive Officer |
| |
| By | | /s/ David H. Longhurst |
| | David H. Longhurst |
| | Treasurer – Principal Financial Officer |
| |
| Date | | August 17, 2009 |