UNITED STATES
SECURITIES AND EXCHANGE COMMISSION
Washington, D.C. 20549
FORM N-CSR
CERTIFIED SHAREHOLDER REPORT OF REGISTERED MANAGEMENT
INVESTMENT COMPANIES
Investment Company Act file number 811-173
DODGE & COX FUNDS
(Exact name of registrant as specified in charter)
555 California Street, 40th Floor
San Francisco, CA 94104
(Address of principal executive offices) (Zip code)
Thomas M. Mistele, Esq.
555 California Street, 40th Floor
San Francisco, CA 94104
(Name and address of agent for service)
Registrant’s telephone number, including area code: 415-981-1710
Date of fiscal year end: DECEMBER 31, 2010
Date of reporting period: JUNE 30, 2010
Form N-CSR is to be used by management investment companies to file reports with the Commission not later than 10 days after the transmission to stockholders of any report that is required to be transmitted to stockholders under Rule 30e-1 under the Investment Company Act of 1940 (17 CFR 270.30e-1). The Commission may use the information provided on Form N-CSR in its regulatory, disclosure review, inspection, and policymaking roles.
A registrant is required to disclose the information specified by Form N-CSR, and the Commission will make this information public. A registrant is not required to respond to the collection of information contained in Form N-CSR unless the Form displays a currently valid Office of Management and Budget (“OMB”) control number. Please direct comments concerning the accuracy of the information collection burden estimate and any suggestions for reducing the burden to Secretary, Securities and Exchange Commission, 450 Fifth Street, NW, Washington, DC 20549-0609. The OMB has reviewed this collection of information under the clearance requirements of 44 U.S.C. ss. 3507.
| ITEM 1. | REPORTS TO STOCKHOLDERS. |
The following are the June 30, 2010 semi-annual reports for the Dodge & Cox Funds, a Delaware statutory trust, consisting of five series: Dodge & Cox Stock Fund, Dodge & Cox Global Stock Fund, Dodge & Cox International Stock Fund, Dodge & Cox Balanced Fund and Dodge & Cox Income Fund. The reports of each series were transmitted to their respective shareholders on August 3, 2010.
| | | | |
 | | | |  |
www.dodgeandcox.com
For Fund literature, transactions, and account
information, please visit the Funds’ web site.
or write or call:
DODGE & COX FUNDS
c/o Boston Financial Data Services
P.O. Box 8422
Boston, Massachusetts 02266-8422
(800) 621-3979
INVESTMENT MANAGER
Dodge & Cox
555 California Street, 40th Floor
San Francisco, California 94104
(415) 981-1710
This report is submitted for the general information of the shareholders of the Fund. The report is not authorized for distribution to prospective investors in the Fund unless it is accompanied by a current prospectus.
This report reflects our views, opinions, and portfolio holdings as of June 30, 2010, the end of the reporting period. Any such views are subject to change at any time based upon market or other conditions and Dodge & Cox disclaims any responsibility to update such views. These views may not be relied on as investment advice and, because investment decisions for a Dodge & Cox Fund are based on numerous factors, may not be relied on as an indication of trading intent on behalf of any Dodge & Cox Fund.
06/10 SF SAR  Printed on recycled paper
Semi-Annual Report
June 30, 2010
Stock Fund
ESTABLISHED 1965
TICKER: DODGX
TO OUR SHAREHOLDERS
The Dodge & Cox Stock Fund had a total return of –13.7% for the second quarter of 2010, compared to –11.4% for the Standard & Poor’s 500 Index (S&P 500). For the six months ended June 30, 2010, the Fund had a total return of –7.9%, compared to –6.7% for the S&P 500. Please see the Fund’s longer-term performance results on page three. At quarter end, the Fund had net assets of $37.0 billion with a cash position of 1.5%. While the Fund and the S&P 500 are down over the past six months, they have increased 15.3% and 14.4%, respectively, over the past twelve months.
MARKET COMMENTARY
While the U.S. and global economies showed signs of continued improvement in the first half of 2010, the performance of the major financial markets reflected a lack of consensus regarding the prospects for economic growth. Gains in the broader indices during the first four months of 2010 were erased in May and June as optimism for a global economic recovery was replaced by pessimism over the health of several European economies and the damage created by the oil spill in the Gulf of Mexico, among other factors. The declining market during the second quarter also reflected concerns of a potential “double-dip” in the U.S. economy, as growth in consumer spending slowed and unemployment remained high at 9.5%. The Fund’s results followed a similar pattern, as its short-term performance is influenced by the movements of the broader market.
We believe a long-term perspective on investing is especially important during periods like the first half of 2010. Short-term concerns can often deflect attention from longer-term positive developments. After the events of 2008, it is not surprising that many are searching to identify the next “crisis.” In the United States, for example, high unemployment, rising health care costs, and weakness in real estate are real concerns. Past economic recoveries have struggled with similar issues, yet the economic rebound was sustained (the post-1982 and post-1991 recoveries are two examples). The current environment has significant positives: interest rates are at record lows, inflation remains subdued, home prices are stabilizing, and household net worth is rising. While some
economic indicators may lag, the economic recovery can continue.
Despite what we believe is a very promising outlook for equities, the aforementioned challenges faced by certain members of the European Monetary Union and the ecological and economic damage from the Gulf oil spill are getting much attention and are contributing to unduly pessimistic expectations for investors. While these issues are significant, they do not dampen our enthusiasm for the prospects of the global economy. Although these issues have had an impact on the companies we invest in on your behalf in the Fund, they have not changed our belief that the future could be rewarding for patient long-term investors.
INVESTMENT STRATEGY
European Challenges and the Global Economy
The difficulties faced by Greece, Italy, Spain, Portugal, and Ireland have led to concerns about all of Europe, and the sustainability of economic recovery around the world. The Fund has investments in a number of large European-based multinational companies whose shares have declined more in U.S. dollar terms than in their local currencies. This factor accounted for more than one percentage point of the Fund’s total decline for this six-month period. Although most of these holdings have meaningful operations in Europe, none of them has large exposure to the countries facing the most difficulties, and all derive a substantial portion of their revenues from other regions of the world. We are cognizant of the impact that persistent weakness in Europe could have on the operations of these companies; however, we believe valuations for the Fund’s holdings generally incorporate other investors’ low expectations for future earnings, and do not reflect the companies’ attractive long-term fundamentals.
A good example is Vodafone, the United Kingdom–based global communications company with operations in more than 30 countries.1 While Vodafone has significant exposure to Europe, it also has valuable assets in other regions, including the United States and emerging markets. Vodafone is currently selling at less than nine times estimated 2010 earnings and has a 6% dividend
PAGE 1 § DODGE & COX STOCK FUND
yield, compared to 14 times estimated earnings and a 2% dividend yield for the S&P 500. We believe that Vodafone’s valuation discounts the current concerns about Europe, and does not reflect its strong and growing presence in other regions.
The Outlook for Energy
We believe that demand for oil and gas (the primary sources of energy, along with coal) will continue to rise due to growth in the developing world. The Fund’s largest exposure within the Energy sector is in the oil services industry. Our expectation is that demand for oil services will increase as exploration and production continue to move into more complex, technically challenging areas, such as deepwater and shale resource development. In particular, we believe that Schlumberger, the Fund’s largest Energy holding and the world’s leading oil services company, is uniquely positioned to benefit from these trends. The company’s management is focused on enhancing its already strong position in many segments of oil services. While the share price has increased from its low in early 2009 (along with the overall market), the valuation is well below its long-term average.
In spite of the environmental disaster in the Gulf of Mexico, our long-term outlook for the Energy sector is positive. The Deepwater Horizon oil spill has leaked large amounts of crude oil, despite the large-scale efforts of BP and others to contain the damage. BP, as majority owner and operator has received the most attention, and has accepted responsibility for the clean-up effort. The Fund did not own shares of BP or the other named responsible parties. Several Fund holdings (e.g., Baker Hughes and Schlumberger) have significant operations in the affected regions. As always, we are closely monitoring these holdings, but at this time do not believe the events have materially changed these companies’ long-term prospects.
INVESTMENT PHILOSOPHY
Dodge & Cox’s investment philosophy is based on evaluating the long-term opportunities and risks for each company, and comparing our outlook to that of other investors, as measured by the company’s valuation. However, our individual company analysis also takes into account the broader forces that dictate the external environment in which a company operates. Therefore, we evaluate macroeconomic and political factors as part of our assessment of the relative attractiveness of each investment. At the same time, we avoid basing our investment decisions solely on predictions regarding the short-term macroeconomic environment, such as predictions of interest rates, currency movements, and election outcomes.
IN CLOSING
Despite the many near-term uncertainties, we are optimistic that the U.S. and global economies are still in the early stages of a multi-year business recovery; in particular, growth conditions in the developing world look excellent. This optimism, combined with what we believe are attractive current valuations, leads us to the view that the long-term prospects for equity investing are favorable.
Thank you for your continued confidence in our firm. As always, we welcome your comments and questions.
For the Board of Trustees,
| | |
 | |  |
John A. Gunn, Chairman | | Kenneth E. Olivier, President |
July 23, 2010
| 1 | | We use this example to illustrate our investment process, not to imply that we think it is more attractive than the Fund’s other holdings. |
| | | | | | |
| | DODGE & COX STOCK FUND § | | PAGE | | 2 |
SEMI-ANNUAL PERFORMANCE REVIEW
The Fund underperformed the S&P 500 by 1.3 percentage points for the six months ended June 30, 2010.
Key Detractors from Relative Results
| | § | | Weak returns from holdings in the Health Care sector (down 13% versus down 9% for the S&P 500 sector), combined with a higher average weighting (21% versus 12%), detracted from results. Boston Scientific (down 36%), Sanofi-Aventis (down 21%), and Pfizer (down 20%) were notably weak. | |
| | § | | Returns from holdings in the Consumer Staples sector (down 14% versus down 3% for the S&P 500 sector) hurt results. Walgreen was down 27%. | |
| | § | | Weak returns in the Industrials sector (down 6% versus down 1% for the S&P 500 sector) had a negative impact. FedEx was down 16%. | |
| | § | | Additional detractors included Hewlett-Packard (down 16%), Motorola (down 16%), Schlumberger (down 14%), and News Corp. (down 12%). | |
Key Contributors to Relative Results
| | § | | Relative returns from holdings in the Energy sector (down 8% versus down 12% for the S&P 500 sector) helped. Baker Hughes was up 3%. | |
| | § | | A much higher average weighting in the Consumer Discretionary sector (18% versus 10% for the S&P 500 sector) had a positive impact, as the area declined less than the market. Time Warner Cable (up 28%) and Comcast (up 4%) were strong performers. | |
| | § | | Returns from holdings in the Telecommunication Services sector (up 5% versus down 8% for the S&P 500 sector) contributed. Sprint Nextel was up 16%. | |
| | § | | Additional contributors included Hitachi (up 26% to date of sale), Ericsson (up 22%), SunTrust Banks (up 15%), and Capital One (up 5%). | |
GROWTH OF $10,000 OVER 10 YEARS
FOR AN INVESTMENT MADE ON JUNE 30, 2000
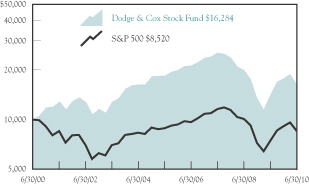
AVERAGE ANNUAL TOTAL RETURN
FOR PERIODS ENDED JUNE 30, 2010
| | | | | | | | | | | | |
| | | 1 Year | | | 5 Years | | | 10 Years | | | 20 Years | |
Dodge & Cox Stock Fund | | 15.34 | % | | (2.44 | )% | | 5.00 | % | | 9.86 | % |
S&P 500 | | 14.42 | | | (0.79 | ) | | (1.59 | ) | | 7.67 | |
Returns represent past performance and do not guarantee future results. Investment return and share price will fluctuate with market conditions, and investors may have a gain or loss when shares are sold. Mutual fund performance changes over time and currently may be significantly lower than stated. Performance is updated and published monthly. Visit the Fund’s web site at www.dodgeandcox.com or call 1-800-621-3979 for current performance figures.
The Fund’s total returns include the reinvestment of dividend and capital gain distributions, but have not been adjusted for any income taxes payable by shareholders on these distributions or on Fund share redemptions. The Standard & Poor’s 500 (S&P 500) is a broad-based unmanaged measure of common stocks. Index returns include dividends and/or interest income but, unlike Fund returns, do not reflect fees or expenses.
Standard & Poor’s, Standard & Poor’s 500, and S&P 500® are trademarks of The McGraw-Hill Companies, Inc.
Risks: The Fund is subject to stock market risk, meaning stocks in the Fund may decline in value for extended periods due to the financial prospects of individual companies, or due to general market and economic conditions. Please read the prospectus for specific details regarding the Fund’s risk profile.
PAGE 3 § DODGE & COX STOCK FUND
FUND EXPENSE EXAMPLE
As a Fund shareholder, you incur ongoing Fund costs, including management fees and other Fund expenses. All mutual funds have ongoing costs, sometimes referred to as operating expenses. The following example shows ongoing costs of investing in the Fund and can help you understand these costs and compare them with those of other mutual funds. The example assumes a $1,000 investment held for the six months indicated.
ACTUAL EXPENSES
The first line of the table below provides information about actual account values and expenses based on the Fund’s actual returns. You may use the information in this line, together with your account balance, to estimate the expenses that you paid over the period. Simply divide your account value by $1,000 (for example, an $8,600 account value divided by $1,000 = 8.6), then multiply the result by the number in the first line under the heading “Expenses Paid During Period” to estimate the expenses you paid on your account during this period.
HYPOTHETICAL EXAMPLE FOR COMPARISON WITH OTHER MUTUAL FUNDS
Information on the second line of the table can help you compare ongoing costs of investing in the Fund with those of other mutual funds. This information may not be used to estimate the actual ending account balance or expenses you paid during the period. The hypothetical “Ending Account Value” is based on the actual expense ratio of the Fund and an assumed 5% annual rate of return before expenses (not the Fund’s actual return). The amount under the heading “Expense Paid During the Period” shows the hypothetical expenses your account would have incurred under this scenario. You can compare this figure with the 5% hypothetical examples that appear in shareholder reports of other mutual funds.
| | | | | | | | | |
Six Months Ended
June 30, 2010 | | Beginning Account Value
1/1/2010 | | Ending Account Value
6/30/2010 | | Expenses Paid
During Period* |
Based on Actual Fund Return | | $ | 1,000.00 | | $ | 920.90 | | $ | 2.51 |
Based on Hypothetical 5% Yearly Return | | | 1,000.00 | | | 1,022.18 | | | 2.64 |
| * | | Expenses are equal to the Fund’s annualized expense ratio of 0.52%, multiplied by the average account value over the period, multiplied by 181/365 (to reflect the one-half year period). |
The expenses shown in the table highlight ongoing costs only and do not reflect any transactional fees or account maintenance fees. While other mutual funds may charge such fees, please note that the Fund does not charge transaction fees (e.g., redemption fees, sales loads) or universal account maintenance fees (e.g., small account fees).
DODGE & COX STOCK FUND §PAGE 4
| | |
| FUND INFORMATION | | June 30, 2010 |
| | |
| GENERAL INFORMATION | | |
Net Asset Value Per Share | | $87.91 |
Total Net Assets (billions) | | $37.0 |
Expense Ratio | | 0.52% |
Portfolio Turnover Rate (1/1/10 to 6/30/10, unannualized) | | 7% |
30-Day SEC Yield(a) | | 1.32% |
Fund Inception | | 1965 |
No sales charges or distribution fees | | |
Investment Manager: Dodge & Cox, San Francisco. Managed by the Investment Policy Committee, whose nine members’ average tenure at Dodge & Cox is 24 years.
| | | | |
| PORTFOLIO CHARACTERISTICS | | Fund | | S&P 500 |
Number of Stocks | | 80 | | 500 |
Median Market Capitalization (billions) | | $17 | | $9 |
Weighted Average Market
Capitalization (billions) | | $55 | | $75 |
Price-to-Earnings Ratio(b) | | 10.8x | | 13.9x |
Foreign Stocks(c) | | 19.6% | | 0.0% |
| | | |
| TEN LARGEST HOLDINGS(d) | | Fund | |
Hewlett-Packard Co. | | 4.6 | % |
Comcast Corp. | | 3.6 | |
Capital One Financial Corp. | | 3.5 | |
Merck & Co., Inc. | | 3.4 | |
Schlumberger, Ltd. | | 3.4 | |
Novartis AG (Switzerland) | | 3.3 | |
Wells Fargo & Co. | | 3.3 | |
General Electric Co. | | 3.0 | |
Time Warner, Inc. | | 2.7 | |
GlaxoSmithKline PLC (United Kingdom) | | 2.6 | |
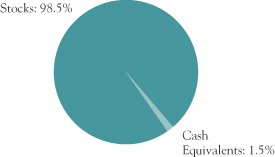
ASSET ALLOCATION
| | | | | | |
| SECTOR DIVERSIFICATION | | Fund | | | S&P 500 | |
Health Care | | 20.4 | % | | 12.1 | % |
Information Technology | | 20.2 | | | 18.7 | |
Consumer Discretionary | | 17.6 | | | 10.1 | |
Financials | | 16.0 | | | 16.3 | |
Energy | | 9.3 | | | 10.7 | |
Industrials | | 7.3 | | | 10.4 | |
Telecommunication Services | | 3.2 | | | 3.0 | |
Materials | | 2.4 | | | 3.4 | |
Consumer Staples | | 2.1 | | | 11.5 | |
Utilities | | 0.0 | | | 3.8 | |
| (a) | SEC yield is an annualization of the Fund’s total net investment income per share for the 30-day period ended on the last day of the month. |
| (b) | Price-to-earnings (P/E) ratios are calculated using 12-month forward earnings estimates. |
| (c) | Foreign stocks are U.S. dollar-denominated. |
| (d) | The Fund’s portfolio holdings are subject to change without notice. The mention of specific securities is not a recommendation or solicitation for any person to buy, sell, or hold any particular security. |
PAGE 5 § DODGE & COX STOCK FUND
| | |
| PORTFOLIO OF INVESTMENTS (unaudited) | | June 30, 2010 |
| | | | | |
| COMMON STOCKS: 98.5% | | | | |
| | |
| | | SHARES | | VALUE |
| CONSUMER DISCRETIONARY: 17.6% |
CONSUMER DURABLES & APPAREL: 2.6% |
Panasonic Corp. ADR(b) (Japan) | | 33,933,474 | | $ | 425,186,429 |
Sony Corp. ADR(b) (Japan) | | 20,552,850 | | | 548,350,038 |
| | | | | |
| | | | | 973,536,467 |
MEDIA: 11.6% |
Comcast Corp., Class A | | 75,995,497 | | | 1,320,041,783 |
DIRECTV, Class A(a) | | 2,447,950 | | | 83,034,464 |
DISH Network Corp., Class A(a) | | 6,842,870 | | | 124,198,091 |
Interpublic Group of Companies, Inc.(a) | | 18,421,293 | | | 131,343,819 |
Liberty Global, Inc., Series A(a) | | 764,210 | | | 19,861,818 |
Liberty Global, Inc., Series C(a) | | 1,301,653 | | | 33,829,961 |
News Corp., Class A | | 76,353,526 | | | 913,188,171 |
Time Warner Cable, Inc. | | 12,785,610 | | | 665,874,569 |
Time Warner, Inc. | | 34,722,732 | | | 1,003,834,182 |
| | | | | |
| | | | | 4,295,206,858 |
RETAILING: 3.4% |
CarMax, Inc.(a) | | 9,007,200 | | | 179,243,280 |
Home Depot, Inc. | | 18,191,070 | | | 510,623,335 |
Liberty Interactive, Series A(a) | | 33,923,375 | | | 356,195,437 |
Macy’s, Inc. | | 10,590,092 | | | 189,562,647 |
| | | | | |
| | | | | 1,235,624,699 |
| | | | | |
| | | | | 6,504,368,024 |
| CONSUMER STAPLES: 2.1% |
FOOD & STAPLES RETAILING: 1.7% |
Wal-Mart Stores, Inc. | | 8,022,950 | | | 385,663,206 |
Walgreen Co. | | 8,807,075 | | | 235,148,903 |
| | | | | |
| | | | | 620,812,109 |
FOOD, BEVERAGE & TOBACCO: 0.4% |
Diageo PLC ADR(b) (United Kingdom) | | 2,500,000 | | | 156,850,000 |
| | | | | |
| | | | | 777,662,109 |
| ENERGY: 9.3% |
Baker Hughes, Inc. | | 13,136,850 | | | 546,098,854 |
Chevron Corp. | | 9,180,680 | | | 623,000,945 |
Occidental Petroleum Corp. | | 11,323,100 | | | 873,577,165 |
Royal Dutch Shell PLC ADR(b) (United Kingdom) | | 3,012,564 | | | 145,446,590 |
Schlumberger, Ltd. | | 22,522,312 | | | 1,246,384,746 |
| | | | | |
| | | | | 3,434,508,300 |
| FINANCIALS: 16.0% |
BANKS: 6.2% |
BB&T Corp. | | 12,462,844 | | | 327,897,426 |
HSBC Holdings PLC ADR(b) (United Kingdom) | | 6,129,229 | | | 279,431,550 |
SunTrust Banks, Inc. | | 10,669,405 | | | 248,597,136 |
U.S. Bancorp | | 8,800,000 | | | 196,680,000 |
Wells Fargo & Co. | | 47,862,841 | | | 1,225,288,730 |
| | | | | |
| | | | | 2,277,894,842 |
| | | | | |
| | |
| | | SHARES | | VALUE |
DIVERSIFIED FINANCIALS: 7.8% |
Bank of New York Mellon Corp. | | 24,856,624 | | $ | 613,710,047 |
Capital One Financial Corp.(c) | | 32,243,611 | | | 1,299,417,523 |
Charles Schwab Corp. | | 19,451,600 | | | 275,823,688 |
Credit Suisse Group AG ADR(b) (Switzerland) | | 2,167,900 | | | 81,144,497 |
Goldman Sachs Group, Inc. | | 1,480,000 | | | 194,279,600 |
Legg Mason, Inc. | | 5,656,700 | | | 158,557,301 |
SLM Corp.(a),(c) | | 26,185,882 | | | 272,071,314 |
| | | | | |
| | | | | 2,895,003,970 |
INSURANCE: 2.0% |
AEGON NV(a),(b) (Netherlands) | | 47,358,988 | | | 250,055,457 |
Genworth Financial, Inc., Class A(a) | | 5,987,660 | | | 78,258,716 |
Loews Corp. | | 3,608,000 | | | 120,182,480 |
The Travelers Companies, Inc. | | 5,981,750 | | | 294,601,187 |
| | | | | |
| | | | | 743,097,840 |
| | | | | |
| | | | | 5,915,996,652 |
| HEALTH CARE: 20.4% |
HEALTH CARE EQUIPMENT & SERVICES: 4.2% |
Boston Scientific Corp.(a) | | 69,969,500 | | | 405,823,100 |
CareFusion Corp.(a) | | 10,484,875 | | | 238,006,663 |
Covidien PLC(b) (Ireland) | | 5,463,291 | | | 219,515,032 |
Medtronic, Inc. | | 5,257,800 | | | 190,700,406 |
UnitedHealth Group, Inc. | | 490,505 | | | 13,930,342 |
WellPoint, Inc.(a) | | 9,611,854 | | | 470,308,016 |
| | | | | |
| | | | | 1,538,283,559 |
PHARMACEUTICALS, BIOTECHNOLOGY & LIFE SCIENCES: 16.2% |
Amgen, Inc.(a) | | 16,061,300 | | | 844,824,380 |
GlaxoSmithKline PLC ADR(b) (United Kingdom) | | 28,024,300 | | | 953,106,443 |
Merck & Co., Inc. | | 36,005,500 | | | 1,259,112,335 |
Novartis AG ADR(b) (Switzerland) | | 25,465,500 | | | 1,230,492,960 |
Pfizer, Inc. | | 60,512,864 | | | 862,913,441 |
Sanofi-Aventis ADR(b) (France) | | 28,568,600 | | | 858,772,116 |
| | | | | |
| | | | | 6,009,221,675 |
| | | | | |
| | | | | 7,547,505,234 |
| INDUSTRIALS: 7.3% |
CAPITAL GOODS: 4.6% |
Eaton Corp. | | 3,698,200 | | | 242,010,208 |
General Electric Co. | | 78,198,175 | | | 1,127,617,684 |
Tyco International, Ltd.(b) (Switzerland) | | 8,960,775 | | | 315,688,103 |
| | | | | |
| | | | | 1,685,315,995 |
COMMERCIAL & PROFESSIONAL SERVICES: 0.6% |
Dun & Bradstreet Corp. | | 35,340 | | | 2,372,021 |
Pitney Bowes, Inc. | | 10,286,950 | | | 225,901,422 |
| | | | | |
| | | | | 228,273,443 |
| | |
| See accompanying Notes to Financial Statements | | DODGE & COX STOCK FUND §PAGE 6 |
| | |
| PORTFOLIO OF INVESTMENTS (unaudited) | | June 30, 2010 |
| | | | | |
| COMMON STOCKS (continued) |
| | |
| | | SHARES | | VALUE |
TRANSPORTATION: 2.1% |
FedEx Corp. | | 11,133,599 | | $ | 780,576,626 |
| | | | | |
| | | | | 2,694,166,064 |
| INFORMATION TECHNOLOGY: 20.2% |
SEMICONDUCTORS & SEMICONDUCTOR EQUIPMENT: 1.0% |
Maxim Integrated Products, Inc.(c) | | 23,348,800 | | | 390,625,424 |
SOFTWARE & SERVICES: 7.5% |
AOL, Inc.(a),(c) | | 7,655,722 | | | 159,162,460 |
BMC Software, Inc.(a) | | 8,220,940 | | | 284,691,152 |
Cadence Design Systems, Inc.(a),(c) | | 23,282,600 | | | 134,806,254 |
Citrix Systems, Inc.(a),(c) | | 4,488,922 | | | 189,567,176 |
Computer Sciences Corp. | | 6,244,072 | | | 282,544,258 |
Compuware Corp.(a),(c) | | 22,088,112 | | | 176,263,134 |
EBay, Inc.(a) | | 27,473,300 | | | 538,751,413 |
Electronic Arts, Inc.(a),(c) | | 21,261,177 | | | 306,160,949 |
Symantec Corp.(a) | | 28,815,300 | | | 399,956,364 |
Synopsys, Inc.(a),(c) | | 14,402,369 | | | 300,577,441 |
| | | | | |
| | | | | 2,772,480,601 |
TECHNOLOGY, HARDWARE & EQUIPMENT: 11.7% |
Hewlett-Packard Co. | | 39,353,595 | | | 1,703,223,592 |
Molex, Inc. | | 2,547,600 | | | 46,468,224 |
Molex, Inc., Class A | | 8,724,330 | | | 134,790,899 |
Motorola, Inc.(a),(c) | | 131,758,711 | | | 859,066,796 |
Nokia Corp. ADR(b) (Finland) | | 34,112,300 | | | 278,015,245 |
Telefonaktiebolaget LM Ericsson ADR(b) (Sweden) | | 28,720,500 | | | 316,499,910 |
Tyco Electronics, Ltd.(b) (Switzerland) | | 16,789,775 | | | 426,124,489 |
Xerox Corp.(c) | | 68,842,082 | | | 553,490,339 |
| | | | | |
| | | | | 4,317,679,494 |
| | | | | |
| | | | | 7,480,785,519 |
| MATERIALS: 2.4% |
Cemex SAB de CV ADR(a),(b) (Mexico) | | 16,751,062 | | | 161,982,770 |
Domtar Corp. | | 1,470,959 | | | 72,297,635 |
Dow Chemical Co. | | 24,344,545 | | | 577,452,607 |
Vulcan Materials Co. | | 2,046,548 | | | 89,700,199 |
| | | | | |
| | | | | 901,433,211 |
| TELECOMMUNICATION SERVICES: 3.2% |
Sprint Nextel Corp.(a) | | 132,825,739 | | | 563,181,133 |
Vodafone Group PLC ADR(b) (United Kingdom) | | 29,000,400 | | | 599,438,268 |
| | | | | |
| | | | | 1,162,619,401 |
| | | | | |
TOTAL COMMON STOCKS
(Cost $40,807,658,482) | | | | $ | 36,419,044,514 |
| | | | | | | | |
| SHORT-TERM INVESTMENTS: 1.7% | |
| | |
| | | PAR VALUE | | | VALUE | |
MONEY MARKET FUND: 0.3% | |
SSgA Prime Money Market Fund | | $ | 112,377,027 | | | $ | 112,377,027 | |
REPURCHASE AGREEMENT: 1.4% | |
Fixed Income Clearing Corporation(d) 0.00%, 7/1/10, maturity value $524,082,000 | | | 524,082,000 | | | | 524,082,000 | |
| | | | | | | | |
TOTAL SHORT-TERM INVESTMENTS
(Cost $636,459,027) | | | $ | 636,459,027 | |
| | | | | | | | |
TOTAL INVESTMENTS
(Cost $41,444,117,509) | | | 100.2 | % | | $ | 37,055,503,541 | |
OTHER ASSETS LESS LIABILITIES | | | (0.2 | %) | | | (55,876,045 | ) |
| | | | | | | | |
| NET ASSETS | | | 100.0 | % | | $ | 36,999,627,496 | |
| | | | | | | | |
| (b) | Security denominated in U.S. dollars |
| (c) | See Note 8 regarding holdings of 5% voting securities |
| (d) | Repurchase agreement is collateralized by Fannie Mae 0.00%-6.25%, 2/1/11-4/26/11; and Freddie Mac 0.00%-4.75%, 1/18/11-2/24/11. Total collateral value is $534,568,225. |
ADR: American Depositary Receipt
| | |
| PAGE 7 § DODGE & COX STOCK FUND | | See accompanying Notes to Financial Statements |
| | | | |
STATEMENT OF ASSETS AND LIABILITIES (unaudited) | |
| |
| | | June 30, 2010 | |
ASSETS: | | | | |
Investments, at value | | | | |
Unaffiliated issuers (cost $35,689,360,519) | | $ | 33,157,352,246 | |
Affiliated issuers (cost $5,754,756,990) | | | 3,898,151,295 | |
| | | | |
| | | 37,055,503,541 | |
Receivable for investments sold | | | 1,690,877 | |
Receivable for Fund shares sold | | | 39,109,379 | |
Dividends and interest receivable | | | 91,930,537 | |
Prepaid expenses and other assets | | | 88,275 | |
| | | | |
| | | 37,188,322,609 | |
| | | | |
LIABILITIES: | | | | |
Payable for investments purchased | | | 112,508,530 | |
Payable for Fund shares redeemed | | | 57,918,818 | |
Management fees payable | | | 16,014,463 | |
Accrued expenses | | | 2,253,302 | |
| | | | |
| | | 188,695,113 | |
| | | | |
NET ASSETS | | $ | 36,999,627,496 | |
| | | | |
NET ASSETS CONSIST OF: | | | | |
Paid in capital | | $ | 48,254,684,644 | |
Undistributed net investment income | | | 21,579,651 | |
Accumulated net realized loss on investments | | | (6,888,022,831 | ) |
Net unrealized depreciation on investments | | | (4,388,613,968 | ) |
| | | | |
| | $ | 36,999,627,496 | |
| | | | |
Fund shares outstanding (par value $0.01 each, unlimited shares authorized) | | | 420,861,554 | |
Net asset value per share | | | $87.91 | |
|
STATEMENT OF OPERATIONS
(unaudited) | |
| |
| | | Six Months Ended
June 30, 2010 | |
INVESTMENT INCOME: | | | | |
Dividends (net of foreign taxes of $16,189,608) | | | | |
Unaffiliated issuers | | $ | 386,671,654 | |
Affiliated issuers | | | 18,400,458 | |
Interest | | | 145,961 | |
| | | | |
| | | 405,218,073 | |
| | | | |
EXPENSES: | | | | |
Management fees | | | 101,422,065 | |
Custody and fund accounting fees | | | 279,244 | |
Transfer agent fees | | | 2,818,681 | |
Professional services | | | 73,451 | |
Shareholder reports | | | 1,265,971 | |
Registration fees | | | 226,042 | |
Trustees’ fees | | | 77,000 | |
Miscellaneous | | | 808,489 | |
| | | | |
| | | 106,970,943 | |
| | | | |
NET INVESTMENT INCOME | | | 298,247,130 | |
| | | | |
REALIZED AND UNREALIZED GAIN/ (LOSS) ON INVESTMENTS: | | | | |
Net realized gain | | | | |
Unaffiliated issuers | | | 112,615,178 | |
Affiliated issuers | | | 81,998,461 | |
Net change in unrealized depreciation | | | (3,684,502,558 | ) |
| | | | |
Net realized and unrealized loss | | | (3,489,888,919 | ) |
| | | | |
NET DECREASE IN NET ASSETS FROM OPERATIONS | | $ | (3,191,641,789 | ) |
| | | | |
| | | | | | | | |
STATEMENT OF CHANGES IN NET ASSETS | |
| | | Six Months Ended
June 30, 2010
(unaudited) | | | Year Ended
December 31, 2009 | |
OPERATIONS: | | | | | | | | |
Net investment income | | $ | 298,247,130 | | | $ | 489,322,713 | |
Net realized gain/(loss) | | | 194,613,639 | | | | (6,582,700,408 | ) |
Net change in unrealized depreciation | | | (3,684,502,558 | ) | | | 15,810,026,274 | |
| | | | | | | | |
Net increase/(decrease) in net assets from operations | | | (3,191,641,789 | ) | | | 9,716,648,579 | |
| | | | | | | | |
|
DISTRIBUTIONS TO
SHAREHOLDERS FROM: | |
Net investment income | | | (284,461,328 | ) | | | (511,502,606 | ) |
Net realized gain | | | — | | | | — | |
| | | | | | | | |
Total distributions | | | (284,461,328 | ) | | | (511,502,606 | ) |
| | | | | | | | |
| | |
FUND SHARE TRANSACTIONS: | | | | | | | | |
Proceeds from sale of shares | | | 3,767,616,250 | | | | 6,004,678,797 | |
Reinvestment of distributions | | | 268,855,988 | | | | 483,257,450 | |
Cost of shares redeemed | | | (3,551,852,058 | ) | | | (8,423,170,138 | ) |
| | | | | | | | |
Net increase/(decrease) from Fund share transactions | | | 484,620,180 | | | | (1,935,233,891 | ) |
| | | | | | | | |
Total increase/(decrease) in net assets | | | (2,991,482,937 | ) | | | 7,269,912,082 | |
| | |
NET ASSETS: | | | | | | | | |
Beginning of period | | | 39,991,110,433 | | | | 32,721,198,351 | |
| | | | | | | | |
End of period (including undistributed net investment income of $21,579,651 and $7,793,849, respectively) | | $ | 36,999,627,496 | | | $ | 39,991,110,433 | |
| | | | | | | | |
| | |
SHARE INFORMATION: | | | | | | | | |
Shares sold | | | 38,592,150 | | | | 77,216,599 | |
Distributions reinvested | | | 2,783,077 | | | | 6,220,003 | |
Shares redeemed | | | (36,478,758 | ) | | | (107,436,792 | ) |
| | | | | | | | |
Net increase/(decrease) in shares outstanding | | | 4,896,469 | | | | (24,000,190 | ) |
| | | | | | | | |
| | |
| See accompanying Notes to Financial Statements | | DODGE & COX STOCK FUND §PAGE 8 |
NOTES TO FINANCIAL STATEMENTS (unaudited)
NOTE 1—ORGANIZATION AND SIGNIFICANT ACCOUNTING POLICIES
Dodge & Cox Stock Fund (the “Fund”) is one of the series constituting the Dodge & Cox Funds (the “Trust” or the “Funds”). The Trust is organized as a Delaware statutory trust and is registered under the Investment Company Act of 1940, as amended, as a diversified, open-end management investment company. The Fund commenced operations on January 4, 1965, and seeks long-term growth of principal and income. Risk considerations and investment strategies of the Fund are discussed in the Fund’s Prospectus.
The financial statements have been prepared in conformity with accounting principles generally accepted in the United States of America, which require the use of estimates and assumptions by management. Actual results may differ from those estimates. Significant accounting policies are as follows:
Security valuation The Fund’s net assets are valued as of the close of trading on the New York Stock Exchange (NYSE), generally 4:00 p.m. Eastern Time, each day that the NYSE is open for business. Stocks are valued at the official quoted close price or the last sale of the day at the close of the NYSE or, if not available, at the mean between the exchange listed bid and ask prices. A security that is listed or traded on more than one exchange is valued at the quotation on the exchange determined to be the primary market for such security. Security values are not discounted based on the size of the Fund’s position. Securities for which market quotations are not readily available are valued at fair value as determined in good faith by or at the direction of the Board of Trustees. Short-term securities are valued at amortized cost which approximates current value. All securities held by the Fund are denominated in U.S. dollars.
Security transactions, investment income, expenses, and distributions Security transactions are recorded on the trade date. Realized gains and losses on securities sold are determined on the basis of identified cost.
Dividend income and corporate action transactions are recorded on the ex-dividend date, except for certain dividends or corporate actions from foreign securities where the ex-dividend date may have passed, which are recorded
as soon as the Fund is informed of the ex-dividend date. Withholding taxes on foreign dividends have been provided for in accordance with the Fund’s understanding of the applicable country’s tax rules and rates. Non-cash dividends included in dividend income, if any, are recorded at the fair market value of the securities received. Distributions received in excess of income are recorded as a reduction of cost of investments and/or realized gain. Interest income is recorded on the accrual basis.
Expenses are recorded on the accrual basis. Most expenses of the Trust can be directly attributed to a specific series. Expenses which cannot be directly attributed are allocated among the Funds in the Trust.
Distributions to shareholders are recorded on the ex-dividend date.
Repurchase agreements The Fund may enter into repurchase agreements, secured by U.S. government or agency securities, which involve the purchase of securities from a counterparty with a simultaneous commitment to resell the securities at an agreed-upon date and price. It is the Fund’s policy that its custodian take possession of the underlying collateral securities, the fair value of which exceeds the principal amount of the repurchase transaction, including accrued interest, at all times. In the event of default by the counterparty, the Fund has the contractual right to liquidate the collateral securities and to apply the proceeds in satisfaction of the obligation.
NOTE 2—VALUATION MEASUREMENTS
Various inputs are used in determining the value of the Fund’s investments. These inputs are summarized in the three broad levels listed below.
| § | | Level 1: Quoted prices in active markets for identical securities |
| § | | Level 2: Other significant observable inputs (including quoted prices for similar securities, market indices, interest rates, credit risk, etc.) |
| § | | Level 3: Significant unobservable inputs (including the Fund’s own assumptions in determining the fair value of investments) |
The inputs or methodology used for valuing securities are not necessarily an indication of the risk associated with investing in those securities.
PAGE 9 § DODGE & COX STOCK FUND
NOTES TO FINANCIAL STATEMENTS (unaudited)
The following is a summary of the inputs used to value the Fund’s holdings as of June 30, 2010:
| | | | | | |
| Security Classification(a) | | LEVEL 1
(Quoted Prices) | | LEVEL 2
(Other Significant
Observable Inputs) |
Common Stocks(b) | | $ | 36,419,044,514 | | $ | — |
Money Market Fund | | | 112,377,027 | | | — |
Repurchase Agreement | | | — | | | 524,082,000 |
| | | | | | |
Total | | $ | 36,531,421,541 | | $ | 524,082,000 |
| | | | | | |
| | | | | | | |
| (a) | At June 30, 2010 the Fund held no securities that were considered to be “Level 3” securities (those valued using significant unobservable inputs). |
| (b) | All common stocks held in the Fund are Level 1 securities. For a detailed break-out of common stocks by major industry classification, please refer to the Portfolio of Investments. |
NOTE 3—RELATED PARTY TRANSACTIONS
Management fees Under a written agreement approved by a unanimous vote of the Board of Trustees, the Fund pays an annual management fee of 0.50% of the Fund’s average daily net assets to Dodge & Cox, investment manager of the Fund. The agreement further provides that Dodge & Cox shall waive its fee to the extent that such fee plus all other ordinary operating expenses of the Fund exceed 0.75% of the average daily net assets for the year.
Fund officers and trustees All officers and three of the trustees of the Trust are officers or employees of Dodge & Cox. The Trust pays a fee only to those trustees who are not affiliated with Dodge & Cox.
Indemnification Under the Trust’s organizational documents, its officers and trustees are indemnified against certain liabilities arising out of the performance of their duties to the Trust. In addition, in the normal course of business the Trust enters into contracts that provide general indemnities to other parties. The Trust’s maximum exposure under these arrangements is unknown as this would involve future claims that may be made against the Trust that have not yet occurred.
NOTE 4—INCOME TAX INFORMATION
A provision for federal income taxes is not required since the Fund intends to continue to qualify as a regulated investment company under Subchapter M of the Internal Revenue Code and distribute all of its taxable income to shareholders. Distributions are determined in accordance with income tax regulations, which may differ from net investment income and realized gains for financial
reporting purposes. Financial reporting records are adjusted for permanent book/tax differences to reflect tax character.
Book/tax differences are primarily due to differing treatments of wash sales and net short-term realized gain/(loss). At June 30, 2010, the cost of investments for federal income tax purposes was $41,506,965,516.
Distributions during the six months ended June 30, 2010 and for the year ended December 31, 2009 were characterized as follows for federal income tax purposes:
| | | | |
| | | Six Months Ended June 30, 2010 | | Year Ended December 31, 2009 |
Ordinary income | | $284,461,328 | | $511,502,606 |
| | ($0.680 per share) | | ($1.195 per share) |
| | |
Long-term capital gain | | — | | — |
At June 30, 2010, the tax basis components of distributable earnings were as follows:
| | | | |
Unrealized appreciation | | $ | 4,148,460,753 | |
Unrealized depreciation | | | (8,599,922,728 | ) |
| | | | |
Net unrealized depreciation | | | (4,451,461,975 | ) |
Undistributed ordinary income | | | 21,579,651 | |
Accumulated capital gain(a) | | | 68,202,577 | |
Capital Loss carryforward(b) | | | (6,893,377,401 | ) |
| (a) | Represents capital loss realized for tax purposes during the period from January 1, 2010 to June 30, 2010. |
| (b) | Represents accumulated capital loss as of December 31, 2009 which may be carried forward to offset future capital gains. If not utilized, the capital loss carryforward expires as follows: |
| | | |
Expiring in 2016 | | $ | 30,080,078 |
Expiring in 2017 | | | 6,863,297,323 |
| | | |
| | $ | 6,893,377,401 |
| | | |
Fund management has reviewed the tax positions for open periods (for Federal purposes, three years from the date of filing and for State purposes, four years from the date of filing) as applicable to the Fund, and has determined that no provision for income tax is required in the Fund’s financial statements.
DODGE & COX STOCK FUND §PAGE 10
NOTES TO FINANCIAL STATEMENTS (unaudited)
NOTE 5—LOAN FACILITIES
Pursuant to an exemptive order issued by the Securities and Exchange Commission (SEC), the Fund may participate in an interfund lending facility (Facility). The Facility allows the Fund to borrow money from or loan money to the Funds. Loans under the Facility are made for temporary or emergency purposes, such as to fund shareholder redemption requests. Interest on borrowings is the average of the current repurchase agreement rate and the bank loan rate. There was no activity in the Facility during the period.
The Fund also participates with the Funds in a $200 million committed credit facility (Line of Credit) with State Street Bank and Trust Company, to be utilized for temporary or emergency purposes to fund shareholder redemptions or for other short-term liquidity purposes. The Fund pays a commitment fee on its pro-rata portion of the line of credit, which amounted to $52,206 and is reflected as a Miscellaneous Expense in the Statement of Operations. Interest on borrowings is charged at the prevailing rate. There were no borrowings on the Line of Credit during the period.
NOTE 6—PURCHASES AND SALES OF INVESTMENTS
For the six months ended June 30, 2010, purchases and sales of securities, other than short-term securities, aggregated $3,244,784,281 and $2,596,154,950, respectively.
NOTE 7—SUBSEQUENT EVENTS
Fund management has determined that no material events or transactions occurred subsequent to June 30, 2010 and through the date of the Fund’s financial statements issuance, which require additional disclosure in the Fund’s financial statements.
NOTE 8—HOLDINGS OF 5% VOTING SECURITIES
Each of the companies listed below was considered to be an affiliate of the Fund because the Fund owned 5% or more of the company’s voting securities during all or part of the six-month period ended June 30, 2010. Purchase and sale transactions and dividend income earned during the period on these securities were as follows:
| | | | | | | | | | | | | | | | | |
| | | Shares at
Beginning of Period | | Additions | | Reductions | | | Shares at
End of Period | | Dividend
Income(a) | | | Value at
End of Period | |
AOL, Inc. | | 6,075,118 | | 1,580,604 | | — | | | 7,655,722 | | | — | (b) | | | 159,162,460 | |
Cadence Design Systems, Inc. | | 23,282,600 | | — | | — | | | 23,282,600 | | | — | (b) | | | 134,806,254 | |
Capital One Financial Corp. | | 31,943,611 | | 300,000 | | — | | | 32,243,611 | | | 3,209,361 | | | | 1,299,417,523 | |
Citrix Systems, Inc. | | 11,327,022 | | — | | (6,838,100 | ) | | 4,488,922 | | | — | (b) | | | — | (c) |
Compuware Corp. | | 22,088,112 | | — | | — | | | 22,088,112 | | | — | (b) | | | 176,263,134 | |
Electronic Arts, Inc. | | 11,161,177 | | 10,100,000 | | — | | | 21,261,177 | | | — | (b) | | | 306,160,949 | |
Maxim Integrated Products, Inc. | | 23,348,800 | | — | | — | | | 23,348,800 | | | 9,339,520 | | | | 390,625,424 | |
Motorola, Inc. | | 129,758,711 | | 2,000,000 | | — | | | 131,758,711 | | | — | (b) | | | 859,066,796 | |
SLM Corp. | | 26,185,882 | | — | | — | | | 26,185,882 | | | — | (b) | | | 272,071,314 | |
Synopsys, Inc. | | 10,122,369 | | 4,280,000 | | — | | | 14,402,369 | | | — | (b) | | | 300,577,441 | |
Xerox Corp. | | 67,997,300 | | 844,782 | | — | | | 68,842,082 | | | 5,851,577 | | | | — | (c) |
| | | | | | | | | | | | | | | | | |
| | | | | | | | | | | $ | 18,400,458 | | | $ | 3,898,151,295 | |
| | | | | | | | | | | | | | | | | |
| | | | | | | | | | | | | | | | | | |
| (a) | Net of foreign taxes, if any |
| (c) | Company was not an affiliate at the end of the period |
PAGE 11 § DODGE & COX STOCK FUND
FINANCIAL HIGHLIGHTS
| | | | | | | | | | | | | | | | | | |
SELECTED DATA AND RATIOS (for a share outstanding throughout each period) | | Six Months
Ended June 30, | | | Year Ended December 31, | |
| | | 2010(a) | | | 2009 | | | 2008 | | | 2007 | | | 2006 | | | 2005 | |
| | | | | | |
Net asset value, beginning of period | | $96.14 | | | $74.37 | | | $138.26 | | | $153.46 | | | $137.22 | | | $130.22 | |
Income from investment operations: | | | | | | | | | | | | | | | | | | |
Net investment income | | 0.71 | | | 1.15 | | | 1.91 | | | 2.30 | | | 2.15 | | | 1.68 | |
Net realized and unrealized gain/(loss) | | (8.26 | ) | | 21.82 | | | (59.83 | ) | | (1.90 | ) | | 23.12 | | | 10.36 | |
| | | | | | |
Total from investment operations | | (7.55 | ) | | 22.97 | | | (57.92 | ) | | 0.40 | | | 25.27 | | | 12.04 | |
| | | | | | |
Distributions to shareholders from: | | | | | | | | | | | | | | | | | | |
Net investment income | | (0.68 | ) | | (1.20 | ) | | (1.84 | ) | | (2.34 | ) | | (2.12 | ) | | (1.70 | ) |
Net realized gain | | — | | | — | | | (4.13 | ) | | (13.26 | ) | | (6.91 | ) | | (3.34 | ) |
| | | | | | |
Total distributions | | (0.68 | ) | | (1.20 | ) | | (5.97 | ) | | (15.60 | ) | | (9.03 | ) | | (5.04 | ) |
| | | | | | |
Net asset value, end of period | | $87.91 | | | $96.14 | | | $74.37 | | | $138.26 | | | $153.46 | | | $137.22 | |
| | | | | | |
Total return | | (7.91 | )% | | 31.27 | % | | (43.31 | )% | | 0.14 | % | | 18.54 | % | | 9.36 | % |
Ratios/supplemental data: | | | | | | | | | | | | | | | | | | |
Net assets, end of period (millions) | | $37,000 | | | $39,991 | | | $32,721 | | | $63,291 | | | $66,185 | | | $52,184 | |
Ratio of expenses to average net assets | | 0.52 | %(b) | | 0.52 | % | | 0.52 | % | | 0.52 | % | | 0.52 | % | | 0.52 | % |
Ratio of net investment income to average net assets | | 1.47 | %(b) | | 1.42 | % | | 1.75 | % | | 1.44 | % | | 1.48 | % | | 1.29 | % |
Portfolio turnover rate | | 7 | % | | 18 | % | | 31 | % | | 27 | % | | 14 | % | | 12 | % |
See accompanying Notes to Financial Statements
DODGE & COX STOCK FUND §PAGE 12
FUND HOLDINGS
The Fund provides a complete list of its holdings four times each fiscal year, as of the end of each quarter. The lists appear in the Fund’s First Quarter, Semi-Annual, Third Quarter and Annual Reports to shareholders. The Fund files the lists with the Securities and Exchange Commission (SEC) on Form N-CSR (second and fourth quarters) and Form N-Q (first and third quarters). Shareholders may view the Fund’s Forms N-CSR and N-Q on the SEC’s website at www.sec.gov. Forms N-CSR and N-Q may also be reviewed and copied at the SEC’s Public Reference Room in Washington, DC. Information regarding the operations of the Public Reference Room may be obtained by 1-202-942-8090 (direct) or 1-800-732-0330 (general SEC number). A complete list of the Fund’s quarter-end holdings is also available at www.dodgeandcox.com on or about 15 days following each quarter end and remains available on the web site until the list is updated in the subsequent quarter.
PROXY VOTING
For a free copy of the Fund’s proxy voting policies and procedures, please call 1-800-621-3979, visit the Fund’s web site at www.dodgeandcox.com or visit the SEC’s web site at www.sec.gov. Information regarding how the Fund voted proxies relating to portfolio securities during the most recent 12-month period ending June 30 is also available at www.dodgeandcox.com or at www.sec.gov.
HOUSEHOLD MAILINGS
The Fund routinely mails shareholder reports and summary prospectuses to shareholders and, on occasion, proxy statements. In order to reduce the volume of mail, when possible, only one copy of these documents will be sent to shareholders who are part of the same family and share the same residential address.
If you have a direct account with the Funds and you do not want the mailing of shareholder reports and summary prospectuses combined with other members in your household, contact the Funds at 1-800-621-3979. Your request will be implemented within 30 days.
PAGE 13 § DODGE & COX STOCK FUND
THIS PAGE INTENTIONALLY LEFT BANK
DODGE & COXSTOCK FUND §PAGE 14
DODGE & COX FUNDS—EXECUTIVE OFFICER & TRUSTEE INFORMATION
| | | | | | |
Name (Age) and
Address* | | Position with Trust
(Year of Election or
Appointment) | | Principal Occupation During Past 5 Years | | Other Directorships Held by Trustees |
| INTERESTED TRUSTEES & OFFICERS |
John A. Gunn (66) | | Chairman and Trustee
(Trustee since 1985) | | Chairman (since 2007), Chief Executive Officer (2005-2010), and Director of Dodge & Cox, Portfolio Manager and member of Investment Policy Committee (IPC), Global Investment Policy Committee (GIPC) (since 2008), and International Investment Policy Committee (IIPC) | | — |
| Kenneth E. Olivier (58) | | President and Trustee
(Trustee since 2005) | | Chief Executive Officer (since 2010), President (since 2005), and Director of Dodge & Cox, Portfolio Manager, and member of IPC | | — |
| Dana M. Emery (48) | | Senior Vice President and Trustee (Trustee since 1993) | | Executive Vice President (since 2005) and Director of Dodge & Cox, Director of Fixed Income, Portfolio Manager, and member of Fixed Income Investment Policy Committee (FIIPC) | | — |
Charles F. Pohl (52) | | Senior Vice President (Officer since 2004) | | Senior Vice President and Director of Dodge & Cox, Chief Investment Officer (since 2007), Director of Credit Research, Portfolio Manager, Investment Analyst, and member of IPC, GIPC (since 2008), IIPC (since 2007), and FIIPC | | — |
| Diana S. Strandberg (50) | | Senior Vice President
(Officer since 2005) | | Vice President of Dodge & Cox, Director of International Equity (since 2009), Portfolio Manager, and member of IPC, GIPC (since 2008), and IIPC | | — |
| David H. Longhurst (53) | | Treasurer (Officer since 2006) | | Vice President (since 2008) and Assistant Treasurer of Dodge & Cox (since 2007); Fund Administrative and Accounting Senior Manager (2004-2007) | | — |
| Thomas M. Mistele (56) | | Secretary
(Officer since 2000) | | Chief Operating Officer, Director (since 2005), Secretary, and General Counsel of Dodge & Cox | | — |
| Katherine M. Primas (35) | | Chief Compliance Officer
(Officer since 2010) | | Chief Compliance Officer of Dodge & Cox (since 2008) and Associate Chief Compliance Officer of Dodge & Cox (2004-2008) | | — |
| INDEPENDENT TRUSTEES |
| William F. Ausfahl (70) | | Trustee (Since 2002) | | CFO, The Clorox Co. (1982-1997); Director, The Clorox Co. (1984-1997) | | — |
| L. Dale Crandall (68) | | Trustee (Since 1999) | | President, Kaiser Foundation Health Plan, Inc. and Kaiser Foundation Hospitals (2000-2002); Senior Vice President—Finance and Administration & CFO, Kaiser Foundation Health Plan, Inc. and Kaiser Foundation Hospitals (1998-2000) | | Director, Ansell Limited (medical equipment and supplies) (2002-present); Director, Coventry Health Care, Inc. (managed health care) (2004-present); Director, Metavante Technologies, Inc. (software) (2007 to 2009); Bridgeport Education, Inc. (education services) (2008 to present) |
| Thomas A. Larsen (60) | | Trustee (Since 2002) | | Director in Howard, Rice, Nemerovski, Canady, Falk & Rabkin (law firm) | | — |
John B. Taylor (63) | | Trustee (Since 2005) | | Professor of Economics, Stanford University; Senior Fellow, Hoover Institution; Under Secretary for International Affairs, United States Treasury (2001-2005) | | — |
Will C. Wood (70) | | Trustee (Since 1992) | | Principal, Kentwood Associates, Financial Advisers | | Director, Banco Latinoamericano de Exportaciones S.A. (Latin American foreign trade bank) (1999-Present) |
| * | | The address for each Officer and Trustee is 555 California Street, 40th Floor, San Francisco, California 94104. Each Officer and Trustee oversees all five series in the Dodge & Cox Funds complex and serves for an indefinite term. |
Additional information about the Trust’s Trustees and Officers is available in the Trust’s Statement of Additional Information (SAI). You can get a free copy of the SAI by visiting the Funds’ website at www.dodgeandcox.com or calling 1-800-621-3979.
PAGE 15 § DODGE & COX STOCK FUND
| | | | |
| | | | |
www.dodgeandcox.com
For Fund literature, transactions, and account information, please visit the Funds’ web site.
or write or call:
DODGE & COX FUNDS
c/o Boston Financial Data Services
P.O. Box 8422
Boston, Massachusetts 02266-8422
(800) 621-3979
INVESTMENT MANAGER
Dodge & Cox
555 California Street, 40th Floor
San Francisco, California 94104
(415) 981-1710
This report is submitted for the general information of the shareholders of the Fund. The report is not authorized for distribution to prospective investors in the Fund unless it is accompanied by a current prospectus.
This report reflects our views, opinions, and portfolio holdings as of June 30, 2010, the end of the reporting period. Any such views are subject to change at any time based upon market or other conditions and Dodge & Cox disclaims any responsibility to update such views. These views may not be relied on as investment advice and, because investment decisions for a Dodge & Cox Fund are based on numerous factors, may not be relied on as an indication of trading intent on behalf of any Dodge & Cox Fund.
06/10 GSF SAR Printed on recycled paper
Semi-Annual Report
June 30, 2010
Global Stock
Fund
ESTABLISHED 2008
TICKER: DODWX
TO OUR SHAREHOLDERS
The Dodge & Cox Global Stock Fund had a total return of –14.2% for the second quarter of 2010, compared to –12.7% for the MSCI World Index. For the six months ended June 30, 2010, the Fund had a total return of –9.6%, compared to –9.8% for the MSCI World. Please see the Fund’s longer-term performance results on page three. At quarter end, the Fund had net assets of $1.2 billion with a cash position of 3.4%.
MARKET COMMENTARY AND INVESTMENT STRATEGY
While the U.S. and global economies showed signs of continued improvement in the first half of 2010, the performance of the major financial markets in the second quarter reflected uncertainty about future economic growth. Optimism for a global recovery was hampered by concerns of a potential “double-dip” U.S. recession, as growth in U.S. consumer spending slowed and unemployment remained elevated. In addition, substantial debt burdens caused uneasiness about the health of a number of European economies.
We believe that a long-term perspective on investing is important during periods of market volatility. While the aforementioned concerns about U.S. and European economic growth have had a negative impact on valuations of the Fund’s holdings, they have not changed our belief that the future could be rewarding for patient long-term investors. The Fund has invested primarily in global industry leaders that can overcome short-term adversity, and will, we believe, prosper when economic growth accelerates again. We have taken advantage of the low valuations available in the market—the MSCI World index is currently trading at 11.5 times forward earnings—and added to many of the Fund’s positions. Two examples of areas where we are finding opportunities are Financials and Pharmaceuticals.
Anxiety about the global economic recovery has had a particularly negative impact on the valuations of the companies in the Financials sector. For the first six months of 2010, the MSCI World Financials sector was down 12%. As we are optimistic about the long-term potential for the Funds’ holdings in the Financials sector, we have increased the sector allocation to 23% of the Fund from 20% at year end. One area of interest is the
capital markets industry, which includes broker-dealers, custodians, and asset managers. During the first half of 2010, we initiated a position in Charles Schwab,1 a leading U.S. retail brokerage firm with over $1.3 trillion in client assets. As a provider of retail brokerage, banking, custodian, and investment management services, Schwab generates profits from a variety of sources, including trading commissions, account management fees, and interest rate spreads on money market funds. Earnings are currently depressed due to muted trading activity and low interest rates, which have necessitated temporary fee waivers on Schwab’s money market funds. However, over the long term, the company’s strong franchise and superior service offering should allow it to grow assets under custody faster than its competitors, and its profitability should further benefit from economic growth and rising interest rates.
Another area of incremental investment for the Fund over the past six months has been the Pharmaceuticals industry, which now comprises 13.8% of the Fund. Sanofi-Aventis is a good example of what we find attractive in this group. A French multinational firm, it is one of the world’s largest pharmaceutical companies with a leading presence in the emerging markets. At seven times our estimate of forward earnings, its low valuation reflects concerns about the impending decline in earnings due to branded pharmaceuticals losing patent protection. However, more than half of Sanofi’s business is in areas that we expect to grow over the next three to five years, including vaccines, emerging markets, and animal health. Furthermore, while it is difficult to predict how successful any pharmaceutical company’s research and development efforts will be, we believe that Sanofi’s more than €4 billion per year R&D effort could produce new drugs with significant sales potential. In the meantime, the balance sheet and cash flows are healthy, management is cutting costs, and the 5% dividend yield is attractive.
INVESTMENT PHILOSOPHY
Dodge & Cox’s investment philosophy is based on evaluating the long-term opportunities and risks for each company, and comparing our outlook to that of other investors, as measured by the company’s valuation. Our
PAGE 1 § DODGE & COX GLOBAL STOCK FUND
individual company analysis also takes into account the broader forces that dictate the external environment in which a company operates. We evaluate macroeconomic and political factors as part of our assessment of the relative attractiveness of each investment. At the same time, we avoid basing our investment decisions solely on predictions regarding the short-term macroeconomic environment, such as predictions of interest rates, currency movements, and election outcomes.
IN CLOSING
Despite the many near-term uncertainties, we are optimistic that the U.S. and global economies are still in the early stages of a multi-year business recovery. In particular, growth conditions in the developing world appear excellent. This enthusiasm, combined with what we believe are attractive current valuations, leads us to believe that the long-term prospects for equity investing are favorable.
Thank you for your continued confidence in our firm. As always, we welcome your comments and questions.
For the Board of Trustees,
| | |
| |  |
John A. Gunn, Chairman | | Diana S. Strandberg, Senior Vice President |
July 23, 2010
| 1 | | We use these examples to illustrate our investment process, not to imply that we think they are more attractive than the Fund’s other holdings. |
SEMI-ANNUAL PERFORMANCE REVIEW
The Fund outperformed the MSCI World by 0.2 percentage points for the six months ended June 30, 2010.
Key Contributors to Relative Results
| | § | | Relative returns in the Financials sector (down 8% versus down 12% for the MSCI World sector) had a positive impact. SunTrust Banks (up 15%), Kasikornbank (up 15%), and Capital One (up 5%) were strong performers. | |
| | § | | Relative returns from holdings in the Energy sector (down 11% versus down 17% for the MSCI World sector) contributed. Fund holdings Baker Hughes (up 3%) and Ultrapar (up 2%) helped. | |
| | § | | Returns from holdings in the Consumer Discretionary sector (down 3% versus down 4% for the MSCI World sector), combined with a higher average weighting (14% versus 10%), also contributed. Time Warner Cable (up 28%) and Comcast (up 4%) were particularly strong. | |
| | § | | Additional contributors included Nintendo (up 28%), Mitsubishi Electric (up 8%), and Anadolu Efes (up 6%). | |
Key Detractors from Relative Results
| | § | | Weak returns from holdings in the Health Care sector (down 15% versus down 9% for the MSCI World sector) hurt results. Bayer (down 28%), Boston Scientific (down 36%), and GlaxoSmithKline (down 17%) were notable detractors. | |
| | § | | Relative returns in the Consumer Staples sector (down 8% versus down 4% for the MSCI World sector) had a negative effect. | |
| | § | | Weak returns from holdings in the Materials sector (down 17% versus down 14% for the MSCI World sector) also detracted from results. Norsk Hydro (down 41%) and Lafarge (down 33%) were weak. | |
| | § | | Additional detractors included Nokia (down 34%), Telefonica (down 31%), and Unicredit (down 29%). | |
DODGE & COX GLOBAL STOCK FUND §PAGE 2
GROWTH OF $10,000 SINCE INCEPTION
FOR AN INVESTMENT MADE ON MAY 1, 2008
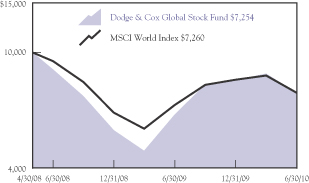
AVERAGE ANNUAL TOTAL RETURN
FOR PERIODS ENDED JUNE 30, 2010
| | | | | | |
| | | 1 Year | | | Since
Inception
(05/01/08) | |
Dodge & Cox Global Stock Fund | | 18.83 | % | | (13.78 | )% |
MSCI World Index | | 10.21 | | | (13.74 | ) |
Returns represent past performance and do not guarantee future results. Investment return and share price will fluctuate with market conditions, and investors may have a gain or loss when shares are sold. Mutual fund performance changes over time and currently may be significantly lower than stated. Performance is updated and published monthly. Visit the Fund’s web site at www.dodgeandcox.com or call 800-621-3979 for current performance figures.
The Fund’s total returns include the reinvestment of dividend and capital gain distributions, but have not been adjusted for any income taxes payable by shareholders on these distributions or on Fund share redemptions. The MSCI World is a widely recognized benchmark of the world’s stock markets, including the United States. Index returns include dividends and/or interest income but, unlike Fund returns, do not reflect fees or expenses.
MSCI World is a service mark of MSCI Barra.
Risks: The Fund is subject to stock market risk, meaning stocks in the Fund may decline in value for extended periods due to the financial prospects of individual companies, or due to general market and economic conditions. Investing in non-U.S. securities may entail risk due to foreign economic and political developments; this risk may be increased when investing in emerging markets. Please read the prospectus for specific details regarding the Fund’s risk profile.
PAGE 3 § DODGE & COX GLOBAL STOCK FUND
FUND EXPENSE EXAMPLE
As a Fund shareholder, you incur ongoing Fund costs, including management fees and other Fund expenses. All mutual funds have ongoing costs, sometimes referred to as operating expenses. The following example shows ongoing costs of investing in the Fund and can help you understand these costs and compare them with those of other mutual funds. The example assumes a $1,000 investment held for the six months indicated.
ACTUAL EXPENSES
The first line of the table below provides information about actual account values and expenses based on the Fund’s actual returns. You may use the information in this line, together with your account balance, to estimate the expenses that you paid over the period. Simply divide your account value by $1,000 (for example, an $8,600 account value divided by $1,000 = 8.6), then multiply the result by the number in the first line under the heading “Expenses Paid During Period” to estimate the expenses you paid on your account during this period.
HYPOTHETICAL EXAMPLE FOR COMPARISON WITH OTHER MUTUAL FUNDS
Information on the second line of the table can help you compare ongoing costs of investing in the Fund with those of other mutual funds. This information may not be used to estimate the actual ending account balance or expenses you paid during the period. The hypothetical “Ending Account Value” is based on the actual expense ratio of the Fund and an assumed 5% annual rate of return before expenses (not the Fund’s actual return). The amount under the heading “Expense Paid During the Period” shows the hypothetical expenses your account would have incurred under this scenario. You can compare this figure with the 5% hypothetical examples that appear in shareholder reports of other mutual funds.
| | | | | | | | | |
Six Months Ended June 30, 2010 | | Beginning Account Value
1/1/2010 | | Ending Account Value
6/30/2010 | | Expenses Paid During Period* |
Based on Actual Fund Return | | $ | 1,000.00 | | $ | 903.90 | | $ | 3.33 |
Based on Hypothetical 5% Yearly Return | | | 1,000.00 | | | 1,021.29 | | | 3.54 |
| * | | Expenses are equal to the Fund’s annualized six-month expense ratio of 0.71%, multiplied by the average account value over the period, multiplied by 181/365 (to reflect the one-half year period). |
The expenses shown in the table highlight ongoing costs only and do not reflect any transactional fees or account maintenance fees. While other mutual funds may charge such fees, please note that the Fund does not charge transaction fees (e.g., redemption fees, sales loads) or universal account maintenance fees (e.g., small account fees).
DODGE & COX GLOBAL STOCK FUND §PAGE 4
| | |
| FUND INFORMATION | | June 30, 2010 |
| | |
| GENERAL INFORMATION | | |
Net Asset Value Per Share | | $7.15 |
Total Net Assets (billions) | | $1.2 |
2009 Expense Ratio(a) | | 0.74% |
Expense Ratio (1/1/10 to 6/30/10, annualized) | | 0.71% |
Portfolio Turnover Rate (1/1/10 to 6/30/10, unannualized) | | 6% |
30-Day SEC Yield(b) | | 1.42% |
Fund Inception Date | | May 1, 2008 |
No sales charges or distribution fees | | |
Investment Manager: Dodge & Cox, San Francisco. Managed by the Global Investment Policy Committee, whose seven members’ average tenure at Dodge & Cox is 18 years.
| | | | |
| PORTFOLIO CHARACTERISTICS | | Fund | | MSCI
World |
Number of Stocks | | 98 | | 1,657 |
Median Market Capitalization (billions) | | $18 | | $6 |
Weighted Average Market
Capitalization (billions) | | $47 | | $55 |
Price-to-Earnings Ratio(c) | | 10.6x | | 11.5x |
Countries Represented | | 24 | | 24 |
Emerging Markets (Brazil, India, Indonesia, Mexico, Russia, South Africa, South Korea, Thailand, Turkey) | | 12.1% | | 0.0% |
| | | |
| TEN LARGEST HOLDINGS(d) | | Fund | |
Hewlett-Packard Co. (United States) | | 2.6 | % |
General Electric Co. (United States) | | 2.5 | |
Novartis AG (Switzerland) | | 2.4 | |
Vodafone Group PLC (United Kingdom) | | 2.4 | |
Merck & Co., Inc. (United States) | | 2.4 | |
Sanofi-Aventis (France) | | 2.3 | |
GlaxoSmithKline PLC (United Kingdom) | | 2.2 | |
Roche Holding AG (Switzerland) | | 2.2 | |
Bank of New York Mellon Corp. (United States) | | 2.0 | |
Capital One Financial Corp. (United States) | | 2.0 | |
ASSET ALLOCATION

| | | | | | |
| REGION DIVERSIFICATION | | Fund | | | MSCI
World | |
United States | | 39.3 | % | | 49.6 | % |
Europe (excluding United Kingdom) | | 32.7 | | | 19.2 | |
United Kingdom | | 9.7 | | | 9.5 | |
Japan | | 4.7 | | | 10.5 | |
Pacific (excluding Japan) | | 4.5 | | | 5.6 | |
Latin America | | 3.0 | | | 0.0 | |
Africa/Middle East | | 2.7 | | | 0.4 | |
Canada | | 0.0 | | | 5.2 | |
| | | | | | |
| SECTOR DIVERSIFICATION | | Fund | | | MSCI
World | |
Financials | | 23.1 | % | | 20.5 | % |
Health Care | | 17.0 | | | 10.2 | |
Consumer Discretionary | | 13.6 | | | 9.9 | |
Information Technology | | 13.0 | | | 11.9 | |
Industrials | | 8.8 | | | 11.0 | |
Materials | | 6.1 | | | 7.3 | |
Energy | | 6.1 | | | 10.0 | |
Telecommunication Services | | 5.7 | | | 4.3 | |
Consumer Staples | | 3.2 | | | 10.5 | |
Utilities | | 0.0 | | | 4.4 | |
| (a) | 2009 expense ratio per Fund prospectus, dated May 1, 2010. |
| (b) | SEC yield is an annualization of the Fund’s total net investment income per share for the 30-day period ended on the last day of the month. |
| (c) | Price-to-earnings (P/E) ratios are calculated using 12-month forward earnings estimates. |
| (d) | The Fund’s portfolio holdings are subject to change without notice. The mention of specific securities is not a recommendation or solicitation for any person to buy, sell, or hold any particular security. |
PAGE 5 § DODGE & COX GLOBAL STOCK FUND
| | |
| PORTFOLIO OF INVESTMENTS (unaudited) | | June 30, 2010 |
| | | | | |
| COMMON STOCKS 94.6% | | | | |
| | |
| | | SHARES | | VALUE |
| CONSUMER DISCRETIONARY: 12.7% |
AUTOMOBILES & COMPONENTS: 2.2% |
Bayerische Motoren Werke AG (Germany) | | 192,600 | | $ | 9,315,719 |
Yamaha Motor Co., Ltd.(a) (Japan) | | 1,252,400 | | | 16,530,556 |
| | | | | |
| | | | | 25,846,275 |
CONSUMER DURABLES & APPAREL: 2.3% |
LG Electronics, Inc. (South Korea) | | 121,800 | | | 9,301,111 |
Panasonic Corp. (Japan) | | 544,300 | | | 6,796,583 |
Sony Corp. (Japan) | | 398,000 | | | 10,594,034 |
| | | | | |
| | | | | 26,691,728 |
MEDIA: 6.2% |
Comcast Corp., Class A (United States) | | 1,055,200 | | | 18,328,824 |
Grupo Televisa SA ADR (Mexico) | | 253,800 | | | 4,418,658 |
Naspers, Ltd. (South Africa) | | 653,600 | | | 21,967,428 |
News Corp., Class A (United States) | | 337,445 | | | 4,035,842 |
Television Broadcasts, Ltd. (Hong Kong) | | 771,900 | | | 3,582,238 |
Time Warner Cable, Inc. (United States) | | 187,971 | | | 9,789,530 |
Time Warner, Inc. (United States) | | 350,266 | | | 10,126,190 |
| | | | | |
| | | | | 72,248,710 |
RETAILING: 2.0% |
Home Depot, Inc. (United States) | | 206,200 | | | 5,788,034 |
Liberty Interactive, Series A(a) (United States) | | 806,557 | | | 8,468,849 |
Macy’s, Inc. (United States) | | 496,500 | | | 8,887,350 |
| | | | | |
| | | | | 23,144,233 |
| | | | | |
| | | | | 147,930,946 |
| CONSUMER STAPLES: 3.2% |
FOOD & STAPLES RETAILING: 1.0% |
Walgreen Co. (United States) | | 445,500 | | | 11,894,850 |
FOOD, BEVERAGE & TOBACCO: 2.2% |
Anadolu Efes Biracilik ve Malt Sanayii AS (Turkey) | | 1,422,600 | | | 16,610,090 |
Diageo PLC ADR (United Kingdom) | | 144,000 | | | 9,034,560 |
| | | | | |
| | | | | 25,644,650 |
| | | | | |
| | | | | 37,539,500 |
| ENERGY: 5.0% |
Baker Hughes, Inc. (United States) | | 247,387 | | | 10,283,877 |
Chevron Corp. (United States) | | 74,800 | | | 5,075,928 |
OAO Lukoil ADR (Russia) | | 150,600 | | | 7,746,107 |
Occidental Petroleum Corp. (United States) | | 89,125 | | | 6,875,994 |
Royal Dutch Shell PLC ADR (United Kingdom) | | 111,400 | | | 5,594,508 |
Schlumberger, Ltd. (United States) | | 330,600 | | | 18,295,404 |
Total SA (France) | | 92,100 | | | 4,098,863 |
| | | | | |
| | | | | 57,970,681 |
| | | | | |
| | |
| | | SHARES | | VALUE |
| FINANCIALS: 23.1% |
BANKS: 10.3% |
Bangkok Bank PCL NVDR (Thailand) | | 1,505,300 | | $ | 5,762,681 |
Barclays PLC (United Kingdom) | | 4,281,600 | | | 16,974,500 |
BB&T Corp. (United States) | | 299,700 | | | 7,885,107 |
HSBC Holdings PLC (United Kingdom) | | 1,572,207 | | | 14,343,299 |
ICICI Bank, Ltd. ADR (India) | | 222,400 | | | 8,037,536 |
Kasikornbank PCL Foreign (Thailand) | | 2,830,600 | | | 8,220,983 |
Standard Bank Group, Ltd. (South Africa) | | 176,600 | | | 2,336,070 |
Standard Chartered PLC (United Kingdom) | | 549,999 | | | 13,351,734 |
SunTrust Banks, Inc. (United States) | | 333,795 | | | 7,777,423 |
Unicredit SPA (Italy) | | 7,682,333 | | | 17,052,490 |
Wells Fargo & Co. (United States) | | 703,273 | | | 18,003,789 |
| | | | | |
| | | | | 119,745,612 |
DIVERSIFIED FINANCIALS: 8.5% |
Bank of New York Mellon Corp. (United States) | | 963,500 | | | 23,788,815 |
Capital One Financial Corp. (United States) | | 579,700 | | | 23,361,910 |
Charles Schwab Corp. (United States) | | 816,200 | | | 11,573,716 |
Credit Suisse Group AG (Switzerland) | | 362,700 | | | 13,631,629 |
Goldman Sachs Group, Inc. (United States) | | 64,500 | | | 8,466,915 |
Haci Omer Sabanci Holding AS (Turkey) | | 2,038,588 | | | 8,156,603 |
Legg Mason, Inc. (United States) | | 345,000 | | | 9,670,350 |
| | | | | |
| | | | | 98,649,938 |
INSURANCE: 3.7% |
AEGON NV(a) (Netherlands) | | 3,514,974 | | | 18,829,871 |
Swiss Life Holding AG (Switzerland) | | 62,000 | | | 5,934,140 |
Swiss Reinsurance Co., Ltd. (Switzerland) | | 450,100 | | | 18,515,397 |
| | | | | |
| | | | | 43,279,408 |
REAL ESTATE: 0.6% |
Hang Lung Group, Ltd. (Hong Kong) | | 1,127,500 | | | 6,002,652 |
Hang Lung Properties, Ltd. (Hong Kong) | | 381,700 | | | 1,471,268 |
| | | | | |
| | | | | 7,473,920 |
| | | | | |
| | | | | 269,148,878 |
| HEALTH CARE: 17.0% |
HEALTH CARE EQUIPMENT & SERVICES: 2.2% |
Boston Scientific Corp.(a) (United States) | | 1,864,100 | | | 10,811,780 |
Covidien PLC (Ireland) | | 232,200 | | | 9,329,796 |
Medtronic, Inc. (United States) | | 155,700 | | | 5,647,239 |
| | | | | |
| | | | | 25,788,815 |
PHARMACEUTICALS, BIOTECHNOLOGY & LIFE SCIENCES: 14.8% |
Amgen, Inc.(a) (United States) | | 210,400 | | | 11,067,040 |
Bayer AG (Germany) | | 284,420 | | | 15,869,230 |
GlaxoSmithKline PLC ADR (United Kingdom) | | 750,900 | | | 25,538,109 |
| | |
| See accompanying Notes to Financial Statements | | DODGE & COX GLOBAL STOCK FUND §PAGE 6 |
| | |
| PORTFOLIO OF INVESTMENTS (unaudited) | | June 30, 2010 |
| | | | | |
| COMMON STOCKS: (continued) | | | | |
| | |
| | | SHARES | | VALUE |
Merck & Co., Inc. (United States) | | 792,200 | | $ | 27,703,234 |
Novartis AG ADR (Switzerland) | | 583,600 | | | 28,199,552 |
Pfizer, Inc. (United States) | | 816,100 | | | 11,637,586 |
Roche Holding AG (Switzerland) | | 184,400 | | | 25,322,474 |
Sanofi-Aventis (France) | | 443,700 | | | 26,756,388 |
| | | | | |
| | | | | 172,093,613 |
| | | | | |
| | | | | 197,882,428 |
| | | | | |
| INDUSTRIALS: 8.8% |
CAPITAL GOODS: 7.6% |
General Electric Co. (United States) | | 2,034,600 | | | 29,338,932 |
Koninklijke Philips Electronics NV (Netherlands) | | 296,965 | | | 8,851,744 |
Mitsubishi Electric Corp. (Japan) | | 1,802,700 | | | 14,041,068 |
Schneider Electric SA (France) | | 118,689 | | | 12,013,087 |
Tyco International, Ltd. (Switzerland) | | 480,300 | | | 16,920,969 |
Wienerberger AG(a) (Austria) | | 624,780 | | | 7,618,548 |
| | | | | |
| | | | | 88,784,348 |
TRANSPORTATION: 1.2% |
FedEx Corp. (United States) | | 192,200 | | | 13,475,142 |
| | | | | |
| | | | | 102,259,490 |
| INFORMATION TECHNOLOGY: 13.0% |
SEMICONDUCTORS & SEMICONDUCTOR EQUIPMENT: 1.0% |
Infineon Technologies AG(a) (Germany) | | 960,408 | | | 5,550,293 |
Maxim Integrated Products, Inc. (United States) | | 334,000 | | | 5,587,820 |
| | | | | |
| | | | | 11,138,113 |
SOFTWARE & SERVICES: 4.6% |
AOL, Inc.(a) (United States) | | 483,169 | | | 10,045,084 |
Cadence Design Systems, Inc.(a) (United States) | | 1,124,000 | | | 6,507,960 |
Compuware Corp.(a) (United States) | | 291,400 | | | 2,325,372 |
EBay, Inc.(a) (United States) | | 515,900 | | | 10,116,799 |
Electronic Arts, Inc.(a) (United States) | | 557,300 | | | 8,025,120 |
Nintendo Co., Ltd. (Japan) | | 23,800 | | | 6,932,852 |
Symantec Corp.(a) (United States) | | 428,900 | | | 5,953,132 |
Synopsys, Inc.(a) (United States) | | 205,100 | | | 4,280,437 |
| | | | | |
| | | | | 54,186,756 |
TECHNOLOGY, HARDWARE & EQUIPMENT: 7.4% |
Alcatel-Lucent(a) (France) | | 1,935,645 | | | 4,936,941 |
Hewlett-Packard Co. (United States) | | 699,800 | | | 30,287,344 |
Motorola, Inc.(a) (United States) | | 812,833 | | | 5,299,671 |
| | | | | |
| | |
| | | SHARES | | VALUE |
Nokia Oyj (Finland) | | 2,506,200 | | $ | 20,463,823 |
Telefonaktiebolaget LM Ericsson (Sweden) | | 477,700 | | | 5,318,614 |
Tyco Electronics, Ltd. (Switzerland) | | 425,900 | | | 10,809,342 |
Xerox Corp. (United States) | | 1,168,200 | | | 9,392,328 |
| | | | | |
| | | | | 86,508,063 |
| | | | | |
| | | | | 151,832,932 |
| MATERIALS: 6.1% | | | | | |
Akzo Nobel NV (Netherlands) | | 194,300 | | | 10,050,768 |
Arkema (France) | | 252,516 | | | 8,687,168 |
Cemex SAB de CV ADR(a) (Mexico) | | 776,456 | | | 7,508,329 |
Domtar Corp. (United States) | | 437,616 | | | 21,508,826 |
Lafarge SA (France) | | 253,908 | | | 13,729,498 |
Lanxess AG (Germany) | | 134,100 | | | 5,651,606 |
Norsk Hydro ASA (Norway) | | 989,700 | | | 4,453,448 |
Norsk Hydro ASA Rights(a) (Norway) | | 219,404 | | | 111,504 |
| | | | | |
| | | | | 71,701,147 |
| TELECOMMUNICATION SERVICES: 5.7% |
MTN Group, Ltd. (South Africa) | | 517,100 | | | 6,778,921 |
PT Telekomunik Indonesia ADR (Indonesia) | | 300,500 | | | 10,286,115 |
Telefonica SA ADR (Spain) | | 325,900 | | | 18,097,227 |
Telekom Austria AG (Austria) | | 261,004 | | | 2,901,258 |
Vodafone Group PLC ADR (United Kingdom) | | 1,356,100 | | | 28,030,587 |
| | | | | |
| | | | | 66,094,108 |
| | | | | |
TOTAL COMMON STOCKS
(Cost $1,131,802,912) | | | | $ | 1,102,360,110 |
| | |
| PREFERRED STOCKS: 2.0% | | | | |
| CONSUMER DISCRETIONARY: 0.9% |
MEDIA: 0.9% |
Net Servicos de Comunicacao SA ADR(a) (Brazil) | | 1,100,800 | | | 10,336,512 |
ENERGY: 1.1% |
Petroleo Brasileiro SA ADR (Brazil) | | 190,000 | | | 5,662,000 |
Ultrapar Participacoes SA ADR (Brazil) | | 147,800 | | | 6,989,462 |
| | | | | |
| | | | | 12,651,462 |
| | | | | |
TOTAL PREFERRED STOCKS
(Cost $18,378,795) | | | | $ | 22,987,974 |
| | |
| PAGE 7 § DODGE & COX GLOBAL STOCK FUND | | See accompanying Notes to Financial Statements |
| | |
| PORTFOLIO OF INVESTMENTS (unaudited) | | June 30, 2010 |
| | | | | | | | |
| SHORT-TERM INVESTMENTS: 6.8% | |
| | |
| | | PAR VALUE | | | VALUE | |
| MONEY MARKET FUND: 0.3% | |
SSgA Prime Money Market Fund | | $ | 3,507,437 | | | $ | 3,507,437 | |
| REPURCHASE AGREEMENT: 6.5% | |
Fixed Income Clearing Corporation(b) 0.00%, 7/1/10, maturity value $76,352,000 | | | 76,352,000 | | | | 76,352,000 | |
| | | | | | | | |
TOTAL SHORT-TERM INVESTMENTS
(Cost $79,859,437) | | | $ | 79,859,437 | |
| | | | | | | | |
TOTAL INVESTMENTS
(Cost $1,230,041,144) | | | 103.4 | % | | | 1,205,207,521 | |
OTHER ASSETS LESS LIABILITIES | | | (3.4 | )% | | | (39,740,928 | ) |
| | | | | | | | |
| NET ASSETS | | | 100.0 | % | | $ | 1,165,466,593 | |
| | | | | | | | |
| (b) | Repurchase agreement is collateralized by Fannie Mae 0.00%, 4/25/11-4/26/11. Total collateral value is $77,879,638. |
ADR: American Depositary Receipt
NVDR: Non-Voting Depositary Receipt
| | |
| See accompanying Notes to Financial Statements | | DODGE & COX GLOBAL STOCK FUND §PAGE 8 |
| | | | |
STATEMENT OF ASSETS AND LIABILITIES (unaudited) | |
| |
| | | June 30, 2010 | |
ASSETS: | | | | |
Investments, at value (cost $1,230,041,144) | | $ | 1,205,207,521 | |
Cash denominated in foreign currency (cost $144,390) | | | 144,627 | |
Receivable for investments sold | | | 60,608 | |
Receivable for Fund shares sold | | | 2,903,104 | |
Dividends and interest receivable | | | 2,953,857 | |
Prepaid expenses and other assets | | | 1,295 | |
| | | | |
| | | 1,211,271,012 | |
| | | | |
LIABILITIES: | | | | |
Payable for investments purchased | | | 44,543,988 | |
Payable for Fund shares redeemed | | | 136,654 | |
Management fees payable | | | 530,584 | |
Accrued foreign capital gain tax | | | 436,057 | |
Accrued expenses | | | 157,136 | |
| | | | |
| | | 45,804,419 | |
| | | | |
NET ASSETS | | $ | 1,165,466,593 | |
| | | | |
NET ASSETS CONSIST OF: | | | | |
Paid in capital | | $ | 1,281,479,636 | |
Undistributed net investment income | | | 9,370,991 | |
Accumulated net realized loss | | | (100,133,262 | ) |
Net unrealized depreciation (net of accrued foreign capital gain tax of $436,057) | | | (25,250,772 | ) |
| | | | |
| | $ | 1,165,466,593 | |
| | | | |
Fund shares outstanding (par value $0.01 each, unlimited shares authorized) | | | 163,113,013 | |
Net asset value per share | | | $7.15 | |
| |
STATEMENT OF OPERATIONS (unaudited) | | | | |
| |
| | | Six Months Ended
June 30, 2010 | |
INVESTMENT INCOME: | | | | |
Dividends (net of foreign taxes of $1,152,428) | | $ | 12,893,765 | |
Interest | | | 10,439 | |
| | | | |
| | | 12,904,204 | |
| | | | |
EXPENSES: | | | | |
Management fees | | | 3,056,830 | |
Custody and fund accounting fees | | | 77,014 | |
Transfer agent fees | | | 149,281 | |
Professional services | | | 73,367 | |
Shareholder reports | | | 40,951 | |
Registration fees | | | 103,178 | |
Trustees’ fees | | | 77,000 | |
Miscellaneous | | | 18,028 | |
| | | | |
| | | 3,595,649 | |
| | | | |
NET INVESTMENT INCOME | | | 9,308,555 | |
| | | | |
REALIZED AND UNREALIZED GAIN/(LOSS): | |
Net realized loss | | | | |
Investments | | | (3,666,722 | ) |
Foreign currency transactions | | | (32,707 | ) |
Net change in unrealized appreciation/depreciation | | | | |
Investments (including net increase in accrued foreign capital gain tax of $179,270) | | | (124,894,630 | ) |
Foreign currency transactions | | | 22,300 | |
| | | | |
Net realized and unrealized loss | | | (128,571,759 | ) |
| | | | |
NET DECREASE IN NET ASSETS FROM OPERATIONS | | $ | (119,263,204 | ) |
| | | | |
| | | | | | | | |
STATEMENT OF CHANGES IN NET ASSETS | |
| | | Six Months Ended
June 30, 2010
(unaudited) | | | Year Ended
December 31, 2009 | |
OPERATIONS: | | | | | | | | |
Net investment income | | $ | 9,308,555 | | | $ | 6,438,809 | |
Net realized loss | | | (3,699,429 | ) | | | (69,287,606 | ) |
Net change in unrealized appreciation/depreciation | | | (124,872,330 | ) | | | 295,603,719 | |
| | | | | | | | |
Net increase/(decrease) in net assets from operations | | | (119,263,204 | ) | | | 232,754,922 | |
| | | | | | | | |
| | |
DISTRIBUTIONS TO SHAREHOLDERS FROM: | | | | | | | | |
Net investment income | | | — | | | | (6,376,326 | ) |
Net realized gain | | | — | | | | — | |
| | | | | | | | |
Total distributions | | | — | | | | (6,376,326 | ) |
| | | | | | | | |
| | |
FUND SHARE TRANSACTIONS: | | | | | | | | |
Proceeds from sale of shares | | | 449,120,209 | | | | 355,259,443 | |
Reinvestment of distributions | | | — | | | | 6,145,632 | |
Cost of shares redeemed | | | (78,172,749 | ) | | | (142,217,300 | ) |
| | | | | | | | |
Net increase from Fund share transactions | | | 370,947,460 | | | | 219,187,775 | |
| | | | | | | | |
Total increase in net assets | | | 251,684,256 | | | | 445,566,371 | |
| | |
NET ASSETS: | | | | | | | | |
Beginning of period | | | 913,782,337 | | | | 468,215,966 | |
| | | | | | | | |
End of period (including undistributed net investment income of $9,370,991 and $62,436, respectively) | | $ | 1,165,466,593 | | | $ | 913,782,337 | |
| | | | | | | | |
| | |
SHARE INFORMATION: | | | | | | | | |
Shares sold | | | 57,499,601 | | | | 51,624,866 | |
Distributions reinvested | | | — | | | | 782,883 | |
Shares redeemed | | | (9,947,528 | ) | | | (24,605,386 | ) |
| | | | | | | | |
Net increase in shares outstanding | | | 47,552,073 | | | | 27,802,363 | |
| | | | | | | | |
| | |
| PAGE 9 § DODGE & COX GLOBAL STOCK FUND | | See accompanying Notes to Financial Statements |
NOTES TO FINANCIAL STATEMENTS (unaudited)
NOTE 1—ORGANIZATION AND SIGNIFICANT ACCOUNTING POLICIES
Dodge & Cox Global Stock Fund (the “Fund”) is one of the series constituting the Dodge & Cox Funds (the “Trust” or the “Funds”). The Trust is organized as a Delaware statutory trust and is registered under the Investment Company Act of 1940, as amended, as a diversified, open-end management investment company. The Fund commenced operations on May 1, 2008. It seeks long-term growth of principal and income, and invests primarily in a diversified portfolio of U.S. and foreign stocks. Foreign investing, especially in developing countries, has special risks such as currency and market volatility and political and social instability. These and other risk considerations are discussed in the Fund’s Prospectus.
The financial statements have been prepared in conformity with accounting principles generally accepted in the United States of America, which require the use of estimates and assumptions by management. Actual results may differ from those estimates. Significant accounting policies are as follows:
Security valuation The Fund’s net assets are valued as of the close of trading on the New York Stock Exchange (NYSE), generally 4:00 p.m. Eastern Time, each day that the NYSE is open for business. Listed securities are valued at market, using the official quoted close price or the last sale on the date of determination on the principal exchange on which such securities are traded or, if not available, at the mean between the exchange listed bid and ask prices. A security that is listed or traded on more than one exchange is valued at the quotation on the exchange determined to be the primary market for such security. Security values are not discounted based on the size of the Fund’s position. Short-term securities are valued at amortized cost which approximates current value.
Investments initially valued in currencies other than the U.S. dollar are converted to the U.S. dollar using prevailing exchange rates. As a result, the Fund’s net asset value (NAV) may be affected by changes in the value of currencies in relation to the U.S. dollar.
If market quotations are not readily available or if a security’s value has materially changed after the close of the security’s primary market but before the close of trading on the NYSE, the security is valued at fair value as
determined in good faith by or at the direction of the Board of Trustees. The Fund may use fair value pricing in calculating its NAV when, for example, (i) the primary market for a security is closed or if trading of a security is suspended or limited, (ii) the Fund determines that the price provided by a pricing service is inaccurate or unreliable, or (iii) the Fund determines that a significant event affecting the value of a security has occurred before the close of the NYSE but after the close of the security’s primary market. An event is considered significant if there is both an affirmative expectation that the security’s value will change in response to the event and a reasonable basis for quantifying a resulting change in value. For securities that do not trade during NYSE hours, fair value determinations are based on analyses of market movements after the close of those securities’ primary markets, and include reviews of developments in foreign markets, the performance of U.S. securities markets, and the performance of instruments trading in U.S. markets that represent foreign securities and baskets of foreign securities. Pricing services are used to obtain closing market prices and to compute certain fair value adjustment factors utilizing pricing models. These adjustment factors may be used to systematically value foreign securities at fair value. When fair value pricing is employed, the prices of securities used by the Fund to calculate its net asset value may differ from quoted or published prices for the same securities. In addition, fair values may not reflect the price that the Fund could obtain for a security if it were to dispose of that security at the time of pricing.
Security transactions, investment income, expenses, and distributions Security transactions are recorded on the trade date. Realized gains and losses on securities sold are determined on the basis of identified cost.
Dividend income and corporate action transactions are recorded on the ex-dividend date, except for certain dividends or corporate actions from foreign securities where the ex-dividend date may have passed, which are recorded as soon as the Fund is informed of the ex-dividend date. Withholding taxes on foreign dividends have been provided for in accordance with the Fund’s understanding of the applicable country’s tax rules and rates. Non-cash dividends included in dividend income, if
DODGE & COX GLOBAL STOCK FUND §PAGE 10
NOTES TO FINANCIAL STATEMENTS (unaudited)
any, are recorded at the fair market value of the securities received. Distributions received in excess of income are recorded as a reduction of cost of investments and/or realized gain. Interest income is recorded on the accrual basis.
Expenses are recorded on the accrual basis. Most expenses of the Trust can be directly attributed to a specific series. Expenses which cannot be directly attributed are allocated among the Funds in the Trust.
Distributions to shareholders are recorded on the ex-dividend date.
Repurchase agreements The Fund may enter into repurchase agreements, secured by U.S. government or agency securities, which involve the purchase of securities from a counterparty with a simultaneous commitment to resell the securities at an agreed-upon date and price. It is the Fund’s policy that its custodian take possession of the underlying collateral securities, the fair value of which exceeds the principal amount of the repurchase transaction, including accrued interest, at all times. In the event of default by the counterparty, the Fund has the contractual right to liquidate the collateral securities and to apply the proceeds in satisfaction of the obligation.
Foreign currency The Fund may enter forward foreign currency contracts to hedge portfolio positions. It may also enter spot foreign currency contracts to facilitate security transactions in foreign currency-denominated securities. Losses from these transactions may arise from unfavorable changes in currency values or if the counterparties do not perform under the contracts’ terms. The Fund did not enter into any forward foreign currency contracts during the period ended June 30, 2010.
Foreign currency-denominated assets (including investment securities) and liabilities are translated into U.S. dollars each business day at the prevailing exchange rate. Purchases and sales of securities, income receipts, and expenses denominated in foreign currencies are translated into U.S. dollars at the exchange rate in effect on the transaction date.
Net realized gains and losses on foreign currency transactions arise from sales of foreign currencies and from changes in currency values between the date recorded and the related settlement/cash payment on securities transactions, dividends, and foreign currency contracts. The effects of currency rate changes on investment securities are included with realized and unrealized gain (loss) on investments.
NOTE 2—VALUATION MEASUREMENTS
Various inputs are used in determining the value of the Fund’s investments and other financial instruments. These inputs are summarized in the three broad levels listed below.
| § | | Level 1: Quoted prices in active markets for identical securities |
| § | | Level 2: Other significant observable inputs (including quoted prices for similar securities, market indices, interest rates, credit risk, etc.) |
| § | | Level 3: Significant unobservable inputs (including the Fund’s own assumptions in determining the fair value of investments) |
The inputs or methodology used for valuing securities are not necessarily an indication of the risk associated with investing in those securities.
The following is a summary of the inputs used to value the Fund’s holdings as of June 30, 2010:
| | | | | | |
| Security Classification(a) | | LEVEL 1
(Quoted Prices) | | LEVEL 2
(Other Significant
Observable Inputs)(b) |
Common Stocks | | | | | | |
Consumer Discretionary | | $ | 69,843,277 | | $ | 78,087,669 |
Consumer Staples | | | 20,929,410 | | | 16,610,090 |
Energy | | | 46,125,711 | | | 11,844,970 |
Financials | | | 118,565,561 | | | 150,583,317 |
Health Care | | | 129,934,336 | | | 67,948,092 |
Industrials | | | 59,735,043 | | | 42,524,447 |
Information Technology | | | 108,630,409 | | | 43,202,523 |
Materials | | | 29,017,155 | | | 42,683,992 |
Telecommunication Services | | | 56,413,929 | | | 9,680,179 |
Preferred Stocks | | | 22,987,974 | | | — |
Money Market Fund | | | 3,507,437 | | | — |
Repurchase Agreement | | | — | | | 76,352,000 |
| | | | | | |
Total | | $ | 665,690,242 | | $ | 539,517,279 |
| | | | | | |
| | | | | | | |
| (a) | | At June 30, 2010 the Fund held no securities that were considered to be “Level 3” securities (those valued using significant unobservable inputs). |
| (b) | | Transfers during the period between Level 1 and Level 2 relate to the use of systematic fair valuation. On days when systematic fair valuation is used, non-US$ denominated securities move from a Level 1 to Level 2 classification. |
PAGE 11 § DODGE & COX GLOBAL STOCK FUND
NOTES TO FINANCIAL STATEMENTS (unaudited)
NOTE 3—RELATED PARTY TRANSACTIONS
Management fees Under a written agreement approved by a unanimous vote of the Board of Trustees, the Fund pays an annual management fee of 0.60% of the Fund’s average daily net assets to Dodge & Cox, investment manager of the Fund. Dodge & Cox has contractually agreed to reimburse the Fund for all ordinary operating expenses to the extent necessary to maintain the Fund’s total operating expenses at 0.90% for the fiscal periods ending December 31, 2008 & 2009.
Fund officers and trustees All officers and three of the trustees of the Trust are officers or employees of Dodge & Cox. The Trust pays a fee only to those trustees who are not affiliated with Dodge & Cox.
Indemnification Under the Trust’s organizational documents, its officers and trustees are indemnified against certain liabilities arising out of the performance of their duties to the Trust. In addition, in the normal course of business the Trust enters into contracts that provide general indemnities to other parties. The Trust’s maximum exposure under these arrangements is unknown as this would involve future claims that may be made against the Trust that have not yet occurred.
NOTE 4—INCOME TAX INFORMATION AND DISTRIBUTIONS TO SHAREHOLDERS
A provision for federal income taxes is not required since the Fund intends to qualify as a regulated investment company under Subchapter M of the Internal Revenue Code and distribute all of its taxable income to shareholders. Distributions are determined in accordance with income tax regulations, which may differ from net investment income and realized gains for financial reporting purposes. Financial reporting records are adjusted for permanent book/tax differences to reflect tax character.
Certain foreign countries impose a tax on capital gains which is accrued by the Fund based on unrealized appreciation, if any, on affected securities. The tax is paid when a gain is realized on the sale of affected securities.
Book/tax differences are primarily due to differing treatments of wash sales, net short-term realized gain/ (loss) on investments, and foreign currency realized gain/ (loss). At June 30, 2010, the cost of investments for federal income tax purposes was $1,233,390,029.
Distributions during the six months ended June 30, 2010 and for the year ended December 31, 2009 were characterized as follows for federal income tax purposes:
| | | | |
| | | Six Months Ended June 30, 2010 | | Year Ended
December 31, 2009 |
Ordinary income | | — | | $6,376,326 |
| | | | ($0.056 per share) |
| | |
Long-term capital gain | | — | | — |
At June 30, 2010, the tax basis components of distributable earnings were as follows:
| | | | |
Unrealized appreciation | | $ | 90,135,593 | |
Unrealized depreciation | | | (118,735,250 | ) |
| | | | |
Net unrealized depreciation | | | (28,599,657 | ) |
Undistributed ordinary income | | | 9,370,991 | |
Accumulated capital loss(a) | | | (3,585,649 | ) |
Capital Loss carryforward(b) | | | (93,198,728 | ) |
| (a) | | Represents capital loss realized for tax purposes during the period form January 1, 2010 to June 30, 2010. |
| (b) | | Represents accumulated capital loss as of December 31, 2009 which may be carried forward to offset future capital gains. If not utilized, the capital loss carryforward expires as follows: |
| | | |
Expiring in 2016 | | $ | 13,362,941 |
Expiring in 2017 | | | 79,835,787 |
| | | |
| | $ | 93,198,728 |
| | | |
Fund management has reviewed the tax positions for open periods (for Federal purposes, three years from the date of filing and for State purposes, four years from the date of filing) as applicable to the Fund, and has determined that no provision for income tax is required in the Fund’s financial statements.
NOTE 5—LOAN FACILITIES
Pursuant to an exemptive order issued by the Securities and Exchange Commission (SEC), the Fund may participate in an interfund lending facility (Facility). The Facility allows the Fund to borrow money from or loan money to the Funds. Loans under the Facility are made for temporary or emergency purposes, such as to fund shareholder redemption requests. Interest on borrowings is the average of the current repurchase agreement rate and the bank loan rate. There was no activity in the Facility during the period.
DODGE & COX GLOBAL STOCK FUND §PAGE 12
NOTES TO FINANCIAL STATEMENTS (unaudited)
The Fund also participates with the Funds in a $200 million committed credit facility (Line of Credit) with State Street Bank and Trust Company, to be utilized for temporary or emergency purposes to fund shareholder redemptions or for other short-term liquidity purposes. The Fund pays a commitment fee on its pro-rata portion of the line of credit, which amounted to $1,483 and is reflected as a Miscellaneous Expense in the Statement of Operations. Interest on borrowings is charged at the prevailing rate. There were no borrowings on the Line of Credit during the period.
NOTE 6—PURCHASES AND SALES OF INVESTMENTS
For the six months ended June 30, 2010, purchases and sales of securities, other than short-term securities, aggregated $426,386,659 and $55,410,633, respectively.
NOTE 7—SUBSEQUENT EVENTS
Fund management has determined that no material events or transactions occurred subsequent to June 30, 2010 and through the date of the Fund’s financial statements issuance, which require additional disclosure in the Fund’s financial statements.
PAGE 13 § DODGE & COX GLOBAL STOCK FUND
FINANCIAL HIGHLIGHTS
| | | | | | | | | | | |
SELECTED DATA AND RATIOS (for a share outstanding throughout the period) | | Six Months
Ended June 30, 2010(a) | | | Year Ended
December 31, 2009 | | |
May 1, 2008 (inception)
through December 31, 2008 | |
Net asset value, beginning of period | | $ | 7.91 | | | $ | 5.34 | | | $10.00 | |
Income from investment operations: | | | | | | | | | | | |
Net investment income | | | 0.06 | | | | 0.06 | | | 0.04 | |
Net realized and unrealized gain/(loss) | | | (0.82 | ) | | | 2.57 | | | (4.66 | ) |
| | | | | | | | | | | |
Total from investment operations | | | (0.76 | ) | | | 2.63 | | | (4.62 | ) |
| | | | | | | | | | | |
Distributions to shareholders from: | | | | | | | | | | | |
Net investment income | | | — | | | | (0.06 | ) | | (0.04 | ) |
Net realized gain | | | — | | | | — | | | — | |
| | | | | | | | | | | |
Total distributions | | | — | | | | (0.06 | ) | | (0.04 | ) |
| | | | | | | | | | | |
Net asset value, end of period | | $ | 7.15 | | | $ | 7.91 | | | $ 5.34 | |
| | | | | | | | | | | |
Total return | | | (9.61 | )% | | | 49.18 | % | | (46.21 | )% |
Ratios/supplemental data: | | | | | | | | | | | |
Net assets, end of period (millions) | | $ | 1,165 | | | | $914 | | | $468 | |
Ratio of expenses to average net assets | | | 0.71 | %(b) | | | 0.74 | % | | 0.87 | %(b) |
Ratio of net investment income to average net assets | | | 1.83 | %(b) | | | 1.09 | % | | 1.39 | %(b) |
Portfolio turnover rate | | | 6 | % | | | 20 | % | | 10 | % |
See accompanying Notes to Financial Statements
FUND HOLDINGS
The Fund provides a complete list of its holdings four times each fiscal year, as of the end of each quarter. The lists appear in the Fund’s First Quarter, Semi-Annual, Third Quarter and Annual Reports to shareholders. The Fund files the lists with the Securities and Exchange Commission (SEC) on Form N-CSR (second and fourth quarters) and Form N-Q (first and third quarters). Shareholders may view the Fund’s Forms N-CSR and N-Q on the SEC’s website at www.sec.gov. Forms N-CSR and N-Q may also be reviewed and copied at the SEC’s Public Reference Room in Washington, DC. Information regarding the operations of the Public Reference Room may be obtained by 1-202-942-8090 (direct) or 1-800-732-0330 (general SEC number). A complete list of the Fund’s quarter-end holdings is also available at www.dodgeandcox.com on or about 15 days following each quarter end and remains available on the web site until the list is updated in the subsequent quarter.
PROXY VOTING
For a free copy of the Fund’s proxy voting policies and procedures, please call 1-800-621-3979, visit the Fund’s web site at www.dodgeandcox.com or visit the SEC’s web site at www.sec.gov. Information regarding how the Fund voted proxies relating to portfolio securities during the most recent 12-month period ending June 30 is also available at www.dodgeandcox.com or at www.sec.gov.
HOUSEHOLD MAILINGS
The Fund routinely mails shareholder reports and summary prospectuses to shareholders and, on occasion, proxy statements. In order to reduce the volume of mail, when possible, only one copy of these documents will be sent to shareholders who are part of the same family and share the same residential address.
If you have a direct account with the Funds and you do not want the mailing of shareholder reports and summary prospectuses combined with other members in your household, contact the Funds at 1-800-621-3979. Your request will be implemented within 30 days.
DODGE & COX GLOBAL STOCK FUND §PAGE 14
DODGE & COX FUNDS—EXECUTIVE OFFICER & TRUSTEE INFORMATION
| | | | | | |
Name (Age) and
Address* | | Position with Trust
(Year of Election or
Appointment) | | Principal Occupation During Past 5 Years | | Other Directorships Held by Trustees |
| INTERESTED TRUSTEES & OFFICERS |
John A. Gunn (66) | | Chairman and Trustee
(Trustee since 1985) | | Chairman (since 2007), Chief Executive Officer (2005-2010), and Director of Dodge & Cox, Portfolio Manager and member of Investment Policy Committee (IPC), Global Investment Policy Committee (GIPC) (since 2008), and International Investment Policy Committee (IIPC) | | — |
| Kenneth E. Olivier (58) | | President and Trustee
(Trustee since 2005) | | Chief Executive Officer (since 2010), President (since 2005), and Director of Dodge & Cox, Portfolio Manager, and member of IPC | | — |
| Dana M. Emery (48) | | Senior Vice President and Trustee (Trustee since 1993) | | Executive Vice President (since 2005) and Director of Dodge & Cox, Director of Fixed Income, Portfolio Manager, and member of Fixed Income Investment Policy Committee (FIIPC) | | — |
Charles F. Pohl (52) | | Senior Vice President (Officer since 2004) | | Senior Vice President and Director of Dodge & Cox, Chief Investment Officer (since 2007), Director of Credit Research, Portfolio Manager, Investment Analyst, and member of IPC, GIPC (since 2008), IIPC (since 2007), and FIIPC | | — |
| Diana S. Strandberg (50) | | Senior Vice President
(Officer since 2005) | | Vice President of Dodge & Cox, Director of International Equity (since 2009), Portfolio Manager, and member of IPC, GIPC (since 2008), and IIPC | | — |
| David H. Longhurst (53) | | Treasurer (Officer since 2006) | | Vice President (since 2008) and Assistant Treasurer of Dodge & Cox (since 2007); Fund Administrative and Accounting Senior Manager (2004-2007) | | — |
| Thomas M. Mistele (56) | | Secretary
(Officer since 2000) | | Chief Operating Officer, Director (since 2005), Secretary, and General Counsel of Dodge & Cox | | — |
| Katherine M. Primas (35) | | Chief Compliance Officer
(Officer since 2010) | | Chief Compliance Officer of Dodge & Cox (since 2008) and Associate Chief Compliance Officer of Dodge & Cox (2004-2008) | | — |
| INDEPENDENT TRUSTEES |
| William F. Ausfahl (70) | | Trustee (Since 2002) | | CFO, The Clorox Co. (1982-1997); Director, The Clorox Co. (1984-1997) | | — |
| L. Dale Crandall (68) | | Trustee (Since 1999) | | President, Kaiser Foundation Health Plan, Inc. and Kaiser Foundation Hospitals (2000-2002); Senior Vice President—Finance and Administration & CFO, Kaiser Foundation Health Plan, Inc. and Kaiser Foundation Hospitals (1998-2000) | | Director, Ansell Limited (medical equipment and supplies) (2002-present); Director, Coventry Health Care, Inc. (managed health care) (2004-present); Director, Metavante Technologies, Inc. (software) (2007 to 2009); Bridgeport Education, Inc. (education services) (2008 to present) |
| Thomas A. Larsen (60) | | Trustee (Since 2002) | | Director in Howard, Rice, Nemerovski, Canady, Falk & Rabkin (law firm) | | — |
John B. Taylor (63) | | Trustee (Since 2005) | | Professor of Economics, Stanford University; Senior Fellow, Hoover Institution; Under Secretary for International Affairs, United States Treasury (2001-2005) | | — |
Will C. Wood (70) | | Trustee (Since 1992) | | Principal, Kentwood Associates, Financial Advisers | | Director, Banco Latinoamericano de Exportaciones S.A. (Latin American foreign trade bank) (1999-Present) |
| * | | The address for each Officer and Trustee is 555 California Street, 40th Floor, San Francisco, California 94104. Each Officer and Trustee oversees all five series in the Dodge & Cox Funds complex and serves for an indefinite term. |
Additional information about the Trust’s Trustees and Officers is available in the Trust’s Statement of Additional Information (SAI). You can get a free copy of the SAI by visiting the Funds’ website at www.dodgeandcox.com or calling 1-800-621-3979.
PAGE 15 § DODGE & COX GLOBAL STOCK FUND
| | | | |
| | | | |
www.dodgeandcox.com
For Fund literature, transactions, and account information, please visit the Funds’ web site.
or write or call:
DODGE & COX FUNDS
c/o Boston Financial Data Services
P.O. Box 8422
Boston, Massachusetts 02266-8422
(800) 621-3979
INVESTMENT MANAGER
Dodge & Cox
555 California Street, 40th Floor
San Francisco, California 94104
(415) 981-1710
This report is submitted for the general information of the shareholders of the Fund. The report is not authorized for distribution to prospective investors in the Fund unless it is accompanied by a current prospectus.
This report reflects our views, opinions, and portfolio holdings as of June 30, 2010, the end of the reporting period. Any such views are subject to change at any time based upon market or other conditions and Dodge & Cox disclaims any responsibility to update such views. These views may not be relied on as investment advice and, because investment decisions for a Dodge & Cox Fund are based on numerous factors, may not be relied on as an indication of trading intent on behalf of any Dodge & Cox Fund.
06/10 ISF SAR Printed on recycled paper
Semi-Annual Report
June 30, 2010
International Stock Fund
ESTABLISHED 2001
TICKER: DODFX
TO OUR SHAREHOLDERS
The Dodge & Cox International Stock Fund had a total return of –14.0% for the second quarter of 2010, compared to –14.0% for the MSCI EAFE (Europe, Australasia, Far East) Index. For the six months ended June 30, 2010, the Fund had a total return of –10.9%, compared to –13.2% for the MSCI EAFE. Please see the Fund’s longer-term performance results on page three. At quarter end, the Fund had net assets of $33.1 billion with a cash position of 1.5%.
MARKET COMMENTARY
Investor concern has focused on the sustainability of current fiscal policies and whether the inevitable reduction in fiscal stimulus will impede economic recovery. Europe, in particular, has come into the spotlight because of its muted prospects for economic growth and the substantial debt burdens of a few of its member countries. Accounting for more than 20% of global GDP, it is the world’s largest economy and an economic slowdown would affect companies around the world. These concerns significantly hurt the European stock market during the first six months of 2010, as the MSCI Europe Index was down 17% in U.S. dollar terms (down 7% in local currency terms). The U.S. dollar’s appreciation against developed and emerging market currencies had a roughly six percentage point negative effect on the Fund’s performance and the overall market.
INVESTMENT STRATEGY
The difficulties faced by Greece, Italy, Spain, Portugal, and Ireland have led to concerns about all of Europe. These concerns have driven European equity markets to ten times forward earnings, a level of valuation near 20-year lows. As a result, some excellent companies have become attractive investment opportunities. Accordingly, we have substantially increased the Fund’s holdings in European companies. Three examples are discussed below.1 By country of incorporation, 63% of the Fund is invested in companies in Europe and the United Kingdom (4% of the Fund is invested in Italy, Spain, and Ireland). By geographic mix of revenue, the Fund’s exposure to the European economy is smaller: between 35 and 40% of the Fund is invested in companies throughout the world that derive significant revenues from continental Europe. For
comparison, about the same percentage of the Fund is invested in companies that derive significant revenues from the emerging markets. The Fund’s geographic positioning is entirely a result of our bottom-up approach that evaluates each company’s long-term fundamental outlook in relation to its valuation.
The largest area of incremental investment for the Fund over the past six months has been in the five European pharmaceutical holdings, comprising 13.5% of the Fund. Sanofi-Aventis, a French multinational firm, is a good example of what we find attractive in this group. As the world’s second largest pharmaceutical company and the largest in the emerging markets, we believe that Sanofi’s prospects have little to do with the debt travails in Europe. At seven times forward earnings, the valuation is low, as investors have focused on the impending decline in earnings due to branded pharmaceuticals losing patent protection. Looking beyond these near-term challenges, however, more than half of Sanofi’s business is in areas we expect to grow over the next three to five years, including vaccines, emerging markets, and animal health. While no one can predict how successful current research and development efforts will be, we believe that promising drugs could come out of Sanofi’s more than €4 billion per year R&D effort. In the meantime, the balance sheet is healthy, cash flow is prodigious, management is cutting costs, and the 5% dividend yield is attractive.
During the first half of the year, the largest incremental investment into a single company was Vodafone, also domiciled in Europe and one of the largest positions in the Fund. Vodafone is a global communications company that typically has leading positions in its markets worldwide. Approximately half of its revenues come from developed Europe, and the balance from its operations in the United Kingdom, Africa, Asia, the Middle East, and Eastern Europe. The company also has a 45% ownership stake in Verizon Wireless, the leading U.S. wireless provider. While our expectations for European growth are muted in light of current economic concerns, we think the valuation—at less than nine times forward earnings and a dividend yield of 6%—captures neither the value of its stake in Verizon Wireless nor Vodafone’s growth opportunities in emerging
PAGE 1 § DODGE & COX INTERNATIONAL STOCK FUND
markets. We expect annual free cash flow generation to be about £6 billion growing to over £9 billion when Verizon Wireless starts paying dividends to its two owners. We believe that the risk-reward trade-off is attractive over the next three to five years.
European Financials have come under particular scrutiny in this market swoon because they sit at the nexus of indebtedness, liquidity support, and financial bailouts. For the first six months of 2010, MSCI EAFE European/U.K. Financials were down 22% compared to down 18% for the broader MSCI EAFE Financials sector. We have added selectively to the Fund’s holdings in this sector. A recent addition to the Fund is Barclays PLC of the United Kingdom, a leading global investment bank with strong commercial banking franchises in the United Kingdom, Iberia, South Africa, and sub-Saharan Africa. Despite navigating the credit crisis admirably and abjuring a direct bailout from the government in 2008, Barclays’ shares have come under increased pressure and now trade at 80% of tangible book value2 —a low level relative to its historical valuation and its European and global peers. This discount likely arises from Barclays’ dependence on capital markets for the majority of its current earnings and its exposure (estimated at <10% of assets) to Spain, Portugal, and Italy. The current valuation does not appear to give sufficient credit for the company’s diversified franchise, sufficient capital, attentive management, and favorable liquidity profile.
IN CLOSING
After markets decline, it is understandable if equity investors become disheartened and fearful. There is a valuation premium on perceived safety—for example, five-year U.S. Treasury bonds yield a meager 1.8%. We remain optimistic about long-term global growth. We believe that in this time of stress, countries and their citizens are more likely to undertake substantial and painful reforms—as the United Kingdom did in the 1980s—that lead to long-term prosperity. In addition, advances in technology and communications are enabling people around the world to enjoy higher standards of living. These factors, combined with attractive current valuations, lead us to believe that the long-term prospects for equity investing are favorable.
Thank you for your continued confidence in our firm. As always, we welcome your comments and questions.
For the Board of Trustees,
| | |
| | |
John A. Gunn, Chairman | | Diana S. Strandberg, Senior Vice President |
July 23, 2010
| 1 | | We use these examples to illustrate our investment process, not to imply that we think they are more attractive than the Fund’s other holdings. |
| 2 | | Tangible book value is a company’s shareholder’s equity less goodwill and most intangible assets. |
DODGE & COX INTERNATIONAL STOCK FUND §PAGE 2
SEMI-ANNUAL PERFORMANCE REVIEW
The Fund outperformed the MSCI EAFE by 2.3 percentage points for the six months ended June 30, 2010.
Key Contributors to Relative Results
| | § | | The Fund’s holdings in the Financials sector (down 7% compared to down 18% for the MSCI EAFE sector) positively impacted performance. The Fund’s Emerging Market Financials were particularly strong (up 7%), notably Yapi Kredi (up 25%), Kasikornbank (up 15%), and Sabanci Holding (up 7%). The Fund’s underweight position in European Financials (7% on average compared to 11% on average for MSCI EAFE) helped results because European Financials were an especially weak area of the market (down 26%). | |
| | § | | The Fund’s holdings in the Energy sector (down 15% compared to down 25% for the MSCI EAFE sector) helped results. Ultrapar (up 2%) and Lukoil (down 9%) were strong contributors. | |
| | § | | The Fund’s holdings in the emerging markets (down 8%) performed relatively well. | |
| | § | | Selected key contributors included Lanxess (up 14%), BMW (up 8%), Mitsubishi Electric (up 8%), and Philips Electronics (up 5%). | |
Key Detractors from Relative Results
| | § | | The Fund’s overweight position and holdings in the Health Care sector (down 17% compared to down 11% for the MSCI EAFE sector) hurt results, especially Bayer (down 28%), Sanofi-Aventis (down 20%), and GlaxoSmithKline (down 17%). | |
| | § | | Selected holdings in the Materials sector (down 21% compared to down 16% for MSCI EAFE Materials sector) hindered performance. Norsk Hydro (down 41%) and Lafarge (down 33%) were particularly weak. | |
| | § | | The Fund’s underweight position in Japan (14% on average compared to 23% on average for the MSCI EAFE), which was the strongest region of the market, detracted from results. | |
| | § | | Selected detractors included Nokia (down 34%), Telefonica (down 31%), and Unicredit (down 29%). | |
GROWTH OF $10,000 SINCE INCEPTION
FOR AN INVESTMENT MADE ON MAY 1, 2001
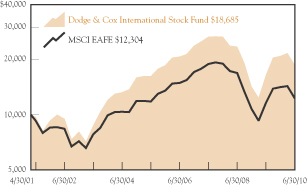
AVERAGE ANNUAL TOTAL RETURN
FOR PERIODS ENDED JUNE 30, 2010
| | | | | | | | | | | | |
| | | 1 Year | | | 3 Years | | | 5 Years | | | Since
Inception
(5/1/01) | |
Dodge & Cox International
Stock Fund | | 13.24 | % | | (11.24 | )% | | 2.83 | % | | 7.06 | % |
MSCI EAFE | | 5.90 | | | (13.39 | ) | | 0.87 | | | 2.29 | |
Returns represent past performance do not guarantee future results. Investment return and share price will fluctuate with market conditions, and investors may have a gain or loss when shares are sold. Mutual fund performance changes over time and currently may be significantly lower than stated. Performance is updated and published monthly. Visit the Fund’s web site at www.dodgeandcox.com or call 800-621-3979 for current performance figures.
The Fund’s total returns include the reinvestment of dividend and capital gain distributions, but have not been adjusted for any income taxes payable by shareholders on these distributions or on Fund share redemptions. The MSCI EAFE Index is an unmanaged index of the developed world’s stock markets, excluding the United States and Canada. Index returns include dividends and/or interest income but, unlike Fund returns, do not reflect fees or expenses.
MSCI EAFE is a service mark of MSCI Barra.
Risks: The Fund is subject to stock market risk, meaning stocks in the Fund may decline in value for extended periods due to the financial prospects of individual companies, or due to general market and economic conditions. Investing in non-U.S. securities may entail risk due to foreign economic and political developments; this risk may be increased when investing in emerging markets. Please read the prospectus for specific details regarding the Fund’s risk profile.
PAGE 3 § DODGE & COX INTERNATIONAL STOCK FUND
FUND EXPENSE EXAMPLE
As a Fund shareholder, you incur ongoing Fund costs, including management fees and other Fund expenses. All mutual funds have ongoing costs, sometimes referred to as operating expenses. The following example shows ongoing costs of investing in the Fund and can help you understand these costs and compare them with those of other mutual funds. The example assumes a $1,000 investment held for the six months indicated.
ACTUAL EXPENSES
The first line of the table below provides information about actual account values and expenses based on the Fund’s actual returns. You may use the information in this line, together with your account balance, to estimate the expenses that you paid over the period. Simply divide your account value by $1,000 (for example, an $8,600 account value divided by $1,000 = 8.6), then multiply the result by the number in the first line under the heading “Expenses Paid During Period” to estimate the expenses you paid on your account during this period.
HYPOTHETICAL EXAMPLE FOR COMPARISON WITH OTHER MUTUAL FUNDS
Information on the second line of the table can help you compare ongoing costs of investing in the Fund with those of other mutual funds. This information may not be used to estimate the actual ending account balance or expenses you paid during the period. The hypothetical “Ending Account Value” is based on the actual expense ratio of the Fund and an assumed 5% annual rate of return before expenses (not the Fund’s actual return). The amount under the heading “Expense Paid During the Period” shows the hypothetical expenses your account would have incurred under this scenario. You can compare this figure with the 5% hypothetical examples that appear in shareholder reports of other mutual funds.
| | | | | | | | | |
Six Months Ended June 30, 2010 | | Beginning Account Value
1/1/2010 | | Ending Account Value
6/30/2010 | | Expenses Paid During Period* |
Based on Actual Fund Return | | $ | 1,000.00 | | $ | 891.40 | | $ | 3.08 |
Based on Hypothetical 5% Yearly Return | | | 1,000.00 | | | 1,021.53 | | | 3.30 |
| * | | Expenses are equal to the Fund’s annualized expense ratio of 0.65%, multiplied by the average account value over the period, multiplied by 181/365 (to reflect the one-half year period). |
The expenses shown in the table highlight ongoing costs only and do not reflect any transactional fees or account maintenance fees. While other mutual funds may charge such fees, please note that the Fund does not charge transaction fees (e.g., redemption fees, sales loads) or universal account maintenance fees (e.g., small account fees).
DODGE & COX INTERNATIONAL STOCK FUND §PAGE 4
| | |
| FUND INFORMATION | | June 30, 2010 |
| | |
| GENERAL INFORMATION | | |
Net Asset Value Per Share | | $28.39 |
Total Net Assets (billions) | | $33.1 |
Expense Ratio | | 0.65% |
Portfolio Turnover Rate (1/1/10 to 6/30/10, unannualized) | | 8% |
30-Day SEC Yield(a) | | 1.80% |
Fund Inception | | 2001 |
No sales charges or distribution fees | | |
Investment Manager: Dodge & Cox, San Francisco. Managed by the International Investment Policy Committee, whose nine members’ average tenure at Dodge & Cox is 20 years.
| | | | |
| PORTFOLIO CHARACTERISTICS | | Fund | | MSCI
EAFE |
Number of Stocks | | 92 | | 964 |
Median Market Capitalization (billions) | | $15 | | $6 |
Weighted Average Market
Capitalization (billions) | | $44 | | $41 |
Price-to-Earnings Ratio(b) | | 10.5x | | 11.2x |
Countries Represented | | 27 | | 22 |
Emerging Markets (Brazil, Czech Republic, India, Indonesia, Mexico, Russia, South Africa,
South Korea, Thailand, Turkey) | | 22.1% | | 0.0% |
| | | |
| TEN LARGEST HOLDINGS(c) | | Fund | |
Naspers, Ltd. (South Africa) | | 3.3 | % |
Vodafone Group PLC (United Kingdom) | | 3.3 | |
Novartis AG (Switzerland) | | 3.2 | |
GlaxoSmithKline PLC (United Kingdom) | | 2.9 | |
Bayer AG (Germany) | | 2.6 | |
HSBC Holdings PLC (United Kingdom) | | 2.5 | |
Schneider Electric SA (France) | | 2.4 | |
Sanofi-Aventis (France) | | 2.4 | |
Roche Holding AG (Switzerland) | | 2.4 | |
Standard Chartered PLC (United Kingdom) | | 2.2 | |
ASSET ALLOCATION
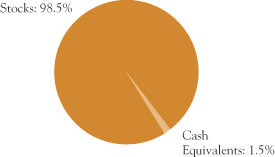
| | | | | | |
| REGION DIVERSIFICATION | | Fund | | | MSCI
EAFE | |
Europe (excluding United Kingdom) | | 46.9 | % | | 42.3 | % |
United Kingdom | | 15.6 | | | 21.0 | |
Japan | | 13.2 | | | 23.3 | |
Pacific (excluding Japan) | | 7.2 | | | 12.5 | |
Africa/Middle East | | 6.4 | | | 0.9 | |
Latin America | | 5.7 | | | 0.0 | |
United States | | 3.5 | | | 0.0 | |
| | | | | | |
| SECTOR DIVERSIFICATION | | Fund | | | MSCI
EAFE | |
Financials | | 22.7 | % | | 24.4 | % |
Consumer Discretionary | | 14.9 | | | 10.3 | |
Health Care | | 14.6 | | | 9.0 | |
Information Technology | | 11.5 | | | 5.1 | |
Industrials | | 9.2 | | | 12.3 | |
Materials | | 8.1 | | | 10.1 | |
Telecommunication Services | | 7.9 | | | 5.6 | |
Energy | | 7.0 | | | 7.1 | |
Consumer Staples | | 2.2 | | | 10.6 | |
Utilities | | 0.4 | | | 5.5 | |
| (a) | SEC yield is an annualization of the Fund’s total net investment income per share for the 30-day period ended on the last day of the month. |
| (b) | Price-to-earnings (P/E) ratios are calculated using 12-month forward earnings estimates. |
| (c) | The Fund’s portfolio holdings are subject to change without notice. The mention of specific securities is not a recommendation or solicitation for any person to buy, sell, or hold any particular security. |
PAGE 5 § DODGE & COX INTERNATIONAL STOCK FUND
| | |
| PORTFOLIO OF INVESTMENTS (unaudited) | | June 30, 2010 |
| | | | | |
| COMMON STOCKS: 96.1% | | | | |
| | |
| | | SHARES | | VALUE |
| CONSUMER DISCRETIONARY: 14.2% |
AUTOMOBILES & COMPONENTS: 3.5% |
Bayerische Motoren Werke AG (Germany) | | 9,181,400 | | $ | 444,087,949 |
Honda Motor Co., Ltd. ADR (Japan) | | 6,428,400 | | | 184,816,500 |
NGK Spark Plug Co., Ltd.(b) (Japan) | | 13,696,000 | | | 169,747,326 |
Yamaha Motor Co., Ltd.(a),(b) (Japan) | | 27,230,000 | | | 359,411,567 |
| | | | | |
| | | | | 1,158,063,342 |
CONSUMER DURABLES & APPAREL: 3.5% |
Consorcio Ara SAB de CV(b) (Mexico) | | 65,865,600 | | | 39,265,585 |
Corporacion Geo SAB de CV, Series B(a),(b) (Mexico) | | 47,305,400 | | | 126,227,715 |
LG Electronics, Inc. (South Korea) | | 4,397,487 | | | 335,808,829 |
Panasonic Corp. (Japan) | | 29,543,072 | | | 368,899,399 |
Sony Corp. (Japan) | | 11,487,600 | | | 305,778,959 |
| | | | | |
| | | | | 1,175,980,487 |
CONSUMER SERVICES: 0.8% |
Accor SA (France) | | 5,448,568 | | | 250,219,143 |
MEDIA: 6.4% |
Grupo Televisa SA ADR(b) (Mexico) | | 26,480,592 | | | 461,027,107 |
Liberty Global, Inc., Series A(a) (United States) | | 3,641,805 | | | 94,650,512 |
Liberty Global, Inc., Series C(a) (United States) | | 3,534,971 | | | 91,873,896 |
Naspers, Ltd.(b) (South Africa) | | 32,330,895 | | | 1,086,638,003 |
News Corp., Class A (United States) | | 22,063,092 | | | 263,874,580 |
Television Broadcasts, Ltd.(b) (Hong Kong) | | 27,299,300 | | | 126,690,772 |
| | | | | |
| | | | | 2,124,754,870 |
RETAILING: 0.0%(d) |
Li & Fung, Ltd. (Hong Kong) | | 2,128,000 | | | 9,553,147 |
| | | | | |
| | | | | 4,718,570,989 |
| CONSUMER STAPLES: 2.2% |
FOOD, BEVERAGE & TOBACCO: 2.1% |
Anadolu Efes Biracilik ve Malt Sanayii AS(b) (Turkey) | | 28,306,443 | | | 330,502,299 |
Diageo PLC ADR (United Kingdom) | | 3,550,000 | | | 222,727,000 |
Tiger Brands, Ltd. (South Africa) | | 5,580,977 | | | 123,097,084 |
| | | | | |
| | | | | 676,326,383 |
HOUSEHOLD & PERSONAL PRODUCTS: 0.1% |
Aderans Holdings Co., Ltd.(a),(b) (Japan) | | 3,535,900 | | | 42,554,152 |
| | | | | |
| | | | | 718,880,535 |
| ENERGY: 5.4% |
OAO Lukoil ADR (Russia) | | 9,059,288 | | | 465,964,261 |
Royal Dutch Shell PLC ADR (United Kingdom) | | 6,718,400 | | | 337,398,048 |
Schlumberger, Ltd. (United States) | | 12,949,596 | | | 716,630,643 |
Total SA (France) | | 5,982,000 | | | 266,225,817 |
| | | | | |
| | | | | 1,786,218,769 |
| | | | | |
| | |
| | | SHARES | | VALUE |
| FINANCIALS: 22.7% |
BANKS: 15.0% |
Bangkok Bank PCL Foreign (Thailand) | | 40,334,300 | | $ | 157,471,642 |
Bangkok Bank PCL NVDR (Thailand) | | 8,490,000 | | | 32,501,936 |
Bank of Yokohama, Ltd. (Japan) | | 23,965,000 | | | 109,423,012 |
Barclays PLC (United Kingdom) | | 97,396,985 | | | 386,132,547 |
Erste Group Bank AG (Austria) | | 4,000,000 | | | 127,253,318 |
Grupo Financiero Banorte SAB de CV (Mexico) | | 36,528,000 | | | 138,395,197 |
HSBC Holdings PLC (United Kingdom) | | 90,765,764 | | | 828,059,214 |
ICICI Bank, Ltd. (India) | | 10,375,668 | | | 189,909,216 |
ICICI Bank, Ltd. ADR (India) | | 1,450,000 | | | 52,403,000 |
Kasikornbank PCL Foreign (Thailand) | | 111,162,627 | | | 322,852,408 |
Kasikornbank PCL NVDR (Thailand) | | 3,500,000 | | | 9,725,150 |
Mitsubishi UFJ Financial Group (Japan) | | 46,899,900 | | | 212,604,750 |
Standard Bank Group, Ltd. (South Africa) | | 44,516,932 | | | 588,871,200 |
Standard Chartered PLC (United Kingdom) | | 30,689,336 | | | 745,012,004 |
Unicredit SPA (Italy) | | 295,864,430 | | | 656,730,886 |
Yapi ve Kredi Bankasi AS(a) (Turkey) | | 150,779,068 | | | 406,752,188 |
| | | | | |
| | | | | 4,964,097,668 |
DIVERSIFIED FINANCIALS: 3.0% |
Credit Suisse Group AG (Switzerland) | | 13,563,000 | | | 509,748,515 |
Deutsche Boerse AG (Germany) | | 2,000,000 | | | 121,513,639 |
Haci Omer Sabanci Holding AS (Turkey) | | 88,189,354 | | | 352,854,776 |
| | | | | |
| | | | | 984,116,930 |
INSURANCE: 3.0% |
AEGON NV(a) (Netherlands) | | 66,517,075 | | | 356,334,897 |
Swiss Life Holding AG (Switzerland) | | 1,520,000 | | | 145,482,145 |
Swiss Reinsurance Co., Ltd. (Switzerland) | | 12,091,868 | | | 497,413,330 |
| | | | | |
| | | | | 999,230,372 |
REAL ESTATE: 1.7% |
Hang Lung Group, Ltd. (Hong Kong) | | 52,357,500 | | | 278,743,977 |
Hang Lung Properties, Ltd. (Hong Kong) | | 72,179,000 | | | 278,215,058 |
| | | | | |
| | | | | 556,959,035 |
| | | | | |
| | | | | 7,504,404,005 |
| HEALTH CARE: 14.6% |
HEALTH CARE EQUIPMENT & SERVICES: 1.0% |
Covidien PLC (Ireland) | | 5,283,672 | | | 212,297,941 |
Medipal Holdings Corp.(b) (Japan) | | 10,674,000 | | | 126,967,742 |
| | | | | |
| | | | | 339,265,683 |
| | |
| See accompanying Notes to Financial Statements | | DODGE & COX INTERNATIONAL STOCK FUND §PAGE 6 |
| | |
| PORTFOLIO OF INVESTMENTS (unaudited) | | June 30, 2010 |
| | | | | |
| COMMON STOCKS (continued) | | | | |
| | |
| | | SHARES | | VALUE |
PHARMACEUTICALS, BIOTECHNOLOGY & LIFE SCIENCES: 13.6% |
Adcock Ingram Holdings, Ltd. (South Africa) | | 7,047,217 | | $ | 53,043,564 |
Bayer AG (Germany) | | 15,205,350 | | | 848,383,381 |
GlaxoSmithKline PLC ADR (United Kingdom) | | 28,573,749 | | | 971,793,204 |
Novartis AG ADR (Switzerland) | | 22,220,000 | | | 1,073,670,400 |
Roche Holding AG (Switzerland) | | 5,665,700 | | | 778,034,377 |
Sanofi-Aventis (France) | | 12,994,409 | | | 783,600,306 |
| | | | | |
| | | | | 4,508,525,232 |
| | | | | |
| | | | | 4,847,790,915 |
| INDUSTRIALS: 9.2% |
CAPITAL GOODS: 7.9% |
Koninklijke Philips Electronics NV (Netherlands) | | 19,876,580 | | | 592,468,441 |
Mitsubishi Electric Corp. (Japan) | | 92,667,600 | | | 721,779,620 |
Nexans SA (France) | | 872,619 | | | 50,453,426 |
Schneider Electric SA (France) | | 7,821,165 | | | 791,617,888 |
Tyco International, Ltd. (Switzerland) | | 9,139,020 | | | 321,967,675 |
Wienerberger AG(a),(b) (Austria) | | 12,335,026 | | | 150,412,917 |
| | | | | |
| | | | | 2,628,699,967 |
COMMERCIAL & PROFESSIONAL SERVICES: 0.6% |
Brambles, Ltd. (Australia) | | 12,095,677 | | | 55,144,735 |
Experian PLC (United Kingdom) | | 15,288,626 | | | 132,375,326 |
| | | | | |
| | | | | 187,520,061 |
TRANSPORTATION: 0.7% |
TNT NV (Netherlands) | | 9,565,875 | | | 241,100,718 |
| | | | | |
| | | | | 3,057,320,746 |
| INFORMATION TECHNOLOGY: 11.5% |
SEMICONDUCTORS & SEMICONDUCTOR EQUIPMENT: 1.7% |
Infineon Technologies AG(a),(b) (Germany) | | 99,336,576 | | | 574,075,961 |
SOFTWARE & SERVICES: 0.8% |
Nintendo Co., Ltd. (Japan) | | 847,500 | | | 246,873,633 |
TECHNOLOGY, HARDWARE & EQUIPMENT: 9.0% |
Alcatel-Lucent(a) (France) | | 69,619,072 | | | 177,566,254 |
Brother Industries, Ltd.(b) (Japan) | | 23,001,000 | | | 239,475,394 |
Fujifilm Holdings Corp. (Japan) | | 8,636,100 | | | 248,426,379 |
Fujitsu, Ltd. (Japan) | | 85,508,000 | | | 537,195,504 |
Kyocera Corp. (Japan) | | 6,283,900 | | | 507,448,272 |
Nokia Oyj (Finland) | | 74,377,000 | | | 607,308,967 |
Telefonaktiebolaget LM Ericsson (Sweden) | | 45,443,000 | | | 505,953,061 |
Tyco Electronics, Ltd. (Switzerland) | | 6,657,617 | | | 168,970,319 |
| | | | | |
| | | | | 2,992,344,150 |
| | | | | |
| | | | | 3,813,293,744 |
| | | | | |
| | |
| | | SHARES | | VALUE |
| MATERIALS: 8.0% |
Akzo Nobel NV (Netherlands) | | 4,998,485 | | $ | 258,562,080 |
Arkema(b) (France) | | 5,566,687 | | | 191,507,642 |
BHP Billiton PLC (United Kingdom) | | 18,306,000 | | | 473,701,703 |
Cemex SAB de CV ADR(a) (Mexico) | | 32,790,117 | | | 317,080,431 |
Lafarge SA(b) (France) | | 12,164,291 | | | 657,756,366 |
Lanxess AG(b) (Germany) | | 8,429,784 | | | 355,270,809 |
Linde AG (Germany) | | 1,386,205 | | | 145,555,142 |
Norsk Hydro ASA (Norway) | | 50,823,233 | | | 228,694,193 |
Norsk Hydro ASA Rights(a) (Norway) | | 10,883,455 | | | 5,531,106 |
| | | | | |
| | | | | 2,633,659,472 |
| TELECOMMUNICATION SERVICES: 7.9% |
Bharti Airtel, Ltd. (India) | | 27,043,387 | | | 151,424,897 |
Millicom International Cellular SA (Luxembourg) | | 2,787,494 | | | 225,982,139 |
MTN Group, Ltd. (South Africa) | | 19,000,000 | | | 249,080,449 |
PT Telekomunik Indonesia ADR (Indonesia) | | 10,768,047 | | | 368,590,249 |
Telefonica SA ADR (Spain) | | 8,777,400 | | | 487,409,022 |
Telekom Austria AG (Austria) | | 4,918,630 | | | 54,674,310 |
Vodafone Group PLC ADR (United Kingdom) | | 52,150,000 | | | 1,077,940,500 |
| | | | | |
| | | | | 2,615,101,566 |
| UTILITIES: 0.4% |
CEZ AS (Czech Republic) | | 3,000,000 | | | 123,198,779 |
| | | | | |
TOTAL COMMON STOCKS
(Cost $36,876,951,043) | | | | $ | 31,818,439,520 |
|
| PREFERRED STOCKS: 2.4% |
| CONSUMER DISCRETIONARY: 0.7% |
MEDIA: 0.7% |
Net Servicos de Comunicacao SA ADR(a) (Brazil) | | 24,306,900 | | | 228,241,791 |
| ENERGY: 1.6% |
Petroleo Brasileiro SA ADR (Brazil) | | 7,932,291 | | | 236,382,272 |
Ultrapar Participacoes SA ADR (Brazil) | | 5,914,832 | | | 279,712,405 |
| | | | | |
| | | | | 516,094,677 |
| MATERIALS: 0.1% |
Duratex SA (Brazil) | | 4,614,472 | | | 41,926,505 |
| | | | | |
TOTAL PREFERRED STOCKS
(Cost $424,302,799) | | | | $ | 786,262,973 |
| | |
| PAGE 7 § DODGE & COX INTERNATIONAL STOCK FUND | | See accompanying Notes to Financial Statements |
| | |
| PORTFOLIO OF INVESTMENTS (unaudited) | | June 30, 2010 |
| | | | | | | |
|
| SHORT-TERM INVESTMENTS: 1.0% |
| | |
| | | PAR VALUE | | | VALUE |
| MONEY MARKET FUND: 0.3% |
SSgA Prime Money Market Fund | | $ | 100,057,782 | | | $ | 100,057,782 |
REPURCHASE AGREEMENT: 0.7% |
Fixed Income Clearing Corporation(c) 0.00%, 7/1/10, maturity value $248,016,000 | | $ | 248,016,000 | | | $ | 248,016,000 |
| | | | | | | |
TOTAL SHORT-TERM INVESTMENTS
(Cost $348,073,782) | | | $ | 348,073,782 |
| | | | | | | |
TOTAL INVESTMENTS
(Cost $37,649,327,624) | | | 99.5 | % | | $ | 32,952,776,275 |
OTHER ASSETS LESS LIABILITIES | | | 0.5 | % | | | 162,454,820 |
| | | | | | | |
| NET ASSETS | | | 100.0 | % | | $ | 33,115,231,095 |
| | | | | | | |
| (b) | See Note 8 regarding holdings of 5% voting securities |
| (c) | Repurchase agreement is collateralized by Fannie Mae 0.00%, 4/26/11. Total collateral value is $252,976,473. |
ADR: American Depositary Receipt
NVDR: Non-Voting Depositary Receipt
| | |
| See accompanying Notes to Financial Statements | | DODGE & COX INTERNATIONAL STOCK FUND §PAGE 8 |
| | | | |
STATEMENT OF ASSETS AND LIABILITIES (unaudited) | |
| | | June 30, 2010 | |
ASSETS: | | | | |
Investments, at value | | | | |
Unaffiliated issuers (cost $32,481,252,721) | | $ | 28,503,239,768 | |
Affiliated issuers (cost $5,168,074,903) | | | 4,449,536,507 | |
| | | | |
| | | 32,952,776,275 | |
Cash denominated in foreign currency (cost $22,043,617) | | | 22,052,369 | |
Receivable for investments sold | | | 190,687,641 | |
Receivable for Fund shares sold | | | 31,629,742 | |
Dividends and interest receivable | | | 110,029,863 | |
Prepaid expenses and other assets | | | 73,023 | |
| | | | |
| | | 33,307,248,913 | |
| | | | |
LIABILITIES: | | | | |
Payable for investments purchased | | | 110,485,346 | |
Payable for Fund shares redeemed | | | 36,675,267 | |
Management fees payable | | | 17,013,573 | |
Accrued foreign capital gain tax | | | 23,886,012 | |
Accrued expenses | | | 3,957,620 | |
| | | | |
| | | 192,017,818 | |
| | | | |
NET ASSETS | | $ | 33,115,231,095 | |
| | | | |
NET ASSETS CONSIST OF: | | | | |
Paid in capital | | $ | 46,719,685,613 | |
Undistributed net investment income | | | 450,859,434 | |
Accumulated net realized loss | | | (9,334,819,428 | ) |
Net unrealized depreciation (net of accrued foreign capital gain tax of $23,886,012) | | | (4,720,494,524 | ) |
| | | | |
| | $ | 33,115,231,095 | |
| | | | |
Fund shares outstanding (par value $0.01 each, unlimited shares authorized) | | | 1,166,242,599 | |
Net asset value per share | | | $28.39 | |
|
STATEMENT OF OPERATIONS
(unaudited) | |
| | | Six Months Ended
June 30, 2010 | |
INVESTMENT INCOME: | | | | |
Dividends (net of foreign taxes of $60,409,592) | | | | |
Unaffiliated issuers | | $ | 542,751,456 | |
Affiliated issuers | | | 22,514,741 | |
Interest | | | 198,469 | |
| | | | |
| | | 565,464,666 | |
| | | | |
EXPENSES: | | | | |
Management fees | | | 109,364,343 | |
Custody and fund accounting fees | | | 3,162,299 | |
Transfer agent fees | | | 4,653,380 | |
Professional services | | | 147,083 | |
Shareholder reports | | | 1,207,236 | |
Registration fees | | | 260,137 | |
Trustees’ fees | | | 77,000 | |
Miscellaneous | | | 970,476 | |
| | | | |
| | | 119,841,954 | |
| | | | |
NET INVESTMENT INCOME | | | 445,622,712 | |
| | | | |
REALIZED AND UNREALIZED GAIN/ (LOSS): | |
Net realized loss | | | | |
Investments in unaffiliated issuers | | | (983,814,923 | ) |
Investments in affiliated issuers | | | (130,376,643 | ) |
Foreign currency transactions | | | (7,306,726 | ) |
Net change in unrealized appreciation/depreciation | | | | |
Investments (including net increase in accrued foreign capital gain tax of $8,789,317) | | | (3,419,030,924 | ) |
Foreign currency transactions | | | 133,875 | |
| | | | |
Net realized and unrealized loss | | | (4,540,395,341 | ) |
| | | | |
NET DECREASE IN NET ASSETS
FROM OPERATIONS | | $ | (4,094,772,629 | ) |
| | | | |
| | | | | | | | |
STATEMENT OF CHANGES IN NET ASSETS | |
| | |
| | | Six Months Ended
June 30, 2010
(unaudited) | | | Year Ended
December 31, 2009 | |
OPERATIONS: | |
Net investment income | | $ | 445,622,712 | | | $ | 458,181,008 | |
Net realized loss | | | (1,121,498,292 | ) | | | (6,317,011,148 | ) |
Net change in unrealized appreciation/depreciation | | | (3,418,897,049 | ) | | | 17,083,942,118 | |
| | | | | | | | |
Net increase/(decrease) in net assets from operations | | | (4,094,772,629 | ) | | | 11,225,111,978 | |
| | | | | | | | |
|
DISTRIBUTIONS TO
SHAREHOLDERS FROM: | |
Net investment income | | | — | | | | (496,706,640 | ) |
Net realized gain | | | — | | | | — | |
| | | | | | | | |
Total distributions | | | — | | | | (496,706,640 | ) |
| | | | | | | | |
|
FUND SHARE
TRANSACTIONS: | |
Proceeds from sale of shares | | | 4,641,084,648 | | | | 7,697,079,669 | |
Reinvestment of distributions | | | — | | | | 429,110,454 | |
Cost of shares redeemed | | | (4,178,685,794 | ) | | | (7,127,353,050 | ) |
| | | | | | | | |
Net increase from Fund share transactions | | | 462,398,854 | | | | 998,837,073 | |
| | | | | | | | |
Total increase/(decrease) in net assets | | | (3,632,373,775 | ) | | | 11,727,242,411 | |
|
NET ASSETS: | |
Beginning of period | | | 36,747,604,870 | | | | 25,020,362,459 | |
| | | | | | | | |
End of period (including undistributed net investment income of $450,859,434 and $5,236,722, respectively) | | $ | 33,115,231,095 | | | $ | 36,747,604,870 | |
| | | | | | | | |
|
SHARE INFORMATION: | |
Shares sold | | | 148,030,344 | | | | 293,503,845 | |
Distributions reinvested | | | — | | | | 13,722,752 | |
Shares redeemed | | | (135,731,647 | ) | | | (295,603,767 | ) |
| | | | | | | | |
Net increase in shares outstanding | | | 12,298,697 | | | | 11,622,830 | |
| | | | | | | | |
| | |
| PAGE 9 § DODGE & COX INTERNATIONAL STOCK FUND | | See accompanying Notes to Financial Statements |
NOTES TO FINANCIAL STATEMENTS (unaudited)
NOTE 1—ORGANIZATION AND SIGNIFICANT ACCOUNTING POLICIES
Dodge & Cox International Stock Fund (the “Fund”) is one of the series constituting the Dodge & Cox Funds (the “Trust” or the “Funds”). The Trust is organized as a Delaware statutory trust and is registered under the Investment Company Act of 1940, as amended, as a diversified, open-end management investment company. The Fund commenced operations on May 1, 2001, and seeks long-term growth of principal and income, and the Fund invests primarily in a diversified portfolio of foreign stocks. Foreign investing, especially in developing countries, has special risks such as currency and market volatility and political and social instability. These and other risk considerations are discussed in the Fund’s Prospectus.
The financial statements have been prepared in conformity with accounting principles generally accepted in the United States of America, which require the use of estimates and assumptions by management. Actual results may differ from those estimates. Significant accounting policies are as follows:
Security valuation The Fund’s net assets are valued as of the close of trading on the New York Stock Exchange (NYSE), generally 4:00 p.m. Eastern Time, each day that the NYSE is open for business. Listed securities are valued at market, using the official quoted close price or the last sale on the date of determination on the principal exchange on which such securities are traded or, if not available, at the mean between the exchange listed bid and ask prices. A security that is listed or traded on more than one exchange is valued at the quotation on the exchange determined to be the primary market for such security. Security values are not discounted based on the size of the Fund’s position. Short-term securities are valued at amortized cost which approximates current value.
Investments initially valued in currencies other than the U.S. dollar are converted to the U.S. dollar using prevailing exchange rates. As a result, the Fund’s net asset value (NAV) may be affected by changes in the value of currencies in relation to the U.S. dollar.
If market quotations are not readily available or if a security’s value has materially changed after the close of the security’s primary market but before the close of
trading on the NYSE, the security is valued at fair value as determined in good faith by or at the direction of the Board of Trustees. The Fund may use fair value pricing in calculating its NAV when, for example, (i) the primary market for a security is closed or if trading of a security is suspended or limited, (ii) the Fund determines that the price provided by a pricing service is inaccurate or unreliable, or (iii) the Fund determines that a significant event affecting the value of a security has occurred before the close of the NYSE but after the close of the security’s primary market. An event is considered significant if there is both an affirmative expectation that the security’s value will change in response to the event and a reasonable basis for quantifying a resulting change in value. For securities that do not trade during NYSE hours, fair value determinations are based on analyses of market movements after the close of those securities’ primary markets, and include reviews of developments in foreign markets, the performance of U.S. securities markets, and the performance of instruments trading in U.S. markets that represent foreign securities and baskets of foreign securities. Pricing services are used to obtain closing market prices and to compute certain fair value adjustment factors utilizing pricing models. These adjustment factors may be used to systematically value foreign securities at fair value. When fair value pricing is employed, the prices of securities used by the Fund to calculate its net asset value may differ from quoted or published prices for the same securities. In addition, fair values may not reflect the price that the Fund could obtain for a security if it were to dispose of that security at the time of pricing.
Security transactions, investment income, expenses, and distributions Security transactions are recorded on the trade date. Realized gains and losses on securities sold are determined on the basis of identified cost.
Dividend income and corporate action transactions are recorded on the ex-dividend date, except for certain dividends or corporate actions from foreign securities where the ex-dividend date may have passed, which are recorded as soon
as the Fund is informed of the ex-dividend date. Withholding taxes on foreign dividends have been provided for in accordance with the Fund’s understanding of the applicable country’s tax rules and rates. Non-cash
DODGE & COX INTERNATIONAL STOCK FUND §PAGE 10
NOTES TO FINANCIAL STATEMENTS (unaudited)
dividends included in dividend income, if any, are recorded at the fair market value of the securities received. Distributions received in excess of income are recorded as a reduction of cost of investments and/or realized gain. Interest income is recorded on the accrual basis.
Expenses are recorded on the accrual basis. Most expenses of the Trust can be directly attributed to a specific series. Expenses which cannot be directly attributed are allocated among the Funds in the Trust.
Distributions to shareholders are recorded on the ex-dividend date.
Repurchase agreements The Fund may enter into repurchase agreements, secured by U.S. government or agency securities, which involve the purchase of securities from a counterparty with a simultaneous commitment to resell the securities at an agreed-upon date and price. It is the Fund’s policy that its custodian take possession of the underlying collateral securities, the fair value of which exceeds the principal amount of the repurchase transaction, including accrued interest, at all times. In the event of default by the counterparty, the Fund has the contractual right to liquidate the collateral securities and to apply the proceeds in satisfaction of the obligation.
Foreign currency The Fund may enter forward foreign currency contracts to hedge portfolio positions. It may also enter spot foreign currency contracts to facilitate security transactions in foreign currency-denominated securities. Losses from these transactions may arise from unfavorable changes in currency values or if the counterparties do not perform under the contracts’ terms. The Fund did not enter into any forward foreign currency contracts during the period ended June 30, 2010.
Foreign currency-denominated assets (including investment securities) and liabilities are translated into U.S. dollars each business day at the prevailing exchange rate. Purchases and sales of securities, income receipts, and expenses denominated in foreign currencies are translated into U.S. dollars at the exchange rate in effect on the transaction date.
Net realized gains and losses on foreign currency transactions arise from sales of foreign currencies and from changes in currency values between the date recorded and the related settlement/cash payment on securities transactions, dividends, and foreign currency contracts. The effects of currency rate changes on investment securities are included with realized and unrealized gain (loss) on investments.
NOTE 2—VALUATION MEASUREMENTS
Various inputs are used in determining the value of the Fund’s investments and other financial instruments. These inputs are summarized in the three broad levels listed below.
| § | | Level 1: Quoted prices in active markets for identical securities |
| § | | Level 2: Other significant observable inputs (including quoted prices for similar securities, market indices, interest rates, credit risk, etc.) |
| § | | Level 3: Significant unobservable inputs (including the Fund’s own assumptions in determining the fair value of investments) |
The inputs or methodology used for valuing securities are not necessarily an indication of the risk associated with investing in those securities.
The following is a summary of the inputs used to value the Fund’s holdings as of June 30, 2010 :
| | | | | | |
| Security Classification(a) | | LEVEL 1
(Quoted Prices) | | LEVEL 2
(Other Significant
Observable Inputs)(b) |
Common Stocks | | | | | | |
Consumer Discretionary | | $ | 1,261,735,895 | | $ | 3,456,835,094 |
Consumer Staples | | | 222,727,000 | | | 496,153,535 |
Energy | | | 1,054,028,691 | | | 732,190,078 |
Financials | | | 190,798,197 | | | 7,313,605,808 |
Health Care | | | 2,257,761,545 | | | 2,590,029,370 |
Industrials | | | 321,967,675 | | | 2,735,353,071 |
Information Technology | | | 168,970,319 | | | 3,644,323,425 |
Materials | | | 317,080,431 | | | 2,316,579,041 |
Telecommunication Services | | | 2,159,921,910 | | | 455,179,656 |
Utilities | | | — | | | 123,198,779 |
Preferred Stocks | | | | | | |
Consumer Discretionary | | | 228,241,791 | | | — |
Energy | | | 516,094,677 | | | — |
Materials | | | — | | | 41,926,505 |
Money Market Fund | | | 100,057,782 | | | — |
Repurchase Agreement | | | — | | | 248,016,000 |
| | | | | | |
Total | | $ | 8,799,385,913 | | $ | 24,153,390,362 |
| | | | | | |
| | | | | | | |
| (a) | | At June 30, 2010 the Fund held no securities that were considered to be “Level 3” securities (those valued using significant unobservable inputs). |
| (b) | | Transfers during the period between Level 1 and Level 2 relate to the use of systematic fair valuation. On days when systematic fair valuation is used, non-US$ denominated securities move from a Level 1 to a Level 2 classification. |
PAGE 11 § DODGE & COX INTERNATIONAL STOCK FUND
NOTES TO FINANCIAL STATEMENTS (unaudited)
NOTE 3—RELATED PARTY TRANSACTIONS
Management fees Under a written agreement approved by a unanimous vote of the Board of Trustees, the Fund pays an annual management fee of 0.60% of the Fund’s average daily net assets to Dodge & Cox, investment manager of the Fund.
Fund officers and trustees All officers and three of the trustees of the Trust are officers or employees of Dodge & Cox. The Trust pays a fee only to those trustees who are not affiliated with Dodge & Cox.
Indemnification Under the Trust’s organizational documents, its officers and trustees are indemnified against certain liabilities arising out of the performance of their duties to the Trust. In addition, in the normal course of business the Trust enters into contracts that provide general indemnities to other parties. The Trust’s maximum exposure under these arrangements is unknown as this would involve future claims that may be made against the Trust that have not yet occurred.
NOTE 4—INCOME TAX INFORMATION AND DISTRIBUTIONS TO SHAREHOLDERS
A provision for federal income taxes is not required since the Fund intends to continue to qualify as a regulated investment company under Subchapter M of the Internal Revenue Code and distribute all of its taxable income to shareholders. Distributions are determined in accordance with income tax regulations, which may differ from net investment income and realized gains for financial reporting purposes. Financial reporting records are adjusted for permanent book/tax differences to reflect tax character.
Certain foreign countries impose a tax on capital gains which is accrued by the Fund based on unrealized appreciation, if any, on affected securities. The tax is paid when a gain is realized on the sale of affected securities.
Book/tax differences are primarily due to differing treatments of wash sales, net short-term realized gain (loss) on investments, and foreign currency realized gain/(loss). At June 30, 2010, the cost of investments for federal income tax purposes was $37,776,408,064.
Distributions during the six months ended June 30, 2010 and for the year ended December 31, 2009 were characterized as follows for federal income tax purpose.
| | | | |
| | | Six Months Ended
June 30, 2010 | | Year Ended
December 31, 2009 |
Ordinary income | | — | | $496,706,640 |
| | | | ($0.436 per share) |
| | |
Long-term capital gain | | — | | — |
| | | | |
At June 30, 2010, the tax basis components of distributable earnings were as follows:
| | | | |
Unrealized appreciation | | $ | 3,027,024,214 | |
Unrealized depreciation | | | (7,874,599,178 | ) |
| | | | |
Net unrealized depreciation | | | (4,847,574,964 | ) |
Undistributed ordinary income | | | 450,859,434 | |
Accumulated capital loss(a) | | | (1,390,047,196 | ) |
Capital Loss carryforward(b) | | | (7,817,691,792 | ) |
| (a) | | Represents capital loss realized for tax purposes during the period from January 1, 2010 to June 30, 2010. |
| (b) | | Represents accumulated capital loss which may be carried forward to offset future capital gains. If not utilized, the capital loss carryforward will expire in 2017. |
Fund management has reviewed the tax positions for open periods (for Federal purposes, three years from the date of filing and for State purposes, four years from the date of filing) as applicable to the Fund, and has determined that no provision for income tax is required in the Fund’s financial statements.
NOTE 5—LOAN FACILITIES
Pursuant to an exemptive order issued by the Securities and Exchange Commission (SEC), the Fund may participate in an interfund lending facility (Facility). The Facility allows the Fund to borrow money from or loan money to the Funds. Loans under the Facility are made for temporary or emergency purposes, such as to fund shareholder redemption requests. Interest on borrowings is the average of the current repurchase agreement rate and the bank loan rate. There was no activity in the Facility during the period.
The Fund also participates with the Funds in a $200 million committed credit facility (Line of Credit) with State Street Bank and Trust Company, to be utilized for temporary or emergency purposes to fund shareholder
DODGE & COX INTERNATIONAL STOCK FUND §PAGE 12
NOTES TO FINANCIAL STATEMENTS (unaudited)
redemptions or for other short-term liquidity purposes. The Fund pays a commitment fee on its pro-rata portion of the line of credit, which amounted to $47,050 and is reflected as a Miscellaneous Expense in the Statement of Operations. Interest on borrowings is charged at the prevailing rate. There were no borrowings on the Line of Credit during the period.
NOTE 6—PURCHASES AND SALES OF INVESTMENTS
For the six months ended June 30, 2010, purchases and sales of securities, other than short-term securities, aggregated $3,935,597,961 and $2,873,343,435, respectively.
NOTE 7—SUBSEQUENT EVENTS
Fund management has determined that no material events or transactions occurred subsequent to June 30, 2010 and through the date of the Fund’s financial statements issuance, which require additional disclosure in the Fund’s financial statements.
NOTE 8—HOLDINGS OF 5% VOTING SECURITIES
Each of the companies listed below was considered to be an affiliate of the Fund because the Fund owned 5% or more of the company’s voting securities during all or part of the six-month period ended June 30, 2010. Purchase and sale transactions and dividend income earned during the period on these securities were as follows:
| | | | | | | | | | | | | | | | | |
| | | Shares at
Beginning of Period | | Additions | | Reductions | | | Shares at
End of Period | | Dividend
Income(a) | | | Value at
End of Period | |
Aderans Holdings Co., Ltd. (Japan) | | 3,537,000 | | — | | (1,100 | ) | | 3,535,900 | | | — | (b) | | | 42,554,152 | |
Anadolu Efes Biracilik ve Malt Sanayii AS (Turkey) | | 25,306,443 | | 3,000,000 | | — | | | 28,306,443 | | | 4,914,062 | | | | 330,502,299 | |
Arkema (France) | | 6,608,245 | | — | | (1,041,558 | ) | | 5,566,687 | | | 3,699,397 | | | | 191,507,642 | |
Brother Industries, Ltd. (Japan) | | 23,101,000 | | — | | (100,000 | ) | | 23,001,000 | | | 2,323,341 | | | | 239,475,394 | |
Consorcio Ara SAB de CV (Mexico) | | 113,420,000 | | — | | (47,554,400 | ) | | 65,865,600 | | | 465,130 | | | | 39,265,585 | |
Corporacion Geo SAB de CV, Series B (Mexico) | | 47,605,400 | | — | | (300,000 | ) | | 47,305,400 | | | — | (b) | | | 126,227,715 | |
Grupo Televisa SA ADR (Mexico) | | 30,430,592 | | — | | (3,950,000 | ) | | 26,480,592 | | | — | | | | — | (c) |
Infineon Technologies AG (Germany) | | 103,886,576 | | — | | (4,550,000 | ) | | 99,336,576 | | | — | (b) | | | 574,075,961 | |
Lafarge SA (France) | | 12,764,291 | | — | | (600,000 | ) | | 12,164,291 | | | — | | | | 657,756,366 | |
Lanxess AG (Germany) | | 8,729,784 | | — | | (300,000 | ) | | 8,429,784 | | | 4,396,461 | | | | 355,270,809 | |
Medipal Holdings Corp. (Japan) | | 12,426,600 | | — | | (1,752,600 | ) | | 10,674,000 | | | 1,070,078 | | | | — | (c) |
Naspers, Ltd. (South Africa) | | 34,040,895 | | — | | (1,710,000 | ) | | 32,330,895 | | | — | | | | 1,086,638,003 | |
NGK Spark Plug Co., Ltd. (Japan) | | 16,250,000 | | — | | (2,554,000 | ) | | 13,696,000 | | | 898,873 | | | | 169,747,326 | |
Television Broadcasts, Ltd. (Hong Kong) | | 27,299,300 | | — | | — | | | 27,299,300 | | | 4,747,399 | | | | 126,690,772 | |
Wienerberger AG (Austria) | | 12,835,026 | | — | | (500,000 | ) | | 12,335,026 | | | — | (b) | | | 150,412,917 | |
Yamaha Motor Co., Ltd. (Japan) | | 23,980,000 | | 3,250,000 | | — | | | 27,230,000 | | | — | (b) | | | 359,411,566 | |
| | | | | | | | | | | | | | | | | |
| | | | | | | | | | | $ | 22,514,741 | | | $ | 4,449,536,507 | |
| | | | | | | | | | | | | | | | | |
| | | | | | | | | | | | | | | | | | |
| (a) | Net of foreign taxes, if any |
| (c) | Company was not an affiliate at the end of the period |
PAGE 13 § DODGE & COX INTERNATIONAL STOCK FUND
FINANCIAL HIGHLIGHTS
| | | | | | | | | | | | | | | | | | |
SELECTED DATA AND RATIOS (for a share outstanding throughout each period) | | Six Months
Ended June 30, | | | Year Ended December 31, | |
| | | 2010(a) | | | 2009 | | | 2008 | | | 2007 | | | 2006 | | | 2005 | |
| | | | | | |
Net asset value, beginning of period | | $31.85 | | | $21.90 | | | $46.02 | | | $43.66 | | | $35.03 | | | $30.64 | |
Income from investment operations: | | | | | | | | | | | | | | | | | | |
Net investment income | | 0.39 | | | 0.41 | | | 0.97 | | | 1.25 | | | 0.57 | | | 0.33 | |
Net realized and unrealized gain/(loss) | | (3.85 | ) | | 9.98 | | | (22.57 | ) | | 3.87 | | | 9.24 | | | 4.80 | |
| | | | | | |
Total from investment operations | | (3.46 | ) | | 10.39 | | | (21.60 | ) | | 5.12 | | | 9.81 | | | 5.13 | |
| | | | | | |
Distributions to shareholders from: | | | | | | | | | | | | | | | | | | |
Net investment income | | — | | | (0.44 | ) | | (0.94 | ) | | (1.26 | ) | | (0.56 | ) | | (0.35 | ) |
Net realized gain | | — | | | — | | | (1.58 | ) | | (1.50 | ) | | (0.62 | ) | | (0.39 | ) |
| | | | | | |
Total distributions | | — | | | (0.44 | ) | | (2.52 | ) | | (2.76 | ) | | (1.18 | ) | | (0.74 | ) |
| | | | | | |
Net asset value, end of period | | $28.39 | | | $31.85 | | | $21.90 | | | $46.02 | | | $43.66 | | | $35.03 | |
| | | | | | |
Total return | | (10.86 | )% | | 47.46 | % | | (46.68 | )% | | 11.71 | % | | 28.00 | % | | 16.74 | % |
Ratios/supplemental data: | | | | | | | | | | | | | | | | | | |
Net assets, end of period (millions) | | $33,115 | | | $36,748 | | | $25,020 | | | $53,479 | | | $30,899 | | | $13,357 | |
Ratio of expenses to average net assets | | 0.65 | %(b) | | 0.65 | % | | 0.64 | % | | 0.65 | % | | 0.66 | % | | 0.70 | % |
Ratio of net investment income to average net assets | | 2.45 | %(b) | | 1.58 | % | | 2.37 | % | | 3.11 | % | | 1.82 | % | | 1.54 | % |
Portfolio turnover rate | | 8 | % | | 21 | % | | 35 | % | | 16 | % | | 9 | % | | 7 | % |
See accompanying Notes to Financial Statements
FUND HOLDINGS
The Fund provides a complete list of its holdings four times each fiscal year, as of the end of each quarter. The lists appear in the Fund’s First Quarter, Semi-Annual, Third Quarter and Annual Reports to shareholders. The Fund files the lists with the Securities and Exchange Commission (SEC) on Form N-CSR (second and fourth quarters) and Form N-Q (first and third quarters). Shareholders may view the Fund’s Forms N-CSR and N-Q on the SEC’s website at www.sec.gov. Forms N-CSR and N-Q may also be reviewed and copied at the SEC’s Public Reference Room in Washington, DC. Information regarding the operations of the Public Reference Room may be obtained by 1-202-942-8090 (direct) or 1-800-732-0330 (general SEC number). A complete list of the Fund’s quarter-end holdings is also available at www.dodgeandcox.com on or about 15 days following each quarter end and remains available on the web site until the list is updated in the subsequent quarter.
PROXY VOTING
For a free copy of the Fund’s proxy voting policies and procedures, please call 1-800-621-3979, visit the Fund’s web site at www.dodgeandcox.com or visit the SEC’s web site at www.sec.gov. Information regarding how the Fund voted proxies relating to portfolio securities during the most recent 12-month period ending June 30 is also available at www.dodgeandcox.com or at www.sec.gov.
HOUSEHOLD MAILINGS
The Fund routinely mails shareholder reports and summary prospectuses to shareholders and, on occasion, proxy statements. In order to reduce the volume of mail, when possible, only one copy of these documents will be sent to shareholders who are part of the same family and share the same residential address.
If you have a direct account with the Funds and you do not want the mailing of shareholder reports and summary prospectuses combined with other members in your household, contact the Funds at 1-800-621-3979. Your request will be implemented within 30 days.
DODGE & COX INTERNATIONAL STOCK FUND §PAGE 14
DODGE & COX FUNDS—EXECUTIVE OFFICER & TRUSTEE INFORMATION
| | | | | | |
Name (Age) and
Address* | | Position with Trust
(Year of Election or
Appointment) | | Principal Occupation During Past 5 Years | | Other Directorships Held by Trustees |
| INTERESTED TRUSTEES & OFFICERS |
John A. Gunn (66) | | Chairman and Trustee
(Trustee since 1985) | | Chairman (since 2007), Chief Executive Officer (2005-2010), and Director of Dodge & Cox, Portfolio Manager and member of Investment Policy Committee (IPC), Global Investment Policy Committee (GIPC) (since 2008), and International Investment Policy Committee (IIPC) | | — |
| Kenneth E. Olivier (58) | | President and Trustee
(Trustee since 2005) | | Chief Executive Officer (since 2010), President (since 2005), and Director of Dodge & Cox, Portfolio Manager, and member of IPC | | — |
| Dana M. Emery (48) | | Senior Vice President and Trustee (Trustee since 1993) | | Executive Vice President (since 2005) and Director of Dodge & Cox, Director of Fixed Income, Portfolio Manager, and member of Fixed Income Investment Policy Committee (FIIPC) | | — |
Charles F. Pohl (52) | | Senior Vice President (Officer since 2004) | | Senior Vice President and Director of Dodge & Cox, Chief Investment Officer (since 2007), Director of Credit Research, Portfolio Manager, Investment Analyst, and member of IPC, GIPC (since 2008), IIPC (since 2007), and FIIPC | | — |
| Diana S. Strandberg (50) | | Senior Vice President
(Officer since 2005) | | Vice President of Dodge & Cox, Director of International Equity (since 2009), Portfolio Manager, and member of IPC, GIPC (since 2008), and IIPC | | — |
| David H. Longhurst (53) | | Treasurer (Officer since 2006) | | Vice President (since 2008) and Assistant Treasurer of Dodge & Cox (since 2007); Fund Administrative and Accounting Senior Manager (2004-2007) | | — |
| Thomas M. Mistele (56) | | Secretary
(Officer since 2000) | | Chief Operating Officer, Director (since 2005), Secretary, and General Counsel of Dodge & Cox | | — |
| Katherine M. Primas (35) | | Chief Compliance Officer
(Officer since 2010) | | Chief Compliance Officer of Dodge & Cox (since 2008) and Associate Chief Compliance Officer of Dodge & Cox (2004-2008) | | — |
| INDEPENDENT TRUSTEES |
| William F. Ausfahl (70) | | Trustee (Since 2002) | | CFO, The Clorox Co. (1982-1997); Director, The Clorox Co. (1984-1997) | | — |
| L. Dale Crandall (68) | | Trustee (Since 1999) | | President, Kaiser Foundation Health Plan, Inc. and Kaiser Foundation Hospitals (2000-2002); Senior Vice President—Finance and Administration & CFO, Kaiser Foundation Health Plan, Inc. and Kaiser Foundation Hospitals (1998-2000) | | Director, Ansell Limited (medical equipment and supplies) (2002-present); Director, Coventry Health Care, Inc. (managed health care) (2004-present); Director, Metavante Technologies, Inc. (software) (2007 to 2009); Bridgeport Education, Inc. (education services) (2008 to present) |
| Thomas A. Larsen (60) | | Trustee (Since 2002) | | Director in Howard, Rice, Nemerovski, Canady, Falk & Rabkin (law firm) | | — |
John B. Taylor (63) | | Trustee (Since 2005) | | Professor of Economics, Stanford University; Senior Fellow, Hoover Institution; Under Secretary for International Affairs, United States Treasury (2001-2005) | | — |
Will C. Wood (70) | | Trustee (Since 1992) | | Principal, Kentwood Associates, Financial Advisers | | Director, Banco Latinoamericano de Exportaciones S.A. (Latin American foreign trade bank) (1999-Present) |
| * | | The address for each Officer and Trustee is 555 California Street, 40th Floor, San Francisco, California 94104. Each Officer and Trustee oversees all five series in the Dodge & Cox Funds complex and serves for an indefinite term. |
Additional information about the Trust’s Trustees and Officers is available in the Trust’s Statement of Additional Information (SAI). You can get a free copy of the SAI by visiting the Funds’ website at www.dodgeandcox.com or calling 1-800-621-3979.
PAGE 15 § DODGE & COX INTERNATIONAL STOCK FUND
| | | | |
| | | | |
www.dodgeandcox.com
For Fund literature, transactions, and account information, please visit the Funds’ web site.
or write or call:
DODGE & COX FUNDS
c/o Boston Financial Data Services
P.O. Box 8422
Boston, Massachusetts 02266-8422
(800) 621-3979
INVESTMENT MANAGER
Dodge & Cox
555 California Street, 40th Floor
San Francisco, California 94104
(415) 981-1710
This report is submitted for the general information of the shareholders of the Fund. The report is not authorized for distribution to prospective investors in the Fund unless it is accompanied by a current prospectus.
This report reflects our views, opinions, and portfolio holdings as of June 30, 2010, the end of the reporting period. Any such views are subject to change at any time based upon market or other conditions and Dodge & Cox disclaims any responsibility to update such views. These views may not be relied on as investment advice and, because investment decisions for a Dodge & Cox Fund are based on numerous factors, may not be relied on as an indication of trading intent on behalf of any Dodge & Cox Fund.
06/10 BF SAR Printed on recycled paper
Semi-Annual Report
June 30, 2010
Balanced Fund
ESTABLISHED 1931
TICKER: DODBX
TO OUR SHAREHOLDERS
The Dodge & Cox Balanced Fund had a total return of –9.6% for the second quarter of 2010, compared to –5.6% for the Combined Index1 (a 60/40 blend of stocks and fixed income securities). For the six months ended June 30, 2010, the Fund had a total return of –4.5%, compared to –1.8% for the Combined Index. Please see the Fund’s longer-term performance results on page four. At quarter end, the Fund’s net assets of $13.8 billion were invested in 70.5% common stocks, 28.1% fixed income securities, and 1.4% cash.
MARKET COMMENTARY
Volatility spiked in U.S. financial markets during the first six months of 2010, fueled by the uncertain impact of financial reform legislation and the European fiscal crisis. The U.S. economy continued its recovery, though mixed economic data in the second quarter cast some doubt on its momentum. As a result, U.S. equity markets tumbled in the second quarter, leading the S&P 500 to fall 6.7% in the first half of the year while “safe haven” U.S. Treasury prices rose significantly. The Treasury sector returned a strong 5.9% for the first half of 2010, and other major U.S. bond market sectors 2 likewise posted solid absolute returns.
The Fund’s higher-than-benchmark allocation to equities reflects our optimism about the long-term potential returns for equities, given compelling valuations and reasonable prospects for profit growth.
INVESTMENT STRATEGY
Equity Portfolio
We believe a long-term perspective on investing is especially important during periods like the first half of 2010. Short-term concerns can often deflect attention from longer-term positive developments. In the United States, for example, high unemployment, rising health care costs, and weakness in real estate are real concerns. However, the current environment has significant positives: interest rates are at record lows, inflation remains subdued, and household net worth is rising. While some economic indicators may lag, the economic recovery can continue.
The difficulties faced by Greece, Italy, Spain, Portugal, and Ireland have led to concerns about all of Europe, and the sustainability of economic recovery
around the world. The Fund’s equity portfolio has investments in a number of large European-based multinational companies whose shares have declined significantly. Although most of these holdings have meaningful operations in Europe, none of them has large exposure to the countries facing the most difficulties, and all derive a substantial portion of their revenues from other regions of the world. We are cognizant of the impact that persistent weakness in Europe could have on the operations of these companies; however, we believe valuations for the portfolio’s holdings generally incorporate other investors’ low expectations for future earnings and do not reflect the companies’ attractive long-term fundamentals.
A good example is Vodafone, the United Kingdom–based global communications company with operations in more than 30 countries.3 While Vodafone has significant exposure to Europe, it also has valuable assets in other regions, including the United States and emerging markets. Vodafone is currently selling at less than nine times estimated 2010 earnings and has a 6% dividend yield, compared to 14 times estimated earnings and a 2% dividend yield for the S&P 500. We believe that Vodafone’s valuation discounts the current concerns about Europe and does not reflect its strong and growing presence in other regions.
Another area of concern weighing on investors is the impact of the Gulf oil spill. In spite of this environmental disaster, our long-term outlook for the Energy sector is positive. We believe that demand for oil and gas (the primary sources of energy, along with coal) will continue to rise due to growth in the developing world. The portfolio’s largest exposure within the Energy sector is in the oil services industry. Our expectation is that demand for oil services will increase as exploration and production continue to move into more complex, technically challenging areas, such as deepwater and shale resource development. In particular, we believe that Schlumberger, the portfolio’s largest Energy holding and the world’s leading oil services company, is uniquely positioned to benefit from these trends. The company’s management is focused on enhancing its strong position in many segments of oil services, and the valuation is well below its long-term average.
PAGE 1 § DODGE & COX BALANCED FUND
The Deepwater Horizon oil spill has leaked large amounts of crude oil, and BP, as majority owner and operator, has accepted responsibility for the clean-up effort. The portfolio did not hold shares of BP or the other named responsible parties. Several companies in the Fund’s equity portfolio (e.g., Baker Hughes and Schlumberger) have significant operations in the affected regions. As always, we are closely monitoring these holdings, but at this time do not believe the events have materially changed these companies’ long-term prospects.
Fixed Income Portfolio
The portfolio continued to feature a significant position (42.1% versus 34.1% for the BCAG) in Agency-guaranteed4 mortgage-backed securities (MBS) and a substantial overweight (50.8% versus 18.2%) in corporate bonds. At the same time, the portfolio maintained a very low (1.7% versus 32.1% for the BCAG) Treasury weighting. In a volatile period for credit spreads generally, we opportunistically added to several Financials sector holdings.
The topic of financial reform has garnered much attention in recent months and the Dodd-Frank Wall Street Reform and Protection Act (Dodd-Frank) was recently signed into law. As of June 30, the portfolio held approximately 21% in securities within the Financials sector, including over 9% in banks. Our investment team has devoted considerable time seeking to understand the potential impact of this legislation on the sector and economy and, importantly, on the Fund’s equity and fixed income holdings. It is our view that many of the new rules—specifically those relating to higher capital levels, less leverage, greater liquidity, and limitations on certain business activities considered “risky”—should have positive implications for bond investors. Certainly, some of these new requirements could result in reduced profitability for banks, but they should also serve to increase transparency and reduce the volatility of bank earnings.
One element of Dodd-Frank establishes a new system for resolution (orderly wind-down) of systemically important non-bank financial companies, including bank holding companies. With the creation of this new process comes a reduced likelihood that large financial institutions would receive government support in a future financial crisis. This could lead to ratings downgrades and greater risks for unsecured creditors of such issuers,
representing a potential negative for some of the portfolio’s Financials holdings. However, the combination of the risk-reducing elements of the legislation, the diverse earnings streams of the portfolio’s bank holdings, and the hard lessons learned by many bank management teams from the recent crisis reduce the likelihood that these institutions would get themselves into such a position.
The portfolio’s MBS weighting remained consistent, invested primarily in three areas, all Agency-guaranteed and with coupons of 5.5% or greater: 1) MBS with 15-year terms, 2) seasoned MBS with 30-year terms, and 3) MBS with 30-year terms preselected for particular borrower or loan characteristics. We believe these MBS can continue to benefit from the ongoing challenges within the real estate and mortgage finance industries that have dampened the ability of mortgage borrowers to take advantage of generation-low mortgage rates.
We continued to position the portfolio defensively vis-à-vis interest rate risk as we believe rates will trend higher over the next three to five years. The low starting point for Treasury yields (e.g., 3-month Treasury bills under 0.2% and 10-year notes under 3.0%), the effect of unprecedented fiscal stimulus and very accommodative monetary policy, and the outsized public and private debt extant in the United States are the primary factors behind this belief. One new development in the recent quarter was our use of Treasury futures. After a thorough investment and operational review, we concluded that Treasury futures provide a useful tool for managing interest rate exposure. We reduced the portfolio’s duration by 0.4 years through a short position in 10-year Treasury futures, and the portfolio ended the first half of 2010 with a 3.8-year duration versus 4.3 years for the BCAG. Importantly, we have maintained a nominal yield advantage despite the portfolio’s shorter relative duration, which provides an additional defensive element in the event that interest rates rise from these low levels.
IN CLOSING
Despite the many near-term economic uncertainties, we are optimistic that the U.S. and global economies are still in the early stages of a multi-year business recovery; in particular, growth conditions in the developing world look excellent. This optimism, combined with what we believe are attractive current valuations, leads us to the view that the long-term prospects for equity investing are favorable,
DODGE & COX BALANCED FUND §PAGE 2
and the Fund’s higher-than-benchmark allocation toward equities reflects that view. Given its low nominal yield, we expect the fixed income portfolio’s contribution to the Fund’s total returns to be more modest in the intermediate term.
Thank you for your continued confidence in our firm. As always, we welcome your comments and questions. For the Board of Trustees,
For the Board of Trustees,
| | |

| |
|
John A. Gunn, Chairman | | Kenneth E. Olivier, President |
July 23, 2010
| 1 | | The Fund’s total returns include the reinvestment of dividend and capital gain distributions, but have not been adjusted for any income taxes payable by shareholders on these distributions or on the redemption of Fund shares. Index returns include dividends and/or interest income and, unlike Fund returns, do not reflect fees or expenses. The Combined Index reflects an unmanaged portfolio of 60% of the Standard & Poor’s 500 Index (S&P 500), which is a widely recognized, unmanaged index of common stock prices, and 40% of the Barclays Capital Aggregate Bond Index (BCAG), which is a widely recognized, unmanaged index of U.S. dollar-denominated investment-grade fixed income securities. The Fund may, however, invest up to 75% of its total assets in stocks. |
| 2 | | Sector returns as calculated and reported by Barclays Capital. |
| 3 | | We use this example to illustrate our investment process, not to imply that we think it is more attractive than the Fund’s other holdings. |
| 4 | | The U.S. Government does not guarantee the Fund’s shares, yield, or net asset value. The guarantee does not eliminate market risk. |
Risks: The Fund is subject to stock market risk, meaning stocks in the Fund may decline in value for extended periods due to the financial prospects of individual companies, or due to general market and economic conditions. The Fund also invests in individual bonds whose yields and market values fluctuate, so that your investment may be worth more or less than its original cost. Bond investments are subject to interest rate risk, credit risk, and prepayment risk, all of which could have adverse effects on the value of the Fund. Please read the prospectus for specific details regarding the Fund’s risk profile.
SEMI-ANNUAL PERFORMANCE REVIEW
The Fund underperformed the Combined Index by 2.7 percentage points for the six months ended June 30, 2010. The Fund’s higher allocation to equities detracted from results.
EQUITY PORTFOLIO
| | § | | Weak returns from holdings in the Health Care sector (down 13% versus down 9% for the S&P 500 sector), combined with a higher average weighting (21% versus 12% for the S&P 500 sector), detracted from results. Boston Scientific (down 36%), Sanofi-Aventis (down 21%), and Pfizer (down 20%) were notably weak. | |
| | § | | Returns from holdings in the Consumer Staples sector (down 15% versus down 3% for the S&P 500 sector) hurt results. Walgreen was down 27%. | |
| | § | | Weak returns in the Industrials sector (down 6% versus down 1% for the S&P 500 sector) had a negative impact. FedEx was down 16%. | |
| | § | | Additional detractors included Hewlett-Packard (down 16%), Motorola (down 16%), Schlumberger (down 14%), and News Corp. (down 12%). | |
| | § | | A much higher average weighting in the Consumer Discretionary sector (18% versus 10% for the S&P 500 sector) had a positive impact, as the area declined less than the market. Time Warner Cable (up 28%) and Comcast (up 4%) were strong. | |
| | § | | Relative returns from holdings in the Energy sector (down 8% versus down 12% for the S&P 500 sector) helped. Baker Hughes was up 3%. | |
| | § | | Returns from holdings in the Telecommunication Services sector (up 6% versus down 8% for the S&P 500 sector) contributed. Sprint Nextel was up 16%. | |
| | § | | Additional contributors included Hitachi (up 26% to date of sale), Ericsson (up 22%), SunTrust Banks (up 15%), and Capital One (up 5%). | |
FIXED INCOME PORTFOLIO
| | § | | The portfolio’s Corporate sector overweight hampered relative returns given the underperformance of the sector as a whole. | |
| | § | | The portfolio’s shorter relative duration positioning (achieved largely through a very low Treasury weighting coupled with a short position in 10-year Treasury futures) detracted from relative returns as Treasuries rallied significantly. | |
| | § | | Certain Agency-guaranteed MBS holdings, primarily premium coupon pools, underperformed similar-duration alternatives in light of the buyouts of seriously delinquent loans by Fannie Mae and Freddie Mac. | |
| | § | | Numerous individual holdings performed poorly, including Financial sector holdings SLM Corp., GE Capital, Bank of America, and HSBC, as well as Boston Scientific and Lafarge. However, this was offset somewhat by good performance from Cigna, Unum Group, Macy’s, Dillard’s, and AIG bonds. | |
| | § | | The portfolio’s nominal yield advantage benefited relative returns. | |
PAGE 3 § DODGE & COX BALANCED FUND
GROWTH OF $10,000 OVER 10 YEARS
FOR AN INVESTMENT MADE ON JUNE 30, 2000
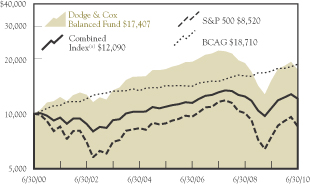
AVERAGE ANNUAL TOTAL RETURN
FOR PERIODS ENDED JUNE 30, 2010
| | | | | | | | | | | | |
| | | 1 Year | | | 5 Years | | | 10 Years | | | 20 Years | |
| | | | | | | | | | | | |
Dodge & Cox Balanced Fund | | 14.93 | % | | (0.09 | )% | | 5.70 | % | | 9.12 | % |
Combined Index(a) | | 12.80 | | | 2.04 | | | 1.92 | | | 7.75 | |
S&P 500 | | 14.42 | | | (0.79 | ) | | (1.59 | ) | | 7.67 | |
Barclays Capital Aggregate
Bond Index (BCAG) | | 9.50 | | | 5.54 | | | 6.47 | | | 7.14 | |
Returns represent past performance and do not guarantee future results. Investment return and share price will fluctuate with market conditions, and investors may have a gain or loss when shares are sold. Mutual fund performance changes over time and currently may be significantly lower than stated. Performance is updated and published monthly. Visit the Fund’s web site at www.dodgeandcox.com or call 1-800-621-3979 for current performance figures.
The Fund’s total returns include the reinvestment of dividend and capital gain distributions, but have not been adjusted for any income taxes payable by shareholders on these distributions or on Fund share redemptions. Index returns include dividends and/or interest income but, unlike Fund returns, do not reflect fees or expenses.
Standard & Poor’s, Standard & Poor’s 500, and S&P 500® are trademarks of The McGraw-Hill Companies, Inc. Barclays Capital® is a trademark of Barclays PLC.
| (a) | | The Combined Index reflects an unmanaged portfolio of 60% of the Standard & Poor’s 500 Index (S&P 500), which is a widely recognized, unmanaged index of common stock prices, and 40% of the Barclays Capital Aggregate Bond Index (BCAG), which is a widely recognized, unmanaged index of U.S. dollar-denominated investment grade fixed income securities. |
FUND EXPENSE EXAMPLE
As a Fund shareholder, you incur ongoing Fund costs, including management fees and other Fund expenses. All mutual funds have ongoing costs, sometimes referred to as operating expenses. The following example shows ongoing costs of investing in the Fund and can help you understand these costs and compare them with those of other mutual funds. The example assumes a $1,000 investment held for the six months indicated.
ACTUAL EXPENSES
The first line of the table below provides information about actual account values and expenses based on the Fund’s actual returns. You may use the information in this line, together with your account balance, to estimate the expenses that you paid over the period. Simply divide your account value by $1,000 (for example, an $8,600 account value divided by $1,000 = 8.6), then multiply the result by the number in the first line under the heading “Expenses Paid During Period” to estimate the expenses you paid on your account during this period.
HYPOTHETICAL EXAMPLE FOR COMPARISON WITH OTHER MUTUAL FUNDS
Information on the second line of the table can help you compare ongoing costs of investing in the Fund with those of other mutual funds. This information may not be used to estimate the actual ending account balance or expenses you paid during the period. The hypothetical “Ending Account Value” is based on the actual expense ratio of the Fund and an assumed 5% annual rate of return before expenses (not the Fund’s actual return). The amount under the heading “Expense Paid During the Period” shows the hypothetical expenses your account would have incurred under this scenario. You can compare this figure with the 5% hypothetical examples that appear in shareholder reports of other mutual funds.
| | | | | | | | | |
Six Months Ended
June 30, 2010 | | Beginning Account Value
1/1/2010 | | Ending Account Value
6/30/2010 | | Expenses Paid
During Period* |
Based on Actual Fund Return | | $ | 1,000.00 | | $ | 954.60 | | $ | 2.59 |
Based on Hypothetical 5% Yearly Return | | | 1,000.00 | | | 1,022.15 | | | 2.68 |
| * | | Expenses are equal to the Fund’s annualized expense ratio of 0.53%, multiplied by the average account value over the period, multiplied by 181/365 (to reflect the one-half year period). |
The expenses shown in the table highlight ongoing costs only and do not reflect any transactional fees or account maintenance fees. While other mutual funds may charge such fees, please note that the Fund does not charge transaction fees (e.g., redemption fees, sales loads) or universal account maintenance fees (e.g., small account fees).
DODGE & COX BALANCED FUND §PAGE 4
| | |
| FUND INFORMATION | | June 30, 2010 |
| | |
| GENERAL INFORMATION | | |
Net Asset Value Per Share | | $60.37 |
Total Net Assets (billions) | | $13.8 |
30-Day SEC Yield(a) | | 2.19% |
Expense Ratio | | 0.53% |
Portfolio Turnover Rate
(1/1/10 to 6/30/10, unannualized) | | 8% |
Fund Inception | | 1931 |
No sales charges or distribution fees | | |
Investment Manager: Dodge & Cox, San Francisco. Managed by the Investment Policy Committee, whose nine members’ average tenure at Dodge & Cox is 24 years, and by the Fixed Income Investment Policy Committee, whose ten members’ average tenure is 15 years. |
| | |
| STOCK PORTFOLIO (70.5%) | | Fund |
Number of Stocks | | 80 |
Median Market Capitalization (billions) | | $18 |
Price-to-Earnings Ratio(b) | | 10.8x |
Foreign Stocks(c) | | 13.7% |
| | | |
| SECTOR DIVERSIFICATION (FIVE LARGEST) | |
Health Care | | 15.0 | % |
Information Technology | | 14.7 | |
Consumer Discretionary | | 12.3 | |
Financials | | 11.8 | |
Energy | | 6.5 | |
| | | |
| TEN LARGEST STOCKS(d) | | | |
Hewlett-Packard Co. | | 3.3 | % |
Capital One Financial Corp. | | 2.7 | |
Comcast Corp. | | 2.6 | |
Merck & Co., Inc. | | 2.6 | |
Wells Fargo & Co. | | 2.5 | |
Novartis AG (Switzerland) | | 2.4 | |
Schlumberger, Ltd. | | 2.4 | |
General Electric Co. | | 2.1 | |
Time Warner, Inc. | | 2.0 | |
GlaxoSmithKline PLC (United Kingdom) | | 1.9 | |
ASSET ALLOCATION
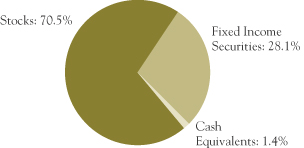
| | |
| FIXED INCOME PORTFOLIO (28.1%) | | Fund |
Number of Fixed Income Securities | | 256 |
Effective Maturity(e) | | 7.0 years |
Effective Duration(f) | | 3.8 years |
| | | |
| SECTOR DIVERSIFICATION | | | |
U.S. Treasury & Government Related(e) | | 2.0 | % |
Mortgage-Related Securities | | 11.8 | |
Asset-Backed Securities | | 0.0 | |
Corporate | | 14.3 | |
| | | |
| CREDIT QUALITY(g) | | | |
U.S. Government & Government Related(e) | | 12.8 | % |
Aaa | | 0.0 | (h) |
Aa | | 2.2 | |
A | | 2.7 | |
Baa | | 6.1 | |
Ba | | 2.5 | |
B | | 1.1 | |
Caa | | 0.7 | |
Ca | | 0.0 | |
C | | 0.0 | |
| | | |
| CORPORATE ISSUERS (FIVE LARGEST)(d) | | | |
Ford Motor Credit Co. | | 0.9 | % |
Ally Financial, Inc. (GMAC) | | 0.7 | |
Burlington Northern Santa Fe Corp. | | 0.7 | |
Bank of America Corp. | | 0.7 | |
Xerox Corp. | | 0.7 | |
| (a) | SEC yield is an annualization of the Fund’s total net investment income per share for the 30-day period ended on the last day of the month. |
| (b) | Price-to-earnings (P/E) ratio is calculated using 12-month forward earnings estimates. |
| (c) | Foreign stocks are U.S. dollar-denominated. |
| (d) | The Fund’s portfolio holdings are subject to change without notice. The mention of specific securities is not a recommendation or solicitation for any person to buy, sell, or hold any particular security. |
| (e) | Data as presented excludes effect of Treasury futures contracts. If the Fund’s exposure to Treasury futures contracts had been included, the effective maturity would be 0.5 years lower, and the relevant sector and credit quality categories would be adjusted down 2.0 percentage points. |
| (f) | Data presented includes effect of Treasury futures contacts. |
| (g) | The Fund’s credit quality distribution is calculated using ratings from Moody’s Investor Services. If no Moody’s rating is available, the lower of the Standard & Poor’s or Fitch rating is used. The credit quality of the investments in the portfolio does not apply to the stability or safety of the Fund or its shares. |
PAGE 5 § DODGE & COX BALANCED FUND
| | |
| PORTFOLIO OF INVESTMENTS (unaudited) | | June 30, 2010 |
| | | | | |
| COMMON STOCKS: 70.5% | | | | |
| | |
| | | SHARES | | VALUE |
| CONSUMER DISCRETIONARY: 12.3% |
CONSUMER DURABLES & APPAREL: 1.8% |
Panasonic Corp. ADR(b) (Japan) | | 8,592,228 | | $ | 107,660,617 |
Sony Corp. ADR(b) (Japan) | | 5,065,900 | | | 135,158,212 |
| | | | | |
| | | | | 242,818,829 |
MEDIA: 8.4% | | | | | |
Comcast Corp., Class A | | 21,027,374 | | | 365,245,486 |
DIRECTV, Class A(a) | | 561,802 | | | 19,056,324 |
DISH Network Corp., Class A(a) | | 1,764,665 | | | 32,028,670 |
Interpublic Group of Companies, Inc.(a) | | 5,346,800 | | | 38,122,684 |
Liberty Global, Inc., Series A(a) | | 258,521 | | | 6,718,961 |
Liberty Global, Inc., Series C(a) | | 382,368 | | | 9,937,744 |
News Corp., Class A | | 20,477,300 | | | 244,908,508 |
Time Warner Cable, Inc. | | 3,258,283 | | | 169,691,378 |
Time Warner, Inc. | | 9,528,466 | | | 275,467,952 |
| | | | | |
| | | | | 1,161,177,707 |
RETAILING: 2.1% | | | | | |
CarMax, Inc.(a) | | 2,100,600 | | | 41,801,940 |
Home Depot, Inc. | | 4,296,692 | | | 120,608,145 |
Liberty Interactive, Series A(a) | | 8,039,750 | | | 84,417,375 |
Macy’s, Inc. | | 2,561,266 | | | 45,846,661 |
| | | | | |
| | | | | 292,674,121 |
| | | | | |
| | | | | 1,696,670,657 |
| CONSUMER STAPLES: 1.2% | | | | | |
FOOD & STAPLES RETAILING: 0.9% | | | |
Wal-Mart Stores, Inc. | | 1,693,600 | | | 81,411,352 |
Walgreen Co. | | 1,976,199 | | | 52,764,513 |
| | | | | |
| | | | | 134,175,865 |
FOOD, BEVERAGE & TOBACCO: 0.3% | | | |
Diageo PLC ADR(b) (United Kingdom) | | 650,000 | | | 40,781,000 |
| | | | | |
| | | | | 174,956,865 |
| ENERGY: 6.5% | | | | | |
Baker Hughes, Inc. | | 3,702,379 | | | 153,907,895 |
Chevron Corp. | | 2,365,579 | | | 160,528,191 |
Occidental Petroleum Corp. | | 2,944,600 | | | 227,175,890 |
Royal Dutch Shell PLC ADR(b) (United Kingdom) | | 480,127 | | | 23,180,532 |
Schlumberger, Ltd. | | 5,925,121 | | | 327,896,196 |
| | | | | |
| | | | | 892,688,704 |
| FINANCIALS: 11.8% | | | | | |
BANKS: 4.6% | | | | | |
BB&T Corp. | | 3,116,484 | | | 81,994,694 |
HSBC Holdings PLC ADR(b) (United Kingdom) | | 1,820,561 | | | 82,999,376 |
SunTrust Banks, Inc. | | 3,005,596 | | | 70,030,387 |
U.S. Bancorp | | 2,442,600 | | | 54,592,110 |
Wells Fargo & Co. | | 13,527,506 | | | 346,304,153 |
| | | | | |
| | | | | 635,920,720 |
| | | | | |
| | |
| | | SHARES | | VALUE |
DIVERSIFIED FINANCIALS: 5.8% | | | |
Bank of New York Mellon Corp. | | 6,688,700 | | $ | 165,144,003 |
Capital One Financial Corp. | | 9,332,659 | | | 376,106,158 |
Charles Schwab Corp. | | 4,690,300 | | | 66,508,454 |
Credit Suisse Group AG ADR(b) (Switzerland) | | 519,200 | | | 19,433,656 |
Goldman Sachs Group, Inc. | | 400,000 | | | 52,508,000 |
Legg Mason, Inc. | | 1,519,300 | | | 42,585,979 |
SLM Corp.(a) | | 7,910,100 | | | 82,185,939 |
| | | | | |
| | | | | 804,472,189 |
INSURANCE: 1.4% | | | | | |
AEGON NV(a),(b) (Netherlands) | | 12,985,200 | | | 68,561,856 |
Genworth Financial, Inc., Class A(a) | | 1,704,200 | | | 22,273,894 |
Loews Corp. | | 911,708 | | | 30,368,993 |
The Travelers Companies, Inc. | | 1,407,119 | | | 69,300,611 |
| | | | | |
| | | | | 190,505,354 |
| | | | | |
| | | | | 1,630,898,263 |
| HEALTH CARE: 15.0% | | | | | |
HEALTH CARE EQUIPMENT & SERVICES: 3.1% |
Boston Scientific Corp.(a) | | 18,638,300 | | | 108,102,140 |
CareFusion Corp.(a) | | 2,922,050 | | | 66,330,535 |
Covidien PLC(b) (Ireland) | | 1,468,700 | | | 59,012,366 |
Medtronic, Inc. | | 1,410,200 | | | 51,147,954 |
UnitedHealth Group, Inc. | | 135,535 | | | 3,849,194 |
WellPoint, Inc.(a) | | 2,705,950 | | | 132,402,134 |
| | | | | |
| | | | | 420,844,323 |
PHARMACEUTICALS, BIOTECHNOLOGY & LIFE SCIENCES: 11.9% |
Amgen, Inc.(a) | | 4,249,400 | | | 223,518,440 |
GlaxoSmithKline PLC ADR(b) (United Kingdom) | | 7,914,400 | | | 269,168,744 |
Merck & Co., Inc. | | 10,186,875 | | | 356,235,019 |
Novartis AG ADR(b) (Switzerland) | | 6,808,300 | | | 328,977,056 |
Pfizer, Inc. | | 16,320,517 | | | 232,730,572 |
Sanofi-Aventis ADR(b) (France) | | 7,790,400 | | | 234,179,424 |
| | | | | |
| | | | | 1,644,809,255 |
| | | | | |
| | | | | 2,065,653,578 |
| INDUSTRIALS: 5.1% | | | | | |
CAPITAL GOODS: 3.1% | | | | | |
Eaton Corp. | | 827,000 | | | 54,118,880 |
General Electric Co. | | 20,084,600 | | | 289,619,932 |
Tyco International, Ltd.(b) (Switzerland) | | 2,185,434 | | | 76,992,840 |
| | | | | |
| | | | | 420,731,652 |
COMMERCIAL & PROFESSIONAL SERVICES: 0.5% |
Dun & Bradstreet Corp. | | 32,300 | | | 2,167,976 |
Pitney Bowes, Inc. | | 3,072,350 | | | 67,468,806 |
| | | | | |
| | | | | 69,636,782 |
| | |
| See accompanying Notes to Financial Statements | | DODGE & COX BALANCED FUND §PAGE 6 |
| | |
| PORTFOLIO OF INVESTMENTS (unaudited) | | June 30, 2010 |
| | | | | |
| COMMON STOCKS (continued) | | | | |
| | |
| | | SHARES | | VALUE |
TRANSPORTATION: 1.5% | | | | | |
FedEx Corp. | | 2,994,554 | | $ | 209,948,181 |
| | | | | |
| | | | | 700,316,615 |
| INFORMATION TECHNOLOGY: 14.7% |
SEMICONDUCTORS & SEMICONDUCTOR EQUIPMENT: 0.8% |
Maxim Integrated Products, Inc. | | 6,294,000 | | | 105,298,620 |
SOFTWARE & SERVICES: 5.6% | | | | | |
AOL, Inc.(a) | | 2,093,306 | | | 43,519,832 |
BMC Software, Inc.(a) | | 2,374,160 | | | 82,217,161 |
Cadence Design Systems, Inc.(a) | | 9,515,800 | | | 55,096,482 |
Citrix Systems, Inc.(a) | | 1,086,410 | | | 45,879,094 |
Computer Sciences Corp. | | 1,654,900 | | | 74,884,225 |
Compuware Corp.(a) | | 6,789,888 | | | 54,183,306 |
EBay, Inc.(a) | | 7,299,900 | | | 143,151,039 |
Electronic Arts, Inc.(a) | | 5,715,680 | | | 82,305,792 |
Symantec Corp.(a) | | 7,849,400 | | | 108,949,672 |
Synopsys, Inc.(a) | | 3,915,100 | | | 81,708,137 |
| | | | | |
| | | | | 771,894,740 |
TECHNOLOGY, HARDWARE & EQUIPMENT: 8.3% |
Hewlett-Packard Co. | | 10,709,212 | | | 463,494,695 |
Molex, Inc. | | 781,600 | | | 14,256,384 |
Molex, Inc., Class A | | 2,469,828 | | | 38,158,843 |
Motorola, Inc.(a) | | 36,043,700 | | | 235,004,924 |
Nokia Corp. ADR(b) (Finland) | | 6,534,660 | | | 53,257,479 |
Telefonaktiebolaget LM Ericsson ADR(b) (Sweden) | | 6,072,200 | | | 66,915,644 |
Tyco Electronics, Ltd.(b) (Switzerland) | | 4,678,500 | | | 118,740,330 |
Xerox Corp. | | 19,745,150 | | | 158,751,006 |
| | | | | |
| | | | | 1,148,579,305 |
| | | | | |
| | | | | 2,025,772,665 |
| MATERIALS: 1.6% | | | | | |
Cemex SAB de CV ADR(a),(b) (Mexico) | | 4,176,414 | | | 40,385,923 |
Domtar Corp. | | 487,491 | | | 23,960,183 |
Dow Chemical Co. | | 6,205,359 | | | 147,191,116 |
Vulcan Materials Co. | | 286,756 | | | 12,568,515 |
| | | | | |
| | | | | 224,105,737 |
| TELECOMMUNICATION SERVICES: 2.3% |
Sprint Nextel Corp.(a) | | 37,874,100 | | | 160,586,184 |
Vodafone Group PLC ADR(b) (United Kingdom) | | 7,416,698 | | | 153,303,148 |
| | | | | |
| | | | | 313,889,332 |
| | | | | |
TOTAL COMMON STOCKS
(Cost $10,688,304,394) | | | | $ | 9,724,952,416 |
| | | | | | |
| FIXED INCOME SECURITIES: 28.1% |
| | |
| | | PAR VALUE | | VALUE |
| U.S. TREASURY AND GOVERNMENT RELATED: 2.0% |
U.S. TREASURY: 0.5% | | | | | | |
U.S. Treasury Note | | | | | | |
1.25%, 11/30/10 | | $ | 67,200,000 | | $ | 67,488,759 |
GOVERNMENT RELATED: 1.5% | | | |
Arkansas Dev. Fin. Auth. GNMA Guaranteed Bonds 9.75%, 11/15/14 | | | 992,592 | | | 1,067,354 |
California Taxable General Obligation | | | | | | |
5.45%, 4/1/15 | | | 14,510,000 | | | 15,221,570 |
7.50%, 4/1/34 | | | 28,825,000 | | | 30,762,040 |
5.65%, 4/1/39 (mandatory put 4/1/13) | | | 4,960,000 | | | 5,201,254 |
7.55%, 4/1/39 | | | 43,350,000 | | | 46,516,718 |
7.30%, 10/1/39 | | | 17,000,000 | | | 17,698,530 |
7.625%, 3/1/40 | | | 5,500,000 | | | 5,942,585 |
Los Angeles Unified School District Taxable General Obligation
6.758%, 7/1/34 | | | 19,000,000 | | | 20,827,800 |
Small Business Administration — 504 Program | | | |
Series 96-20L, 6.70%, 12/1/16 | | | 1,003,005 | | | 1,092,173 |
Series 97-20F, 7.20%, 6/1/17 | | | 1,472,886 | | | 1,619,615 |
Series 97-20I, 6.90%, 9/1/17 | | | 1,978,230 | | | 2,161,996 |
Series 98-20D, 6.15%, 4/1/18 | | | 2,427,019 | | | 2,635,263 |
Series 98-20I, 6.00%, 9/1/18 | | | 1,677,340 | | | 1,815,654 |
Series 99-20F, 6.80%, 6/1/19 | | | 1,921,522 | | | 2,106,022 |
Series 00-20D, 7.47%, 4/1/20 | | | 5,326,590 | | | 5,861,994 |
Series 00-20E, 8.03%, 5/1/20 | | | 2,212,972 | | | 2,478,388 |
Series 00-20G, 7.39%, 7/1/20 | | | 3,412,938 | | | 3,755,344 |
Series 00-20I, 7.21%, 9/1/20 | | | 2,203,133 | | | 2,408,292 |
Series 01-20E, 6.34%, 5/1/21 | | | 6,544,232 | | | 7,112,902 |
Series 01-20G, 6.625%, 7/1/21 | | | 5,600,426 | | | 6,110,128 |
Series 03-20J, 4.92%, 10/1/23 | | | 13,969,863 | | | 14,892,771 |
Series 07-20F, 5.71%, 6/1/27 | | | 9,347,278 | | | 10,294,239 |
| | | | | | |
| | | | | | 207,582,632 |
| | | | | | |
| | | | | | 275,071,391 |
| MORTGAGE-RELATED SECURITIES: 11.8% |
FEDERAL AGENCY CMO & REMIC: 2.0% | | | |
Dept. of Veterans Affairs | | | | | | |
Trust 1995-1A 1, 7.214%, 2/15/25 | | | 938,394 | | | 1,041,031 |
Trust 1995-2C 3A, 8.793%, 6/15/25 | | | 390,171 | | | 474,058 |
Fannie Mae | | | | | | |
Trust 2001-T5 A3, 7.50%, 6/19/30 | | | 1,131,106 | | | 1,284,645 |
Trust 2002-33 A1, 7.00%, 6/25/32 | | | 3,494,905 | | | 3,912,518 |
Trust 2002-86, 6.00%, 8/25/32 | | | 12,970,838 | | | 13,923,608 |
Trust 2005-W4 1A2, 6.50%, 8/25/35 | | | 19,572,867 | | | 21,680,008 |
Trust 2001-T7 A1, 7.50%, 2/25/41 | | | 3,352,080 | | | 3,827,211 |
Trust 2001-T8 A1, 7.50%, 7/25/41 | | | 3,703,401 | | | 4,224,626 |
Trust 2001-T4 A1, 7.50%, 7/25/41 | | | 3,039,229 | | | 3,535,359 |
Trust 2001-W3 A, 7.00%, 9/25/41 | | | 2,829,206 | | | 3,238,004 |
Trust 2001-T10 A2, 7.50%, 12/25/41 | | | 3,595,274 | | | 4,101,280 |
Trust 2002-W6 2A1, 7.00%, 6/25/42 | | | 3,347,230 | | | 3,780,670 |
Trust 2002-W8 A2, 7.00%, 6/25/42 | | | 3,919,182 | | | 4,485,474 |
| | |
| PAGE 7 § DODGE & COX BALANCED FUND | | See accompanying Notes to Financial Statements |
| | |
| PORTFOLIO OF INVESTMENTS (unaudited) | | June 30, 2010 |
| | | | | | |
| FIXED INCOME SECURITIES (continued) |
| | |
| | | PAR VALUE | | VALUE |
Trust 2003-W2 1A1, 6.50%, 7/25/42 | | $ | 6,989,360 | | $ | 7,976,412 |
Trust 2003-W2 1A2, 7.00%, 7/25/42 | | | 2,939,102 | | | 3,352,531 |
Trust 2003-W4 4A, 7.50%, 10/25/42 | | | 4,206,589 | | | 4,811,674 |
Trust 2004-T1 1A2, 6.50%, 1/25/44 | | | 6,832,406 | | | 7,721,686 |
Trust 2004-W2 5A, 7.50%, 3/25/44 | | | 13,108,749 | | | 14,953,703 |
Trust 2004-W8 3A, 7.50%, 6/25/44 | | | 1,891,173 | | | 2,145,994 |
Trust 2009-11 MP, 7.00%, 3/25/49 | | | 63,835,961 | | | 69,686,885 |
Freddie Mac | | | | | | |
Series 2100 GS, 6.50%, 12/15/13 | | | 2,507,397 | | | 2,658,717 |
Series 2430 UC, 6.00%, 9/15/16 | | | 1,644,748 | | | 1,662,499 |
Series 1078 GZ, 6.50%, 5/15/21 | | | 653,785 | | | 697,395 |
Series (GN) 16 PK, 7.00%, 8/25/23 | | | 7,683,026 | | | 8,444,264 |
Series T-48 1A4, 5.538%, 7/25/33 | | | 53,639,183 | | | 58,160,108 |
Series T-051 1A, 6.50%, 9/25/43 | | | 347,888 | | | 389,798 |
Series T-59 1A1, 6.50%, 10/25/43 | | | 21,330,203 | | | 23,587,280 |
| | | | | | |
| | | | | | 275,757,438 |
FEDERAL AGENCY MORTGAGE PASS-THROUGH: 9.8% |
Fannie Mae, 10 Year | | | | | | |
6.00%, 1/1/12-4/1/12 | | | 4,320,081 | | | 4,575,353 |
Fannie Mae, 15 Year | | | | | | |
6.00%, 7/1/16-3/1/22 | | | 41,125,603 | | | 44,785,080 |
6.50%, 1/1/13-11/1/18 | | | 61,617,537 | | | 66,713,817 |
7.00%, 7/1/11-11/1/18 | | | 4,613,762 | | | 5,015,255 |
7.50%, 9/1/15-8/1/17 | | | 21,962,861 | | | 23,997,686 |
Fannie Mae, 20 Year | | | | | | |
6.50%, 1/1/22-10/1/26 | | | 15,115,226 | | | 16,561,802 |
Fannie Mae, 30 Year | | | | | | |
5.50%, 5/1/33-8/1/37 | | | 250,036,308 | | | 269,739,875 |
6.00%, 9/1/36-1/1/39 | | | 277,188,893 | | | 303,049,314 |
6.50%, 12/1/28-11/1/37 | | | 190,580,880 | | | 209,891,066 |
7.00%, 4/1/37-8/1/37 | | | 59,345,919 | | | 65,989,596 |
Fannie Mae, Hybrid ARM | | | | | | |
2.092%, 1/1/35 | | | 6,797,622 | | | 7,057,381 |
2.602%, 12/1/34 | | | 9,349,293 | | | 9,652,913 |
3.002%, 1/1/35 | | | 4,666,621 | | | 4,880,558 |
3.291%, 8/1/35 | | | 6,467,075 | | | 6,734,788 |
4.765%, 9/1/34 | | | 6,433,990 | | | 6,777,993 |
Fannie Mae, Multifamily DUS | | | | | | |
Pool 555728, 4.02%, 8/1/13 | | | 315,474 | | | 332,377 |
Pool 555162, 4.826%, 1/1/13 | | | 14,059,812 | | | 14,980,044 |
Pool 760762, 4.89%, 4/1/12 | | | 15,745,000 | | | 16,441,620 |
Pool 555316, 4.918%, 2/1/13 | | | 4,140,842 | | | 4,363,813 |
Pool 735387, 4.921%, 4/1/15 | | | 11,534,407 | | | 12,595,655 |
Pool 555148, 4.976%, 1/1/13 | | | 3,550,177 | | | 3,776,305 |
Pool 555806, 5.145%, 10/1/13 | | | 2,452,297 | | | 2,652,552 |
Pool 461628, 5.32%, 4/1/14 | | | 9,709,027 | | | 10,620,221 |
Pool 462086, 5.355%, 11/1/15 | | | 19,938,613 | | | 22,115,339 |
Pool 545316, 5.629%, 12/1/11 | | | 4,458,219 | | | 4,672,481 |
Pool 545685, 5.876%, 4/1/12 | | | 11,215,009 | | | 11,609,939 |
Pool 545387, 5.885%, 1/1/12 | | | 5,054,361 | | | 5,329,289 |
Pool 545258, 5.926%, 11/1/11 | | | 766,632 | | | 797,129 |
| | | | | | |
| | |
| | | PAR VALUE | | VALUE |
Freddie Mac, Hybrid ARM
2.836%, 5/1/34 | | $ | 8,333,704 | | $ | 8,771,329 |
Freddie Mac Gold, 15 Year | | | | | | |
6.00%, 10/1/13-10/1/18 | | | 19,544,995 | | | 21,029,574 |
6.50%, 7/1/14-3/1/18 | | | 26,487,523 | | | 28,684,571 |
7.00%, 4/1/15 | | | 59,959 | | | 62,597 |
7.75%, 7/25/21 | | | 1,046,134 | | | 1,181,273 |
Freddie Mac Gold, 20 Year
6.50%, 10/1/26 | | | 26,132,431 | | | 28,761,029 |
Freddie Mac Gold, 30 Year | | | | | | |
6.50%, 9/1/18-4/1/33 | | | 34,318,067 | | | 38,362,608 |
7.00%, 11/1/37-9/1/38 | | | 58,813,204 | | | 65,491,023 |
7.47%, 3/17/23 | | | 279,957 | | | 314,097 |
8.50%, 1/1/23 | | | 4,886 | | | 5,452 |
Ginnie Mae, 30 Year | | | | | | |
7.50%, 11/15/24-10/15/25 | | | 2,770,777 | | | 3,126,292 |
7.97%, 4/15/20-1/15/21 | | | 1,555,988 | | | 1,764,739 |
| | | | | | |
| | | | | | 1,353,263,825 |
PRIVATE LABEL CMO & REMIC SECURITIES: 0.0%(e) |
Union Planters Mortgage Finance Corp. Series 2000-1 A1,
7.70%, 12/25/24 | | | 2,333,349 | | | 2,422,793 |
| | | | | | |
| | | | | | 1,631,444,056 |
| CORPORATE: 14.3% | | | | | | |
FINANCIALS: 5.8% | | | | | | |
Ally Financial, Inc. 6.875%, 9/15/11 | | | 99,905,000 | | | 101,278,694 |
American International Group, Inc.
8.25%, 8/15/18 | | | 28,335,000 | | | 28,689,188 |
Bank of America Corp. | | | | | | |
5.30%, 3/15/17 | | | 41,040,000 | | | 41,323,217 |
7.625%, 6/1/19 | | | 6,000,000 | | | 6,873,048 |
8.00%, 12/15/26(c) | | | 16,960,000 | | | 16,451,200 |
6.625%, 5/23/36(c) | | | 33,500,000 | | | 30,630,290 |
Barclays PLC(b) (United Kingdom) 5.125%, 1/8/20 | | | 40,985,000 | | | 40,774,491 |
Boston Properties, Inc. | | | | | | |
6.25%, 1/15/13 | | | 14,335,000 | | | 15,614,126 |
5.625%, 4/15/15 | | | 28,825,000 | | | 31,180,839 |
5.00%, 6/1/15 | | | 2,825,000 | | | 2,929,412 |
Capital One Financial Corp.
6.75%, 9/15/17 | | | 44,585,000 | | | 51,064,984 |
CIGNA Corp. | | | | | | |
8.50%, 5/1/19 | | | 7,330,000 | | | 9,236,518 |
7.65%, 3/1/23 | | | 9,525,000 | | | 11,344,247 |
7.875%, 5/15/27 | | | 12,675,000 | | | 15,024,273 |
8.30%, 1/15/33 | | | 8,845,000 | | | 10,861,395 |
6.15%, 11/15/36 | | | 5,375,000 | | | 5,528,424 |
Citigroup, Inc. | | | | | | |
4.75%, 5/19/15 | | | 10,045,000 | | | 10,039,676 |
6.125%, 11/21/17 | | | 58,380,000 | | | 60,966,818 |
General Electric Co.
0.474%, 11/1/12 | | | 35,640,000 | | | 34,724,551 |
| | |
| See accompanying Notes to Financial Statements | | DODGE & COX BALANCED FUND §PAGE 8 |
| | |
| PORTFOLIO OF INVESTMENTS (unaudited) | | June 30, 2010 |
| | | | | | |
| FIXED INCOME SECURITIES (continued) |
| | |
| | | PAR VALUE | | VALUE |
Health Net, Inc.
6.375%, 6/1/17 | | $ | 18,250,000 | | $ | 16,972,500 |
HSBC Holdings PLC(b) (United Kingdom) | | | | | | |
6.50%, 5/2/36 | | | 18,955,000 | | | 19,659,538 |
6.50%, 9/15/37 | | | 8,940,000 | | | 9,253,329 |
JPMorgan Chase & Co.(c) | | | | | | |
8.75%, 9/1/30 | | | 27,542,000 | | | 32,323,043 |
5.85%, 8/1/35 | | | 5,820,000 | | | 5,278,938 |
SLM Corp.
8.45%, 6/15/18 | | | 39,255,000 | | | 36,224,946 |
Travelers Cos., Inc. | | | | | | |
5.00%, 3/15/13 | | | 9,530,000 | | | 10,200,445 |
6.25%, 6/20/16 | | | 9,515,000 | | | 11,090,912 |
Unum Group | | | | | | |
7.625%, 3/1/11 | | | 8,236,000 | | | 8,550,014 |
6.85%, 11/15/15(d) | | | 9,970,000 | | | 10,588,808 |
7.19%, 2/1/28 | | | 8,305,000 | | | 7,761,147 |
7.25%, 3/15/28 | | | 11,855,000 | | | 12,086,018 |
6.75%, 12/15/28 | | | 11,368,000 | | | 11,174,664 |
WellPoint, Inc. | | | | | | |
5.00%, 12/15/14 | | | 12,770,000 | | | 13,874,286 |
5.25%, 1/15/16 | | | 39,085,000 | | | 42,791,626 |
Wells Fargo & Co.
6.00%, 11/15/17 | | | 30,195,000 | | | 32,902,676 |
| | | | | | |
| | | | | | 805,268,281 |
INDUSTRIALS: 6.8% | | | | | | |
Boston Scientific Corp. | | | | | | |
5.45%, 6/15/14 | | | 18,940,000 | | | 19,416,663 |
6.25%, 11/15/15 | | | 1,055,000 | | | 1,093,765 |
6.40%, 6/15/16 | | | 21,405,000 | | | 22,461,487 |
Comcast Corp. | | | | | | |
5.85%, 11/15/15 | | | 25,895,000 | | | 29,268,678 |
5.90%, 3/15/16 | | | 3,110,000 | | | 3,504,805 |
6.30%, 11/15/17 | | | 5,865,000 | | | 6,695,912 |
Cox Communications, Inc. | | | | | | |
5.45%, 12/15/14 | | | 36,920,000 | | | 40,751,558 |
5.50%, 10/1/15 | | | 4,705,000 | | | 5,135,771 |
5.875%, 12/1/16(d) | | | 24,570,000 | | | 27,314,297 |
8.375%, 3/1/39(d) | | | 6,255,000 | | | 8,502,622 |
Dillard’s, Inc. | | | | | | |
7.85%, 10/1/12 | | | 13,680,000 | | | 14,056,200 |
7.13%, 8/1/18 | | | 10,586,000 | | | 9,950,840 |
7.875%, 1/1/23 | | | 8,660,000 | | | 7,707,400 |
7.75%, 7/15/26 | | | 50,000 | | | 43,000 |
7.75%, 5/15/27 | | | 540,000 | | | 457,650 |
7.00%, 12/1/28 | | | 15,135,000 | | | 12,410,700 |
Dow Chemical Co. | | | | | | |
8.55%, 5/15/19 | | | 27,420,000 | | | 33,565,178 |
7.375%, 11/1/29 | | | 17,755,000 | | | 19,656,596 |
9.40%, 5/15/39 | | | 11,890,000 | | | 16,536,493 |
| | | | | | |
| | |
| | | PAR VALUE | | VALUE |
Ford Motor Credit Co.(g)
7.375%, 2/1/11 | | $ | 124,450,000 | | $ | 126,780,077 |
HCA, Inc. | | | | | | |
7.875%, 2/1/11 | | | 7,828,000 | | | 7,945,420 |
6.95%, 5/1/12 | | | 48,940,000 | | | 50,408,200 |
6.30%, 10/1/12 | | | 8,210,000 | | | 8,168,950 |
6.25%, 2/15/13 | | | 18,390,000 | | | 18,068,175 |
6.75%, 7/15/13 | | | 4,600,000 | | | 4,508,000 |
Kraft Foods, Inc.
5.375%, 2/10/20 | | | 14,100,000 | | | 15,108,869 |
Lafarge SA(b) (France)
6.50%, 7/15/16 | | | 32,945,000 | | | 34,128,319 |
Liberty Media Corp. | | | | | | |
8.50%, 7/15/29 | | | 9,462,000 | | | 8,705,040 |
8.25%, 2/1/30 | | | 7,291,000 | | | 6,707,720 |
Macy’s, Inc. | | | | | | |
7.45%, 10/15/16 | | | 11,410,000 | | | 12,009,025 |
6.65%, 7/15/24 | | | 12,600,000 | | | 12,096,000 |
6.90%, 4/1/29 | | | 5,235,000 | | | 5,038,687 |
6.90%, 1/15/32 | | | 54,699,000 | | | 51,964,050 |
6.70%, 7/15/34 | | | 8,190,000 | | | 7,760,025 |
Nordstrom, Inc.
6.25%, 1/15/18 | | | 5,510,000 | | | 6,271,713 |
Reed Elsevier PLC(b)
(United Kingdom)
8.625%, 1/15/19 | | | 22,475,000 | | | 28,612,316 |
Sprint Nextel Corp. | | | | | | |
6.00%, 12/1/16 | | | 25,000,000 | | | 22,437,500 |
6.875%, 11/15/28 | | | 9,855,000 | | | 8,179,650 |
Time Warner Cable, Inc. | | | | | | |
8.75%, 2/14/19 | | | 20,265,000 | | | 25,569,141 |
8.25%, 4/1/19 | | | 21,145,000 | | | 26,004,163 |
Time Warner, Inc. | | | | | | |
7.625%, 4/15/31 | | | 49,450,000 | | | 59,487,064 |
7.70%, 5/1/32 | | | 13,055,000 | | | 15,744,774 |
Xerox Corp. | | | | | | |
6.875%, 8/15/11 | | | 63,690,000 | | | 67,313,133 |
6.35%, 5/15/18 | | | 20,110,000 | | | 22,431,378 |
| | | | | | |
| | | | | | 929,977,004 |
TRANSPORTATION: 1.7% | | | | | | |
Burlington Northern Santa Fe Corp.(g) | | | | | | |
8.251%, 1/15/21 | | | 1,160,992 | | | 1,440,628 |
4.967%, 4/1/23 | | | 10,622,818 | | | 11,923,078 |
5.72%, 1/15/24 | | | 19,390,191 | | | 21,182,899 |
5.629%, 4/1/24 | | | 22,889,421 | | | 24,882,896 |
5.342%, 4/1/24 | | | 14,943,511 | | | 15,979,089 |
5.996%, 4/1/24 | | | 19,779,838 | | | 22,580,794 |
CSX Corp.
9.75%, 6/15/20 | | | 5,231,000 | | | 7,197,035 |
| | |
| PAGE 9 § DODGE & COX BALANCED FUND | | See accompanying Notes to Financial Statements |
| | |
| PORTFOLIO OF INVESTMENTS (unaudited) | | June 30, 2010 |
| | | | | | | |
| FIXED INCOME SECURITIES (continued) |
| | |
| | | PAR VALUE | | | VALUE |
FedEx Corp. | | | | | | | |
7.375%, 1/15/14 | | $ | 8,795,000 | | | $ | 10,273,932 |
8.00%, 1/15/19 | | | 6,965,000 | | | | 8,845,063 |
6.72%, 7/15/23 | | | 14,300,477 | | | | 15,780,395 |
Norfolk Southern Corp. | | | | | | | |
7.70%, 5/15/17 | | | 5,820,000 | | | | 7,237,880 |
9.75%, 6/15/20 | | | 7,224,000 | | | | 10,071,397 |
Union Pacific Corp. | | | | | | | |
6.33%, 1/2/20 | | | 22,510,445 | | | | 25,318,687 |
5.866%, 7/2/30 | | | 33,875,966 | | | | 39,080,669 |
6.176%, 1/2/31 | | | 11,572,505 | | | | 13,153,343 |
| | | | | | | |
| | | | | | | 234,947,785 |
| | | | | | | |
| | | | | | | 1,970,193,070 |
| | | | | | | |
TOTAL FIXED INCOME SECURITIES
(Cost $3,652,246,162) | | | $ | 3,876,708,517 |
| SHORT-TERM INVESTMENTS: 1.1% |
MONEY MARKET FUND: 0.3% | | | | | | | |
SSgA Prime Money Market Fund | | | 41,781,750 | | | | 41,781,750 |
REPURCHASE AGREEMENT: 0.8% |
Fixed Income Clearing Corporation(f)
0.00%, 7/1/10,
maturity value $102,723,000 | | | 102,723,000 | | | | 102,723,000 |
| | | | | | | |
TOTAL SHORT-TERM INVESTMENTS
(Cost $144,504,751) | | | $ | 144,504,750 |
| | | | | | | |
TOTAL INVESTMENTS
(Cost $14,485,055,307) | | | 99.7 | % | | $ | 13,746,165,683 |
OTHER ASSETS LESS LIABILITIES | | | 0.3 | % | | | 45,371,764 |
| | | | | | | |
| NET ASSETS | | | 100.0 | % | | $ | 13,791,537,447 |
| | | | | | | |
| (b) | Security denominated in U.S. dollars |
| (c) | Cumulative preferred security |
| (d) | Security exempt from registration under Rule 144A of the Securities Act of 1933. The security may be resold in transactions exempt from registration, normally to qualified institutional buyers. As of June 30, 2010, all such securities in total represented $46,405,727 or 0.3% of net assets. |
| (f) | Repurchase agreement is collateralized by Fannie Mae 0.00%, 4/25/11. Total collateral value is $104,782,388. |
| (g) | Subsidiary (see Note below) |
| | Note: Fixed income securities are grouped by parent company unless otherwise noted. Actual securities may be issued by the listed parent company or one of its subsidiaries. |
ADR: American Depositary Receipt
ARM: Adjustable Rate Mortgage
CMO: Collateralized Mortgage Obligation
DUS: Delegated Underwriting and Servicing
REMIC: Real Estate Mortgage Investment Conduit
FUTURES CONTRACTS
| | | | | | | | | | | | |
| Description | | Number of
Contracts | | Expiration
Date | | Notional
Amount | | | Unrealized
Depreciation | |
10 Year U.S. Treasury Note- short position | | 2,245 | | Sept 2010 | | $ | (275,117,734 | ) | | $ | (3,963,517 | ) |
| | |
| See accompanying Notes to Financial Statements | | DODGE & COX BALANCED FUND §PAGE 10 |
| | | |
STATEMENT OF ASSETS AND LIABILITIES (unaudited) | |
| |
| | | June 30, 2010 | |
ASSETS: | | | |
Investments, at value (cost $14,485,055,307) | | $13,746,165,683 | |
Cash held at broker | | 2,918,500 | |
Receivable for investments sold | | 16,396,661 | |
Receivable for paydowns on mortgage-backed securities | | 477,137 | |
Receivable for Fund shares sold | | 3,484,296 | |
Dividends and interest receivable | | 70,459,110 | |
Prepaid expenses and other assets | | 37,544 | |
| | | |
| | 13,839,938,931 | |
| | | |
LIABILITIES: | | | |
Payable for investments purchased | | 23,669,979 | |
Payable for Fund shares redeemed | | 17,755,828 | |
Payable to broker for futures margin variation | | 35,078 | |
Management fees payable | | 5,930,563 | |
Accrued expenses | | 1,010,036 | |
| | | |
| | 48,401,484 | |
| | | |
NET ASSETS | | $13,791,537,447 | |
| | | |
NET ASSETS CONSIST OF: | | | |
Paid in capital | | $16,944,968,653 | |
Undistributed net investment income | | 7,036,712 | |
Accumulated net realized loss | | (2,417,614,777 | ) |
Net unrealized depreciation | | (742,853,141 | ) |
| | | |
| | $13,791,537,447 | |
| | | |
Fund shares outstanding (par value $0.01 each, unlimited shares authorized) | | 228,437,974 | |
Net asset value per share | | $60.37 | |
|
STATEMENT OF OPERATIONS
(unaudited) | |
| |
| | | Six Months Ended
June 30, 2010 | |
INVESTMENT INCOME: | | | |
Dividends (net of foreign taxes of $4,293,999) | | $109,643,338 | |
Interest | | 101,956,788 | |
| | | |
| | 211,600,126 | |
| | | |
EXPENSES: | | | |
Management fees | | 37,794,976 | |
Custody and fund accounting fees | | 126,172 | |
Transfer agent fees | | 1,518,334 | |
Professional services | | 73,450 | |
Shareholder reports | | 405,975 | |
Registration fees | | 123,077 | |
Trustees’ fees | | 77,000 | |
Miscellaneous | | 240,428 | |
| | | |
| | 40,359,412 | |
| | | |
NET INVESTMENT INCOME | | 171,240,714 | |
| | | |
REALIZED AND UNREALIZED GAIN/ (LOSS): | |
Net realized gain | | 67,367,489 | |
Net change in unrealized appreciation/depreciation | | | |
Investments | | (882,669,586 | ) |
Treasury futures contracts | | (3,963,517 | ) |
| | | |
Net realized and unrealized loss | | (819,265,614 | ) |
| | | |
NET DECREASE IN NET ASSETS
FROM OPERATIONS | | $(648,024,900 | ) |
| | | |
| | | | | | | | |
STATEMENT OF CHANGES IN NET ASSETS | |
| | | Six Months Ended
June 30, 2010
(unaudited) | | | Year Ended
December 31, 2009 | |
OPERATIONS: | | | | | | | | |
Net investment income | | $ | 171,240,714 | | | $ | 376,765,574 | |
Net realized gain | | | 67,367,489 | | | | (2,052,998,779 | ) |
Net change in unrealized appreciation/depreciation | | | (886,633,103 | ) | | | 5,276,540,161 | |
| | | | | | | | |
Net increase/(decrease) in net assets from operations | | | (648,024,900 | ) | | | 3,600,306,956 | |
| | | | | | | | |
| | |
DISTRIBUTIONS TO SHAREHOLDERS FROM: | | | | | | | | |
Net investment income | | | (184,210,645 | ) | | | (390,735,227 | ) |
Net realized gain | | | — | | | | — | |
| | | | | | | | |
Total distributions | | | (184,210,645 | ) | | | (390,735,227 | ) |
| | | | | | | | |
| | |
FUND SHARE TRANSACTIONS: | | | | | | | | |
Proceeds from sale of shares | | | 808,510,889 | | | | 1,537,912,991 | |
Reinvestment of distributions | | | 174,714,018 | | | | 371,264,842 | |
Cost of shares redeemed | | | (1,807,683,007 | ) | | | (4,346,300,231 | ) |
| | | | | | | | |
Net decrease from Fund
share transactions | | | (824,458,100 | ) | | | (2,437,122,398 | ) |
| | | | | | | | |
Total increase/(decrease) in net assets | | | (1,656,693,645 | ) | | | 772,449,331 | |
| | |
NET ASSETS: | | | | | | | | |
Beginning of period | | | 15,448,231,092 | | | | 14,675,781,761 | |
| | | | | | | | |
End of period (including undistributed net investment income of $7,036,712 and $4,906,786, respectively) | | $ | 13,791,537,447 | | | $ | 15,448,231,092 | |
| | | | | | | | |
| | |
SHARE INFORMATION: | | | | | | | | |
Shares sold | | | 12,330,374 | �� | | | 28,435,356 | |
Distributions reinvested | | | 2,705,630 | | | | 6,779,008 | |
Shares redeemed | | | (27,848,665 | ) | | | (80,245,172 | ) |
| | | | | | | | |
Net decrease in shares outstanding | | | (12,812,661 | ) | | | (45,030,808 | ) |
| | | | | | | | |
| | |
| PAGE 11 § DODGE & COX BALANCED FUND | | See accompanying Notes to Financial Statements |
NOTES TO FINANCIAL STATEMENTS (unaudited)
NOTE 1—ORGANIZATION AND SIGNIFICANT ACCOUNTING POLICIES
Dodge & Cox Balanced Fund (the “Fund”) is one of the series constituting the Dodge & Cox Funds (the “Trust” or the “Funds”). The Trust is organized as a Delaware statutory trust and is registered under the Investment Company Act of 1940, as amended, as a diversified, open-end management investment company. The Fund commenced operations on June 26, 1931, and seeks regular income, conservation of principal and an opportunity for long-term growth of principal and income. Risk considerations and investment strategies of the Fund are discussed in the Fund’s Prospectus.
The financial statements have been prepared in conformity with accounting principles generally accepted in the United States of America, which require the use of estimates and assumptions by management. Actual results may differ from those estimates. Significant accounting policies are as follows:
Security valuation The Fund’s net assets are valued as of the close of trading on the New York Stock Exchange (NYSE), generally 4:00 p.m. Eastern Time, each day that the NYSE is open for business. Stocks are valued at the official quoted close price or the last sale of the day at the close of the NYSE or, if not available, at the mean between the exchange-listed bid and ask prices. A security that is listed or traded on more than one exchange is valued at the quotation on the exchange determined to be the primary market for such security. Fixed income securities with original maturities of one year or more are priced on the basis of valuations furnished by pricing services which utilize both dealer-supplied valuations and pricing models. Under certain circumstances, fixed income securities that are not valued by pricing services are temporarily valued by the investment manager utilizing both dealer-supplied valuations and pricing models. Valuations of fixed income securities take into account appropriate factors such as institutional-size trading markets in similar groups of securities, yield, quality, coupon rate, maturity, type of issue, trading characteristics and other market data and do not rely exclusively upon exchange or over-the-counter listed prices. Security values are not discounted based on
the size of the Fund’s position. Securities for which market quotations are not readily available are valued at fair value as determined in good faith by or at the direction of the Board of Trustees. Futures contracts are valued daily at the closing settlement price on the exchange. Short-term securities are valued at amortized cost which approximates current value. All securities held by the Fund are denominated in U.S. dollars.
Security transactions, investment income, expenses, and distributions Security transactions are recorded on the trade date. Realized gains and losses on securities sold are determined on the basis of identified cost.
Dividend income and corporate action transactions are recorded on the ex-dividend date, except for certain dividends or corporate actions from foreign securities where the ex-dividend date may have passed, which are recorded as soon as the Fund is informed of the ex-dividend date. Withholding taxes on foreign dividends have been provided for in accordance with the Fund’s understanding of the applicable country’s tax rules and rates. Non-cash dividends included in dividend income, if any, are recorded at the fair market value of the securities received. Distributions received in excess of income are recorded as a reduction of cost of investments and/or realized gain.
Interest income is recorded on the accrual basis. Interest income includes coupon interest, amortization of premium and accretion of discount on debt securities, and gain/loss on paydowns of mortgage-backed securities. The ability of the issuers of the debt securities held by the Fund to meet their obligations may be affected by economic developments in a specific industry, state or region. Debt obligations may be placed on non-accrual status and related interest income may be reduced by ceasing current accruals and writing off interest receivables when the collection of all or a portion of interest has become doubtful. A debt obligation is removed from non-accrual status when the issuer resumes interest payments or when collectibility of interest is reasonably assured.
DODGE & COX BALANCED FUND §PAGE 12
NOTES TO FINANCIAL STATEMENTS (unaudited)
Expenses are recorded on the accrual basis. Most expenses of the Trust can be directly attributed to a specific series. Expenses which cannot be directly attributed are allocated among the Funds in the Trust.
Distributions to shareholders are recorded on the ex-dividend date.
Repurchase agreements The Fund may enter into repurchase agreements, secured by U.S. government or agency securities, which involve the purchase of securities from a counterparty with a simultaneous commitment to resell the securities at an agreed-upon date and price. It is the Fund’s policy that its custodian take possession of the underlying collateral securities, the fair value of which exceeds the principal amount of the repurchase transaction, including accrued interest, at all times. In the event of default by the counterparty, the Fund has the contractual right to liquidate the collateral securities and to apply the proceeds in satisfaction of the obligation.
Forward Commitments The Fund may enter into “TBA” (to be announced) commitments to purchase or sell mortgage-related securities in which payment and delivery take place after the customary settlement period. Purchasing securities on a delayed-delivery basis involves risk of loss if the value of the security to be purchased declines prior to the settlement date. The Fund may dispose of a TBA purchase prior to the settlement date. While a contract is outstanding, the Fund must segregate an equivalent value of liquid assets. The Fund did not have any forward commitments at June 30, 2010.
Treasury Futures Contracts The Fund may enter into Treasury futures contracts to assist with the management of the portfolio’s interest rate exposure or for other purposes.
Futures contracts involve an obligation to purchase or sell (depending on whether the Fund has entered a long or short futures contract, respectively) an asset at a future date, at a price set at the time of the contract. Upon entering into a futures contract, the Fund is required to deposit an amount of cash or liquid assets (referred to as initial margin) in a segregated account with the clearing broker. Subsequent payments (referred to as variation margin) to and from the clearing broker are made on a
daily basis based on changes in the market value of futures contracts. Futures are traded publicly and their market value changes daily. Changes in the market value of open futures contracts are recorded as unrealized appreciation or depreciation in the Statement of Operations. Realized gains and losses on futures contracts are recorded in the Statement of Operations at the closing or expiration of futures contracts.
Investments in futures contracts may include certain risks, which may be different from, and potentially greater than, those of the underlying securities. To the extent the Fund uses Treasury futures, it is exposed to additional volatility and potential losses resulting from leverage.
The Fund began trading in short Treasury futures contracts in May 2010 and the current notional balance presented in the Portfolio of Investments is representative of the notional values from May 2010 through period end.
NOTE 2—VALUATION MEASUREMENTS
Various inputs are used in determining the value of the Fund’s investments. These inputs are summarized in the three broad levels listed below.
| § | | Level 1: Quoted prices in active markets for identical securities |
| § | | Level 2: Other significant observable inputs (including quoted prices for similar securities, market indices, interest rates, credit risk, etc.) |
| § | | Level 3: Significant unobservable inputs (including the Fund’s own assumptions in determining the fair value of investments) |
The inputs or methodology used for valuing securities are not necessarily an indication of the risk associated with investing in those securities.
PAGE 13 § DODGE & COX BALANCED FUND
NOTES TO FINANCIAL STATEMENTS (unaudited)
The following is a summary of the inputs used to value the Fund’s holdings as of June 30, 2010:
| | | | | | | |
| Classification(a) | | LEVEL 1
(Quoted Prices) | | | LEVEL 2
(Other Significant
Observable
Inputs) |
Securities | | | | | | | |
Common Stocks(b) | | $ | 9,724,952,416 | | | $ | — |
Fixed Income Securities | | | | | | | |
U.S. Treasury | | | 67,488,759 | | | | — |
Government Related | | | — | | | | 207,582,632 |
Mortgage-Related Securities | | | — | | | | 1,631,444,056 |
Corporate | | | — | | | | 1,970,193,070 |
Money Market Fund | | | 41,781,750 | | | | — |
Repurchase Agreement | | | — | | | | 102,723,000 |
| | | | | | | |
Total Securities | | $ | 9,834,222,925 | | | $ | 3,911,942,758 |
| | | | | | | |
Other Financial Instruments | | | | |
Futures Contracts | | | (3,963,517 | )(c) | | | — |
| | | | | | | |
| | | | | | | | |
| (a) | At June 30, 2010 the Fund held no securities that were considered to be “Level 3” securities (those valued using significant unobservable inputs). |
| (b) | All common stocks held in the Fund are Level 1 securities. For a detailed break-out of common stocks by major industry classification, please refer to the Portfolio of Investments. |
| (c) | Represents unrealized depreciation on futures contracts. |
NOTE 3—RELATED PARTY TRANSACTIONS
Management fees Under a written agreement approved by a unanimous vote of the Board of Trustees, the Fund pays an annual management fee of 0.50% of the Fund’s average daily net assets to Dodge & Cox, investment manager of the Fund.
Fund officers and trustees All officers and three of the trustees of the Trust are officers or employees of Dodge & Cox. The Trust pays a fee only to those trustees who are not affiliated with Dodge & Cox.
Indemnification Under the Trust’s organizational documents, its officers and trustees are indemnified against certain liabilities arising out of the performance of their duties to the Trust. In addition, in the normal course of business the Trust enters into contracts that provide general indemnities to other parties. The Trust’s maximum exposure under these arrangements is unknown as this would involve future claims that may be made against the Trust that have not yet occurred.
NOTE 4—INCOME TAX INFORMATION AND DISTRIBUTIONS TO SHAREHOLDERS
A provision for federal income taxes is not required since the Fund intends to continue to qualify as a regulated investment company under Subchapter M of the Internal Revenue Code and distribute all of its taxable income to shareholders. Distributions are determined in accordance with income tax regulations, which may differ from net investment income and realized gains for financial reporting purposes. Financial reporting records are adjusted for permanent book/tax differences to reflect tax character.
Book/tax differences are primarily due to differing treatments of wash sales, in-kind redemptions, net short-term realized gain/(loss), and paydown loss. During the period, the Fund recognized net realized gain of $94,066,200 from the delivery of appreciated securities in an in-kind redemption transaction. For federal income tax purposes, this gain is not recognized as taxable income to the Fund and therefore will not be distributed to shareholders. At June 30, 2010, the cost of investments for federal income tax purposes was $14,494,261,988.
DODGE & COX BALANCED FUND §PAGE 14
NOTES TO FINANCIAL STATEMENTS (unaudited)
Distributions during the six months ended June 30, 2010 and for the year ended December 31, 2009 were characterized as follows for federal income tax purposes:
| | | | |
| | | Six Months Ended
June 30, 2010 | | Year Ended
December 31, 2009 |
Ordinary income | | $184,210,645 | | $390,735,227 |
| | ($0.800 per share) | | ($1.510 per share) |
| | |
Long-term capital gain | | — | | — |
At June 30, 2010, the tax basis components of distributable earnings were as follows:
| | | | |
Unrealized appreciation | | $ | 1,436,306,303 | |
Unrealized depreciation | | | (2,184,402,608 | ) |
| | | | |
Net unrealized depreciation | | | (748,096,305 | ) |
Undistributed ordinary income | | | 7,036,712 | |
Accumulated capital loss (a) | | | (101,547,775 | ) |
Capital Loss carryforward(b) | | | (2,310,823,838 | ) |
| (a) | Represents capital loss realized for tax purposes during the period from January 1, 2010 to June 30, 2010. |
| (b) | Represents accumulated capital loss as of December 31, 2009 which may be carried forward to offset future capital gains. If not utilized, the capital loss carryforward expires as follows: |
| | | |
Expiring in 2016 | | $ | 32,015,139 |
Expiring in 2017 | | | 2,278,808,699 |
| | | |
| | $ | 2,310,823,838 |
| | | |
Fund management has reviewed the tax positions for open periods (for Federal purposes, three years from the date of filing and for State purposes, four years from the date of filing) as applicable to the Fund, and has determined that no provision for income tax is required in the Fund’s financial statements.
NOTE 5—LOAN FACILITIES
Pursuant to an exemptive order issued by the Securities and Exchange Commission (SEC), the Fund may participate in an interfund lending facility (Facility). The Facility allows the Fund to borrow money from or loan money to the Funds. Loans under the Facility are made for temporary or emergency purposes, such as to fund shareholder redemption requests. Interest on borrowings is the average of the current repurchase agreement rate and the bank loan rate. There was no activity in the Facility during the period.
The Fund also participates with the Funds in a $200 million committed credit facility (Line of Credit) with State Street Bank and Trust Company, to be utilized for temporary or emergency purposes to fund shareholder redemptions or for other short-term liquidity purposes. The Fund pays a commitment fee on its pro-rata portion of the line of credit, which amounted to $19,296 and is reflected as a Miscellaneous Expense in the Statement of Operations. Interest on borrowings is charged at the prevailing rate. There were no borrowings on the Line of Credit during the period.
NOTE 6—PURCHASES AND SALES OF INVESTMENTS
For the six months ended June 30, 2010, purchases and sales of securities, other than short-term securities and U.S. government securities, aggregated $881,628,736 and $1,540,826,731, respectively. For the year ended June 30, 2010, purchases and sales of U.S. government securities aggregated $454,951,398 and $529,380,251, respectively.
NOTE 7—SUBSEQUENT EVENTS
Fund management has determined that no material events or transactions occurred subsequent to June 30, 2010 and through the date of the Fund’s financial statements issuance, which require additional disclosure in the Fund’s financial statements.
PAGE 15 § DODGE & COX BALANCED FUND
FINANCIAL HIGHLIGHTS
| | | | | | | | | | | | | | | | | | |
SELECTED DATA AND RATIOS (for a share outstanding throughout each period) | | Six Months
Ended June 30, | | | Year Ended December 31, | |
| | | 2010(a) | | | 2009 | | | 2008 | | | 2007 | | | 2006 | | | 2005 | |
| | | | | | |
Net asset value, beginning of period | | $64.03 | | | $51.26 | | | $81.00 | | | $87.08 | | | $81.34 | | | $79.35 | |
Income from investment operations: | | | | | | | | | | | | | | | | | | |
Net investment income | | 0.74 | | | 1.46 | | | 1.99 | | | 2.35 | | | 2.21 | | | 1.84 | |
Net realized and unrealized gain/(loss) | | (3.60) | | | 12.82 | | | (28.44 | ) | | (0.78 | ) | | 8.93 | | | 3.31 | |
| | | | | | |
Total from investment operations | | (2.86) | | | 14.28 | | | (26.45 | ) | | 1.57 | | | 11.14 | | | 5.15 | |
| | | | | | |
Distributions to shareholders from: | | | | | | | | | | | | | | | | | | |
Net investment income | | (0.80) | | | (1.51 | ) | | (1.95 | ) | | (2.37 | ) | | (2.20 | ) | | (1.84 | ) |
Net realized gain | | — | | | — | | | (1.34 | ) | | (5.28 | ) | | (3.20 | ) | | (1.32 | ) |
| | | | | | |
Total distributions | | (0.80) | | | (1.51 | ) | | (3.29 | ) | | (7.65 | ) | | (5.40 | ) | | (3.16 | ) |
| | | | | | |
Net asset value, end of period | | $60.37 | | | $64.03 | | | $51.26 | | | $81.00 | | | $87.08 | | | $81.34 | |
| | | | | | |
Total return | | (4.54 | )% | | 28.37 | % | | (33.57 | )% | | 1.74 | % | | 13.84 | % | | 6.59 | % |
Ratios/supplemental data: | | | | | | | | | | | | | | | | | | |
Net assets, end of period (millions) | | $13,792 | | | $15,448 | | | $14,676 | | | $26,932 | | | $27,458 | | | $23,611 | |
Ratio of expenses to average net assets | | 0.53 | %(b) | | 0.53 | % | | 0.53 | % | | 0.53 | % | | 0.52 | % | | 0.53 | % |
Ratio of net investment income to average net assets | | 2.27 | %(b) | | 2.61 | % | | 2.85 | % | | 2.59 | % | | 2.52 | % | | 2.15 | % |
Portfolio turnover rate | | 8 | % | | 19 | % | | 27 | % | | 27 | % | | 20 | % | | 18 | % |
See accompanying Notes to Financial Statements
DODGE & COX BALANCED FUND §PAGE 16
FUND HOLDINGS
The Fund provides a complete list of its holdings four times each fiscal year, as of the end of each quarter. The lists appear in the Fund’s First Quarter, Semi-Annual, Third Quarter and Annual Reports to shareholders. The Fund files the lists with the SEC on Form N-CSR (second and fourth quarters) and Form N-Q (first and third quarters). Shareholders may view the Fund’s Forms N-CSR and N-Q on the SEC’s website at www.sec.gov. Forms N-CSR and N-Q may also be reviewed and copied at the SEC’s Public Reference Room in Washington, DC. Information regarding the operations of the Public Reference Room may be obtained by 1-202-942-8090 (direct) or 1-800-732-0330 (general SEC number). A complete list of the Fund’s quarter-end holdings is also available at www.dodgeandcox.com on or about 15 days following each quarter end and remains available on the web site until the list is updated in the subsequent quarter.
PROXY VOTING
For a free copy of the Fund’s proxy voting policies and procedures, please call 1-800-621-3979, visit the Fund’s web site at www.dodgeandcox.com or visit the SEC’s web site at www.sec.gov. Information regarding how the Fund voted proxies relating to portfolio securities during the most recent 12-month period ending June 30 is also available at www.dodgeandcox.com or at www.sec.gov.
HOUSEHOLD MAILINGS
The Fund routinely mails shareholder reports and summary prospectuses to shareholders and, on occasion, proxy statements. In order to reduce the volume of mail, when possible, only one copy of these documents will be sent to shareholders who are part of the same family and share the same residential address.
If you have a direct account with the Funds and you do not want the mailing of shareholder reports and summary prospectuses combined with other members in your household, contact the Funds at 1-800-621-3979. Your request will be implemented within 30 days.
PAGE 17 § DODGE & COX BALANCED FUND
THIS PAGE INTENTIONALLY LEFT BLANK
DODGE & COX BALANCED FUND §PAGE 18
DODGE & COX FUNDS—EXECUTIVE OFFICER & TRUSTEE INFORMATION
| | | | | | |
Name (Age) and
Address* | | Position with Trust
(Year of Election or
Appointment) | | Principal Occupation During Past 5 Years | | Other Directorships Held by Trustees |
| INTERESTED TRUSTEES & OFFICERS |
John A. Gunn (66) | | Chairman and Trustee
(Trustee since 1985) | | Chairman (since 2007), Chief Executive Officer (2005-2010), and Director of Dodge & Cox, Portfolio Manager and member of Investment Policy Committee (IPC), Global Investment Policy Committee (GIPC) (since 2008), and International Investment Policy Committee (IIPC) | | — |
| Kenneth E. Olivier (58) | | President and Trustee
(Trustee since 2005) | | Chief Executive Officer (since 2010), President (since 2005), and Director of Dodge & Cox, Portfolio Manager, and member of IPC | | — |
| Dana M. Emery (48) | | Senior Vice President and Trustee (Trustee since 1993) | | Executive Vice President (since 2005) and Director of Dodge & Cox, Director of Fixed Income, Portfolio Manager, and member of Fixed Income Investment Policy Committee (FIIPC) | | — |
Charles F. Pohl (52) | | Senior Vice President (Officer since 2004) | | Senior Vice President and Director of Dodge & Cox, Chief Investment Officer (since 2007), Director of Credit Research, Portfolio Manager, Investment Analyst, and member of IPC, GIPC (since 2008), IIPC (since 2007), and FIIPC | | — |
| Diana S. Strandberg (50) | | Senior Vice President
(Officer since 2005) | | Vice President of Dodge & Cox, Director of International Equity (since 2009), Portfolio Manager, and member of IPC, GIPC (since 2008), and IIPC | | — |
| David H. Longhurst (53) | | Treasurer (Officer since 2006) | | Vice President (since 2008) and Assistant Treasurer of Dodge & Cox (since 2007); Fund Administrative and Accounting Senior Manager (2004-2007) | | — |
| Thomas M. Mistele (56) | | Secretary
(Officer since 2000) | | Chief Operating Officer, Director (since 2005), Secretary, and General Counsel of Dodge & Cox | | — |
| Katherine M. Primas (35) | | Chief Compliance Officer
(Officer since 2010) | | Chief Compliance Officer of Dodge & Cox (since 2008) and Associate Chief Compliance Officer of Dodge & Cox (2004-2008) | | — |
| INDEPENDENT TRUSTEES |
| William F. Ausfahl (70) | | Trustee (Since 2002) | | CFO, The Clorox Co. (1982-1997); Director, The Clorox Co. (1984-1997) | | — |
| L. Dale Crandall (68) | | Trustee (Since 1999) | | President, Kaiser Foundation Health Plan, Inc. and Kaiser Foundation Hospitals (2000-2002); Senior Vice President—Finance and Administration & CFO, Kaiser Foundation Health Plan, Inc. and Kaiser Foundation Hospitals (1998-2000) | | Director, Ansell Limited (medical equipment and supplies) (2002-present); Director, Coventry Health Care, Inc. (managed health care) (2004-present); Director, Metavante Technologies, Inc. (software) (2007 to 2009); Bridgeport Education, Inc. (education services) (2008 to present) |
| Thomas A. Larsen (60) | | Trustee (Since 2002) | | Director in Howard, Rice, Nemerovski, Canady, Falk & Rabkin (law firm) | | — |
John B. Taylor (63) | | Trustee (Since 2005) | | Professor of Economics, Stanford University; Senior Fellow, Hoover Institution; Under Secretary for International Affairs, United States Treasury (2001-2005) | | — |
Will C. Wood (70) | | Trustee (Since 1992) | | Principal, Kentwood Associates, Financial Advisers | | Director, Banco Latinoamericano de Exportaciones S.A. (Latin American foreign trade bank) (1999-Present) |
| * | | The address for each Officer and Trustee is 555 California Street, 40th Floor, San Francisco, California 94104. Each Officer and Trustee oversees all five series in the Dodge & Cox Funds complex and serves for an indefinite term. |
Additional information about the Trust’s Trustees and Officers is available in the Trust’s Statement of Additional Information (SAI). You can get a free copy of the SAI by visiting the Funds’ website at www.dodgeandcox.com or calling 1-800-621-3979.
PAGE 19 § DODGE & COX BALANCED FUND
| | | | |
| | | | |
www.dodgeandcox.com
For Fund literature, transactions, and account
information, please visit the Funds’ web site.
or write or call:
DODGE & COX FUNDS
c/o Boston Financial Data Services
P.O. Box 8422
Boston, Massachusetts 02266-8422
(800) 621-3979
INVESTMENT MANAGER
Dodge & Cox
555 California Street, 40th Floor
San Francisco, California 94104
(415) 981-1710
This report is submitted for the general information of the shareholders of the Fund. The report is not authorized for distribution to prospective investors in the Fund unless it is accompanied by a current prospectus.
This report reflects our views, opinions, and portfolio holdings as of June 30, 2010, the end of the reporting period. Any such views are subject to change at any time based upon market or other conditions and Dodge & Cox disclaims any responsibility to update such views. These views may not be relied on as investment advice and, because investment decisions for a Dodge & Cox Fund are based on numerous factors, may not be relied on as an indication of trading intent on behalf of any Dodge & Cox Fund.
06/10 IF SAR Printed on recycled paper
Semi-Annual Report
June 30, 2010
Income Fund
ESTABLISHED 1989
TICKER: DODIX
TO OUR SHAREHOLDERS
The Dodge & Cox Income Fund had a total return of 2.0% for the second quarter of 2010, compared to a total return of 3.5% for the Barclays Capital U.S. Aggregate Bond Index (BCAG). For the first six months of 2010 the Fund had a total return of 4.3%, compared to 5.3% for the BCAG. Please see the Fund’s longer-term performance results on page three. At quarter end, the Fund had net assets of $21.9 billion with a cash position of 1.9%.
MARKET COMMENTARY
Volatility spiked in U.S. bond markets during the first six months of 2010, fueled by the uncertain impact of financial reform legislation and the European fiscal crisis. The U.S. economy continued its recovery, though mixed economic data in the second quarter cast some doubt on its momentum. Specifically, the U.S. manufacturing and service sectors continued to expand and interest rates remained low, but reports of weak U.S. housing market activity, tepid labor market growth, and slower consumer spending reduced investor expectations for both U.S. GDP growth and inflation.
As a result, U.S. Treasury rates declined significantly over the first half of 2010 and the sector 1 returned a strong 5.9%. Other major U.S. bond market sectors likewise posted solid absolute returns. Investment-grade corporate bonds produced a 5.8% return but underperformed duration-matched Treasuries; after declining early in the year, corporate bond yield premiums rose in the second quarter amidst the more uncertain environment. Financials meaningfully underperformed Industrials and Utilities for the period. Nevertheless, corporate profitability remained strong and balance sheets continued to strengthen. Agency-guaranteed2 mortgage-backed securities (MBS) returned 4.5%, slightly outperforming similar-duration Treasuries despite the negative impact of prepayments related to the buyouts of seriously delinquent loans by Fannie Mae and Freddie Mac. Other than these buyouts, the prepayment environment was relatively benign despite mortgage rates at historic lows and MBS dollar prices at all-time highs.
INVESTMENT STRATEGY
There were no major changes to the Fund’s portfolio structure during the first half of 2010. As of June 30, the Fund featured a significant position (42.4% versus 34.1% for the BCAG) in Agency MBS and a substantial
overweight (46.1% compared to 18.2% for the BCAG) in corporate bonds, as well as a 3.5% position in taxable municipal securities (primarily Build America bonds). At the same time, the Fund maintained a very low (3.5% compared to 32.1% for the BCAG) Treasury weighting. As always, we build the Fund’s sector weightings based on our analysis of individual investment opportunities within—and between—sectors. In a volatile period for credit risk premiums, we opportunistically added to several Financials sector holdings, including Bank of America, Barclays (a new position in 2010), Citigroup, GE Capital, and JPMorgan Chase.
The topic of financial reform has garnered much attention in recent months and the Dodd-Frank Wall Street Reform and Protection Act (Dodd-Frank) was recently signed into law. As of June 30, the Fund held approximately 18% in securities within the Financials sector, including nearly 9% in banks. Our investment team has devoted considerable time seeking to understand the potential impact of this legislation on the sector and economy and, importantly, on the Fund’s holdings. It is our view that many of the new rules—specifically those relating to higher capital levels, less leverage, greater liquidity, enhanced disclosure, and limitations on certain “non-core” business activities—should have positive implications for bond investors. Certainly, some of these new requirements could result in reduced profitability for banks; but, they should also serve to increase transparency, reduce earnings volatility, and strengthen their ability to withstand a business downturn.
One element of Dodd-Frank establishes a new system for resolution (orderly wind-down) of systemically important non-bank financial companies, including bank holding companies. With the creation of this new process comes a reduced likelihood that large financial institutions would receive government support in a future financial crisis. This could lead to ratings downgrades and greater risks for unsecured creditors of such issuers, representing a potential negative for some of the Fund’s Financials holdings. However, the combination of the risk-reducing elements of the legislation, the diverse earnings streams of the Fund’s bank holdings, and the hard lessons learned by many bank management teams from the recent crisis reduce the likelihood that these institutions would get themselves into such a position.
PAGE 1 § DODGE & COX INCOME FUND
During the period the Fund’s MBS weighting remained relatively consistent, invested primarily in three areas, all Agency-guaranteed and with coupons of 5.5% or greater: 1) MBS with 15-year terms, 2) seasoned MBS with 30-year terms, and 3) MBS with 30-year terms pre-selected for particular borrower or loan characteristics. We believe these MBS can continue to benefit from the ongoing challenges within the real estate and mortgage finance industries. The combination of vastly reduced home equity, significantly tighter mortgage underwriting standards, reduced competition among mortgage originators, and higher fees have dampened the ability of mortgage borrowers to take advantage of generation-low mortgage rates. This has been true for all MBS, but particularly in the case of the third area of the Fund’s MBS holdings, MBS backed by loans with specific characteristics (low borrower FICO, low-to-no home equity, past delinquency, etc.). While the market has gradually incorporated some of these unique factors into valuations, we believe that these security types remain undervalued and the Fund’s MBS offer attractive relative return potential and adequate yield compensation for the risks assumed.
We continued to position the Fund defensively vis-à-vis interest rate risk, with a shorter relative duration3 (3.8 years versus 4.3 years for the BCAG). One new development in the recent quarter was our use of Treasury futures to incrementally reduce the Fund’s duration position. After a thorough investment and operational review, we concluded that Treasury futures provide a useful tool for managing interest rate exposure and Fund flows. This tool is particularly helpful in the current environment, as it allows us to maintain positions in attractive (but long-duration) corporate bond holdings while keeping the Fund’s overall interest rate risk relatively low. We reduced the Fund’s duration by 0.2 years through a short position in 10-year Treasury futures. However, a significant move lower in rates is a risk, as this position means the Fund would participate less in the price increases associated with such a move than it otherwise would.
We believe U.S. Treasury rates are likely to trend higher over the next three to five years, given the low starting point (e.g., 3-month Treasury bills under 0.2% and 10-year notes under 3.0%), the effect of unprecedented fiscal stimulus and very accommodative monetary policy, and the outsized public and private debt
extant in the United States. Importantly, we have maintained a nominal yield advantage despite the Fund’s shorter relative duration, which provides an additional defensive element in the event that interest rates rise from these low levels.
IN CLOSING
We continue to seek attractive long-term investment opportunities primarily within the higher-yielding corporate, government-related, and Agency MBS sectors of the bond market. As always, we utilize our in-depth fundamental research to identify attractive investment opportunities that provide ample yield compensation for the risks assumed. By focusing on these sectors (thereby maintaining a nominal yield advantage of 0.9%) and positioning the Fund defensively vis-à-vis interest rate risk, we believe the Fund may provide reasonable total returns over longer periods of time. However, given the Fund’s low nominal yield of 3.8%, total return prospects for the intermediate term are modest, at best.
Thank you for your continued confidence in our firm. As always, we welcome your comments and questions.
For the Board of Trustees,
| | |
| | 
|
John A. Gunn, Chairman | | Dana M. Emery, Senior Vice President |
July 23, 2010
| 1 | | Sector returns as calculated and reported by Barclays Capital. |
| 2 | | The U.S. Government does not guarantee the Fund’s shares, yield, or net asset value. The guarantee does not eliminate market risk. |
| 3 | | Duration is a measure of a bond’s price sensitivity to changes in interest rates. |
Risks: The Fund invests in individual bonds whose yields and market values fluctuate, so that your investment may be worth more or less than its original cost. Bond investments are subject to interest rate risk, credit risk, and prepayment risk, all of which could have adverse effects on the value of the Fund. Please read the prospectus for specific details regarding the Fund’s risk profile.
DODGE & COX INCOME FUND §PAGE 2
SEMI-ANNUAL PERFORMANCE REVIEW
The Fund underperformed the BCAG by 1.0 percentage point for the six months ended June 30, 2010, primarily the result of the strong relative performance of Treasuries versus corporates and Agency MBS. The Fund continued to have significant weightings in both corporate bonds and Agency-guaranteed MBS, and a correspondingly low Treasury sector weighting.
Key Detractors from Relative Results
| | § | | The Fund’s overweight to corporate bonds hampered relative returns given the underperformance of the sector as a whole. | |
| | § | | The Fund’s shorter relative duration positioning (achieved largely through holding very few–and very short duration–Treasuries coupled with a short position in 10-year Treasury futures), detracted from relative returns as Treasuries rallied significantly. | |
| | § | | Certain Agency-guaranteed MBS holdings, primarily premium coupon pools, underperformed similar-duration alternatives in light of the buyouts of seriously delinquent loans. | |
| | § | | Several financial sector holdings performed poorly, including SLM Corp., Bank of America, and HSBC, as well as Boston Scientific and Lafarge. | |
Key Contributors to Relative Results
| | § | | The Fund’s nominal yield advantage benefited relative returns. | |
| | § | | Many corporate bond holdings performed well, including insurers Cigna, WellPoint, and Unum Group, retailers Macy’s and Dillard’s, and AIG. | |
| | § | | The Fund’s taxable municipal holdings posted solid returns. | |
GROWTH OF $10,000 OVER 10 YEARS
FOR AN INVESTMENT MADE ON JUNE 30, 2000
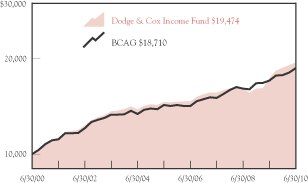
AVERAGE ANNUAL TOTAL RETURN
FOR PERIODS ENDED JUNE 30, 2010
| | | | | | | | | | | | |
| | | 1 Year | | | 5 Years | | | 10 Years | | | 20 Years | |
| | | | | | | | | | | | |
Dodge & Cox Income Fund | | 12.31 | % | | 5.94 | % | | 6.89 | % | | 7.55 | % |
Barclays Capital
Aggregate Bond Index (BCAG) | | 9.50 | | | 5.54 | | | 6.47 | | | 7.14 | |
Returns represent past performance and do not guarantee future results. Investment return and share price will fluctuate with market conditions, and investors may have a gain or loss when shares are sold. Mutual fund performance changes over time and currently may be significantly lower than stated. Performance is updated and published monthly. Visit the Fund’s web site at www.dodgeandcox.com or call 1-800-621-3979 for current performance figures.
The Fund’s total returns include the reinvestment of dividend and capital gain distributions, but have not been adjusted for any income taxes payable by shareholders on these distributions or on Fund share redemptions. The Barclays Capital Aggregate Bond Index is a widely-recognized, unmanaged index of U.S. dollar-denominated investment-grade fixed income securities. Index returns include dividends and/or interest income but, unlike Fund returns, do not reflect fees or expenses.
Barclays Capital® is a trademark of Barclays PLC.
PAGE 3 § DODGE & COX INCOME FUND
FUND EXPENSE EXAMPLE
As a Fund shareholder, you incur ongoing Fund costs, including management fees and other Fund expenses. All mutual funds have ongoing costs, sometimes referred to as operating expenses. The following example shows ongoing costs of investing in the Fund and can help you understand these costs and compare them with those of other mutual funds. The example assumes a $1,000 investment held for the six months indicated.
ACTUAL EXPENSES
The first line of the table below provides information about actual account values and expenses based on the Fund’s actual returns. You may use the information in this line, together with your account balance, to estimate the expenses that you paid over the period. Simply divide your account value by $1,000 (for example, an $8,600 account value divided by $1,000 = 8.6), then multiply the result by the number in the first line under the heading “Expenses Paid During Period” to estimate the expenses you paid on your account during this period.
HYPOTHETICAL EXAMPLE FOR COMPARISON WITH OTHER MUTUAL FUNDS
Information on the second line of the table can help you compare ongoing costs of investing in the Fund with those of other mutual funds. This information may not be used to estimate the actual ending account balance or expenses you paid during the period. The hypothetical “Ending Account Value” is based on the actual expense ratio of the Fund and an assumed 5% annual rate of return before expenses (not the Fund’s actual return). The amount under the heading “Expense Paid During the Period” shows the hypothetical expenses your account would have incurred under this scenario. You can compare this figure with the 5% hypothetical examples that appear in shareholder reports of other mutual funds.
| | | | | | | | | |
Six Months Ended June 30, 2010 | | Beginning Account Value
1/1/2010 | | Ending Account Value
6/30/2010 | | Expenses Paid
During Period* |
Based on Actual Fund Return | | $ | 1,000.00 | | $ | 1,042.80 | | $ | 2.20 |
Based on Hypothetical 5% Yearly Return | | | 1,000.00 | | | 1,022.64 | | | 2.18 |
| * | | Expenses are equal to the Fund’s annualized expense ratio of 0.43%, multiplied by the average account value over the period, multiplied by 181/365 (to reflect the one-half year period). |
The expenses shown in the table highlight ongoing costs only and do not reflect any transactional fees or account maintenance fees. While other mutual funds may charge such fees, please note that the Fund does not charge transaction fees (e.g., redemption fees, sales loads) or universal account maintenance fees (e.g., small account fees).
DODGE & COX INCOME FUND §PAGE 4
| | |
| FUND INFORMATION | | June 30, 2010 |
| | |
| GENERAL INFORMATION | | |
Net Asset Value Per Share | | $13.19 |
Total Net Assets (billions) | | $21.9 |
30-Day SEC Yield(a) | | 3.96% |
Expense Ratio | | 0.43% |
Portfolio Turnover Rate (1/1/10 to 6/30/10, unannualized) | | 14% |
Fund Inception | | 1989 |
No sales charges or distribution fees | | |
Investment Manager: Dodge & Cox, San Francisco. Managed by the Fixed Income Investment Policy Committee, whose ten members’ average tenure at Dodge & Cox is 15 years.
| | | | |
| PORTFOLIO CHARACTERISTICS | | Fund | | BCAG |
Number of Fixed Income Securities | | 588 | | 8,211 |
Effective Maturity (years)(d) | | 6.6 | | 6.5 |
Effective Duration (years)(e) | | 3.8 | | 4.3 |
| | | |
| FIVE LARGEST CORPORATE ISSUERS(b) | | Fund | |
Ford Motor Credit Co. | | 2.8 | % |
Bank of America Corp. | | 2.6 | |
Ally Financial, Inc. (GMAC) | | 2.4 | |
HCA, Inc. | | 2.1 | |
Xerox Corp. | | 2.1 | |
| | | | | | |
| CREDIT QUALITY(c) | | Fund | | | BCAG | |
U.S. Government & Government Related(d) | | 47.5 | % | | 73.9 | % |
Aaa | | 1.0 | | | 4.6 | |
Aa | | 4.5 | | | 4.2 | |
A | | 14.1 | | | 9.4 | |
Baa | | 18.3 | | | 7.9 | |
Ba | | 7.6 | | | 0.0 | |
B | | 3.0 | | | 0.0 | |
Caa | | 2.1 | | | 0.0 | |
Ca | | 0.0 | | | 0.0 | |
C | | 0.0 | | | 0.0 | |
Cash Equivalents | | 1.9 | | | 0.0 | |
ASSET ALLOCATION
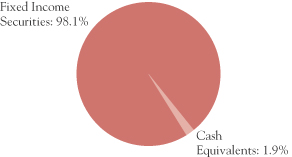
| | | | | | |
| SECTOR DIVERSIFICATION | | Fund | | | BCAG | |
U.S. Treasury & Government Related(d) | | 8.6 | % | | 39.9 | % |
Mortgage-Related Securities | | 42.4 | | | 34.1 | |
Asset-Backed Securities/CMBS(f) | | 1.0 | | | 3.3 | |
Corporate | | 46.1 | | | 18.2 | |
Non-Corporate Yankee | | 0.0 | | | 4.5 | |
Cash Equivalents | | 1.9 | | | 0.0 | |
| | | | | | |
| MATURITY DIVERSIFICATION | | Fund | | | BCAG | |
0-1 Years to Maturity | | 7.5 | % | | 0.0 | % |
1-5 | | 52.7 | | | 59.0 | |
5-10(d) | | 27.5 | | | 30.3 | |
10-15 | | 1.0 | | | 1.7 | |
15-20 | | 1.8 | | | 1.9 | |
20-25 | | 5.0 | | | 1.5 | |
25 and Over | | 4.5 | | | 5.6 | |
| (a) | SEC yield is an annualization of the Fund’s total net investment income per share for the 30-day period ended on the last day of the month. |
| (b) | The Fund’s portfolio holdings are subject to change without notice. The mention of specific securities is not a recommendation or solicitation for any person to buy, sell, or hold any particular security. |
| (c) | The Fund’s credit quality distribution is calculated using ratings from Moody’s Investor Services. If no Moody’s rating is available, the lower of the Standard & Poor’s or Fitch rating is used. The BCAG’s credit quality ratings are from Barclays Capital and reference Moody’s, Standard & Poor’s, and Fitch ratings. The credit quality of the investments in the portfolio does not apply to the stability or safety of the Fund or its shares. |
| (d) | Data as presented excludes effects of Treasury futures contracts. If the Fund’s exposure to Treasury futures contracts had been included, the effective maturity would be 0.2 years lower, and the relevant sector, credit quality, and maturity categories would be adjusted down 3.1 percentage points. |
| (e) | Data presented includes effect of Treasury futures contracts. |
| (f) | CMBS refers to commercial mortgage-backed securities, which are a component of the BCAG but not currently held by the Fund. |
PAGE 5 § DODGE & COX INCOME FUND
| | |
| PORTFOLIO OF INVESTMENTS (unaudited) | | June 30, 2010 |
| | | | | | |
| FIXED INCOME SECURITIES: 98.1% |
| | |
| | | PAR VALUE | | VALUE |
| U.S. TREASURY AND GOVERNMENT RELATED: 8.6% |
U.S. TREASURY: 3.5% |
U.S. Treasury Note | | | | | | |
2.00%, 9/30/10 | | $ | 150,000,000 | | $ | 150,667,950 |
1.25%, 11/30/10 | | | 150,000,000 | | | 150,644,550 |
0.875%, 1/31/11 | | | 150,200,000 | | | 150,739,819 |
0.875%, 2/28/11 | | | 150,000,000 | | | 150,580,050 |
0.875%, 5/31/11 | | | 150,290,000 | | | 151,006,282 |
| | | | | | |
| | | | | | 753,638,651 |
GOVERNMENT RELATED: 5.1% |
California Taxable General Obligation | | | |
5.25%, 4/1/14 | | | 35,700,000 | | | 37,270,086 |
6.20%, 3/1/19 | | | 6,435,000 | | | 6,712,348 |
6.20%, 10/1/19 | | | 20,285,000 | | | 21,205,330 |
7.50%, 4/1/34 | | | 120,335,000 | | | 128,421,512 |
5.65%, 4/1/39
(mandatory put 4/1/13) | | | 18,710,000 | | | 19,620,054 |
7.55%, 4/1/39 | | | 248,053,000 | | | 266,173,272 |
7.30%, 10/1/39 | | | 105,975,000 | | | 110,329,513 |
7.625%, 3/1/40 | | | 55,395,000 | | | 59,852,636 |
Los Angeles Unified School District Taxable General Obligation
6.758%, 7/1/34 | | | 103,660,000 | | | 113,632,092 |
Small Business Administration — 504 Program | | | |
Series 91-20K, 8.25%, 11/1/11 | | | 56,685 | | | 58,896 |
Series 92-20B, 8.10%, 2/1/12 | | | 113,467 | | | 115,840 |
Series 92-20C, 8.20%, 3/1/12 | | | 183,172 | | | 187,809 |
Series 92-20D, 8.20%, 4/1/12 | | | 46,902 | | | 48,269 |
Series 92-20G, 7.60%, 7/1/12 | | | 382,397 | | | 388,222 |
Series 92-20H, 7.40%, 8/1/12 | | | 232,193 | | | 237,382 |
Series 92-20I, 7.05%, 9/1/12 | | | 220,133 | | | 225,716 |
Series 92-20J, 7.00%, 10/1/12 | | | 322,511 | | | 331,632 |
Series 92-20K, 7.55%, 11/1/12 | | | 404,295 | | | 417,440 |
Series 92-20L, 7.45%, 12/1/12 | | | 153,392 | | | 158,791 |
Series 93-20B, 7.00%, 2/1/13 | | | 286,360 | | | 293,176 |
Series 93-20C, 6.50%, 3/1/13 | | | 1,097,787 | | | 1,126,551 |
Series 93-20D, 6.75%, 4/1/13 | | | 200,142 | | | 206,023 |
Series 93-20E, 6.55%, 5/1/13 | | | 1,208,250 | | | 1,246,227 |
Series 93-20F, 6.65%, 6/1/13 | | | 469,250 | | | 485,275 |
Series 93-20L, 6.30%, 12/1/13 | | | 673,681 | | | 697,993 |
Series 94-20A, 6.50%, 1/1/14 | | | 815,835 | | | 833,759 |
Series 94-20D, 7.70%, 4/1/14 | | | 214,679 | | | 222,370 |
Series 94-20E, 7.75%, 5/1/14 | | | 888,163 | | | 936,093 |
Series 94-20F, 7.60%, 6/1/14 | | | 429,929 | | | 448,864 |
Series 94-20G, 8.00%, 7/1/14 | | | 395,314 | | | 426,136 |
Series 94-20H, 7.95%, 8/1/14 | | | 308,351 | | | 318,719 |
Series 94-20I, 7.85%, 9/1/14 | | | 304,087 | | | 315,772 |
Series 94-20K, 8.65%, 11/1/14 | | | 322,298 | | | 333,461 |
Series 94-20L, 8.40%, 12/1/14 | | | 243,277 | | | 255,380 |
Series 95-20A, 8.50%, 1/1/15 | | | 101,163 | | | 105,050 |
Series 95-20C, 8.10%, 3/1/15 | | | 246,005 | | | 258,574 |
| | | | | | |
| | |
| | | PAR VALUE | | VALUE |
Series 97-20E, 7.30%, 5/1/17 | | $ | 567,611 | | $ | 623,474 |
Series 97-20H, 6.80%, 8/1/17 | | | 40,098 | | | 43,691 |
Series 97-20J, 6.55%, 10/1/17 | | | 872,919 | | | 951,619 |
Series 98-20B, 6.15%, 2/1/18 | | | 35,537 | | | 38,505 |
Series 98-20C, 6.35%, 3/1/18 | | | 3,825,248 | | | 4,160,490 |
Series 98-20H, 6.15%, 8/1/18 | | | 1,337,518 | | | 1,449,782 |
Series 98-20L, 5.80%, 12/1/18 | | | 930,783 | | | 1,000,702 |
Series 99-20C, 6.30%, 3/1/19 | | | 1,059,862 | | | 1,148,332 |
Series 99-20E, 6.30%, 5/1/19 | | | 22,311 | | | 24,488 |
Series 99-20G, 7.00%, 7/1/19 | | | 2,452,714 | | | 2,682,402 |
Series 99-20I, 7.30%, 9/1/19 | | | 662,111 | | | 728,059 |
Series 00-20G, 7.39%, 7/1/20 | | | 36,206 | | | 39,839 |
Series 01-20G, 6.625%, 7/1/21 | | | 6,753,197 | | | 7,367,814 |
Series 01-20L, 5.78%, 12/1/21 | | | 16,753,922 | | | 18,237,770 |
Series 02-20A, 6.14%, 1/1/22 | | | 119,974 | | | 130,228 |
Series 02-20L, 5.10%, 12/1/22 | | | 4,549,981 | | | 4,859,322 |
Series 04-20L, 4.87%, 12/1/24 | | | 5,235,920 | | | 5,677,963 |
Series 05-20B, 4.625%, 2/1/25 | | | 7,475,133 | | | 7,933,978 |
Series 05-20E, 4.84%, 5/1/25 | | | 14,408,684 | | | 15,394,228 |
Series 05-20G, 4.75%, 7/1/25 | | | 13,838,527 | | | 14,806,459 |
Series 05-20H, 5.11%, 8/1/25 | | | 167,723 | | | 180,822 |
Series 05-20I, 4.76%, 9/1/25 | | | 14,679,426 | | | 15,666,149 |
Series 06-20A, 5.21%, 1/1/26 | | | 15,884,789 | | | 17,055,919 |
Series 06-20B, 5.35%, 2/1/26 | | | 4,781,369 | | | 5,200,164 |
Series 06-20C, 5.57%, 3/1/26 | | | 22,624,772 | | | 24,877,320 |
Series 06-20G, 6.07%, 7/1/26 | | | 40,171,744 | | | 44,413,880 |
Series 06-20J, 5.37%, 10/1/26 | | | 13,365,866 | | | 14,589,830 |
Series 06-20L, 5.12%, 12/1/26 | | | 10,167,387 | | | 11,016,193 |
Series 07-20A, 5.32%, 1/1/27 | | | 21,652,376 | | | 23,628,034 |
Series 07-20C, 5.23%, 3/1/27 | | | 33,356,644 | | | 36,193,437 |
Series 07-20D, 5.32%, 4/1/27 | | | 33,911,468 | | | 37,043,874 |
Series 07-20G, 5.82%, 7/1/27 | | | 24,097,819 | | | 26,765,225 |
| | | | | | |
| | | | | | 1,117,826,255 |
| | | | | | |
| | | | | | 1,871,464,906 |
| MORTGAGE-RELATED SECURITIES: 42.4% |
FEDERAL AGENCY CMO & REMIC: 1.7% |
Dept. of Veterans Affairs | | | | | | |
Trust 1995-2D 4A, 9.293%, 5/15/25 | | | 284,613 | | | 349,173 |
Trust 1997-2Z, 7.50%, 6/15/27 | | | 21,654,606 | | | 25,166,442 |
Trust 1998-1 1A, 8.184%, 3/15/28 | | | 738,303 | | | 822,054 |
Fannie Mae | | | | | | |
Trust 1998-58 PX, 6.50%, 9/25/28 | | | 1,696,851 | | | 1,875,974 |
Trust 1998-58 PC, 6.50%, 10/25/28 | | | 9,685,174 | | | 10,686,883 |
Trust 2001 T-5 A2, 7.00%, 2/19/30 | | | 87,397 | | | 98,102 |
Trust 2001-69 PQ, 6.00%, 12/25/31 | | | 13,386,944 | | | 14,709,849 |
Trust 2002-33 A1, 7.00%, 6/25/32 | | | 4,185,182 | | | 4,685,278 |
Trust 2008-24 GD, 6.50%, 3/25/37 | | | 20,482,613 | | | 22,226,835 |
Trust 2001-T3 A1, 7.50%, 11/25/40 | | | 159,043 | | | 181,428 |
Trust 2001-T7 A1, 7.50%, 2/25/41 | | | 47,887 | | | 54,674 |
Trust 2001-T4 A1, 7.50%, 7/25/41 | | | 3,509,472 | | | 4,082,365 |
Trust 2001-T10 A1, 7.00%, 12/25/41 | | | 5,624,746 | | | 6,296,859 |
Trust 2002-T12 A3, 7.50%, 5/25/42 | | | 85,448 | | | 98,414 |
| | |
| See accompanying Notes to Financial Statements | | DODGE & COX INCOME FUND §PAGE 6 |
| | |
| PORTFOLIO OF INVESTMENTS (unaudited) | | June 30, 2010 |
| | | | | | |
| FIXED INCOME SECURITIES (continued) |
| | |
| | | PAR VALUE | | VALUE |
Trust 2002-90 A1, 6.50%, 6/25/42 | | $ | 7,515,646 | | $ | 8,324,752 |
Trust 2002-W6 2A1, 7.00%, 6/25/42 | | | 5,975,073 | | | 6,748,799 |
Trust 2002-W8 A2, 7.00%, 6/25/42 | | | 3,151,653 | | | 3,607,043 |
Trust 2003-W2 1A2, 7.00%, 7/25/42 | | | 18,999,289 | | | 21,671,824 |
Trust 2003-W4 3A, 7.00%, 10/25/42 | | | 5,888,182 | | | 6,768,420 |
Trust 2003-07 A1, 6.50%, 12/25/42 | | | 7,505,254 | | | 8,313,241 |
Trust 2003-W1 1A1, 6.50%, 12/25/42 | | | 12,009,683 | | | 13,302,600 |
Trust 2003-W1 2A, 7.50%, 12/25/42 | | | 5,492,591 | | | 6,375,482 |
Trust 2004-T1 1A2, 6.50%, 1/25/44 | | | 117,141 | | | 132,388 |
Trust 2004-W2 5A, 7.50%, 3/25/44 | | | 21,334,666 | | | 24,337,354 |
Trust 2004-W8 3A, 7.50%, 6/25/44 | | | 13,728,654 | | | 15,578,483 |
Trust 2005-W1 1A3, 7.00%, 10/25/44 | | | 13,581,081 | | | 15,136,009 |
Trust 2001-79 BA, 7.00%, 3/25/45 | | | 1,611,335 | | | 1,803,876 |
Trust 2006-W1 1A1, 6.50%, 12/25/45 | | | 1,669,396 | | | 1,849,117 |
Trust 2006-W1 1A2, 7.00%, 12/25/45 | | | 11,278,990 | | | 12,570,347 |
Trust 2006-W1 1A3, 7.50%, 12/25/45 | | | 176,937 | | | 201,840 |
Trust 2006-W1 1A4, 8.00%, 12/25/45 | | | 12,819,557 | | | 14,447,540 |
Trust 2007-W10 1A, 6.167%, 8/25/47 | | | 67,534,686 | | | 73,648,682 |
Trust 2007-W10 2A, 6.153%, 8/25/47 | | | 18,509,344 | | | 20,597,429 |
Freddie Mac | | | | | | |
Series 2632 NH, 3.50%, 6/15/13 | | | 128,928 | | | 130,247 |
Series 3312 AB, 6.50%, 6/15/32 | | | 19,110,231 | | | 20,742,862 |
Series T-48 1A, 6.824%, 7/25/33 | | | 5,460,968 | | | 6,124,355 |
| | | | | | |
| | | | | | 373,747,020 |
FEDERAL AGENCY MORTGAGE PASS-THROUGH: 40.7% |
Fannie Mae, 07 Year Balloon
3.50%, 7/1/10 | | | 907 | | | 909 |
Fannie Mae, 10 Year
6.00%, 11/1/16 | | | 8,403,543 | | | 9,137,018 |
Fannie Mae, 15 Year | | | | | | |
5.50%, 9/1/14-1/1/24 | | | 334,362,047 | | | 362,468,898 |
6.00%, 7/1/16-3/1/23 | | | 621,996,147 | | | 677,711,980 |
6.50%, 11/1/12-12/1/19 | | | 86,366,372 | | | 94,010,749 |
7.00%, 12/1/10-11/1/17 | | | 159,326 | | | 170,852 |
7.50%, 11/1/14-8/1/17 | | | 7,571,718 | | | 8,264,086 |
8.00%, 2/1/13 | | | 2,872 | | | 3,038 |
Fannie Mae, 20 Year | | | | | | |
6.00%, 2/1/28 | | | 35,225,647 | | | 38,439,566 |
6.50%, 4/1/19-10/1/24 | | | 33,904,540 | | | 37,493,630 |
Fannie Mae, 30 Year | | | | | | |
5.50%, 2/1/33-8/1/37 | | | 1,054,551,019 | | | 1,137,992,370 |
6.00%, 11/1/28-9/14/40(g) | | | 2,384,195,807 | | | 2,597,528,379 |
6.50%, 12/1/32-12/1/38 | | | 900,439,849 | | | 987,367,103 |
7.00%, 4/1/32-12/1/37 | | | 717,784,744 | | | 798,195,887 |
8.00%, 11/1/11-1/1/12 | | | 42,368 | | | 44,046 |
Fannie Mae, Hybrid ARM | | | | | | |
2.238%, 4/1/35 | | | 14,211,458 | | | 14,715,769 |
2.498%, 9/1/34 | | | 9,376,206 | | | 9,670,354 |
2.629%, 6/1/35 | | | 5,270,004 | | | 5,455,021 |
2.638%, 8/1/34 | | | 2,536,181 | | | 2,628,928 |
2.798%, 10/1/34 | | | 12,708,252 | | | 13,022,981 |
2.804%, 7/1/35 | | | 6,920,026 | | | 7,167,419 |
| | | | | | |
| | |
| | | PAR VALUE | | VALUE |
3.021%, 12/1/36 | | $ | 12,568,294 | | $ | 13,121,932 |
3.235%, 11/1/36 | | | 9,730,824 | | | 10,088,600 |
3.385%, 7/1/35 | | | 9,409,175 | | | 9,746,989 |
3.517%, 10/1/33 | | | 8,995,388 | | | 9,306,083 |
3.63%, 7/1/35 | | | 8,437,376 | | | 8,749,628 |
3.721%, 1/1/36 | | | 15,575,680 | | | 16,196,054 |
3.914%, 7/1/34 | | | 9,143,084 | | | 9,417,212 |
4.224%, 1/1/35 | | | 10,790,637 | | | 11,199,991 |
4.464%, 8/1/34-1/1/36 | | | 26,894,713 | | | 28,054,457 |
4.49%, 1/1/35 | | | 6,692,727 | | | 6,954,629 |
4.602%, 8/1/35 | | | 11,120,008 | | | 11,554,971 |
4.704%, 10/1/35 | | | 13,948,904 | | | 14,538,321 |
4.749%, 8/1/35 | | | 30,385,259 | | | 31,642,607 |
4.853%, 12/1/35 | | | 10,845,842 | | | 11,326,302 |
4.932%, 10/1/35 | | | 9,692,882 | | | 10,090,765 |
5.007%, 9/1/35 | | | 11,259,753 | | | 11,708,281 |
5.085%, 7/1/35 | | | 10,261,943 | | | 10,864,990 |
5.196%, 1/1/37 | | | 15,674,920 | | | 16,464,697 |
5.262%, 11/1/35 | | | 8,648,745 | | | 9,023,452 |
Fannie Mae, Multifamily DUS | | | | | | |
Pool 760744, 4.75%, 3/1/15 | | | 13,590,000 | | | 14,747,616 |
Pool 555162, 4.826%, 1/1/13 | | | 14,148,884 | | | 15,074,946 |
Pool 555191, 4.856%, 2/1/13 | | | 13,980,081 | | | 14,921,405 |
Pool 555317, 4.862%, 4/1/13 | | | 27,057 | | | 28,914 |
Pool 555806, 5.145%, 10/1/13 | | | 90,217 | | | 97,584 |
Pool 545892, 5.235%, 10/1/12 | | | 41,871,171 | | | 44,643,956 |
Pool 462084, 5.275%, 11/1/15 | | | 59,787 | | | 65,764 |
Pool 888559, 5.424%, 6/1/17 | | | 36,272,239 | | | 39,989,256 |
Pool 888381, 5.506%, 4/1/17 | | | 87,674 | | | 97,823 |
Pool 888015, 5.546%, 11/1/16 | | | 47,430,737 | | | 52,801,897 |
Pool 555172, 5.678%, 12/1/12 | | | 2,448,162 | | | 2,589,876 |
Pool 545987, 5.835%, 9/1/12 | | | 18,389,134 | | | 19,793,079 |
Pool 545685, 5.876%, 4/1/12 | | | 10,934,371 | | | 11,319,419 |
Pool 545210, 5.912%, 10/1/11 | | | 158,848 | | | 164,531 |
Pool 545258, 5.926%, 11/1/11 | | | 40,349 | | | 41,954 |
Pool 545708, 6.047%, 5/1/12 | | | 1,817,785 | | | 1,910,892 |
Pool 545547, 6.078%, 3/1/12 | | | 11,312,573 | | | 11,963,577 |
Pool 545527, 6.112%, 2/1/12 | | | 8,354,140 | | | 8,863,605 |
Pool 545209, 6.13%, 10/1/11 | | | 22,928,657 | | | 23,948,244 |
Pool 545059, 6.224%, 5/1/11 | | | 21,481,378 | | | 21,936,771 |
Pool 545179, 6.253%, 9/1/11 | | | 16,173,350 | | | 16,727,807 |
Pool 535621, 7.087%, 12/1/10 | | | 11,957 | | | 12,061 |
Freddie Mac, 30 Year
6.50%, 10/1/37 | | | 380,432 | | | 417,726 |
Freddie Mac, Hybrid ARM | | | | | | |
2.50%, 4/1/35 | | | 4,070,587 | | | 4,195,729 |
2.846%, 1/1/35 | | | 8,527,416 | | | 8,897,590 |
2.874%, 3/1/35 | | | 5,068,487 | | | 5,302,820 |
3.31%, 8/1/35 | | | 6,986,868 | | | 7,317,493 |
3.318%, 4/1/36 | | | 16,220,704 | | | 16,867,723 |
3.41%, 9/1/33 | | | 30,227,380 | | | 31,351,152 |
3.517%, 8/1/34 | | | 4,680,600 | | | 4,832,244 |
| | |
| PAGE 7 § DODGE & COX INCOME FUND | | See accompanying Notes to Financial Statements |
| | |
| PORTFOLIO OF INVESTMENTS (unaudited) | | June 30, 2010 |
| | | | | | |
| FIXED INCOME SECURITIES (continued) |
| | |
| | | PAR VALUE | | VALUE |
4.341%, 9/1/35 | | $ | 17,572,464 | | $ | 18,122,919 |
4.572%, 1/1/36 | | | 12,472,523 | | | 13,013,521 |
4.74%, 8/1/35 | | | 9,357,246 | | | 9,748,353 |
4.774%, 2/1/34-10/1/35 | | | 36,905,741 | | | 38,558,446 |
4.819%, 2/1/35 | | | 5,693,146 | | | 5,964,952 |
5.119%, 1/1/36 | | | 34,266,838 | | | 35,532,699 |
5.163%, 5/1/37 | | | 16,257,525 | | | 17,104,905 |
5.305%, 1/1/37 | | | 14,822,810 | | | 15,618,387 |
5.321%, 7/1/37 | | | 41,908,268 | | | 44,327,086 |
5.44%, 3/1/37 | | | 21,423,125 | | | 22,696,369 |
5.491%, 4/1/37 | | | 34,263,603 | | | 36,438,433 |
5.794%, 8/1/36 | | | 11,289,840 | | | 11,885,453 |
5.875%, 1/1/36 | | | 7,321,735 | | | 7,526,958 |
Freddie Mac Gold, 10 Year
6.00%, 9/1/16 | | | 3,955,930 | | | 4,301,919 |
Freddie Mac Gold, 15 Year | | | | | | |
5.50%, 11/1/13-10/1/20 | | | 81,653,842 | | | 88,508,238 |
6.00%, 4/1/13-11/1/23 | | | 199,617,569 | | | 217,196,531 |
6.50%, 2/1/11-9/1/18 | | | 29,991,572 | | | 32,560,160 |
7.00%, 12/1/11-3/1/12 | | | 118,415 | | | 120,013 |
Freddie Mac Gold, 20 Year | | | | | | |
5.50%, 11/1/23 | | | 39,540,217 | | | 42,868,891 |
6.00%, 7/1/25-12/1/27 | | | 211,071,658 | | | 230,796,902 |
6.50%, 7/1/21-10/1/26 | | | 21,894,538 | | | 24,119,345 |
Freddie Mac Gold, 30 Year | | | | | | |
5.50%, 3/1/34-7/1/35 | | | 163,510,643 | | | 176,533,161 |
6.00%, 2/1/33-6/1/38 | | | 52,685,031 | | | 57,566,749 |
6.50%, 5/1/17-10/1/38 | | | 246,723,156 | | | 270,878,044 |
7.00%, 4/1/31-11/1/38 | | | 36,541,205 | | | 40,944,996 |
7.90%, 2/17/21 | | | 1,596,194 | | | 1,795,275 |
Ginnie Mae, 30 Year | | | | | | |
7.00%, 5/15/28 | | | 1,261,380 | | | 1,423,786 |
7.50%, 9/15/17-5/15/25 | | | 4,362,596 | | | 4,917,219 |
7.80%, 6/15/20-1/15/21 | | | 1,175,042 | | | 1,326,140 |
8.00%, 9/15/20 | | | 24,591 | | | 27,006 |
| | | | | | |
| | | | | | 8,904,885,254 |
PRIVATE LABEL CMO & REMIC SECURITIES: 0.0%(f) |
GSMPS Mortgage Loan Trust(b)
Series 2004-4 1A4, 8.50%, 6/25/34 | | | 9,156,291 | | | 9,068,821 |
| | | | | | |
| | | | | | 9,287,701,095 |
| ASSET-BACKED SECURITIES: 1.0% |
STUDENT LOAN: 1.0% |
SLM Student Loan Trust | | | | | | |
Series 2008-3 A1, 0.816%, 1/25/14 | | | 6,243,416 | | | 6,257,360 |
Series 2007-8 A1, 0.546%, 7/27/15 | | | 2,334,630 | | | 2,335,180 |
Series 2006-8 A2, 0.316%, 10/25/16 | | | 7,081,973 | | | 7,076,019 |
Series 2005-2 A4, 0.396%, 4/25/17 | | | 17,717,902 | | | 17,655,682 |
Series 2007-2 A2, 0.316%, 7/25/17 | | | 130,836,138 | | | 129,738,659 |
Series 2007-3 A2, 0.326%, 10/25/17 | | | 10,000,000 | | | 9,933,408 |
Series 2006-3A 4, 0.396%, 7/25/19 | | | 56,000,000 | | | 55,646,282 |
| | | | | | |
| | | | | | 228,642,590 |
| | | | | | |
| | |
| | | PAR VALUE | | VALUE |
| CORPORATE: 46.1% |
FINANCIALS: 18.2% |
Ally Financial, Inc. | | | | | | |
6.875%, 9/15/11 | | $ | 466,022,000 | | $ | 472,429,802 |
6.875%, 8/28/12 | | | 36,995,000 | | | 37,087,487 |
8.00%, 11/1/31 | | | 31,191,000 | | | 28,773,698 |
American International Group, Inc. 8.25%, 8/15/18 | | | 79,025,000 | | | 80,012,812 |
Bank of America Corp. | | | | | | |
7.375%, 5/15/14 | | | 74,285,000 | | | 83,255,731 |
5.30%, 3/15/17 | | | 105,000,000 | | | 105,724,605 |
7.625%, 6/1/19 | | | 175,621,000 | | | 201,175,260 |
5.625%, 7/1/20 | | | 80,990,000 | | | 81,633,304 |
8.00%, 12/15/26(a) | | | 15,070,000 | | | 14,617,900 |
5.625%, 3/8/35(a) | | | 21,450,000 | | | 18,071,775 |
6.625%, 5/23/36(a) | | | 64,470,000 | | | 58,947,306 |
Barclays PLC(c) (United Kingdom) 5.125%, 1/8/20 | | | 212,730,000 | | | 211,615,486 |
Boston Properties, Inc. | | | | | | |
6.25%, 1/15/13 | | | 74,693,000 | | | 81,357,931 |
5.625%, 4/15/15 | | | 35,485,000 | | | 38,385,154 |
5.00%, 6/1/15 | | | 17,569,000 | | | 18,218,350 |
5.875%, 10/15/19 | | | 35,260,000 | | | 37,723,440 |
5.625%, 11/15/20 | | | 53,115,000 | | | 55,562,486 |
2.875%, 2/15/37 | | | 27,300,000 | | | 26,924,625 |
Capital One Financial Corp. | | | | | | |
7.375%, 5/23/14 | | | 44,855,000 | | | 51,289,719 |
6.75%, 9/15/17 | | | 167,893,000 | | | 192,294,569 |
CIGNA Corp. | | | | | | |
7.00%, 1/15/11 | | | 13,710,000 | | | 14,096,279 |
6.375%, 10/15/11 | | | 28,790,000 | | | 30,458,381 |
8.50%, 5/1/19 | | | 62,510,000 | | | 78,768,726 |
7.65%, 3/1/23 | | | 3,697,000 | | | 4,403,116 |
7.875%, 5/15/27 | | | 27,840,000 | | | 33,000,060 |
8.30%, 1/15/33 | | | 7,750,000 | | | 9,516,768 |
6.15%, 11/15/36 | | | 59,100,000 | | | 60,786,950 |
Citigroup, Inc. | | | | | | |
4.75%, 5/19/15 | | | 41,700,000 | | | 41,677,899 |
6.125%, 11/21/17 | | | 167,868,000 | | | 175,306,231 |
2.136%, 5/15/18 | | | 161,415,000 | | | 151,202,596 |
General Electric Co. | | | | | | |
5.90%, 5/13/14 | | | 29,340,000 | | | 32,385,961 |
5.50%, 1/8/20 | | | 134,105,000 | | | 141,716,129 |
Health Net, Inc.
6.375%, 6/1/17 | | | 53,275,000 | | | 49,545,750 |
HSBC Holdings PLC(c)
(United Kingdom) | | | | | | |
9.30%, 6/1/21 | | | 100,000 | | | 125,122 |
6.50%, 5/2/36 | | | 73,940,000 | | | 76,688,276 |
6.50%, 9/15/37 | | | 91,616,000 | | | 94,826,958 |
| | |
| See accompanying Notes to Financial Statements | | DODGE & COX INCOME FUND §PAGE 8 |
| | |
| PORTFOLIO OF INVESTMENTS (unaudited) | | June 30, 2010 |
| | | | | | |
| FIXED INCOME SECURITIES (continued) |
| | |
| | | PAR VALUE | | VALUE |
JPMorgan Chase & Co. | | | | | | |
4.95%, 3/25/20 | | $ | 46,340,000 | | $ | 48,158,845 |
8.75%, 9/1/30(a) | | | 38,773,000 | | | 45,503,644 |
5.875%, 3/15/35(a) | | | 16,935,000 | | | 15,420,367 |
5.85%, 8/1/35(a) | | | 22,090,000 | | | 20,036,381 |
6.80%, 10/1/37(a) | | | 28,253,000 | | | 27,924,531 |
Liberty Mutual Group, Inc.(b)
7.25%, 9/1/12 | | | 18,215,000 | | | 19,229,849 |
SLM Corp. | | | | | | |
8.45%, 6/15/18 | | | 145,954,000 | | | 134,687,957 |
8.00%, 3/25/20 | | | 86,445,000 | | | 75,914,789 |
Travelers Cos., Inc. | | | | | | |
5.00%, 3/15/13 | | | 17,118,000 | | | 18,322,268 |
5.50%, 12/1/15 | | | 14,312,000 | | | 16,079,561 |
6.25%, 6/20/16 | | | 44,420,000 | | | 51,777,018 |
5.75%, 12/15/17 | | | 36,090,000 | | | 39,490,652 |
Unum Group | | | | | | |
7.625%, 3/1/11 | | | 11,531,000 | | | 11,970,642 |
6.85%, 11/15/15(b) | | | 21,180,000 | | | 22,494,579 |
7.19%, 2/1/28 | | | 11,640,000 | | | 10,877,755 |
7.25%, 3/15/28 | | | 25,730,000 | | | 26,231,401 |
6.75%, 12/15/28 | | | 8,027,000 | | | 7,890,485 |
WellPoint, Inc. | | | | | | |
6.375%, 1/15/12 | | | 7,662,000 | | | 8,193,842 |
5.00%, 12/15/14 | | | 15,750,000 | | | 17,111,981 |
5.25%, 1/15/16 | | | 138,358,000 | | | 151,479,181 |
5.875%, 6/15/17 | | | 16,511,000 | | | 18,394,278 |
7.00%, 2/15/19 | | | 53,523,000 | | | 63,486,735 |
Wells Fargo & Co. | | | | | | |
2.114%, 5/1/13 | | | 101,630,000 | | | 103,387,183 |
6.00%, 11/15/17 | | | 80,000,000 | | | 87,173,840 |
5.625%, 12/11/17 | | | 15,000 | | | 16,398 |
5.75%, 2/1/18 | | | 36,285,000 | | | 39,751,959 |
| | | | | | |
| | | | | | 3,970,612,763 |
INDUSTRIALS: 24.7% |
AT&T, Inc.
8.00%, 11/15/31 | | | 160,190,000 | | | 206,198,650 |
BHP Billiton, Ltd.(c) (Australia)
5.50%, 4/1/14 | | | 49,875,000 | | | 55,614,216 |
Boston Scientific Corp. | | | | | | |
5.45%, 6/15/14 | | | 71,258,000 | | | 73,051,350 |
6.25%, 11/15/15 | | | 15,000,000 | | | 15,551,160 |
6.40%, 6/15/16 | | | 112,049,000 | | | 117,579,402 |
6.00%, 1/15/20 | | | 15,965,000 | | | 15,850,483 |
Comcast Corp. | | | | | | |
5.30%, 1/15/14 | | | 14,680,000 | | | 16,113,223 |
5.85%, 11/15/15 | | | 25,085,000 | | | 28,353,149 |
5.90%, 3/15/16 | | | 41,965,000 | | | 47,292,331 |
6.50%, 1/15/17 | | | 42,070,000 | | | 48,205,405 |
6.30%, 11/15/17 | | | 16,445,000 | | | 18,774,812 |
5.875%, 2/15/18 | | | 58,260,000 | | | 64,824,912 |
6.45%, 3/15/37 | | | 3,120,000 | | | 3,373,656 |
| | | | | | |
| | |
| | | PAR VALUE | | VALUE |
6.95%, 8/15/37 | | $ | 10,674,000 | | $ | 12,141,953 |
Covidien PLC(c) (Ireland)
6.00%, 10/15/17 | | | 32,790,000 | | | 38,051,647 |
Cox Communications, Inc. | | | | | | |
5.45%, 12/15/14 | | | 67,154,000 | | | 74,123,242 |
5.50%, 10/1/15 | | | 50,000 | | | 54,578 |
5.875%, 12/1/16(b) | | | 78,490,000 | | | 87,256,784 |
9.375%, 1/15/19(b) | | | 139,889,000 | | | 185,388,597 |
8.375%, 3/1/39(b) | | | 57,080,000 | | | 77,590,671 |
Dillard’s, Inc. | | | | | | |
7.85%, 10/1/12 | | | 1,900,000 | | | 1,952,250 |
7.13%, 8/1/18 | | | 24,015,000 | | | 22,574,100 |
7.75%, 7/15/26 | | | 21,666,000 | | | 18,632,760 |
7.75%, 5/15/27 | | | 13,013,000 | | | 11,028,518 |
7.00%, 12/1/28 | | | 28,950,000 | | | 23,739,000 |
Dow Chemical Co. | | | | | | |
8.55%, 5/15/19 | | | 162,636,000 | | | 199,084,842 |
7.375%, 11/1/29 | | | 49,084,000 | | | 54,340,995 |
9.40%, 5/15/39 | | | 44,190,000 | | | 61,459,010 |
Ford Motor Credit Co.(e) | | | | | | |
7.375%, 2/1/11 | | | 323,598,000 | | | 329,656,725 |
7.25%, 10/25/11 | | | 268,175,000 | | | 275,488,132 |
7.80%, 6/1/12 | | | 525,000 | | | 540,623 |
General Electric Co.
5.00%, 2/1/13 | | | 31,739,000 | | | 34,035,475 |
HCA, Inc. | | | | | | |
8.75%, 9/1/10 | | | 28,685,000 | | | 28,864,281 |
7.875%, 2/1/11 | | | 49,550,000 | | | 50,293,250 |
6.95%, 5/1/12 | | | 152,243,000 | | | 156,810,290 |
6.30%, 10/1/12 | | | 30,147,000 | | | 29,996,265 |
6.25%, 2/15/13 | | | 69,665,000 | | | 68,445,862 |
6.75%, 7/15/13 | | | 35,102,000 | | | 34,399,960 |
5.75%, 3/15/14 | | | 45,451,000 | | | 42,269,430 |
6.50%, 2/15/16 | | | 61,575,000 | | | 57,418,687 |
Hewlett-Packard Co.
6.125%, 3/1/14 | | | 116,875,000 | | | 134,266,234 |
Kraft Foods, Inc.
5.375%, 2/10/20 | | | 80,430,000 | | | 86,184,847 |
Lafarge SA(c) (France)
6.50%, 7/15/16 | | | 103,151,000 | | | 106,855,978 |
Liberty Media Corp. | | | | | | |
8.50%, 7/15/29 | | | 12,099,000 | | | 11,131,080 |
8.25%, 2/1/30 | | | 29,472,000 | | | 27,114,240 |
Macy’s, Inc. | | | | | | |
8.00%, 7/15/12 | | | 11,872,000 | | | 12,703,040 |
7.625%, 8/15/13 | | | 7,155,000 | | | 7,655,850 |
8.375%, 7/15/15 | | | 75,935,000 | | | 83,718,337 |
5.90%, 12/1/16 | | | 33,309,000 | | | 33,392,272 |
6.65%, 7/15/24 | | | 27,526,000 | | | 26,424,960 |
7.00%, 2/15/28 | | | 39,040,000 | | | 37,576,000 |
6.70%, 9/15/28 | | | 23,175,000 | | | 21,784,500 |
6.90%, 4/1/29 | | | 49,119,000 | | | 47,277,037 |
6.90%, 1/15/32 | | | 35,395,000 | | | 33,625,250 |
| | |
| PAGE 9 § DODGE & COX INCOME FUND | | See accompanying Notes to Financial Statements |
| | |
| PORTFOLIO OF INVESTMENTS (unaudited) | | June 30, 2010 |
| | | | | | |
| FIXED INCOME SECURITIES (continued) |
| | |
| | | PAR VALUE | | VALUE |
6.70%, 7/15/34 | | $ | 86,032,000 | | $ | 81,515,320 |
6.375%, 3/15/37 | | | 26,705,000 | | | 25,102,700 |
Nordstrom, Inc. | | | | | | |
6.75%, 6/1/14 | | | 44,300,000 | | | 51,479,745 |
6.25%, 1/15/18 | | | 16,835,000 | | | 19,162,304 |
6.95%, 3/15/28 | | | 12,720,000 | | | 14,537,624 |
Pfizer, Inc.
6.20%, 3/15/19 | | | 36,008,000 | | | 42,791,835 |
Reed Elsevier PLC(c) (United Kingdom) | | | | | | |
7.75%, 1/15/14 | | | 6,300,000 | | | 7,288,439 |
8.625%, 1/15/19 | | | 112,845,000 | | | 143,659,923 |
Roche Holding AG(b),(c) (Switzerland) | | | | | | |
4.50%, 3/1/12 | | | 77,425,000 | | | 81,530,538 |
6.00%, 3/1/19 | | | 18,040,000 | | | 21,014,670 |
Sprint Nextel Corp. | | | | | | |
6.00%, 12/1/16 | | | 120,865,000 | | | 108,476,337 |
6.90%, 5/1/19 | | | 26,195,000 | | | 23,706,475 |
6.875%, 11/15/28 | | | 24,335,000 | | | 20,198,050 |
Time Warner Cable, Inc. | | | | | | |
8.75%, 2/14/19 | | | 81,879,000 | | | 103,309,928 |
8.25%, 4/1/19 | | | 139,366,000 | | | 171,392,586 |
Time Warner, Inc. | | | | | | |
7.625%, 4/15/31 | | | 188,643,000 | | | 226,932,624 |
7.70%, 5/1/32 | | | 161,698,000 | | | 195,013,286 |
Wyeth | | | | | | |
5.50%, 2/1/14 | | | 110,940,000 | | | 124,623,229 |
5.50%, 2/15/16 | | | 55,525,000 | | | 63,645,642 |
5.45%, 4/1/17 | | | 63,508,000 | | | 72,530,455 |
Xerox Corp. | | | | | | |
6.875%, 8/15/11 | | | 30,880,000 | | | 32,636,671 |
8.25%, 5/15/14 | | | 36,000,000 | | | 42,197,256 |
6.40%, 3/15/16 | | | 72,481,000 | | | 81,468,064 |
7.20%, 4/1/16 | | | 25,741,000 | | | 30,002,526 |
6.75%, 2/1/17 | | | 63,929,000 | | | 71,939,943 |
6.35%, 5/15/18 | | | 109,312,000 | | | 121,930,321 |
5.625%, 12/15/19 | | | 68,622,000 | | | 73,022,111 |
| | | | | | |
| | | | | | 5,407,238,903 |
TRANSPORTATION: 3.2% |
Burlington Northern Santa Fe Corp.(e) | | | |
4.30%, 7/1/13 | | | 7,883,000 | | | 8,381,986 |
4.875%, 1/15/15 | | | 13,285,000 | | | 14,502,012 |
4.70%, 10/1/19 | | | 77,795,000 | | | 82,392,918 |
7.57%, 1/2/21 | | | 19,423,845 | | | 23,609,054 |
8.251%, 1/15/21 | | | 6,546,807 | | | 8,123,671 |
4.967%, 4/1/23 | | | 28,029 | | | 31,459 |
5.72%, 1/15/24 | | | 24,062,135 | | | 26,286,786 |
5.629%, 4/1/24 | | | 34,948,799 | | | 37,992,544 |
5.342%, 4/1/24 | | | 8,297,825 | | | 8,872,861 |
5.996%, 4/1/24 | | | 44,092,875 | | | 50,336,718 |
Consolidated Rail Corp.
6.76%, 5/25/15 | | | 90,876 | | | 98,452 |
CSX Corp. | | | | | | |
8.375%, 10/15/14 | | | 46,067 | | | 54,470 |
| | | | | | |
| | |
| | | PAR VALUE | | VALUE |
9.75%, 6/15/20 | | $ | 10,272,000 | | $ | 14,132,659 |
6.251%, 1/15/23 | | | 21,314,649 | | | 23,937,131 |
FedEx Corp. | | | | | | |
7.375%, 1/15/14 | | | 22,740,000 | | | 26,563,867 |
8.00%, 1/15/19 | | | 18,610,000 | | | 23,633,397 |
6.72%, 7/15/23 | | | 21,276,076 | | | 23,477,880 |
7.65%, 7/15/24 | | | 2,556,053 | | | 2,996,970 |
Norfolk Southern Corp. | | | | | | |
7.70%, 5/15/17 | | | 29,475,000 | | | 36,655,759 |
9.75%, 6/15/20 | | | 14,188,000 | | | 19,780,314 |
Union Pacific Corp. | | | | | | |
5.375%, 5/1/14 | | | 22,886,000 | | | 25,221,471 |
4.875%, 1/15/15 | | | 10,764,000 | | | 11,710,037 |
6.85%, 1/2/19 | | | 6,172,035 | | | 7,062,162 |
7.875%, 1/15/19 | | | 13,425,000 | | | 17,091,462 |
6.70%, 2/23/19 | | | 7,165,069 | | | 8,186,353 |
7.60%, 1/2/20 | | | 1,444,657 | | | 1,781,893 |
6.125%, 2/15/20 | | | 47,890,000 | | | 55,566,671 |
6.061%, 1/17/23 | | | 15,559,548 | | | 17,531,980 |
4.698%, 1/2/24 | | | 5,593,038 | | | 5,746,846 |
5.082%, 1/2/29 | | | 10,471,244 | | | 10,982,576 |
5.866%, 7/2/30 | | | 57,480,397 | | | 66,311,686 |
6.176%, 1/2/31 | | | 40,639,486 | | | 46,190,958 |
| | | | | | |
| | | | | | 705,245,003 |
| | | | | | |
| | | | | | 10,083,096,669 |
TOTAL FIXED INCOME SECURITIES
(Cost $20,296,092,474) | | $ | 21,470,905,260 |
| | |
| See accompanying Notes to Financial Statements | | DODGE & COX INCOME FUND §PAGE 10 |
| | |
| PORTFOLIO OF INVESTMENTS (unaudited) | | June 30, 2010 |
| | | | | | | | |
| SHORT-TERM INVESTMENTS: 4.4% | |
COMMERCIAL PAPER: 0.5% | |
WellPoint, Inc.(b) | | | | | | | | |
7/21/10 | | $ | 55,000,000 | | | $ | 54,990,222 | |
8/3/10 | | | 50,000,000 | | | | 49,983,042 | |
| | | | | | | | |
| | | | | | | 104,973,264 | |
MONEY MARKET FUND: 0.3% | | | | | |
SSgA Prime Money Market Fund | | | 65,589,596 | | | | 65,589,596 | |
REPURCHASE AGREEMENT: 3.6% | |
Fixed Income Clearing Corporation(d)
0.00%, 7/1/10,
maturity value $778,944,000 | | | 778,944,000 | | | | 778,944,000 | |
| | | | | | | | |
TOTAL SHORT-TERM INVESTMENTS
(Cost $949,506,860) | | | $ | 949,506,860 | |
| | | | | | | | |
TOTAL INVESTMENTS
(Cost $21,245,599,334) | | | 102.5 | % | | $ | 22,420,412,120 | |
OTHER ASSETS LESS LIABILITIES | | | (2.5 | %) | | | (537,389,506 | ) |
| | | | | | | | |
| NET ASSETS | | | 100.0 | % | | $ | 21,883,022,614 | |
| | | | | | | | |
| (a) | Cumulative preferred security |
| (b) | Security exempt from registration under Rule 144A of the Securities Act of 1933. The security may be resold in transactions exempt from registration, normally to qualified institutional buyers. As of June 30, 2010, all such securities in total represented $608,547,773 or 2.8% of net assets. |
| (c) | Security denominated in U.S. dollars |
| (d) | Repurchase agreement is collateralized by Fannie Mae 0.00%-5.50%, 3/15/11-4/25/11; Federal Home Loan Bank 3.25%, 3/11/11; Freddie Mac 3.25%-5.125%, 2/24/11-4/18/11; and U.S. Treasury Notes 0.875%, 2/28/11-3/31/11. Total collateral value is $794,527,025. |
| (e) | Subsidiary (see Note below) |
| (g) | A portion of securities were purchased on a delayed-delivery basis. |
| | Note: Fixed income securities are grouped by parent company unless otherwise noted. Actual securities may be issued by the listed parent company or one of its subsidiaries. |
ARM: Adjustable Rate Mortgage
CMO: Collateralized Mortgage Obligation
DUS: Delegated Underwriting and Servicing
REMIC: Real Estate Mortgage Investment Conduit
FUTURES CONTRACTS
| | | | | | | | | | | | |
| Description | | Number of
Contracts | | Expiration
Date | | Notional
Amount | | | Unrealized
Depreciation | |
10 Year U.S. Treasury Note-short position | | 5,570 | | Sept 2010 | | $ | (682,586,094 | ) | | $ | (8,669,005 | ) |
| | |
| PAGE 11 § DODGE & COX INCOME FUND | | See accompanying Notes to Financial Statements |
| | | |
STATEMENT OF ASSETS AND LIABILITIES (unaudited) | |
| |
| | | June 30, 2010 | |
ASSETS: | | | |
Investments, at value (cost $21,245,599,334) | | $22,420,412,120 | |
Cash held at broker | | 7,241,000 | |
Receivable for paydowns on mortgage-backed securities | | 9,176,083 | |
Receivable for Fund shares sold | | 31,735,579 | |
Interest receivable | | 227,493,003 | |
Prepaid expenses and other assets | | 38,830 | |
| | | |
| | 22,696,096,615 | |
| | | |
LIABILITIES: | | | |
Payable for investments purchased | | 771,459,087 | |
Payable for Fund shares redeemed | | 33,156,038 | |
Payable to broker for futures variation margin | | 87,031 | |
Management fees payable | | 7,130,937 | |
Accrued expenses | | 1,240,908 | |
| | | |
| | 813,074,001 | |
| | | |
NET ASSETS | | $21,883,022,614 | |
| | | |
NET ASSETS CONSIST OF: | | | |
Paid in capital | | $21,173,139,151 | |
Undistributed net investment income | | 7,074,155 | |
Accumulated net realized loss | | (463,334,473 | ) |
Net unrealized appreciation | | 1,166,143,781 | |
| | | |
| | $21,883,022,614 | |
| | | |
Fund shares outstanding (par value $0.01 each, unlimited shares authorized) | | 1,658,590,420 | |
Net asset value per share | | $13.19 | |
| | | |
|
STATEMENT OF OPERATIONS
(unaudited) | |
| |
| | | Six Months Ended
June 30, 2010 | |
INVESTMENT INCOME: | | | |
Interest | | $474,695,835 | |
| |
EXPENSES: | | | |
Management fees | | 40,899,181 | |
Custody and fund accounting fees | | 182,225 | |
Transfer agent fees | | 1,921,472 | |
Professional services | | 73,450 | |
Shareholder reports | | 714,038 | |
Registration fees | | 420,308 | |
Trustees’ fees | | 77,000 | |
Miscellaneous | | 104,147 | |
| | | |
| | 44,391,821 | |
| | | |
NET INVESTMENT INCOME | | 430,304,014 | |
| | | |
REALIZED AND UNREALIZED GAIN/(LOSS): | |
Net realized loss | | (101,165,275 | ) |
Net change in unrealized appreciation/depreciation | | | |
Investments | | 552,538,383 | |
Treasury futures contracts | | (8,669,005 | ) |
| | | |
Net realized and unrealized gain | | 442,704,103 | |
| | | |
NET INCREASE IN NET ASSETS FROM OPERATIONS | | $873,008,117 | |
| | | |
| | | | | | | | |
STATEMENT OF CHANGES IN NET ASSETS | |
| | |
| | | Six Months Ended
June 30, 2010
(unaudited) | | | Year Ended
December 31, 2009 | |
OPERATIONS: | | | | | | | | |
Net investment income | | $ | 430,304,014 | | | $ | 836,389,573 | |
Net realized gain/(loss) | | | (101,165,275 | ) | | | 42,688,330 | |
Net change in unrealized appreciation/depreciation | | | 543,869,378 | | | | 1,431,676,839 | |
| | | | | | | | |
Net increase in net assets from operations | | | 873,008,117 | | | | 2,310,754,742 | |
| | | | | | | | |
| | |
DISTRIBUTIONS TO SHAREHOLDERS FROM: | | | | | | | | |
Net investment income | | | (512,967,291 | ) | | | (874,280,119 | ) |
Net realized gain | | | — | | | | — | |
| | | | | | | | |
Total distributions | | | (512,967,291 | ) | | | (874,280,119 | ) |
| | | | | | | | |
| | |
FUND SHARE TRANSACTIONS: | | | | | | | | |
Proceeds from sale of shares | | | 4,092,623,154 | | | | 7,487,028,315 | |
Reinvestment of distributions | | | 436,834,368 | | | | 733,414,087 | |
Cost of shares redeemed | | | (2,260,240,753 | ) | | | (4,211,458,973 | ) |
| | | | | | | | |
Net increase from Fund share transactions | | | 2,269,216,769 | | | | 4,008,983,429 | |
| | | | | | | | |
Total increase in net assets | | | 2,629,257,595 | | | | 5,445,458,052 | |
| | |
NET ASSETS: | | | | | | | | |
Beginning of period | | | 19,253,765,019 | | | | 13,808,306,967 | |
| | | | | | | | |
End of period (including undistributed net investment income of $7,074,155 and $4,915,581, respectively) | | $ | 21,883,022,614 | | | $ | 19,253,765,019 | |
| | | | | | | | |
| | |
SHARE INFORMATION: | | | | | | | | |
Shares sold | | | 311,384,209 | | | | 597,949,714 | |
Distributions reinvested | | | 33,318,447 | | | | 58,933,340 | |
Shares redeemed | | | (172,034,648 | ) | | | (341,796,111 | ) |
| | | | | | | | |
Net increase in shares
outstanding | | | 172,668,008 | | | | 315,086,943 | |
| | | | | | | | |
| | |
| See accompanying Notes to Financial Statements | | DODGE & COX INCOME FUND §PAGE 12 |
NOTES TO FINANCIAL STATEMENTS (unaudited)
NOTE 1—ORGANIZATION AND SIGNIFICANT ACCOUNTING POLICIES
Dodge & Cox Income Fund (the “Fund”) is one of the series constituting the Dodge & Cox Funds (the “Trust” or the “Funds”). The Trust is organized as a Delaware statutory trust and is registered under the Investment Company Act of 1940, as amended, as a diversified, open-end management investment company. The Fund commenced operations on January 3, 1989, and seeks high and stable current income consistent with long-term preservation of capital. Risk considerations and investment strategies of the Fund are discussed in the Fund’s Prospectus.
The financial statements have been prepared in conformity with accounting principles generally accepted in the United States of America, which require the use of estimates and assumptions by management. Actual results may differ from those estimates. Significant accounting policies are as follows:
Security valuation The Fund’s net assets are valued as of the close of trading on the New York Stock Exchange (NYSE), generally 4:00 p.m. Eastern Time, each day that the NYSE is open for business. Fixed income securities with original maturities of one year or more are priced on the basis of valuations furnished by pricing services which utilize both dealer-supplied valuations and pricing models. Under certain circumstances, fixed income securities that are not valued by pricing services are temporarily valued by the investment manager utilizing both dealer-supplied valuations and pricing models. Valuations of fixed income securities take into account appropriate factors such as institutional-size trading markets in similar groups of securities, yield, quality, coupon rate, maturity, type of issue, trading characteristics and other market data and do not rely exclusively upon exchange or over-the-counter listed prices. Security values are not discounted based on the size of the Fund’s position. Securities for which market quotations are not readily available are valued at fair value as determined in good faith by or at the direction of the Board of Trustees. Futures contracts are valued daily at the closing settlement price on the exchange. Short-term securities are valued at amortized cost which approximates
current value. All securities held by the Fund are denominated in U.S. dollars.
Security transactions, investment income, expenses, and distributions Security transactions are recorded on the trade date. Realized gains and losses on securities sold are determined on the basis of identified cost.
Interest income is recorded on the accrual basis. Interest income includes coupon interest, amortization of premium and accretion of discount on debt securities, and gain/loss on paydowns of mortgage-backed securities. The ability of the issuers of the debt securities held by the Fund to meet their obligations may be affected by economic developments in a specific industry, state or region. Debt obligations may be placed on non-accrual status and related interest income may be reduced by ceasing current accruals and writing off interest receivables when the collection of all or a portion of interest has become doubtful. A debt obligation is removed from non-accrual status when the issuer resumes interest payments or when collectibility of interest is reasonably assured. Dividend Income is recorded on the ex-dividend date.
Expenses are recorded on the accrual basis. Most expenses of the Trust can be directly attributed to a specific series. Expenses which cannot be directly attributed are allocated among the Funds in the Trust.
Distributions to shareholders are recorded on the ex-dividend date.
Repurchase agreements The Fund may enter into repurchase agreements, secured by U.S. government or agency securities, which involve the purchase of securities from a counterparty with a simultaneous commitment to resell the securities at an agreed-upon date and price. It is the Fund’s policy that its custodian take possession of the underlying collateral securities, the fair value of which exceeds the principal amount of the repurchase transaction, including accrued interest, at all times. In the event of default by the counterparty, the Fund has the contractual right to liquidate the securities and to apply the proceeds in satisfaction of the obligation.
Forward Commitments The Fund may enter into “TBA” (to be announced) commitments to purchase or sell mortgage-related securities in which payment and delivery take place after the customary settlement period.
PAGE 13 § DODGE & COX INCOME FUND
NOTES TO FINANCIAL STATEMENTS (unaudited)
Purchasing securities on a delayed-delivery basis involves risk of loss if the value of the security to be purchased declines prior to the settlement date. The Fund may dispose of a TBA purchase prior to the settlement date. While a contract is outstanding, the Fund must segregate an equivalent value of liquid assets.
Treasury Futures Contracts The Fund may enter into Treasury futures contracts to assist with the management of the portfolio’s interest rate exposure or for other purposes.
Futures contracts involve an obligation to purchase or sell (depending on whether the Fund has entered a long or short futures contract, respectively) an asset at a future date, at a price set at the time of the contract. Upon entering into a futures contract, the Fund is required to deposit an amount of cash or liquid assets (referred to as initial margin) in a segregated account with the clearing broker. Subsequent payments (referred to as variation margin) to and from the clearing broker are made on a daily basis based on changes in the market value of futures contracts. Futures are traded publicly and their market value changes daily. Changes in the market value of open futures contracts are recorded as unrealized appreciation or depreciation in the Statement of Operations. Realized gains and losses on futures contracts are recorded in the Statement of Operations at the closing or expiration of futures contracts.
Investments in futures contracts may include certain risks, which may be different from, and potentially greater than, those of the underlying securities. To the extent the Fund uses Treasury futures, it is exposed to additional volatility and potential losses resulting from leverage.
The Fund began trading in short Treasury futures contracts in May 2010 and the current notional balance presented in the Portfolio of Investments is representative of the notional values from May 2010 through period end.
NOTE 2—VALUATION MEASUREMENTS
Various inputs are used in determining the value of the Fund’s investments. These inputs are summarized in the three broad levels listed below.
| § | | Level 1: Quoted prices in active markets for identical securities |
| § | | Level 2: Other significant observable inputs (including quoted prices for similar securities, market indices, interest rates, credit risk, etc.) |
| § | | Level 3: Significant unobservable inputs (including the Fund’s own assumptions in determining the fair value of investments) |
The inputs or methodology used for valuing securities are not necessarily an indication of the risk associated with investing in those securities.
The following is a summary of the inputs used to value the Fund’s holdings as of June 30, 2010:
| | | | | | | |
| Classification(a) | | LEVEL 1
(Quoted
Prices) | | | LEVEL 2 (Other Significant
Observable Inputs) |
Securities | | | | | | | |
Fixed Income Securities | | | | | | | |
U.S. Treasury | | $ | 753,638,651 | | | $ | — |
Government Related | | | — | | | | 1,117,826,255 |
Mortgage-Related Securities | | | — | | | | 9,287,701,095 |
Asset-backed Securities | | | — | | | | 228,642,590 |
Corporate | | | — | | | | 10,083,096,669 |
Commercial Paper | | | — | | | | 104,973,264 |
Money Market Fund | | | 65,589,596 | | | | — |
Repurchase Agreement | | | — | | | | 778,944,000 |
| | | | | | | |
Total Securities | | $ | 819,228,247 | | | $ | 21,601,183,873 |
| | | | | | | |
Other Financial
Instruments | | | | | | | |
Futures Contracts | | | (8,669,005 | )(b) | | | — |
| | | | | | | |
| | | | | | | | |
| (a) | At June 30, 2010 the Fund held no securities that were considered to be “Level 3” securities (those valued using significant unobservable inputs). |
| (b) | Represents unrealized depreciation on futures contracts. |
NOTE 3—RELATED PARTY TRANSACTIONS
Management fees Under a written agreement approved by a unanimous vote of the Board of Trustees, the Fund pays an annual management fee of 0.50% of the Fund’s average daily net assets up to $100 million and 0.40% of the Fund’s average daily net assets in excess of $100 million to Dodge & Cox, investment manager of the Fund. The agreement further provides that Dodge & Cox shall waive its fee to the extent that such fee plus all other ordinary operating expenses of the Fund exceed 1% of the average daily net assets for the year.
DODGE & COX INCOME FUND §PAGE 14
NOTES TO FINANCIAL STATEMENTS (unaudited)
Fund officers and trustees All officers and three of the trustees of the Trust are officers or employees of Dodge & Cox. The Trust pays a fee only to those trustees who are not affiliated with Dodge & Cox.
Indemnification Under the Trust’s organizational documents, its officers and trustees are indemnified against certain liabilities arising out of the performance of their duties to the Trust. In addition, in the normal course of business the Trust enters into contracts that provide general indemnities to other parties. The Trust’s maximum exposure under these arrangements is unknown as this would involve future claims that may be made against the Trust that have not yet occurred.
NOTE 4—INCOME TAX INFORMATION AND DISTRIBUTIONS TO SHAREHOLDERS
A provision for federal income taxes is not required since the Fund intends to continue to qualify as a regulated investment company under Subchapter M of the Internal Revenue Code and distribute all of its taxable income to shareholders. Distributions are determined in accordance with income tax regulations, which may differ from net investment income and realized gains for financial reporting purposes. Financial reporting records are adjusted for permanent book/tax differences to reflect tax character.
Book/tax differences are primarily due to differing treatments of wash sales and net short-term realized gain/(loss) and paydown loss. At June 30, 2010, the cost of investments for federal income tax purposes was $21,245,599,943.
Distributions during the six months ended June 30, 2010 and for the year ended December 31, 2009 were characterized as follows for federal income tax purposes:
| | | | | | | | |
| | | Six months Ended June 30, 2010 | | | Year Ended December 31, 2009 | |
Ordinary income | | $ | 512,967,291 | | | $ | 874,280,119 | |
| | ($ | 0.320 per share | ) | | ($ | 0.677 per share | ) |
Long-term capital gain | | | — | | | | — | |
At June 30, 2010, the tax basis components of distributable earnings were as follows:
| | | | |
Unrealized appreciation | | $ | 1,233,914,522 | |
Unrealized depreciation | | | (59,102,345 | ) |
| | | | |
Net unrealized appreciation | | | 1,174,812,177 | |
Undistributed ordinary income | | | 7,074,155 | |
Accumulated capital loss(a) | | | (202,235,751 | ) |
Capital Loss carryforward(b) | | | (269,767,118 | ) |
| (a) | Represents capital loss realized for tax purposes during the period from January 1, 2010 to June 30, 2010. |
| (b) | Represents accumulated capital loss as of December 31, 2009 which may be carried forward to offset future capital gains. If not utilized, the capital loss carryforward expires as follows: |
| | | |
Expiring in 2011 | | $ | 3,015,471 |
Expiring in 2012 | | | 32,528,048 |
Expiring in 2013 | | | 19,963,019 |
Expiring in 2014 | | | 39,482,767 |
Expiring in 2017 | | | 174,777,813 |
| | | |
| | $ | 269,767,118 |
| | | |
Fund management has reviewed the tax positions for open periods (for Federal purposes, three years from the date of filing and for State purposes, four years from the date of filing) as applicable to the Fund, and has determined that no provision for income tax is required in the Fund’s financial statements.
NOTE 5—LOAN FACILITIES
Pursuant to an exemptive order issued by the Securities and Exchange Commission (SEC), the Fund may participate in an interfund lending facility (Facility). The Facility allows the Fund to borrow money from or loan money to the Funds. Loans under the Facility are made for temporary or emergency purposes, such as to fund shareholder redemption requests. Interest on borrowings is the average of the current repurchase agreement rate and the bank loan rate. There was no activity in the Facility during the period.
The Fund also participates with the Funds in a $200 million committed credit facility (Line of Credit) with State Street Bank and Trust Company, to be utilized for temporary or emergency purposes to fund shareholder redemptions or for other short-term liquidity purposes. The Fund pays a commitment fee on its pro-rata portion
PAGE 15 § DODGE & COX INCOME FUND
NOTES TO FINANCIAL STATEMENTS (unaudited)
of the line of credit, which amounted to $27,888 and is reflected as a Miscellaneous Expense in the Statement of Operations. Interest on borrowings is charged at the prevailing rate. There were no borrowings on the Line of Credit during the period.
NOTE 6—PURCHASES AND SALES OF INVESTMENTS
For the six months ended June 30, 2010, purchases and sales of securities, other than short-term securities and U.S. government securities, aggregated $2,060,749,808 and $509,689,184, respectively. For the six months ended June 30, 2010, purchases and sales of U.S. government securities aggregated $3,801,239,639 and $2,805,029,264, respectively.
NOTE 7—SUBSEQUENT EVENTS
Fund management has determined that no material events or transactions occurred subsequent to June 30, 2010 and through the date of the Fund’s financial statements issuance, which require additional disclosure in the Fund’s financial statements.
FINANCIAL HIGHLIGHTS
| | | | | | | | | | | | | | | | | | |
SELECTED DATA AND RATIOS (for a share outstanding throughout each period) | | Six Months
Ended June 30, | | | Year Ended December 31, | |
| | | 2010(a) | | | 2009 | | | 2008 | | | 2007 | | | 2006 | | | 2005 | |
| | | | | | |
Net asset value, beginning of period | | $12.96 | | | $11.79 | | | $12.51 | | | $12.57 | | | $12.54 | | | $12.84 | |
Income from investment operations: | | | | | | | | | | | | | | | | | | |
Net investment income | | 0.27 | | | 0.65 | | | 0.68 | | | 0.63 | | | 0.61 | | | 0.55 | |
Net realized and unrealized gain (loss) | | 0.28 | | | 1.20 | | | (0.72 | ) | | (0.05 | ) | | 0.04 | | | (0.30 | ) |
| | | | | | |
Total from investment operations | | 0.55 | | | 1.85 | | | (0.04 | ) | | 0.58 | | | 0.65 | | | 0.25 | |
| | | | | | |
Distributions to shareholders from: | | | | | | | | | | | | | | | | | | |
Net investment income | | (0.32 | ) | | (0.68 | ) | | (0.68 | ) | | (0.64 | ) | | (0.62 | ) | | (0.55 | ) |
Net realized gain | | — | | | — | | | — | | | — | | | — | | | — | |
| | | | | | |
Total distributions | | (0.32 | ) | | (0.68 | ) | | (0.68 | ) | | (0.64 | ) | | (0.62 | ) | | (0.55 | ) |
| | | | | | |
Net asset value, end of period | | $13.19 | | | $12.96 | | | $11.79 | | | $12.51 | | | $12.57 | | | $12.54 | |
| | | | | | |
Total return | | 4.28 | % | | 16.05 | % | | (0.29 | )% | | 4.68 | % | | 5.30 | % | | 1.98 | % |
Ratios/supplemental data: | | | | | | | | | | | | | | | | | | |
Net assets, end of period (millions) | | $21,883 | | | $19,254 | | | $13,808 | | | $15,932 | | | $11,972 | | | $9,610 | |
Ratio of expenses to average net assets | | 0.43 | %(b) | | 0.43 | % | | 0.43 | % | | 0.44 | % | | 0.44 | % | | 0.44 | % |
Ratio of net investment income to average net assets | | 4.21 | %(b) | | 5.29 | % | | 5.40 | % | | 5.07 | % | | 4.77 | % | | 3.99 | % |
Portfolio turnover rate | | 14 | % | | 20 | % | | 24 | % | | 27 | % | | 30 | % | | 24 | % |
See accompanying Notes to Financial Statements
DODGE & COX INCOME FUND §PAGE 16
FUND HOLDINGS
The Fund provides a complete list of its holdings four times each fiscal year, as of the end of each quarter. The lists appear in the Fund’s First Quarter, Semi-Annual, Third Quarter and Annual Reports to shareholders. The Fund files the lists with the Securities and Exchange Commission (SEC) on Form N-CSR (second and fourth quarters) and Form N-Q (first and third quarters). Shareholders may view the Fund’s Forms N-CSR and N-Q on the SEC’s website at www.sec.gov. Forms N-CSR and N-Q may also be reviewed and copied at the SEC’s Public Reference Room in Washington, DC. Information regarding the operations of the Public Reference Room may be obtained by 1-202-942-8090 (direct) or 1-800-732-0330 (general SEC number). A complete list of the Fund’s quarter-end holdings is also available at www.dodgeandcox.com on or about 15 days following each quarter end and remains available on the web site until the list is updated in the subsequent quarter.
PROXY VOTING
For a free copy of the Fund’s proxy voting policies and procedures, please call 1-800-621-3979, visit the Fund’s web site at www.dodgeandcox.com or visit the SEC’s web site at www.sec.gov. Information regarding how the Fund voted proxies relating to portfolio securities during the most recent 12-month period ending June 30 is also available at www.dodgeandcox.com or at www.sec.gov.
HOUSEHOLD MAILINGS
The Fund routinely mails shareholder reports and summary prospectuses to shareholders and, on occasion, proxy statements. In order to reduce the volume of mail, when possible, only one copy of these documents will be sent to shareholders who are part of the same family and share the same residential address.
If you have a direct account with the Funds and you do not want the mailing of shareholder reports and summary prospectuses combined with other members in your household, contact the Funds at 1-800-621-3979. Your request will be implemented within 30 days.
PAGE 17 § DODGE & COX INCOME FUND
THIS PAGE INTENTIONALLY LEFT BANK
DODGE & COX INCOME FUND §PAGE 18
DODGE & COX FUNDS—EXECUTIVE OFFICER & TRUSTEE INFORMATION
| | | | | | |
Name (Age) and
Address* | | Position with Trust
(Year of Election or
Appointment) | | Principal Occupation During Past 5 Years | | Other Directorships Held by Trustees |
| INTERESTED TRUSTEES & OFFICERS |
John A. Gunn (66) | | Chairman and Trustee
(Trustee since 1985) | | Chairman (since 2007), Chief Executive Officer (2005-2010), and Director of Dodge & Cox, Portfolio Manager and member of Investment Policy Committee (IPC), Global Investment Policy Committee (GIPC) (since 2008), and International Investment Policy Committee (IIPC) | | — |
| Kenneth E. Olivier (58) | | President and Trustee
(Trustee since 2005) | | Chief Executive Officer (since 2010), President (since 2005), and Director of Dodge & Cox, Portfolio Manager, and member of IPC | | — |
| Dana M. Emery (48) | | Senior Vice President and Trustee (Trustee since 1993) | | Executive Vice President (since 2005) and Director of Dodge & Cox, Director of Fixed Income, Portfolio Manager, and member of Fixed Income Investment Policy Committee (FIIPC) | | — |
Charles F. Pohl (52) | | Senior Vice President (Officer since 2004) | | Senior Vice President and Director of Dodge & Cox, Chief Investment Officer (since 2007), Director of Credit Research, Portfolio Manager, Investment Analyst, and member of IPC, GIPC (since 2008), IIPC (since 2007), and FIIPC | | — |
| Diana S. Strandberg (50) | | Senior Vice President
(Officer since 2005) | | Vice President of Dodge & Cox, Director of International Equity (since 2009), Portfolio Manager, and member of IPC, GIPC (since 2008), and IIPC | | — |
| David H. Longhurst (53) | | Treasurer (Officer since 2006) | | Vice President (since 2008) and Assistant Treasurer of Dodge & Cox (since 2007); Fund Administrative and Accounting Senior Manager (2004-2007) | | — |
| Thomas M. Mistele (56) | | Secretary
(Officer since 2000) | | Chief Operating Officer, Director (since 2005), Secretary, and General Counsel of Dodge & Cox | | — |
| Katherine M. Primas (35) | | Chief Compliance Officer
(Officer since 2010) | | Chief Compliance Officer of Dodge & Cox (since 2008) and Associate Chief Compliance Officer of Dodge & Cox (2004-2008) | | — |
| INDEPENDENT TRUSTEES |
| William F. Ausfahl (70) | | Trustee (Since 2002) | | CFO, The Clorox Co. (1982-1997); Director, The Clorox Co. (1984-1997) | | — |
| L. Dale Crandall (68) | | Trustee (Since 1999) | | President, Kaiser Foundation Health Plan, Inc. and Kaiser Foundation Hospitals (2000-2002); Senior Vice President—Finance and Administration & CFO, Kaiser Foundation Health Plan, Inc. and Kaiser Foundation Hospitals (1998-2000) | | Director, Ansell Limited (medical equipment and supplies) (2002-present); Director, Coventry Health Care, Inc. (managed health care) (2004-present); Director, Metavante Technologies, Inc. (software) (2007 to 2009); Bridgeport Education, Inc. (education services) (2008 to present) |
| Thomas A. Larsen (60) | | Trustee (Since 2002) | | Director in Howard, Rice, Nemerovski, Canady, Falk & Rabkin (law firm) | | — |
John B. Taylor (63) | | Trustee (Since 2005) | | Professor of Economics, Stanford University; Senior Fellow, Hoover Institution; Under Secretary for International Affairs, United States Treasury (2001-2005) | | — |
Will C. Wood (70) | | Trustee (Since 1992) | | Principal, Kentwood Associates, Financial Advisers | | Director, Banco Latinoamericano de Exportaciones S.A. (Latin American foreign trade bank) (1999-Present) |
| * | | The address for each Officer and Trustee is 555 California Street, 40th Floor, San Francisco, California 94104. Each Officer and Trustee oversees all five series in the Dodge & Cox Funds complex and serves for an indefinite term. |
Additional information about the Trust’s Trustees and Officers is available in the Trust’s Statement of Additional Information (SAI). You can get a free copy of the SAI by visiting the Funds’ website at www.dodgeandcox.com or calling 1-800-621-3979.
PAGE 19 § DODGE & COX INCOME FUND
Not applicable for semi-annual report filings.
| ITEM 3. | AUDIT COMMITTEE FINANCIAL EXPERT. |
Not applicable for semi-annual report filings.
| ITEM 4. | PRINCIPAL ACCOUNTANT FEES AND SERVICES. |
Not applicable for semi-annual report filings.
| ITEM 5. | AUDIT COMMITTEE OF LISTED REGISTRANTS. |
Not applicable.
| ITEM 6. | SCHEDULE OF INVESTMENTS. |
Not applicable. The complete schedule of investments is included in Item 1 of this Form N-CSR.
| ITEM 7. | DISCLOSURE OF PROXY VOTING POLICIES AND PROCEDURES FOR CLOSED-END MANAGEMENT INVESTMENT COMPANIES. |
Not applicable.
| ITEM 8. | PORTFOLIO MANAGERS OF CLOSED-END MANAGEMENT INVESTMENT COMPANIES. |
Not applicable.
| ITEM 9. | PURCHASES OF EQUITY SECURITIES BY CLOSED-END MANAGEMENT INVESTMENT COMPANY AND AFFILIATED PURCHASERS. |
Not applicable.
| ITEM 10. | SUBMISSION OF MATTERS TO A VOTE OF SECURITY HOLDERS. |
During the reporting period, there were no material changes to the procedures by which shareholders may recommend nominees to the registrant’s board.
| ITEM 11. | CONTROLS AND PROCEDURES. |
(a) An evaluation was performed within 90 days of the filing of this report, under the supervision and with the participation of the registrant’s management, including the principal executive officer and principal financial officer, of the effectiveness of the design and operation of the registrant’s disclosure controls and procedures. Based on that evaluation, the principal executive officer and principal financial officer concluded that the registrant’s disclosure controls and procedures were effective.
(b) The registrant’s principal executive officer and principal financial officer are aware of no changes in the registrant’s internal control over financial reporting that occurred during the registrant’s second fiscal quarter of the period covered by this report that have materially affected, or are reasonably likely to materially affect, the registrant’s internal control over financial reporting.
| | |
| (a)(1) | | Not applicable for semi-annual report filings. |
| |
| (a)(2) | | Certifications pursuant to Section 302 of the Sarbanes-Oxley Act of 2002 are attached. (EX.99A) |
| |
| (a)(3) | | Not applicable. |
| |
| (b) | | Certifications pursuant to Section 906 of the Sarbanes-Oxley Act of 2002 are attached. (EX.99B) |
SIGNATURES
Pursuant to the requirements of the Securities Exchange Act of 1934 and the Investment Company Act of 1940, the registrant has duly caused this report to be signed on its behalf by the undersigned, thereunto duly authorized.
| | |
| Dodge & Cox Funds |
| |
| By | | /s/ JOHN A. GUNN |
| | John A. Gunn Chairman - Principal Executive Officer |
Date August 9, 2010
Pursuant to the requirements of the Securities Exchange Act of 1934 and the Investment Company Act of 1940, this report has been signed below by the following persons on behalf of the registrant and in the capacities and on the dates indicated.
| | |
| Dodge & Cox Funds |
| |
| By | | /s/ JOHN A. GUNN |
| | John A. Gunn Chairman - Principal Executive Officer |
| | |
| |
| By | | /s/ DAVID H. LONGHURST |
| | David H. Longhurst Treasurer - Principal Financial Officer |
Date August 9, 2010