UNITED STATES
SECURITIES AND EXCHANGE COMMISSION
Washington, D.C. 20549
FORM N-CSR
CERTIFIED SHAREHOLDER REPORT OF REGISTERED
MANAGEMENT INVESTMENT COMPANIES
Investment Company Act file number 811-173
DODGE & COX FUNDS
(Exact name of registrant as specified in charter)
| | |
| 555 California Street, 40th Floor | | |
| San Francisco, CA | | 94104 |
| (Address of principal executive offices) | | (Zip code) |
Thomas M. Mistele, Esq.
555 California Street, 40th Floor
San Francisco, CA 94104
(Name and address of agent for service)
Registrant’s telephone number, including area code: 415-981-1710
Date of fiscal year end: DECEMBER 31, 2007
Date of reporting period: JUNE 30, 2007
Form N-CSR is to be used by management investment companies to file reports with the Commission not later than 10 days after the transmission to stockholders of any report that is required to be transmitted to stockholders under Rule 30e-1 under the Investment Company Act of 1940 (17 CFR 270.30e-1). The Commission may use the information provided on Form N-CSR in its regulatory, disclosure review, inspection, and policymaking roles.
A registrant is required to disclose the information specified by Form N-CSR, and the Commission will make this information public. A registrant is not required to respond to the collection of information contained in Form N-CSR unless the Form displays a currently valid Office of Management and Budget (“OMB”) control number. Please direct comments concerning the accuracy of the information collection burden estimate and any suggestions for reducing the burden to Secretary, Securities and Exchange Commission, 450 Fifth Street, NW, Washington, DC 20549-0609. The OMB has reviewed this collection of information under the clearance requirements of 44 U.S.C. ss. 3507.
| ITEM 1. | REPORTS TO STOCKHOLDERS. |
The following are the June 30, 2007 semi-annual reports for the Dodge & Cox Funds, a Delaware statutory trust, consisting of four series: Dodge & Cox Stock Fund, Dodge & Cox International Stock Fund, Dodge & Cox Balanced Fund and Dodge & Cox Income Fund. The reports of each series were transmitted to their respective shareholders on August 7, 2007.
| | | | |
 | | | |  |
www.dodgeandcox.com
For Fund literature, transactions and account
information, please visit the Funds’ web site.
or write or call:
DODGE & COX FUNDS
c/o Boston Financial Data Services
P.O. Box 8422
Boston, Massachusetts 02266-8422
(800) 621-3979
INVESTMENT MANAGER
Dodge & Cox
555 California Street, 40th Floor
San Francisco, California 94104
(415) 981-1710
This report is submitted for the general information of the shareholders of the Fund. The report is not authorized for distribution to prospective investors in the Fund unless it is accompanied by a current prospectus.
This report reflects our views, opinions and portfolio holdings as of June 30, 2007, the end of the reporting period. Any such views are subject to change at any time based upon market or other conditions and Dodge & Cox disclaims any responsibility to update such views. These views may not be relied on as investment advice and, because investment decisions for a Dodge & Cox Fund are based on numerous factors, may not be relied on as an indication of trading intent on behalf of any Dodge & Cox Fund.
06/07 SF SAR  Printed on recycled paper
Semi-Annual Report
June 30, 2007
Stock Fund
ESTABLISHED 1965
(Closed to New Investors)
TO OUR SHAREHOLDERS
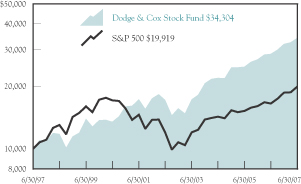
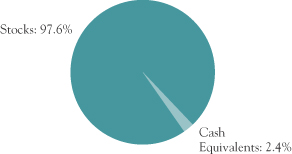
The Dodge & Cox Stock Fund had a total return of 7.2% for the six months ended June 30, 2007, compared to a total return of 7.0% for the Standard & Poor’s 500 Index (S&P 500). Longer-term results can be found on page 3. As of June 30, the Fund had net assets of $72.0 billion with a cash position of 2.4%.
SIX-MONTH PERFORMANCE REVIEW
We begin this letter with a discussion of the Fund’s performance relative to the S&P 500 for the first six months of 2007. However, since we manage the Fund using a three-to-five year investment horizon, we encourage you to use a similar time frame when assessing the Fund.
Key Contributors to Results
| n | | Strong relative returns from the Fund’s Financials holdings (up 3% versus down 1% for the S&P 500 sector) in combination with a lower weighting than the S&P 500 (14% versus 21%) aided results. SLM (Sallie Mae) was a standout performer (up 35%) after agreeing to be acquired. |
| n | | Stronger returns from the Fund’s holdings in Consumer Staples (up 8% versus up 5% for the S&P 500 sector) also contributed to Fund performance. Unilever (up 16%) and Avon Products (up 12%) were notable contributors. |
| n | | Other contributors included: Union Pacific (up 26%), Sony (up 20%) and Chevron (up 16%). |
Key Detractors from Results
| n | | The Fund’s Information Technology holdings (up 6%) underperformed the S&P 500 sector’s 9% return. Motorola, the group’s largest detractor, was down 13%. We discuss our investment thesis on Motorola below. |
| n | | Weaker relative returns from the Fund’s Health Care holdings (up 4% versus up 6% for the S&P 500 sector), in combination with a higher weighting than the S&P 500 (17% versus 12%), hindered performance. Sanofi-Aventis (down 11%) released disappointing news concerning a key pharmaceutical product. |
| n | | Wachovia (down 8%), Honda Motor (down 7%) and Citigroup (down 6%) also had a negative impact on the Fund’s performance. |
INVESTMENT STRATEGY
At Dodge & Cox, individual company analysis drives our investment decisions. The market provides us with the price of a stock each morning. Our fundamental research is focused on assessing a company’s cash flow and profit potential over the next three-to-five years relative to this stock price. We ask ourselves: What is a reasonable expectation if all goes according to management’s plan? How does the competitive environment affect the company’s ability to reach its goals? What could go wrong? It is our job to develop an understanding of a company’s risks and opportunities, and then to determine the price at which we are willing to participate (on our shareholders’ behalf) as equity owners.
While most of our time and energy is spent on fundamental analysis, several important factors and assumptions influence our individual company research and the Fund’s portfolio structure.
The dynamism of the U.S. economy has provided an attractive environment for equity investors. Over the past 60 years, the U.S. economy has expanded on a “real” basis at a better than 2.5% rate, 67% of the time, and has contracted only 13% of the time. Over the past 50 years the S&P 500’s earnings have increased by a factor of 24, while its price has risen by a factor of 30. Over its 42 year history the Fund has benefited as well, returning 12.4% versus 10.5% for the S&P 500, on an annualized basis. While there is no guarantee that the economy will grow continuously, we remain optimistic about the long-term prospects for both earnings growth and equity returns.
We also believe that the U.S. economy will continue to benefit from the emergence of the developing world as a new engine of global economic growth. Thirty years ago, most citizens in developing countries were isolated with limited individual economic and political freedom. The collective labor of the developing world’s citizens was, and remains, the largest under-utilized resource in the world, but the powerful advances of the information economy are gradually ending isolation.
In our view, prospects for global growth are improved by the rapid pace of technological innovation in computing power and electronic communications. Improved knowledge
PAGE 1 § DODGE & COX STOCK FUND
transfer is enabling the citizens of the developing world to “plug into” the global economy, empowering them to produce and consume more. An expanding global economy expands the marketplace in which multinational U.S. companies can sell their goods and services. Today, over 39% of the revenues of the Fund’s holdings come from outside the United States, and we expect that percentage to grow.
How do the above observations and assumptions affect our portfolio strategy? To begin, we have generally stayed close to fully invested; cash in the Fund has seldom been higher than 10%. Next, we look for companies with long-term incremental growth opportunities in areas of technological innovation. We also try to uncover companies that are well positioned to provide products and services to the consumer in the developing world. Importantly, the narrow range of valuations within the equity market today allows us to invest in these types of companies at what we believe are reasonable valuations. Companies in the Fund that may benefit from increased consumption in the developing world include Avon Products, McDonald’s, Hewlett-Packard, Nike, GlaxoSmithKline and Motorola.
MOTOROLA—AN EXAMPLE
(We discuss Motorola not because we think it is more attractive than the other 83 holdings in the Fund, but because it illustrates our investment approach and incorporates two of the assumptions discussed above: continued demand for telecommunications products and services, and increased purchasing power for people in the developing world.)
At the end of the third quarter of 2006, the Fund owned a relatively small position in Motorola (1.2% of the Fund). Unfortunately, the company’s earnings tumbled over the next six months, and the stock’s valuation followed, falling to approximately one times Motorola’s sales (from a high of about 3.5 times sales in 2000). Motorola’s risks include increased competition from other handset manufacturers, dependence on its ability to continue to innovate and lack of market share in next-generation wireless network infrastructure. However, we believe Motorola enjoys a durable position in the extremely competitive global telecommunications market. Further, management appears to be taking meaningful steps towards improving internal operations and profitability in its handset business. Additionally, Motorola has a leading position in broadband network equipment and is a key supplier to operators of cable,
cellular and private two-way radio systems. With strong intellectual property and a solid balance sheet, we believe Motorola has the necessary foundation to execute a turnaround over the long term. Because of the stock’s lower valuation and our analysis of Motorola’s opportunities and risks, we increased the Fund’s position in Motorola to 2.6% as of June 30.
IN CLOSING
Although we are encouraged by long-term opportunities provided by the developing world coupled with advances in the information economy, we close with a few words of caution. First, we do not expect the Fund’s dramatic outperformance of the S&P 500 (14.3% versus 2.2% annualized, since June 30, 2000) to be repeated. While lower valuations among companies in areas of traditional growth (e.g., Technology and Healthcare) have provided us with investment opportunity, these lower valuations also mean that from a valuation perspective the Fund is more comparable to the S&P 500. Next, although we are forecasting neither slower growth nor collapsing margins, at some point there is bound to be a “bump in the road.” Therefore, maintaining a long-term perspective continues to be critical. In fact, with the S&P 500 losing nearly 5% during the week of July 23, we appear to be experiencing one of these bumps as we write this letter. So far, this recent volatility has not changed our long-term optimism on the equity market.
The forces of globalism and technological innovation are unprecedented in human history, and could provide opportunities for the diligent and persistent investor. In that regard, our team of 45 investment professionals will continue to work hard to uncover these attractive investment opportunities on your behalf.
Thank you for your continued confidence in our firm as a shareholder of the Dodge & Cox Stock Fund. As always, we welcome your comments and questions.
For the Board of Trustees,
| | |
 | | 
|
John A. Gunn, Chairman | | Kenneth E. Olivier, President |
August 1, 2007
| | | | | | |
| | DODGE & COX STOCK FUND § | | PAGE | | 2 |
GROWTH OF $10,000 OVER 10 YEARS
FOR AN INVESTMENT MADE ON JUNE 30, 1997
AVERAGE ANNUAL TOTAL RETURN
FOR PERIODS ENDED JUNE 30, 2007
| | | | | | | | | | | | |
| | | 1 Year | | | 5 Years | | | 10 Years | | | 20 Years | |
Dodge & Cox Stock Fund | | 19.72 | % | | 14.80 | % | | 13.12 | % | | 13.79 | % |
S&P 500 | | 20.60 | | | 10.70 | | | 7.13 | | | 10.83 | |
Past performance does not guarantee future results. Investment return and share price will fluctuate with market conditions, and investors may have a gain or loss when shares are sold. Mutual fund performance changes over time and currently may be significantly lower than stated above. Performance is updated and published monthly. Visit the Fund’s web site at www.dodgeandcox.com or call 1-800-621-3979 for current performance figures.
The Fund’s total returns include the reinvestment of dividend and capital gain distributions, but have not been adjusted for any income taxes payable by shareholders on these distributions. The Standard & Poor’s 500 (S&P 500) is a broad-based unmanaged measure of common stocks. Index returns include dividends and/or interest income and, unlike Fund returns, do not reflect fees or expenses.
Standard & Poor’s, Standard & Poor’s 500, and S&P 500® are trademarks of The McGraw-Hill Companies, Inc.
FUND EXPENSE EXAMPLE
As a Fund shareholder, you incur ongoing Fund costs, including management fees and other Fund expenses. All mutual funds have ongoing costs, sometimes referred to as operating expenses. The following example shows ongoing costs of investing in the Fund and can help you understand these costs and compare them with those of other mutual funds. The example assumes a $1,000 investment held for the six months indicated.
ACTUAL EXPENSES
The first line of the table below provides information about actual account values and expenses based on the Fund’s actual returns. You may use the information in this line, together with your account balance, to estimate the expenses that you paid over the period. Simply divide your account value by $1,000 (for example, an $8,600 account value divided by $1,000 = 8.6), then multiply the result by the number in the first line under the heading “Expenses Paid During Period” to estimate the expenses you paid on your account during this period.
HYPOTHETICAL EXAMPLE FOR COMPARISON WITH OTHER MUTUAL FUNDS
Information on the second line of the table can help you compare ongoing costs of investing in the Fund with those of other mutual funds. This information may not be used to estimate the actual ending account balance or expenses you paid during the period. The hypothetical “Ending Account Value” is based on the actual expense ratio of the Fund and an assumed 5% annual rate of return before expenses (not the Fund’s actual return). The amount under the heading “Expense Paid During the Period” shows the hypothetical expenses your account would have incurred under this scenario. You can compare this figure with the 5% hypothetical examples that appear in shareholder reports of other mutual funds.
| | | | | | | | | |
Six Months Ended
June 30, 2007 | | Beginning Account
Value 1/1/2007 | | Ending Account
Value 6/30/2007 | | Expenses Paid
During Period* |
Based on Actual Fund Return | | $ | 1,000.00 | | $ | 1,072.20 | | $ | 2.66 |
Based on Hypothetical 5% Yearly Return | | | 1,000.00 | | | 1,022.23 | | | 2.60 |
| * | | Expenses are equal to the Fund’s annualized six-month expense ratio of 0.52%, multiplied by the average account value over the period, multiplied by 181/365 (to reflect the one-half year period). |
The expenses shown in the table highlight ongoing costs only and do not reflect any transactional fees or account maintenance fees. While other mutual funds may charge such fees, please note that the Fund does not charge transaction fees (e.g., redemption fees, sales loads) or universal account maintenance fees (e.g., small account fees).
PAGE 3 § DODGE & COX STOCK FUND
| | |
| FUND INFORMATION | | June 30, 2007 |
| | |
| GENERAL INFORMATION | | |
Net Asset Value Per Share | | $162.09 |
Total Net Assets (billions) | | $72.0 |
Expense Ratio (1/1/07 to 6/30/07, annualized) | | 0.52% |
Portfolio Turnover Rate (1/1/07 to 6/30/07, unannualized) | | 8% |
30-Day SEC Yield(a) | | 1.14% |
Fund Inception | | 1965 |
No sales charges or distribution fees | | |
Investment Manager: Dodge & Cox, San Francisco. Managed by the Investment Policy Committee, whose nine members’ average tenure at Dodge & Cox is 21 years.
| | | | |
| PORTFOLIO CHARACTERISTICS | | Fund | | S&P 500 |
Number of Stocks | | 84 | | 500 |
Median Market Capitalization (billions) | | $31 | | $14 |
Weighted Average Market Capitalization (billions) | | $84 | | $103 |
Price-to-Earnings Ratio(b) | | 14.4x | | 15.2x |
Foreign Stocks(c) | | 19.0% | | 0.0% |
| | | |
| TEN LARGEST HOLDINGS(d) | | Fund | |
Hewlett-Packard Co. | | 3.6 | % |
Comcast Corp., Class A | | 3.5 | |
Wal-Mart Stores, Inc. | | 2.8 | |
Sony Corp. ADR (Japan) | | 2.7 | |
News Corp., Class A | | 2.7 | |
Chevron Corp. | | 2.7 | |
Motorola, Inc. | | 2.6 | |
Time Warner, Inc. | | 2.6 | |
Pfizer, Inc. | | 2.5 | |
Sanofi-Aventis ADR (France) | | 2.4 | |
| | | | | | |
| SECTOR DIVERSIFICATION | | Fund | | | S&P 500 | |
Consumer Discretionary | | 22.2 | % | | 10.2 | % |
Health Care | | 16.6 | | | 11.7 | |
Information Technology | | 15.4 | | | 15.4 | |
Financials | | 13.7 | | | 20.8 | |
Energy | | 10.4 | | | 10.8 | |
Industrials | | 7.6 | | | 11.4 | |
Materials | | 4.3 | | | 3.1 | |
Consumer Staples | | 4.1 | | | 9.3 | |
Telecommunication Services | | 2.9 | | | 3.8 | |
Utilities | | 0.4 | | | 3.5 | |
(a) | SEC yield is an annualization of the Fund’s total net investment income per share for the 30-day period ended on the last day of the month. |
(b) | Price-to-earnings (P/E) ratios are calculated using 12-month forward earnings estimates. |
(c) | Foreign stocks are U.S. dollar-denominated. |
(d) | The Fund’s portfolio holdings are subject to change without notice. The mention of specific securities is not a recommendation or solicitation for any person to buy, sell or hold any particular security. |
DODGE & COX STOCK FUND §PAGE 4
| | |
| PORTFOLIO OF INVESTMENTS (unaudited) | | June 30, 2007 |
| | | | | |
| COMMON STOCKS: 97.6% | | |
| | |
| | | SHARES | | VALUE |
| CONSUMER DISCRETIONARY: 22.2% | | | |
AUTOMOBILES & COMPONENTS: 0.4% | | | |
Honda Motor Co., Ltd. ADR(b) (Japan) | | 9,052,800 | | $ | 328,526,112 |
| | | | | |
CONSUMER DURABLES & APPAREL: 6.2% | | | |
Koninklijke Philips Electronics NV(b) (Netherlands) | | 8,602,100 | | | 364,040,872 |
Matsushita Electric Industrial Co., Ltd. ADR(b) (Japan) | | 79,681,300 | | | 1,578,486,553 |
Nike, Inc., Class B | | 7,111,800 | | | 414,546,822 |
Sony Corp. ADR(b) (Japan) | | 38,500,000 | | | 1,977,745,000 |
Thomson ADR(b) (France) | | 6,586,900 | | | 122,121,126 |
| | | | | |
| | | | | 4,456,940,373 |
CONSUMER SERVICES: 2.4% | | | | | |
McDonald’s Corp. | | 33,761,800 | | | 1,713,748,968 |
| | | | | |
MEDIA: 10.2% | | | | | |
Comcast Corp., Class A(a) | | 90,642,945 | | | 2,548,879,614 |
EchoStar Communications Corp.(a) | | 7,641,870 | | | 331,427,902 |
Interpublic Group of Companies, Inc.(a),(c) | | 28,804,600 | | | 328,372,440 |
Liberty Capital, Series A(a) | | 2,227,080 | | | 262,082,774 |
Liberty Global, Inc., Series A(a) | | 961,907 | | | 39,476,663 |
Liberty Global, Inc., Series C(a) | | 1,569,140 | | | 61,667,202 |
News Corp., Class A | | 91,316,338 | | | 1,936,819,529 |
Time Warner, Inc. | | 87,645,400 | | | 1,844,059,216 |
| | | | | |
| | | | | 7,352,785,340 |
RETAILING: 3.0% | | | | | |
Gap, Inc. | | 26,360,000 | | | 503,476,000 |
Genuine Parts Co.(c) | | 8,834,800 | | | 438,206,080 |
Home Depot, Inc. | | 14,501,000 | | | 570,614,350 |
Liberty Interactive, Series A(a) | | 8,856,900 | | | 197,774,577 |
Macy’s, Inc. | | 10,972,962 | | | 436,504,428 |
| | | | | |
| | | | | 2,146,575,435 |
| | | | | |
| | | | | 15,998,576,228 |
| CONSUMER STAPLES: 4.1% | | | |
FOOD & STAPLES RETAILING: 2.8% | | | |
Wal-Mart Stores, Inc. | | 42,307,500 | | | 2,035,413,825 |
| | | | | |
FOOD, BEVERAGE & TOBACCO: 0.8% | | | |
Unilever NV(b) (Netherlands) | | 18,549,800 | | | 575,414,796 |
| | | | | |
HOUSEHOLD & PERSONAL PRODUCTS: 0.5% |
Avon Products, Inc. | | 9,969,100 | | | 366,364,425 |
| | | | | |
| | | | | 2,977,193,046 |
| ENERGY: 10.4% | | | | | |
Baker Hughes, Inc. | | 14,476,100 | | | 1,217,874,293 |
Chevron Corp. | | 22,960,281 | | | 1,934,174,072 |
ConocoPhillips | | 11,043,100 | | | 866,883,350 |
Exxon Mobil Corp. | | 8,579,400 | | | 719,640,072 |
| | | | | |
| | | |
| | |
| | | SHARES | | VALUE |
Occidental Petroleum Corp. | | 15,210,800 | | $ | 880,401,104 |
Royal Dutch Shell PLC ADR(b) (United Kingdom) | | 10,057,864 | | | 838,322,964 |
Schlumberger, Ltd. | | 9,930,764 | | | 843,519,094 |
Spectra Energy Corp. | | 7,043,500 | | | 182,849,260 |
| | | | | |
| | | | | 7,483,664,209 |
| FINANCIALS: 13.7% | | | | | |
BANKS: 3.8% | | | | | |
HSBC Holdings PLC(b)
(United Kingdom) | | 7,700,500 | | | 706,674,885 |
Wachovia Corp. | | 31,702,735 | | | 1,624,765,169 |
Wells Fargo & Co. | | 11,865,100 | | | 417,295,567 |
| | | | | |
| | | | | 2,748,735,621 |
DIVERSIFIED FINANCIALS: 4.2% | | | |
Capital One Financial Corp. | | 16,436,411 | | | 1,289,272,079 |
Citigroup, Inc. | | 23,680,300 | | | 1,214,562,587 |
SLM Corp. | | 8,200,600 | | | 472,190,548 |
| | | | | |
| | | | | 2,976,025,214 |
INSURANCE: 5.7% | | | | | |
Aegon NV(b) (Netherlands) | | 34,984,991 | | | 687,455,073 |
Chubb Corp. | | 11,249,600 | | | 609,053,344 |
Genworth Financial, Inc., Class A | | 8,695,000 | | | 299,108,000 |
Loews Corp. | | 15,089,800 | | | 769,278,004 |
Safeco Corp. | | 3,913,415 | | | 243,649,218 |
The Travelers Companies, Inc. | | 22,750,350 | | | 1,217,143,725 |
Unum Group | | 11,024,100 | | | 287,839,251 |
| | | | | |
| | | | | 4,113,526,615 |
| | | | | |
| | | | | 9,838,287,450 |
| HEALTH CARE: 16.6% | | | | | |
HEALTH CARE EQUIPMENT & SERVICES: 5.5% |
Becton, Dickinson & Co. | | 4,042,150 | | | 301,140,175 |
Boston Scientific Corp.(a) | | 23,201,500 | | | 355,911,010 |
Cardinal Health, Inc.(c) | | 24,119,250 | | | 1,703,783,820 |
Health Management Associates, Inc.(c) | | 15,306,600 | | | 173,882,976 |
WellPoint, Inc.(a) | | 17,583,800 | | | 1,403,714,754 |
| | | | | |
| | | | | 3,938,432,735 |
PHARMACEUTICALS & BIOTECHNOLOGY: 11.1% |
Bristol-Myers Squibb Co. | | 20,300,350 | | | 640,679,046 |
GlaxoSmithKline PLC ADR(b) (United Kingdom) | | 30,218,900 | | | 1,582,563,793 |
Novartis AG ADR(b) (Switzerland) | | 19,204,200 | | | 1,076,779,494 |
Pfizer, Inc. | | 71,025,600 | | | 1,816,124,592 |
Sanofi-Aventis ADR(b) (France) | | 42,599,600 | | | 1,715,485,892 |
Thermo Fisher Scientific, Inc.(a) | | 9,114,700 | | | 471,412,284 |
Wyeth | | 11,842,800 | | | 679,066,152 |
| | | | | |
| | | | | 7,982,111,253 |
| | | | | |
| | | | | 11,920,543,988 |
| | |
| PAGE 5 § DODGE & COX STOCK FUND | | See accompanying Notes to Financial Statements |
| | |
| PORTFOLIO OF INVESTMENTS (unaudited) | | June 30, 2007 |
| | | | | |
| COMMON STOCKS (continued) | | |
| | |
| | | SHARES | | VALUE |
| INDUSTRIALS: 7.6% | | | | | |
CAPITAL GOODS: 3.1% | | | | | |
General Electric Co. | | 21,166,200 | | $ | 810,242,136 |
Masco Corp. | | 12,912,800 | | | 367,627,416 |
Tyco International, Ltd. | | 31,072,800 | | | 1,049,949,912 |
| | | | | |
| | | | | 2,227,819,464 |
COMMERCIAL SERVICES & SUPPLIES: 0.6% |
Pitney Bowes, Inc. | | 9,275,250 | | | 434,267,205 |
| | | | | |
TRANSPORTATION: 3.9% | | | | | |
FedEx Corp. | | 11,859,250 | | | 1,316,020,973 |
Union Pacific Corp.(c) | | 12,979,600 | | | 1,494,600,940 |
| | | | | |
| | | | | 2,810,621,913 |
| | | | | |
| | | | | 5,472,708,582 |
| INFORMATION TECHNOLOGY: 15.4% |
SOFTWARE & SERVICES: 4.2% | | | | | |
BMC Software, Inc.(a),(c) | | 10,879,200 | | | 329,639,760 |
Citrix Systems, Inc.(a) | | 5,067,702 | | | 170,629,526 |
Computer Sciences Corp.(a),(c) | | 12,762,300 | | | 754,890,045 |
Compuware Corp.(a),(c) | | 19,321,600 | | | 229,154,176 |
EBay, Inc.(a) | | 17,753,400 | | | 571,304,412 |
Electronic Data Systems Corp.(c) | | 34,221,000 | | | 948,948,330 |
| | | | | |
| | | | | 3,004,566,249 |
TECHNOLOGY, HARDWARE & EQUIPMENT: 11.2% |
Avaya, Inc.(a),(c) | | 30,386,224 | | | 511,704,012 |
Dell, Inc.(a) | | 26,746,133 | | | 763,602,097 |
Hewlett-Packard Co. | | 58,399,293 | | | 2,605,776,454 |
Hitachi, Ltd. ADR(b) (Japan) | | 10,342,000 | | | 731,696,500 |
Motorola, Inc. | | 107,157,600 | | | 1,896,689,520 |
NCR Corp.(a) | | 5,895,750 | | | 309,762,705 |
Sun Microsystems, Inc.(a) | | 53,595,300 | | | 281,911,278 |
Xerox Corp.(a),(c) | | 53,804,400 | | | 994,305,312 |
| | | | | |
| | | | | 8,095,447,878 |
| | | | | |
| | | | | 11,100,014,127 |
| MATERIALS: 4.3% | | | | | |
Alcoa, Inc. | | 8,061,583 | | | 326,735,959 |
Cemex SAB de CV ADR(b) (Mexico) | | 10,023,682 | | | 369,873,866 |
Dow Chemical Co. | | 33,396,352 | | | 1,476,786,685 |
International Paper Co. | | 7,575,200 | | | 295,811,560 |
Nova Chemicals Corp.(b),(c) (Canada) | | 4,441,870 | | | 157,997,316 |
Rohm and Haas Co. | | 8,684,700 | | | 474,879,396 |
| | | | | |
| | | | | 3,102,084,782 |
| TELECOMMUNICATION SERVICES: 2.9% |
Sprint Nextel Corp. | | 59,361,900 | | | 1,229,384,949 |
Vodafone Group PLC ADR(b) (United Kingdom) | | 25,404,587 | | | 854,356,261 |
| | | | | |
| | | | | 2,083,741,210 |
| UTILITIES: 0.4% | | | | | |
FirstEnergy Corp. | | 3,836,000 | | | 248,304,280 |
| | | | | |
| | | | | 248,304,280 |
TOTAL COMMON STOCKS
(Cost $49,738,355,189) | | | | $ | 70,225,117,902 |
| | | | | |
| | | | | | | | |
| SHORT-TERM INVESTMENTS: 2.5% | |
| | |
| | | PAR VALUE | | | VALUE | |
Fixed Income Clearing Corporation Repurchase Agreement(d) 5.05%, 7/2/07, maturity value $1,730,305,864 | | $ | 1,729,578,000 | | | $ | 1,729,578,000 | |
SSgA Prime Money Market Fund | | | 72,185,391 | | | | 72,185,391 | |
| | | | | | | | |
TOTAL SHORT-TERM INVESTMENTS
(Cost $1,801,763,391) | | | $ | 1,801,763,391 | |
| | | | | | | | |
TOTAL INVESTMENTS
(Cost $51,540,118,580) | | | 100.1 | % | | $ | 72,026,881,293 | |
OTHER ASSETS LESS LIABILITIES | | | (0.1 | %) | | | (49,459,516 | ) |
| | | | | | | | |
| TOTAL NET ASSETS | | | 100.0 | % | | $ | 71,977,421,777 | |
| | | | | | | | |
(b) | Security issued by a foreign entity, denominated in U.S. dollars |
(c) | See Note 6 regarding holdings of 5% voting securities |
(d) | Repurchase agreement is collateralized by Freddie Mac 4.125%-5.40%, 6/11/09-3/2/12; Fannie Mae 5.08%-5.30%, 5/14/10-5/7/12; Federal Home Loan Bank 5.25%-5.60%, 6/12/09-5/15/12; and Federal Farm Credit Bank 5.00%-5.25%, 8/3/09-10/23/09. Total collateral value is $1,764,178,143. |
ADR: American Depository Receipt
| | |
| See accompanying Notes to Financial Statements | | DODGE & COX STOCK FUND §PAGE 6 |
| | | |
STATEMENT OF ASSETS AND LIABILITIES (unaudited) |
| | | June 30, 2007 |
ASSETS: | | | |
Investments, at value | | | |
Unaffiliated issuers (cost $46,966,058,020) | | $ | 65,455,997,026 |
Affiliated issuers (cost $4,574,060,560) | | | 6,570,884,267 |
| | | |
| | | 72,026,881,293 |
Receivable for investments sold | | | 68,232,668 |
Receivable for Fund shares sold | | | 51,077,342 |
Dividends and interest receivable | | | 138,163,895 |
Prepaid expenses and other assets | | | 95,135 |
| | | |
| | | 72,284,450,333 |
LIABILITIES: | | | |
Payable for investments purchased | | | 131,288,917 |
Payable for Fund shares redeemed | | | 143,543,532 |
Management fees payable | | | 29,920,882 |
Accrued expenses | | | 2,275,225 |
| | | |
| | | 307,028,556 |
| | | |
NET ASSETS | | $ | 71,977,421,777 |
| | | |
NET ASSETS CONSIST OF: | | | |
Paid in capital | | $ | 49,140,366,157 |
Undistributed net investment income | | | 48,065,456 |
Undistributed net realized gain on investments | | | 2,302,227,451 |
Net unrealized appreciation on investments | | | 20,486,762,713 |
| | | |
| | $ | 71,977,421,777 |
| | | |
Fund shares outstanding (par value $0.01 each, unlimited shares authorized) | | | 444,050,891 |
Net asset value per share | | | $162.09 |
|
STATEMENT OF OPERATIONS
(unaudited) |
| | | Six Months Ended
June 30, 2007 |
INVESTMENT INCOME: | | | |
Dividends (net of foreign taxes of $13,329,799) | | | |
Unaffiliated issuers | | $ | 535,265,263 |
Affiliated issuers | | | 178,828,791 |
Interest | | | 73,189,922 |
| | | |
| | | 787,283,976 |
EXPENSES: | | | |
Management fees | | | 173,258,016 |
Custody and fund accounting fees | | | 437,275 |
Transfer agent fees | | | 2,178,693 |
Professional services | | | 61,517 |
Shareholder reports | | | 2,316,088 |
Registration fees | | | 452,411 |
Trustees’ fees | | | 84,188 |
Miscellaneous | | | 705,649 |
| | | |
| | | 179,493,837 |
| | | |
NET INVESTMENT INCOME | | | 607,790,139 |
| |
REALIZED AND UNREALIZED GAIN ON INVESTMENTS: | | | |
Net realized gain | | | |
Unaffiliated issuers | | | 1,999,025,235 |
Affiliated issuers | | | 303,202,216 |
Net change in unrealized appreciation | | | 1,937,773,051 |
| | | |
Net realized and unrealized gain | | | 4,240,000,502 |
| | | |
NET INCREASE IN NET ASSETS FROM OPERATIONS | | $ | 4,847,790,641 |
| | | |
| | | | | | | | |
STATEMENT OF CHANGES IN NET ASSETS (unaudited) | |
| | | Six Months Ended
June 30, 2007 | | | Year Ended December 31, 2006 | |
OPERATIONS: | | | | | | | | |
Net investment income | | $ | 607,790,139 | | | $ | 865,519,931 | |
Net realized gain | | | 2,302,227,451 | | | | 3,209,367,265 | |
Net change in unrealized appreciation | | | 1,937,773,051 | | | | 5,995,600,442 | |
| | | | | | | | |
Net increase in net assets from operations | | | 4,847,790,641 | | | | 10,070,487,638 | |
| |
DISTRIBUTIONS TO
SHAREHOLDERS FROM: | | | | | |
Net investment income | | | (577,622,043 | ) | | | (850,295,361 | ) |
Net realized gain | | | (462,894,616 | ) | | | (2,847,558,997 | ) |
| | | | | | | | |
Total distributions | | | (1,040,516,659 | ) | | | (3,697,854,358 | ) |
| | |
FUND SHARE TRANSACTIONS: | | | | | | | | |
Proceeds from sale of shares | | | 5,032,416,771 | | | | 10,571,607,422 | |
Reinvestment of distributions | | | 980,191,190 | | | | 3,483,584,887 | |
Cost of shares redeemed | | | (4,027,466,135 | ) | | | (6,427,028,935 | ) |
| | | | | | | | |
Net increase from Fund share transactions | | | 1,985,141,826 | | | | 7,628,163,374 | |
| | | | | | | | |
Total increase in net assets | | | 5,792,415,808 | | | | 14,000,796,654 | |
| | |
NET ASSETS: | | | | | | | | |
Beginning of period | | | 66,185,005,969 | | | | 52,184,209,315 | |
| | | | | | | | |
End of period (including undistributed net investment income of $48,065,456 and $17,897,360, respectively) | | $ | 71,977,421,777 | | | $ | 66,185,005,969 | |
| | | | | | | | |
| |
SHARE INFORMATION: | | | | | |
Shares sold | | | 31,881,995 | | | | 71,830,464 | |
Distributions reinvested | | | 6,269,096 | | | | 22,836,316 | |
Shares redeemed | | | (25,392,890 | ) | | | (43,682,824 | ) |
| | | | | | | | |
Net increase in shares outstanding | | | 12,758,201 | | | | 50,983,956 | |
| | | | | | | | |
| | |
| PAGE 7 § DODGE & COX STOCK FUND | | See accompanying Notes to Financial Statements |
NOTES TO FINANCIAL STATEMENTS (unaudited)
NOTE 1—ORGANIZATION AND SIGNIFICANT ACCOUNTING POLICIES
Dodge & Cox Stock Fund (the “Fund”) is one of the series constituting the Dodge & Cox Funds (the “Trust” or the “Funds”). The Trust is organized as a Delaware statutory trust and is registered under the Investment Company Act of 1940, as amended, as a diversified, open-end management investment company. The Fund commenced operations on January 4, 1965, and seeks long-term growth of principal and income. Risk considerations and investment strategies of the Fund are discussed in the Fund’s Prospectus. The Fund is closed to new investors.
The financial statements have been prepared in conformity with accounting principles generally accepted in the United States of America, which require the use of estimates and assumptions by management. Significant accounting policies are as follows:
Security valuation The Fund’s net assets are valued as of the close of trading on the New York Stock Exchange (NYSE), generally 4:00 p.m. Eastern Time, each day that the NYSE is open for business. Stocks are valued at the official quoted close price or the last sale of the day at the close of the NYSE or, if not available, at the mean between the exchange listed bid and ask prices for the day. A security that is listed or traded on more than one exchange is valued at the quotation on the exchange determined to be the primary market for such security. Security values are not discounted based on the size of the Fund’s position. Securities for which market quotations are not readily available are valued at fair value as determined in good faith by or at the direction of the Board of Trustees. Short-term securities are valued at amortized cost which approximates current value. All securities held by the Fund are denominated in U.S. dollars.
Security transactions, investment income, expenses, and distributions Security transactions are recorded on the trade date. Realized gains and losses on securities sold are determined on the basis of identified cost.
Dividend income and corporate action transactions are recorded on the ex-dividend date, except for certain dividends or corporate actions from foreign securities where the ex-dividend date may have passed, which are
recorded as soon as the Fund is informed of the ex-dividend date. Withholding taxes on foreign dividends have been provided for in accordance with the Fund’s understanding of the applicable country’s tax rules and rates. Non-cash dividends included in dividend income, if any, are recorded at the fair market value of the securities received. Distributions received in excess of income are recorded as a reduction of cost of investments and/or realized gain. The Fund may estimate the character of distributions received from Real Estate Investment Trusts (“REITs”). Interest income is recorded on the accrual basis.
Expenses are recorded on the accrual basis. Most expenses of the Trust can be directly attributed to a specific series. Expenses which cannot be directly attributed are apportioned among the Funds in the Trust.
Distributions to shareholders are recorded on the ex-dividend date.
Repurchase agreements The Fund may enter into repurchase agreements secured by U.S. government and agency securities which involve the purchase of securities from a counterparty with a simultaneous commitment to resell the securities at an agreed-upon date and price. It is the Fund’s policy that its custodian take possession of the underlying collateral securities, the fair value of which exceeds the principal amount of the repurchase transaction, including accrued interest, at all times. In the event of default by the counterparty, the Fund has the contractual right to liquidate the securities and to apply the proceeds in satisfaction of the obligation.
NOTE 2—RELATED PARTY TRANSACTIONS
Management fees Under a written agreement approved by a unanimous vote of the Board of Trustees, the Fund pays an annual management fee of 0.50% of the Fund’s average daily net assets to Dodge & Cox, investment manager of the Fund. The agreement further provides that Dodge & Cox shall waive its fee to the extent that such fee plus all other ordinary operating expenses of the Fund exceed 0.75% of the average daily net assets for the year.
Fund officers and trustees All officers and three of the trustees of the Trust are officers or employees of Dodge & Cox. The Trust pays a fee only to those trustees who are not affiliated with Dodge & Cox.
DODGE & COX STOCK FUND §PAGE 8
NOTES TO FINANCIAL STATEMENTS (unaudited)
Indemnification Under the Trust’s organizational documents, its officers and trustees are indemnified against certain liabilities arising out of the performance of their duties to the Trust. In addition, in the normal course of business the Trust enters into contracts that provide general indemnities to other parties. The Trust’s maximum exposure under these arrangements is unknown as this would involve future claims that may be made against the Trust that have not yet occurred.
NOTE 3—INCOME TAX INFORMATION
A provision for federal income taxes is not required since the Fund intends to continue to qualify as a regulated investment company under Subchapter M of the Internal Revenue Code and distribute all of its taxable income to shareholders. Distributions are determined in accordance with income tax regulations, which may differ from net investment income and realized gains for financial reporting purposes. Financial reporting records are adjusted for permanent book/tax differences to reflect tax character. Financial records are not adjusted for temporary differences.
Book/tax differences are primarily due to differing treatments of net short-term realized gain. At June 30, 2007, the cost of investments for federal income tax purposes was equal to the cost for financial reporting purposes.
Distributions for the six months ended June 30, 2007 and for the year ended December 31, 2006 were characterized as follows for federal income tax purposes:
| | | | |
| | | Six Months Ended
June 30, 2007 | | Year Ended
December 31, 2006 |
Ordinary income | | $623,087,628 | | $952,202,374 |
| | ($1.414 per share) | | ($2.367 per share) |
| | |
Long-term capital gain | | $417,429,031 | | $2,745,651,984 |
| | ($0.951 per share) | | ($6.663 per share) |
At June 30, 2007, the tax basis components of distributable earnings were as follows:
| | | | |
Unrealized appreciation | | $ | 20,798,090,867 | |
Unrealized depreciation | | | (311,328,154 | ) |
| | | | |
Net unrealized appreciation | | | 20,486,762,713 | |
Undistributed ordinary income | | | 268,162,421 | |
Undistributed long-term capital gain | | | 2,082,130,486 | |
NOTE 4—PURCHASES AND SALES OF INVESTMENTS
For the six months ended June 30, 2007, purchases and sales of securities, other than short-term securities, aggregated $8,382,272,233 and $5,657,539,986, respectively.
NOTE 5—ACCOUNTING PRONOUNCEMENTS
In July 2006, the Financial Accounting Standards Board (FASB) issued Interpretation 48, “Accounting for Uncertainty in Income Taxes” (FIN 48). FIN 48 clarifies the accounting for income taxes by prescribing the minimum recognition threshold a tax position must meet before being recognized in the financial statements. FIN 48 was effective for the Fund on June 29, 2007. Implementation of FIN 48 included a review of tax positions taken from January 1, 2003 through June 30, 2007. There was no impact to the Fund’s financial statements as a result of implementing FIN 48.
In September 2006, FASB issued “Statement of Financial Accounting Standards No. 157, Fair Value Measurements” (SFAS 157). SFAS 157 is effective for the Fund beginning January 1, 2008. It defines fair value, establishes a framework for measuring fair value and expands disclosures about fair value measurements. Management is currently evaluating the impact the adoption of SFAS 157 will have on the Fund’s financial statement disclosures.
PAGE 9 § DODGE & COX STOCK FUND
NOTES TO FINANCIAL STATEMENTS (unaudited)
NOTE 6—HOLDINGS OF 5% VOTING SECURITIES
Each of the companies listed below is considered to be an affiliate of the Fund because the Fund owned 5% or more of the company’s voting securities during the six months ended June 30, 2007. Transactions during the period in securities of affiliated companies were as follows:
| | | | | | | | | | | | | | | | | |
| | | Shares at
Beginning of Period | | Additions | | Reductions | | | Shares at
End of Period | |
| Dividend
Income |
(a) | | | Value at End of Period | |
American Power Conversion Corp. | | 13,409,652 | | — | | (13,409,652 | ) | | — | | $ | — | | | $ | — | |
Avaya, Inc. | | 31,094,924 | | 6,100 | | (714,800 | ) | | 30,386,224 | | | — | (b) | | | 511,704,012 | |
BMC Software, Inc. | | 10,876,500 | | 2,700 | | — | | | 10,879,200 | | | — | (b) | | | 329,639,760 | |
Cardinal Health, Inc. | | 24,264,150 | | 5,100 | | (150,000 | ) | | 24,119,250 | | | 5,078,123 | | | | 1,703,783,820 | |
Computer Sciences Corp. | | 12,858,900 | | 3,400 | | (100,000 | ) | | 12,762,300 | | | — | (b) | | | 754,890,045 | |
Compuware Corp. | | 19,312,600 | | 9,000 | | — | | | 19,321,600 | | | — | (b) | | | 229,154,176 | |
Electronic Data Systems Corp. | | 34,711,300 | | 9,700 | | (500,000 | ) | | 34,221,000 | | | 3,471,465 | | | | 948,948,330 | |
Genuine Parts Co. | | 8,931,300 | | 3,500 | | (100,000 | ) | | 8,834,800 | | | 6,521,382 | | | | 438,206,080 | |
Health Management Associates, Inc. | | 15,303,200 | | 3,400 | | — | | | 15,306,600 | | | 153,055,000 | | | | 173,882,976 | |
Interpublic Group of Companies, Inc. | | 27,499,200 | | 1,305,400 | | — | | | 28,804,600 | | | — | (b) | | | 328,372,440 | |
Nova Chemicals Corp. (Canada) | | 4,740,470 | | 1,400 | | (300,000 | ) | | 4,441,870 | | | 700,101 | | | | 157,997,316 | |
Union Pacific Corp. | | 15,120,650 | | 3,750 | | (2,144,800 | ) | | 12,979,600 | | | 10,002,720 | | | | — | (c) |
Xerox Corp. | | 63,334,900 | | 12,400 | | (9,542,900 | ) | | 53,804,400 | | | — | (b) | | | 994,305,312 | |
| | | | | | | | | | | | | | | | | |
| | | | | | | | | | | $ | 178,828,791 | | | $ | 6,570,884,267 | |
| | | | | | | | | | | | | | | | | |
| | | | | | | | | | | | | | | | | | |
(a) | Net of foreign taxes, if any |
(c) | Company was not an affiliate at the end of the period |
DODGE & COX STOCK FUND §PAGE 10
FINANCIAL HIGHLIGHTS (unaudited)
| | | | | | | | | | | | | | | | | | |
SELECTED DATA AND RATIOS (for a share outstanding throughout each period) | | Six Months Ended June 30, | | | Year Ended December 31, | |
| | | 2007 | | | 2006 | | | 2005 | | | 2004 | | | 2003 | | | 2002 | |
Net asset value, beginning of period | | $153.46 | | | $137.22 | | | $130.22 | | | $113.78 | | | $ 88.05 | | | $100.51 | |
Income from investment operations: | | | | | | | | | | | | | | | | | | |
Net investment income | | 1.38 | | | 2.15 | | | 1.68 | | | 1.54 | | | 1.60 | | | 1.53 | |
Net realized and unrealized gain (loss) | | 9.62 | | | 23.12 | | | 10.36 | | | 20.08 | | | 26.59 | | | (12.06 | ) |
| | | | | | |
Total from investment operations | | 11.00 | | | 25.27 | | | 12.04 | | | 21.62 | | | 28.19 | | | (10.53 | ) |
| | | | | | |
Distributions to shareholders from: | | | | | | | | | | | | | | | | | | |
Net investment income | | (1.31 | ) | | (2.12 | ) | | (1.70 | ) | | (1.53 | ) | | (1.62 | ) | | (1.51 | ) |
Net realized gain | | (1.06 | ) | | (6.91 | ) | | (3.34 | ) | | (3.65 | ) | | (0.84 | ) | | (0.42 | ) |
| | | | | | |
Total distributions | | (2.37 | ) | | (9.03 | ) | | (5.04 | ) | | (5.18 | ) | | (2.46 | ) | | (1.93 | ) |
| | | | | | |
Net asset value, end of period | | $162.09 | | | $153.46 | | | $137.22 | | | $130.22 | | | $113.78 | | | $ 88.05 | |
| | | | | | |
Total return | | 7.22 | % | | 18.54 | % | | 9.36 | % | | 19.16 | % | | 32.35 | % | | (10.52 | )% |
Ratios/supplemental data: | | | | | | | | | | | | | | | | | | |
Net assets, end of period (millions) | | $71,977 | | | $66,185 | | | $52,184 | | | $43,266 | | | $29,437 | | | $14,036 | |
Ratios of expenses to average net assets | | 0.52 | %* | | 0.52 | % | | 0.52 | % | | 0.53 | % | | 0.54 | % | | 0.54 | % |
Ratios of net investment income to average net assets | | 1.75 | %* | | 1.48 | % | | 1.29 | % | | 1.32 | % | | 1.72 | % | | 1.74 | % |
Portfolio turnover rate | | 8 | % | | 14 | % | | 12 | % | | 11 | % | | 8 | % | | 13 | % |
| | | | | | | | | | | | | | | | | | | |
See accompanying Notes to Financial Statements
PAGE 11 § DODGE & COX STOCK FUND
SHAREHOLDER MEETING RESULTS
A special meeting of Fund shareholders was held on April 17, 2007. The meeting was adjourned in order to permit shareholders further time to respond to the solicitation of proxies and was reconvened on April 27, 2007. At the meeting, the proposals to amend the Fund’s fundamental investment restrictions listed below were approved. The following is a report of the total votes cast by the Fund’s shareholders:
| | | | | | | | |
PROPOSAL | | FOR | | AGAINST | | ABSTAIN | | TOTAL |
1. Amend the Fund’s fundamental investment restrictions with respect to the percentage of the Fund’s assets that are subject to diversification requirements | | 199,406,974 | | 15,579,846 | | 8,763,681 | | 223,750,501 |
| | | | |
2a. Amend the Fund’s fundamental investment restrictions with respect to investments in real estate | | 202,647,924 | | 10,861,276 | | 10,241,304 | | 223,750,504 |
| | | | |
2b. Amend the Fund’s fundamental investment restrictions with respect to investments in commodities and commodity contracts | | 201,967,285 | | 12,823,310 | | 8,959,906 | | 223,750,501 |
| | | | |
3. Amend the Fund’s fundamental investment restrictions with respect to making loans | | 203,031,891 | | 11,676,137 | | 9,042,475 | | 223,750,503 |
| | | | |
4. Eliminate the Fund’s fundamental investment restrictions with respect to investments in oil, gas and mineral leases or other mineral exploration or development programs | | 200,479,179 | | 12,937,848 | | 10,333,472 | | 223,750,499 |
| | | | |
5. Amend the Fund’s fundamental investment restrictions with respect to borrowing and issuing senior securities | | 200,893,655 | | 13,783,940 | | 9,072,770 | | 223,750,365 |
FUND HOLDINGS
The Fund provides a complete list of its holdings four times each fiscal year, as of the end of each quarter. The lists appear in the Fund’s First Quarter, Semi-Annual, Third Quarter and Annual Reports to shareholders. The Fund files the lists with the Securities and Exchange Commission (SEC) on Form N-CSR (second and fourth quarters) and Form N-Q (first and third quarters). Shareholders may view the Fund’s Forms N-CSR and N-Q on the SEC’s website at www.sec.gov. Forms N-CSR and N-Q may also be reviewed and copied at the SEC’s Public Reference Room in Washington, DC. Information regarding the operations of the Public Reference Room may be obtained by 1-202-942-8090 (direct) or 1-800-732-0330 (general SEC number). A complete list of the Fund’s quarter-end holdings is also available at www.dodgeandcox.com on or about 15 days following each quarter end and remains available on the web site until the list is updated in the subsequent quarter.
PROXY VOTING
For a free copy of the Fund’s proxy voting policies and procedures, please call 1-800-621-3979, visit the Fund’s web site at www.dodgeandcox.com or visit the SEC’s web site at www.sec.gov. Information regarding how the Fund voted proxies relating to portfolio securities during the most recent 12-month period ending June 30 is also available at www.dodgeandcox.com or at www.sec.gov.
DODGE & COX STOCK FUND §PAGE 12
THIS PAGE INTENTIONALLY LEFT BLANK
PAGE 13 § DODGE & COX STOCK FUND
THIS PAGE INTENTIONALLY LEFT BLANK
DODGE & COX STOCK FUND §PAGE 14
DODGE & COX FUNDS—EXECUTIVE OFFICER & TRUSTEE INFORMATION
| | | | | | |
Name (Age) and
Address* | | Position with Trust
(Year of Election or
Appointment) | | Principal Occupation During Past 5 Years | | Other Directorships Held by Trustees |
| INTERESTED TRUSTEES & OFFICERS |
John A. Gunn (63) | | Chairman and Trustee
(Trustee since 1985) | | Chairman (since 2007), Chief Executive Officer (since 2005) and Director of Dodge & Cox, Portfolio Manager and member of Investment Policy Committee (IPC), Fixed Income Investment Policy Committee (FIIPC) and International Investment Policy Committee (IIPC) | | — |
Kenneth E. Olivier (55) | | President and Trustee
(Trustee since 2005) | | President (since 2005) and Director of Dodge & Cox, Portfolio Manager and member of IPC | | — |
Dana M. Emery (45) | | Vice President and Trustee (Trustee since 1993) | | Executive Vice President (since 2005) and Director of Dodge & Cox, Manager of the Fixed Income Department, Portfolio Manager and member of FIIPC | | — |
| Katherine Herrick Drake (53) | | Vice President (Since 1993) | | Vice President of Dodge & Cox, Portfolio Manager | | — |
| Diana S. Strandberg (47) | | Vice President
(Since 2005) | | Vice President of Dodge & Cox, Portfolio Manager and member of IPC and IIPC | | — |
| Roberta R.W. Kameda (46) | | Assistant Secretary (Since 2007) | | Senior Counsel (since 2006) of Dodge & Cox, Senior Associate General Counsel, Franklin Templeton Investments (1997-2006) | | — |
John M. Loll (40) | | Assistant
Treasurer and Assistant Secretary (Since 2000) | | Vice President and Treasurer of Dodge & Cox | | — |
David H. Longhurst (49) | | Treasurer (Since 2006) | | Fund Administration and Accounting Senior Manager of Dodge & Cox (since 2004); Vice President, Treasurer, Controller and Secretary of Safeco Mutual Funds, Safeco Asset Management Company, Safeco Services, Safeco Securities, and Safeco Investment Services (2000-2004) | | — |
| Thomas M. Mistele (53) | | Secretary (Since 2000) | | Chief Operating Officer (since 2004), Director (since 2005), Secretary and General Counsel of Dodge & Cox | | — |
| Marcia P. Venegas (38) | | Chief Compliance Officer
(Since 2004) | | Chief Compliance Officer of Dodge & Cox (since 2005), Compliance Officer of Dodge & Cox (2003-2004); Compliance and Business Risk Manager of Deutsche Asset Management, Australia Limited (1999-2001) | | — |
| INDEPENDENT TRUSTEES |
William F. Ausfahl (67) | | Trustee (Since 2002) | | CFO, The Clorox Co. (1982-1997); Director, The Clorox Co. (1984-1997) | | — |
L. Dale Crandall (65) | | Trustee (Since 1999) | | President, Kaiser Foundation Health Plan, Inc. and Kaiser Foundation Hospitals (2000-2002); Senior Vice President—Finance and Administration & CFO, Kaiser Foundation Health Plan, Inc. and Kaiser Foundation Hospitals (1998-2000) | | Director, Union BanCal Corporation (bank holding company) and Union Bank of California (commercial bank) (2001-Present); Director, Covad Communications Group (broadband communications services) (2002-Present); Director, Ansell Limited (medical equipment and supplies) (2002-Present); Director, BEA Systems, Inc. (software and programming) (2003-Present); Director, Coventry Health Care, Inc. (managed healthcare) (2004-Present) |
Thomas A. Larsen (57) | | Trustee (Since 2002) | | Director in Howard, Rice, Nemerovski, Canady, Falk & Rabkin (law firm) | | — |
John B. Taylor (60) | | Trustee (Since 2005) | | Professor of Economics, Stanford University; Senior Fellow, Hoover Institution; Under Secretary for International Affairs, United States Treasury (2001-2005) | | — |
Will C. Wood (67) | | Trustee (Since 1992) | | Principal, Kentwood Associates, Financial Advisers | | Director, Banco Latinoamericano de Exportaciones S.A. (Latin American Foreign Trade Bank) (1999-Present) |
| * | | The address for each Officer and Trustee is 555 California Street, 40th Floor, San Francisco, California 94104. Each Officer and Trustee oversees all four series in the Dodge & Cox Funds complex and serves for an indefinite term. |
Additional information about the Trust’s Trustees and Officers is available in the Trust’s Statement of Additional Information (SAI). You can get a free copy of the SAI by visiting the Funds’ website at www.dodgeandcox.com or calling
1-800-621-3979.
| | | | |
| PAGE | | 15 § DODGE & COX STOCK FUND | | |
| | | | |
 | | | |  |
www.dodgeandcox.com
For Fund literature, transactions and account information, please visit the Funds’ web site.
or write or call:
DODGE & COX FUNDS
c/o Boston Financial Data Services
P.O. Box 8422
Boston, Massachusetts 02266-8422
(800) 621-3979
INVESTMENT MANAGER
Dodge & Cox
555 California Street, 40th Floor
San Francisco, California 94104
(415) 981-1710
This report is submitted for the general information of the shareholders of the Fund. The report is not authorized for distribution to prospective investors in the Fund unless it is accompanied by a current prospectus.
This report reflects our views, opinions and portfolio holdings as of June 30, 2007, the end of the reporting period. Any such views are subject to change at any time based upon market or other conditions and Dodge & Cox disclaims any responsibility to update such views. These views may not be relied on as investment advice and, because investment decisions for a Dodge & Cox Fund are based on numerous factors, may not be relied on as an indication of trading intent on behalf of any Dodge & Cox Fund.
06/07 ISF SAR  Printed on recycled paper
Semi-Annual Report
June 30, 2007
International Stock Fund
ESTABLISHED 2001
TO OUR SHAREHOLDERS
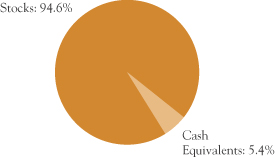
The Dodge & Cox International Stock Fund had a total return of 12.0% for the first six months of 2007, compared to a total return of 10.7% for its benchmark, the Morgan Stanley Capital International Europe, Australasia, Far East Index (MSCI EAFE). Longer-term results can be found on page 3. As of June 30, the Fund had net assets of $46.4 billion with a cash position of 5.4%.
SIX-MONTH PERFORMANCE REVIEW
Global equity markets appreciated strongly during the past six months. U.S. dollar-based investors were helped by the dollar’s depreciation against developed and emerging market currencies. MSCI Japan was a notable exception to this trend: performance lagged and the yen depreciated against the U.S. dollar, resulting in only a 3% return in U.S. dollars.
For the six months ended June 30, 2007, the Fund performed well both on an absolute basis and relative to the MSCI EAFE.
Key Contributors to Results
| n | | The Fund benefited from its overweight position in Information Technology (12% versus 6%) and stock selection. Its holdings averaged a return of 19% compared to 9% for the MSCI EAFE Information Technology sector. Notable performers included LG.Philips (up 50%) and Nokia (up 40%). |
| n | | The Fund benefited from its slightly overweight position in Energy. In addition, the Fund’s investments in this sector returned 23%, outperforming the MSCI EAFE Energy sector, which returned 17%. Significant contributors include Ultrapar Participacoes (up 47%), Schlumberger (up 35%) and Norsk Hydro (up 25%). |
| n | | Other notable performers included Volvo (up 55%), Bayer (up 44%), Imperial Chemical Industries (up 43%), BASF (up 39%) and Vodafone (up 24%). |
Key Detractors from Results
| n | | The Fund is overweight the Pharmaceutical industry, compared to the MSCI EAFE (7% vs. 5%). Its holdings in this area were down 3% (e.g. Sanofi-Aventis was down 10%) compared to a decline of 1% for the MSCI EAFE Pharmaceutical industry. |
| n | | The Fund’s Japanese holdings, which are roughly equal in weight to the MSCI EAFE, were weak in general. Three Japanese bank holdings detracted from performance: Shinsei (down 31%), Mitsubishi Tokyo UFJ (down 11%) and Bank of Yokohama (down 8%). Other weak Japanese holdings included Mediceo Paltac (down 19%) and Toto (down 13%). |
INVESTMENT STRATEGY
As persistent, long-term investors, our team of global industry analysts uses a three-to-five year time frame when evaluating individual companies. We construct the Fund one company at a time after formal written and oral advocacy by a research analyst, intense peer scrutiny and a thorough review by the International Investment Policy Committee. Historically, this approach has resulted in low portfolio turnover.
Our long-term approach does not preclude us from moving opportunistically. This half year was particularly busy as we added 20 new companies to the Fund. We do not have a pre-specified objective for the number of companies in the Fund. While the number of new investments is higher than usual, it reflects our analysts’ response to changes in the market and our evaluation of these companies’ prospects. One change that we have discussed in recent letters is that the market is not differentiating, to the same degree as in years past, between companies with different growth prospects and business franchises (i.e. valuations for companies are much more similar). We believe this creates opportunity in two broad areas in particular: Financials and large-capitalization Pharmaceuticals.
Financials
The past few years have been very profitable for Financials around the globe. Over the next decade, we believe that Financials located in Japan and the developing world have the potential for an even brighter future.
In Japan, concerns over the low interest-rate environment, weak demand for corporate loans and changes to the consumer finance industry have dampened investor enthusiasm toward the sector. As a result, we believe valuations have declined to an attractive level. Going forward, higher interest rates and faster economic growth could lead to better than expected earnings. In
PAGE 1 § DODGE & COX INTERNATIONAL STOCK FUND
addition to increasing the Fund’s position in Mitsubishi UFJ, we have established new holdings in Bank of Yokohama (the largest regional bank in Japan, with a 25% market share in one of the country’s fastest growing and wealthiest prefectures) and Millea (the holding company of the nation’s largest and oldest property and casualty insurer). We use these examples and those below to illustrate our investment process, not to imply that we think they are more attractive than the Fund’s other holdings.
In the developing world, financial institutions should benefit from consumers’ growing affluence and increasing use of financial products. Over the past six months, we have added significantly to the Fund’s holdings of HSBC Holdings and Standard Chartered—two United Kingdom-domiciled banks with substantial franchises in the developing world. We have also initiated investments in several emerging market banks such as Shinhan Financial (the second largest bank in Korea), Bangkok Bank (the largest bank in Thailand) and Haci Omer Sabanci Holdings (a Turkish conglomerate whose primary value is its stake in leading financial institutions).
Pharmaceuticals
Another area of emphasis over the past six months has been large-capitalization, Europe-based pharmaceutical companies. Over the past two years valuations in this group have fallen, resulting in substantial underperformance for these stocks. Some reasons for investor pessimism include: patent expirations, increased competition from generics, pricing pressure and regulatory uncertainty in the United States. Pharmaceutical company valuations are especially sensitive to the forecasted value of their drug development pipelines. As evidence, two of the Fund’s holdings—GlaxoSmithKline and Sanofi-Aventis—have recently experienced share price declines as a result of unforeseen regulatory setbacks.
In the current environment, it is easy to overlook the positive dynamics in the industry. As the developed world ages and the developing world becomes more affluent, the demand for pharmaceuticals should continue to grow strongly. Companies continue to invest aggressively in research and development, and we believe this will result in new products in the years ahead. The industry also has the potential to reduce future expenses through ongoing cost-cutting programs and further consolidation.
Moreover, these companies have strong cash flows and balance sheets, which should enable them to withstand current challenges and still reward shareholders through share buybacks and dividends.
Each company’s fundamentals and valuation are constantly changing. When a holding underperforms, we revisit our investment thesis and, if the long-term opportunity is still attractive, we may add to the position. For example, we have added to the Fund’s Sanofi-Aventis and GlaxoSmithKline positions and initiated a position in Novartis (a leader in hypertension and oncology treatment with a robust product pipeline and limited near-term patent pressure).
IN CLOSING
We are optimistic about the Fund’s portfolio, but caution shareholders to have reasonable expectations for the market and the Fund’s prospective performance.
Current valuations incorporate expectations of continued healthy profit margins and earnings growth. Although we have no indication that global corporate profit margins will fall imminently, they are historically high. In our opinion, the pace of recent earnings growth is not sustainable over the longer term. Consequently, we expect market returns in the years ahead to be more muted than in the recent past.
Thank you for your continued confidence in the Dodge & Cox International Stock Fund. As always, we welcome your comments and questions.
For the Board of Trustees,
| | |
 | | 
|
John A. Gunn, Chairman | | Diana S. Strandberg, Vice President |
August 1, 2007
Risks of International Investing: Foreign investing, especially in developing countries, has special risks such as currency and market volatility and political and social instability. These and other risk considerations are discussed in the Fund’s prospectus.
DODGE & COX INTERNATIONAL STOCK FUND §PAGE 2
| | |
GROWTH OF $10,000 SINCE INCEPTION FOR AN INVESTMENT MADE ON MAY 1, 2001 | | |
 | | Past performance does not guarantee future results. Investment return and share price will fluctuate with market conditions, and investors may have a gain or loss when shares are sold. Mutual fund performance changes over time and currently may be significantly lower than stated above. Performance is updated and published monthly. Visit the Fund’s web site at www.dodgeandcox.com or call 1-800-621-3979 for current performance figures. * Expense reimbursements were paid by Dodge & Cox from the Fund’s inception through June 30, 2003 to maintain operating expenses at 0.90%. Accordingly, without the expense reimbursements, the Fund’s returns prior to June 30, 2003 would have been lower. The Fund’s total returns include the reinvestment of dividend and capital gain distributions, but have not been adjusted for any income taxes payable on these distributions. The Morgan Stanley Capital International Europe, Australasia, Far East Index (MSCI EAFE) is a widely recognized benchmark of the world’s stock markets, excluding the United States. Index returns include dividends and, unlike Fund returns, do not reflect fees or expenses. Morgan Stanley®, Morgan Stanley Capital International, and EAFE® are trademarks of Morgan Stanley. |
AVERAGE ANNUAL TOTAL RETURN
FOR PERIODS ENDING JUNE 30, 2007
| | | | | | | | | | | | |
| | | 1 Year | | | 3 Years | | | 5 Years | | | Since
Inception
(5/1/01) | |
Dodge & Cox International Stock Fund | | 28.85 | % | | 26.28 | % | | 22.98 | %* | | 17.29 | %* |
MSCI EAFE | | 27.00 | | | 22.25 | | | 17.73 | | | 10.91 | |
FUND EXPENSE EXAMPLE
As a Fund shareholder, you incur ongoing Fund costs, including management fees and other Fund expenses. All mutual funds have ongoing costs, sometimes referred to as operating expenses. The following example shows ongoing costs of investing in the Fund and can help you understand these costs and compare them with those of other mutual funds. The example assumes a $1,000 investment held for the six months indicated.
ACTUAL EXPENSES
The first line of the table below provides information about actual account values and expenses based on the Fund’s actual returns. You may use the information in this line, together with your account balance, to estimate the expenses that you paid over the period. Simply divide your account value by $1,000 (for example, an $8,600 account value divided by $1,000 = 8.6), then multiply the result by the number in the first line under the heading “Expenses Paid During Period” to estimate the expenses you paid on your account during this period.
HYPOTHETICAL EXAMPLE FOR COMPARISON WITH OTHER MUTUAL FUNDS
Information on the second line of the table can help you compare ongoing costs of investing in the Fund with those of other mutual funds. This information may not be used to estimate the actual ending account balance or expenses you paid during the period. The hypothetical “Ending Account Value” is based on the actual expense ratio of the Fund and an assumed 5% annual rate of return before expenses (not the Fund’s actual return). The amount under the heading “Expense Paid During the Period” shows the hypothetical expenses your account would have incurred under this scenario. You can compare this figure with the 5% hypothetical examples that appear in shareholder reports of other mutual funds.
| | | | | | | | | |
Six Months Ended June 30, 2007 | | Beginning Account Value 1/1/2007 | | Ending Account Value 6/30/2007 | | Expenses Paid During Period† |
Based on Actual Fund Return | | $ | 1,000.00 | | $ | 1,119.60 | | $ | 3.42 |
Based on Hypothetical 5% Yearly Return | | | 1,000.00 | | | 1,021.57 | | | 3.26 |
| † | | Expenses are equal to the Fund’s annualized six-month expense ratio of 0.65%, multiplied by the average account value over the period, multiplied by 181/365 (to reflect the one-half year period). |
The expenses shown in the table highlight ongoing costs only and do not reflect any transactional fees or account maintenance fees. While other mutual funds may charge such fees, please note that the Fund does not charge transaction fees (e.g., redemption fees, sales loads) or universal account maintenance fees (e.g., small account fees).
PAGE 3 § DODGE & COX INTERNATIONAL STOCK FUND
| | |
| FUND INFORMATION | | June 30, 2007 |
GENERAL INFORMATION
| | |
Net Asset Value Per Share | | $48.88 |
Total Net Assets (billions) | | $46.4 |
Expense Ratio (1/1/07 to 6/30/07, annualized) | | 0.65% |
Portfolio Turnover Rate (1/1/07 to 6/30/07, unannualized) | | 4% |
30-Day SEC Yield(a) | | 1.42% |
Fund Inception Date | | 2001 |
No sales charges or distribution fees | | |
Investment Manager: Dodge & Cox, San Francisco. Managed by the International Investment Policy Committee, whose nine members’ average tenure at Dodge & Cox is 17 years.
| | | | |
| PORTFOLIO CHARACTERISTICS | | Fund | | MSCI
EAFE |
Number of Stocks | | 96 | | 1,145 |
Median Market Capitalization (billions) | | $16 | | $6 |
Weighted Average Market Capitalization (billions) | | $65 | | $62 |
Price-to-Earnings Ratio(b) | | 14.2x | | 14.3x |
Countries Represented | | 23 | | 21 |
Emerging Markets (Brazil, Indonesia, Israel, Mexico, South Africa, South Korea, Thailand, Turkey) | | 16.7% | | 0.0% |
| | | |
| TEN LARGEST HOLDINGS(c) | | Fund | |
Nokia Oyj (Finland) | | 2.6 | % |
Sanofi-Aventis (France) | | 2.6 | |
HSBC Holdings PLC (United Kingdom) | | 2.5 | |
GlaxoSmithKline PLC ADR (United Kingdom) | | 2.5 | |
Novartis AG ADR (Switzerland) | | 2.2 | |
Hitachi, Ltd. (Japan) | | 2.1 | |
Matsushita Electric Industrial Co., Ltd. (Japan) | | 2.1 | |
Total SA (France) | | 2.1 | |
Infineon Technologies AG (Germany) | | 2.0 | |
Royal Dutch Shell PLC ADR (United Kingdom) | | 2.0 | |
| | | | | | |
| REGION DIVERSIFICATION | | Fund | | | MSCI
EAFE | |
Europe (excluding United Kingdom) | | 35.2 | % | | 46.5 | % |
Japan | | 19.6 | | | 21.2 | |
United Kingdom | | 16.0 | | | 23.1 | |
Latin America | | 7.1 | | | 0.0 | |
Pacific (excluding Japan) | | 6.6 | | | 9.2 | |
United States | | 5.4 | | | 0.0 | |
Africa | | 2.8 | | | 0.0 | |
Canada | | 1.1 | | | 0.0 | |
Middle East | | 0.8 | | | 0.0 | |
| | | | | | |
| SECTOR DIVERSIFICATION | | Fund | | | MSCI
EAFE | |
Financials | | 22.5 | % | | 28.7 | % |
Consumer Discretionary | | 14.3 | | | 11.8 | |
Information Technology | | 12.1 | | | 5.5 | |
Energy | | 9.6 | | | 7.6 | |
Materials | | 9.5 | | | 9.5 | |
Industrials | | 8.5 | | | 12.1 | |
Health Care | | 8.1 | | | 6.3 | |
Consumer Staples | | 6.0 | | | 7.8 | |
Telecommunication Services | | 3.5 | | | 5.4 | |
Utilities | | 0.5 | | | 5.3 | |
(a) | SEC Yield is an annualization of the Fund’s total net investment income per share for the 30-day period ended on the last day of the month. |
(b) | Price-to-earnings (P/E) ratios are calculated using 12-month forward earnings estimates. |
(c) | The Fund’s portfolio holdings are subject to change without notice. The mention of specific securities is not a recommendation or solicitation for any person to buy, sell or hold any particular security. |
DODGE & COX INTERNATIONAL STOCK FUND §PAGE 4
| | |
| PORTFOLIO OF INVESTMENTS (unaudited) | | June 30, 2007 |
| | | | | |
| COMMON STOCKS: 91.7% | | | | |
| | |
| | | SHARES | | VALUE |
| | | | | |
| CONSUMER DISCRETIONARY: 14.3% |
AUTOMOBILES & COMPONENTS: 1.9% |
Honda Motor Co., Ltd. ADR(b) (Japan) | | 21,621,300 | | $ | 784,636,977 |
Yamaha Motor Co., Ltd. (Japan) | | 3,413,700 | | | 99,257,226 |
| | | | | |
| | | | | 883,894,203 |
CONSUMER DURABLES & APPAREL: 7.9% |
Consorcio Ara SAB de CV(c) (Mexico) | | 88,420,000 | | | 142,408,294 |
Corporacion Geo SAB de CV, Series B(a),(c) (Mexico) | | 42,105,400 | | | 231,309,806 |
Fujifilm Holdings Corp. (Japan) | | 7,086,100 | | | 317,111,967 |
Koninklijke Philips Electronics NV (Netherlands) | | 13,935,000 | | | 595,231,528 |
Matsushita Electric Industrial Co., Ltd. (Japan) | | 49,091,000 | | | 974,842,599 |
Sony Corp. (Japan) | | 14,737,600 | | | 757,677,222 |
Thomson(c) (France) | | 17,885,792 | | | 342,052,128 |
Yamaha Corp.(c) (Japan) | | 14,851,000 | | | 308,780,183 |
| | | | | |
| | | | | 3,669,413,727 |
MEDIA: 4.5% |
Grupo Televisa SA ADR(b) (Mexico) | | 20,578,492 | | | 568,172,164 |
Liberty Global, Inc., Series A(a) (United States) | | 1,220,332 | | | 50,082,425 |
Liberty Global, Inc., Series C(a) (United States) | | 1,894,168 | | | 74,440,803 |
Naspers, Ltd.(c) (South Africa) | | 20,800,000 | | | 535,634,949 |
News Corp., Class A (United States) | | 40,944,892 | | | 868,441,159 |
| | | | | |
| | | | | 2,096,771,500 |
| | | | | |
| | | | | 6,650,079,430 |
| CONSUMER STAPLES: 5.5% |
FOOD & STAPLES RETAILING: 1.8% |
Tesco PLC (United Kingdom) | | 98,164,379 | | | 824,963,756 |
| | | | | |
FOOD, BEVERAGE & TOBACCO: 3.2% |
Anadolu Efes Biracilik ve Malt Sanayii AS (Turkey) | | 3,757,696 | | | 150,307,840 |
Cott Corp.(a),(b),(c) (Canada) | | 2,285,530 | | | 32,888,777 |
Fomento Economico Mexicano SAB de CV ADR(b) (Mexico) | | 8,142,174 | | | 320,150,281 |
Nestle SA (Switzerland) | | 1,506,000 | | | 574,536,226 |
Tiger Brands, Ltd. (South Africa) | | 7,552,043 | | | 193,943,517 |
Unilever NV(b) (Netherlands) | | 7,451,700 | | | 231,151,734 |
| | | | | |
| | | | | 1,502,978,375 |
HOUSEHOLD & PERSONAL PRODUCTS: 0.5% |
Aderans Co., Ltd.(c) (Japan) | | 3,680,200 | | | 77,564,419 |
Avon Products, Inc. (United States) | | 4,150,000 | | | 152,512,500 |
| | | | | |
| | | | | 230,076,919 |
| | | | | |
| | | | | 2,558,019,050 |
| | | | | |
| | |
| | | SHARES | | VALUE |
| | | | | |
| ENERGY: 7.8% |
Norsk Hydro ASA (Norway) | | 23,190,500 | | $ | 896,638,771 |
Royal Dutch Shell PLC ADR(b) (United Kingdom) | | 11,428,400 | | | 927,986,080 |
Schlumberger, Ltd. (United States) | | 9,533,000 | | | 809,733,020 |
Total SA (France) | | 11,722,000 | | | 956,032,824 |
| | | | | |
| | | | | 3,590,390,695 |
| FINANCIALS: 21.9% | | | | | |
BANKS: 14.8% | | | | | |
Bangkok Bank PCL Foreign (Thailand) | | 14,261,800 | | | 50,396,513 |
Bangkok Bank PCL NVDR (Thailand) | | 12,850,000 | | | 43,546,705 |
DBS Group Holdings, Ltd. (Singapore) | | 29,042,000 | | | 432,570,701 |
Grupo Financiero Banorte SAB de CV (Mexico) | | 43,834,600 | | | 200,762,346 |
HSBC Holdings PLC (United Kingdom) | | 63,989,200 | | | 1,175,745,317 |
Kasikornbank PCL Foreign (Thailand) | | 96,725,600 | | | 214,323,198 |
Kasikornbank PCL NVDR (Thailand) | | 77,094,600 | | | 165,242,590 |
Kookmin Bank ADR(b) (South Korea) | | 5,978,100 | | | 524,398,932 |
Mitsubishi UFJ Financial Group (Japan) | | 29,800 | | | 329,161,421 |
Mitsubishi UFJ Financial Group ADR(b) (Japan) | | 67,666,500 | | | 745,684,830 |
Royal Bank of Scotland Group PLC (United Kingdom) | | 50,402,916 | | | 640,685,442 |
Shinhan Financial Group Co., Ltd. ADR(b) (South Korea) | | 2,178,784 | | | 266,879,252 |
Shinsei Bank, Ltd.(c) (Japan) | | 74,153,000 | | | 299,924,418 |
Standard Bank Group, Ltd. (South Africa) | | 40,846,234 | | | 568,119,533 |
Standard Chartered PLC (United Kingdom) | | 27,738,506 | | | 907,937,917 |
The Bank of Yokohama, Ltd. (Japan) | | 42,638,000 | | | 299,201,884 |
| | | | | |
| | | | | 6,864,580,999 |
DIVERSIFIED FINANCIALS: 2.2% | | | | | |
Credit Suisse Group (Switzerland) | | 11,448,000 | | | 818,651,494 |
Haci Omer Sabanci Holding AS (Turkey) | | 43,211,180 | | | 215,644,365 |
| | | | | |
| | | | | 1,034,295,859 |
INSURANCE: 4.6% | | | | | |
Aegon NV (Netherlands) | | 19,477,211 | | | 385,931,124 |
Millea Holdings, Inc. (Japan) | | 14,221,500 | | | 584,453,117 |
Standard Life PLC (United Kingdom) | | 13,925,343 | | | 92,349,428 |
Swiss Life Holding (Switzerland) | | 1,285,000 | | | 340,843,225 |
Swiss Reinsurance Co. (Switzerland) | | 7,895,795 | | | 723,323,341 |
| | | | | |
| | | | | 2,126,900,235 |
REAL ESTATE: 0.3% | | | | | |
Hang Lung Group, Ltd. (Hong Kong) | | 18,812,000 | | | 84,927,307 |
Hang Lung Properties, Ltd. (Hong Kong) | | 6,751,000 | | | 23,268,295 |
| | | | | |
| | | | | 108,195,602 |
| | | | | |
| | | | | 10,133,972,695 |
| | |
| PAGE 5 § DODGE & COX INTERNATIONAL STOCK FUND | | See accompanying Notes to Financial Statements |
| | |
| PORTFOLIO OF INVESTMENTS (unaudited) | | June 30, 2007 |
| | | | | |
| COMMON STOCKS (continued) |
| | |
| | | SHARES | | VALUE |
| | | | | |
| HEALTH CARE: 8.1% |
HEALTH CARE EQUIPMENT & SERVICES: 0.8% |
Mediceo Paltac Holdings Co., Ltd.(c) (Japan) | | 23,974,300 | | $ | 367,622,160 |
| | | | | |
PHARMACEUTICALS & BIOTECHNOLOGY: 7.3% |
GlaxoSmithKline PLC ADR(b) (United Kingdom) | | 22,237,200 | | | 1,164,562,164 |
Novartis AG ADR(b) (Switzerland) | | 18,112,850 | | | 1,015,587,499 |
Sanofi-Aventis (France) | | 14,885,500 | | | 1,210,820,759 |
| | | | | |
| | | | | 3,390,970,422 |
| | | | | |
| | | | | 3,758,592,582 |
| INDUSTRIALS: 8.5% |
CAPITAL GOODS: 3.9% |
Nexans SA(c) (France) | | 1,866,440 | | | 312,735,107 |
Schneider Electric SA (France) | | 1,600,000 | | | 225,495,464 |
Toto, Ltd.(c) (Japan) | | 36,657,000 | | | 317,669,190 |
Volvo AB (Sweden) | | 42,058,000 | | | 842,488,303 |
Wienerberger AG (Austria) | | 1,206,362 | | | 89,311,407 |
| | | | | |
| | | | | 1,787,699,471 |
TRANSPORTATION: 4.6% |
Canadian Pacific Railway, Ltd.(b) (Canada) | | 2,838,906 | | | 195,373,511 |
Central Japan Railway Co. (Japan) | | 56,050 | | | 591,796,954 |
Deutsche Post AG (Germany) | | 10,975,000 | | | 356,944,142 |
Nippon Yusen Kabushiki Kaisha (Japan) | | 51,950,000 | | | 477,201,624 |
TNT NV (Netherlands) | | 11,775,249 | | | 532,780,640 |
| | | | | |
| | | | | 2,154,096,871 |
| | | | | |
| | | | | 3,941,796,342 |
| INFORMATION TECHNOLOGY: 12.1% |
SEMICONDUCTORS & SEMICONDUCTOR EQUIPMENT: 2.3% |
Chartered Semiconductor Manufacturing, Ltd.(a) (Singapore) | | 44,533,000 | | | 39,274,571 |
Infineon Technologies AG(a),(c) (Germany) | | 57,127,800 | | | 951,803,969 |
Qimonda AG ADR(a),(b) (Germany) | | 6,060,600 | | | 93,636,270 |
| | | | | |
| | | | | 1,084,714,810 |
TECHNOLOGY, HARDWARE & EQUIPMENT: 9.8% |
Brother Industries, Ltd.(c) (Japan) | | 17,244,000 | | | 253,635,606 |
Epcos AG(c) (Germany) | | 5,828,100 | | | 114,613,182 |
Hitachi, Ltd. (Japan) | | 137,818,000 | | | 979,417,259 |
Kyocera Corp. (Japan) | | 969,200 | | | 103,433,811 |
LG.Philips LCD Co., Ltd. ADR(a),(b) (South Korea) | | 23,321,800 | | | 527,772,334 |
Motorola, Inc. (United States) | | 29,800,000 | | | 527,460,000 |
Nokia Oyj (Finland) | | 43,512,500 | | | 1,225,541,650 |
Nortel Networks Corp.(a),(b) (Canada) | | 9,990,705 | | | 240,276,455 |
Oce NV(c) (Netherlands) | | 8,018,524 | | | 156,712,481 |
Seiko Epson Corp.(c) (Japan) | | 14,091,500 | | | 408,581,970 |
| | | | | |
| | | | | 4,537,444,748 |
| | | | | |
| | | | | 5,622,159,558 |
| | | | | |
| | |
| | | SHARES | | VALUE |
| | | | | |
| MATERIALS: 9.5% |
Akzo Nobel NV (Netherlands) | | 2,936,100 | | $ | 254,168,226 |
Arkema(a),(c) (France) | | 3,400,263 | | | 223,155,016 |
BASF AG (Germany) | | 5,910,400 | | | 777,864,198 |
Bayer AG (Germany) | | 10,327,000 | | | 784,113,619 |
BHP Billiton, Ltd. (Australia) | | 3,785,078 | | | 112,410,934 |
Cemex SAB de CV ADR(b) (Mexico) | | 12,808,482 | | | 472,632,986 |
Imperial Chemical Industries PLC (United Kingdom) | | 45,795,762 | | | 572,006,754 |
Lafarge SA (France) | | 3,771,025 | | | 691,066,809 |
Lanxess AG (Germany) | | 4,092,359 | | | 229,195,544 |
Makhteshim-Agan Industries, Ltd.(c) (Israel) | | 29,459,809 | | | 213,346,371 |
Nova Chemicals Corp. (Canada) | | 1,587,900 | | | 56,763,419 |
| | | | | |
| | | | | 4,386,723,876 |
| TELECOMMUNICATION SERVICES: 3.5% |
Bezeq Israeli Telecommunication Corp., Ltd. (Israel) | | 98,791,000 | | | 160,276,957 |
KT Corp. ADR(b) (South Korea) | | 21,858,400 | | | 512,798,064 |
Telekomunik Indonesia ADR(b) (Indonesia) | | 2,009,447 | | | 86,607,166 |
Vodafone Group PLC ADR(b) (United Kingdom) | | 26,156,562 | | | 879,645,180 |
| | | | | |
| | | | | 1,639,327,367 |
| UTILITIES: 0.5% |
Centrica PLC (United Kingdom) | | 30,061,936 | | | 234,527,326 |
| | | | | |
| | | | | 234,527,326 |
| | | | | |
TOTAL COMMON STOCKS
(Cost $33,668,034,618) | | | | $ | 42,515,588,921 |
| | | | | |
|
| PREFERRED STOCKS: 2.9% |
| CONSUMER STAPLES: 0.5% |
FOOD & STAPLES RETAILING: 0.5% |
Sadia SA ADR(b) (Brazil) | | 4,839,921 | | $ | 226,024,310 |
| | | | | |
| | | | | 226,024,310 |
| ENERGY: 1.8% | | | | | |
Petroleo Brasileiro SA ADR(b) (Brazil) | | 5,879,200 | | | 627,193,056 |
Ultrapar Participacoes SA ADR(b) (Brazil) | | 6,819,785 | | | 226,416,862 |
| | | | | |
| | | | | 853,609,918 |
| FINANCIALS: 0.6% | | | | | |
BANKS: 0.6% | | | | | |
Uniao de Bancos Brasileiros SA GDR(b) (Brazil) | | 2,259,500 | | | 255,029,765 |
| | | | | |
| | | | | 255,029,765 |
TOTAL PREFERRED STOCKS
(Cost $568,767,245) | | | | $ | 1,334,663,993 |
| | | | | |
| | |
| See accompanying Notes to Financial Statements | | DODGE & COX INTERNATIONAL STOCK FUND §PAGE 6 |
| | |
| PORTFOLIO OF INVESTMENTS (unaudited) | | June 30, 2007 |
| | | | | | | |
| SHORT-TERM INVESTMENTS: 4.0% |
| | |
| | | PAR VALUE | | | VALUE |
| | | | | | | |
Fixed Income Clearing Corporation Repurchase Agreement(d) 5.05%, 7/2/07, maturity value $1,812,882,601 | | $ | 1,812,120,000 | | | $ | 1,812,120,000 |
SSgA Prime Money Market Fund | | | 45,325,675 | | | | 45,325,675 |
| | | | | | | |
TOTAL SHORT-TERM INVESTMENTS
(Cost $1,857,445,675) | | | | 1,857,445,675 |
| | | | | | | |
TOTAL INVESTMENTS
(Cost $36,094,247,538) | | | 98.6 | % | | | 45,707,698,589 |
OTHER ASSETS LESS LIABILITIES | | | 1.4 | % | | | 652,047,640 |
| | | | | | | |
| TOTAL NET ASSETS | | | 100.0 | % | | $ | 46,359,746,229 |
| | | | | | | |
(b) | Security issued by a foreign entity, denominated in U.S. dollars |
(c) | See Note 6 regarding holdings of 5% voting securities |
(d) | Repurchase agreement is collateralized by Freddie Mac 4.125%-5.00%, 12/19/08-11/18/09; Fannie Mae 5.08%-5.35%, 6/5/09-5/14/10; Federal Home Loan Bank 4.50%-5.375%, 10/14/08-1/22/10; and Federal Farm Credit Bank 4.875%, 4/13/09. Total collateral value is $1,848,375,165. |
ADR: American Depository Receipt
GDR: Global Depository Receipt
NVDR: Non Voting Depository Receipt
| | |
| PAGE 7 § DODGE & COX INTERNATIONAL STOCK FUND | | See accompanying Notes to Financial Statements |
| | | | |
STATEMENT OF ASSETS AND LIABILITIES (unaudited) | |
| | | June 30, 2007 | |
ASSETS: | | | | |
Investments, at value | | | | |
Unaffiliated issuers (cost $31,860,959,749) | | $ | 40,450,149,341 | |
Affiliated issuers (cost $4,233,287,789) | | | 5,257,549,248 | |
| | | | |
| | | 45,707,698,589 | |
Cash denominated in foreign currency (cost $38,840,417) | | | 38,953,054 | |
Receivable for investments sold | | | 585,337,109 | |
Receivable for Fund shares sold | | | 420,859,116 | |
Dividends and interest receivable | | | 86,236,623 | |
Prepaid expenses and other assets | | | 32,657 | |
| | | | |
| | | 46,839,117,148 | |
LIABILITIES: | | | | |
Payable for investments purchased | | | 431,505,670 | |
Payable for Fund shares redeemed | | | 12,243,704 | |
Management fees payable | | | 22,285,904 | |
Accrued foreign capital gain tax | | | 9,547,600 | |
Accrued expenses | | | 3,788,041 | |
| | | | |
| | | 479,370,919 | |
| | | | |
NET ASSETS | | $ | 46,359,746,229 | |
| | | | |
NET ASSETS CONSIST OF: | | | | |
Paid in capital | | $ | 35,508,917,442 | |
Undistributed net investment income | | | 476,007,687 | |
Undistributed net realized gain | | | 770,809,476 | |
Net unrealized appreciation (net of accrued foreign capital gain tax of $9,547,600) | | | 9,604,011,624 | |
| | | | |
| | $ | 46,359,746,229 | |
| | | | |
Fund shares outstanding (par value $0.01 each, unlimited shares authorized) | | | 948,480,976 | |
Net asset value per share | | | $48.88 | |
| |
STATEMENT OF OPERATIONS (unaudited) | | | | |
| | | Six Months Ended
June 30, 2007 | |
INVESTMENT INCOME: | | | | |
Dividends (net of foreign taxes of $53,040,313) | | | | |
Unaffiliated issuers | | $ | 515,727,591 | |
Affiliated issuers | | | 19,645,552 | |
Interest | | | 55,430,715 | |
| | | | |
| | | 590,803,858 | |
EXPENSES: | | | | |
Management fees | | | 115,413,389 | |
Custody and fund accounting fees | | | 2,559,265 | |
Transfer agent fees | | | 3,410,585 | |
Professional services | | | 81,176 | |
Shareholder reports | | | 2,370,241 | |
Registration fees | | | 1,022,869 | |
Trustees’ fees | | | 84,188 | |
Miscellaneous | | | 188,654 | |
| | | | |
| | | 125,130,367 | |
| | | | |
NET INVESTMENT INCOME | | | 465,673,491 | |
| |
REALIZED AND UNREALIZED GAIN (LOSS): | | | | |
Net realized gain (loss) | | | | |
Investments in unaffiliated issuers | | | 483,756,335 | |
Investments in affiliated issuers | | | 92,408,973 | |
Foreign currency transactions | | | (5,110,102 | ) |
Net change in unrealized appreciation (including net increase in accrued foreign capital gain tax of $8,918,107) | | | 3,321,247,913 | |
| | | | |
Net realized and unrealized gain | | | 3,892,303,119 | |
| | | | |
NET INCREASE IN NET ASSETS FROM OPERATIONS | | $ | 4,357,976,610 | |
| | | | |
| | | | | | | | |
STATEMENT OF CHANGES IN NET ASSETS (unaudited) | |
| | | Six Months Ended
June 30, 2007 | | | Year Ended
December 31, 2006 | |
OPERATIONS: | | | | | | | | |
Net investment income | | $ | 465,673,491 | | | $ | 393,714,698 | |
Net realized gain | | | 571,055,206 | | | | 594,313,896 | |
Net change in unrealized appreciation | | | 3,321,247,913 | | | | 4,368,035,130 | |
| | | | | | | | |
Net increase in net assets from operations | | | 4,357,976,610 | | | | 5,356,063,724 | |
| |
DISTRIBUTIONS TO SHAREHOLDERS FROM: | | | | | |
Net investment income | | | — | | | | (385,150,238 | ) |
Net realized gain | | | — | | | | (422,290,813 | ) |
| | | | | | | | |
Total distributions | | | — | | | | (807,441,051 | ) |
| | |
FUND SHARE TRANSACTIONS: | | | | | | | | |
Proceeds from sale of shares | | | 13,082,363,462 | | | | 14,647,193,582 | |
Reinvestment of distributions | | | — | | | | 724,233,070 | |
Cost of shares redeemed | | | (1,979,931,465 | ) | | | (2,377,956,549 | ) |
| | | | | | | | |
Net increase from Fund share transactions | | | 11,102,431,997 | | | | 12,993,470,103 | |
| | | | | | | | |
Total increase in net assets | | | 15,460,408,607 | | | | 17,542,092,776 | |
| | |
NET ASSETS: | | | | | | | | |
Beginning of period | | | 30,899,337,622 | | | | 13,357,244,847 | |
| | | | | | | | |
End of period (including undistributed net investment income of $476,007,687 and $10,334,196, respectively) | | $ | 46,359,746,229 | | | $ | 30,899,337,623 | |
| | | | | | | | |
| | |
SHARE INFORMATION: | | | | | | | | |
Shares sold | | | 283,539,814 | | | | 370,106,951 | |
Distributions reinvested | | | — | | | | 16,603,234 | |
Shares redeemed | | | (42,839,009 | ) | | | (60,274,819 | ) |
| | | | | | | | |
Net increase in shares outstanding | | | 240,700,805 | | | | 326,435,366 | |
| | | | | | | | |
| | |
| See accompanying Notes to Financial Statements | | DODGE & COX INTERNATIONAL STOCK FUND §PAGE 8 |
NOTES TO FINANCIAL STATEMENTS (unaudited)
NOTE 1—ORGANIZATION AND SIGNIFICANT ACCOUNTING POLICIES
Dodge & Cox International Stock Fund (the “Fund”) is one of the series constituting the Dodge & Cox Funds (the “Trust” or the “Funds”). The Trust is organized as a Delaware statutory trust and is registered under the Investment Company Act of 1940, as amended, as a diversified, open-end management investment company. The Fund commenced operations on May 1, 2001, and seeks long-term growth of principal and income, and the Fund invests primarily in a diversified portfolio of foreign stocks. Foreign investing, especially in developing countries, has special risks such as currency and market volatility and political and social instability. These and other risk considerations are discussed in the Fund’s Prospectus.
The financial statements have been prepared in conformity with accounting principles generally accepted in the United States of America, which require the use of estimates and assumptions by management. Significant accounting policies are as follows:
Security valuation The Fund’s net assets are valued as of the close of trading on the New York Stock Exchange (NYSE), generally 4:00 p.m. Eastern Time, each day that the NYSE is open for business. Listed securities are valued at market, using as a price the official quoted close price or the last sale on the date of determination on the principal exchange on which such securities are traded or, if not available, at the mean between the exchange listed bid and ask prices for the day. A security that is listed or traded on more than one exchange is valued at the quotation on the exchange determined to be the primary market for such security. Security values are not discounted based on the size of the Fund’s position. Short-term securities are valued at amortized cost which approximates current value.
Investments initially valued in currencies other than the U.S. dollar are converted to the U.S. dollar using prevailing exchange rates. As a result, the Fund’s net asset value (NAV) may be affected by changes in the value of currencies in relation to the U.S. dollar.
If market quotations are not readily available or if a security’s value has materially changed after the close of the security’s primary market but before the close of trading on the NYSE, the security is valued at fair value as determined in good faith by or at the direction of the Board of Trustees. The Fund may use fair value pricing in calculating its NAV when, for example, (i) the primary market for a security is closed or if trading of a security is suspended or limited, (ii) the Fund determines that the price provided by a pricing service is inaccurate or unreliable, or (iii) the Fund determines that a significant event affecting the value of a security has occurred before the close of the NYSE but after the close of the security’s primary market. An event is considered significant if there is both an affirmative expectation that the security’s value will change in response to the event and a reasonable basis for quantifying a resulting change in value. For securities that do not trade during NYSE hours, fair value determinations are based on analyses of market movements after the close of those securities’ primary markets, and include reviews of developments in foreign markets, the performance of U.S. securities markets, and the performance of instruments trading in U.S. markets that represent foreign securities and baskets of foreign securities. Pricing services are used to obtain closing market prices and to compute certain fair value adjustments utilizing computerized pricing models. When fair value pricing is employed, the prices of securities used by the Fund to calculate its net asset value may differ from quoted or published prices for the same securities. In addition, fair values may not reflect the price that the Fund could obtain for a security if it were to dispose of that security at the time of pricing.
Foreign currency translation The Fund’s accounting records are maintained in U.S. dollars. The market values of foreign securities, currency holdings, and other assets and liabilities are translated into U.S. dollars at the prevailing rates of exchange at the end of each business day. Purchases and sales of securities, income receipts, and expenses are translated into U.S. dollars at the exchange rate in effect on the transaction date. Realized foreign currency gains and losses may arise from
PAGE 9 § DODGE & COX INTERNATIONAL STOCK FUND
NOTES TO FINANCIAL STATEMENTS (unaudited)
sales and maturities of foreign currency contracts, sales of foreign currencies, the difference between the amount of net investment income accrued and the U.S. dollar amount actually received, and from currency gains and losses between trade and settlement date on security transactions. The effects of exchange rate changes on investment securities are included with realized and unrealized gain (loss) on investments.
Foreign currency contracts When the Fund purchases or sells foreign securities, it may enter into foreign exchange contracts to minimize foreign exchange risk from the trade date to the settlement date of the transaction. Losses from these transactions may arise from changes in the value of the foreign currency or if the counterparties do not perform under the contract’s terms.
Security transactions, investment income, expenses, and distributions Security transactions are recorded on the trade date. Realized gains and losses on securities sold are determined on the basis of identified cost.
Dividend income and corporate action transactions are recorded on the ex-dividend date, except for certain dividends or corporate actions from foreign securities where the ex-dividend date may have passed, which are recorded as soon as the Fund is informed of the ex-dividend date. Withholding taxes on foreign dividends have been provided for in accordance with the Fund’s understanding of the applicable country’s tax rules and rates. Non-cash dividends included in dividend income, if any, are recorded at the fair market value of the securities received. Distributions received in excess of income are recorded as a reduction of cost of investments and/or realized gain. Interest income is recorded on the accrual basis.
Expenses are recorded on the accrual basis. Most expenses of the Trust can be directly attributed to a specific series. Expenses which cannot be directly attributed are apportioned among the Funds in the Trust.
Distributions to shareholders are recorded on the ex-dividend date.
Repurchase agreements The Fund may enter into repurchase agreements secured by U.S. government and
agency securities which involve the purchase of securities from a counterparty with a simultaneous commitment to resell the securities at an agreed-upon date and price. It is the Fund’s policy that its custodian take possession of the underlying collateral securities, the fair value of which exceeds the principal amount of the repurchase transaction, including accrued interest, at all times. In the event of default by the counterparty, the Fund has the contractual right to liquidate the securities and to apply the proceeds in satisfaction of the obligation.
NOTE 2—RELATED PARTY TRANSACTIONS
Management fees Under a written agreement approved by a unanimous vote of the Board of Trustees, the Fund pays an annual management fee of 0.60% of the Fund’s average daily net assets to Dodge & Cox, investment manager of the Fund.
Fund officers and trustees All officers and three of the trustees of the Trust are officers or employees of Dodge & Cox. The Trust pays a fee only to those trustees who are not affiliated with Dodge & Cox.
Indemnification Under the Trust’s organizational documents, its officers and trustees are indemnified against certain liabilities arising out of the performance of their duties to the Trust. In addition, in the normal course of business the Trust enters into contracts that provide general indemnities to other parties. The Trust’s maximum exposure under these arrangements is unknown as this would involve future claims that may be made against the Trust that have not yet occurred.
NOTE 3—INCOME TAX INFORMATION AND DISTRIBUTIONS TO SHAREHOLDERS
A provision for federal income taxes is not required since the Fund intends to continue to qualify as a regulated investment company under Subchapter M of the Internal Revenue Code and distribute all of its taxable income to shareholders. Distributions are determined in accordance with income tax regulations, which may differ from net investment income and realized gains for financial reporting purposes. Financial reporting records are adjusted for permanent book/tax differences to reflect tax
DODGE & COX INTERNATIONAL STOCK FUND §PAGE 10
NOTES TO FINANCIAL STATEMENTS (unaudited)
character. Financial records are not adjusted for temporary differences.
Certain foreign countries impose a tax on capital gains which is accrued by the Fund based on unrealized appreciation, if any, on affected securities. The tax is paid when the gain is realized.
Book/tax differences are primarily due to differing treatments of net short-term realized gain and foreign currency realized gain (loss). At June 30, 2007, the cost of investments for federal income tax purposes was equal to the cost for financial reporting purposes.
Distributions for the six months ended June 30, 2007 and for the year ended December 31, 2006 were characterized as follows for federal income tax purpose.
| | | | |
| | | Six Months Ended June 30, 2007 | | Year Ended December 31, 2006 |
Ordinary income | | — | | $485,133,441 |
| | | | ($0.709 per share) |
| | |
Long-term capital gain | | — | | $322,307,610 |
| | | | ($0.471 per share) |
At June 30, 2007, the tax basis components of distributable earnings were as follows:
| | | | |
Unrealized appreciation | | $ | 9,996,767,075 | |
Unrealized depreciation | | | (392,755,451 | ) |
| | | | |
Net unrealized appreciation | | | 9,604,011,624 | |
Undistributed ordinary income | | | 727,182,963 | |
Undistributed long-term capital gain | | | 519,634,200 | |
NOTE 4—PURCHASES AND SALES OF INVESTMENTS
For the six months ended June 30, 2007, purchases and sales of securities, other than short-term securities, aggregated $12,183,390,357 and $1,452,223,809, respectively.
NOTE 5—ACCOUNTING PRONOUNCEMENTS
In July 2006, the Financial Accounting Standards Board (FASB) issued Interpretation 48, “Accounting for Uncertainty in Income Taxes” (FIN 48). FIN 48 clarifies the accounting for income taxes by prescribing the minimum recognition threshold a tax position must meet before being recognized in the financial statements. FIN 48 was effective for the Fund on June 29, 2007. Implementation of FIN 48 included a review of tax positions taken from January 1, 2003 through June 30, 2007. There was no impact to the Fund’s financial statements as a result of implementing FIN 48.
In September 2006, FASB issued “Statement of Financial Accounting Standards No. 157, Fair Value Measurements” (SFAS 157). SFAS 157 is effective for the Fund beginning January 1, 2008. It defines fair value, establishes a framework for measuring fair value and expands disclosures about fair value measurements. Management is currently evaluating the impact the adoption of SFAS 157 will have on the Fund’s financial statement disclosures.
PAGE 11 § DODGE & COX INTERNATIONAL STOCK FUND
NOTES TO FINANCIAL STATEMENTS (unaudited)
NOTE 6—HOLDINGS OF 5% VOTING SECURITIES
Each of the companies listed below is considered to be an affiliate of the Fund because the Fund owned 5% or more of the company’s voting securities during the six months ended June 30, 2007. Transactions during the period in securities of affiliated companies were as follows:
| | | | | | | | | | | | | | | | | | |
| | | Shares at
Beginning of Period | | Additions | | | Reductions | | | Shares at
End of Period | | Dividend
Income(a) | | | Value at
End of Period | |
Aderans Co., Ltd. (Japan) | | 3,005,100 | | 675,100 | | | — | | | 3,680,200 | | $ | 1,154,519 | | | $ | 77,564,418 | |
Arkema (France) | | 3,400,263 | | — | | | — | | | 3,400,263 | | | — | (b) | | | 223,155,016 | |
Brother Industries, Ltd. (Japan) | | 19,244,000 | | — | | | (2,000,000 | ) | | 17,244,000 | | | 1,768,653 | | | | 253,635,606 | |
Consorcio Ara SAB de CV (Mexico) | | 22,105,000 | | 66,315,000 | (c) | | — | | | 88,420,000 | | | 1,255,021 | | | | 142,408,294 | |
Converium Holdings AG (Switzerland) | | 8,918,646 | | — | | | (8,918,646 | ) | | — | | | 1,143,371 | | | | — | |
Corporacion Geo SAB de CV, Series B (Mexico) | | 42,105,400 | | — | | | — | | | 42,105,400 | | | — | (b) | | | 231,309,806 | |
Cott Corp. (Canada) | | 3,830,800 | | — | | | (1,545,270 | ) | | 2,285,530 | | | — | (b) | | | — | (d) |
Epcos AG (Germany) | | 5,828,100 | | — | | | — | | | 5,828,100 | | | 1,302,129 | | | | 114,613,182 | |
Infineon Technologies AG (Germany) | | 47,027,800 | | 10,100,000 | | | — | | | 57,127,800 | | | — | (b) | | | 951,803,969 | |
Makhteshim-Agan Industries, Ltd. (Israel) | | 29,459,809 | | — | | | — | | | 29,459,809 | | | — | | | | 213,346,371 | |
Mediceo Paltac Holdings Co., Ltd. (Japan) | | 13,559,700 | | 10,414,600 | | | — | | | 23,974,300 | | | 1,056,809 | | | | 367,622,160 | |
Naspers, Ltd. (South Africa) | | — | | 20,800,000 | | | — | | | 20,800,000 | | | — | | | | 535,634,949 | |
Nexans SA (France) | | 1,866,440 | | — | | | — | | | 1,866,440 | | | 2,588,461 | | | | 312,735,107 | |
Oce NV (Netherlands) | | 8,018,524 | | — | | | — | | | 8,018,524 | | | 3,975,883 | | | | 156,712,481 | |
Seiko Epson Corp. (Japan) | | 13,406,900 | | 684,600 | | | — | | | 14,091,500 | | | 1,778,846 | | | | 408,581,970 | |
Shinsei Bank, Ltd. (Japan) | | 74,153,000 | | — | | | — | | | 74,153,000 | | | 585,046 | | | | 299,924,418 | |
Thomson (France) | | 15,784,838 | | 2,100,954 | | | — | | | 17,885,792 | | | — | | | | 342,052,128 | |
Toto, Ltd. (Japan) | | 28,657,000 | | 8,000,000 | | | — | | | 36,657,000 | | | 1,572,187 | | | | 317,669,190 | |
Yamaha Corp. (Japan) | | 14,851,000 | | — | | | — | | | 14,851,000 | | | 1,464,627 | | | | 308,780,183 | |
| | | | | | | | | | | | | | | | | | |
| | | | | | | | | | | | $ | 19,645,552 | | | $ | 5,257,549,248 | |
| | | | | | | | | | | | | | | | | | |
| | | | | | | | | | | | | | | | | | | |
(a) | Net of foreign taxes, if any |
(c) | Represents shares obtained in a 4 for 1 stock split on March 8, 2007 |
(d) | Company was not an affiliate at the end of the period |
DODGE & COX INTERNATIONAL STOCK FUND §PAGE 12
FINANCIAL HIGHLIGHTS (unaudited)
| | | | | | | | | | | | | | | | | | |
SELECTED DATA AND RATIOS (for a share outstanding throughout each period) | | Six Months
Ended June 30, | | | Year Ended December 31, | |
| | | 2007 | | | 2006 | | | 2005 | | | 2004 | | | 2003 | | | 2002 | |
Net asset value, beginning of period | | $43.66 | | | $35.03 | | | $30.64 | | | $23.48 | | | $15.81 | | | $18.42 | |
Income from investment operations: | | | | | | | | | | | | | | | | | | |
Net investment income | | 0.49 | | | 0.57 | | | 0.33 | | | 0.26 | | | 0.14 | | | 0.13 | |
Net realized and unrealized gain (loss) | | 4.73 | | | 9.24 | | | 4.80 | | | 7.36 | | | 7.67 | | | (2.55 | ) |
| | | | | | |
Total from investment operations | | 5.22 | | | 9.81 | | | 5.13 | | | 7.62 | | | 7.81 | | | (2.42 | ) |
| | | | | | |
Distributions to shareholders from: | | | | | | | | | | | | | | | | | | |
Net investment income | | — | | | (0.56 | ) | | (0.35 | ) | | (0.24 | ) | | (0.14 | ) | | (0.13 | ) |
Net realized gain | | — | | | (0.62 | ) | | (0.39 | ) | | (0.22 | ) | | — | | | (0.06 | ) |
| | | | | | |
Total distributions | | — | | | (1.18 | ) | | (0.74 | ) | | (0.46 | ) | | (0.14 | ) | | (0.19 | ) |
| | | | | | |
Net asset value, end of period | | $48.88 | | | $43.66 | | | $35.03 | | | $30.64 | | | $23.48 | | | $15.81 | |
| | | | | | |
Total return | | 11.96 | % | | 28.00 | % | | 16.74 | % | | 32.46 | % | | 49.42 | %† | | (13.11 | )%† |
Ratios/supplemental data: | | | | | | | | | | | | | | | | | | |
Net assets, end of period (millions) | | $46,360 | | | $30,899 | | | $13,357 | | | $4,203 | | | $655 | | | $117 | |
Ratios of expenses to average net assets | | 0.65 | %* | | 0.66 | % | | 0.70 | % | | 0.77 | % | | 0.82 | % | | 0.90 | % |
Ratio of expenses to average net assets,
before reimbursement by investment manager | | 0.65 | %* | | 0.66 | % | | 0.70 | % | | 0.77 | % | | 0.84 | % | | 1.03 | % |
Ratios of net investment income to average net assets | | 2.42 | %* | | 1.82 | % | | 1.54 | % | | 1.90 | % | | 1.53 | % | | 1.30 | % |
Portfolio turnover rate | | 4 | % | | 9 | % | | 7 | % | | 6 | % | | 11 | % | | 12 | % |
| † | Expense reimbursements were paid by Dodge & Cox from the Fund’s inception through June 30, 2003 to maintain operating expenses at 0.90%. Accordingly, without the expense reimbursements, the Fund’s returns prior to June 30, 2003 would have been lower. |
See accompanying Notes to Financial Statements
PAGE 13 § DODGE & COX INTERNATIONAL STOCK FUND
SHAREHOLDER MEETING RESULTS
A special meeting of Fund shareholders was held on April 17, 2007. The meeting was adjourned in order to permit shareholders further time to respond to the solicitation of proxies and was reconvened on April 27, 2007. At the meeting, the proposals to amend the Fund’s fundamental investment restrictions listed below were approved. The following is a report of the total votes cast by the Fund’s shareholders:
| | | | | | | | |
PROPOSAL | | FOR | | AGAINST | | ABSTAIN | | TOTAL |
1. Amend the Fund’s fundamental investment restrictions with respect to the percentage of the Fund’s assets that are subject to diversification requirements | | 381,928,794 | | 22,862,728 | | 12,339,540 | | 417,131,062 |
| | | | |
2a. Amend the Fund’s fundamental investment restrictions with respect to investments in real estate | | 386,367,821 | | 18,369,126 | | 12,394,238 | | 417,131,185 |
| | | | |
2b. Amend the Fund’s fundamental investment restrictions with respect to investments in commodities and commodity contracts | | 376,666,512 | | 27,943,423 | | 12,521,251 | | 417,131,186 |
| | | | |
3. Amend the Fund’s fundamental investment restrictions with respect to making loans | | 374,253,082 | | 30,154,489 | | 12,723,613 | | 417,131,184 |
| | | | |
4. Eliminate the Fund’s fundamental investment restrictions with respect to investments in oil, gas and mineral leases or other mineral exploration or development programs | | 376,863,352 | | 27,928,718 | | 12,339,113 | | 417,131,183 |
| | | | |
5. Amend the Fund’s fundamental investment restrictions with respect to borrowing and issuing senior securities | | 372,964,336 | | 31,271,941 | | 12,894,899 | | 417,131,176 |
FUND’S HOLDINGS
The Fund provides a complete list of its holdings four times each fiscal year, as of the end of each quarter. The lists appear in the Fund’s First Quarter, Semi-Annual, Third Quarter and Annual Reports to shareholders. The Fund files the lists with the Securities and Exchange Commission (SEC) on Form N-CSR (second and fourth quarters) and Form N-Q (first and third quarters). Shareholders may view the Fund’s Forms N-CSR and N-Q on the SEC’s website at www.sec.gov. Forms N-CSR and N-Q may also be reviewed and copied at the SEC’s Public Reference Room in Washington, DC. Information regarding the operations of the Public Reference Room may be obtained by 1-202-942-8090 (direct) or 1-800-732-0330 (general SEC number). A complete list of the Fund’s quarter-end holdings is also available at www.dodgeandcox.com on or about 15 days following each quarter end and remains available on the web site until the list is updated in the subsequent quarter.
PROXY VOTING
For a free copy of the Fund’s proxy voting policies and procedures, please call 1-800-621-3979, visit the Fund’s web site at www.dodgeandcox.com or visit the SEC’s web site at www.sec.gov. Information regarding how the Fund voted proxies relating to portfolio securities during the most recent 12-month period ending June 30 is also available at www.dodgeandcox.com or at www.sec.gov.
DODGE & COX INTERNATIONAL STOCK FUND §PAGE 14
DODGE & COX FUNDS—EXECUTIVE OFFICER & TRUSTEE INFORMATION
| | | | | | |
Name (Age) and
Address* | | Position with Trust
(Year of Election or
Appointment) | | Principal Occupation During Past 5 Years | | Other Directorships Held by Trustees |
| INTERESTED TRUSTEES & OFFICERS |
John A. Gunn (63) | | Chairman and Trustee
(Trustee since 1985) | | Chairman (since 2007), Chief Executive Officer (since 2005) and Director of Dodge & Cox, Portfolio Manager and member of Investment Policy Committee (IPC), Fixed Income Investment Policy Committee (FIIPC) and International Investment Policy Committee (IIPC) | | — |
Kenneth E. Olivier (55) | | President and Trustee (Trustee since 2005) | | President (since 2005) and Director of Dodge & Cox, Portfolio Manager and member of IPC | | — |
Dana M. Emery (45) | | Vice President and Trustee (Trustee since 1993) | | Executive Vice President (since 2005) and Director of Dodge & Cox, Manager of the Fixed Income Department, Portfolio Manager and member of FIIPC | | — |
| Katherine Herrick Drake (53) | | Vice President (Since 1993) | | Vice President of Dodge & Cox, Portfolio Manager | | — |
| Diana S. Strandberg (47) | | Vice President
(Since 2005) | | Vice President of Dodge & Cox, Portfolio Manager and member of IPC and IIPC | | — |
| Roberta R.W. Kameda (46) | | Assistant Secretary (Since 2007) | | Senior Counsel (since 2006) of Dodge & Cox, Senior Associate General Counsel, Franklin Templeton Investments (1997-2006) | | — |
John M. Loll (40) | | Assistant
Treasurer and Assistant Secretary (Since 2000) | | Vice President and Treasurer of Dodge & Cox | | — |
| David H. Longhurst (49) | | Treasurer (Since 2006) | | Fund Administration and Accounting Senior Manager of Dodge & Cox (since 2004); Vice President, Treasurer, Controller and Secretary of Safeco Mutual Funds, Safeco Asset Management Company, Safeco Services, Safeco Securities, and Safeco Investment Services (2000-2004) | | — |
| Thomas M. Mistele (53) | | Secretary (Since 2000) | | Chief Operating Officer (since 2004), Director (since 2005), Secretary and General Counsel of Dodge & Cox | | — |
| Marcia P. Venegas (38) | | Chief Compliance Officer
(Since 2004) | | Chief Compliance Officer of Dodge & Cox (since 2005), Compliance Officer of Dodge & Cox (2003-2004); Compliance and Business Risk Manager of Deutsche Asset Management, Australia Limited (1999-2001) | | — |
| INDEPENDENT TRUSTEES |
William F. Ausfahl (67) | | Trustee (Since 2002) | | CFO, The Clorox Co. (1982-1997); Director, The Clorox Co. (1984-1997) | | — |
L. Dale Crandall (65) | | Trustee (Since 1999) | | President, Kaiser Foundation Health Plan, Inc. and Kaiser Foundation Hospitals (2000-2002); Senior Vice President—Finance and Administration & CFO, Kaiser Foundation Health Plan, Inc. and Kaiser Foundation Hospitals (1998-2000) | | Director, Union BanCal Corporation (bank holding company) and Union Bank of California (commercial bank) (2001-Present); Director, Covad Communications Group (broadband communications services) (2002-Present); Director, Ansell Limited (medical equipment and supplies) (2002-Present); Director, BEA Systems, Inc. (software and programming) (2003-Present); Director, Coventry Health Care, Inc. (managed healthcare) (2004-Present) |
Thomas A. Larsen (57) | | Trustee (Since 2002) | | Director in Howard, Rice, Nemerovski, Canady, Falk & Rabkin (law firm) | | — |
John B. Taylor (60) | | Trustee (Since 2005) | | Professor of Economics, Stanford University; Senior Fellow, Hoover Institution; Under Secretary for International Affairs, United States Treasury (2001-2005) | | — |
Will C. Wood (67) | | Trustee (Since 1992) | | Principal, Kentwood Associates, Financial Advisers | | Director, Banco Latinoamericano de Exportaciones S.A. (Latin American Foreign Trade Bank) (1999-Present) |
| * | | The address for each Officer and Trustee is 555 California Street, 40th Floor, San Francisco, California 94104. Each Officer and Trustee oversees all four series in the Dodge & Cox Funds complex and serves for an indefinite term. |
Additional information about the Trust’s Trustees and Officers is available in the Trust’s Statement of Additional Information (SAI). You can get a free copy of the SAI by visiting the Fund’s website at www.dodgeandcox.com or calling
1-800-621-3979.
PAGE 15 § DODGE & COX INTERNATIONAL STOCK FUND
| | | | |
 | | | |  |
www.dodgeandcox.com
For Fund literature, transactions and account information, please visit the Funds’ web site.
or write or call:
DODGE & COX FUNDS
c/o Boston Financial Data Services
P.O. Box 8422
Boston, Massachusetts 02266-8422
(800) 621-3979
INVESTMENT MANAGER
Dodge & Cox
555 California Street, 40th Floor
San Francisco, California 94104
(415) 981-1710
This report is submitted for the general information of the shareholders of the Fund. The report is not authorized for distribution to prospective investors in the Fund unless it is accompanied by a current prospectus.
This report reflects our views, opinions and portfolio holdings as of June 30, 2007, the end of the reporting period. Any such views are subject to change at any time based upon market or other conditions and Dodge & Cox disclaims any responsibility to update such views. These views may not be relied on as investment advice and, because investment decisions for a Dodge & Cox Fund are based on numerous factors, may not be relied on as an indication of trading intent on behalf of any Dodge & Cox Fund.
06/07 BF SAR  Printed on recycled paper
Semi-Annual Report
June 30, 2007
Balanced Fund
ESTABLISHED 1931
(Closed to New Investors)
TO OUR SHAREHOLDERS
The Dodge & Cox Balanced Fund had a total return of 5.4% for the six months ended June 30, 2007, compared to a total return of 4.6% for the Combined Index1. Longer-term results can be found on page 3. As of June 30, the Fund’s net assets of $29.3 billion were invested 65.2% in stocks, 32.4% in fixed income securities and 2.4% in cash equivalents.
SIX-MONTH PERFORMANCE REVIEW
Strong equity markets were the primary driver of Fund performance during the period, as rising interest rates led to modest total returns for the fixed income portion of the Fund. The difference in performance between equity and fixed income markets meant that the Fund benefited from its generally higher weighting in stocks relative to the Combined Index.
Equity Portfolio
During the period, the equity portion of the Fund slightly outperformed the S&P 500 return. Key factors influencing relative performance included:
| n | | Strong relative returns from the Fund’s Financials holdings (up 3% versus down 1% for the S&P 500 sector) in combination with a lower weighting than the S&P 500 (14% versus 21%) aided results. SLM (Sallie Mae) was a standout performer (up 35%) after agreeing to be acquired. |
| n | | Stronger returns from the Fund’s holdings in Consumer Staples (up 8% versus up 5% for the S&P 500 sector) also contributed to Fund performance. Unilever (up 16%) and Avon Products (up 12%) were notable contributors. |
| n | | The Fund’s Information Technology holdings (up 6%) underperformed the S&P 500 sector’s 9% return. Motorola, the group’s largest detractor, was down 13%. We discuss our investment thesis on Motorola below. |
| n | | Weaker relative returns from the Fund’s Health Care holdings (up 4% versus up 6% for the S&P 500 sector), in combination with a higher weighting than the S&P 500 (15% versus 12%), hindered performance. Sanofi-Aventis (down 11%) released disappointing news concerning a key pharmaceutical product. |
Fixed Income Portfolio
Despite a modest return, the fixed income portion of the Fund slightly outperformed the LBAG, influenced by the following factors:
n | | A shorter effective duration2 (3.8 years versus 4.5 years for the LBAG at the beginning of the year) added modestly to relative returns as intermediate and long-term Treasury yields rose. |
| n | | Strong relative performance from Corporate bond holdings helped returns. HCA, Liberty Media, Unum Group and Kaupthing Bank holdings performed well, offset somewhat by poor performance from Dow Chemical and Macy’s, both of which have been persistently rumored to be LBO targets. |
| n | | The overweighting of the MBS sector (46% of the Fund’s fixed income portfolio vs. 35% for the LBAG at the beginning of the year) detracted from relative returns due to the underperformance of this sector. |
INVESTMENT STRATEGY
Equity Portfolio
At Dodge & Cox, individual company analysis drives our investment decisions. The market provides us with the price of a stock each morning. Our fundamental research is focused on assessing a company’s cash flow and profit potential over the next three-to-five years relative to this stock price. We ask ourselves: What is a reasonable expectation if all goes according to management’s plan? How does the competitive environment affect the company’s ability to reach its goals? What could go wrong? It is our job to develop an understanding of a company’s risks and opportunities, and then to determine the price at which we are willing to participate (on our shareholders’ behalf) as equity owners.
Utilizing this “bottom-up” approach, we continue to identify what we believe are attractive long-term opportunities in selected “fallen growth” stocks in areas such as Technology, Health Care and Retailing. For example, Motorola stock has performed poorly over the past year (down more than 20%), due in part to loss of market share and lower profits in its mobile handset business. Motorola faces some significant challenges, including increased competition from other handset manufacturers, dependence on its ability to successfully innovate and lack of market share in next-generation
PAGE 1 § DODGE & COX BALANCED FUND
wireless network infrastructure. However, we believe Motorola enjoys a durable position in the extremely competitive global telecommunications market. Further, management appears to be taking meaningful steps toward improving internal operations and profitability in its handset business. Because of the stock’s lower valuation and our analysis of Motorola’s opportunities and risks, we increased the Fund’s position in Motorola to 2.7% of the equity portfolio as of June 30. (We discuss Motorola not because we think it is more attractive than the other 83 stocks in the Fund, but because it illustrates our investment approach.)
Fixed Income Portfolio
The fixed income portion of the Fund remains positioned with higher weightings in Corporates and MBS than the LBAG. We use our fundamental research capabilities in our efforts to locate attractive opportunities in these higher yielding sectors.
While our investment horizon is long and the portfolio’s turnover relatively low, we actively monitor existing and prospective holdings and, when new opportunities present themselves, we make changes to the portfolio. Importantly, all investment decisions are the result of our disciplined investment process in which we conduct independent research to locate securities that, in our view, offer favorable performance potential over our extended (three-to-five year) investment horizon.
For example, we made a number of incremental adjustments to the Fund’s holdings throughout the first half of 2007. Within the Corporate sector, we added three new issuers to the Fund, sold or tendered bonds of four other Fund holdings and adjusted several other issuer weightings. As a result of these changes, the fixed income portfolio’s Corporate weighting was 34% of the portfolio. This represents a significant sector overweighting when compared to the LBAG’s 19% weighting. Within the MBS sector, we added to holdings of seasoned 30-year and 15-year Federal Agency MBS, maintaining this weighting at a substantial 43% of the portfolio.
Concerned about a potential rise in long-term rates, we have focused a relatively high proportion of the Fund’s bond holdings in short and intermediate securities. For example, we find Government Sponsored Enterprise-guaranteed MBS (primarily Fannie Mae and Freddie Mac) to be among the most attractive securities from a risk/ reward perspective in this maturity range. Therefore, we have maintained a significantly above-benchmark
weighting in them for more than a year. In addition, we purchased short-duration asset-backed securities collateralized by student loans, which serve as a high-quality, higher-yielding substitute for short-maturity Treasuries. Finally, we recently added short, floating rate corporate notes to the portfolio based on our expectations that interest rates will continue to rise.
The fixed income portfolio’s overall duration remains substantially lower than the LBAG’s (3.6 years versus 4.7 years for the Index). Real (after-inflation) yields have remained stubbornly low over the past several years, particularly among longer-maturity securities. In our view, the low yields of longer-maturity securities do not offer an attractive level of compensation for the risks assumed, and the bond portfolio has significantly less exposure to them than the LBAG.
IN CLOSING
Over the past five years, strong equity markets have been the primary driver of the Fund’s performance. While we remain optimistic about the long-term contribution that equities will make to the Fund, there is bound to be a “bump in the road”. In fact, with the S&P 500 losing nearly 5% during the week of July 23, we appear to be experiencing one of these bumps as we write this letter. However, during the same week, bond markets generally rose in value. Rather than dampening our enthusiasm about investment opportunities, recent events have only reaffirmed our belief in the wisdom of maintaining a long-term perspective and a well balanced portfolio of carefully chosen stocks and bonds.
Thank you for your confidence in the Dodge & Cox Balanced Fund. As always, we welcome your comments and questions.
For the Board of Trustees,
| | |

| | 
|
John A. Gunn, Chairman | | Kenneth E. Olivier, President |
August 1, 2007
1 | | The Combined Index reflects an unmanaged portfolio of 60% of the Standard & Poor’s 500 Index (S&P 500) and 40% of the Lehman Brothers Aggregate Bond Index (LBAG). The Fund may, however, invest up to 75% of its total assets in stocks. |
2 | | Duration is a measure of a bond’s price sensitivity to changes in interest rates. |
DODGE & COX BALANCED FUND §PAGE 2
GROWTH OF $10,000 OVER 10 YEARS
FOR AN INVESTMENT MADE ON JUNE 30, 1997
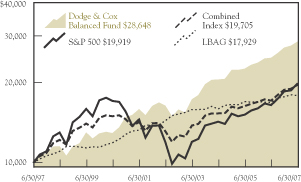
AVERAGE ANNUAL TOTAL RETURN
FOR PERIODS ENDED JUNE 30, 2007
| | | | | | | | | | | | |
| | | 1 Year | | | 5 Years | | | 10 Years | | | 20 Years | |
| | | | | | | | | | | | |
Dodge & Cox Balanced Fund | | 15.24 | % | | 11.78 | % | | 11.09 | % | | 11.85 | % |
Combined Index | | 14.66 | | | 8.38 | | | 7.01 | | | 9.74 | |
S&P 500 | | 20.60 | | | 10.70 | | | 7.13 | | | 10.83 | |
Lehman Brothers Aggregate
Bond Index (LBAG) | | 6.11 | | | 4.48 | | | 6.02 | | | 7.41 | |
Past performance does not guarantee future results. Investment return and share price will fluctuate with market conditions, and investors may have a gain or loss when shares are sold. Mutual fund performance changes over time and currently may be significantly lower than stated above. Performance is updated and published monthly. Visit the Fund’s web site at www.dodgeandcox.com or call 1-800-621-3979 for current performance figures.
The Fund’s total returns include the reinvestment of dividend and capital gain distributions, but have not been adjusted for any income taxes payable by shareholders on these distributions. Index returns include dividends and/or interest income and, unlike Fund returns, do not reflect fees or expenses.
Lehman Brothers® is a trademark of Lehman Brothers, Inc.; Standard & Poor’s, Standard & Poor’s 500, and S&P 500® are trademarks of The McGraw-Hill Companies, Inc.
FUND EXPENSE EXAMPLE
As a Fund shareholder, you incur ongoing Fund costs, including management fees and other Fund expenses. All mutual funds have ongoing costs, sometimes referred to as operating expenses. The following example shows ongoing costs of investing in the Fund and can help you understand these costs and compare them with those of other mutual funds. The example assumes a $1,000 investment held for the six months indicated.
ACTUAL EXPENSES
The first line of the table below provides information about actual account values and expenses based on the Fund’s actual returns. You may use the information in this line, together with your account balance, to estimate the expenses that you paid over the period. Simply divide your account value by $1,000 (for example, an $8,600 account value divided by $1,000 = 8.6), then multiply the result by the number in the first line under the heading “Expenses Paid During Period” to estimate the expenses you paid on your account during this period.
HYPOTHETICAL EXAMPLE FOR COMPARISON WITH OTHER MUTUAL FUNDS
Information on the second line of the table can help you compare ongoing costs of investing in the Fund with those of other mutual funds. This information may not be used to estimate the actual ending account balance or expenses you paid during the period. The hypothetical “Ending Account Value” is based on the actual expense ratio of the Fund and an assumed 5% annual rate of return before expenses (not the Fund’s actual return). The amount under the heading “Expense Paid During the Period” shows the hypothetical expenses your account would have incurred under this scenario. You can compare this figure with the 5% hypothetical examples that appear in shareholder reports of other mutual funds.
| | | | | | | | | |
Six Months Ended
June 30, 2007 | | Beginning Account
Value 1/1/2007 | | Ending Account
Value 6/30/2007 | | Expenses Paid
During Period* |
Based on Actual Fund Return | | $ | 1,000.00 | | $ | 1,053.60 | | $ | 2.72 |
Based on Hypothetical 5% Yearly Return | | | 1,000.00 | | | 1,022.15 | | | 2.68 |
| * | | Expenses are equal to the Fund’s annualized six-month expense ratio of 0.53%, multiplied by the average account value over the period, multiplied by 181/365 (to reflect the one-half year period). |
The expenses shown in the table highlight ongoing costs only and do not reflect any transactional fees or account maintenance fees. While other mutual funds may charge such fees, please note that the Fund does not charge transaction fees (e.g., redemption fees, sales loads) or universal account maintenance fees (e.g., small account fees).
PAGE 3 § DODGE & COX BALANCED FUND
| | |
| FUND INFORMATION | | June 30, 2007 |
GENERAL INFORMATION
| | |
| | | $90.01 |
Total Net Assets (billions) | | $29.3 |
30-Day SEC Yield(a) | | 2.42% |
Expense Ratio (1/1/07 to 6/30/07, annualized) | | 0.53% |
Portfolio Turnover Rate (1/1/07 to 6/30/07, unannualized) | | 11% |
Fund Inception | | 1931 |
No sales charges or distribution fees | | |
Investment Manager: Dodge & Cox, San Francisco. Managed by the Investment Policy Committee, whose nine members’ average tenure at Dodge & Cox is 21 years, and by the Fixed Income Investment Policy Committee, whose nine members’ average tenure is 17 years.
| | |
| STOCK PORTFOLIO (65.2% OF FUND) | | |
Number of Stocks | | 84 |
Median Market Capitalization (billions) | | $31 |
Price-to-Earnings Ratio(b) | | 14.4x |
Foreign Stocks(c) | | 12.4% |
| | | |
| FIVE LARGEST SECTORS | | | |
Consumer Discretionary | | 14.9 | % |
Health Care | | 11.1 | |
Information Technology | | 10.4 | |
Financials | | 9.2 | |
Energy | | 6.9 | |
| | |
| FIXED INCOME PORTFOLIO (32.4% OF FUND) |
Number of Fixed Income Securities | | 326 |
Effective Maturity | | 5.9 years |
Effective Duration | | 3.6 years |
| | | |
| CREDIT QUALITY(e) | | | |
U.S. Government & Government Related | | 20.5 | % |
Aaa | | 1.5 | |
Aa | | 1.9 | |
A | | 1.7 | |
Baa | | 3.8 | |
Ba | | 1.4 | |
B | | 1.0 | |
Caa | | 0.6 | |
Average Quality | | Aa2 | |
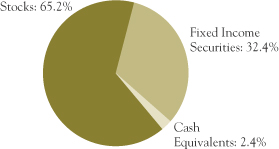
| | | |
| TEN LARGEST STOCK HOLDINGS(d) | | | |
Hewlett-Packard Co. | | 2.4 | % |
Comcast Corp., Class A | | 2.4 | |
Wal-Mart Stores, Inc. | | 1.9 | |
Sony Corp. ADR (Japan) | | 1.8 | |
News Corp., Class A | | 1.8 | |
Chevron Corp. | | 1.8 | |
Motorola, Inc. | | 1.8 | |
Pfizer, Inc. | | 1.7 | |
Time Warner, Inc. | | 1.6 | |
McDonald’s Corp. | | 1.6 | |
| | | |
| SECTOR DIVERSIFICATION | | | |
U.S. Treasury & Government Related | | 6.4 | % |
Mortgage-Related Securities | | 14.1 | |
Asset-Backed Securities | | 0.8 | |
Corporate | | 11.1 | |
| | | |
FIVE LARGEST CORPORATE FIXED INCOME
ISSUERS(d) | |
Ford Motor Credit Co. | | 0.8 | % |
GMAC, LLC | | 0.7 | |
Time Warner, Inc. (AOL Time Warner) | | 0.7 | |
General Electric Co. | | 0.7 | |
Wachovia Corp. | | 0.6 | |
(a) | SEC yield is an annualization of the Fund’s total net investment income per share for the 30-day period ended on the last day of the month. |
(b) | Price-to-earnings (P/E) ratio is calculated using 12-month forward earnings estimates. |
(c) | Foreign stocks are U.S. dollar-denominated. |
(d) | The Fund’s portfolio holdings are subject to change without notice. The mention of specific securities is not a recommendation or solicitation for any person to buy, sell or hold any particular security. |
(e) | Credit quality ratings are from Moody’s Investor Services. If no Moody’s rating is available, the Standard & Poor’s rating is reported. If unrated, the investment manager determines a comparable rating. In calculating average quality, the investment manager assigns ratings to U.S. Government and Government Related securities that are higher than the ratings assigned to securities rated Aaa. The credit quality of the investments in the portfolio does not apply to the stability or safety of the Fund or its shares. |
DODGE & COX BALANCED FUND §PAGE 4
| | |
| PORTFOLIO OF INVESTMENTS (unaudited) | | June 30, 2007 |
| | | | | |
| COMMON STOCKS: 65.2% | | | | |
| | |
| | | SHARES | | VALUE |
| CONSUMER DISCRETIONARY: 14.9% |
AUTOMOBILES & COMPONENTS: 0.3% |
Honda Motor Co., Ltd. ADR(b) (Japan) | | 2,863,300 | | $ | 103,909,157 |
| | | | | |
CONSUMER DURABLES & APPAREL: 4.1% |
Koninklijke Philips Electronics NV(b) (Netherlands) | | 2,400,000 | | | 101,568,000 |
Matsushita Electric Industrial Co., Ltd. ADR(b) (Japan) | | 21,308,200 | | | 422,115,442 |
Nike, Inc., Class B | | 1,964,000 | | | 114,481,560 |
Sony Corp. ADR(b) (Japan) | | 10,333,600 | | | 530,837,032 |
Thomson ADR(b) (France) | | 1,900,000 | | | 35,226,000 |
| | | | | |
| | | | | 1,204,228,034 |
CONSUMER SERVICES: 1.6% |
McDonald’s Corp. | | 9,192,350 | | | 466,603,686 |
| | | | | |
MEDIA: 6.8% |
Comcast Corp., Class A(a) | | 24,572,574 | | | 690,980,781 |
EchoStar Communications Corp.(a) | | 2,305,365 | | | 99,983,680 |
Interpublic Group of Companies, Inc.(a) | | 7,617,000 | | | 86,833,800 |
Liberty Capital, Series A(a) | | 633,129 | | | 74,506,621 |
Liberty Global, Inc., Series A(a) | | 264,221 | | | 10,843,630 |
Liberty Global, Inc., Series C(a) | | 391,068 | | | 15,368,972 |
News Corp., Class A | | 25,007,900 | | | 530,417,559 |
Time Warner, Inc. | | 22,784,600 | | | 479,387,984 |
| | | | | |
| | | | | 1,988,323,027 |
RETAILING: 2.1% |
Gap, Inc. | | 7,002,800 | | | 133,753,480 |
Genuine Parts Co. | | 2,875,750 | | | 142,637,200 |
Home Depot, Inc. | | 3,900,000 | | | 153,465,000 |
Liberty Interactive, Series A(a) | | 2,587,300 | | | 57,774,409 |
Macy’s, Inc. | | 3,168,272 | | | 126,033,860 |
| | | | | |
| | | | | 613,663,949 |
| | | | | |
| | | | | 4,376,727,853 |
| CONSUMER STAPLES: 2.7% |
FOOD & STAPLES RETAILING: 1.9% |
Wal-Mart Stores, Inc. | | 11,243,300 | | | 540,915,163 |
| | | | | |
FOOD, BEVERAGE & TOBACCO: 0.5% |
Unilever NV(b) (Netherlands) | | 4,859,100 | | | 150,729,282 |
| | | | | |
HOUSEHOLD & PERSONAL PRODUCTS: 0.3% |
Avon Products, Inc. | | 2,697,700 | | | 99,140,475 |
| | | | | |
| | | | | 790,784,920 |
| ENERGY: 6.9% |
Baker Hughes, Inc. | | 3,941,417 | | | 331,591,412 |
Chevron Corp. | | 6,243,002 | | | 525,910,489 |
ConocoPhillips | | 3,023,000 | | | 237,305,500 |
Exxon Mobil Corp. | | 2,365,500 | | | 198,418,140 |
Occidental Petroleum Corp. | | 3,945,000 | | | 228,336,600 |
Royal Dutch Shell PLC ADR(b) (United Kingdom) | | 2,766,127 | | | 230,556,685 |
| | | | | |
| | |
| | | SHARES | | VALUE |
Schlumberger, Ltd. | | 2,681,821 | | $ | 227,793,876 |
Spectra Energy Corp. | | 1,893,600 | | | 49,157,856 |
| | | | | |
| | | | | 2,029,070,558 |
| FINANCIALS: 9.2% |
BANKS: 2.5% |
HSBC Holdings PLC(b) (United Kingdom) | | 2,100,000 | | | 192,717,000 |
Wachovia Corp. | | 8,469,661 | | | 434,070,126 |
Wells Fargo & Co. | | 3,121,900 | | | 109,797,223 |
| | | | | |
| | | | | 736,584,349 |
DIVERSIFIED FINANCIALS: 2.7% |
Capital One Financial Corp. | | 4,466,150 | | | 350,324,806 |
Citigroup, Inc. | | 6,290,900 | | | 322,660,261 |
SLM Corp. | | 2,200,000 | | | 126,676,000 |
| | | | | |
| | | | | 799,661,067 |
INSURANCE: 4.0% |
Aegon NV(b) (Netherlands) | | 9,090,555 | | | 178,629,406 |
Chubb Corp. | | 3,334,224 | | | 180,514,888 |
Genworth Financial, Inc., Class A | | 2,448,000 | | | 84,211,200 |
Loews Corp. | | 4,190,700 | | | 213,641,886 |
Safeco Corp. | | 960,193 | | | 59,781,616 |
The Travelers Companies, Inc. | | 6,452,900 | | | 345,230,150 |
Unum Group | | 3,605,400 | | | 94,136,994 |
| | | | | |
| | | | | 1,156,146,140 |
| | | | | |
| | | | | 2,692,391,556 |
| HEALTH CARE: 11.1% |
HEALTH CARE EQUIPMENT & SERVICES: 3.6% |
Becton, Dickinson & Co. | | 1,227,900 | | | 91,478,550 |
Boston Scientific Corp.(a) | | 6,150,000 | | | 94,341,000 |
Cardinal Health, Inc. | | 6,491,400 | | | 458,552,496 |
Health Management Associates, Inc. | | 3,900,000 | | | 44,304,000 |
WellPoint, Inc.(a) | | 4,748,000 | | | 379,032,840 |
| | | | | |
| | | | | 1,067,708,886 |
PHARMACEUTICALS & BIOTECHNOLOGY: 7.5% |
Bristol-Myers Squibb Co. | | 5,620,550 | | | 177,384,558 |
GlaxoSmithKline PLC ADR(b) (United Kingdom) | | 8,100,400 | | | 424,217,948 |
Novartis AG ADR(b) (Switzerland) | | 5,222,700 | | | 292,836,789 |
Pfizer, Inc. | | 19,436,367 | | | 496,987,904 |
Sanofi-Aventis ADR(b) (France) | | 11,262,400 | | | 453,536,848 |
Thermo Fisher Scientific, Inc.(a) | | 2,955,850 | | | 152,876,562 |
Wyeth | | 3,366,800 | | | 193,052,312 |
| | | | | |
| | | | | 2,190,892,921 |
| | | | | |
| | | | | 3,258,601,807 |
| INDUSTRIALS: 5.0% |
CAPITAL GOODS: 2.0% |
General Electric Co. | | 5,962,700 | | | 228,252,156 |
Masco Corp. | | 3,151,000 | | | 89,708,970 |
Tyco International, Ltd. | | 8,265,600 | | | 279,294,624 |
| | | | | |
| | | | | 597,255,750 |
| | |
| PAGE 5 § DODGE & COX BALANCED FUND | | See accompanying Notes to Financial Statements |
| | |
| PORTFOLIO OF INVESTMENTS (unaudited) | | June 30, 2007 |
| | | | | |
| COMMON STOCKS (continued) |
| | |
| | | SHARES | | VALUE |
COMMERCIAL SERVICES & SUPPLIES: 0.4% |
Pitney Bowes, Inc. | | 2,506,650 | | $ | 117,361,353 |
| | | | | |
TRANSPORTATION: 2.6% |
FedEx Corp. | | 3,290,250 | | | 365,119,042 |
Union Pacific Corp. | | 3,342,700 | | | 384,911,905 |
| | | | | |
| | | | | 750,030,947 |
| | | | | |
| | | | | 1,464,648,050 |
| INFORMATION TECHNOLOGY: 10.4% |
SOFTWARE & SERVICES: 2.9% |
BMC Software, Inc.(a) | | 2,836,000 | | | 85,930,800 |
Citrix Systems, Inc.(a) | | 1,352,069 | | | 45,524,163 |
Computer Sciences Corp.(a) | | 3,636,400 | | | 215,093,060 |
Compuware Corp.(a) | | 6,038,700 | | | 71,618,982 |
EBay, Inc.(a) | | 5,117,600 | | | 164,684,368 |
Electronic Data Systems Corp. | | 9,733,700 | | | 269,915,501 |
| | | | | |
| | | | | 852,766,874 |
TECHNOLOGY, HARDWARE & EQUIPMENT: 7.5% |
Avaya, Inc.(a) | | 8,976,600 | | | 151,165,944 |
Dell, Inc.(a) | | 7,097,900 | | | 202,645,045 |
Hewlett-Packard Co. | | 15,837,331 | | | 706,661,709 |
Hitachi, Ltd. ADR(b) (Japan) | | 2,690,000 | | | 190,317,500 |
Motorola, Inc. | | 29,577,700 | | | 523,525,290 |
NCR Corp.(a) | | 1,505,750 | | | 79,112,105 |
Sun Microsystems, Inc.(a) | | 14,250,300 | | | 74,956,578 |
Xerox Corp.(a) | | 14,016,850 | | | 259,031,388 |
| | | | | |
| | | | | 2,187,415,559 |
| | | | | |
| | | | | 3,040,182,433 |
| MATERIALS: 2.9% |
Alcoa, Inc. | | 2,065,650 | | | 83,720,795 |
Cemex SAB de CV ADR(b) (Mexico) | | 2,780,907 | | | 102,615,468 |
Dow Chemical Co. | | 8,620,259 | | | 381,187,853 |
International Paper Co. | | 2,082,900 | | | 81,337,245 |
Nova Chemicals Corp.(b) (Canada) | | 1,442,870 | | | 51,322,886 |
Rohm and Haas Co. | | 2,620,700 | | | 143,299,876 |
| | | | | |
| | | | | 843,484,123 |
| TELECOMMUNICATION SERVICES: 1.9% |
Sprint Nextel Corp. | | 15,880,000 | | | 328,874,800 |
Vodafone Group PLC ADR(b) (United Kingdom) | | 6,575,350 | | | 221,129,021 |
| | | | | |
| | | | | 550,003,821 |
| UTILITIES: 0.2% |
FirstEnergy Corp. | | 1,095,100 | | | 70,885,823 |
| | | | | |
| | | | | 70,885,823 |
| | | | | |
TOTAL COMMON STOCKS
(Cost $13,014,579,722) | | | | $ | 19,116,780,944 |
| | | | | |
| | | | | | |
| FIXED INCOME SECURITIES: 32.4% |
| | |
| | | PAR VALUE | | VALUE |
| U.S. TREASURY AND GOVERNMENT RELATED: 6.4% |
U.S. TREASURY: 5.4% |
U.S. Treasury Notes | | | | | | |
2.75%, 8/15/07 | | $ | 150,000,000 | | $ | 149,613,300 |
3.00%, 11/15/07 | | | 200,000,000 | | | 198,593,800 |
3.375%, 2/15/08 | | | 200,000,000 | | | 197,984,400 |
4.875%, 4/30/08 | | | 200,000,000 | | | 199,734,400 |
3.75%, 5/15/08 | | | 350,000,000 | | | 346,171,700 |
3.125%, 9/15/08 | | | 200,000,000 | | | 195,687,600 |
3.625%, 7/15/09 | | | 307,000,000 | | | 299,468,983 |
| | | | | | |
| | | | | | 1,587,254,183 |
GOVERNMENT RELATED: 1.0% |
Arkansas Dev. Fin. Auth. GNMA Guaranteed Bonds 9.75%, 11/15/14 | | | 3,225,259 | | | 3,471,443 |
Small Business Administration—504 Program | | | |
Series 96-20L, 6.70%, 12/1/16 | | | 2,169,589 | | | 2,215,339 |
Series 97-20F, 7.20%, 6/1/17 | | | 3,529,971 | | | 3,633,821 |
Series 97-20I, 6.90%, 9/1/17 | | | 5,117,569 | | | 5,244,856 |
Series 98-20D, 6.15%, 4/1/18 | | | 6,286,885 | | | 6,370,794 |
Series 98-20I, 6.00%, 9/1/18 | | | 3,262,874 | | | 3,298,573 |
Series 99-20F, 6.80%, 6/1/19 | | | 4,588,584 | | | 4,714,116 |
Series 00-20D, 7.47%, 4/1/20 | | | 12,441,671 | | | 12,948,239 |
Series 00-20E, 8.03%, 5/1/20 | | | 4,899,617 | | | 5,172,185 |
Series 00-20G, 7.39%, 7/1/20 | | | 8,454,652 | | | 8,792,924 |
Series 00-20I, 7.21%, 9/1/20 | | | 5,371,765 | | | 5,581,056 |
Series 01-20E, 6.34%, 5/1/21 | | | 11,215,564 | | | 11,450,223 |
Series 01-20G, 6.625%, 7/1/21 | | | 10,057,649 | | | 10,335,645 |
Series 03-20J, 4.92%, 10/1/23 | | | 20,012,636 | | | 19,292,533 |
Series 05-20F, 4.57%, 6/1/25 | | | 42,096,994 | | | 39,291,835 |
Series 05-20K, 5.36%, 11/1/25 | | | 35,318,090 | | | 34,661,781 |
Series 06-20D, 5.64%, 4/1/26 | | | 49,304,083 | | | 49,365,600 |
Series 06-20F, 5.82%, 6/1/26 | | | 55,274,549 | | | 55,640,362 |
Series 07-20F, 5.71%, 6/1/27 | | | 12,080,000 | | | 12,072,838 |
| | | | | | |
| | | | | | 293,554,163 |
| | | | | | |
| | | | | | 1,880,808,346 |
| MORTGAGE-RELATED SECURITIES: 14.1% |
FEDERAL AGENCY CMO & REMIC: 1.0% |
Dept. of Veterans Affairs | | | | | | |
Trust 1995-1A 1, 7.209%, 2/15/25 | | | 1,245,406 | | | 1,281,826 |
Trust 1995-2C 3A, 8.793%, 6/15/25 | | | 627,394 | | | 672,272 |
Fannie Mae | | | | | | |
SMBS I-1, 6.50%, 4/1/09 | | | 19,794 | | | 19,782 |
Trust 1993-207 G, 6.15%, 4/25/23 | | | 2,453,297 | | | 2,455,260 |
Trust 2002-73 PM, 5.00%, 12/25/26 | | | 10,738,166 | | | 10,686,933 |
Trust 2002-33 A1, 7.00%, 6/25/32 | | | 5,163,216 | | | 5,286,044 |
Trust 2005-W4 1A2, 6.50%, 8/25/35 | | | 33,900,566 | | | 34,239,023 |
Trust 2001-T7 A1, 7.50%, 2/25/41 | | | 5,097,195 | | | 5,246,593 |
Trust 2001-T8 A1, 7.50%, 7/25/41 | | | 5,472,793 | | | 5,631,921 |
Trust 2001-W3 A, 7.00%, 9/25/41 | | | 2,046,497 | | | 2,085,911 |
Trust 2002-W6 2A1, 7.00%, 6/25/42 | | | 5,273,376 | | | 5,399,215 |
Trust 2002-W8 A2, 7.00%, 6/25/42 | | | 5,806,310 | | | 5,918,345 |
| | |
| See accompanying Notes to Financial Statements | | DODGE & COX BALANCED FUND §PAGE 6 |
| | |
| PORTFOLIO OF INVESTMENTS (unaudited) | | June 30, 2007 |
| | | | | | |
| FIXED INCOME SECURITIES (continued) |
| | |
| | | PAR VALUE | | VALUE |
Trust 2003-W2 1A1, 6.50%, 7/25/42 | | $ | 10,911,386 | | $ | 11,046,613 |
Trust 2003-W2 1A2, 7.00%, 7/25/42 | | | 4,323,742 | | | 4,391,107 |
Trust 2003-W4 4A, 7.50%, 10/25/42 | | | 6,554,667 | | | 6,757,932 |
Trust 2004-T1 1A2, 6.50%, 1/25/44 | | | 9,935,536 | | | 10,062,517 |
Trust 2004-W2 5A, 7.50%, 3/25/44 | | | 24,277,268 | | | 25,187,399 |
Freddie Mac | | | | | | |
Series 1512 I, 6.50%, 5/15/08 | | | 514,559 | | | 513,639 |
Series 2100 GS, 6.50%, 12/15/13 | | | 8,132,439 | | | 8,265,614 |
Series 2430 UC, 6.00%, 9/15/16 | | | 13,546,533 | | | 13,628,574 |
Series 1078 GZ, 6.50%, 5/15/21 | | | 1,121,196 | | | 1,135,000 |
Series (GN) 16 PK, 7.00%, 8/25/23 | | | 13,182,371 | | | 13,503,903 |
Series T-48 1A4, 5.538%, 7/25/33 | | | 81,643,642 | | | 80,617,201 |
Series T-051 1A, 6.50%, 9/25/43 | | | 516,131 | | | 522,032 |
Series T-59 1A1, 6.50%, 10/25/43 | | | 32,792,941 | | | 33,218,797 |
| | | | | | |
| | | | | | 287,773,453 |
FEDERAL AGENCY MORTGAGE PASS-THROUGH: 13.1% |
Fannie Mae, 10 Year | | | | | | |
6.00%, 1/1/12-10/1/14 | | | 27,500,393 | | | 27,597,267 |
Fannie Mae, 15 Year | | | | | | |
5.50%, 1/1/14-1/1/21 | | | 425,375,753 | | | 421,312,687 |
6.00%, 12/1/13-6/1/19 | | | 462,874,031 | | | 466,899,751 |
6.50%, 1/1/13-11/1/18 | | | 165,516,384 | | | 169,164,356 |
7.00%, 12/1/07-11/1/18 | | | 15,299,199 | | | 15,770,550 |
7.50%, 9/1/15-8/1/17 | | | 54,634,958 | | | 56,458,141 |
Fannie Mae, 20 Year | | | | | | |
5.50%, 1/1/23 | | | 17,340,501 | | | 16,956,950 |
6.50%, 1/1/22-10/1/26 | | | 32,058,586 | | | 32,491,245 |
Fannie Mae, 30 Year | | | | | | |
5.00%, 3/1/34 | | | 251,681,200 | | | 237,074,882 |
5.50%, 6/1/33-8/1/35 | | | 268,481,769 | | | 259,686,096 |
6.00%, 4/1/35-11/1/35 | | | 509,182,108 | | | 506,422,620 |
6.50%, 12/1/32 | | | 194,976,992 | | | 198,768,439 |
7.50%, 9/1/07-7/1/19 | | | 65,540 | | | 66,519 |
8.00%, 1/1/09 | | | 34,217 | | | 34,494 |
Fannie Mae, Hybrid ARM | | | | | | |
3.85%, 6/1/34 | | | 57,345,082 | | | 56,757,798 |
4.126%, 1/1/35 | | | 21,010,990 | | | 21,002,017 |
4.436%, 7/1/33 | | | 31,116,138 | | | 30,628,223 |
4.666%, 9/1/34 | | | 18,582,388 | | | 18,301,714 |
4.754%, 12/1/34 | | | 17,587,860 | | | 17,369,642 |
4.755%, 3/1/35 | | | 19,828,354 | | | 19,514,622 |
4.756%, 1/1/35 | | | 11,084,775 | | | 11,033,380 |
4.83%, 8/1/35 | | | 11,773,124 | | | 11,664,280 |
5.032%, 7/1/35 | | | 136,591,558 | | | 136,036,263 |
5.058%, 7/1/35 | | | 51,241,534 | | | 51,054,098 |
5.304%, 1/1/36 | | | 56,843,881 | | | 56,518,941 |
5.58%, 5/1/36 | | | 54,463,325 | | | 54,231,625 |
Fannie Mae, Multifamily DUS | | | | | | |
Pool 555728, 4.019%, 8/1/13 | | | 384,271 | | | 356,808 |
Pool 555162, 4.834%, 1/1/13 | | | 17,474,876 | | | 16,928,344 |
Pool 555316, 4.887%, 2/1/13 | | | 5,375,426 | | | 5,225,984 |
Pool 760762, 4.89%, 4/1/12 | | | 16,115,000 | | | 15,660,439 |
| | | | | | |
| | |
| | | PAR VALUE | | VALUE |
Pool 735387, 4.925%, 4/1/15 | | $ | 13,810,406 | | $ | 13,283,605 |
Pool 555148, 4.975%, 1/1/13 | | | 4,683,670 | | | 4,568,313 |
Pool 555806, 5.092%, 10/1/13 | | | 3,505,814 | | | 3,431,350 |
Pool 461628, 5.32%, 4/1/14 | | | 10,476,718 | | | 10,295,716 |
Pool 462086, 5.355%, 11/1/15 | | | 28,484,786 | | | 28,095,162 |
Pool 545316, 5.636%, 12/1/11 | | | 5,107,947 | | | 5,135,934 |
Pool 323350, 5.65%, 11/1/08 | | | 1,977,942 | | | 1,975,120 |
Pool 545387, 5.897%, 1/1/12 | | | 6,029,970 | | | 6,120,622 |
Pool 545258, 5.94%, 11/1/11 | | | 972,611 | | | 987,559 |
Pool 380735, 5.965%, 10/1/08 | | | 16,224,584 | | | 16,218,280 |
Pool 545685, 6.016%, 4/1/12 | | | 30,249,075 | | | 30,761,362 |
Pool 323492, 6.02%, 1/1/09 | | | 3,969,720 | | | 3,981,052 |
Freddie Mac, 30 Year | | | | | | |
8.00%, 2/1/08-11/1/10 | | | 29,296 | | | 29,496 |
8.25%, 2/1/17 | | | 5,887 | | | 5,912 |
8.75%, 5/1/10 | | | 22,875 | | | 23,470 |
Freddie Mac Gold, 15 Year | | | | | | |
5.50%, 8/1/14-1/1/17 | | | 29,346,627 | | | 29,162,421 |
6.00%, 10/1/13-10/1/18 | | | 145,938,856 | | | 147,140,038 |
6.50%, 7/1/14-3/1/18 | | | 64,828,575 | | | 66,091,566 |
7.00%, 5/1/08-4/1/15 | | | 1,615,504 | | | 1,635,850 |
7.75%, 7/25/21 | | | 1,431,910 | | | 1,491,351 |
Freddie Mac Gold, 20 Year
6.50%, 10/1/26 | | | 60,568,835 | | | 61,484,437 |
Freddie Mac Gold, 30 Year | | | | | | |
5.00%, 8/1/33 | | | 97,247,128 | | | 91,363,677 |
6.50%, 9/1/18-4/1/33 | | | 115,163,311 | | | 117,505,006 |
7.47%, 3/17/23 | | | 414,444 | | | 430,339 |
8.50%, 1/1/23 | | | 47,164 | | | 50,096 |
Freddie Mac Gold, Hybrid ARM | | | | | | |
3.809%, 5/1/34 | | | 21,394,510 | | | 20,935,266 |
4.804%, 10/1/35 | | | 31,621,034 | | | 31,326,538 |
4.842%, 5/1/35 | | | 97,353,890 | | | 95,689,827 |
5.387%, 11/1/35 | | | 56,710,513 | | | 56,640,670 |
6.323%, 11/1/36 | | | 40,943,577 | | | 41,344,786 |
Ginnie Mae, 30 Year | | | | | | |
7.50%, 1/15/08-10/15/25 | | | 4,706,073 | | | 4,910,950 |
7.97%, 4/15/20-1/15/21 | | | 2,294,335 | | | 2,414,287 |
| | | | | | |
| | | | | | 3,825,518,233 |
PRIVATE LABEL CMO & REMIC SECURITIES: 0.0%(e) |
Union Planters Mortgage Finance Corp.
7.70%, 12/25/24 | | | 3,958,584 | | | 4,067,399 |
| | | | | | |
| | | | | | 4,117,359,085 |
| ASSET-BACKED SECURITIES: 0.8% |
STUDENT LOAN: 0.8% |
SLM Student Loan Trust | | | | | | |
Series 2006-7 A1, 5.315%, 4/25/12 | | | 6,349,093 | | | 6,348,647 |
Series 2006-3 A2, 5.355%, 1/25/16 | | | 5,697,316 | | | 5,698,353 |
Series 2006-09 A2, 5.355%, 4/25/17 | | | 44,300,000 | | | 44,300,000 |
Series 2007-2 A2, 5.355%, 7/25/17 | | | 124,000,000 | | | 123,995,276 |
Series 2006-10 A2, 5.365%, 10/25/17 | | | 65,000,000 | | | 65,020,585 |
| | | | | | |
| | | | | | 245,362,861 |
| | |
| PAGE 7 § DODGE & COX BALANCED FUND | | See accompanying Notes to Financial Statements |
| | |
| PORTFOLIO OF INVESTMENTS (unaudited) | | June 30, 2007 |
| | | | | | |
| FIXED INCOME SECURITIES (continued) |
| | |
| | | PAR VALUE | | VALUE |
| CORPORATE: 11.1% |
FINANCIALS: 3.8% | | | | | | |
Bank of America
5.30%, 3/15/17 | | $ | 61,000,000 | | $ | 58,247,985 |
BankAmerica Capital II(c)
8.00%, 12/15/26 (callable) | | | 17,355,000 | | | 18,043,820 |
BankAmerica Capital VI(c)
5.625%, 3/8/35 | | | 10,000,000 | | | 8,928,850 |
BankAmerica Capital XI(c)
6.625%, 5/23/36 | | | 41,040,000 | | | 41,846,805 |
Boston Properties, Inc. | | | | | | |
6.25%, 1/15/13 | | | 49,070,000 | | | 50,318,145 |
5.625%, 4/15/15 | | | 29,500,000 | | | 29,089,271 |
5.00%, 6/1/15 | | | 2,890,000 | | | 2,734,238 |
CIGNA Corp. | | | | | | |
7.00%, 1/15/11 | | | 14,705,000 | | | 15,307,802 |
6.375%, 10/15/11 | | | 17,820,000 | | | 18,263,754 |
7.65%, 3/1/23 | | | 9,745,000 | | | 10,736,252 |
7.875%, 5/15/27 | | | 12,970,000 | | | 14,959,741 |
8.30%, 1/15/33 | | | 9,050,000 | | | 10,750,585 |
6.15%, 11/15/36 | | | 5,500,000 | | | 5,239,036 |
General Electric Co., FRN
5.486%, 11/1/12 | | | 190,000,000 | | | 189,905,570 |
Health Net, Inc.
6.375%, 6/1/17 | | | 18,675,000 | | | 18,325,068 |
HSBC Holdings PLC
6.50%, 5/2/36 | | | 23,000,000 | | | 23,636,433 |
JPMorgan Chase (Bank One) Capital III(c)
8.75%, 9/1/30 | | | 28,187,000 | | | 35,829,933 |
JPMorgan Chase Capital XVII(c)
5.85%, 8/1/35 | | | 5,955,000 | | | 5,413,286 |
Kaupthing Bank
7.125%, 5/19/16(d) | | | 65,060,000 | | | 68,726,912 |
Safeco Corp. | | | | | | |
4.875%, 2/1/10 | | | 15,131,000 | | | 14,851,258 |
7.25%, 9/1/12 | | | 13,672,000 | | | 14,563,578 |
The Travelers Companies, Inc. | | | | | | |
8.125%, 4/15/10 (St. Paul) | | | 19,885,000 | | | 21,201,705 |
5.00%, 3/15/13 (Travelers) | | | 10,250,000 | | | 9,871,949 |
5.50%, 12/1/15 | | | 9,160,000 | | | 8,895,936 |
6.25%, 6/20/16 | | | 22,000,000 | | | 22,363,308 |
5.75%, 12/15/17 | | | 21,660,000 | | | 21,151,142 |
Unum Group | | | | | | |
7.625%, 3/1/11 | | | 15,330,000 | | | 16,165,868 |
6.85%, 11/15/15(d)
(Unum Finance PLC) | | | 10,200,000 | | | 10,423,094 |
7.19%, 2/1/28 (Unum) | | | 8,500,000 | | | 8,239,909 |
7.25%, 3/15/28
(Provident Companies) | | | 12,130,000 | | | 12,479,950 |
6.75%, 12/15/28 (Unum) | | | 27,430,000 | | | 26,723,211 |
7.375%, 6/15/32 | | | 19,470,000 | | | 20,364,510 |
| | | | | | |
| | |
| | | PAR VALUE | | VALUE |
Wachovia Corp., FRN
5.485%, 4/23/12 | | $ | 186,000,000 | | $ | 186,117,180 |
WellPoint, Inc. | | | | | | |
5.00%, 12/15/14 | | | 13,070,000 | | | 12,340,589 |
5.25%, 1/15/16 | | | 77,600,000 | | | 73,608,644 |
5.875%, 6/15/17 | | | 1,275,000 | | | 1,259,351 |
| | | | | | |
| | | | | | 1,106,924,668 |
INDUSTRIALS: 6.4% | | | | | | |
AT&T Corp.
8.00%, 11/15/31 | | | 111,400,000 | | | 132,407,812 |
Comcast Corp. | | | | | | |
5.30%, 1/15/14 | | | 63,050,000 | | | 60,775,913 |
5.85%, 11/15/15 | | | 26,500,000 | | | 26,060,259 |
5.90%, 3/15/16 | | | 22,880,000 | | | 22,474,177 |
6.50%, 1/15/17 | | | 27,500,000 | | | 28,076,290 |
Cox Communications, Inc. | | | | | | |
5.45%, 12/15/14 | | | 75,530,000 | | | 73,071,650 |
5.50%, 10/1/15 | | | 15,265,000 | | | 14,667,604 |
5.875%, 12/1/16(d) | | | 25,145,000 | | | 24,584,895 |
Dillard’s, Inc. | | | | | | |
6.30%, 2/15/08 | | | 6,000,000 | | | 5,962,566 |
7.85%, 10/1/12 | | | 14,000,000 | | | 14,440,132 |
7.13%, 8/1/18 | | | 10,831,000 | | | 10,302,469 |
7.875%, 1/1/23 | | | 8,860,000 | | | 8,584,835 |
7.75%, 7/15/26 | | | 50,000 | | | 47,912 |
7.75%, 5/15/27 | | | 550,000 | | | 528,186 |
7.00%, 12/1/28 | | | 15,486,000 | | | 13,916,293 |
Dow Chemical Co. | | | | | | |
4.027%, 9/30/09(d) | | | 33,950,000 | | | 32,630,228 |
6.00%, 10/1/12 | | | 5,800,000 | | | 5,860,314 |
7.375%, 11/1/29 | | | 35,170,000 | | | 38,066,179 |
Ford Motor Credit Co. | | | | | | |
7.375%, 2/1/11 | | | 134,160,000 | | | 131,068,283 |
7.25%, 10/25/11 | | | 118,160,000 | | | 113,720,965 |
GMAC, LLC | | | | | | |
7.75%, 1/19/10 | | | 6,145,000 | | | 6,220,786 |
6.875%, 9/15/11 | | | 201,105,000 | | | 197,817,738 |
HCA, Inc. | | | | | | |
8.75%, 9/1/10 | | | 27,750,000 | | | 28,964,062 |
7.875%, 2/1/11 | | | 23,798,000 | | | 24,154,970 |
6.95%, 5/1/12 | | | 14,090,000 | | | 13,561,625 |
6.30%, 10/1/12 | | | 11,400,000 | | | 10,545,000 |
6.25%, 2/15/13 | | | 47,740,000 | | | 43,085,350 |
6.75%, 7/15/13 | | | 27,400,000 | | | 24,934,000 |
5.75%, 3/15/14 | | | 20,420,000 | | | 17,280,425 |
6.50%, 2/15/16 | | | 22,000,000 | | | 18,617,500 |
Hewlett-Packard Co.
5.50%, 7/1/07 | | | 21,210,000 | | | 21,210,000 |
Lafarge SA
6.50%, 7/15/16 | | | 27,590,000 | | | 28,241,096 |
| | |
| See accompanying Notes to Financial Statements | | DODGE & COX BALANCED FUND §PAGE 8 |
| | |
| PORTFOLIO OF INVESTMENTS (unaudited) | | June 30, 2007 |
| | | | | | |
| FIXED INCOME SECURITIES (continued) |
| | |
| | | PAR VALUE | | VALUE |
Liberty Media Corp. | | | | | | |
8.50%, 7/15/29 | | $ | 32,630,000 | | $ | 32,586,602 |
4.00%, 11/15/29 (exchangeable) | | | 18,975,000 | | | 12,760,687 |
8.25%, 2/1/30 | | | 18,875,000 | | | 18,305,277 |
3.75%, 2/15/30 (exchangeable) | | | 35,755,000 | | | 22,212,794 |
Lockheed Martin Corp. | | | | | | |
7.65%, 5/1/16 | | | 18,500,000 | | | 20,832,480 |
7.75%, 5/1/26 | | | 8,500,000 | | | 9,969,795 |
6.15%, 9/1/36 | | | 7,000,000 | | | 6,980,463 |
Macy’s, Inc. (May Department Stores Co.) | | | | | | |
7.625%, 8/15/13 | | | 5,900,000 | | | 6,270,089 |
7.45%, 10/15/16 | | | 9,300,000 | | | 9,561,470 |
6.90%, 1/15/32 | | | 54,484,000 | | | 51,832,754 |
6.70%, 7/15/34 | | | 13,025,000 | | | 12,108,209 |
Raytheon Co.
6.75%, 8/15/07 | | | 20,476,000 | | | 20,502,598 |
Time Warner, Inc.
(AOL Time Warner) | | | | | | |
7.625%, 4/15/31 | | | 101,940,000 | | | 109,215,560 |
7.70%, 5/1/32 | | | 79,490,000 | | | 85,956,511 |
Wyeth | | | | | | |
5.50%, 2/1/14 | | | 70,724,000 | | | 69,704,514 |
5.50%, 2/15/16 | | | 10,665,000 | | | 10,386,462 |
5.45%, 4/1/17 | | | 35,000,000 | | | 33,816,930 |
Xerox Corp. | | | | | | |
7.125%, 6/15/10 | | | 18,425,000 | | | 19,108,973 |
6.875%, 8/15/11 | | | 135,655,000 | | | 140,749,795 |
6.40%, 3/15/16 | | | 10,000,000 | | | 10,061,660 |
| | | | | | |
| | | | | | 1,894,803,137 |
TRANSPORTATION: 0.9% |
Burlington Northern Santa Fe Railway | | | |
4.30%, 7/1/13 | | | 7,320,000 | | | 6,763,922 |
8.251%, 1/15/21 | | | 1,381,588 | | | 1,574,001 |
4.967%, 4/1/23 | | | 13,274,493 | | | 12,379,555 |
5.72%, 1/15/24 | | | 25,867,509 | | | 25,344,711 |
5.996%, 4/1/24 | | | 25,163,000 | | | 25,335,384 |
5.629%, 4/1/24 | | | 29,771,230 | | | 29,179,311 |
5.342%, 4/1/24 | | | 19,387,326 | | | 18,658,276 |
Consolidated Rail Corp.
6.76%, 5/25/15 | | | 3,385,937 | | | 3,450,269 |
CSX Transportation, Inc.
9.75%, 6/15/20 | | | 5,351,000 | | | 6,837,936 |
FedEx Corp.
6.72%, 7/15/23 | | | 5,367,526 | | | 5,646,100 |
Norfolk Southern Corp. | | | | | | |
7.70%, 5/15/17 | | | 13,000,000 | | | 14,317,823 |
9.75%, 6/15/20 | | | 7,389,000 | | | 9,480,109 |
| | | | | | | | |
| | |
| | | PAR VALUE | | | VALUE | |
Union Pacific Corp. | | | | | | | | |
6.125%, 1/15/12 | | $ | 15,720,000 | | | $ | 15,924,549 | |
6.50%, 4/15/12 | | | 3,550,000 | | | | 3,654,079 | |
5.375%, 5/1/14 | | | 2,935,000 | | | | 2,834,230 | |
4.875%, 1/15/15 | | | 8,320,000 | | | | 7,762,901 | |
6.33%, 1/2/20 | | | 33,992,328 | | | | 35,054,589 | |
5.866%, 7/2/30 | | | 36,924,000 | | | | 37,000,802 | |
| | | | | | | | |
| | | | | | | 261,198,547 | |
| | | | | | | | |
| | | | | | | 3,262,926,352 | |
| | | | | | | | |
TOTAL FIXED INCOME SECURITIES
(Cost $9,566,340,770) | | | $ | 9,506,456,644 | |
| | | | | | | | |
|
| SHORT-TERM INVESTMENTS: 2.7% | |
Fixed Income Clearing Corporation Repurchase Agreement(f)
5.05%, 7/2/07, maturity value $752,693,625 | | $ | 752,377,000 | | | $ | 752,377,000 | |
SSgA Prime Money Market Fund | | | 29,249,340 | | | | 29,249,340 | |
| | | | | | | | |
TOTAL SHORT-TERM INVESTMENTS
(Cost $781,626,340) | | | $ | 781,626,340 | |
| | | | | | | | |
TOTAL INVESTMENTS
(Cost $23,362,546,832) | | | 100.3 | % | | $ | 29,404,863,928 | |
OTHER ASSETS LESS LIABILITIES | | | (0.3 | %) | | | (92,414,922 | ) |
| | | | | | | | |
| TOTAL NET ASSETS | | | 100.0 | % | | $ | 29,312,449,006 | |
| | | | | | | | |
| (b) | Security issued by a foreign entity, denominated in U.S. dollars |
| (c) | Cumulative preferred security |
| (d) | Security exempt from registration under Rule 144A of the Securities Act of 1933. The security may be resold in transactions exempt from registration, normally to qualified institutional buyers. As of June 30, 2007, all such securities in total represented $136,365,129 or 0.5% of total net assets. |
| (f) | Repurchase agreement is collateralized by Freddie Mac 4.625%, 2/21/08; Fannie Mae 5.00%-6.00%, 2/27/08-5/22/12; and Federal Home Loan Bank 5.125%-5.50%, 6/18/08-8/15/19. Total collateral value is $767,428,719. |
When two issuers are identified, the first name refers to the acquirer/successor obligor or guarantor, and the second name (within the parentheses) refers to the original issuer of the instrument.
ADR: American Depository Receipt
ARM: Adjustable Rate Mortgage
CMO: Collateralized Mortgage Obligation
DUS: Delegated Underwriting and Servicing
FRN: Floating Rate Note
REMIC: Real Estate Mortgage Investment Conduit
| | |
| PAGE 9 § DODGE & COX BALANCED FUND | | See accompanying Notes to Financial Statements |
| | | |
STATEMENT OF ASSETS AND LIABILITIES (unaudited) |
| | | June 30, 2007 |
ASSETS: | | | |
Investments, at value (cost $23,362,546,832) | | $ | 29,404,863,928 |
Receivable for investments sold | | | 22,573,773 |
Receivable for paydowns on mortgage-backed securities | | | 3,865,098 |
Receivable for Fund shares sold | | | 17,756,956 |
Dividends and interest receivable | | | 136,120,255 |
Prepaid expenses and other assets | | | 41,467 |
| | | |
| | | 29,585,221,477 |
LIABILITIES: | | | |
Payable for investments purchased | | | 151,070,229 |
Payable for Fund shares redeemed | | | 108,120,102 |
Management fees payable | | | 12,142,185 |
Accrued expenses | | | 1,439,955 |
| | | |
| | | 272,772,471 |
| | | |
NET ASSETS | | $ | 29,312,449,006 |
| | | |
NET ASSETS CONSIST OF: | | | |
Paid in capital | | $ | 22,503,036,403 |
Undistributed net investment income | | | 12,923,770 |
Undistributed net realized gain on investments | | | 754,171,737 |
Net unrealized appreciation on investments | | | 6,042,317,096 |
| | | |
| | $ | 29,312,449,006 |
| | | |
Fund shares outstanding (par value $0.01 each, unlimited shares authorized) | | | 325,655,088 |
Net asset value per share | | | $90.01 |
|
STATEMENT OF OPERATIONS
(unaudited) |
| | | Six Months Ended
June 30, 2007 |
INVESTMENT INCOME: | | | |
Dividends (net of foreign taxes of $3,633,971) | | $ | 193,714,049 |
Interest | | | 270,795,601 |
| | | |
| | | 464,509,650 |
EXPENSES: | | | |
Management fees | | | 70,952,182 |
Custody and fund accounting fees | | | 207,728 |
Transfer agent fees | | | 2,376,893 |
Professional services | | | 49,547 |
Shareholder reports | | | 1,537,368 |
Registration fees | | | 286,689 |
Trustees’ fees | | | 84,188 |
Miscellaneous | | | 222,424 |
| | | |
| | | 75,717,019 |
| | | |
NET INVESTMENT INCOME | | | 388,792,631 |
| |
REALIZED AND UNREALIZED GAIN ON INVESTMENTS: | | | |
Net realized gain | | | 761,487,882 |
Net change in unrealized appreciation | | | 328,546,110 |
| | | |
Net realized and unrealized gain | | | 1,090,033,992 |
| | | |
NET INCREASE IN NET ASSETS FROM OPERATIONS | | $ | 1,478,826,623 |
| | | |
| | | | | | | | |
STATEMENT OF CHANGES IN NET ASSETS (unaudited) | |
| | | Six Months Ended
June 30, 2007 | | | Year Ended
December 31, 2006 | |
OPERATIONS: | | | | | | | | |
Net investment income | | $ | 388,792,631 | | | $ | 636,379,100 | |
Net realized gain | | | 761,487,882 | | | | 1,120,034,743 | |
Net change in unrealized appreciation | | | 328,546,110 | | | | 1,552,806,112 | |
| | | | | | | | |
Net increase in net assets from operations | | | 1,478,826,623 | | | | 3,309,219,955 | |
| |
DISTRIBUTIONS TO SHAREHOLDERS FROM: | | | | | |
Net investment income | | | (389,517,335 | ) | | | (653,483,566 | ) |
Net realized gain | | | (152,924,399 | ) | | | (969,143,303 | ) |
| | | | | | | | |
Total distributions | | | (542,441,734 | ) | | | (1,622,626,869 | ) |
| | |
FUND SHARE TRANSACTIONS: | | | | | | | | |
Proceeds from sale of shares | | | 2,409,467,041 | | | | 3,661,818,984 | |
Reinvestment of distributions | | | 517,765,711 | | | | 1,554,510,730 | |
Cost of shares redeemed | | | (2,008,972,890 | ) | | | (3,056,236,439 | ) |
| | | | | | | | |
Net increase from Fund share transactions | | | 918,259,862 | | | | 2,160,093,275 | |
| | | | | | | | |
Total increase in net assets | | | 1,854,644,751 | | | | 3,846,686,361 | |
| | |
NET ASSETS: | | | | | | | | |
Beginning of period | | | 27,457,804,255 | | | | 23,611,117,894 | |
| | | | | | | | |
End of period (including undistributed net investment income of $12,923,770 and $6,332,329, respectively) | | $ | 29,312,449,006 | | | $ | 27,457,804,255 | |
| | | | | | | | |
| | |
SHARE INFORMATION: | | | | | | | | |
Shares sold | | | 27,070,280 | | | | 42,976,777 | |
Distributions reinvested | | | 5,861,111 | | | | 17,977,977 | |
Shares redeemed | | | (22,576,044 | ) | | | (35,942,189 | ) |
| | | | | | | | |
Net increase in shares outstanding | | | 10,355,347 | | | | 25,012,565 | |
| | | | | | | | |
| | |
| See accompanying Notes to Financial Statements | | DODGE & COX BALANCED FUND §PAGE 10 |
NOTES TO FINANCIAL STATEMENTS (unaudited)
NOTE 1—ORGANIZATION AND SIGNIFICANT ACCOUNTING POLICIES
Dodge & Cox Balanced Fund (the “Fund”) is one of the series constituting the Dodge & Cox Funds (the “Trust” or the “Funds”). The Trust is organized as a Delaware statutory trust and is registered under the Investment Company Act of 1940, as amended, as a diversified, open-end management investment company. The Fund commenced operations on June 26, 1931, and seeks regular income, conservation of principal and an opportunity for long-term growth of principal and income. Risk considerations and investment strategies of the Fund are discussed in the Fund’s Prospectus. The Fund is closed to new investors.
The financial statements have been prepared in conformity with accounting principles generally accepted in the United States of America, which require the use of estimates and assumptions by management. Significant accounting policies are as follows:
Security valuation The Fund’s net assets are valued as of the close of trading on the New York Stock Exchange (NYSE), generally 4:00 p.m. Eastern Time, each day that the NYSE is open for business. Stocks are valued at the official quoted close price or the last sale of the day at the close of the NYSE or, if not available, at the mean between the exchange-listed bid and ask prices for the day. A security that is listed or traded on more than one exchange is valued at the quotation on the exchange determined to be the primary market for such security. Fixed income securities with original maturities of one year or more are priced on the basis of valuations furnished by pricing services which utilize both dealer-supplied valuations and computerized pricing models. Under certain circumstances, fixed income securities that are not valued by pricing services are temporarily valued by the investment manager utilizing both dealer-supplied valuations and computerized pricing models. Valuations of fixed income securities take into account appropriate factors such as institutional-size trading markets in similar groups of securities, yield, quality, coupon rate, maturity, type of issue, trading characteristics and other market data and do not rely exclusively upon exchange or over-the-
counter listed prices. Security values are not discounted based on the size of the Fund’s position. Securities for which market quotations are not readily available are valued at fair value as determined in good faith by or at the direction of the Board of Trustees. Short-term securities are valued at amortized cost which approximates current value. All securities held by the Fund are denominated in U.S. dollars.
Security transactions, investment income, expenses, and distributions Security transactions are recorded on the trade date. Realized gains and losses on securities sold are determined on the basis of identified cost.
Dividend income and corporate action transactions are recorded on the ex-dividend date, except for certain dividends or corporate actions from foreign securities where the ex-dividend date may have passed, which are recorded as soon as the Fund is informed of the ex-dividend date. Withholding taxes on foreign dividends have been provided for in accordance with the Fund’s understanding of the applicable country’s tax rules and rates. Non-cash dividends included in dividend income, if any, are recorded at the fair market value of the securities received. Distributions received in excess of income are recorded as a reduction of cost of investments and/or realized gain. The Fund may estimate the character of distributions received from Real Estate Investment Trusts (“REITs”).
Interest income is recorded on the accrual basis. Interest income includes coupon interest, amortization of premium and accretion of discount on debt securities, and gain/loss on paydowns of mortgage-backed securities. The ability of the issuers of the debt securities held by the Fund to meet their obligations may be affected by economic developments in a specific industry, state or region. Debt obligations may be placed on non-accrual status and related interest income may be reduced by ceasing current accruals and writing off interest receivables when the collection of all or a portion of interest has become doubtful. A debt obligation is removed from non-accrual status when the issuer resumes interest payments or when collectibility of interest is reasonably assured.
PAGE 11 § DODGE & COX BALANCED FUND
NOTES TO FINANCIAL STATEMENTS (unaudited)
Expenses are recorded on the accrual basis. Most expenses of the Trust can be directly attributed to a specific series. Expenses which cannot be directly attributed are apportioned among the Funds in the Trust.
Distributions to shareholders are recorded on the ex-dividend date.
Repurchase agreements The Fund may enter into repurchase agreements secured by U.S. government and agency securities which involve the purchase of securities from a counterparty with a simultaneous commitment to resell the securities at an agreed-upon date and price. It is the Fund’s policy that its custodian take possession of the underlying collateral securities, the fair value of which exceeds the principal amount of the repurchase transaction, including accrued interest, at all times. In the event of default by the counterparty, the Fund has the contractual right to liquidate the securities and to apply the proceeds in satisfaction of the obligation.
NOTE 2—RELATED PARTY TRANSACTIONS
Management fees Under a written agreement approved by a unanimous vote of the Board of Trustees, the Fund pays an annual management fee of 0.50% of the Fund’s average daily net assets to Dodge & Cox, investment manager of the Fund.
Fund officers and trustees All officers and three of the trustees of the Trust are officers or employees of Dodge & Cox. The Trust pays a fee only to those trustees who are not affiliated with Dodge & Cox.
Indemnification Under the Trust’s organizational documents, its officers and trustees are indemnified against certain liabilities arising out of the performance of their duties to the Trust. In addition, in the normal course of business the Trust enters into contracts that provide general indemnities to other parties. The Trust’s maximum exposure under these arrangements is unknown as this would involve future claims that may be made against the Trust that have not yet occurred.
NOTE 3—INCOME TAX INFORMATION AND DISTRIBUTIONS TO SHAREHOLDERS
A provision for federal income taxes is not required since the Fund intends to continue to qualify as a regulated
investment company under Subchapter M of the Internal Revenue Code and distribute all of its taxable income to shareholders. Distributions are determined in accordance with income tax regulations, which may differ from net investment income and realized gains for financial reporting purposes. Financial reporting records are adjusted for permanent book/tax differences to reflect tax character. Financial records are not adjusted for temporary differences.
Book/tax differences are primarily due to differing treatments of net short-term realized gain and paydown loss. At June 30, 2007 investments for federal income tax purposes was equal to the cost for financial reporting purposes.
Distributions for the six months ended June 30, 2007 and for the year ended December 31, 2006 were characterized as follows for federal income tax purposes:
| | | | |
| | | Six Months Ended
June 30, 2007 | | Year Ended
December 31, 2006 |
Ordinary income | | $396,179,933 | | $677,362,327 |
| | ($1.231 per share) | | ($2.279 per share) |
| | |
Long-term capital gain | | $146,261,801 | | $945,264,542 |
| | ($0.459 per share) | | ($3.124 per share) |
At June 30, 2007, the tax basis components of distributable earnings were as follows:
| | | | |
Unrealized appreciation | | $ | 6,244,335,370 | |
Unrealized depreciation | | | (202,018,274 | ) |
| | | | |
Net unrealized appreciation | | | 6,042,317,096 | |
Undistributed ordinary income | | | 62,153,479 | |
Undistributed long-term capital gain | | | 704,942,028 | |
NOTE 4—PURCHASES AND SALES OF INVESTMENTS
For the six months ended June 30, 2007, purchases and sales of securities, other than short-term securities and U.S. government securities, aggregated $3,135,501,088 and $2,174,067,672 respectively. For the six months ended June 30, 2007, purchases and sales of U.S. government securities aggregated $1,380,380,266 and $839,083,343, respectively.
DODGE & COX BALANCED FUND §PAGE 12
NOTES TO FINANCIAL STATEMENTS (unaudited)
NOTE 5—ACCOUNTING PRONOUNCEMENTS
In July 2006, the Financial Accounting Standards Board (FASB) issued Interpretation 48, “Accounting for Uncertainty in Income Taxes” (FIN 48). FIN 48 clarifies the accounting for income taxes by prescribing the minimum recognition threshold a tax position must meet before being recognized in the financial statements. FIN 48 was effective for the Fund on June 29, 2007. Implementation of FIN 48 included a review of tax positions taken from January 1, 2003 through June 30, 2007. There was no impact to the Fund’s financial statements as a result of implementing FIN 48.
In September 2006, FASB issued “Statement of Financial Accounting Standards No. 157, Fair Value Measurements” (SFAS 157). SFAS 157 is effective for the Fund beginning January 1, 2008. It defines fair value, establishes a framework for measuring fair value and expands disclosures about fair value measurements. Management is currently evaluating the impact the adoption of SFAS 157 will have on the Fund’s financial statement disclosures.
FINANCIAL HIGHLIGHTS
| | | | | | | | | | | | | | | | | | |
SELECTED DATA AND RATIOS (for a share outstanding throughout each period) | | Six Months
Ended June 30, | | | Year Ended December 31, | |
| | | 2007 | | | 2006 | | | 2005 | | | 2004 | | | 2003 | | | 2002 | |
Net asset value, beginning of period | | $87.08 | | | $81.34 | | | $79.35 | | | $73.04 | | | $60.75 | | | $65.42 | |
Income from investment operations: | | | | | | | | | | | | | | | | | | |
Net investment income | | 1.23 | | | 2.21 | | | 1.84 | | | 1.60 | | | 1.66 | | | 1.89 | |
Net realized and unrealized gain (loss) | | 3.39 | | | 8.93 | | | 3.31 | | | 7.99 | | | 12.96 | | | (3.80 | ) |
| | | | | | |
Total from investment operations | | 4.62 | | | 11.14 | | | 5.15 | | | 9.59 | | | 14.62 | | | (1.91 | ) |
| | | | | | | | | | | | | | | | | | |
Distributions to shareholders from: | | | | | | | | | | | | | | | | | | |
Net investment income | | (1.21 | ) | | (2.20 | ) | | (1.84 | ) | | (1.60 | ) | | (1.66 | ) | | (1.88 | ) |
Net realized gain | | (0.48 | ) | | (3.20 | ) | | (1.32 | ) | | (1.68 | ) | | (0.67 | ) | | (0.88 | ) |
| | | | | | | | | | | | | | | | | | |
Total distributions | | (1.69 | ) | | (5.40 | ) | | (3.16 | ) | | (3.28 | ) | | (2.33 | ) | | (2.76 | ) |
| | | | | | | | | | | | | | | | | | |
Net asset value, end of period | | $90.01 | | | $87.08 | | | $81.34 | | | $79.35 | | | $73.04 | | | $60.75 | |
| | | | | | |
Total return | | 5.36 | % | | 13.84 | % | | 6.59 | % | | 13.31 | % | | 24.44 | % | | (2.94 | )% |
Ratios/supplemental data: | | | | | | | | | | | | | | | | | | |
Net assets, end of period (millions) | | $29,312 | | | $27,458 | | | $23,611 | | | $20,741 | | | $13,196 | | | $7,885 | |
Ratios of expenses to average net assets | | 0.53 | %* | | 0.52 | % | | 0.53 | % | | 0.54 | % | | 0.54 | % | | 0.53 | % |
Ratios of net investment income to average net assets | | 2.74 | %* | | 2.52 | % | | 2.15 | % | | 1.97 | % | | 2.40 | % | | 3.05 | % |
Portfolio turnover rate | | 11 | % | | 20 | % | | 18 | % | | 18 | % | | 19 | % | | 25 | % |
See accompanying Notes to Financial Statements
PAGE 13 § DODGE & COX BALANCED FUND
SHAREHOLDER MEETING RESULTS
A special meeting of Fund shareholders was held on April 17, 2007. The meeting was adjourned in order to permit shareholders further time to respond to the solicitation of proxies and was reconvened on April 27, 2007. At the meeting, the proposals to amend the Fund’s fundamental investment restrictions listed below were approved. The following is a report of the total votes cast by the Fund’s shareholders:
| | | | | | | | |
PROPOSAL | | FOR | | AGAINST | | ABSTAIN | | TOTAL |
1. Amend the Fund’s fundamental investment restrictions with respect to the percentage of the Fund's assets that are subject to diversification requirements | | 143,692,794 | | 9,933,207 | | 7,631,399 | | 161,257,400 |
| | | | |
2a. Amend the Fund’s fundamental investment restrictions with respect to investments in real estate | | 145,281,308 | | 8,363,515 | | 7,613,323 | | 161,258,146 |
| | | | |
2b. Amend the Fund’s fundamental investment restrictions with respect to investments in commodities and commodity contracts | | 142,717,198 | | 10,700,365 | | 7,840,586 | | 161,258,149 |
| | | | |
3. Amend the Fund’s fundamental investment restrictions with respect to making loans | | 142,864,260 | | 10,542,879 | | 7,851,006 | | 161,258,145 |
| | | | |
4. Eliminate the Fund’s fundamental investment restrictions with respect to investments in oil, gas and mineral leases or other mineral exploration or development programs | | 143,523,945 | | 9,718,084 | | 8,016,121 | | 161,258,150 |
| | | | |
5. Amend the Fund’s fundamental investment restrictions with respect to borrowing and issuing senior securities | | 141,093,892 | | 12,194,474 | | 7,969,749 | | 161,258,115 |
FUND HOLDINGS
The Fund provides a complete list of its holdings four times each fiscal year, as of the end of each quarter. The lists appear in the Fund’s First Quarter, Semi-Annual, Third Quarter and Annual Reports to shareholders. The Fund files the lists with the Securities and Exchange Commission (SEC) on Form N-CSR (second and fourth quarters) and Form N-Q (first and third quarters). Shareholders may view the Fund’s Forms N-CSR and N-Q on the SEC’s website at www.sec.gov. Forms N-CSR and N-Q may also be reviewed and copied at the SEC’s Public Reference Room in Washington, DC. Information regarding the operations of the Public Reference Room may be obtained by 1-202-942-8090 (direct) or 1-800-732-0330 (general SEC number). A complete list of the Fund’s quarter-end holdings is also available at www.dodgeandcox.com on or about 15 days following each quarter end and remains available on the web site until the list is updated in the subsequent quarter.
PROXY VOTING
For a free copy of the Fund’s proxy voting policies and procedures, please call 1-800-621-3979, visit the Fund’s web site at www.dodgeandcox.com or visit the SEC’s web site at www.sec.gov. Information regarding how the Fund voted proxies relating to portfolio securities during the most recent 12-month period ending June 30 is also available at www.dodgeandcox.com or at www.sec.gov.
DODGE & COX BALANCED FUND §PAGE 14
DODGE & COX FUNDS—EXECUTIVE OFFICER & TRUSTEE INFORMATION
| | | | | | |
Name (Age) and
Address* | | Position with Trust
(Year of Election or
Appointment) | | Principal Occupation During Past 5 Years | | Other Directorships Held by Trustees |
| INTERESTED TRUSTEES & OFFICERS |
John A. Gunn (63) | | Chairman and Trustee
(Trustee since 1985) | | Chairman (since 2007), Chief Executive Officer (since 2005) and Director of Dodge & Cox, Portfolio Manager and member of Investment Policy Committee (IPC), Fixed Income Investment Policy Committee (FIIPC) and International Investment Policy Committee (IIPC) | | — |
Kenneth E. Olivier (55) | | President and Trustee (Trustee since 2005) | | President (since 2005) and Director of Dodge & Cox, Portfolio Manager and member of IPC | | — |
Dana M. Emery (45) | | Vice President and Trustee (Trustee since 1993) | | Executive Vice President (since 2005) and Director of Dodge & Cox, Manager of the Fixed Income Department, Portfolio Manager and member of FIIPC | | — |
| Katherine Herrick Drake (53) | | Vice President (Since 1993) | | Vice President of Dodge & Cox, Portfolio Manager | | — |
| Diana S. Strandberg (47) | | Vice President
(Since 2005) | | Vice President of Dodge & Cox, Portfolio Manager and member of IPC and IIPC | | — |
| Roberta R.W. Kameda (46) | | Assistant Secretary (Since 2007) | | Senior Counsel (since 2006) of Dodge & Cox, Senior Associate General Counsel, Franklin Templeton Investments (1997-2006) | | — |
John M. Loll (40) | | Assistant Treasurer and Assistant Secretary (Since 2000) | | Vice President and Treasurer of Dodge & Cox | | — |
| David H. Longhurst (49) | | Treasurer (since 2006 ) | | Fund Administration and Accounting Senior Manager of Dodge & Cox (since 2004); Vice President, Treasurer, Controller and Secretary of Safeco Mutual Funds, Safeco Asset Management Company, Safeco Services, Safeco Securities, and Safeco Investment Services (2000-2004) | | — |
| Thomas M. Mistele (53) | | Secretary (Since 2000) | | Chief Operating Officer (since 2004), Director (since 2005), Secretary and General Counsel of Dodge & Cox | | — |
| Marcia P. Venegas (38) | | Chief Compliance Officer
(Since 2004) | | Chief Compliance Officer of Dodge & Cox (since 2005), Compliance Officer of Dodge & Cox (2003-2004); Compliance and Business Risk Manager of Deutsche Asset Management, Australia Limited (1999-2001) | | — |
| INDEPENDENT TRUSTEES |
William F. Ausfahl (67) | | Trustee (Since 2002) | | CFO, The Clorox Co. (1982-1997); Director, The Clorox Co. (1984-1997) | | — |
L. Dale Crandall (65) | | Trustee (Since 1999) | | President, Kaiser Foundation Health Plan, Inc. and Kaiser Foundation Hospitals (2000-2002); Senior Vice President—Finance and Administration & CFO, Kaiser Foundation Health Plan, Inc. and Kaiser Foundation Hospitals (1998-2000) | | Director, Union BanCal Corporation (bank holding company) and Union Bank of California (commercial bank) (2001-Present); Director, Covad Communications Group (broadband communications services) (2002-Present); Director, Ansell Limited (medical equipment and supplies) (2002-Present); Director, BEA Systems, Inc. (software and programming) (2003-Present); Director, Coventry Health Care, Inc. (managed healthcare) (2004-Present) |
Thomas A. Larsen (57) | | Trustee (Since 2002) | | Director in Howard, Rice, Nemerovski, Canady, Falk & Rabkin (law firm) | | — |
John B. Taylor (60) | | Trustee (Since 2005) | | Professor of Economics, Stanford University; Senior Fellow, Hoover Institution; Under Secretary for International Affairs, United States Treasury (2001-2005) | | — |
Will C. Wood (67) | | Trustee (Since 1992) | | Principal, Kentwood Associates, Financial Advisers | | Director, Banco Latinoamericano de Exportaciones S.A. (Latin American Foreign Trade Bank) (1999-Present) |
| * | | The address for each Officer and Trustee is 555 California Street, 40th Floor, San Francisco, California 94104. Each Officer and Trustee oversees all four series in the Dodge & Cox Funds complex and serves for an indefinite term. |
Additional information about the Trust’s Trustees and Officers is available in the Trust’s Statement of Additional Information (SAI). You can get a free copy of the SAI by visiting the Fund’s website at www.dodgeandcox.com or calling
1-800-621-3979.
PAGE 15 § DODGE & COX BALANCED FUND
| | | | |
 | | | |  |
www.dodgeandcox.com
For Fund literature, transactions and account
information, please visit the Funds’ web site.
or write or call:
DODGE & COX FUNDS
c/o Boston Financial Data Services
P.O. Box 8422
Boston, Massachusetts 02266-8422
(800) 621-3979
INVESTMENT MANAGER
Dodge & Cox
555 California Street, 40th Floor
San Francisco, California 94104
(415) 981-1710
This report is submitted for the general information of the shareholders of the Fund. The report is not authorized for distribution to prospective investors in the Fund unless it is accompanied by a current prospectus.
This report reflects our views, opinions and portfolio holdings as of June 30, 2007, the end of the reporting period. Any such views are subject to change at any time based upon market or other conditions and Dodge & Cox disclaims any responsibility to update such views. These views may not be relied on as investment advice and, because investment decisions for a Dodge & Cox Fund are based on numerous factors, may not be relied on as an indication of trading intent on behalf of any Dodge & Cox Fund.
06/07 IF SAR  Printed on recycled paper
Semi-Annual Report
June 30, 2007
Income Fund
ESTABLISHED 1989
TO OUR SHAREHOLDERS
The Dodge & Cox Income Fund had a total return of 1.2% for the first half of 2007, compared to 1.0% for the Lehman Brothers Aggregate Bond Index (LBAG). Longer-term results can be found on page 3. As of June 30, the Fund had net assets of $14.3 billion with a cash position of 3.0%.
MARKET COMMENTARY
During the first half of 2007, intermediate and long-term U.S. Treasury yields rose by 5-30 basis points1 amid strong global economic growth, a stronger-than-expected rebound in U.S. economic activity and concerns over the potential for rising inflation. Bond price declines associated with these rate increases offset a large portion of the income earned over the period, resulting in the modest returns described above.
U.S. consumer spending rose by 3.7%, aided by solid durable goods orders and vehicle sales. In addition, the labor market remained firm: the unemployment rate was 4.5%, and 2 million new jobs were created over the past year. However, the housing market was undeniably weak, with home sales (both new and existing) and housing starts down significantly.
The Federal Open Market Committee met four times during the period without adjusting the 5.25% target Federal Funds rate. Inflation has risen of late, most recently 2.7% year-over-year. Inflationary pressures remain, including volatile energy prices ($70 per barrel oil prices, the highest in nearly a year), accelerating unit labor costs and the weak U.S. dollar.
The Lehman Corporate Index returned 0.7% and performed in line with comparable-duration2 Treasuries. Despite solid earnings reports and good equity market performance, yield premiums increased from narrow levels due to growing concerns over high levels of share buybacks and leveraged buyout (LBO) activity, as well as deepening problems in the subprime mortgage lending industry. Interest rate volatility rose, negatively affecting Mortgage-backed Securities (MBS). The Lehman MBS Index returned 1.1%, underperforming comparable-duration Treasuries by 0.6%.
SIX-MONTH PERFORMANCE REVIEW
Despite its modest 1.2% return, the Fund outperformed the LBAG, influenced by the following factors:
| n | | A shorter effective duration (3.6 years versus 4.5 years for the LBAG at the beginning of the year) added modestly to relative returns as intermediate and long-term Treasury yields rose. |
| n | | Strong relative performance from Corporate bond holdings helped returns. HCA, Liberty Media, Unum Group and Kaupthing Bank holdings performed well, offset somewhat by poor performance from Dow Chemical and Macy’s, both of which have been persistently rumored to be LBO targets. |
| n | | The Fund’s overweighting of the MBS sector (43% vs. 35% for the LBAG at the beginning of the year) detracted from relative returns due to the underperformance of this sector. |
INVESTMENT STRATEGY
The Fund remains positioned with higher weightings in Corporates and MBS than the LBAG. We use our fundamental research capabilities in our effort to locate attractive opportunities in these higher yielding sectors.
While our investment horizon is long and the Fund’s portfolio turnover relatively low, we actively monitor existing and prospective holdings and, when new opportunities present themselves, we make changes to the portfolio. Importantly, all investment decisions are the result of our disciplined investment process in which we conduct independent research to locate securities that, in our view, offer favorable performance potential over our extended (three-to-five year) investment horizon.
For example, we made a number of incremental adjustments to the Fund’s holdings throughout the first half of 2007. Within the Corporate sector, we added three new issuers to the Fund, sold or tendered bonds of three other Fund holdings and adjusted several other issuer weightings. The result of these changes was a 32% Corporate weighting, which is 1% higher than at the beginning of the year. This represents a significant sector overweighting when compared to the LBAG’s 19% weighting. Within the MBS sector, we added to holdings of seasoned 30-year and 15-year Federal Agency MBS, maintaining this weighting at a substantial 45% of the portfolio.
Concerned about a potential rise in long-term rates, we have focused a relatively high proportion of the Fund’s holdings in short and intermediate securities. For example, we find Government Sponsored Enterprise-
PAGE 1 § DODGE & COX INCOME FUND
guaranteed MBS (primarily Fannie Mae and Freddie Mac) to be among the most attractive securities from a risk/reward perspective in this maturity range. Therefore, we have maintained a significantly above-benchmark weighting in them for more than a year. In addition, we purchased short-duration asset-backed securities collateralized by student loans, which serve as a high-quality, higher-yielding substitute for short-maturity Treasuries. Finally, we recently added short, floating rate corporate notes to the portfolio based on our expectations that interest rates will continue to rise.
One sector we have not turned to for value is the subprime mortgage sector. The fallout from lax underwriting practices in the subprime mortgage industry continues at an alarming rate, and prices of subprime MBS and Collateralized Debt Obligations (CDOs), whose cash flows are supported by subprime MBS, have declined significantly. Importantly, the Fund has no direct exposure to these securities, though we keep a watchful eye on the sector to gauge whether there may eventually be a prudent investment opportunity given the dramatic change in pricing that has occurred.
The Fund’s overall duration remains substantially lower than the LBAG’s (3.9 years versus 4.7 years for the Index). Real (after-inflation) yields have remained stubbornly low over the past several years, particularly among longer-maturity securities. In our view, the low yields of longer-maturity securities do not offer an attractive level of compensation for the risks assumed, and the Fund has significantly less exposure to them than the LBAG.
PERSPECTIVE ON OUR APPROACH TO LBO RISK
The last two months of the reporting period were volatile, marked by a significant increase in intermediate and long-term U.S. Treasury rates and widening corporate yield premiums. A significant factor in the latter was the dramatic increase in LBO activity and the sizable amount of money in new private equity funds. Companies that are acquired via LBO often see their existing debt fall in value as the new debt required to finance the purchase diminishes the company’s overall creditworthiness. The Fund has not been immune to this as our recent experience with the debt of HCA attests (HCA was acquired via LBO in late 2006). With this in mind, we thought it might be illuminating to review our approach to managing this difficult issue.
Through our fundamental research process, we have taken steps to identify corporate issuers most susceptible to this type of risk. To that end, we have created “LBO screens” for current and prospective holdings in order to monitor on a real-time basis how attractive an LBO may be to private acquirers. We believe our long history (70+ years) as an equity investor is a tangible benefit in this regard as we incorporate the views and research of our industry analysts, who analyze corporate issuers from both an equity and fixed income perspective. We have also intensified our dialogue with company management in order to deepen our understanding of management’s capitalization philosophy, including target leverage levels and the importance of that leverage to stated strategic goals.
Through this work we seek to understand the feasibility, management’s inclination toward, and the attractiveness (given the current stock price) of a leveraged transaction. We then work to ensure that the Fund’s Corporate holdings reflect these analyses.
As a result, we have reduced or sold Fund holdings in certain issuers with above-average LBO risk whose valuations, in our view, do not fully reflect that risk. Further, we are focusing our current Corporate investments in issuers and bonds that we believe may have a lower LBO risk profile (with the understanding that no corporate bond is totally immune to this risk).
IN CLOSING
Our rigorous fundamental research efforts are targeted to understanding both the potential reward and potential risk of each of the Fund’s investments. We believe this approach is particularly appropriate in the current environment. As always, we welcome your questions or comments.
For the Board of Trustees,
| | |

| | 
|
John A. Gunn, Chairman | | Dana M. Emery, Vice President |
August 1, 2007
1 | | One basis point is equal to 1/100th of 1%. |
2 | | Duration is a measure of price sensitivity to changes in interest rates. |
DODGE & COX INCOME FUND §PAGE 2
| | |
GROWTH OF $10,000 OVER 10 YEARS FOR AN INVESTMENT MADE ON JUNE 30, 1997 | | |

| | Past performance does not guarantee future results. Investment return and share price will fluctuate with market conditions, and investors may have a gain or loss when shares are sold. Mutual fund performance changes over time and currently may be significantly lower than stated above. Performance is updated and published monthly. Visit the Fund’s web site at www.dodgeandcox.com or call 1-800-621-3979 for current performance figures. The Fund’s total returns include the reinvestment of dividend and capital gain distributions, but have not been adjusted for any income taxes payable by shareholders on these distributions. The Lehman Brothers Aggregate Bond Index is an unmanaged index of investment-grade fixed income securities. Index returns include dividends and/or interest income and, unlike Fund returns, do not reflect fees or expenses. Lehman Brothers® is a trademark of Lehman Brothers, Inc. |
AVERAGE ANNUAL TOTAL RETURN
FOR PERIODS ENDED JUNE 30, 2007
| | | | | | | | | |
| | | 1 Year | | | 5 Years | | | 10 Years | |
Dodge & Cox Income Fund | | 6.47 | % | | 4.89 | % | | 6.35 | % |
Lehman Brothers
Aggregate Bond Index (LBAG) | | 6.11 | | | 4.48 | | | 6.02 | |
FUND EXPENSE EXAMPLE
As a Fund shareholder, you incur ongoing Fund costs, including management fees and other Fund expenses. All mutual funds have ongoing costs, sometimes referred to as operating expenses. The following example shows ongoing costs of investing in the Fund and can help you understand these costs and compare them with those of other mutual funds. The example assumes a $1,000 investment held for the six months indicated.
ACTUAL EXPENSES
The first line of the table below provides information about actual account values and expenses based on the Fund’s actual returns. You may use the information in this line, together with your account balance, to estimate the expenses that you paid over the period. Simply divide your account value by $1,000 (for example, an $8,600 account value divided by $1,000 = 8.6), then multiply the result by the number in the first line under the heading “Expenses Paid During Period” to estimate the expenses you paid on your account during this period.
HYPOTHETICAL EXAMPLE FOR COMPARISON WITH OTHER MUTUAL FUNDS
Information on the second line of the table can help you compare ongoing costs of investing in the Fund with those of other mutual funds. This information may not be used to estimate the actual ending account balance or expenses you paid during the period. The hypothetical “Ending Account Value” is based on the actual expense ratio of the Fund and an assumed 5% annual rate of return before expenses (not the Fund’s actual return). The amount under the heading “Expense Paid During the Period” shows the hypothetical expenses your account would have incurred under this scenario. You can compare this figure with the 5% hypothetical examples that appear in shareholder reports of other mutual funds.
| | | | | | | | | |
Six Months Ended June 30, 2007 | | Beginning Account
Value 1/1/2007 | | Ending Account
Value 6/30/2007 | | Expenses Paid
During Period* |
Based on Actual Fund Return | | $ | 1,000.00 | | $ | 1,011.90 | | $ | 2.22 |
Based on Hypothetical 5% Yearly Return | | | 1,000.00 | | | 1,022.59 | | | 2.23 |
| * | | Expenses are equal to the Fund’s annualized six-month expense ratio of 0.44%, multiplied by the average account value over the period, multiplied by 181/365 (to reflect the one-half year period). |
The expenses shown in the table highlight ongoing costs only and do not reflect any transactional fees or account maintenance fees. While other mutual funds may charge such fees, please note that the Fund does not charge transaction fees (e.g., redemption fees, sales loads) or universal account maintenance fees (e.g., small account fees).
PAGE 3 § DODGE & COX INCOME FUND
| | |
| FUND INFORMATION | | June 30, 2007 |
GENERAL INFORMATION
| | |
Net Asset Value Per Share | | $12.41 |
Total Net Assets (billions) | | $14.3 |
30-Day SEC Yield(a) | | 5.39% |
Expense Ratio (1/1/07 to 6/30/07, annualized) | | 0.44% |
Portfolio Turnover Rate (1/1/07 to 6/30/07, unannualized) | | 13% |
Fund Inception | | 1989 |
No sales charges or distribution fees | | |
Investment Manager: Dodge & Cox, San Francisco. Managed by the Fixed Income Investment Policy Committee, whose nine members’ average tenure at Dodge & Cox is 17 years, and by the Investment Policy Committee, whose 12 members’ (for fixed income decisions) average tenure is 20 years.
| | | | |
| PORTFOLIO CHARACTERISTICS | | Fund | | LBAG |
Number of Fixed Income Securities | | 440 | | 8,899 |
Effective Maturity (years) | | 6.2 | | 7.3 |
Effective Duration (years) | | 3.9 | | 4.7 |
| | | |
| FIVE LARGEST CORPORATE ISSUERS(c) | | Fund | |
Ford Motor Credit Co. | | 2.6 | % |
GMAC, LLC | | 2.2 | |
Time Warner, Inc. (AOL Time Warner) | | 2.1 | |
HCA, Inc. | | 1.9 | |
Xerox Corp. | | 1.7 | |
| | | | | | |
| CREDIT QUALITY(d) | | Fund | | | LBAG | |
U.S. Government & Government Related | | 63.2 | % | | 71.6 | % |
Aaa | | 2.4 | | | 8.2 | |
Aa | | 5.0 | | | 5.1 | |
A | | 5.3 | | | 7.8 | |
Baa | | 11.8 | | | 7.3 | |
Ba | | 4.2 | | | 0.0 | |
B | | 3.2 | | | 0.0 | |
Caa | | 1.9 | | | 0.0 | |
Cash Equivalents | | 3.0 | | | 0.0 | |
Average Quality | | Aa2 | | | Aa1 | |
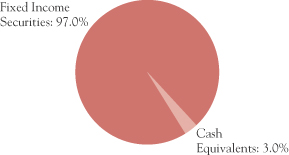
| | | | | | |
| | |
| SECTOR DIVERSIFICATION | | Fund | | | LBAG | |
U.S. Treasury & Government Related | | 18.6 | % | | 33.8 | % |
Mortgage-Related Securities | | 44.7 | | | 37.9 | |
Asset-Backed Securities/CMBS(b) | | 2.1 | | | 6.3 | |
Corporate | | 31.6 | | | 18.6 | |
Non-Corporate Yankee | | 0.0 | | | 3.4 | |
Cash Equivalents | | 3.0 | | | 0.0 | |
| | | | | | |
| | |
| MATURITY DIVERSIFICATION | | Fund | | | LBAG | |
0-1 Years to Maturity | | 9.2 | % | | 0.0 | % |
1-5 | | 49.3 | | | 41.5 | |
5-10 | | 30.7 | | | 47.2 | |
10-15 | | 1.4 | | | 3.1 | |
15-20 | | 1.2 | | | 2.2 | |
20-25 | | 6.4 | | | 2.9 | |
25 and Over | | 1.8 | | | 3.1 | |
(a) | SEC yield is an annualization of the Fund’s total net investment income per share for the 30-day period ended on the last day of the month. |
(b) | CMBS refers to commercial mortgage-backed securities, which are a component of the LBAG but not currently held by the Fund. |
(c) | | The Fund’s portfolio holdings are subject to change without notice. The mention of specific securities is not a recommendation or solicitation for any person to buy, sell or hold any particular security. |
(d) | The Fund’s credit quality ratings are from Moody’s Investor Services. If no Moody’s rating is available, the Standard & Poor’s rating is reported. If unrated, the investment manager determines a comparable rating. The LBAG’s credit quality ratings are from Lehman Brothers and reference Moody’s, Standard & Poor’s and Fitch ratings. The LBAG’s methodology for calculating average credit quality differs from that used by the Fund. Applying the LBAG methodology, the Fund’s average credit quality would be Aa2. The credit quality of the investments in the portfolio does not apply to the stability or safety of the Fund or its shares. |
DODGE & COX INCOME FUND §PAGE 4
| | |
| PORTFOLIO OF INVESTMENTS (unaudited) | | June 30, 2007 |
| | | | | | |
| FIXED INCOME SECURITIES: 97.0% |
| | |
| | | PAR VALUE | | VALUE |
| U.S. TREASURY AND GOVERNMENT RELATED: 18.6% |
U.S. TREASURY: 15.5% | | | | | | |
U.S. Treasury Notes | | | | | | |
3.00%, 11/15/07 | | $ | 476,500,000 | | $ | 473,149,728 |
3.00%, 2/15/08 | | | 150,000,000 | | | 148,136,700 |
4.875%, 4/30/08 | | | 175,000,000 | | | 174,767,600 |
3.25%, 8/15/08 | | | 200,000,000 | | | 196,250,000 |
3.125%, 10/15/08 | | | 325,000,000 | | | 317,611,450 |
3.25%, 1/15/09 | | | 400,000,000 | | | 390,156,400 |
3.625%, 7/15/09 | | | 485,000,000 | | | 473,102,465 |
3.375%, 9/15/09 | | | 50,000,000 | | | 48,437,500 |
| | | | | | |
| | | | | | 2,221,611,843 |
GOVERNMENT RELATED: 3.1% | | | | | | |
Small Business Administration—504 Program |
Series 91-20K, 8.25%, 11/1/11 | | | 313,153 | | | 319,871 |
Series 92-20B, 8.10%, 2/1/12 | | | 282,308 | | | 287,540 |
Series 92-20C, 8.20%, 3/1/12 | | | 690,876 | | | 704,826 |
Series 92-20D, 8.20%, 4/1/12 | | | 459,859 | | | 469,729 |
Series 92-20G, 7.60%, 7/1/12 | | | 928,131 | | | 943,737 |
Series 92-20H, 7.40%, 8/1/12 | | | 639,795 | | | 650,412 |
Series 92-20I, 7.05%, 9/1/12 | | | 865,460 | | | 878,523 |
Series 92-20J, 7.00%, 10/1/12 | | | 1,146,356 | | | 1,164,021 |
Series 92-20K, 7.55%, 11/1/12 | | | 1,150,143 | | | 1,173,375 |
Series 92-20L, 7.45%, 12/1/12 | | | 521,484 | | | 532,087 |
Series 93-20B, 7.00%, 2/1/13 | | | 916,619 | | | 930,775 |
Series 93-20C, 6.50%, 3/1/13 | | | 2,758,358 | | | 2,791,373 |
Series 93-20D, 6.75%, 4/1/13 | | | 942,006 | | | 955,770 |
Series 93-20E, 6.55%, 5/1/13 | | | 3,488,989 | | | 3,535,496 |
Series 93-20F, 6.65%, 6/1/13 | | | 1,059,856 | | | 1,075,500 |
Series 93-20L, 6.30%, 12/1/13 | | | 1,768,867 | | | 1,790,080 |
Series 94-20A, 6.50%, 1/1/14 | | | 2,230,775 | | | 2,259,831 |
Series 94-20D, 7.70%, 4/1/14 | | | 570,609 | | | 587,323 |
Series 94-20E, 7.75%, 5/1/14 | | | 2,125,799 | | | 2,183,346 |
Series 94-20F, 7.60%, 6/1/14 | | | 1,244,663 | | | 1,277,656 |
Series 94-20G, 8.00%, 7/1/14 | | | 952,101 | | | 978,437 |
Series 94-20H, 7.95%, 8/1/14 | | | 865,269 | | | 889,646 |
Series 94-20I, 7.85%, 9/1/14 | | | 1,141,292 | | | 1,173,468 |
Series 94-20K, 8.65%, 11/1/14 | | | 802,860 | | | 832,902 |
Series 94-20L, 8.40%, 12/1/14 | | | 684,910 | | | 709,734 |
Series 95-20A, 8.50%, 1/1/15 | | | 276,899 | | | 286,411 |
Series 95-20C, 8.10%, 3/1/15 | | | 664,721 | | | 686,510 |
Series 97-20E, 7.30%, 5/1/17 | | | 1,590,562 | | | 1,638,953 |
Series 97-20J, 6.55%, 10/1/17 | | | 2,187,379 | | | 2,230,298 |
Series 98-20C, 6.35%, 3/1/18 | | | 8,797,492 | | | 8,944,728 |
Series 98-20H, 6.15%, 8/1/18 | | | 2,900,453 | | | 2,940,138 |
Series 98-20L, 5.80%, 12/1/18 | | | 1,615,160 | | | 1,626,564 |
Series 99-20C, 6.30%, 3/1/19 | | | 2,060,921 | | | 2,089,171 |
Series 99-20G, 7.00%, 7/1/19 | | | 4,855,490 | | | 5,006,170 |
Series 99-20I, 7.30%, 9/1/19 | | | 1,534,616 | | | 1,591,806 |
Series 01-20G, 6.625%, 7/1/21 | | | 11,849,257 | | | 12,176,773 |
Series 01-20L, 5.78%, 12/1/21 | | | 26,345,424 | | | 26,527,895 |
Series 02-20L, 5.10%, 12/1/22 | | | 6,423,963 | | | 6,211,312 |
| | | | | | |
| | |
| | | PAR VALUE | | VALUE |
Series 04-20L, 4.87%, 12/1/24 | | $ | 7,667,731 | | $ | 7,313,619 |
Series 05-20B, 4.625%, 2/1/25 | | | 10,390,397 | | | 9,745,647 |
Series 05-20C, 4.95%, 3/1/25 | | | 7,130,196 | | | 6,769,898 |
Series 05-20E, 4.84%, 5/1/25 | | | 20,042,148 | | | 19,027,613 |
Series 05-20G, 4.75%, 7/1/25 | | | 18,752,194 | | | 17,776,791 |
Series 05-20I, 4.76%, 9/1/25 | | | 21,167,275 | | | 19,953,196 |
Series 06-20A, 5.21%, 1/1/26 | | | 21,244,809 | | | 20,637,556 |
Series 06-20B, 5.35%, 2/1/26 | | | 6,187,356 | | | 6,085,995 |
Series 06-20C, 5.57%, 3/1/26 | | | 31,860,476 | | | 31,682,430 |
Series 06-20G, 6.07%, 7/1/26 | | | 54,470,996 | | | 55,430,078 |
Series 06-20J, 5.37%, 10/1/26 | | | 18,154,082 | | | 17,747,452 |
Series 06-20L, 5.12%, 12/1/26 | | | 14,094,747 | | | 13,512,955 |
Series 07-20A, 5.32%, 1/1/27 | | | 28,455,000 | | | 27,685,070 |
Series 07-20C, 5.23%, 3/1/27 | | | 43,205,000 | | | 41,938,636 |
Series 07-20D, 5.32%, 4/1/27 | | | 43,610,000 | | | 42,709,279 |
| | | | | | |
| | | | | | 439,068,402 |
| | | | | | |
| | | | | | 2,660,680,245 |
| MORTGAGE-RELATED SECURITIES: 44.7% |
FEDERAL AGENCY CMO & REMIC: 2.3% |
Dept. of Veterans Affairs | | | | | | |
Trust 1995-2D 4A, 9.293%, 5/15/25 | | | 444,832 | | | 482,922 |
Trust 1997-2Z, 7.50%, 6/15/27 | | | 32,929,915 | | | 34,174,916 |
Trust 1998-1 1A, 8.182%, 10/15/27 | | | 1,181,029 | | | 1,235,155 |
Fannie Mae | | | | | | |
Trust 1994-72 J, 6.00%, 6/25/23 | | | 6,682,255 | | | 6,690,278 |
Trust 1998-58 PX, 6.50%, 9/25/28 | | | 3,000,217 | | | 3,056,425 |
Trust 1998-58 PC, 6.50%, 10/25/28 | | | 17,298,006 | | | 17,623,083 |
Trust 2002-33 A1, 7.00%, 6/25/32 | | | 5,866,484 | | | 6,006,042 |
Trust 2001-T4 A1, 7.50%, 7/25/41 | | | 5,068,002 | | | 5,220,659 |
Trust 2001-T10 A1, 7.00%, 12/25/41 | | | 8,191,408 | | | 8,366,467 |
Trust 2001-79 BA, 7.00%, 3/25/45 | | | 2,602,273 | | | 2,641,037 |
Trust 2002-90 A1, 6.50%, 6/25/42 | | | 10,913,176 | | | 11,069,032 |
Trust 2002-W6 2A1, 7.00%, 6/25/42 | | | 9,413,398 | | | 9,638,031 |
Trust 2002-W8 A2, 7.00%, 6/25/42 | | | 4,669,208 | | | 4,759,302 |
Trust 2003-W2 1A2, 7.00%, 7/25/42 | | | 27,950,039 | | | 28,385,506 |
Trust 2003-W4 3A, 7.00%, 10/25/42 | | | 8,590,729 | | | 8,784,528 |
Trust 2003-07 A1, 6.50%, 12/25/42 | | | 11,837,806 | | | 11,985,273 |
Trust 2003-W1 1A1, 6.50%, 12/25/42 | | | 17,376,130 | | | 17,576,689 |
Trust 2003-W1 2A, 7.50%, 12/25/42 | | | 7,941,796 | | | 8,205,474 |
Trust 2004-W2 5A, 7.50%, 3/25/44 | | | 38,385,990 | | | 39,825,043 |
Trust 2004-W8 3A, 7.50%, 6/25/44 | | | 22,429,600 | | | 23,257,954 |
Trust 2005-W1 1A3, 7.00%, 10/25/44 | | | 19,867,151 | | | 20,419,988 |
Trust 2006-W1 1A1, 6.50%, 12/25/45 | | | 2,700,665 | | | 2,740,804 |
Trust 2006-W1 1A2, 7.00%, 12/25/45 | | | 17,718,442 | | | 18,247,876 |
Trust 2006-W1 1A3, 7.50%, 12/25/45 | | | 284,933 | | | 297,055 |
Trust 2006-W1 1A4, 8.00%, 12/25/45 | | | 21,490,480 | | | 22,657,783 |
Freddie Mac | | | | | | |
Series 1565 G, 6.00%, 8/15/08 | | | 1,047,951 | | | 1,046,151 |
Series 1601 PJ, 6.00%, 10/15/08 | | | 4,549,650 | | | 4,545,871 |
Series 2439 LG, 6.00%, 9/15/30 | | | 9,260,035 | | | 9,293,934 |
Series T-48 1A, 7.098%, 7/25/33 | | | 8,017,733 | | | 8,213,316 |
Ginnie Mae | | | | | | |
7.25%, 7/16/28 | | | 2,872,566 | | | 2,913,256 |
| | | | | | |
| | | | | | 339,359,850 |
| | |
| PAGE 5 § DODGE & COX INCOME FUND | | See accompanying Notes to Financial Statements |
| | |
| PORTFOLIO OF INVESTMENTS (unaudited) | | June 30, 2007 |
| | | | | | |
| FIXED INCOME SECURITIES (continued) |
| | |
| | | PAR VALUE | | VALUE |
FEDERAL AGENCY MORTGAGE PASS-THROUGH: 42.3% |
Fannie Mae, 10 Year | | | | | | |
6.00%, 11/1/16 | | $ | 22,136,862 | | $ | 22,262,152 |
Fannie Mae, 15 Year | | | | | | |
5.50%, 9/1/14-1/1/22 | | | 473,521,875 | | | 468,218,538 |
6.00%, 4/1/13-4/1/22 | | | 1,008,913,521 | | | 1,014,881,814 |
6.50%, 11/1/12-11/1/18 | | | 188,749,417 | | | 192,883,804 |
7.00%, 7/1/08-12/1/11 | | | 1,437,392 | | | 1,463,108 |
7.50%, 11/1/14-8/1/17 | | | 18,904,015 | | | 19,539,839 |
Fannie Mae, 20 Year | | | | | | |
6.50%, 4/1/19-10/1/24 | | | 64,207,974 | | | 65,644,432 |
Fannie Mae, 30 Year | | | | | | |
4.50%, 8/1/33-11/1/33 | | | 125,343,194 | | | 114,335,879 |
5.00%, 11/1/33-3/1/34 | | | 310,891,291 | | | 292,848,715 |
5.50%, 10/1/33-8/1/35 | | | 425,712,588 | | | 412,039,755 |
6.00%, 11/1/28-11/1/35 | | | 1,113,089,405 | | | 1,107,571,511 |
6.50%, 12/1/32-4/1/36 | | | 195,730,811 | | | 199,441,787 |
7.00%, 4/1/32 | | | 3,804,608 | | | 3,945,576 |
7.50%, 9/1/07 | | | 19 | | | 19 |
8.00%, 1/1/12-8/1/22 | | | 164,266 | | | 168,512 |
Fannie Mae, Hybrid ARM | | | | | | |
4.117%, 12/1/36 | | | 35,790,136 | | | 35,162,444 |
4.226%, 9/1/34 | | | 19,646,668 | | | 19,402,751 |
4.493%, 1/1/35 | | | 15,212,370 | | | 14,872,004 |
4.495%, 1/1/35 | | | 61,551,612 | | | 60,613,295 |
4.50%, 6/1/35-7/1/35 | | | 27,539,338 | | | 27,202,801 |
4.612%, 10/1/34 | | | 22,760,836 | | | 22,404,459 |
4.653%, 8/1/35 | | | 20,644,082 | | | 20,370,629 |
4.686%, 1/1/36 | | | 42,507,957 | | | 41,989,865 |
4.705%, 8/1/34 | | | 5,519,681 | | | 5,479,701 |
4.738%, 7/1/35 | | | 17,044,929 | | | 16,768,660 |
4.764%, 10/1/35 | | | 31,469,910 | | | 31,134,974 |
4.771%, 1/1/36 | | | 34,636,559 | | | 34,299,101 |
4.773%, 11/1/36 | | | 25,659,978 | | | 25,291,736 |
4.774%, 7/1/35 | | | 18,148,328 | | | 17,863,950 |
4.806%, 8/1/35 | | | 53,886,517 | | | 53,340,096 |
4.876%, 12/1/35 | | | 20,813,024 | | | 20,612,059 |
4.882%, 10/1/35 | | | 17,240,086 | | | 17,094,505 |
4.999%, 4/1/35 | | | 28,217,145 | | | 27,996,277 |
5.002%, 9/1/35 | | | 23,822,671 | | | 23,598,388 |
5.038%, 7/1/35 | | | 128,634,700 | | | 128,122,823 |
5.255%, 1/1/37 | | | 30,827,007 | | | 30,493,244 |
Fannie Mae, Multifamily DUS | | | | | | |
Pool 760744, 4.75%, 3/1/15 | | | 13,590,000 | | | 12,775,182 |
Pool 555162, 4.834%, 1/1/13 | | | 17,100,415 | | | 16,565,594 |
Pool 555191, 4.866%, 2/1/13 | | | 15,819,479 | | | 15,333,211 |
Pool 888015, 5.549%, 11/1/16 | | | 47,933,682 | | | 47,426,262 |
Pool 555172, 5.656%, 12/1/12 | | | 2,895,556 | | | 2,915,820 |
Pool 545987, 5.88%, 9/1/12 | | | 25,180,691 | | | 25,587,141 |
Pool 545685, 6.016%, 4/1/12 | | | 28,814,898 | | | 29,302,897 |
Pool 545708, 6.055%, 5/1/12 | | | 2,529,720 | | | 2,581,372 |
Pool 545547, 6.087%, 3/1/12 | | | 13,120,567 | | | 13,402,414 |
Pool 545209, 6.135%, 10/1/11 | | | 25,004,801 | | | 25,540,219 |
| | | | | | |
| | |
| | | PAR VALUE | | VALUE |
Pool 545059, 6.224%, 5/1/11 | | $ | 22,568,631 | | $ | 23,073,947 |
Pool 545179, 6.249%, 9/1/11 | | | 18,172,754 | | | 18,631,303 |
Pool 323822, 6.374%, 7/1/09 | | | 3,376,694 | | | 3,418,723 |
Freddie Mac, 30 Year | | | | | | |
7.50%, 10/1/08 | | | 876 | | | 876 |
8.00%, 1/1/08-5/1/09 | | | 1,705 | | | 1,713 |
Freddie Mac Gold, 10 Year | | | | | | |
6.00%, 9/1/16 | | | 11,351,811 | | | 11,415,480 |
Freddie Mac Gold, 15 Year | | | | | | |
5.50%, 11/1/13-10/1/20 | | | 161,092,839 | | | 159,241,058 |
6.00%, 4/1/13-2/1/19 | | | 130,740,990 | | | 131,532,944 |
6.50%, 2/1/11-9/1/18 | | | 71,216,140 | | | 72,766,854 |
7.00%, 11/1/08-3/1/12 | | | 1,415,789 | | | 1,445,895 |
Freddie Mac Gold, 20 Year | | | | | | |
5.50%, 11/1/23 | | | 74,003,656 | | | 72,371,735 |
6.00%, 7/1/25 | | | 18,211,342 | | | 18,284,950 |
6.50%, 7/1/21-10/1/26 | | | 49,051,874 | | | 49,832,757 |
Freddie Mac Gold, 30 Year | | | | | | |
4.50%, 7/1/33 | | | 26,699,875 | | | 24,355,642 |
6.00%, 2/1/33-3/1/35 | | | 115,396,191 | | | 114,935,015 |
6.50%, 5/1/17-12/1/32 | | | 44,010,294 | | | 44,914,258 |
7.00%, 4/1/31 | | | 22,761,997 | | | 23,527,473 |
7.90%, 2/17/21 | | | 2,647,742 | | | 2,766,742 |
Freddie Mac Gold, Hybrid ARM | | | | | | |
4.147%, 1/1/35 | | | 16,868,497 | | | 16,587,089 |
4.159%, 3/1/35 | | | 11,858,282 | | | 11,560,888 |
4.319%, 8/1/34 | | | 13,646,456 | | | 13,440,022 |
4.41%, 9/1/35 | | | 33,137,793 | | | 32,192,704 |
4.497%, 4/1/35 | | | 9,111,531 | | | 8,997,167 |
4.584%, 4/1/36 | | | 38,948,608 | | | 38,253,209 |
4.68%, 8/1/35 | | | 17,115,615 | | | 16,830,014 |
4.727%, 8/1/35 | | | 19,648,656 | | | 19,407,803 |
4.829%, 2/1/35 | | | 12,553,685 | | | 12,332,173 |
4.867%, 10/1/35 | | | 23,868,110 | | | 23,690,028 |
4.872%, 1/1/36 | | | 23,754,958 | | | 23,245,005 |
5.135%, 1/1/36 | | | 71,583,744 | | | 70,956,541 |
5.325%, 1/1/37 | | | 39,314,187 | | | 38,863,895 |
5.489%, 3/1/37 | | | 48,730,817 | | | 48,425,096 |
5.563%, 4/1/37 | | | 70,098,175 | | | 69,653,232 |
5.873%, 8/1/36 | | | 29,935,319 | | | 30,017,075 |
5.962%, 1/1/36 | | | 24,156,900 | | | 24,275,186 |
Ginnie Mae, 15 Year | | | | | | |
7.00%, 4/15/09 | | | 312,579 | | | 315,165 |
Ginnie Mae, 30 Year | | | | | | |
7.00%, 5/15/28 | | | 2,107,934 | | | 2,196,707 |
7.50%, 9/15/17-5/15/25 | | | 7,079,058 | | | 7,391,451 |
7.80%, 6/15/20-1/15/21 | | | 1,897,829 | | | 1,983,787 |
| | | | | | |
| | | | | | 6,063,920,917 |
PRIVATE LABEL CMO & REMIC SECURITIES: 0.1% |
GSMPS Mortgage Loan Trust
8.50%, 6/25/34(b) | | | 13,551,570 | | | 14,339,575 |
| | | | | | |
| | | | | | 6,417,620,342 |
| | |
| See accompanying Notes to Financial Statements | | DODGE & COX INCOME FUND §PAGE 6 |
| | |
| PORTFOLIO OF INVESTMENTS (unaudited) | | June 30, 2007 |
| | | | | | |
| FIXED INCOME SECURITIES (continued) |
| | |
| | | PAR VALUE | | VALUE |
| ASSET-BACKED SECURITIES: 2.1% |
STUDENT LOAN: 2.1% | | | | | | |
SLM Student Loan Trust | | | | | | |
Series 2007-2 A2, 5.355%, 7/25/17 | | $ | 162,000,000 | | $ | 161,993,828 |
Series 2006-7 A2, 5.345%, 10/25/16 | | | 45,107,000 | | | 45,124,244 |
Series 2006-8 A2, 5.355%, 10/25/16 | | | 35,000,000 | | | 34,989,920 |
Series 2007-1 A1, 5.325%, 4/25/12 | | | 29,225,339 | | | 29,238,874 |
Series 2005-10 A2, 5.365%, 4/27/15 | | | 14,711,043 | | | 14,710,307 |
Series 2007-3 A2, 5.365%, 10/25/17 | | | 10,000,000 | | | 9,999,617 |
Series 2006-5 A1, 5.346%, 7/25/13 | | | 4,470,228 | | | 4,470,106 |
| | | | | | |
| | | | | | 300,526,896 |
| CORPORATE: 31.6% | | | | | | |
FINANCIALS: 8.5% | | | | | | |
Bank of America
5.30%, 3/15/17 | | | 90,000,000 | | | 85,939,650 |
BankAmerica Capital II(a)
8.00%, 12/15/26 (callable) | | | 14,550,000 | | | 15,127,489 |
BankAmerica Capital VI(a)
5.625%, 3/8/35 | | | 21,450,000 | | | 19,152,383 |
BankAmerica Capital XI(a)
6.625%, 5/23/36 | | | 64,360,000 | | | 65,625,253 |
Boston Properties, Inc. | | | | | | |
6.25%, 1/15/13 | | | 55,977,000 | | | 57,400,831 |
5.625%, 4/15/15 | | | 34,560,000 | | | 34,078,821 |
5.00%, 6/1/15 | | | 15,309,000 | | | 14,483,891 |
CIGNA Corp. | | | | | | |
7.00%, 1/15/11 | | | 13,665,000 | | | 14,225,169 |
6.375%, 10/15/11 | | | 28,755,000 | | | 29,471,057 |
7.65%, 3/1/23 | | | 3,597,000 | | | 3,962,883 |
7.875%, 5/15/27 | | | 27,840,000 | | | 32,110,962 |
8.30%, 1/15/33 | | | 7,375,000 | | | 8,760,836 |
6.15%, 11/15/36 | | | 38,000,000 | | | 36,196,976 |
Health Net, Inc.
6.375%, 6/1/17 | | | 29,000,000 | | | 28,456,598 |
HSBC Holdings PLC
6.50%, 5/2/36 | | | 41,875,000 | | | 43,033,723 |
JPMorgan Chase (Bank One) Capital III(a)
8.75%, 9/1/30 | | | 26,355,000 | | | 33,501,185 |
JPMorgan Chase Capital XV(a)
5.875%, 3/15/35 | | | 14,625,000 | | | 13,346,600 |
JPMorgan Chase Capital XVII(a)
5.85%, 8/1/35 | | | 22,090,000 | | | 20,080,517 |
Kaupthing Bank
7.125%, 5/19/16(b) | | | 105,268,000 | | | 111,201,115 |
Safeco Corp. | | | | | | |
4.875%, 2/1/10 | | | 15,150,000 | | | 14,869,907 |
7.25%, 9/1/12 | | | 18,122,000 | | | 19,303,772 |
The Travelers Companies, Inc. | | | | | | |
8.125%, 4/15/10 (St. Paul) | | | 21,575,000 | | | 23,003,610 |
5.00%, 3/15/13 (Travelers) | | | 17,118,000 | | | 16,486,637 |
5.50%, 12/1/15 | | | 14,067,000 | | | 13,661,477 |
| | | | | | |
| | |
| | | PAR VALUE | | VALUE |
6.25%, 6/20/16 | | $ | 44,360,000 | | $ | 45,092,561 |
5.75%, 12/15/17 | | | 30,300,000 | | | 29,588,162 |
Unum Group | | | | | | |
7.625%, 3/1/11 | | | 20,894,000 | | | 22,033,245 |
6.85%, 11/15/15(b)
(Unum Finance PLC) | | | 21,150,000 | | | 21,612,593 |
7.19%, 2/1/28 (Unum) | | | 11,640,000 | | | 11,283,828 |
7.25%, 3/15/28 (Provident Companies) | | | 24,155,000 | | | 24,851,872 |
6.75%, 12/15/28 (Unum) | | | 15,415,000 | | | 15,017,802 |
7.375%, 6/15/32 | | | 29,840,000 | | | 31,210,939 |
Wachovia Corp., FRN 5.485%, 4/23/12 | | | 135,000,000 | | | 135,085,050 |
WellPoint, Inc. | | | | | | |
6.375%, 1/15/12 | | | 7,662,000 | | | 7,847,290 |
5.00%, 12/15/14 | | | 15,610,000 | | | 14,738,837 |
5.25%, 1/15/16 | | | 119,390,000 | | | 113,249,175 |
| | | | | | |
| | | | | | 1,225,092,696 |
INDUSTRIALS: 20.1% | | | | | | |
AT&T Corp.
8.00%, 11/15/31 | | | 173,430,000 | | | 206,135,429 |
Comcast Corp. | | | | | | |
5.30%, 1/15/14 | | | 75,040,000 | | | 72,333,457 |
5.85%, 11/15/15 | | | 24,960,000 | | | 24,545,814 |
5.90%, 3/15/16 | | | 33,925,000 | | | 33,323,272 |
6.50%, 1/15/17 | | | 41,870,000 | | | 42,747,428 |
5.875%, 2/15/18 | | | 34,385,000 | | | 33,302,457 |
Cox Communications, Inc. | | | | | | |
5.45%, 12/15/14 | | | 104,995,000 | | | 101,577,623 |
5.875%, 12/1/16(b) | | | 67,540,000 | | | 66,035,546 |
Dillard’s, Inc. | | | | | | |
6.625%, 11/15/08 | | | 4,985,000 | | | 4,997,463 |
9.50%, 9/1/09 | | | 550,000 | | | 579,437 |
7.13%, 8/1/18 | | | 24,015,000 | | | 22,843,116 |
7.75%, 7/15/26 | | | 21,666,000 | | | 20,761,314 |
7.75%, 5/15/27 | | | 12,803,000 | | | 12,295,207 |
7.00%, 12/1/28 | | | 28,825,000 | | | 25,903,212 |
Dow Chemical Co. | | | | | | |
4.027%, 9/30/09(b) | | | 54,087,000 | | | 51,984,422 |
6.00%, 10/1/12 | | | 9,875,000 | | | 9,977,690 |
7.375%, 11/1/29 | | | 29,739,000 | | | 32,187,947 |
Ford Motor Credit Co. | | | | | | |
7.375%, 2/1/11 | | | 170,200,000 | | | 166,277,741 |
7.25%, 10/25/11 | | | 220,905,000 | | | 212,606,041 |
General Electric Co.
5.00%, 2/1/13 | | | 34,994,000 | | | 33,928,013 |
GMAC, LLC
6.875%, 9/15/11 | | | 316,700,000 | | | 311,523,222 |
HCA, Inc. | | | | | | |
8.75%, 9/1/10 | | | 54,920,000 | | | 57,322,750 |
7.875%, 2/1/11 | | | 54,800,000 | | | 55,622,000 |
6.95%, 5/1/12 | | | 57,250,000 | | | 55,103,125 |
| | |
| PAGE 7 § DODGE & COX INCOME FUND | | See accompanying Notes to Financial Statements |
| | |
| PORTFOLIO OF INVESTMENTS (unaudited) | | June 30, 2007 |
| | | | | | |
| FIXED INCOME SECURITIES (continued) |
| | |
| | | PAR VALUE | | VALUE |
6.25%, 2/15/13 | | $ | 39,655,000 | | $ | 35,788,637 |
6.75%, 7/15/13 | | | 29,463,000 | | | 26,811,330 |
5.75%, 3/15/14 | | | 28,700,000 | | | 24,287,375 |
6.50%, 2/15/16 | | | 19,690,000 | | | 16,662,663 |
Hess Corp. (Amerada Hess)
7.875%, 10/1/29 | | | 6,685,000 | | | 7,535,158 |
Hewlett-Packard Co.
5.50%, 7/1/07 | | | 36,220,000 | | | 36,220,000 |
Lafarge SA
6.50%, 7/15/16 | | | 50,350,000 | | | 51,538,210 |
Liberty Media Corp. | | | | | | |
8.50%, 7/15/29 | | | 26,085,000 | | | 26,050,307 |
4.00%, 11/15/29 (exchangeable) | | | 25,675,000 | | | 17,266,438 |
8.25%, 2/1/30 | | | 63,310,000 | | | 61,399,051 |
3.75%, 2/15/30 (exchangeable) | | | 44,370,000 | | | 27,564,862 |
Lockheed Martin Corp. | | | | | | |
7.65%, 5/1/16 | | | 15,025,000 | | | 16,919,352 |
6.15%, 9/1/36 | | | 16,684,000 | | | 16,637,435 |
Macy’s, Inc. | | | | | | |
7.625%, 8/15/13 (May Department Stores Co.) | | | 7,155,000 | | | 7,603,812 |
7.00%, 2/15/28 (Federated Department Stores, Inc.) | | | 29,325,000 | | | 28,391,615 |
6.70%, 9/15/28 (May Department Stores Co.) | | | 20,550,000 | | | 19,164,889 |
6.90%, 4/1/29 (Federated Department Stores, Inc.) | | | 10,450,000 | | | 9,963,532 |
6.90%, 1/15/32 (May Department Stores Co.) | | | 24,815,000 | | | 23,607,477 |
6.70%, 7/15/34 (May Department Stores Co.) | | | 43,245,000 | | | 40,201,114 |
Nordstrom, Inc.
6.95%, 3/15/28 | | | 12,620,000 | | | 13,230,013 |
Raytheon Co. | | | | | | |
6.75%, 8/15/07 | | | 6,756,000 | | | 6,764,776 |
7.20%, 8/15/27 | | | 4,905,000 | | | 5,504,141 |
Time Warner, Inc. (AOL Time Warner) | | | | | | |
7.625%, 4/15/31 | | | 146,758,000 | | | 157,232,265 |
7.70%, 5/1/32 | | | 135,473,000 | | | 146,493,729 |
Wyeth | | | | | | |
5.50%, 2/1/14 | | | 110,715,000 | | | 109,119,043 |
5.50%, 2/15/16 | | | 15,000,000 | | | 14,608,245 |
5.45%, 4/1/17 | | | 47,445,000 | | | 45,841,264 |
Xerox Corp. | | | | | | |
9.75%, 1/15/09 | | | 17,375,000 | | | 18,379,744 |
7.125%, 6/15/10 | | | 77,900,000 | | | 80,791,804 |
6.875%, 8/15/11 | | | 52,625,000 | | | 54,601,437 |
6.40%, 3/15/16 | | | 25,510,000 | | | 25,667,295 |
7.20%, 4/1/16 | | | 17,996,000 | | | 18,719,979 |
6.75%, 2/1/17 | | | 40,166,000 | | | 41,201,399 |
| | | | | | |
| | | | | | 2,885,682,117 |
| | | | | | |
| | |
| | | PAR VALUE | | VALUE |
TRANSPORTATION: 3.0% | | | | | | |
Burlington Northern Santa Fe Railway | | | | | | |
4.30%, 7/1/13 | | $ | 7,883,000 | | $ | 7,284,152 |
4.875%, 1/15/15 | | | 7,835,000 | | | 7,328,405 |
7.57%, 1/2/21 | | | 22,620,068 | | | 24,599,097 |
8.251%, 1/15/21 | | | 7,166,985 | | | 8,165,131 |
5.72%, 1/15/24 | | | 31,336,774 | | | 30,703,439 |
5.629%, 4/1/24 | | | 44,364,230 | | | 43,482,169 |
5.342%, 4/1/24 | | | 10,423,041 | | | 10,031,088 |
5.996%, 4/1/24 | | | 54,625,000 | | | 54,999,220 |
CSX Transportation, Inc.
9.75%, 6/15/20 | | | 10,272,000 | | | 13,126,383 |
FedEx Corp. | | | | | | |
6.72%, 7/15/23 | | | 7,667,894 | | | 8,065,858 |
7.65%, 7/15/24 | | | 2,895,580 | | | 3,201,867 |
Norfolk Southern Corp. | | | | | | |
7.70%, 5/15/17 | | | 29,475,000 | | | 32,462,910 |
9.75%, 6/15/20 | | | 14,188,000 | | | 18,203,247 |
Union Pacific Corp. | | | | | | |
6.50%, 4/15/12 | | | 12,337,000 | | | 12,698,696 |
5.375%, 5/1/14 | | | 22,886,000 | | | 22,100,232 |
4.875%, 1/15/15 | | | 10,764,000 | | | 10,043,253 |
6.85%, 1/2/19 | | | 7,497,817 | | | 7,896,926 |
6.70%, 2/23/19 | | | 11,244,128 | | | 11,754,836 |
7.60%, 1/2/20 | | | 1,702,509 | | | 1,865,201 |
6.061%, 1/17/23 | | | 17,047,094 | | | 17,119,374 |
4.698%, 1/2/24 | | | 6,136,039 | | | 5,634,663 |
5.082%, 1/2/29 | | | 10,998,450 | | | 10,273,001 |
5.866%, 7/2/30 | | | 61,210,000 | | | 61,337,317 |
| | | | | | |
| | | | | | 422,376,465 |
| | | | | | |
| | | | | | 4,533,151,278 |
| | | | | | |
TOTAL FIXED INCOME SECURITIES
(Cost $14,041,886,358) | | $ | 13,911,978,761 |
| | | | | | |
| | |
| See accompanying Notes to Financial Statements | | DODGE & COX INCOME FUND §PAGE 8 |
| | |
| PORTFOLIO OF INVESTMENTS (unaudited) | | June 30, 2007 |
| | | | | | | | |
| SHORT-TERM INVESTMENTS: 3.8% | |
| | |
| | | PAR VALUE | | | VALUE | |
Fixed Income Clearing Corporation Repurchase Agreement(c) 5.05%, 7/2/07, maturity value $535,364,204 | | $ | 535,139,000 | | | $ | 535,139,000 | |
SSgA Prime Money Market Fund | | | 14,089,290 | | | | 14,089,290 | |
| | | | | | | | |
TOTAL SHORT-TERM INVESTMENTS
(Cost $549,228,290) | | | $ | 549,228,290 | |
| | | | | | | | |
TOTAL INVESTMENTS
(Cost $14,591,114,648) | | | 100.8 | % | | $ | 14,461,207,051 | |
OTHER ASSETS LESS LIABILITIES | | | (0.8 | %) | | | (120,497,340 | ) |
| | | | | | | | |
| TOTAL NET ASSETS | | | 100.0 | % | | $ | 14,340,709,711 | |
| | | | | | | | |
(a) | Cumulative preferred security |
(b) | Security exempt from registration under Rule 144A of the Securities Act of 1933. The security may be resold in transactions exempt from registration, normally to qualified institutional buyers. As of June 30, 2007, all such securities in total represented $265,173,251 or 1.8% of total net assets. |
(c) | Repurchase agreement is collateralized by Freddie Mac 4.125%-5.40%, 6/15/10-2/24/11; Fannie Mae 4.25, 8/15/10; and Federal Home Loan Bank 4.375%-5.59%, 6/18/10-9/17/10. Total collateral value is $545,841,791. |
When two issuers are identified, the first name refers to the acquirer/successor obligor or guarantor, and the second name (within the parentheses) refers to the original issuer of the instruments.
ARM: Adjustable Rate Mortgage
CMO: Collateralized Mortgage Obligation
DUS: Delegated Underwriting and Servicing
FRN: Floating Rate Note
REMIC: Real Estate Mortgage Investment Conduit
| | |
| PAGE 9 § DODGE & COX INCOME FUND | | See accompanying Notes to Financial Statements |
| | | | |
STATEMENT OF ASSETS AND LIABILITIES (unaudited) | |
| | | June 30, 2007 | |
ASSETS: | | | | |
Investments, at value (cost $14,591,114,648) | | $ | 14,461,207,051 | |
Receivable for paydowns on mortgage-backed securities | | | 5,698,755 | |
Receivable for Fund shares sold | | | 25,738,986 | |
Interest receivable | | | 146,807,339 | |
Prepaid expenses and other assets | | | 17,216 | |
| | | | |
| | | 14,639,469,347 | |
LIABILITIES: | | | | |
Payable for investments purchased | | | 279,100,222 | |
Payable for Fund shares redeemed | | | 13,866,485 | |
Management fees payable | | | 4,646,456 | |
Accrued expenses | | | 1,146,473 | |
| | | | |
| | | 298,759,636 | |
| | | | |
NET ASSETS | | $ | 14,340,709,711 | |
| | | | |
NET ASSETS CONSIST OF: | | | | |
Paid in capital | | $ | 14,575,800,126 | |
Undistributed net investment income | | | 2,552,047 | |
Accumulated undistributed net realized loss on investments | | | (107,734,865 | ) |
Net unrealized depreciation on investments | | | (129,907,597 | ) |
| | | | |
| | $ | 14,340,709,711 | |
| | | | |
Fund shares outstanding (par value $0.01 each, unlimited shares authorized) | | | 1,155,310,807 | |
Net asset value per share | | | $12.41 | |
|
STATEMENT OF OPERATIONS
(unaudited) | |
| | | Six Months Ended
June 30, 2007 | |
INVESTMENT INCOME: | | | | |
Interest | | | 354,390,416 | |
| |
EXPENSES: | | | | |
Management fees | | | 26,293,772 | |
Custody and fund accounting fees | | | 135,838 | |
Transfer agent fees | | | 1,362,038 | |
Professional services | | | 53,601 | |
Shareholder reports | | | 861,892 | |
Registration fees | | | 320,940 | |
Trustees’ fees | | | 84,188 | |
Miscellaneous | | | 34,909 | |
| | | | |
| | | 29,147,178 | |
| | | | |
NET INVESTMENT INCOME | | | 325,243,238 | |
| |
REALIZED AND UNREALIZED GAIN (LOSS) ON INVESTMENTS: | | | | |
Net realized gain | | | 7,538,086 | |
Net change in unrealized depreciation | | | (184,942,200 | ) |
| | | | |
Net realized and unrealized loss | | | (177,404,114 | ) |
| | | | |
NET INCREASE IN NET ASSETS FROM OPERATIONS | | $ | 147,839,124 | |
| | | | |
| | | | | | | | |
STATEMENT OF CHANGES IN NET ASSETS (unaudited) | |
| | | Six Months Ended
June 30, 2007 | | | Year Ended
December 31, 2006 | |
OPERATIONS: | | | | | | | | |
Net investment income | | $ | 325,243,238 | | | $ | 503,896,761 | |
Net realized gain (loss) | | | 7,538,086 | | | | (3,533,509 | ) |
Net change in unrealized appreciation/depreciation | | | (184,942,200 | ) | | | 66,417,029 | |
| | | | | | | | |
Net increase in net assets from operations | | | 147,839,124 | | | | 566,780,281 | |
| | |
DISTRIBUTIONS TO SHAREHOLDERS FROM: | | | | | | | | |
Net investment income | | | (338,792,862 | ) | | | (532,395,799 | ) |
Net realized gain | | | — | | | | — | |
| | | | | | | | |
Total distributions | | | (338,792,862 | ) | | | (532,395,799 | ) |
| | |
FUND SHARE TRANSACTIONS: | | | | | | | | |
Proceeds from sale of shares | | | 3,467,815,063 | | | | 4,115,697,531 | |
Reinvestment of distributions | | | 286,044,068 | | | | 453,075,083 | |
Cost of shares redeemed | | | (1,193,912,515 | ) | | | (2,241,206,234 | ) |
| | | | | | | | |
Net increase from Fund share transactions | | | 2,559,946,616 | | | | 2,327,566,380 | |
| | | | | | | | |
Total increase in net assets | | | 2,368,992,878 | | | | 2,361,950,862 | |
| | |
NET ASSETS: | | | | | | | | |
Beginning of period | | | 11,971,716,833 | | | | 9,609,765,971 | |
| | | | | | | | |
End of period (including undistributed net investment income of $2,552,047 and $6,896,143, respectively) | | $ | 14,340,709,711 | | | $ | 11,971,716,833 | |
| | | | | | | | |
| | |
SHARE INFORMATION: | | | | | | | | |
Shares sold | | | 274,494,129 | | | | 328,751,052 | |
Distributions reinvested | | | 22,918,163 | | | | 36,459,332 | |
Shares redeemed | | | (94,561,733 | ) | | | (179,356,904 | ) |
| | | | | | | | |
Net increase in shares
outstanding | | | 202,850,559 | | | | 185,853,480 | |
| | | | | | | | |
| | |
| See accompanying Notes to Financial Statements | | DODGE & COX INCOME FUND §PAGE 10 |
NOTES TO FINANCIAL STATEMENTS (unaudited)
NOTE 1—ORGANIZATION AND SIGNIFICANT ACCOUNTING POLICIES
Dodge & Cox Income Fund (the “Fund”) is one of the series constituting the Dodge & Cox Funds (the “Trust” or the “Funds”). The Trust is organized as a Delaware statutory trust and is registered under the Investment Company Act of 1940, as amended, as a diversified, open-end management investment company. The Fund commenced operations on January 3, 1989, and seeks high and stable current income consistent with long-term preservation of capital. Risk considerations and investment strategies of the Fund are discussed in the Fund’s Prospectus.
The financial statements have been prepared in conformity with accounting principles generally accepted in the United States of America, which require the use of estimates and assumptions by management. Significant accounting policies are as follows:
Security valuation The Fund’s net assets are valued as of the close of trading on the New York Stock Exchange (NYSE), generally 4:00 p.m. Eastern Time, each day that the NYSE is open for business. Fixed income securities with original maturities of one year or more are priced on the basis of valuations furnished by pricing services which utilize both dealer-supplied valuations and computerized pricing models. Under certain circumstances, fixed income securities that are not valued by pricing services are temporarily valued by the investment manager utilizing both dealer-supplied valuations and computerized pricing models. Valuations of fixed income securities take into account appropriate factors such as institutional-size trading markets in similar groups of securities, yield, quality, coupon rate, maturity, type of issue, trading characteristics and other market data and do not rely exclusively upon exchange or over-the-counter listed prices. Security values are not discounted based on the size of the Fund’s position. Securities for which market quotations are not readily available are valued at fair value as determined in good faith by or at the direction of the Board of Trustees. Short-term securities are valued at amortized cost which approximates current value. All securities held by the Fund are denominated in U.S. dollars.
Security transactions, investment income, expenses, and distributions Security transactions are recorded on the trade date. Realized gains and losses on securities sold are determined on the basis of identified cost.
Interest income is recorded on the accrual basis. Interest income includes coupon interest, amortization of premium and accretion of discount on debt securities, and gain/loss on paydowns of mortgage-backed securities. The ability of the issuers of the debt securities held by the Fund to meet their obligations may be affected by economic developments in a specific industry, state or region. Debt obligations may be placed on non-accrual status and related interest income may be reduced by ceasing current accruals and writing off interest receivables when the collection of all or a portion of interest has become doubtful. A debt obligation is removed from non-accrual status when the issuer resumes interest payments or when collectibility of interest is reasonably assured.
Expenses are recorded on the accrual basis. Most expenses of the Trust can be directly attributed to a specific series. Expenses which cannot be directly attributed are apportioned among the Funds in the Trust.
Distributions to shareholders are recorded on the ex-dividend date.
Repurchase agreements The Fund may enter into repurchase agreements secured by U.S. government and agency securities which involve the purchase of securities from a counterparty with a simultaneous commitment to resell the securities at an agreed-upon date and price. It is the Fund’s policy that its custodian take possession of the underlying collateral securities, the fair value of which exceeds the principal amount of the repurchase transaction, including accrued interest, at all times. In the event of default by the counterparty, the Fund has the contractual right to liquidate the securities and to apply the proceeds in satisfaction of the obligation.
NOTE 2—RELATED PARTY TRANSACTIONS
Management fees Under a written agreement approved by a unanimous vote of the Board of Trustees, the Fund pays an annual management fee of 0.50% of the Fund’s average daily net assets up to $100 million and 0.40% of the Fund’s average daily net assets in excess of $100
PAGE 11 § DODGE & COX INCOME FUND
NOTES TO FINANCIAL STATEMENTS (unaudited)
million to Dodge & Cox, investment manager of the Fund. The agreement further provides that Dodge & Cox shall waive its fee to the extent that such fee plus all other ordinary operating expenses of the Fund exceed 1% of the average daily net assets for the year.
Fund officers and trustees All officers and three of the trustees of the Trust are officers or employees of Dodge & Cox. The Trust pays a fee only to those trustees who are not affiliated with Dodge & Cox.
Indemnification Under the Trust’s organizational documents, its officers and trustees are indemnified against certain liabilities arising out of the performance of their duties to the Trust. In addition, in the normal course of business the Trust enters into contracts that provide general indemnities to other parties. The Trust’s maximum exposure under these arrangements is unknown as this would involve future claims that may be made against the Trust that have not yet occurred.
NOTE 3—INCOME TAX INFORMATION AND DISTRIBUTIONS TO SHAREHOLDERS
A provision for federal income taxes is not required since the Fund intends to continue to qualify as a regulated investment company under Subchapter M of the Internal Revenue Code and distribute all of its taxable income to shareholders. Distributions are determined in accordance with income tax regulations, which may differ from net investment income and realized gains for financial reporting purposes. Financial reporting records are adjusted for permanent book/tax differences to reflect tax character. Financial records are not adjusted for temporary differences.
Book/tax differences are primarily due to differing treatments of net short-term realized gain and paydown loss. At June 30, 2007, the cost of investments for federal income tax purposes was equal to the cost for financial reporting purposes.
Distributions for the six months ended June 30, 2007 and for the year ended December 31, 2006 were characterized as follows for federal income tax purposes:
| | | | |
| | | Six Months Ended
June 30, 2007 | | Year Ended
December 31, 2006 |
Ordinary income | | $338,792,862 | | $532,395,799 |
| | ($0.310 per share) | | ($0.616 per share) |
| | |
Long-term capital gain | | — | | — |
At June 30, 2007, the tax basis components of distributable earnings were as follows:
| | | | |
Unrealized appreciation | | $ | 70,771,787 | |
Unrealized depreciation | | | (200,679,384 | ) |
| | | | |
Net unrealized depreciation | | | (129,907,597 | ) |
Undistributed ordinary income | | | 2,552,047 | |
Accumulated capital loss | | | (1,667,442 | ) |
Capital loss carryforward† | | | (106,067,423 | ) |
| † | | Represents accumulated capital loss which may be carried forward to offset future capital gains. This carryforward expires as follows: |
| | | |
Expiring in 2011 | | $ | 14,093,589 |
Expiring in 2012 | | | 32,528,048 |
Expiring in 2013 | | | 19,963,019 |
Expiring in 2014 | | | 39,482,767 |
| | | |
| | $ | 106,067,423 |
| | | |
NOTE 4—PURCHASES AND SALES OF INVESTMENTS
For the six months ended June 30, 2007, purchases and sales of securities, other than short-term securities and U.S. government securities, aggregated $1,593,534,840 and $385,478,711, respectively. For the six months ended June 30, 2007, purchases and sales of U.S. government securities aggregated $3,053,303,357 and $1,712,747,521, respectively.
NOTE 5—ACCOUNTING PRONOUNCEMENTS
In July 2006, the Financial Accounting Standards Board (FASB) issued Interpretation 48, “Accounting for Uncertainty in Income Taxes” (FIN 48). FIN 48 clarifies the accounting for income taxes by prescribing the minimum recognition threshold a tax position must meet before being recognized in the financial statements. FIN 48 was effective for the Fund on June 29, 2007. Implementation of FIN 48 included a review of tax positions taken from January 1, 2003 through June 30, 2007. There was no impact to the Fund’s financial statements as a result of implementing FIN 48.
In September 2006, FASB issued “Statement of Financial Accounting Standards No. 157, Fair Value Measurements” (SFAS 157). SFAS 157 is effective for the Fund beginning January 1, 2008. It defines fair value, establishes a framework for measuring fair value and expands disclosures about fair value measurements. Management is currently evaluating the impact the adoption of SFAS 157 will have on the Fund’s financial statement disclosures.
DODGE & COX INCOME FUND §PAGE 12
FINANCIAL HIGHLIGHTS (unaudited)
| | | | | | | | | | | | | | | | | | |
SELECTED DATA AND RATIOS (for a share outstanding throughout each period) | | Six Months
Ended June 30, | | | Year Ended December 31, | |
| | | 2007 | | | 2006 | | | 2005 | | | 2004 | | | 2003 | | | 2002 | |
Net asset value, beginning of period | | $12.57 | | | $12.54 | | | $12.84 | | | $12.92 | | | $12.77 | | | $12.20 | |
Income from investment operations: | | | | | | | | | | | | | | | | | | |
Net investment income | | 0.30 | | | 0.61 | | | 0.55 | | | 0.54 | | | 0.60 | | | 0.66 | |
Net realized and unrealized gain (loss) | | (0.15 | ) | | 0.04 | | | (0.30 | ) | | (0.08 | ) | | 0.15 | | | 0.62 | |
| | | | | | |
Total from investment operations | | 0.15 | | | 0.65 | | | 0.25 | | | 0.46 | | | 0.75 | | | 1.28 | |
| | | | | | |
Distributions to shareholders from: | | | | | | | | | | | | | | | | | | |
Net investment income | | (0.31 | ) | | (0.62 | ) | | (0.55 | ) | | (0.54 | ) | | (0.60 | ) | | (0.66 | ) |
Net realized gain | | — | | | — | | | — | | | — | | | — | | | (0.05 | ) |
| | | | | | |
Total distributions | | (0.31 | ) | | (0.62 | ) | | (0.55 | ) | | (0.54 | ) | | (0.60 | ) | | (0.71 | ) |
| | | | | | |
Net asset value, end of period | | $12.41 | | | $12.57 | | | $12.54 | | | $12.84 | | | $12.92 | | | $12.77 | |
| | | | | | |
Total return | | 1.19 | % | | 5.30 | % | | 1.98 | % | | 3.64 | % | | 5.97 | % | | 10.75 | % |
Ratios/supplemental data: | | | | | | | | | | | | | | | | | | |
Net assets, end of period (millions) | | $14,341 | | | $11,972 | | | $9,610 | | | $7,870 | | | $5,697 | | | $3,405 | |
Ratios of expenses to average net assets | | 0.44 | %* | | 0.44 | % | | 0.44 | % | | 0.44 | % | | 0.45 | % | | 0.45 | % |
Ratios of net investment income to average net assets | | 4.96 | %* | | 4.77 | % | | 3.99 | % | | 3.61 | % | | 3.93 | % | | 5.38 | % |
Portfolio turnover rate | | 13 | % | | 30 | % | | 24 | % | | 30 | % | | 41 | % | | 31 | % |
See accompanying Notes to Financial Statements
PAGE 13 § DODGE & COX INCOME FUND
SHAREHOLDER MEETING RESULTS
A special meeting of Fund shareholders was held on April 17, 2007. The meeting was adjourned in order to permit shareholders further time to respond to the solicitation of proxies and was reconvened on April 27, 2007. At the meeting, the proposals to amend the Fund’s fundamental investment restrictions listed below were approved. The following is a report of the total votes cast by the Fund’s shareholders:
| | | | | | | | |
PROPOSAL | | FOR | | AGAINST | | WITHHELD | | TOTAL |
1. Amend the Fund’s fundamental investment restrictions with respect to the percentage of the Fund’s assets that are subject to diversification requirements | | 483,241,902 | | 15,836,087 | | 22,631,539 | | 521,709,528 |
| | | | |
2a. Amend the Fund’s fundamental investment restrictions with respect to investments in real estate | | 482,163,291 | | 16,783,128 | | 22,763,113 | | 521,709,532 |
| | | | |
2b. Amend the Fund’s fundamental investment restrictions with respect to investments in commodities and commodity contracts | | 479,354,986 | | 19,246,198 | | 23,108,345 | | 521,709,529 |
| | | | |
3. Amend the Fund’s fundamental investment restrictions with respect to making loans | | 477,077,234 | | 21,348,926 | | 23,283,372 | | 521,709,532 |
| | | | |
4. Eliminate the Fund’s fundamental investment restrictions with respect to investments in oil, gas and mineral leases or other mineral exploration or development programs | | 472,901,002 | | 26,048,803 | | 22,759,730 | | 521,709,535 |
| | | | |
5. Amend the Fund’s fundamental investment restrictions with respect to borrowing and issuing senior securities | | 468,040,588 | | 30,215,379 | | 23,453,566 | | 521,709,533 |
FUND HOLDINGS
The Fund provides a complete list of its holdings four times each fiscal year, as of the end of each quarter. The lists appear in the Fund’s First Quarter, Semi-Annual, Third Quarter and Annual Reports to shareholders. The Fund files the lists with the Securities and Exchange Commission (SEC) on Form N-CSR (second and fourth quarters) and Form N-Q (first and third quarters). Shareholders may view the Funds’ Forms N-CSR and N-Q on the SEC’s website at www.sec.gov. Forms N-CSR and N-Q may also be reviewed and copied at the SEC’s Public Reference Room in Washington, DC. Information regarding the operations of the Public Reference Room may be obtained by 1-202-942-8090 (direct) or 1-800-732-0330 (general SEC number). A complete list of the Fund’s quarter-end holdings is also available at www.dodgeandcox.com on or about 15 days following each quarter end and remains available on the web site until the list is updated in the subsequent quarter.
PROXY VOTING
For a free copy of the Fund’s proxy voting policies and procedures, please call 1-800-621-3979, visit the Fund’s web site at www.dodgeandcox.com or visit the SEC’s web site at www.sec.gov. Information regarding how the Fund voted proxies relating to portfolio securities during the most recent 12-month period ending June 30 is also available at www.dodgeandcox.com or at www.sec.gov.
DODGE & COX INCOME FUND §PAGE 14
DODGE & COX FUNDS—EXECUTIVE OFFICER & TRUSTEE INFORMATION
| | | | | | |
Name (Age) and
Address* | | Position with Trust
(Year of Election or
Appointment) | | Principal Occupation During Past 5 Years | | Other Directorships Held by Trustees |
| INTERESTED TRUSTEES & OFFICERS |
John A. Gunn (63) | | Chairman and Trustee
(Trustee since 1985) | | Chairman (since 2007), Chief Executive Officer (since 2005) and Director of Dodge & Cox, Portfolio Manager and member of Investment Policy Committee (IPC), Fixed Income Investment Policy Committee (FIIPC) and International Investment Policy Committee (IIPC) | | — |
Kenneth E. Olivier (55) | | President and Trustee
(Trustee since 2005) | | President (since 2005) and Director of Dodge & Cox, Portfolio Manager and member of IPC | | — |
Dana M. Emery (45) | | Vice President and Trustee (Trustee since 1993) | | Executive Vice President (since 2005) and Director of Dodge & Cox, Manager of the Fixed Income Department, Portfolio Manager and member of FIIPC | | — |
| Katherine Herrick Drake (53) | | Vice President (Since 1993) | | Vice President of Dodge & Cox, Portfolio Manager | | — |
| Diana S. Strandberg (47) | | Vice President
(Since 2005) | | Vice President of Dodge & Cox, Portfolio Manager and member of IPC and IIPC | | — |
| Roberta R.W. Kameda (46) | | Assistant Secretary (Since 2007) | | Senior Counsel (since 2006) of Dodge & Cox, Senior Associate General Counsel, Franklin Templeton Investments (1977-2006) | | — |
John M. Loll (40) | | Assistant Treasurer and Assistant Secretary (Since 2000) | | Vice President and Treasurer of Dodge & Cox | | — |
| David H. Longhurst (49) | | Treasurer
(Since 2006) | | Fund Administration and Accounting Senior Manager of Dodge & Cox (since 2004); Vice President, Treasurer, Controller and Secretary of Safeco Mutual Funds, Safeco Asset Management Company, Safeco Services, Safeco Securities, and Safeco Investment Services (2000-2004) | | — |
| Thomas M. Mistele (53) | | Secretary (Since 2000) | | Chief Operating Officer (since 2004), Director (since 2005), Secretary and General Counsel of Dodge & Cox | | — |
| Marcia P. Venegas (38) | | Chief Compliance Officer
(Since 2004) | | Chief Compliance Officer of Dodge & Cox (since 2005), Compliance Officer of Dodge & Cox (2003-2004); Compliance and Business Risk Manager of Deutsche Asset Management, Australia Limited (1999-2001) | | — |
| INDEPENDENT TRUSTEES |
William F. Ausfahl (67) | | Trustee (Since 2002) | | CFO, The Clorox Co. (1982-1997); Director, The Clorox Co. (1984-1997) | | — |
L. Dale Crandall (65) | | Trustee (Since 1999) | | President, Kaiser Foundation Health Plan, Inc. and Kaiser Foundation Hospitals (2000-2002); Senior Vice President—Finance and Administration & CFO, Kaiser Foundation Health Plan, Inc. and Kaiser Foundation Hospitals (1998-2000) | | Director, Union BanCal Corporation (bank holding company) and Union Bank of California (commercial bank) (2001-Present); Director, Covad Communications Group (broadband communications services) (2002-Present); Director, Ansell Limited (medical equipment and supplies) (2002-Present); Director, BEA Systems, Inc. (software and programming) (2003-Present); Director, Coventry Health Care, Inc. (managed healthcare) (2004-Present) |
Thomas A. Larsen (57) | | Trustee (Since 2002) | | Director in Howard, Rice, Nemerovski, Canady, Falk & Rabkin (law firm) | | — |
John B. Taylor (60) | | Trustee (Since 2005) | | Professor of Economics, Stanford University; Senior Fellow, Hoover Institution; Under Secretary for International Affairs, United States Treasury (2001-2005) | | — |
Will C. Wood (67) | | Trustee (Since 1992) | | Principal, Kentwood Associates, Financial Advisers | | Director, Banco Latinoamericano de Exportaciones S.A. (Latin American Foreign Trade Bank) (1999-Present) |
| * | | The address for each Officer and Trustee is 555 California Street, 40th Floor, San Francisco, California 94104. Each Officer and Trustee oversees all four series in the Dodge & Cox Funds complex and serves for an indefinite term. |
Additional information about the Trust’s Trustees and Officers is available in the Trust’s Statement of Additional Information (SAI). You can get a free copy of the SAI by visiting the Fund’s website at www.dodgeandcox.com or calling
1-800-621-3979.
PAGE 15 § DODGE & COX INCOME FUND
Not applicable for semi-annual report filings.
| ITEM 3. | AUDIT COMMITTEE FINANCIAL EXPERT. |
Not applicable for semi-annual report filings.
| ITEM 4. | PRINCIPAL ACCOUNTANT FEES AND SERVICES. |
Not applicable for semi-annual report filings.
| ITEM 5. | AUDIT COMMITTEE OF LISTED REGISTRANTS. |
Not applicable.
| ITEM 6. | SCHEDULE OF INVESTMENTS. |
Not applicable. The complete schedule of investments is included in Item 1 of this Form N-CSR.
| ITEM 7. | DISCLOSURE OF PROXY VOTING POLICIES AND PROCEDURES FOR CLOSED-END MANAGEMENT INVESTMENT COMPANIES. |
Not applicable.
| ITEM 8. | PORTFOLIO MANAGERS OF CLOSED-END MANAGEMENT INVESTMENT COMPANIES. |
Not applicable.
| ITEM 9. | PURCHASES OF EQUITY SECURITIES BY CLOSED-END MANAGEMENT INVESTMENT COMPANY AND AFFILIATED PURCHASERS. |
Not applicable.
| ITEM 10. | SUBMISSION OF MATTERS TO A VOTE OF SECURITY HOLDERS. |
During the reporting period, there were no material changes to the procedures by which shareholders may recommend nominees to the registrant’s board.
| ITEM 11. | CONTROLS AND PROCEDURES. |
(a) An evaluation was performed within 90 days of the filing of this report, under the supervision and with the participation of the registrant’s management, including the principal executive officer and principal financial officer, of the effectiveness of the design and operation of the registrant’s disclosure controls and procedures. Based on that evaluation, the principal executive officer and principal financial officer concluded that the registrant’s disclosure controls and procedures were effective.
(b) The registrant’s principal executive officer and principal financial officer are aware of no changes in the registrant’s internal control over financial reporting that occurred during the registrant’s second fiscal quarter of the period covered by this report that has materially affected, or is reasonably likely to materially affect, the registrant’s internal control over financial reporting.
(a) (1) Not applicable for semi-annual report filings.
(a) (2) Certifications pursuant to Section 302 of the Sarbanes-Oxley Act of 2002 are attached. (EX.99A)
(a) (3) Not applicable.
(b) Certifications pursuant to Section 906 of the Sarbanes-Oxley Act of 2002 are attached. (EX.99B)
SIGNATURES
Pursuant to the requirements of the Securities Exchange Act of 1934 and the Investment Company Act of 1940, the registrant has duly caused this report to be signed on its behalf by the undersigned, thereunto duly authorized.
| | |
| DODGE & COX FUNDS |
| |
| By | | /S/ JOHN A. GUNN |
| | John A. Gunn Chairman – Principal Executive Officer |
Date August 16, 2007
Pursuant to the requirements of the Securities Exchange Act of 1934 and the Investment Company Act of 1940, this report has been signed below by the following persons on behalf of the registrant and in the capacities and on the dates indicated.
| | |
| DODGE & COX FUNDS |
| |
| By | | /S/ JOHN A. GUNN |
| | John A. Gunn Chairman – Principal Executive Officer |
| | |
| |
| By | | /S/ DAVID H. LONGHURST |
| | David H. Longhurst Treasurer – Principal Financial Officer |
Date August 16, 2007