UNITED STATES
SECURITIES AND EXCHANGE COMMISSION
Washington, D.C. 20549
FORM N-CSR
CERTIFIED SHAREHOLDER REPORT OF REGISTERED
MANAGEMENT INVESTMENT COMPANIES
|
Investment Company Act file number 811-173 |
DODGE & COX FUNDS
|
| (Exact name of registrant as specified in charter) |
| | |
555 California Street, 40th Floor San Francisco, CA | | 94104 |
| (Address of principal executive offices) | | (Zip code) |
Thomas M. Mistele, Esq.
555 California Street, 40th Floor
San Francisco, CA 94104
|
| (Name and address of agent for service) |
Registrant’s telephone number, including area code: 415-981-1710
Date of fiscal year end: DECEMBER 31, 2008
Date of reporting period: DECEMBER 31, 2008
Form N-CSR is to be used by management investment companies to file reports with the Commission not later than 10 days after the transmission to stockholders of any report that is required to be transmitted to stockholders under Rule 30e-1 under the Investment Company Act of 1940 (17 CFR 270.30e-1). The Commission may use the information provided on Form N-CSR in its regulatory, disclosure review, inspection, and policymaking roles.
A registrant is required to disclose the information specified by Form N-CSR, and the Commission will make this information public. A registrant is not required to respond to the collection of information contained in Form N-CSR unless the Form displays a currently valid Office of Management and Budget (“OMB”) control number. Please direct comments concerning the accuracy of the information collection burden estimate and any suggestions for reducing the burden to Secretary, Securities and Exchange Commission, 450 Fifth Street, NW, Washington, DC 20549-0609. The OMB has reviewed this collection of information under the clearance requirements of 44 U.S.C. ss. 3507.
| ITEM 1. | REPORTS TO STOCKHOLDERS. |
The following are the December 31, 2008 annual reports for the Dodge & Cox Funds, a Delaware statutory trust, consisting of five series: Dodge & Cox Stock Fund, Dodge & Cox Global Stock Fund, Dodge & Cox International Stock Fund, Dodge & Cox Balanced Fund and Dodge & Cox Income Fund. The reports of each series were transmitted to their respective shareholders on February 18, 2009.
| | | | |
 | | | |  |
www.dodgeandcox.com
For Fund literature, transactions, and account
information, please visit the Funds’ web site.
or write or call:
DODGE & COX FUNDS
c/o Boston Financial Data Services
P.O. Box 8422
Boston, Massachusetts 02266-8422
(800) 621-3979
INVESTMENT MANAGER
Dodge & Cox
555 California Street, 40th Floor
San Francisco, California 94104
(415) 981-1710
This report is submitted for the general information of the shareholders of the Fund. The report is not authorized for distribution to prospective investors in the Fund unless it is accompanied by a current prospectus.
This report reflects our views, opinions, and portfolio holdings as of December 31, 2008, the end of the reporting period. Any such views are subject to change at any time based upon market or other conditions and Dodge & Cox disclaims any responsibility to update such views. These views may not be relied on as investment advice and, because investment decisions for a Dodge & Cox Fund are based on numerous factors, may not be relied on as an indication of trading intent on behalf of any Dodge & Cox Fund.
12/08 SF AR  Printed on recycled paper
Annual Report
December 31, 2008
Stock Fund
ESTABLISHED 1965
TICKER: DODGX
TO OUR SHAREHOLDERS
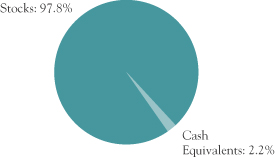
The Dodge & Cox Stock Fund had a total return of negative 43.3% for 2008, compared to a total return of negative 37.0% for the Standard & Poor’s 500 Index (S&P 500). At year end, the Fund had net assets of $32.7 billion with a cash position of 2.2%. Longer-term results appear on page four.
LOOKING BACK
The past year was the most disappointing in the Stock Fund’s 43-year history and the worst year for the broad market since 1931. As we reflect on 2008, we clearly underestimated the worsening credit crisis, the likelihood of government interventions, the depth and breadth of the ongoing economic problems, and the combined effect of these on many of the Fund’s holdings, particularly within the Financials sector.
While the returns resulting from a number of our investment decisions were disappointing during 2008, we are confident in the Fund’s holdings. The Fund has experienced periods of underperformance in the past. We have learned from these past periods just as we are learning from this one, and are incorporating these lessons into our strategy and outlook on an ongoing basis.
For example, during this unique period of extreme volatility and limited liquidity, our equity and fixed income research analysts have reviewed, updated, and stress-tested our financial projections for each of the Fund’s holdings, paying particular attention to potential vulnerabilities to the challenging credit market. We review this work with our analysts while continually monitoring relative values across our investment universe in order to determine the best long-term opportunities on behalf of the Fund’s shareholders. As a result of this review, we sold General Motors and Ford during the fourth quarter.
While we have made refinements, maintaining the essence of our investment approach through previous challenging periods has been crucial to the Fund’s long-term success. That approach—constructing a diversified portfolio through in-depth, independent research, a three-to-five year investment horizon, and a focus on valuation relative to underlying fundamentals—continues to guide us through this period as well. As we learn and make
adjustments, we remain confident that our enduring value-oriented approach will benefit our shareholders in the years ahead.
Founded in 1930, our firm has weathered past financial storms and we are confident we will weather this one as well. We are independently owned by our current employees, have no debt, and have kept our employee count low. We have no need for layoffs, and in fact have continued to invest in our most important resource—people—by maintaining a pattern of hiring one or two new analysts per year. Our independence gives us the staying power to stick with our convictions and maintain our focus on the long term. Our firm’s foremost objective is to provide high quality investment management service to our clients.
LOOKING FORWARD
While the economic landscape has clearly worsened with rising unemployment, declining home values, and continuing uncertainty within the Financials sector, there are a number of factors which build our convictions about the positive prospects for equity returns over the long term.
First, government officials and companies’ management teams have been actively addressing and responding to the economic downturn. Unlike some past recessions or the Great Depression, when policy makers either did nothing or raised barriers, the U.S. and foreign governments have implemented large programs to support the financial system and stimulate the economy, and have largely maintained free-market principles. Government involvement, though, can be a double-edged sword for the equity investor, as we’ve learned since September. As regulators take a more active role addressing problems in the banking system, but also take on health care, telecommunications, energy, and environmental policy, we are working to expand our understanding of where public policy is heading and its potential impact on the Fund’s investments.
In our regular discussions with management teams, we hear how they are also rapidly responding to the downturn. Many companies are reducing costs, improving processes, reconsidering strategies, and looking for growth and market share opportunities as competitors struggle.
PAGE 1 § DODGE & COX STOCK FUND
The survivors should be better positioned and more profitable when the economy does turn around. Examples of Fund holdings gaining market share and/or aggressively cutting costs include Hewlett-Packard, Comcast, Pfizer, FedEx, Schlumberger, and Wal-Mart.
Second, the U.S. economy has been through difficult periods before—it has survived wars, flu pandemics, inflation, labor unrest, and terrorist attacks. Pessimism during these periods—just like optimism during upturns—can become pervasive. Stock market volatility during this crisis has been at record levels with prices moving as much as 10% in a day—certainly beyond any changes in the underlying fundamentals of the companies these stocks represent. The U.S. and global economies are resilient and, while setbacks have occurred throughout history, equity investors have been rewarded over the long term. In the first 52 years of the S&P 500 (from early 1957 to the end of 2008) the annualized total return was 9.5% (including dividends). This return was driven primarily by the expansion in earnings of the companies that comprise the S&P 500. Earnings expansion in turn has come from companies focusing on their relative strength, expanding productivity, and, in the last few decades, taking advantage of overseas opportunities. While companies are currently under extreme profit pressure, there is nothing to indicate to us that the experience of the past 52 years is no longer relevant to the future.
Third, valuations for companies have obviously come down dramatically, and in our opinion are even more attractive today. As a whole, the stock market is selling at depressed valuations, and select companies are selling at very low multiples to sales and earnings potential. When the global economy stabilizes and recovers, attractive nominal returns could be achieved. Furthermore, companies perceived by investors as being more defensive—generally in the Utilities, Telecommunication Services, and Consumer Staples sectors—now trade at premium valuations, while companies viewed as riskier—generally those in the Consumer Discretionary, Information Technology, Industrials, and Financials sectors—have been discounted. The “flight to safety” strategy could prove successful in the near term. We, however, do not believe it will prove to be successful over the long term.
And finally, the powerful forces behind accelerated global economic growth over the past five years remain in place—namely, technological innovation and the growth in developing countries. While emerging markets growth has slowed, we believe the long-term outlook is good. The 5.5 billion people in the developing world now account for 30% to 40% of the global economy, and increasingly their growth is being created by demand from their own markets, not just by exports to the West—creating potential opportunities for multinational companies. As of year end, 20% of the Fund was invested in multinational foreign companies, and another 24% invested in U.S.-based companies that have at least 50% of their sales coming from overseas—much of it from emerging markets.
Two sectors in the crosshairs of technological innovation and growth in the developing world are Health Care and Information Technology. At year end, the Fund had 28% of its assets in Health Care stocks, primarily in global pharmaceutical companies (e.g., Novartis and GlaxoSmithKline). Pharmaceuticals are faced with many regulatory challenges, but are trading at historically low valuations and are in financially strong condition. They continue to innovate, and should benefit from increased demand as discretionary income in the developing world increases. Another 18% of the Fund was invested in Information Technology stocks, including a number of software and services companies (e.g., BMC Software, Citrix Systems, and Computer Sciences), that have solid balance sheets and high recurring revenues from clients who are dependent on them to maintain their businesses.
A THOUGHT ON FINANCIALS
As you will read in the box below, the performance of several of the Fund’s holdings in the Financials sector was breathtakingly bad. And given that the root of today’s economic turmoil lies in the banking system, it is not an unfair question to ask why one would invest in this area at all. As of year end, 11% of the Fund was invested in Financials compared to 13% of the S&P 500. Despite the continued sell-off during the fourth quarter and still lower valuations, we decided not to add significantly to positions in acknowledgement of the industry’s disruptions. At the same time, we did not sell the Fund’s positions with the
| | | | | | |
| | DODGE & COX STOCK FUND § | | PAGE | | 2 |
rationale that banks and other financial services firms provide a necessary long-term role in the global economy, and the survivors of this crisis will eventually return to profitability with stronger market positions and higher stock valuations. As we discussed earlier, we are fully cognizant of the challenges and risks in this area and are monitoring all of the Fund’s finance holdings.
IN CLOSING
Investing can be a humbling endeavor. This past year has been humbling for us twofold. First, a number of our investment decisions—made based on considerable research, discussion, and debate—proved to be wrong. Second, we have been humbled by the loyalty and confidence our shareholders have displayed through this difficult period. While the Fund did experience net outflows during the year, the outflows were manageable and represented a small percentage of the Fund’s asset base. By and large what we have heard from shareholders is not only disappointment with our recent returns, but confidence in Dodge & Cox and our investment approach. As fellow shareholders in the Fund, we share in these sentiments.
Our experienced investment team is working hard to take advantage of the attractive opportunities being created during this period of economic stress and volatility. Although it is impossible to predict the short-term direction of stock prices, our experience has taught us that persistence in the face of significant market dislocations can potentially be rewarding for patient investors with long-term investment horizons.
We appreciate your continued patience and confidence in our firm as a shareholder of the Dodge & Cox Stock Fund. As always, we welcome your comments and questions.
For the Board of Trustees,
| | |
 | | 
|
John A. Gunn, Chairman | | Kenneth E. Olivier, President |
February 13, 2009
2008 PERFORMANCE REVIEW
The Fund lagged the S&P 500 by 6.3 percentage points for the year.
Key Detractors from Relative Results
| | § | | The Fund’s Financials holdings (down 72% versus down 55% for the S&P 500 sector) had the largest negative impact on performance. American International Group (AIG, down 97%), Fannie Mae (down 97% to date of sale), Wachovia (down 85%, acquired by Wells Fargo), and Citigroup (down 76%) were notable detractors. | |
| | § | | The Fund’s higher average weighting in the Consumer Discretionary sector (22% versus 8% for the S&P 500 sector), in combination with the underperformance of the Fund’s holdings (down 41% versus down 33%), detracted. Sony (down 59%) and News Corp. (down 55%) lagged. | |
| | § | | The Fund’s lower average weighting in the Consumer Staples sector (3% versus 11% for the S&P 500 sector) detracted, as the sector declined less than the market. | |
| | § | | Individual detractors included Sprint Nextel (down 86%), Motorola (down 72%), Dow Chemical (down 59%), Schlumberger (down 56%), General Electric (down 54%), and Cardinal Health (down 40%). | |
Key Contributors to Relative Results
| | § | | The Fund’s higher average weighting in the Health Care sector (23% versus 13% for the S&P 500 sector) was beneficial, as both the Fund’s holdings and the S&P 500 sector (both down 23%) declined less than the overall market. Amgen (up 24%) and Novartis (down 6%) were strong contributors. | |
| | § | | Individual contributors included Rohm and Haas (up 42% to date of sale, potentially being acquired by Dow Chemical), Wal-Mart (up 20%), Electronic Data Systems (up 18% to date of sale, acquired by Hewlett-Packard), Union Pacific (up 10% to date of sale), Sherwin-Williams (up 10%, from initial purchase), and Wells Fargo (up 2%). | |
PAGE 3 § DODGE & COX STOCK FUND
GROWTH OF $10,000 OVER 10 YEARS
FOR AN INVESTMENT MADE ON DECEMBER 31, 1998
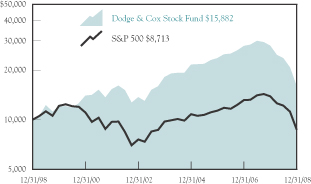
AVERAGE ANNUAL TOTAL RETURN
FOR PERIODS ENDED DECEMBER 31, 2008
| | | | | | | | | | | | |
| | | 1 Year | | | 5 Years | | | 10 Years | | | 20 Years | |
Dodge & Cox Stock Fund | | –43.31 | % | | –2.59 | % | | 4.73 | % | | 10.27 | % |
S&P 500 | | –36.99 | | | –2.19 | | | –1.38 | | | 8.43 | |
Past performance does not guarantee future results. Investment return and share price will fluctuate with market conditions, and investors may have a gain or loss when shares are sold. Mutual fund performance changes over time and currently may be significantly lower than stated. Performance is updated and published monthly. Visit the Fund’s web site at www.dodgeandcox.com or call 1-800-621-3979 for current performance figures.
The Fund’s total returns include the reinvestment of dividend and capital gain distributions, but have not been adjusted for any income taxes payable by shareholders on these distributions. The Standard & Poor’s 500 (S&P 500) is a broad-based unmanaged measure of common stocks. Index returns include dividends and/or interest income but, unlike Fund returns, do not reflect fees or expenses.
Standard & Poor’s, Standard & Poor’s 500, and S&P 500® are trademarks of The McGraw-Hill Companies, Inc.
FUND EXPENSE EXAMPLE
As a Fund shareholder, you incur ongoing Fund costs, including management fees and other Fund expenses. All mutual funds have ongoing costs, sometimes referred to as operating expenses. The following example shows ongoing costs of investing in the Fund and can help you understand these costs and compare them with those of other mutual funds. The example assumes a $1,000 investment held for the six months indicated.
ACTUAL EXPENSES
The first line of the table below provides information about actual account values and expenses based on the Fund’s actual returns. You may use the information in this line, together with your account balance, to estimate the expenses that you paid over the period. Simply divide your account value by $1,000 (for example, an $8,600 account value divided by $1,000 = 8.6), then multiply the result by the number in the first line under the heading “Expenses Paid During Period” to estimate the expenses you paid on your account during this period.
HYPOTHETICAL EXAMPLE FOR COMPARISON WITH OTHER MUTUAL FUNDS
Information on the second line of the table can help you compare ongoing costs of investing in the Fund with those of other mutual funds. This information may not be used to estimate the actual ending account balance or expenses you paid during the period. The hypothetical “Ending Account Value” is based on the actual expense ratio of the Fund and an assumed 5% annual rate of return before expenses (not the Fund’s actual return). The amount under the heading “Expense Paid During the Period” shows the hypothetical expenses your account would have incurred under this scenario. You can compare this figure with the 5% hypothetical examples that appear in shareholder reports of other mutual funds.
| | | | | | | | | |
Six Months Ended
December 31, 2008 | | Beginning Account Value
7/1/2008 | | Ending Account Value
12/31/2008 | | Expenses Paid
During Period* |
Based on Actual Fund Return | | $ | 1,000.00 | | $ | 673.80 | | $ | 2.19 |
Based on Hypothetical 5% Yearly Return | | | 1,000.00 | | | 1,022.52 | | | 2.64 |
| * | | Expenses are equal to the Fund’s annualized expense ratio of 0.52%, multiplied by the average account value over the period, multiplied by 184/366 (to reflect the one-half year period). |
The expenses shown in the table highlight ongoing costs only and do not reflect any transactional fees or account maintenance fees. While other mutual funds may charge such fees, please note that the Fund does not charge transaction fees (e.g., redemption fees, sales loads) or universal account maintenance fees (e.g., small account fees).
DODGE & COX STOCK FUND §PAGE 4
| | |
| FUND INFORMATION | | December 31, 2008 |
| | |
| GENERAL INFORMATION | | |
Net Asset Value Per Share | | $74.37 |
Total Net Assets (billions) | | $32.7 |
2008 Expense Ratio | | 0.52% |
2008 Portfolio Turnover Rate | | 31% |
30-Day SEC Yield(a) | | 2.43% |
Fund Inception | | 1965 |
No sales charges or distribution fees | | |
Investment Manager: Dodge & Cox, San Francisco. Managed by the Investment Policy Committee, whose nine members’ average tenure at Dodge & Cox is 23 years.
| | | | |
| PORTFOLIO CHARACTERISTICS | | Fund | | S&P 500 |
Number of Stocks | | 77 | | 500 |
Median Market Capitalization (billions) | | $12 | | $7 |
Weighted Average Market
Capitalization (billions) | | $55 | | $80 |
Price-to-Earnings Ratio(b) | | 11.0x | | 15.6x |
Foreign Stocks(c) | | 20.1% | | 0.0% |
| | | |
| TEN LARGEST HOLDINGS(d) | | Fund | |
Comcast Corp. | | 5.1 | % |
Hewlett-Packard Co. | | 4.9 | |
Novartis AG (Switzerland) | | 4.2 | |
Sanofi-Aventis (France) | | 3.6 | |
Amgen, Inc. | | 3.3 | |
GlaxoSmithKline PLC (United Kingdom) | | 3.3 | |
Time Warner, Inc. | | 3.3 | |
WellPoint, Inc. | | 3.0 | |
Schlumberger, Ltd. | | 2.7 | |
News Corp. | | 2.7 | |
| | | | | | |
| SECTOR DIVERSIFICATION | | Fund | | | S&P 500 | |
Health Care | | 28.1 | % | | 14.8 | % |
Consumer Discretionary | | 18.9 | | | 8.4 | |
Information Technology | | 18.0 | | | 15.3 | |
Financials | | 11.1 | | | 13.3 | |
Energy | | 9.7 | | | 13.3 | |
Industrials | | 6.5 | | | 11.1 | |
Consumer Staples | | 2.7 | | | 12.9 | |
Materials | | 2.2 | | | 2.9 | |
Telecommunication Services | | 0.6 | | | 3.8 | |
Utilities | | 0.0 | | | 4.2 | |
(a) | SEC yield is an annualization of the Fund’s total net investment income per share for the 30-day period ended on the last day of the month. |
(b) | Price-to-earnings (P/E) ratios are calculated using 12-month forward earnings estimates. |
(c) | Foreign stocks are U.S. dollar-denominated. |
(d) | The Fund’s portfolio holdings are subject to change without notice. The mention of specific securities is not a recommendation or solicitation for any person to buy, sell or hold any particular security. |
PAGE 5 § DODGE & COX STOCK FUND
| | |
| PORTFOLIO OF INVESTMENTS | | December 31, 2008 |
| | | | | |
| COMMON STOCKS: 97.8% | | | | |
| | |
| | | SHARES | | VALUE |
| CONSUMER DISCRETIONARY: 18.9% | | | |
CONSUMER DURABLES & APPAREL: 3.7% | | | |
Panasonic Corp. ADR(b) (Japan) | | 42,484,674 | | $ | 528,509,345 |
Sony Corp. ADR(b) (Japan) | | 31,729,550 | | | 693,925,258 |
Thomson ADR(a),(b) (France) | | 5,988,000 | | | 8,083,800 |
| | | | | |
| | | | | 1,230,518,403 |
MEDIA: 11.8% | | | | | |
Comcast Corp., Class A(c) | | 99,057,632 | | | 1,672,092,828 |
DISH Network Corp., Class A(a) | | 6,045,670 | | | 67,046,480 |
Interpublic Group of Companies, Inc.(a),(c) | | 20,429,193 | | | 80,899,604 |
Liberty Entertainment, Series A(a) | | 3,648,160 | | | 63,769,837 |
Liberty Global, Inc., Series A(a) | | 763,410 | | | 12,153,487 |
Liberty Global, Inc., Series C(a) | | 1,301,753 | | | 19,760,611 |
News Corp., Class A | | 96,431,826 | | | 876,565,299 |
Time Warner, Inc. | | 105,719,400 | | | 1,063,537,164 |
| | | | | |
| | | | | 3,855,825,310 |
RETAILING: 3.4% | | | | | |
CarMax, Inc.(a),(c) | | 11,812,400 | | | 93,081,712 |
Genuine Parts Co. | | 2,643,927 | | | 100,099,076 |
Home Depot, Inc. | | 24,516,700 | | | 564,374,434 |
Liberty Interactive, Series A(a) | | 27,524,472 | | | 85,876,353 |
Macy’s, Inc. | | 11,093,094 | | | 114,813,523 |
The Sherwin-Williams Co. | | 2,434,919 | | | 145,486,410 |
| | | | | |
| | | | | 1,103,731,508 |
| | | | | |
| | | | | 6,190,075,221 |
| CONSUMER STAPLES: 2.7% | | | | | |
FOOD & STAPLES RETAILING: 2.7% | | | |
Wal-Mart Stores, Inc. | | 13,557,850 | | | 760,053,071 |
Walgreen Co. | | 5,014,375 | | | 123,704,631 |
| | | | | |
| | | | | 883,757,702 |
| ENERGY: 9.7% | | | | | |
Baker Hughes, Inc. | | 15,061,494 | | | 483,022,113 |
Chevron Corp. | | 8,834,717 | | | 653,504,016 |
Occidental Petroleum Corp. | | 13,933,400 | | | 835,864,666 |
Royal Dutch Shell PLC ADR(b) (United Kingdom) | | 6,587,864 | | | 338,813,846 |
Schlumberger, Ltd. | | 20,774,712 | | | 879,393,559 |
| | | | | |
| | | | | 3,190,598,200 |
| | | | | |
| | | | | |
| | |
| | | SHARES | | VALUE |
| FINANCIALS: 11.1% | | | | | |
BANKS: 3.9% | | | | | |
HSBC Holdings PLC ADR(b) (United Kingdom) | | 4,691,050 | | $ | 228,313,403 |
Wachovia Corp. | | 56,415,122 | | | 312,539,776 |
Wells Fargo & Co. | | 24,740,000 | | | 729,335,200 |
| | | | | |
| | | | | 1,270,188,379 |
DIVERSIFIED FINANCIALS: 5.0% | | | |
Capital One Financial Corp.(c) | | 26,304,011 | | | 838,834,911 |
Citigroup, Inc. | | 50,108,800 | | | 336,230,048 |
Credit Suisse Group AG ADR(b) (Switzerland) | | 4,905,300 | | | 138,623,778 |
Legg Mason, Inc. | | 4,358,600 | | | 95,496,926 |
SLM Corp.(a),(c) | | 26,195,782 | | | 233,142,460 |
| | | | | |
| | | | | 1,642,328,123 |
INSURANCE: 2.2% | | | | | |
AEGON NV(b) (Netherlands) | | 26,882,488 | | | 162,639,052 |
American International Group, Inc.(a) | | 74,057,387 | | | 116,270,098 |
Genworth Financial, Inc., Class A(a) | | 6,909,800 | | | 19,554,734 |
Loews Corp. | | 3,910,100 | | | 110,460,325 |
The Travelers Companies, Inc. | | 6,914,650 | | | 312,542,180 |
| | | | | |
| | | | | 721,466,389 |
| | | | | |
| | | | | 3,633,982,891 |
| HEALTH CARE: 28.1% | | | | | |
HEALTH CARE EQUIPMENT & SERVICES: 9.7% |
Boston Scientific Corp.(a) | | 47,792,300 | | | 369,912,402 |
Cardinal Health, Inc.(c) | | 21,868,375 | | | 753,802,886 |
Covidien, Ltd. | | 6,351,750 | | | 230,187,420 |
Health Management Associates, Inc.(a),(c) | | 15,334,500 | | | 27,448,755 |
UnitedHealth Group, Inc. | | 29,768,600 | | | 791,844,760 |
WellPoint, Inc.(a) | | 23,419,243 | | | 986,652,708 |
| | | | | |
| | | | | 3,159,848,931 |
PHARMACEUTICALS, BIOTECHNOLOGY & LIFE SCIENCES: 18.4% |
Amgen, Inc.(a) | | 19,011,800 | | | 1,097,931,450 |
GlaxoSmithKline PLC ADR(b) (United Kingdom) | | 28,938,300 | | | 1,078,530,441 |
Novartis AG ADR(b) (Switzerland) | | 27,778,700 | | | 1,382,268,112 |
Pfizer, Inc. | | 42,425,604 | | | 751,357,447 |
Sanofi-Aventis ADR(b) (France) | | 36,306,700 | | | 1,167,623,472 |
Wyeth | | 14,868,600 | | | 557,721,186 |
| | | | | |
| | | | | 6,035,432,108 |
| | | | | |
| | | | | 9,195,281,039 |
| | |
| See accompanying Notes to Financial Statements | | DODGE & COX STOCK FUND §PAGE 6 |
| | |
| PORTFOLIO OF INVESTMENTS | | December 31, 2008 |
| | | | | |
| COMMON STOCKS (continued) | | |
| | |
| | | SHARES | | VALUE |
| INDUSTRIALS: 6.5% | | | | | |
CAPITAL GOODS: 3.4% | | | | | |
Eaton Corp. | | 395,502 | | $ | 19,660,404 |
General Electric Co. | | 52,779,900 | | | 855,034,380 |
Koninklijke Philips Electronics NV(b) (Netherlands) | | 2,509,100 | | | 49,855,817 |
Tyco International, Ltd. | | 8,631,425 | | | 186,438,780 |
| | | | | |
| | | | | 1,110,989,381 |
COMMERCIAL SERVICES & SUPPLIES: 0.8% |
Pitney Bowes, Inc. | | 10,291,750 | | | 262,233,790 |
| | |
TRANSPORTATION: 2.3% | | | | | |
FedEx Corp. | | 11,547,400 | | | 740,765,710 |
| | | | | |
| | | | | 2,113,988,881 |
| INFORMATION TECHNOLOGY: 18.0% |
SEMICONDUCTORS & SEMICONDUCTOR EQUIPMENT: 0.8% |
Maxim Integrated Products, Inc.(c) | | 24,360,200 | | | 278,193,484 |
| |
SOFTWARE & SERVICES: 5.2% | | | |
Autodesk, Inc.(a) | | 516,800 | | | 10,155,120 |
BMC Software, Inc.(a),(c) | | 9,356,040 | | | 251,771,037 |
Cadence Design Systems, Inc.(a),(c) | | 23,293,600 | | | 85,254,576 |
Citrix Systems, Inc.(a),(c) | | 12,014,741 | | | 283,187,445 |
Computer Sciences Corp.(a),(c) | | 13,462,172 | | | 473,060,724 |
Compuware Corp.(a),(c) | | 22,096,012 | | | 149,148,081 |
EBay, Inc.(a) | | 22,987,400 | | | 320,904,104 |
Synopsys, Inc.(a) | | 6,825,369 | | | 126,405,834 |
| | | | | |
| | | | | 1,699,886,921 |
TECHNOLOGY, HARDWARE & EQUIPMENT: 12.0% |
Hewlett-Packard Co. | | 44,475,608 | | | 1,614,019,814 |
Hitachi, Ltd. ADR(b) (Japan) | | 7,409,800 | | | 290,019,572 |
Kyocera Corp. ADR(b) (Japan) | | 3,351,098 | | | 242,518,962 |
Molex, Inc. | | 2,550,100 | | | 36,950,949 |
Molex, Inc., Class A | | 8,727,930 | | | 113,026,694 |
Motorola, Inc.(c) | | 155,139,211 | | | 687,266,705 |
Sun Microsystems, Inc.(a) | | 10,111,794 | | | 38,627,053 |
Telefonaktiebologet LM Ericsson ADR(b) (Sweden) | | 23,936,500 | | | 186,944,065 |
Tyco Electronics, Ltd. | | 15,899,925 | | | 257,737,784 |
Xerox Corp.(c) | | 57,778,300 | | | 460,493,051 |
| | | | | |
| | | | | 3,927,604,649 |
| | | | | |
| | | | | 5,905,685,054 |
| MATERIALS: 2.2% | | | | | |
Cemex SAB de CV ADR(b) (Mexico) | | 13,132,572 | | | 120,031,708 |
Domtar Corp.(a) | | 16,420,300 | | | 27,421,901 |
Dow Chemical Co. | | 29,260,445 | | | 441,540,115 |
Vulcan Materials Co. | | 1,655,048 | | | 115,158,240 |
| | | | | |
| | | | | 704,151,964 |
| TELECOMMUNICATION SERVICES: 0.6% |
Sprint Nextel Corp.(a) | | 109,849,239 | | | 201,024,107 |
| | | | | |
TOTAL COMMON STOCKS
(Cost $48,532,682,743) | | $ | 32,018,545,059 |
| | | | | | | |
| SHORT-TERM INVESTMENTS: 1.6% | | | |
| | |
| | | PAR VALUE | | | VALUE |
MONEY MARKET FUND: 0.3% | | | | |
SSgA Prime Money Market Fund | | $ | 97,385,042 | | | $ | 97,385,042 |
| |
REPURCHASE AGREEMENT: 1.3% | | | | |
Fixed Income Clearing Corporation(d) 0.01%, 1/2/09,
maturity value $413,681,230 | | | 413,681,000 | | | | 413,681,000 |
| | | | | | | |
TOTAL SHORT-TERM INVESTMENTS
(Cost $511,066,042) | | | $ | 511,066,042 |
| | | | | | | |
TOTAL INVESTMENTS
(Cost $49,043,748,785) | | | 99.4 | % | | $ | 32,529,611,101 |
OTHER ASSETS LESS LIABILITIES | | | 0.6 | % | | | 191,587,250 |
| | | | | | | |
| NET ASSETS | | | 100.0 | % | | $ | 32,721,198,351 |
| | | | | | | |
(b) | Security issued by a foreign entity, denominated in U.S. dollars |
(c) | See Note 8 regarding holdings of 5% voting securities |
(d) | Repurchase agreement is collateralized by Fannie Mae 2.875%-5.5%, 7/9/10-10/12/10; Federal Home Loan Bank 2.48%-3.5%, 6/18/10-7/16/10; and Freddie Mac, 2.875%-6.875%, 6/28/10-9/15/10. Total collateral value is $421,959,300. |
ADR: American Depositary Receipt
| | |
| PAGE 7 § DODGE & COX STOCK FUND | | See accompanying Notes to Financial Statements |
| | | | |
STATEMENT OF ASSETS AND LIABILITIES | |
| |
| | | December 31, 2008 | |
ASSETS: | | | | |
Investments, at value | | | | |
Unaffiliated issuers (cost $40,708,509,783) | | $ | 28,166,696,311 | |
Affiliated issuers (cost $8,335,239,002) | | | 4,362,914,790 | |
| | | | |
| | | 32,529,611,101 | |
Receivable for investments sold | | | 138,956,473 | |
Receivable for Fund shares sold | | | 108,065,543 | |
Dividends and interest receivable | | | 95,803,628 | |
Prepaid expenses and other assets | | | 307,030 | |
| | | | |
| | | 32,872,743,775 | |
| | | | |
LIABILITIES: | | | | |
Payable for investments purchased | | | 7,147,222 | |
Payable for Fund shares redeemed | | | 129,060,442 | |
Management fees payable | | | 13,251,516 | |
Accrued expenses | | | 2,086,244 | |
| | | | |
| | | 151,545,424 | |
| | | | |
NET ASSETS | | $ | 32,721,198,351 | |
| | | | |
NET ASSETS CONSIST OF: | | | | |
Paid in capital | | $ | 49,696,033,015 | |
Undistributed net investment income | | | 29,973,742 | |
Accumulated net realized loss on investments | | | (490,670,722 | ) |
Net unrealized depreciation on investments | | | (16,514,137,684 | ) |
| | | | |
| | $ | 32,721,198,351 | |
| | | | |
Fund shares outstanding (par value $0.01 each, unlimited shares authorized) | | | 439,965,275 | |
Net asset value per share | | | $74.37 | |
|
STATEMENT OF OPERATIONS | |
| |
| | | Year Ended December 31, 2008 | |
INVESTMENT INCOME: | | | | |
Dividends (net of foreign taxes of $21,825,998) | | | | |
Unaffiliated issuers | | $ | 969,975,316 | |
Affiliated issuers | | | 141,626,173 | |
Interest | | | 19,004,780 | |
| | | | |
| | | 1,130,606,269 | |
| | | | |
EXPENSES: | | | | |
Management fees | | | 249,277,593 | |
Custody and fund accounting fees | | | 670,536 | |
Transfer agent fees | | | 5,088,894 | |
Professional services | | | 133,294 | |
Shareholder reports | | | 1,934,642 | |
Registration fees | | | 360,052 | |
Trustees’ fees | | | 151,187 | |
Miscellaneous | | | 1,723,324 | |
| | | | |
| | | 259,339,522 | |
| | | | |
NET INVESTMENT INCOME | | | 871,266,747 | |
| | | | |
REALIZED AND UNREALIZED LOSS
ON INVESTMENTS: | | | | |
Net realized loss | | | | |
Unaffiliated issuers | | | (18,602,562 | ) |
Affiliated issuers | | | (471,636,440 | ) |
Net change in unrealized appreciation/depreciation | | | (27,280,798,157 | ) |
| | | | |
Net realized and unrealized loss | | | (27,771,037,159 | ) |
| | | | |
NET DECREASE IN NET ASSETS
FROM OPERATIONS | | $ | (26,899,770,412 | ) |
| | | | |
| | | | | | | | |
STATEMENT OF CHANGES IN NET ASSETS | |
| | |
| | | Year Ended
December 31, 2008 | | | Year Ended
December 31, 2007 | |
OPERATIONS: | | | | | | | | |
Net investment income | | $ | 871,266,747 | | | $ | 989,709,132 | |
Net realized gain/(loss) | | | (490,239,002 | ) | | | 6,995,198,039 | |
Net change in unrealized appreciation/depreciation | | | (27,280,798,157 | ) | | | (7,782,329,189 | ) |
| | | | | | | | |
Net increase/(decrease) in net assets from operations | | | (26,899,770,412 | ) | | | 202,577,982 | |
| | | | | | | | |
| |
DISTRIBUTIONS TO
SHAREHOLDERS FROM: | | | | | |
Net investment income | | | (841,293,005 | ) | | | (1,007,606,492 | ) |
Net realized gain | | | (1,851,869,071 | ) | | | (5,606,655,304 | ) |
| | | | | | | | |
Total distributions | | | (2,693,162,076 | ) | | | (6,614,261,796 | ) |
| | | | | | | | |
| | |
FUND SHARE
TRANSACTIONS: | | | | | | | | |
Proceeds from sale of shares | | | 10,316,815,718 | | | | 8,202,384,871 | |
Reinvestment of distributions | | | 2,558,867,110 | | | | 6,303,311,198 | |
Cost of shares redeemed | | | (13,852,190,915 | ) | | | (10,988,379,298 | ) |
| | | | | | | | |
Net increase/(decrease) from Fund share transactions | | | (976,508,087 | ) | | | 3,517,316,771 | |
| | | | | | | | |
Total decrease in net assets | | | (30,569,440,575 | ) | | | (2,894,367,043 | ) |
| | |
NET ASSETS: | | | | | | | | |
Beginning of year | | | 63,290,638,926 | | | | 66,185,005,969 | |
| | | | | | | | |
End of year (including undistributed net investment income of $29,973,742 and $0, respectively) | | $ | 32,721,198,351 | | | $ | 63,290,638,926 | |
| | | | | | | | |
| |
SHARE INFORMATION: | | | | | |
Shares sold | | | 96,421,753 | | | | 52,502,799 | |
Distributions reinvested | | | 22,845,911 | | | | 44,317,981 | |
Shares redeemed | | | (137,061,296 | ) | | | (70,354,563 | ) |
| | | | | | | | |
Net increase/(decrease) in shares outstanding | | | (17,793,632 | ) | | | 26,466,217 | |
| | | | | | | | |
| | |
| See accompanying Notes to Financial Statements | | DODGE & COX STOCK FUND §PAGE 8 |
NOTES TO FINANCIAL STATEMENTS
NOTE 1—ORGANIZATION AND SIGNIFICANT ACCOUNTING POLICIES
Dodge & Cox Stock Fund (the “Fund”) is one of the series constituting the Dodge & Cox Funds (the “Trust” or the “Funds”). The Trust is organized as a Delaware statutory trust and is registered under the Investment Company Act of 1940, as amended, as a diversified, open-end management investment company. The Fund commenced operations on January 4, 1965, and seeks long-term growth of principal and income. Risk considerations and investment strategies of the Fund are discussed in the Fund’s Prospectus.
The financial statements have been prepared in conformity with accounting principles generally accepted in the United States of America, which require the use of estimates and assumptions by management. Significant accounting policies are as follows:
Security valuation The Fund’s net assets are valued as of the close of trading on the New York Stock Exchange (NYSE), generally 4:00 p.m. Eastern Time, each day that the NYSE is open for business. Stocks are valued at the official quoted close price or the last sale of the day at the close of the NYSE or, if not available, at the mean between the exchange listed bid and ask prices for the day. A security that is listed or traded on more than one exchange is valued at the quotation on the exchange determined to be the primary market for such security. Security values are not discounted based on the size of the Fund’s position. Securities for which market quotations are not readily available are valued at fair value as determined in good faith by or at the direction of the Board of Trustees. Short-term securities are valued at amortized cost which approximates current value. All securities held by the Fund are denominated in U.S. dollars.
Security transactions, investment income, expenses, and distributions Security transactions are recorded on the trade date. Realized gains and losses on securities sold are determined on the basis of identified cost.
Dividend income and corporate action transactions are recorded on the ex-dividend date, except for certain dividends or corporate actions from foreign securities where the ex-dividend date may have passed, which are recorded as soon as the Fund is informed of the ex-dividend date. Withholding taxes on foreign dividends have been provided for in accordance with the Fund’s understanding of the applicable country’s tax rules and rates. Non-cash dividends included in dividend income, if any, are recorded
at the fair market value of the securities received. Distributions received in excess of income are recorded as a reduction of cost of investments and/or realized gain. Interest income is recorded on the accrual basis.
Expenses are recorded on the accrual basis. Most expenses of the Trust can be directly attributed to a specific series. Expenses which cannot be directly attributed are allocated among the Funds in the Trust.
Distributions to shareholders are recorded on the ex-dividend date.
Repurchase agreements The Fund may enter into repurchase agreements, secured by U.S. government or agency securities, which involve the purchase of securities from a counterparty with a simultaneous commitment to resell the securities at an agreed-upon date and price. It is the Fund’s policy that its custodian take possession of the underlying collateral securities, the fair value of which exceeds the principal amount of the repurchase transaction, including accrued interest, at all times. In the event of default by the counterparty, the Fund has the contractual right to liquidate the collateral securities and to apply the proceeds in satisfaction of the obligation.
NOTE 2—VALUATION MEASUREMENTS
Various inputs are used in determining the value of the Fund’s investments. These inputs are summarized in the three broad levels listed below.
| § | | Level 1: Quoted prices in active markets for identical securities |
| § | | Level 2: Other significant observable inputs (including quoted prices for similar securities, market indices, interest rates, credit risk, etc.) |
| § | | Level 3: Significant unobservable inputs (including the Fund’s own assumptions in determining the fair value of investments) |
The inputs or methodology used for valuing securities are not necessarily an indication of the risk associated with investing in those securities.
The following is a summary of the inputs used to value the Fund’s net assets as of December 31, 2008:
| | | |
| Valuation Inputs | | Investments in Securities |
Level 1: Quoted Prices | | $ | 32,115,930,101 |
Level 2: Other Significant Observable Inputs | | | 413,681,000 |
Level 3: Significant Unobservable Inputs | | | — |
| | | |
Total | | $ | 32,529,611,101 |
| | | |
PAGE 9 § DODGE & COX STOCK FUND
NOTES TO FINANCIAL STATEMENTS
NOTE 3—RELATED PARTY TRANSACTIONS
Management fees Under a written agreement approved by a unanimous vote of the Board of Trustees, the Fund pays an annual management fee of 0.50% of the Fund’s average daily net assets to Dodge & Cox, investment manager of the Fund. The agreement further provides that Dodge & Cox shall waive its fee to the extent that such fee plus all other ordinary operating expenses of the Fund exceed 0.75% of the average daily net assets for the year.
Fund officers and trustees All officers and three of the trustees of the Trust are officers or employees of Dodge & Cox. The Trust pays a fee only to those trustees who are not affiliated with Dodge & Cox.
Indemnification Under the Trust’s organizational documents, its officers and trustees are indemnified against certain liabilities arising out of the performance of their duties to the Trust. In addition, in the normal course of business the Trust enters into contracts that provide general indemnities to other parties. The Trust’s maximum exposure under these arrangements is unknown as this would involve future claims that may be made against the Trust that have not yet occurred.
NOTE 4—INCOME TAX INFORMATION
A provision for federal income taxes is not required since the Fund intends to continue to qualify as a regulated investment company under Subchapter M of the Internal Revenue Code and distribute all of its taxable income to shareholders. Distributions are determined in accordance with income tax regulations, which may differ from net investment income and realized gains for financial reporting purposes. Financial reporting records are adjusted for permanent book/tax differences to reflect tax character.
Book/tax differences are primarily due to differing treatments of wash sales and net short-term realized gain/(loss). At December 31, 2008, the cost of investments for federal income tax purposes was $49,080,153,958.
Distributions for the years ended December 31, 2008 and 2007 were characterized as follows for federal income tax purposes:
| | | | |
| | | Year Ended December 31, 2008 | | Year Ended December 31, 2007 |
Ordinary income | | $863,451,970 | | $1,382,138,076 |
| | ($1.889 per share) | | ($3.197 per share) |
| | |
Long-term capital gain | | $1,829,710,106 | | $5,232,123,720 |
| | ($4.079 per share) | | ($12.403 per share) |
At December 31, 2008, the tax basis components of distributable earnings were as follows:
| | | | |
Unrealized appreciation | | $ | 2,567,345,419 | |
Unrealized depreciation | | | (19,117,888,276 | ) |
| | | | |
Net unrealized depreciation | | | (16,550,542,857 | ) |
Undistributed ordinary income | | | 29,973,742 | |
Capital loss carryforward* | | | (30,080,078 | ) |
Deferred loss** | | | (424,185,471 | ) |
| * | Represents accumulated capital loss which may be carried forward to offset future capital gains. If not utilized, the capital loss carryforward will expire in 2016. |
| ** | Represents net realized loss incurred between November 1, 2008 and December 31, 2008. As permitted by tax regulations, the Fund has elected to treat this loss as arising in 2009. |
NOTE 5—COMMITTED LINE OF CREDIT
The Fund participates with the Funds in a $200 million committed credit facility (“Line of Credit”) with State Street Bank and Trust Company to be utilized for temporary or emergency purposes to fund shareholder redemptions or for other short-term liquidity purposes. Interest on borrowings is charged at the prevailing rate. There were no borrowings on the Line of Credit during the year.
NOTE 6—PURCHASES AND SALES OF INVESTMENTS
For the year ended December 31, 2008, purchases and sales of securities, other than short-term securities, aggregated $15,352,408,063 and $18,013,028,628, respectively.
NOTE 7—ACCOUNTING PRONOUNCEMENTS
Effective June 29, 2007, the Fund adopted the Financial Accounting Standards Board (FASB) Interpretation No. 48, “Accounting for Uncertainty in Income Taxes” (FIN 48). FIN 48 clarifies the accounting for income taxes by prescribing the minimum recognition threshold a tax position must meet before being recognized in the financial statements. At December 31, 2008, FIN 48 was applied to the period from January 1, 2005 through December 31, 2008, the open tax years subject to regulatory examination. There was no impact to the Fund’s financial statements as a result of applying FIN 48.
Effective January 1, 2009, the Fund will adopt “Statement of Financial Accounting Standards No. 161, Disclosures about Derivative Instruments and Hedging Activities” (FAS 161). FAS 161 requires enhanced disclosures about the Fund’s derivative and hedging activities. Management expects that implementation of FAS 161 will not significantly impact the Fund’s financial statement disclosures.
DODGE & COX STOCK FUND §PAGE 10
NOTES TO FINANCIAL STATEMENTS
NOTE 8—HOLDINGS OF 5% VOTING SECURITIES
Each of the companies listed below was considered to be an affiliate of the Fund because the Fund owned 5% or more of the company’s voting securities during all or part of the year ended December 31, 2008. Purchase and sale transactions and dividend income earned during the year on these securities were as follows:
| | | | | | | | | | | | | | | | | |
| | | Shares at
Beginning of Year | | Additions | | Reductions | | | Shares at
End of Year | | Dividend
Income(a) | | | Value at End of Year | |
BMC Software, Inc. | | 10,602,400 | | 2,862,140 | | (4,108,500 | ) | | 9,356,040 | | $ | — | (b) | | $ | — | (c) |
Cadence Design Systems, Inc. | | — | | 23,293,600 | | — | | | 23,293,600 | | | — | (b) | | | 85,254,576 | |
Capital One Financial Corp. | | 22,303,074 | | 4,000,937 | | — | | | 26,304,011 | | | 39,454,104 | | | | 838,834,911 | |
Cardinal Health, Inc. | | 23,396,450 | | 13,400 | | (1,541,475 | ) | | 21,868,375 | | | 12,195,803 | | | | 753,802,886 | |
CarMax, Inc. | | 6,800,400 | | 5,012,000 | | — | | | 11,812,400 | | | — | (b) | | | 93,081,712 | |
Citrix Systems, Inc. | | 7,219,622 | | 4,795,119 | | — | | | 12,014,741 | | | — | (b) | | | 283,187,445 | |
Comcast Corp., Class A | | 138,558,560 | | 639,072 | | (40,140,000 | ) | | 99,057,632 | | | 23,698,650 | | | | — | (c) |
Computer Sciences Corp. | | 11,677,300 | | 3,510,400 | | (1,725,528 | ) | | 13,462,172 | | | — | (b) | | | 473,060,724 | |
Compuware Corp. | | 19,325,400 | | 2,770,612 | | — | | | 22,096,012 | | | — | (b) | | | 149,148,081 | |
Electronic Data Systems Corp. | | 34,224,100 | | 17,200 | | (34,241,300 | ) | | — | | | 3,423,435 | | | | — | |
General Motors Corp. | | — | | 29,957,700 | | (29,957,700 | ) | | — | | | 9,160,121 | | | | — | |
Health Management Associates, Inc. | | 15,307,700 | | 26,800 | | — | | | 15,334,500 | | | — | (b) | | | 27,448,755 | |
Interpublic Group of Companies, Inc. | | 28,806,600 | | 40,400 | | (8,417,807 | ) | | 20,429,193 | | | — | (b) | | | — | (c) |
Maxim Integrated Products, Inc. | | 12,167,100 | | 12,193,100 | | — | | | 24,360,200 | | | 15,557,741 | | | | 278,193,484 | |
Motorola, Inc. | | 116,820,111 | | 38,319,100 | | — | | | 155,139,211 | | | 29,738,047 | | | | 687,266,705 | |
SLM Corp. | | 7,201,100 | | 20,694,682 | | (1,700,000 | ) | | 26,195,782 | | | — | (b) | | | 233,142,460 | |
Xerox Corp. | | 48,387,700 | | 11,190,600 | | (1,800,000 | ) | | 57,778,300 | | | 8,398,272 | | | | 460,493,051 | |
| | | | | | | | | | | | | | | | | |
| | | | | | | | | | | $ | 141,626,173 | | | $ | 4,362,914,790 | |
| | | | | | | | | | | | | | | | | |
| | | | | | | | | | | | | | | | | | |
(a) | Net of foreign taxes, if any |
(c) | Company was not an affiliate at the end of the year |
PAGE 11 § DODGE & COX STOCK FUND
FINANCIAL HIGHLIGHTS
| | | | | | | | | | | | | | | |
SELECTED DATA AND RATIOS (for a share outstanding throughout each year) | | Year Ended December 31, | |
| | | 2008 | | | 2007 | | | 2006 | | | 2005 | | | 2004 | |
| | | |
Net asset value, beginning of year | | $138.26 | | | $153.46 | | | $137.22 | | | $130.22 | | | $113.78 | |
Income from investment operations: | | | | | | | | | | | | | | | |
Net investment income | | 1.91 | | | 2.30 | | | 2.15 | | | 1.68 | | | 1.54 | |
Net realized and unrealized gain (loss) | | (59.83 | ) | | (1.90 | ) | | 23.12 | | | 10.36 | | | 20.08 | |
| | | |
Total from investment operations | | (57.92 | ) | | 0.40 | | | 25.27 | | | 12.04 | | | 21.62 | |
| | | |
Distributions to shareholders from: | | | | | | | | | | | | | | | |
Net investment income | | (1.84 | ) | | (2.34 | ) | | (2.12 | ) | | (1.70 | ) | | (1.53 | ) |
Net realized gain | | (4.13 | ) | | (13.26 | ) | | (6.91 | ) | | (3.34 | ) | | (3.65 | ) |
| | | |
Total distributions | | (5.97 | ) | | (15.60 | ) | | (9.03 | ) | | (5.04 | ) | | (5.18 | ) |
| | | |
Net asset value, end of year | | $74.37 | | | $138.26 | | | $153.46 | | | $137.22 | | | $130.22 | |
| | | |
Total return | | (43.31 | )% | | 0.14 | % | | 18.54 | % | | 9.36 | % | | 19.16 | % |
Ratios/supplemental data: | | | | | | | | | | | | | | | |
Net assets, end of year (millions) | | $32,721 | | | $63,291 | | | $66,185 | | | $52,184 | | | $43,266 | |
Ratio of expenses to average net assets | | 0.52 | % | | 0.52 | % | | 0.52 | % | | 0.52 | % | | 0.53 | % |
Ratio of net investment income to average net assets | | 1.75 | % | | 1.44 | % | | 1.48 | % | | 1.29 | % | | 1.32 | % |
Portfolio turnover rate | | 31 | % | | 27 | % | | 14 | % | | 12 | % | | 11 | % |
See accompanying Notes to Financial Statements
DODGE & COX STOCK FUND §PAGE 12
REPORT OF INDEPENDENT REGISTERED PUBLIC ACCOUNTING FIRM
To the Trustees of Dodge & Cox Funds and Shareholders of Dodge & Cox Stock Fund
In our opinion, the accompanying statement of assets and liabilities, including the portfolio of investments, and the related statements of operations and of changes in net assets and the financial highlights present fairly, in all material respects, the financial position of Dodge & Cox Stock Fund (the “Fund”, one of the series constituting Dodge & Cox Funds) at December 31, 2008, the results of its operations for the year then ended, the changes in its net assets for each of the two years in the period then ended and the financial highlights for each of the five years in the period then ended, in conformity with accounting principles generally accepted in the United States of America. These financial statements and financial highlights (hereafter referred to as “financial statements”) are the responsibility of the Fund’s management; our responsibility is to express an opinion on these financial statements based on our audits. We conducted our audits of these financial statements in accordance with the standards of the Public Company Accounting Oversight Board (United States). Those standards require that we plan and perform the audit to obtain reasonable assurance about whether the financial statements are free of material misstatement. An audit includes examining, on a test basis, evidence supporting the amounts and disclosures in the financial statements, assessing the accounting principles used and significant estimates made by management, and evaluating the overall financial statement presentation. We believe that our audits, which included confirmation of securities at December 31, 2008, by correspondence with the custodian and brokers, provide a reasonable basis for our opinion.
PricewaterhouseCoopers LLP
San Francisco, California
February 13, 2009
PAGE 13 § DODGE & COX STOCK FUND
SPECIAL 2008 TAX INFORMATION (unaudited)
The following information is provided pursuant to provisions of the Internal Revenue Code:
The Fund designates up to a maximum amount of $841,293,005 of its distributions paid to shareholders in 2008 as qualified dividends (treated for federal income tax purposes in the hands of shareholders as taxable at a maximum rate of 15%).
For shareholders that are corporations, the Fund designates 88% of its ordinary dividends (including short-term gains) paid to shareholders in 2008 as dividends from domestic corporations eligible for the corporate dividends received deduction, provided that the shareholder otherwise satisfies applicable requirements to claim that deduction.
BOARD APPROVAL OF FUNDS’ INVESTMENT MANAGEMENT AGREEMENTS AND MANAGEMENT FEES (unaudited)
The Board of Trustees is responsible for overseeing the performance of the Dodge & Cox Funds’ investment manager and determining whether to continue the Investment Management Agreements between the Funds and Dodge & Cox each year (the “Agreements”). At a meeting of the Board of Trustees of the Trust held on December 15, 2008, the Trustees, by a unanimous vote (including a separate vote of those Trustees who are not “interested persons” (as defined in the Investment Company Act of 1940) (the “Independent Trustees”)), approved the renewal of the Agreements for an additional one-year term through December 31, 2009. During the course of the year, the Board received a wide variety of materials relating to the services provided by Dodge & Cox and the performance of the Funds.
INFORMATION RECEIVED
In advance of the meeting, the Board, including each of the Independent Trustees, requested, received and reviewed materials relating to the Agreements. The Independent Trustees retained Morningstar® to prepare an independent expense and performance summary for each Fund and comparable funds managed by other advisers identified by Morningstar®. The Morningstar® materials
included information regarding advisory fee rates, expense ratios, and transfer agency, custodial and distribution expenses, as well as appropriate performance comparisons to an index or combination of indices. The materials reviewed by the Board also included information concerning Dodge & Cox’s profitability, financial results and condition, including advisory fee revenue and separate account advisory fee schedules. The Board additionally considered the Funds’ brokerage commissions, turnover rates and sales and redemption data for the Funds, including “soft dollar” payments made for research benefiting the Funds and other accounts managed by Dodge & Cox, and brokerage commissions and expenses paid by Dodge & Cox. Other aspects of Dodge & Cox’s services to the Funds which were reviewed included compliance and supervision of third-party service providers (e.g., custodian, fund accountant, transfer agent and state registration administrator), shareholder servicing, accounting and administrative services, web services, the character of non-advisory services, the record of compliance with the Funds’ investment policies and restrictions and the Funds’ Code of Ethics, investment management staffing and biographies, information furnished to investors and shareholders (including the Funds’ Prospectus, Statement of Additional Information, shareholder reports, and quarterly reports), and third-party retirement plan administrator reimbursements by Dodge & Cox for the same periods.
The Board received copies of the Agreements and a memorandum from the Independent Legal Counsel to the Independent Trustees, discussing the factors generally regarded as appropriate to consider in evaluating advisory arrangements. The Trust’s Contract Review Committee, consisting solely of Independent Trustees, met with the Independent Legal Counsel on December 3, 2008, and again on December 15, 2008, to discuss whether to renew the Agreements. The Board, including the Independent Trustees, subsequently concluded that the existing Agreements are fair and reasonable and voted to approve the Agreements.
In considering the Agreements, the Board, including the Independent Trustees, did not identify any single factor or particular information as all-important or controlling. In reaching the decision to approve the
DODGE & COX STOCK FUND §PAGE 14
Agreements, the Board, which was advised by Independent Legal Counsel, considered the following factors, among others, and reached the conclusions described below.
NATURE, QUALITY, AND EXTENT OF THE SERVICES
The Board considered that Dodge & Cox provides a wide range of services to the Funds in addition to portfolio management and that the quality of these services has been excellent in all respects. The extensive nature of services provided by Dodge & Cox has been documented in materials provided to the Board and in presentations made to the Board throughout the year. In particular, the Board considered the nature, quality and extent of portfolio management, administrative and shareholder services performed by Dodge & Cox, including: Dodge & Cox’s established long-term history of care and conscientiousness in the management of the Funds; demonstrated consistency in investment approach and depth, background and experience of the Dodge & Cox Investment Policy Committee, International Investment Policy Committee, Global Investment Policy Committee, Fixed Income Investment Policy Committee and research analysts responsible for managing the Funds; Dodge & Cox’s organizational structure; Dodge & Cox’s performance in the areas of compliance, administration and shareholder communication and services, supervision of Fund operations and general oversight of other service providers; peer group comparisons of expense ratios, management fee comparisons, expenses (e.g., transfer agent, custody and other fees and expenses) and asset comparisons and performance and risk summaries prepared independently by Morningstar® and favorable stewardship ratings and “Star” rankings by Morningstar®. The Board concluded that it was satisfied with the nature, extent and quality of investment management and other services provided to the Funds by Dodge & Cox.
INVESTMENT PERFORMANCE
The Board considered short-term and long-term investment performance for each Fund (including periods of outperformance or underperformance) as compared to both relevant indices and the performance of such Fund’s
peer group. In light of recent market volatility, the Board also reviewed recent performance in the context of long-term investment goals. The Board noted that the shorter-term performance of the Funds has been disappointing, particularly with respect to the Stock Fund, which performed below its peer group median. The performance information prepared by Morningstar® and Dodge & Cox demonstrated more favorable performance over the long term in keeping with the stated goals in the Prospectus. The Board considered that the performance of the Funds is the result of a team-oriented investment management process that emphasizes a long-term investment horizon, independence, comprehensive research, price discipline and focus. The Board also noted that the investment performance delivered by Dodge & Cox to the Funds appeared to be consistent with the relevant performance delivered for other (non-fund) clients of Dodge & Cox. The Board concluded that Dodge & Cox has delivered favorable long-term performance for Fund investors consistent with the long-term investment strategies being pursued by the Funds.
COSTS AND ANCILLARY BENEFITS
Costs of Services to Funds: Fees and Expenses. The Board considered each Fund’s management fee rates and expense ratios relative to industry averages for similar mutual funds and relative to management fees charged by Dodge & Cox to other (non-fund) clients. The Board evaluated the operating structures of the Funds and Dodge & Cox, including the following: Dodge & Cox has a centralized focus on investment management operations and derives revenue solely from management fees; its outsourcing of non-advisory support services to unaffiliated third-party service providers is efficient and less costly to investors; Dodge & Cox does not charge front-end sales commissions or distribution fees and bears all third party research and distribution-related costs as well as reimbursements to third-party retirement plan administrators; the Funds receive numerous administrative, regulatory compliance, and shareholder support services from Dodge & Cox without any additional administrative fee; and the fact that the Funds have relatively low transaction costs and portfolio turnover rates. The Board noted that the Funds are
PAGE 15 § DODGE & COX STOCK FUND
substantially below peer group averages in expense ratios and management fee rates and that many media and industry reports specifically comment on the low expense ratios of Dodge & Cox, which along with solid long-term performance, has been a defining characteristic of Dodge & Cox for many years. The Board also noted that the range of services under the Agreements is much more extensive than under Dodge & Cox’s separate advisory (non-fund) client agreements and that many of the separate accounts were opened decades ago when fees were lower, and considered that, when coupled with the greater risks and regulatory burdens associated with the high profile mutual fund business, there is reasonable justification for differences in fee rates charged between the two lines of business. The Board concluded that costs incurred by the Funds for the services they receive (including the management fee paid to Dodge & Cox) are reasonable and that the fees are acceptable based upon the qualifications, experience, reputation and performance of Dodge & Cox and the low overall expense ratios of the Funds.
Profitability and Costs of Services to Dodge & Cox; “Fall-out” Benefits. The Board reviewed reports of Dodge & Cox’s financial position, profitability and estimated overall value, and they considered Dodge & Cox’s overall profitability within its context as a private, employee-owned S-Corporation and relative to the favorable services provided. The Board noted that net revenues for 2008 reflect a decline in assets under management compared with 2007. The Board recognized the importance of Dodge & Cox’s profitability—which is derived solely from management fees and does not include other business ventures—to maintain its independence, stability, company culture and ethics, and management continuity. The Board also considered that revenues reflect the continued success of the Funds and that such revenues are not generated by fees that are high compared to its peers. They noted that Dodge & Cox’s profitability is enhanced due to its efficient internal business model, and that the compensation/profit structure at Dodge & Cox is vital for remaining independent and facilitating retention of its management and investment professionals. The Board considered potential “fall-out” benefits (including the receipt of research from unaffiliated brokers) that
Dodge & Cox might receive in its association with the Funds. The Board also noted the extent of additional administrative services performed by Dodge & Cox for the Funds, and that the magnitude of costs and risks borne by Dodge & Cox in rendering advisory services to the Funds (including risks in the compliance, securities valuation and investment management processes) are continuing to increase. The Board concluded that the profitability of Dodge & Cox’s relationship with the Funds (including fall-out benefits) was fair and reasonable.
THE BENEFIT OF ECONOMIES OF SCALE
The Board considered whether there have been economies of scale with respect to the management of each Fund, whether the Funds have appropriately benefited from any economies of scale, and whether the management fee rate is reasonable in relation to the Fund assets and any economies of scale that may exist. In the Board’s view, any consideration of economies of scale must take account of the Funds’ low fee structure and the considerable efficiencies of the Funds’ organization and fee structure that has been realized by shareholders at the outset of their investment (i.e., from the first dollar). Shareholders also realize efficiencies from the outset of their investment due to organizational efficiencies derived from Dodge & Cox’s investment management process (e.g., low portfolio turnover) and the avoidance of distribution and marketing structures whose costs would ultimately be borne by shareholders of the Funds. The Board noted that Dodge & Cox has shared economies of scale by adding or enhancing services to the Funds over time, and that the internal costs of providing investment management, administrative and compliance services to the Funds are continuing to increase. Thus, the Funds provide access by small investors to top-rank investment management at a relatively low cost. The Board’s decision to renew the Agreements was made after consideration of economies of scale and review of comparable fund expense ratios and historical expense ratio patterns for the Funds. Their review also included consideration of the desirability of adding breakpoints to the Funds’ fee schedules. The Board concluded that the current Dodge & Cox fee structure is fair and reasonable and adequately reflects economies of scale.
DODGE & COX STOCK FUND §PAGE 16
CONCLUSION
Based on their evaluation of all material factors and assisted by the advice of Independent Legal Counsel to the Independent Trustees, the Board, including the Independent Trustees, concluded that the advisory fee structure was fair and reasonable, that each Fund was paying a competitive fee for the services provided, that the scope and quality of Dodge & Cox’s services has provided substantial value for Fund shareholders over the long term, and that approval of the Agreements was in the best interests of each Fund and its shareholders.
FUND HOLDINGS
The Fund provides a complete list of its holdings four times each fiscal year, as of the end of each quarter. The lists appear in the Fund’s First Quarter, Semi-Annual, Third Quarter and Annual Reports to shareholders. The Fund files the lists with the Securities and Exchange Commission (SEC) on Form N-CSR (second and fourth quarters) and Form N-Q (first and third quarters).
Shareholders may view the Fund’s Forms N-CSR and N-Q on the SEC’s website at www.sec.gov. Forms N-CSR and N-Q may also be reviewed and copied at the SEC’s Public Reference Room in Washington, DC. Information regarding the operations of the Public Reference Room may be obtained by 1-202-942-8090 (direct) or 1-800-732-0330 (general SEC number). A complete list of the Fund’s quarter-end holdings is also available at www.dodgeandcox.com on or about 15 days following each quarter end and remains available on the web site until the list is updated in the subsequent quarter.
PROXY VOTING
For a free copy of the Fund’s proxy voting policies and procedures, please call 1-800-621-3979, visit the Fund’s web site at www.dodgeandcox.com or visit the SEC’s web site at www.sec.gov. Information regarding how the Fund voted proxies relating to portfolio securities during the most recent 12-month period ending June 30 is also available at www.dodgeandcox.com or at www.sec.gov.
PAGE 17 § DODGE & COX STOCK FUND
THIS PAGE INTENTIONALLY LEFT BLANK
DODGE & COX STOCK FUND §PAGE 18
DODGE & COX FUNDS—EXECUTIVE OFFICER & TRUSTEE INFORMATION
| | | | | | |
Name (Age) and
Address* | | Position with Trust
(Year of Election or
Appointment) | | Principal Occupation During Past 5 Years | | Other Directorships Held by Trustees |
| INTERESTED TRUSTEES & OFFICERS |
John A. Gunn
(65) | | Chairman and Trustee
(Trustee since 1985) | | Chairman (since 2007), Chief Executive Officer (since 2005) and Director of Dodge & Cox, Portfolio Manager and member of Investment Policy Committee (IPC), Global Investment Policy Committee (GIPC) (since 2008), and International Investment Policy Committee (IIPC) | | — |
| Kenneth E. Olivier (56) | | President and Trustee
(Trustee since 2005) | | President (since 2005) and Director of Dodge & Cox, Portfolio Manager, and member of IPC | | — |
| Dana M. Emery (47) | | Senior Vice President and Trustee (Trustee since 1993) | | Executive Vice President (since 2005) and Director of Dodge & Cox, Manager of the Fixed Income Department, Portfolio Manager, and member of Fixed Income Investment Policy Committee (FIIPC) | | — |
Charles F. Pohl
(50) | | Senior Vice President (Officer since 2004) | | Senior Vice President and Director of Dodge & Cox, Chief Investment Officer (since 2007), Director of Credit Research, Portfolio Manager, Investment Analyst, and member of IPC, GIPC (since 2008), IIPC (since 2007), and FIIPC | | — |
| Diana S. Strandberg (49) | | Senior Vice President
(Officer since 2005) | | Vice President of Dodge & Cox, Portfolio Manager, and member of IPC, GIPC (since 2008), and IIPC | | — |
David H. Longhurst (51) | | Treasurer (Officer since 2006) | | Vice President and Assistant Treasurer of Dodge & Cox (since 2008); Vice President, Treasurer, Controller and Secretary of Safeco Mutual Funds, Safeco Asset Management Company, Safeco Services, Safeco Securities, and Safeco Investment Services (2000-2004) | | — |
| Thomas M. Mistele (55) | | Secretary
(Officer since 2000) | | Chief Operating Officer (since 2004), Director (since 2005), Secretary, and General Counsel of Dodge & Cox | | — |
| Marcia P. Venegas (40) | | Chief Compliance Officer
(Officer since 2004) | | Associate Chief Compliance Officer of Dodge & Cox (since 2008), Chief Compliance Officer of Dodge & Cox (2005-2008), Compliance Officer of Dodge & Cox (2003-2004) | | — |
| INDEPENDENT TRUSTEES |
| William F. Ausfahl (68) | | Trustee (Since 2002) | | CFO, The Clorox Co. (1982-1997); Director, The Clorox Co. (1984-1997) | | — |
| L. Dale Crandall (67) | | Trustee (Since 1999) | | President, Kaiser Foundation Health Plan, Inc. and Kaiser Foundation Hospitals (2000-2002); Senior Vice President—Finance and Administration & CFO, Kaiser Foundation Health Plan, Inc. and Kaiser Foundation Hospitals (1998-2000) | | Director, Ansell Limited (medical equipment and supplies) (2002-Present); Director, Coventry Health Care, Inc. (managed health care) (2004-Present); Director, Metavante Technologies, Inc. (software) (2007 to present) |
| Thomas A. Larsen (59) | | Trustee (Since 2002) | | Director in Howard, Rice, Nemerovski, Canady, Falk & Rabkin (law firm) | | — |
John B. Taylor
(62) | | Trustee (Since 2005) | | Professor of Economics, Stanford University; Senior Fellow, Hoover Institution; Under Secretary for International Affairs, United States Treasury (2001-2005) | | — |
Will C. Wood
(69) | | Trustee (Since 1992) | | Principal, Kentwood Associates, Financial Advisers | | Director, Banco Latinoamericano de Exportaciones S.A. (Latin American foreign trade bank) (1999-Present) |
| * | | The address for each Officer and Trustee is 555 California Street, 40th Floor, San Francisco, California 94104. Each Officer and Trustee oversees all five series in the Dodge & Cox Funds complex and serves for an indefinite term. |
Additional information about the Trust’s Trustees and Officers is available in the Trust’s Statement of Additional Information (SAI). You can get a free copy of the SAI by visiting the Funds’ website at www.dodgeandcox.com or calling 1-800-621-3979.
PAGE 19 § DODGE & COX STOCK FUND
| | | | |
| | | | |
www.dodgeandcox.com
For Fund literature, transactions, and account information, please visit the Funds’ web site.
or write or call:
DODGE & COX FUNDS
c/o Boston Financial Data Services
P.O. Box 8422
Boston, Massachusetts 02266-8422
(800) 621-3979
INVESTMENT MANAGER
Dodge & Cox
555 California Street, 40th Floor
San Francisco, California 94104
(415) 981-1710
This report is submitted for the general information of the shareholders of the Fund. The report is not authorized for distribution to prospective investors in the Fund unless it is accompanied by a current prospectus.
This report reflects our views, opinions, and portfolio holdings as of December 31, 2008, the end of the reporting period. Any such views are subject to change at any time based upon market or other conditions and Dodge & Cox disclaims any responsibility to update such views. These views may not be relied on as investment advice and, because investment decisions for a Dodge & Cox Fund are based on numerous factors, may not be relied on as an indication of trading intent on behalf of any Dodge & Cox Fund.
12/08 GSF AR Printed on recycled paper
Annual Report
December 31, 2008
Global Stock
Fund
ESTABLISHED 2008
TICKER: DODWX
TO OUR SHAREHOLDERS
The Dodge & Cox Global Stock Fund had a total return of negative 46.2% since its inception on May 1, 2008, compared to a total return of negative 38.1% for the MSCI World Index (MSCI World) over the same time period. At year end, the Fund had net assets of $468 million with a cash position of 3.4%. Longer-term results appear on page three.
The fourth quarter completed what turned out to be one of the worst years for global equity markets since the Great Depression, as companies and investors incorporated expectations of lower revenue and profits caused by recession. Stock markets in every region around the world suffered meaningful losses, essentially erasing the MSCI World’s gains of the past ten years.
LOOKING BACK
The financial crisis intensified throughout 2008 and manifested itself in falling consumer confidence and declining economic activity around the world. In hindsight, we clearly underestimated the worsening credit crisis, the likelihood of government interventions, the depth and breadth of the ongoing economic problems, and the combined effect of these on many of the Fund’s holdings, particularly within the Financials sector.
In this environment of fear and uncertainty, we saw a flight to safety and shunning of risk. For example, there has been extreme pessimism associated with companies with economic sensitivity or financing needs. Thus, the share prices of companies in the Materials, Industrials, and Information Technology sectors performed poorly, while the share prices of companies in the less economically sensitive areas of the market—Consumer Staples (e.g., food), Telecommunication Services, Utilities, and Health Care—held up relatively well.
LOOKING FORWARD
While the returns resulting from a number of our investment decisions were disappointing since the Fund’s launch in May 2008, we are confident in the Fund’s holdings. Over the past 78 years, our firm has experienced periods of underperformance. We have learned from those past periods just as we are learning from this one, and are incorporating these lessons into our strategy and outlook on an ongoing basis.
During this unique period of extreme volatility and limited liquidity, our equity and fixed income research analysts have reviewed, updated, and stress-tested our financial projections for each of the Fund’s holdings, paying particular attention to potential vulnerabilities to the challenging credit market. We review this work with our analysts while continually monitoring relative values across our investment universe in order to determine the best long-term opportunities on behalf of the Fund’s shareholders. As a result of this review, we trimmed or sold several positions (e.g., Ford, General Motors, and Nortel Networks).
While we have made refinements, maintaining the essence of our investment approach through our firm’s previous challenging periods has been crucial to our long-term success. That approach—using a stable investment team to analyze company fundamentals over a three-to-five year investment horizon in relation to valuations—continues to guide us through this period as well. As we learn and make adjustments, we remain confident that our enduring value-oriented approach will benefit our shareholders in the years ahead.
FINDING OPPORTUNITIES
In light of economic uncertainty, investors are understandably pessimistic about the earnings prospects of businesses whose earnings are economically sensitive, thus severely depressing the valuations of those companies. We continue to find opportunities among these economically sensitive companies that we believe are likely to withstand the current downturn. When the global economy stabilizes, the investment returns from owning these companies may prove to be attractive.
At year end, roughly 57% of the Fund was invested in companies in Information Technology, Industrials, Energy, Materials, and Consumer Discretionary sectors, compared to about 47% for the MSCI World. Examples include Ericsson, a market share leader in wireless network equipment; Schneider, the world’s leader in electricity distribution (e.g., circuit breakers) and power management; and Schlumberger, a dominant oilfield service company in multiple geographies.
PAGE 1 § DODGE & COX GLOBAL STOCK FUND
The Fund had 21% of its weighting in Financials compared to 19% for the MSCI World at year end. Despite the continued sell-off during the fourth quarter and still lower valuations, we decided not to add significantly to our positions in acknowledgement of the industry’s disruptions. As banks and other financial services firms provide a necessary role in the global economy, the survivors of this crisis will eventually return to profitability with stronger market positions and higher stock valuations in the long term. We have maintained the Fund’s current positions where we continue to find a compelling investment case.
The Fund’s remaining holdings were companies in sectors perceived to be less economically sensitive—Health Care, Telecommunication Services, Consumer Staples, and Utilities. The Fund had less exposure in these sectors—19% of the Fund compared to 34% for the MSCI World. Within this exposure, 8% of the Fund was invested in pharmaceutical companies due to their low valuations, cost-cutting opportunities, and potential from their drug pipelines. One example is Novartis, which has an impressive research and development effort that could yield promising drug compounds in the future.
THE FUTURE FOR EQUITIES
As fellow shareholders, we share in your disappointment with the Fund’s recent performance.
We are optimistic about the potential for long-term equity returns given the low valuations in the current market. At 11 times trailing 2008 earnings, the market appears inexpensive on an absolute basis and relative to history. This low valuation reflects extreme pessimism about the growth prospects for the global economy and company earnings. A low valuation provides upside potential in the form of better-than-expected earnings and/or a higher prospective valuation. Though the timing is uncertain, we think the forces of technological innovation and free market economic principles in the developing world will allow the global economy to return to growth over our investment horizon.
Founded in 1930, our firm has weathered past financial storms and we are confident we will weather this one as well. We are independently owned by our current employees, have no debt, and have kept our employee count low. We have no need for layoffs, and in fact have continued to invest in our most important resource—people—by maintaining a pattern of hiring one or two new analysts per year. Our independence gives us the staying power to stick with our convictions and maintain our focus on the long term. Our firm’s foremost objective is to provide high quality investment management service to our clients.
IN CLOSING
We appreciate the loyalty and confidence our shareholders have displayed through this difficult period. Our experienced investment team is working hard to take advantage of the attractive opportunities being created during this period of economic stress and volatility. Although it is impossible to predict the short-term direction of stock prices, our experience has taught us that persistence in the face of significant market dislocations can potentially be rewarding for patient investors with long-term investment horizons.
Thank you for your continued patience and confidence in our firm as a shareholder of the Dodge & Cox Global Stock Fund. We welcome your comments and questions.
For the Board of Trustees,
| | |
| |  |
John A. Gunn, Chairman | | Diana S. Strandberg, Senior Vice President |
February 13, 2009
DODGE & COX GLOBAL STOCK FUND §PAGE 2
PERFORMANCE REVIEW SINCE INCEPTION
The Fund lagged the MSCI World by 8.1 percentage points from May 1, 2008 to December 31, 2008.
Key Detractors from Relative Results
| | § | | The Fund’s overweight position and selection of holdings in the Financials sector accounted for most of the Fund’s underperformance. Weak performers included American International Group (AIG, down 97%), Royal Bank of Scotland (down 88%), Fannie Mae (down 98%), and Wachovia (down 81%). | |
| | § | | The Fund’s overweight position and selection of holdings in the Information Technology sector hurt performance. Selected weak performers included Nortel Networks (down 97%), Infineon Technologies (down 86%), and Alcatel-Lucent (down 68%). | |
| | § | | The Fund’s underweight position (2% versus 11% of the MSCI World at year end) and selection of holdings in the Consumer Staples sector also detracted from relative performance. The Fund’s Consumer Staples holdings declined 24% compared to a 21% decline in the MSCI World sector. | |
Key Contributors to Relative Results
| | § | | The Fund’s overweight position in the Health Care sector (14% versus 12% of the MSCI World at year end) and selection of holdings (down 3% versus down 14%) contributed to relative performance. | |
| | § | | The Fund’s Energy holdings, including Occidental Petroleum (down 22%) and Royal Dutch Shell (down 32%), helped relative performance. | |
GROWTH OF $10,000 SINCE INCEPTION
FOR AN INVESTMENT MADE ON MAY 1, 2008
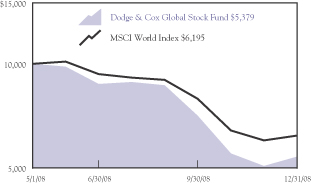
TOTAL RETURN
| | |
From 5/1/08 (inception) to 12/31/08 |
Dodge & Cox Global Stock Fund | | –46.21% |
MSCI World Index | | –38.06
|
Past performance does not guarantee future results. Investment return and share price will fluctuate with market conditions, and investors may have a gain or loss when shares are sold. Mutual fund performance changes over time and currently may be significantly lower than stated. Performance is updated and published monthly. Visit the Fund’s web site at www.dodgeandcox.com or call 1-800-621-3979 for current performance figures.
The Fund’s total returns include the reinvestment of dividend and capital gain distributions, but have not been adjusted for any income taxes payable by shareholders on these distributions. The MSCI World Index is a widely recognized benchmark of the world’s stock markets, including the United States. Index returns include dividends and/or interest income but, unlike Fund returns, do not reflect fees or expenses.
MSCI World Index® is a trademark of MSCI Barra.
Risks of international investing: Foreign investing, especially in developing countries, has special risks such as currency and market volatility and political and social instability. These and other risk considerations are discussed in the Fund’s prospectus.
PAGE 3 § DODGE & COX GLOBAL STOCK FUND
FUND EXPENSE EXAMPLE
As a Fund shareholder, you incur ongoing Fund costs, including management fees and other Fund expenses. All mutual funds have ongoing costs, sometimes referred to as operating expenses. The following example shows ongoing costs of investing in the Fund and can help you understand these costs and compare them with those of other mutual funds. The example assumes a $1,000 investment held for the six months indicated.
ACTUAL EXPENSES
The first line of the table below provides information about actual account values and expenses based on the Fund’s actual returns. You may use the information in this line, together with your account balance, to estimate the expenses that you paid over the period. Simply divide your account value by $1,000 (for example, an $8,600 account value divided by $1,000 = 8.6), then multiply the result by the number in the first line under the heading “Expenses Paid During Period” to estimate the expenses you paid on your account during this period.
HYPOTHETICAL EXAMPLE FOR COMPARISON WITH OTHER MUTUAL FUNDS
Information on the second line of the table can help you compare ongoing costs of investing in the Fund with those of other mutual funds. This information may not be used to estimate the actual ending account balance or expenses you paid during the period. The hypothetical “Ending Account Value” is based on the actual expense ratio of the Fund and an assumed 5% annual rate of return before expenses (not the Fund’s actual return). The amount under the heading “Expense Paid During the Period” shows the hypothetical expenses your account would have incurred under this scenario. You can compare this figure with the 5% hypothetical examples that appear in shareholder reports of other mutual funds.
| | | | | | | | | |
Six Months Ended December 31, 2008 | | Beginning Account Value
7/1/2008 | | Ending Account Value
12/31/2008 | | Expenses Paid During Period* |
Based on Actual Fund Return | | $ | 1,000.00 | | $ | 615.40 | | $ | 3.54 |
Based on Hypothetical 5% Yearly Return | | | 1,000.00 | | | 1,020.76 | | | 4.42 |
| * | | Expenses are equal to the Fund’s annualized six-month expense ratio of 0.87%, multiplied by the average account value over the period, multiplied by 184/366 (to reflect the one-half year period). |
The expenses shown in the table highlight ongoing costs only and do not reflect any transactional fees or account maintenance fees. While other mutual funds may charge such fees, please note that the Fund does not charge transaction fees (e.g., redemption fees, sales loads) or universal account maintenance fees (e.g., small account fees).
DODGE & COX GLOBAL STOCK FUND §PAGE 4
| | |
| FUND INFORMATION | | December 31, 2008 |
| | |
| GENERAL INFORMATION | | |
Net Asset Value Per Share | | $5.34 |
Total Net Assets (millions) | | $468 |
Expense Ratio (5/1/08 to 12/31/08, annualized) | | 0.87% |
Portfolio Turnover Rate (5/1/08 to 12/31/08, unannualized) | | 10% |
30-Day SEC Yield(a) | | 2.88% |
Fund Inception Date | | May 1, 2008 |
No sales charges or distribution fees | | |
Investment Manager: Dodge & Cox, San Francisco. Managed by the Global Investment Policy Committee, whose six members’ average tenure at Dodge & Cox is 18 years.
| | | | |
| PORTFOLIO CHARACTERISTICS | | Fund | | MSCI
World |
Number of Stocks | | 88 | | 1,693 |
Median Market Capitalization (billions) | | $16 | | $5 |
Weighted Average Market
Capitalization (billions) | | $40 | | $58 |
Price-to-Earnings Ratio(b) | | 9.4x | | 10.6x |
Countries Represented | | 24 | | 23 |
Emerging Markets (Brazil, India, Indonesia, Mexico, Russia, South Africa, South Korea, Thailand, Turkey) | | 12.9% | | 0.0% |
| | | |
| TEN LARGEST HOLDINGS(c) | | Fund | |
Hewlett-Packard Co. (United States) | | 3.0 | % |
Schlumberger, Ltd. (United States) | | 2.7 | |
Novartis AG (Switzerland) | | 2.6 | |
Comcast Corp. (United States) | | 2.3 | |
General Electric Co. (United States) | | 2.1 | |
Swiss Reinsurance Co. (Switzerland) | | 2.1 | |
Amgen, Inc. (United States) | | 2.0 | |
Capital One Financial Corp. (United States) | | 2.0 | |
Schneider Electric SA (France) | | 2.0 | |
Time Warner, Inc. (United States) | | 1.9 | |
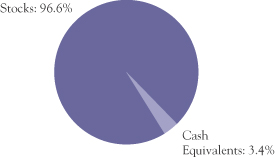
| | | | | | |
| REGION DIVERSIFICATION | | Fund | | | MSCI
World | |
United States | | 41.8 | % | | 49.7 | % |
Europe (excluding United Kingdom) | | 30.8 | | | 21.2 | |
United Kingdom | | 7.1 | | | 9.2 | |
Japan | | 5.8 | | | 11.7 | |
Pacific (excluding Japan) | | 4.2 | | | 4.3 | |
Latin America | | 4.0 | | | 0.0 | |
Africa | | 2.9 | | | 0.0 | |
Canada | | 0.0 | (d) | | 3.9 | |
| | | | | | |
| SECTOR DIVERSIFICATION | | Fund | | | MSCI
World | |
Financials | | 20.8 | % | | 18.6 | % |
Information Technology | | 14.7 | | | 10.2 | |
Health Care | | 13.9 | | | 11.9 | |
Consumer Discretionary | | 13.6 | | | 8.9 | |
Energy | | 10.9 | | | 11.6 | |
Industrials | | 9.2 | | | 10.9 | |
Materials | | 8.4 | | | 5.8 | |
Telecommunication Services | | 2.9 | | | 5.3 | |
Consumer Staples | | 2.2 | | | 11.1 | |
Utilities | | 0.0 | | | 5.7 | |
(a) | SEC yield is an annualization of the Fund’s total net investment income per share for the 30-day period ended on the last day of the month. |
(b) | Price-to-earnings (P/E) ratios are calculated using 12-month forward earnings estimates. |
(c) | The Fund’s portfolio holdings are subject to change without notice. The mention of specific securities is not a recommendation or solicitation for any person to buy, sell or hold any particular security. |
PAGE 5 § DODGE & COX GLOBAL STOCK FUND
| | |
| PORTFOLIO OF INVESTMENTS | | December 31, 2008 |
| | | | | |
| COMMON STOCKS: 94.6% | | | | |
| | |
| | | SHARES | | VALUE |
| CONSUMER DISCRETIONARY: 12.2% | | | |
AUTOMOBILES & COMPONENTS: 1.2% | | | |
Bayerische Motoren Werke AG (Germany) | | 73,300 | | $ | 2,253,157 |
Honda Motor Co., Ltd. ADR(b) (Japan) | | 146,200 | | | 3,119,908 |
| | | | | |
| | | | | 5,373,065 |
CONSUMER DURABLES & APPAREL: 2.6% | | | |
Panasonic Corp. (Japan) | | 376,000 | | | 4,711,418 |
Sony Corp. (Japan) | | 347,900 | | | 7,563,004 |
| | | | | |
| | | | | 12,274,422 |
MEDIA: 8.0% | | | | | |
Comcast Corp., Class A (United States) | | 639,900 | | | 10,801,512 |
Grupo Televisa SA ADR(b) (Mexico) | | 162,600 | | | 2,429,244 |
Naspers, Ltd. (South Africa) | | 459,100 | | | 8,345,084 |
News Corp., Class A (United States) | | 657,100 | | | 5,973,039 |
Television Broadcasts, Ltd. (Hong Kong) | | 366,700 | | | 1,201,432 |
Time Warner, Inc. (United States) | | 866,000 | | | 8,711,960 |
| | | | | |
| | | | | 37,462,271 |
RETAILING: 0.4% | | | | | |
Liberty Interactive, Series A(a) (United States) | | 159,700 | | | 498,264 |
Macy’s, Inc. (United States) | | 137,800 | | | 1,426,230 |
| | | | | |
| | | | | 1,924,494 |
| | | | | |
| | | | | 57,034,252 |
| CONSUMER STAPLES: 2.2% | | | | | |
FOOD & STAPLES RETAILING: 0.9% | | | | | |
Tesco PLC (United Kingdom) | | 423,800 | | | 2,207,961 |
Wal-Mart Stores, Inc. (United States) | | 36,000 | | | 2,018,160 |
| | | | | |
| | | | | 4,226,121 |
FOOD, BEVERAGE & TOBACCO: 1.3% | | | |
Anadolu Efes Biracilik ve Malt Sanayii AS (Turkey) | | 914,800 | | | 6,123,511 |
| | | | | |
| | | | | 10,349,632 |
| ENERGY: 10.3% | | | | | |
Baker Hughes, Inc. (United States) | | 167,987 | | | 5,387,343 |
Chevron Corp. (United States) | | 61,100 | | | 4,519,567 |
OAO Lukoil ADR(b) (Russia) | | 169,400 | | | 5,492,499 |
Occidental Petroleum Corp. (United States) | | 142,300 | | | 8,536,577 |
Royal Dutch Shell PLC ADR(b) (United Kingdom) | | 150,800 | | | 7,983,352 |
Schlumberger, Ltd. (United States) | | 303,600 | | | 12,851,388 |
Total SA (France) | | 64,000 | | | 3,489,131 |
| | | | | |
| | | | | 48,259,857 |
| | | | | |
| | | | | |
| | |
| | | SHARES | | VALUE |
| FINANCIALS: 20.8% | | | | | |
BANKS: 9.4% | | | | | |
HSBC Holdings PLC (United Kingdom) | | 611,100 | | $ | 5,848,977 |
ICICI Bank, Ltd. ADR(b) (India) | | 130,300 | | | 2,508,275 |
Kasikornbank PCL Foreign (Thailand) | | 1,641,100 | | | 2,170,111 |
Royal Bank of Scotland Group PLC(a)
(United Kingdom) | | 5,896,684 | | | 4,262,769 |
Shinhan Financial Group Co., Ltd. ADR(b) (South Korea) | | 89,900 | | | 4,239,684 |
Standard Bank Group, Ltd. (South Africa) | | 571,700 | | | 5,179,566 |
Standard Chartered PLC (United Kingdom) | | 435,555 | | | 5,567,835 |
Unicredit SPA (Italy) | | 3,322,600 | | | 8,271,766 |
Wachovia Corp. (United States) | | 1,074,200 | | | 5,951,068 |
| | | | | |
| | | | | 44,000,051 |
DIVERSIFIED FINANCIALS: 5.7% | | | | | |
Capital One Financial Corp. (United States) | | 299,600 | | | 9,554,244 |
Citigroup, Inc. (United States) | | 193,000 | | | 1,295,030 |
Credit Suisse Group AG (Switzerland) | | 305,900 | | | 8,384,487 |
Haci Omer Sabanci Holding AS (Turkey) | | 1,061,800 | | | 2,424,499 |
Legg Mason, Inc. (United States) | | 233,700 | | | 5,120,367 |
| | | | | |
| | | | | 26,778,627 |
INSURANCE: 4.7% | | | | | |
AEGON NV (Netherlands) | | 1,278,374 | | | 8,157,916 |
American International Group, Inc.(a)
(United States) | | 873,400 | | | 1,371,238 |
Swiss Reinsurance Co. (Switzerland) | | 199,800 | | | 9,706,551 |
Tokio Marine Holdings, Inc. (Japan) | | 89,600 | | | 2,625,479 |
| | | | | |
| | | | | 21,861,184 |
REAL ESTATE: 1.0% | | | | | |
Hang Lung Group, Ltd. (Hong Kong) | | 1,127,500 | | | 3,441,438 |
Hang Lung Properties, Ltd. (Hong Kong) | | 480,700 | | | 1,054,461 |
| | | | | |
| | | | | 4,495,899 |
| | | | | |
| | | | | 97,135,761 |
| HEALTH CARE: 13.9% | | | | | |
HEALTH CARE EQUIPMENT & SERVICES: 3.6% | | | |
Covidien, Ltd. (United States) | | 130,700 | | | 4,736,568 |
UnitedHealth Group, Inc. (United States) | | 171,400 | | | 4,559,240 |
WellPoint, Inc.(a) (United States) | | 186,100 | | | 7,840,393 |
| | | | | |
| | | | | 17,136,201 |
PHARMACEUTICALS, BIOTECHNOLOGY &
LIFE SCIENCES: 10.3% | | | |
Amgen, Inc.(a) (United States) | | 165,700 | | | 9,569,175 |
Bayer AG (Germany) | | 86,500 | | | 5,081,422 |
GlaxoSmithKline PLC ADR(b) (United Kingdom) | | 204,100 | | | 7,606,807 |
Novartis AG ADR(b) (Switzerland) | | 249,000 | | | 12,390,240 |
Sanofi-Aventis (France) | | 104,900 | | | 6,662,607 |
Wyeth (United States) | | 180,100 | | | 6,755,551 |
| | | | | |
| | | | | 48,065,802 |
| | | | | |
| | | | | 65,202,003 |
| | |
| See accompanying Notes to Financial Statements | | DODGE & COX GLOBAL STOCK FUND §PAGE 6 |
| | |
| PORTFOLIO OF INVESTMENTS | | December 31, 2008 |
| | | | | |
| COMMON STOCKS (continued) | | | | |
| | |
| | | SHARES | | VALUE |
| INDUSTRIALS: 9.2% | | | | | |
CAPITAL GOODS: 7.9% | | | | | |
General Electric Co. (United States) | | 613,200 | | $ | 9,933,840 |
Koninklijke Philips Electronics NV (Netherlands) | | 278,400 | | | 5,414,595 |
Mitsubishi Electric Corp. (Japan) | | 665,000 | | | 4,161,371 |
Schneider Electric SA (France) | | 123,800 | | | 9,247,410 |
Tyco International, Ltd. (United States) | | 255,500 | | | 5,518,800 |
Wienerberger AG (Austria) | | 161,200 | | | 2,692,051 |
| | | | | |
| | | | | 36,968,067 |
TRANSPORTATION: 1.3% | | | | | |
FedEx Corp. (United States) | | 97,000 | | | 6,222,550 |
| | | | | |
| | | | | 43,190,617 |
| INFORMATION TECHNOLOGY: 14.7% | | | |
SEMICONDUCTORS & SEMICONDUCTOR EQUIPMENT: 0.7% |
Infineon Technologies AG(a) (Germany) | | 590,200 | | | 812,363 |
Maxim Integrated Products, Inc. (United States) | | 213,000 | | | 2,432,460 |
| | | | | |
| | | | | 3,244,823 |
SOFTWARE & SERVICES: 3.2% | | | | | |
Cadence Design Systems, Inc.(a) (United States) | | 670,000 | | | 2,452,200 |
Computer Sciences Corp.(a) (United States) | | 96,300 | | | 3,383,982 |
Compuware Corp.(a) (United States) | | 171,400 | | | 1,156,950 |
EBay, Inc.(a) (United States) | | 427,700 | | | 5,970,692 |
Synopsys, Inc.(a) (United States) | | 118,900 | | | 2,202,028 |
| | | | | |
| | | | | 15,165,852 |
TECHNOLOGY, HARDWARE & EQUIPMENT: 10.8% |
Alcatel-Lucent(a) (France) | | 2,234,400 | | | 4,824,556 |
Hewlett-Packard Co. (United States) | | 382,200 | | | 13,870,038 |
Kyocera Corp. (Japan) | | 69,400 | | | 5,006,513 |
Motorola, Inc. (United States) | | 1,253,500 | | | 5,553,005 |
Nokia Oyj (Finland) | | 481,900 | | | 7,470,861 |
Nortel Networks Corp.(a),(b) (Canada) | | 221,984 | | | 57,716 |
Telefonaktiebologet LM Ericsson (Sweden) | | 511,800 | | | 3,925,254 |
Tyco Electronics, Ltd. (United States) | | 335,400 | | | 5,436,834 |
Xerox Corp. (United States) | | 540,800 | | | 4,310,176 |
| | | | | |
| | | | | 50,454,953 |
| | | | | |
| | | | | 68,865,628 |
| MATERIALS: 8.4% | | | | | |
Akzo Nobel NV (Netherlands) | | 147,000 | | | 6,061,889 |
Arkema (France) | | 280,916 | | | 4,827,584 |
Cemex SAB de CV ADR(b) (Mexico) | | 717,878 | | | 6,561,405 |
Domtar Corp.(a) (United States) | | 2,745,600 | | | 4,585,152 |
Dow Chemical Co. (United States) | | 173,500 | | | 2,618,115 |
Lafarge SA (France) | | 115,800 | | | 7,040,695 |
Norsk Hydro ASA (Norway) | | 1,624,300 | | | 6,559,932 |
Siam Cement PCL NVDR (Thailand) | | 416,300 | | | 1,249,831 |
| | | | | |
| | | | | 39,504,603 |
| | | | | | | | |
| | |
| | | SHARES | | | VALUE | |
| TELECOMMUNICATION SERVICES: 2.9% | | | | | |
Sprint Nextel Corp.(a) (United States) | | | 1,509,300 | | | $ | 2,762,019 | |
Telefonica SA ADR(b) (Spain) | | | 99,000 | | | | 6,671,610 | |
Telekomunik Indonesia ADR(b) (Indonesia) | | | 157,600 | | | | 3,951,032 | |
| | | | | | | | |
| | | | | | | 13,384,661 | |
| | | | | | | | |
TOTAL COMMON STOCKS
(Cost $637,057,671) | | | | | | $ | 442,927,014 | |
| | |
| PREFERRED STOCKS: 2.0% | | | | | | |
| CONSUMER DISCRETIONARY: 1.4% | | | | | |
MEDIA: 0.6% | | | | | | | | |
Net Servicos de Comunicacao SA ADR(b) (Brazil) | | | 507,700 | | | | 2,954,814 | |
| | |
RETAILING: 0.8% | | | | | | | | |
Ultrapar Participacoes SA ADR(b) (Brazil) | | | 170,200 | | | | 3,827,798 | |
| | | | | | | | |
| | | | | | | 6,782,612 | |
| ENERGY: 0.6% | | | | | | | | |
Petroleo Brasileiro SA ADR(b) (Brazil) | | | 134,800 | | | | 2,751,268 | |
| | | | | | | | |
TOTAL PREFERRED STOCKS
(Cost $11,385,380) | | | | | | $ | 9,533,880 | |
| |
| SHORT-TERM INVESTMENTS: 3.9% | | | | |
| | |
| | | PAR VALUE | | | VALUE | |
MONEY MARKET FUND: 0.3% | | | | | | | | |
SSgA Prime Money Market Fund | | $ | 1,389,352 | | | $ | 1,389,352 | |
| | |
REPURCHASE AGREEMENT: 3.6% | | | | | | | | |
Fixed Income Clearing Corporation(c) 0.01%, 1/2/09,
maturity value $16,934,009 | | | 16,934,000 | | | | 16,934,000 | |
| | | | | | | | |
TOTAL SHORT-TERM INVESTMENTS
(Cost $18,323,352) | | | $ | 18,323,352 | |
| | | | | | | | |
TOTAL INVESTMENTS
(Cost $666,766,403) | | | 100.5 | % | | $ | 470,784,246 | |
OTHER ASSETS LESS LIABILITIES | | | (0.5 | %) | | | (2,568,280 | ) |
| | | | | | | | |
| NET ASSETS | | | 100.0 | % | | $ | 468,215,966 | |
| | | | | | | | |
(b) | Security issued by a foreign entity, denominated in U.S. dollars |
(c) | Repurchase agreement is collateralized by Fannie Mae 3.53%, 8/25/10; and Federal Home Loan Bank 3.375%, 10/20/10. Total collateral value is $17,277,606. |
ADR: American Depositary Receipt
NVDR: Non Voting Depositary Receipt
| | |
| PAGE 7 § DODGE & COX GLOBAL STOCK FUND | | See accompanying Notes to Financial Statements |
| | | | |
STATEMENT OF ASSETS AND LIABILITIES | |
| |
| | | December 31, 2008 | |
ASSETS: | | | | |
Investments, at value (cost $666,766,403) | | $ | 470,784,246 | |
Cash denominated in foreign currency (cost $449,429) | | | 449,425 | |
Receivable for investments sold | | | 14,656 | |
Receivable for Fund shares sold | | | 2,526,869 | |
Dividends and interest receivable | | | 926,640 | |
Prepaid expenses and other assets | | | 1,336 | |
| | | | |
| | | 474,703,172 | |
| | | | |
LIABILITIES: | | | | |
Payable for investments purchased | | | 4,918,021 | |
Payable for Fund shares redeemed | | | 1,211,829 | |
Management fees payable | | | 207,228 | |
Accrued expenses | | | 150,128 | |
| | | | |
| | | 6,487,206 | |
| | | | |
NET ASSETS | | $ | 468,215,966 | |
| | | | |
NET ASSETS CONSIST OF: | | | | |
Paid in capital | | $ | 691,344,401 | |
Undistributed net investment income | | | 16,099 | |
Accumulated net realized loss on investments | | | (27,162,373 | ) |
Net unrealized depreciation on investments | | | (195,982,161 | ) |
| | | | |
| | $ | 468,215,966 | |
| | | | |
Fund shares outstanding (par value $0.01 each, unlimited shares authorized) | | | 87,758,577 | |
Net asset value per share | | | $5.34 | |
| |
STATEMENT OF OPERATIONS | | | | |
| |
| | | Period Ended
December 31, 2008* | |
INVESTMENT INCOME: | | | | |
Dividends (net of foreign taxes of $308,871) | | $ | 5,038,896 | |
Interest | | | 196,363 | |
| | | | |
| | | 5,235,259 | |
| | | | |
EXPENSES: | | | | |
Management fees | | | 1,393,102 | |
Custody and fund accounting fees | | | 88,038 | |
Transfer agent fees | | | 128,897 | |
Professional services | | | 117,822 | |
Shareholder reports | | | 58,348 | |
Registration fees | | | 113,423 | |
Trustees’ fees | | | 110,250 | |
Miscellaneous | | | 5,832 | |
| | | | |
| | | 2,015,712 | |
| | | | |
NET INVESTMENT INCOME | | | 3,219,547 | |
| | | | |
REALIZED AND UNREALIZED GAIN (LOSS) ON INVESTMENTS: | | | | |
Net realized gain (loss) | | | | |
Investments | | | (30,707,555 | ) |
Foreign currency transactions | | | 3,404,217 | |
Net change in unrealized depreciation | | | (195,982,161 | ) |
| | | | |
Net realized and unrealized loss | | | (223,285,499 | ) |
| | | | |
NET DECREASE IN NET ASSETS FROM OPERATIONS | | $ | (220,065,952 | ) |
| | | | |
| | | | |
STATEMENT OF CHANGES IN NET ASSETS | |
| |
| | | Period Ended
December 31, 2008* | |
OPERATIONS: | | | | |
Net investment income | | $ | 3,219,547 | |
Net realized loss | | | (27,303,338 | ) |
Net change in unrealized depreciation | | | (195,982,161 | ) |
| | | | |
Net decrease in net assets from operations | | | (220,065,952 | ) |
| | | | |
| |
DISTRIBUTIONS TO SHAREHOLDERS FROM: | | | | |
Net investment income | | | (3,126,483 | ) |
Net realized gain | | | — | |
| | | | |
Total distributions | | | (3,126,483 | ) |
| | | | |
| |
FUND SHARE TRANSACTIONS: | | | | |
Proceeds from sale of shares | | | 824,035,034 | |
Reinvestment of distributions | | | 3,011,686 | |
Cost of shares redeemed | | | (135,638,319 | ) |
| | | | |
Net increase from Fund share transactions | | | 691,408,401 | |
| | | | |
Total increase in net assets | | | 468,215,966 | |
| |
NET ASSETS: | | | | |
Beginning of period | | | — | |
| | | | |
End of period (including undistributed net investment income of $16,099) | | $ | 468,215,966 | |
| | | | |
| |
SHARE INFORMATION: | | | | |
Shares sold | | | 109,860,232 | |
Distributions reinvested | | | 588,220 | |
Shares redeemed | | | (22,689,875 | ) |
| | | | |
Net increase in shares outstanding | | | 87,758,577 | |
| | | | |
| * | | For the period from May 1, 2008 (inception) to December 31, 2008. |
| | |
| See accompanying Notes to Financial Statements | | DODGE & COX GLOBAL STOCK FUND §PAGE 8 |
NOTES TO FINANCIAL STATEMENTS
NOTE 1—ORGANIZATION AND SIGNIFICANT ACCOUNTING POLICIES
Dodge & Cox Global Stock Fund (the “Fund”) is one of the series constituting the Dodge & Cox Funds (the “Trust” or the “Funds”). The Trust is organized as a Delaware statutory trust and is registered under the Investment Company Act of 1940, as amended, as a diversified, open-end management investment company. The Fund commenced operations on May 1, 2008. It seeks long-term growth of principal and income, and invests primarily in a diversified portfolio of U.S. and foreign stocks. Foreign investing, especially in developing countries, has special risks such as currency and market volatility and political and social instability. These and other risk considerations are discussed in the Fund’s Prospectus.
The financial statements have been prepared in conformity with accounting principles generally accepted in the United States of America, which require the use of estimates and assumptions by management. Significant accounting policies are as follows:
Security valuation The Fund’s net assets are valued as of the close of trading on the New York Stock Exchange (NYSE), generally 4:00 p.m. Eastern Time, each day that the NYSE is open for business. Listed securities are valued at market, using the official quoted close price or the last sale on the date of determination on the principal exchange on which such securities are traded or, if not available, at the mean between the exchange listed bid and ask prices for the day. A security that is listed or traded on more than one exchange is valued at the quotation on the exchange determined to be the primary market for such security. Security values are not discounted based on the size of the Fund’s position. Short-term securities are valued at amortized cost which approximates current value.
Investments initially valued in currencies other than the U.S. dollar are converted to the U.S. dollar using prevailing exchange rates. As a result, the Fund’s net asset value (NAV) may be affected by changes in the value of currencies in relation to the U.S. dollar.
If market quotations are not readily available or if a security’s value has materially changed after the close of the security’s primary market but before the close of trading on the NYSE, the security is valued at fair value as
determined in good faith by or at the direction of the Board of Trustees. The Fund may use fair value pricing in calculating its NAV when, for example, (i) the primary market for a security is closed or if trading of a security is suspended or limited, (ii) the Fund determines that the price provided by a pricing service is inaccurate or unreliable, or (iii) the Fund determines that a significant event affecting the value of a security has occurred before the close of the NYSE but after the close of the security’s primary market. An event is considered significant if there is both an affirmative expectation that the security’s value will change in response to the event and a reasonable basis for quantifying a resulting change in value. For securities that do not trade during NYSE hours, fair value determinations are based on analyses of market movements after the close of those securities’ primary markets, and include reviews of developments in foreign markets, the performance of U.S. securities markets, and the performance of instruments trading in U.S. markets that represent foreign securities and baskets of foreign securities. Pricing services are used to obtain closing market prices and to compute certain fair value adjustments utilizing computerized pricing models. When fair value pricing is employed, the prices of securities used by the Fund to calculate its net asset value may differ from quoted or published prices for the same securities. In addition, fair values may not reflect the price that the Fund could obtain for a security if it were to dispose of that security at the time of pricing.
Security transactions, investment income, expenses, and distributions Security transactions are recorded on the trade date. Realized gains and losses on securities sold are determined on the basis of identified cost.
Dividend income and corporate action transactions are recorded on the ex-dividend date, except for certain dividends or corporate actions from foreign securities where the ex-dividend date may have passed, which are recorded as soon as the Fund is informed of the ex-dividend date. Withholding taxes on foreign dividends have been provided for in accordance with the Fund’s understanding of the applicable country’s tax rules and rates. Non-cash dividends included in dividend income, if
PAGE 9 § DODGE & COX GLOBAL STOCK FUND
NOTES TO FINANCIAL STATEMENTS
any, are recorded at the fair market value of the securities received. Distributions received in excess of income are recorded as a reduction of cost of investments and/or realized gain. Interest income is recorded on the accrual basis.
Expenses are recorded on the accrual basis. Most expenses of the Trust can be directly attributed to a specific series. Expenses which cannot be directly attributed are allocated among the Funds in the Trust.
Distributions to shareholders are recorded on the ex-dividend date.
Repurchase agreements The Fund may enter into repurchase agreements, secured by U.S. government or agency securities, which involve the purchase of securities from a counterparty with a simultaneous commitment to resell the securities at an agreed-upon date and price. It is the Fund’s policy that its custodian take possession of the underlying collateral securities, the fair value of which exceeds the principal amount of the repurchase transaction, including accrued interest, at all times. In the event of default by the counterparty, the Fund has the contractual right to liquidate the collateral securities and to apply the proceeds in satisfaction of the obligation.
Foreign currency The Fund may use foreign currency contracts to hedge portfolio positions and facilitate security transactions in foreign currency-denominated securities. Losses from these transactions may arise from unfavorable changes in currency values or if the counterparties do not perform under the contracts’ terms.
Foreign currency-denominated assets (including investment securities) and liabilities are translated into U.S. dollars each business day at the prevailing exchange rate. Purchases and sales of securities, income receipts, and expenses denominated in foreign currencies are translated into U.S. dollars at the exchange rate in effect on the transaction date.
Net realized gains and losses on foreign currency transactions arise from sales of foreign currencies and from changes in currency values between the date recorded and the related settlement/cash payment on securities transactions, dividends, and foreign currency contracts. The effects of currency rate changes on investment securities are included with realized and unrealized gain (loss) on investments.
NOTE 2—VALUATION MEASUREMENTS
Various inputs are used in determining the value of the Fund’s investments and other financial instruments. These inputs are summarized in the three broad levels listed below.
| § | | Level 1: Quoted prices in active markets for identical securities |
| § | | Level 2: Other significant observable inputs (including quoted prices for similar securities, market indices, interest rates, credit risk, etc.) |
| § | | Level 3: Significant unobservable inputs (including the Fund’s own assumptions in determining the fair value of investments) |
The inputs or methodology used for valuing securities are not necessarily an indication of the risk associated with investing in those securities.
The following is a summary of the inputs used to value the Fund’s net assets as of December 31, 2008:
| | | |
| Valuation Inputs | | Investments
in Securities |
Level 1: Quoted Prices | | $ | 264,328,260 |
Level 2: Other Significant Observable Inputs | | | 206,455,986 |
Level 3: Significant Unobservable Inputs | | | — |
| | | |
Total | | $ | 470,784,246 |
| | | |
NOTE 3—RELATED PARTY TRANSACTIONS
Management fees Under a written agreement approved by a unanimous vote of the Board of Trustees, the Fund pays an annual management fee of 0.60% of the Fund’s average daily net assets to Dodge & Cox, investment manager of the Fund.
Fund officers and trustees All officers and three of the trustees of the Trust are officers or employees of Dodge & Cox. The Trust pays a fee only to those trustees who are not affiliated with Dodge & Cox.
Indemnification Under the Trust’s organizational documents, its officers and trustees are indemnified against certain liabilities arising out of the performance of their duties to the Trust. In addition, in the normal course of business the Trust enters into contracts that provide general indemnities to other parties. The Trust’s maximum exposure under these arrangements is unknown as this would involve future claims that may be made against the Trust that have not yet occurred.
DODGE & COX GLOBAL STOCK FUND §PAGE 10
NOTES TO FINANCIAL STATEMENTS
NOTE 4—INCOME TAX INFORMATION AND DISTRIBUTIONS TO SHAREHOLDERS
A provision for federal income taxes is not required since the Fund intends to qualify as a regulated investment company under Subchapter M of the Internal Revenue Code and distribute all of its taxable income to shareholders. Distributions are determined in accordance with income tax regulations, which may differ from net investment income and realized gains for financial reporting purposes. Financial reporting records are adjusted for permanent book/tax differences to reflect tax character.
Certain foreign countries impose a tax on capital gains which is accrued by the Fund based on unrealized appreciation, if any, on affected securities. The tax is paid when a gain is realized on the sale of affected securities.
Book/tax differences are primarily due to differing treatments of wash sales, net short-term realized gain/(loss) on investments, foreign currency realized gain/(loss), and offering costs. At December 31, 2008, the cost of investments for federal income tax purposes was $670,501,882.
Distributions during the period ended December 31, 2008 were characterized as follows for federal income tax purposes:
| | |
| | | Period Ended December 31, 2008 |
Ordinary income | | $3,126,483 |
| | ($0.037 per share) |
| |
Long-term capital gain | | — |
At December 31, 2008, the tax basis components of distributable earnings were as follows:
| | | | |
Unrealized appreciation | | $ | 4,284,819 | |
Unrealized depreciation | | | (204,002,458 | ) |
| | | | |
Net unrealized depreciation | | | (199,717,639 | ) |
Undistributed ordinary income | | | 16,099 | |
Capital loss carryforward* | | | (13,362,941 | ) |
Deferred loss** | | | (10,063,954 | ) |
| * | Represents accumulated capital loss which may be carried forward to offset future capital gains. If not utilized, the capital loss carryforward will expire in 2016. |
| ** | Represents net realized loss on investments of $9,920,893 and net realized loss on foreign currency of $143,061 incurred between November 1, 2008 and December 31, 2008. As permitted by tax regulations, the Fund has elected to treat this loss as arising in 2009. |
NOTE 5—COMMITTED LINE OF CREDIT
The Fund participates with the Funds in a $200 million committed credit facility (“Line of Credit”) with State Street Bank and Trust Company to be utilized for temporary or emergency purposes to fund shareholder redemptions or for other short-term liquidity purposes. Interest on borrowings is charged at the prevailing rate. There were no borrowings on the Line of Credit during the period.
NOTE 6—PURCHASES AND SALES OF INVESTMENTS
For the period ended December 31, 2008, purchases and sales of securities, other than short-term securities, aggregated $713,284,917 and $34,131,046, respectively.
NOTE 7—ACCOUNTING PRONOUNCEMENTS
The Fund adopted the Financial Accounting Standards Board (FASB) Interpretation No. 48, “Accounting for Uncertainty in Income Taxes” (FIN 48). FIN 48 clarifies the accounting for income taxes by prescribing the minimum recognition threshold a tax position must meet before being recognized in the financial statements. At December 31, 2008, FIN 48 was applied to the period from May 1, 2008 through December 31, 2008, the open tax period subject to regulatory examination. There was no impact to the Fund’s financial statements as a result of applying FIN 48.
Effective January 1, 2009, the Fund will adopt “Statement of Financial Accounting Standards No. 161, Disclosures about Derivative Instruments and Hedging Activities” (FAS 161). FAS 161 requires enhanced disclosures about the Fund’s derivative and hedging activities. Management expects that implementation of FAS 161 will not significantly impact the Fund’s financial statement disclosures.
PAGE 11 § DODGE & COX GLOBAL STOCK FUND
FINANCIAL HIGHLIGHTS
| | | |
SELECTED DATA AND RATIOS (for a share outstanding throughout the period) | | Period from
May 1, 2008
(inception) to
December 31, 2008 | |
| |
Net asset value, beginning of period | | $10.00 | |
Income from investment operations: | | | |
Net investment income | | 0.04 | |
Net realized and unrealized loss | | (4.66 | ) |
| | | |
Total from investment operations | | (4.62 | ) |
| | | |
Distributions to shareholders from: | | | |
Net investment income | | (0.04 | ) |
Net realized gain | | — | |
| | | |
Total distributions | | (0.04 | ) |
| | | |
Net asset value, end of period | | $5.34 | |
| | | |
Total return | | (46.21 | )% |
Ratios/supplemental data: | | | |
Net assets, end of period (millions) | | $468 | |
Ratio of expenses to average net assets | | 0.87 | %* |
Ratio of net investment income to average net assets | | 1.39 | %* |
Portfolio turnover rate | | 10 | % |
See accompanying Notes to Financial Statements
DODGE & COX GLOBAL STOCK FUND §PAGE 12
REPORT OF INDEPENDENT REGISTERED PUBLIC ACCOUNTING FIRM
To the Trustees of Dodge & Cox Funds and Shareholders of Dodge & Cox Global Stock Fund
In our opinion, the accompanying statement of assets and liabilities, including the portfolio of investments, and the related statements of operations and of changes in net assets and the financial highlights present fairly, in all material respects, the financial position of Dodge & Cox Global Stock Fund (the “Fund”, one of the series constituting Dodge & Cox Funds) at December 31, 2008, the results of its operations, the changes in its net assets and the financial highlights for the period indicated, in conformity with accounting principles generally accepted in the United States of America. These financial statements and financial highlights (hereafter referred to as “financial statements”) are the responsibility of the Fund’s management; our responsibility is to express an opinion on these financial statements based on our audit. We conducted our audit of these financial statements in accordance with the standards of the Public Company Accounting Oversight Board (United States). Those standards require that we plan and perform the audit to obtain reasonable assurance about whether the financial statements are free of material misstatement. An audit includes examining, on a test basis, evidence supporting the amounts and disclosures in the financial statements, assessing the accounting principles used and significant estimates made by management, and evaluating the overall financial statement presentation. We believe that our audit, which included confirmation of securities at December 31, 2008 by correspondence with the custodian and brokers, provides a reasonable basis for our opinion.
PricewaterhouseCoopers LLP
San Francisco, California
February 13, 2009
PAGE 13 § DODGE & COX GLOBAL STOCK FUND
SPECIAL 2008 TAX INFORMATION
(unaudited)
The following information is provided pursuant to provisions of the Internal Revenue Code:
In 2008, the Fund elected to pass through to shareholders foreign source income of $3,111,829 and foreign taxes paid of $308,871.
The Fund designates up to a maximum of $3,435,354 of its distributions paid to shareholders in 2008 as qualified dividends (treated for federal income tax purposes in the hands of shareholders as taxable at a maximum rate of 15%).
For shareholders that are corporations, the Fund designates 64% of its ordinary dividends (including short-term gains) paid to shareholders in 2008 as dividends from domestic corporations eligible for the corporate dividends received deduction, provided that the shareholder otherwise satisfies applicable requirements to claim that deduction.
BOARD APPROVAL OF FUNDS’ INVESTMENT MANAGEMENT
AGREEMENTS AND MANAGEMENT FEES
(unaudited)
The Board of Trustees is responsible for overseeing the performance of the Dodge & Cox Funds’ investment manager and determining whether to continue the Investment Management Agreements between the Funds and Dodge & Cox each year (the “Agreements”). At a meeting of the Board of Trustees of the Trust held on December 15, 2008, the Trustees, by a unanimous vote (including a separate vote of those Trustees who are not “interested persons” (as defined in the Investment Company Act of 1940) (the “Independent Trustees”)), approved the renewal of the Agreements for an additional one-year term through December 31, 2009. During the course of the year, the Board received a wide variety of materials relating to the services provided by Dodge & Cox and the performance of the Funds.
INFORMATION RECEIVED
In advance of the meeting, the Board, including each of the Independent Trustees, requested, received and reviewed materials relating to the Agreements. The Independent Trustees retained Morningstar® to prepare an
independent expense and performance summary for each Fund and comparable funds managed by other advisers identified by Morningstar®. The Morningstar® materials included information regarding advisory fee rates, expense ratios, and transfer agency, custodial and distribution expenses, as well as appropriate performance comparisons to an index or combination of indices. The materials reviewed by the Board also included information concerning Dodge & Cox’s profitability, financial results and condition, including advisory fee revenue and separate account advisory fee schedules. The Board additionally considered the Funds’ brokerage commissions, turnover rates and sales and redemption data for the Funds, including “soft dollar” payments made for research benefiting the Funds and other accounts managed by Dodge & Cox, and brokerage commissions and expenses paid by Dodge & Cox. Other aspects of Dodge & Cox’s services to the Funds which were reviewed included compliance and supervision of third-party service providers (e.g., custodian, fund accountant, transfer agent and state registration administrator), shareholder servicing, accounting and administrative services, web services, the character of non-advisory services, the record of compliance with the Funds’ investment policies and restrictions and the Funds’ Code of Ethics, investment management staffing and biographies, information furnished to investors and shareholders (including the Funds’ Prospectus, Statement of Additional Information, shareholder reports, and quarterly reports), and third-party retirement plan administrator reimbursements by Dodge & Cox for the same periods.
The Board received copies of the Agreements and a memorandum from the Independent Legal Counsel to the Independent Trustees, discussing the factors generally regarded as appropriate to consider in evaluating advisory arrangements. The Trust’s Contract Review Committee, consisting solely of Independent Trustees, met with the Independent Legal Counsel on December 3, 2008 and again on December 15, 2008 to discuss whether to renew the Agreements. The Board, including the Independent Trustees, subsequently concluded that the existing Agreements are fair and reasonable and voted to approve the Agreements.
DODGE & COX GLOBAL STOCK FUND §PAGE 14
In considering the Agreements, the Board, including the Independent Trustees, did not identify any single factor or particular information as all-important or controlling. In reaching the decision to approve the Agreements, the Board, which was advised by Independent Legal Counsel, considered the following factors, among others, and reached the conclusions described below.
NATURE, QUALITY, AND EXTENT OF THE SERVICES
The Board considered that Dodge & Cox provides a wide range of services to the Funds in addition to portfolio management and that the quality of these services has been excellent in all respects. The extensive nature of services provided by Dodge & Cox has been documented in materials provided to the Board and in presentations made to the Board throughout the year. In particular, the Board considered the nature, quality and extent of portfolio management, administrative and shareholder services performed by Dodge & Cox, including: Dodge & Cox’s established long-term history of care and conscientiousness in the management of the Funds; demonstrated consistency in investment approach and depth, background and experience of the Dodge & Cox Investment Policy Committee, International Investment Policy Committee, Global Investment Policy Committee, Fixed Income Investment Policy Committee and research analysts responsible for managing the Funds; Dodge & Cox’s organizational structure; Dodge & Cox’s performance in the areas of compliance, administration and shareholder communication and services, supervision of Fund operations and general oversight of other service providers; peer group comparisons of expense ratios, management fee comparisons, expenses (e.g., transfer agent, custody and other fees and expenses) and asset comparisons and performance and risk summaries prepared independently by Morningstar® and favorable stewardship ratings and “Star” rankings by Morningstar®. The Board concluded that it was satisfied with the nature, extent and quality of investment management and other services provided to the Funds by Dodge & Cox.
INVESTMENT PERFORMANCE
The Board considered short-term and long-term investment performance for each Fund (including periods of outperformance or underperformance) as compared to both relevant indices and the performance of such Fund’s peer group. In light of recent market volatility, the Board also reviewed recent performance in the context of long-term investment goals. The Board noted that the shorter-term performance of the Funds has been disappointing. The Board considered that the performance of the Funds is the result of a team-oriented investment management process that emphasizes a long-term investment horizon, independence, comprehensive research, price discipline and focus. The Board also noted that the investment performance delivered by Dodge & Cox to the Funds appeared to be consistent with the relevant performance delivered for other (non-fund) clients of Dodge & Cox. The Board concluded that Dodge & Cox is well positioned to deliver favorable long-term performance for Fund investors consistent with the long-term investment strategies being pursued by the Funds.
COSTS AND ANCILLARY BENEFITS
Costs of Services to Funds: Fees and Expenses. The Board considered each Fund’s management fee rates and expense ratios relative to industry averages for similar mutual funds and relative to management fees charged by Dodge & Cox to other (non-fund) clients. The Board evaluated the operating structures of the Funds and Dodge & Cox, including the following: Dodge & Cox has a centralized focus on investment management operations and derives revenue solely from management fees; its outsourcing of non-advisory support services to unaffiliated third-party service providers is efficient and less costly to investors; Dodge & Cox does not charge front-end sales commissions or distribution fees and bears all third party research and distribution-related costs as well as reimbursements to third-party retirement plan administrators; the Funds receive numerous administrative, regulatory compliance, and shareholder support services from Dodge & Cox without any additional administrative fee; and the fact that the Funds have relatively low
PAGE 15 § DODGE & COX GLOBAL STOCK FUND
transaction costs and portfolio turnover rates. The Board noted that the Funds are substantially below peer group averages in expense ratios and management fee rates and that many media and industry reports specifically comment on the low expense ratios of Dodge & Cox, which along with solid long-term performance, has been a defining characteristic of Dodge & Cox for many years. The Board also noted that the range of services under the Agreements is much more extensive than under Dodge & Cox’s separate advisory (non-fund) client agreements and that many of the separate accounts were opened decades ago when fees were lower, and considered that, when coupled with the greater risks and regulatory burdens associated with the high profile mutual fund business, there is reasonable justification for differences in fee rates charged between the two lines of business. The Board concluded that costs incurred by the Funds for the services they receive (including the management fee paid to Dodge & Cox) are reasonable and that the fees are acceptable based upon the qualifications, experience, reputation and performance of Dodge & Cox and the low overall expense ratios of the Funds.
Profitability and Costs of Services to Dodge & Cox; “Fall-out” Benefits. The Board reviewed reports of Dodge & Cox’s financial position, profitability and estimated overall value, and they considered Dodge & Cox’s overall profitability within its context as a private, employee-owned S-Corporation and relative to the favorable services provided. The Board noted that net revenues for 2008 reflect a decline in assets under management compared with 2007. The Board recognized the importance of Dodge & Cox’s profitability—which is derived solely from management fees and does not include other business ventures—to maintain its independence, stability, company culture and ethics, and management continuity. The Board also considered that revenues reflect the continued success of the Funds and that such revenues are not generated by fees that are high compared to its peers. They noted that Dodge & Cox’s profitability is enhanced due to its efficient internal business model, and that the compensation/profit structure at Dodge & Cox is vital for remaining independent and facilitating retention of its management and investment professionals. The Board considered potential “fall-out” benefits (including the receipt of research from unaffiliated brokers) that
Dodge & Cox might receive in its association with the Funds. The Board also noted the extent of additional administrative services performed by Dodge & Cox for the Funds, and that the magnitude of costs and risks borne by Dodge & Cox in rendering advisory services to the Funds (including risks in the compliance, securities valuation and investment management processes) are continuing to increase. The Board concluded that the profitability of Dodge & Cox’s relationship with the Funds (including fall-out benefits) was fair and reasonable.
THE BENEFIT OF ECONOMIES OF SCALE
The Board considered whether there have been economies of scale with respect to the management of each Fund, whether the Funds have appropriately benefited from any economies of scale, and whether the management fee rate is reasonable in relation to the Fund assets and any economies of scale that may exist. In the Board’s view, any consideration of economies of scale must take account of the Funds’ low fee structure and the considerable efficiencies of the Funds’ organization and fee structure that has been realized by shareholders at the outset of their investment (i.e., from the first dollar). Shareholders also realize efficiencies from the outset of their investment due to organizational efficiencies derived from Dodge & Cox’s investment management process (e.g., low portfolio turnover) and the avoidance of distribution and marketing structures whose costs would ultimately be borne by shareholders of the Funds. The Board noted that Dodge & Cox has shared economies of scale by adding or enhancing services to the Funds over time, and that the internal costs of providing investment management, administrative and compliance services to the Funds are continuing to increase. Thus, the Funds provide access by small investors to top-rank investment management at a relatively low cost. The Board’s decision to renew the Agreements was made after consideration of economies of scale and review of comparable fund expense ratios and historical expense ratio patterns for the Funds. Their review also included consideration of the desirability of adding breakpoints to the Funds’ fee schedules. The Board concluded that the current Dodge & Cox fee structure is fair and reasonable and adequately reflects economies of scale.
DODGE & COX GLOBAL STOCK FUND §PAGE 16
CONCLUSION
Based on their evaluation of all material factors and assisted by the advice of Independent Legal Counsel to the Independent Trustees, the Board, including the Independent Trustees, concluded that the advisory fee structure was fair and reasonable, that each Fund was paying a competitive fee for the services provided, that the scope and quality of Dodge & Cox’s services has provided substantial value for Fund shareholders over the long term, and that approval of the Agreements was in the best interests of each Fund and its shareholders.
FUND HOLDINGS
The Fund provides a complete list of its holdings four times each fiscal year, as of the end of each quarter. The lists appear in the Fund’s First Quarter, Semi-Annual, Third Quarter and Annual Reports to shareholders. The Fund files the lists with the Securities and Exchange Commission (SEC) on Form N-CSR (second and fourth quarters) and Form N-Q (first and third quarters).
Shareholders may view the Fund’s Forms N-CSR and N-Q on the SEC’s website at www.sec.gov. Forms N-CSR and N-Q may also be reviewed and copied at the SEC’s Public Reference Room in Washington, DC. Information regarding the operations of the Public Reference Room may be obtained by 1-202-942-8090 (direct) or 1-800-732-0330 (general SEC number). A complete list of the Fund’s quarter-end holdings is also available at www.dodgeandcox.com on or about 15 days following each quarter end and remains available on the web site until the list is updated in the subsequent quarter.
PROXY VOTING
For a free copy of the Fund’s proxy voting policies and procedures, please call 1-800-621-3979, visit the Fund’s web site at www.dodgeandcox.com or visit the SEC’s web site at www.sec.gov. Information regarding how the Fund voted proxies relating to portfolio securities during the most recent 12-month period ending June 30 is also available at www.dodgeandcox.com or at www.sec.gov.
PAGE 17 § DODGE & COX GLOBAL STOCK FUND
THIS PAGE INTENTIONALLY LEFT BLANK
DODGE & COX GLOBAL STOCK FUND §PAGE 18
DODGE & COX FUNDS—EXECUTIVE OFFICER & TRUSTEE INFORMATION
| | | | | | |
Name (Age) and
Address* | | Position with Trust
(Year of Election or
Appointment) | | Principal Occupation During Past 5 Years | | Other Directorships Held by Trustees |
| INTERESTED TRUSTEES & OFFICERS |
John A. Gunn
(65) | | Chairman and Trustee
(Trustee since 1985) | | Chairman (since 2007), Chief Executive Officer (since 2005) and Director of Dodge & Cox, Portfolio Manager and member of Investment Policy Committee (IPC), Global Investment Policy Committee (GIPC) (since 2008), and International Investment Policy Committee (IIPC) | | — |
| Kenneth E. Olivier (56) | | President and Trustee (Trustee since 2005) | | President (since 2005) and Director of Dodge & Cox, Portfolio Manager, and member of IPC | | — |
| Dana M. Emery (47) | | Senior Vice President and Trustee (Trustee since 1993) | | Executive Vice President (since 2005) and Director of Dodge & Cox, Manager of the Fixed Income Department, Portfolio Manager, and member of Fixed Income Investment Policy Committee (FIIPC) | | — |
Charles F. Pohl (50) | | Senior Vice President
(Officer since 2004) | | Senior Vice President and Director of Dodge & Cox, Chief Investment Officer (since 2007), Director of Credit Research, Portfolio Manager, Investment Analyst, and member of IPC, GIPC (since 2008), IIPC (since 2007), and FIIPC | | — |
| Diana S. Strandberg (49) | | Senior Vice President
(Officer since 2005) | | Vice President of Dodge & Cox, Portfolio Manager, and member of IPC, GIPC (since 2008), and IIPC | | — |
| David H. Longhurst (51) | | Treasurer
(Officer since 2006) | | Vice President and Assistant Treasurer of Dodge & Cox (since 2008); Vice President, Treasurer, Controller and Secretary of Safeco Mutual Funds, Safeco Asset Management Company, Safeco Services, Safeco Securities, and Safeco Investment Services (2000-2004) | | — |
| Thomas M. Mistele (55) | | Secretary
(Officer since 2000) | | Chief Operating Officer (since 2004), Director (since 2005), Secretary, and General Counsel of Dodge & Cox | | — |
| Marcia P. Venegas (40) | | Chief Compliance Officer
(Officer since 2004) | | Associate Chief Compliance Officer of Dodge & Cox (since 2008), Chief Compliance Officer of Dodge & Cox (2005-2008), Compliance Officer of Dodge & Cox (2003-2004) | | — |
| INDEPENDENT TRUSTEES |
| William F. Ausfahl (68) | | Trustee (Since 2002) | | CFO, The Clorox Co. (1982-1997); Director, The Clorox Co. (1984-1997) | | — |
| L. Dale Crandall (67) | | Trustee (Since 1999) | | President, Kaiser Foundation Health Plan, Inc. and Kaiser Foundation Hospitals (2000-2002); Senior Vice President—Finance and Administration & CFO, Kaiser Foundation Health Plan, Inc. and Kaiser Foundation Hospitals (1998-2000) | | Director, Ansell Limited (medical equipment and supplies) (2002-Present); Director, Coventry Health Care, Inc. (managed health care) (2004-Present); Director, Metavante Technologies, Inc. (software) (2007 to present) |
| Thomas A. Larsen (59) | | Trustee (Since 2002) | | Director in Howard, Rice, Nemerovski, Canady, Falk & Rabkin (law firm) | | — |
John B. Taylor
(62) | | Trustee (Since 2005) | | Professor of Economics, Stanford University; Senior Fellow, Hoover Institution; Under Secretary for International Affairs, United States Treasury (2001-2005) | | — |
Will C. Wood (69) | | Trustee (Since 1992) | | Principal, Kentwood Associates, Financial Advisers | | Director, Banco Latinoamericano de Exportaciones S.A. (Latin American foreign trade bank) (1999-Present) |
| * | | The address for each Officer and Trustee is 555 California Street, 40th Floor, San Francisco, California 94104. Each Officer and Trustee oversees all five series in the Dodge & Cox Funds complex and serves for an indefinite term. |
Additional information about the Trust’s Trustees and Officers is available in the Trust’s Statement of Additional Information (SAI). You can get a free copy of the SAI by visiting the Fund’s website at www.dodgeandcox.com or calling 1-800-621-3979.
PAGE 19 § DODGE & COX GLOBAL STOCK FUND
| | | | |
| | | | |
www.dodgeandcox.com
For Fund literature, transactions, and account information, please visit the Funds’ web site.
or write or call:
DODGE & COX FUNDS
c/o Boston Financial Data Services
P.O. Box 8422
Boston, Massachusetts 02266-8422
(800) 621-3979
INVESTMENT MANAGER
Dodge & Cox
555 California Street, 40th Floor
San Francisco, California 94104
(415) 981-1710
This report is submitted for the general information of the shareholders of the Fund. The report is not authorized for distribution to prospective investors in the Fund unless it is accompanied by a current prospectus.
This report reflects our views, opinions, and portfolio holdings as of December 31, 2008, the end of the reporting period. Any such views are subject to change at any time based upon market or other conditions and Dodge & Cox disclaims any responsibility to update such views. These views may not be relied on as investment advice and, because investment decisions for a Dodge & Cox Fund are based on numerous factors, may not be relied on as an indication of trading intent on behalf of any Dodge & Cox Fund.
12/08 ISF AR Printed on recycled paper
Annual Report
December 31, 2008
International Stock Fund
ESTABLISHED 2001
TICKER: DODFX
TO OUR SHAREHOLDERS
The Dodge & Cox International Stock Fund had a total return of negative 46.7% for 2008, compared to a total return of negative 43.4% for the MSCI Europe, Australasia, Far East Index (MSCI EAFE). At year end, the Fund had net assets of $25.0 billion with a cash position of 2.2%. Longer-term results appear on page three.
The fourth quarter completed what turned out to be one of the worst years for global equity markets since the Great Depression, as companies and investors incorporated expectations of lower revenue and profits caused by recession. Stock markets in every region around the world suffered meaningful losses, essentially erasing MSCI EAFE gains of the past ten years. In light of these disappointing results, we thought it would be helpful for us to share with you some of the questions we’ve been asked, and our responses to them.
WHAT HAPPENED?
The financial crisis intensified throughout 2008 and manifested itself in falling consumer confidence and declining economic activity around the world. In hindsight, we clearly underestimated the worsening credit crisis, the likelihood of government interventions, and the depth and breadth of the ongoing economic problems. This was reflected in disappointing investment results in companies such as Royal Bank of Scotland, American International Group (AIG), and Infineon Technologies.
In this environment of fear and uncertainty, we saw a flight to safety and shunning of risk. For example, there has been extreme pessimism associated with companies with economic sensitivity or financing needs. Thus, the share prices of companies in the Materials, Industrials, and Information Technology sectors performed poorly in the second half of the year, while the share prices of companies in the less economically sensitive areas of the market—Telecommunication Services, Utilities, Consumer Staples (e.g., food), and Health Care—held up relatively well.
WHAT ARE YOU DOING DIFFERENTLY IN THIS INVESTMENT ENVIRONMENT?
While the returns resulting from our investment decisions were disappointing during 2008, we remain confident in the Fund’s current holdings. Over the past 78 years, our
firm has experienced periods of underperformance. We have learned from these past periods just as we are learning from this one, and are incorporating these lessons into our strategy and outlook on an ongoing basis.
For example, during this unique period of extreme volatility and limited liquidity, our equity and fixed income research analysts have reviewed, updated, and stress-tested our financial projections for each of the Fund’s holdings, paying particular attention to potential vulnerabilities to the challenging credit market. We review this work with our analysts while continually monitoring relative values across our investment universe in order to determine the best long-term opportunities on behalf of the Fund’s shareholders. As a result of this work, we trimmed or sold a handful of holdings (e.g., Qimonda).
While we have made refinements, maintaining the essence of our investment approach through previous challenging periods has been crucial to the Fund’s long-term success. That approach—constructing a diversified portfolio through in-depth, independent research, a three-to-five year investment horizon, and a focus on valuation relative to underlying fundamentals—continues to guide us through this period as well. As we learn and make adjustments, we remain confident that our enduring value-oriented approach will benefit our shareholders in the years ahead.
WHERE ARE YOU FINDING INVESTMENT OPPORTUNITIES TODAY?
In light of economic uncertainty, investors are understandably pessimistic about the earnings prospects of businesses whose earnings are economically sensitive, thus severely depressing the valuations of those companies. We continue to find opportunities among economically sensitive companies that we believe are likely to withstand the current downturn. When the global economy stabilizes, the investment returns from owning these companies may prove to be attractive.
At year end, roughly 55% of the Fund was invested in companies in industries such as Information Technology, Industrials, Energy, Materials, and Consumer Discretionary sectors, compared to 43% for the MSCI EAFE. Examples include Ericsson, a market share leader
PAGE 1 § DODGE & COX INTERNATIONAL STOCK FUND
in wireless network equipment; Schneider, the world’s leader in electricity distribution (e.g., circuit breakers) and power management; and Naspers, a pay-TV and Internet content developer with leading positions throughout sub-Saharan Africa, Brazil, Russia, and China.
A quarter of the Fund was invested in a variety of financial services firms around the world, a significant portion of which provide financial services in the developing world. Growing savings and demand for financial products provide these companies with long-term opportunities. Examples include Banorte, a leading bank in Mexico, and Standard Chartered, a bank with strong positions in Asia, Africa, and the Middle East.
The Fund’s remaining holdings were companies in sectors perceived to be less economically sensitive—Health Care, Telecommunication Services, Consumer Staples, and Utilities. The Fund had less exposure in these sectors—19% of the Fund compared to 35% for the MSCI EAFE. Within this exposure, 12% of the Fund was invested in pharmaceutical companies due to their low valuations, cost-cutting opportunities, and potential provided by their drug pipelines. An example is Novartis, which has an impressive research and development effort that could yield promising drug compounds in the future.
WHY SHOULD I CONTINUE TO INVEST IN THE FUND?
As fellow shareholders, we share in your disappointment with the Fund’s recent performance.
However, we are optimistic about the potential for long-term equity returns given the low valuations in the current market. At nine times trailing 2008 earnings, the market appears inexpensive on an absolute basis and relative to history. This low valuation reflects extreme pessimism about the growth prospects for the global economy and company earnings. A low valuation provides upside potential in the form of better-than-expected earnings and/or a higher prospective valuation. Though the timing is uncertain, we think the forces of technological innovation and free market economic principles in the developing world will allow the global economy to return to growth over our investment horizon.
Founded in 1930, our firm has weathered past financial storms and we are confident we will weather this one as well. We are independently owned by our current employees, have no debt, and have kept our employee count low. We have no need for layoffs, and in fact have continued to invest in our most important resource—people—by maintaining a pattern of hiring one or two new analysts per year. Our independence gives us the staying power to stick with our convictions and maintain our focus on the long term. Our firm’s foremost objective is to provide high quality investment management service to our clients.
IN CLOSING
We appreciate the loyalty and confidence our shareholders have displayed through this difficult period. While the Fund did experience net outflows late in the year, they were manageable and represented a small percentage of the Fund’s asset base. Our experienced investment team is working hard to take advantage of the attractive opportunities being created during this period of economic stress and volatility. Although it is impossible to predict the short-term direction of stock prices, our experience has taught us that persistence in the face of significant market dislocations can potentially be rewarding for patient investors with long-term investment horizons.
We appreciate your continued patience and confidence in our firm as a shareholder of the Dodge & Cox International Stock Fund. As always, we welcome your comments and questions.
For the Board of Trustees,
| | |
| | |
John A. Gunn, Chairman | | Diana S. Strandberg, Senior Vice President |
February 13, 2009
DODGE & COX INTERNATIONAL STOCK FUND §PAGE 2
2008 PERFORMANCE REVIEW
The Fund lagged the MSCI EAFE by 3.3 percentage points for the year.
Key Detractors from Relative Results
| | § | | Weak returns from the Fund’s holdings in the Information Technology sector (down 55% compared to down 45% for the MSCI EAFE sector) hurt performance. Infineon Technologies (down 89%), Nortel Networks (down 98%), Motorola (down 72%), Alcatel-Lucent (down 66%), and Nokia (down 59%) were weak performers. | |
| | § | | The Fund’s significantly underweight position (0% versus 8% at year end) in the Utilities sector hurt relative performance, as the sector (down 28%) was one of the better performing areas of the market. | |
| | § | | The Fund’s overweight position (4% versus 1%) in the poor-performing Construction Materials industry hurt performance. Selected detractors included Lafarge (down 66%) and Cemex (down 64%). | |
| | § | | Selected additional holdings that hurt performance included American International Group (AIG, down 96%), Royal Bank of Scotland (down 90%), Unicredit (down 70%), and Sony (down 61%). | |
Key Contributors to Relative Results
| | § | | The Fund’s overweight position in the Health Care sector (14% versus 10% at year end), an area of relative strength, contributed to results. Notable performers included Novartis (down 6%), GlaxoSmithKline (down 22%), and Sanofi-Aventis (down 29%). | |
| | § | | The Fund’s underweight position in the Metals & Mining industry (1% versus 4% for the MSCI EAFE industry at year end) positively affected performance. Metals & Mining (down 60%) was one of the poorest performing areas of the market. | |
| | § | | Selected strong performers included Epcos (up 44%), Seiko Epson (up 26%), and FEMSA (up 19%). | |
For 2008, the Fund’s active hedging of the Euro and British Pound-Sterling increased performance by 1.3 percentage points. However, U.S. Dollar appreciation had an overall negative effect on the Fund’s performance.
GROWTH OF $10,000 SINCE INCEPTION
FOR AN INVESTMENT MADE ON MAY 1, 2001
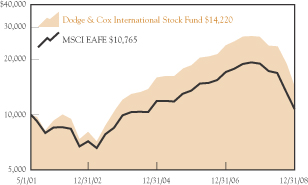
AVERAGE ANNUAL TOTAL RETURN
FOR PERIODS ENDED DECEMBER 31, 2008
| | | | | | | | | | | | |
| | | 1 Year | | | 3 Years | | | 5 Years | | | Since
Inception
(5/1/01) | |
Dodge & Cox International
Stock Fund | | –46.68 | % | | –8.65 | % | | 3.35 | % | | 4.70 | % |
MSCI EAFE | | –43.39 | | | –7.35 | | | 1.66 | | | 0.97 | |
Past performance does not guarantee future results. Investment return and share price will fluctuate with market conditions, and investors may have a gain or loss when shares are sold. Mutual fund performance changes over time and currently may be significantly lower than stated. Performance is updated and published monthly. Visit the Fund’s web site at www.dodgeandcox.com or call 1-800-621-3979 for current performance figures.
The Fund’s total returns include the reinvestment of dividend and capital gain distributions, but have not been adjusted for any income taxes payable by shareholders on these distributions. The MSCI EAFE Index is an unmanaged index of the world’s stock markets, excluding the United States. Index returns include dividends and/or interest income but, unlike Fund returns, do not reflect fees or expenses.
MSCI EAFE® is a trademark of MSCI Barra.
Risks of international investing: Foreign investing, especially in developing countries, has special risks such as currency and market volatility and political and social instability. These and other risk considerations are discussed in the Fund’s prospectus.
PAGE 3 § DODGE & COX INTERNATIONAL STOCK FUND
FUND EXPENSE EXAMPLE
As a Fund shareholder, you incur ongoing Fund costs, including management fees and other Fund expenses. All mutual funds have ongoing costs, sometimes referred to as operating expenses. The following example shows ongoing costs of investing in the Fund and can help you understand these costs and compare them with those of other mutual funds. The example assumes a $1,000 investment held for the six months indicated.
ACTUAL EXPENSES
The first line of the table below provides information about actual account values and expenses based on the Fund’s actual returns. You may use the information in this line, together with your account balance, to estimate the expenses that you paid over the period. Simply divide your account value by $1,000 (for example, an $8,600 account value divided by $1,000 = 8.6), then multiply the result by the number in the first line under the heading “Expenses Paid During Period” to estimate the expenses you paid on your account during this period.
HYPOTHETICAL EXAMPLE FOR COMPARISON WITH OTHER MUTUAL FUNDS
Information on the second line of the table can help you compare ongoing costs of investing in the Fund with those of other mutual funds. This information may not be used to estimate the actual ending account balance or expenses you paid during the period. The hypothetical “Ending Account Value” is based on the actual expense ratio of the Fund and an assumed 5% annual rate of return before expenses (not the Fund’s actual return). The amount under the heading “Expense Paid During the Period” shows the hypothetical expenses your account would have incurred under this scenario. You can compare this figure with the 5% hypothetical examples that appear in shareholder reports of other mutual funds.
| | | | | | | | | |
Six Months Ended December 31, 2008 | | Beginning Account Value
7/1/2008 | | Ending Account Value
12/31/2008 | | Expenses Paid During Period* |
Based on Actual Fund Return | | $ | 1,000.00 | | $ | 602.70 | | $ | 2.54 |
Based on Hypothetical 5% Yearly Return | | | 1,000.00 | | | 1,021.97 | | | 3.20 |
| * | | Expenses are equal to the Fund’s annualized expense ratio of 0.63%, multiplied by the average account value over the period, multiplied by 184/366 (to reflect the one-half year period). |
The expenses shown in the table highlight ongoing costs only and do not reflect any transactional fees or account maintenance fees. While other mutual funds may charge such fees, please note that the Fund does not charge transaction fees (e.g., redemption fees, sales loads) or universal account maintenance fees (e.g., small account fees).
DODGE & COX INTERNATIONAL STOCK §PAGE 4
| | |
| FUND INFORMATION | | December 31, 2008 |
| | |
| GENERAL INFORMATION | | |
Net Asset Value Per Share | | $21.90 |
Total Net Assets (billions) | | $25.0 |
2008 Expense Ratio | | 0.64% |
2008 Portfolio Turnover Rate | | 35% |
30-Day SEC Yield(a) | | 3.68% |
Fund Inception | | 2001 |
No sales charges or distribution fees | | |
Investment Manager: Dodge & Cox, San Francisco. Managed by the International Investment Policy Committee, whose nine members’ average tenure at Dodge & Cox is 19 years.
| | | | |
| PORTFOLIO CHARACTERISTICS | | Fund | | MSCI
EAFE |
Number of Stocks | | 90 | | 989 |
Median Market Capitalization (billions) | | $9 | | $4 |
Weighted Average Market
Capitalization (billions) | | $38 | | $42 |
Price-to-Earnings Ratio(b) | | 9.3x | | 9.8x |
Countries Represented | | 26 | | 21 |
Emerging Markets (Brazil, India, Indonesia, Israel, Mexico, Russia, South Africa, South Korea, Thailand, Turkey) | | 20.4% | | 0.0% |
| | | |
| TEN LARGEST HOLDINGS(c) | | Fund | |
Novartis AG (Switzerland) | | 4.3 | % |
Sanofi-Aventis (France) | | 2.9 | |
GlaxoSmithKline PLC (United Kingdom) | | 2.7 | |
Naspers, Ltd. (South Africa) | | 2.7 | |
Kyocera Corp. (Japan) | | 2.6 | |
Schneider Electric SA (France) | | 2.6 | |
Standard Bank Group, Ltd. (South Africa) | | 2.5 | |
Bayer AG (Germany) | | 2.3 | |
Telefonica SA (Spain) | | 2.3 | |
Lafarge SA (France) | | 2.2 | |
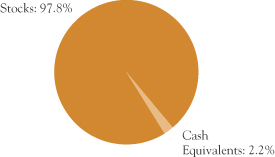
| | | | | | |
| REGION DIVERSIFICATION | | Fund | | | MSCI
EAFE | |
Europe (excluding United Kingdom) | | 43.9 | % | | 47.8 | % |
Japan | | 19.6 | | | 25.3 | |
United Kingdom | | 10.7 | | | 17.8 | |
Pacific (excluding Japan) | | 6.3 | | | 9.1 | |
Latin America | | 6.2 | | | 0.0 | |
Africa | | 5.8 | | | 0.0 | |
United States | | 5.1 | | | 0.0 | |
Middle East | | 0.2 | | | 0.0 | |
Canada | | 0.0 | (d) | | 0.0 | |
| | | | | | |
| SECTOR DIVERSIFICATION | | Fund | | | MSCI
EAFE | |
Financials | | 24.5 | % | | 22.6 | % |
Consumer Discretionary | | 16.6 | | | 9.6 | |
Health Care | | 13.6 | | | 9.8 | |
Information Technology | | 13.0 | | | 5.1 | |
Energy | | 9.2 | | | 8.5 | |
Industrials | | 8.3 | | | 11.6 | |
Materials | | 7.4 | | | 7.8 | |
Telecommunication Services | | 3.5 | | | 7.0 | |
Consumer Staples | | 1.7 | | | 10.3 | |
Utilities | | 0.0 | | | 7.7 | |
(a) | SEC yield is an annualization of the Fund’s total net investment income per share for the 30-day period ended on the last day of the month. |
(b) | Price-to-earnings (P/E) ratios are calculated using 12-month forward earnings estimates. |
(c) | The Fund’s portfolio holdings are subject to change without notice. The mention of specific securities is not a recommendation or solicitation for any person to buy, sell or hold any particular security. |
PAGE 5 § DODGE & COX INTERNATIONAL STOCK FUND
| | |
| PORTFOLIO OF INVESTMENTS | | December 31, 2008 |
| | | | | |
| COMMON STOCKS: 95.5% | | | | |
| | |
| | | SHARES | | VALUE |
| CONSUMER DISCRETIONARY: 15.6% | | | |
AUTOMOBILES & COMPONENTS: 3.6% | | | |
Bayerische Motoren Werke AG (Germany) | | 6,221,100 | | $ | 191,229,400 |
Honda Motor Co., Ltd. ADR(b) (Japan) | | 15,528,400 | | | 331,376,056 |
NGK Spark Plug Co., Ltd.(c) (Japan) | | 17,500,000 | | | 140,250,321 |
Yamaha Motor Co., Ltd.(c) (Japan) | | 23,253,000 | | | 243,995,256 |
| | | | | |
| | | | | 906,851,033 |
CONSUMER DURABLES & APPAREL: 3.9% | | | |
Consorcio Ara SAB de CV(c) (Mexico) | | 113,420,000 | | | 42,997,798 |
Corporacion Geo SAB de CV, Series B(a),(c) (Mexico) | | 47,605,400 | | | 53,626,331 |
Panasonic Corp. (Japan) | | 29,743,072 | | | 372,691,590 |
Sony Corp. (Japan) | | 21,337,600 | | | 463,858,469 |
Thomson(a),(c) (France) | | 25,015,792 | | | 33,830,098 |
| | | | | |
| | | | | 967,004,286 |
CONSUMER SERVICES: 0.9% | | | | | |
Accor SA (France) | | 4,500,000 | | | 221,444,113 |
| | |
MEDIA: 7.0% | | | | | |
Grupo Televisa SA ADR(b),(c) (Mexico) | | 32,779,396 | | | 489,724,176 |
Liberty Global, Inc., Series A(a) (United States) | | 2,701,805 | | | 43,012,736 |
Liberty Global, Inc., Series C(a) (United States) | | 4,534,971 | | | 68,840,860 |
Naspers, Ltd.(c) (South Africa) | | 37,040,895 | | | 673,294,211 |
News Corp., Class A (United States) | | 41,644,892 | | | 378,552,068 |
Television Broadcasts, Ltd.(c)
(Hong Kong) | | 27,299,300 | | | 89,441,675 |
| | | | | |
| | | | | 1,742,865,726 |
RETAILING: 0.2% | | | | | |
Li & Fung, Ltd. (Hong Kong) | | 32,198,000 | | | 55,551,758 |
| | | | | |
| | | | | 3,893,716,916 |
| CONSUMER STAPLES: 1.4% | | | |
FOOD, BEVERAGE & TOBACCO: 1.2% | | | |
Anadolu Efes Biracilik ve Malt Sanayii AS(c) (Turkey) | | 29,464,582 | | | 197,230,758 |
Tiger Brands, Ltd. (South Africa) | | 7,072,043 | | | 110,087,109 |
| | | | | |
| | | | | 307,317,867 |
HOUSEHOLD & PERSONAL PRODUCTS: 0.2% | | | |
Aderans Holdings Co., Ltd.(c) (Japan) | | 4,037,000 | | | 42,298,794 |
| | | | | |
| | | | | 349,616,661 |
| | | | | |
| | | | | |
| | |
| | | SHARES | | VALUE |
| ENERGY: 8.2% | | | | | |
OAO Lukoil ADR(b) (Russia) | | 11,226,500 | | $ | 363,999,661 |
Royal Dutch Shell PLC ADR(b) (United Kingdom) | | 10,068,400 | | | 533,021,096 |
Schlumberger, Ltd. (United States) | | 11,600,396 | | | 491,044,763 |
StatoilHydro ASA ADR(b) (Norway) | | 9,759,989 | | | 162,601,417 |
Total SA (France) | | 8,982,000 | | | 489,677,708 |
| | | | | |
| | | | | 2,040,344,645 |
| FINANCIALS: 24.5% | | | | | |
BANKS: 16.0% | | | | | |
Bangkok Bank PCL Foreign (Thailand) | | 38,571,900 | | | 79,015,289 |
Bangkok Bank PCL NVDR (Thailand) | | 5,075,000 | | | 10,319,661 |
Grupo Financiero Banorte SAB de CV (Mexico) | | 54,228,000 | | | 97,895,079 |
HSBC Holdings PLC
(United Kingdom) | | 55,836,800 | | | 534,426,681 |
ICICI Bank, Ltd. (India) | | 15,195,668 | | | 141,791,744 |
ICICI Bank, Ltd. ADR(b) (India) | | 4,300,000 | | | 82,775,000 |
Kasikornbank PCL Foreign (Thailand) | | 108,446,527 | | | 143,404,458 |
Mitsubishi UFJ Financial Group (Japan) | | 42,299,900 | | | 262,467,638 |
Royal Bank of Scotland Group PLC(a)
(United Kingdom) | | 344,885,647 | | | 249,321,127 |
Shinhan Financial Group Co., Ltd. ADR(b)
(South Korea) | | 4,628,664 | | | 218,287,794 |
Standard Bank Group, Ltd.
(South Africa) | | 69,320,397 | | | 628,038,433 |
Standard Chartered PLC
(United Kingdom) | | 36,811,923 | | | 470,578,310 |
The Bank of Yokohama, Ltd.(c) (Japan) | | 70,029,000 | | | 414,230,556 |
Unicredit SPA (Italy) | | 188,900,800 | | | 470,277,256 |
Yapi ve Kredi Bankasi AS(a) (Turkey) | | 148,779,068 | | | 204,089,409 |
| | | | | |
| | | | | 4,006,918,435 |
DIVERSIFIED FINANCIALS: 3.0% | | | | | |
Credit Suisse Group AG (Switzerland) | | 20,205,000 | | | 553,803,740 |
Haci Omer Sabanci Holding AS (Turkey) | | 84,838,651 | | | 193,719,317 |
| | | | | |
| | | | | 747,523,057 |
INSURANCE: 4.2% | | | | | |
AEGON NV (Netherlands) | | 42,517,075 | | | 271,321,785 |
American International Group, Inc.(a)
(United States) | | 37,833,000 | | | 59,397,810 |
Swiss Life Holding (Switzerland) | | 1,525,796 | | | 105,841,036 |
Swiss Reinsurance Co. (Switzerland) | | 10,565,795 | | | 513,300,427 |
Tokio Marine Holdings, Inc. (Japan) | | 3,401,500 | | | 99,671,520 |
| | | | | |
| | | | | 1,049,532,578 |
| | |
| See accompanying Notes to Financial Statements | | DODGE & COX INTERNATIONAL STOCK FUND §PAGE 6 |
| | |
| PORTFOLIO OF INVESTMENTS | | December 31, 2008 |
| | | | | |
| COMMON STOCKS (continued) | | |
| | |
| | | SHARES | | VALUE |
REAL ESTATE: 1.3% | | | | | |
Hang Lung Group, Ltd. (Hong Kong) | | 51,796,500 | | $ | 158,097,057 |
Hang Lung Properties, Ltd.
(Hong Kong) | | 76,679,000 | | | 168,202,721 |
| | | | | |
| | | | | 326,299,778 |
| | | | | |
| | | | | 6,130,273,848 |
| HEALTH CARE: 13.6% | | | | | |
HEALTH CARE EQUIPMENT & SERVICES: 1.0% |
Mediceo Paltac Holdings Co., Ltd.(c)
(Japan) | | 19,438,000 | | | 234,252,293 |
|
PHARMACEUTICALS, BIOTECHNOLOGY & LIFE SCIENCES: 12.6% |
Adcock Ingram Holdings, Ltd.(a)
(South Africa) | | 7,047,217 | | | 29,799,593 |
Bayer AG (Germany) | | 9,817,000 | | | 576,697,287 |
Cipla, Ltd. (India) | | 18,365,421 | | | 70,948,247 |
GlaxoSmithKline PLC ADR(b)
(United Kingdom) | | 18,071,600 | | | 673,528,532 |
Novartis AG ADR(b) (Switzerland) | | 21,850,000 | | | 1,087,256,000 |
Sanofi-Aventis (France) | | 11,325,500 | | | 719,326,593 |
| | | | | |
| | | | | 3,157,556,252 |
| | | | | |
| | | | | 3,391,808,545 |
| INDUSTRIALS: 8.3% | | | | | |
CAPITAL GOODS: 7.7% | | | | | |
Koninklijke Philips Electronics NV (Netherlands) | | 20,685,000 | | | 402,302,101 |
Mitsubishi Electric Corp. (Japan) | | 38,750,000 | | | 242,485,912 |
Nexans SA (France) | | 932,619 | | | 55,700,824 |
Schneider Electric SA (France) | | 8,619,833 | | | 643,870,165 |
Toto, Ltd.(c) (Japan) | | 28,511,000 | | | 178,847,844 |
Volvo AB (Sweden) | | 42,607,200 | | | 235,423,246 |
Wienerberger AG(c) (Austria) | | 9,397,376 | | | 156,936,828 |
| | | | | |
| | | | | 1,915,566,920 |
TRANSPORTATION: 0.6% | | | | | |
TNT NV (Netherlands) | | 8,034,410 | | | 154,310,529 |
| | | | | |
| | | | | 2,069,877,449 |
| | | | | |
| | | |
| | |
| | | SHARES | | VALUE |
| INFORMATION TECHNOLOGY: 13.0% | | | |
SEMICONDUCTORS & SEMICONDUCTOR EQUIPMENT: 0.5% |
Chartered Semiconductor Manufacturing, Ltd.(a),(c) (Singapore) | | 200,000,000 | | $ | 25,194,933 |
Infineon Technologies AG(a),(c)
(Germany) | | 84,902,800 | | | 116,861,892 |
| | | | | |
| | | | | 142,056,825 |
|
TECHNOLOGY, HARDWARE & EQUIPMENT: 12.5% |
Alcatel-Lucent(a) (France) | | 94,519,072 | | | 204,087,246 |
Brother Industries, Ltd.(c) (Japan) | | 23,601,000 | | | 140,792,188 |
Fujifilm Holdings Corp. (Japan) | | 22,736,100 | | | 500,375,186 |
Fujitsu, Ltd. (Japan) | | 41,981,000 | | | 202,913,681 |
Hirose Electric Co., Ltd. (Japan) | | 1,112,700 | | | 112,339,431 |
Hitachi, Ltd. (Japan) | | 26,658,000 | | | 103,382,407 |
Kyocera Corp.(c) (Japan) | | 9,203,900 | | | 663,968,964 |
Motorola, Inc. (United States) | | 52,141,458 | | | 230,986,659 |
Murata Manufacturing Co., Ltd. (Japan) | | 3,951,000 | | | 154,878,575 |
Nokia Oyj (Finland) | | 32,392,500 | | | 502,178,600 |
Nortel Networks Corp.(a),(b),(c)
(Canada) | | 14,884,002 | | | 3,869,840 |
Telefonaktiebologet LM Ericsson (Sweden) | | 39,643,100 | | | 304,043,059 |
| | | | | |
| | | | | 3,123,815,836 |
| | | | | |
| | | | | 3,265,872,661 |
| MATERIALS: 7.4% | | | | | |
Akzo Nobel NV (Netherlands) | | 4,876,290 | | | 201,085,214 |
Arkema(c) (France) | | 6,626,740 | | | 113,881,533 |
BHP Billiton PLC (United Kingdom) | | 12,106,000 | | | 228,039,252 |
Cemex SAB de CV ADR(b) (Mexico) | | 31,832,579 | | | 290,949,772 |
Lafarge SA(a) (France) | | 9,120,225 | | | 554,514,038 |
Lanxess AG(c) (Germany) | | 8,912,359 | | | 173,379,407 |
Norsk Hydro ASA (Norway) | | 32,634,600 | | | 131,798,776 |
Norsk Hydro ASA ADR(b) (Norway) | | 24,717,700 | | | 100,848,216 |
Siam Cement PCL Foreign (Thailand) | | 10,725,400 | | | 34,088,434 |
Siam Cement PCL NVDR (Thailand) | | 9,110,000 | | | 27,350,377 |
| | | | | |
| | | | | 1,855,935,019 |
| TELECOMMUNICATION SERVICES: 3.5% |
Bezeq Israeli Telecommunication Corp., Ltd. (Israel) | | 36,575,685 | | | 60,110,294 |
Telefonica SA ADR(b) (Spain) | | 8,442,400 | | | 568,933,336 |
Telekomunik Indonesia ADR(b) (Indonesia) | | 10,353,047 | | | 259,550,888 |
| | | | | |
| | | | | 888,594,518 |
TOTAL COMMON STOCKS
(Cost $42,257,566,441) | | $ | 23,886,040,262 |
| | |
| PAGE 7 § DODGE & COX INTERNATIONAL STOCK FUND | | See accompanying Notes to Financial Statements |
| | |
| PORTFOLIO OF INVESTMENTS | | December 31, 2008 |
| | | | | |
| PREFERRED STOCKS: 2.3% | | |
| | |
| | | SHARES | | VALUE |
| CONSUMER DISCRETIONARY: 1.0% |
MEDIA: 0.5% | | | | | |
Net Servicos de Comunicacao SA ADR(b) (Brazil) | | 20,753,640 | | $ | 120,786,185 |
| | |
RETAILING: 0.5% | | | | | |
Ultrapar Participacoes SA ADR(b)
(Brazil) | | 6,100,052 | | | 137,190,169 |
| | | | | |
| | | | | 257,976,354 |
| CONSUMER STAPLES: 0.3% | | | |
FOOD & STAPLES RETAILING: 0.3% | | | |
Sadia SA ADR(b) (Brazil) | | 16,466,401 | | | 80,685,365 |
| | |
| ENERGY: 1.0% | | | | | |
Petroleo Brasileiro SA ADR(b) (Brazil) | | 12,191,800 | | | 248,834,638 |
| | | | | |
TOTAL PREFERRED STOCKS
(Cost $600,989,524) | | $ | 587,496,357 |
| | | | | | | |
| SHORT-TERM INVESTMENTS: 1.9% | | | |
| | |
| | | PAR VALUE | | | VALUE |
MONEY MARKET FUND: 0.3% | | | | |
SSgA Prime Money Market Fund | | $ | 74,902,149 | | | $ | 74,902,149 |
| |
REPURCHASE AGREEMENT: 1.6% | | | | |
Fixed Income Clearing Corporation(d)
0.01%, 1/2/09,
maturity value $388,424,216 | | | 388,424,000 | | | | 388,424,000 |
| | | | | | | |
TOTAL SHORT-TERM INVESTMENTS
(Cost $463,326,149) | | | $ | 463,326,149 |
| | | | | | | |
TOTAL INVESTMENTS
(Cost $43,321,882,114) | | | 99.7 | % | | $ | 24,936,862,768 |
OTHER ASSETS LESS LIABILITIES | | | 0.3 | % | | | 83,499,691 |
| | | | | | | |
| NET ASSETS | | | 100.0 | % | | $ | 25,020,362,459 |
| | | | | | | |
(b) | Security issued by a foreign entity, denominated in U.S. dollars |
(c) | See Note 8 regarding holdings of 5% voting securities |
(d) | Repurchase agreement is collateralized by Fannie Mae 6.625%, 09/15/09; and Freddie Mac, 2.68%-6.625%, 9/15/09-11/16/09. Total collateral value is $396,194,488. |
ADR: American Depositary Receipt
NVDR: Non Voting Depositary Receipt
| | |
| See accompanying Notes to Financial Statements | | DODGE & COX INTERNATIONAL STOCK FUND §PAGE 8 |
| | | | |
STATEMENT OF ASSETS AND LIABILITIES | |
| |
| | | December 31, 2008 | |
ASSETS: | | | | |
Investments, at value | | | | |
Unaffiliated issuers (cost $35,332,450,747) | | $ | 20,821,281,838 | |
Affiliated issuers (cost $7,989,431,367) | | | 4,115,580,930 | |
| | | | |
| | | 24,936,862,768 | |
Cash denominated in foreign currency (cost $6,257,784) | | | 6,152,303 | |
Receivable for investments sold | | | 61,769,434 | |
Receivable for Fund shares sold | | | 37,743,422 | |
Dividends and interest receivable | | | 65,968,213 | |
Prepaid expenses and other assets | | | 277,640 | |
| | | | |
| | | 25,108,773,780 | |
| | | | |
LIABILITIES: | | | | |
Payable for investments purchased | | | 2,797,608 | |
Payable for Fund shares redeemed | | | 69,917,878 | |
Management fees payable | | | 12,126,452 | |
Accrued expenses | | | 3,569,383 | |
| | | | |
| | | 88,411,321 | |
| | | | |
NET ASSETS | | $ | 25,020,362,459 | |
| | | | |
NET ASSETS CONSIST OF: | | | | |
Paid in capital | | $ | 45,258,449,686 | |
Undistributed net investment income | | | 38,173,342 | |
Accumulated net realized loss on investments | | | (1,890,720,976 | ) |
Net unrealized depreciation on investments | | | (18,385,539,593 | ) |
| | | | |
| | $ | 25,020,362,459 | |
| | | | |
Fund shares outstanding (par value $0.01 each, unlimited shares authorized) | | | 1,142,321,072 | |
Net asset value per share | | | $21.90 | |
|
STATEMENT OF OPERATIONS | |
| | | Year Ended
December 31, 2008 | |
INVESTMENT INCOME: | | | | |
Dividends (net of foreign taxes of $128,013,623) | | | | |
Unaffiliated issuers | | $ | 1,133,852,872 | |
Affiliated issuers | | | 156,396,875 | |
Interest | | | 23,172,872 | |
| | | | |
| | | 1,313,422,619 | |
| | | | |
EXPENSES: | | | | |
Management fees | | | 261,127,897 | |
Custody and fund accounting fees | | | 4,812,402 | |
Transfer agent fees | | | 8,839,716 | |
Professional services | | | 318,375 | |
Shareholder reports | | | 2,417,318 | |
Registration fees | | | 595,080 | |
Trustees’ fees | | | 151,187 | |
Miscellaneous | | | 2,079,714 | |
| | | | |
| | | 280,341,689 | |
| | | | |
NET INVESTMENT INCOME | | | 1,033,080,930 | |
| | | | |
REALIZED AND UNREALIZED GAIN (LOSS) ON INVESTMENTS: | | | | |
Net realized gain (loss) (net of foreign taxes of $12,199,029) | | | | |
Investments in unaffiliated issuers | | | (1,422,972,085 | ) |
Investments in affiliated issuers | | | (675,056,279 | ) |
Foreign currency transactions | | | 474,204,790 | |
Net change in unrealized appreciation/depreciation | | | | |
Investments (including net decrease in accrued foreign capital gain tax of $19,397,490) | | | (24,748,651,538 | ) |
Foreign currency transactions | | | 899,104 | |
| | | | |
Net realized and unrealized loss | | | (26,371,576,008 | ) |
| | | | |
NET DECREASE IN NET ASSETS
FROM OPERATIONS | | $ | (25,338,495,078 | ) |
| | | | |
| | | | | | | | |
STATEMENT OF CHANGES IN NET ASSETS | |
| | | Year Ended
December 31, 2008 | | | Year Ended
December 31, 2007 | |
OPERATIONS: | | | | | | | | |
Net investment income | | $ | 1,033,080,930 | | | $ | 1,384,768,817 | |
Net realized gain/(loss) | | | (1,623,823,574 | ) | | | 2,820,238,090 | |
Net change in unrealized appreciation/depreciation | | | (24,747,752,434 | ) | | | 79,449,130 | |
| | | | | | | | |
Net increase/(decrease) in net assets from operations | | | (25,338,495,078 | ) | | | 4,284,456,037 | |
| | | | | | | | |
| |
DISTRIBUTIONS TO
SHAREHOLDERS FROM: | | | | | |
Net investment income | | | (998,288,562 | ) | | | (1,391,722,039 | ) |
Net realized gain | | | (1,634,354,213 | ) | | | (1,652,535,550 | ) |
| | | | | | | | |
Total distributions | | | (2,632,642,775 | ) | | | (3,044,257,589 | ) |
| | | | | | | | |
| | |
FUND SHARE TRANSACTIONS: | | | | | | | | |
Proceeds from sale of shares | | | 11,196,443,003 | | | | 24,577,625,079 | |
Reinvestment of distributions | | | 2,367,976,717 | | | | 2,689,702,196 | |
Cost of shares redeemed | | | (14,051,916,960 | ) | | | (5,927,865,794 | ) |
| | | | | | | | |
Net increase/(decrease) from Fund share transactions | | | (487,497,240 | ) | | | 21,339,461,481 | |
| | | | | | | | |
Total increase/(decrease) in net assets | | | (28,458,635,093 | ) | | | 22,579,659,929 | |
| | |
NET ASSETS: | | | | | | | | |
Beginning of year | | | 53,478,997,552 | | | | 30,899,337,623 | |
| | | | | | | | |
End of year (including undistributed net investment income of $38,173,342 and $3,380,974, respectively) | | $ | 25,020,362,459 | | | $ | 53,478,997,552 | |
| | | | | | | | |
| |
SHARE INFORMATION: | | | | | |
Shares sold | | | 301,746,094 | | | | 521,338,937 | |
Distributions reinvested | | | 112,975,990 | | | | 58,269,105 | |
Shares redeemed | | | (434,440,065 | ) | | | (125,349,160 | ) |
| | | | | | | | |
Net increase/(decrease) in shares outstanding | | | (19,717,981 | ) | | | 454,258,882 | |
| | | | | | | | |
| | |
| PAGE 9 § DODGE & COX INTERNATIONAL STOCK FUND | | See accompanying Notes to Financial Statements |
NOTES TO FINANCIAL STATEMENTS
NOTE 1—ORGANIZATION AND SIGNIFICANT ACCOUNTING POLICIES
Dodge & Cox International Stock Fund (the “Fund”) is one of the series constituting the Dodge & Cox Funds (the “Trust” or the “Funds”). The Trust is organized as a Delaware statutory trust and is registered under the Investment Company Act of 1940, as amended, as a diversified, open-end management investment company. The Fund commenced operations on May 1, 2001, and seeks long-term growth of principal and income, and the Fund invests primarily in a diversified portfolio of foreign stocks. Foreign investing, especially in developing countries, has special risks such as currency and market volatility and political and social instability. These and other risk considerations are discussed in the Fund’s Prospectus.
The financial statements have been prepared in conformity with accounting principles generally accepted in the United States of America, which require the use of estimates and assumptions by management. Significant accounting policies are as follows:
Security valuation The Fund’s net assets are valued as of the close of trading on the New York Stock Exchange (NYSE), generally 4:00 p.m. Eastern Time, each day that the NYSE is open for business. Listed securities are valued at market, using the official quoted close price or the last sale on the date of determination on the principal exchange on which such securities are traded or, if not available, at the mean between the exchange listed bid and ask prices for the day. A security that is listed or traded on more than one exchange is valued at the quotation on the exchange determined to be the primary market for such security. Security values are not discounted based on the size of the Fund’s position. Short-term securities are valued at amortized cost which approximates current value.
Investments initially valued in currencies other than the U.S. dollar are converted to the U.S. dollar using prevailing exchange rates. As a result, the Fund’s net asset value (NAV) may be affected by changes in the value of currencies in relation to the U.S. dollar.
If market quotations are not readily available or if a security’s value has materially changed after the close of
the security’s primary market but before the close of trading on the NYSE, the security is valued at fair value as determined in good faith by or at the direction of the Board of Trustees. The Fund may use fair value pricing in calculating its NAV when, for example, (i) the primary market for a security is closed or if trading of a security is suspended or limited, (ii) the Fund determines that the price provided by a pricing service is inaccurate or unreliable, or (iii) the Fund determines that a significant event affecting the value of a security has occurred before the close of the NYSE but after the close of the security’s primary market. An event is considered significant if there is both an affirmative expectation that the security’s value will change in response to the event and a reasonable basis for quantifying a resulting change in value. For securities that do not trade during NYSE hours, fair value determinations are based on analyses of market movements after the close of those securities’ primary markets, and include reviews of developments in foreign markets, the performance of U.S. securities markets, and the performance of instruments trading in U.S. markets that represent foreign securities and baskets of foreign securities. Pricing services are used to obtain closing market prices and to compute certain fair value adjustments utilizing computerized pricing models. When fair value pricing is employed, the prices of securities used by the Fund to calculate its net asset value may differ from quoted or published prices for the same securities. In addition, fair values may not reflect the price that the Fund could obtain for a security if it were to dispose of that security at the time of pricing.
Security transactions, investment income, expenses, and distributions Security transactions are recorded on the trade date. Realized gains and losses on securities sold are determined on the basis of identified cost.
Dividend income and corporate action transactions are recorded on the ex-dividend date, except for certain dividends or corporate actions from foreign securities where the ex-dividend date may have passed, which are recorded as soon as the Fund is informed of the ex-dividend date. Withholding taxes on foreign dividends
DODGE & COX INTERNATIONAL STOCK FUND §PAGE 10
NOTES TO FINANCIAL STATEMENTS
have been provided for in accordance with the Fund’s understanding of the applicable country’s tax rules and rates. Non-cash dividends included in dividend income, if any, are recorded at the fair market value of the securities received. Distributions received in excess of income are recorded as a reduction of cost of investments and/or realized gain. Interest income is recorded on the accrual basis.
Expenses are recorded on the accrual basis. Most expenses of the Trust can be directly attributed to a specific series. Expenses which cannot be directly attributed are allocated among the Funds in the Trust.
Distributions to shareholders are recorded on the ex-dividend date.
Repurchase agreements The Fund may enter into repurchase agreements, secured by U.S. government or agency securities, which involve the purchase of securities from a counterparty with a simultaneous commitment to resell the securities at an agreed-upon date and price. It is the Fund’s policy that its custodian take possession of the underlying collateral securities, the fair value of which exceeds the principal amount of the repurchase transaction, including accrued interest, at all times. In the event of default by the counterparty, the Fund has the contractual right to liquidate the collateral securities and to apply the proceeds in satisfaction of the obligation.
Foreign currency The Fund may use foreign currency contracts to hedge portfolio positions and facilitate security transactions in foreign currency-denominated securities. Losses from these transactions may arise from unfavorable changes in currency values or if the counterparties do not perform under the contracts’ terms.
Foreign currency-denominated assets (including investment securities) and liabilities are translated into U.S. dollars each business day at the prevailing exchange rate. Purchases and sales of securities, income receipts, and expenses denominated in foreign currencies are translated into U.S. dollars at the exchange rate in effect on the transaction date.
Net realized gains and losses on foreign currency transactions arise from sales of foreign currencies and from changes in currency values between the date recorded and the related settlement/cash payment on securities transactions, dividends, and foreign currency contracts.
The effects of currency rate changes on investment securities are included with realized and unrealized gain (loss) on investments.
NOTE 2—VALUATION MEASUREMENTS
Various inputs are used in determining the value of the Fund’s investments and other financial instruments. These inputs are summarized in the three broad levels listed below.
| § | | Level 1: Quoted prices in active markets for identical securities |
| § | | Level 2: Other significant observable inputs (including quoted prices for similar securities, market indices, interest rates, credit risk, etc.) |
| § | | Level 3: Significant unobservable inputs (including the Fund’s own assumptions in determining the fair value of investments) |
The inputs or methodology used for valuing securities are not necessarily an indication of the risk associated with investing in those securities.
The following is a summary of the inputs used to value the Fund’s net assets as of December 31, 2008:
| | | |
| Valuation Inputs | | Investments
in Securities |
Level 1: Quoted Prices | | $ | 6,931,474,733 |
Level 2: Other Significant Observable Inputs | | | 18,005,388,035 |
Level 3: Significant Unobservable Inputs | | | — |
| | | |
Total | | $ | 24,936,862,768 |
| | | |
NOTE 3—RELATED PARTY TRANSACTIONS
Management fees Under a written agreement approved by a unanimous vote of the Board of Trustees, the Fund pays an annual management fee of 0.60% of the Fund’s average daily net assets to Dodge & Cox, investment manager of the Fund.
Fund officers and trustees All officers and three of the trustees of the Trust are officers or employees of Dodge & Cox. The Trust pays a fee only to those trustees who are not affiliated with Dodge & Cox.
Indemnification Under the Trust’s organizational documents, its officers and trustees are indemnified against certain liabilities arising out of the performance of
PAGE 11 § DODGE & COX INTERNATIONAL STOCK FUND
NOTES TO FINANCIAL STATEMENTS
their duties to the Trust. In addition, in the normal course of business the Trust enters into contracts that provide general indemnities to other parties. The Trust’s maximum exposure under these arrangements is unknown as this would involve future claims that may be made against the Trust that have not yet occurred.
NOTE 4—INCOME TAX INFORMATION AND DISTRIBUTIONS TO SHAREHOLDERS
A provision for federal income taxes is not required since the Fund intends to continue to qualify as a regulated investment company under Subchapter M of the Internal Revenue Code and distribute all of its taxable income to shareholders. Distributions are determined in accordance with income tax regulations, which may differ from net investment income and realized gains for financial reporting purposes. Financial reporting records are adjusted for permanent book/tax differences to reflect tax character.
Certain foreign countries impose a tax on capital gains which is accrued by the Fund based on unrealized appreciation, if any, on affected securities. The tax is paid when a gain is realized on the sale of affected securities.
Book/tax differences are primarily due to differing treatments of wash sales, net short-term realized gain (loss) on investments, and foreign currency realized gain/(loss). At December 31, 2008, the cost of investments for federal income tax purposes was $43,405,140,272.
Distributions for the years ended December 31, 2008 and 2007 were characterized as follows for federal income tax purpose.
| | | | |
| | | Year Ended
December 31, 2008 | | Year Ended
December 31, 2007 |
Ordinary income | | $1,043,595,329 | | $1,767,337,129 |
| | ($1.000 per share) | | ($1.603 per share) |
| | |
Long-term capital gain | | $1,589,047,446 | | $1,276,920,460 |
| | ($1.522 per share) | | ($1.158 per share) |
At December 31, 2008, the tax basis components of distributable earnings were as follows:
| | | | |
Unrealized appreciation | | $ | 398,396,487 | |
Unrealized depreciation | | | (18,867,194,239 | ) |
| | | | |
Net unrealized depreciation | | | (18,468,797,752 | ) |
Undistributed ordinary income | | | 38,173,342 | |
Deferred loss** | | | (1,807,462,817 | ) |
| ** | Represents net realized loss incurred between November 1, 2008 and December 31, 2008. As permitted by tax regulations, the Fund has elected to treat this loss as arising in 2009. |
NOTE 5—COMMITTED LINE OF CREDIT
The Fund participates with the Funds in a $200 million committed credit facility (“Line of Credit”) with State Street Bank and Trust Company to be utilized for temporary or emergency purposes to fund shareholder redemptions or for other short-term liquidity purposes. Interest on borrowings is charged at the prevailing rate. There were no borrowings on the Line of Credit during the year.
NOTE 6—PURCHASES AND SALES OF INVESTMENTS
For the year ended December 31, 2008, purchases and sales of securities, other than short-term securities, aggregated $14,881,338,908 and $15,266,062,749, respectively.
NOTE 7—ACCOUNTING PRONOUNCEMENTS
Effective June 29, 2007, the Fund adopted the Financial Accounting Standards Board (FASB) Interpretation No. 48, “Accounting for Uncertainty in Income Taxes” (FIN 48). FIN 48 clarifies the accounting for income taxes by prescribing the minimum recognition threshold a tax position must meet before being recognized in the financial statements. At December 31, 2008, FIN 48 was applied to the period from January 1, 2005 through December 31, 2008, the open tax years subject to regulatory examination. There was no impact to the Fund’s financial statements as a result of applying FIN 48.
Effective January 1, 2009, the Fund will adopt “Statement of Financial Accounting Standards No. 161, Disclosures about Derivative Instruments and Hedging Activities” (FAS 161). FAS 161 requires enhanced disclosures about the Fund’s derivative and hedging activities. Management expects that implementation of FAS 161 will not significantly impact the Fund’s financial statement disclosures.
DODGE & COX INTERNATIONAL STOCK FUND §PAGE 12
NOTES TO FINANCIAL STATEMENTS
NOTE 8—HOLDINGS OF 5% VOTING SECURITIES
Each of the companies listed below was considered to be an affiliate of the Fund because the Fund owned 5% or more of the company’s voting securities during all or part of the year ended December 31, 2008. Purchase and sale transactions and dividend income earned during the year on these securities were as follows:
| | | | | | | | | | | | | | | | | |
| | | Shares at
Beginning of Year | | Additions | | Reductions | | | Shares at
End of Year | | Dividend
Income(a) | | | Value at
End of Year | |
Aderans Holdings Co., Ltd. (Japan) | | 5,062,700 | | — | | (1,025,700 | ) | | 4,037,000 | | $ | 1,914,857 | | | $ | 42,298,794 | |
Anadolu Efes Biracilik ve Malt Sanayii AS (Turkey) | | 19,764,582 | | 11,000,000 | | (1,300,000 | ) | | 29,464,582 | | | 4,975,660 | | | | 197,230,758 | |
Arkema (France) | | 5,960,263 | | 666,477 | | — | | | 6,626,740 | | | 7,683,902 | | | | 113,881,533 | |
Brother Industries, Ltd. (Japan) | | 19,358,500 | | 4,242,500 | | — | | | 23,601,000 | | | 5,088,494 | | | | 140,792,188 | |
Chartered Semiconductor Manufacturing, Ltd. (Singapore) | | 200,000,000 | | — | | — | | | 200,000,000 | | | — | (b) | | | 25,194,933 | |
Consorcio Ara SAB de CV (Mexico) | | 106,790,900 | | 6,629,100 | | — | | | 113,420,000 | | | 1,700,662 | | | | 42,997,798 | |
Corporacion Geo SAB de CV, Series B (Mexico) | | 47,605,400 | | — | | — | | | 47,605,400 | | | — | (b) | | | 53,626,331 | |
Epcos AG (Germany) | | 6,328,100 | | 2,500,000 | | (8,828,100 | ) | | — | | | 2,708,963 | | | | — | |
Grupo Televisa SA (Mexico) | | 26,823,592 | | 10,107,000 | | (4,151,196 | ) | | 32,779,396 | | | 12,774,182 | | | | 489,724,176 | |
Infineon Technologies AG (Germany) | | 66,627,800 | | 18,275,000 | | — | | | 84,902,800 | | | — | (b) | | | 116,861,892 | |
Kyocera Corp. (Japan) | | 5,919,200 | | 4,345,000 | | (1,060,300 | ) | | 9,203,900 | | | 10,177,728 | | | | — | (c) |
Lafarge SA (France) | | 6,684,625 | | 2,435,600 | | — | | | 9,120,225 | | | 37,576,644 | | | | 554,514,038 | |
Lanxess AG (Germany) | | 8,792,359 | | 470,000 | | (350,000 | ) | | 8,912,359 | | | 11,356,998 | | | | 173,379,407 | |
Makhteshim-Agan Industries, Ltd. (Israel) | | 26,459,809 | | — | | (26,459,809 | ) | | — | | | 4,335,922 | | | | — | |
Mediceo Paltac Holdings Co., Ltd. (Japan) | | 25,959,700 | | — | | (6,521,700 | ) | | 19,438,000 | | | 4,275,035 | | | | 234,252,293 | |
Naspers, Ltd. (South Africa) | | 27,060,000 | | 10,980,895 | | (1,000,000 | ) | | 37,040,895 | | | 8,495,928 | | | | 673,294,211 | |
NGK Spark Plug Co., Ltd. (Japan) | | 7,904,000 | | 9,596,000 | | — | | | 17,500,000 | | | 4,138,473 | | | | 140,250,321 | |
Nortel Networks Corp. (Canada) | | 24,990,705 | | 15,018,585 | | (25,125,288 | ) | | 14,884,002 | | | — | (b) | | | — | (c) |
Qimonda AG (Germany) | | 22,470,300 | | — | | (22,470,300 | ) | | — | | | — | (b) | | | — | |
Seiko Epson Corp. (Japan) | | 13,865,000 | | — | | (13,865,000 | ) | | — | | | 2,077,237 | | | | — | |
Television Broadcasts, Ltd. (Hong Kong) | | 2,025,000 | | 25,274,300 | | — | | | 27,299,300 | | | 3,353,713 | | | | 89,441,675 | |
The Bank of Yokohama, Ltd. (Japan) | | 82,015,000 | | 3,500,000 | | (15,486,000 | ) | | 70,029,000 | | | 8,833,461 | | | | 414,230,556 | |
Thomson (France) | | 17,885,792 | | 7,130,000 | | — | | | 25,015,792 | | | — | (b) | | | 33,830,098 | |
Toto, Ltd. (Japan) | | 37,907,000 | | — | | (9,396,000 | ) | | 28,511,000 | | | 4,104,230 | | | | 178,847,844 | |
Wienerberger AG (Austria) | | 5,983,876 | | 3,484,000 | | (70,500 | ) | | 9,397,376 | | | 11,744,935 | | | | 156,936,828 | |
Yamaha Motor Co., Ltd. (Japan) | | 22,220,000 | | 1,260,000 | | (227,000 | ) | | 23,253,000 | | | 9,079,851 | | | | 243,995,256 | |
| | | | | | | | | | | | | | | | | |
| | | | | | | | | | | $ | 156,396,875 | | | $ | 4,115,580,930 | |
| | | | | | | | | | | | | | | | | |
| | | | | | | | | | | | | | | | | | |
(a) | Net of foreign taxes, if any |
(c) | Company was not an affiliate at the end of the year |
PAGE 13 § DODGE & COX INTERNATIONAL STOCK FUND
FINANCIAL HIGHLIGHTS
| | | | | | | | | | | | | | | |
SELECTED DATA AND RATIOS (for a share outstanding throughout each year) | | Year Ended December 31, | |
| | | 2008 | | | 2007 | | | 2006 | | | 2005 | | | 2004 | |
Net asset value, beginning of year | | $46.02 | | | $43.66 | | | $35.03 | | | $30.64 | | | $23.48 | |
Income from investment operations: | | | | | | | | | | | | | | | |
Net investment income | | 0.97 | | | 1.25 | | | 0.57 | | | 0.33 | | | 0.26 | |
Net realized and unrealized gain (loss) | | (22.57 | ) | | 3.87 | | | 9.24 | | | 4.80 | | | 7.36 | |
| | | |
Total from investment operations | | (21.60 | ) | | 5.12 | | | 9.81 | | | 5.13 | | | 7.62 | |
| | | |
Distributions to shareholders from: | | | | | | | | | | | | | | | |
Net investment income | | (0.94 | ) | | (1.26 | ) | | (0.56 | ) | | (0.35 | ) | | (0.24 | ) |
Net realized gain | | (1.58 | ) | | (1.50 | ) | | (0.62 | ) | | (0.39 | ) | | (0.22 | ) |
| | | |
Total distributions | | (2.52 | ) | | (2.76 | ) | | (1.18 | ) | | (0.74 | ) | | (0.46 | ) |
| | | |
Net asset value, end of year | | $21.90 | | | $46.02 | | | $43.66 | | | $35.03 | | | $30.64 | |
| | | |
Total return | | (46.68 | )% | | 11.71 | % | | 28.00 | % | | 16.74 | % | | 32.46 | % |
Ratios/supplemental data: | | | | | | | | | | | | | | | |
Net assets, end of year (millions) | | $25,020 | | | $53,479 | | | $30,899 | | | $13,357 | | | $4,203 | |
Ratio of expenses to average net assets | | 0.64 | % | | 0.65 | % | | 0.66 | % | | 0.70 | % | | 0.77 | % |
Ratio of net investment income to average net assets | | 2.37 | % | | 3.11 | % | | 1.82 | % | | 1.54 | % | | 1.90 | % |
Portfolio turnover rate | | 35 | % | | 16 | % | | 9 | % | | 7 | % | | 6 | % |
See accompanying Notes to Financial Statements
REPORT OF INDEPENDENT REGISTERED PUBLIC ACCOUNTING FIRM
To the Trustees of Dodge & Cox Funds and Shareholders of Dodge & Cox International Stock Fund
In our opinion, the accompanying statement of assets and liabilities, including the portfolio of investments, and the related statements of operations and of changes in net assets and the financial highlights present fairly, in all material respects, the financial position of Dodge & Cox International Stock Fund (the “Fund”, one of the series constituting Dodge & Cox Funds) at December 31, 2008, the results of its operations for the year then ended, the changes in its net assets for each of the two years in the period then ended and the financial highlights for each of the five years in the period then ended, in conformity with accounting principles generally accepted in the United States of America. These financial statements and financial highlights (hereafter referred to as “financial statements”) are the responsibility of the Fund’s management; our responsibility is to express an opinion on these financial statements based on our audits. We conducted our audits of these financial statements in accordance with the standards of the Public Company Accounting Oversight Board (United States). Those standards require that we plan and perform the audit to obtain reasonable assurance about whether the financial statements are free of material misstatement. An audit includes examining, on a test basis, evidence supporting the amounts and disclosures in the financial statements, assessing the accounting principles used and significant estimates made by management, and evaluating the overall financial statement presentation. We believe that our audits, which included confirmation of securities at December 31, 2008 by correspondence with the custodian and brokers, provide a reasonable basis for our opinion.
PricewaterhouseCoopers LLP
San Francisco, California
February 13, 2009
DODGE & COX INTERNATIONAL STOCK FUND §PAGE 14
SPECIAL 2008 TAX INFORMATION
(unaudited)
The following information is provided pursuant to provisions of the Internal Revenue Code:
In 2008, the Fund elected to pass through to shareholders foreign source income of $1,379,649,982 and foreign taxes paid of $128,013,623.
The Fund designates up to a maximum of $1,105,870,196 of its distributions paid to shareholders in 2008 as qualified dividends (treated for federal income tax purposes in the hands of shareholders as taxable at a maximum rate of 15%).
For shareholders that are corporations, the Fund designates 3% of its ordinary dividends (including short-term gains) paid to shareholders in 2008 as dividends from domestic corporations eligible for the corporate dividends received deduction, provided that the shareholder otherwise satisfies applicable requirements to claim that deduction.
BOARD APPROVAL OF FUNDS’ INVESTMENT MANAGEMENT AGREEMENTS AND MANAGEMENT FEES
(unaudited)
The Board of Trustees is responsible for overseeing the performance of the Dodge & Cox Funds’ investment manager and determining whether to continue the Investment Management Agreements between the Funds and Dodge & Cox each year (the “Agreements”). At a meeting of the Board of Trustees of the Trust held on December 15, 2008, the Trustees, by a unanimous vote (including a separate vote of those Trustees who are not “interested persons” (as defined in the Investment Company Act of 1940) (the “Independent Trustees”)), approved the renewal of the Agreements for an additional one-year term through December 31, 2009. During the course of the year, the Board received a wide variety of materials relating to the services provided by Dodge & Cox and the performance of the Funds.
INFORMATION RECEIVED
In advance of the meeting, the Board, including each of the Independent Trustees, requested, received and reviewed materials relating to the Agreements. The Independent Trustees retained Morningstar® to prepare an independent expense and performance summary for each
Fund and comparable funds managed by other advisers identified by Morningstar®. The Morningstar® materials included information regarding advisory fee rates, expense ratios, and transfer agency, custodial and distribution expenses, as well as appropriate performance comparisons to an index or combination of indices. The materials reviewed by the Board also included information concerning Dodge & Cox’s profitability, financial results and condition, including advisory fee revenue and separate account advisory fee schedules. The Board additionally considered the Funds’ brokerage commissions, turnover rates and sales and redemption data for the Funds, including “soft dollar” payments made for research benefiting the Funds and other accounts managed by Dodge & Cox, and brokerage commissions and expenses paid by Dodge & Cox. Other aspects of Dodge & Cox’s services to the Funds which were reviewed included compliance and supervision of third-party service providers (e.g., custodian, fund accountant, transfer agent and state registration administrator), shareholder servicing, accounting and administrative services, web services, the character of non-advisory services, the record of compliance with the Funds’ investment policies and restrictions and the Funds’ Code of Ethics, investment management staffing and biographies, information furnished to investors and shareholders (including the Funds’ Prospectus, Statement of Additional Information, shareholder reports, and quarterly reports), and third-party retirement plan administrator reimbursements by Dodge & Cox for the same periods.
The Board received copies of the Agreements and a memorandum from the Independent Legal Counsel to the Independent Trustees, discussing the factors generally regarded as appropriate to consider in evaluating advisory arrangements. The Trust’s Contract Review Committee, consisting solely of Independent Trustees, met with the Independent Legal Counsel on December 3, 2008 and again on December 15, 2008 to discuss whether to renew the Agreements. The Board, including the Independent Trustees, subsequently concluded that the existing Agreements are fair and reasonable and voted to approve the Agreements.
In considering the Agreements, the Board, including the Independent Trustees, did not identify any single factor or particular information as all-important or
PAGE 15 § DODGE & COX INTERNATIONAL STOCK FUND
controlling. In reaching the decision to approve the Agreements, the Board, which was advised by Independent Legal Counsel, considered the following factors, among others, and reached the conclusions described below.
NATURE, QUALITY, AND EXTENT OF
THE SERVICES
The Board considered that Dodge & Cox provides a wide range of services to the Funds in addition to portfolio management and that the quality of these services has been excellent in all respects. The extensive nature of services provided by Dodge & Cox has been documented in materials provided to the Board and in presentations made to the Board throughout the year. In particular, the Board considered the nature, quality and extent of portfolio management, administrative and shareholder services performed by Dodge & Cox, including: Dodge & Cox’s established long-term history of care and conscientiousness in the management of the Funds; demonstrated consistency in investment approach and depth, background and experience of the Dodge & Cox Investment Policy Committee, International Investment Policy Committee, Global Investment Policy Committee, Fixed Income Investment Policy Committee and research analysts responsible for managing the Funds; Dodge & Cox’s organizational structure; Dodge & Cox’s performance in the areas of compliance, administration and shareholder communication and services, supervision of Fund operations and general oversight of other service providers; peer group comparisons of expense ratios, management fee comparisons, expenses (e.g., transfer agent, custody and other fees and expenses) and asset comparisons and performance and risk summaries prepared independently by Morningstar® and favorable stewardship ratings and “Star” rankings by Morningstar®. The Board concluded that it was satisfied with the nature, extent and quality of investment management and other services provided to the Funds by Dodge & Cox.
INVESTMENT PERFORMANCE
The Board considered short-term and long-term investment performance for each Fund (including periods of outperformance or underperformance) as compared to both relevant indices and the performance of such Fund’s
peer group. In light of recent market volatility, the Board also reviewed recent performance in the context of long-term investment goals. The Board noted that the shorter-term performance of the Funds has been disappointing. The performance information prepared by Morningstar® and Dodge & Cox demonstrated more favorable performance over the long term in keeping with the stated goals in the Prospectus. The Board considered that the performance of the Funds is the result of a team-oriented investment management process that emphasizes a long-term investment horizon, independence, comprehensive research, price discipline and focus. The Board also noted that the investment performance delivered by Dodge & Cox to the Funds appeared to be consistent with the relevant performance delivered for other (non-fund) clients of Dodge & Cox. The Board concluded that Dodge & Cox has delivered favorable long-term performance for Fund investors consistent with the long-term investment strategies being pursued by the Funds.
COSTS AND ANCILLARY BENEFITS
Costs of Services to Funds: Fees and Expenses. The Board considered each Fund’s management fee rates and expense ratios relative to industry averages for similar mutual funds and relative to management fees charged by Dodge & Cox to other (non-fund) clients. The Board evaluated the operating structures of the Funds and Dodge & Cox, including the following: Dodge & Cox has a centralized focus on investment management operations and derives revenue solely from management fees; its outsourcing of non-advisory support services to unaffiliated third-party service providers is efficient and less costly to investors; Dodge & Cox does not charge front-end sales commissions or distribution fees and bears all third party research and distribution-related costs as well as reimbursements to third-party retirement plan administrators; the Funds receive numerous administrative, regulatory compliance, and shareholder support services from Dodge & Cox without any additional administrative fee; and the fact that the Funds have relatively low transaction costs and portfolio turnover rates. The Board noted that the Funds are substantially below peer group averages in expense ratios and management fee rates and that many media and industry reports specifically comment on the low expense ratios of Dodge & Cox, which along
DODGE & COX INTERNATIONAL STOCK FUND §PAGE 16
with solid long-term performance, has been a defining characteristic of Dodge & Cox for many years. The Board also noted that the range of services under the Agreements is much more extensive than under Dodge & Cox’s separate advisory (non-fund) client agreements and that many of the separate accounts were opened decades ago when fees were lower, and considered that, when coupled with the greater risks and regulatory burdens associated with the high profile mutual fund business, there is reasonable justification for differences in fee rates charged between the two lines of business. The Board concluded that costs incurred by the Funds for the services they receive (including the management fee paid to Dodge & Cox) are reasonable and that the fees are acceptable based upon the qualifications, experience, reputation and performance of Dodge & Cox and the low overall expense ratios of the Funds.
Profitability and Costs of Services to Dodge & Cox; “Fall-out” Benefits. The Board reviewed reports of Dodge & Cox’s financial position, profitability and estimated overall value, and they considered Dodge & Cox’s overall profitability within its context as a private, employee-owned S-Corporation and relative to the favorable services provided. The Board noted that net revenues for 2008 reflect a decline in assets under management compared with 2007. The Board recognized the importance of Dodge & Cox’s profitability—which is derived solely from management fees and does not include other business ventures—to maintain its independence, stability, company culture and ethics, and management continuity. The Board also considered that revenues reflect the continued success of the Funds and that such revenues are not generated by fees that are high compared to its peers. They noted that Dodge & Cox’s profitability is enhanced due to its efficient internal business model, and that the compensation/profit structure at Dodge & Cox is vital for remaining independent and facilitating retention of its management and investment professionals. The Board considered potential “fall-out” benefits (including the receipt of research from unaffiliated brokers) that Dodge & Cox might receive in its association with the Funds. The Board also noted the extent of additional administrative services performed by Dodge & Cox for the
Funds, and that the magnitude of costs and risks borne by Dodge & Cox in rendering advisory services to the Funds (including risks in the compliance, securities valuation and investment management processes) are continuing to increase. The Board concluded that the profitability of Dodge & Cox’s relationship with the Funds (including fall-out benefits) was fair and reasonable.
THE BENEFIT OF ECONOMIES OF SCALE
The Board considered whether there have been economies of scale with respect to the management of each Fund, whether the Funds have appropriately benefited from any economies of scale, and whether the management fee rate is reasonable in relation to the Fund assets and any economies of scale that may exist. In the Board’s view, any consideration of economies of scale must take account of the Funds’ low fee structure and the considerable efficiencies of the Funds’ organization and fee structure that has been realized by shareholders at the outset of their investment (i.e., from the first dollar). Shareholders also realize efficiencies from the outset of their investment due to organizational efficiencies derived from Dodge & Cox’s investment management process (e.g., low portfolio turnover) and the avoidance of distribution and marketing structures whose costs would ultimately be borne by shareholders of the Funds. The Board noted that Dodge & Cox has shared economies of scale by adding or enhancing services to the Funds over time, and that the internal costs of providing investment management, administrative and compliance services to the Funds are continuing to increase. Thus, the Funds provide access by small investors to top-rank investment management at a relatively low cost. The Board’s decision to renew the Agreements was made after consideration of economies of scale and review of comparable fund expense ratios and historical expense ratio patterns for the Funds. Their review also included consideration of the desirability of adding breakpoints to the Funds’ fee schedules. The Board concluded that the current Dodge & Cox fee structure is fair and reasonable and adequately reflects economies of scale.
PAGE 17 § DODGE & COX INTERNATIONAL STOCK FUND
CONCLUSION
Based on their evaluation of all material factors and assisted by the advice of Independent Legal Counsel to the Independent Trustees, the Board, including the Independent Trustees, concluded that the advisory fee structure was fair and reasonable, that each Fund was paying a competitive fee for the services provided, that the scope and quality of Dodge & Cox’s services has provided substantial value for Fund shareholders over the long term, and that approval of the Agreements was in the best interests of each Fund and its shareholders.
FUND HOLDINGS
The Fund provides a complete list of its holdings four times each fiscal year, as of the end of each quarter. The lists appear in the Fund’s First Quarter, Semi-Annual, Third Quarter and Annual Reports to shareholders. The Fund files the lists with the Securities and Exchange Commission (SEC) on Form N-CSR (second and fourth quarters) and Form N-Q (first and third quarters).
Shareholders may view the Fund’s Forms N-CSR and N-Q on the SEC’s website at www.sec.gov. Forms N-CSR and N-Q may also be reviewed and copied at the SEC’s Public Reference Room in Washington, DC. Information regarding the operations of the Public Reference Room may be obtained by 1-202-942-8090 (direct) or 1-800-732-0330 (general SEC number). A complete list of the Fund’s quarter-end holdings is also available at www.dodgeandcox.com on or about 15 days following each quarter end and remains available on the web site until the list is updated in the subsequent quarter.
PROXY VOTING
For a free copy of the Fund’s proxy voting policies and procedures, please call 1-800-621-3979, visit the Fund’s web site at www.dodgeandcox.com or visit the SEC’s web site at www.sec.gov. Information regarding how the Fund voted proxies relating to portfolio securities during the most recent 12-month period ending June 30 is also available at www.dodgeandcox.com or at www.sec.gov.
DODGE & COX INTERNATIONAL STOCK FUND §PAGE 18
DODGE & COX FUNDS—EXECUTIVE OFFICER & TRUSTEE INFORMATION
| | | | | | |
Name (Age) and
Address* | | Position with Trust
(Year of Election or
Appointment) | | Principal Occupation During Past 5 Years | | Other Directorships Held by Trustees |
| INTERESTED TRUSTEES & OFFICERS |
John A. Gunn
(65) | | Chairman and Trustee
(Trustee since 1985) | | Chairman (since 2007), Chief Executive Officer (since 2005) and Director of Dodge & Cox, Portfolio Manager and member of Investment Policy Committee (IPC), Global Investment Policy Committee (GIPC) (since 2008), and International Investment Policy Committee (IIPC) | | — |
| Kenneth E. Olivier (56) | | President and Trustee (Trustee since 2005) | | President (since 2005) and Director of Dodge & Cox, Portfolio Manager, and member of IPC | | — |
| Dana M. Emery (47) | | Senior Vice President and Trustee (Trustee since 1993) | | Executive Vice President (since 2005) and Director of Dodge & Cox, Manager of the Fixed Income Department, Portfolio Manager, and member of Fixed Income Investment Policy Committee (FIIPC) | | — |
Charles F. Pohl (50) | | Senior Vice President
(Officer since 2004) | | Senior Vice President and Director of Dodge & Cox, Chief Investment Officer (since 2007), Director of Credit Research, Portfolio Manager, Investment Analyst, and member of IPC, GIPC (since 2008), IIPC (since 2007), and FIIPC | | — |
| Diana S. Strandberg (49) | | Senior Vice President
(Officer since 2005) | | Vice President of Dodge & Cox, Portfolio Manager, and member of IPC, GIPC (since 2008), and IIPC | | — |
| David H. Longhurst (51) | | Treasurer
(Officer since 2006) | | Vice President and Assistant Treasurer of Dodge & Cox (since 2008); Vice President, Treasurer, Controller and Secretary of Safeco Mutual Funds, Safeco Asset Management Company, Safeco Services, Safeco Securities, and Safeco Investment Services (2000-2004) | | — |
| Thomas M. Mistele (55) | | Secretary
(Officer since 2000) | | Chief Operating Officer (since 2004), Director (since 2005), Secretary, and General Counsel of Dodge & Cox | | — |
| Marcia P. Venegas (40) | | Chief Compliance Officer
(Officer since 2004) | | Associate Chief Compliance Officer of Dodge & Cox (since 2008), Chief Compliance Officer of Dodge & Cox (2005-2008), Compliance Officer of Dodge & Cox (2003-2004) | | — |
| INDEPENDENT TRUSTEES |
| William F. Ausfahl (68) | | Trustee (Since 2002) | | CFO, The Clorox Co. (1982-1997); Director, The Clorox Co. (1984-1997) | | — |
| L. Dale Crandall (67) | | Trustee (Since 1999) | | President, Kaiser Foundation Health Plan, Inc. and Kaiser Foundation Hospitals (2000-2002); Senior Vice President—Finance and Administration & CFO, Kaiser Foundation Health Plan, Inc. and Kaiser Foundation Hospitals (1998-2000) | | Director, Ansell Limited (medical equipment and supplies) (2002-Present); Director, Coventry Health Care, Inc. (managed health care) (2004-Present); Director, Metavante Technologies, Inc. (software) (2007 to present) |
| Thomas A. Larsen (59) | | Trustee (Since 2002) | | Director in Howard, Rice, Nemerovski, Canady, Falk & Rabkin (law firm) | | — |
John B. Taylor
(62) | | Trustee (Since 2005) | | Professor of Economics, Stanford University; Senior Fellow, Hoover Institution; Under Secretary for International Affairs, United States Treasury (2001-2005) | | — |
Will C. Wood (69) | | Trustee (Since 1992) | | Principal, Kentwood Associates, Financial Advisers | | Director, Banco Latinoamericano de Exportaciones S.A. (Latin American foreign trade bank) (1999-Present) |
| * | | The address for each Officer and Trustee is 555 California Street, 40th Floor, San Francisco, California 94104. Each Officer and Trustee oversees all five series in the Dodge & Cox Funds complex and serves for an indefinite term. |
Additional information about the Trust’s Trustees and Officers is available in the Trust’s Statement of Additional Information (SAI). You can get a free copy of the SAI by visiting the Fund’s website at www.dodgeandcox.com or calling 1-800-621-3979.
PAGE 19 § DODGE & COX INTERNATIONAL STOCK FUND
| | | | |
| | | | |
www.dodgeandcox.com
For Fund literature, transactions, and account information, please visit the Funds’ web site.
or write or call:
DODGE & COX FUNDS
c/o Boston Financial Data Services
P.O. Box 8422
Boston, Massachusetts 02266-8422
(800) 621-3979
INVESTMENT MANAGER
Dodge & Cox
555 California Street, 40th Floor
San Francisco, California 94104
(415) 981-1710
This report is submitted for the general information of the shareholders of the Fund. The report is not authorized for distribution to prospective investors in the Fund unless it is accompanied by a current prospectus.
This report reflects our views, opinions, and portfolio holdings as of December 31, 2008, the end of the reporting period. Any such views are subject to change at any time based upon market or other conditions and Dodge & Cox disclaims any responsibility to update such views. These views may not be relied on as investment advice and, because investment decisions for a Dodge & Cox Fund are based on numerous factors, may not be relied on as an indication of trading intent on behalf of any Dodge & Cox Fund.
12/08 BF AR Printed on recycled paper
Annual Report
December 31, 2008
Balanced Fund
ESTABLISHED 1931
TICKER: DODBX
TO OUR SHAREHOLDERS
The Dodge & Cox Balanced Fund had a total return of negative 33.6% for 2008, compared to a total return of negative 22.1% for the Combined Index (60% S&P 500/40% BCAG)1. At year end, the Fund was 67% invested in equities, 31% in fixed income securities, and 2% cash. Net assets of the Fund were $14.7 billion. Longer-term results appear on page five.
LOOKING BACK
The past year was one of the most disappointing in the Balanced Fund’s 77-year history and the worst year for the broad equity market since 1931. As we reflect on 2008, we clearly underestimated the worsening credit crisis, the likelihood of government interventions, the depth and breadth of the ongoing economic problems, and the combined effect of these on many of the Fund’s holdings, particularly within the Financials sector.
While the returns resulting from a number of our investment decisions were disappointing during 2008, we are confident in the Fund’s holdings. The Fund has experienced periods of underperformance in the past. We have learned from these past periods just as we are learning from this one, and are incorporating these lessons into our strategy and outlook on an ongoing basis.
For example, during this unique period of extreme volatility and limited liquidity, our equity and fixed income research analysts have reviewed, updated, and stress-tested our financial projections for each of the Fund’s holdings, paying particular attention to potential vulnerabilities to the challenging credit market. We review this work with our analysts while continually monitoring relative values across our investment universe in order to determine the best long-term opportunities on behalf of the Fund’s shareholders. As a result of this review, we sold the equity positions of General Motors and Ford during the fourth quarter.
While we have made refinements, maintaining the essence of our investment approach through previous challenging periods has been crucial to the Fund’s long-term success. That approach—constructing a diversified portfolio through in-depth, independent research, a three-to-five year investment horizon, and a focus on
valuation relative to underlying fundamentals—continues to guide us through this period as well. As we learn and make adjustments, we remain confident that our enduring, value-oriented approach will benefit our shareholders in the years ahead.
Founded in 1930, our firm has weathered past financial storms and we will weather this one as well. We are independently owned by our current employees, have no debt, and have kept our employee count low. We have no need for layoffs, and in fact have continued to invest in our most important resource—people—by maintaining a pattern of hiring one or two new analysts per year. Our independence gives us the staying power to stick with our convictions and maintain our focus on the long term. Our firm’s foremost objective is to provide high quality investment management service to our clients.
INVESTMENT STRATEGY
Asset Allocation
The Fund ended the year with 67% of its assets invested in equities, and had just over 70% of its assets in equities at various points throughout the year. This higher weighting (relative to the 60% equity weighting in the Combined Index) was detrimental, given extremely weak equity returns. Although we are disappointed with the outcome of the asset allocation in 2008, we remain confident in the decision-making process which led to the allocation. Our bottom-up process weighs the relative attractiveness among equity securities and fixed income alternatives. Our analysts build informed views of what the key drivers are for each and every investment and focus on how different macroeconomic and company-specific scenarios could affect the value of the investment over the next three to five years. We also constantly ask ourselves what could go wrong—and to what degree—and build a diversified portfolio in our efforts to strike an appropriate balance between long-term investment risk and reward.
This process has reinforced our conviction about the attractiveness of equities, which is reflected by the relatively high equity weighting in the Fund. Admittedly, we were similarly confident entering 2008. However, we measure successful investing in years rather than quarters,
PAGE 1 § DODGE & COX BALANCED FUND
and as equity market valuations have declined relative to alternatives we have continued to lean toward equities.
EQUITY PORTFOLIO
While the economic landscape has clearly worsened with rising unemployment, declining home values, and continuing uncertainty within the Financials sector, there are a number of factors which build our convictions about the positive prospects for equity returns over the long term.
First, government officials and companies’ management teams have been actively addressing and responding to the economic downturn. Unlike some past recessions or the Great Depression, when policy makers either did nothing or raised barriers, the U.S. and foreign governments have implemented large programs to support the financial system and stimulate the economy, and have largely maintained free-market principles. We are working to expand our understanding of where public policy is heading and its potential impact on the portfolio’s investments.
In our regular discussions with management teams we hear how they are responding to the downturn. Many companies are reducing costs, improving processes, reconsidering strategies, and looking for growth and market share opportunities as competitors struggle. The survivors should be better positioned and more profitable when the economy does turn around. Examples of portfolio holdings gaining market share and/or aggressively cutting costs include Hewlett-Packard, Comcast, Pfizer, FedEx, Schlumberger, and Wal-Mart.
Second, the U.S. economy has been through difficult periods before—it has survived wars, flu pandemics, inflation, labor unrest, and terrorist attacks. Pessimism during these periods—just like optimism during upturns—can become pervasive. However, the U.S. and global economies are resilient and, while setbacks have occurred throughout history, equity investors have been rewarded over the long term.
Third, valuations for companies have obviously come down dramatically, and in our opinion are even more attractive today. As a whole, the stock market is selling at depressed valuations, and select companies are selling at very low multiples to sales and earnings potential. When
the global economy stabilizes and recovers, attractive nominal returns could be achieved.
And finally, the powerful forces behind accelerated global economic growth over the past five years remain in place—namely, technological innovation and the growth in developing countries. While emerging markets growth has slowed, we believe the long-term outlook is good. As of year end, 20% of the equity portfolio was invested in multinational foreign companies, and another 24% invested in U.S.-based companies that have at least 50% of their sales coming from overseas—much of it from emerging markets.
Two sectors in the crosshairs of technological innovation and growth in the developing world are Health Care and Information Technology. At year end, 29% of the equity portfolio was invested in Health Care stocks, primarily in global pharmaceutical companies (e.g., Novartis and GlaxoSmithKline). Pharmaceuticals are faced with many regulatory challenges, but are trading at historically low valuations and are in financially strong condition. They continue to innovate, and should benefit from increased demand as discretionary income in the developing world increases. Another 18% of the equity portfolio was invested in Information Technology stocks, including a number of software and services companies (e.g., BMC Software, Citrix Systems, and Computer Sciences), that have solid balance sheets and high recurring revenues from clients who are dependent on them to maintain their businesses.
A Thought on Financials
As you will read below, the performance of several of the portfolio’s holdings in the Financials sector was breathtakingly bad. And given that the root of today’s economic turmoil lies in the banking system, it is not an unfair question to ask why one would invest in this area at all. As of year end, 11% of the equity portfolio was invested in Financials compared to 13% of the S&P 500. Despite the continued sell-off during the fourth quarter and still lower valuations, we decided not to add significantly to positions in acknowledgement of the industry’s disruptions. At the same time, we did not sell the Fund’s positions with the rationale that term banks and other financial services firms provide a necessary long-term
DODGE & COX BALANCED FUND §PAGE 2
role in the global economy, and the survivors of this crisis will eventually return to profitability with stronger market positions and higher stock valuations. As we discussed earlier, we are fully cognizant of the challenges and risks in this area and are monitoring the Fund’s holdings.
FIXED INCOME PORTFOLIO
Market pricing of fixed income instruments (e.g., U.S. Treasury yields at all-time lows, corporate yield premiums near all-time highs) has responded vigorously to the negative economic news, but the new consensus, which incorporates expectations for a severe and multi-year economic downturn, appears too pessimistic to us. With the backdrop of extraordinary monetary and (most likely) fiscal policies aimed at arresting the economy’s decline, current valuations of many corporate securities appear attractive for a long-term investor. For example, the elevated yield levels of investment-grade Corporate securities relative to U.S. Treasuries imply a default rate among investment-grade Corporates that is a multiple of the previous 1938 high. In response to these opportunities, we have raised the emphasis on the Corporate sector in the fixed income portion of the Fund, as always with a strong focus on individual security selection.
In the most recent quarter, for example, we established new positions in two investment-grade corporate issuers and added to several existing holdings. At year end, the fixed income portion of the Fund held a 57% weighting in Corporates (up from 42% at year-end 2007) spread among 42 individual issuers in 16 different industries.
We reduced the Fund’s holdings of Government Sponsored Enterprise (GSE)-guaranteed2 Mortgage-Backed Securities (MBS) in the fourth quarter from 49% a year ago to just over 37%. Despite lagging the spectacular returns of U.S. Treasuries, the Fund’s GSE-guaranteed MBS have fulfilled a critically important role throughout the current crisis, delivering solid returns (this sector of the BCAG returned 8.3% in 2008) while retaining their liquidity. Recently, U.S. Government efforts to reduce mortgage rates have begun to bear fruit: MBS rates and yield premiums have come down
significantly and most MBS trade at a premium to par. New, lower mortgage rates create greater prepayment risk for existing mortgage securities, leading us to favor—on the margin—opportunities among corporate securities. However, the Fund has retained a significant weighting in GSE-guaranteed MBS due to their creditworthiness and attractive total return potential.
The Fund held few U.S. Treasuries during 2008, which was a detriment to performance as this sector delivered excellent returns due to its “safe haven” status. As a result, at year end, short-term U.S. Treasuries offered near-zero yields while longer-term Treasuries, whose prices are most sensitive to changes in yields, offered yields below 3%. While the safety of these securities’ principal is intuitively attractive in a period of distress, their ultimate value will be judged by what they return to investors over the long term. With these yields as starting points, the long-term outlook for returns from this sector is not promising.
IN CLOSING
Investing can be a humbling endeavor. This past year has been humbling for us twofold. First, a number of our investment decisions—made based on considerable research, discussion and debate—proved to be wrong. Second, we have been humbled by the loyalty and confidence our shareholders have displayed through this difficult period. While the Fund did experience net outflows during the year, the outflows were manageable. By and large what we have heard from shareholders is not only disappointment with our recent returns, but confidence in Dodge & Cox and our investment approach. As fellow shareholders in the Fund, we share in these sentiments.
Our experienced investment team is working hard to take advantage of the attractive opportunities being created during this period of economic stress and volatility. Although it is impossible to predict the short-term direction of securities prices, our experience has taught us that persistence in the face of significant market dislocations can be potentially rewarding for patient investors with long-term investment horizons.
PAGE 3 § DODGE & COX BALANCED FUND
Thank you for your continued patience and confidence in our firm as a shareholder of the Dodge & Cox Balanced Fund. As always, we welcome your comments and questions.
For the Board of Trustees,
| | |

| |
|
John A. Gunn, Chairman | | Kenneth E. Olivier, President |
February 13, 2009
1 | | The Combined Index reflects an unmanaged portfolio of 60% of the Standard & Poor’s 500 Index, which is a widely recognized, unmanaged index of common stock prices, and 40% of the Barclays Capital Aggregate Bond Index (BCAG), which is a widely recognized, unmanaged index of U.S. dollar denominated investment-grade fixed-income securities. |
2 | | The U.S. Government does not guarantee the Fund’s shares, yield and net asset value. The guarantee does not eliminate market risk. |
2008 PERFORMANCE REVIEW
The Fund lagged the Combined Index by 11.5 percentage points for the year
Key Detractors from Relative Results
| | § | | The Fund’s overweighting of equities throughout the year relative to the Combined Index was detrimental, given the extremely weak returns from equities (S&P 500 down 37%). | |
| | § | | The Fund’s equity holdings underperformed the S&P 500. Financials holdings (down 71% versus down 55% for the S&P 500 sector) had the largest negative impact on performance. AIG, Wachovia, and Citigroup were all significant detractors. | |
| | § | | The equity portfolio’s higher average weighting in the Consumer Discretionary sector (22% versus 8% for the S&P 500 sector), in combination with the underperformance of the sector’s holdings (down 41% versus down 33%), detracted. Sony (down 59%) and News Corp. (down 55%) lagged. | |
| | § | | The Fund’s fixed income portfolio return lagged the BCAG. A high relative weighting in the very weak Corporate bond sector, along with few holdings in the best performing U.S. Treasury sector, were the primary factors behind the underperformance. | |
Key Contributors to Relative Results
| | § | | Within the equity portfolio, the Fund’s higher average weighting in the Health Care sector (23% versus 13% for the S&P 500 sector) was beneficial, as both the Fund’s holdings and the S&P 500 sector (both down 23%) declined less than the overall market. In particular, Amgen (up 24%) was strong. | |
| | § | | Strong equity holdings included Rohm and Haas (up 42% to date of sale) Wal-Mart Stores (up 20%), and Electronic Data Systems (up 18% to date of sale). | |
| | § | | The sizable nominal yield advantage for the fixed income portfolio benefited returns relative to the BCAG. | |
DODGE & COX BALANCED FUND §PAGE 4
GROWTH OF $10,000 OVER 10 YEARS
FOR AN INVESTMENT MADE ON DECEMBER 31, 1998

AVERAGE ANNUAL TOTAL RETURN
FOR PERIODS ENDED DECEMBER 31, 2008
| | | | | | | | | | | | |
| | | 1 Year | | | 5 Years | | | 10 Years | | | 20 Years | |
| | | | | | | | | | | | |
Dodge & Cox Balanced Fund | | –33.57 | % | | –1.45 | % | | 4.77 | % | | 9.31 | % |
Combined Index | | –22.06 | | | 0.71 | | | 1.69 | | | 8.30 | |
S&P 500 | | –36.99 | | | –2.19 | | | –1.38 | | | 8.43 | |
Barclays Capital Aggregate
Bond Index (BCAG) | | 5.24 | | | 4.65 | | | 5.63 | | | 7.43 | |
Past performance does not guarantee future results. Investment return and share price will fluctuate with market conditions, and investors may have a gain or loss when shares are sold. Mutual fund performance changes over time and currently may be significantly lower than stated. Performance is updated and published monthly. Visit the Fund’s web site at www.dodgeandcox.com or call 1-800-621-3979 for current performance figures.
The Fund’s total returns include the reinvestment of dividend and capital gain distributions, but have not been adjusted for any income taxes payable by shareholders on these distributions. Index returns include dividends and/or interest income but, unlike Fund returns, do not reflect fees or expenses.
Standard & Poor’s, Standard & Poor’s 500, and S&P 500® are trademarks of The McGraw-Hill Companies, Inc. Barclays Capital® is a trademark of Barclays PLC.
FUND EXPENSE EXAMPLE
As a Fund shareholder, you incur ongoing Fund costs, including management fees and other Fund expenses. All mutual funds have ongoing costs, sometimes referred to as operating expenses. The following example shows ongoing costs of investing in the Fund and can help you understand these costs and compare them with those of other mutual funds. The example assumes a $1,000 investment held for the six months indicated.
ACTUAL EXPENSES
The first line of the table below provides information about actual account values and expenses based on the Fund’s actual returns. You may use the information in this line, together with your account balance, to estimate the expenses that you paid over the period. Simply divide your account value by $1,000 (for example, an $8,600 account value divided by $1,000 = 8.6), then multiply the result by the number in the first line under the heading “Expenses Paid During Period” to estimate the expenses you paid on your account during this period.
HYPOTHETICAL EXAMPLE FOR COMPARISON WITH OTHER MUTUAL FUNDS
Information on the second line of the table can help you compare ongoing costs of investing in the Fund with those of other mutual funds. This information may not be used to estimate the actual ending account balance or expenses you paid during the period. The hypothetical “Ending Account Value” is based on the actual expense ratio of the Fund and an assumed 5% annual rate of return before expenses (not the Fund’s actual return). The amount under the heading “Expense Paid During the Period” shows the hypothetical expenses your account would have incurred under this scenario. You can compare this figure with the 5% hypothetical examples that appear in shareholder reports of other mutual funds.
| | | | | | | | | |
Six Months Ended
December 31, 2008 | | Beginning Account Value
7/1/2008 | | Ending Account Value
12/31/2008 | | Expenses Paid
During Period* |
Based on Actual Fund Return | | $ | 1,000.00 | | $ | 749.10 | | $ | 2.29 |
Based on Hypothetical 5% Yearly Return | | | 1,000.00 | | | 1,022.51 | | | 2.65 |
| * | | Expenses are equal to the Fund’s annualized expense ratio of 0.52%, multiplied by the average account value over the period, multiplied by 184/366 (to reflect the one-half year period). |
The expenses shown in the table highlight ongoing costs only and do not reflect any transactional fees or account maintenance fees. While other mutual funds may charge such fees, please note that the Fund does not charge transaction fees (e.g., redemption fees, sales loads) or universal account maintenance fees (e.g., small account fees).
PAGE 5 § DODGE & COX BALANCED FUND
| | |
| FUND INFORMATION | | December 31, 2008 |
| | |
| GENERAL INFORMATION | | |
Net Asset Value Per Share | | $51.26 |
Total Net Assets (billions) | | $14.7 |
30-Day SEC Yield(a) | | 4.41% |
2008 Expense Ratio | | 0.53% |
2008 Portfolio Turnover Rate | | 27% |
Fund Inception | | 1931 |
No sales charges or distribution fees | | |
Investment Manager: Dodge & Cox, San Francisco. Managed by the Investment Policy Committee, whose nine members’ average tenure at Dodge & Cox is 23 years, and by the Fixed Income Investment Policy Committee, whose nine members’ average tenure is 15 years. |
| | |
| STOCK PORTFOLIO (66.9%) | | Fund |
Number of Stocks | | 77 |
Median Market Capitalization (billions) | | $12 |
Price-to-Earnings Ratio(b) | | 10.9x |
Foreign Stocks(c) | | 13.2% |
| | | |
| SECTOR DIVERSIFICATION (FIVE LARGEST) | |
Health Care | | 19.1 | % |
Consumer Discretionary | | 13.2 | |
Information Technology | | 12.2 | |
Financials | | 7.6 | |
Energy | | 6.7 | |
| | | |
| TEN LARGEST STOCKS(d) | | | |
Comcast Corp. | | 3.6 | % |
Hewlett-Packard Co. | | 3.5 | |
Novartis AG (Switzerland) | | 2.8 | |
Sanofi-Aventis (France) | | 2.4 | |
Amgen, Inc. | | 2.3 | |
Time Warner, Inc. | | 2.2 | |
WellPoint, Inc. | | 2.1 | |
GlaxoSmithKline PLC (United Kingdom) | | 2.1 | |
Capital One Financial Corp. | | 1.8 | |
News Corp. | | 1.8 | |
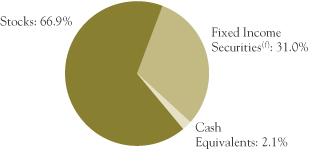
| | |
| FIXED INCOME PORTFOLIO(31.0%)(f) | | Fund |
Number of Fixed Income Securities(f) | | 276 |
Effective Maturity | | 6.5 years |
Effective Duration | | 3.8 years |
| | | |
| SECTOR DIVERSIFICATION | | | |
U.S. Treasury & Government Related | | 1.7 | % |
Mortgage-Related Securities | | 11.5 | |
Asset-Backed Securities | | 0.1 | |
Corporate(f) | | 17.7 | |
| | | |
| CREDIT QUALITY(e) | | | |
U.S. Government & Government Related | | 13.2 | % |
Aaa | | 1.3 | |
Aa | | 2.9 | |
A | | 2.7 | |
Baa | | 5.6 | |
Ba | | 0.9 | |
B | | 0.2 | |
Caa | | 2.4 | |
Ca | | 1.7 | |
C | | 0.0 | (g) |
Preferred Stock (no rating) | | 0.1 | |
Average Quality | | A1 | |
| | | |
| CORPORATE ISSUERS (FIVE LARGEST)(d) | | | |
GMAC, LLC and subsidiaries(f) | | 1.8 | % |
Ford Motor Credit Co. | | 1.5 | |
Wachovia Corp. | | 1.4 | |
General Electric Co. | | 1.1 | |
Time Warner, Inc. | | 1.0 | |
(a) | SEC yield is an annualization of the Fund’s total net investment income per share for the 30-day period ended on the last day of the month. |
(b) | Price-to-earnings (P/E) ratio is calculated using 12-month forward earnings estimates. |
(c) | Foreign stocks are U.S. dollar-denominated. |
(d) | The Fund’s portfolio holdings are subject to change without notice. The mention of specific securities is not a recommendation or solicitation for any person to buy, sell or hold any particular security. |
(e) | Credit quality ratings are from Moody’s Investor Services. If no Moody’s rating is available, the Standard & Poor’s rating is reported. If unrated, the investment manager determines a comparable rating. In calculating average quality, the investment manager assigns ratings to U.S. Government and Government Related securities that are higher than the ratings assigned to securities rated Aaa. The credit quality of the investments in the portfolio does not apply to the stability or safety of the Fund or its shares. |
(f) | Includes cumulative preferred stock (Preferred Blocker, Inc., a subsidiary of GMAC, LLC) representing 0.1% of the Fund’s net assets. |
DODGE & COX BALANCED FUND §PAGE 6
| | |
| PORTFOLIO OF INVESTMENTS | | December 31, 2008 |
| | | | | |
| COMMON STOCKS: 66.9% | | | | |
| | |
| | | SHARES | | VALUE |
| CONSUMER DISCRETIONARY: 13.2% |
CONSUMER DURABLES & APPAREL: 2.5% | | | |
Panasonic Corp. ADR(b) (Japan) | | 13,030,728 | | $ | 162,102,256 |
Sony Corp. ADR(b) (Japan) | | 9,264,000 | | | 202,603,680 |
Thomson ADR(a),(b) (France) | | 1,900,000 | | | 2,565,000 |
| | | | | |
| | | | | 367,270,936 |
MEDIA: 8.3% | | | | | |
Comcast Corp., Class A | | 31,603,774 | | | 533,471,705 |
DISH Network Corp., Class A(a) | | 1,806,165 | | | 20,030,370 |
Interpublic Group of Companies, Inc.(a) | | 7,484,200 | | | 29,637,432 |
Liberty Entertainment, Series A(a) | | 1,958,579 | | | 34,235,961 |
Liberty Global, Inc., Series A(a) | | 264,621 | | | 4,212,767 |
Liberty Global, Inc., Series C(a) | | 391,368 | | | 5,940,966 |
News Corp., Class A | | 29,484,800 | | | 268,016,832 |
Time Warner, Inc. | | 32,592,500 | | | 327,880,550 |
| | | | | |
| | | | | 1,223,426,583 |
RETAILING: 2.4% | | | | | |
CarMax, Inc.(a) | | 3,800,000 | | | 29,944,000 |
Genuine Parts Co. | | 814,458 | | | 30,835,380 |
Home Depot, Inc. | | 7,302,200 | | | 168,096,644 |
Liberty Interactive, Series A(a) | | 8,553,195 | | | 26,685,968 |
Macy’s, Inc. | | 3,944,266 | | | 40,823,153 |
The Sherwin-Williams Co. | | 829,300 | | | 49,550,675 |
| | | | | |
| | | | | 345,935,820 |
| | | | | |
| | | | | 1,936,633,339 |
| CONSUMER STAPLES: 1.9% | | | | | |
FOOD & STAPLES RETAILING: 1.9% | | | |
Wal-Mart Stores, Inc. | | 4,206,900 | | | 235,838,814 |
Walgreen Co. | | 1,730,199 | | | 42,684,009 |
| | | | | |
| | | | | 278,522,823 |
| ENERGY: 6.7% | | | | | |
Baker Hughes, Inc. | | 4,474,510 | | | 143,497,536 |
Chevron Corp. | | 2,567,679 | | | 189,931,216 |
Occidental Petroleum Corp. | | 4,217,700 | | | 253,019,823 |
Royal Dutch Shell PLC ADR(b) (United Kingdom) | | 2,550,127 | | | 131,153,031 |
Schlumberger, Ltd. | | 6,325,421 | | | 267,755,071 |
| | | | | |
| | | | | 985,356,677 |
| | | | | |
| | | | | |
| | |
| | | SHARES | | VALUE |
| FINANCIALS: 7.6% | | | | | |
BANKS: 2.6% | | | | | |
HSBC Holdings PLC ADR(b)
(United Kingdom) | | 1,550,200 | | $ | 75,448,234 |
Wachovia Corp. | | 16,395,312 | | | 90,830,028 |
Wells Fargo & Co. | | 7,568,300 | | | 223,113,484 |
| | | | | |
| | | | | 389,391,746 |
DIVERSIFIED FINANCIALS: 3.5% | | | |
Capital One Financial Corp. | | 8,552,059 | | | 272,725,162 |
Citigroup, Inc. | | 14,924,800 | | | 100,145,408 |
Credit Suisse Group AG ADR(b) (Switzerland) | | 1,500,300 | | | 42,398,478 |
Legg Mason, Inc. | | 1,350,300 | | | 29,585,073 |
SLM Corp.(a) | | 8,096,000 | | | 72,054,400 |
| | | | | |
| | | | | 516,908,521 |
INSURANCE: 1.5% | | | | | |
AEGON NV(b) (Netherlands) | | 8,172,900 | | | 49,446,045 |
American International Group, Inc.(a) | | 22,661,400 | | | 35,578,398 |
Genworth Financial, Inc., Class A(a) | | 1,949,000 | | | 5,515,670 |
Loews Corp. | | 1,283,108 | | | 36,247,801 |
The Travelers Companies, Inc. | | 1,990,219 | | | 89,957,899 |
| | | | | |
| | | | | 216,745,813 |
| | | | | |
| | | | | 1,123,046,080 |
| HEALTH CARE: 19.1% | | | | | |
HEALTH CARE EQUIPMENT & SERVICES: 6.7% |
Boston Scientific Corp.(a) | | 14,777,700 | | | 114,379,398 |
Cardinal Health, Inc. | | 6,593,300 | | | 227,271,051 |
Covidien, Ltd. | | 2,103,200 | | | 76,219,968 |
Health Management Associates, Inc.(a) | | 3,901,200 | | | 6,983,148 |
UnitedHealth Group, Inc. | | 9,109,700 | | | 242,318,020 |
WellPoint, Inc.(a) | | 7,349,900 | | | 309,651,287 |
| | | | | |
| | | | | 976,822,872 |
PHARMACEUTICALS, BIOTECHNOLOGY & LIFE SCIENCES: 12.4% |
Amgen, Inc.(a) | | 5,921,600 | | | 341,972,400 |
GlaxoSmithKline PLC ADR(b)
(United Kingdom) | | 8,300,500 | | | 309,359,635 |
Novartis AG ADR(b) (Switzerland) | | 8,218,300 | | | 408,942,608 |
Pfizer, Inc. | | 13,138,117 | | | 232,676,052 |
Sanofi-Aventis ADR(b) (France) | | 11,038,900 | | | 355,011,024 |
Wyeth | | 4,772,800 | | | 179,027,728 |
| | | | | |
| | | | | 1,826,989,447 |
| | | | | |
| | | | | 2,803,812,319 |
| | |
| PAGE 7 § DODGE & COX BALANCED FUND | | See accompanying Notes to Financial Statements |
| | |
| PORTFOLIO OF INVESTMENTS | | December 31, 2008 |
| | | | | |
| COMMON STOCKS (continued) | | | | |
| | |
| | | SHARES | | VALUE |
| INDUSTRIALS: 4.4% | | | | | |
CAPITAL GOODS: 2.3% | | | | | |
Eaton Corp. | | 182,706 | | $ | 9,082,315 |
General Electric Co. | | 16,187,400 | | | 262,235,880 |
Koninklijke Philips Electronics NV(b) (Netherlands) | | 650,600 | | | 12,927,422 |
Tyco International, Ltd. | | 2,472,100 | | | 53,397,360 |
| | | | | |
| | | | | 337,642,977 |
COMMERCIAL SERVICES & SUPPLIES: 0.6% | | | |
Pitney Bowes, Inc. | | 3,144,550 | | | 80,123,134 |
| | |
TRANSPORTATION: 1.5% | | | | | |
FedEx Corp. | | 3,491,150 | | | 223,957,273 |
| | | | | |
| | | | | 641,723,384 |
| |
| INFORMATION TECHNOLOGY: 12.2% | | | |
SEMICONDUCTORS & SEMICONDUCTOR EQUIPMENT: 0.5% |
Maxim Integrated Products, Inc. | | 7,042,000 | | | 80,419,640 |
| | |
SOFTWARE & SERVICES: 3.6% | | | | | |
Autodesk, Inc.(a) | | 96,100 | | | 1,888,365 |
BMC Software, Inc.(a) | | 2,520,560 | | | 67,828,269 |
Cadence Design Systems, Inc.(a) | | 9,739,500 | | | 35,646,570 |
Citrix Systems, Inc.(a) | | 2,642,610 | | | 62,286,318 |
Computer Sciences Corp.(a) | | 4,337,500 | | | 152,419,750 |
Compuware Corp.(a) | | 6,949,488 | | | 46,909,044 |
EBay, Inc.(a) | | 7,069,200 | | | 98,686,032 |
Synopsys, Inc.(a) | | 2,989,500 | | | 55,365,540 |
| | | | | |
| | | | | 521,029,888 |
TECHNOLOGY, HARDWARE & EQUIPMENT: 8.1% |
Hewlett-Packard Co. | | 14,260,912 | | | 517,528,496 |
Hitachi, Ltd. ADR(b) (Japan) | | 2,220,245 | | | 86,900,389 |
Kyocera Corp. ADR(b) (Japan) | | 856,200 | | | 61,963,194 |
Molex, Inc. | | 800,000 | | | 11,592,000 |
Molex, Inc., Class A | | 2,527,928 | | | 32,736,668 |
Motorola, Inc. | | 47,509,600 | | | 210,467,528 |
Sun Microsystems, Inc.(a) | | 4,248,233 | | | 16,228,250 |
Telefonaktiebologet LM Ericsson ADR(b) (Sweden) | | 2,412,300 | | | 18,840,063 |
Tyco Electronics, Ltd. | | 4,797,900 | | | 77,773,959 |
Xerox Corp. | | 18,721,050 | | | 149,206,769 |
| | | | | |
| | | | | 1,183,237,316 |
| | | | | |
| | | | | 1,784,686,844 |
| MATERIALS: 1.4% | | | | | |
Cemex SAB de CV ADR(b) (Mexico) | | 3,763,542 | | | 34,398,774 |
Domtar Corp.(a) | | 6,601,100 | | | 11,023,837 |
Dow Chemical Co. | | 8,960,259 | | | 135,210,308 |
Vulcan Materials Co. | | 291,356 | | | 20,272,551 |
| | | | | |
| | | | | 200,905,470 |
| TELECOMMUNICATION SERVICES: 0.4% |
Sprint Nextel Corp.(a) | | 33,567,200 | | | 61,427,976 |
| | | | | |
TOTAL COMMON STOCKS
(Cost $14,521,770,487) | | | | $ | 9,816,114,912 |
| | | | | | |
| PREFERRED STOCKS: 0.1% | | | | |
| | |
| | | SHARES | | VALUE |
| FINANCIALS: 0.1% | | | | | | |
DIVERSIFIED FINANCIALS: 0.1% | | | |
Preferred Blocker, Inc.
(a subsidiary of GMAC, LLC)(d),(g) | | | 81,809 | | $ | 16,361,785 |
| | | | | | |
TOTAL PREFERRED STOCKS
(Cost $16,361,785) | | | | | $ | 16,361,785 |
|
| FIXED INCOME SECURITIES: 30.9% |
| | |
| | | PAR VALUE | | VALUE |
| U.S. TREASURY AND GOVERNMENT RELATED: 1.7% |
GOVERNMENT RELATED: 1.7% | | | |
Arkansas Dev. Fin. Auth. GNMA Guaranteed Bonds 9.75%, 11/15/14 | | $ | 1,982,529 | | $ | 2,084,887 |
Small Business Administration — 504 Program | | | |
Series 96-20L, 6.70%, 12/1/16 | | | 1,432,159 | | | 1,498,344 |
Series 97-20F, 7.20%, 6/1/17 | | | 2,091,807 | | | 2,203,823 |
Series 97-20I, 6.90%, 9/1/17 | | | 2,966,711 | | | 3,105,632 |
Series 98-20D, 6.15%, 4/1/18 | | | 3,618,805 | | | 3,740,661 |
Series 98-20I, 6.00%, 9/1/18 | | | 2,290,057 | | | 2,358,690 |
Series 99-20F, 6.80%, 6/1/19 | | | 3,008,278 | | | 3,142,705 |
Series 00-20D, 7.47%, 4/1/20 | | | 8,233,564 | | | 8,738,454 |
Series 00-20E, 8.03%, 5/1/20 | | | 3,565,697 | | | 3,846,919 |
Series 00-20G, 7.39%, 7/1/20 | | | 5,322,009 | | | 5,655,450 |
Series 00-20I, 7.21%, 9/1/20 | | | 3,553,771 | | | 3,764,856 |
Series 01-20E, 6.34%, 5/1/21 | | | 8,295,204 | | | 8,683,114 |
Series 01-20G, 6.625%, 7/1/21 | | | 7,819,129 | | | 8,242,325 |
Series 03-20J, 4.92%, 10/1/23 | | | 16,314,617 | | | 16,557,935 |
Series 05-20F, 4.57%, 6/1/25 | | | 35,820,651 | | | 35,610,330 |
Series 05-20K, 5.36%, 11/1/25 | | | 30,183,287 | | | 31,156,677 |
Series 06-20D, 5.64%, 4/1/26 | | | 42,098,207 | | | 43,645,535 |
Series 06-20F, 5.82%, 6/1/26 | | | 46,638,884 | | | 49,034,020 |
Series 07-20F, 5.71%, 6/1/27 | | | 11,117,489 | | | 11,501,597 |
| | | | | | |
| | | | | | 244,571,954 |
| MORTGAGE-RELATED SECURITIES: 11.5% |
FEDERAL AGENCY CMO & REMIC: 1.6% | | | |
Dept. of Veterans Affairs | | | | | | |
Trust 1995-1A 1, 7.212%, 2/15/25 | | | 1,067,134 | | | 1,119,156 |
Trust 1995-2C 3A, 8.793%, 6/15/25 | | | 472,204 | | | 503,488 |
Fannie Mae | | | | | | |
SMBS I-1, 6.50%, 4/1/09 | | | 35 | | | 35 |
Trust 1993-207 G, 6.15%, 4/25/23 | | | 204,687 | | | 204,439 |
Trust 2001-T5 A3, 7.50%, 6/19/30 | | | 1,311,157 | | | 1,360,736 |
Trust 2002-33 A1, 7.00%, 6/25/32 | | | 4,132,777 | | | 4,348,459 |
Trust 2005-W4 1A2, 6.50%, 8/25/35 | | | 26,277,926 | | | 26,893,828 |
Trust 2001-T7 A1, 7.50%, 2/25/41 | | | 3,992,241 | | | 4,143,200 |
Trust 2001-T8 A1, 7.50%, 7/25/41 | | | 4,214,339 | | | 4,436,911 |
Trust 2001-T4 A1, 7.50%, 7/25/41 | | | 3,526,219 | | | 3,712,449 |
Trust 2001-W3 A, 7.00%, 9/25/41 | | | 3,383,709 | | | 3,560,298 |
Trust 2001-T10 A2, 7.50%, 12/25/41 | | | 4,268,386 | | | 4,493,812 |
Trust 2002-W6 2A1, 7.00%, 6/25/42 | | | 4,006,649 | | | 4,215,748 |
Trust 2002-W8 A2, 7.00%, 6/25/42 | | | 4,640,105 | | | 4,777,861 |
Trust 2003-W2 1A1, 6.50%, 7/25/42 | | | 8,609,587 | | | 8,811,378 |
Trust 2003-W2 1A2, 7.00%, 7/25/42 | | | 3,461,727 | | | 3,564,499 |
| | |
| See accompanying Notes to Financial Statements | | DODGE & COX BALANCED FUND §PAGE 8 |
| | |
| PORTFOLIO OF INVESTMENTS | | December 31, 2008 |
| | | | | | |
| FIXED INCOME SECURITIES (continued) |
| | |
| | | PAR VALUE | | VALUE |
Trust 2003-W4 4A, 7.50%, 10/25/42 | | $ | 5,059,136 | | $ | 5,326,325 |
Trust 2004-T1 1A2, 6.50%, 1/25/44 | | | 8,225,903 | | | 8,418,702 |
Trust 2004-W2 5A, 7.50%, 3/25/44 | | | 17,567,221 | | | 18,363,245 |
Trust 2004-W8 3A, 7.50%, 6/25/44 | | | 2,413,501 | | | 2,522,864 |
Freddie Mac | | | | | | |
Series 2100 GS, 6.50%, 12/15/13 | | | 4,787,596 | | | 5,013,072 |
Series 2430 UC, 6.00%, 9/15/16 | | | 7,160,372 | | | 7,323,305 |
Series 1078 GZ, 6.50%, 5/15/21 | | | 901,176 | | | 933,882 |
Series (GN) 16 PK, 7.00%, 8/25/23 | | | 10,337,309 | | | 10,995,259 |
Series T-48 1A4, 5.538%, 7/25/33 | | | 64,314,325 | | | 65,439,826 |
Series T-051 1A, 6.50%, 9/25/43 | | | 412,418 | | | 422,084 |
Series T-59 1A1, 6.50%, 10/25/43 | | | 25,925,630 | | | 26,820,562 |
| | | | | | |
| | | | | | 227,725,423 |
FEDERAL AGENCY MORTGAGE PASS-THROUGH: 9.9% |
Fannie Mae, 10 Year | | | | | | |
6.00%, 1/1/12-10/1/14 | | | 14,887,584 | | | 15,424,632 |
Fannie Mae, 15 Year | | | | | | |
5.50%, 4/1/18-6/1/18 | | | 26,213,832 | | | 27,188,424 |
6.00%, 3/1/14-3/1/22 | | | 126,521,850 | | | 131,797,199 |
6.50%, 1/1/13-11/1/18 | | | 106,113,849 | | | 110,361,410 |
7.00%, 7/1/11-11/1/18 | | | 7,854,574 | | | 8,142,467 |
7.50%, 9/1/15-8/1/17 | | | 36,196,713 | | | 37,908,448 |
Fannie Mae, 20 Year | | | | | | |
5.50%, 1/1/23 | | | 13,767,450 | | | 14,180,685 |
6.50%, 1/1/22-10/1/26 | | | 23,117,570 | | | 24,022,770 |
Fannie Mae, 30 Year | | | | | | |
6.00%, 8/25/32 | | | 23,488,469 | | | 24,188,554 |
6.50%, 12/1/32-11/1/37 | | | 274,222,408 | | | 283,146,051 |
7.00%, 8/1/37 | | | 23,186,414 | | | 24,303,780 |
7.50%, 8/1/10-7/1/19 | | | 9,855 | | | 10,078 |
Fannie Mae, Hybrid ARM | | | | | | |
3.845%, 6/1/34 | | | 41,364,948 | | | 39,922,794 |
4.423%, 7/1/33 | | | 25,758,576 | | | 26,334,042 |
4.661%, 9/1/34 | | | 13,852,479 | | | 13,945,072 |
4.741%, 3/1/35 | | | 16,535,171 | | | 16,644,518 |
4.748%, 1/1/35 | | | 8,800,629 | | | 8,899,037 |
4.759%, 12/1/34 | | | 14,041,680 | | | 14,084,186 |
4.824%, 8/1/35 | | | 9,242,202 | | | 9,361,246 |
5.061%, 7/1/35 | | | 40,665,264 | | | 41,211,658 |
5.551%, 5/1/36 | | | 44,491,224 | | | 45,302,919 |
5.865%, 1/1/35 | | | 6,982,483 | | | 7,043,905 |
Fannie Mae, Multifamily DUS | | | | | | |
Pool 555728, 4.021%, 8/1/13 | | | 327,950 | | | 324,832 |
Pool 555162, 4.826%, 1/1/13 | | | 14,821,184 | | | 15,107,412 |
Pool 760762, 4.89%, 4/1/12 | | | 16,115,000 | | | 16,365,219 |
Pool 555316, 4.918%, 2/1/13 | | | 4,270,743 | | | 4,361,662 |
Pool 735387, 4.921%, 4/1/15 | | | 12,125,203 | | | 12,392,142 |
Pool 555148, 4.977%, 1/1/13 | | | 3,655,883 | | | 3,740,304 |
Pool 555806, 5.097%, 10/1/13 | | | 3,253,437 | | | 3,349,506 |
Pool 461628, 5.32%, 4/1/14 | | | 10,220,995 | | | 10,623,485 |
Pool 462086, 5.355%, 11/1/15 | | | 20,898,883 | | | 21,683,030 |
Pool 545316, 5.63%, 12/1/11 | | | 4,701,449 | | | 4,882,811 |
Pool 545387, 5.896%, 1/1/12 | | | 5,509,397 | | | 5,759,310 |
Pool 545685, 5.931%, 4/1/12 | | | 22,939,960 | | | 24,035,733 |
| | | | | | |
| |
| | |
| | | PAR VALUE | | VALUE |
Pool 545258, 5.942%, 11/1/11 | | $ | 854,316 | | $ | 891,248 |
Pool 323492, 6.103%, 1/1/09 | | | 496,795 | | | 495,639 |
Freddie Mac, 30 Year | | | | | | |
8.00%, 11/1/10 | | | 28 | | | 28 |
8.75%, 5/1/10 | | | 3,726 | | | 3,794 |
Freddie Mac Gold, 15 Year | | | | | | |
6.00%, 10/1/13-10/1/18 | | | 66,794,061 | | | 69,167,213 |
6.50%, 7/1/14-3/1/18 | | | 43,061,898 | | | 44,622,652 |
7.00%, 8/1/09-4/1/15 | | | 238,685 | | | 245,830 |
7.75%, 7/25/21 | | | 1,194,586 | | | 1,255,215 |
Freddie Mac Gold, 20 Year
6.50%, 10/1/26 | | | 43,475,812 | | | 45,269,338 |
Freddie Mac Gold, 30 Year | | | | | | |
6.50%, 9/1/18-4/1/33 | | | 51,923,041 | | | 54,223,945 |
7.47%, 3/17/23 | | | 342,698 | | | 360,676 |
8.50%, 1/1/23 | | | 11,886 | | | 12,694 |
Freddie Mac Gold, Hybrid ARM | | | | | | |
3.796%, 5/1/34 | | | 15,373,380 | | | 15,311,046 |
4.80%, 10/1/35 | | | 24,592,098 | | | 24,721,837 |
4.84%, 5/1/35 | | | 75,383,048 | | | 76,841,400 |
5.389%, 11/1/35 | | | 44,745,302 | | | 45,424,803 |
6.297%, 11/1/36 | | | 28,717,585 | | | 29,535,392 |
Ginnie Mae, 30 Year | | | | | | |
7.50%, 11/15/24-10/15/25 | | | 3,590,616 | | | 3,796,262 |
7.97%, 4/15/20-1/15/21 | | | 1,934,276 | | | 2,063,858 |
| | | | | | |
| | | | | | 1,460,292,191 |
PRIVATE LABEL CMO & REMIC SECURITIES: 0.0%(e) |
Union Planters Mortgage Finance Corp.
| | | |
Series 2000-1 A1, 7.70%, 12/25/24 | | | 2,972,083 | | | 3,248,917 |
| | | | | | |
| | | | | | 1,691,266,531 |
| ASSET-BACKED SECURITIES: 0.1% | | | |
STUDENT LOAN: 0.1% | | | | | | |
SLM Student Loan Trust | | | | | | |
Series 2006-09 A2, 3.535%, 4/25/17 | | | 9,357,257 | | | 9,217,188 |
Series 2006-10 A2, 3.545%, 10/25/17 | | | 11,075,502 | | | 11,036,320 |
| | | | | | |
| | | | | | 20,253,508 |
| CORPORATE: 17.6% | | | | | | |
FINANCIALS: 8.3% | | | | | | |
American International Group, Inc.(d)
8.25%, 8/15/18 | | | 29,000,000 | | | 21,225,651 |
Bank of America Corp. | | | | | | |
5.30%, 3/15/17 | | | 42,000,000 | | | 39,880,092 |
8.00%, 12/15/26(c) | | | 17,355,000 | | | 13,495,039 |
5.625%, 3/8/35(c) | | | 10,000,000 | | | 8,321,887 |
6.625%, 5/23/36(c) | | | 41,040,000 | | | 39,000,014 |
Boston Properties, Inc. | | | | | | |
6.25%, 1/15/13 | | | 27,070,000 | | | 20,463,180 |
5.625%, 4/15/15 | | | 29,500,000 | | | 19,646,144 |
5.00%, 6/1/15 | | | 2,890,000 | | | 1,819,847 |
Capital One Financial Corp.
6.75%, 9/15/17 | | | 60,630,000 | | | 58,724,642 |
| | |
| PAGE 9 § DODGE & COX BALANCED FUND | | See accompanying Notes to Financial Statements |
| | |
| PORTFOLIO OF INVESTMENTS | | December 31, 2008 |
| | | | | | |
| FIXED INCOME SECURITIES (continued) |
| | |
| | | PAR VALUE | | VALUE |
CIGNA Corp. | | | | | | |
7.65%, 3/1/23 | | $ | 9,745,000 | | $ | 8,624,267 |
7.875%, 5/15/27 | | | 12,970,000 | | | 12,013,631 |
8.30%, 1/15/33 | | | 9,050,000 | | | 8,277,945 |
6.15%, 11/15/36 | | | 5,500,000 | | | 4,184,956 |
Citigroup, Inc.
6.125%, 11/21/17 | | | 35,000,000 | | | 35,368,900 |
General Electric Co.
3.323%, 11/1/12 | | | 190,000,000 | | | 164,095,658 |
GMAC, LLC(d),(i) | | | | | | |
6.875%, 9/15/11 | | | 170,940,000 | | | 140,044,304 |
6.875%, 8/28/12 | | | 17,070,000 | | | 13,102,648 |
8.00%, 11/1/31 | | | 167,712,000 | | | 99,686,336 |
Health Net, Inc.
6.375%, 6/1/17 | | | 18,675,000 | | | 7,422,530 |
HSBC Holdings PLC(b) (United Kingdom) | | | |
6.50%, 5/2/36 | | | 23,000,000 | | | 23,352,130 |
6.50%, 9/15/37 | | | 45,000,000 | | | 45,701,325 |
JPMorgan Chase & Co.(c) | | | | | | |
8.75%, 9/1/30 | | | 28,187,000 | | | 27,759,741 |
5.85%, 8/1/35 | | | 5,955,000 | | | 4,614,146 |
Kaupthing Bank HF(b),(d),(h) (Iceland)
7.125%, 5/19/16 | | | 65,060,000 | | | 19,518 |
Liberty Mutual Group, Inc.(d)
4.875%, 2/1/10 | | | 15,131,000 | | | 14,477,573 |
SLM Corp.
8.45%, 6/15/18 | | | 50,000,000 | | | 39,809,466 |
Travelers Cos., Inc. | | | | | | |
5.00%, 3/15/13 | | | 9,750,000 | | | 9,234,554 |
5.50%, 12/1/15 | | | 9,160,000 | | | 8,738,486 |
6.25%, 6/20/16 | | | 22,000,000 | | | 21,893,188 |
Unum Group | | | | | | |
7.625%, 3/1/11 | | | 8,426,000 | | | 8,306,957 |
6.85%, 11/15/15(d) | | | 10,200,000 | | | 8,340,826 |
7.19%, 2/1/28 | | | 8,500,000 | | | 6,792,546 |
7.25%, 3/15/28 | | | 12,130,000 | | | 9,751,295 |
6.75%, 12/15/28 | | | 11,633,000 | | | 8,804,517 |
Wachovia Corp. | | | | | | |
3.964%, 4/23/12 | | | 186,000,000 | | | 163,082,269 |
6.00%, 11/15/17 | | | 46,000,000 | | | 44,790,118 |
WellPoint, Inc. | | | | | | |
5.00%, 12/15/14 | | | 13,070,000 | | | 11,651,334 |
5.25%, 1/15/16 | | | 50,000,000 | | | 44,262,850 |
5.875%, 6/15/17 | | | 1,275,000 | | | 1,160,422 |
| | | | | | |
| | | | | | 1,217,940,932 |
INDUSTRIALS: 7.5% | | | | | | |
Boston Scientific Corp. | | | | | | |
5.45%, 6/15/14 | | | 24,085,000 | | | 20,592,675 |
6.25%, 11/15/15 | | | 1,075,000 | | | 903,000 |
6.40%, 6/15/16 | | | 21,905,000 | | | 18,728,775 |
Comcast Corp. | | | | | | |
5.30%, 1/15/14 | | | 63,050,000 | | | 58,959,946 |
5.85%, 11/15/15 | | | 26,500,000 | | | 25,066,217 |
5.90%, 3/15/16 | | | 3,180,000 | | | 3,036,312 |
| | | | | | |
| |
| | |
| | | PAR VALUE | | VALUE |
Cox Communications, Inc. | | | | | | |
5.45%, 12/15/14 | | $ | 75,530,000 | | $ | 66,055,517 |
5.50%, 10/1/15 | | | 4,815,000 | | | 4,294,210 |
5.875%, 12/1/16(d) | | | 25,145,000 | | | 22,361,172 |
Dillard’s, Inc. | | | | | | |
7.85%, 10/1/12 | | | 14,000,000 | | | 8,820,000 |
7.13%, 8/1/18 | | | 10,831,000 | | | 3,899,160 |
7.875%, 1/1/23 | | | 8,860,000 | | | 2,790,900 |
7.75%, 7/15/26 | | | 50,000 | | | 13,750 |
7.75%, 5/15/27 | | | 550,000 | | | 151,250 |
7.00%, 12/1/28 | | | 15,490,000 | | | 4,724,450 |
Dow Chemical Co. | | | | | | |
4.027%, 9/30/09(d) | | | 33,950,000 | | | 33,525,897 |
7.375%, 11/1/29 | | | 20,170,000 | | | 18,995,642 |
Ford Motor Credit Co.(i) | | | | | | |
7.375%, 2/1/11 | | | 166,700,000 | | | 125,025,000 |
7.25%, 10/25/11 | | | 118,160,000 | | | 87,438,400 |
HCA, Inc. | | | | | | |
8.75%, 9/1/10 | | | 7,750,000 | | | 7,440,000 |
7.875%, 2/1/11 | | | 23,798,000 | | | 20,942,240 |
6.95%, 5/1/12 | | | 50,090,000 | | | 41,073,800 |
6.30%, 10/1/12 | | | 11,400,000 | | | 8,037,000 |
6.25%, 2/15/13 | | | 47,740,000 | | | 29,837,500 |
6.75%, 7/15/13 | | | 27,400,000 | | | 17,262,000 |
5.75%, 3/15/14 | | | 20,420,000 | | | 11,384,150 |
6.50%, 2/15/16 | | | 12,000,000 | | | 7,380,000 |
Hewlett-Packard Co.
6.125%, 3/1/14 | | | 63,200,000 | | | 67,181,726 |
Lafarge SA(b) (France)
6.50%, 7/15/16 | | | 33,715,000 | | | 22,770,062 |
Liberty Media Corp. | | | | | | |
8.50%, 7/15/29 | | | 9,682,000 | | | 5,482,432 |
8.25%, 2/1/30 | | | 7,461,000 | | | 4,224,791 |
Macy’s, Inc. | | | | | | |
7.625%, 8/15/13 | | | 5,900,000 | | | 4,208,405 |
7.45%, 10/15/16 | | | 11,675,000 | | | 7,466,980 |
6.65%, 7/15/24 | | | 12,895,000 | | | 7,078,169 |
6.90%, 4/1/29 | | | 8,080,000 | | | 4,346,395 |
6.90%, 1/15/32 | | | 55,984,000 | | | 30,669,435 |
6.70%, 7/15/34 | | | 8,380,000 | | | 4,580,189 |
Sprint Nextel Corp. | | | | | | |
6.00%, 12/1/16 | | | 39,585,000 | | | 27,459,427 |
6.875%, 11/15/28 | | | 10,085,000 | | | 5,959,919 |
Time Warner Cable, Inc.(i)
8.75%, 2/14/19 | | | 8,000,000 | | | 8,698,680 |
Time Warner, Inc. | | | | | | |
7.625%, 4/15/31 | | | 90,055,000 | | | 88,798,325 |
7.70%, 5/1/32 | | | 55,490,000 | | | 55,558,419 |
Xerox Corp.
6.875%, 8/15/11 | | | 126,380,000 | | | 109,243,757 |
| | | | | | |
| | | | | | 1,102,466,074 |
| | |
| See accompanying Notes to Financial Statements | | DODGE & COX BALANCED FUND §PAGE 10 |
| | |
| PORTFOLIO OF INVESTMENTS | | December 31, 2008 |
| | | | | | |
| FIXED INCOME SECURITIES (continued) |
| | |
| | | PAR VALUE | | VALUE |
TRANSPORTATION: 1.8% | | | | | | |
Burlington Northern Santa Fe Corp. | | | | | | |
4.30%, 7/1/13 | | $ | 7,320,000 | | $ | 6,793,275 |
8.251%, 1/15/21 | | | 1,286,999 | | | 1,423,546 |
4.967%, 4/1/23 | | | 12,468,982 | | | 11,626,317 |
5.72%, 1/15/24 | | | 23,742,449 | | | 23,090,689 |
5.629%, 4/1/24 | | | 27,296,161 | | | 26,322,676 |
5.342%, 4/1/24 | | | 17,629,321 | | | 17,130,092 |
5.996%, 4/1/24 | | | 23,750,283 | | | 22,543,999 |
CSX Corp.
9.75%, 6/15/20 | | | 5,351,000 | | | 6,065,492 |
FedEx Corp.
6.72%, 7/15/23 | | | 16,017,000 | | | 15,362,515 |
Norfolk Southern Corp. | | | | | | |
7.70%, 5/15/17 | | | 10,000,000 | | | 10,719,160 |
9.75%, 6/15/20 | | | 7,389,000 | | | 8,694,193 |
Union Pacific Corp. | | | | | | |
6.125%, 1/15/12 | | | 15,720,000 | | | 15,307,303 |
6.50%, 4/15/12 | | | 3,550,000 | | | 3,644,661 |
5.375%, 5/1/14 | | | 2,935,000 | | | 2,768,462 |
4.875%, 1/15/15 | | | 8,320,000 | | | 7,604,813 |
6.33%, 1/2/20 | | | 29,968,939 | | | 30,558,173 |
5.866%, 7/2/30 | | | 36,638,899 | | | 34,374,080 |
6.176%, 1/2/31 | | | 12,073,484 | | | 11,872,807 |
| | | | | | |
| | | | | | 255,902,253 |
| | | | | | |
| | | | | | 2,576,309,259 |
| | | | | | |
TOTAL FIXED INCOME SECURITIES
(Cost $4,959,505,876) | | $ | 4,532,401,252 |
| | | | | | | |
| SHORT-TERM INVESTMENTS: 1.5% |
| | |
| | | PAR VALUE | | | VALUE |
MONEY MARKET FUND: 0.3% | | | | |
SSgA Prime Money Market Fund | | $ | 43,948,888 | | | $ | 43,948,888 |
|
REPURCHASE AGREEMENT: 1.2% |
Fixed Income Clearing Corporation(f) 0.01%, 1/2/09,
maturity value $176,925,098 | | | 176,925,000 | | | | 176,925,000 |
| | | | | | | |
TOTAL SHORT-TERM INVESTMENTS
(Cost $220,873,888) | | | $ | 220,873,888 |
| | | | | | | |
TOTAL INVESTMENTS
(Cost $19,718,512,036) | | | 99.4 | % | | $ | 14,585,751,837 |
OTHER ASSETS LESS LIABILITIES | | | 0.6 | % | | | 90,029,924 |
| | | | | | | |
| NET ASSETS | | | 100.0 | % | | $ | 14,675,781,761 |
| | | | | | | |
(b) | Security issued by a foreign entity, denominated in U.S. dollars |
(c) | Cumulative preferred security |
(d) | Security exempt from registration under Rule 144A of the Securities Act of 1933. The security may be resold in transactions exempt from registration, normally to qualified institutional buyers. As of December 31, 2008, all such securities in total represented $369,145,710 or 2.5% of net assets. |
(f) | Repurchase agreement is collateralized by Fannie Mae 5.125%, 4/15/11; Federal Home Loan Bank 3.00%-3.375%, 10/20/10-12/10/10; and Freddie Mac 4.75%, 1/18/11. Total collateral value is $180,468,431. |
(g) | Priced at fair value on December 31, 2008. See Notes 1 and 2. |
(h) | Non-income producing/security in default. On October 9, 2008, Kaupthing Bank requested protection under the Icelandic Financial Supervisory Authority, which has appointed a resolution committee to oversee the affairs of Kaupthing, including supervision of its assets and business operations. |
(i) | Subsidiary (see Note below) |
| | Note: Fixed income securities are grouped by parent company unless otherwise noted. Actual securities may be issued by the listed parent company or one of its subsidiaries. |
ADR: American Depositary Receipt
ARM: Adjustable Rate Mortgage
CMO: Collateralized Mortgage Obligation
DUS: Delegated Underwriting and Servicing
REMIC: Real Estate Mortgage Investment Conduit
| | |
| PAGE 11 § DODGE & COX BALANCED FUND | | See accompanying Notes to Financial Statements |
| | | | |
STATEMENT OF ASSETS AND LIABILITIES | |
| |
| | | December 31, 2008 | |
ASSETS: | | | | |
Investments, at value (cost $19,718,512,036) | | $ | 14,585,751,837 | |
Receivable for investments sold | | | 29,341,869 | |
Receivable for paydowns on mortgage-backed securities | | | 2,804,459 | |
Receivable for Fund shares sold | | | 14,663,234 | |
Dividends and interest receivable | | | 92,230,359 | |
Prepaid expenses and other assets | | | 130,776 | |
| | | | |
| | | 14,724,922,534 | |
| | | | |
LIABILITIES: | | | | |
Payable for investments purchased | | | 2,926,568 | |
Payable for Fund shares redeemed | | | 38,942,730 | |
Management fees payable | | | 5,920,334 | |
Accrued expenses | | | 1,351,141 | |
| | | | |
| | | 49,140,773 | |
| | | | |
NET ASSETS | | $ | 14,675,781,761 | |
| | | | |
NET ASSETS CONSIST OF: | | | | |
Paid in capital | | $ | 20,112,482,951 | |
Undistributed net investment income | | | 12,638,299 | |
Accumulated net realized loss on investments | | | (316,579,290 | ) |
Net unrealized depreciation on investments | | | (5,132,760,199 | ) |
| | | | |
| | $ | 14,675,781,761 | |
| | | | |
Fund shares outstanding (par value $0.01 each, unlimited shares authorized) | | | 286,281,443 | |
Net asset value per share | | | $51.26 | |
| |
STATEMENT OF OPERATIONS | | | | |
| |
| | | Year Ended
December 31, 2008 | |
INVESTMENT INCOME: | | | | |
Dividends (net of foreign taxes of $6,680,543) | | $ | 342,134,806 | |
Interest | | | 382,341,369 | |
| | | | |
| | | 724,476,175 | |
| | | | |
EXPENSES: | | | | |
Management fees | | | 107,349,279 | |
Custody and fund accounting fees | | | 344,565 | |
Transfer agent fees | | | 3,380,793 | |
Professional services | | | 136,341 | |
Shareholder reports | | | 1,006,884 | |
Registration fees | | | 176,679 | |
Trustees’ fees | | | 151,188 | |
Miscellaneous | | | 561,764 | |
| | | | |
| | | 113,107,493 | |
| | | | |
NET INVESTMENT INCOME | | | 611,368,682 | |
| | | | |
REALIZED AND UNREALIZED LOSS ON INVESTMENTS: | | | | |
Net realized loss | | | (308,295,854 | ) |
Net change in unrealized appreciation/depreciation | | | (8,641,036,762 | ) |
| | | | |
Net realized and unrealized loss | | | (8,949,332,616 | ) |
| | | | |
NET DECREASE IN NET ASSETS FROM OPERATIONS | | $ | (8,337,963,934 | ) |
| | | | |
| | | | | | | | |
STATEMENT OF CHANGES IN NET ASSETS | |
| | |
| | | Year Ended
December 31, 2008 | | | Year Ended
December 31, 2007 | |
OPERATIONS: | | | | | | | | |
Net investment income | | $ | 611,368,682 | | | $ | 736,458,997 | |
Net realized gain/(loss) | | | (308,295,854 | ) | | | 1,956,206,007 | |
Net change in unrealized appreciation/depreciation | | | (8,641,036,762 | ) | | | (2,205,494,423 | ) |
| | | | | | | | |
Net increase/(decrease) in net assets from operations | | | (8,337,963,934 | ) | | | 487,170,581 | |
| | | | | | | | |
| |
DISTRIBUTIONS TO SHAREHOLDERS FROM: | | | | | |
Net investment income | | | (607,013,818 | ) | | | (755,711,777 | ) |
Net realized gain | | | (433,264,664 | ) | | | (1,662,945,292 | ) |
| | | | | | | | |
Total distributions | | | (1,040,278,482 | ) | | | (2,418,657,069 | ) |
| | | | | | | | |
| | |
FUND SHARE TRANSACTIONS: | | | | | | | | |
Proceeds from sale of shares | | | 2,553,747,909 | | | | 3,783,203,996 | |
Reinvestment of distributions | | | 994,817,279 | | | | 2,319,059,647 | |
Cost of shares redeemed | | | (6,426,914,208 | ) | | | (4,696,208,213 | ) |
| | | | | | | | |
Net increase/(decrease) from Fund share transactions | | | (2,878,349,020 | ) | | | 1,406,055,430 | |
| | | | | | | | |
Total decrease in net assets | | | (12,256,591,436 | ) | | | (525,431,058 | ) |
| | |
NET ASSETS: | | | | | | | | |
Beginning of year | | | 26,932,373,197 | | | | 27,457,804,255 | |
| | | | | | | | |
End of year (including undistributed net investment income of $12,638,299 and $0, respectively) | | $ | 14,675,781,761 | | | $ | 26,932,373,197 | |
| | | | | | | | |
| | |
SHARE INFORMATION: | | | | | | | | |
Shares sold | | | 37,021,532 | | | | 42,672,570 | |
Distributions reinvested | | | 14,719,733 | | | | 27,828,536 | |
Shares redeemed | | | (97,962,966 | ) | | | (53,297,703 | ) |
| | | | | | | | |
Net increase/(decrease) in shares outstanding | | | (46,221,701 | ) | | | 17,203,403 | |
| | | | | | | | |
| | |
| See accompanying Notes to Financial Statements | | DODGE & COX BALANCED FUND §PAGE 12 |
NOTES TO FINANCIAL STATEMENTS
NOTE 1—ORGANIZATION AND SIGNIFICANT ACCOUNTING POLICIES
Dodge & Cox Balanced Fund (the “Fund”) is one of the series constituting the Dodge & Cox Funds (the “Trust” or the “Funds”). The Trust is organized as a Delaware statutory trust and is registered under the Investment Company Act of 1940, as amended, as a diversified, open-end management investment company. The Fund commenced operations on June 26, 1931, and seeks regular income, conservation of principal and an opportunity for long-term growth of principal and income. Risk considerations and investment strategies of the Fund are discussed in the Fund’s Prospectus.
The financial statements have been prepared in conformity with accounting principles generally accepted in the United States of America, which require the use of estimates and assumptions by management. Significant accounting policies are as follows:
Security valuation The Fund’s net assets are valued as of the close of trading on the New York Stock Exchange (NYSE), generally 4:00 p.m. Eastern Time, each day that the NYSE is open for business. Stocks are valued at the official quoted close price or the last sale of the day at the close of the NYSE or, if not available, at the mean between the exchange-listed bid and ask prices for the day. A security that is listed or traded on more than one exchange is valued at the quotation on the exchange determined to be the primary market for such security. Fixed income securities with original maturities of one year or more are priced on the basis of valuations furnished by pricing services which utilize both dealer-supplied valuations and computerized pricing models. Under certain circumstances, fixed income securities that are not valued by pricing services are temporarily valued by the investment manager utilizing both dealer-supplied valuations and computerized pricing models. Valuations of fixed income securities take into account appropriate factors such as institutional-size trading markets in similar groups of securities, yield, quality, coupon rate, maturity, type of issue, trading characteristics and other market data and do not rely exclusively upon exchange or over-the-counter listed prices. Security values are not discounted based on the size of the Fund’s position. Securities for which market
quotations are not readily available are valued at fair value as determined in good faith by or at the direction of the Board of Trustees. Short-term securities are valued at amortized cost which approximates current value. All securities held by the Fund are denominated in U.S. dollars.
Security transactions, investment income, expenses, and distributions Security transactions are recorded on the trade date. Realized gains and losses on securities sold are determined on the basis of identified cost.
Dividend income and corporate action transactions are recorded on the ex-dividend date, except for certain dividends or corporate actions from foreign securities where the ex-dividend date may have passed, which are recorded as soon as the Fund is informed of the ex-dividend date. Withholding taxes on foreign dividends have been provided for in accordance with the Fund’s understanding of the applicable country’s tax rules and rates. Non-cash dividends included in dividend income, if any, are recorded at the fair market value of the securities received. Distributions received in excess of income are recorded as a reduction of cost of investments and/or realized gain.
Interest income is recorded on the accrual basis. Interest income includes coupon interest, amortization of premium and accretion of discount on debt securities, and gain/loss on paydowns of mortgage-backed securities. The ability of the issuers of the debt securities held by the Fund to meet their obligations may be affected by economic developments in a specific industry, state or region. Debt obligations may be placed on non-accrual status and related interest income may be reduced by ceasing current accruals and writing off interest receivables when the collection of all or a portion of interest has become doubtful. A debt obligation is removed from non-accrual status when the issuer resumes interest payments or when collectibility of interest is reasonably assured.
Expenses are recorded on the accrual basis. Most expenses of the Trust can be directly attributed to a specific series. Expenses which cannot be directly attributed are allocated among the Funds in the Trust.
Distributions to shareholders are recorded on the ex-dividend date.
PAGE 13 § DODGE & COX BALANCED FUND
NOTES TO FINANCIAL STATEMENTS
Repurchase agreements The Fund may enter into repurchase agreements, secured by U.S. government or agency securities, which involve the purchase of securities from a counterparty with a simultaneous commitment to resell the securities at an agreed-upon date and price. It is the Fund’s policy that its custodian take possession of the underlying collateral securities, the fair value of which exceeds the principal amount of the repurchase transaction, including accrued interest, at all times. In the event of default by the counterparty, the Fund has the contractual right to liquidate the collateral securities and to apply the proceeds in satisfaction of the obligation.
NOTE 2—VALUATION MEASUREMENTS
Various inputs are used in determining the value of the Fund’s investments. These inputs are summarized in the three broad levels listed below.
| § | | Level 1: Quoted prices in active markets for identical securities |
| § | | Level 2: Other significant observable inputs (including quoted prices for similar securities, market indices, interest rates, credit risk, etc.) |
| § | | Level 3: Significant unobservable inputs (including the Fund’s own assumptions in determining the fair value of investments) |
The inputs or methodology used for valuing securities are not necessarily an indication of the risk associated with investing in those securities.
The following is a summary of the inputs used to value the Fund’s net assets as of December 31, 2008:
| | | |
| Valuation Inputs | | Investments in Securities |
Level 1: Quoted Prices | | $ | 9,860,063,800 |
Level 2: Other Significant Observable Inputs | | | 4,709,326,252 |
Level 3: Significant Unobservable Inputs* | | | 16,361,785 |
| | | |
Total | | $ | 14,585,751,837 |
| | | |
| | | | |
| * | | Represents preferred shares (Preferred Blocker, Inc., a subsidiary of GMAC, LLC) received on December 31, 2008 pursuant to an exchange offer. Beginning in early January 2009, quoted prices were used to value these shares. |
NOTE 3—RELATED PARTY TRANSACTIONS
Management fees Under a written agreement approved by a unanimous vote of the Board of Trustees, the Fund pays an annual management fee of 0.50% of the Fund’s average daily net assets to Dodge & Cox, investment manager of the Fund.
Fund officers and trustees All officers and three of the trustees of the Trust are officers or employees of Dodge & Cox. The Trust pays a fee only to those trustees who are not affiliated with Dodge & Cox.
Indemnification Under the Trust’s organizational documents, its officers and trustees are indemnified against certain liabilities arising out of the performance of their duties to the Trust. In addition, in the normal course of business the Trust enters into contracts that provide general indemnities to other parties. The Trust’s maximum exposure under these arrangements is unknown as this would involve future claims that may be made against the Trust that have not yet occurred.
NOTE 4—INCOME TAX INFORMATION AND DISTRIBUTIONS TO SHAREHOLDERS
A provision for federal income taxes is not required since the Fund intends to continue to qualify as a regulated investment company under Subchapter M of the Internal Revenue Code and distribute all of its taxable income to shareholders. Distributions are determined in accordance with income tax regulations, which may differ from net investment income and realized gains for financial reporting purposes. Financial reporting records are adjusted for permanent book/tax differences to reflect tax character.
Book/tax differences are primarily due to differing treatments of wash sales, net short-term realized gain/(loss), paydown loss, and defaulted fixed income securities. At December 31, 2008, the cost of investments for federal income tax purposes was $19,728,289,898.
DODGE & COX BALANCED FUND §PAGE 14
NOTES TO FINANCIAL STATEMENTS
Distributions for the years ended December 31, 2008 and 2007 were characterized as follows for federal income tax purposes:
| | | | |
| | | Year Ended
December 31, 2008 | | Year Ended
December 31, 2007 |
Ordinary income | | $611,773,389 | | $822,777,430 |
| | ($1.965 per share) | | ($2.575 per share) |
| | |
Long-term capital gain | | $428,505,093 | | $1,595,879,639 |
| | ($1.328 per share) | | ($5.072 per share) |
At December 31, 2008, the tax basis components of distributable earnings were as follows:
| | | | |
Unrealized appreciation | | $ | 940,261,926 | |
Unrealized depreciation | | | (6,082,799,987 | ) |
| | | | |
Net unrealized depreciation | | | (5,142,538,061 | ) |
Undistributed ordinary income | | | 12,638,299 | |
Capital loss carryforward* | | | (32,015,139 | ) |
Deferred loss** | | | (272,906,326 | ) |
| * | Represents accumulated capital loss which may be carried forward to offset future capital gains. If not utilized, the capital loss carryforward will expire in 2016. |
| ** | Represents net realized loss incurred between November 1, 2008 and December 31, 2008. As permitted by tax regulations, the Fund has elected to treat this loss as arising in 2009. |
NOTE 5—COMMITTED LINE OF CREDIT
The Fund participates with the Funds in a $200 million committed credit facility (“Line of Credit”) with State Street Bank and Trust Company to be utilized for temporary or emergency purposes to fund shareholder redemptions or for other short-term liquidity purposes. Interest on borrowings is charged at the prevailing rate. There were no borrowings on the Line of Credit during the year.
NOTE 6—PURCHASES AND SALES OF INVESTMENTS
For the year ended December 31, 2008, purchases and sales of securities, other than short-term securities and U.S. government securities, aggregated $5,670,314,476 and $5,949,745,764, respectively. For the year ended December 31, 2008, purchases and sales of U.S. government securities aggregated $52,609,045 and $3,077,607,712, respectively.
NOTE 7—ACCOUNTING PRONOUNCEMENTS
Effective June 29, 2007, the Fund adopted, the Financial Accounting Standards Board (FASB) Interpretation No. 48, “Accounting for Uncertainty in Income Taxes” (FIN 48). FIN 48 clarifies the accounting for income taxes by prescribing the minimum recognition threshold a tax position must meet before being recognized in the financial statements. At December 31, 2008, FIN 48 was applied to the period from January 1, 2005 through December 31, 2008, the open tax years subject to regulatory examination. There was no impact to the Fund’s financial statements as a result of applying FIN 48.
Effective January 1, 2009, the Fund will adopt “Statement of Financial Accounting Standards No. 161, Disclosures about Derivative Instruments and Hedging Activities” (FAS 161). FAS 161 requires enhanced disclosures about the Fund’s derivative and hedging activities. Management expects that implementation of FAS 161 will not significantly impact the Fund’s financial statement disclosures.
PAGE 15 § DODGE & COX BALANCED FUND
FINANCIAL HIGHLIGHTS
| | | | | | | | | | | | | | | |
SELECTED DATA AND RATIOS (for a share outstanding throughout each year) | | Year Ended December 31, | |
| | | 2008 | | | 2007 | | | 2006 | | | 2005 | | | 2004 | |
Net asset value, beginning of year | | $81.00 | | | $87.08 | | | $81.34 | | | $79.35 | | | $73.04 | |
Income from investment operations: | | | | | | | | | | | | | | | |
Net investment income | | 1.99 | | | 2.35 | | | 2.21 | | | 1.84 | | | 1.60 | |
Net realized and unrealized gain (loss) | | (28.44 | ) | | (0.78 | ) | | 8.93 | | | 3.31 | | | 7.99 | |
| | | |
Total from investment operations | | (26.45 | ) | | 1.57 | | | 11.14 | | | 5.15 | | | 9.59 | |
| | | |
Distributions to shareholders from: | | | | | | | | | | | | | | | |
Net investment income | | (1.95 | ) | | (2.37 | ) | | (2.20 | ) | | (1.84 | ) | | (1.60 | ) |
Net realized gain | | (1.34 | ) | | (5.28 | ) | | (3.20 | ) | | (1.32 | ) | | (1.68 | ) |
| | | |
Total distributions | | (3.29 | ) | | (7.65 | ) | | (5.40 | ) | | (3.16 | ) | | (3.28 | ) |
| | | |
Net asset value, end of year | | $51.26 | | | $81.00 | | | $87.08 | | | $81.34 | | | $79.35 | |
| | | |
Total return | | (33.57 | )% | | 1.74 | % | | 13.84 | % | | 6.59 | % | | 13.31 | % |
Ratios/supplemental data: | | | | | | | | | | | | | | | |
Net assets, end of year (millions) | | $14,676 | | | $26,932 | | | $27,458 | | | $23,611 | | | $20,741 | |
Ratio of expenses to average net assets | | 0.53 | % | | 0.53 | % | | 0.52 | % | | 0.53 | % | | 0.54 | % |
Ratio of net investment income to average net assets | | 2.85 | % | | 2.59 | % | | 2.52 | % | | 2.15 | % | | 1.97 | % |
Portfolio turnover rate | | 27 | % | | 27 | % | | 20 | % | | 18 | % | | 18 | % |
See accompanying Notes to Financial Statements
REPORT OF INDEPENDENT REGISTERED PUBLIC ACCOUNTING FIRM
To the Trustees of Dodge & Cox Funds and Shareholders of Dodge & Cox Balanced Fund
In our opinion, the accompanying statement of assets and liabilities, including the portfolio of investments, and the related statements of operations and of changes in net assets and the financial highlights present fairly, in all material respects, the financial position of Dodge & Cox Balanced Fund (the “Fund”, one of the series constituting Dodge & Cox Funds) at December 31, 2008, the results of its operations for the year then ended, the changes in its net assets for each of the two years in the period then ended and the financial highlights for each of the five years in the period then ended, in conformity with accounting principles generally accepted in the United States of America. These financial statements and financial highlights (hereafter referred to as “financial statements”) are the responsibility of the Fund’s management; our responsibility is to express an opinion on these financial statements based on our audits. We conducted our audits of these financial statements in accordance with the standards of the Public Company Accounting Oversight Board (United States). Those standards require that we plan and perform the audit to obtain reasonable assurance about whether the financial statements are free of material misstatement. An audit includes examining, on a test basis, evidence supporting the amounts and disclosures in the financial statements, assessing the accounting principles used and significant estimates made by management, and evaluating the overall financial statement presentation. We believe that our audits, which included confirmation of securities at December 31, 2008 by correspondence with the custodian and brokers, provide a reasonable basis for our opinion.
PricewaterhouseCoopers LLP
San Francisco, California
February 13, 2009
DODGE & COX BALANCED FUND §PAGE 16
SPECIAL 2008 TAX INFORMATION
(unaudited)
The following information is provided pursuant to provisions of the Internal Revenue Code:
The Fund designates $345,481,697 of its distributions paid to shareholders in 2008 as qualified dividends (treated for federal income tax purposes in the hands of shareholders as taxable at a maximum rate of 15%).
For shareholders that are corporations, the Fund designates 38% of its ordinary dividends (including short-term gains) paid to shareholders in 2008 as dividends from domestic corporations eligible for the corporate dividends received deduction, provided that the shareholder otherwise satisfies applicable requirements to claim that deduction.
BOARD APPROVAL OF FUNDS’ INVESTMENT MANAGEMENT AGREEMENTS AND MANAGEMENT FEES
(unaudited)
The Board of Trustees is responsible for overseeing the performance of the Dodge & Cox Funds’ investment manager and determining whether to continue the Investment Management Agreements between the Funds and Dodge & Cox each year (the “Agreements”). At a meeting of the Board of Trustees of the Trust held on December 15, 2008, the Trustees, by a unanimous vote (including a separate vote of those Trustees who are not “interested persons” (as defined in the Investment Company Act of 1940) (the “Independent Trustees”)), approved the renewal of the Agreements for an additional one-year term through December 31, 2009. During the course of the year, the Board received a wide variety of materials relating to the services provided by Dodge & Cox and the performance of the Funds.
INFORMATION RECEIVED
In advance of the meeting, the Board, including each of the Independent Trustees, requested, received and reviewed materials relating to the Agreements. The Independent Trustees retained Morningstar® to prepare an independent expense and performance summary for each Fund and comparable funds managed by other advisers identified by Morningstar®. The Morningstar® materials included information regarding advisory fee rates, expense ratios, and transfer agency, custodial and distribution
expenses, as well as appropriate performance comparisons to an index or combination of indices. The materials reviewed by the Board also included information concerning Dodge & Cox’s profitability, financial results and condition, including advisory fee revenue and separate account advisory fee schedules. The Board additionally considered the Funds’ brokerage commissions, turnover rates and sales and redemption data for the Funds, including “soft dollar” payments made for research benefiting the Funds and other accounts managed by Dodge & Cox, and brokerage commissions and expenses paid by Dodge & Cox. Other aspects of Dodge & Cox’s services to the Funds which were reviewed included compliance and supervision of third-party service providers (e.g., custodian, fund accountant, transfer agent and state registration administrator), shareholder servicing, accounting and administrative services, web services, the character of non-advisory services, the record of compliance with the Funds’ investment policies and restrictions and the Funds’ Code of Ethics, investment management staffing and biographies, information furnished to investors and shareholders (including the Funds’ Prospectus, Statement of Additional Information, shareholder reports, and quarterly reports), and third-party retirement plan administrator reimbursements by Dodge & Cox for the same periods.
The Board received copies of the Agreements and a memorandum from the Independent Legal Counsel to the Independent Trustees, discussing the factors generally regarded as appropriate to consider in evaluating advisory arrangements. The Trust’s Contract Review Committee, consisting solely of Independent Trustees, met with the Independent Legal Counsel on December 3, 2008 and again on December 15, 2008 to discuss whether to renew the Agreements. The Board, including the Independent Trustees, subsequently concluded that the existing Agreements are fair and reasonable and voted to approve the Agreements.
In considering the Agreements, the Board, including the Independent Trustees, did not identify any single factor or particular information as all-important or controlling. In reaching the decision to approve the Agreements, the Board, which was advised by Independent Legal Counsel, considered the following factors, among others, and reached the conclusions described below.
PAGE 17 § DODGE & COX BALANCED FUND
NATURE, QUALITY, AND EXTENT OF THE SERVICES
The Board considered that Dodge & Cox provides a wide range of services to the Funds in addition to portfolio management and that the quality of these services has been excellent in all respects. The extensive nature of services provided by Dodge & Cox has been documented in materials provided to the Board and in presentations made to the Board throughout the year. In particular, the Board considered the nature, quality and extent of portfolio management, administrative and shareholder services performed by Dodge & Cox, including: Dodge & Cox’s established long-term history of care and conscientiousness in the management of the Funds; demonstrated consistency in investment approach and depth, background and experience of the Dodge & Cox Investment Policy Committee, International Investment Policy Committee, Global Investment Policy Committee, Fixed Income Investment Policy Committee and research analysts responsible for managing the Funds; Dodge & Cox’s organizational structure; Dodge & Cox’s performance in the areas of compliance, administration and shareholder communication and services, supervision of Fund operations and general oversight of other service providers; peer group comparisons of expense ratios, management fee comparisons, expenses (e.g., transfer agent, custody and other fees and expenses) and asset comparisons and performance and risk summaries prepared independently by Morningstar® and favorable stewardship ratings and “Star” rankings by Morningstar®. The Board concluded that it was satisfied with the nature, extent and quality of investment management and other services provided to the Funds by Dodge & Cox.
INVESTMENT PERFORMANCE
The Board considered short-term and long-term investment performance for each Fund (including periods of outperformance or underperformance) as compared to both relevant indices and the performance of such Fund’s peer group. In light of recent market volatility, the Board also reviewed recent performance in the context of long-term investment goals. The Board noted that the shorter-term performance of the Funds has been disappointing, particularly with respect to the Balanced Fund, which performed below its peer group median. The performance
information prepared by Morningstar® and Dodge & Cox demonstrated more favorable performance over the long term in keeping with the stated goals in the Prospectus. The Board considered that the performance of the Funds is the result of a team-oriented investment management process that emphasizes a long-term investment horizon, independence, comprehensive research, price discipline and focus. The Board also noted that the investment performance delivered by Dodge & Cox to the Funds appeared to be consistent with the relevant performance delivered for other (non-fund) clients of Dodge & Cox. The Board concluded that Dodge & Cox has delivered favorable long-term performance for Fund investors consistent with the long-term investment strategies being pursued by the Funds.
COSTS AND ANCILLARY BENEFITS
Costs of Services to Funds: Fees and Expenses. The Board considered each Fund’s management fee rates and expense ratios relative to industry averages for similar mutual funds and relative to management fees charged by Dodge & Cox to other (non-fund) clients. The Board evaluated the operating structures of the Funds and Dodge & Cox, including the following: Dodge & Cox has a centralized focus on investment management operations and derives revenue solely from management fees; its outsourcing of non-advisory support services to unaffiliated third-party service providers is efficient and less costly to investors; Dodge & Cox does not charge front-end sales commissions or distribution fees and bears all third party research and distribution-related costs as well as reimbursements to third-party retirement plan administrators; the Funds receive numerous administrative, regulatory compliance, and shareholder support services from Dodge & Cox without any additional administrative fee; and the fact that the Funds have relatively low transaction costs and portfolio turnover rates. The Board noted that the Funds are substantially below peer group averages in expense ratios and management fee rates and that many media and industry reports specifically comment on the low expense ratios of Dodge & Cox, which along with solid long-term performance, has been a defining characteristic of Dodge & Cox for many years. The Board also noted that the range of services under the Agreements is much more extensive than under Dodge & Cox’s separate advisory (non-fund) client agreements and that
DODGE & COX BALANCED FUND §PAGE 18
many of the separate accounts were opened decades ago when fees were lower, and considered that, when coupled with the greater risks and regulatory burdens associated with the high profile mutual fund business, there is reasonable justification for differences in fee rates charged between the two lines of business. The Board concluded that costs incurred by the Funds for the services they receive (including the management fee paid to Dodge & Cox) are reasonable and that the fees are acceptable based upon the qualifications, experience, reputation and performance of Dodge & Cox and the low overall expense ratios of the Funds.
Profitability and Costs of Services to Dodge & Cox; “Fall-out” Benefits. The Board reviewed reports of Dodge & Cox’s financial position, profitability and estimated overall value, and they considered Dodge & Cox’s overall profitability within its context as a private, employee-owned S-Corporation and relative to the favorable services provided. The Board noted that net revenues for 2008 reflect a decline in assets under management compared with 2007. The Board recognized the importance of Dodge & Cox’s profitability—which is derived solely from management fees and does not include other business ventures—to maintain its independence, stability, company culture and ethics, and management continuity. The Board also considered that revenues reflect the continued success of the Funds and that such revenues are not generated by fees that are high compared to its peers. They noted that Dodge & Cox’s profitability is enhanced due to its efficient internal business model, and that the compensation/profit structure at Dodge & Cox is vital for remaining independent and facilitating retention of its management and investment professionals. The Board considered potential “fall-out” benefits (including the receipt of research from unaffiliated brokers) that Dodge & Cox might receive in its association with the Funds. The Board also noted the extent of additional administrative services performed by Dodge & Cox for the Funds, and that the magnitude of costs and risks borne by Dodge & Cox in rendering advisory services to the Funds (including risks in the compliance, securities valuation and investment management processes) are continuing to increase. The Board concluded that the profitability of
Dodge & Cox’s relationship with the Funds (including fall-out benefits) was fair and reasonable.
THE BENEFIT OF ECONOMIES OF SCALE
The Board considered whether there have been economies of scale with respect to the management of each Fund, whether the Funds have appropriately benefited from any economies of scale, and whether the management fee rate is reasonable in relation to the Fund assets and any economies of scale that may exist. In the Board’s view, any consideration of economies of scale must take account of the Funds’ low fee structure and the considerable efficiencies of the Funds’ organization and fee structure that has been realized by shareholders at the outset of their investment (i.e., from the first dollar). Shareholders also realize efficiencies from the outset of their investment due to organizational efficiencies derived from Dodge & Cox’s investment management process (e.g., low portfolio turnover) and the avoidance of distribution and marketing structures whose costs would ultimately be borne by shareholders of the Funds. The Board noted that Dodge & Cox has shared economies of scale by adding or enhancing services to the Funds over time, and that the internal costs of providing investment management, administrative and compliance services to the Funds are continuing to increase. Thus, the Funds provide access by small investors to top-rank investment management at a relatively low cost. The Board’s decision to renew the Agreements was made after consideration of economies of scale and review of comparable fund expense ratios and historical expense ratio patterns for the Funds. Their review also included consideration of the desirability of adding breakpoints to the Funds’ fee schedules. The Board concluded that the current Dodge & Cox fee structure is fair and reasonable and adequately reflects economies of scale.
CONCLUSION
Based on their evaluation of all material factors and assisted by the advice of Independent Legal Counsel to the Independent Trustees, the Board, including the Independent Trustees, concluded that the advisory fee structure was fair and reasonable, that each Fund was paying a competitive fee for the services provided, that the scope and quality of Dodge & Cox’s services has
PAGE 19 § DODGE & COX BALANCED FUND
provided substantial value for Fund shareholders over the long term, and that approval of the Agreements was in the best interests of each Fund and its shareholders.
FUND HOLDINGS
The Fund provides a complete list of its holdings four times each fiscal year, as of the end of each quarter. The lists appear in the Fund’s First Quarter, Semi-Annual, Third Quarter and Annual Reports to shareholders. The Fund files the lists with the Securities and Exchange Commission (SEC) on Form N-CSR (second and fourth quarters) and Form N-Q (first and third quarters). Shareholders may view the Fund’s Forms N-CSR and N-Q on the SEC’s website at www.sec.gov. Forms N-CSR and N-Q may also be reviewed and copied at the SEC’s Public Reference Room in Washington, DC. Information regarding the operations of the Public Reference Room
may be obtained by 1-202-942-8090 (direct) or 1-800-732-0330 (general SEC number). A complete list of the Fund’s quarter-end holdings is also available at www.dodgeandcox.com on or about 15 days following each quarter end and remains available on the web site until the list is updated in the subsequent quarter.
PROXY VOTING
For a free copy of the Fund’s proxy voting policies and procedures, please call 1-800-621-3979, visit the Fund’s web site at www.dodgeandcox.com or visit the SEC’s web site at www.sec.gov. Information regarding how the Fund voted proxies relating to portfolio securities during the most recent 12-month period ending June 30 is also available at www.dodgeandcox.com or at www.sec.gov.
DODGE & COX BALANCED FUND §PAGE 20
THIS PAGE INTENTIONALLY LEFT BLANK
PAGE 21 § DODGE & COX BALANCED FUND
THIS PAGE INTENTIONALLY LEFT BLANK
DODGE & COX BALANCED FUND §PAGE 22
DODGE & COX FUNDS—EXECUTIVE OFFICER & TRUSTEE INFORMATION
| | | | | | |
Name (Age) and
Address* | | Position with Trust
(Year of Election or
Appointment) | | Principal Occupation During Past 5 Years | | Other Directorships Held by Trustees |
| INTERESTED TRUSTEES & OFFICERS |
John A. Gunn
(65) | | Chairman and Trustee
(Trustee since 1985) | | Chairman (since 2007), Chief Executive Officer (since 2005) and Director of Dodge & Cox, Portfolio Manager and member of Investment Policy Committee (IPC), Global Investment Policy Committee (GIPC) (since 2008), and International Investment Policy Committee (IIPC) | | — |
| Kenneth E. Olivier (56) | | President and Trustee (Trustee since 2005) | | President (since 2005) and Director of Dodge & Cox, Portfolio Manager, and member of IPC | | — |
| Dana M. Emery (47) | | Senior Vice President and Trustee (Trustee since 1993) | | Executive Vice President (since 2005) and Director of Dodge & Cox, Manager of the Fixed Income Department, Portfolio Manager, and member of Fixed Income Investment Policy Committee (FIIPC) | | — |
Charles F. Pohl
(50) | | Senior Vice President (Officer since 2004) | | Senior Vice President and Director of Dodge & Cox, Chief Investment Officer (since 2007), Director of Credit Research, Portfolio Manager, Investment Analyst, and member of IPC, GIPC (since 2008), IIPC (since 2007), and FIIPC | | — |
| Diana S. Strandberg (49) | | Senior Vice President (Officer since 2005) | | Vice President of Dodge & Cox, Portfolio Manager, and member of IPC, GIPC (since 2008), and IIPC | | — |
| David H. Longhurst (51) | | Treasurer (Officer since 2006) | | Vice President and Assistant Treasurer of Dodge & Cox (since 2008); Vice President, Treasurer, Controller and Secretary of Safeco Mutual Funds, Safeco Asset Management Company, Safeco Services, Safeco Securities, and Safeco Investment Services (2000-2004) | | — |
| Thomas M. Mistele (55) | | Secretary
(Officer since 2000) | | Chief Operating Officer (since 2004), Director (since 2005), Secretary, and General Counsel of Dodge & Cox | | — |
| Marcia P. Venegas (40) | | Chief Compliance Officer
(Officer since 2004) | | Associate Chief Compliance Officer of Dodge & Cox (since 2008), Chief Compliance Officer of Dodge & Cox (2005-2008), Compliance Officer of Dodge & Cox (2003-2004) | | — |
| INDEPENDENT TRUSTEES |
| William F. Ausfahl (68) | | Trustee (Since 2002) | | CFO, The Clorox Co. (1982-1997); Director, The Clorox Co. (1984-1997) | | — |
| L. Dale Crandall (67) | | Trustee (Since 1999) | | President, Kaiser Foundation Health Plan, Inc. and Kaiser Foundation Hospitals (2000-2002); Senior Vice President—Finance and Administration & CFO, Kaiser Foundation Health Plan, Inc. and Kaiser Foundation Hospitals (1998-2000) | | Director, Ansell Limited (medical equipment and supplies) (2002-Present); Director, Coventry Health Care, Inc. (managed health care) (2004-Present); Director, Metavante Technologies, Inc. (software) (2007 to present) |
| Thomas A. Larsen (59) | | Trustee (Since 2002) | | Director in Howard, Rice, Nemerovski, Canady, Falk & Rabkin (law firm) | | — |
John B. Taylor
(62) | | Trustee (Since 2005) | | Professor of Economics, Stanford University; Senior Fellow, Hoover Institution; Under Secretary for International Affairs, United States Treasury (2001-2005) | | — |
Will C. Wood
(69) | | Trustee (Since 1992) | | Principal, Kentwood Associates, Financial Advisers | | Director, Banco Latinoamericano de Exportaciones S.A. (Latin American foreign trade bank) (1999-Present) |
| * | | The address for each Officer and Trustee is 555 California Street, 40th Floor, San Francisco, California 94104. Each Officer and Trustee oversees all five series in the Dodge & Cox Funds complex and serves for an indefinite term. |
Additional information about the Trust’s Trustees and Officers is available in the Trust’s Statement of Additional Information (SAI). You can get a free copy of the SAI by visiting the Fund’s website at www.dodgeandcox.com or calling
1-800-621-3979.
PAGE 23 § DODGE & COX BALANCED FUND
| | | | |
| | | | |
www.dodgeandcox.com
For Fund literature, transactions, and account
information, please visit the Funds’ web site.
or write or call:
DODGE & COX FUNDS
c/o Boston Financial Data Services
P.O. Box 8422
Boston, Massachusetts 02266-8422
(800) 621-3979
INVESTMENT MANAGER
Dodge & Cox
555 California Street, 40th Floor
San Francisco, California 94104
(415) 981-1710
This report is submitted for the general information of the shareholders of the Fund. The report is not authorized for distribution to prospective investors in the Fund unless it is accompanied by a current prospectus.
This report reflects our views, opinions, and portfolio holdings as of December 31, 2008, the end of the reporting period. Any such views are subject to change at any time based upon market or other conditions and Dodge & Cox disclaims any responsibility to update such views. These views may not be relied on as investment advice and, because investment decisions for a Dodge & Cox Fund are based on numerous factors, may not be relied on as an indication of trading intent on behalf of any Dodge & Cox Fund.
12/08 IF AR Printed on recycled paper
Annual Report
December 31, 2008
Income Fund
ESTABLISHED 1989
TICKER: DODIX
TO OUR SHAREHOLDERS
The Dodge & Cox Income Fund had a total return of negative 0.3% for 2008, compared to 5.2% for the Barclays Capital Aggregate Bond Index (BCAG)1. At year end, the Fund had net assets of $13.8 billion with a cash position of 3.0%. Longer-term results appear on page four.
The Fund’s relative performance results since the mid-2007 onset of the credit crisis have been disappointing. As we reflect on the past year, we clearly underestimated the worsening credit crisis, the likelihood of government interventions, the depth and breadth of the ongoing economic difficulties, and the combined effect of these on many of the Fund’s holdings.
Despite the disappointing recent performance, we are confident in the Fund’s holdings. The Fund has experienced periods of underperformance in the past. We have learned from these past episodes just as we are learning from this one and are incorporating these lessons into our strategy and outlook on an ongoing basis. While we have made refinements, maintaining the essence of our investment approach through previous challenging periods for the Fund has been crucial to subsequent periods of success. That approach—constructing a diversified portfolio through in-depth, independent research, a three-to-five year investment horizon, and a focus on valuation relative to underlying fundamentals— continues to guide us through this period as well.
MARKET COMMENTARY
An extraordinary year in the financial markets was capped by an extremely volatile fourth quarter that featured more government efforts to unfreeze debt markets and restore investor confidence. The U.S. economy deteriorated significantly over the course of the year, and by year’s end was officially declared to be in a recession. The net result was a substantial rally among U.S. Treasury securities, an increase in corporate bond risk premiums to all-time highs (triple the level from the beginning of 2008), a 37% drop in the broad U.S. equity market, and a clear macroeconomic illustration of what happens to a major developed economy when the flow of credit stops abruptly.
Over the year the unemployment rate spiked from 4.9% to 7.2% (the highest level in 15 years) and the U.S.
economy shed over 2.6 million jobs (the worst annual job loss since 1945). Consumer spending fell, dragged down by plunging car sales, and manufacturing and service sector activity slowed significantly. Home prices continued to decline and housing activity levels (home building, new and existing home sales) remain depressed. One bright spot for consumers was the dramatic retreat of oil prices in the second half of the year, from $140/barrel to $45/barrel.
The Federal Reserve, the U.S. Treasury, and Congress introduced a series of policies and programs to restart the short-term debt markets, aid homeowners, recapitalize and provide liquidity to major financial institutions, and bolster investor confidence. Programs with acronyms like TARP, TLGP, TALF, and H4H have quickly become a part of the new financial market lexicon. The result of these programs has been a historic level of U.S. government involvement in a large cross-section of the U.S. debt market. In addition, the Federal Reserve lowered the target federal funds rate to close to zero, compared to 4.25% a year ago. These efforts have achieved some success of late as short-term debt markets have recovered somewhat, mortgage rates have come down substantially, and investment-grade Corporate issuance roared back in December after grinding to a halt in the summer/early fall. Despite these positive developments, capital markets remain fragile with varying levels of liquidity.
Financial market volatility can have many causes, including unanticipated changes in economic circumstances, a significant change in investor risk appetite or confidence, or a combination of these and other factors. Given the volatility of financial markets in 2008, we are frequently asked how we manage the Fund through these periods and what lessons we have learned.
MANAGING THROUGH VOLATILITY
Through periods of volatility we lean on the experience and depth of our team (our nine-member policy committee has an average tenure of 15 years, and is supported by over 50 industry analysts, research associates, and traders), our time-tested investment philosophy, and our willingness to go against the grain if a compelling
PAGE 1 § DODGE & COX INCOME FUND
long-term investment opportunity presents itself in a currently out-of-favor area.
In line with this, we consider adjustments to the composition of the Fund in response to changes in the fundamental factors and circumstances affecting an investment, a substantial move in its valuation (absolute or relative), or a combination of the two. When fundamentals and/or valuations change meaningfully for an existing investment, we examine our original thesis by incorporating as much new information as possible, then asking ourselves whether this investment remains an attractive long-term opportunity. This process is similar for a potential new investment to the Fund, and is the typical catalyst for changes to the Fund’s overall composition.
Over the past year this process has resulted in new additions to the Fund, as well as subtractions, some of which we detail below. Importantly, the discipline and thoroughness of this process are not a guarantee against mistakes. They do, however, keep us focused on facts and analysis, rather than allowing the emotions of a particularly challenging period in the financial markets to sway us from being a good, long-term steward of your capital.
There has been no shortage of learning opportunities in the credit crisis to date. To name a few: the surprising degree of correlation between securities and sectors whose fundamental sources of risk seem unrelated; the fleeting nature of liquidity in what had historically been dependably liquid markets; the degree to which a crisis shortens the collective investment world’s investment horizon; and the realization that market perceptions of a company’s risk can quickly become self-fulfilling prophecies.
An outgrowth of some of these hard-earned lessons was the incorporation of a deeper liquidity review into our corporate bond research process. While a liquidity analysis has been an important part of our company research process for a long time, the exigencies of this crisis required a re-examination of some elements of our liquidity analysis, especially in regard to access to markets for further funding, and the ability to monetize assets at a reasonable price and in a timely manner.
INVESTMENT STRATEGY
While there were some encouraging signs of moderation of financial market stress toward year end, the direction of the broad economy has been sharply downward. Market pricing of fixed income instruments (e.g., U.S. Treasury yields at all-time lows, corporate yield premiums near all-time highs) has responded vigorously to the negative economic news, but the new consensus, which incorporates expectations for a severe and multi-year economic downturn, appears too pessimistic to us. With the backdrop of extraordinary monetary and (most likely) fiscal policies aimed at arresting the economy’s decline, current valuations of many corporate securities appear attractive for a long-term investor and we have raised the Fund’s emphasis on the Corporate sector, as always with a strong focus on individual security selection.
For example, the elevated yield levels of investment-grade corporate securities relative to U.S. Treasuries imply a default rate among investment-grade Corporates that is a multiple of the previous 1938 high. While we do expect defaults to rise over the near term in line with the obvious deterioration of the economy, we do not expect the level implied by current valuations and see opportunities to take advantage of this dislocation. In the most recent quarter, for example, we established new positions in two investment-grade corporate issuers and added to several existing holdings. At year end the Fund held a 43.5% weighting in Corporates (up from 34.6% at year-end 2007) spread among 42 individual issuers in 16 different industries.
We slightly reduced the Fund’s holdings of Government-Sponsored Enterprise (GSE)-guaranteed2 Mortgage-Backed Securities (MBS) in the fourth quarter from 50% to just over 46%. Despite lagging the spectacular returns of U.S. Treasuries, the Fund’s GSE-guaranteed MBS have fulfilled a critically important role throughout the current crisis, delivering solid returns (this sector of the BCAG returned 8.3% in 2008) while retaining their liquidity. Recently, U.S. Government efforts to reduce mortgage rates have begun to bear fruit: MBS rates and yield premiums have come down significantly and most MBS trade at a premium to par. New, lower mortgage rates create greater prepayment risk
DODGE & COX INCOME FUND §PAGE 2
for existing mortgage securities, leading us to favor—on the margin—opportunities among corporate securities. However, the Fund has retained a significant weighting in GSE-guaranteed MBS due to their creditworthiness and attractive total return potential.
The Fund continues to de-emphasize the U.S. Treasury sector. This sector delivered excellent returns in 2008, benefiting from its “safe haven” status during the economic and financial turmoil. As a result, at year end, short-term U.S. Treasuries offered near-zero yields while longer-term Treasuries, whose prices are most sensitive to changes in yields, offered yields below 3%. While the safety of these securities’ principal is intuitively attractive in a period of distress, their ultimate value will be judged by what they return to investors over the long term. With these yields as starting points, the long-term outlook for returns from this sector is not compelling, leading us to keep a low weighting focused on shorter maturities.
IN CLOSING
Investing can be a humbling endeavor. This past year has been humbling for us twofold. First, a number of our investment decisions—made based on considerable research, discussion, and debate—proved to be wrong. Second, we have been humbled by the loyalty and confidence our shareholders have displayed through this difficult period. While the Fund did experience net outflows during the year, the outflows were manageable and represented a small percentage of the Fund’s asset base. By and large what we have heard from shareholders is disappointment with our recent returns, but also confidence in Dodge & Cox and our investment approach. As fellow shareholders in the Fund, we share in these sentiments.
Our experienced investment team is working hard to take advantage of the attractive opportunities being created during this period of economic stress and volatility. Although it is impossible to predict the short-term direction of markets, our experience has taught us that persistence in the face of significant market dislocations can potentially be rewarding for patient investors with long-term investment horizons.
Thank you for your continued patience and confidence in our firm as a shareholder of the Dodge & Cox Income Fund. As always, we welcome your comments and questions.
For the Board of Trustees,
| | |
| | 
|
John A. Gunn, Chairman | | Dana M. Emery, Senior Vice President |
February 13, 2009
1 | | Formerly the Lehman Brothers Aggregate Bond Index (LBAG), renamed 11/3/08. |
2 | | The U.S. Government does not guarantee the Fund’s shares, yield and net asset value. The guarantee does not eliminate market risk. |
2008 PERFORMANCE REVIEW
The Fund lagged the BCAG by 5.5 percentage points for the year.
The primary source of the underperformance was the Fund’s overweighting of the Corporate (by 19 percentage points) and GSE-guaranteed MBS (by 9 percentage points) sectors, and a corresponding underweighting of the U.S. Treasury sector. As measured by Barclays Capital Indices, the U.S. Treasury sector returned 13.7% for the year, compared to 8.3% for GSE-guaranteed MBS and negative 4.9% for Corporates. In addition, several of the Fund’s corporate holdings, including Kaupthing Bank, Dillard’s, Macy’s, and GMAC (despite its recent partial recovery), performed very poorly during 2008. Finally, the U.S. Treasuries that the Fund held were generally of short maturity, which significantly lagged the performance of longer-maturity Treasuries.
PAGE 3 § DODGE & COX INCOME FUND
GROWTH OF $10,000 OVER 10 YEARS
FOR AN INVESTMENT MADE ON DECEMBER 31, 1998
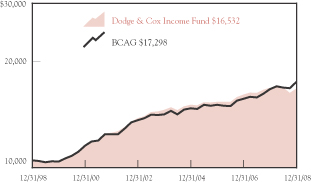
AVERAGE ANNUAL TOTAL RETURN
FOR PERIODS ENDED DECEMBER 31, 2008
| | | | | | | | | | | | |
| | | 1 Year | | | 5 Years | | | 10 Years | | | 20 Years | |
| | | | | | | | | | | | |
Dodge & Cox Income Fund | | –0.29 | % | | 3.04 | % | | 5.15 | % | | 7.34 | % |
Barclays Capital
Aggregate Bond Index (BCAG) | | 5.24 | | | 4.65 | | | 5.63 | | | 7.43 | |
Past performance does not guarantee future results. Investment return and share price will fluctuate with market conditions, and investors may have a gain or loss when shares are sold. Mutual fund performance changes over time and currently may be significantly lower than stated. Performance is updated and published monthly. Visit the Fund’s web site at www.dodgeandcox.com or call 1-800-621-3979 for current performance figures.
The Fund’s total returns include the reinvestment of dividend and capital gain distributions, but have not been adjusted for any income taxes payable by shareholders on these distributions. The Barclays Capital Aggregate Bond Index is a widely-recognized, unmanaged index of U.S. dollar-denominated investment-grade fixed income securities. Index returns include dividends and/or interest income but, unlike Fund returns, do not reflect fees or expenses.
Barclays Capital® is a trademark of Barclays PLC.
FUND EXPENSE EXAMPLE
As a Fund shareholder, you incur ongoing Fund costs, including management fees and other Fund expenses. All mutual funds have ongoing costs, sometimes referred to as operating expenses. The following example shows ongoing costs of investing in the Fund and can help you understand these costs and compare them with those of other mutual funds. The example assumes a $1,000 investment held for the six months indicated.
ACTUAL EXPENSES
The first line of the table below provides information about actual account values and expenses based on the Fund’s actual returns. You may use the information in this line, together with your account balance, to estimate the expenses that you paid over the period. Simply divide your account value by $1,000 (for example, an $8,600 account value divided by $1,000 = 8.6), then multiply the result by the number in the first line under the heading “Expenses Paid During Period” to estimate the expenses you paid on your account during this period.
HYPOTHETICAL EXAMPLE FOR COMPARISON WITH OTHER MUTUAL FUNDS
Information on the second line of the table can help you compare ongoing costs of investing in the Fund with those of other mutual funds. This information may not be used to estimate the actual ending account balance or expenses you paid during the period. The hypothetical “Ending Account Value” is based on the actual expense ratio of the Fund and an assumed 5% annual rate of return before expenses (not the Fund’s actual return). The amount under the heading “Expense Paid During the Period” shows the hypothetical expenses your account would have incurred under this scenario. You can compare this figure with the 5% hypothetical examples that appear in shareholder reports of other mutual funds.
| | | | | | | | | |
Six Months Ended December 31, 2008 | | Beginning Account Value
7/1/2008 | | Ending Account Value
12/31/2008 | | Expenses Paid
During Period* |
Based on Actual Fund Return | | $ | 1,000.00 | | $ | 994.70 | | $ | 2.13 |
Based on Hypothetical 5% Yearly Return | | | 1,000.00 | | | 1,023.00 | | | 2.16 |
| * | | Expenses are equal to the Fund’s annualized expense ratio of 0.42%, multiplied by the average account value over the period, multiplied by 184/366 (to reflect the one-half year period). |
The expenses shown in the table highlight ongoing costs only and do not reflect any transactional fees or account maintenance fees. While other mutual funds may charge such fees, please note that the Fund does not charge transaction fees (e.g., redemption fees, sales loads) or universal account maintenance fees (e.g., small account fees).
DODGE & COX INCOME FUND §PAGE 4
| | |
| FUND INFORMATION | | December 31, 2008 |
| | |
| GENERAL INFORMATION | | |
Net Asset Value Per Share | | $11.79 |
Total Net Assets (billions) | | $13.8 |
30-Day SEC Yield(a) | | 7.45% |
2008 Expense Ratio | | 0.43% |
2008 Portfolio Turnover Rate | | 24% |
Fund Inception | | 1989 |
No sales charges or distribution fees | | |
Investment Manager: Dodge & Cox, San Francisco. Managed by the Fixed Income Investment Policy Committee, whose nine members’ average tenure at Dodge & Cox is 15 years.
| | | | | |
| PORTFOLIO CHARACTERISTICS | | Fund | | | BCAG |
Number of Fixed Income Securities | | 474 | (e) | | 9,168 |
Effective Maturity (years) | | 5.7 | | | 5.5 |
Effective Duration (years) | | 3.5 | | | 3.7 |
| | | |
| FIVE LARGEST CORPORATE ISSUERS(c) | | Fund | |
Wachovia Corp. | | 3.2 | % |
Ford Motor Credit Co. | | 3.1 | |
GMAC, LLC and subsidiaries(e) | | 3.0 | |
Time Warner, Inc. | | 2.6 | |
HCA, Inc. | | 2.3 | |
| | | | | | |
| CREDIT QUALITY(d) | | Fund | | | BCAG | |
U.S. Government & Government Related | | 51.3 | % | | 74.1 | % |
Aaa | | 2.4 | | | 6.8 | |
Aa | | 6.0 | | | 3.1 | |
A | | 11.0 | | | 9.3 | |
Baa | | 15.5 | | | 6.7 | |
Ba | | 2.2 | | | 0.0 | |
B | | 0.2 | | | 0.0 | |
Caa | | 5.4 | | | 0.0 | |
Ca | | 2.9 | | | 0.0 | |
C | | 0.0 | (f) | | 0.0 | |
Preferred Stock (no rating) | | 0.1 | | | 0.0 | |
Cash Equivalents | | 3.0 | | | 0.0 | |
| | |
Average Quality | | Aa3 | | | A1 | |
ASSET ALLOCATION
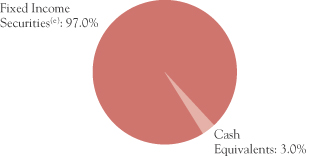
| | | | | | |
| SECTOR DIVERSIFICATION | | Fund | | | BCAG | |
U.S. Treasury & Government Related | | 4.8 | % | | 34.7 | % |
Mortgage-Related Securities | | 46.6 | | | 39.6 | |
Asset-Backed Securities/CMBS(b) | | 2.1 | | | 4.1 | |
Corporate(e) | | 43.5 | | | 17.7 | |
Non-Corporate Yankee | | 0.0 | | | 3.9 | |
Cash Equivalents | | 3.0 | | | 0.0 | |
| | | | | | |
| MATURITY DIVERSIFICATION | | Fund | | | BCAG | |
0-1 Years to Maturity | | 5.6 | % | | 0.0 | % |
1-5 | | 59.9 | | | 70.6 | |
5-10 | | 23.4 | | | 18.1 | |
10-15 | | 2.0 | | | 2.9 | |
15-20 | | 1.0 | | | 2.1 | |
20-25 | | 5.5 | | | 2.2 | |
25 and Over | | 2.5 | | | 4.1 | |
Preferred Stock (no maturity) | | 0.1 | | | 0.0 | |
(a) | | SEC yield is an annualization of the Fund’s total net investment income per share for the 30-day period ended on the last day of the month. |
(b) | | CMBS refers to commercial mortgage-backed securities, which are a component of the BCAG but not currently held by the Fund. |
(c) | | The Fund’s portfolio holdings are subject to change without notice. The mention of specific securities is not a recommendation or solicitation for any person to buy, sell or hold any particular security. |
(d) | | The Fund’s credit quality ratings are from Moody’s Investor Services. If no Moody’s rating is available, the Standard & Poor’s rating is reported. If unrated, the investment manager determines a comparable rating. The BCAG’s credit quality ratings are from Barclays Capital and reference Moody’s, Standard & Poor’s and Fitch ratings. The BCAG’s methodology for calculating average credit quality differs from that used by the Fund. Applying the BCAG methodology, the Fund’s average credit quality would be A1. The credit quality of the investments in the portfolio does not apply to the stability or safety of the Fund or its shares. |
(e) | | Includes cumulative preferred stock (Preferred Blocker, Inc., a subsidiary of GMAC, LLC) representing 0.1% of the Fund’s net assets. |
PAGE 5 § DODGE & COX INCOME FUND
| | |
| PORTFOLIO OF INVESTMENTS | | December 31, 2008 |
| | | | | | |
| FIXED INCOME SECURITIES: 96.9% |
| | |
| | | PAR VALUE | | VALUE |
| U.S. TREASURY AND GOVERNMENT RELATED: 4.8% |
U.S. TREASURY: 1.8% | | | | | | |
U.S. Treasury Notes
3.625%, 7/15/09 | | $ | 240,000,000 | | $ | 244,284,480 |
| |
GOVERNMENT RELATED: 3.0% | | | |
Small Business Administration — 504 Program | | | |
Series 91-20K, 8.25%, 11/1/11 | | | 106,897 | | | 109,003 |
Series 92-20B, 8.10%, 2/1/12 | | | 187,493 | | | 190,139 |
Series 92-20C, 8.20%, 3/1/12 | | | 364,788 | | | 370,805 |
Series 92-20D, 8.20%, 4/1/12 | | | 217,412 | | | 221,463 |
Series 92-20G, 7.60%, 7/1/12 | | | 670,629 | | | 678,169 |
Series 92-20H, 7.40%, 8/1/12 | | | 402,484 | | | 407,486 |
Series 92-20I, 7.05%, 9/1/12 | | | 431,906 | | | 437,505 |
Series 92-20J, 7.00%, 10/1/12 | | | 586,195 | | | 594,631 |
Series 92-20K, 7.55%, 11/1/12 | | | 642,649 | | | 654,649 |
Series 92-20L, 7.45%, 12/1/12 | | | 312,022 | | | 318,236 |
Series 93-20B, 7.00%, 2/1/13 | | | 493,518 | | | 500,229 |
Series 93-20C, 6.50%, 3/1/13 | | | 1,693,142 | | | 1,715,585 |
Series 93-20D, 6.75%, 4/1/13 | | | 541,198 | | | 549,751 |
Series 93-20E, 6.55%, 5/1/13 | | | 2,064,428 | | | 2,097,711 |
Series 93-20F, 6.65%, 6/1/13 | | | 738,967 | | | 752,350 |
Series 93-20L, 6.30%, 12/1/13 | | | 1,027,746 | | | 1,048,716 |
Series 94-20A, 6.50%, 1/1/14 | | | 1,474,220 | | | 1,500,697 |
Series 94-20D, 7.70%, 4/1/14 | | | 344,236 | | | 355,499 |
Series 94-20E, 7.75%, 5/1/14 | | | 1,242,125 | | | 1,287,069 |
Series 94-20F, 7.60%, 6/1/14 | | | 714,438 | | | 741,200 |
Series 94-20G, 8.00%, 7/1/14 | | | 606,261 | | | 628,063 |
Series 94-20H, 7.95%, 8/1/14 | | | 529,026 | | | 549,356 |
Series 94-20I, 7.85%, 9/1/14 | | | 514,789 | | | 535,524 |
Series 94-20K, 8.65%, 11/1/14 | | | 506,121 | | | 534,718 |
Series 94-20L, 8.40%, 12/1/14 | | | 405,653 | | | 428,622 |
Series 95-20A, 8.50%, 1/1/15 | | | 187,462 | | | 196,836 |
Series 95-20C, 8.10%, 3/1/15 | | | 405,602 | | | 426,361 |
Series 97-20E, 7.30%, 5/1/17 | | | 881,801 | | | 930,060 |
Series 97-20J, 6.55%, 10/1/17 | | | 1,276,459 | | | 1,329,466 |
Series 98-20C, 6.35%, 3/1/18 | | | 5,573,828 | | | 5,780,082 |
Series 98-20H, 6.15%, 8/1/18 | | | 1,997,273 | | | 2,062,277 |
Series 98-20L, 5.80%, 12/1/18 | | | 1,191,670 | | | 1,216,014 |
Series 99-20C, 6.30%, 3/1/19 | | | 1,477,555 | | | 1,524,912 |
Series 99-20G, 7.00%, 7/1/19 | | | 3,463,988 | | | 3,627,249 |
Series 99-20I, 7.30%, 9/1/19 | | | 997,475 | | | 1,050,792 |
Series 01-20G, 6.625%, 7/1/21 | | | 9,211,980 | | | 9,710,562 |
Series 01-20L, 5.78%, 12/1/21 | | | 19,832,844 | | | 20,543,788 |
Series 02-20L, 5.10%, 12/1/22 | | | 5,371,074 | | | 5,473,788 |
Series 04-20L, 4.87%, 12/1/24 | | | 6,241,408 | | | 6,307,921 |
Series 05-20B, 4.625%, 2/1/25 | | | 8,656,939 | | | 8,659,892 |
Series 05-20E, 4.84%, 5/1/25 | | | 16,858,689 | | | 17,006,300 |
Series 05-20G, 4.75%, 7/1/25 | | | 16,166,593 | | | 16,262,183 |
Series 05-20I, 4.76%, 9/1/25 | | | 17,934,172 | | | 18,022,690 |
Series 06-20A, 5.21%, 1/1/26 | | | 18,462,564 | | | 18,787,579 |
Series 06-20B, 5.35%, 2/1/26 | | | 5,475,896 | | | 5,650,803 |
| | | | | | |
| |
| | |
| | | PAR VALUE | | VALUE |
Series 06-20C, 5.57%, 3/1/26 | | $ | 27,542,913 | | $ | 28,681,389 |
Series 06-20G, 6.07%, 7/1/26 | | | 47,976,902 | | | 51,471,262 |
Series 06-20J, 5.37%, 10/1/26 | | | 16,064,380 | | | 16,550,931 |
Series 06-20L, 5.12%, 12/1/26 | | | 12,492,489 | | | 12,709,762 |
Series 07-20A, 5.32%, 1/1/27 | | | 26,233,242 | | | 26,968,329 |
Series 07-20C, 5.23%, 3/1/27 | | | 39,632,874 | | | 40,248,994 |
Series 07-20D, 5.32%, 4/1/27 | | | 40,088,646 | | | 41,141,611 |
Series 07-20G, 5.82%, 7/1/27 | | | 28,856,827 | | | 30,240,160 |
| | | | | | |
| | | | | | 409,789,169 |
| | | | | | |
| | | | | | 654,073,649 |
| MORTGAGE-RELATED SECURITIES: 46.6% |
FEDERAL AGENCY CMO & REMIC: 3.5% | | | |
Dept. of Veterans Affairs | | | | | | |
Trust 1995-2D 4A, 9.293%, 5/15/25 | | | 334,055 | | | 362,032 |
Trust 1997-2Z, 7.50%, 6/15/27 | | | 25,795,672 | | | 27,053,211 |
Trust 1998-1 1A, 8.189%, 3/15/28 | | | 959,095 | | | 1,016,941 |
Fannie Mae | | | | | | |
Trust 1994-72 J, 6.00%, 6/25/23 | | | 2,333,109 | | | 2,342,942 |
Trust 1998-58 PX, 6.50%, 9/25/28 | | | 2,339,975 | | | 2,422,601 |
Trust 1998-58 PC, 6.50%, 10/25/28 | | | 13,632,559 | | | 14,200,696 |
Series 2001-69 PQ, 6.00%, 12/25/31 | | | 20,912,307 | | | 21,604,408 |
Trust 2002-33 A1, 7.00%, 6/25/32 | | | 4,739,372 | | | 4,986,711 |
Series 2008-24 GD, 6.50%, 3/25/37 | | | 47,375,604 | | | 49,045,163 |
Trust 2001-T4 A1, 7.50%, 7/25/41 | | | 4,071,810 | | | 4,286,855 |
Trust 2001-T10 A1, 7.00%, 12/25/41 | | | 6,567,126 | | | 6,909,852 |
Trust 2002-90 A1, 6.50%, 6/25/42 | | | 8,687,356 | | | 9,042,999 |
Trust 2002-W6 2A1, 7.00%, 6/25/42 | | | 7,152,190 | | | 7,525,448 |
Trust 2002-W8 A2, 7.00%, 6/25/42 | | | 3,731,392 | | | 3,842,169 |
Trust 2003-W2 1A2, 7.00%, 7/25/42 | | | 22,377,701 | | | 23,042,050 |
Trust 2003-W4 3A, 7.00%, 10/25/42 | | | 6,837,237 | | | 7,040,221 |
Trust 2003-07 A1, 6.50%, 12/25/42 | | | 8,921,513 | | | 9,286,742 |
Trust 2003-W1 1A1, 6.50%, 12/25/42 | | | 14,086,845 | | | 14,417,012 |
Trust 2003-W1 2A, 7.50%, 12/25/42 | | | 6,316,283 | | | 6,649,865 |
Trust 2004-W2 5A, 7.50%, 3/25/44 | | | 27,817,554 | | | 29,078,051 |
Trust 2004-W8 3A, 7.50%, 6/25/44 | | | 17,520,408 | | | 18,314,310 |
Trust 2005-W1 1A3, 7.00%, 10/25/44 | | | 15,883,738 | | | 16,355,294 |
Trust 2001-79 BA, 7.00%, 3/25/45 | | | 2,017,818 | | | 2,123,124 |
Trust 2006-W1 1A1, 6.50%, 12/25/45 | | | 2,098,352 | | | 2,147,533 |
Trust 2006-W1 1A2, 7.00%, 12/25/45 | | | 13,936,871 | | | 14,350,629 |
Trust 2006-W1 1A3, 7.50%, 12/25/45 | | | 223,192 | | | 231,632 |
Trust 2006-W1 1A4, 8.00%, 12/25/45 | | | 16,352,575 | | | 17,349,068 |
Trust 2007-W10 1A, 6.155%, 8/25/47 | | | 92,603,542 | | | 96,428,420 |
Trust 2007-W10 2A, 6.133%, 8/25/47 | | | 25,385,410 | | | 26,762,564 |
Freddie Mac | | | | | | |
Series 2439 LG, 6.00%, 9/15/30 | | | 4,233,986 | | | 4,268,003 |
Series 3312 AB, 6.50%, 6/15/32 | | | 29,671,909 | | | 30,750,130 |
Series T-48 1A, 7.087%, 7/25/33 | | | 6,315,924 | | | 6,616,818 |
Ginnie Mae
Series 1999-29 PB, 7.25%, 7/16/28 | | | 1,286,565 | | | 1,305,229 |
| | | | | | |
| | | | | | 481,158,723 |
| | |
| See accompanying Notes to Financial Statements | | DODGE & COX INCOME FUND §PAGE 6 |
| | |
| PORTFOLIO OF INVESTMENTS | | December 31, 2008 |
| | | | | | |
| FIXED INCOME SECURITIES (continued) |
| | |
| | | PAR VALUE | | VALUE |
FEDERAL AGENCY MORTGAGE PASS-THROUGH: 43.0% |
Fannie Mae, 10 Year
6.00%, 11/1/16 | | $ | 14,614,905 | | $ | 15,133,609 |
Fannie Mae, 15 Year | | | | | | |
5.50%, 9/1/14-1/1/22 | | | 345,710,013 | | | 358,338,221 |
6.00%, 4/1/13-3/1/23 | | | 1,086,197,340 | | | 1,129,743,541 |
6.50%, 11/1/12-11/1/18 | | | 130,566,552 | | | 135,828,434 |
7.00%, 12/1/10-12/1/11 | | | 466,443 | | | 478,576 |
7.50%, 11/1/14-8/1/17 | | | 12,351,637 | | | 12,937,852 |
Fannie Mae, 20 Year | | | | | | |
6.00%, 2/1/28 | | | 59,134,698 | | | 60,976,514 |
6.50%, 4/1/19-10/1/24 | | | 47,420,240 | | | 49,578,315 |
Fannie Mae, 30 Year | | | | | | |
6.00%, 11/1/28-3/1/36 | | | 314,341,611 | | | 325,220,061 |
6.50%, 12/1/32-5/1/38 | | | 739,612,013 | | | 762,594,237 |
7.00%, 4/1/32-12/1/37 | | | 306,805,499 | | | 321,619,496 |
8.00%, 1/1/12 | | | 56,177 | | | 58,650 |
Fannie Mae, Hybrid ARM | | | | | | |
3.931%, 10/1/33 | | | 18,550,985 | | | 18,488,320 |
4.132%, 12/1/36 | | | 27,097,008 | | | 27,078,392 |
4.205%, 9/1/34 | | | 13,888,858 | | | 13,623,547 |
4.232%, 1/1/35 | | | 14,465,538 | | | 14,815,774 |
4.482%, 1/1/35 | | | 11,157,783 | | | 11,135,438 |
4.486%, 7/1/34 | | | 17,220,154 | | | 17,251,619 |
4.493%, 1/1/35 | | | 42,762,426 | | | 42,874,129 |
4.50%, 6/1/35-7/1/35 | | | 20,668,718 | | | 20,717,641 |
4.516%, 8/1/34 | | | 20,058,304 | | | 20,436,870 |
4.606%, 10/1/34 | | | 17,092,917 | | | 17,261,159 |
4.643%, 8/1/35 | | | 17,400,410 | | | 17,451,114 |
4.654%, 1/1/36 | | | 29,638,463 | | | 29,776,152 |
4.686%, 8/1/34 | | | 3,887,829 | | | 3,855,463 |
4.729%, 7/1/35 | | | 14,470,513 | | | 14,492,561 |
4.735%, 7/1/35 | | | 13,739,697 | | | 13,756,387 |
4.761%, 10/1/35 | | | 24,496,878 | | | 24,525,438 |
4.774%, 8/1/35 | | | 43,658,201 | | | 43,732,456 |
4.824%, 11/1/36 | | | 18,862,959 | | | 18,994,218 |
4.83%, 1/1/36 | | | 23,120,468 | | | 23,355,066 |
4.864%, 12/1/35 | | | 16,378,277 | | | 16,543,386 |
4.902%, 10/1/35 | | | 12,800,661 | | | 12,906,871 |
4.989%, 4/1/35 | | | 22,556,254 | | | 22,820,928 |
4.997%, 9/1/35 | | | 18,146,595 | | | 18,294,829 |
5.03%, 7/1/35 | | | 107,896,545 | | | 109,299,150 |
5.076%, 7/1/35 | | | 15,395,743 | | | 15,510,931 |
5.222%, 1/1/37 | | | 27,206,400 | | | 27,621,841 |
5.279%, 11/1/35 | | | 15,045,558 | | | 15,532,279 |
Fannie Mae, Multifamily DUS | | | | | | |
Pool 760744, 4.75%, 3/1/15 | | | 13,590,000 | | | 13,747,202 |
Pool 555162, 4.826%, 1/1/13 | | | 14,503,587 | | | 14,783,682 |
Pool 555191, 4.858%, 2/1/13 | | | 14,651,753 | | | 14,954,324 |
Pool 545892, 5.235%, 10/1/12 | | | 43,096,238 | | | 44,445,540 |
Pool 888559, 5.425%, 6/1/17 | | | 36,465,690 | | | 37,116,947 |
Pool 888015, 5.549%, 11/1/16 | | | 47,737,277 | | | 49,173,659 |
Pool 555172, 5.678%, 12/1/12 | | | 2,516,672 | | | 2,626,187 |
Pool 545987, 5.835%, 9/1/12 | | | 18,857,275 | | | 19,862,874 |
| | | | | | |
| |
| | |
| | | PAR VALUE | | VALUE |
Pool 545685, 5.931%, 4/1/12 | | $ | 21,852,325 | | $ | 22,896,145 |
Pool 545708, 6.046%, 5/1/12 | | | 1,863,489 | | | 1,961,286 |
Pool 545547, 6.095%, 3/1/12 | | | 12,431,413 | | | 13,141,674 |
Pool 545527, 6.114%, 2/1/12 | | | 8,767,153 | | | 9,218,830 |
Pool 545209, 6.13%, 10/1/11 | | | 23,680,702 | | | 24,779,308 |
Pool 545059, 6.224%, 5/1/11 | | | 22,070,561 | | | 23,040,973 |
Pool 545179, 6.253%, 9/1/11 | | | 16,602,773 | | | 17,428,334 |
Pool 323822, 6.38%, 7/1/09 | | | 1,165,306 | | | 1,162,621 |
Freddie Mac Gold, 10 Year
6.00%, 9/1/16 | | | 6,934,072 | | | 7,190,295 |
Freddie Mac Gold, 15 Year | | | | | | |
5.50%, 11/1/13-10/1/20 | | | 118,906,250 | | | 122,900,076 |
6.00%, 4/1/13-11/1/23 | | | 342,169,269 | | | 354,771,540 |
6.50%, 2/1/11-9/1/18 | | | 47,743,971 | | | 49,604,872 |
7.00%, 12/1/11-3/1/12 | | | 633,311 | | | 648,768 |
Freddie Mac Gold, 20 Year | | | | | | |
5.50%, 11/1/23 | | | 60,020,965 | | | 61,761,273 |
6.00%, 7/1/25 | | | 13,995,660 | | | 14,488,891 |
6.50%, 7/1/21-10/1/26 | | | 35,418,854 | | | 36,895,679 |
Freddie Mac Gold, 30 Year | | | | | | |
6.00%, 2/1/33 | | | 34,919,243 | | | 36,159,273 |
6.50%, 5/1/17-3/1/38 | | | 406,156,521 | | | 421,214,775 |
7.00%, 4/1/31 | | | 17,352,631 | | | 18,152,156 |
7.90%, 2/17/21 | | | 2,133,527 | | | 2,264,775 |
Freddie Mac Gold, Hybrid ARM | | | | | | |
4.147%, 1/1/35 | | | 13,492,935 | | | 13,481,967 |
4.327%, 8/1/34 | | | 8,761,260 | | | 8,799,741 |
4.357%, 3/1/35 | | | 7,949,012 | | | 8,030,030 |
4.397%, 9/1/35 | | | 27,684,027 | | | 27,754,345 |
4.407%, 1/1/35 | | | 101,182,549 | | | 99,944,697 |
4.478%, 4/1/35 | | | 6,405,186 | | | 6,342,778 |
4.615%, 4/1/36 | | | 28,316,474 | | | 28,544,166 |
4.649%, 8/1/35 | | | 13,173,685 | | | 13,245,570 |
4.72%, 2/1/34 | | | 50,433,906 | | | 50,972,641 |
4.735%, 8/1/35 | | | 15,635,749 | | | 15,645,108 |
4.83%, 2/1/35 | | | 9,603,481 | | | 9,677,189 |
4.853%, 1/1/36 | | | 19,410,229 | | | 19,585,891 |
4.854%, 10/1/35 | | | 18,807,679 | | | 19,004,653 |
5.135%, 1/1/36 | | | 58,781,365 | | | 58,965,588 |
5.155%, 9/1/33 | | | 52,882,566 | | | 53,126,268 |
5.158%, 5/1/37 | | | 24,320,860 | | | 24,551,686 |
5.286%, 1/1/37 | | | 25,959,638 | | | 26,372,137 |
5.339%, 7/1/37 | | | 63,919,421 | | | 65,048,238 |
5.444%, 3/1/37 | | | 41,436,885 | | | 42,110,580 |
5.529%, 4/1/37 | | | 56,936,477 | | | 58,056,824 |
5.851%, 8/1/36 | | | 23,037,878 | | | 23,241,026 |
5.932%, 1/1/36 | | | 17,584,024 | | | 17,835,451 |
Ginnie Mae, 15 Year
7.00%, 4/15/09 | | | 12,027 | | | 12,097 |
Ginnie Mae, 30 Year | | | | | | |
7.00%, 5/15/28 | | | 1,680,374 | | | 1,782,572 |
7.50%, 9/15/17-5/15/25 | | | 5,471,838 | | | 5,789,984 |
7.80%, 6/15/20-1/15/21 | | | 1,463,142 | | | 1,551,503 |
| | | | | | |
| | | | | | 5,940,524,154 |
| | |
| PAGE 7 § DODGE & COX INCOME FUND | | See accompanying Notes to Financial Statements |
| | |
| PORTFOLIO OF INVESTMENTS | | December 31, 2008 |
| | | | | | |
| FIXED INCOME SECURITIES (continued) |
| | |
| | | PAR VALUE | | VALUE |
PRIVATE LABEL CMO & REMIC SECURITIES: 0.1% |
GSMPS Mortgage Loan Trust(b)
Series 2004-4 1A4, 8.50%, 6/25/34 | | $ | 10,864,741 | | $ | 12,577,918 |
| | | | | | |
| | | | | | 6,434,260,795 |
| ASSET-BACKED SECURITIES: 2.1% | | | |
STUDENT LOAN: 2.1% | | | | | | |
SLM Student Loan Trust | | | | | | |
Series 2008-3 A1, 4.035%, 1/25/14 | | | 10,507,771 | | | 10,332,585 |
Series 2007-8 A1, 3.765%, 7/27/15 | | | 4,787,107 | | | 4,785,393 |
Series 2006-7 A2, 3.525%, 10/25/16 | | | 11,364,471 | | | 11,320,227 |
Series 2006-8 A2, 3.535%, 10/25/16 | | | 18,134,233 | | | 17,802,757 |
Series 2005-2 A4, 3.615%, 4/25/17 | | | 33,443,380 | | | 31,445,917 |
Series 2007-2 A2, 3.535%, 7/25/17 | | | 183,175,000 | | | 160,542,172 |
Series 2007-3 A2, 3.545%, 10/25/17 | | | 10,000,000 | | | 8,790,178 |
Series 2006-3A 4, 3.615%, 7/25/19 | | | 56,000,000 | | | 47,609,083 |
| | | | | | |
| | | | | | 292,628,312 |
| CORPORATE: 43.4% | | | | | | |
FINANCIALS: 17.1% | | | | | | |
American International Group, Inc.(b)
8.25%, 8/15/18 | | | 78,800,000 | | | 57,675,217 |
Bank of America Corp. | | | | | | |
5.30%, 3/15/17 | | | 105,000,000 | | | 99,700,230 |
8.00%, 12/15/26(a) | | | 14,615,000 | | | 11,364,448 |
5.625%, 3/8/35(a) | | | 21,450,000 | | | 17,850,448 |
6.625%, 5/23/36(a) | | | 64,470,000 | | | 61,265,374 |
Boston Properties, Inc. | | | | | | |
6.25%, 1/15/13 | | | 74,643,000 | | | 56,425,309 |
5.625%, 4/15/15 | | | 35,160,000 | | | 23,415,540 |
5.00%, 6/1/15 | | | 17,444,000 | | | 10,984,574 |
2.875%, 2/15/37 | | | 26,675,000 | | | 21,048,095 |
Capital One Financial Corp.
6.75%, 9/15/17 | | | 130,225,000 | | | 126,132,549 |
CIGNA Corp. | | | | | | |
7.00%, 1/15/11 | | | 13,665,000 | | | 13,477,038 |
6.375%, 10/15/11 | | | 28,755,000 | | | 27,884,529 |
7.65%, 3/1/23 | | | 3,597,000 | | | 3,183,323 |
7.875%, 5/15/27 | | | 27,840,000 | | | 25,787,162 |
8.30%, 1/15/33 | | | 7,445,000 | | | 6,809,867 |
6.15%, 11/15/36 | | | 38,000,000 | | | 28,914,238 |
Citigroup, Inc. | | | | | | |
6.125%, 11/21/17 | | | 77,115,000 | | | 77,927,792 |
3.849%, 5/15/18 | | | 161,000,000 | | | 120,811,368 |
GMAC, LLC(b),(g) | | | | | | |
6.875%, 9/15/11 | | | 365,615,000 | | | 299,533,950 |
6.875%, 8/28/12 | | | 35,495,000 | | | 27,245,732 |
8.00%, 11/1/31 | | | 124,120,000 | | | 73,775,687 |
Health Net, Inc.
6.375%, 6/1/17 | | | 46,160,000 | | | 18,346,666 |
HSBC Holdings PLC(c) (United Kingdom) | | | | | | |
6.50%, 5/2/36 | | | 41,875,000 | | | 42,516,106 |
6.50%, 9/15/37 | | | 78,475,000 | | | 79,698,033 |
| | | | | | |
| |
| | |
| | | PAR VALUE | | VALUE |
JPMorgan Chase & Co.(a) | | | | | | |
8.75%, 9/1/30 | | $ | 26,480,000 | | $ | 26,078,616 |
5.875%, 3/15/35 | | | 14,625,000 | | | 11,318,229 |
5.85%, 8/1/35 | | | 22,090,000 | | | 17,116,118 |
Kaupthing Bank HF(b),(c),(e)
(Iceland)
7.125%, 5/19/16 | | | 118,913,000 | | | 35,674 |
Liberty Mutual Group, Inc.(b) | | | | | | |
4.875%, 2/1/10 | | | 15,225,000 | | | 14,567,513 |
7.25%, 9/1/12 | | | 18,122,000 | | | 16,503,470 |
SLM Corp.
8.45%, 6/15/18 | | | 124,500,000 | | | 99,125,572 |
Travelers Cos., Inc. | | | | | | |
8.125%, 4/15/10 | | | 21,575,000 | | | 22,078,625 |
5.00%, 3/15/13 | | | 17,118,000 | | | 16,213,035 |
5.50%, 12/1/15 | | | 14,152,000 | | | 13,500,770 |
6.25%, 6/20/16 | | | 44,360,000 | | | 44,144,627 |
5.75%, 12/15/17 | | | 36,040,000 | | | 34,741,676 |
Unum Group | | | | | | |
7.625%, 3/1/11 | | | 11,496,000 | | | 11,333,585 |
6.85%, 11/15/15(b) | | | 21,150,000 | | | 17,294,947 |
7.19%, 2/1/28 | | | 11,640,000 | | | 9,301,792 |
7.25%, 3/15/28 | | | 25,730,000 | | | 20,684,321 |
6.75%, 12/15/28 | | | 8,005,000 | | | 6,058,640 |
Wachovia Corp. | | | | | | |
3.964%, 4/23/12 | | | 154,790,000 | | | 135,717,765 |
4.963%, 5/1/13 | | | 166,000,000 | | | 148,430,062 |
6.00%, 11/15/17 | | | 80,000,000 | | | 77,895,858 |
5.75%, 2/1/18 | | | 84,060,000 | | | 84,227,279 |
WellPoint, Inc. | | | | | | |
6.375%, 1/15/12 | | | 7,662,000 | | | 7,384,544 |
5.00%, 12/15/14 | | | 15,685,000 | | | 13,982,493 |
5.25%, 1/15/16 | | | 121,540,000 | | | 107,594,136 |
Wells Fargo & Co.
5.625%, 12/11/17 | | | 76,035,000 | | | 79,325,567 |
| | | | | | |
| | | | | | 2,366,428,189 |
INDUSTRIALS: 22.9% | | | | | | |
AT&T, Inc.
8.00%, 11/15/31 | | | 160,005,000 | | | 200,987,881 |
Boston Scientific Corp. | | | | | | |
5.45%, 6/15/14 | | | 51,258,000 | | | 43,825,590 |
6.25%, 11/15/15 | | | 15,000,000 | | | 12,600,000 |
6.40%, 6/15/16 | | | 60,317,000 | | | 51,571,035 |
Comcast Corp. | | | | | | |
5.30%, 1/15/14 | | | 75,090,000 | | | 70,218,912 |
5.85%, 11/15/15 | | | 24,985,000 | | | 23,633,187 |
5.90%, 3/15/16 | | | 41,765,000 | | | 39,877,848 |
6.50%, 1/15/17 | | | 42,020,000 | | | 41,503,742 |
6.30%, 11/15/17 | | | 31,370,000 | | | 30,538,507 |
5.875%, 2/15/18 | | | 58,260,000 | | | 55,207,293 |
6.45%, 3/15/37 | | | 3,120,000 | | | 3,104,765 |
6.95%, 8/15/37 | | | 16,599,000 | | | 17,479,610 |
6.40%, 5/15/38 | | | 12,600,000 | | | 12,570,554 |
Covidien, Ltd.
6.00%, 10/15/17 | | | 32,700,000 | | | 32,258,746 |
| | |
| See accompanying Notes to Financial Statements | | DODGE & COX INCOME FUND §PAGE 8 |
| | |
| PORTFOLIO OF INVESTMENTS | | December 31, 2008 |
| | | | | | |
| FIXED INCOME SECURITIES (continued) |
| | |
| | | PAR VALUE | | VALUE |
Cox Communications, Inc. | | | | | | |
5.45%, 12/15/14 | | $ | 114,974,000 | | $ | 100,551,661 |
5.875%, 12/1/16(b) | | | 78,390,000 | | | 69,711,365 |
9.375%, 1/15/19(b) | | | 88,095,000 | | | 92,173,887 |
Dillard’s, Inc. | | | | | | |
9.50%, 9/1/09 | | | 550,000 | | | 530,062 |
7.85%, 10/1/12 | | | 1,900,000 | | | 1,197,000 |
7.13%, 8/1/18 | | | 24,015,000 | | | 8,645,400 |
7.75%, 7/15/26 | | | 21,666,000 | | | 5,958,150 |
7.75%, 5/15/27 | | | 12,903,000 | | | 3,548,325 |
7.00%, 12/1/28 | | | 28,825,000 | | | 8,791,625 |
Dow Chemical Co. | | | | | | |
4.027%, 9/30/09(b) | | | 54,087,000 | | | 53,411,345 |
6.00%, 10/1/12 | | | 9,875,000 | | | 9,539,655 |
7.375%, 11/1/29 | | | 48,884,000 | | | 46,037,827 |
Ford Motor Credit Co.(g) | | | | | | |
7.375%, 2/1/11 | | | 305,048,000 | | | 228,786,000 |
7.25%, 10/25/11 | | | 235,750,000 | | | 174,455,000 |
7.80%, 6/1/12 | | | 38,625,000 | | | 27,423,750 |
7.00%, 10/1/13 | | | 2,070,000 | | | 1,430,219 |
General Electric Co.
5.00%, 2/1/13 | | | 31,739,000 | | | 32,097,365 |
HCA, Inc. | | | | | | |
8.75%, 9/1/10 | | | 54,920,000 | | | 52,723,200 |
7.875%, 2/1/11 | | | 54,800,000 | | | 48,224,000 |
6.95%, 5/1/12 | | | 147,133,000 | | | 120,649,060 |
6.30%, 10/1/12 | | | 32,100,000 | | | 22,630,500 |
6.25%, 2/15/13 | | | 39,655,000 | | | 24,784,375 |
6.75%, 7/15/13 | | | 29,463,000 | | | 18,561,690 |
5.75%, 3/15/14 | | | 28,700,000 | | | 16,000,250 |
6.50%, 2/15/16 | | | 19,690,000 | | | 12,109,350 |
Hewlett-Packard Co.
6.125%, 3/1/14 | | | 195,625,000 | | | 207,949,766 |
Lafarge SA(c) (France)
6.50%, 7/15/16 | | | 69,585,000 | | | 46,995,543 |
Liberty Media Corp. | | | | | | |
8.50%, 7/15/29 | | | 12,043,000 | | | 6,819,349 |
8.25%, 2/1/30 | | | 29,445,000 | | | 16,673,231 |
Macy’s, Inc. | | | | | | |
8.00%, 7/15/12 | | | 11,372,000 | | | 8,686,661 |
7.625%, 8/15/13 | | | 7,155,000 | | | 5,103,583 |
7.875%, 7/15/15 | | | 70,935,000 | | | 51,091,927 |
6.65%, 7/15/24 | | | 1,525,000 | | | 837,085 |
7.00%, 2/15/28 | | | 29,350,000 | | | 16,095,276 |
6.70%, 9/15/28 | | | 20,550,000 | | | 11,242,021 |
6.90%, 4/1/29 | | | 31,140,000 | | | 16,750,833 |
6.90%, 1/15/32 | | | 33,720,000 | | | 18,472,659 |
6.70%, 7/15/34 | | | 60,630,000 | | | 33,138,054 |
6.375%, 3/15/37 | | | 1,100,000 | | | 625,704 |
Nordstrom, Inc.
6.95%, 3/15/28 | | | 12,620,000 | | | 8,252,528 |
Sprint Nextel Corp. | | | | | | |
6.00%, 12/1/16 | | | 91,530,000 | | | 63,492,771 |
6.90%, 5/1/19 | | | 16,110,000 | | | 11,438,100 |
6.875%, 11/15/28 | | | 24,290,000 | | | 14,354,630 |
| | | | | | |
| |
| | |
| | | PAR VALUE | | VALUE |
Time Warner Cable, Inc.(g)
8.75%, 2/14/19 | | $ | 34,460,000 | | $ | 37,469,564 |
Time Warner, Inc. | | | | | | |
7.625%, 4/15/31 | | | 197,133,000 | | | 194,382,102 |
7.70%, 5/1/32 | | | 155,313,000 | | | 155,504,501 |
Wyeth | | | | | | |
5.50%, 2/1/14 | | | 110,715,000 | | | 112,462,968 |
5.50%, 2/15/16 | | | 15,000,000 | | | 15,274,260 |
5.45%, 4/1/17 | | | 47,445,000 | | | 48,322,780 |
Xerox Corp. | | | | | | |
9.75%, 1/15/09 | | | 17,375,000 | | | 17,357,538 |
7.125%, 6/15/10 | | | 77,900,000 | | | 73,119,175 |
6.875%, 8/15/11 | | | 52,650,000 | | | 45,511,029 |
6.40%, 3/15/16 | | | 38,716,000 | | | 30,198,480 |
7.20%, 4/1/16 | | | 17,996,000 | | | 13,421,082 |
6.75%, 2/1/17 | | | 46,321,000 | | | 33,612,092 |
6.35%, 5/15/18 | | | 39,865,000 | | | 31,178,177 |
| | | | | | |
| | | | | | 3,161,182,200 |
TRANSPORTATION: 3.4% | | | | | | |
Burlington Northern Santa Fe Corp. | | | | | | |
4.30%, 7/1/13 | | | 7,883,000 | | | 7,315,763 |
4.875%, 1/15/15 | | | 7,835,000 | | | 7,373,229 |
7.57%, 1/2/21 | | | 21,020,069 | | | 22,582,665 |
8.251%, 1/15/21 | | | 6,817,071 | | | 7,540,347 |
5.72%, 1/15/24 | | | 28,783,948 | | | 27,993,793 |
5.629%, 4/1/24 | | | 40,719,225 | | | 39,267,023 |
5.342%, 4/1/24 | | | 9,499,294 | | | 9,230,292 |
5.996%, 4/1/24 | | | 51,723,386 | | | 49,096,339 |
CSX Corp. | | | | | | |
9.75%, 6/15/20 | | | 10,272,000 | | | 11,643,569 |
6.251%, 1/15/23 | | | 22,073,281 | | | 20,662,322 |
FedEx Corp. | | | | | | |
6.72%, 7/15/23 | | | 23,282,894 | | | 22,331,510 |
7.65%, 7/15/24 | | | 2,782,404 | | | 2,776,412 |
Norfolk Southern Corp. | | | | | | |
7.70%, 5/15/17 | | | 29,475,000 | | | 31,594,724 |
9.75%, 6/15/20 | | | 14,188,000 | | | 16,694,168 |
Union Pacific Corp. | | | | | | |
6.50%, 4/15/12 | | | 12,337,000 | | | 12,665,966 |
5.375%, 5/1/14 | | | 22,886,000 | | | 21,587,403 |
4.875%, 1/15/15 | | | 10,764,000 | | | 9,838,727 |
6.85%, 1/2/19 | | | 7,290,304 | | | 7,580,335 |
7.875%, 1/15/19 | | | 1,700,000 | | | 1,942,128 |
6.70%, 2/23/19 | | | 9,125,143 | | | 9,253,782 |
7.60%, 1/2/20 | | | 1,635,540 | | | 1,747,012 |
6.061%, 1/17/23 | | | 16,040,251 | | | 15,618,589 |
4.698%, 1/2/24 | | | 5,922,584 | | | 5,371,825 |
5.082%, 1/2/29 | | | 10,764,255 | | | 9,825,915 |
5.866%, 7/2/30 | | | 60,737,379 | | | 56,982,922 |
6.176%, 1/2/31 | | | 41,423,701 | | | 40,735,188 |
| | | | | | |
| | | | | | 469,251,948 |
| | | | | | |
| | | | | | 5,996,862,337 |
TOTAL FIXED INCOME SECURITIES
(Cost $14,187,227,529) | | $ | 13,377,825,093 |
| | |
| PAGE 9 § DODGE & COX INCOME FUND | | See accompanying Notes to Financial Statements |
| | |
| PORTFOLIO OF INVESTMENTS | | December 31, 2008 |
| | | | | | | |
| PREFERRED STOCKS: 0.1% | | | | | |
| | |
| | | SHARES | | | VALUE |
| FINANCIALS: 0.1% | | | | | | | |
DIVERSIFIED FINANCIALS: 0.1% | | | | | | | |
Preferred Blocker, Inc. (a subsidiary of GMAC, LLC)(b),(f) | | | 116,114 | | | $ | 23,222,825 |
| | | | | | | |
TOTAL PREFERRED STOCKS
(Cost $23,222,825) | | | | | | $ | 23,222,825 |
| |
| SHORT-TERM INVESTMENTS: 1.7% | | | |
| | |
| | | PAR VALUE | | | VALUE |
MONEY MARKET FUND: 0.3% | | | | |
SSgA Prime Money Market Fund | | $ | 41,658,671 | | | $ | 41,658,671 |
| |
REPURCHASE AGREEMENT: 1.4% | | | | |
Fixed Income Clearing Corporation(d) 0.01%, 1/2/09,
maturity value $189,941,106 | | | 189,941,000 | | | | 189,941,000 |
| | | | | | | |
TOTAL SHORT-TERM INVESTMENTS
(Cost $231,599,671) | | | $ | 231,599,671 |
| | | | | | | |
TOTAL INVESTMENTS
(Cost $14,442,050,025) | | | 98.7 | % | | | 13,632,647,589 |
OTHER ASSETS LESS LIABILITIES | | | 1.3 | % | | | 175,659,378 |
| | | | | | | |
| NET ASSETS | | | 100.0 | % | | $ | 13,808,306,967 |
| | | | | | | |
(a) | Cumulative preferred security |
(b) | Security exempt from registration under Rule 144A of the Securities Act of 1933. The security may be resold in transactions exempt from registration, normally to qualified institutional buyers. As of December 31, 2008, all such securities in total represented $757,729,530 or 5.5% of net assets. |
(c) | Security issued by a foreign entity, denominated in U.S. dollars |
(d) | Repurchase agreement is collateralized by Fannie Mae 4.125%-5.125%, 4/15/11-6/16/11. Total collateral value is $193,742,750. |
(e) | Non-income producing/security in default. On October 9, 2008, Kaupthing Bank requested protection under the Icelandic Financial Supervisory Authority, which has appointed a resolution committee to oversee the affairs of Kaupthing, including supervision of its assets and business operations. |
(f) | Priced at fair value on December 31, 2008. See Notes 1 and 2. |
(g) | Subsidiary (see Note below) |
| | Note: Fixed income securities are grouped by parent company unless otherwise noted. Actual securities may be issued by the listed parent company or one of its subsidiaries. |
ARM: Adjustable Rate Mortgage
CMO: Collateralized Mortgage Obligation
DUS: Delegated Underwriting and Servicing
REMIC: Real Estate Mortgage Investment Conduit
| | |
| See accompanying Notes to Financial Statements | | DODGE & COX INCOME FUND §PAGE 10 |
| | | | |
STATEMENT OF ASSETS AND LIABILITIES | |
| |
| | | December 31, 2008 | |
ASSETS: | | | | |
Investments, at value (cost $14,442,050,025) | | $ | 13,632,647,589 | |
Receivable for paydowns on mortgage-backed securities | | | 7,467,401 | |
Receivable for Fund shares sold | | | 34,738,308 | |
Interest receivable | | | 161,391,508 | |
Prepaid expenses and other assets | | | 87,193 | |
| | | | |
| | | 13,836,331,999 | |
| | | | |
LIABILITIES: | | | | |
Payable for Fund shares redeemed | | | 22,290,125 | |
Management fees payable | | | 4,586,508 | |
Accrued expenses | | | 1,148,399 | |
| | | | |
| | | 28,025,032 | |
| | | | |
NET ASSETS | | $ | 13,808,306,967 | |
| | | | |
NET ASSETS CONSIST OF: | | | | |
Paid in capital | | $ | 14,894,938,953 | |
Undistributed net investment income | | | 12,291,572 | |
Accumulated net realized loss on investments | | | (289,521,122 | ) |
Net unrealized depreciation on investments | | | (809,402,436 | ) |
| | | | |
| | $ | 13,808,306,967 | |
| | | | |
Fund shares outstanding (par value $0.01 each, unlimited shares authorized) | | | 1,170,835,469 | |
Net asset value per share | | | $11.79 | |
|
STATEMENT OF OPERATIONS | |
| |
| | | Year Ended
December 31, 2008 | |
INVESTMENT INCOME: | | | | |
Interest | | $ | 898,828,211 | |
| |
EXPENSES: | | | | |
Management fees | | | 61,790,602 | |
Custody and fund accounting fees | | | 272,872 | |
Transfer agent fees | | | 3,183,475 | |
Professional services | | | 135,977 | |
Shareholder reports | | | 765,634 | |
Registration fees | | | 216,738 | |
Trustees’ fees | | | 151,188 | |
Miscellaneous | | | 111,074 | |
| | | | |
| | | 66,627,560 | |
| | | | |
NET INVESTMENT INCOME | | | 832,200,651 | |
| | | | |
REALIZED AND UNREALIZED LOSS ON INVESTMENTS: | | | | |
Net realized loss | | | (171,591,954 | ) |
Net change in unrealized depreciation | | | (783,334,610 | ) |
| | | | |
Net realized and unrealized loss | | | (954,926,564 | ) |
| | | | |
NET DECREASE IN NET ASSETS FROM OPERATIONS | | $ | (122,725,913 | ) |
| | | | |
| | | | | | | | |
STATEMENT OF CHANGES IN NET ASSETS | |
| | |
| | | Year Ended
December 31, 2008 | | | Year Ended
December 31, 2007 | |
OPERATIONS: | | | | | | | | |
Net investment income | | $ | 832,200,651 | | | $ | 722,120,865 | |
Net realized gain/(loss) | | | (171,591,954 | ) | | | 23,365,130 | |
Net change in unrealized appreciation/depreciation | | | (783,334,610 | ) | | | (81,102,429 | ) |
| | | | | | | | |
Net increase/(decrease) in net assets from operations | | | (122,725,913 | ) | | | 664,383,566 | |
| | | | | | | | |
| | |
DISTRIBUTIONS TO SHAREHOLDERS FROM: | | | | | | | | |
Net investment income | | | (842,066,629 | ) | | | (742,086,333 | ) |
Net realized gain | | | — | | | | — | |
| | | | | | | | |
Total distributions | | | (842,066,629 | ) | | | (742,086,333 | ) |
| | | | | | | | |
| | |
FUND SHARE TRANSACTIONS: | | | | | | | | |
Proceeds from sale of shares | | | 4,677,916,833 | | | | 6,536,074,931 | |
Reinvestment of distributions | | | 708,378,627 | | | | 628,066,510 | |
Cost of shares redeemed | | | (6,545,585,784 | ) | | | (3,125,765,674 | ) |
| | | | | | | | |
Net increase/(decrease) from Fund share transactions | | | (1,159,290,324 | ) | | | 4,038,375,767 | |
| | | | | | | | |
Total increase/(decrease) in net assets | | | (2,124,082,866 | ) | | | 3,960,673,000 | |
| | |
NET ASSETS: | | | | | | | | |
Beginning of year | | | 15,932,389,833 | | | | 11,971,716,833 | |
| | | | | | | | |
End of year (including undistributed net investment income of $12,291,572 and $3,485,360, respectively) | | $ | 13,808,306,967 | | | $ | 15,932,389,833 | |
| | | | | | | | |
| | |
SHARE INFORMATION: | | | | | | | | |
Shares sold | | | 383,415,743 | | | | 519,177,084 | |
Distributions reinvested | | | 59,473,610 | | | | 50,291,905 | |
Shares redeemed | | | (545,459,961 | ) | | | (248,523,160 | ) |
| | | | | | | | |
Net increase/(decrease) in shares outstanding | | | (102,570,608 | ) | | | 320,945,829 | |
| | | | | | | | |
| | |
| PAGE 11 § DODGE & COX INCOME FUND | | See accompanying Notes to Financial Statements |
NOTES TO FINANCIAL STATEMENTS
NOTE 1—ORGANIZATION AND SIGNIFICANT ACCOUNTING POLICIES
Dodge & Cox Income Fund (the “Fund”) is one of the series constituting the Dodge & Cox Funds (the “Trust” or the “Funds”). The Trust is organized as a Delaware statutory trust and is registered under the Investment Company Act of 1940, as amended, as a diversified, open-end management investment company. The Fund commenced operations on January 3, 1989, and seeks high and stable current income consistent with long-term preservation of capital. Risk considerations and investment strategies of the Fund are discussed in the Fund’s Prospectus.
The financial statements have been prepared in conformity with accounting principles generally accepted in the United States of America, which require the use of estimates and assumptions by management. Significant accounting policies are as follows:
Security valuation The Fund’s net assets are valued as of the close of trading on the New York Stock Exchange (NYSE), generally 4:00 p.m. Eastern Time, each day that the NYSE is open for business. Fixed income securities with original maturities of one year or more are priced on the basis of valuations furnished by pricing services which utilize both dealer-supplied valuations and computerized pricing models. Under certain circumstances, fixed income securities that are not valued by pricing services are temporarily valued by the investment manager utilizing both dealer-supplied valuations and computerized pricing models. Valuations of fixed income securities take into account appropriate factors such as institutional-size trading markets in similar groups of securities, yield, quality, coupon rate, maturity, type of issue, trading characteristics and other market data and do not rely exclusively upon exchange or over-the-counter listed prices. Security values are not discounted based on the size of the Fund’s position. Securities for which market quotations are not readily available are valued at fair value as determined in good faith by or at the direction of the Board of Trustees. Short-term securities are valued at amortized cost which approximates current value. All securities held by the Fund are denominated in U.S. dollars.
Security transactions, investment income, expenses, and distributions Security transactions are
recorded on the trade date. Realized gains and losses on securities sold are determined on the basis of identified cost.
Interest income is recorded on the accrual basis. Interest income includes coupon interest, amortization of premium and accretion of discount on debt securities, and gain/loss on paydowns of mortgage-backed securities. The ability of the issuers of the debt securities held by the Fund to meet their obligations may be affected by economic developments in a specific industry, state or region. Debt obligations may be placed on non-accrual status and related interest income may be reduced by ceasing current accruals and writing off interest receivables when the collection of all or a portion of interest has become doubtful. A debt obligation is removed from non-accrual status when the issuer resumes interest payments or when collectibility of interest is reasonably assured. Dividend Income is recorded on the ex-dividend date.
Expenses are recorded on the accrual basis. Most expenses of the Trust can be directly attributed to a specific series. Expenses which cannot be directly attributed are allocated among the Funds in the Trust.
Distributions to shareholders are recorded on the ex-dividend date.
Repurchase agreements The Fund may enter into repurchase agreements, secured by U.S. government or agency securities, which involve the purchase of securities from a counterparty with a simultaneous commitment to resell the securities at an agreed-upon date and price. It is the Fund’s policy that its custodian take possession of the underlying collateral securities, the fair value of which exceeds the principal amount of the repurchase transaction, including accrued interest, at all times. In the event of default by the counterparty, the Fund has the contractual right to liquidate the securities and to apply the proceeds in satisfaction of the obligation.
NOTE 2—VALUATION MEASUREMENTS
Various inputs are used in determining the value of the Fund’s investments. These inputs are summarized in the three broad levels listed below.
| § | | Level 1: Quoted prices in active markets for identical securities |
| § | | Level 2: Other significant observable inputs (including quoted prices for similar securities, market indices, interest rates, credit risk, etc.) |
DODGE & COX INCOME FUND §PAGE 12
NOTES TO FINANCIAL STATEMENTS
| § | | Level 3: Significant unobservable inputs (including the Fund’s own assumptions in determining the fair value of investments) |
The inputs or methodology used for valuing securities are not necessarily an indication of the risk associated with investing in those securities.
The following is a summary of the inputs used to value the Fund’s net assets as of December 31, 2008:
| | | |
| Valuation Inputs | | Investments in Securities |
Level 1: Quoted Prices | | $ | 285,943,151 |
Level 2: Other Significant Observable Inputs | | | 13,323,481,613 |
Level 3: Significant Unobservable Inputs* | | | 23,222,825 |
| | | |
Total | | $ | 13,632,647,589 |
| | | |
| | | | |
| * | | Represents preferred shares (Preferred Blocker, Inc., a subsidiary of GMAC, LLC) received on December 31, 2008 pursuant to an exchange offer. Beginning in early January 2009, quoted prices were used to value these shares. |
NOTE 3—RELATED PARTY TRANSACTIONS
Management fees Under a written agreement approved by a unanimous vote of the Board of Trustees, the Fund pays an annual management fee of 0.50% of the Fund’s average daily net assets up to $100 million and 0.40% of the Fund’s average daily net assets in excess of $100 million to Dodge & Cox, investment manager of the Fund. The agreement further provides that Dodge & Cox shall waive its fee to the extent that such fee plus all other ordinary operating expenses of the Fund exceed 1% of the average daily net assets for the year.
Fund officers and trustees All officers and three of the trustees of the Trust are officers or employees of Dodge & Cox. The Trust pays a fee only to those trustees who are not affiliated with Dodge & Cox.
Indemnification Under the Trust’s organizational documents, its officers and trustees are indemnified against certain liabilities arising out of the performance of their duties to the Trust. In addition, in the normal course of business the Trust enters into contracts that provide general indemnities to other parties. The Trust’s maximum exposure under these arrangements is unknown as this would involve future claims that may be made against the Trust that have not yet occurred.
NOTE 4—INCOME TAX INFORMATION AND DISTRIBUTIONS TO SHAREHOLDERS
A provision for federal income taxes is not required since the Fund intends to continue to qualify as a regulated investment company under Subchapter M of the Internal Revenue Code and distribute all of its taxable income to shareholders. Distributions are determined in accordance with income tax regulations, which may differ from net investment income and realized gains for financial reporting purposes. Financial reporting records are adjusted for permanent book/tax differences to reflect tax character.
Book/tax differences are primarily due to differing treatments of net short-term realized gain/(loss), paydown loss, and defaulted fixed income securities. At December 31, 2008, the cost of investments for federal income tax purposes was equal to the cost for financial reporting purposes.
Distributions for the years ended December 31, 2008 and 2007 were characterized as follows for federal income tax purposes:
| | | | | | |
| | | Year Ended December 31, 2008 | | Year Ended December 31, 2007 |
Ordinary income | | $ | 842,066,629 | | $ | 742,086,333 |
| | | ($0.675 per share) | | | ($0.635 per share) |
Long-term capital gain | | | — | | | — |
At December 31, 2008, the tax basis components of distributable earnings were as follows:
| | | | |
Unrealized appreciation | | $ | 201,652,833 | |
Unrealized depreciation | | | (1,011,055,269 | ) |
| | | | |
Net unrealized depreciation | | | (809,402,436 | ) |
Undistributed ordinary income | | | 12,291,572 | |
Capital loss carryforward* | | | (94,989,305 | ) |
Deferred loss** | | | (191,095,727 | ) |
| * | | Represents accumulated capital loss as of December 31, 2008 which may be carried forward to offset future capital gains. During 2008, the Fund utilized $4,267,673 of this capital loss carryforward. If not utilized, the remaining carryforward expires as follows: |
| | | |
Expiring in 2011 | | $ | 3,015,471 |
Expiring in 2012 | | | 32,528,048 |
Expiring in 2013 | | | 19,963,019 |
Expiring in 2014 | | | 39,482,767 |
| | | |
| | $ | 94,989,305 |
| | | |
| ** | Represents net realized loss incurred between November 1, 2008 and December 31, 2008. As permitted by tax regulations, the Fund has elected to treat this loss as arising in 2009. |
PAGE 13 § DODGE & COX INCOME FUND
NOTES TO FINANCIAL STATEMENTS
NOTE 5—COMMITTED LINE OF CREDIT
The Fund participates with the Funds in a $200 million committed credit facility (“Line of Credit”) with State Street Bank and Trust Company to be utilized for temporary or emergency purposes to fund shareholder redemptions or for other short-term liquidity purposes. Interest on borrowings is charged at the prevailing rate. There were no borrowings on the Line of Credit during the year.
NOTE 6—PURCHASES AND SALES OF INVESTMENTS
For the year ended December 31, 2008, purchases and sales of securities, other than short-term securities and U.S. government securities, aggregated $1,680,360,552 and $188,842,264, respectively. For the year ended December 31, 2008, purchases and sales of U.S. government securities aggregated $2,310,399,827 and $4,670,036,630, respectively.
NOTE 7—ACCOUNTING PRONOUNCEMENTS
Effective June 29, 2007, the Fund adopted the Financial Accounting Standards Board (FASB) Interpretation No. 48, “Accounting for Uncertainty in Income Taxes” (FIN 48). FIN 48 clarifies the accounting for income taxes by prescribing the minimum recognition threshold a tax position must meet before being recognized in the financial statements. At December 31, 2008, FIN 48 was applied to the period from January 1, 2005 through December 31, 2008, the open tax years subject to regulatory examination. There was no impact to the Fund’s financial statements as a result of applying FIN 48.
Effective January 1, 2009, the Fund will adopt “Statement of Financial Accounting Standards No. 161, Disclosures about Derivative Instruments and Hedging Activities” (FAS 161). FAS 161 requires enhanced disclosures about the Fund’s derivative and hedging activities. Management expects that implementation of FAS 161 will not significantly impact the Fund’s financial statement disclosures.
FINANCIAL HIGHLIGHTS
| | | | | | | | | | | | | | | |
SELECTED DATA AND RATIOS (for a share outstanding throughout each year) | | Year Ended December 31, | |
| | | 2008 | | | 2007 | | | 2006 | | | 2005 | | | 2004 | |
Net asset value, beginning of year | | $12.51 | | | $12.57 | | | $12.54 | | | $12.84 | | | $12.92 | |
Income from investment operations: | | | | | | | | | | | | | | | |
Net investment income | | 0.68 | | | 0.63 | | | 0.61 | | | 0.55 | | | 0.54 | |
Net realized and unrealized gain (loss) | | (0.72 | ) | | (0.05 | ) | | 0.04 | | | (0.30 | ) | | (0.08 | ) |
| | | |
Total from investment operations | | (0.04 | ) | | 0.58 | | | 0.65 | | | 0.25 | | | 0.46 | |
| | | |
Distributions to shareholders from: | | | | | | | | | | | | | | | |
Net investment income | | (0.68 | ) | | (0.64 | ) | | (0.62 | ) | | (0.55 | ) | | (0.54 | ) |
Net realized gain | | — | | | — | | | — | | | — | | | — | |
| | | |
Total distributions | | (0.68 | ) | | (0.64 | ) | | (0.62 | ) | | (0.55 | ) | | (0.54 | ) |
| | | |
Net asset value, end of year | | $11.79 | | | $12.51 | | | $12.57 | | | $12.54 | | | $12.84 | |
| | | |
Total return | | (0.29 | )% | | 4.68 | % | | 5.30 | % | | 1.98 | % | | 3.64 | % |
Ratios/supplemental data: | | | | | | | | | | | | | | | |
Net assets, end of year (millions) | | $13,808 | | | $15,932 | | | $11,972 | | | $9,610 | | | $7,870 | |
Ratio of expenses to average net assets | | 0.43 | % | | 0.44 | % | | 0.44 | % | | 0.44 | % | | 0.44 | % |
Ratio of net investment income to average net assets | | 5.40 | % | | 5.07 | % | | 4.77 | % | | 3.99 | % | | 3.61 | % |
Portfolio turnover rate | | 24 | % | | 27 | % | | 30 | % | | 24 | % | | 30 | % |
See accompanying Notes to Financial Statements
DODGE & COX INCOME FUND §PAGE 14
REPORT OF INDEPENDENT REGISTERED PUBLIC ACCOUNTING FIRM
To the Trustees of Dodge & Cox Funds and Shareholders of Dodge & Cox Income Fund
In our opinion, the accompanying statement of assets and liabilities, including the portfolio of investments, and the related statements of operations and of changes in net assets and the financial highlights present fairly, in all material respects, the financial position of Dodge & Cox Income Fund (the “Fund”, one of the series constituting Dodge & Cox Funds) at December 31, 2008, the results of its operations for the year then ended, the changes in its net assets for each of the two years in the period then ended and the financial highlights for each of the five years in the period then ended, in conformity with accounting principles generally accepted in the United States of America. These financial statements and financial highlights (hereafter referred to as “financial statements”) are the responsibility of the Fund’s management; our responsibility is to express an opinion on these financial statements based on our audits. We conducted our audits of these financial statements in accordance with the standards of the Public Company Accounting Oversight Board (United States). Those standards require that we plan and perform the audit to obtain reasonable assurance about whether the financial statements are free of material misstatement. An audit includes examining, on a test basis, evidence supporting the amounts and disclosures in the financial statements, assessing the accounting principles used and significant estimates made by management, and evaluating the overall financial statement presentation. We believe that our audits, which included confirmation of securities at December 31, 2008 by correspondence with the custodian and brokers, provide a reasonable basis for our opinion.
PricewaterhouseCoopers LLP
San Francisco, California
February 13, 2009
BOARD APPROVAL OF FUNDS’ INVESTMENT MANAGEMENT
AGREEMENTS AND MANAGEMENT FEES
(unaudited)
The Board of Trustees is responsible for overseeing the performance of the Dodge & Cox Funds’ investment manager and determining whether to continue the Investment Management Agreements between the Funds and Dodge & Cox each year (the “Agreements”). At a meeting of the Board of Trustees of the Trust held on December 15, 2008, the Trustees, by a unanimous vote (including a separate vote of those Trustees who are not “interested persons” (as defined in the Investment Company Act of 1940) (the “Independent Trustees”)), approved the renewal of the Agreements for an additional one-year term through December 31, 2009. During the course of the year, the Board received a wide variety of materials relating to the services provided by Dodge & Cox and the performance of the Funds.
INFORMATION RECEIVED
In advance of the meeting, the Board, including each of the Independent Trustees, requested, received and reviewed materials relating to the Agreements. The Independent Trustees retained Morningstar® to prepare an independent expense and performance summary for each Fund and comparable funds managed by other advisers identified by Morningstar®. The Morningstar® materials included information regarding advisory fee rates, expense ratios, and transfer agency, custodial and distribution expenses, as well as appropriate performance comparisons to an index or combination of indices. The materials reviewed by the Board also included information concerning Dodge & Cox’s profitability, financial results and condition, including advisory fee revenue and separate account advisory fee schedules. The Board additionally considered the Funds’ brokerage commissions, turnover rates and sales and redemption data for the Funds, including “soft dollar” payments made for research
PAGE 15 § DODGE & COX INCOME FUND
benefiting the Funds and other accounts managed by Dodge & Cox, and brokerage commissions and expenses paid by Dodge & Cox. Other aspects of Dodge & Cox’s services to the Funds which were reviewed included compliance and supervision of third-party service providers (e.g., custodian, fund accountant, transfer agent and state registration administrator), shareholder servicing, accounting and administrative services, web services, the character of non-advisory services, the record of compliance with the Funds’ investment policies and restrictions and the Funds’ Code of Ethics, investment management staffing and biographies, information furnished to investors and shareholders (including the Funds’ Prospectus, Statement of Additional Information, shareholder reports, and quarterly reports), and third-party retirement plan administrator reimbursements by Dodge & Cox for the same periods.
The Board received copies of the Agreements and a memorandum from the Independent Legal Counsel to the Independent Trustees, discussing the factors generally regarded as appropriate to consider in evaluating advisory arrangements. The Trust’s Contract Review Committee, consisting solely of Independent Trustees, met with the Independent Legal Counsel on December 3, 2008 and again on December 15, 2008 to discuss whether to renew the Agreements. The Board, including the Independent Trustees, subsequently concluded that the existing Agreements are fair and reasonable and voted to approve the Agreements.
In considering the Agreements, the Board, including the Independent Trustees, did not identify any single factor or particular information as all-important or controlling. In reaching the decision to approve the Agreements, the Board, which was advised by Independent Legal Counsel, considered the following factors, among others, and reached the conclusions described below.
NATURE, QUALITY, AND EXTENT OF THE SERVICES
The Board considered that Dodge & Cox provides a wide range of services to the Funds in addition to portfolio management and that the quality of these services has been excellent in all respects. The extensive nature of
services provided by Dodge & Cox has been documented in materials provided to the Board and in presentations made to the Board throughout the year. In particular, the Board considered the nature, quality and extent of portfolio management, administrative and shareholder services performed by Dodge & Cox, including: Dodge & Cox’s established long-term history of care and conscientiousness in the management of the Funds; demonstrated consistency in investment approach and depth, background and experience of the Dodge & Cox Investment Policy Committee, International Investment Policy Committee, Global Investment Policy Committee, Fixed Income Investment Policy Committee and research analysts responsible for managing the Funds; Dodge & Cox’s organizational structure; Dodge & Cox’s performance in the areas of compliance, administration and shareholder communication and services, supervision of Fund operations and general oversight of other service providers; peer group comparisons of expense ratios, management fee comparisons, expenses (e.g., transfer agent, custody and other fees and expenses) and asset comparisons and performance and risk summaries prepared independently by Morningstar® and favorable stewardship ratings and “Star” rankings by Morningstar®. The Board concluded that it was satisfied with the nature, extent and quality of investment management and other services provided to the Funds by Dodge & Cox.
INVESTMENT PERFORMANCE
The Board considered short-term and long-term investment performance for each Fund (including periods of outperformance or underperformance) as compared to both relevant indices and the performance of such Fund’s peer group. In light of recent market volatility, the Board also reviewed recent performance in the context of long-term investment goals. The Board noted that the shorter-term performance of the Funds has been disappointing. The performance information prepared by Morningstar® and Dodge & Cox demonstrated more favorable performance over the long term in keeping with the stated goals in the Prospectus. The Board considered that the performance of the Funds is the result of a team-oriented investment management process that emphasizes a long-term investment horizon, independence,
DODGE & COX INCOME FUND §PAGE 16
comprehensive research, price discipline and focus. The Board also noted that the investment performance delivered by Dodge & Cox to the Funds appeared to be consistent with the relevant performance delivered for other (non-fund) clients of Dodge & Cox. The Board concluded that Dodge & Cox is well positioned to deliver favorable long-term performance for Fund investors consistent with the long-term investment strategies being pursued by the Funds.
COSTS AND ANCILLARY BENEFITS
Costs of Services to Funds: Fees and Expenses. The Board considered each Fund’s management fee rates and expense ratios relative to industry averages for similar mutual funds and relative to management fees charged by Dodge & Cox to other (non-fund) clients. The Board evaluated the operating structures of the Funds and Dodge & Cox, including the following: Dodge & Cox has a centralized focus on investment management operations and derives revenue solely from management fees; its outsourcing of non-advisory support services to unaffiliated third-party service providers is efficient and less costly to investors; Dodge & Cox does not charge front-end sales commissions or distribution fees and bears all third party research and distribution-related costs as well as reimbursements to third-party retirement plan administrators; the Funds receive numerous administrative, regulatory compliance, and shareholder support services from Dodge & Cox without any additional administrative fee; and the fact that the Funds have relatively low transaction costs and portfolio turnover rates. The Board noted that the Funds are substantially below peer group averages in expense ratios and management fee rates and that many media and industry reports specifically comment on the low expense ratios of Dodge & Cox, which along with solid long-term performance, has been a defining characteristic of Dodge & Cox for many years. The Board also noted that the range of services under the Agreements is much more extensive than under Dodge & Cox’s separate advisory (non-fund) client agreements and that many of the separate accounts were opened decades ago when fees were lower, and considered that, when coupled with the greater risks and regulatory burdens associated with the high profile mutual fund business, there is
reasonable justification for differences in fee rates charged between the two lines of business. The Board concluded that costs incurred by the Funds for the services they receive (including the management fee paid to Dodge & Cox) are reasonable and that the fees are acceptable based upon the qualifications, experience, reputation and performance of Dodge & Cox and the low overall expense ratios of the Funds.
Profitability and Costs of Services to Dodge & Cox; “Fall-out” Benefits. The Board reviewed reports of Dodge & Cox’s financial position, profitability and estimated overall value, and they considered Dodge & Cox’s overall profitability within its context as a private, employee-owned S-Corporation and relative to the favorable services provided. The Board noted that net revenues for 2008 reflect a decline in assets under management compared with 2007. The Board recognized the importance of Dodge & Cox’s profitability—which is derived solely from management fees and does not include other business ventures—to maintain its independence, stability, company culture and ethics, and management continuity. The Board also considered that revenues reflect the continued success of the Funds and that such revenues are not generated by fees that are high compared to its peers. They noted that Dodge & Cox’s profitability is enhanced due to its efficient internal business model, and that the compensation/profit structure at Dodge & Cox is vital for remaining independent and facilitating retention of its management and investment professionals. The Board considered potential “fall-out” benefits (including the receipt of research from unaffiliated brokers) that Dodge & Cox might receive in its association with the Funds. The Board also noted the extent of additional administrative services performed by Dodge & Cox for the Funds, and that the magnitude of costs and risks borne by Dodge & Cox in rendering advisory services to the Funds (including risks in the compliance, securities valuation and investment management processes) are continuing to increase. The Board concluded that the profitability of Dodge & Cox’s relationship with the Funds (including fall-out benefits) was fair and reasonable.
PAGE 17 § DODGE & COX INCOME FUND
THE BENEFIT OF ECONOMIES OF SCALE
The Board considered whether there have been economies of scale with respect to the management of each Fund, whether the Funds have appropriately benefited from any economies of scale, and whether the management fee rate is reasonable in relation to the Fund assets and any economies of scale that may exist. In the Board’s view, any consideration of economies of scale must take account of the Funds’ low fee structure and the considerable efficiencies of the Funds’ organization and fee structure that has been realized by shareholders at the outset of their investment (i.e., from the first dollar). Shareholders also realize efficiencies from the outset of their investment due to organizational efficiencies derived from Dodge & Cox’s investment management process (e.g., low portfolio turnover) and the avoidance of distribution and marketing structures whose costs would ultimately be borne by shareholders of the Funds. The Board noted that Dodge & Cox has shared economies of scale by adding or enhancing services to the Funds over time, and that the internal costs of providing investment management, administrative and compliance services to the Funds are continuing to increase. Thus, the Funds provide access by small investors to top-rank investment management at a relatively low cost. The Board’s decision to renew the Agreements was made after consideration of economies of scale and review of comparable fund expense ratios and historical expense ratio patterns for the Funds. Their review also included consideration of the desirability of adding breakpoints to the Funds’ fee schedules. The Board concluded that the current Dodge & Cox fee structure is fair and reasonable and adequately reflects economies of scale.
CONCLUSION
Based on their evaluation of all material factors and assisted by the advice of Independent Legal Counsel to
the Independent Trustees, the Board, including the Independent Trustees, concluded that the advisory fee structure was fair and reasonable, that each Fund was paying a competitive fee for the services provided, that the scope and quality of Dodge & Cox’s services has provided substantial value for Fund shareholders over the long term, and that approval of the Agreements was in the best interests of each Fund and its shareholders.
FUND HOLDINGS
The Fund provides a complete list of its holdings four times each fiscal year, as of the end of each quarter. The lists appear in the Fund’s First Quarter, Semi-Annual, Third Quarter and Annual Reports to shareholders. The Fund files the lists with the Securities and Exchange Commission (SEC) on Form N-CSR (second and fourth quarters) and Form N-Q (first and third quarters). Shareholders may view the Fund’s Forms N-CSR and N-Q on the SEC’s website at www.sec.gov. Forms N-CSR and N-Q may also be reviewed and copied at the SEC’s Public Reference Room in Washington, DC. Information regarding the operations of the Public Reference Room may be obtained by 1-202-942-8090 (direct) or 1-800-732-0330 (general SEC number). A complete list of the Fund’s quarter-end holdings is also available at www.dodgeandcox.com on or about 15 days following each quarter end and remains available on the web site until the list is updated in the subsequent quarter.
PROXY VOTING
For a free copy of the Fund’s proxy voting policies and procedures, please call 1-800-621-3979, visit the Fund’s web site at www.dodgeandcox.com or visit the SEC’s web site at www.sec.gov. Information regarding how the Fund voted proxies relating to portfolio securities during the most recent 12-month period ending June 30 is also available at www.dodgeandcox.com or at www.sec.gov.
DODGE & COX INCOME FUND §PAGE 18
DODGE & COX FUNDS—EXECUTIVE OFFICER & TRUSTEE INFORMATION
| | | | | | |
Name (Age) and
Address* | | Position with Trust
(Year of Election or
Appointment) | | Principal Occupation During Past 5 Years | | Other Directorships Held by Trustees |
| INTERESTED TRUSTEES & OFFICERS |
John A. Gunn
(65) | | Chairman and Trustee
(Trustee since 1985) | | Chairman (since 2007), Chief Executive Officer (since 2005) and Director of Dodge & Cox, Portfolio Manager and member of Investment Policy Committee (IPC), Global Investment Policy Committee (GIPC) (since 2008), and International Investment Policy Committee (IIPC) | | — |
| Kenneth E. Olivier (56) | | President and Trustee
(Trustee since 2005) | | President (since 2005) and Director of Dodge & Cox, Portfolio Manager, and member of IPC | | — |
| Dana M. Emery (47) | | Senior Vice President and Trustee (Trustee since 1993) | | Executive Vice President (since 2005) and Director of Dodge & Cox, Manager of the Fixed Income Department, Portfolio Manager, and member of Fixed Income Investment Policy Committee (FIIPC) | | — |
| Charles F. Pohl (50) | | Senior Vice President (Officer since 2004) | | Senior Vice President and Director of Dodge & Cox, Chief Investment Officer (since 2007), Director of Credit Research, Portfolio Manager, Investment Analyst, and member of IPC, GIPC (since 2008), IIPC (since 2007), and FIIPC | | — |
| Diana S. Strandberg (49) | | Senior Vice President
(Officer since 2005) | | Vice President of Dodge & Cox, Portfolio Manager, and member of IPC, GIPC (since 2008), and IIPC | | — |
| David H. Longhurst (51) | | Treasurer
(Officer since 2006) | | Vice President and Assistant Treasurer of Dodge & Cox (since 2008); Vice President, Treasurer, Controller and Secretary of Safeco Mutual Funds, Safeco Asset Management Company, Safeco Services, Safeco Securities, and Safeco Investment Services (2000-2004) | | — |
| Thomas M. Mistele (55) | | Secretary (Officer since 2000) | | Chief Operating Officer (since 2004), Director (since 2005), Secretary, and General Counsel of Dodge & Cox | | — |
Marcia P. Venegas
(40) | | Chief Compliance Officer
(Officer since 2004) | | Associate Chief Compliance Officer of Dodge & Cox (since 2008), Chief Compliance Officer of Dodge & Cox (2005-2008), Compliance Officer of Dodge & Cox (2003-2004) | | — |
| INDEPENDENT TRUSTEES |
| William F. Ausfahl (68) | | Trustee (Since 2002) | | CFO, The Clorox Co. (1982-1997); Director, The Clorox Co. (1984-1997) | | — |
| L. Dale Crandall (67) | | Trustee (Since 1999) | | President, Kaiser Foundation Health Plan, Inc. and Kaiser Foundation Hospitals (2000-2002); Senior Vice President—Finance and Administration & CFO, Kaiser Foundation Health Plan, Inc. and Kaiser Foundation Hospitals (1998-2000) | | Director, Ansell Limited (medical equipment and supplies) (2002-Present); Director, Coventry Health Care, Inc. (managed health care) (2004-Present); Director, Metavante Technologies, Inc. (software) (2007 to present) |
| Thomas A. Larsen (59) | | Trustee (Since 2002) | | Director in Howard, Rice, Nemerovski, Canady, Falk & Rabkin (law firm) | | — |
John B. Taylor
(62) | | Trustee (Since 2005) | | Professor of Economics, Stanford University; Senior Fellow, Hoover Institution; Under Secretary for International Affairs, United States Treasury (2001-2005) | | — |
Will C. Wood
(69) | | Trustee (Since 1992) | | Principal, Kentwood Associates, Financial Advisers | | Director, Banco Latinoamericano de Exportaciones S.A. (Latin American foreign trade bank) (1999-Present) |
| * | | The address for each Officer and Trustee is 555 California Street, 40th Floor, San Francisco, California 94104. Each Officer and Trustee oversees all five series in the Dodge & Cox Funds complex and serves for an indefinite term. |
Additional information about the Trust’s Trustees and Officers is available in the Trust’s Statement of Additional Information (SAI). You can get a free copy of the SAI by visiting the Fund’s website at www.dodgeandcox.com or calling 1-800-621-3979.
PAGE 19 § DODGE & COX INCOME FUND
A code of ethics, as defined in Item 2 of Form N-CSR, adopted by the registrant and applicable to the registrant’s principal executive officer and principal financial officer was in effect during the entire period covered by this report. A copy of the code of ethics effective December 15, 2008 is filed as an exhibit to this Form N-CSR. No substantive amendments were approved or waivers were granted to this code of ethics during the period covered by this report.
| ITEM 3. | AUDIT COMMITTEE FINANCIAL EXPERT. |
The Board of Trustees of the registrant has determined that William F. Ausfahl and L. Dale Crandall, members of the registrant’s Audit and Compliance Committee, are each an “audit committee financial expert” and are “independent,” as defined in Item 3 of Form N-CSR.
| ITEM 4. | PRINCIPAL ACCOUNTANT FEES AND SERVICES. |
(a)– (d) Aggregate fees billed to the registrant for the fiscal years ended December 31, 2008 and December 31, 2007 for professional services rendered by the registrant’s principal accountant were as follows:
| | | | | | |
| | | 2008 | | 2007 |
Audit Fees | | $ | 225,000 | | $ | 191,720 |
Audit-Related Fees | | | 26,250 | | | 22,400 |
Tax Fees | | | 87,600 | | | 66,380 |
All Other Fees | | | — | | | — |
Audit fees include amounts related to the audit of the registrant’s annual financial statements and services normally provided by the accountant in connection with statutory and regulatory filings. Audit-related fees include the performance of agreed-upon procedures related to the registrant’s semi-annual financial statements and internal controls. Tax fees include amounts related to tax advice and tax return preparation, compliance, and reviews.
(e) (1) The registrant’s Audit and Compliance Committee has adopted policies and procedures (“Policies”) which require the registrant’s Audit and Compliance Committee to pre-approve all audit and non-audit services provided by the principal accountant to the registrant. The policies also require the Audit and Compliance Committee to pre-approve any engagement of the principal accountant to provide non-audit services to the registrant’s investment adviser, if the services directly impact the registrant’s operations and financial reporting. The Policies do not apply in the case of audit services that the principal accountant provides to the registrant’s adviser. If a service (other than the engagement of the principal accountant to audit the registrant’s financial statements) is required to be pre-approved under the Policies between regularly scheduled Audit and Compliance Committee meetings, pre-approval may be authorized by a designated Audit and Compliance Committee member with ratification at the next scheduled Audit and Compliance Committee meeting.
(e) (2) No services included in (b) – (d) above were approved pursuant to paragraph (c) (7) (i) (C) of Rule 2-01 of Regulation S-X.
(f) Less than 50% of the hours expended on the principal accountant’s engagement to audit the registrant’s financial statements for the most recent fiscal year were attributed to work performed by persons other than the principal accountant’s full-time, permanent employees.
(g) For the fiscal years ended December 31, 2008 and December 31, 2007, the aggregate fees billed by the registrant’s principal accountant for non-audit services rendered to the registrant, for non-audit services rendered to the registrant’s investment adviser, and for non-audit services rendered to entities controlled by the adviser were $452,000 and $450,000, respectively.
(h) All non-audit services described under (g) above that were not pre-approved by the registrant’s Audit and Compliance Committee were considered by the registrant’s Audit and Compliance Committee and found to be compatible with maintaining the principal accountant’s independence.
| ITEM 5. | AUDIT COMMITTEE OF LISTED REGISTRANTS. |
Not applicable.
| ITEM 6. | SCHEDULE OF INVESTMENTS. |
Not applicable. The complete schedule of investments is included in Item 1 of this Form N-CSR.
| ITEM 7. | DISCLOSURE OF PROXY VOTING POLICIES AND PROCEDURES FOR CLOSED-END MANAGEMENT INVESTMENT COMPANIES. |
Not applicable.
| ITEM 8. | PORTFOLIO MANAGERS OF CLOSED-END MANAGEMENT INVESTMENT COMPANIES. |
Not applicable.
| ITEM 9. | PURCHASES OF EQUITY SECURITIES BY CLOSED-END MANAGEMENT INVESTMENT COMPANY AND AFFILIATED PURCHASERS. |
Not applicable.
| ITEM 10. | SUBMISSION OF MATTERS TO A VOTE OF SECURITY HOLDERS. |
The registrant has adopted the following procedures by which shareholders may recommend nominees to the registrant’s Board of Trustees.
1. The shareholder must submit any such recommendation in writing to the registrant to the attention of the Secretary at the address of the principal executive offices of the registrant. The shareholder’s recommendation is then considered by the registrant’s Nominating Committee.
2. The shareholder recommendation must include:
(i) A statement in writing setting forth (a) the name, date of birth, business address and residence address of the person recommended by the shareholder (the “candidate”); and (b) whether the recommending shareholder believes that the candidate is or will be an “interested person” of the registrant (as defined in the Investment Company Act of 1940) and, if not an “interested person,” information regarding the candidate that will be sufficient for the registrant to make such determination and, if applicable, similar information regarding whether the candidate would satisfy the standards for independence of a Board member under listing standards of the New York Stock Exchange or other applicable securities exchange.
(ii) The written and manually signed consent of the candidate to be named as a nominee and to serve as a Trustee if elected;
(iii) The recommending shareholder’s name as it appears on the registrant’s books and the number of all shares of the registrant owned beneficially and of record by the recommending shareholder (as evidenced to the Nominating Committee’s satisfaction by a recent brokerage or account statement); and
(iv) A description of all arrangements or understandings between the recommending shareholder and the candidate and any other person or persons (including their names) pursuant to which the recommendation is being made by the recommending shareholder.
In addition, the Nominating Committee may require the candidate to furnish such other information as it may reasonably require or deem necessary to determine the eligibility of such candidate to serve on the Board or to satisfy applicable law and information regarding the candidate that would be required to be disclosed if the candidate were a nominee in a proxy statement or other filing required to be made in connection with solicitation of proxies for election of Trustees.
| ITEM 11. | CONTROLS AND PROCEDURES. |
(a) An evaluation was performed within 90 days of the filing of this report, under the supervision and with the participation of the registrant’s management, including the principal executive officer and principal financial officer, of the effectiveness of the design and operation of the registrant’s disclosure controls and procedures. Based on that evaluation, the principal executive officer and principal financial officer concluded that the registrant’s disclosure controls and procedures were effective.
(b) The registrant‘s principal executive officer and principal financial officer are aware of no changes in the registrant‘s internal control over financial reporting that occurred during the second fiscal quarter of the period covered by this report that has materially affected, or is reasonably likely to materially affect, the registrant’s internal control over financial reporting.
(a) (1) The registrant‘s code of ethics pursuant to Item 2 of Form N-CSR is attached. (EX.99A)
(a) (2) Certifications pursuant to Section 302 of the Sarbanes-Oxley Act of 2002 are attached. (EX.99B)
(a) (3) Not applicable.
(b) Certifications pursuant to Section 906 of the Sarbanes-Oxley Act of 2002 are attached. (EX.99C)
SIGNATURES
Pursuant to the requirements of the Securities Exchange Act of 1934 and the Investment Company Act of 1940, the registrant has duly caused this report to be signed on its behalf by the undersigned, thereunto duly authorized.
| | |
| Dodge & Cox Funds |
| |
| By | | /s/ John A. Gunn |
| | John A. Gunn |
| | Chairman - Principal Executive Officer |
Date February 25, 2009
Pursuant to the requirements of the Securities Exchange Act of 1934 and the Investment Company Act of 1940, this report has been signed below by the following persons on behalf of the registrant and in the capacities and on the dates indicated.
| | |
| Dodge & Cox Funds |
| |
| By | | /s/ John A. Gunn |
| | John A. Gunn |
| | Chairman - Principal Executive Officer |
| |
| By | | /s/ David H. Longhurst |
| | David H. Longhurst |
| | Treasurer - Principal Financial Officer |
Date February 25, 2009