UNITED STATES
SECURITIES AND EXCHANGE COMMISSION
Washington, D.C. 20549
FORM N-CSR
CERTIFIED SHAREHOLDER REPORT OF REGISTERED
MANAGEMENT INVESTMENT COMPANIES
Investment Company Act file number 811-173
DODGE & COX FUNDS
(Exact name of registrant as specified in charter)
555 California Street, 40th Floor
San Francisco, CA 94104
(Address of principal executive offices) (Zip code)
Thomas M. Mistele, Esq.
555 California Street, 40th Floor
San Francisco, CA 94104
(Name and address of agent for service)
Registrant’s telephone number, including area code: 415-981-1710
Date of fiscal year end: DECEMBER 31, 2011
Date of reporting period: DECEMBER 31, 2011
Form N-CSR is to be used by management investment companies to file reports with the Commission not later than 10 days after the transmission to stockholders of any report that is required to be transmitted to stockholders under Rule 30e-1 under the Investment Company Act of 1940 (17 CFR 270.30e-1). The Commission may use the information provided on Form N-CSR in its regulatory, disclosure review, inspection, and policymaking roles.
A registrant is required to disclose the information specified by Form N-CSR, and the Commission will make this information public. A registrant is not required to respond to the collection of information contained in Form N-CSR unless the Form displays a currently valid Office of Management and Budget (“OMB”) control number. Please direct comments concerning the accuracy of the information collection burden estimate and any suggestions for reducing the burden to Secretary, Securities and Exchange Commission, 450 Fifth Street, NW, Washington, DC 20549-0609. The OMB has reviewed this collection of information under the clearance requirements of 44 U.S.C. ss. 3507.
ITEM 1. REPORTS TO STOCKHOLDERS.
The following are the December 31, 2011 annual reports for the Dodge & Cox Funds, a Delaware statutory trust, consisting of five series: Dodge & Cox Stock Fund, Dodge & Cox Global Stock Fund, Dodge & Cox International Stock Fund, Dodge & Cox Balanced Fund and Dodge & Cox Income Fund. The reports of each series were transmitted to their respective shareholders on February 21, 2011.
| | | | |
 | | | |  |
www.dodgeandcox.com
For Fund literature, transactions, and account
information, please visit the Funds’ website.
or write or call:
DODGE & COX FUNDS
c/o Boston Financial Data Services
P.O. Box 8422
Boston, Massachusetts 02266-8422
(800) 621-3979
INVESTMENT MANAGER
Dodge & Cox
555 California Street, 40th Floor
San Francisco, California 94104
(415) 981-1710
This report is submitted for the general information of the shareholders of the Fund. The report is not authorized for distribution to prospective investors in the Fund unless it is accompanied by a current prospectus.
This report reflects our views, opinions, and portfolio holdings as of December 31, 2011, the end of the reporting period. Any such views are subject to change at any time based upon market or other conditions and Dodge & Cox disclaims any responsibility to update such views. These views may not be relied on as investment advice and, because investment decisions for a Dodge & Cox Fund are based on numerous factors, may not be relied on as an indication of trading intent on behalf of any Dodge & Cox Fund.
12/11 SF AR  Printed on recycled paper
Annual Report
December 31, 2011
Stock Fund
ESTABLISHED 1965
TICKER: DODGX
A LETTER FROM THE CHAIRMAN
Our experience over 80 years has taught us that the best long-term investment opportunities often arise in periods of trepidation. While it is impossible to time market cycles with precision, we believe that building strong long-term returns rests on two key tenets of our investment approach: a willingness to revisit and retest our thinking as prices and conditions change, and the fortitude to stay the course, even in periods of volatility or underperformance.
A Year Defined by Aversion to Risk and Extreme Volatility
Two interconnected issues weighed heavily on global financial markets in 2011: uncertainty about the future of the Eurozone and the challenges to global economic growth posed by high debt levels. Investors responded by turning toward safety and security. A regular feature of this market environment was the “risk-on/risk-off” trade. Markets and securities with widely divergent fundamental risk factors traded in tandem based on whether short-term investor confidence improved (risk-on) or deteriorated (risk-off) on that day—often resulting in one day’s move being retraced the following day.
The year-over-year effect on returns was strong performance from investments considered less risky (e.g., 30-year U.S. Treasury securities returned 36% for the year), negative returns from world equities (down 6%), and wide divergence within asset classes between investments viewed as more safe and those viewed as less. Volatility levels were significantly elevated, especially during a gut-wrenching four days of daily 4% price moves in major equity markets in early August. In this environment, our Funds’ strategies suffered, with each underperforming its market benchmark for the year. For a more detailed discussion of each Fund’s 2011 performance, please read their Annual Letters.
Importance of Fundamental Research
In fear-driven markets, when prices fall across the board, bottom-up research is more important than ever. At Dodge & Cox, our goal is to build diversified
portfolios of individual securities—with attractive fundamentals at low valuations—based on our analysts’ intensive research and the depth of knowledge and experience of our portfolio managers.
Through the team-based decision-making of our seasoned investment professionals, we evaluate the risks, merits, and trade-offs of our investment decisions. Our analysts’ detailed knowledge about our holdings and our investment universe enables us to quickly assess a security’s long-term return potential following a decline in valuation—and take advantage of those opportunities where short-term valuations do not reflect the security’s long-term potential.
Opportunities Ahead
Starting valuation is an important component of long-term returns, and as significant pessimism about the future has driven down equity prices, we have been finding attractive opportunities around the world. Today, global equity markets are trading at 10 to 12 times forward estimated earnings, and many companies have strong balance sheets and opportunities for long-term global growth. Corporate bonds are also very attractive in this environment. Their yield premiums are at high levels now, and we’re seeing interesting opportunities in companies across a range of industries.
Over Dodge & Cox’s 80-year history, our long-term, value-oriented approach has withstood many periods of uncertainty. All of our Fund portfolios are well diversified and thoughtfully constructed, giving us optimism for the future. Thank you for your continued confidence in our firm. As always, we welcome your comments and questions.
For the Board of Trustees,

Kenneth E. Olivier,
Chairman and President
January 31, 2012
PAGE 1 § DODGE & COX STOCK FUND
TO OUR SHAREHOLDERS
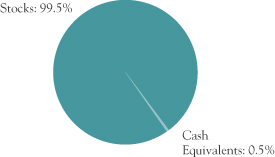
The Dodge & Cox Stock Fund had a total return of 11.2% for the fourth quarter of 2011, compared to 11.8% for the S&P 500 Index. For 2011, the Fund had a total return of –4.1%, compared to 2.1% for the S&P 500. At year end, the Fund had net assets of $36.6 billion with a cash position of 0.5%.
MARKET COMMENTARY
The past year was highly volatile for equities. Even though stocks generally finished the year about where they started, the year was marked by macroeconomic uncertainty and fear. Concerns largely centered around the subpar economic recovery in the United States and the sovereign debt crisis in Europe. These issues may not be resolved in the short term, so the current environment of risk aversion may continue. However, the outlook for U.S. corporate profitability is strong: 2011 earnings are estimated to have increased by more than 15% and have already surpassed the prior earnings peak in 2007; balance sheets have improved; and dividends are rising. Though unemployment is still high, the United States added nearly two million private sector jobs.
INVESTMENT STRATEGY
The performance of the Fund was disappointing this past year, but we remain confident in our team and approach. The Fund has experienced periods of prolonged underperformance in the past, such as 1969–72, 1988–91, and 1995–98. We believe it’s important to keep a long-term perspective. For example, the Fund’s 20-year annualized return was 10.1% at year end, compared with 7.8% for the S&P 500.
We are optimistic about the long-term prospects for the Fund’s holdings because starting valuation is the most significant driver of long-term equity returns, and many of the Fund’s holdings are currently at unusually low valuations. The Fund’s price-to-earnings multiple (P/E) was 12 times trailing earnings at year end, with 21 of the Fund’s 73 holdings below 9 times trailing earnings, which is low relative to the S&P 500’s long-term average of 15 times earnings. We are encouraged by the modest expectations in the Fund’s holdings (and the overall market) and remain optimistic about the prospects for improving absolute and relative returns from the Fund.
One example of a security with an unusually low multiple is Hewlett-Packard(a) (H-P). H-P’s P/E declined from over ten times to six times trailing earnings as the shares declined sharply during the year. The price decline may have been fueled by investor concerns about management stability, revenue growth, and a large software acquisition. Given the Fund’s large weighting in the company during the year, this decline made H-P the biggest detractor from the Fund’s returns relative to the S&P 500. We maintain our conviction in H-P, previously discussed in the Fund’s Semi-Annual Letter. As the valuation has fallen, we have added to our position, with H-P remaining the Fund’s largest holding at year end (at 4.1%). The company remains a global leader in its core businesses of servers, services, and printers, now with new CEO Meg Whitman at the helm. In addition, the bulk of H-P’s revenues come from outside the United States, including emerging markets, which we expect to be a significant source of future growth.
Finding Opportunities
Our confidence in the Fund’s future prospects is based on our investment team’s years of experience and continued diligent bottom-up analysis of the various businesses of each company held in the Fund, looking at their valuations as well as comparing investment alternatives to current holdings. Gradual changes in the portfolio result from this process, as evidenced by the Fund’s low turnover rate, which last year was 16%. New holdings were in a variety of sectors including Consumer Staples, Financials, Health Care, and Information Technology. Among the Fund’s largest purchases in 2011 were Microsoft and Roche (a position initiated in the fourth quarter of 2010).
Microsoft is a leading software company. Its Windows and Office suite of products dominate corporate and personal computing. Over the past decade, Microsoft more than doubled revenues and increased earnings per share at a faster rate. Yet today, its valuation of nine times forward estimated earnings and a 3% dividend yield reflects skepticism about its growth prospects. One concern is how Microsoft will respond as personal computers and laptops face increasing competition from tablets and mobile phones.
DODGE & COX STOCK FUND §PAGE 2
Microsoft has the resources and drive to compete and innovate in the rapidly changing technology markets. The company is well financed and wields a significant research budget that is, for example, 50% larger than IBM’s ($9 versus $6 billion). Management has invested in various initiatives from SharePoint for corporate networks to Windows Phone for mobile phones that should enable them to compete effectively as the internet and mobile and cloud computing continue to develop. Finally, we believe management’s owner-operator mentality aligns their interests with those of long-term shareholders.
Roche is a multinational pharmaceutical company based in Switzerland, with around 60% of its sales from cancer treatment drugs. Our investment thesis for Roche rests on the efforts by management to improve operations and continue to discover innovative pharmaceuticals for the future. While some of its oncology products face patent expiration over the next five years, generic competitors for these biologically derived pharmaceuticals face a significant hurdle: they must demonstrate biologic equivalence to achieve regulatory and commercial acceptance. The Fund is able to invest in an excellent company at an attractive valuation of less than 12 times forward estimated earnings with a current dividend yield greater than 4%.
IN CLOSING
Throughout our firm’s history, Dodge & Cox’s long-term, value-oriented, fundamental approach has withstood many periods of uncertainty and delivered strong long-term returns. We acknowledge the current challenges around the world. However, global equity markets are at compelling valuations which adequately reflect present concerns in our opinion. Thus, we are enthusiastic about the prospects for equities in general, and especially the holdings in the Fund, over the long run. Since short-term market movements are impossible to predict, and markets could continue to be volatile, we encourage shareholders to remain focused on the long term.
Thank you for your continued confidence in our firm. As always, we welcome your comments and questions.
For the Board of Trustees,
| | |
 | |  |
Kenneth E. Olivier, Chairman and President | | Charles F. Pohl, Senior Vice President |
January 31, 2012
| (a) | We use these examples to illustrate our investment process, not to imply that we think they are more attractive than the Fund’s other holdings. |
PAGE 3 § DODGE & COX STOCK FUND
ANNUAL PERFORMANCE REVIEW
The Fund underperformed the S&P 500 by 6.2 percentage points in 2011.
Key Detractors from Relative Results
| | § | | Weak returns from holdings in the Information Technology sector (down 11% versus up 3% for the S&P 500 sector) hurt results. Notably, Hewlett-Packard—the Fund’s largest holding—was down 38%, while Computer Sciences Corp. (down 51%) and Xerox (down 30%) also performed poorly. | |
| | § | | Weak returns from Financials (down 21% versus down 17% for the S&P 500 sector) and a slightly higher average weighting (18% versus 15%) detracted. Bank of America (down 48% from date of purchase), Goldman Sachs (down 46%), and Bank of New York Mellon (down 33%) lagged. | |
| | § | | Weak relative returns in Energy (down 6% versus up 5% for the S&P 500 sector) had a negative impact. Oil services giant Schlumberger was down 17%. | |
| | § | | Additional detractors included Sony (down 49%), Cemex (down 48%), Sprint Nextel (down 45%), and Boston Scientific (down 29%). | |
Key Contributors to Relative Results
| | § | | A higher average weighting in the Health Care sector (21% versus 11% for the S&P 500 sector) contributed to relative returns. Pharmaceutical firms Pfizer (up 29%), GlaxoSmithKline (up 23%), and Amgen (up 18%) were strong performers. | |
| | § | | A higher average Consumer Discretionary weighting (16% versus 11% for the S&P 500 sector), combined with good relative returns, was beneficial. News Corp. (up 24%), Home Depot (up 23%), and Time Warner (up 15%) helped. | |
| | § | | Additional contributors included Electronic Arts (up 38% to date of sale), Motorola Mobility (up 25% from spin-off to sale), Chevron (up 20%), and Wal-Mart (up 14%). | |
KEY CHARACTERISTICS OF DODGE & COX
Independent Organization
Dodge & Cox is one of the largest privately owned investment managers in the world. We remain committed to independence, with a goal of providing the highest quality investment management service to our existing clients.
80 Years of Investment Experience
Dodge & Cox was founded in 1930. We have a stable and well-qualified team of investment professionals, most of whom have spent their entire careers at Dodge & Cox.
Experienced Investment Team
The Investment Policy Committee, which is the decision-making body for the Stock Fund, is a nine-member committee with an average tenure at Dodge & Cox of 26 years.
One Business with a Single Research Office
Dodge & Cox manages domestic, international, and global equity, fixed income, and balanced investments, operating from one office in San Francisco.
Consistent Investment Approach
Our team decision-making process involves thorough, bottom-up fundamental analysis of each investment.
Long-Term Focus and Low Expenses
We invest with a three- to five-year investment horizon, which has historically resulted in low turnover relative to our peers. We manage Funds that maintain low expense ratios.
DODGE & COX STOCK FUND §PAGE 4
GROWTH OF $10,000 OVER 10 YEARS
FOR AN INVESTMENT MADE ON DECEMBER 31, 2001
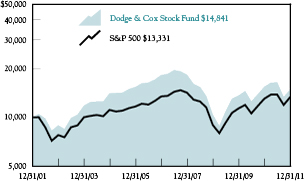
AVERAGE ANNUAL TOTAL RETURN
FOR PERIODS ENDED DECEMBER 31, 2011
| | | | | | | | | | | | | | | | |
| | | 1 Year | | | 5 Years | | | 10 Years | | | 20 Years | |
Dodge & Cox Stock Fund | | | -4.08 | % | | | -4.09 | % | | | 4.03 | % | | | 10.14 | % |
S&P 500 | | | 2.12 | | | | -0.25 | | | | 2.92 | | | | 7.81 | |
Returns represent past performance and do not guarantee future results. Investment return and share price will fluctuate with market conditions, and investors may have
a gain or loss when shares are sold. Fund performance changes over time and currently may be significantly lower than stated. Performance is updated and published monthly. Visit the Fund’s website at www.dodgeandcox.com or call 1-800-621-3979 for current performance figures.
The Fund’s total returns include the reinvestment of dividend and capital gain distributions, but have not been adjusted for any income taxes payable by shareholders on these distributions or on Fund share redemptions. Index returns include dividends but, unlike Fund returns, do not reflect fees or expenses. The S&P 500 Index is a market capitalization-weighted index of 500 large-capitalization stocks commonly used to represent the U.S. equity market.
S&P 500® is a trademark of The McGraw-Hill Companies, Inc.
Risks: The Fund is subject to stock market risk, meaning stocks in the Fund may decline in value for extended periods due to the financial prospects of individual companies, or due to general market and economic conditions. Please read the prospectus and summary prospectus for specific details regarding the Fund’s risk profile.
FUND EXPENSE EXAMPLE
As a Fund shareholder, you incur ongoing Fund costs, including management fees and other Fund expenses. All mutual funds have ongoing costs, sometimes referred to as operating expenses. The following example shows ongoing costs of investing in the Fund and can help you understand these costs and compare them with those of other mutual funds. The example assumes a $1,000 investment held for the six months indicated.
ACTUAL EXPENSES
The first line of the table below provides information about actual account values and expenses based on the Fund’s actual returns. You may use the information in this line, together with your account balance, to estimate the expenses that you paid over the period. Simply divide your account value by $1,000 (for example, an $8,600 account value divided by $1,000 = 8.6), then multiply the result by the number in the first line under the heading “Expenses Paid During Period” to estimate the expenses you paid on your account during this period.
HYPOTHETICAL EXAMPLE FOR COMPARISON WITH OTHER MUTUAL FUNDS
Information on the second line of the table can help you compare ongoing costs of investing in the Fund with those of other mutual funds. This information may not be used to estimate the actual ending account balance or expenses you paid during the period. The hypothetical “Ending Account Value” is based on the actual expense ratio of the Fund and an assumed 5% annual rate of return before expenses (not the Fund’s actual return). The amount under the heading “Expense Paid During the Period” shows the hypothetical expenses your account would have incurred under this scenario. You can compare this figure with the 5% hypothetical examples that appear in shareholder reports of other mutual funds.
| | | | | | | | | | | | |
Six Months Ended
December 31, 2011 | | Beginning Account Value
7/1/2011 | | | Ending Account Value
12/31/2011 | | | Expenses Paid
During Period* | |
Based on Actual Fund Return | | $ | 1,000.00 | | | $ | 902.40 | | | $ | 2.49 | |
Based on Hypothetical 5% Yearly Return | | | 1,000.00 | | | | 1,022.59 | | | | 2.65 | |
| * | Expenses are equal to the Fund’s annualized expense ratio of 0.52%, multiplied by the average account value over the period, multiplied by 184/365 (to reflect the one-half year period). |
The expenses shown in the table highlight ongoing costs only and do not reflect any transactional fees or account maintenance fees. While other mutual funds may charge such fees, please note that the Fund does not charge transaction fees (e.g., redemption fees, sales loads) or universal account maintenance fees (e.g., small account fees).
PAGE 5 § DODGE & COX STOCK FUND
| | | | |
| FUND INFORMATION | | | December 31, 2011 | |
| | | | |
| GENERAL INFORMATION | | | |
Net Asset Value Per Share | | | $101.64 | |
Total Net Assets (billions) | | | $36.6 | |
Expense Ratio | | | 0.52% | |
Portfolio Turnover Rate | | | 16% | |
30-Day SEC Yield(a) | | | 1.74% | |
Fund Inception | | | 1965 | |
No sales charges or distribution fees | | | | |
Investment Manager: Dodge & Cox, San Francisco. Managed by the Investment Policy Committee, whose nine members’ average tenure at Dodge & Cox is 26 years.
| | | | | | | | |
| PORTFOLIO CHARACTERISTICS | | Fund | | | S&P 500 | |
Number of Stocks | | | 73 | | | | 500 | |
Median Market Capitalization (billions) | | | $20 | | | | $11 | |
Weighted Average Market
Capitalization (billions) | | | $73 | | | | $96 | |
Price-to-Earnings Ratio(b) | | | 9.9x | | | | 12.1x | |
Foreign Stocks not in the S&P 500(c) | | | 17.3% | | | | 0.0% | |
| | | | |
| TEN LARGEST HOLDINGS (%)(d) | | Fund | |
Hewlett-Packard Co. | | | 4.1 | |
Wells Fargo & Co. | | | 3.9 | |
Comcast Corp. | | | 3.7 | |
Merck & Co., Inc. | | | 3.5 | |
Capital One Financial Corp. | | | 3.5 | |
Sanofi (France) | | | 3.2 | |
General Electric Co. | | | 3.2 | |
Time Warner, Inc. | | | 3.2 | |
Amgen, Inc. | | | 2.9 | |
GlaxoSmithKline PLC (United Kingdom) | | | 2.9 | |
| | | | | | | | |
| SECTOR DIVERSIFICATION (%) | | Fund | | | S&P 500 | |
Health Care | | | 21.8 | | | | 11.9 | |
Information Technology | | | 19.8 | | | | 19.0 | |
Financials | | | 17.5 | | | | 13.6 | |
Consumer Discretionary | | | 16.9 | | | | 10.7 | |
Energy | | | 7.9 | | | | 12.3 | |
Industrials | | | 7.0 | | | | 10.7 | |
Materials | | | 3.3 | | | | 3.4 | |
Consumer Staples | | | 2.9 | | | | 11.5 | |
Telecommunication Services | | | 2.4 | | | | 3.0 | |
Utilities | | | 0.0 | | | | 3.9 | |
| (a) | SEC Yield is an annualization of the Fund’s total net investment income per share for the 30-day period ended on the last day of the month. |
| (b) | Price-to-earnings (P/E) ratios are calculated using 12-month forward earnings estimates. |
| (c) | Foreign stocks are U.S. dollar-denominated. |
| (d) | The Fund’s portfolio holdings are subject to change without notice. The mention of specific securities is not a recommendation to buy, sell, or hold any particular security and is not indicative of Dodge & Cox’s current or future trading activity. |
DODGE & COX STOCK FUND §PAGE 6
| | | | |
| PORTFOLIO OF INVESTMENTS | | | December 31, 2011 | |
| | | | | | | | |
| COMMON STOCKS: 99.5% | |
| | |
| | | SHARES | | | VALUE | |
CONSUMER DISCRETIONARY: 16.9% | |
CONSUMER DURABLES & APPAREL: 1.4% | | | | | |
NVR, Inc.(a) | | | 90,000 | | | $ | 61,740,000 | |
Panasonic Corp. ADR(b) (Japan) | | | 18,095,474 | | | | 151,821,027 | |
Sony Corp. ADR(b) (Japan) | | | 15,633,650 | | | | 282,031,046 | |
| | | | | | | | |
| | | | 495,592,073 | |
MEDIA: 12.4% | | | | | | | | |
Comcast Corp., Class A | | | 56,580,397 | | | | 1,341,521,213 | |
DISH Network Corp., Class A(a) | | | 8,005,453 | | | | 227,995,301 | |
Liberty Global, Inc., Series A(a) | | | 753,210 | | | | 30,904,206 | |
Liberty Global, Inc., Series C(a) | | | 983,053 | | | | 38,850,255 | |
McGraw-Hill Companies, Inc. | | | 5,000,000 | | | | 224,850,000 | |
News Corp., Class A | | | 54,050,326 | | | | 964,257,816 | |
Time Warner Cable, Inc. | | | 8,811,410 | | | | 560,141,334 | |
Time Warner, Inc. | | | 31,841,732 | | | | 1,150,760,194 | |
| | | | | | | | |
| | | | 4,539,280,319 | |
RETAILING: 3.1% | | | | | | | | |
CarMax, Inc. (a) | | | 4,329,200 | | | | 131,954,016 | |
Home Depot, Inc. | | | 13,776,870 | | | | 579,179,615 | |
Liberty Interactive, Series A(a) | | | 19,050,875 | | | | 308,909,938 | |
Lowe’s Companies, Inc. | | | 4,200,000 | | | | 106,596,000 | |
| | | | | | | | |
| | | | 1,126,639,569 | |
| | | | | | | | |
| | | | 6,161,511,961 | |
| CONSUMER STAPLES: 2.9% | | | | | | | | |
FOOD & STAPLES RETAILING: 2.2% | | | | | |
Wal-Mart Stores, Inc. | | | 13,422,350 | | | | 802,119,636 | |
| | | | | | | | |
FOOD, BEVERAGE & TOBACCO: 0.7% | |
Unilever PLC ADR(b) (United Kingdom) | | | 7,150,000 | | | | 239,668,000 | |
| | | | | | | | |
| | | | 1,041,787,636 | |
| ENERGY: 7.9% | | | | | | | | |
Baker Hughes, Inc. | | | 10,380,750 | | | | 504,919,680 | |
Chevron Corp. | | | 5,005,680 | | | | 532,604,352 | |
Occidental Petroleum Corp. | | | 9,661,100 | | | | 905,245,070 | |
Schlumberger, Ltd.(b)
(Curacao/United States) | | | 14,067,445 | | | | 960,947,168 | |
| | | | | | | | |
| | | | 2,903,716,270 | |
| FINANCIALS: 17.5% | | | | | | | | |
BANKS: 6.3% | | | | | | | | |
BB&T Corp. | | | 17,084,044 | | | | 430,005,387 | |
HSBC Holdings PLC ADR(b) (United Kingdom) | | | 5,745,529 | | | | 218,904,655 | |
SunTrust Banks, Inc. | | | 11,256,433 | | | | 199,238,864 | |
Wells Fargo & Co. | | | 52,224,541 | | | | 1,439,308,350 | |
| | | | | | | | |
| | | | 2,287,457,256 | |
DIVERSIFIED FINANCIALS: 10.1% | | | | | |
Bank of America Corp. | | | 77,600,000 | | | | 431,456,000 | |
Bank of New York Mellon Corp. | | | 35,320,824 | | | | 703,237,606 | |
Capital One Financial Corp.(c) | | | 30,180,911 | | | | 1,276,350,726 | |
| | | | | | | | |
| | |
| | | SHARES | | | VALUE | |
Charles Schwab Corp. | | | 47,011,200 | | | $ | 529,346,112 | |
Credit Suisse Group AG ADR(b) (Switzerland) | | | 4,248,000 | | | | 99,743,040 | |
Goldman Sachs Group, Inc. | | | 6,838,700 | | | | 618,423,641 | |
Legg Mason, Inc. | | | 1,926,452 | | | | 46,331,171 | |
| | | | | | | | |
| | | | 3,704,888,296 | |
INSURANCE: 1.1% | | | | | | | | |
AEGON NV(a),(b) (Netherlands) | | | 61,934,972 | | | | 248,978,588 | |
Genworth Financial, Inc., Class A(a) | | | 22,302,457 | | | | 146,081,093 | |
| | | | | | | | |
| | | | 395,059,681 | |
| | | | | | | | |
| | | | 6,387,405,233 | |
| HEALTH CARE: 21.8% | | | | | | | | |
HEALTH CARE EQUIPMENT & SERVICES: 1.6% | |
Boston Scientific Corp.(a) | | | 62,465,500 | | | | 333,565,770 | |
Medtronic, Inc. | | | 6,182,400 | | | | 236,476,800 | |
| | | | | | | | |
| | | | 570,042,570 | |
PHARMACEUTICALS, BIOTECHNOLOGY & LIFE SCIENCES: 20.2% | |
Amgen, Inc. | | | 16,850,700 | | | | 1,081,983,447 | |
GlaxoSmithKline PLC ADR(b) (United Kingdom) | | | 23,290,800 | | | | 1,062,759,204 | |
Merck & Co., Inc. | | | 33,926,100 | | | | 1,279,013,970 | |
Novartis AG ADR(b) (Switzerland) | | | 17,114,600 | | | | 978,441,682 | |
Pfizer, Inc. | | | 48,994,564 | | | | 1,060,242,365 | |
Roche Holding AG ADR(b) (Switzerland) | | | 18,200,000 | | | | 774,410,000 | |
Sanofi ADR(b) (France) | | | 31,697,129 | | | | 1,158,213,094 | |
| | | | | | | | |
| | | | 7,395,063,762 | |
| | | | | | | | |
| | | | 7,965,106,332 | |
| INDUSTRIALS: 7.0% | | | | | | | | |
CAPITAL GOODS: 4.3% | | | | | | | | |
General Electric Co. | | | 64,596,075 | | | | 1,156,915,704 | |
Koninklijke Philips Electronics NV(b) (Netherlands) | | | 7,100,000 | | | | 148,745,000 | |
Tyco International, Ltd.(b)
(Switzerland) | | | 5,792,275 | | | | 270,557,165 | |
| | | | | | | | |
| | | | 1,576,217,869 | |
COMMERCIAL & PROFESSIONAL SERVICES: 0.2% | |
Pitney Bowes, Inc.(c) | | | 3,648,080 | | | | 67,635,403 | |
| | | | | | | | |
TRANSPORTATION: 2.5% | | | | | | | | |
FedEx Corp. | | | 10,973,899 | | | | 916,430,305 | |
| | | | | | | | |
| | | | 2,560,283,577 | |
| INFORMATION TECHNOLOGY: 19.8% | |
SEMICONDUCTORS & SEMICONDUCTOR EQUIPMENT: 1.2% | |
Maxim Integrated Products, Inc.(c) | | | 17,296,400 | | | | 450,398,256 | |
| | | | | | | | |
SOFTWARE & SERVICES: 10.0% | | | | | | | | |
Adobe Systems, Inc.(a) | | | 6,400,000 | | | | 180,928,000 | |
AOL, Inc.(a),(c) | | | 8,439,054 | | | | 127,429,715 | |
| | |
| PAGE 7 § DODGE & COX STOCK FUND | | See accompanying Notes to Financial Statements |
| | | | |
| PORTFOLIO OF INVESTMENTS | | | December 31, 2011 | |
| | | | | | | | |
| COMMON STOCKS (continued) | |
| | |
| | | SHARES | | | VALUE | |
BMC Software, Inc.(a) | | | 8,250,140 | | | $ | 270,439,589 | |
Cadence Design Systems, Inc.(a),(c) | | | 19,448,500 | | | | 202,264,400 | |
Computer Sciences Corp.(c) | | | 8,996,552 | | | | 213,218,283 | |
Compuware Corp.(a),(c) | | | 15,838,112 | | | | 131,773,092 | |
eBay, Inc.(a) | | | 23,779,100 | | | | 721,220,103 | |
Equinix, Inc.(a) | | | 705,200 | | | | 71,507,280 | |
Microsoft Corp. | | | 31,900,000 | | | | 828,124,000 | |
Symantec Corp.(a) | | | 34,109,200 | | | | 533,808,980 | |
Synopsys, Inc.(a),(c) | | | 13,695,769 | | | | 372,524,917 | |
| | | | | | | | |
| | | | 3,653,238,359 | |
TECHNOLOGY, HARDWARE & EQUIPMENT: 8.6% | |
Corning, Inc.(a) | | | 5,200,000 | | | | 67,496,000 | |
Hewlett-Packard Co. | | | 58,113,295 | | | | 1,496,998,479 | |
Molex, Inc. | | | 2,511,000 | | | | 59,912,460 | |
Molex, Inc., Class A | | | 9,099,230 | | | | 179,982,769 | |
NetApp, Inc.(a) | | | 4,550,000 | | | | 165,028,500 | |
Nokia Corp. ADR(b) (Finland) | | | 53,513,300 | | | | 257,934,106 | |
TE Connectivity, Ltd.(b) (Switzerland) | | | 13,622,475 | | | | 419,708,455 | |
Xerox Corp. | | | 62,009,582 | | | | 493,596,273 | |
| | | | | | | | |
| | | | 3,140,657,042 | |
| | | | | �� | | | |
| | | | 7,244,293,657 | |
| MATERIALS: 3.3% | | | | | | | | |
Celanese Corp., Series A | | | 4,602,003 | | | | 203,730,673 | |
Cemex SAB de CV ADR(a),(b) (Mexico) | | | 22,171,088 | | | | 119,502,164 | |
Domtar Corp. | | | 685,249 | | | | 54,792,510 | |
Dow Chemical Co. | | | 18,439,345 | | | | 530,315,562 | |
Vulcan Materials Co. (c) | | | 7,942,625 | | | | 312,542,294 | |
| | | | | | | | |
| | | | 1,220,883,203 | |
| TELECOMMUNICATION SERVICES: 2.4% | |
Sprint Nextel Corp.(a) | | | 135,934,139 | | | | 318,085,885 | |
Vodafone Group PLC ADR(b) (United Kingdom) | | | 20,353,900 | | | | 570,519,817 | |
| | | | | | | | |
| | | | 888,605,702 | |
| | | | | | | | |
TOTAL COMMON STOCKS
(Cost $36,113,172,847) | | | $ | 36,373,593,571 | |
| | | | | | | | |
| SHORT-TERM INVESTMENTS: 0.7% | |
| | |
| | | PAR VALUE | | | VALUE | |
MONEY MARKET FUND: 0.1% | | | | | | | | |
SSgA U.S. Treasury Money Market Fund | | $ | 36,773,469 | | | $ | 36,773,469 | |
REPURCHASE AGREEMENT: 0.6% | |
Fixed Income Clearing Corporation(d) 0.01%, dated 12/30/11, due 1/3/12, maturity value $220,575,245 | | | 220,575,000 | | | | 220,575,000 | |
| | | | | | | | |
TOTAL SHORT-TERM INVESTMENTS
(Cost $257,348,469) | | | $ | 257,348,469 | |
| | | | | | | | |
TOTAL INVESTMENTS
(Cost $36,370,521,316) | | | 100.2 | % | | $ | 36,630,942,040 | |
OTHER ASSETS LESS LIABILITIES | | | (0.2 | %) | | | (68,564,836 | ) |
| | | | | | | | |
| NET ASSETS | | | 100.0 | % | | $ | 36,562,377,204 | |
| | | | | | | | |
| (b) | Security denominated in U.S. dollars |
| (c) | See Note 8 regarding holdings of 5% voting securities |
| (d) | Repurchase agreement is collateralized by U.S. Treasury Note 2.50%, 3/31/13. Total collateral value is $224,988,300. |
In determining a company’s country designation, the Fund generally references the country of incorporation. In cases where the Fund considers the country of incorporation to be a “jurisdiction of convenience” chosen primarily for tax purposes, the Fund uses the country designation of an appropriate broad-based market index. In that circumstance, two countries are listed—the country of incorporation and the country designated by an appropriate index, respectively.
ADR: American Depositary Receipt
| | |
| See accompanying Notes to Financial Statements | | DODGE & COX STOCK FUND §PAGE 8 |
| | | | |
STATEMENT OF ASSETS AND LIABILITIES | |
| |
| | | December 31, 2011 | |
ASSETS: | | | | |
Investments, at value | | | | |
Unaffiliated issuers (cost $33,105,233,999) | | $ | 33,544,440,357 | |
Affiliated issuers (cost $3,265,287,317) | | | 3,086,501,683 | |
| | | | |
| | | 36,630,942,040 | |
Receivable for Fund shares sold | | | 35,271,544 | |
Dividends and interest receivable | | | 108,651,670 | |
Prepaid expenses and other assets | | | 260,978 | |
| | | | |
| | | 36,775,126,232 | |
| | | | |
LIABILITIES: | | | | |
Payable for investments purchased | | | 16,732,085 | |
Payable for Fund shares redeemed | | | 179,287,237 | |
Management fees payable | | | 15,451,003 | |
Accrued expenses | | | 1,278,703 | |
| | | | |
| | | 212,749,028 | |
| | | | |
NET ASSETS | | $ | 36,562,377,204 | |
| | | | |
NET ASSETS CONSIST OF: | | | | |
Paid in capital | | $ | 42,222,722,388 | |
Undistributed net investment income | | | 6,529,385 | |
Accumulated net realized loss | | | (5,927,295,293 | ) |
Net unrealized appreciation | | | 260,420,724 | |
| | | | |
| | $ | 36,562,377,204 | |
| | | | |
Fund shares outstanding (par value $0.01 each, unlimited shares authorized) | | | 359,727,902 | |
Net asset value per share | | | $101.64 | |
|
STATEMENT OF OPERATIONS | |
| |
| | | Year Ended
December 31, 2011 | |
INVESTMENT INCOME: | | | | |
Dividends (net of foreign taxes of $23,146,771) | | | | |
Unaffiliated issuers | | $ | 827,463,579 | |
Affiliated issuers | | | 50,675,642 | |
Interest | | | 115,009 | |
| | | | |
| | | 878,254,230 | |
| | | | |
EXPENSES: | | | | |
Management fees | | | 205,646,420 | |
Custody and fund accounting fees | | | 568,601 | |
Transfer agent fees | | | 4,272,765 | |
Professional services | | | 156,159 | |
Shareholder reports | | | 1,028,778 | |
Registration fees | | | 203,081 | |
Trustees’ fees | | | 214,500 | |
Miscellaneous | | | 1,647,847 | |
| | | | |
| | | 213,738,151 | |
| | | | |
NET INVESTMENT INCOME | | | 664,516,079 | |
| | | | |
REALIZED AND UNREALIZED
GAIN (LOSS) ON INVESTMENTS: | | | | |
Net realized gain (loss) | | | | |
Unaffiliated issuers | | | 875,127,384 | |
Affiliated issuers | | | (363,062,868 | ) |
Net change in unrealized appreciation/depreciation | | | (2,850,476,884 | ) |
| | | | |
Net realized and unrealized loss | | | (2,338,412,368 | ) |
| | | | |
NET DECREASE IN NET ASSETS FROM OPERATIONS | | $ | (1,673,896,289 | ) |
| | | | |
| | | | | | | | |
STATEMENT OF CHANGES IN NET ASSETS | |
| | |
| | | Year Ended
December 31, 2011 | | | Year Ended
December 31, 2010 | |
OPERATIONS: | | | | | | | | |
Net investment income | | $ | 664,516,079 | | | $ | 506,082,111 | |
Net realized gain | | | 512,064,516 | | | | 879,922,337 | |
Net change in unrealized appreciation/depreciation | | | (2,850,476,884 | ) | | | 3,815,009,018 | |
| | | | | | | | |
| | | (1,673,896,289 | ) | | | 5,201,013,466 | |
| | | | | | | | |
| | |
DISTRIBUTIONS TO SHAREHOLDERS FROM: | | | | | | | | |
Net investment income | | | (664,086,748 | ) | | | (507,775,906 | ) |
Net realized gain | | | — | | | | — | |
| | | | | | | | |
Total distributions | | | (664,086,748 | ) | | | (507,775,906 | ) |
| | | | | | | | |
| | |
FUND SHARE TRANSACTIONS: | | | | | | | | |
Proceeds from sale of shares | | | 5,006,315,221 | | | | 6,076,073,491 | |
Reinvestment of distributions | | | 625,800,158 | | | | 479,511,504 | |
Cost of shares redeemed | | | (9,769,356,748 | ) | | | (8,202,331,378 | ) |
| | | | | | | | |
Net decrease from Fund share transactions | | | (4,137,241,369 | ) | | | (1,646,746,383 | ) |
| | | | | | | | |
Total increase (decrease) in net assets | | | (6,475,224,406 | ) | | | 3,046,491,177 | |
| | |
NET ASSETS: | | | | | | | | |
Beginning of year | | | 43,037,601,610 | | | | 39,991,110,433 | |
| | | | | | | | |
End of year (including undistributed net investment income of $6,529,385 and $6,100,054, respectively) | | $ | 36,562,377,204 | | | $ | 43,037,601,610 | |
| | | | | | | | |
| | |
SHARE INFORMATION: | | | | | | | | |
Shares sold | | | 46,452,278 | | | | 62,171,956 | |
Distributions reinvested | | | 5,991,930 | | | | 4,856,472 | |
Shares redeemed | | | (92,083,372 | ) | | | (83,626,447 | ) |
| | | | | | | | |
Net decrease in shares outstanding | | | (39,639,164 | ) | | | (16,598,019 | ) |
| | | | | | | | |
| | |
| PAGE 9 § DODGE & COX STOCK FUND | | See accompanying Notes to Financial Statements |
NOTES TO FINANCIAL STATEMENTS
NOTE 1—ORGANIZATION AND SIGNIFICANT ACCOUNTING POLICIES
Dodge & Cox Stock Fund (the “Fund”) is one of the series constituting the Dodge & Cox Funds (the “Trust” or the “Funds”). The Trust is organized as a Delaware statutory trust and is registered under the Investment Company Act of 1940, as amended, as a diversified, open-end management investment company. The Fund commenced operations on January 4, 1965, and seeks long-term growth of principal and income. Risk considerations and investment strategies of the Fund are discussed in the Fund’s Prospectus.
The financial statements have been prepared in conformity with accounting principles generally accepted in the United States of America, which require the use of estimates and assumptions by management. Actual results may differ from those estimates. Significant accounting policies are as follows:
Security valuation The Fund’s net assets are valued as of the close of trading on the New York Stock Exchange (NYSE), generally 4:00 p.m. Eastern Time, each day that the NYSE is open for business. Stocks are valued at the official quoted close price or the last sale of the day at the close of the NYSE or, if not available, at the mean between the exchange listed bid and ask prices. A security that is listed or traded on more than one exchange is valued at the quotation on the exchange determined to be the primary market for such security. Security values are not discounted based on the size of the Fund’s position. Securities for which market quotations are not readily available are valued at fair value as determined in good faith by or under the direction of the Board of Trustees. Short-term securities are valued at amortized cost, which approximates current value. All securities held by the Fund are denominated in U.S. dollars.
Security transactions, investment income, expenses, and distributions Security transactions are recorded on the trade date. Realized gains and losses on securities sold are determined on the basis of identified cost.
Dividend income and corporate action transactions are recorded on the ex-dividend date, or when the Fund first learns of the dividend/corporate action if the ex-dividend date has passed. Withholding taxes on foreign dividends have been provided for in accordance with the
Fund’s understanding of the applicable country’s tax rules and rates. Non-cash dividends included in dividend income, if any, are recorded at the fair market value of the securities received. Dividends characterized as return of capital are recorded as a reduction of cost of investments and/or realized gain. Interest income is recorded on the accrual basis.
Expenses are recorded on the accrual basis. Most expenses of the Trust can be directly attributed to a specific series. Expenses which cannot be directly attributed are allocated among the Funds in the Trust based on relative net assets or other expense methodologies determined by the nature of the expense.
Distributions to shareholders are recorded on the ex-dividend date.
Repurchase agreements The Fund enters into repurchase agreements, secured by U.S. government or agency securities, which involve the purchase of securities from a counterparty with a simultaneous commitment to resell the securities at an agreed-upon date and price. It is the Fund’s policy that its custodian take possession of the underlying collateral securities, the fair value of which exceeds the principal amount of the repurchase transaction, including accrued interest, at all times. In the event of default by the counterparty, the Fund has the contractual right to liquidate the collateral securities and to apply the proceeds in satisfaction of the obligation.
Indemnification Under the Trust’s organizational documents, its officers and trustees are indemnified against certain liabilities arising out of the performance of their duties to the Trust. In addition, in the normal course of business the Trust enters into contracts that provide general indemnities to other parties. The Trust’s maximum exposure under these arrangements is unknown as this would involve future claims that may be made against the Trust that have not yet occurred.
NOTE 2—VALUATION MEASUREMENTS
Various inputs are used in determining the value of the Fund’s investments. These inputs are summarized in the three broad levels listed below.
| § | | Level 1: Quoted prices in active markets for identical securities |
DODGE & COX STOCK FUND §PAGE 10
NOTES TO FINANCIAL STATEMENTS
| § | | Level 2: Other significant observable inputs (including quoted prices for similar securities, market indices, interest rates, credit risk, etc.) |
| § | | Level 3: Significant unobservable inputs (including Fund management’s assumptions in determining the fair value of investments) |
The inputs or methodology used for valuing securities are not necessarily an indication of the risk associated with investing in those securities.
The following is a summary of the inputs used to value the Fund’s holdings as of December 31, 2011:
| | | | | | | | |
| Security Classification(a) | | LEVEL 1
(Quoted Prices) | | | LEVEL 2
(Other Significant
Observable Inputs) | |
Common Stocks(b) | | $ | 36,373,593,571 | | | $ | — | |
Money Market Fund | | | 36,773,469 | | | | — | |
Repurchase Agreement | | | — | | | | 220,575,000 | |
| | | | | | | | |
Total | | $ | 36,410,367,040 | | | $ | 220,575,000 | |
| | | | | | | | |
| | | | | | | | | |
| (a) | There were no transfers between Level 1 and Level 2 during the year ended December 31, 2011. There were no Level 3 securities at December 31, 2011 and 2010, and there were no transfers to Level 3 during the year. |
| (b) | All common stocks held in the Fund are Level 1 securities. For a detailed break-out of common stocks by major industry classification, please refer to the Portfolio of Investments. |
NOTE 3—RELATED PARTY TRANSACTIONS
Management fees Under a written agreement approved by a unanimous vote of the Board of Trustees, the Fund pays an annual management fee of 0.50% of the Fund’s average daily net assets to Dodge & Cox, investment manager of the Fund. The agreement further provides that Dodge & Cox shall waive its fee to the extent that such fee plus all other ordinary operating expenses of the Fund exceed 0.75% of the average daily net assets for the year.
Fund officers and trustees All officers and three of the trustees of the Trust are officers or employees of Dodge & Cox. The Trust pays a fee only to those trustees who are not affiliated with Dodge & Cox.
NOTE 4—INCOME TAX INFORMATION
A provision for federal income taxes is not required since the Fund intends to continue to qualify as a regulated investment company under Subchapter M of the Internal Revenue Code and distribute all of its taxable income to shareholders. Distributions are determined in accordance
with income tax regulations, and such amounts may differ from net investment income and realized gains for financial reporting purposes. Financial reporting records are adjusted for permanent book/tax differences to reflect tax character.
Book/tax differences are primarily due to differing treatments of wash sales, in-kind redemptions, and net short-term realized gain (loss). During the year, the Fund recognized net realized gains of $92,416,445 from the delivery of appreciated securities in an in-kind redemption transaction. For federal income tax purposes, this gain is not recognized as taxable income to the Fund and therefore will not be distributed to shareholders. At December 31, 2011, the cost of investments for federal income tax purposes was $36,444,083,033.
Distributions during years ended December 31, 2011 and 2010 were characterized as follows for federal income tax purposes:
| | | | | | | | |
| | | Year Ended December 31, 2011 | | | Year Ended December 31, 2010 | |
Ordinary income | | | $664,086,748 | | | | $507,775,906 | |
| | | ($1.754 per share) | | | | ($1.230 per share) | |
| | |
Long-term capital gain | | | — | | | | — | |
At December 31, 2011, the tax basis components of distributable earnings were as follows:
| | | | |
Unrealized appreciation | | $ | 5,758,865,908 | |
Unrealized depreciation | | | (5,572,006,901 | ) |
| | | | |
Net unrealized appreciation | | | 186,859,007 | |
Undistributed ordinary income | | | 6,529,385 | |
Capital Loss carryforward(a) | | | (5,853,733,576 | ) |
| (a) | Represents accumulated capital loss as of December 31, 2011, which may be carried forward to offset future capital gains. During 2011, the Fund utilized $443,284,672 of the carryforward. If not utilized, the remaining capital loss carryforward will expire in 2017. |
Under the recently enacted Regulated Investment Company Modernization Act of 2010, capital losses incurred by the Fund after January 1, 2011, will not be subject to expiration. In addition, such losses must be utilized prior to the losses incurred in the years preceding enactment. (The Fund had net capital gains in 2011.)
PAGE 11 § DODGE & COX STOCK FUND
NOTES TO FINANCIAL STATEMENTS
Fund management has reviewed the tax positions for open periods (three years and four years, respectively, from filing the Fund’s Federal and State tax returns) as applicable to the Fund, and has determined that no provision for income tax is required in the Fund’s financial statements.
NOTE 5—LOAN FACILITIES
Pursuant to an exemptive order issued by the Securities and Exchange Commission (SEC), the Fund may participate in an interfund lending facility (Facility). The Facility allows the Fund to borrow money from or loan money to the Funds. Loans under the Facility are made for temporary or emergency purposes, such as to fund shareholder redemption requests. Interest on borrowings is the average of the current repurchase agreement rate and the bank loan rate. There was no activity in the Facility during the period.
All Funds in the Trust participate in a committed credit facility (Line of Credit) with State Street Bank and Trust Company, to be utilized for temporary or emergency purposes to fund shareholder redemptions or for other
short-term liquidity purposes. The total amount of the Line of Credit was increased from $200 million to $500 million on June 28, 2011. The maximum amount available to the Fund is $250 million. Each Fund pays an annual commitment fee on its pro-rata portion of the Line of Credit. The Fund’s commitment fee for the year ended December 31, 2011, amounted to $125,151 and is reflected as a Miscellaneous Expense in the Statement of Operations. Interest on borrowings is charged at the prevailing rate. There were no borrowings on the Line of Credit during the period.
NOTE 6—PURCHASES AND SALES OF INVESTMENTS
For the year ended December 31, 2011, purchases and sales of securities, other than short-term securities, aggregated $6,557,833,377 and $10,428,398,631, respectively.
NOTE 7—SUBSEQUENT EVENTS
Fund management has determined that no material events or transactions occurred subsequent to December 31, 2011, and through the date of the Fund’s financial statements issuance, which require additional disclosure in the Fund’s financial statements.
NOTE 8—HOLDINGS OF 5% VOTING SECURITIES
Each of the companies listed below was considered to be an affiliate of the Fund because the Fund owned 5% or more of the company’s voting securities during all or part of the year ended December 31, 2011. Purchase and sale transactions and dividend income earned during the period on these securities were as follows:
| | | | | | | | | | | | | | | | | | | | | | | | |
| | | Shares at
Beginning of Period | | | Additions | | | Reductions | | | Shares at
End of Period | | | Dividend
Income(a) | | | Value at
End of Period | |
AOL, Inc. | | | 7,585,522 | | | | 893,132 | | | | (39,600 | ) | | | 8,439,054 | | | $ | — | (b) | | $ | 127,429,715 | |
Cadence Design Systems, Inc. | | | 23,069,000 | | | | — | | | | (3,620,500 | ) | | | 19,448,500 | | | | — | (b) | | | 202,264,400 | |
Capital One Financial Corp. | | | 31,947,811 | | | | — | | | | (1,766,900 | ) | | | 30,180,911 | | | | 6,181,182 | | | | 1,276,350,726 | |
Computer Sciences Corp. | | | 6,661,900 | | | | 2,380,052 | | | | (45,400 | ) | | | 8,996,552 | | | | 6,738,322 | | | | 213,218,283 | |
Compuware Corp. | | | 20,885,512 | | | | — | | | | (5,047,400 | ) | | | 15,838,112 | | | | — | (b) | | | 131,773,092 | |
Electronic Arts, Inc. | | | 21,066,077 | | | | — | | | | (21,066,077 | ) | | | — | | | | — | (b) | | | — | |
Maxim Integrated Products, Inc. | | | 22,634,600 | | | | — | | | | (5,338,200 | ) | | | 17,296,400 | | | | 17,189,104 | | | | 450,398,256 | |
Motorola Mobility Holdings Inc. (d) | | | — | | | | 15,863,901 | | | | (15,863,901 | ) | | | — | | | | — | (b) | | | — | |
Pitney Bowes, Inc. | | | 10,192,550 | | | | — | | | | (6,544,470 | ) | | | 3,648,080 | | | | 11,956,968 | | | | — | (c) |
SLM Corp. | | | 25,945,682 | | | | — | | | | (25,945,682 | ) | | | — | | | | 3,791,931 | | | | — | |
Synopsys, Inc. | | | 14,270,269 | | | | — | | | | (574,500 | ) | | | 13,695,769 | | | | — | (b) | | | 372,524,917 | |
Vulcan Materials Co. | | | 3,259,625 | | | | 4,700,000 | | | | (17,000 | ) | | | 7,942,625 | | | | 4,818,135 | | | | 312,542,294 | |
| | | | | | | | | | | | | | | | | | | | | | | | |
| | | | | | | | | | | | | | | | | | $ | 50,675,642 | | | $ | 3,086,501,683 | |
| | | | | | | | | | | | | | | | | | | | | | | | |
| | | | | | | | | | | | | | | | | | | | | | | | | |
| (a) | Net of foreign taxes, if any |
| (c) | Company was not an affiliate at period end |
| (d) | Spun-off from Motorola on January 4, 2011 |
DODGE & COX STOCK FUND §PAGE 12
FINANCIAL HIGHLIGHTS
| | | | | | | | | | | | | | | | | | | | |
SELECTED DATA AND RATIOS (for a share outstanding throughout each year) | | Year Ended December 31, | |
| | | 2011 | | | 2010 | | | 2009 | | | 2008 | | | 2007 | |
| | | | |
Net asset value, beginning of year | | | $107.76 | | | | $96.14 | | | | $74.37 | | | | $138.26 | | | | $153.46 | |
Income from investment operations: | | | | | | | | | | | | | | | | | | | | |
Net investment income | | | 1.76 | | | | 1.23 | | | | 1.15 | | | | 1.91 | | | | 2.30 | |
Net realized and unrealized gain (loss) | | | (6.13 | ) | | | 11.62 | | | | 21.82 | | | | (59.83 | ) | | | (1.90 | ) |
| | | | |
Total from investment operations | | | (4.37 | ) | | | 12.85 | | | | 22.97 | | | | (57.92 | ) | | | 0.40 | |
| | | | |
Distributions to shareholders from: | | | | | | | | | | | | | | | | | | | | |
Net investment income | | | (1.75 | ) | | | (1.23 | ) | | | (1.20 | ) | | | (1.84 | ) | | | (2.34 | ) |
Net realized gain | | | — | | | | — | | | | — | | | | (4.13 | ) | | | (13.26 | ) |
| | | | |
Total distributions | | | (1.75 | ) | | | (1.23 | ) | | | (1.20 | ) | | | (5.97 | ) | | | (15.60 | ) |
| | | | |
Net asset value, end of year | | | $101.64 | | | | $107.76 | | | | $96.14 | | | | $74.37 | | | | $138.26 | |
| | | | |
Total return | | | (4.08 | )% | | | 13.48 | % | | | 31.27 | % | | | (43.31 | )% | | | 0.14 | % |
Ratios/supplemental data: | | | | | | | | | | | | | | | | | | | | |
Net assets, end of year (millions) | | | $36,562 | | | | $43,038 | | | | $39,991 | | | | $32,721 | | | | $63,291 | |
Ratio of expenses to average net assets | | | 0.52 | % | | | 0.52 | % | | | 0.52 | % | | | 0.52 | % | | | 0.52 | % |
Ratio of net investment income to average net assets | | | 1.62 | % | | | 1.25 | % | | | 1.42 | % | | | 1.75 | % | | | 1.44 | % |
Portfolio turnover rate | | | 16 | % | | | 12 | % | | | 18 | % | | | 31 | % | | | 27 | % |
See accompanying Notes to Financial Statements
PAGE 13 § DODGE & COX STOCK FUND
REPORT OF INDEPENDENT REGISTERED PUBLIC ACCOUNTING FIRM
To the Trustees of Dodge & Cox Funds and Shareholders of Dodge & Cox Stock Fund
In our opinion, the accompanying statement of assets and liabilities, including the portfolio of investments, and the related statements of operations and of changes in net assets and the financial highlights present fairly, in all material respects, the financial position of Dodge & Cox Stock Fund (the “Fund”, one of the series constituting Dodge & Cox Funds) at December 31, 2011, the results of its operations for the year then ended, the changes in its net assets for each of the two years in the period then ended and the financial highlights for each of the five years in the period then ended, in conformity with accounting principles generally accepted in the United States of America. These financial statements and financial highlights (hereafter referred to as “financial statements”) are the responsibility of the Fund’s management; our responsibility is to express an opinion on these financial statements based on our audits. We conducted our audits of these financial statements in accordance with the standards of the Public Company Accounting Oversight Board (United States). Those standards require that we plan and perform the audit to obtain reasonable assurance about whether the financial statements are free of material misstatement. An audit includes examining, on a test basis, evidence supporting the amounts and disclosures in the financial statements, assessing the accounting principles used and significant estimates made by management, and evaluating the overall financial statement presentation. We believe that our audits, which included confirmation of securities at December 31, 2011, by correspondence with the custodian and brokers, provide a reasonable basis for our opinion.
PricewaterhouseCoopers LLP
San Francisco, California
February 21, 2012
DODGE & COX STOCK FUND §PAGE 14
SPECIAL 2011 TAX INFORMATION (unaudited)
The following information is provided pursuant to provisions of the Internal Revenue Code:
The Fund designates up to a maximum amount of $901,285,992 of its distributions paid to shareholders in 2011 as qualified dividends (treated for federal income tax purposes in the hands of shareholders as taxable at a maximum rate of 15%).
For shareholders that are corporations, the Fund designates 86% of its ordinary dividends paid to shareholders in 2011 as dividends from domestic corporations eligible for the corporate dividends received deduction, provided that the shareholder otherwise satisfies applicable requirements to claim that deduction.
BOARD APPROVAL OF FUNDS’
INVESTMENT MANAGEMENT AGREEMENTS AND MANAGEMENT FEES
(unaudited)
The Board of Trustees is responsible for overseeing the performance of the Dodge & Cox Funds’ investment manager and determining whether to continue the Investment Management Agreements between the Funds and Dodge & Cox each year (the “Agreements”). At a meeting of the Board of Trustees of the Trust held on December 14, 2011, the Trustees, by a unanimous vote (including a separate vote of those Trustees who are not “interested persons” (as defined in the Investment Company Act of 1940) (the “Independent Trustees”)), approved the renewal of the Agreements for an additional one-year term through December 31, 2012. During the course of the year, the Board received a wide variety of materials relating to the services provided by Dodge & Cox and the performance of each of the Funds.
INFORMATION RECEIVED
In advance of the meeting, the Board, including each of the Independent Trustees, requested, received, and reviewed materials relating to the Agreements and the services provided by Dodge & Cox. The Independent Trustees retained Morningstar® to prepare an independent expense and performance summary for each Fund and comparable funds managed by other advisers identified by Morningstar®. The Morningstar® materials included information regarding advisory fee rates, expense
ratios, and transfer agency, custodial, and distribution expenses, as well as appropriate performance comparisons to a Fund’s peer group and an index or combination of indices. The Morningstar® materials also included a comparison of expenses of various share classes offered by comparable funds. The materials reviewed by the Board contained information concerning, among other things, Dodge & Cox’s profitability, financial results and condition, advisory fee revenue, and separate account advisory fee schedules. The Board additionally considered the Funds’ brokerage commissions, turnover rates, sales and redemption data for the Funds, and the fact that Dodge & Cox paid for all third party research used in managing the Funds out of its profits, rather than using “soft dollars” generated from portfolio trading commissions. The Board received and reviewed a memorandum summarizing information provided throughout the year regarding Dodge & Cox’s services to the Funds as well as information regarding (i) the different fees, services, costs, and risks associated with separate accounts managed by Dodge & Cox as compared to the Dodge & Cox Funds; (ii) the differences in performance between the Funds and separately managed accounts; and (iii) Fund share subscription and redemption activity. In addition, the Board requested and received additional information regarding attribution analyses and recent Fund performance. Throughout the process of reviewing the services provided by Dodge & Cox and preparing for the meeting, the Independent Trustees found Dodge & Cox to be open, forthright, detailed, and very helpful in answering questions about all issues. The Board received copies of the Agreements and a memorandum from the independent legal counsel to the Independent Trustees discussing the factors generally regarded as appropriate to consider in evaluating advisory arrangements. The Trust’s Contract Review Committee, consisting solely of Independent Trustees, met with the independent legal counsel on November 3, 2011, and again on December 14, 2011, to discuss whether to renew the Agreements. The Board, including the Independent Trustees, subsequently concluded that the existing Agreements are fair and reasonable and voted to approve the Agreements.
In considering the Agreements, the Board, including the Independent Trustees, did not identify any single
PAGE 15 § DODGE & COX STOCK FUND
factor or particular information as all-important or controlling. In reaching the decision to approve the Agreements, the Board considered several factors, discussed below, to be key factors and reached the conclusions described below.
NATURE, QUALITY, AND EXTENT
OF THE SERVICES
The Board considered that Dodge & Cox provides a wide range of services to the Funds in addition to portfolio management and that the quality of these services has been excellent in all respects. The extensive nature of services provided by Dodge & Cox has been documented in materials provided to the Board and in presentations made to the Board throughout the year. In particular, the Board considered the nature, quality, and extent of portfolio management, administrative, and shareholder services performed by Dodge & Cox. With regard to portfolio management services, the Board considered Dodge & Cox’s established long-term history of care and conscientiousness in the management of the Funds; its demonstrated consistency in investment approach and depth; the background and experience of the Dodge & Cox Investment Policy Committee, International Investment Policy Committee, Global Investment Policy Committee, Fixed Income Investment Policy Committee, and research analysts responsible for managing the Funds; its methods for assessing the regulatory and investment climate in various jurisdictions; Dodge & Cox’s overall high level of attention to its core investment management function; and its commitment to the Funds and their shareholders.
In the area of administrative and shareholder services, the Board considered the excellent quality of Dodge & Cox’s work in areas such as compliance, legal services, trading, proxy voting, oversight of the Funds’ transfer agent and custodian, tax compliance, and shareholder communication through its web site and other means. The Board also noted Dodge & Cox’s diligent disclosure policy, its favorable compliance record and its reputation as a trusted, shareholder-friendly mutual fund family.
In addition, the Board considered that Dodge & Cox manages approximately $112 billion in Fund assets with
fewer professionals than most comparable funds, and that on average these professionals have more experience and longer tenure than investment professionals at comparable funds. The Board also noted that Dodge & Cox is an investment research-oriented firm with no other business endeavors to distract management’s attention from its research efforts, and that its investment professionals adhere to a consistent investment approach across the Funds. The Board further considered the Funds’ favorable stewardship and Gold ratings by Morningstar®. The Board concluded that it was satisfied with the nature, extent, and quality of investment management and other services provided to the Funds by Dodge & Cox.
INVESTMENT PERFORMANCE
The Board considered short-term and long-term investment performance for each Fund (including periods of outperformance or underperformance) as compared to both relevant indices and the performance of such Fund’s peer group. In light of recent market volatility, the Board also reviewed recent performance in the context of long-term investment goals. The Board noted that, although the Fund’s returns over recent periods have been disappointing, its longer-term performance is favorable relative to its peers and benchmark index. The Board determined after extensive review and inquiry that Dodge & Cox’s historic, long-term, team-oriented bottom up investment approach remains consistent and that Dodge & Cox continues to be distinguished by its integrity, thoroughness, and independence.
The Board noted that longer-term comparisons demonstrated favorable performance in comparison to peer group funds and was in keeping with the stated goals in the Funds’ Prospectus. The Board considered that the performance of the Funds is the result of a team-oriented investment management process that emphasizes a long-term investment horizon, comprehensive independent research, price discipline, and focus. The Board also considered that the investment performance delivered by Dodge & Cox to the Funds appeared to be consistent with the relevant performance delivered for other (non-fund) clients of Dodge & Cox. The Board concluded that Dodge & Cox has delivered favorable long-term
DODGE & COX STOCK FUND §PAGE 16
performance for Fund investors consistent with the long-term investment strategies being pursued by the Funds.
COSTS AND ANCILLARY BENEFITS
Costs of Services to Funds: Fees and Expenses. The Board considered each Fund’s management fee rate and expense ratio relative to similar mutual funds and relative to management fees charged by Dodge & Cox to other clients. In particular, the Board considered that the Funds continue to be substantially below their peer group median in expense ratios and management fee rates and that many media and industry reports specifically comment on the low expense ratios of the Funds, which have been a defining characteristic of the Funds for many years. The Board also evaluated the operating structures of the Funds and Dodge & Cox, noting that Dodge & Cox does not charge front-end sales commissions or distribution fees and bears, among other things, third party research and distribution-related costs, reimbursement for recordkeeping and administrative costs to third-party retirement plan administrators, and administrative and office overhead. The Board noted that expenses are well below industry averages. The Board also considered that the Funds receive numerous administrative, regulatory compliance, and shareholder support services from Dodge & Cox without any additional administrative fee and the fact that the Funds have relatively low transaction costs and portfolio turnover rates. The Board reviewed Morningstar® data showing that the few peer group funds with lower expense ratios often have other share classes with significantly higher expense ratios.
In comparing the range of services provided to the Funds under the Agreements to the services Dodge & Cox provides under its separate advisory client agreements, the Board determined that part of the difference is due to higher risks as well as legal and management costs of sponsoring the Funds and noted that separate accounts incur other expenses that should be considered when comparing Fund expenses to separate account expenses. In light of that, the greater risks and regulatory burdens associated with sponsoring a high profile mutual fund business, and the fact that these are different lines of business, there is reasonable justification for differences in fee rates charged between the two. The Board further
noted that, with respect to non-U.S. funds sponsored and managed by Dodge & Cox that are comparable to the Funds in many respects, the fee rates charged by Dodge & Cox are the same as or higher than the fee rates charged to the Funds. The Board concluded that costs incurred by the Funds for the services they receive (including the management fee paid to Dodge & Cox) are reasonable and that the fees are acceptable based upon the qualifications, experience, reputation, and performance of Dodge & Cox and the low overall expense ratios of the Funds.
Profitability and Costs of Services to Dodge & Cox; “Fall-out” Benefits. The Board reviewed reports of Dodge & Cox’s financial position, profitability, and estimated overall value, and considered Dodge & Cox’s overall profitability within its context as a private, employee-owned S-Corporation and relative to the favorable services provided. The Board noted that net revenues for 2011 are projected to increase from 2010. The Board noted in particular that Dodge & Cox’s profits are not generated by high fee rates, but reflect an extraordinarily streamlined, efficient, and focused business approach toward investment management. The Board recognized the importance of Dodge & Cox’s profitability—which is derived solely from management fees and does not include other business ventures—to maintain its independence, stability, company culture and ethics, and management continuity. The Board also considered that the compensation/profit structure at Dodge & Cox is vital for remaining independent and facilitating retention of its management and investment professionals.
The Board considered potential “fall-out” benefits (including the receipt of research from unaffiliated brokers) that Dodge & Cox might receive as a result of its association with the Funds and determined that they are not significant. The Board also noted the extent of additional administrative services performed by Dodge & Cox for the Funds, and that the magnitude of costs and risks borne by Dodge & Cox in rendering advisory services to the Funds (including risks in the regulatory compliance, securities valuation, and investment management processes) are continuing to increase. The Board concluded that the profitability of Dodge & Cox’s relationship with the Funds (including fall-out benefits) was fair and reasonable.
PAGE 17 § DODGE & COX STOCK FUND
THE BENEFIT OF ECONOMIES OF SCALE
The Board considered whether there have been economies of scale with respect to the management of each Fund, whether the Funds have appropriately benefited from any economies of scale, and whether the management fee rate is reasonable in relation to the Fund assets and any economies of scale that may exist. In the Board’s view, any consideration of economies of scale must take account of the Funds’ low fee structure and the considerable efficiencies of the Funds’ organization and fee structure that has been realized by shareholders at the outset of their investment (i.e., from the first dollar). The Board noted that Dodge & Cox has shared economies of scale by adding or enhancing services to the Funds over time, and that the internal costs of providing investment management, up-to-date technology, administrative, and compliance services to the Funds are continuing to increase. For example, Dodge & Cox has increased its global research staff and investment resources over the years to address the increased complexity of investing in multinational and non-U.S. companies. In addition, Dodge & Cox has made substantial expenditures in other staff and infrastructure to enable it to integrate credit and equity analyses and to be able to implement its strategy in a more effective and secure manner. The Board determined that the Funds provide access by small investors to high quality investment management at a relatively low cost. The Board’s decision to renew the Agreements was made after consideration of economies of scale and review of peer group fund expense ratios and historical expense ratio patterns for the Funds. The Board concluded that the current Dodge & Cox fee structure is fair and reasonable and adequately shares economies of scale that may exist.
CONCLUSION
Based on their evaluation of all material factors and assisted by the advice of independent legal counsel to the Independent Trustees, the Board, including the Independent Trustees, concluded that the advisory fee structure was fair and reasonable, that each Fund was paying a competitive fee for the services provided, that the scope and quality of Dodge & Cox’s services has provided substantial value for Fund shareholders over the
long term, and that approval of the Agreements was in the best interests of each Fund and its shareholders.
FUND HOLDINGS
The Fund provides a complete list of its holdings four times each fiscal year, as of the end of each quarter. The Fund files the lists with the Securities and Exchange Commission (SEC) on Form N-CSR (second and fourth quarters) and Form N-Q (first and third quarters). Shareholders may view the Fund’s Forms N-CSR and N-Q on the SEC’s website at www.sec.gov. Forms N-CSR and N-Q may also be reviewed and copied at the SEC’s Public Reference Room in Washington, DC. Information regarding the operations of the Public Reference Room may be obtained by calling 1-202-942-8090 (direct) or 1-800-732-0330 (general SEC number). A complete list of the Fund’s quarter-end holdings is also available at www.dodgeandcox.com on or about 15 days following each quarter end and remains available on the website until the list is updated in the subsequent quarter.
PROXY VOTING
For a free copy of the Fund’s proxy voting policies and procedures, please call 1-800-621-3979, visit the Fund’s website at www.dodgeandcox.com, or visit the SEC’s website at www.sec.gov. Information regarding how the Fund voted proxies relating to portfolio securities during the most recent 12-month period ending June 30 is also available at www.dodgeandcox.com or at www.sec.gov.
HOUSEHOLD MAILINGS
The Fund routinely mails shareholder reports and summary prospectuses to shareholders and, on occasion, proxy statements. In order to reduce the volume of mail, when possible, only one copy of these documents will be sent to shareholders who are part of the same family and share the same residential address.
If you have a direct account with the Funds and you do not want the mailing of shareholder reports and summary prospectuses combined with other members in your household, contact the Funds at 1-800-621-3979. Your request will be implemented within 30 days.
DODGE & COX STOCK FUND §PAGE 18
DODGE & COX FUNDS—EXECUTIVE OFFICER & TRUSTEE INFORMATION
| | | | | | |
Name (Age) and
Address* | | Position with Trust (Year of Election or
Appointment) | | Principal Occupation During Past 5 Years | | Other Directorships Held by Trustees |
| INTERESTED TRUSTEES AND OFFICERS |
| Kenneth E. Olivier (59) | | Chairman, President, and Trustee (Trustee since 2005) | | Chairman (since March 2011), Chief Executive Officer (since 2010), President (until March 2011), and Director of Dodge & Cox; Portfolio Manager and member of Investment Policy Committee (IPC) | | — |
| Dana M. Emery (50) | | Senior Vice President and Trustee (Trustee since 1993) | | Co-President (since March 2011), Executive Vice President (until March 2011), and Director of Dodge & Cox; Director of Fixed Income, Portfolio Manager, and member of Fixed Income Investment Policy Committee (FIIPC) | | — |
| John A. Gunn (68) | | Trustee (Trustee since 1985) | | Chairman Emeritus (since March 2011), Chairman (2007-March 2011), Chief Executive Officer (2007-2010), and Director of Dodge & Cox; Portfolio Manager and member of IPC, Global Investment Policy Committee (GIPC) (since 2008), International Investment Policy Committee (IIPC), and FIIPC (until 2008) | | — |
| Charles F. Pohl (53) | | Senior Vice President (Officer since 2004) | | Co-President (since March 2011), Senior Vice President (until March 2011), and Director of Dodge & Cox; Chief Investment Officer (since 2007), Director of Credit Research, Portfolio Manager, Investment Analyst, and member of IPC, GIPC (since 2008), IIPC (since 2007), and FIIPC | | — |
| Diana S. Strandberg (52) | | Senior Vice President (Officer since 2006) | | Senior Vice President (since May 2011), Vice President (until May 2011), and Director (since May 2011) of Dodge & Cox; Director of International Equity (since 2009), Portfolio Manager, Investment Analyst, and member of IPC, GIPC (since 2008), and IIPC | | — |
| David H. Longhurst (54) | | Treasurer (Officer since 2006) | | Vice President (since 2008) and Assistant Treasurer (since 2007) of Dodge & Cox; Fund Administration and Accounting Senior Manager (until 2007) | | — |
| Thomas M. Mistele (58) | | Secretary (Officer since 1998) | | Chief Operating Officer, Director, Secretary, Senior Counsel (since May 2011), and General Counsel (until May 2011) of Dodge & Cox | | — |
| Katherine M. Primas (36) | | Chief Compliance Officer (Officer since 2009) | | Chief Compliance Officer of Dodge & Cox (since 2008) and Associate Chief Compliance Officer of Dodge & Cox (until 2008) | | — |
| INDEPENDENT TRUSTEES |
William F. Ausfahl (71) | | Trustee (Since 2002) | | CFO, The Clorox Co. (1982-1997); Director, The Clorox Co. (1984-1997) | | — |
| L. Dale Crandall (70) | | Trustee (Since 1999) | | President, Kaiser Foundation Health Plan, Inc. and Kaiser Foundation Hospitals (2000-2002); Senior Vice President—Finance and Administration & CFO, Kaiser Foundation Health Plan, Inc. and Kaiser Foundation Hospitals (1998-2000) | | Director, Ansell Limited (medical equipment and supplies) (2002-present); Director, Coventry Health Care, Inc. (managed health care) (2004-present); Bridgeport Education, Inc. (education services) (2008 to present) |
| Thomas A. Larsen (62) | | Trustee (Since 2002) | | Partner of Arnold & Porter LLP (law firm) (since 2012); Director of Howard, Rice, Nemerovski, Canady, Falk & Rabkin (1977-2011) | | — |
| Ann Mather (51) | | Trustee (Since 2011) | | CFO, Pixar Animation Studios (1999-2004) | | Director, Google, Inc. (internet information services) (2005-present); Director, Glu Mobile, Inc. (multimedia software) (2005-present); Director, Netflix, Inc. (video services) (2010-present); Director, MoneyGram International, Inc. (business services) (2010-present) |
| Robert B. Morris III (59) | | Trustee (Since 2011) | | Advisory Director, Presidio Financial Partners (Since 2005) | | — |
| John B. Taylor (65) | | Trustee (Since 2005) (and 1998-2001) | | Professor of Economics, Stanford University; Senior Fellow, Hoover Institution; Under Secretary for International Affairs, United States Treasury (2001-2005) | | — |
| * | | The address for each Officer and Trustee is 555 California Street, 40th Floor, San Francisco, California 94104. Each Officer and Trustee oversees all five series in the Dodge & Cox Funds complex and serves for an indefinite term. |
Additional information about the Trust’s Trustees and Officers is available in the Trust’s Statement of Additional Information (SAI). You can get a free copy of the SAI by visiting the Funds’ website at www.dodgeandcox.com or calling
1-800-621-3979.
PAGE 19 § DODGE & COX STOCK FUND
| | | | |
| | | | |
www.dodgeandcox.com
For Fund literature, transactions, and account information, please visit the Funds’ website.
or write or call:
DODGE & COX FUNDS
c/o Boston Financial Data Services
P.O. Box 8422
Boston, Massachusetts 02266-8422
(800) 621-3979
INVESTMENT MANAGER
Dodge & Cox
555 California Street, 40th Floor
San Francisco, California 94104
(415) 981-1710
This report is submitted for the general information of the shareholders of the Fund. The report is not authorized for distribution to prospective investors in the Fund unless it is accompanied by a current prospectus.
This report reflects our views, opinions, and portfolio holdings as of December 31, 2011, the end of the reporting period. Any such views are subject to change at any time based upon market or other conditions and Dodge & Cox disclaims any responsibility to update such views. These views may not be relied on as investment advice and, because investment decisions for a Dodge & Cox Fund are based on numerous factors, may not be relied on as an indication of trading intent on behalf of any Dodge & Cox Fund.
12/11 GSF AR Printed on recycled paper
Annual Report
December 31, 2011
Global Stock
Fund
ESTABLISHED 2008
TICKER: DODWX
A LETTER FROM THE CHAIRMAN
Our experience over 80 years has taught us that the best long-term investment opportunities often arise in periods of trepidation. While it is impossible to time market cycles with precision, we believe that building strong long-term returns rests on two key tenets of our investment approach: a willingness to revisit and retest our thinking as prices and conditions change, and the fortitude to stay the course, even in periods of volatility or underperformance.
A Year Defined by Aversion to Risk and Extreme Volatility
Two interconnected issues weighed heavily on global financial markets in 2011: uncertainty about the future of the Eurozone and the challenges to global economic growth posed by high debt levels. Investors responded by turning toward safety and security. A regular feature of this market environment was the “risk-on/risk-off” trade. Markets and securities with widely divergent fundamental risk factors traded in tandem based on whether short-term investor confidence improved (risk-on) or deteriorated (risk-off) on that day—often resulting in one day’s move being retraced the following day.
The year-over-year effect on returns was strong performance from investments considered less risky (e.g., 30-year U.S. Treasury securities returned 36% for the year), negative returns from world equities (down 6%), and wide divergence within asset classes between investments viewed as more safe and those viewed as less. Volatility levels were significantly elevated, especially during a gut-wrenching four days of daily 4% price moves in major equity markets in early August. In this environment, our Funds’ strategies suffered, with each underperforming its market benchmark for the year. For a more detailed discussion of each Fund’s 2011 performance, please read their Annual Letters.
Importance of Fundamental Research
In fear-driven markets, when prices fall across the board, bottom-up research is more important than ever. At Dodge & Cox, our goal is to build diversified
portfolios of individual securities—with attractive fundamentals at low valuations—based on our analysts’ intensive research and the depth of knowledge and experience of our portfolio managers.
Through the team-based decision-making of our seasoned investment professionals, we evaluate the risks, merits, and trade-offs of our investment decisions. Our analysts’ detailed knowledge about our holdings and our investment universe enables us to quickly assess a security’s long-term return potential following a decline in valuation—and take advantage of those opportunities where short-term valuations do not reflect the security’s long-term potential.
Opportunities Ahead
Starting valuation is an important component of long-term returns, and as significant pessimism about the future has driven down equity prices, we have been finding attractive opportunities around the world. Today, global equity markets are trading at 10 to 12 times forward estimated earnings, and many companies have strong balance sheets and opportunities for long-term global growth. Corporate bonds are also very attractive in this environment. Their yield premiums are at high levels now, and we’re seeing interesting opportunities in companies across a range of industries.
Over Dodge & Cox’s 80-year history, our long-term, value-oriented approach has withstood many periods of uncertainty. All of our Fund portfolios are well diversified and thoughtfully constructed, giving us optimism for the future. Thank you for your continued confidence in our firm. As always, we welcome your comments and questions.
For the Board of Trustees,

Kenneth E. Olivier,
Chairman and President
January 31, 2012
PAGE 1 § DODGE & COX GLOBAL STOCK FUND
TO OUR SHAREHOLDERS
The Dodge & Cox Global Stock Fund had a total return of 7.4% for the fourth quarter of 2011, compared to 7.6% for the MSCI World Index. For 2011, the Fund had a total return of –11.4%, compared to –5.5% for the MSCI World. At year end, the Fund had net assets of $1.9 billion with a cash position of 2.5%.
MARKET COMMENTARY
Global markets in 2011 were highly volatile, reflecting investor pessimism about a number of macroeconomic concerns, including the European sovereign debt crisis, U.S. unemployment, and slower economic growth worldwide. As a result, markets were weak, with the majority of developed and emerging equity markets experiencing significant declines in both U.S.-dollar and local currency terms. The emerging markets (down 18% in U.S. dollars) and the Eurozone (down 17% in U.S. dollars) were particularly weak.
INVESTMENT STRATEGY
Valuations Are at Exceptionally Low Levels
Valuations are now at exceptionally low levels, and many strong companies have seen steep declines in their stock prices, weighed down by the generally negative sentiment affecting markets more broadly. At year end, the MSCI World was trading at 13 times trailing earnings, compared to the 42-year average of 18 times. Our analysis of the data shows that starting valuation is the most significant driver of long-term equity returns. For example, low valuations are strongly associated with attractive ten-year returns. Historically, the ten-year return for the MSCI World has never been negative from a starting valuation as low as the one that exists today.
A low starting point valuation then, combined with earnings growth, provides a compelling foundation for long-term investment returns. Over the long term, we expect earnings to grow at rates comparable to nominal GDP. Over the past 42 years, earnings for the MSCI World have grown at 6% per year on average, which is in line with nominal GDP growth of the OECD countries over the same period. In addition, corporate prospects appear quite attractive from here. Since the outset of the 2008 financial crisis, managements have reduced leverage
and improved margins. As a result, balance sheets and cash flows are strong today.
Markets could continue to be highly volatile. While this can be unsettling, volatility can create significant opportunity for patient investors like ourselves. Our task is to continue to do what our firm has done for over 80 years: search the world for attractively valued companies in which we want to become long-term owners, given their potential for attractive earnings and cash flow growth. With the overall market so inexpensive today, we see numerous opportunities to invest in companies with strong competitive positions and capable management teams focused on building value for long-term owners.
Portfolio Examples
Microsoft(a) and Roche are examples of excellent companies at attractive valuations, which the Fund has held since the first quarter of 2011 and second quarter of 2009, respectively.
Microsoft is a leading software company. Its Windows and Office suite of products dominate corporate and personal computing. Over the past decade, Microsoft more than doubled revenues and increased earnings per share at a faster rate. Yet today, its valuation of nine times forward estimated earnings and a 3% dividend yield reflects skepticism about its growth prospects. One concern is how Microsoft will respond as personal computers and laptops face increasing competition from tablets and mobile phones.
Microsoft has the resources and drive to compete and innovate in the rapidly changing technology markets. The company is well financed and wields a significant research budget that is, for example, 50% larger than IBM’s ($9 versus $6 billion). Management has invested in various initiatives from SharePoint for corporate networks to Windows Phone for mobile phones that should enable them to compete effectively as the internet and mobile and cloud computing continue to develop. Finally, we believe management’s owner-operator mentality aligns their interests with those of long-term shareholders.
Roche is a multinational pharmaceutical company based in Switzerland, with around 60% of its sales from cancer treatment drugs. Our investment thesis for Roche rests on the efforts by management to improve operations
DODGE & COX GLOBAL STOCK FUND §PAGE 2
and continue to discover innovative pharmaceuticals for the future. While some of its oncology products face patent expiration over the next five years, generic competitors for these biologically derived pharmaceuticals face a significant hurdle: they must demonstrate biologic equivalence to achieve regulatory and commercial acceptance. The Fund is able to invest in an excellent company at an attractive valuation of less than 12 times forward estimated earnings with a current dividend yield greater than 4%.
Europe: Opportunities in Negative Headlines
The depth of concern about the sovereign debt crisis has depressed the valuations of many European companies to historically low levels. At year end, the MSCI Europe Index was trading at 9.8 times forward earnings with a dividend yield of 4.2%. We found compelling investment opportunities in multinational companies domiciled in Europe and added to holdings with significant worldwide market opportunities such as Nokia, Philips Electronics, and Schneider Electric.
Investors’ concerns about the Eurozone sovereign debt crisis are centered on the European financial services companies. The region’s banks were down 26% in 2011 and traded at around 70% of tangible book value, a historically low multiple reflecting significant skepticism about their capital levels and long-term viability. At year end, 9.3% of the Fund was invested in an array of financial services companies in Western Europe and the United Kingdom (compared to 4.8% for the MSCI World). A small portion—less than 1.3%—was invested in two banks in the Eurozone periphery: UniCredit in Italy and Banco Santander in Spain.
Our equity and fixed income investment teams devote significant time and resources researching and monitoring these holdings. Among the many issues we continue to scrutinize are the health of bank balance sheets, the stance of regulators, and funding sources and costs. In light of worsening events, we have revisited our positioning with a clean sheet of paper and asked ourselves the question, “If we did not already own these banks, would we start a position today?” Among the lessons that were reinforced from the 2008 financial crisis was the importance of incorporating “clean sheet of
paper” thinking about long-term prospects, while vigilantly monitoring sources of short-term liquidity and capital, as stock prices fall and investor concerns rise.
As a result of our ongoing work, the Fund added to a handful of financial services holdings with limited exposure to the Eurozone periphery, such as Barclays, Credit Suisse, and HSBC. These firms are leading global franchises trading at low valuations with strong levels of capital (e.g., Common Equity Tier 1 Capital Ratios(b) are all well above current regulatory minimums and at the high end of their peer group). All three are positioned to meet proposed regulatory requirements for liquidity and capital. Moreover, each is led by a management team that has successfully navigated challenging market conditions in the past. The monetary authorities in the UK and Switzerland also have the latitude to provide liquidity and support, and have done so.
The Fund also continues to hold both UniCredit and Banco Santander. UniCredit is raising capital that we believe will place it among the best capitalized European banks, has a low valuation, and has a management team that is working to improve operations. Banco Santander has global and growing retail banking businesses outside of Spain. However, despite both being multinational banks, they have large exposures to economic, political, and regulatory concerns in their home markets. We continue to research and stress test the assumptions underlying our evaluation of their investment merits and risks.
IN CLOSING
Over Dodge & Cox’s 80-year history, our long-term, value-oriented, fundamental investment approach has withstood many periods of uncertainty and delivered strong long-term returns for shareholders. We acknowledge the current challenges around the world. However, global equity markets are at compelling valuations which adequately reflect present concerns in our opinion. Thus, we are enthusiastic about the prospects for equities in general, and especially the holdings in the Fund, over the long run. Since short-term market movements are impossible to predict, and markets could continue to be volatile, we encourage shareholders to remain focused on the long term.
PAGE 3 § DODGE & COX GLOBAL STOCK FUND
Thank you for your continued confidence in our firm. As always, we welcome your comments and questions.
For the Board of Trustees,
| | |
| | |
Kenneth E. Olivier, Chairman and President | | Charles F. Pohl Senior Vice President |
January 31, 2012
| (a) | We use these examples to illustrate our investment process, not to imply that we think they are more attractive than the Fund’s other holdings. |
| (b) | The Tier 1 Capital Ratio is the ratio of a bank’s core equity capital to its total risk-weighted assets. |
ANNUAL PERFORMANCE REVIEW
The Fund underperformed the MSCI World by 5.8 percentage points in 2011.
Key Detractors from Relative Results
| | § | | Weak returns from holdings in the Information Technology sector (down 22% versus down 2% for the MSCI World sector) hurt results. Nintendo (down 53%), Nokia (down 51%), and Hewlett-Packard (down 38%) were notable detractors. | |
| | § | | Weak returns in the Financials sector (down 25% versus down 19% for the MSCI World sector), combined with a higher average weighting (25% versus 19%), also hurt results. Credit Suisse (down 40%), Charles Schwab (down 33%), and Bank of New York Mellon (down 33%) were weak performers. | |
| | § | | The Consumer Staples sector was the second strongest sector of the market. Therefore, the Fund’s lower average weighting (4% versus 10% for the MSCI World sector) detracted from relative results. | |
| | § | | Additional detractors included Lafarge (down 46%) and Naspers (down 25%). | |
Key Contributors to Relative Results
| | § | | Relative returns in the Health Care sector (up 12% versus up 9% for the MSCI World sector), combined with a higher average weighting (18% versus 10%), had a positive impact. GlaxoSmithKline (up 23%), Roche (up 20%), and Sanofi (up 19%) were strong performers. | |
| | § | | The Materials sector was the weakest sector of the market. The Metals & Mining industry was especially weak (down 28% for the MSCI World industry). As a result, the Fund’s lower average weighting in the industry helped results. | |
DODGE & COX GLOBAL STOCK FUND §PAGE 4
KEY CHARACTERISTICS OF DODGE & COX
Independent Organization
Dodge & Cox is one of the largest privately owned investment managers in the world. We remain committed to independence, with a goal of providing the highest quality investment management service to our existing clients.
80 Years of Investment Experience
Dodge & Cox was founded in 1930. We have a stable and well-qualified team of investment professionals, most of whom have spent their entire careers at Dodge & Cox.
Experienced Investment Team
The Global Investment Policy Committee, which is the decision-making body for the Global Stock Fund, is a seven-member committee with an average tenure at Dodge & Cox of 20 years.
One Business with a Single Research Office
Dodge & Cox manages domestic, international, and global equity, fixed income, and balanced investments, operating from one office in San Francisco.
Consistent Investment Approach
Our team decision-making process involves thorough, bottom-up fundamental analysis of each investment.
Long-Term Focus and Low Expenses
We invest with a three- to five-year investment horizon, which has historically resulted in low turnover relative to our peers. We manage Funds that maintain low expense ratios.
PAGE 5 § DODGE & COX GLOBAL STOCK FUND
GROWTH OF $10,000 SINCE INCEPTION
FOR AN INVESTMENT MADE ON MAY 1, 2008
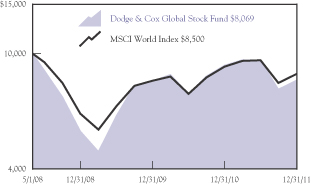
AVERAGE ANNUAL TOTAL RETURN
FOR PERIODS ENDED DECEMBER 31, 2011
| | | | | | | | | | | | |
| | | 1 Year | | | 3 Years | | | Since
Inception
(5/01/08) | |
Dodge & Cox Global Stock Fund | | | -11.39 | % | |
| 14.48
| %
| | | -5.68 | % |
MSCI World Index | | | -5.55 | | |
| 11.13
|
| | | -4.33 | |
Returns represent past performance and do not guarantee future results. Investment return and share price will fluctuate with market conditions, and investors may have a gain or loss when shares are sold. Fund performance changes over time and currently may be significantly
lower than stated. Performance is updated and published monthly. Visit the Fund’s website at www.dodgeandcox.com or call 1-800-621-3979 for current performance figures.
The Fund’s total returns include the reinvestment of dividend and capital gain distributions, but have not been adjusted for any income taxes payable by shareholders on these distributions or on Fund share redemptions. Index returns include dividends but, unlike Fund returns, do not reflect fees or expenses. The MSCI World Index is a broad-based, unmanaged equity market index aggregated from 24 developed market country indices, including the United States. MSCI makes no express or implied warranties or representations and shall have no liability whatsoever with respect to any MSCI data contained herein. The MSCI data may not be further redistributed or used as a basis for other indices or any securities or financial products. This report is not approved, reviewed, or produced by MSCI.
MSCI World is a service mark of MSCI Barra.
Risks: The Fund is subject to stock market risk, meaning stocks in the Fund may decline in value for extended periods due to the financial prospects of individual companies, or due to general market and economic conditions. Investing in non-U.S. securities may entail risk due to foreign economic and political developments; this risk may be increased when investing in emerging markets. Please read the prospectus and summary prospectus for specific details regarding the Fund’s risk profile.
FUND EXPENSE EXAMPLE
As a Fund shareholder, you incur ongoing Fund costs, including management fees and other Fund expenses. All mutual funds have ongoing costs, sometimes referred to as operating expenses. The following example shows ongoing costs of investing in the Fund and can help you understand these costs and compare them with those of other mutual funds. The example assumes a $1,000 investment held for the six months indicated.
ACTUAL EXPENSES
The first line of the table below provides information about actual account values and expenses based on the Fund’s actual returns. You may use the information in this line, together with your account balance, to estimate the expenses that you paid over the period. Simply divide your account value by $1,000 (for example, an $8,600 account value divided by $1,000 = 8.6), then multiply the result by the number in the first line under the heading “Expenses Paid During Period” to estimate the expenses you paid on your account during this period.
HYPOTHETICAL EXAMPLE FOR COMPARISON WITH OTHER MUTUAL FUNDS
Information on the second line of the table can help you compare ongoing costs of investing in the Fund with those of other mutual funds. This information may not be used to estimate the actual ending account balance or expenses you paid during the period. The hypothetical “Ending Account Value” is based on the actual expense ratio of the Fund and an assumed 5% annual rate of return before expenses (not the Fund’s actual return). The amount under the heading “Expense Paid During the Period” shows the hypothetical expenses your account would have incurred under this scenario. You can compare this figure with the 5% hypothetical examples that appear in shareholder reports of other mutual funds.
| | | | | | | | | | | | |
Six Months Ended December 31, 2011 | | Beginning Account Value
7/1/2011 | | | Ending Account Value
12/31/2011 | | | Expenses Paid During Period* | |
Based on Actual Fund Return | | $ | 1,000.00 | | | $ | 853.50 | | | $ | 3.05 | |
Based on Hypothetical 5% Yearly Return | | | 1,000.00 | | | | 1,021.91 | | | | 3.33 | |
| * | Expenses are equal to the Fund’s annualized expense ratio of 0.65%, multiplied by the average account value over the period, multiplied by 184/365 (to reflect the one-half year period). |
The expenses shown in the table highlight ongoing costs only and do not reflect any transactional fees or account maintenance fees. While other mutual funds may charge such fees, please note that the Fund does not charge transaction fees (e.g., redemption fees, sales loads) or universal account maintenance fees (e.g., small account fees).
DODGE & COX GLOBAL STOCK FUND §PAGE 6
| | | | |
| FUND INFORMATION | | | December 31, 2011 | |
| | | | |
| GENERAL INFORMATION | | | |
Net Asset Value Per Share | | | $7.68 | |
Total Net Assets (billions) | | | $1.9 | |
2010 Expense Ratio(a) | | | 0.69% | |
2011 Expense Ratio | | | 0.66% | |
Portfolio Turnover Rate | | | 19% | |
30-Day SEC Yield(b) | | | 2.30% | |
Fund Inception Date | | | May 1, 2008 | |
No sales charges or distribution fees | | | | |
Investment Manager: Dodge & Cox, San Francisco. Managed by the Global Investment Policy Committee, whose seven members’ average tenure at Dodge & Cox is 20 years.
| | | | | | | | |
| PORTFOLIO CHARACTERISTICS | | Fund | | | MSCI
World | |
Number of Stocks | | | 97 | | | | 1,615 | |
Median Market Capitalization (billions) | | | $21 | | | | $8 | |
Weighted Average Market
Capitalization (billions) | | | $65 | | | | $69 | |
Price-to-Earnings Ratio(c) | | | 9.7x | | | | 10.8x | |
Countries Represented | | | 22 | | | | 24 | |
Emerging Markets (Brazil, China, India, Indonesia, Mexico, Russia, South Africa, South Korea, Turkey) | | | 12.1% | | | | 0.0% | |
| | | | |
| TEN LARGEST HOLDINGS (%)(d) | | Fund | |
Hewlett-Packard Co. (United States) | | | 3.3 | |
Sanofi (France) | | | 3.1 | |
Roche Holding AG (Switzerland) | | | 3.0 | |
Merck & Co., Inc. (United States) | | | 2.7 | |
Wells Fargo & Co. (United States) | | | 2.5 | |
Microsoft Corp. (United States) | | | 2.4 | |
Novartis AG (Switzerland) | | | 2.2 | |
GlaxoSmithKline PLC (United Kingdom) | | | 2.1 | |
General Electric Co. (United States) | | | 2.1 | |
Amgen, Inc. (United States) | | | 2.0 | |
ASSET ALLOCATION
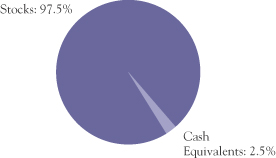
| | | | | | | | |
| REGION DIVERSIFICATION (%)(e) | | Fund | | | MSCI
World | |
United States | | | 43.3 | | | | 52.7 | |
Europe (excluding United Kingdom) | | | 28.0 | | | | 17.4 | |
United Kingdom | | | 9.7 | | | | 9.8 | |
Latin America | | | 4.8 | | | | 0.0 | |
Japan | | | 4.7 | | | | 9.1 | |
Africa/Middle East | | | 3.5 | | | | 0.3 | |
Pacific (excluding Japan) | | | 3.5 | | | | 5.5 | |
Canada | | | 0.0 | | | | 5.2 | |
| | | | | | | | |
| SECTOR DIVERSIFICATION (%) | | Fund | | | MSCI
World | |
Financials | | | 22.9 | | | | 17.6 | |
Health Care | | | 18.5 | | | | 10.5 | |
Information Technology | | | 13.8 | | | | 12.0 | |
Consumer Discretionary | | | 12.1 | | | | 10.3 | |
Industrials | | | 7.4 | | | | 11.1 | |
Telecommunication Services | | | 7.3 | | | | 4.5 | |
Energy | | | 6.2 | | | | 11.8 | |
Materials | | | 5.3 | | | | 7.2 | |
Consumer Staples | | | 4.0 | | | | 11.0 | |
Utilities | | | 0.0 | | | | 4.0 | |
| (a) | | 2010 expense ratio per Fund prospectus, dated May 1, 2011. |
| (b) | | SEC Yield is an annualization of the Fund’s total net investment income per share for the 30-day period ended on the last day of the month. |
| (c) | | Price-to-earnings (P/E) ratios are calculated using 12-month forward earnings estimates. |
| (d) | | The Fund’s portfolio holdings are subject to change without notice. The mention of specific securities is not a recommendation to buy, sell, or hold any particular security and is not indicative of Dodge & Cox’s current or future trading activity. |
| (e) | | The Fund may classify a company in a different category than the MSCI World. The Fund generally classifies a company based on its country of incorporation, but may designate a different country in certain circumstances. |
PAGE 7 § DODGE & COX GLOBAL STOCK FUND
| | | | |
| PORTFOLIO OF INVESTMENTS | | | December 31, 2011 | |
| | | | | | | | |
COMMON STOCKS: 96.2% | | | | |
| | |
| | | SHARES | | | VALUE | |
| CONSUMER DISCRETIONARY: 12.1% | |
AUTOMOBILES & COMPONENTS: 1.6% | |
Bayerische Motoren Werke AG (Germany) | | | 102,400 | | | $ | 6,859,817 | |
Mahindra & Mahindra, Ltd. (India) | | | 400,300 | | | | 5,125,770 | |
Yamaha Motor Co., Ltd. (Japan) | | | 1,472,400 | | | | 18,632,163 | |
| | | | | | | | |
| | | | | | | 30,617,750 | |
CONSUMER DURABLES & APPAREL: 1.9% | |
LG Electronics, Inc.(a) (South Korea) | | | 184,800 | | | | 11,953,547 | |
Li Ning Co., Ltd. (Cayman Islands/China) | | | 6,192,600 | | | | 4,927,544 | |
Panasonic Corp. (Japan) | | | 1,568,700 | | | | 13,328,957 | |
Sony Corp. (Japan) | | | 319,100 | | | | 5,729,456 | |
| | | | | | | | |
| | | | | | | 35,939,504 | |
MEDIA: 7.3% | |
Comcast Corp., Class A (United States) | | | 1,085,600 | | | | 25,739,576 | |
DISH Network Corp., Class A(a) (United States) | | | 296,300 | | | | 8,438,624 | |
Grupo Televisa SAB ADR (Mexico) | | | 934,100 | | | | 19,672,146 | |
Naspers, Ltd. (South Africa) | | | 743,600 | | | | 32,533,968 | |
News Corp., Class A (United States) | | | 542,445 | | | | 9,677,219 | |
Television Broadcasts, Ltd. (Hong Kong) | | | 2,523,100 | | | | 15,301,163 | |
Time Warner Cable, Inc. (United States) | | | 153,171 | | | | 9,737,081 | |
Time Warner, Inc. (United States) | | | 412,466 | | | | 14,906,521 | |
| | | | | | | | |
| | | | | | | 136,006,298 | |
RETAILING: 1.3% | | | | | | | | |
Home Depot, Inc. (United States) | | | 320,600 | | | | 13,478,024 | |
Liberty Interactive, Series A(a) (United States) | | | 626,657 | | | | 10,161,243 | |
| | | | | | | | |
| | | | | | | 23,639,267 | |
| | | | | | | | |
| | | | | | | 226,202,819 | |
| CONSUMER STAPLES: 4.0% | |
FOOD & STAPLES RETAILING: 1.5% | |
Wal-Mart Stores, Inc. (United States) | | | 457,400 | | | | 27,334,224 | |
|
FOOD, BEVERAGE & TOBACCO: 2.5% | |
Anadolu Efes Biracilik ve Malt Sanayii AS (Turkey) | | | 1,602,600 | | | | 19,294,669 | |
Diageo PLC ADR (United Kingdom) | | | 147,800 | | | | 12,920,676 | |
Unilever PLC (United Kingdom) | | | 445,300 | | | | 14,958,246 | |
| | | | | | | | |
| | | | | | | 47,173,591 | |
| | | | | | | | |
| | | | | | | 74,507,815 | |
| | | | | | | | |
| | |
| | | SHARES | | | VALUE | |
| ENERGY: 4.9% | | | | | | | | |
Baker Hughes, Inc. (United States) | | | 166,387 | | | $ | 8,093,064 | |
Chevron Corp. (United States) | | | 97,700 | | | | 10,395,280 | |
Occidental Petroleum Corp. (United States) | | | 209,525 | | | | 19,632,492 | |
Royal Dutch Shell PLC ADR (United Kingdom) | | | 293,155 | | | | 21,426,699 | |
Schlumberger, Ltd. (Curacao/United States) | | | 467,900 | | | | 31,962,249 | |
| | | | | | | | |
| | | | | | | 91,509,784 | |
| FINANCIALS: 22.9% | | | | | | | | |
BANKS: 9.2% | | | | | | | | |
Banco Santander SA (Spain) | | | 2,099,972 | | | | 15,954,012 | |
Barclays PLC (United Kingdom) | | | 11,003,400 | | | | 30,083,917 | |
BB&T Corp. (United States) | | | 736,700 | | | | 18,542,739 | |
HSBC Holdings PLC (United Kingdom) | | | 2,568,162 | | | | 19,584,820 | |
Mitsubishi UFJ Financial Group, Inc. (Japan) | | | 1,525,000 | | | | 6,478,823 | |
Standard Bank Group, Ltd. (South Africa) | | | 649,200 | | | | 7,941,543 | |
Standard Chartered PLC (United Kingdom) | | | 514,722 | | | | 11,263,028 | |
SunTrust Banks, Inc. (United States) | | | 413,795 | | | | 7,324,172 | |
UniCredit SPA (Italy) | | | 918,233 | | | | 7,629,681 | |
Wells Fargo & Co. (United States) | | | 1,717,773 | | | | 47,341,824 | |
| | | | | | | | |
| | | | | | | 172,144,559 | |
DIVERSIFIED FINANCIALS: 9.2% | | | | | | | | |
Bank of America Corp. (United States) | | | 3,345,500 | | | | 18,600,980 | |
Bank of New York Mellon Corp. (United States) | | | 1,648,700 | | | | 32,825,617 | |
Capital One Financial Corp. (United States) | | | 731,900 | | | | 30,952,051 | |
Charles Schwab Corp. (United States) | | | 2,362,900 | | | | 26,606,254 | |
Credit Suisse Group AG (Switzerland) | | | 1,272,200 | | | | 29,891,892 | |
Goldman Sachs Group, Inc. (United States) | | | 273,000 | | | | 24,687,390 | |
Haci Omer Sabanci Holding AS (Turkey) | | | 3,344,188 | | | | 9,535,902 | |
| | | | | | | | |
| | | | | | | 173,100,086 | |
INSURANCE: 3.7% | | | | | | | | |
AEGON NV(a) (Netherlands) | | | 6,502,474 | | | | 26,097,488 | |
Dai-ichi Life Insurance Co., Ltd. (Japan) | | | 9,585 | | | | 9,426,848 | |
Swiss Life Holding AG (Switzerland) | | | 70,600 | | | | 6,494,027 | |
Swiss Re AG (Switzerland) | | | 545,300 | | | | 27,790,388 | |
| | | | | | | | |
| | | | | | | 69,808,751 | |
| | |
| See accompanying Notes to Financial Statements | | DODGE & COX GLOBAL STOCK FUND §PAGE 8 |
| | | | |
| PORTFOLIO OF INVESTMENTS | | | December 31, 2011 | |
| | | | | | | | |
COMMON STOCKS (continued) | | | | |
| | |
| | | SHARES | | | VALUE | |
REAL ESTATE: 0.8% | | | | | | | | |
BR Malls Participacoes SA (Brazil) | | | 703,600 | | | $ | 6,835,133 | |
Hang Lung Group, Ltd. (Hong Kong) | | | 1,327,500 | | | | 7,230,095 | |
| | | | | | | | |
| | | | | | | 14,065,228 | |
| | | | | | | | |
| | | | | | | 429,118,624 | |
| HEALTH CARE: 18.5% | | | | | | | | |
HEALTH CARE EQUIPMENT & SERVICES: 0.8% | |
Boston Scientific Corp.(a) (United States) | | | 1,120,200 | | | | 5,981,868 | |
Medtronic, Inc. (United States) | | | 221,200 | | | | 8,460,900 | |
| | | | | | | | |
| | | | | | | 14,442,768 | |
PHARMACEUTICALS, BIOTECHNOLOGY & LIFE SCIENCES: 17.7% | |
Amgen, Inc. (United States) | | | 574,100 | | | | 36,862,961 | |
Bayer AG (Germany) | | | 494,520 | | | | 31,617,616 | |
GlaxoSmithKline PLC ADR (United Kingdom) | | | 782,100 | | | | 35,687,223 | |
GlaxoSmithKline PLC (United Kingdom) | | | 194,800 | | | | 4,451,647 | |
Merck & Co., Inc. (United States) | | | 1,349,600 | | | | 50,879,920 | |
Novartis AG ADR (Switzerland) | | | 609,700 | | | | 34,856,549 | |
Novartis AG (Switzerland) | | | 98,800 | | | | 5,648,419 | |
Pfizer, Inc. (United States) | | | 856,300 | | | | 18,530,332 | |
Roche Holding AG (Switzerland) | | | 333,800 | | | | 56,575,066 | |
Sanofi (France) | | | 784,862 | | | | 57,647,103 | |
| | | | | | | | |
| | | | | | | 332,756,836 | |
| | | | | | | | |
| | | | | | | 347,199,604 | |
| INDUSTRIALS: 7.4% | | | | | | | | |
CAPITAL GOODS: 6.0% | | | | | | | | |
General Electric Co. (United States) | | | 2,200,300 | | | | 39,407,373 | |
Koninklijke Philips Electronics NV (Netherlands) | | | 1,287,419 | | | | 27,126,429 | |
Mitsubishi Electric Corp. (Japan) | | | 1,628,700 | | | | 15,616,222 | |
Schneider Electric SA (France) | | | 324,578 | | | | 17,089,066 | |
Tyco International, Ltd. (Switzerland) | | | 149,900 | | | | 7,001,829 | |
Wienerberger AG (Austria) | | | 684,480 | | | | 6,196,594 | |
| | | | | | | | |
| | | | | | | 112,437,513 | |
TRANSPORTATION: 1.4% | | | | | | | | |
FedEx Corp. (United States) | | | 305,100 | | | | 25,478,901 | |
| | | | | | | | |
| | | | | | | 137,916,414 | |
| INFORMATION TECHNOLOGY: 13.8% | |
SEMICONDUCTORS & SEMICONDUCTOR EQUIPMENT: 0.5% | |
Maxim Integrated Products, Inc. (United States) | | | 344,000 | | | | 8,957,760 | |
| | | | | | | | |
| | |
| | | SHARES | | | VALUE | |
SOFTWARE & SERVICES: 6.0% | | | | | | | | |
AOL, Inc.(a) (United States) | | | 847,869 | | | $ | 12,802,822 | |
eBay, Inc.(a) (United States) | | | 515,900 | | | | 15,647,247 | |
Microsoft Corp. (United States) | | | 1,699,700 | | | | 44,124,212 | |
Nintendo Co., Ltd. (Japan) | | | 139,300 | | | | 19,183,838 | |
Symantec Corp.(a) (United States) | | | 756,600 | | | | 11,840,790 | |
Synopsys, Inc.(a) (United States) | | | 346,800 | | | | 9,432,960 | |
| | | | | | | | |
| | | | | | | 113,031,869 | |
TECHNOLOGY, HARDWARE & EQUIPMENT: 7.3% | |
Corning, Inc.(a) (United States) | | | 675,000 | | | | 8,761,500 | |
Hewlett-Packard Co. (United States) | | | 2,409,500 | | | | 62,068,720 | |
NetApp, Inc.(a) (United States) | | | 250,000 | | | | 9,067,500 | |
Nokia Oyj (Finland) | | | 5,250,425 | | | | 25,632,116 | |
TE Connectivity, Ltd. (Switzerland) | | | 484,115 | | | | 14,915,583 | |
Telefonaktiebolaget LM Ericsson (Sweden) | | | 702,188 | | | | 7,183,039 | |
Xerox Corp. (United States) | | | 1,163,000 | | | | 9,257,480 | |
| | | | | | | | |
| | | | | | | 136,885,938 | |
| | | | | | | | |
| | | | | | | 258,875,567 | |
| MATERIALS: 5.3% | | | | | | | | |
Akzo Nobel NV (Netherlands) | | | 300,456 | | | | 14,528,008 | |
Celanese Corp., Series A
(United States) | | | 390,200 | | | | 17,274,154 | |
Cemex SAB de CV ADR(a) (Mexico) | | | 2,012,442 | | | | 10,847,063 | |
Domtar Corp. (United States) | | | 138,416 | | | | 11,067,743 | |
Dow Chemical Co. (United States) | | | 367,600 | | | | 10,572,176 | |
Duratex SA (Brazil) | | | 1,816,600 | | | | 8,687,346 | |
Lafarge SA (France) | | | 519,208 | | | | 18,251,117 | |
Norsk Hydro ASA (Norway) | | | 1,845,711 | | | | 8,560,660 | |
| | | | | | | | |
| | | | | | | 99,788,267 | |
| TELECOMMUNICATION SERVICES: 7.3% | |
America Movil SAB de CV, Series L (Mexico) | | | 16,935,400 | | | | 19,150,581 | |
MTN Group, Ltd. (South Africa) | | | 1,405,100 | | | | 25,017,500 | |
PT Telekomunikasi Indonesia TBK ADR (Indonesia) | | | 666,200 | | | | 20,478,988 | |
Telecom Italia SPA-RSP (Italy) | | | 25,855,800 | | | | 23,157,005 | |
Telefonica SA (Spain) | | | 534,300 | | | | 9,255,969 | |
Telekom Austria AG (Austria) | | | 787,533 | | | | 9,439,245 | |
Vodafone Group PLC (United Kingdom) | | | 11,227,000 | | | | 31,192,165 | |
| | | | | | | | |
| | | | | | | 137,691,453 | |
| | | | | | | | |
TOTAL COMMON STOCKS
(Cost $1,907,689,570) | | | $ | 1,802,810,347 | |
| | |
| PAGE 9 § DODGE & COX GLOBAL STOCK FUND | | See accompanying Notes to Financial Statements |
| | | | |
| PORTFOLIO OF INVESTMENTS | | | December 31, 2011 | |
| | | | | | | | |
PREFERRED STOCKS: 1.3% | | | | |
| | |
| | | SHARES | | | VALUE | |
ENERGY: 1.3% | | | | | | | | |
Petroleo Brasileiro SA ADR (Brazil) | | | 640,500 | | | $ | 15,045,345 | |
Ultrapar Participacoes SA ADR (Brazil) | | | 591,200 | | | | 10,168,640 | |
| | | | | | | | |
TOTAL PREFERRED STOCKS
(Cost $22,306,117) | | | $ | 25,213,985 | |
|
| SHORT-TERM INVESTMENTS: 1.2% | |
| | |
| | | PAR VALUE | | | VALUE | |
MONEY MARKET FUND: 0.1% | | | | | | | | |
SSgA U.S. Treasury Money Market
Fund | | $ | 1,849,043 | | | $ | 1,849,043 | |
| | |
REPURCHASE AGREEMENT: 1.1% | | | | | | | | |
Fixed Income Clearing Corporation(b) 0.01%, dated 12/30/11, due 1/3/12, maturity value $21,235,024 | | | 21,235,000 | | | | 21,235,000 | |
| | | | | | | | |
TOTAL SHORT-TERM INVESTMENTS
(Cost $23,084,043) | | | $ | 23,084,043 | |
| | | | | | | | |
TOTAL INVESTMENTS
(Cost $1,953,079,730) | | | 98.7 | % | | $ | 1,851,108,375 | |
OTHER ASSETS LESS
LIABILITIES | | | 1.3 | % | | | 23,881,764 | |
| | | | | | | | |
| NET ASSETS | | | 100.0 | % | | $ | 1,874,990,139 | |
| | | | | | | | |
| | | | | | | | | |
| (b) | Repurchase agreement is collateralized by U.S. Treasury Note 2.50%, 3/31/13. Total collateral value is $21,662,550. |
In determining a company’s country designation, the Fund generally references the country of incorporation. In cases where the Fund considers the country of incorporation to be a “jurisdiction of convenience” chosen primarily for tax purposes, the Fund uses the country designation of an appropriate broad-based market index. In that circumstance, two countries are listed—the country of incorporation and the country designated by an appropriate index, respectively.
ADR: American Depositary Receipt
Forward Foreign Currency Contracts
As of December 31, 2011, open forward foreign currency contracts are summarized as follows:
| | | | | | | | | | | | |
| | | | | Contract Amount | | | | |
| Counterparty | | Settlement
Date | | Receive
(USD) | | Deliver
(CHF) | | | Unrealized
Appreciation | |
| |
| Contracts to sell Swiss Franc: | | | | | | | | | | |
| Barclays | | 2/8/2012 | | 4,538,132 | | | 4,000,000 | | | $ | 277,085 | |
| Citibank | | 2/15/2012 | | 3,538,023 | | | 3,200,000 | | | | 128,631 | |
| JPMorgan Chase | | 2/15/2012 | | 3,536,341 | | | 3,200,000 | | | | 126,950 | |
| HSBC | | 2/22/2012 | | 3,478,185 | | | 3,200,000 | | | | 68,240 | |
| | | | | | | | | | | | |
| | | | | | | | | | $ | 600,906 | |
| | | | | | | | | | | | |
| | | | | | | | | | | | | |
Currency Abbreviations
CHF—Swiss Franc
USD—U.S. Dollar
| | |
| See accompanying Notes to Financial Statements | | DODGE & COX GLOBAL STOCK FUND §PAGE 10 |
| | | | |
STATEMENT OF ASSETS AND LIABILITIES | |
| |
| | | December 31, 2011 | |
ASSETS: | | | | |
Investments, at value (cost $1,953,079,730) | | $ | 1,851,108,375 | |
Cash denominated in foreign currency (cost $363) | | | 363 | |
Receivable for investments sold | | | 1,655,779 | |
Receivable for foreign currency contracts closed | | | 776,183 | |
Unrealized appreciation on foreign currency contracts | | | 600,906 | |
Receivable for Fund shares sold | | | 18,196,600 | |
Dividends and interest receivable | | | 5,149,150 | |
Prepaid expenses and other assets | | | 11,715 | |
| | | | |
| | | 1,877,499,071 | |
| | | | |
LIABILITIES: | | | | |
Payable for Fund shares redeemed | | | 1,418,186 | |
Management fees payable | | | 939,993 | |
Accrued expenses | | | 150,753 | |
| | | | |
| | | 2,508,932 | |
| | | | |
NET ASSETS | | $ | 1,874,990,139 | |
| | | | |
NET ASSETS CONSIST OF: | | | | |
Paid in capital | | $ | 1,975,575,361 | |
Undistributed net investment income | | | 88,406 | |
Accumulated net realized gain | | | 759,553 | |
Net unrealized depreciation | | | (101,433,181 | ) |
| | | | |
| | $ | 1,874,990,139 | |
| | | | |
Fund shares outstanding (par value $0.01 each, unlimited shares authorized) | | | 244,101,196 | |
Net asset value per share | | | $7.68 | |
| |
STATEMENT OF OPERATIONS | | | | |
| |
| | | Year Ended
December 31, 2011 | |
INVESTMENT INCOME: | | | | |
Dividends (net of foreign taxes of $2,879,637) | | $ | 49,860,483 | |
Interest | | | 10,983 | |
| | | | |
| | | 49,871,466 | |
| | | | |
EXPENSES: | | | | |
Management fees | | | 11,490,296 | |
Custody and fund accounting fees | | | 266,357 | |
Transfer agent fees | | | 287,690 | |
Professional services | | | 158,719 | |
Shareholder reports | | | 49,447 | |
Registration fees | | | 137,850 | |
Trustees’ fees | | | 214,500 | |
Miscellaneous | | | 60,677 | |
| | | | |
| | | 12,665,536 | |
| | | | |
NET INVESTMENT INCOME | | | 37,205,930 | |
| | | | |
REALIZED AND UNREALIZED GAIN (LOSS): | | | | |
Net realized gain | | | | |
Investments (net of foreign capital gain tax of $1,344,230) | | | 76,679,296 | |
Foreign currency transactions | | | 4,430,628 | |
Net change in unrealized appreciation/depreciation | | | | |
Investments (including net decrease in accrued foreign capital gain tax of $1,127,939) | | | (358,598,974 | ) |
Foreign currency transactions | | | 561,756 | |
| | | | |
Net realized and unrealized loss | | | (276,927,294 | ) |
| | | | |
NET DECREASE IN NET ASSETS FROM OPERATIONS | | $ | (239,721,364 | ) |
| | | | |
| | | | | | | | |
STATEMENT OF CHANGES IN NET ASSETS | |
| | |
| | | Year Ended
December 31, 2011
| | | Year Ended
December 31, 2010
| |
OPERATIONS: | | | | | | | | |
Net investment income | | $ | 37,205,930 | | | $ | 14,657,050 | |
Net realized gain | | | 81,109,924 | | | | 26,521,021 | |
Net change in unrealized appreciation/depreciation | | | (358,037,218 | ) | | | 156,982,479 | |
| | | | | | | | |
| | | (239,721,364 | ) | | | 198,160,550 | |
| | | | | | | | |
| | |
DISTRIBUTIONS TO SHAREHOLDERS FROM: | | | | | | | | |
Net investment income | | | (35,098,359 | ) | | | (14,456,000 | ) |
Net realized gain | | | (12,720,210 | ) | | | — | |
| | | | | | | | |
Total distributions | | | (47,818,569 | ) | | | (14,456,000 | ) |
| | | | | | | | |
| | |
FUND SHARE TRANSACTIONS: | | | | | | | | |
Proceeds from sale of shares | | | 625,171,940 | | | | 895,416,650 | |
Reinvestment of distributions | | | 46,192,193 | | | | 13,491,932 | |
Cost of shares redeemed | | | (325,573,001 | ) | | | (189,656,529 | ) |
| | | | | | | | |
Net increase from Fund share transactions | | | 345,791,132 | | | | 719,252,053 | |
| | | | | | | | |
Total increase in net assets | | | 58,251,199 | | | | 902,956,603 | |
| | |
NET ASSETS: | | | | | | | | |
Beginning of year | | | 1,816,738,940 | | | | 913,782,337 | |
| | | | | | | | |
End of year (including undistributed net investment income of $88,406 and $19,856, respectively) | | $ | 1,874,990,139 | | | $ | 1,816,738,940 | |
| | | | | | | | |
| | |
SHARE INFORMATION: | | | | | | | | |
Shares sold | | | 72,510,079 | | | | 110,491,862 | |
Distributions reinvested | | | 6,102,007 | | | | 1,524,512 | |
Shares redeemed | | | (38,661,666 | ) | | | (23,426,538 | ) |
| | | | | | | | |
Net increase in shares outstanding | | | 39,950,420 | | | | 88,589,836 | |
| | | | | | | | |
| | |
| PAGE 11 § DODGE & COX GLOBAL STOCK FUND | | See accompanying Notes to Financial Statements |
NOTES TO FINANCIAL STATEMENTS
NOTE 1—ORGANIZATION AND SIGNIFICANT ACCOUNTING POLICIES
Dodge & Cox Global Stock Fund (the “Fund”) is one of the series constituting the Dodge & Cox Funds (the “Trust” or the “Funds”). The Trust is organized as a Delaware statutory trust and is registered under the Investment Company Act of 1940, as amended, as a diversified, open-end management investment company. The Fund commenced operations on May 1, 2008, and seeks long-term growth of principal and income. The Fund invests primarily in a diversified portfolio of U.S. and foreign stocks. Foreign investing, especially in developing countries, has special risks such as currency and market volatility and political and social instability. These and other risk considerations are discussed in the Fund’s Prospectus.
The financial statements have been prepared in conformity with accounting principles generally accepted in the United States of America, which require the use of estimates and assumptions by management. Actual results may differ from those estimates. Significant accounting policies are as follows:
Security valuation The Fund’s net assets are valued as of the close of trading on the New York Stock Exchange (NYSE), generally 4:00 p.m. Eastern Time, each day that the NYSE is open for business. Listed securities are valued at market, using the official quoted close price or the last sale on the date of determination or, if not available, at the mean between the exchange listed bid and ask prices. A security that is listed or traded on more than one exchange is valued at the quotation on the exchange determined to be the primary market for such security. Security values are not discounted based on the size of the Fund’s position. Short-term securities are valued at amortized cost, which approximates current value.
Investments initially valued in currencies other than the U.S. dollar are converted to the U.S. dollar using prevailing exchange rates. As a result, the Fund’s net asset value per share (NAV) may be affected by changes in the value of currencies in relation to the U.S. dollar.
If market quotations are not readily available or if a security’s value has materially changed after the close of the security’s primary market but before the close of
trading on the NYSE, the security is valued at fair value as determined in good faith by or under the direction of the Board of Trustees. The Fund may use fair value pricing in calculating its NAV when, for example, (i) the primary market for a security is closed or if trading of a security is suspended or limited, (ii) the Fund determines that the price provided by a pricing service is inaccurate or unreliable, or (iii) the Fund determines that a significant event affecting the value of a security has occurred before the close of the NYSE but after the close of the security’s primary market. An event is considered significant if there is both an affirmative expectation that the security’s value will materially change in response to the event and a reasonable basis for quantifying a resulting change in value. Because trading in securities on most non-U.S. exchanges is normally completed before the close of the NYSE, the value of foreign securities can change by the time the Fund calculates its NAV. To address these changes, the Fund may utilize adjustment factors provided by an independent pricing service to systematically value foreign securities at fair value. These adjustment factors are based on statistical analyses of subsequent movements and changes in securities indices, specific security prices, and exchange rates in foreign markets. When fair value pricing is employed, the prices of securities used by the Fund to calculate its net asset value may differ from quoted or published prices for the same securities. In addition, fair values may not reflect the price that the Fund could obtain for a security if it were to dispose of that security at the time of pricing.
Security transactions, investment income, expenses, and distributions Security transactions are recorded on the trade date. Realized gains and losses on securities sold are determined on the basis of identified cost.
Dividend income and corporate action transactions are recorded on the ex-dividend date, or when the Fund first learns of the dividend/corporate action if the ex-dividend date has passed. Non-cash dividends included in dividend income, if any, are recorded at the fair market value of the securities received. Dividends characterized as return of capital are recorded as a reduction of cost of investments and/or realized gain. Interest income is recorded on the accrual basis.
DODGE & COX GLOBAL STOCK FUND §PAGE 12
NOTES TO FINANCIAL STATEMENTS
Expenses are recorded on the accrual basis. Most expenses of the Trust can be directly attributed to a specific series. Expenses which cannot be directly attributed are allocated among the Funds in the Trust based on relative net assets or other expense methodologies determined by the nature of the expense.
Distributions to shareholders are recorded on the ex-dividend date.
Repurchase agreements The Fund enters into repurchase agreements, secured by U.S. government or agency securities, which involve the purchase of securities from a counterparty with a simultaneous commitment to resell the securities at an agreed-upon date and price. It is the Fund’s policy that its custodian take possession of the underlying collateral securities, the fair value of which exceeds the principal amount of the repurchase transaction, including accrued interest, at all times. In the event of default by the counterparty, the Fund has the contractual right to liquidate the collateral securities and to apply the proceeds in satisfaction of the obligation.
Foreign taxes The Fund is subject to foreign taxes which may be imposed by certain countries in which the Fund invests. Withholding taxes are incurred on certain foreign dividends and are accrued at the time the associated dividend is recorded. Capital gains taxes are incurred upon disposition of certain foreign securities. Capital gains taxes are accrued as unrealized losses and are reflected as realized losses upon the sale of the related security. Currency taxes may be incurred when the Fund purchases certain foreign currencies related to securities transactions and are recorded as realized losses on foreign currency transactions. The Fund endeavors to record foreign taxes based on applicable foreign tax law.
Forward foreign currency contracts A forward foreign currency contract represents an obligation to purchase or sell a specific foreign currency at a future date and at a price set at the time of the contract. Losses from these transactions may arise from unfavorable changes in currency values or if the counterparties do not perform under a contract’s terms.
The values of the forward foreign currency contracts are adjusted daily based on the applicable exchange rate of the underlying currency. Changes in the value of open
contracts are recorded as unrealized appreciation or depreciation. When the forward contract is closed, the Fund records a realized gain or loss equal to the difference between the value at the time the contract was opened and the value at the time it was closed.
On April 27, 2011, the Fund entered into foreign currency contracts to hedge foreign currency risks associated with portfolio investments denominated in Swiss Francs. From that date through December 31, 2011, the Fund held forward foreign currency contracts with U.S. dollar total values ranging from 0.2% to 1.3% of net assets.
Foreign currency translation The books and records of the Funds are maintained in U.S. dollars. Foreign currency amounts are translated into U.S. dollars at the prevailing exchange rates of such currencies against the U.S. dollar. The market value of investment securities and other assets and liabilities are translated at the exchange rate as of the valuation date. Purchases and sales of investment securities, income, and expenses are translated at the exchange rate prevailing on the transaction date.
Reported realized and unrealized gain (loss) on investments include foreign currency gain (loss) related to investment transactions.
Reported realized and unrealized gain (loss) on foreign currency transactions include the following: holding/disposing of foreign currency and forward foreign currency contracts, the difference between the trade and settlement dates on securities transactions, the difference between the accrual and payment dates on dividends, and currency losses on the purchase of foreign currency in certain countries that impose taxes on such transactions.
Indemnification Under the Trust’s organizational documents, its officers and trustees are indemnified against certain liabilities arising out of the performance of their duties to the Trust. In addition, in the normal course of business the Trust enters into contracts that provide general indemnities to other parties. The Trust’s maximum exposure under these arrangements is unknown as this would involve future claims that may be made against the Trust that have not yet occurred.
PAGE 13 § DODGE & COX GLOBAL STOCK FUND
NOTES TO FINANCIAL STATEMENTS
NOTE 2—VALUATION MEASUREMENTS
Various inputs are used in determining the value of the Fund’s investments and other financial instruments. These inputs are summarized in the three broad levels listed below.
| § | | Level 1: Quoted prices in active markets for identical securities |
| § | | Level 2: Other significant observable inputs (including quoted prices for similar securities, market indices, interest rates, credit risk, etc.) |
| § | | Level 3: Significant unobservable inputs (including Fund management’s assumptions in determining the fair value of investments) |
The inputs or methodology used for valuing securities are not necessarily an indication of the risk associated with investing in those securities.
The following is a summary of the inputs used to value the Fund’s holdings as of December 31, 2011:
| | | | | | | | |
| Security Classification(a) | | LEVEL 1
(Quoted Prices) | | | LEVEL 2
(Other Significant
Observable Inputs) | |
Securities | | | | | | | | |
Common Stocks | | | | | | | | |
Consumer Discretionary | | $ | 214,249,272 | | | $ | 11,953,547 | |
Consumer Staples | | | 74,507,815 | | | | — | |
Energy | | | 91,509,784 | | | | — | |
Financials | | | 429,118,624 | | | | — | |
Health Care | | | 347,199,604 | | | | — | |
Industrials | | | 131,719,820 | | | | 6,196,594 | |
Information Technology | | | 258,875,567 | | | | — | |
Materials | | | 99,788,267 | | | | — | |
Telecommunication Services | | | 128,252,208 | | | | 9,439,245 | |
Preferred Stocks | | | | | | | | |
Energy | | | 25,213,985 | | | | — | |
Short-term Investments | | | | | | | | |
Money Market Fund | | | 1,849,043 | | | | — | |
Repurchase Agreement | | | — | | | | 21,235,000 | |
| | | | | | | | |
Total Securities | | $ | 1,802,283,989 | | | $ | 48,824,386 | |
Other Financial Instruments | | | | | | | | |
Forward Foreign Currency Contracts | | $ | — | | | $ | 600,906 | (b) |
| | | | | | | | | |
| (a) | Transfers during the period between Level 1 and Level 2 relate to the use of systematic fair valuation. On days when systematic fair valuation is used, securities whose primary market closes before the NYSE are classified as Level 2. There were no Level 3 securities at December 31, 2011 and 2010, and there were no transfers to Level 3 during the year. |
| (b) | Represents net unrealized appreciation on forward foreign currency contracts. |
NOTE 3—RELATED PARTY TRANSACTIONS
Management fees Under a written agreement approved by a unanimous vote of the Board of Trustees, the Fund pays an annual management fee of 0.60% of the Fund’s average daily net assets to Dodge & Cox, investment manager of the Fund.
Fund officers and trustees All officers and three of the trustees of the Trust are officers or employees of Dodge & Cox. The Trust pays a fee only to those trustees who are not affiliated with Dodge & Cox.
NOTE 4—INCOME TAX INFORMATION AND DISTRIBUTIONS TO SHAREHOLDERS
A provision for federal income taxes is not required since the Fund intends to qualify as a regulated investment company under Subchapter M of the Internal Revenue Code and distribute all of its taxable income to shareholders. Distributions are determined in accordance with income tax regulations, and such amounts may differ from net investment income and realized gains for financial reporting purposes. Financial reporting records are adjusted for permanent book/tax differences to reflect tax character.
Book/tax differences are primarily due to differing treatments of wash sales, net short-term realized gain (loss) on investments, foreign capital gain taxes, and foreign currency realized gain (loss). At December 31, 2011, the cost of investments for federal income tax purposes was $1,956,795,733.
DODGE & COX GLOBAL STOCK FUND §PAGE 14
NOTES TO FINANCIAL STATEMENTS
Distributions during the years ended December 31, 2011 and 2010 were characterized as follows for federal income tax purposes:
| | | | | | | | |
| | | Year Ended December 31, 2011 | | | Year Ended
December 31, 2010 | |
Ordinary income | | | $35,098,359 | | | | $14,456,000 | |
| | | ($0.149 per share) | | | | ($0.078 per share) | |
| | |
Long-term capital gain | | | $12,720,210 | | | | — | |
| | | ($0.054 per share) | | | | | |
At December 31, 2011, the tax basis components of distributable earnings were as follows:
| | | | |
Unrealized appreciation | | $ | 196,885,135 | |
Unrealized depreciation | | | (302,572,493 | ) |
| | | | |
Net unrealized depreciation | | | (105,687,358 | ) |
Undistributed ordinary income | | | 88,406 | |
Undistributed long-term capital gain | | | 5,076,462 | |
During 2011, the Fund utilized all of its capital loss carryforward, which amounted to $66,447,920.
Under the recently enacted Regulated Investment Company Modernization Act of 2010, capital losses incurred by the Fund after January 1, 2011, will not be subject to expiration. In addition, such losses must be utilized prior to the losses incurred in the years preceding enactment. (The Fund had net capital gains in 2011.)
Fund management has reviewed the tax positions for open periods (three years and four years, respectively, from filing the Fund’s Federal and State tax returns) as applicable to the Fund, and has determined that no provision for income tax is required in the Fund’s financial statements.
NOTE 5—LOAN FACILITIES
Pursuant to an exemptive order issued by the Securities and Exchange Commission (SEC), the Fund may participate in an interfund lending facility (Facility). The Facility allows the Fund to borrow money from or loan money to the Funds. Loans under the Facility are made for temporary or emergency purposes, such as to fund shareholder redemption requests. Interest on borrowings is the average of the current
repurchase agreement rate and the bank loan rate. There was no activity in the Facility during the period.
All the Funds in the Trust participate in a committed credit facility (Line of Credit) with State Street Bank and Trust Company, to be utilized for temporary or emergency purposes to fund shareholder redemptions or for other short-term liquidity purposes. The total amount of the Line of Credit was increased from $200 million to $500 million on June 28, 2011. The maximum amount available to the Fund is $250 million. Each Fund pays an annual commitment fee on its pro-rata portion of the Line of Credit. The Fund’s commitment fee for the year ended December 31, 2011, amounted to $6,269 and is reflected as a Miscellaneous Expense in the Statement of Operations. Interest on borrowings is charged at the prevailing rate. There were no borrowings on the Line of Credit during the period.
NOTE 6—PURCHASES AND SALES OF INVESTMENTS
For the year ended December 31, 2011, purchases and sales of securities, other than short-term securities, aggregated $752,945,865 and $350,352,555, respectively.
NOTE 7—SUBSEQUENT EVENTS
Fund management has determined that no material events or transactions occurred subsequent to December 31, 2011, and through the date of the Fund’s financial statements issuance, which require additional disclosure in the Fund’s financial statements.
PAGE 15 § DODGE & COX GLOBAL STOCK FUND
FINANCIAL HIGHLIGHTS
| | | | | | | | | | | | | | | | |
SELECTED DATA AND RATIOS (for a share outstanding throughout the period) | | Year Ended December 31, | | |
May 1, 2008 (inception)
through December 31, | |
| | | 2011 | | | 2010 | | | 2009 | | | 2008 | |
| | | | |
Net asset value, beginning of period | | $ | 8.90 | | | $ | 7.91 | | | $ | 5.34 | | | | $10.00 | |
Income from investment operations: | | | | | | | | | | | | | | | | |
Net investment income | | | 0.16 | | | | 0.08 | | | | 0.06 | | | | 0.04 | |
Net realized and unrealized gain (loss) | | | (1.18 | ) | | | 0.99 | | | | 2.57 | | | | (4.66 | ) |
| | | | |
Total from investment operations | | | (1.02 | ) | | | 1.07 | | | | 2.63 | | | | (4.62 | ) |
| | | | |
Distributions to shareholders from: | | | | | | | | | | | | | | | | |
Net investment income | | | (0.15 | ) | | | (0.08 | ) | | | (0.06 | ) | | | (0.04 | ) |
Net realized gain | | | (0.05 | ) | | | — | | | | — | | | | — | |
| | | | |
Total distributions | | | (0.20 | ) | | | (0.08 | ) | | | (0.06 | ) | | | (0.04 | ) |
| | | | |
Net asset value, end of period | | $ | 7.68 | | | $ | 8.90 | | | $ | 7.91 | | | | $ 5.34 | |
| | | | |
Total return | | | (11.39 | )% | | | 13.51 | % | | | 49.18 | % | | | (46.21 | )% |
Ratios/supplemental data: | | | | | | | | | | | | | | | | |
Net assets, end of period (millions) | | $ | 1,875 | | | $ | 1,817 | | | | $914 | | | | $468 | |
Ratio of expenses to average net assets | | | 0.66 | % | | | 0.69 | % | | | 0.74 | % | | | 0.87 | %(a) |
Ratio of net investment income to average net assets | | | 1.94 | % | | | 1.19 | % | | | 1.09 | % | | | 1.39 | %(a) |
Portfolio turnover rate | | | 19 | % | | | 14 | % | | | 20 | % | | | 10 | % |
See accompanying Notes to Financial Statements
DODGE & COX GLOBAL STOCK FUND §PAGE 16
REPORT OF INDEPENDENT REGISTERED PUBLIC ACCOUNTING FIRM
To the Trustees of Dodge & Cox Funds and Shareholders of Dodge & Cox Global Stock Fund
In our opinion, the accompanying statement of assets and liabilities, including the portfolio of investments, and the related statements of operations and of changes in net assets and the financial highlights present fairly, in all material respects, the financial position of Dodge & Cox Global Stock Fund (the “Fund”, one of the series constituting Dodge & Cox Funds) at December 31, 2011, the results of its operations for the year then ended, the changes in its net assets for each of the two years in the period then ended and the financial highlights for the periods presented in conformity with accounting principles generally accepted in the United States of America. These financial statements and financial highlights (hereafter referred to as “financial statements”) are the responsibility of the Fund’s management; our responsibility is to express an opinion on these financial statements based on our audits. We conducted our audits of these financial statements in accordance with the standards of the Public Company Accounting Oversight Board (United States). Those standards require that we plan and perform the audit to obtain reasonable assurance about whether the financial statements are free of material misstatement. An audit includes examining, on a test basis, evidence supporting the amounts and disclosures in the financial statements, assessing the accounting principles used and significant estimates made by management, and evaluating the overall financial statement presentation. We believe that our audits, which included confirmation of securities at December 31, 2011, by correspondence with the custodian and brokers, provide a reasonable basis for our opinion.
PricewaterhouseCoopers LLP
San Francisco, California
February 21, 2012
PAGE 17 § DODGE & COX GLOBAL STOCK FUND
SPECIAL 2011 TAX INFORMATION
(unaudited)
The following information is provided pursuant to provisions of the Internal Revenue Code:
In 2011, the Fund elected to pass through to shareholders foreign source income of $47,332,231 and foreign taxes paid of $4,223,097.
The Fund designates up to a maximum of $51,521,900 of its distributions paid to shareholders in 2011 as qualified dividends (treated for federal income tax purposes in the hands of shareholders as taxable at a maximum rate of 15%).
For shareholders that are corporations, the Fund designates 35% of its ordinary dividends paid to shareholders in 2011 as dividends from domestic corporations eligible for the corporate dividends received deduction, provided that the shareholder otherwise satisfies applicable requirements to claim that deduction.
BOARD APPROVAL OF FUNDS’ INVESTMENT MANAGEMENT AGREEMENTS AND MANAGEMENT FEES (unaudited)
The Board of Trustees is responsible for overseeing the performance of the Dodge & Cox Funds’ investment manager and determining whether to continue the Investment Management Agreements between the Funds and Dodge & Cox each year (the “Agreements”). At a meeting of the Board of Trustees of the Trust held on December 14, 2011, the Trustees, by a unanimous vote (including a separate vote of those Trustees who are not “interested persons” (as defined in the Investment Company Act of 1940) (the “Independent Trustees”)), approved the renewal of the Agreements for an additional one-year term through December 31, 2012. During the course of the year, the Board received a wide variety of materials relating to the services provided by Dodge & Cox and the performance of each of the Funds.
INFORMATION RECEIVED
In advance of the meeting, the Board, including each of the Independent Trustees, requested, received, and reviewed materials relating to the Agreements and the services provided by Dodge & Cox. The Independent Trustees retained Morningstar® to prepare an independent
expense and performance summary for each Fund and comparable funds managed by other advisers identified by Morningstar®. The Morningstar® materials included information regarding advisory fee rates, expense ratios, and transfer agency, custodial, and distribution expenses, as well as appropriate performance comparisons to a Fund’s peer group and an index or combination of indices. The Morningstar® materials also included a comparison of expenses of various share classes offered by comparable funds. The materials reviewed by the Board contained information concerning, among other things, Dodge & Cox’s profitability, financial results and condition, advisory fee revenue, and separate account advisory fee schedules. The Board additionally considered the Funds’ brokerage commissions, turnover rates, sales and redemption data for the Funds, and the fact that Dodge & Cox paid for all third party research used in managing the Funds out of its profits, rather than using “soft dollars” generated from portfolio trading commissions. The Board received and reviewed a memorandum summarizing information provided throughout the year regarding Dodge & Cox’s services to the Funds as well as information regarding (i) the different fees, services, costs, and risks associated with separate accounts managed by Dodge & Cox as compared to the Dodge & Cox Funds; (ii) the differences in performance between the Funds and separately managed accounts; and (iii) Fund share subscription and redemption activity. In addition, the Board requested and received additional information regarding attribution analyses and recent Fund performance. Throughout the process of reviewing the services provided by Dodge & Cox and preparing for the meeting, the Independent Trustees found Dodge & Cox to be open, forthright, detailed, and very helpful in answering questions about all issues. The Board received copies of the Agreements and a memorandum from the independent legal counsel to the Independent Trustees discussing the factors generally regarded as appropriate to consider in evaluating advisory arrangements. The Trust’s Contract Review Committee, consisting solely of Independent Trustees, met with the independent legal counsel on November 3, 2011, and again on December 14, 2011, to discuss whether to renew the Agreements. The Board, including the Independent
DODGE & COX GLOBAL STOCK FUND §PAGE 18
Trustees, subsequently concluded that the existing Agreements are fair and reasonable and voted to approve the Agreements.
In considering the Agreements, the Board, including the Independent Trustees, did not identify any single factor or particular information as all-important or controlling. In reaching the decision to approve the Agreements, the Board considered several factors, discussed below, to be key factors and reached the conclusions described below.
NATURE, QUALITY, AND EXTENT OF THE SERVICES
The Board considered that Dodge & Cox provides a wide range of services to the Funds in addition to portfolio management and that the quality of these services has been excellent in all respects. The extensive nature of services provided by Dodge & Cox has been documented in materials provided to the Board and in presentations made to the Board throughout the year. In particular, the Board considered the nature, quality, and extent of portfolio management, administrative, and shareholder services performed by Dodge & Cox. With regard to portfolio management services, the Board considered Dodge & Cox’s established long-term history of care and conscientiousness in the management of the Funds; its demonstrated consistency in investment approach and depth; the background and experience of the Dodge & Cox Investment Policy Committee, International Investment Policy Committee, Global Investment Policy Committee, Fixed Income Investment Policy Committee, and research analysts responsible for managing the Funds; its methods for assessing the regulatory and investment climate in various jurisdictions; Dodge & Cox’s overall high level of attention to its core investment management function; and its commitment to the Funds and their shareholders.
In the area of administrative and shareholder services, the Board considered the excellent quality of Dodge & Cox’s work in areas such as compliance, legal services, trading, proxy voting, oversight of the Funds’ transfer agent and custodian, tax compliance, and shareholder communication through its web site and other means. The Board also noted Dodge & Cox’s
diligent disclosure policy, its favorable compliance record and its reputation as a trusted, shareholder-friendly mutual fund family.
In addition, the Board considered that Dodge & Cox manages approximately $112 billion in Fund assets with fewer professionals than most comparable funds, and that on average these professionals have more experience and longer tenure than investment professionals at comparable funds. The Board also noted that Dodge & Cox is an investment research-oriented firm with no other business endeavors to distract management’s attention from its research efforts, and that its investment professionals adhere to a consistent investment approach across the Funds. The Board further considered the Funds’ favorable stewardship and Gold ratings by Morningstar®. The Board concluded that it was satisfied with the nature, extent, and quality of investment management and other services provided to the Funds by Dodge & Cox.
INVESTMENT PERFORMANCE
The Board considered short-term and long-term investment performance for each Fund (including periods of outperformance or underperformance) as compared to both relevant indices and the performance of such Fund’s peer group. In light of recent market volatility, the Board also reviewed recent performance in the context of long-term investment goals. The Board noted that, although the Fund has underperformed in the short term, its three-year returns are favorable relative to its peers and benchmark index. The Board determined after extensive review and inquiry that Dodge & Cox’s historic, long-term, team-oriented bottom up investment approach remains consistent and that Dodge & Cox continues to be distinguished by its integrity, thoroughness, and independence.
The Board noted that longer-term comparisons demonstrated favorable performance in comparison to peer group funds and was in keeping with the stated goals in the Funds’ Prospectus. The Board considered that the performance of the Funds is the result of a team-oriented investment management process that emphasizes a long-term investment horizon, comprehensive independent research, price discipline, and focus. The Board also considered that the investment performance delivered by
PAGE 19 § DODGE & COX GLOBAL STOCK FUND
Dodge & Cox to the Funds appeared to be consistent with the relevant performance delivered for other (non-fund) clients of Dodge & Cox. The Board concluded that Dodge & Cox has delivered favorable long-term performance for Fund investors consistent with the long-term investment strategies being pursued by the Funds.
COSTS AND ANCILLARY BENEFITS
Costs of Services to Funds: Fees and Expenses. The Board considered each Fund’s management fee rate and expense ratio relative to similar mutual funds and relative to management fees charged by Dodge & Cox to other clients. In particular, the Board considered that the Funds continue to be substantially below their peer group median in expense ratios and management fee rates and that many media and industry reports specifically comment on the low expense ratios of the Funds, which have been a defining characteristic of the Funds for many years. The Board also evaluated the operating structures of the Funds and Dodge & Cox, noting that Dodge & Cox does not charge front-end sales commissions or distribution fees and bears, among other things, third party research and distribution-related costs, reimbursement for recordkeeping and administrative costs to third-party retirement plan administrators, and administrative and office overhead. The Board noted that expenses are well below industry averages. The Board also considered that the Funds receive numerous administrative, regulatory compliance, and shareholder support services from Dodge & Cox without any additional administrative fee and the fact that the Funds have relatively low transaction costs and portfolio turnover rates. The Board reviewed Morningstar® data showing that the few peer group funds with lower expense ratios often have other share classes with significantly higher expense ratios.
In comparing the range of services provided to the Funds under the Agreements to the services Dodge & Cox provides under its separate advisory client agreements, the Board determined that part of the difference is due to higher risks as well as legal and management costs of sponsoring the Funds and noted that separate accounts incur other expenses that should be considered when comparing Fund expenses to separate account expenses. In light of that, the greater risks and regulatory burdens
associated with sponsoring a high profile mutual fund business, and the fact that these are different lines of business, there is reasonable justification for differences in fee rates charged between the two. The Board further noted that, with respect to non-U.S. funds sponsored and managed by Dodge & Cox that are comparable to the Funds in many respects, the fee rates charged by Dodge & Cox are the same as or higher than the fee rates charged to the Funds. The Board concluded that costs incurred by the Funds for the services they receive (including the management fee paid to Dodge & Cox) are reasonable and that the fees are acceptable based upon the qualifications, experience, reputation, and performance of Dodge & Cox and the low overall expense ratios of the Funds.
Profitability and Costs of Services to Dodge & Cox; “Fall-out” Benefits. The Board reviewed reports of Dodge & Cox’s financial position, profitability, and estimated overall value, and considered Dodge & Cox’s overall profitability within its context as a private, employee-owned S-Corporation and relative to the favorable services provided. The Board noted that net revenues for 2011 are projected to increase from 2010. The Board noted in particular that Dodge & Cox’s profits are not generated by high fee rates, but reflect an extraordinarily streamlined, efficient, and focused business approach toward investment management. The Board recognized the importance of Dodge & Cox’s profitability—which is derived solely from management fees and does not include other business ventures—to maintain its independence, stability, company culture and ethics, and management continuity. The Board also considered that the compensation/profit structure at Dodge & Cox is vital for remaining independent and facilitating retention of its management and investment professionals.
The Board considered potential “fall-out” benefits (including the receipt of research from unaffiliated brokers) that Dodge & Cox might receive as a result of its association with the Funds and determined that they are not significant. The Board also noted the extent of additional administrative services performed by Dodge & Cox for the Funds, and that the magnitude of costs and risks borne by Dodge & Cox in rendering advisory services to the Funds (including risks in the regulatory
DODGE & COX GLOBAL STOCK FUND §PAGE 20
compliance, securities valuation, and investment management processes) are continuing to increase. The Board concluded that the profitability of Dodge & Cox’s relationship with the Funds (including fall-out benefits) was fair and reasonable.
THE BENEFIT OF ECONOMIES OF SCALE
The Board considered whether there have been economies of scale with respect to the management of each Fund, whether the Funds have appropriately benefited from any economies of scale, and whether the management fee rate is reasonable in relation to the Fund assets and any economies of scale that may exist. In the Board’s view, any consideration of economies of scale must take account of the Funds’ low fee structure and the considerable efficiencies of the Funds’ organization and fee structure that has been realized by shareholders at the outset of their investment (i.e., from the first dollar). The Board noted that Dodge & Cox has shared economies of scale by adding or enhancing services to the Funds over time, and that the internal costs of providing investment management, up-to-date technology, administrative, and compliance services to the Funds are continuing to increase. For example, Dodge & Cox has increased its global research staff and investment resources over the years to address the increased complexity of investing in multinational and non-U.S. companies. In addition, Dodge & Cox has made substantial expenditures in other staff and infrastructure to enable it to integrate credit and equity analyses and to be able to implement its strategy in a more effective and secure manner. The Board determined that the Funds provide access by small investors to high quality investment management at a relatively low cost. The Board’s decision to renew the Agreements was made after consideration of economies of scale and review of peer group fund expense ratios and historical expense ratio patterns for the Funds. The Board concluded that the current Dodge & Cox fee structure is fair and reasonable and adequately shares economies of scale that may exist.
CONCLUSION
Based on their evaluation of all material factors and assisted by the advice of independent legal counsel to the
Independent Trustees, the Board, including the Independent Trustees, concluded that the advisory fee structure was fair and reasonable, that each Fund was paying a competitive fee for the services provided, that the scope and quality of Dodge & Cox’s services has provided substantial value for Fund shareholders over the long term, and that approval of the Agreements was in the best interests of each Fund and its shareholders.
FUND HOLDINGS
The Fund provides a complete list of its holdings four times each fiscal year, as of the end of each quarter. The Fund files the lists with the Securities and Exchange Commission (SEC) on Form N-CSR (second and fourth quarters) and Form N-Q (first and third quarters). Shareholders may view the Fund’s Forms N-CSR and N-Q on the SEC’s website at www.sec.gov. Forms N-CSR and N-Q may also be reviewed and copied at the SEC’s Public Reference Room in Washington, DC. Information regarding the operations of the Public Reference Room may be obtained by calling 1-202-942-8090 (direct) or 1-800-732-0330 (general SEC number). A complete list of the Fund’s quarter-end holdings is also available at www.dodgeandcox.com on or about 15 days following each quarter end and remains available on the website until the list is updated in the subsequent quarter.
PROXY VOTING
For a free copy of the Fund’s proxy voting policies and procedures, please call 1-800-621-3979, visit the Fund’s website at www.dodgeandcox.com, or visit the SEC’s website at www.sec.gov. Information regarding how the Fund voted proxies relating to portfolio securities during the most recent 12-month period ending June 30 is also available at www.dodgeandcox.com or at www.sec.gov.
HOUSEHOLD MAILINGS
The Fund routinely mails shareholder reports and summary prospectuses to shareholders and, on occasion, proxy statements. In order to reduce the volume of mail, when possible, only one copy of these documents will be sent to shareholders who are part of the same family and share the same residential address.
If you have a direct account with the Funds and you do not want the mailing of shareholder reports and summary prospectuses combined with other members in your household, contact the Funds at 1-800-621-3979. Your request will be implemented within 30 days.
PAGE 21 § DODGE & COX GLOBAL STOCK FUND
[THIS PAGE INTENTIONALLY LEFT BLANK]
DODGE & COX GLOBAL STOCK FUND §PAGE 22
DODGE & COX FUNDS—EXECUTIVE OFFICER & TRUSTEE INFORMATION
| | | | | | |
Name (Age) and
Address* | | Position with Trust (Year of Election or
Appointment) | | Principal Occupation During Past 5 Years | | Other Directorships Held by Trustees |
| INTERESTED TRUSTEES AND OFFICERS |
| Kenneth E. Olivier (59) | | Chairman, President, and Trustee (Trustee since 2005) | | Chairman (since March 2011), Chief Executive Officer (since 2010), President (until March 2011), and Director of Dodge & Cox; Portfolio Manager and member of Investment Policy Committee (IPC) | | — |
| Dana M. Emery (50) | | Senior Vice President and Trustee (Trustee since 1993) | | Co-President (since March 2011), Executive Vice President (until March 2011), and Director of Dodge & Cox; Director of Fixed Income, Portfolio Manager, and member of Fixed Income Investment Policy Committee (FIIPC) | | — |
| John A. Gunn (68) | | Trustee (Trustee since 1985) | | Chairman Emeritus (since March 2011), Chairman (2007-March 2011), Chief Executive Officer (2007-2010), and Director of Dodge & Cox; Portfolio Manager and member of IPC, Global Investment Policy Committee (GIPC) (since 2008), International Investment Policy Committee (IIPC), and FIIPC (until 2008) | | — |
| Charles F. Pohl (53) | | Senior Vice President (Officer since 2004) | | Co-President (since March 2011), Senior Vice President (until March 2011), and Director of Dodge & Cox; Chief Investment Officer (since 2007), Director of Credit Research, Portfolio Manager, Investment Analyst, and member of IPC, GIPC (since 2008), IIPC (since 2007), and FIIPC | | — |
| Diana S. Strandberg (52) | | Senior Vice President (Officer since 2006) | | Senior Vice President (since May 2011), Vice President (until May 2011), and Director (since May 2011) of Dodge & Cox; Director of International Equity (since 2009), Portfolio Manager, Investment Analyst, and member of IPC, GIPC (since 2008), and IIPC | | — |
| David H. Longhurst (54) | | Treasurer (Officer since 2006) | | Vice President (since 2008) and Assistant Treasurer (since 2007) of Dodge & Cox; Fund Administration and Accounting Senior Manager (until 2007) | | — |
| Thomas M. Mistele (58) | | Secretary (Officer since 1998) | | Chief Operating Officer, Director, Secretary, Senior Counsel (since May 2011), and General Counsel (until May 2011) of Dodge & Cox | | — |
| Katherine M. Primas (36) | | Chief Compliance Officer (Officer since 2009) | | Chief Compliance Officer of Dodge & Cox (since 2008) and Associate Chief Compliance Officer of Dodge & Cox (until 2008) | | — |
| INDEPENDENT TRUSTEES |
| William F. Ausfahl (71) | | Trustee (Since 2002) | | CFO, The Clorox Co. (1982-1997); Director, The Clorox Co. (1984-1997) | | — |
| L. Dale Crandall (70) | | Trustee (Since 1999) | | President, Kaiser Foundation Health Plan, Inc. and Kaiser Foundation Hospitals (2000-2002); Senior Vice President—Finance and Administration & CFO, Kaiser Foundation Health Plan, Inc. and Kaiser Foundation Hospitals (1998-2000) | | Director, Ansell Limited (medical equipment and supplies) (2002-present); Director, Coventry Health Care, Inc. (managed health care) (2004-present); Bridgeport Education, Inc. (education services) (2008 to present) |
| Thomas A. Larsen (62) | | Trustee (Since 2002) | | Partner of Arnold & Porter LLP (law firm) (since 2012); Director of Howard, Rice, Nemerovski, Canady, Falk & Rabkin (1977-2011) | | — |
| Ann Mather (51) | | Trustee (Since 2011) | | CFO, Pixar Animation Studios (1999-2004) | | Director, Google, Inc. (internet information services) (2005-present); Director, Glu Mobile, Inc. (multimedia software) (2005-present); Director, Netflix, Inc. (video services) (2010-present); Director, MoneyGram International, Inc. (business services) (2010-present) |
| Robert B. Morris III (59) | | Trustee (Since 2011) | | Advisory Director, Presidio Financial Partners (Since 2005) | | — |
| John B. Taylor (65) | | Trustee (Since 2005) (and 1998-2001) | | Professor of Economics, Stanford University; Senior Fellow, Hoover Institution; Under Secretary for International Affairs, United States Treasury (2001-2005) | | — |
| * | | The address for each Officer and Trustee is 555 California Street, 40th Floor, San Francisco, California 94104. Each Officer and Trustee oversees all five series in the Dodge & Cox Funds complex and serves for an indefinite term. |
Additional information about the Trust’s Trustees and Officers is available in the Trust’s Statement of Additional Information (SAI). You can get a free copy of the SAI by visiting the Funds’ website at www.dodgeandcox.com or calling
1-800-621-3979.
PAGE 23 § DODGE & COX GLOBAL STOCK FUND
| | | | |
| | | | |
www.dodgeandcox.com
For Fund literature, transactions, and account information, please visit the Funds’ website.
or write or call:
DODGE & COX FUNDS
c/o Boston Financial Data Services
P.O. Box 8422
Boston, Massachusetts 02266-8422
(800) 621-3979
INVESTMENT MANAGER
Dodge & Cox
555 California Street, 40th Floor
San Francisco, California 94104
(415) 981-1710
This report is submitted for the general information of the shareholders of the Fund. The report is not authorized for distribution to prospective investors in the Fund unless it is accompanied by a current prospectus.
This report reflects our views, opinions, and portfolio holdings as of December 31, 2011, the end of the reporting period. Any such views are subject to change at any time based upon market or other conditions and Dodge & Cox disclaims any responsibility to update such views. These views may not be relied on as investment advice and, because investment decisions for a Dodge & Cox Fund are based on numerous factors, may not be relied on as an indication of trading intent on behalf of any Dodge & Cox Fund.
12/11 ISF AR Printed on recycled paper
Annual Report
December 31, 2011
International Stock Fund
ESTABLISHED 2001
TICKER: DODFX
A LETTER FROM THE CHAIRMAN
Our experience over 80 years has taught us that the best long-term investment opportunities often arise in periods of trepidation. While it is impossible to time market cycles with precision, we believe that building strong long-term returns rests on two key tenets of our investment approach: a willingness to revisit and retest our thinking as prices and conditions change, and the fortitude to stay the course, even in periods of volatility or underperformance.
A Year Defined by Aversion to Risk and Extreme Volatility
Two interconnected issues weighed heavily on global financial markets in 2011: uncertainty about the future of the Eurozone and the challenges to global economic growth posed by high debt levels. Investors responded by turning toward safety and security. A regular feature of this market environment was the “risk-on/risk-off” trade. Markets and securities with widely divergent fundamental risk factors traded in tandem based on whether short-term investor confidence improved (risk-on) or deteriorated (risk-off) on that day—often resulting in one day’s move being retraced the following day.
The year-over-year effect on returns was strong performance from investments considered less risky (e.g., 30-year U.S. Treasury securities returned 36% for the year), negative returns from world equities (down 6%), and wide divergence within asset classes between investments viewed as more safe and those viewed as less. Volatility levels were significantly elevated, especially during a gut-wrenching four days of daily 4% price moves in major equity markets in early August. In this environment, our Funds’ strategies suffered, with each underperforming its market benchmark for the year. For a more detailed discussion of each Fund’s 2011 performance, please read their Annual Letters.
Importance of Fundamental Research
In fear-driven markets, when prices fall across the board, bottom-up research is more important than ever. At Dodge & Cox, our goal is to build diversified
portfolios of individual securities—with attractive fundamentals at low valuations—based on our analysts’ intensive research and the depth of knowledge and experience of our portfolio managers.
Through the team-based decision-making of our seasoned investment professionals, we evaluate the risks, merits, and trade-offs of our investment decisions. Our analysts’ detailed knowledge about our holdings and our investment universe enables us to quickly assess a security’s long-term return potential following a decline in valuation—and take advantage of those opportunities where short-term valuations do not reflect the security’s long-term potential.
Opportunities Ahead
Starting valuation is an important component of long-term returns, and as significant pessimism about the future has driven down equity prices, we have been finding attractive opportunities around the world. Today, global equity markets are trading at 10 to 12 times forward estimated earnings, and many companies have strong balance sheets and opportunities for long-term global growth. Corporate bonds are also very attractive in this environment. Their yield premiums are at high levels now, and we’re seeing interesting opportunities in companies across a range of industries.
Over Dodge & Cox’s 80-year history, our long-term, value-oriented approach has withstood many periods of uncertainty. All of our Fund portfolios are well diversified and thoughtfully constructed, giving us optimism for the future. Thank you for your continued confidence in our firm. As always, we welcome your comments and questions.
For the Board of Trustees,

Kenneth E. Olivier,
Chairman and President
January 31, 2012
PAGE 1 § DODGE & COX INTERNATIONAL STOCK FUND
TO OUR SHAREHOLDERS
The Dodge & Cox International Stock Fund had a total return of 4.2% for the fourth quarter of 2011, compared to 3.3% for the MSCI EAFE (Europe, Australasia, Far East) Index. For 2011, the Fund had a total return of –16.0%, compared to –12.1% for the MSCI EAFE. At year end, the Fund had net assets of $35.9 billion with a cash position of 1.4%.
MARKET COMMENTARY
During 2011, markets around the world experienced high volatility. The majority of developed and emerging equity markets declined significantly in both U.S.-dollar and local currency terms. Emerging markets (down 18% in U.S. dollars) and the Eurozone (down 17% in U.S. dollars) were particularly weak. The negative returns for the year reflect investor pessimism about a number of macroeconomic issues, especially the European sovereign debt crisis, unemployment in the United States, and slower economic growth worldwide. Short-term market movements are impossible to predict and markets could continue to be highly volatile. Thus, we encourage shareholders to remain focused on the long term.
INVESTMENT STRATEGY
Investment Courage in a Fear-Driven Market
We are often asked how we can be long-term investors amidst such uncertainty about the global economy. The answer is straightforward: the combination of low valuation and strong company cash flows provides a compelling foundation for long-term returns.
Valuations are at exceptionally low levels, pricing in significant pessimism about the outlook. At year end, the MSCI EAFE was trading at 12 times trailing earnings, compared to the 42-year average of 19 times trailing earnings, and had a dividend yield of 3.9%, compared to an average of 2.9% over the same period. Our analysis of the data and experience over 80 years of investing confirm that starting valuation is the most significant driver of long-term equity returns. Low valuations are strongly associated with attractive ten-year returns, high valuations the opposite, because valuation already embeds investor expectations about the future. Historically, it has never been the case that ten-year MSCI EAFE returns were negative from a valuation starting point as low as we see in the market today.
Over the past 42 years, earnings for the MSCI EAFE have grown at 5% per year on average, which is in line with nominal GDP growth for the same period. We believe this is a reasonable expectation for the future. In addition, companies are generally much stronger today than at the outset of the financial crisis. Managements have reduced leverage and improved margins. Balance sheets and cash flows are strong. Thus, corporate prospects appear quite attractive.
Markets could continue to be highly volatile. While this can be unsettling, volatility can create significant opportunity for patient investors like ourselves. Our task then is to continue to do what our firm has done for over 80 years: search the world for attractively valued companies in which we want to become long-term owners given their potential for attractive earnings and cash flow growth. With the overall market so inexpensive today, we see numerous opportunities to invest in companies with strong competitive positions and capable management teams focused on building value for long-term owners.
Long-Term Opportunities in Negative Headlines
On the heels of the Japanese earthquake in March, the Fund started a position in Nidec,(a) a Japan-based global leader in small electric motors and components. Its products are used in a variety of end markets, from computers to automobiles. We had been researching Nidec for at least a decade. Our visits with management, competitors, and customers supported our view of the company’s proactive management, focus on profitability, dominant market positions, and the increasing applications for electric motors. However, the company traded at a premium valuation. Because we had accumulated significant knowledge about the company through our ongoing research, we were able to build a position as its price declined.
The depth of concern about the sovereign debt crisis has depressed the valuations of many European companies to historically low levels. The MSCI Europe Index was trading at 9.8 times forward earnings with a dividend yield of 4.2% at year end. In particular, we found compelling investment opportunities in multinational companies
DODGE & COX INTERNATIONAL STOCK FUND §PAGE 2
domiciled in Europe. As prices fell, we added meaningfully to existing holdings, such as Nokia, Philips Electronics, Roche, Royal Dutch Shell, and Sanofi. The Fund also initiated a position in Unilever, a personal care and food products company. Though based in Europe, over half of Unilever’s sales come from the emerging markets; management expects emerging markets will eventually account for 70% of the business. Unilever has tremendous expertise in these markets derived from several decades of experience building out distribution networks, catering to local preferences, and competing against local and multinational companies.
Investors’ concerns about the European sovereign debt crisis are centered on the European financial services companies. The region’s banks were down 26% in 2011 and traded at around 70% of tangible book value, a historically low multiple reflecting significant skepticism about their capital levels and long-term viability. At year end, 12.7% of the Fund was invested in an array of financial services companies in Western Europe and the United Kingdom (compared to 11.5% for the MSCI EAFE). A small portion—less than 2%—was invested in two banks in the Eurozone periphery: UniCredit in Italy and Banco Santander in Spain.
Our equity and fixed income investment teams devote significant time and resources digging into the health of bank balance sheets, the stance of regulators, and funding sources and costs, among the many issues we continue to scrutinize. In light of worsening events, we have revisited our positioning with a clean sheet of paper and asked ourselves the question, “If we did not already own these banks, would we start a position today?” Among the lessons that were reinforced from the 2008 financial crisis was the importance of incorporating “clean sheet of paper” thinking about the long-term prospects, while vigilantly monitoring sources of short-term liquidity and capital as stock prices fall and investor concerns rise.
As a result of our analysis, the Fund maintained holdings in both UniCredit and Banco Santander. UniCredit is raising capital that we believe will place it among the best capitalized European banks, has a low valuation, and has a management team that is working to improve operations. Banco Santander has global and growing retail banking businesses outside of Spain.
However, despite being multinational banks, they have large exposures to economic, political, and regulatory concerns in their home markets. We continue to research and stress test the assumptions underlying our evaluation of their investment merits and risks.
The Fund also added to a handful of financial services holdings in Europe with limited exposure to the periphery, such as Barclays, Credit Suisse, and HSBC. These three holdings are leading global franchises trading at low valuations with strong levels of capital (e.g., Common Equity Tier 1 Capital Ratios(b) are all well above current regulatory minimums and at the high end of their peer group). We think all three are positioned to meet proposed regulatory requirements for liquidity and capital. Moreover, each is led by a management team that has successfully navigated challenging market conditions in the past. We believe that the UK and Switzerland have favorable political and regulatory backdrops as the authorities have the latitude to provide liquidity and support, and have done so.
Staying the Course in Health Care and TMT
The overall portfolio is broadly diversified, however there are areas of overweight and underweight relative to the benchmark as a result of where we see opportunities on a bottom-up basis. We continue to find investment opportunity in the Health Care and the Technology, Media, and Telecom Services (TMT) sectors, and thus the Fund was overweight in those areas in relation to the MSCI EAFE at year end, with 16.6% versus 10.0% and 33.1% versus 12.5%, respectively. Fund shareholders may recall that we were adding to Pharmaceuticals over the past few years as pessimism about innovation, regulatory reform, and competition weighed on valuations. We were adding to mobile telecom services as valuations were depressed by concerns about regulatory changes, technology investments, and the transition in consumer usage from traditional voice and texting services to mobile broadband services. These companies generate significant free cash flow while they deploy strategies to address mobile data growth. Valuations are still attractive and we remain optimistic about the long-term investment potential for the Fund’s holdings in Health Care and TMT.
PAGE 3 § DODGE & COX INTERNATIONAL STOCK FUND
IN CLOSING
Over Dodge & Cox’s 80-year history, our long-term, value-oriented, bottom-up investment approach has withstood many periods of uncertainty and delivered strong long-term returns for shareholders. We acknowledge the current challenges around the world. However, global equity markets are at compelling valuations which adequately reflect present concerns in our opinion. Thus, we are enthusiastic about the prospects for equities in general, and especially the holdings in the Fund, over the long run. Since short-term market movements are impossible to predict, and markets could continue to be volatile, we encourage shareholders to remain focused on the long term.
Thank you for your continued confidence in our firm. As always, we welcome your comments and questions.
For the Board of Trustees,
| | |
| |  |
Kenneth E. Olivier, Chairman and President | | Diana S. Strandberg, Senior Vice President |
January 31, 2012
| (a) | We use these examples to illustrate our investment process, not to imply that we think they are more attractive than the Fund’s other holdings. |
| (b) | The Tier 1 Capital Ratio is the ratio of a bank’s core equity capital to its total risk-weighted assets. |
ANNUAL PERFORMANCE REVIEW
The Fund underperformed the MSCI EAFE by 3.8 percentage points in 2011.
Key Detractors from Relative Results
| | § | | The Fund’s holdings in emerging markets (down 23%) hurt overall results. Cemex (down 48%), Naspers (down 25%), and the Fund’s emerging market Financials (discussed below) were especially weak. | |
| | § | | The Fund’s holdings and overweight position in the Information Technology sector (down 28% versus down 19% for the MSCI EAFE sector) and average overweight position in the Consumer Electronics sub-industry (3% compared to 1% for the MSCI EAFE sub-industry), a weak area of the market (down 40%), detracted from results. Nintendo (down 53%), Nokia (down 51%), Sony (down 50%), Hewlett-Packard (down 42% from date of purchase), and LG Electronics (down 37%) performed poorly. | |
| | § | | The Fund’s holdings in the Financials sector (down 27% versus down 22% for the MSCI EAFE sector) hindered performance, especially emerging market and selected European financial holdings. Erste (down 62%), UniCredit (down 59%), Yapi Kredi (down 55%), and Credit Suisse (down 40%) were particularly weak. | |
| | § | | The Fund’s underweight position and selection of holdings in the Consumer Staples sector (up 1% compared to up 4% for the MSCI EAFE sector), the second-strongest performing sector of the market, hurt results. | |
| | § | | Additional detractors included Lafarge (down 46%) and Philips Electronics (down 29%) | |
Key Contributors to Relative Results
| | § | | The Fund’s overweight position and holdings in the Health Care sector (up 10% compared to up 6% for the MSCI EAFE sector), the best performing sector of the market, contributed to results. GlaxoSmithKline (up 23%), Roche (up 20%), and Sanofi (up 19%) performed well. | |
| | § | | The Fund’s average underweight position in the Metals & Mining industry (2% compared to 6% for the MSCI EAFE industry), a weak area of the market (down 30%), contributed to results. | |
| | § | | Additional contributors included Arkema (up 52% to date of sale), News Corp. (up 23%), Diageo (up 22%), Royal Dutch Shell (up 14%), and Vodafone (up 9%). | |
DODGE & COX INTERNATIONAL STOCK FUND §PAGE 4
KEY CHARACTERISTICS OF DODGE & COX
Independent Organization
Dodge & Cox is one of the largest privately owned investment managers in the world. We remain committed to independence, with a goal of providing the highest quality investment management service to our existing clients.
80 Years of Investment Experience
Dodge & Cox was founded in 1930. We have a stable and well-qualified team of investment professionals, most of whom have spent their entire careers at Dodge & Cox.
Experienced Investment Team
The International Investment Policy Committee, which is the decision-making body for the International Stock Fund, is an eight-member committee with an average tenure at Dodge & Cox of 23 years.
One Business with a Single Research Office
Dodge & Cox manages domestic, international, and global equity, fixed income, and balanced investments, operating from one office in San Francisco.
Consistent Investment Approach
Our team decision-making process involves thorough, bottom-up fundamental analysis of each investment.
Long-Term Focus and Low Expenses
We invest with a three- to five-year investment horizon, which has historically resulted in low turnover relative to our peers. We manage Funds that maintain low expense ratios.
PAGE 5 § DODGE & COX INTERNATIONAL STOCK FUND
GROWTH OF $10,000 SINCE INCEPTION
FOR AN INVESTMENT MADE ON DECEMBER 31, 2001
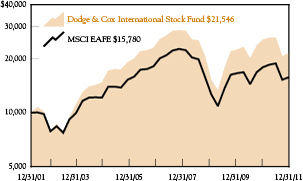
AVERAGE ANNUAL TOTAL RETURN
FOR PERIODS ENDED DECEMBER 31, 2011
| | | | | | | | | | | | | | | | |
| | | 1 Year | | | 3 Years | | | 5 Years | | | 10 Years | |
Dodge & Cox International
Stock Fund | | | -15.97 | % | | | 12.10 | % | | | -3.45 | % | | | 7.99 | % |
MSCI EAFE | | | -12.13 | | | | 7.65 | | | | -4.72 | | | | 4.67 | |
Returns represent past performance and do not guarantee future results. Investment return and share price will fluctuate with market conditions, and investors may have a gain or loss when shares are sold. Fund performance changes over time and currently may be significantly lower than stated. Performance is updated and published
monthly. Visit the Fund’s website at www.dodgeandcox.com or call 1-800-621-3979 for current performance figures.
The Fund’s total returns include the reinvestment of dividend and capital gain distributions, but have not been adjusted for any income taxes payable by shareholders on these distributions or on Fund share redemptions. Index returns include dividends but, unlike Fund returns, do not reflect fees or expenses. The MSCI EAFE (Europe, Australasia, Far East) Index is a broad-based, unmanaged equity market index aggregated from 22 developed market country indices, excluding the United States. MSCI makes no express or implied warranties or representations and shall have no liability whatsoever with respect to any MSCI data contained herein. The MSCI data may not be further redistributed or used as a basis for other indices or any securities or financial products. This report is not approved, reviewed, or produced by MSCI.
MSCI EAFE is a service mark of MSCI Barra.
Risks: The Fund is subject to stock market risk, meaning stocks in the Fund may decline in value for extended periods due to the financial prospects of individual companies, or due to general market and economic conditions. Investing in non-U.S. securities may entail risk due to foreign economic and political developments; this risk may be increased when investing in emerging markets. Please read the prospectus and summary prospectus for specific details regarding the Fund’s risk profile.
FUND EXPENSE EXAMPLE
As a Fund shareholder, you incur ongoing Fund costs, including management fees and other Fund expenses. All mutual funds have ongoing costs, sometimes referred to as operating expenses. The following example shows ongoing costs of investing in the Fund and can help you understand these costs and compare them with those of other mutual funds. The example assumes a $1,000 investment held for the six months indicated.
ACTUAL EXPENSES
The first line of the table below provides information about actual account values and expenses based on the Fund’s actual returns. You may use the information in this line, together with your account balance, to estimate the expenses that you paid over the period. Simply divide your account value by $1,000 (for example, an $8,600 account value divided by $1,000 = 8.6), then multiply the result by the number in the first line under the heading “Expenses Paid During Period” to estimate the expenses you paid on your account during this period.
HYPOTHETICAL EXAMPLE FOR COMPARISON WITH OTHER MUTUAL FUNDS
Information on the second line of the table can help you compare ongoing costs of investing in the Fund with those of other mutual funds. This information may not be used to estimate the actual ending account balance or expenses you paid during the period. The hypothetical “Ending Account Value” is based on the actual expense ratio of the Fund and an assumed 5% annual rate of return before expenses (not the Fund’s actual return). The amount under the heading “Expense Paid During the Period” shows the hypothetical expenses your account would have incurred under this scenario. You can compare this figure with the 5% hypothetical examples that appear in shareholder reports of other mutual funds.
| | | | | | | | | | | | |
Six Months Ended December 31, 2011 | | Beginning Account Value
7/1/2011 | | | Ending Account Value
12/31/2011 | | | Expenses Paid During Period* | |
Based on Actual Fund Return | | $ | 1,000.00 | | | $ | 815.80 | | | $ | 2.94 | |
Based on Hypothetical 5% Yearly Return | | | 1,000.00 | | | | 1,021.96 | | | | 3.28 | |
| * | Expenses are equal to the Fund’s annualized expense ratio of 0.64%, multiplied by the average account value over the period, multiplied by 184/365 (to reflect the one-half year period). |
The expenses shown in the table highlight ongoing costs only and do not reflect any transactional fees or account maintenance fees. While other mutual funds may charge such fees, please note that the Fund does not charge transaction fees (e.g., redemption fees, sales loads) or universal account maintenance fees (e.g., small account fees).
DODGE & COX INTERNATIONAL STOCK FUND §PAGE 6
| | | | |
| FUND INFORMATION | | | December 31, 2011 | |
| | | | |
| GENERAL INFORMATION | | | |
Net Asset Value Per Share | | | $29.24 | |
Total Net Assets (billions) | | | $35.9 | |
2010 Expense Ratio(a) | | | 0.65% | |
2011 Expense Ratio | | | 0.64% | |
Portfolio Turnover Rate | | | 16% | |
30-Day SEC Yield(b) | | | 2.74% | |
Fund Inception | | | 2001 | |
No sales charges or distribution fees | | | | |
Investment Manager: Dodge & Cox, San Francisco. Managed by the International Investment Policy Committee, whose eight members’ average tenure at Dodge & Cox is 23 years.
| | | | | | | | |
| PORTFOLIO CHARACTERISTICS | | Fund | | | MSCI
EAFE | |
Number of Stocks | | | 95 | | | | 925 | |
Median Market Capitalization (billions) | | | $13 | | | | $6 | |
Weighted Average Market
Capitalization (billions) | | | $56 | | | | $47 | |
Price-to-Earnings Ratio(c) | | | 9.7x | | | | 10.3x | |
Countries Represented | | | 25 | | | | 22 | |
Emerging Markets (Brazil, China, India, Indonesia, Mexico, South Africa, South Korea, Thailand, Turkey, United Arab Emirates) | | | 19.2% | | | | 0.0% | |
| | | | |
| TEN LARGEST HOLDINGS (%)(d) | | Fund | |
Roche Holding AG (Switzerland) | | | 3.8 | |
Sanofi (France) | | | 3.7 | |
GlaxoSmithKline PLC (United Kingdom) | | | 3.5 | |
Naspers, Ltd. (South Africa) | | | 3.3 | |
Vodafone Group PLC (United Kingdom) | | | 3.3 | |
Novartis AG (Switzerland) | | | 2.8 | |
Bayer AG (Germany) | | | 2.8 | |
HSBC Holdings PLC (United Kingdom) | | | 2.3 | |
Mitsubishi Electric Corp. (Japan) | | | 2.3 | |
Koninklijke Philips Electronics NV (Netherlands) | | | 2.3 | |
ASSET ALLOCATION
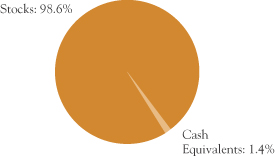
| | | | | | | | |
| REGION DIVERSIFICATION (%)(e) | | Fund | | | MSCI
EAFE | |
Europe (excluding United Kingdom) | | | 42.9 | | | | 41.3 | |
United Kingdom | | | 18.2 | | | | 23.3 | |
Japan | | | 14.1 | | | | 21.6 | |
Africa/Middle East | | | 7.0 | | | | 0.6 | |
Latin America | | | 6.1 | | | | 0.0 | |
Pacific (excluding Japan) | | | 5.7 | | | | 13.2 | |
United States | | | 4.6 | | | | 0.0 | |
| | | | | | | | |
| SECTOR DIVERSIFICATION (%) | | Fund | | | MSCI
EAFE | |
Financials | | | 20.0 | | | | 21.4 | |
Health Care | | | 16.6 | | | | 10.0 | |
Consumer Discretionary | | | 13.6 | | | | 10.0 | |
Information Technology | | | 12.9 | | | | 4.7 | |
Telecommunication Services | | | 10.9 | | | | 6.1 | |
Industrials | | | 9.0 | | | | 12.5 | |
Energy | | | 7.0 | | | | 9.2 | |
Materials | | | 5.9 | | | | 10.1 | |
Consumer Staples | | | 2.6 | | | | 11.5 | |
Utilities | | | 0.1 | | | | 4.5 | |
| (a) | | 2010 expense ratio per Fund prospectus, dated May 1, 2011. |
| (b) | | SEC Yield is an annualization of the Fund’s total net investment income per share for the 30-day period ended on the last day of the month. |
| (c) | | Price-to-earnings (P/E) ratios are calculated using 12-month forward earnings estimates. |
| (d) | | The Fund’s portfolio holdings are subject to change without notice. The mention of specific securities is not a recommendation to buy, sell, or hold any particular security and is not indicative of Dodge & Cox’s current or future trading activity. |
| (e) | | The Fund may classify a company in a different category than the MSCI EAFE. The Fund generally classifies a company based on its country of incorporation, but may designate a different country in certain circumstances. |
PAGE 7 § DODGE & COX INTERNATIONAL STOCK FUND
| | | | |
| PORTFOLIO OF INVESTMENTS | | | December 31, 2011 | |
| | | | | | | | |
| COMMON STOCKS: 96.7% | |
| | |
| | | SHARES | | | VALUE | |
| CONSUMER DISCRETIONARY: 13.6% | |
AUTOMOBILES & COMPONENTS: 3.6% | |
Bayerische Motoren Werke AG (Germany) | | | 7,471,400 | | | $ | 500,512,088 | |
Honda Motor Co., Ltd. ADR (Japan) | | | 6,758,400 | | | | 206,469,120 | |
Mahindra & Mahindra, Ltd. (India) | | | 3,414,447 | | | | 43,721,381 | |
NGK Spark Plug Co., Ltd.(b) (Japan) | | | 16,720,000 | | | | 207,452,254 | |
Yamaha Motor Co., Ltd.(b) (Japan) | | | 27,230,000 | | | | 344,576,069 | |
| | | | | | | | |
| | | | 1,302,730,912 | |
CONSUMER DURABLES & APPAREL: 2.6% | |
Corporacion Geo SAB de CV, Series B(a),(b) (Mexico) | | | 50,305,400 | | | | 62,112,553 | |
LG Electronics, Inc.(a) (South Korea) | | | 6,117,487 | | | | 395,701,669 | |
Li Ning Co., Ltd. (Cayman Islands/China) | | | 46,843,900 | | | | 37,274,393 | |
Panasonic Corp. (Japan) | | | 28,693,072 | | | | 243,799,780 | |
Sony Corp. (Japan) | | | 10,542,600 | | | | 189,292,883 | |
Woongjin Coway Co., Ltd. (South Korea) | | | 328,420 | | | | 10,457,925 | |
| | | | | | | | |
| | | | 938,639,203 | |
CONSUMER SERVICES: 0.4% | |
Accor SA (France) | | | 5,358,051 | | | | 135,815,312 | |
| | |
MEDIA: 7.0% | | | | | | | | |
Grupo Televisa SAB ADR (Mexico) | | | 25,880,592 | | | | 545,045,268 | |
Liberty Global, Inc., Series A(a) (United States) | | | 2,481,805 | | | | 101,828,459 | |
Liberty Global, Inc., Series C(a) (United States) | | | 3,329,971 | | | | 131,600,454 | |
Naspers, Ltd.(b) (South Africa) | | | 27,360,895 | | | | 1,197,093,174 | |
News Corp., Class A (United States) | | | 17,912,792 | | | | 319,564,209 | |
Television Broadcasts, Ltd.(b) (Hong Kong) | | | 35,625,100 | | | | 216,045,916 | |
| | | | | | | | |
| | | | 2,511,177,480 | |
| | | | | | | | |
| | | | 4,888,362,907 | |
| CONSUMER STAPLES: 2.6% | |
FOOD, BEVERAGE & TOBACCO: 2.5% | |
Anadolu Efes Biracilik ve Malt Sanayii AS(b) (Turkey) | | | 25,888,440 | | | | 311,686,565 | |
Diageo PLC ADR (United Kingdom) | | | 2,151,000 | | | | 188,040,420 | |
Unilever PLC (United Kingdom) | | | 11,750,000 | | | | 394,698,834 | |
| | | | | | | | |
| | | | 894,425,819 | |
HOUSEHOLD & PERSONAL PRODUCTS: 0.1% | |
Aderans Co., Ltd.(a),(b) (Japan) | | | 3,417,400 | | | | 43,955,126 | |
| | | | | | | | |
| | | | 938,380,945 | |
| | | | | | | | |
| | |
| | |
| | | SHARES | | | VALUE | |
| ENERGY: 5.1% | | | | | | | | |
Royal Dutch Shell PLC ADR (United Kingdom) | | | 11,011,862 | | | $ | 804,856,993 | |
Schlumberger, Ltd. (Curacao/United States) | | | 10,012,217 | | | | 683,934,543 | |
Total SA (France) | | | 7,108,600 | | | | 363,412,188 | |
| | | | | | | | |
| | | | 1,852,203,724 | |
| FINANCIALS: 20.0% | | | | | | | | |
BANKS: 12.1% | |
Banco Santander SA (Spain) | | | 44,024,150 | | | | 334,462,472 | |
Bank of Yokohama, Ltd. (Japan) | | | 29,312,500 | | | | 138,622,190 | |
Barclays PLC (United Kingdom) | | | 253,545,898 | | | | 693,208,814 | |
Erste Group Bank AG (Austria) | | | 3,700,000 | | | | 65,182,159 | |
Grupo Financiero Banorte SAB de CV (Mexico) | | | 26,928,000 | | | | 81,528,661 | |
HSBC Holdings PLC (United Kingdom) | | | 110,154,921 | | | | 840,042,148 | |
ICICI Bank, Ltd. (India) | | | 2,844,243 | | | | 36,618,189 | |
Kasikornbank PCL Foreign (Thailand) | | | 90,212,627 | | | | 355,989,606 | |
Mitsubishi UFJ Financial Group, Inc. (Japan) | | | 58,099,900 | | | | 246,832,107 | |
Standard Bank Group, Ltd. (South Africa) | | | 48,129,417 | | | | 588,758,190 | |
Standard Chartered PLC (United Kingdom) | | | 23,852,887 | | | | 521,943,390 | |
UniCredit SPA (Italy) | | | 27,450,596 | | | | 228,089,410 | |
Yapi ve Kredi Bankasi AS(a) (Turkey) | | | 155,779,068 | | | | 221,278,254 | |
| | | | | | | | |
| | | | 4,352,555,590 | |
DIVERSIFIED FINANCIALS: 2.9% | |
Credit Suisse Group AG (Switzerland) | | | 30,020,049 | | | | 705,357,693 | |
Deutsche Boerse AG (Germany) | | | 2,000,000 | | | | 104,860,169 | |
Haci Omer Sabanci Holding AS (Turkey) | | | 83,789,354 | | | | 238,924,099 | |
| | | | | | | | |
| | | | 1,049,141,961 | |
INSURANCE: 3.4% | |
AEGON NV(a) (Netherlands) | | | 82,913,149 | | | | 332,769,482 | |
Dai-ichi Life Insurance Co., Ltd. (Japan) | | | 144,193 | | | | 141,813,825 | |
Swiss Life Holding AG (Switzerland) | | | 1,520,000 | | | | 139,814,756 | |
Swiss Re AG (Switzerland) | | | 11,891,868 | | | | 606,051,018 | |
| | | | | | | | |
| | | | 1,220,449,081 | |
REAL ESTATE: 1.6% | | | | | | | | |
BR Malls Participacoes SA(b) (Brazil) | | | 18,138,300 | | | | 176,204,796 | |
Hang Lung Group, Ltd. (Hong Kong) | | | 52,357,500 | | | | 285,159,819 | |
Hang Lung Properties, Ltd. (Hong Kong) | | | 31,964,000 | | | | 90,954,137 | |
| | | | | | | | |
| | | | 552,318,752 | |
| | | | | | | | |
| | | | 7,174,465,384 | |
| | |
| See accompanying Notes to Financial Statements | | DODGE & COX INTERNATIONAL STOCK FUND §PAGE 8 |
| | | | |
| PORTFOLIO OF INVESTMENTS | | | December 31, 2011 | |
| | | | | | | | |
| COMMON STOCKS (continued) | |
| | |
| | | SHARES | | | VALUE | |
| HEALTH CARE: 16.6% | | | | | | | | |
PHARMACEUTICALS, BIOTECHNOLOGY & LIFE SCIENCES: 16.6% | |
Bayer AG (Germany) | | | 15,775,350 | | | $ | 1,008,612,318 | |
GlaxoSmithKline PLC (United Kingdom) | | | 10,770,000 | | | | 246,120,295 | |
GlaxoSmithKline PLC ADR (United Kingdom) | | | 21,616,649 | | | | 986,367,694 | |
Novartis AG (Switzerland) | | | 1,100,000 | | | | 62,887,256 | |
Novartis AG ADR (Switzerland) | | | 16,605,000 | | | | 949,307,850 | |
Roche Holding AG (Switzerland) | | | 8,155,400 | | | | 1,382,241,754 | |
Sanofi (France) | | | 18,004,120 | | | | 1,322,379,415 | |
| | | | | | | | |
| | | | 5,957,916,582 | |
| INDUSTRIALS: 9.0% | | | | | | | | |
CAPITAL GOODS: 7.9% | | | | | | | | |
Koninklijke Philips Electronics NV (Netherlands) | | | 39,372,099 | | | | 829,585,752 | |
Mitsubishi Electric Corp. (Japan) | | | 86,689,800 | | | | 831,194,912 | |
Nexans SA(b) (France) | | | 1,391,332 | | | | 72,209,354 | |
Nidec Corp. (Japan) | | | 2,707,700 | | | | 235,345,109 | |
Schneider Electric SA (France) | | | 9,184,546 | | | | 483,567,331 | |
Tyco International, Ltd. (Switzerland) | | | 6,119,020 | | | | 285,819,424 | |
Wienerberger AG(b) (Austria) | | | 11,254,341 | | | | 101,885,486 | |
| | | | | | | | |
| | | | 2,839,607,368 | |
COMMERCIAL & PROFESSIONAL SERVICES: 0.7% | |
Edenred SA (France) | | | 4,035,461 | | | | 99,339,503 | |
Experian PLC (Jersey/United Kingdom) | | | 10,762,212 | | | | 146,328,577 | |
| | | | | | | | |
| | | | 245,668,080 | |
TRANSPORTATION: 0.4% | | | | | | | | |
DP World, Ltd. (United Arab Emirates) | | | 5,301,590 | | | | 51,372,407 | |
PostNL NV (Netherlands) | | | 5,897,771 | | | | 18,777,654 | |
TNT Express NV (Netherlands) | | | 13,397,272 | | | | 100,117,840 | |
| | | | | | | | |
| | | | 170,267,901 | |
| | | | | | | | |
| | | | 3,255,543,349 | |
| INFORMATION TECHNOLOGY: 12.9% | |
SEMICONDUCTORS & SEMICONDUCTOR EQUIPMENT: 1.3% | |
Infineon Technologies AG(b)
(Germany) | | | 62,194,266 | | | | 468,158,658 | |
|
SOFTWARE & SERVICES: 1.4% | |
Nintendo Co., Ltd. (Japan) | | | 3,630,000 | | | | 499,909,056 | |
|
TECHNOLOGY, HARDWARE & EQUIPMENT: 10.2% | |
Alcatel-Lucent(a) (France) | | | 11,438,174 | | | | 17,868,261 | |
Brother Industries, Ltd.(b) (Japan) | | | 22,885,100 | | | | 280,972,061 | |
Fujifilm Holdings Corp. (Japan) | | | 17,204,700 | | | | 407,485,619 | |
Fujitsu, Ltd.(b) (Japan) | | | 100,723,000 | | | | 523,440,301 | |
Hewlett-Packard Co. (United States) | | | 15,380,000 | | | | 396,188,800 | |
| | | | | | | | |
| | |
| | |
| | | SHARES | | | VALUE | |
Kyocera Corp. (Japan) | | | 6,433,900 | | | | 517,420,307 | |
Nokia Oyj (Finland) | | | 136,229,200 | | | | 665,059,047 | |
TE Connectivity, Ltd. (Switzerland) | | | 10,770,462 | | | $ | 331,837,934 | |
Telefonaktiebolaget LM Ericsson (Sweden) | | | 51,322,200 | | | | 525,000,963 | |
| | | | | | | | |
| | | | | | | 3,665,273,293 | |
| | | | | | | | |
| | | | | | | 4,633,341,007 | |
| MATERIALS: 5.9% | | | | | | | | |
Akzo Nobel NV (Netherlands) | | | 2,767,142 | | | | 133,800,159 | |
BHP Billiton PLC (United Kingdom) | | | 18,051,354 | | | | 526,333,711 | |
Cemex SAB de CV ADR(a) (Mexico) | | | 34,101,721 | | | | 183,808,276 | |
Duratex SA (Brazil) | | | 15,860,246 | | | | 75,846,881 | |
Lafarge SA(b) (France) | | | 16,454,291 | | | | 578,398,629 | |
Lanxess AG(b) (Germany) | | | 4,839,784 | | | | 250,555,699 | |
Linde AG (Germany) | | | 1,020,205 | | | | 151,780,066 | |
Norsk Hydro ASA (Norway) | | | 45,811,984 | | | | 212,482,245 | |
| | | | | | | | |
| | | | | | | 2,113,005,666 | |
| TELECOMMUNICATION SERVICES: 10.9% | |
America Movil SAB de CV, Series L (Mexico) | | | 357,500,000 | | | | 404,261,647 | |
Bharti Airtel, Ltd. (India) | | | 15,543,387 | | | | 100,685,908 | |
Millicom International Cellular SA SDR SDR (Luxembourg) | | | 2,977,494 | | | | 298,309,677 | |
MTN Group, Ltd. (South Africa) | | | 39,020,300 | | | | 694,747,969 | |
PT Telekomunikasi Indonesia TBK ADR (Indonesia) | | | 14,439,149 | | | | 443,859,440 | |
Telecom Italia SPA (Italy) | | | 201,500,000 | | | | 216,717,703 | |
Telecom Italia SPA-RSP (Italy) | | | 189,023,245 | | | | 169,293,243 | |
Telefonica SA (Spain) | | | 14,332,200 | | | | 248,284,467 | |
Telekom Austria AG (Austria) | | | 12,767,576 | | | | 153,030,135 | |
Vodafone Group PLC (United Kingdom) | | | 427,000,000 | | | | 1,186,341,365 | |
| | | | | | | | |
| | | | | | | 3,915,531,554 | |
| UTILITIES: 0.1% | | | | | | | | |
ENN Energy Holdings, Ltd. (Cayman Islands/China) | | | 7,041,100 | | | | 22,574,021 | |
| | | | | | | | |
TOTAL COMMON STOCKS
(Cost $40,278,792,681) | | | | | | $ | 34,751,325,139 | |
|
| PREFERRED STOCKS: 1.9% | |
| ENERGY: 1.9% | | | | | | | | |
Petroleo Brasileiro SA ADR (Brazil) | | | 14,066,500 | | | | 330,422,085 | |
Ultrapar Participacoes SA ADR (Brazil) | | | 20,215,034 | | | | 347,698,585 | |
| | | | | | | | |
TOTAL PREFERRED STOCKS
(Cost $334,535,304) | | | | | | $ | 678,120,670 | |
| | |
| PAGE 9 § DODGE & COX INTERNATIONAL STOCK FUND | | See accompanying Notes to Financial Statements |
| | | | |
| PORTFOLIO OF INVESTMENTS | | | December 31, 2011 | |
| | | | | | | | |
| SHORT-TERM INVESTMENTS: 0.6% | |
| | |
| | | PAR VALUE | | | VALUE | |
MONEY MARKET FUND: 0.1% | |
SSgA U.S. Treasury Money Market Fund | | $ | 35,750,493 | | | $ | 35,750,493 | |
|
REPURCHASE AGREEMENT: 0.5% | |
Fixed Income Clearing Corporation(c)
0.01%, dated 12/30/11, due 1/3/12, maturity value $177,235,197 | | | 177,235,000 | | | | 177,235,000 | |
| | | | | | | | |
TOTAL SHORT-TERM INVESTMENTS
(Cost $212,985,493) | | | | | | | 212,985,493 | |
| | | | | | | | |
TOTAL INVESTMENTS
(Cost $40,826,313,478) | | | 99.2 | % | | | 35,642,431,302 | |
OTHER ASSETS LESS LIABILITIES | | | 0.8 | % | | | 281,098,154 | |
| | | | | | | | |
| NET ASSETS | | | 100.0 | % | | $ | 35,923,529,456 | |
| | | | | | | | |
| (b) | See Note 8 regarding holdings of 5% voting securities |
| (c) | Repurchase agreement is collateralized by U.S. Treasury Note 0.375%, 7/31/13. Total collateral value is $180,780,825. |
| | In determining a company’s country designation, the Fund generally references the country of incorporation. In cases where the Fund considers the country of incorporation to be a “jurisdiction of convenience” chosen primarily for tax purposes, the Fund uses the country designation of an appropriate broad-based market index. In that circumstance, two countries are listed—the country of incorporation and the country designated by an appropriate index, respectively. |
ADR: American Depositary Receipt
NVDR: Non-Voting Depositary Receipt
SDR: Swedish Depository Receipt
Forward Foreign Currency Contracts
As of December 31, 2011, open forward foreign currency contracts are summarized as follows:
| | | | | | | | | | | | |
| | | | | Contract Amount | | | | |
| Counterparty | | Settlement
Date | | Receive
(USD) | | Deliver
(CHF) | | | Unrealized
Appreciation | |
| Contracts to sell Swiss Franc: | | | | | | | | | | |
| Barclays | | 2/8/2012 | | 98,704,363 | | | 87,000,000 | | | $ | 6,026,592 | |
| Citibank | | 2/15/2012 | | 95,084,360 | | | 86,000,000 | | | | 3,456,965 | |
| JPMorgan Chase | | 2/15/2012 | | 78,462,576 | | | 71,000,000 | | | | 2,816,703 | |
| HSBC | | 2/22/2012 | | 93,476,229 | | | 86,000,000 | | | | 1,833,944 | |
| | | | | | | | | | | | |
| | | | | | | | | | $ | 14,134,204 | |
| | | | | | | | | | | | |
| | | | | | | | | | | | | |
Currency Abbreviations
CHF—Swiss Franc
USD—U.S. Dollar
| | |
| See accompanying Notes to Financial Statements | | DODGE & COX INTERNATIONAL STOCK FUND §PAGE 10 |
| | | | |
STATEMENT OF ASSETS AND LIABILITIES | |
| |
| | | December 31, 2011 | |
ASSETS: | | | | |
Investments, at value | | | | |
Unaffiliated issuers (cost $36,438,028,002) | | $ | 31,579,539,112 | |
Affiliated issuers (cost $4,388,285,476) | | | 4,062,892,190 | |
| | | | |
| | | 35,642,431,302 | |
Cash denominated in foreign currency (cost $909) | | | 908 | |
Receivable for investments sold | | | 155,326,378 | |
Receivable for foreign currency contracts closed | |
| 17,422,623
|
|
Unrealized appreciation on foreign currency contracts | | | 14,134,204 | |
Receivable for Fund shares sold | | | 170,603,254 | |
Dividends and interest receivable | | | 111,814,321 | |
Prepaid expenses and other assets | | | 272,176 | |
| | | | |
| | | 36,112,005,166 | |
| | | | |
LIABILITIES: | | | | |
Payable for investments purchased | | | 22,178,097 | |
Payable for Fund shares redeemed | | | 118,903,487 | |
Management fees payable | | | 18,430,675 | |
Accrued foreign capital gain tax | | | 26,523,074 | |
Accrued expenses | | | 2,440,377 | |
| | | | |
| | | 188,475,710 | |
| | | | |
NET ASSETS | | $ | 35,923,529,456 | |
| | | | |
| |
NET ASSETS CONSIST OF: | | | | |
Paid in capital | | $ | 48,968,028,478 | |
Undistributed net investment income | | | 3,255,825 | |
Accumulated net realized loss | | | (7,849,467,054 | ) |
Net unrealized depreciation (net of accrued foreign capital gain tax of $26,523,074) | | | (5,198,287,793 | ) |
| | | | |
| | $ | 35,923,529,456 | |
| | | | |
Fund shares outstanding (par value $0.01 each, unlimited shares authorized) | | | 1,228,605,113 | |
Net asset value per share | | | $29.24 | |
|
STATEMENT OF OPERATIONS | |
| |
| | | Year Ended
December 31, 2011 | |
INVESTMENT INCOME: | | | | |
Dividends (net of foreign taxes of $93,686,867) | | | | |
Unaffiliated issuers | | $ | 1,120,488,355 | |
Affiliated issuers | | | 93,219,467 | |
Interest | | | 189,687 | |
| | | | |
| | | 1,213,897,509 | |
| | | | |
EXPENSES: | | | | |
Management fees | | | 253,217,597 | |
Custody and fund accounting fees | | | 6,258,474 | |
Transfer agent fees | | | 7,227,485 | |
Professional services | | | 238,715 | |
Shareholder reports | | | 1,430,719 | |
Registration fees | | | 374,102 | |
Trustees’ fees | | | 214,500 | |
Miscellaneous | | | 2,036,061 | |
| | | | |
| | | 270,997,653 | |
| | | | |
NET INVESTMENT INCOME | | | 942,899,856 | |
| | | | |
| |
REALIZED AND UNREALIZED
GAIN (LOSS): | | | | |
Net realized gain | | | | |
Investments in unaffiliated issuers (net of foreign capital gain tax of $18,057,251) | | | 741,532,483 | |
Investments in affiliated issuers | | | 340,311,203 | |
Foreign currency transactions | | | 109,259,947 | |
Net change in unrealized appreciation/depreciation | | | | |
Investments (including net decrease in accrued foreign capital gain tax of $20,365,442) | | | (9,298,899,806 | ) |
Foreign currency transactions | | | 10,013,005 | |
| | | | |
Net realized and unrealized loss | | | (8,097,783,168 | ) |
| | | | |
NET DECREASE IN NET ASSETS FROM OPERATIONS | | $ | (7,154,883,312 | ) |
| | | | |
| | | | | | | | |
STATEMENT OF CHANGES IN NET ASSETS | |
| | |
| | | Year Ended
December 31, 2011 | | | Year Ended
December 31, 2010 | |
OPERATIONS: | | | | | | | | |
Net investment income | | $ | 942,899,856 | | | $ | 602,831,632 | |
Net realized gain (loss) | | | 1,191,103,633 | | | | (860,012,477 | ) |
Net change in unrealized appreciation/depreciation | | | (9,288,886,801 | ) | | | 5,392,196,483 | |
| | | | | | | | |
| | | (7,154,883,312 | ) | | | 5,135,015,638 | |
| | | | | | | | |
| | |
DISTRIBUTIONS TO SHAREHOLDERS FROM: | | | | | | | | |
Net investment income | | | (922,003,327 | ) | | | (592,946,132 | ) |
Net realized gain | | | — | | | | — | |
| | | | | | | | |
Total distributions | | | (922,003,327 | ) | | | (592,946,132 | ) |
| | | | | | | | |
| | |
FUND SHARE TRANSACTIONS: | | | | | | | | |
Proceeds from sale of shares | | | 8,672,373,099 | | | | 9,292,347,685 | |
Reinvestment of distributions | | | 791,899,770 | | | | 516,946,497 | |
Cost of shares redeemed | | | (8,870,305,644 | ) | | | (7,692,519,688 | ) |
| | | | | | | | |
Net increase from Fund share transactions | | | 593,967,225 | | | | 2,116,774,494 | |
| | | | | | | | |
Total increase (decrease) in net assets | | | (7,482,919,414 | ) | | | 6,658,844,000 | |
| | |
NET ASSETS: | | | | | | | | |
Beginning of year | | | 43,406,448,870 | | | | 36,747,604,870 | |
| | | | | | | | |
End of year (including undistributed net investment income of $3,255,825 and $2,833,637, respectively) | | $ | 35,923,529,456 | | | $ | 43,406,448,870 | |
| | | | | | | | |
| | |
SHARE INFORMATION: | | | | | | | | |
Shares sold | | | 255,279,422 | | | | 287,776,250 | |
Distributions reinvested | | | 27,372,961 | | | | 14,615,394 | |
Shares redeemed | | | (269,547,993 | ) | | | (240,834,823 | ) |
| | | | | | | | |
Net increase in shares outstanding | | | 13,104,390 | | | | 61,556,821 | |
| | | | | | | | |
| | |
| PAGE 11 § DODGE & COX INTERNATIONAL STOCK FUND | | See accompanying Notes to Financial Statements |
NOTES TO FINANCIAL STATEMENTS
NOTE 1—ORGANIZATION AND SIGNIFICANT ACCOUNTING POLICIES
Dodge & Cox International Stock Fund (the “Fund”) is one of the series constituting the Dodge & Cox Funds (the “Trust” or the “Funds”). The Trust is organized as a Delaware statutory trust and is registered under the Investment Company Act of 1940, as amended, as a diversified, open-end management investment company. The Fund commenced operations on May 1, 2001, and seeks long-term growth of principal and income. The Fund invests primarily in a diversified portfolio of foreign stocks. Foreign investing, especially in developing countries, has special risks such as currency and market volatility and political and social instability. These and other risk considerations are discussed in the Fund’s Prospectus.
The financial statements have been prepared in conformity with accounting principles generally accepted in the United States of America, which require the use of estimates and assumptions by management. Actual results may differ from those estimates. Significant accounting policies are as follows:
Security valuation The Fund’s net assets are valued as of the close of trading on the New York Stock Exchange (NYSE), generally 4:00 p.m. Eastern Time, each day that the NYSE is open for business. Listed securities are valued at market, using the official quoted close price or the last sale on the date of determination or, if not available, at the mean between the exchange listed bid and ask prices. A security that is listed or traded on more than one exchange is valued at the quotation on the exchange determined to be the primary market for such security. Security values are not discounted based on the size of the Fund’s position. Short-term securities are valued at amortized cost which approximates current value.
Investments initially valued in currencies other than the U.S. dollar are converted to the U.S. dollar using prevailing exchange rates. As a result, the Fund’s net asset value per share (NAV) may be affected by changes in the value of currencies in relation to the U.S. dollar.
If market quotations are not readily available or if a security’s value has materially changed after the close of the security’s primary market but before the close of trading on the NYSE, the security is valued at fair value as
determined in good faith by or under the direction of the Board of Trustees. The Fund may use fair value pricing in calculating its NAV when, for example, (i) the primary market for a security is closed or if trading of a security is suspended or limited, (ii) the Fund determines that the price provided by a pricing service is inaccurate or unreliable, or (iii) the Fund determines that a significant event affecting the value of a security has occurred before the close of the NYSE but after the close of the security’s primary market. An event is considered significant if there is both an affirmative expectation that the security’s value will materially change in response to the event and a reasonable basis for quantifying a resulting change in value. Because trading in securities on most non-U.S. exchanges is normally completed before the close of the NYSE, the value of foreign securities can change by the time the Fund calculates its NAV. To address these changes, the Fund may utilize adjustment factors provided by an independent pricing service to systematically value foreign securities at fair value. These adjustment factors are based on statistical analyses of subsequent movements and changes in securities indices, specific security prices, and exchange rates in foreign markets. When fair value pricing is employed, the prices of securities used by the Fund to calculate its net asset value may differ from quoted or published prices for the same securities. In addition, fair values may not reflect the price that the Fund could obtain for a security if it were to dispose of that security at the time of pricing.
Security transactions, investment income, expenses, and distributions Security transactions are recorded on the trade date. Realized gains and losses on securities sold are determined on the basis of identified cost.
Dividend income and corporate action transactions are recorded on the ex-dividend date, or when the Fund first learns of the dividend/corporate action if the ex-dividend date has passed. Non-cash dividends included in dividend income, if any, are recorded at the fair market value of the securities received. Dividends characterized as return of capital are recorded as a reduction of cost of investments and/or realized gain. Interest income is recorded on the accrual basis.
DODGE & COX INTERNATIONAL STOCK FUND §PAGE 12
NOTES TO FINANCIAL STATEMENTS
Expenses are recorded on the accrual basis. Most expenses of the Trust can be directly attributed to a specific series. Expenses which cannot be directly attributed are allocated among the Funds in the Trust based on relative net assets or other expense methodologies determined by the nature of the expense.
Distributions to shareholders are recorded on the ex-dividend date.
Repurchase agreements The Fund enters into repurchase agreements, secured by U.S. government or agency securities, which involve the purchase of securities from a counterparty with a simultaneous commitment to resell the securities at an agreed-upon date and price. It is the Fund’s policy that its custodian take possession of the underlying collateral securities, the fair value of which exceeds the principal amount of the repurchase transaction, including accrued interest, at all times. In the event of default by the counterparty, the Fund has the contractual right to liquidate the collateral securities and to apply the proceeds in satisfaction of the obligation.
Foreign taxes The Fund is subject to foreign taxes which may be imposed by certain countries in which the Fund invests. Withholding taxes are incurred on certain foreign dividends and are accrued at the time the associated dividend is recorded. Capital gains taxes are incurred upon disposition of certain foreign securities. Capital gains taxes are accrued as unrealized losses and are reflected as realized losses upon the sale of the related security. Currency taxes may be incurred when the Fund purchases certain foreign currencies related to securities transactions and are recorded as realized losses on foreign currency transactions. The Fund endeavors to record foreign taxes based on applicable foreign tax law.
Forward foreign currency contracts A forward foreign currency contract represents an obligation to purchase or sell a specific foreign currency at a future date and at a price set at the time of the contract. Losses from these transactions may arise from unfavorable changes in currency values or if the counterparties do not perform under a contract’s terms.
The values of the forward foreign currency contracts are adjusted daily based on the applicable exchange rate of the underlying currency. Changes in the value of open
contracts are recorded as unrealized appreciation or depreciation. When the forward contract is closed, the Fund records a realized gain or loss equal to the difference between the value at the time the contract was opened and the value at the time it was closed.
On April 27, 2011, the Fund entered into foreign currency contracts to hedge foreign currency risks associated with portfolio investments denominated in Swiss Francs. From that date through December 31, 2011, the Fund held forward foreign currency contracts with U.S. dollar total values ranging from 0.2% to 1.8% of net assets.
Foreign currency translation The books and records of the Funds are maintained in U.S. dollars. Foreign currency amounts are translated into U.S. dollars at the prevailing exchange rates of such currencies against the U.S. dollar. The market value of investment securities and other assets and liabilities are translated at the exchange rate as of the valuation date. Purchases and sales of investment securities, income, and expenses are translated at the exchange rate prevailing on the transaction date.
Reported realized and unrealized gain (loss) on investments include foreign currency gain (loss) related to investment transactions.
Reported realized and unrealized gain (loss) on foreign currency transactions include the following: holding/disposing of foreign currency and forward foreign currency contracts, the difference between the trade and settlement dates on securities transactions, the difference between the accrual and payment dates on dividends, and currency losses on the purchase of foreign currency in certain countries that impose taxes on such transactions.
Indemnification Under the Trust’s organizational documents, its officers and trustees are indemnified against certain liabilities arising out of the performance of their duties to the Trust. In addition, in the normal course of business the Trust enters into contracts that provide general indemnities to other parties. The Trust’s maximum exposure under these arrangements is unknown as this would involve future claims that may be made against the Trust that have not yet occurred.
PAGE 13 § DODGE & COX INTERNATIONAL STOCK FUND
NOTES TO FINANCIAL STATEMENTS
NOTE 2—VALUATION MEASUREMENTS
Various inputs are used in determining the value of the Fund’s investments and other financial instruments. These inputs are summarized in the three broad levels listed below.
| § | | Level 1: Quoted prices in active markets for identical securities |
| § | | Level 2: Other significant observable inputs (including quoted prices for similar securities, market indices, interest rates, credit risk, etc.) |
| § | | Level 3: Significant unobservable inputs (including Fund management’s assumptions in determining the fair value of investments) |
The inputs or methodology used for valuing securities are not necessarily an indication of the risk associated with investing in those securities.
The following is a summary of the inputs used to value the Fund’s holdings as of December 31, 2011:
| | | | | | | | |
| Security Classification(a) | | LEVEL 1
(Quoted Prices) | | | LEVEL 2
(Other
Significant
Observable
Inputs) | |
Securities | | | | | | | | |
Common Stocks | | | | | | | | |
Consumer Discretionary | | $ | 4,482,203,313 | | | $ | 406,159,594 | |
Consumer Staples | | | 938,380,945 | | | | — | |
Energy | | | 1,852,203,724 | | | | — | |
Financials | | | 7,109,283,225 | | | | 65,182,159 | |
Health Care | | | 5,957,916,582 | | | | — | |
Industrials | | | 3,153,657,863 | | | | 101,885,486 | |
Information Technology | | | 4,633,341,007 | | | | — | |
Materials | | | 2,113,005,666 | | | | — | |
Telecommunication Services | | | 3,762,501,419 | | | | 153,030,135 | |
Utilities | | | 22,574,021 | | | | — | |
Preferred Stocks | | | | | | | | |
Energy | | | 678,120,670 | | | | — | |
Short-term Investments | | | | | | | | |
Money Market Fund | | | 35,750,493 | | | | — | |
Repurchase Agreement | | | — | | | | 177,235,000 | |
| | | | | | | | |
Total Securities | | $ | 34,738,938,928 | | | $ | 903,492,374 | |
Other Financial Instruments | | | | | | | | |
Forward Foreign Currency Contracts | | $ | — | | | $ | 14,134,204 | (b) |
| | | | | | | | | |
| (a) | Transfers during the period between Level 1 and Level 2 relate to the use of systematic fair valuation. On days when systematic fair valuation is used, securities whose primary market closes before the NYSE are classified as Level 2. There were no Level 3 securities at December 31, 2011 and 2010, and there were no transfers to Level 3 during the year. |
| (b) | Represents net unrealized appreciation on forward foreign currency contracts. |
NOTE 3—RELATED PARTY TRANSACTIONS
Management fees Under a written agreement approved by a unanimous vote of the Board of Trustees, the Fund pays an annual management fee of 0.60% of the Fund’s average daily net assets to Dodge & Cox, investment manager of the Fund.
Fund officers and trustees All officers and three of the trustees of the Trust are officers or employees of Dodge & Cox. The Trust pays a fee only to those trustees who are not affiliated with Dodge & Cox.
NOTE 4—INCOME TAX INFORMATION AND DISTRIBUTIONS TO SHAREHOLDERS
A provision for federal income taxes is not required since the Fund intends to continue to qualify as a regulated investment company under Subchapter M of the Internal Revenue Code and distribute all of its taxable income to shareholders. Distributions are determined in accordance with income tax regulations, and such amounts may differ from net investment income and realized gains for financial reporting purposes. Financial reporting records are adjusted for permanent book/tax differences to reflect tax character.
Book/tax differences are primarily due to differing treatments of wash sales, net short-term realized gain (loss) on investments, foreign capital gain taxes, and foreign currency realized gain (loss). At December 31, 2011, the cost of investments for federal income tax purposes was $40,940,984,067.
DODGE & COX INTERNATIONAL STOCK FUND §PAGE 14
NOTES TO FINANCIAL STATEMENTS
Distributions during the years ended December 31, 2011 and 2010 were characterized as follows for federal income tax purpose.
| | | | | | | | |
| | | Year Ended
December 31, 2011 | | | Year Ended
December 31, 2010 | |
Ordinary income | | | $922,003,327 | | | | $592,946,132 | |
| | | ($0.759 per share) | | | | ($0.495 per share) | |
| | |
Long-term capital gain | | | — | | | | — | |
At December 31, 2011, the tax basis components of distributable earnings were as follows:
| | | | |
Unrealized appreciation | | $ | 4,428,806,024 | |
Unrealized depreciation | | | (9,753,881,863 | ) |
| | | | |
Net unrealized depreciation | | | (5,325,075,839 | ) |
Undistributed ordinary income | | | 3,255,825 | |
Capital Loss carryforward(a) | | | (7,720,662,259 | ) |
| (a) | Represents accumulated capital loss as of December 31, 2011, which may be carried forward to offset future capital gains. During 2011, the Fund utilized $1,217,149,762 of the carryforward. If not utilized, the capital loss carryforward expires as follows: |
| | | | |
Expiring in 2017 | | $ | 6,600,542,030 | |
Expiring in 2018 | | | 1,120,120,229 | |
| | | | |
| | $ | 7,720,662,259 | |
| | | | |
Under the recently enacted Regulated Investment Company Modernization Act of 2010, capital losses incurred by the Fund after January 1, 2011, will not be subject to expiration. In addition, such losses must be utilized prior to the losses incurred in the years preceding enactment. (The Fund had net capital gains in 2011.)
Fund management has reviewed the tax positions for open periods (three years and four years, respectively, from filing the Fund’s Federal and State tax returns) as applicable to the Fund, and has determined that no provision for income tax is required in the Fund’s financial statements.
NOTE 5—LOAN FACILITIES
Pursuant to an exemptive order issued by the Securities and Exchange Commission (SEC), the Fund may participate in an interfund lending facility (Facility). The Facility allows the Fund to borrow money from or loan money to the Funds. Loans under the Facility are made for temporary or emergency purposes, such as to fund shareholder redemption requests. Interest on borrowings is the average of the current repurchase agreement rate and the bank loan rate. There was no activity in the Facility during the period.
All Funds in the Trust participate in a committed credit facility (Line of Credit) with State Street Bank and Trust Company, to be utilized for temporary or emergency purposes to fund shareholder redemptions or for other short-term liquidity purposes. The total amount of the Line of Credit was increased from $200 million to $500 million on June 28, 2011. The maximum amount available to the Fund is $250 million. Each Fund pays an annual commitment fee on its pro-rata portion of the Line of Credit. The Fund’s commitment fee for the year ended December 31, 2011, amounted to $130,893 and is reflected as a Miscellaneous Expense in the Statement of Operations. Interest on borrowings is charged at the prevailing rate. There were no borrowings on the Line of Credit during the period.
NOTE 6—PURCHASES AND SALES OF INVESTMENTS
For the year ended December 31, 2011, purchases and sales of securities, other than short-term securities, aggregated $7,903,664,999 and $6,832,767,836 respectively.
NOTE 7—SUBSEQUENT EVENTS
Fund management has determined that no material events or transactions occurred subsequent to December 31, 2011, and through the date of the Fund’s financial statements issuance, which require additional disclosure in the Fund’s financial statements.
PAGE 15 § DODGE & COX INTERNATIONAL STOCK FUND
NOTES TO FINANCIAL STATEMENTS
NOTE 8—HOLDINGS OF 5% VOTING SECURITIES
Each of the companies listed below was considered to be an affiliate of the Fund because the Fund owned 5% or more of the company’s voting securities during all or part of the year ended December 31, 2011. Purchase and sale transactions and dividend income earned during the period on these securities were as follows:
| | | | | | | | | | | | | | | | | | | | | | | | |
| | | Shares at
Beginning of Period | | | Additions | | | Reductions | | | Shares at End
of Period | | | Dividend
Income(a) | | | Value at
End of Period | |
Aderans Co., Ltd.(d) (Japan) | | | 3,437,000 | | | | — | | | | (19,600 | ) | | | 3,417,400 | | | $ | — | (b) | | $ | 43,955,126 | |
Anadolu Efes Biracilik ve Malt Sanayii AS (Turkey) | | | 26,256,443 | | | | — | | | | (368,003 | ) | | | 25,888,440 | | | | 6,578,323 | | | | 311,686,565 | |
Arkema (France) | | | 3,066,687 | | | | — | | | | (3,066,687 | ) | | | — | | | | — | | | | — | |
BR Malls Participacoes SA (Brazil) | | | 18,000,000 | | | | 4,829,100 | | | | (4,690,800 | ) | | | 18,138,300 | | | | 2,400,433 | | | | — | (c) |
Brother Industries, Ltd. (Japan) | | | 23,001,000 | | | | — | | | | (115,900 | ) | | | 22,885,100 | | | | 6,449,124 | | | | 280,972,061 | |
Corporacion Geo SAB de CV, Series B (Mexico) | | | 47,305,400 | | | | 3,000,000 | | | | — | | | | 50,305,400 | | | | — | (b) | | | 62,112,553 | |
Fujitsu, Ltd. (Japan) | | | 88,808,000 | | | | 14,915,000 | | | | (3,000,000 | ) | | | 100,723,000 | | | | 11,613,801 | | | | — | (c) |
Infineon Technologies AG (Germany) | | | 94,036,576 | | | | — | | | | (31,842,310 | ) | | | 62,194,266 | | | | 12,823,770 | | | | 468,158,658 | |
Lafarge SA (France) | | | 12,774,291 | | | | 3,680,000 | | | | — | | | | 16,454,291 | | | | 16,198,908 | | | | 578,398,629 | |
Lanxess AG (Germany) | | | 5,745,092 | | | | — | | | | (905,308 | ) | | | 4,839,784 | | | | 4,332,911 | | | | 250,555,699 | |
Naspers, Ltd. (South Africa) | | | 31,680,895 | | | | — | | | | (4,320,000 | ) | | | 27,360,895 | | | | 9,677,155 | | | | 1,197,093,174 | |
Nexans SA (France) | | | 1,726,461 | | | | 46,158 | | | | (381,287 | ) | | | 1,391,332 | | | | 2,130,960 | | | | — | (c) |
NGK Spark Plug Co., Ltd. (Japan) | | | 7,306,200 | | | | 9,413,800 | | | | — | | | | 16,720,000 | | | | 3,786,412 | | | | 207,452,254 | |
Television Broadcasts, Ltd. (Hong Kong) | | | 27,299,300 | | | | 8,613,800 | | | | (288,000 | ) | | | 35,625,100 | | | | 9,348,893 | | | | 216,045,916 | |
Wienerberger AG (Austria) | | | 12,335,026 | | | | — | | | | (1,080,685 | ) | | | 11,254,341 | | | | 1,377,134 | | | | 101,885,486 | |
Yamaha Motor Co., Ltd. (Japan) | | | 27,230,000 | | | | — | | | | — | | | | 27,230,000 | | | | 6,501,643 | | | | 344,576,069 | |
| | | | | | | | | | | | | | | | | | | | | | | | |
| | | | | | | | | | | | | | | | | | $ | 93,219,467 | | | $ | 4,062,892,190 | |
| | | | | | | | | | | | | | | | | | | | | | | | |
| | | | | | | | | | | | | | | | | | | | | | | | | |
| (a) | Net of foreign taxes, if any |
| (c) | Company was not an affiliate at period end |
| (d) | Name changed from Unihair on July 1, 2011 |
DODGE & COX INTERNATIONAL STOCK FUND §PAGE 16
FINANCIAL HIGHLIGHTS
| | | | | | | | | | | | | | | | | | | | |
SELECTED DATA AND RATIOS (for a share outstanding throughout each year) | | Year Ended December 31, | |
| | | 2011 | | | 2010 | | | 2009 | | | 2008 | | | 2007 | |
| | | | |
Net asset value, beginning of year | | | $35.71 | | | | $31.85 | | | | $21.90 | | | | $46.02 | | | | $43.66 | |
Income from investment operations: | | | | | | | | | | | | | | | | | | | | |
Net investment income | | | 0.78 | | | | 0.51 | | | | 0.41 | | | | 0.97 | | | | 1.25 | |
Net realized and unrealized gain (loss) | | | (6.49 | ) | | | 3.85 | | | | 9.98 | | | | (22.57 | ) | | | 3.87 | |
| | | | |
Total from investment operations | | | (5.71 | ) | | | 4.36 | | | | 10.39 | | | | (21.60 | ) | | | 5.12 | |
| | | | |
Distributions to shareholders from: | | | | | | | | | | | | | | | | | | | | |
Net investment income | | | (0.76 | ) | | | (0.50 | ) | | | (0.44 | ) | | | (0.94 | ) | | | (1.26 | ) |
Net realized gain | | | — | | | | — | | | | — | | | | (1.58 | ) | | | (1.50 | ) |
| | | | |
Total distributions | | | (0.76 | ) | | | (0.50 | ) | | | (0.44 | ) | | | (2.52 | ) | | | (2.76 | ) |
| | | | |
Net asset value, end of year | | | $29.24 | | | | $35.71 | | | | $31.85 | | | | $21.90 | | | | $46.02 | |
| | | | |
Total return | | | (15.97 | )% | | | 13.69 | % | | | 47.46 | % | | | (46.68 | )% | | | 11.71 | % |
Ratios/supplemental data: | | | | | | | | | | | | | | | | | | | | |
Net assets, end of year (millions) | | | $35,924 | | | | $43,406 | | | | $36,748 | | | | $25,020 | | | | $53,479 | |
Ratio of expenses to average net assets | | | 0.64 | % | | | 0.65 | % | | | 0.65 | % | | | 0.64 | % | | | 0.65 | % |
Ratio of net investment income to average net assets | | | 2.23 | % | | | 1.58 | % | | | 1.58 | % | | | 2.37 | % | | | 3.11 | % |
Portfolio turnover rate | | | 16 | % | | | 15 | % | | | 21 | % | | | 35 | % | | | 16 | % |
See accompanying Notes to Financial Statements
PAGE 17 § DODGE & COX INTERNATIONAL STOCK FUND
REPORT OF INDEPENDENT REGISTERED PUBLIC ACCOUNTING FIRM
To the Trustees of Dodge & Cox Funds and Shareholders of Dodge & Cox International Stock Fund
In our opinion, the accompanying statement of assets and liabilities, including the portfolio of investments, and the related statements of operations and of changes in net assets and the financial highlights present fairly, in all material respects, the financial position of Dodge & Cox International Stock Fund (the “Fund”, one of the series constituting Dodge & Cox Funds) at December 31, 2011, the results of its operations for the year then ended, the changes in its net assets for each of the two years in the period then ended and the financial highlights for each of the five years in the period then ended, in conformity with accounting principles generally accepted in the United States of America. These financial statements and financial highlights (hereafter referred to as “financial statements”) are the responsibility of the Fund’s management; our responsibility is to express an opinion on these financial statements based on our audits. We conducted our audits of these financial statements in accordance with the standards of the Public Company Accounting Oversight Board (United States). Those standards require that we plan and perform the audit to obtain reasonable assurance about whether the financial statements are free of material misstatement. An audit includes examining, on a test basis, evidence supporting the amounts and disclosures in the financial statements, assessing the accounting principles used and significant estimates made by management, and evaluating the overall financial statement presentation. We believe that our audits, which included confirmation of securities at December 31, 2011, by correspondence with the custodian and brokers, provide a reasonable basis for our opinion.
PricewaterhouseCoopers LLP
San Francisco, California
February 21, 2012
DODGE & COX INTERNATIONAL STOCK FUND §PAGE 18
SPECIAL 2011 TAX INFORMATION
(unaudited)
The following information is provided pursuant to provisions of the Internal Revenue Code:
In 2011, the Fund elected to pass through to shareholders foreign source income of $1,417,536,706 and foreign taxes paid of $111,739,333.
The Fund designates up to a maximum of $1,280,973,710 of its distributions paid to shareholders in 2011 as qualified dividends (treated for federal income tax purposes in the hands of shareholders as taxable at a maximum rate of 15%).
For shareholders that are corporations, the Fund designates 1% of its ordinary dividends paid to shareholders in 2011 as dividends from domestic corporations eligible for the corporate dividends received deduction, provided that the shareholder otherwise satisfies applicable requirements to claim that deduction.
BOARD APPROVAL OF FUNDS’ INVESTMENT MANAGEMENT AGREEMENTS AND MANAGEMENT FEES (unaudited)
The Board of Trustees is responsible for overseeing the performance of the Dodge & Cox Funds’ investment manager and determining whether to continue the Investment Management Agreements between the Funds and Dodge & Cox each year (the “Agreements”). At a meeting of the Board of Trustees of the Trust held on December 14, 2011, the Trustees, by a unanimous vote (including a separate vote of those Trustees who are not “interested persons” (as defined in the Investment Company Act of 1940) (the “Independent Trustees”)), approved the renewal of the Agreements for an additional one-year term through December 31, 2012. During the course of the year, the Board received a wide variety of materials relating to the services provided by Dodge & Cox and the performance of each of the Funds.
INFORMATION RECEIVED
In advance of the meeting, the Board, including each of the Independent Trustees, requested, received, and reviewed materials relating to the Agreements and the services provided by Dodge & Cox. The Independent Trustees retained Morningstar® to prepare an independent
expense and performance summary for each Fund and comparable funds managed by other advisers identified by Morningstar®. The Morningstar® materials included information regarding advisory fee rates, expense ratios, and transfer agency, custodial, and distribution expenses, as well as appropriate performance comparisons to a Fund’s peer group and an index or combination of indices. The Morningstar® materials also included a comparison of expenses of various share classes offered by comparable funds. The materials reviewed by the Board contained information concerning, among other things, Dodge & Cox’s profitability, financial results and condition, advisory fee revenue, and separate account advisory fee schedules. The Board additionally considered the Funds’ brokerage commissions, turnover rates, sales and redemption data for the Funds, and the fact that Dodge & Cox paid for all third party research used in managing the Funds out of its profits, rather than using “soft dollars” generated from portfolio trading commissions. The Board received and reviewed a memorandum summarizing information provided throughout the year regarding Dodge & Cox’s services to the Funds as well as information regarding (i) the different fees, services, costs, and risks associated with separate accounts managed by Dodge & Cox as compared to the Dodge & Cox Funds; (ii) the differences in performance between the Funds and separately managed accounts; and (iii) Fund share subscription and redemption activity. In addition, the Board requested and received additional information regarding attribution analyses and recent Fund performance. Throughout the process of reviewing the services provided by Dodge & Cox and preparing for the meeting, the Independent Trustees found Dodge & Cox to be open, forthright, detailed, and very helpful in answering questions about all issues. The Board received copies of the Agreements and a memorandum from the independent legal counsel to the Independent Trustees discussing the factors generally regarded as appropriate to consider in evaluating advisory arrangements. The Trust’s Contract Review Committee, consisting solely of Independent Trustees, met with the independent legal counsel on November 3, 2011, and again on December 14, 2011, to discuss whether to renew the Agreements. The Board, including the Independent
PAGE 19 § DODGE & COX INTERNATIONAL STOCK FUND
Trustees, subsequently concluded that the existing Agreements are fair and reasonable and voted to approve the Agreements.
In considering the Agreements, the Board, including the Independent Trustees, did not identify any single factor or particular information as all-important or controlling. In reaching the decision to approve the Agreements, the Board considered several factors, discussed below, to be key factors and reached the conclusions described below.
NATURE, QUALITY, AND EXTENT
OF THE SERVICES
The Board considered that Dodge & Cox provides a wide range of services to the Funds in addition to portfolio management and that the quality of these services has been excellent in all respects. The extensive nature of services provided by Dodge & Cox has been documented in materials provided to the Board and in presentations made to the Board throughout the year. In particular, the Board considered the nature, quality, and extent of portfolio management, administrative, and shareholder services performed by Dodge & Cox. With regard to portfolio management services, the Board considered Dodge & Cox’s established long-term history of care and conscientiousness in the management of the Funds; its demonstrated consistency in investment approach and depth; the background and experience of the Dodge & Cox Investment Policy Committee, International Investment Policy Committee, Global Investment Policy Committee, Fixed Income Investment Policy Committee, and research analysts responsible for managing the Funds; its methods for assessing the regulatory and investment climate in various jurisdictions; Dodge & Cox’s overall high level of attention to its core investment management function; and its commitment to the Funds and their shareholders.
In the area of administrative and shareholder services, the Board considered the excellent quality of Dodge & Cox’s work in areas such as compliance, legal services, trading, proxy voting, oversight of the Funds’ transfer agent and custodian, tax compliance, and shareholder communication through its web site and other means. The Board also noted Dodge & Cox’s diligent disclosure policy, its favorable compliance record
and its reputation as a trusted, shareholder-friendly mutual fund family.
In addition, the Board considered that Dodge & Cox manages approximately $112 billion in Fund assets with fewer professionals than most comparable funds, and that on average these professionals have more experience and longer tenure than investment professionals at comparable funds. The Board also noted that Dodge & Cox is an investment research-oriented firm with no other business endeavors to distract management’s attention from its research efforts, and that its investment professionals adhere to a consistent investment approach across the Funds. The Board further considered the Funds’ favorable stewardship and Gold ratings by Morningstar®. The Board concluded that it was satisfied with the nature, extent, and quality of investment management and other services provided to the Funds by Dodge & Cox.
INVESTMENT PERFORMANCE
The Board considered short-term and long-term investment performance for each Fund (including periods of outperformance or underperformance) as compared to both relevant indices and the performance of such Fund’s peer group. In light of recent market volatility, the Board also reviewed recent performance in the context of long-term investment goals. The Board noted that, other than the recent one-year period, the Fund’s performance has been favorable relative to its peers and its benchmark index. The Board determined after extensive review and inquiry that Dodge & Cox’s historic, long-term, team-oriented bottom up investment approach remains consistent and that Dodge & Cox continues to be distinguished by its integrity, thoroughness, and independence.
The Board noted that longer-term comparisons demonstrated favorable performance in comparison to peer group funds and was in keeping with the stated goals in the Funds’ Prospectus. The Board considered that the performance of the Funds is the result of a team-oriented investment management process that emphasizes a long-term investment horizon, comprehensive independent research, price discipline, and focus. The Board also considered that the investment performance delivered by Dodge & Cox to the Funds appeared to be consistent with
DODGE & COX INTERNATIONAL STOCK FUND §PAGE 20
the relevant performance delivered for other (non-fund) clients of Dodge & Cox. The Board concluded that Dodge & Cox has delivered favorable long-term performance for Fund investors consistent with the long-term investment strategies being pursued by the Funds.
COSTS AND ANCILLARY BENEFITS
Costs of Services to Funds: Fees and Expenses. The Board considered each Fund’s management fee rate and expense ratio relative to similar mutual funds and relative to management fees charged by Dodge & Cox to other clients. In particular, the Board considered that the Funds continue to be substantially below their peer group median in expense ratios and management fee rates and that many media and industry reports specifically comment on the low expense ratios of the Funds, which have been a defining characteristic of the Funds for many years. The Board also evaluated the operating structures of the Funds and Dodge & Cox, noting that Dodge & Cox does not charge front-end sales commissions or distribution fees and bears, among other things, third party research and distribution-related costs, reimbursement for recordkeeping and administrative costs to third-party retirement plan administrators, and administrative and office overhead. The Board noted that expenses are well below industry averages. The Board also considered that the Funds receive numerous administrative, regulatory compliance, and shareholder support services from Dodge & Cox without any additional administrative fee and the fact that the Funds have relatively low transaction costs and portfolio turnover rates. The Board reviewed Morningstar® data showing that the few peer group funds with lower expense ratios often have other share classes with significantly higher expense ratios.
In comparing the range of services provided to the Funds under the Agreements to the services Dodge & Cox provides under its separate advisory client agreements, the Board determined that part of the difference is due to higher risks as well as legal and management costs of sponsoring the Funds and noted that separate accounts incur other expenses that should be considered when comparing Fund expenses to separate account expenses. In light of that, the greater risks and regulatory burdens
associated with sponsoring a high profile mutual fund business, and the fact that these are different lines of business, there is reasonable justification for differences in fee rates charged between the two. The Board further noted that, with respect to non-U.S. funds sponsored and managed by Dodge & Cox that are comparable to the Funds in many respects, the fee rates charged by Dodge & Cox are the same as or higher than the fee rates charged to the Funds. The Board concluded that costs incurred by the Funds for the services they receive (including the management fee paid to Dodge & Cox) are reasonable and that the fees are acceptable based upon the qualifications, experience, reputation, and performance of Dodge & Cox and the low overall expense ratios of the Funds.
Profitability and Costs of Services to Dodge & Cox; “Fall-out” Benefits. The Board reviewed reports of Dodge & Cox’s financial position, profitability, and estimated overall value, and considered Dodge & Cox’s overall profitability within its context as a private, employee-owned S-Corporation and relative to the favorable services provided. The Board noted that net revenues for 2011 are projected to increase from 2010. The Board noted in particular that Dodge & Cox’s profits are not generated by high fee rates, but reflect an extraordinarily streamlined, efficient, and focused business approach toward investment management. The Board recognized the importance of Dodge & Cox’s profitability—which is derived solely from management fees and does not include other business ventures—to maintain its independence, stability, company culture and ethics, and management continuity. The Board also considered that the compensation/profit structure at Dodge & Cox is vital for remaining independent and facilitating retention of its management and investment professionals.
The Board considered potential “fall-out” benefits (including the receipt of research from unaffiliated brokers) that Dodge & Cox might receive as a result of its association with the Funds and determined that they are not significant. The Board also noted the extent of additional administrative services performed by Dodge & Cox for the Funds, and that the magnitude of costs and risks borne by Dodge & Cox in rendering advisory services
PAGE 21 § DODGE & COX INTERNATIONAL STOCK FUND
to the Funds (including risks in the regulatory compliance, securities valuation, and investment management processes) are continuing to increase. The Board concluded that the profitability of Dodge & Cox’s relationship with the Funds (including fall-out benefits) was fair and reasonable.
THE BENEFIT OF ECONOMIES OF SCALE
The Board considered whether there have been economies of scale with respect to the management of each Fund, whether the Funds have appropriately benefited from any economies of scale, and whether the management fee rate is reasonable in relation to the Fund assets and any economies of scale that may exist. In the Board’s view, any consideration of economies of scale must take account of the Funds’ low fee structure and the considerable efficiencies of the Funds’ organization and fee structure that has been realized by shareholders at the outset of their investment (i.e., from the first dollar). The Board noted that Dodge & Cox has shared economies of scale by adding or enhancing services to the Funds over time, and that the internal costs of providing investment management, up-to-date technology, administrative, and compliance services to the Funds are continuing to increase. For example, Dodge & Cox has increased its global research staff and investment resources over the years to address the increased complexity of investing in multinational and non-U.S. companies. In addition, Dodge & Cox has made substantial expenditures in other staff and infrastructure to enable it to integrate credit and equity analyses and to be able to implement its strategy in a more effective and secure manner. The Board determined that the Funds provide access by small investors to high quality investment management at a relatively low cost. The Board’s decision to renew the Agreements was made after consideration of economies of scale and review of peer group fund expense ratios and historical expense ratio patterns for the Funds. The Board concluded that the current Dodge & Cox fee structure is fair and reasonable and adequately shares economies of scale that may exist.
CONCLUSION
Based on their evaluation of all material factors and assisted by the advice of independent legal counsel to the Independent Trustees, the Board, including the
Independent Trustees, concluded that the advisory fee structure was fair and reasonable, that each Fund was paying a competitive fee for the services provided, that the scope and quality of Dodge & Cox’s services has provided substantial value for Fund shareholders over the long term, and that approval of the Agreements was in the best interests of each Fund and its shareholders.
FUND HOLDINGS
The Fund provides a complete list of its holdings four times each fiscal year, as of the end of each quarter. The Fund files the lists with the Securities and Exchange Commission (SEC) on Form N-CSR (second and fourth quarters) and Form N-Q (first and third quarters). Shareholders may view the Fund’s Forms N-CSR and N-Q on the SEC’s website at www.sec.gov. Forms N-CSR and N-Q may also be reviewed and copied at the SEC’s Public Reference Room in Washington, DC. Information regarding the operations of the Public Reference Room may be obtained by calling 1-202-942-8090 (direct) or 1-800-732-0330 (general SEC number). A complete list of the Fund’s quarter-end holdings is also available at www.dodgeandcox.com on or about 15 days following each quarter end and remains available on the website until the list is updated in the subsequent quarter.
PROXY VOTING
For a free copy of the Fund’s proxy voting policies and procedures, please call 1-800-621-3979, visit the Fund’s website at www.dodgeandcox.com, or visit the SEC’s website at www.sec.gov. Information regarding how the Fund voted proxies relating to portfolio securities during the most recent 12-month period ending June 30 is also available at www.dodgeandcox.com or at www.sec.gov.
HOUSEHOLD MAILINGS
The Fund routinely mails shareholder reports and summary prospectuses to shareholders and, on occasion, proxy statements. In order to reduce the volume of mail, when possible, only one copy of these documents will be sent to shareholders who are part of the same family and share the same residential address.
If you have a direct account with the Funds and you do not want the mailing of shareholder reports and summary prospectuses combined with other members in your household, contact the Funds at 1-800-621-3979. Your request will be implemented within 30 days.
DODGE & COX INTERNATIONAL STOCK FUND §PAGE 22
DODGE & COX FUNDS—EXECUTIVE OFFICER & TRUSTEE INFORMATION
| | | | | | |
Name (Age) and
Address* | | Position with Trust (Year of Election or
Appointment) | | Principal Occupation During Past 5 Years | | Other Directorships Held by Trustees |
| INTERESTED TRUSTEES AND OFFICERS |
| Kenneth E. Olivier (59) | | Chairman, President, and Trustee (Trustee since 2005) | | Chairman (since March 2011), Chief Executive Officer (since 2010), President (until March 2011), and Director of Dodge & Cox; Portfolio Manager and member of Investment Policy Committee (IPC) | | — |
| Dana M. Emery (50) | | Senior Vice President and Trustee (Trustee since 1993) | | Co-President (since March 2011), Executive Vice President (until March 2011), and Director of Dodge & Cox; Director of Fixed Income, Portfolio Manager, and member of Fixed Income Investment Policy Committee (FIIPC) | | — |
| John A. Gunn (68) | | Trustee (Trustee since 1985) | | Chairman Emeritus (since March 2011), Chairman (2007-March 2011), Chief Executive Officer (2007-2010), and Director of Dodge & Cox; Portfolio Manager and member of IPC, Global Investment Policy Committee (GIPC) (since 2008), International Investment Policy Committee (IIPC), and FIIPC (until 2008) | | — |
| Charles F. Pohl (53) | | Senior Vice President (Officer since 2004) | | Co-President (since March 2011), Senior Vice President (until March 2011), and Director of Dodge & Cox; Chief Investment Officer (since 2007), Director of Credit Research, Portfolio Manager, Investment Analyst, and member of IPC, GIPC (since 2008), IIPC (since 2007), and FIIPC | | — |
| Diana S. Strandberg (52) | | Senior Vice President (Officer since 2006) | | Senior Vice President (since May 2011), Vice President (until May 2011), and Director (since May 2011) of Dodge & Cox; Director of International Equity (since 2009), Portfolio Manager, Investment Analyst, and member of IPC, GIPC (since 2008), and IIPC | | — |
| David H. Longhurst (54) | | Treasurer (Officer since 2006) | | Vice President (since 2008) and Assistant Treasurer (since 2007) of Dodge & Cox; Fund Administration and Accounting Senior Manager (until 2007) | | — |
| Thomas M. Mistele (58) | | Secretary (Officer since 1998) | | Chief Operating Officer, Director, Secretary, Senior Counsel (since May 2011), and General Counsel (until May 2011) of Dodge & Cox | | — |
| Katherine M. Primas (36) | | Chief Compliance Officer (Officer since 2009) | | Chief Compliance Officer of Dodge & Cox (since 2008) and Associate Chief Compliance Officer of Dodge & Cox (until 2008) | | — |
| INDEPENDENT TRUSTEES |
| William F. Ausfahl (71) | | Trustee (Since 2002) | | CFO, The Clorox Co. (1982-1997); Director, The Clorox Co. (1984-1997) | | — |
| L. Dale Crandall (70) | | Trustee (Since 1999) | | President, Kaiser Foundation Health Plan, Inc. and Kaiser Foundation Hospitals (2000-2002); Senior Vice President—Finance and Administration & CFO, Kaiser Foundation Health Plan, Inc. and Kaiser Foundation Hospitals (1998-2000) | | Director, Ansell Limited (medical equipment and supplies) (2002-present); Director, Coventry Health Care, Inc. (managed health care) (2004-present); Bridgeport Education, Inc. (education services) (2008 to present) |
| Thomas A. Larsen (62) | | Trustee (Since 2002) | | Partner of Arnold & Porter LLP (law firm) (since 2012); Director of Howard, Rice, Nemerovski, Canady, Falk & Rabkin (1977-2011) | | — |
| Ann Mather (51) | | Trustee (Since 2011) | | CFO, Pixar Animation Studios (1999-2004) | | Director, Google, Inc. (internet information services) (2005-present); Director, Glu Mobile, Inc. (multimedia software) (2005-present); Director, Netflix, Inc. (video services) (2010-present); Director, MoneyGram International, Inc. (business services) (2010-present) |
| Robert B. Morris III (59) | | Trustee (Since 2011) | | Advisory Director, Presidio Financial Partners (Since 2005) | | — |
| John B. Taylor (65) | | Trustee (Since 2005) (and 1998-2001) | | Professor of Economics, Stanford University; Senior Fellow, Hoover Institution; Under Secretary for International Affairs, United States Treasury (2001-2005) | | — |
| * | | The address for each Officer and Trustee is 555 California Street, 40th Floor, San Francisco, California 94104. Each Officer and Trustee oversees all five series in the Dodge & Cox Funds complex and serves for an indefinite term. |
Additional information about the Trust’s Trustees and Officers is available in the Trust’s Statement of Additional Information (SAI). You can get a free copy of the SAI by visiting the Funds’ website at www.dodgeandcox.com or calling
1-800-621-3979.
PAGE 23 § DODGE & COX INTERNATIONAL STOCK FUND
| | | | |
| | | | |
www.dodgeandcox.com
For Fund literature, transactions, and account information, please visit the Funds’ website.
or write or call:
DODGE & COX FUNDS
c/o Boston Financial Data Services
P.O. Box 8422
Boston, Massachusetts 02266-8422
(800) 621-3979
INVESTMENT MANAGER
Dodge & Cox
555 California Street, 40th Floor
San Francisco, California 94104
(415) 981-1710
This report is submitted for the general information of the shareholders of the Fund. The report is not authorized for distribution to prospective investors in the Fund unless it is accompanied by a current prospectus.
This report reflects our views, opinions, and portfolio holdings as of December 31, 2011, the end of the reporting period. Any such views are subject to change at any time based upon market or other conditions and Dodge & Cox disclaims any responsibility to update such views. These views may not be relied on as investment advice and, because investment decisions for a Dodge & Cox Fund are based on numerous factors, may not be relied on as an indication of trading intent on behalf of any Dodge & Cox Fund.
12/11 BF AR Printed on recycled paper
Annual Report
December 31, 2011
Balanced Fund
ESTABLISHED 1931
TICKER: DODBX
A LETTER FROM THE CHAIRMAN
Our experience over 80 years has taught us that the best long-term investment opportunities often arise in periods of trepidation. While it is impossible to time market cycles with precision, we believe that building strong long-term returns rests on two key tenets of our investment approach: a willingness to revisit and retest our thinking as prices and conditions change, and the fortitude to stay the course, even in periods of volatility or underperformance.
A Year Defined by Aversion to Risk and Extreme Volatility
Two interconnected issues weighed heavily on global financial markets in 2011: uncertainty about the future of the Eurozone and the challenges to global economic growth posed by high debt levels. Investors responded by turning toward safety and security. A regular feature of this market environment was the “risk-on/risk-off” trade. Markets and securities with widely divergent fundamental risk factors traded in tandem based on whether short-term investor confidence improved (risk-on) or deteriorated (risk-off) on that day—often resulting in one day’s move being retraced the following day.
The year-over-year effect on returns was strong performance from investments considered less risky (e.g., 30-year U.S. Treasury securities returned 36% for the year), negative returns from world equities (down 6%), and wide divergence within asset classes between investments viewed as more safe and those viewed as less. Volatility levels were significantly elevated, especially during a gut-wrenching four days of daily 4% price moves in major equity markets in early August. In this environment, our Funds’ strategies suffered, with each underperforming its market benchmark for the year. For a more detailed discussion of each Fund’s 2011 performance, please read their Annual Letters.
Importance of Fundamental Research
In fear-driven markets, when prices fall across the board, bottom-up research is more important than ever. At Dodge & Cox, our goal is to build diversified
portfolios of individual securities—with attractive fundamentals at low valuations—based on our analysts’ intensive research and the depth of knowledge and experience of our portfolio managers.
Through the team-based decision-making of our seasoned investment professionals, we evaluate the risks, merits, and trade-offs of our investment decisions. Our analysts’ detailed knowledge about our holdings and our investment universe enables us to quickly assess a security’s long-term return potential following a decline in valuation—and take advantage of those opportunities where short-term valuations do not reflect the security’s long-term potential.
Opportunities Ahead
Starting valuation is an important component of long-term returns, and as significant pessimism about the future has driven down equity prices, we have been finding attractive opportunities around the world. Today, global equity markets are trading at 10 to 12 times forward estimated earnings, and many companies have strong balance sheets and opportunities for long-term global growth. Corporate bonds are also very attractive in this environment. Their yield premiums are at high levels now, and we’re seeing interesting opportunities in companies across a range of industries.
Over Dodge & Cox’s 80-year history, our long-term, value-oriented approach has withstood many periods of uncertainty. All of our Fund portfolios are well diversified and thoughtfully constructed, giving us optimism for the future. Thank you for your continued confidence in our firm. As always, we welcome your comments and questions.
For the Board of Trustees,

Kenneth E. Olivier,
Chairman and President
January 31, 2012
PAGE 1 § DODGE & COX BALANCED FUND
TO OUR SHAREHOLDERS
The Dodge & Cox Balanced Fund had a total return of 8.5% for the fourth quarter of 2011, compared to 7.5% for the Combined Index(a) (a 60/40 blend of stocks and fixed income securities). For 2011, the Fund had a total return of –1.7%, compared to 4.7% for the Combined Index. At year end, the Fund’s net assets of $12.2 billion were invested in 74.8% common stocks, 23.6% fixed income securities, and 1.6% cash.
MARKET COMMENTARY
2011 was a volatile year for the capital markets. Even though stocks generally finished the year about where they started, the year was marked by macroeconomic uncertainty and fear. Concerns largely centered around the subpar economic recovery in the United States, the sovereign debt crisis in Europe, and regime change in the Middle East and North Africa. These issues may not be resolved in the short term, so the current environment of risk aversion may linger. We believe the outlook for U.S. corporate profitability is strong. 2011 earnings for the S&P 500 are estimated to have increased by more than 15%, surpassing the prior earnings peak in 2007. Corporate balance sheets have improved and dividends are rising. Although unemployment is still high, the United States added nearly two million private sector jobs in 2011.
In the fixed income markets, the Treasury sector(b) posted a return of 9.8%, its strongest annual return since 2008, and the 10-year Treasury reached an all-time low yield of 1.7% in September. The Treasury sector outpaced the other broad sectors of the BCAG such as corporate bonds and mortgage-backed securities (MBS). Investment-grade corporate bonds returned 8.2% for the year, underperforming comparable-duration Treasuries by 3.7 percentage points as spreads widened due to the macroeconomic concerns described above. Financials substantially underperformed Industrials and Utilities for the year. Agency-guaranteed(c) MBS returned 6.2%, underperforming comparable-duration Treasuries by 1.1%.
INVESTMENT STRATEGY
The Fund’s equity weighting was close to 75% for much of 2011. This high allocation is informed by our view that equities currently offer far more attractive long-term total
return potential than fixed income securities, particularly Treasuries. We recognize the appeal of “safe-haven” instruments such as Treasuries during periods of near-term uncertainty, but believe that such investments offer poor relative return prospects over the longer term given current valuations.
Equity Strategy: H-P and Roche
Although the Fund’s underperformance in 2011 was due largely to its high equity weighting, we remain enthusiastic about the long-term total return potential for equities. Many of the Fund’s equity holdings are at unusually low valuations. The equity portfolio’s price-to-earnings multiple (P/E) was 12 times trailing earnings at year end, with 21 of the portfolio’s 72 holdings trading at below 9 times trailing earnings, which is low relative to the S&P 500’s long-term average of 15 times earnings. We are encouraged by the modest expectations currently priced into the portfolio’s equity holdings and remain optimistic about the prospects for improving absolute and relative returns in the Fund.
One example of a security with an unusually low multiple is Hewlett-Packard(d) (H-P). H-P’s P/E declined from over ten times to six times trailing earnings as the shares declined sharply during the year. Given the portfolio’s large weighting in the company during the year, this decline made H-P the biggest detractor from the equity portfolio’s returns relative to the S&P 500. We maintain our conviction in H-P, previously discussed in the Fund’s Semi-Annual Letter. As the valuation has fallen, we have added to our position, with H-P remaining the Fund’s largest equity holding at year end. The company remains a global leader in its core businesses of servers, services, and printers, now with new CEO Meg Whitman at the helm. In addition, the bulk of H-P’s revenues come from outside the United States, including emerging markets, which we expect to be a significant source of future growth.
Among the Fund’s largest equity purchases in 2011 was Roche, a multinational pharmaceutical company based in Switzerland with around 60% of its sales from cancer treatment drugs. Our investment thesis for Roche rests on the efforts by management to improve operations
DODGE & COX BALANCED FUND §PAGE 2
and continue to discover innovative pharmaceuticals for the future. While some of its oncology products face patent expiration over the next five years, generic competitors for these biologically derived pharmaceuticals face a significant hurdle: they must demonstrate biologic equivalence to achieve regulatory and commercial acceptance. The Fund is able to invest in an excellent company at an attractive valuation of less than 12 times forward estimated earnings with a current dividend yield greater than 4%.
Fixed Income Strategy:
Long-Term and Valuation Discipline
Key attributes of our investment philosophy are our long-term horizon and value orientation. Sometimes, particularly in periods of investor uncertainty, we are asked why we focus so much on the long term. The answer is that we focus on what we believe is knowable—longer-term investment fundamentals such as stability and size of cash flows, relative valuation, the competitive position of issuers, and related risks—versus what is less predictable, like short-term swings in market sentiment. This is coupled with a firm belief that the fundamentals of an investment will be determinative of its success over the long run.
A recent example of the importance of our long-term horizon comes out of the Treasury sector, where the highest fixed income returns were earned in 2011. At year end, Treasuries represented 35% of the BCAG. Conversely, the fixed income portfolio held under 1% in Treasuries and had a short 10-year Treasury futures position to reduce portfolio duration.(e) The portfolio’s low exposure to Treasuries was a significant cause of its poor performance relative to the BCAG in 2011. Nevertheless, as we look at the return prospects for holding U.S. Treasuries over the next three to five years, we see far more risks than rewards. Treasury yields are close to zero at the short end of the yield curve, while long-term yields are near generational lows. As such, there is a steep price to pay in terms of price declines if rates were to rise from today’s historically low levels. Further, current valuations seem to incorporate expectations for very low inflation, ignoring for the time being that inflation is running above 2% by nearly all measures. Given these factors, it is our view that the ultra-low Treasury yields are simply a concentrated reflection of
investors’ near-term preference for “safety” over all else, and that the long-term investor will be dissatisfied with the returns from this sector going forward.
An area where we do perceive strong fundamental value is the banking sector, which comprised 12% of the portfolio at year end. Buffeted by some very real risk factors, this much-maligned part of the corporate bond market posted very poor returns in 2011. As a result of this recent underperformance, as well as lingering concerns from the financial crisis, expectations (as captured by valuations) for securities from bank issuers are quite low. For example, the yield premium to comparable U.S. Treasuries of the Barclays Capital Banking Index at year end was 361 basis points,(f) versus 184 basis points for the Industrial Index. However, bank balance sheets have been shored up to a great extent over the past three years, leaving them far less vulnerable to economic or industry-specific shocks. Their liquidity is higher, credit losses are declining, and the international regulatory framework pertaining to large financial institutions is becoming clearer. Improving fundamentals combined with our own fundamental research makes us comfortable taking advantage of the current valuation opportunity. At year end, the portfolio held positions in Ally Financial, Bank of America, Barclays, Capital One, Citigroup, HSBC, JPMorgan Chase, Royal Bank of Scotland, and Wells Fargo.
IN CLOSING
Over Dodge & Cox’s 80-year history, our long-term, value-oriented, fundamental approach has withstood many periods of uncertainty and delivered strong long-term returns for shareholders. We acknowledge the current challenges around the world. However, equity markets are at compelling valuations which adequately reflect present concerns in our opinion. Thus, we are enthusiastic about the prospects for equities in general, and especially the holdings in the Fund. The Fund’s high allocation to equities reflects this viewpoint. Since short-term market movements are impossible to predict, and markets could continue to be volatile, we encourage shareholders to remain focused on the long term.
Thank you for your continued confidence in our firm. As always, we welcome your comments and questions.
PAGE 3 § DODGE & COX BALANCED FUND
For the Board of Trustees,
| | |
| | 
|
Kenneth E. Olivier, Chairman and President | | Dana M. Emery, Senior Vice President |
January 31, 2012
| (a) | | The Combined Index reflects an unmanaged portfolio (rebalanced monthly) of 60% of the Standard & Poor’s 500 Index (S&P 500), which is a market capitalization-weighted index of 500 large-capitalization stocks commonly used to represent the U.S. equity market, and 40% of the Barclays Capital U.S. Aggregate Bond Index (BCAG), which is a widely recognized, unmanaged index of U.S. dollar-denominated investment-grade fixed income securities. |
| (b) | | Sector returns as calculated and reported by Barclays Capital. |
| (c) | | The U.S. Government does not guarantee the Fund’s shares, yield, or net asset value. The guarantee does not eliminate market risk. |
| (d) | | We use these examples to illustrate our investment process, not to imply that we think they are more attractive than the Fund’s other holdings. |
| (e) | | Duration is a measure of a bond’s (or a bond portfolio’s) price sensitivity to changes in interest rates. |
| (f) | | One basis point is equal to 1/100th of 1%. |
Risks: The Fund is subject to stock market risk, meaning stocks in the Fund may decline in value for extended periods due to the financial prospects of individual companies, or due to general market and economic conditions. The Fund also invests in individual bonds whose yields and market values fluctuate, so that your investment may be worth more or less than its original cost. Bond investments are subject to interest rate risk, credit risk, and prepayment risk, all of which could have adverse effects on the value of the Fund. Please read the prospectus and summary prospectus for specific details regarding the Fund’s risk profile.
ANNUAL PERFORMANCE REVIEW
The Fund underperformed the Combined Index by 6.4 percentage points in 2011. The Fund’s equity and fixed income portfolios underperformed their respective benchmark indices. The Fund’s higher allocation to equities also hurt relative results.
EQUITY PORTFOLIO
| | § | | Weak Information Technology returns (down 11% versus up 3% for the S&P 500 sector) hurt results. Hewlett-Packard, the portfolio’s largest holding, was down 38%. | |
| | § | | A higher average weighting in Financials (18% versus 15% for the S&P 500 sector) and weak returns (down 21% versus down 17%) detracted. Bank of America (down 48% from date of purchase), Goldman Sachs (down 46%), and Bank of New York Mellon (down 33%) lagged. | |
| | § | | Additional detractors included Sony (down 49%) and Sprint Nextel (down 45%). | |
| | § | | A higher average Health Care weighting (21% versus 11% for the S&P 500 sector) contributed. Pharmaceutical firms Pfizer (up 29%), GlaxoSmithKline (up 23%), and Amgen (up 18%) were strong. | |
| | § | | A higher average Consumer Discretionary weighting (16% versus 11% for the S&P 500 sector), combined with good relative returns, was beneficial. News Corp. (up 24%) and Time Warner (up 15%) helped. | |
FIXED INCOME PORTFOLIO
| | § | | The portfolio’s shorter relative duration and significant underweight of U.S. Treasuries detracted from the relative returns as interest rates declined and the Treasury sector meaningfully outperformed other sectors in the BCAG for the year. | |
| | § | | The portfolio’s significant overweight to corporate bonds, particularly within the Financials sector, hampered relative returns; the Corporate sector underperformed considerably in 2011, with Financials faring the worst. | |
| | § | | Numerous bank holdings (Bank of America, Citigroup, and HSBC) and lower-rated holdings (Lafarge and Sprint) performed poorly. | |
| | § | | The portfolio’s Agency MBS performed well versus short-duration Treasuries. | |
| | § | | The portfolio’s taxable municipal holdings performed extremely well (22% average returns) versus credit alternatives, though they underperformed long Treasuries. | |
DODGE & COX BALANCED FUND §PAGE 4
KEY CHARACTERISTICS OF DODGE & COX
Independent Organization
Dodge & Cox is one of the largest privately owned investment managers in the world. We remain committed to independence, with a goal of providing the highest quality investment management service to our existing clients.
80 Years of Investment Experience
Dodge & Cox was founded in 1930. We have a stable and well-qualified team of investment professionals, most of whom have spent their entire careers at Dodge & Cox.
Experienced Investment Team
The Investment Policy Committee, which is the decision-making body for the equity portion of the Balanced Fund, is a nine-member committee with an average tenure at Dodge & Cox of 26 years. The Fixed Income Investment Policy Committee, which is the decision-making body for the Fixed Income portion of the Balanced Fund, is a nine-member committee with an average tenure of 17 years.
One Business with a Single Research Office
Dodge & Cox manages domestic, international, and global equity, fixed income, and balanced investments, operating from one office in San Francisco.
Consistent Investment Approach
Our team decision-making process involves thorough, bottom-up fundamental analysis of each investment.
Long-Term Focus and Low Expenses
We invest with a three- to five-year investment horizon, which has historically resulted in low turnover relative to our peers. We manage Funds that maintain low expense ratios.
PAGE 5 § DODGE & COX BALANCED FUND
GROWTH OF $10,000 OVER 10 YEARS
FOR AN INVESTMENT MADE ON DECEMBER 31, 2001
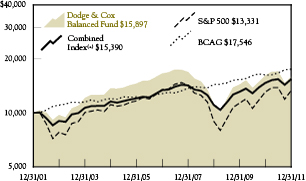
AVERAGE ANNUAL TOTAL RETURN
FOR PERIODS ENDED DECEMBER 31, 2011
| | | | | | | | | | | | | | | | |
| | | 1 Year | | | 5 Years | | | 10 Years | | | 20 Years | |
| | | | | | | | | | | | | | | | |
Dodge & Cox Balanced Fund | | | -1.66 | % | | | -0.86 | % | | | 4.75 | % | | | 9.00 | % |
Combined Index(a) | | | 4.70 | | | | 2.85 | | | | 4.40 | | | | 7.59 | |
S&P 500 | | | 2.12 | | | | -0.25 | | | | 2.92 | | | | 7.81 | |
Barclays Capital Aggregate
Bond Index (BCAG) | | | 7.86 | | | | 6.51 | | | | 5.78 | | | | 6.50 | |
Returns represent past performance and do not guarantee future results. Investment return and share price will fluctuate with market conditions, and investors may have a gain or loss when shares are sold. Fund performance changes over time and currently may be significantly lower than stated. Performance is updated and published monthly. Visit the Fund’s website at www.dodgeandcox.com or call 1-800-621-3979 for current performance figures.
The Fund’s total returns include the reinvestment of dividend and capital gain distributions, but have not been adjusted for any income taxes payable by shareholders on these distributions or on Fund share redemptions. Index returns include dividends and/or interest income but, unlike Fund returns, do not reflect fees or expenses.
Standard & Poor’s, Standard & Poor’s 500, and S&P 500® are trademarks of The McGraw-Hill Companies, Inc. Barclays Capital® is a trademark of Barclays PLC.
| (a) | The Combined Index reflects an unmanaged portfolio (rebalanced monthly) of 60% of the Standard & Poor’s 500 Index (S&P 500), which is a market capitalization-weighted index of 500 large-capitalization stocks commonly used to represent the U.S. equity market, and 40% of the Barclays Capital U.S. Aggregate Bond Index (BCAG), which is a widely recognized, unmanaged index of U.S. dollar-denominated investment-grade fixed income securities. |
FUND EXPENSE EXAMPLE
As a Fund shareholder, you incur ongoing Fund costs, including management fees and other Fund expenses. All mutual funds have ongoing costs, sometimes referred to as operating expenses. The following example shows ongoing costs of investing in the Fund and can help you understand these costs and compare them with those of other mutual funds. The example assumes a $1,000 investment held for the six months indicated.
ACTUAL EXPENSES
The first line of the table below provides information about actual account values and expenses based on the Fund’s actual returns. You may use the information in this line, together with your account balance, to estimate the expenses that you paid over the period. Simply divide your account value by $1,000 (for example, an $8,600 account value divided by $1,000 = 8.6), then multiply the result by the number in the first line under the heading “Expenses Paid During Period” to estimate the expenses you paid on your account during this period.
HYPOTHETICAL EXAMPLE FOR COMPARISON WITH OTHER MUTUAL FUNDS
Information on the second line of the table can help you compare ongoing costs of investing in the Fund with those of other mutual funds. This information may not be used to estimate the actual ending account balance or expenses you paid during the period. The hypothetical “Ending Account Value” is based on the actual expense ratio of the Fund and an assumed 5% annual rate of return before expenses (not the Fund’s actual return). The amount under the heading “Expense Paid During the Period” shows the hypothetical expenses your account would have incurred under this scenario. You can compare this figure with the 5% hypothetical examples that appear in shareholder reports of other mutual funds.
| | | | | | | | | | | | |
Six Months Ended
December 31, 2011 | | Beginning Account Value
7/1/2011 | | | Ending Account Value
12/31/2011 | | | Expenses Paid
During Period* | |
Based on Actual Fund Return | | $ | 1,000.00 | | | $ | 931.10 | | | $ | 2.58 | |
Based on Hypothetical 5% Yearly Return | | | 1,000.00 | | | | 1,022.54 | | | | 2.70 | |
| * | | Expenses are equal to the Fund’s annualized expense ratio of 0.53%, multiplied by the average account value over the period, multiplied by 184/365 (to reflect the one-half year period). |
The expenses shown in the table highlight ongoing costs only and do not reflect any transactional fees or account maintenance fees. While other mutual funds may charge such fees, please note that the Fund does not charge transaction fees (e.g., redemption fees, sales loads) or universal account maintenance fees (e.g., small account fees).
DODGE & COX BALANCED FUND §PAGE 6
| | | | |
| FUND INFORMATION | | | December 31, 2011 | |
| | | | |
| GENERAL INFORMATION | | | |
Net Asset Value Per Share | | | $67.45 | |
Total Net Assets (billions) | | | $12.2 | |
30-Day SEC Yield(a) | | | 2.35% | |
Expense Ratio | | | 0.53% | |
Portfolio Turnover Rate | | | 19% | |
Fund Inception | | | 1931 | |
No sales charges or distribution fees | | | | |
| | |
Investment Manager: Dodge & Cox, San Francisco. Managed by the Investment Policy Committee, whose nine members’ average tenure at Dodge & Cox is 26 years, and by the Fixed Income Investment Policy Committee, whose nine members’ average tenure is 17 years. |
| | | | |
| STOCK PORTFOLIO (74.8%) | | Fund | |
Number of Stocks | | | 72 | |
Median Market Capitalization (billions) | |
| $20
|
|
Price-to-Earnings Ratio(b) | | | 9.9x | |
Foreign Stocks not in the S&P 500(c) | | | 12.8% | |
| | | | |
| SECTOR DIVERSIFICATION (%)(FIVE LARGEST) | |
Health Care | | | 16.3 | |
Information Technology | | | 15.2 | |
Financials | | | 13.5 | |
Consumer Discretionary | | | 12.3 | |
Energy | | | 5.8 | |
| | | | |
| TEN LARGEST STOCKS (%)(d) | | | |
Hewlett-Packard Co. | | | 3.1 | |
Wells Fargo & Co. | | | 3.1 | |
Comcast Corp. | | | 2.7 | |
Capital One Financial Corp. | | | 2.6 | |
Merck & Co., Inc. | | | 2.5 | |
Sanofi (France) | | | 2.5 | |
General Electric Co. | | | 2.3 | |
Time Warner, Inc. | | | 2.3 | |
Amgen, Inc. | | | 2.2 | |
Pfizer, Inc. | | | 2.1 | |
| | | | |
ASSET ALLOCATION
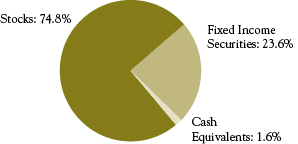
| | | | |
FIXED INCOME PORTFOLIO (23.6%) | | Fund | |
Number of Fixed Income Securities | | | 255 | |
Effective Maturity (years)(e) | | | 7.6 | |
Effective Duration (years)(f) | | | 3.6 | |
| | | | |
| SECTOR DIVERSIFICATION (%) | | | |
U.S. Treasury(e) | | | 0.1 | |
Government-Related | | | 2.0 | |
Mortgage-Related | | | 9.9 | |
Corporate | | | 11.6 | |
Asset-Backed | | | 0.0 | |
| | | | |
| CREDIT QUALITY (%)(g) | | | |
U.S. Government & U.S. Agency/MBS(e) | | | 10.4 | |
Aaa | | | 0.0 | |
Aa | | | 1.8 | |
A | | | 3.3 | |
Baa | | | 4.4 | |
Ba | | | 2.2 | |
B | | | 1.5 | |
Caa | | | 0.0 | |
Ca | | | 0.0 | |
C | | | 0.0 | |
| | | | |
| FIVE LARGEST CORPORATE ISSUERS (%)(d) | |
Bank of America Corp. | | | 0.7 | |
Citigroup, Inc. | | | 0.6 | |
Macy’s, Inc. | | | 0.6 | |
Burlington Northern Santa Fe Corp. | | | 0.5 | |
HCA, Inc. | | | 0.5 | |
| (a) | | SEC Yield is an annualization of the Fund’s total net investment income per share for the 30-day period ended on the last day of the month. |
| (b) | | Price-to-earnings (P/E) ratio is calculated using 12-month forward earnings estimates. |
| (c) | | Foreign stocks are U.S. dollar-denominated. |
| (d) | | The Fund’s portfolio holdings are subject to change without notice. The mention of specific securities is not a recommendation to buy, sell, or hold any particular security and is not indicative of Dodge & Cox’s current or future trading activity. |
| (e) | | Data as presented excludes the effect of the Fund’s short position in 10-year Treasury futures contracts (notional value = 3.8% of the Fund’s net assets). If the Fund’s exposure to Treasury futures contracts had been included, the effective maturity would be 1.1 years lower. |
| (f) | | Data as presented includes the effect of Treasury futures contracts. |
| (g) | | The Fund’s credit quality distribution is calculated using ratings from Moody’s Investor Services. If no Moody’s rating is available, the lower of the Standard & Poor’s or Fitch rating is used. The credit quality of the investments in the portfolio does not apply to the stability or safety of the Fund or its shares. |
PAGE 7 § DODGE & COX BALANCED FUND
| | | | |
| PORTFOLIO OF INVESTMENTS | | | December 31, 2011 | |
| | | | | | | | |
| COMMON STOCKS: 74.8% | |
| | |
| | | SHARES | | | VALUE | |
| CONSUMER DISCRETIONARY: 12.3% | |
CONSUMER DURABLES & APPAREL: 0.9% | |
Panasonic Corp. ADR(b) (Japan) | | | 4,378,128 | | | $ | 36,732,494 | |
Sony Corp. ADR(b) (Japan) | | | 4,035,325 | | | | 72,797,263 | |
| | | | | | | | |
| | | | 109,529,757 | |
MEDIA: 9.2% | | | | | | | | |
Comcast Corp., Class A | | | 14,143,974 | | | | 335,353,624 | |
DISH Network Corp., Class A(a) | | | 2,133,682 | | | | 60,767,263 | |
Liberty Global, Inc., Series A(a) | | | 158,521 | | | | 6,504,117 | |
Liberty Global, Inc., Series C(a) | | | 232,368 | | | | 9,183,183 | |
McGraw-Hill Companies, Inc. | | | 1,355,337 | | | | 60,949,505 | |
News Corp., Class A | | | 13,201,800 | | | | 235,520,112 | |
Time Warner Cable, Inc. | | | 2,118,883 | | | | 134,697,392 | |
Time Warner, Inc. | | | 7,738,466 | | | | 279,668,161 | |
| | | | | | | | |
| | | | 1,122,643,357 | |
RETAILING: 2.2% | | | | | | | | |
CarMax, Inc.(a) | | | 1,181,000 | | | | 35,996,880 | |
Home Depot, Inc. | | | 3,546,692 | | | | 149,102,932 | |
Liberty Interactive, Series A(a) | | | 4,109,650 | | | | 66,637,975 | |
Lowe’s Companies, Inc. | | | 887,804 | | | | 22,532,465 | |
| | | | | | | | |
| | | | 274,270,252 | |
| | | | | | | | |
| | | | 1,506,443,366 | |
| CONSUMER STAPLES: 2.2% | | | | | |
FOOD & STAPLES RETAILING: 1.7% | |
Wal-Mart Stores, Inc. | | | 3,469,900 | | | | 207,361,224 | |
|
FOOD, BEVERAGE & TOBACCO: 0.5% | |
Unilever PLC ADR(b) (United Kingdom) | | | 1,787,400 | | | | 59,913,648 | |
| | | | | | | | |
| | | | 267,274,872 | |
| ENERGY: 5.8% | | | | | | | | |
Baker Hughes, Inc. | | | 2,612,079 | | | | 127,051,523 | |
Chevron Corp. | | | 1,242,879 | | | | 132,242,326 | |
Occidental Petroleum Corp. | | | 2,279,600 | | | | 213,598,520 | |
Schlumberger, Ltd.(b)
(Curacao/United States) | | | 3,538,221 | | | | 241,695,876 | |
| | | | | | | | |
| | | | 714,588,245 | |
| FINANCIALS: 13.5% | | | | | | | | |
BANKS: 4.9% | | | | | | | | |
BB&T Corp. | | | 4,216,484 | | | | 106,128,902 | |
HSBC Holdings PLC ADR(b) (United Kingdom) | | | 1,470,561 | | | | 56,028,374 | |
SunTrust Banks, Inc. | | | 3,504,490 | | | | 62,029,473 | |
Wells Fargo & Co. | | | 13,706,906 | | | | 377,762,330 | |
| | | | | | | | |
| | | | 601,949,079 | |
DIVERSIFIED FINANCIALS: 7.7% | | | | | | | | |
Bank of America Corp. | | | 20,385,600 | | | | 113,343,936 | |
Bank of New York Mellon Corp. | | | 9,039,800 | | | | 179,982,418 | |
Capital One Financial Corp. | | | 7,532,659 | | | | 318,556,149 | |
Charles Schwab Corp. | | | 11,799,900 | | | | 132,866,874 | |
| | | | | | | | |
| | |
| | | SHARES | | | VALUE | |
Credit Suisse Group AG ADR(b) (Switzerland) | | | 1,069,200 | | | $ | 25,104,816 | |
Goldman Sachs Group, Inc. | | | 1,750,000 | | | | 158,252,500 | |
Legg Mason, Inc. | | | 564,290 | | | | 13,571,174 | |
| | | | | | | | |
| | | | 941,677,867 | |
INSURANCE: 0.9% | | | | | | | | |
AEGON NV(a),(b) (Netherlands) | | | 15,817,651 | | | | 63,586,957 | |
Genworth Financial, Inc., Class A(a) | | | 6,904,200 | | | | 45,222,510 | |
| | | | | | | | |
| | | | 108,809,467 | |
| | | | | | | | |
| | | | 1,652,436,413 | |
| HEALTH CARE: 16.3% | | | | | | | | |
HEALTH CARE EQUIPMENT & SERVICES: 1.3% | |
Boston Scientific Corp.(a) | | | 18,638,300 | | | | 99,528,522 | |
Medtronic, Inc. | | | 1,410,200 | | | | 53,940,150 | |
| | | | | | | | |
| | | | 153,468,672 | |
PHARMACEUTICALS, BIOTECHNOLOGY & LIFE SCIENCES: 15.0% | |
Amgen, Inc. | | | 4,149,400 | | | | 266,432,974 | |
GlaxoSmithKline PLC ADR(b) (United Kingdom) | | | 5,550,600 | | | | 253,273,878 | |
Merck & Co., Inc. | | | 8,210,975 | | | | 309,553,757 | |
Novartis AG ADR(b) (Switzerland) | | | 4,400,000 | | | | 251,548,000 | |
Pfizer, Inc. | | | 11,870,517 | | | | 256,877,988 | |
Roche Holding AG ADR(b) (Switzerland) | | | 4,600,000 | | | | 195,730,000 | |
Sanofi ADR(b) (France) | | | 8,326,265 | | | | 304,241,723 | |
| | | | | | | | |
| | | | 1,837,658,320 | |
| | | | | | | | |
| | | | 1,991,126,992 | |
| INDUSTRIALS: 5.1% | | | | | | | | |
CAPITAL GOODS: 3.1% | | | | | | | | |
General Electric Co. | | | 15,914,600 | | | | 285,030,486 | |
Koninklijke Philips Electronics NV(b) (Netherlands) | | | 1,000,000 | | | | 20,950,000 | |
Tyco International, Ltd.(b) (Switzerland) | | | 1,425,434 | | | | 66,582,022 | |
| | | | | | | | |
| | | | 372,562,508 | |
COMMERCIAL & PROFESSIONAL SERVICES: 0.1% | |
Pitney Bowes, Inc. | | | 914,408 | | | | 16,953,124 | |
| | |
TRANSPORTATION: 1.9% | | | | | | | | |
FedEx Corp. | | | 2,844,554 | | | | 237,548,705 | |
| | | | | | | | |
| | | | 627,064,337 | |
| INFORMATION TECHNOLOGY: 15.2% | |
SEMICONDUCTORS & SEMICONDUCTOR EQUIPMENT: 0.9% | |
Maxim Integrated Products, Inc. | | | 4,364,000 | | | | 113,638,560 | |
| | |
SOFTWARE & SERVICES: 7.9% | | | | | | | | |
Adobe Systems, Inc.(a) | | | 1,865,600 | | | | 52,740,512 | |
AOL, Inc.(a) | | | 2,539,074 | | | | 38,340,017 | |
BMC Software, Inc.(a) | | | 2,111,560 | | | | 69,216,937 | |
| | |
| See accompanying Notes to Financial Statements | | DODGE & COX BALANCED FUND §PAGE 8 |
| | | | |
PORTFOLIO OF INVESTMENTS | | | December 31, 2011 | |
| | | | | | | | |
| COMMON STOCKS (continued) | |
| | |
| | | SHARES | | | VALUE | |
Cadence Design Systems, Inc.(a) | | | 5,265,800 | | | $ | 54,764,320 | |
Computer Sciences Corp. | | | 2,333,232 | | | | 55,297,599 | |
Compuware Corp.(a) | | | 3,975,888 | | | | 33,079,388 | |
eBay, Inc.(a) | | | 5,709,900 | | | | 173,181,267 | |
Equinix, Inc.(a) | | | 253,900 | | | | 25,745,460 | |
Microsoft Corp. | | | 8,594,900 | | | | 223,123,604 | |
Symantec Corp.(a) | | | 9,184,000 | | | | 143,729,600 | |
Synopsys, Inc.(a) | | | 3,365,100 | | | | 91,530,720 | |
| | | | | | | | |
| | | | 960,749,424 | |
TECHNOLOGY, HARDWARE & EQUIPMENT: 6.4% | |
Corning, Inc.(a) | | | 135,000 | | | | 1,752,300 | |
Hewlett-Packard Co. | | | 14,771,812 | | | | 380,521,877 | |
Molex, Inc. | | | 781,600 | | | | 18,648,976 | |
Molex, Inc., Class A | | | 2,569,828 | | | | 50,831,198 | |
NetApp, Inc.(a) | | | 708,985 | | | | 25,714,886 | |
Nokia Corp. ADR(b) (Finland) | | | 14,040,260 | | | | 67,674,053 | |
TE Connectivity, Ltd.(b) (Switzerland) | | | 3,580,536 | | | | 110,316,314 | |
Xerox Corp. | | | 15,645,150 | | | | 124,535,394 | |
| | | | | | | | |
| | | | 779,994,998 | |
| | | | | | | | |
| | | | 1,854,382,982 | |
| MATERIALS: 2.6% | | | | | | | | |
Celanese Corp., Series A | | | 1,375,759 | | | | 60,904,851 | |
Cemex SAB de CV ADR(a),(b) (Mexico) | | | 4,343,470 | | | | 23,411,303 | |
Domtar Corp. | | | 153,391 | | | | 12,265,145 | |
Dow Chemical Co. | | | 4,605,617 | | | | 132,457,545 | |
Vulcan Materials Co. | | | 2,156,189 | | | | 84,846,037 | |
| | | | | | | | |
| | | | 313,884,881 | |
| TELECOMMUNICATION SERVICES: 1.8% | |
Sprint Nextel Corp.(a) | | | 35,874,100 | | | | 83,945,394 | |
Vodafone Group PLC ADR(b) (United Kingdom) | | | 4,786,698 | | | | 134,171,145 | |
| | | | | | | | |
| | | | 218,116,539 | |
| | | | | | | | |
TOTAL COMMON STOCKS
(Cost $8,725,866,869) | | | $ | 9,145,318,627 | |
|
| FIXED INCOME SECURITIES: 23.6% | |
| | |
| | | PAR VALUE | | | VALUE | |
| U.S. TREASURY AND GOVERNMENT-RELATED: 2.1% | |
U.S. TREASURY: 0.1% | |
U.S. Treasury Note | | | | | | | | |
0.875%, 1/31/12 | | $ | 9,725,000 | | | $ | 9,731,078 | |
0.75%, 5/31/12 | | | 3,900,000 | | | | 3,911,275 | |
| | | | | | | | |
| | | | 13,642,353 | |
GOVERNMENT-RELATED: 2.0% | | | | | | | | |
Arkansas Dev. Fin. Auth. GNMA Guaranteed Bonds | | | | | | | | |
9.75%, 11/15/14 | | | 362,879 | | | | 368,355 | |
| | | | | | | | |
| | |
| | | PAR VALUE | | | VALUE | |
California Taxable General Obligation | |
7.50%, 4/1/34 | | $ | 28,825,000 | | | $ | 34,585,676 | |
7.55%, 4/1/39 | | | 28,350,000 | | | | 34,664,112 | |
7.30%, 10/1/39 | | | 17,000,000 | | | | 20,101,310 | |
7.625%, 3/1/40 | | | 5,500,000 | | | | 6,766,925 | |
Illinois Taxable General Obligation | | | | | | | | |
4.961%, 3/1/16 | | | 1,900,000 | | | | 2,006,761 | |
5.365%, 3/1/17 | | | 26,055,000 | | | | 27,483,335 | |
5.665%, 3/1/18 | | | 19,800,000 | | | | 21,072,744 | |
Los Angeles Unified School District Taxable General Obligation | | | | | | | | |
6.758%, 7/1/34 | | | 19,000,000 | | | | 23,579,760 | |
New Jersey State Turnpike Authority Revenue Bonds | | | | | | | | |
7.102%, 1/1/41 | | | 18,450,000 | | | | 25,259,157 | |
Small Business Administration—504 Program | |
Series 96-20L, 6.70%, 12/1/16 | | | 633,794 | | | | 688,026 | |
Series 97-20F, 7.20%, 6/1/17 | | | 906,220 | | | | 1,007,538 | |
Series 97-20I, 6.90%, 9/1/17 | | | 1,305,743 | | | | 1,425,716 | |
Series 98-20D, 6.15%, 4/1/18 | | | 1,518,633 | | | | 1,650,975 | |
Series 98-20I, 6.00%, 9/1/18 | | | 1,136,950 | | | | 1,235,175 | |
Series 99-20F, 6.80%, 6/1/19 | | | 1,234,603 | | | | 1,365,488 | |
Series 00-20D, 7.47%, 4/1/20 | | | 3,339,286 | | | | 3,732,808 | |
Series 00-20E, 8.03%, 5/1/20 | | | 1,597,275 | | | | 1,826,774 | |
Series 00-20G, 7.39%, 7/1/20 | | | 2,367,666 | | | | 2,667,858 | |
Series 00-20I, 7.21%, 9/1/20 | | | 1,441,057 | | | | 1,607,080 | |
Series 01-20E, 6.34%, 5/1/21 | | | 3,840,928 | | | | 4,257,500 | |
Series 01-20G, 6.625%, 7/1/21 | | | 4,067,752 | | | | 4,511,835 | |
Series 03-20J, 4.92%, 10/1/23 | | | 11,480,450 | | | | 12,680,746 | |
Series 07-20F, 5.71%, 6/1/27 | | | 7,774,244 | | | | 8,769,760 | |
| | | | | | | | |
| | | | 243,315,414 | |
| | | | | | | | |
| | | | 256,957,767 | |
| MORTGAGE-RELATED: 9.9% | |
FEDERAL AGENCY CMO & REMIC: 2.1% | |
Dept. of Veterans Affairs | | | | | | | | |
Trust 1995-1A 1, 7.216%, 2/15/25 | | | 745,354 | | | | 869,277 | |
Trust 1995-2C 3A, 8.793%, 6/15/25 | | | 342,078 | | | | 412,129 | |
Fannie Mae | | | | | | | | |
Trust 2001-T5 A3, 7.50%, 6/19/30 | | | 978,617 | | | | 1,097,322 | |
Trust 2002-33 A1, 7.00%, 6/25/32 | | | 3,074,403 | | | | 3,565,283 | |
Trust 2002-86, 6.00%, 8/25/32 | | | 5,860,029 | | | | 6,174,749 | |
Trust 2005-W4 1A2, 6.50%, 8/25/35 | | | 14,337,770 | | | | 16,490,675 | |
Trust 2009-66 ET, 6.00%, 5/25/39 | | | 36,378,374 | | | | 39,950,319 | |
Trust 2001-T7 A1, 7.50%, 2/25/41 | | | 2,873,140 | | | | 3,200,943 | |
Trust 2001-T8 A1, 7.50%, 7/25/41 | | | 2,873,104 | | | | 3,180,612 | |
Trust 2001-T4 A1, 7.50%, 7/25/41 | | | 2,643,487 | | | | 3,078,198 | |
Trust 2001-W3 A, 7.00%, 9/25/41 | | | 2,393,928 | | | | 2,788,947 | |
Trust 2001-T10 A2, 7.50%, 12/25/41 | | | 2,736,595 | | | | 3,029,132 | |
Trust 2002-W6 2A1, 6.658%, 6/25/42 | | | 2,842,737 | | | | 3,212,660 | |
Trust 2002-W8 A2, 7.00%, 6/25/42 | | | 3,317,252 | | | | 3,747,535 | |
Trust 2003-W2 1A1, 6.50%, 7/25/42 | | | 5,514,564 | | | | 6,326,015 | |
Trust 2003-W2 1A2, 7.00%, 7/25/42 | | | 2,239,985 | | | | 2,539,700 | |
| | |
| PAGE 9 § DODGE & COX BALANCED FUND | | See accompanying Notes to Financial Statements |
| | | | |
| PORTFOLIO OF INVESTMENTS | | | December 31, 2011 | |
| | | | | | | | |
| FIXED INCOME SECURITIES (continued) | |
| | |
| | | PAR VALUE | | | VALUE | |
Trust 2003-W4 4A, 7.271%, 10/25/42 | | $ | 3,732,423 | | | $ | 4,327,579 | |
Trust 2004-T1 1A2, 6.50%, 1/25/44 | | | 3,902,707 | | | | 4,381,673 | |
Trust 2004-W2 5A, 7.50%, 3/25/44 | | | 10,164,207 | | | | 11,767,751 | |
Trust 2004-W8 3A, 7.50%, 6/25/44 | | | 1,493,977 | | | | 1,760,426 | |
Trust 2009-11 MP, 7.00%, 3/25/49 | | | 41,528,248 | | | | 47,451,659 | |
Freddie Mac | | | | | | | | |
Series 2100 GS, 6.50%, 12/15/13 | | | 930,840 | | | | 958,950 | |
Series 1078 GZ, 6.50%, 5/15/21 | | | 486,691 | | | | 530,449 | |
Series (GN) 16 PK, 7.00%, 8/25/23 | | | 5,858,704 | | | | 6,354,821 | |
Series T-48 1A4, 5.538%, 7/25/33 | | | 47,887,134 | | | | 52,891,583 | |
Series T-051 1A, 6.50%, 9/25/43 | | | 313,287 | | | | 353,480 | |
Series T-59 1A1, 6.50%, 10/25/43 | | | 18,123,252 | | | | 20,356,433 | |
| | | | | | | | |
| | | | 250,798,300 | |
FEDERAL AGENCY MORTGAGE PASS-THROUGH: 7.8% | |
Fannie Mae, 10 Year | | | | | | | | |
6.00%, 3/1/12 - 4/1/12 | | | 258,849 | | | | 260,453 | |
Fannie Mae, 15 Year | | | | | | | | |
6.00%, 7/1/16 - 3/1/22 | | | 24,382,576 | | | | 26,399,240 | |
6.50%, 1/1/13 - 11/1/18 | | | 33,294,113 | | | | 36,135,358 | |
7.00%, 11/1/18 | | | 2,550,342 | | | | 2,779,543 | |
7.50%, 9/1/15 - 8/1/17 | | | 12,507,367 | | | | 13,425,450 | |
Fannie Mae, 20 Year | | | | | | | | |
6.50%, 1/1/22 - 10/1/26 | | | 9,801,713 | | | | 11,024,133 | |
Fannie Mae, 30 Year | | | | | | | | |
5.50%, 7/1/33 | | | 6,340,795 | | | | 6,931,505 | |
6.00%, 9/1/36 - 3/1/40 | | | 234,481,753 | | | | 259,355,105 | |
6.50%, 12/1/28 - 8/1/39 | | | 152,311,995 | | | | 170,838,447 | |
7.00%, 4/1/37 - 8/1/37 | | | 38,737,220 | | | | 44,236,846 | |
Fannie Mae, Hybrid ARM | | | | | | | | |
2.059%, 1/1/35 | | | 5,673,984 | | | | 5,943,401 | |
2.121%, 9/1/34 | | | 3,669,870 | | | | 3,808,306 | |
2.234%, 12/1/34 | | | 4,912,382 | | | | 5,037,348 | |
2.312%, 8/1/35 | | | 4,137,859 | | | | 4,360,597 | |
2.45%, 1/1/35 | | | 2,574,906 | | | | 2,717,288 | |
5.395%, 8/1/38 | | | 17,830,739 | | | | 18,922,282 | |
Fannie Mae, Multifamily DUS | | | | | | | | |
Pool 555728, 4.021%, 8/1/13 | | | 302,102 | | | | 312,262 | |
Pool 555162, 4.826%, 1/1/13 | | | 13,602,340 | | | | 13,887,362 | |
Pool 760762, 4.89%, 4/1/12 | | | 15,745,000 | | | | 15,661,057 | |
Pool 735387, 4.894%, 4/1/15 | | | 6,973,233 | | | | 7,628,502 | |
Pool 555316, 4.962%, 2/1/13 | | | 2,922,909 | | | | 2,968,950 | |
Pool 555148, 5.032%, 1/1/13 | | | 1,193,123 | | | | 1,211,445 | |
Pool 555806, 5.159%, 10/1/13 | | | 2,184,830 | | | | 2,291,427 | |
Pool 461628, 5.32%, 4/1/14 | | | 9,411,361 | | | | 10,030,920 | |
Pool 462086, 5.355%, 11/1/15 | | | 19,418,871 | | | | 21,416,836 | |
Pool 545387, 5.969%, 1/1/12 | | | 1,450,071 | | | | 1,450,014 | |
Pool 545685, 6.138%, 4/1/12 | | | 2,088,679 | | |
| 2,087,102
|
|
Freddie Mac, 30 Year | | | | | | | | |
6.00%, 2/1/39 | | | 20,545,124 | | | | 22,712,399 | |
Freddie Mac, Hybrid ARM | | | | | | | | |
2.711%, 5/1/34 | | | 6,677,680 | | | | 7,091,886 | |
| | | | | | | | |
| FIXED INCOME SECURITIES (continued) | |
| | |
| | | PAR VALUE | | | VALUE | |
5.35%, 4/1/37 | | $ | 8,691,956 | | | $ | 9,256,971 | |
5.377%, 10/1/38 | | | 12,624,970 | | | | 13,595,744 | |
5.58%, 2/1/38 | | | 19,068,637 | | | | 20,395,887 | |
5.977%, 9/1/37 | | | 13,443,858 | | | | 14,521,124 | |
Freddie Mac Gold, 15 Year | | | | | | | | |
6.00%, 2/1/18 | | | 3,476,023 | | | | 3,776,246 | |
6.50%, 7/1/14 - 3/1/18 | | | 14,902,534 | | | | 16,177,931 | |
7.00%, 4/1/15 | | | 11,113 | | | | 11,448 | |
7.75%, 7/25/21 | | | 815,949 | | | | 950,500 | |
Freddie Mac Gold, 20 Year | | | | | | | | |
6.50%, 10/1/26 | | | 16,037,796 | | | | 17,895,238 | |
Freddie Mac Gold, 30 Year | | | | | | | | |
6.00%, 2/1/38 - 11/1/39 | | | 62,720,453 | | | | 69,124,234 | |
6.50%, 9/1/18 - 4/1/33 | | | 23,599,402 | | | | 26,887,253 | |
7.00%, 11/1/37 - 9/1/38 | | | 34,260,621 | | | | 39,065,844 | |
7.47%, 3/17/23 | | | 176,642 | | | | 204,739 | |
Ginnie Mae, 30 Year | | | | | | | | |
7.50%, 11/15/24 - 10/15/25 | | | 2,163,782 | | | | 2,567,802 | |
7.97%, 4/15/20 - 1/15/21 | | | 1,150,826 | | | | 1,322,640 | |
| | | | | | | | |
| | | | 956,679,065 | |
PRIVATE LABEL CMO & REMIC: 0.0%(e) | |
Union Planters Mortgage Finance Corp. Series 2000-1 A1, 7.70%, 12/25/24 | | | 1,766,208 | | | | 1,913,593 | |
| | | | | | | | |
| | | | 1,209,390,958 | |
| CORPORATE: 11.6% | |
FINANCIALS: 4.8% | |
Ally Financial, Inc. | | | | | | | | |
4.50%, 2/11/14 | | | 45,875,000 | | | | 44,269,375 | |
American International Group, Inc. | | | | | | | | |
4.25%, 9/15/14 | | | 4,750,000 | | | | 4,612,858 | |
8.25%, 8/15/18 | | | 16,335,000 | | | | 17,290,614 | |
Bank of America Corp. | | | | | | | | |
5.30%, 3/15/17 | | | 41,040,000 | | | | 37,014,427 | |
7.625%, 6/1/19 | | | 6,000,000 | | | | 6,205,302 | |
8.00%, 12/15/26(c) | | | 16,960,000 | | | | 15,221,600 | |
6.625%, 5/23/36(c) | | | 33,500,000 | | | | 29,381,610 | |
Barclays PLC(b) (United Kingdom) | | | | | | | | |
5.125%, 1/8/20 | | | 22,435,000 | | | | 23,045,703 | |
Boston Properties, Inc. | | | | | | | | |
5.625%, 4/15/15 | | | 28,825,000 | | | | 31,799,192 | |
Capital One Financial Corp. | | | | | | | | |
6.75%, 9/15/17 | | | 37,585,000 | | | | 42,114,631 | |
CIGNA Corp. | | | | | | | | |
7.65%, 3/1/23 | | | 9,525,000 | | | | 11,134,077 | |
7.875%, 5/15/27 | | | 12,675,000 | | | | 15,657,575 | |
8.30%, 1/15/33 | | | 8,845,000 | | | | 11,369,465 | |
Citigroup, Inc. | | | | | | | | |
7.875%, 10/30/40(c) | | | 16,985,000 | | | | 17,834,250 | |
6.125%, 11/21/17 | | | 48,955,000 | | | | 52,246,294 | |
Equity Residential | | | | | | | | |
4.625%, 12/15/21 | | | 7,500,000 | | | | 7,648,155 | |
| | |
| See accompanying Notes to Financial Statements | | DODGE & COX BALANCED FUND §PAGE 10 |
| | | | |
| PORTFOLIO OF INVESTMENTS | | | December 31, 2011 | |
| | | | | | | | |
| FIXED INCOME SECURITIES (continued) | |
| | |
| | | PAR VALUE | | | VALUE | |
General Electric Co. | | | | | | | | |
5.50%, 1/8/20 | | $ | 32,095,000 | | | $ | 35,313,872 | |
4.375%, 9/16/20 | | | 8,475,000 | | | | 8,660,475 | |
4.625%, 1/7/21 | | | 3,350,000 | | | | 3,475,464 | |
Health Net, Inc. | | | | | | | | |
6.375%, 6/1/17 | | | 10,250,000 | | | | 10,660,000 | |
HSBC Holdings PLC(b) (United Kingdom) | | | | | | | | |
5.10%, 4/5/21 | | | 3,625,000 | | | | 3,851,900 | |
6.50%, 5/2/36 | | | 25,990,000 | | | | 26,260,452 | |
6.50%, 9/15/37 | | | 8,940,000 | | | | 8,824,594 | |
JPMorgan Chase & Co.(c) | | | | | | | | |
8.75%, 9/1/30 | | | 23,042,000 | | | | 29,022,969 | |
Royal Bank of Scotland Group PLC(b) (United Kingdom) | | | | | | | | |
4.375%, 3/16/16 | | | 7,900,000 | | | | 7,536,545 | |
5.625%, 8/24/20 | | | 13,250,000 | | | | 12,708,420 | |
6.125%, 1/11/21 | | | 17,500,000 | | | | 17,264,258 | |
SLM Corp. | | | | | | | | |
8.45%, 6/15/18 | | | 15,550,000 | | | | 16,016,500 | |
Unum Group | | | | | | | | |
7.19%, 2/1/28 | | | 8,305,000 | | | | 9,487,806 | |
7.25%, 3/15/28 | | | 2,030,000 | | | | 2,167,340 | |
6.75%, 12/15/28 | | | 11,368,000 | | | | 12,000,413 | |
Wells Fargo & Co. | | | | | | | | |
6.00%, 11/15/17 | | | 13,695,000 | | | | 15,122,334 | |
| | | | | | | | |
| | | | 585,218,470 | |
INDUSTRIALS: 6.8% | | | | | | | | |
Boston Scientific Corp. | | | | | | | | |
6.25%, 11/15/15 | | | 1,055,000 | | | | 1,169,491 | |
6.40%, 6/15/16 | | | 21,405,000 | | | | 23,998,515 | |
Burlington Northern Santa Fe Corp.(g) | | | | | | | | |
8.251%, 1/15/21 | | | 1,047,421 | | | | 1,267,589 | |
4.967%, 4/1/23 | | | 9,801,003 | | | | 11,026,372 | |
5.72%, 1/15/24 | | | 12,646,359 | | | | 14,462,648 | |
5.629%, 4/1/24 | | | 21,271,218 | | | | 24,082,502 | |
5.342%, 4/1/24 | | | 13,843,903 | | | | 15,656,495 | |
Canadian Pacific Railway Ltd.(b) (Canada) | | | | | | | | |
5.75%, 1/15/42 | | | 4,850,000 | | | | 5,126,988 | |
Comcast Corp. | | | | | | | | |
6.30%, 11/15/17 | | | 5,865,000 | | | | 6,937,110 | |
5.875%, 2/15/18 | | | 1,900,000 | | | | 2,196,907 | |
6.45%, 3/15/37 | | | 4,998,000 | | | | 6,058,791 | |
6.95%, 8/15/37 | | | 1,700,000 | | | | 2,162,924 | |
Cox Communications, Inc. | | | | | | | | |
5.50%, 10/1/15 | | | 4,705,000 | | | | 5,294,217 | |
5.875%, 12/1/16(d) | | | 24,570,000 | | | | 28,367,539 | |
CSX Corp. | | | | | | | | |
9.75%, 6/15/20 | | | 5,231,000 | | | | 7,154,951 | |
Dillard’s, Inc. | | | | | | | | |
7.13%, 8/1/18 | | | 10,586,000 | | | | 10,652,162 | |
| | | | | | | | |
| | |
| | | PAR VALUE | | | VALUE | |
7.875%, 1/1/23 | | $ | 8,660,000 | | | $ | 8,313,600 | |
7.75%, 7/15/26 | | | 50,000 | | | | 47,000 | |
7.75%, 5/15/27 | | | 540,000 | | | | 502,200 | |
7.00%, 12/1/28 | | | 15,135,000 | | | | 13,924,200 | |
Dow Chemical Co. | | | | | | | | |
8.55%, 5/15/19 | | | 21,553,000 | | | | 28,198,393 | |
7.375%, 11/1/29 | | | 15,330,000 | | | | 19,455,492 | |
9.40%, 5/15/39 | | | 4,890,000 | | | | 7,350,169 | |
FedEx Corp. | | | | | | | | |
8.00%, 1/15/19 | | | 6,965,000 | | | | 9,145,679 | |
6.72%, 7/15/23 | | | 13,522,912 | | | | 15,679,300 | |
Ford Motor Credit Co.(g) | | | | | | | | |
5.625%, 9/15/15 | | | 23,250,000 | | | | 24,062,564 | |
5.75%, 2/1/21 | | | 25,200,000 | | | | 26,261,701 | |
HCA, Inc. | | | | | | | | |
6.95%, 5/1/12 | | | 33,940,000 | | | | 34,279,400 | |
6.30%, 10/1/12 | | | 8,210,000 | | | | 8,353,675 | |
6.25%, 2/15/13 | | | 18,390,000 | | | | 18,757,800 | |
6.75%, 7/15/13 | | | 4,600,000 | | | | 4,749,500 | |
Hewlett-Packard Co. | | | | | | | | |
3.30%, 12/9/16 | | | 11,275,000 | | | | 11,512,948 | |
Lafarge SA(b) (France) | | | | | | | | |
6.20%, 7/9/15(d) | | | 4,600,000 | | | | 4,681,323 | |
6.50%, 7/15/16 | | | 32,945,000 | | | | 33,604,197 | |
Liberty Media Corp. | | | | | | | | |
8.50%, 7/15/29 | | | 9,462,000 | | | | 9,178,140 | |
8.25%, 2/1/30 | | | 7,291,000 | | | | 7,008,474 | |
Macy’s, Inc. | | | | | | | | |
7.45%, 10/15/16 | | | 11,410,000 | | | | 13,280,110 | |
6.90%, 1/15/32 | | | 49,699,000 | | | | 54,418,396 | |
News Corp. | | | | | | | | |
6.15%, 3/1/37 | | | 11,000,000 | | | | 12,024,243 | |
6.65%, 11/15/37 | | | 1,638,000 | | | | 1,855,744 | |
Norfolk Southern Corp. | | | | | | | | |
9.75%, 6/15/20 | | | 7,224,000 | | | | 10,452,767 | |
Reed Elsevier PLC(b) (United Kingdom) | | | | | | | | |
8.625%, 1/15/19 | | | 22,475,000 | | | | 28,050,710 | |
Sprint Nextel Corp. | | | | | | | | |
6.00%, 12/1/16 | | | 25,000,000 | | | | 20,750,000 | |
6.875%, 11/15/28 | | | 9,855,000 | | | | 7,021,687 | |
Telecom Italia SPA(b) (Italy) | | | | | | | | |
6.175%, 6/18/14 | | | 3,000,000 | | | | 2,885,595 | |
4.95%, 9/30/14 | | | 7,550,000 | | | | 7,007,940 | |
6.999%, 6/4/18 | | | 2,000,000 | | | | 1,869,792 | |
7.175%, 6/18/19 | | | 15,450,000 | | | | 14,478,319 | |
Time Warner Cable, Inc. | | | | | | | | |
8.75%, 2/14/19 | | | 20,265,000 | | | | 25,876,966 | |
8.25%, 4/1/19 | | | 16,145,000 | | | | 20,278,314 | |
Time Warner, Inc. | | | | | | | | |
7.625%, 4/15/31 | | | 31,950,000 | | | | 41,243,648 | |
7.70%, 5/1/32 | | | 8,080,000 | | | | 10,541,855 | |
| | |
| PAGE 11 § DODGE & COX BALANCED FUND | | See accompanying Notes to Financial Statements |
| | | | |
| PORTFOLIO OF INVESTMENTS | | | December 31, 2011 | |
| | | | | | | | |
| FIXED INCOME SECURITIES (continued) | |
| | |
| | | PAR VALUE | | | VALUE | |
Union Pacific Corp. | | | | | | | | |
5.866%, 7/2/30 | | $ | 31,559,287 | | | $ | 36,253,845 | |
6.176%, 1/2/31 | | | 11,115,778 | | | | 13,435,675 | |
Vulcan Materials Co. | | | | | | | | |
6.50%, 12/1/16 | | | 5,250,000 | | | | 5,420,625 | |
7.50%, 6/15/21 | | | 10,825,000 | | | | 11,691,000 | |
Xerox Corp. | | | | | | | | |
6.35%, 5/15/18 | | | 28,585,000 | | | | 32,199,859 | |
5.625%, 12/15/19 | | | 11,115,000 | | | | 12,141,815 | |
| | | | | | | | |
| | | | | | | 833,859,861 | |
| | | | | | | | |
| | | | | | | 1,419,078,331 | |
TOTAL FIXED INCOME SECURITIES
(Cost $2,688,763,780) | | | $ | 2,885,427,056 | |
SHORT-TERM INVESTMENTS: 2.1% | |
MONEY MARKET FUND: 0.1% | |
SSgA U.S. Treasury Money Market Fund | | | 12,355,957 | | | | 12,355,957 | |
|
REPURCHASE AGREEMENT: 2.0% | |
Fixed Income Clearing Corporation(f) 0.01%, dated 12/30/11, due 1/3/12, maturity value $241,311,268 | | | 241,311,000 | | | | 241,311,000 | |
| | | | | | | | |
TOTAL SHORT-TERM INVESTMENTS
(Cost $253,666,957) | | | $ | 253,666,957 | |
| | | | | | | | |
TOTAL INVESTMENTS
(Cost $11,668,297,606) | | | 100.5 | % | | $ | 12,284,412,640 | |
OTHER ASSETS LESS LIABILITIES | | | (0.5 | %) | | | (63,927,974 | ) |
| | | | | | | | |
| NET ASSETS | | | 100.0 | % | | $ | 12,220,484,666 | |
| | | | | | | | |
| (b) | Security denominated in U.S. dollars |
| (c) | Cumulative preferred security |
| (d) | Security exempt from registration under Rule 144A of the Securities Act of 1933. The security may be resold in transactions exempt from registration, normally to qualified institutional buyers. As of December 31, 2011, all such securities in total represented $33,048,863 or 0.3% of net assets. These securities have been deemed liquid by Dodge & Cox, investment manager, pursuant to procedures approved by the Fund’s Board of Trustees. |
| (f) | Repurchase agreement is collateralized by U.S. Treasury Note 0.375%, 7/31/13. Total collateral value is $246,138,813. |
| (g) | Subsidiary (see below) |
| | In determining a company’s country designation, the Fund generally references the country of incorporation. In cases where the Fund considers the country of incorporation to be a “jurisdiction of convenience” chosen primarily for tax purposes, the Fund uses the country designation of an appropriate broad-based market index. In |
| | that circumstance, two countries are listed—the country of incorporation and the country designated by an appropriate index, respectively. |
| | Fixed income securities are grouped by parent company unless otherwise noted. Actual securities may be issued by the listed parent company or one of its subsidiaries. |
ADR: American Depositary Receipt
ARM: Adjustable Rate Mortgage
CMO: Collateralized Mortgage Obligation
DUS: Delegated Underwriting and Servicing
REMIC: Real Estate Mortgage Investment Conduit
TREASURY FUTURES CONTRACTS
| | | | | | | | | | | | | | | | |
| Description | | Number of
Contracts | | | Expiration
Date | | | Notional
Amount | | | Unrealized
Depreciation | |
10 Year
U.S. Treasury Note – Short Position | | | 3,527 | | | | Mar 2012 | | | $ | (462,477,875 | ) | | $ | (4,036,419 | ) |
| | |
| See accompanying Notes to Financial Statements | | DODGE & COX BALANCED FUND §PAGE 12 |
| | | | |
STATEMENT OF ASSETS AND LIABILITIES | |
| |
| | | December 31, 2011 | |
ASSETS: | | | | |
Investments, at value (cost $11,668,297,606) | | $ | 12,284,412,640 | |
Cash held at broker | | | 5,643,200 | |
Receivable for investments sold | | | 1,067,019 | |
Receivable for Fund shares sold | | | 5,147,980 | |
Dividends and interest receivable | | | 59,580,972 | |
Prepaid expenses and other assets | | | 88,521 | |
| | | | |
| | | 12,355,940,332 | |
| | | | |
LIABILITIES: | |
Payable for Fund shares redeemed | | | 128,625,319 | |
Payable to broker for futures variation margin | | | 991,969 | |
Management fees payable | | | 5,195,058 | |
Accrued expenses | | | 643,320 | |
| | | | |
| | | 135,455,666 | |
| | | | |
NET ASSETS | | $ | 12,220,484,666 | |
| | | | |
NET ASSETS CONSIST OF: | |
Paid in capital | | $ | 13,700,021,602 | |
Undistributed net investment income | | | 2,753,054 | |
Accumulated net realized loss | | | (2,094,368,605 | ) |
Net unrealized appreciation | | | 612,078,615 | |
| | | | |
| | $ | 12,220,484,666 | |
| | | | |
Fund shares outstanding (par value $0.01 each, unlimited shares authorized) | | | 181,187,391 | |
Net asset value per share | | | $67.45 | |
|
STATEMENT OF OPERATIONS | |
| |
| | | Year Ended
December 31, 2011 | |
INVESTMENT INCOME: | | | | |
Dividends (net of foreign taxes of $5,492,842) | | $ | 218,488,850 | |
Interest | | | 170,442,223 | |
| | | | |
| | | 388,931,073 | |
| | | | |
EXPENSES: | | | | |
Management fees | | | 69,707,857 | |
Custody and fund accounting fees | | | 237,279 | |
Transfer agent fees | | | 2,567,826 | |
Professional services | | | 183,184 | |
Shareholder reports | | | 327,220 | |
Registration fees | | | 133,774 | |
Trustees’ fees | | | 214,500 | |
Miscellaneous | | | 436,776 | |
| | | | |
| | | 73,808,416 | |
| | | | |
NET INVESTMENT INCOME | | | 315,122,657 | |
| | | | |
REALIZED AND UNREALIZED GAIN (LOSS): | | | | |
Net realized gain (loss) | | | | |
Investments | | | 223,311,043 | |
Treasury futures contracts | | | (37,713,026 | ) |
Net change in unrealized appreciation/depreciation | | | | |
Investments | | | (675,413,474 | ) |
Treasury futures contracts | | | (15,362,145 | ) |
| | | | |
Net realized and unrealized loss | | | (505,177,602 | ) |
| | | | |
NET DECREASE IN NET ASSETS FROM OPERATIONS | | $ | (190,054,945 | ) |
| | | | |
| | | | | | | | |
STATEMENT OF CHANGES IN NET ASSETS | |
| | |
| | | Year Ended
December 31, 2011 | | | Year Ended
December 31, 2010 | |
OPERATIONS: | | | | | | | | |
Net investment income | | $ | 315,122,657 | | | $
| 316,855,030
|
|
Net realized gain | | | 185,598,017 | | |
| 212,931,966
|
|
Net change in unrealized appreciation | | | (690,775,619 | ) | |
| 1,159,074,272
|
|
| | | | | | | | |
| | | (190,054,945 | ) | |
| 1,688,861,268
|
|
| | | | | | | | |
| | |
DISTRIBUTIONS TO SHAREHOLDERS FROM: | | | | | | | | |
Net investment income | | | (316,115,114 | ) | |
| (341,035,498
| )
|
Net realized gain | | | — | | |
| —
|
|
| | | | | | | | |
Total distributions | | | (316,115,114 | ) | |
| (341,035,498
| )
|
| | | | | | | | |
| | |
FUND SHARE TRANSACTIONS: | | | | | | | | |
Proceeds from sale of shares | | | 1,229,782,857 | | |
| 1,306,649,783
|
|
Reinvestment of distributions | | | 298,241,031 | | |
| 323,107,024
|
|
Cost of shares redeemed | | | (3,650,564,512 | ) | |
| (3,576,618,320
| )
|
| | | | | | | | |
Net decrease from Fund share transactions | | | (2,122,540,624 | ) | |
| (1,946,861,513
| )
|
| | | | | | | | |
Total decrease in net assets | | | (2,628,710,683 | ) | |
| (599,035,743
| )
|
| | |
NET ASSETS: | | | | | | | | |
Beginning of period | | | 14,849,195,349 | | |
| 15,448,231,092
|
|
| | | | | | | | |
End of year (including undistributed net investment income of $2,753,054 and $3,745,511, respectively) | | $ | 12,220,484,666 | | | $
| 14,849,195,349
|
|
| | | | | | | | |
| | |
SHARE INFORMATION: | | | | | | | | |
Shares sold | | | 17,433,979 | | |
| 19,923,219
|
|
Distributions reinvested | | | 4,340,712 | | |
| 4,912,047
|
|
Shares redeemed | | | (52,048,379 | ) | |
| (54,624,822
| )
|
| | | | | | | | |
Net decrease in shares outstanding | | | (30,273,688 | ) | | | (29,789,556 | ) |
| | | | | | | | |
| | |
| PAGE 13 § DODGE & COX BALANCED FUND | | See accompanying Notes to Financial Statements |
NOTES TO FINANCIAL STATEMENTS
NOTE 1—ORGANIZATION AND SIGNIFICANT ACCOUNTING POLICIES
Dodge & Cox Balanced Fund (the “Fund”) is one of the series constituting the Dodge & Cox Funds (the “Trust” or the “Funds”). The Trust is organized as a Delaware statutory trust and is registered under the Investment Company Act of 1940, as amended, as a diversified, open-end management investment company. The Fund commenced operations on June 26, 1931, and seeks regular income, conservation of principal, and an opportunity for long-term growth of principal and income. Risk considerations and investment strategies of the Fund are discussed in the Fund’s Prospectus.
The financial statements have been prepared in conformity with accounting principles generally accepted in the United States of America, which require the use of estimates and assumptions by management. Actual results may differ from those estimates. Significant accounting policies are as follows:
Security valuation The Fund’s net assets are valued as of the close of trading on the New York Stock Exchange (NYSE), generally 4:00 p.m. Eastern Time, each day that the NYSE is open for business. Stocks are valued at the official quoted close price or the last sale of the day at the close of the NYSE or, if not available, at the mean between the exchange-listed bid and ask prices. A security that is listed or traded on more than one exchange is valued at the quotation on the exchange determined to be the primary market for such security. Fixed income securities are priced on the basis of valuations furnished by independent pricing services which utilize both dealer-supplied valuations and pricing models. Under certain circumstances, fixed income securities that are not valued by pricing services are temporarily valued by the investment manager utilizing both dealer-supplied valuations and pricing models. Pricing models may consider quoted prices for similar securities, interest rates, prepayment speeds, and credit risk. Futures contracts are valued daily at the closing settlement price on the exchange. Security values are not discounted based on the size of the Fund’s position. Securities for which market quotations are not readily available are valued at fair value as determined in good faith by or under the direction of
the Board of Trustees. Short-term securities are valued at amortized cost which approximates current value. All securities held by the Fund are denominated in U.S. dollars.
Security transactions, investment income, expenses, and distributions Security transactions are recorded on the trade date. Realized gains and losses on securities sold are determined on the basis of identified cost.
Dividend income and corporate action transactions are recorded on the ex-dividend date, or when the Fund first learns of the dividend/corporate action if the ex-dividend date has passed. Withholding taxes on foreign dividends have been provided for in accordance with the Fund’s understanding of the applicable country’s tax rules and rates. Non-cash dividends included in dividend income, if any, are recorded at the fair market value of the securities received. Dividends characterized as return of capital are recorded as a reduction of cost of investments and/or realized gain.
Interest income is recorded on the accrual basis. Interest income includes coupon interest, amortization of premium and accretion of discount on debt securities, and gain/loss on paydowns of mortgage-backed securities. The ability of the issuers of the debt securities held by the Fund to meet their obligations may be affected by economic developments in a specific industry, state, or region. Debt obligations may be placed on non-accrual status and related interest income may be reduced by ceasing current accruals and writing off interest receivables when the collection of all or a portion of interest has become doubtful. A debt obligation is removed from non-accrual status when the issuer resumes interest payments or when collectibility of interest is reasonably assured.
Expenses are recorded on the accrual basis. Most expenses of the Trust can be directly attributed to a specific series. Expenses which cannot be directly attributed are allocated among the Funds in the Trust based on relative net assets or other expense methodologies determined by the nature of the expense.
Distributions to shareholders are recorded on the ex-dividend date.
DODGE & COX BALANCED FUND §PAGE 14
NOTES TO FINANCIAL STATEMENTS
Repurchase agreements The Fund enters into repurchase agreements, secured by U.S. government or agency securities, which involve the purchase of securities from a counterparty with a simultaneous commitment to resell the securities at an agreed-upon date and price. It is the Fund’s policy that its custodian take possession of the underlying collateral securities, the fair value of which exceeds the principal amount of the repurchase transaction, including accrued interest, at all times. In the event of default by the counterparty, the Fund has the contractual right to liquidate the collateral securities and to apply the proceeds in satisfaction of the obligation.
Treasury Futures Contracts Futures contracts involve an obligation to purchase or sell (depending on whether the Fund has entered a long or short futures contract, respectively) an asset at a future date, at a price set at the time of the contract. Upon entering into a futures contract, the Fund is required to deposit an amount of cash or liquid assets (referred to as initial margin) in a segregated account with the clearing broker. Subsequent payments (referred to as variation margin) to and from the clearing broker are made on a daily basis based on changes in the market value of futures contracts. Futures are traded publicly and their market value changes daily. Changes in the market value of open futures contracts are recorded as unrealized appreciation or depreciation in the Statement of Operations. Realized gains and losses on futures contracts are recorded in the Statement of Operations at the closing or expiration of futures contracts. Cash deposited with a broker as initial margin is recorded on the Statement of Assets and Liabilities. A receivable and/or payable to brokers for daily variation margin is also recorded on the Statement of Assets and Liabilities.
Investments in futures contracts may include certain risks, which may be different from, and potentially greater than, those of the underlying securities. To the extent the Fund uses Treasury futures, it is exposed to additional volatility and potential losses resulting from leverage.
The Fund has entered into short Treasury futures contracts to assist with the management of the portfolio’s interest rate exposure. During the year ended
December 31 2011, the Fund remained consistently invested in short Treasury futures contracts. Notional values during the year ranged from approximately 3% to 4% of net assets.
Indemnification Under the Trust’s organizational documents, its officers and trustees are indemnified against certain liabilities arising out of the performance of their duties to the Trust. In addition, in the normal course of business the Trust enters into contracts that provide general indemnities to other parties. The Trust’s maximum exposure under these arrangements is unknown as this would involve future claims that may be made against the Trust that have not yet occurred.
NOTE 2—VALUATION MEASUREMENTS
Various inputs are used in determining the value of the Fund’s investments. These inputs are summarized in the three broad levels listed below.
| § | | Level 1: Quoted prices in active markets for identical securities |
| § | | Level 2: Other significant observable inputs (including quoted prices for similar securities, market indices, interest rates, credit risk, etc.) |
| § | | Level 3: Significant unobservable inputs (including Fund management’s assumptions in determining the fair value of investments) |
The inputs or methodology used for valuing securities are not necessarily an indication of the risk associated with investing in those securities.
PAGE 15 § DODGE & COX BALANCED FUND
NOTES TO FINANCIAL STATEMENTS
The following is a summary of the inputs used to value the Fund’s holdings as of December 31, 2011:
| | | | | | | | |
| Classification(a) | | LEVEL 1
(Quoted Prices) | | | LEVEL 2
(Other Significant
Observable Inputs) | |
Securities | | | | | | | | |
Common Stocks(b) | | $ | 9,145,318,627 | | | $ | — | |
Fixed Income Securities | | | | | | | | |
U.S. Treasury | | | 13,642,353 | | | | — | |
Government Related | | | — | | | | 243,315,414 | |
Mortgage-Related Securities | | | — | | | | 1,209,390,958 | |
Corporate | | | — | | | | 1,419,078,331 | |
Money Market Fund | | | 12,355,957 | | | | — | |
Repurchase Agreement | | | — | | | | 241,311,000 | |
| | | | | | | | |
| | | | | | | | |
Total Securities | | $ | 9,171,316,937 | | | $ | 3,113,095,703 | |
| | | | | | | | |
Other Financial Instruments | | | | | | | | |
Futures Contracts | | $ | (4,036,419 | )(c) | | $ | — | |
| | | | | | | | | |
| (a) | There were no transfers between Level 1 and Level 2 during the year ended December 31, 2011. There were no Level 3 securities at December 31, 2011 and 2010, and there were no transfers to Level 3 during the year. |
| (b) | All common stocks held in the Fund are Level 1 securities. For a detailed break-out of common stocks by major industry classification, please refer to the Portfolio of Investments. |
| (c) | Represents unrealized depreciation on futures contracts. |
NOTE 3—RELATED PARTY TRANSACTIONS
Management fees Under a written agreement approved by a unanimous vote of the Board of Trustees, the Fund pays an annual management fee of 0.50% of the Fund’s average daily net assets to Dodge & Cox, investment manager of the Fund.
Fund officers and trustees All officers and three of the trustees of the Trust are officers or employees of Dodge & Cox. The Trust pays a fee only to those trustees who are not affiliated with Dodge & Cox.
NOTE 4—INCOME TAX INFORMATION AND DISTRIBUTIONS TO SHAREHOLDERS
A provision for federal income taxes is not required since the Fund intends to continue to qualify as a regulated investment company under Subchapter M of the Internal Revenue Code and distribute all of its taxable income to shareholders. Distributions are determined in accordance with income tax regulations, and such amounts may differ
from net investment income and realized gains for financial reporting purposes. Financial reporting records are adjusted for permanent book/tax differences to reflect tax character.
Book/tax differences are primarily due to differing treatments of wash sales, net short-term realized gain (loss), and Treasury futures contracts. At December 31, 2011, the cost of investments for federal income tax purposes was $11,681,592,626.
Distributions during the years ended December 31, 2011 and 2010 were characterized as follows for federal income tax purposes:
| | | | | | | | |
| | | Year Ended
December 31, 2011 | | | Year Ended
December 31, 2010 | |
Ordinary income | | | $316,115,114 | | | | $341,035,498 | |
| | | ($1.620 per share) | | | | ($1.520 per share) | |
| | |
Long-term capital gain | | | — | | | | — | |
At December 31, 2011, the tax basis components of distributable earnings were as follows:
| | | | |
Unrealized appreciation | | $ | 1,840,595,775 | |
Unrealized depreciation | | | (1,237,775,761 | ) |
| | | | |
Net unrealized appreciation | | | 602,820,014 | |
Undistributed ordinary income | | | 2,753,054 | |
Capital Loss carryforward(a) | | | (2,085,110,003 | ) |
| (a) | Represents accumulated capital loss as of December 31, 2011, which may be carried forward to offset future capital gains. During 2011, the Fund utilized $174,362,715 of the carryforward. If not utilized, the remaining capital loss carryforward will expire in 2017. |
Under the recently enacted Regulated Investment Company Modernization Act of 2010, capital losses incurred by the Fund after January 1, 2011, will not be subject to expiration. In addition, such losses must be utilized prior to the losses incurred in the years preceding enactment. (The Fund had net capital gains in 2011.)
Fund management has reviewed the tax positions for open periods (three years and four years, respectively, from filing the Fund’s Federal and State tax returns) as applicable to the Fund, and has determined that no provision for income tax is required in the Fund’s financial statements.
DODGE & COX BALANCED FUND §PAGE 16
NOTES TO FINANCIAL STATEMENTS
NOTE 5—LOAN FACILITIES
Pursuant to an exemptive order issued by the Securities and Exchange Commission (SEC), the Fund may participate in an interfund lending facility (Facility). The Facility allows the Fund to borrow money from or loan money to the Funds. Loans under the Facility are made for temporary or emergency purposes, such as to fund shareholder redemption requests. Interest on borrowings is the average of the current repurchase agreement rate and the bank loan rate. There was no activity in the Facility during the period.
All Funds in the Trust participate in a committed credit facility (Line of Credit) with State Street Bank and Trust Company, to be utilized for temporary or emergency purposes to fund shareholder redemptions or for other short-term liquidity purposes. The total amount of the Line of Credit was increased from $200 million to $500 million on June 28, 2011. The maximum amount available to the Fund is $250 million. Each Fund pays an annual commitment fee on its pro-rata portion of the Line of Credit. The Fund’s commitment fee for the year ended December 3, 2011, amounted to $43,606 and is reflected as a Miscellaneous Expense in the Statement of Operations. Interest on borrowings is charged at the prevailing rate. There were no borrowings on the Line of Credit during the period.
NOTE 6—PURCHASES AND SALES OF INVESTMENTS
For the year ended December 31, 2011, purchases and sales of securities, other than short-term securities and U.S. government securities, aggregated $2,102,817,511 and $3,873,576,349, respectively. For the year ended December 31, 2011, purchases and sales of U.S. government securities aggregated $694,714,774 and $1,023,653,319, respectively.
NOTE 7—SUBSEQUENT EVENTS
Fund management has determined that no material events or transactions occurred subsequent to December 31, 2011, and through the date of the Fund’s financial statements issuance, which require additional disclosure in the Fund’s financial statements.
PAGE 17 § DODGE & COX BALANCED FUND
FINANCIAL HIGHLIGHTS
| | | | | | | | | | | | | | | | | | | | |
SELECTED DATA AND RATIOS (for a share outstanding throughout each year) | | Year Ended December 31, | |
| | | 2011 | | | 2010 | | | 2009 | | | 2008 | | | 2007 | |
| | | | |
Net asset value, beginning of year | | | $70.22 | | | | $64.03 | | | | $51.26 | | | | $81.00 | | | | $87.08 | |
Income from investment operations: | | | | | | | | | | | | | | | | | | | | |
Net investment income | | | 1.62 | | | | 1.41 | | | | 1.46 | | | | 1.99 | | | | 2.35 | |
Net realized and unrealized gain (loss) | | | (2.77 | ) | | | 6.30 | | | | 12.82 | | | | (28.44 | ) | | | (0.78 | ) |
| | | | |
Total from investment operations | | | (1.15 | ) | | | 7.71 | | | | 14.28 | | | | (26.45 | ) | | | 1.57 | |
| | | | |
Distributions to shareholders from: | | | | | | | | | | | | | | | | | | | | |
Net investment income | | | (1.62 | ) | | | (1.52 | ) | | | (1.51 | ) | | | (1.95 | ) | | | (2.37 | ) |
Net realized gain | | | — | | | | — | | | | — | | | | (1.34 | ) | | | (5.28 | ) |
| | | | |
Total distributions | | | (1.62 | ) | | | (1.52 | ) | | | (1.51 | ) | | | (3.29 | ) | | | (7.65 | ) |
| | | | |
Net asset value, end of year | | | $67.45 | | | | $70.22 | | | | $64.03 | | | | $51.26 | | | | $81.00 | |
| | | | |
Total return | | | (1.66 | )% | | | 12.23 | % | | | 28.37 | % | | | (33.57 | )% | | | 1.74 | % |
Ratios/supplemental data: | | | | | | | | | | | | | | | | | | | | |
Net assets, end of year (millions) | | | $12,220 | | | | $14,849 | | | | $15,448 | | | | $14,676 | | | | $26,932 | |
Ratio of expenses to average net assets | | | 0.53 | % | | | 0.53 | % | | | 0.53 | % | | | 0.53 | % | | | 0.53 | % |
Ratio of net investment income to average net assets | | | 2.26 | % | | | 2.13 | % | | | 2.61 | % | | | 2.85 | % | | | 2.59 | % |
Portfolio turnover rate | | | 19 | % | | | 12 | % | | | 19 | % | | | 27 | % | | | 27 | % |
See accompanying Notes to Financial Statements
REPORT OF INDEPENDENT REGISTERED PUBLIC ACCOUNTING FIRM
To the Trustees of Dodge & Cox Funds and Shareholders of Dodge & Cox Balanced Fund
In our opinion, the accompanying statement of assets and liabilities, including the portfolio of investments, and the related statements of operations and of changes in net assets and the financial highlights present fairly, in all material respects, the financial position of Dodge & Cox Balanced Fund (the “Fund”, one of the series constituting Dodge & Cox Funds) at December 31, 2011, the results of its operations for the year then ended, the changes in its net assets for each of the two years in the period then ended and the financial highlights for each of the five years in the period then ended, in conformity with accounting principles generally accepted in the United States of America. These financial statements and financial highlights (hereafter referred to as “financial statements”) are the responsibility of the Fund’s management; our responsibility is to express an opinion on these financial statements based on our audits. We conducted our audits of these financial statements in accordance with the standards of the Public Company Accounting Oversight Board (United States). Those standards require that we plan and perform the audit to obtain reasonable assurance about whether the financial statements are free of material misstatement. An audit includes examining, on a test basis, evidence supporting the amounts and disclosures in the financial statements, assessing the accounting principles used and significant estimates made by management, and evaluating the overall financial statement presentation. We believe that our audits, which included confirmation of securities at December 31, 2011, by correspondence with the custodian and brokers, provide a reasonable basis for our opinion.
PricewaterhouseCoopers LLP
San Francisco, California
February 21, 2012
DODGE & COX BALANCED FUND §PAGE 18
SPECIAL 2011 TAX INFORMATION
(unaudited)
The following information is provided pursuant to provisions of the Internal Revenue Code:
The Fund designates $223,950,826 of its distributions paid to shareholders in 2011 as qualified dividends (treated for federal income tax purposes in the hands of shareholders as taxable at a maximum rate of 15%).
For shareholders that are corporations, the Fund designates 46% of its ordinary dividends paid to shareholders in 2011 as dividends from domestic corporations eligible for the corporate dividends received deduction, provided that the shareholder otherwise satisfies applicable requirements to claim that deduction.
BOARD APPROVAL OF FUNDS’ INVESTMENT MANAGEMENT AGREEMENTS AND MANAGEMENT FEES (unaudited)
The Board of Trustees is responsible for overseeing the performance of the Dodge & Cox Funds’ investment manager and determining whether to continue the Investment Management Agreements between the Funds and Dodge & Cox each year (the “Agreements”). At a meeting of the Board of Trustees of the Trust held on December 14, 2011, the Trustees, by a unanimous vote (including a separate vote of those Trustees who are not “interested persons” (as defined in the Investment Company Act of 1940) (the “Independent Trustees”)), approved the renewal of the Agreements for an additional one-year term through December 31, 2012. During the course of the year, the Board received a wide variety of materials relating to the services provided by Dodge & Cox and the performance of each of the Funds.
INFORMATION RECEIVED
In advance of the meeting, the Board, including each of the Independent Trustees, requested, received, and reviewed materials relating to the Agreements and the services provided by Dodge & Cox. The Independent Trustees retained Morningstar® to prepare an independent expense and performance summary for each Fund and comparable funds managed by other advisers identified by Morningstar®. The Morningstar® materials included information regarding advisory fee rates, expense
ratios, and transfer agency, custodial, and distribution expenses, as well as appropriate performance comparisons to a Fund’s peer group and an index or combination of indices. The Morningstar® materials also included a comparison of expenses of various share classes offered by comparable funds. The materials reviewed by the Board contained information concerning, among other things, Dodge & Cox’s profitability, financial results and condition, advisory fee revenue, and separate account advisory fee schedules. The Board additionally considered the Funds’ brokerage commissions, turnover rates, sales and redemption data for the Funds, and the fact that Dodge & Cox paid for all third party research used in managing the Funds out of its profits, rather than using “soft dollars” generated from portfolio trading commissions. The Board received and reviewed a memorandum summarizing information provided throughout the year regarding Dodge & Cox’s services to the Funds as well as information regarding (i) the different fees, services, costs, and risks associated with separate accounts managed by Dodge & Cox as compared to the Dodge & Cox Funds; (ii) the differences in performance between the Funds and separately managed accounts; and (iii) Fund share subscription and redemption activity. In addition, the Board requested and received additional information regarding attribution analyses and recent Fund performance.
Throughout the process of reviewing the services provided by Dodge & Cox and preparing for the meeting, the Independent Trustees found Dodge & Cox to be open, forthright, detailed, and very helpful in answering questions about all issues.
The Board received copies of the Agreements and a memorandum from the independent legal counsel to the Independent Trustees discussing the factors generally regarded as appropriate to consider in evaluating advisory arrangements. The Trust’s Contract Review Committee, consisting solely of Independent Trustees, met with the independent legal counsel on November 3, 2011, and again on December 14, 2011, to discuss whether to renew the Agreements. The Board, including the Independent Trustees, subsequently concluded that the existing Agreements are fair and reasonable and voted to approve the Agreements.
PAGE 19 § DODGE & COX BALANCED FUND
In considering the Agreements, the Board, including the Independent Trustees, did not identify any single factor or particular information as all-important or controlling. In reaching the decision to approve the Agreements, the Board considered several factors, discussed below, to be key factors and reached the conclusions described below.
NATURE, QUALITY, AND EXTENT OF THE SERVICES
The Board considered that Dodge & Cox provides a wide range of services to the Funds in addition to portfolio management and that the quality of these services has been excellent in all respects. The extensive nature of services provided by Dodge & Cox has been documented in materials provided to the Board and in presentations made to the Board throughout the year. In particular, the Board considered the nature, quality, and extent of portfolio management, administrative, and shareholder services performed by Dodge & Cox. With regard to portfolio management services, the Board considered Dodge & Cox’s established long-term history of care and conscientiousness in the management of the Funds; its demonstrated consistency in investment approach and depth; the background and experience of the Dodge & Cox Investment Policy Committee, International Investment Policy Committee, Global Investment Policy Committee, Fixed Income Investment Policy Committee, and research analysts responsible for managing the Funds; its methods for assessing the regulatory and investment climate in various jurisdictions; Dodge & Cox’s overall high level of attention to its core investment management function; and its commitment to the Funds and their shareholders.
In the area of administrative and shareholder services, the Board considered the excellent quality of Dodge & Cox’s work in areas such as compliance, legal services, trading, proxy voting, oversight of the Funds’ transfer agent and custodian, tax compliance, and shareholder communication through its web site and other means. The Board also noted Dodge & Cox’s diligent disclosure policy, its favorable compliance record and its reputation as a trusted, shareholder-friendly mutual fund family.
In addition, the Board considered that Dodge & Cox manages approximately $112 billion in Fund assets with fewer professionals than most comparable funds, and that on average these professionals have more experience and longer tenure than investment professionals at comparable funds. The Board also noted that Dodge & Cox is an investment research-oriented firm with no other business endeavors to distract management’s attention from its research efforts, and that its investment professionals adhere to a consistent investment approach across the Funds. The Board further considered the Funds’ favorable stewardship and Gold ratings by Morningstar®. The Board concluded that it was satisfied with the nature, extent, and quality of investment management and other services provided to the Funds by Dodge & Cox.
INVESTMENT PERFORMANCE
The Board considered short-term and long-term investment performance for each Fund (including periods of outperformance or underperformance) as compared to both relevant indices and the performance of such Fund’s peer group. In light of recent market volatility, the Board also reviewed recent performance in the context of long-term investment goals. The Board noted that, although the Fund’s returns over recent periods have been disappointing, its longer-term performance is favorable relative to its peers and benchmark index. The Board determined after extensive review and inquiry that Dodge & Cox’s historic, long-term, team-oriented bottom up investment approach remains consistent and that Dodge & Cox continues to be distinguished by its integrity, thoroughness, and independence.
The Board noted that longer-term comparisons demonstrated favorable performance in comparison to peer group funds and was in keeping with the stated goals in the Funds’ Prospectus. The Board considered that the performance of the Funds is the result of a team-oriented investment management process that emphasizes a long-term investment horizon, comprehensive independent research, price discipline, and focus. The Board also considered that the investment performance delivered by Dodge & Cox to the Funds appeared to be consistent with the relevant performance delivered for other (non-fund) clients of Dodge & Cox. The Board concluded that
DODGE & COX BALANCED FUND §PAGE 20
Dodge & Cox has delivered favorable long-term performance for Fund investors consistent with the long-term investment strategies being pursued by the Funds.
COSTS AND ANCILLARY BENEFITS
Costs of Services to Funds: Fees and Expenses. The Board considered each Fund’s management fee rate and expense ratio relative to similar mutual funds and relative to management fees charged by Dodge & Cox to other clients. In particular, the Board considered that the Funds continue to be substantially below their peer group median in expense ratios and management fee rates and that many media and industry reports specifically comment on the low expense ratios of the Funds, which have been a defining characteristic of the Funds for many years. The Board also evaluated the operating structures of the Funds and Dodge & Cox, noting that Dodge & Cox does not charge front-end sales commissions or distribution fees and bears, among other things, third party research and distribution-related costs, reimbursement for recordkeeping and administrative costs to third-party retirement plan administrators, and administrative and office overhead. The Board noted that expenses are well below industry averages. The Board also considered that the Funds receive numerous administrative, regulatory compliance, and shareholder support services from Dodge & Cox without any additional administrative fee and the fact that the Funds have relatively low transaction costs and portfolio turnover rates. The Board reviewed Morningstar® data showing that the few peer group funds with lower expense ratios often have other share classes with significantly higher expense ratios.
In comparing the range of services provided to the Funds under the Agreements to the services Dodge & Cox provides under its separate advisory client agreements, the Board determined that part of the difference is due to higher risks as well as legal and management costs of sponsoring the Funds and noted that separate accounts incur other expenses that should be considered when comparing Fund expenses to separate account expenses. In light of that, the greater risks and regulatory burdens associated with sponsoring a high profile mutual fund business, and the fact that these are different lines of
business, there is reasonable justification for differences in fee rates charged between the two. The Board further noted that, with respect to non-U.S. funds sponsored and managed by Dodge & Cox that are comparable to the Funds in many respects, the fee rates charged by Dodge & Cox are the same as or higher than the fee rates charged to the Funds. The Board concluded that costs incurred by the Funds for the services they receive (including the management fee paid to Dodge & Cox) are reasonable and that the fees are acceptable based upon the qualifications, experience, reputation, and performance of Dodge & Cox and the low overall expense ratios of the Funds.
Profitability and Costs of Services to Dodge & Cox; “Fall-out” Benefits. The Board reviewed reports of Dodge & Cox’s financial position, profitability, and estimated overall value, and considered Dodge & Cox’s overall profitability within its context as a private, employee-owned S-Corporation and relative to the favorable services provided. The Board noted that net revenues for 2011 are projected to increase from 2010. The Board noted in particular that Dodge & Cox’s profits are not generated by high fee rates, but reflect an extraordinarily streamlined, efficient, and focused business approach toward investment management. The Board recognized the importance of Dodge & Cox’s profitability—which is derived solely from management fees and does not include other business ventures—to maintain its independence, stability, company culture and ethics, and management continuity. The Board also considered that the compensation/profit structure at Dodge & Cox is vital for remaining independent and facilitating retention of its management and investment professionals.
The Board considered potential “fall-out” benefits (including the receipt of research from unaffiliated brokers) that Dodge & Cox might receive as a result of its association with the Funds and determined that they are not significant. The Board also noted the extent of additional administrative services performed by Dodge & Cox for the Funds, and that the magnitude of costs and risks borne by Dodge & Cox in rendering advisory services to the Funds (including risks in the regulatory compliance, securities valuation, and investment
PAGE 21 § DODGE & COX BALANCED FUND
management processes) are continuing to increase. The Board concluded that the profitability of Dodge & Cox’s relationship with the Funds (including fall-out benefits) was fair and reasonable.
THE BENEFIT OF ECONOMIES OF SCALE
The Board considered whether there have been economies of scale with respect to the management of each Fund, whether the Funds have appropriately benefited from any economies of scale, and whether the management fee rate is reasonable in relation to the Fund assets and any economies of scale that may exist. In the Board’s view, any consideration of economies of scale must take account of the Funds’ low fee structure and the considerable efficiencies of the Funds’ organization and fee structure that has been realized by shareholders at the outset of their investment (i.e., from the first dollar). The Board noted that Dodge & Cox has shared economies of scale by adding or enhancing services to the Funds over time, and that the internal costs of providing investment management, up-to-date technology, administrative, and compliance services to the Funds are continuing to increase. For example, Dodge & Cox has increased its global research staff and investment resources over the years to address the increased complexity of investing in multinational and non-U.S. companies. In addition, Dodge & Cox has made substantial expenditures in other staff and infrastructure to enable it to integrate credit and equity analyses and to be able to implement its strategy in a more effective and secure manner. The Board determined that the Funds provide access by small investors to high quality investment management at a relatively low cost. The Board’s decision to renew the Agreements was made after consideration of economies of scale and review of peer group fund expense ratios and historical expense ratio patterns for the Funds. The Board concluded that the current Dodge & Cox fee structure is fair and reasonable and adequately shares economies of scale that may exist.
CONCLUSION
Based on their evaluation of all material factors and assisted by the advice of independent legal counsel to the Independent Trustees, the Board, including the
Independent Trustees, concluded that the advisory fee structure was fair and reasonable, that each Fund was paying a competitive fee for the services provided, that the scope and quality of Dodge & Cox’s services has provided substantial value for Fund shareholders over the long term, and that approval of the Agreements was in the best interests of each Fund and its shareholders.
FUND HOLDINGS
The Fund provides a complete list of its holdings four times each fiscal year, as of the end of each quarter. The Fund files the lists with the SEC on Form N-CSR (second and fourth quarters) and Form N-Q (first and third quarters). Shareholders may view the Fund’s Forms N-CSR and N-Q on the SEC’s website at www.sec.gov. Forms N-CSR and N-Q may also be reviewed and copied at the SEC’s Public Reference Room in Washington, DC. Information regarding the operations of the Public Reference Room may be obtained by calling 1-202-942-8090 (direct) or 1-800-732-0330 (general SEC number). A complete list of the Fund’s quarter-end holdings is also available at www.dodgeandcox.com on or about 15 days following each quarter end and remains available on the website until the list is updated in the subsequent quarter.
PROXY VOTING
For a free copy of the Fund’s proxy voting policies and procedures, please call 1-800-621-3979, visit the Fund’s website at www.dodgeandcox.com, or visit the SEC’s website at www.sec.gov. Information regarding how the Fund voted proxies relating to portfolio securities during the most recent 12-month period ending June 30 is also available at www.dodgeandcox.com or at www.sec.gov.
HOUSEHOLD MAILINGS
The Fund routinely mails shareholder reports and summary prospectuses to shareholders and, on occasion, proxy statements. In order to reduce the volume of mail, when possible, only one copy of these documents will be sent to shareholders who are part of the same family and share the same residential address.
If you have a direct account with the Funds and you do not want the mailing of shareholder reports and summary prospectuses combined with other members in your household, contact the Funds at 1-800-621-3979. Your request will be implemented within 30 days.
DODGE & COX BALANCED FUND §PAGE 22
DODGE & COX FUNDS—EXECUTIVE OFFICER & TRUSTEE INFORMATION
| | | | | | |
Name (Age) and
Address* | | Position with Trust (Year of Election or
Appointment) | | Principal Occupation During Past 5 Years | | Other Directorships Held by Trustees |
| INTERESTED TRUSTEES AND OFFICERS |
| Kenneth E. Olivier (59) | | Chairman, President, and Trustee (Trustee since 2005) | | Chairman (since March 2011), Chief Executive Officer (since 2010), President (until March 2011), and Director of Dodge & Cox; Portfolio Manager and member of Investment Policy Committee (IPC) | | — |
| Dana M. Emery (50) | | Senior Vice President and Trustee (Trustee since 1993) | | Co-President (since March 2011), Executive Vice President (until March 2011), and Director of Dodge & Cox; Director of Fixed Income, Portfolio Manager, and member of Fixed Income Investment Policy Committee (FIIPC) | | — |
| John A. Gunn (68) | | Trustee (Trustee since 1985) | | Chairman Emeritus (since March 2011), Chairman (2007-March 2011), Chief Executive Officer (2007-2010), and Director of Dodge & Cox; Portfolio Manager and member of IPC, Global Investment Policy Committee (GIPC) (since 2008), International Investment Policy Committee (IIPC), and FIIPC (until 2008) | | — |
| Charles F. Pohl (53) | | Senior Vice President (Officer since 2004) | | Co-President (since March 2011), Senior Vice President (until March 2011), and Director of Dodge & Cox; Chief Investment Officer (since 2007), Director of Credit Research, Portfolio Manager, Investment Analyst, and member of IPC, GIPC (since 2008), IIPC (since 2007), and FIIPC | | — |
| Diana S. Strandberg (52) | | Senior Vice President (Officer since 2006) | | Senior Vice President (since May 2011), Vice President (until May 2011), and Director (since May 2011) of Dodge & Cox; Director of International Equity (since 2009), Portfolio Manager, Investment Analyst, and member of IPC, GIPC (since 2008), and IIPC | | — |
| David H. Longhurst (54) | | Treasurer (Officer since 2006) | | Vice President (since 2008) and Assistant Treasurer (since 2007) of Dodge & Cox; Fund Administration and Accounting Senior Manager (until 2007) | | — |
| Thomas M. Mistele (58) | | Secretary (Officer since 1998) | | Chief Operating Officer, Director, Secretary, Senior Counsel (since May 2011), and General Counsel (until May 2011) of Dodge & Cox | | — |
| Katherine M. Primas (36) | | Chief Compliance Officer (Officer since 2009) | | Chief Compliance Officer of Dodge & Cox (since 2008) and Associate Chief Compliance Officer of Dodge & Cox (until 2008) | | — |
| INDEPENDENT TRUSTEES |
| William F. Ausfahl (71) | | Trustee (Since 2002) | | CFO, The Clorox Co. (1982-1997); Director, The Clorox Co. (1984-1997) | | — |
| L. Dale Crandall (70) | | Trustee (Since 1999) | | President, Kaiser Foundation Health Plan, Inc. and Kaiser Foundation Hospitals (2000-2002); Senior Vice President—Finance and Administration & CFO, Kaiser Foundation Health Plan, Inc. and Kaiser Foundation Hospitals (1998-2000) | | Director, Ansell Limited (medical equipment and supplies) (2002-present); Director, Coventry Health Care, Inc. (managed health care) (2004-present); Bridgeport Education, Inc. (education services) (2008 to present) |
| Thomas A. Larsen (62) | | Trustee (Since 2002) | | Partner of Arnold & Porter LLP (law firm) (since 2012); Director of Howard, Rice, Nemerovski, Canady, Falk & Rabkin (1977-2011) | | — |
| Ann Mather (51) | | Trustee (Since 2011) | | CFO, Pixar Animation Studios (1999-2004) | | Director, Google, Inc. (internet information services) (2005-present); Director, Glu Mobile, Inc. (multimedia software) (2005-present); Director, Netflix, Inc. (video services) (2010-present); Director, MoneyGram International, Inc. (business services) (2010-present) |
| Robert B. Morris III (59) | | Trustee (Since 2011) | | Advisory Director, Presidio Financial Partners (since 2005) | | — |
| John B. Taylor (65) | | Trustee (Since 2005) (and 1998-2001) | | Professor of Economics, Stanford University; Senior Fellow, Hoover Institution; Under Secretary for International Affairs, United States Treasury (2001-2005) | | — |
| * | | The address for each Officer and Trustee is 555 California Street, 40th Floor, San Francisco, California 94104. Each Officer and Trustee oversees all five series in the Dodge & Cox Funds complex and serves for an indefinite term. |
Additional information about the Trust’s Trustees and Officers is available in the Trust’s Statement of Additional Information (SAI). You can get a free copy of the SAI by visiting the Funds’ website at www.dodgeandcox.com or calling
1-800-621-3979.
PAGE 23 § DODGE & COX BALANCED FUND
| | | | |
| | | | |
www.dodgeandcox.com
For Fund literature, transactions, and account
information, please visit the Funds’ website.
or write or call:
DODGE & COX FUNDS
c/o Boston Financial Data Services
P.O. Box 8422
Boston, Massachusetts 02266-8422
(800) 621-3979
INVESTMENT MANAGER
Dodge & Cox
555 California Street, 40th Floor
San Francisco, California 94104
(415) 981-1710
This report is submitted for the general information of the shareholders of the Fund. The report is not authorized for distribution to prospective investors in the Fund unless it is accompanied by a current prospectus.
This report reflects our views, opinions, and portfolio holdings as of December 31, 2011, the end of the reporting period. Any such views are subject to change at any time based upon market or other conditions and Dodge & Cox disclaims any responsibility to update such views. These views may not be relied on as investment advice and, because investment decisions for a Dodge & Cox Fund are based on numerous factors, may not be relied on as an indication of trading intent on behalf of any Dodge & Cox Fund.
12/11 IF AR Printed on recycled paper
Annual Report
December 31, 2011
Income Fund
ESTABLISHED 1989
TICKER: DODIX
A LETTER FROM THE CHAIRMAN
Our experience over 80 years has taught us that the best long-term investment opportunities often arise in periods of trepidation. While it is impossible to time market cycles with precision, we believe that building strong long-term returns rests on two key tenets of our investment approach: a willingness to revisit and retest our thinking as prices and conditions change, and the fortitude to stay the course, even in periods of volatility or underperformance.
A Year Defined by Aversion to Risk and Extreme Volatility
Two interconnected issues weighed heavily on global financial markets in 2011: uncertainty about the future of the Eurozone and the challenges to global economic growth posed by high debt levels. Investors responded by turning toward safety and security. A regular feature of this market environment was the “risk-on/risk-off” trade. Markets and securities with widely divergent fundamental risk factors traded in tandem based on whether short-term investor confidence improved (risk-on) or deteriorated (risk-off) on that day—often resulting in one day’s move being retraced the following day.
The year-over-year effect on returns was strong performance from investments considered less risky (e.g., 30-year U.S. Treasury securities returned 36% for the year), negative returns from world equities (down 6%), and wide divergence within asset classes between investments viewed as more safe and those viewed as less. Volatility levels were significantly elevated, especially during a gut-wrenching four days of daily 4% price moves in major equity markets in early August. In this environment, our Funds’ strategies suffered, with each underperforming its market benchmark for the year. For a more detailed discussion of each Fund’s 2011 performance, please read their Annual Letters.
Importance of Fundamental Research
In fear-driven markets, when prices fall across the board, bottom-up research is more important than ever. At Dodge & Cox, our goal is to build diversified
portfolios of individual securities—with attractive fundamentals at low valuations—based on our analysts’ intensive research and the depth of knowledge and experience of our portfolio managers.
Through the team-based decision-making of our seasoned investment professionals, we evaluate the risks, merits, and trade-offs of our investment decisions. Our analysts’ detailed knowledge about our holdings and our investment universe enables us to quickly assess a security’s long-term return potential following a decline in valuation—and take advantage of those opportunities where short-term valuations do not reflect the security’s long-term potential.
Opportunities Ahead
Starting valuation is an important component of long-term returns, and as significant pessimism about the future has driven down equity prices, we have been finding attractive opportunities around the world. Today, global equity markets are trading at 10 to 12 times forward estimated earnings, and many companies have strong balance sheets and opportunities for long-term global growth. Corporate bonds are also very attractive in this environment. Their yield premiums are at high levels now, and we’re seeing interesting opportunities in companies across a range of industries.
Over Dodge & Cox’s 80-year history, our long-term, value-oriented approach has withstood many periods of uncertainty. All of our Fund portfolios are well diversified and thoughtfully constructed, giving us optimism for the future. Thank you for your continued confidence in our firm. As always, we welcome your comments and questions.
For the Board of Trustees,

Kenneth E. Olivier,
Chairman and President
January 31, 2012
PAGE 1 § DODGE & COX INCOME FUND
TO OUR SHAREHOLDERS
The Dodge & Cox Income Fund had a total return of 1.4% for the fourth quarter of 2011, compared to a total return of 1.1% for the Barclays Capital Aggregate Bond Index (BCAG). For 2011, the Fund had a total return of 4.8%, compared to 7.9% for the BCAG. At year end, the Fund had net assets of $24.1 billion with a cash position of 2.8%.
While the Fund’s absolute return was positive, as was its relative return over the first half of 2011, full-year results show meaningful underperformance versus the BCAG. This underperformance was concentrated in the third quarter when the Fund’s significant underweight to U.S. Treasuries, and corresponding overweight to corporate bonds, was penalized as investors moved toward the perceived safety and security of Treasuries.
The Fund has experienced periods of underperformance in the past, most recently in 2008. Now, as then, we reflect on these episodes and determine whether the Fund’s positioning is appropriate in light of new information received and in the context of absolute and relative valuations. The Fund’s longer-term returns remain strong and we remain confident in our ability to generate attractive relative returns for shareholders going forward.
MARKET COMMENTARY
U.S. fixed income investors endured significant volatility throughout 2011, a year that brought regime change to the Middle East and North Africa, escalating concern over the European sovereign debt crisis and myriad attempts at resolution, a downgrade to the U.S. government’s debt rating, and a likely recession in Europe. An uneven U.S. economic recovery gained some strength toward year end with improving labor market data and consumer spending patterns, but real economic growth remained modest for this point in the economic cycle. The Federal Reserve ended its second round of quantitative easing in 2011 but remained committed to accommodative monetary policies through unconventional measures.
In this environment, the Treasury sector(a) posted a return of 9.8%, its strongest annual return since 2008, and the 10-year Treasury reached an all-time low yield of 1.7% in September. The Treasury sector outpaced the other broad market sectors such as corporate bonds and mortgage-backed securities (MBS). Investment-grade corporate bonds returned a strong 8.2% for the year but underperformed comparable-duration(b) Treasuries by 3.7 percentage points,
primarily due to macroeconomic concerns. Financials substantially underperformed Industrials and Utilities for the year, weighed down by uncertainties about regulatory policies and concerns about asset quality. Corporate balance sheets generally remained healthy and credit fundamentals strong, with improving access to funding.
Agency-guaranteed(c) MBS returned 6.2%, underperforming comparable-duration Treasuries by 1.1%. MBS performed well for most of the year, though they suffered underperformance in the third quarter amid uncertainty about the effect of an expanded Home Affordable Refinance Program (“HARP 2.0”) on mortgage prepayment rates.
INVESTMENT STRATEGY
As always, our longstanding investment approach guides us as we navigate the vagaries of the current market environment. The pillars of this approach—a long-term orientation, a focus on valuation, in-depth fundamental research of companies and securities, and diversification within and across sectors—are detailed below.
Long-Term View:
Low Return Prospects for U.S. Treasuries
A key component of our investment philosophy is our long-term investment horizon. We evaluate every Fund investment with a three- to five-year outlook and ask ourselves whether, given what we know, the potential rewards of the investment over this horizon are worth the attendant risks. Sometimes, particularly in periods of investor uncertainty, we are asked why we focus so much on the long term. The answer is that we focus on what we believe is more knowable—longer-term investment fundamentals such as stability and size of cash flows, relative valuation, the competitive position of issuers, and related risks—versus what is more unpredictable, like short-term swings in market sentiment. This focus on the long term has particular resonance in fixed income investing where income earned and its compounding, which only occur with the passage of time, comprise such a large portion of the total return of a security.
A recent example(d) of the importance of our long-term investment horizon in the Fund comes out of the Treasury sector of the market, where the highest returns were earned in 2011. At year end, Treasuries represented
DODGE & COX INCOME FUND §PAGE 2
35% of the BCAG, up from 23% pre-crisis. Conversely, the Fund held just 1% in Treasuries (down from 15% pre-crisis) and also had a short 10-year Treasury futures position to reduce portfolio duration. The Fund’s low exposure to Treasuries was a significant cause of its poor relative performance in 2011. Nevertheless, as we look at the return prospects for holding Treasuries over the next three to five years, we see far more risks than rewards, and our change to the Fund’s positioning reflects this view.
In our estimation, movements in U.S. Treasury yields have largely become a barometer of investor confidence, rather than reflecting the Treasury sector’s true underlying fundamentals. Through the latter prism, we see the prospect for Treasury returns as challenged. Short-term Treasury yields remain near zero, and long-term yields are near generational lows (e.g., the 10-year Treasury was 1.9% at year end, versus 5.0% pre-crisis). As such, there is a steep price to pay if rates were to rise from today’s historically low levels. Further, current valuations seem to incorporate a “safety preference” and expectations for very low inflation, conditions we expect to reverse as the economy and investor confidence improve. Given these factors, we believe that the long-term investor will be dissatisfied with the returns from Treasuries going forward, especially considering the many long-term opportunities within other sectors such as corporate bonds. This has led us to de-emphasize Treasuries to a great degree in the Fund.
Attractive Valuations Within the Banking Sector
Another characteristic of our investment philosophy is a focus on valuation. As value investors, we believe one key to generating good returns is finding securities with attractive characteristics that are not currently reflected in market prices. A current example is the Fund’s bank holdings, which totaled 11% of the Fund at year end.
Buffeted by some very real risk factors, this much-maligned part of the corporate bond market posted very poor returns in 2011, and yield premiums rose significantly. As a result of recent underperformance and lingering concerns from the financial crisis, expectations (as captured by valuations) for securities from bank issuers are quite low. For example, the yield premium to comparable U.S. Treasuries of the Barclays Capital Banking Index at year end was 361 basis points,(e) versus 184 basis points for the Industrials Index. As the yield premium of a corporate bond primarily serves to
compensate investors for the risk of default, the outsized yield advantage accorded bank bonds is reflective of the low expectations investors have for the sector, given investor concerns over capitalization and solvency for certain institutions.
As value investors, we are attracted by these reduced expectations; we believe they overstate the risks of holding securities from a well researched set of bank issuers, playing to our strengths as security selectors. Bank balance sheets have been shored up to a great extent over the last three years, leaving them less vulnerable to economic or industry-specific shocks. Their liquidity is higher, credit losses are declining, and the international regulatory framework pertaining to large financial institutions is becoming clearer. While an attractive valuation is not sufficient in and of itself, improving fundamentals, combined with our deep fundamental research effort, makes us comfortable investing a significant percentage of the Fund in systemically important banks. At year end, the Fund held positions in Ally Financial, Bank of America, Barclays, Capital One, Citigroup, HSBC, JPMorgan Chase, Royal Bank of Scotland, and Wells Fargo.
Our Focus on Fundamental Research: Lafarge
Fundamental research of individual securities and sectors is another key tenet of our investment approach. Oftentimes the most compelling long-term investment opportunities arrive at a time of the greatest uncertainty, elevated market stress, or within an industry experiencing serious challenges. Investing confidently in such environments requires a talented group of analysts and traders using both qualitative and quantitative analysis to sift through the noise and fear and properly judge the long-term opportunity. We devote the majority of our time and resources to exactly this type of research, with a particular eye to downside vulnerabilities and the protections that exist for bondholders in the event that credit fundamentals deteriorate. One Fund holding, Lafarge (1.1% of the Fund and rated one notch below investment grade at year end), offers an illustration of how our research-based process gives us conviction in an investment facing numerous near-term uncertainties.
Lafarge is among the world’s largest producers of cement, gypsum, and other building materials. Our investment team already had extensive company knowledge when we established a small initial position in
PAGE 3 § DODGE & COX INCOME FUND
mid-2006, as Dodge & Cox had been a longstanding equity investor in Lafarge. Based in France, the company has a presence on five continents, including rapidly growing emerging markets in Asia, the Middle East, and Latin America. Less than 50% of revenue is sourced from mature European and North American markets. Near-term challenges exist, including a years-long construction downturn in many parts of the world, as well as the company’s relatively high leverage due to an ill-timed acquisition in 2008. Incremental yields on Lafarge debt have risen substantially alongside other European corporates and in the wake of the company’s 2011 downgrade to below investment grade. We have revisited the investment thesis numerous times in recent years, incorporating a changing industry outlook into our models and using a rather extreme downside case in projecting the company’s financials out several years to determine whether Lafarge can withstand a prolonged business downturn and still repay its obligations. We also have spoken regularly to company management to understand their strategic vision and plans for maintaining financial flexibility. We were comforted by management’s commitment to debt reduction (minimum €2 billion for 2011 through cost cutting and divestitures) and Lafarge’s various sources of financial flexibility (e.g., further asset sales, covenant-free bank lines with staggered maturities, flexibility with capital expenditures) relative to its debt maturity profile. This research and analysis provided us the necessary confidence to build the Fund’s position over the past several years. We conduct similar research for all of the Fund’s holdings.
Portfolio Diversification
Finally, we construct the Fund to feature investments in securities and sectors with fundamentally different risk factors (and opportunity sets) within and across a broad spectrum of the bond market. In this way, the Fund’s returns do not hinge on a single economic or interest rate environment or investment outcome. Within the Corporate sector, for example, the Fund’s holdings are well diversified, with 51 different corporate issuers representing a broad range of industries; many individual holdings performed well in 2011 despite the underperformance of the sector as a whole.
A meaningful example of the benefits of diversification can be found in the Fund’s MBS. Agency MBS comprised 41% of the Fund at year end and performed very well versus short-duration alternatives,
fulfilling their portfolio role as short- to intermediate-duration, stable investments. These securities come with a different set of risk factors than that of a corporate or municipal bond. Given that the Fund’s MBS holdings are guaranteed by Fannie Mae or Freddie Mac (both of which are heavily supported by the U.S. government), credit risk is minimal. Rather, prepayment risk is the primary risk for the Fund’s MBS—that is, uncertainty regarding the timing and sustainability of the above-market income stream on the Fund’s MBS. We seek to mitigate this risk to the extent possible through our research diligence and our security selection efforts. At this point, we do not expect a meaningful increase in prepayments beyond that which has already been priced into MBS valuations. Nevertheless, we are closely monitoring activities out of Washington vis-à-vis HARP 2.0 and the potential effects of its expanded guidelines on mortgage borrowers’ ability to refinance.
IN CLOSING
Thank you for your continued confidence in our firm. As always, we welcome your comments and questions.
For the Board of Trustees,
| | |
| |
|
Kenneth E. Olivier, Chairman and President | | Dana M. Emery, Senior Vice President |
January 31, 2012
| (a) | | Sector returns as calculated and reported by Barclays Capital. |
| (b) | | Duration is a measure of a bond’s (or a bond portfolio’s) price sensitivity to changes in interest rates. |
| (c) | | The U.S. Government does not guarantee the Fund’s shares, yield, or net asset value. The guarantee does not eliminate market risk. |
| (d) | | We use these examples to illustrate our investment process, not to imply that we think they are more attractive than the Fund’s other holdings. |
| (e) | | One basis point is equal to 1/100th of 1%. |
Risks: The Fund invests in individual bonds whose yields and market values fluctuate, so that your investment may be worth more or less than its original cost. Bond investments are subject to interest rate risk, credit risk, and prepayment risk, all of which could have adverse effects on the value of the Fund. Please read the prospectus and summary prospectus for specific details regarding the Fund’s risk profile.
DODGE & COX INCOME FUND §PAGE 4
ANNUAL PERFORMANCE REVIEW
The Fund underperformed the BCAG by 3.1 percentage points in 2011.
Key Detractors from Relative Results
| | § | | The Fund’s shorter relative duration and significant underweight of U.S. Treasuries detracted from relative returns as interest rates declined and the Treasury sector meaningfully outperformed other sectors for the year. | |
| | § | | The Fund’s significant overweight to corporate bonds, particularly within the Financials sector, hampered relative returns as the Corporate sector underperformed considerably in 2011, with Financials faring the worst. | |
| | § | | Numerous bank holdings (Bank of America, Citigroup, and HSBC) and lower-rated holdings (Lafarge and Sprint) performed poorly. | |
Key Contributors to Relative Results
| | § | | The Fund’s Agency MBS performed well versus short-duration Treasuries. | |
| | § | | The Fund’s taxable municipal holdings performed extremely well (22% average return) versus credit alternatives, though they underperformed long Treasuries. | |
| | § | | The Fund’s yield advantage added to relative returns. | |
KEY CHARACTERISTICS OF DODGE & COX
Independent Organization
Dodge & Cox is one of the largest privately owned investment managers in the world. We remain committed to independence, with a goal of providing the highest quality investment management service to our existing clients.
80 Years of Investment Experience
Dodge & Cox was founded in 1930. We have a stable and well-qualified team of investment professionals, most of whom have spent their entire careers at Dodge & Cox.
Experienced Investment Team
The Fixed Income Investment Policy Committee, which is the decision-making body for the Income Fund, is a nine-member committee with an average tenure at Dodge & Cox of 17 years.
One Business with a Single Research Office
Dodge & Cox manages domestic, international, and global equity, fixed income, and balanced investments, operating from one office in San Francisco.
Consistent Investment Approach
Our team decision-making process involves thorough, bottom-up fundamental analysis of each investment.
Long-Term Focus and Low Expenses
We invest with a three- to five-year investment horizon, which has historically resulted in low turnover relative to our peers. We manage Funds that maintain low expense ratios.
PAGE 5 § DODGE & COX INCOME FUND
GROWTH OF $10,000 OVER 10 YEARS
FOR AN INVESTMENT MADE ON DECEMBER 31, 2001
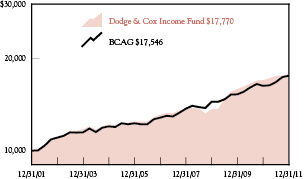
AVERAGE ANNUAL TOTAL RETURN
FOR PERIODS ENDED DECEMBER 31, 2011
| | | | | | | | | | | | | | | | |
| | | 1 Year | | | 5 Years | | | 10 Years | | | 20 Years | |
| | | | | | | | | | | | | | | | |
Dodge & Cox Income Fund | | | 4.76 | % | | | 6.34 | % | | | 5.91 | % | | | 6.78 | % |
Barclays Capital
Aggregate Bond Index (BCAG) | | | 7.86 | | | | 6.51 | | | | 5.78 | | | | 6.50 | |
Returns represent past performance and do not guarantee future results. Investment return and share price will fluctuate with market conditions, and investors may have a gain or loss when shares are sold. Fund performance changes over time and currently may be significantly lower than stated. Performance is updated and published monthly. Visit the Fund’s website at www.dodgeandcox.com or call 1-800-621-3979 for current performance figures.
The Fund’s total returns include the reinvestment of dividend and capital gain distributions, but have not been adjusted for any income taxes payable by shareholders on these distributions or on Fund share redemptions. Index returns include interest income but, unlike Fund returns, do not reflect fees or expenses. The Barclays Capital U.S. Aggregate Bond Index (BCAG) is a widely recognized, unmanaged index of U.S. dollar-denominated investment-grade fixed income securities.
Barclays Capital® is a trademark of Barclays PLC.
FUND EXPENSE EXAMPLE
As a Fund shareholder, you incur ongoing Fund costs, including management fees and other Fund expenses. All mutual funds have ongoing costs, sometimes referred to as operating expenses. The following example shows ongoing costs of investing in the Fund and can help you understand these costs and compare them with those of other mutual funds. The example assumes a $1,000 investment held for the six months indicated.
ACTUAL EXPENSES
The first line of the table below provides information about actual account values and expenses based on the Fund’s actual returns. You may use the information in this line, together with your account balance, to estimate the expenses that you paid over the period. Simply divide your account value by $1,000 (for example, an $8,600 account value divided by $1,000 = 8.6), then multiply the result by the number in the first line under the heading “Expenses Paid During Period” to estimate the expenses you paid on your account during this period.
HYPOTHETICAL EXAMPLE FOR COMPARISON WITH OTHER MUTUAL FUNDS
Information on the second line of the table can help you compare ongoing costs of investing in the Fund with those of other mutual funds. This information may not be used to estimate the actual ending account balance or expenses you paid during the period. The hypothetical “Ending Account Value” is based on the actual expense ratio of the Fund and an assumed 5% annual rate of return before expenses (not the Fund’s actual return). The amount under the heading “Expense Paid During the Period” shows the hypothetical expenses your account would have incurred under this scenario. You can compare this figure with the 5% hypothetical examples that appear in shareholder reports of other mutual funds.
| | | | | | | | | | | | |
Six Months Ended December 31, 2011 | | Beginning Account Value
7/1/2011 | | | Ending Account Value
12/31/2011 | | | Expenses Paid
During Period* | |
Based on Actual Fund Return | | $ | 1,000.00 | | | $ | 1,015.60 | | | $ | 2.18 | |
Based on Hypothetical 5% Yearly Return | | | 1,000.00 | | | | 1,023.04 | | | | 2.19 | |
| * | | Expenses are equal to the Fund’s annualized expense ratio of 0.43%, multiplied by the average account value over the period, multiplied by 184/365 (to reflect the one-half year period). |
The expenses shown in the table highlight ongoing costs only and do not reflect any transactional fees or account maintenance fees. While other mutual funds may charge such fees, please note that the Fund does not charge transaction fees (e.g., redemption fees, sales loads) or universal account maintenance fees (e.g., small account fees).
DODGE & COX INCOME FUND §PAGE 6
| | | | |
| FUND INFORMATION | | | December 31, 2011 | |
| | | | |
| GENERAL INFORMATION | | | |
Net Asset Value Per Share | | | $13.30 | |
Total Net Assets (billions) | | | $24.1 | |
30-Day SEC Yield(a) | | | 3.85% | |
Expense Ratio | | | 0.43% | |
Portfolio Turnover Rate | | | 27% | |
Fund Inception | | | 1989 | |
No sales charges or distribution fees | | | | |
Investment Manager: Dodge & Cox, San Francisco. Managed by the Fixed Income Investment Policy Committee, whose nine members’ average tenure at Dodge & Cox is 17 years.
| | | | | | | | |
| PORTFOLIO CHARACTERISTICS | | Fund | | | BCAG | |
Number of Fixed Income Securities | | | 672 | | | | 7,829 | |
Effective Maturity (years)(b) | | | 7.0 | | | | 7.1 | |
Effective Duration (years)(c) | | | 3.9 | | | | 5.0 | |
| | | | |
| FIVE LARGEST CORPORATE ISSUERS (%)(d) | | Fund | |
Bank of America Corp. | | | 2.8 | |
HCA, Inc. | | | 2.2 | |
Citigroup, Inc. | | | 2.2 | |
Time Warner, Inc. | | | 1.8 | |
Xerox Corp. | | | 1.8 | |
| | | | | | | | |
| CREDIT QUALITY (%)(e) | | Fund | | | BCAG | |
U.S. Government & U.S. Agency/MBS(b) | | | 43.1 | | | | 72.5 | |
Aaa | | | 0.1 | | | | 4.0 | |
Aa | | | 4.7 | | | | 3.7 | |
A | | | 15.1 | | | | 10.7 | |
Baa | | | 21.6 | | | | 9.1 | |
Ba | | | 7.8 | | | | 0.0 | |
B | | | 4.8 | | | | 0.0 | |
Caa | | | 0.0 | | | | 0.0 | |
Ca | | | 0.0 | | | | 0.0 | |
C | | | 0.0 | | | | 0.0 | |
Cash Equivalents | | | 2.8 | | | | 0.0 | |
ASSET ALLOCATION
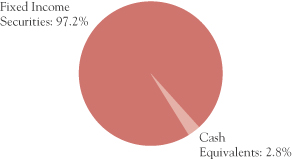
| | | | | | | | |
| SECTOR DIVERSIFICATION (%) | | Fund | | | BCAG | |
U.S. Treasury(b) | | | 1.1 | | | | 35.2 | |
Government-Related | | | 7.4 | | | | 10.8 | |
Mortgage-Related | | | 40.8 | | | | 31.8 | |
Corporate | | | 47.8 | | | | 19.9 | |
Asset-Backed/Commercial Mortgage-Backed(f) | | | 0.1 | | | | 2.3 | |
Cash Equivalents | | | 2.8 | | | | 0.0 | |
| | | | | | | | |
| MATURITY DIVERSIFICATION (%) | | Fund | | | BCAG | |
0-1 Years to Maturity | | | 5.5 | | | | 0.0 | |
1-5 | | | 53.4 | | | | 52.7 | |
5-10(b) | | | 26.3 | | | | 34.4 | |
10-15 | | | 0.6 | | | | 1.4 | |
15-20 | | | 3.7 | | | | 1.9 | |
20-25 | | | 4.9 | | | | 1.9 | |
25 and Over | | | 5.6 | | | | 7.7 | |
| (a) | SEC Yield is an annualization of the Fund’s total net investment income per share for the 30-day period ended on the last day of the month. |
| (b) | Data as presented excludes the effect of the Fund’s short position in 10-year Treasury futures contracts (notional value = 6.3% of the Fund’s net assets). If the Fund’s exposure to Treasury futures contracts had been included, the effective maturity would be 0.4 years lower. |
| (c) | Data as presented includes the effect of Treasury futures contracts. |
| (d) | The Fund’s portfolio holdings are subject to change without notice. The mention of specific securities is not a recommendation to buy, sell, or hold any particular security and is not indicative of Dodge & Cox’s current or future trading activity. |
| (e) | The Fund’s credit quality distribution is calculated using ratings from Moody’s Investor Services. If no Moody’s rating is available, the lower of the Standard & Poor’s or Fitch rating is used. The BCAG’s credit quality ratings are from Barclays Capital and reference Moody’s, Standard & Poor’s, and Fitch ratings. The credit quality of the investments in the portfolio does not apply to the stability or safety of the Fund or its shares. |
| (f) | Commercial mortgage-backed securities are a component of the BCAG but not currently held by the Fund. |
PAGE 7 § DODGE & COX INCOME FUND
| | | | |
| PORTFOLIO OF INVESTMENTS | | | December 31, 2011 | |
| | | | | | | | |
| FIXED INCOME SECURITIES: 97.2% | |
| | |
| | | PAR VALUE | | | VALUE | |
| U.S. TREASURY AND GOVERNMENT-RELATED: 8.5% | |
U.S. TREASURY: 1.1% | |
U.S. Treasury Note | | | | | | | | |
0.875%, 2/29/12 | | $ | 75,000,000 | | | $ | 75,099,600 | |
1.00%, 4/30/12 | | | 150,000,000 | | | | 150,468,750 | |
0.625%, 7/31/12 | | | 50,000,000 | | | | 50,154,300 | |
| | | | | | | | |
| | | | 275,722,650 | |
GOVERNMENT-RELATED: 7.4% | | | | | | | | |
Arkansas Dev. Fin. Auth. GNMA Guaranteed Bonds | | | | | | | | |
9.75%, 11/15/14 | | | 15,057 | | | | 15,284 | |
California Taxable General Obligation | | | | | |
5.25%, 4/1/14 | | | 15,800,000 | | | | 16,875,190 | |
6.20%, 3/1/19 | | | 6,435,000 | | | | 7,392,206 | |
6.20%, 10/1/19 | | | 20,285,000 | | | | 23,121,452 | |
7.50%, 4/1/34 | | | 146,850,000 | | | | 176,197,973 | |
7.55%, 4/1/39 | | | 262,103,000 | | | | 320,478,580 | |
7.30%, 10/1/39 | | | 113,880,000 | | | | 134,655,128 | |
7.625%, 3/1/40 | | | 55,395,000 | | | | 68,155,238 | |
7.60%, 11/1/40 | | | 25,775,000 | | | | 31,824,650 | |
Illinois Taxable General Obligation | | | | | | | | |
4.961%, 3/1/16 | | | 51,005,000 | | | | 53,870,971 | |
5.365%, 3/1/17 | | | 189,840,000 | | | | 200,247,029 | |
5.665%, 3/1/18 | | | 139,375,000 | | | | 148,334,025 | |
Los Angeles Unified School District Taxable General Obligation | | | | | | | | |
6.758%, 7/1/34 | | | 119,290,000 | | | | 148,043,662 | |
New Jersey State Turnpike Authority Revenue Bonds | | | | | | | | |
7.102%, 1/1/41 | | | 116,380,000 | | | | 159,331,203 | |
New Valley Generation V | | | | | | | | |
4.929%, 1/15/21 | | | 317,571 | | | | 356,404 | |
Small Business Administration — 504 Program | | | | | |
Series 92-20B, 8.10%, 2/1/12 | | | 30,078 | | | | 30,281 | |
Series 92-20C, 8.20%, 3/1/12 | | | 41,488 | | | | 42,017 | |
Series 92-20D, 8.20%, 4/1/12 | | | 11,581 | | | | 11,728 | |
Series 92-20G, 7.60%, 7/1/12 | | | 105,218 | | | | 106,840 | |
Series 92-20H, 7.40%, 8/1/12 | | | 64,020 | | | | 65,373 | |
Series 92-20I, 7.05%, 9/1/12 | | | 80,132 | | | | 81,805 | |
Series 92-20J, 7.00%, 10/1/12 | | | 84,679 | | | | 86,640 | |
Series 92-20K, 7.55%, 11/1/12 | | | 126,522 | | | | 129,956 | |
Series 92-20L, 7.45%, 12/1/12 | | | 26,944 | | | | 27,710 | |
Series 93-20B, 7.00%, 2/1/13 | | | 128,704 | | | | 132,524 | |
Series 93-20C, 6.50%, 3/1/13 | | | 470,764 | | | | 481,980 | |
Series 93-20D, 6.75%, 4/1/13 | | | 105,050 | | | | 107,547 | |
Series 93-20E, 6.55%, 5/1/13 | | | 583,682 | | | | 599,807 | |
Series 93-20F, 6.65%, 6/1/13 | | | 173,179 | | | | 178,736 | |
Series 93-20L, 6.30%, 12/1/13 | | | 357,009 | | | | 368,698 | |
Series 94-20A, 6.50%, 1/1/14 | | | 461,031 | | | | 475,220 | |
Series 94-20D, 7.70%, 4/1/14 | | | 118,890 | | | | 123,946 | |
Series 94-20E, 7.75%, 5/1/14 | | | 523,896 | | | | 547,972 | |
| | | | | | | | |
| | |
| | | PAR VALUE | | | VALUE | |
Series 94-20F, 7.60%, 6/1/14 | | $ | 236,235 | | | $ | 247,061 | |
Series 94-20G, 8.00%, 7/1/14 | | | 258,037 | | | | 271,110 | |
Series 94-20H, 7.95%, 8/1/14 | | | 166,581 | | | | 174,314 | |
Series 94-20I, 7.85%, 9/1/14 | | | 137,675 | | | | 143,320 | |
Series 94-20K, 8.65%, 11/1/14 | | | 150,401 | | | | 158,910 | |
Series 94-20L, 8.40%, 12/1/14 | | | 122,544 | | | | 129,498 | |
Series 95-20A, 8.50%, 1/1/15 | | | 70,789 | | | | 75,562 | |
Series 95-20C, 8.10%, 3/1/15 | | | 127,005 | | | | 134,098 | |
Series 97-20E, 7.30%, 5/1/17 | | | 328,518 | | | | 360,555 | |
Series 97-20H, 6.80%, 8/1/17 | | | 42,401 | | | | 46,172 | |
Series 97-20J, 6.55%, 10/1/17 | | | 555,490 | | | | 605,280 | |
Series 97-20L, 6.55%, 12/1/17 | | | 30,028 | | | | 32,816 | |
Series 98-20B, 6.15%, 2/1/18 | | | 26,502 | | | | 28,707 | |
Series 98-20C, 6.35%, 3/1/18 | | | 2,490,272 | | | | 2,710,171 | |
Series 98-20H, 6.15%, 8/1/18 | | | 974,768 | | | | 1,059,743 | |
Series 98-20L, 5.80%, 12/1/18 | | | 616,889 | | | | 671,133 | |
Series 99-20C, 6.30%, 3/1/19 | | | 688,125 | | | | 752,711 | |
Series 99-20E, 6.30%, 5/1/19 | | | 15,169 | | | | 16,642 | |
Series 99-20G, 7.00%, 7/1/19 | | | 1,436,296 | | | | 1,583,578 | |
Series 99-20I, 7.30%, 9/1/19 | | | 488,708 | | | | 542,582 | |
Series 00-20C, 7.625%, 3/1/20 | | | 21,797 | | | | 24,363 | |
Series 00-20G, 7.39%, 7/1/20 | | | 25,117 | | | | 28,302 | |
Series 01-20G, 6.625%, 7/1/21 | | | 4,905,043 | | | | 5,440,534 | |
Series 01-20L, 5.78%, 12/1/21 | | | 11,553,256 | | | | 12,745,149 | |
Series 02-20A, 6.14%, 1/1/22 | | | 92,915 | | | | 103,058 | |
Series 02-20L, 5.10%, 12/1/22 | | | 3,323,870 | | | | 3,639,027 | |
Series 03-20G, 4.35%, 7/1/23 | | | 188,571 | | | | 203,490 | |
Series 04-20L, 4.87%, 12/1/24 | | | 4,230,303 | | | | 4,685,524 | |
Series 05-20B, 4.625%, 2/1/25 | | | 6,225,622 | | | | 6,795,318 | |
Series 05-20D, 5.11%, 4/1/25 | | | 310,774 | | | | 343,302 | |
Series 05-20E, 4.84%, 5/1/25 | | | 11,507,537 | | | | 12,640,357 | |
Series 05-20G, 4.75%, 7/1/25 | | | 11,144,978 | | | | 12,214,838 | |
Series 05-20H, 5.11%, 8/1/25 | | | 136,679 | | | | 150,998 | |
Series 05-20I, 4.76%, 9/1/25 | | | 12,286,130 | | | | 13,473,149 | |
Series 06-20A, 5.21%, 1/1/26 | | | 13,510,753 | | | | 14,989,566 | |
Series 06-20B, 5.35%, 2/1/26 | | | 3,905,688 | | | | 4,308,180 | |
Series 06-20C, 5.57%, 3/1/26 | | | 18,358,198 | | | | 20,705,644 | |
Series 06-20G, 6.07%, 7/1/26 | | | 32,945,822 | | | | 37,235,569 | |
Series 06-20H, 5.70%, 8/1/26 | | | 271,396 | | | | 304,901 | |
Series 06-20J, 5.37%, 10/1/26 | | | 11,009,287 | | | | 12,303,051 | |
Series 06-20L, 5.12%, 12/1/26 | | | 8,363,450 | | | | 9,303,929 | |
Series 07-20A, 5.32%, 1/1/27 | | | 17,302,345 | | | | 19,316,360 | |
Series 07-20C, 5.23%, 3/1/27 | | | 27,771,651 | | | | 30,953,469 | |
Series 07-20D, 5.32%, 4/1/27 | | | 28,604,895 | | | | 31,947,116 | |
Series 07-20G, 5.82%, 7/1/27 | | | 19,214,240 | | | | 21,808,635 | |
| | | | | | | | |
| | | | 1,777,905,567 | |
| | | | | | | | |
| | | | 2,053,628,217 | |
| | |
| See accompanying Notes to Financial Statements | | DODGE & COX INCOME FUND §PAGE 8 |
| | | | |
PORTFOLIO OF INVESTMENTS | | | December 31, 2011 | |
| | | | | | | | |
| FIXED INCOME SECURITIES (continued) | | | | |
| | |
| | | PAR VALUE | | | VALUE | |
| MORTGAGE-RELATED: 40.8% | | | | | |
FEDERAL AGENCY CMO & REMIC: 2.6% | | | | | |
Dept. of Veterans Affairs | | | | | | | | |
Trust 1995-2D 4A, 9.293%, 5/15/25 | | $ | 230,477 | | | $ | 280,309 | |
Trust 1997-2Z, 7.50%, 6/15/27 | | | 18,942,779 | | | | 22,398,027 | |
Trust 1998-2 2A PT, 8.828%, 8/15/27 | | | 66,768 | | | | 78,245 | |
Trust 1998-1 1A, 8.198%, 3/15/28 | | | 624,239 | | | | 729,587 | |
Fannie Mae | | | | | | | | |
Trust 1998-58 PX, 6.50%, 9/25/28 | | | 1,192,868 | | | | 1,347,383 | |
Trust 1998-58 PC, 6.50%, 10/25/28 | | | 6,479,637 | | | | 7,191,300 | |
Trust 2001 T-5 A2, 6.991%, 2/19/30 | | | 75,893 | | | | 88,915 | |
Trust 2001-T5 A3, 7.50%, 6/19/30 | | | 373,996 | | | | 419,362 | |
Trust 2001-69 PQ, 6.00%, 12/25/31 | | | 8,427,063 | | | | 9,472,204 | |
Trust 2002-33 A1, 7.00%, 6/25/32 | | | 3,681,627 | | | | 4,269,460 | |
Trust 2008-24 GD, 6.50%, 3/25/37 | | | 13,283,327 | | | | 14,729,006 | |
Trust 2009-53 QM, 5.50%, 5/25/39 | | | 27,263,195 | | | | 30,560,526 | |
Trust 2009-40 TB, 6.00%, 6/25/39 | | | 48,058,039 | | | | 53,646,872 | |
Trust 2001-T3 A1, 7.50%, 11/25/40 | | | 206,891 | | | | 234,599 | |
Trust 2010-123 WT, 7.00%, 11/25/40 | | | 209,444,671 | | | | 237,257,918 | |
Trust 2001-T7 A1, 7.50%, 2/25/41 | | | 41,045 | | | | 45,728 | |
Trust 2001-T4 A1, 7.50%, 7/25/41 | | | 3,145,351 | | | | 3,662,591 | |
Trust 2001-T10 A1, 7.00%, 12/25/41 | | | 4,330,101 | | | | 4,791,739 | |
Trust 2002-T12 A3, 7.50%, 5/25/42 | | | 77,040 | | | | 90,630 | |
Trust 2002-90 A1, 6.50%, 6/25/42 | | | 6,672,595 | | | | 7,719,820 | |
Trust 2002-W6 2A1, 6.658%, 6/25/42 | | | 5,074,513 | | | | 5,734,855 | |
Trust 2002-W8 A2, 7.00%, 6/25/42 | | | 2,667,604 | | | | 3,013,621 | |
Trust 2003-W2 1A2, 7.00%, 7/25/42 | | | 14,479,972 | | | | 16,417,425 | |
Trust 2003-W4 3A, 6.848%, 10/25/42 | | | 5,328,403 | | | | 6,174,169 | |
Trust 2003-07 A1, 6.50%, 12/25/42 | | | 6,467,505 | | | | 7,525,391 | |
Trust 2003-W1 1A1, 6.292%, 12/25/42 | | | 10,487,530 | | | | 12,009,353 | |
Trust 2003-W1 2A, 7.122%, 12/25/42 | | | 4,959,793 | | | | 5,768,898 | |
Trust 2004-T1 1A2, 6.50%, 1/25/44 | | | 66,912 | | | | 75,124 | |
Trust 2004-W2 2A2, 7.00%, 2/25/44 | | | 234,694 | | | | 267,905 | |
Trust 2004-W2 5A, 7.50%, 3/25/44 | | | 16,542,385 | | | | 19,152,174 | |
Trust 2004-W8 3A, 7.50%, 6/25/44 | | | 10,845,275 | | | | 12,779,522 | |
Trust 2005-W1 1A3, 7.00%, 10/25/44 | | | 11,977,465 | | | | 14,278,012 | |
Trust 2001-79 BA, 7.00%, 3/25/45 | | | 1,209,861 | | | | 1,349,057 | |
Trust 2006-W1 1A1, 6.50%, 12/25/45 | | | 1,246,719 | | | | 1,447,014 | |
Trust 2006-W1 1A2, 7.00%, 12/25/45 | | | 8,661,516 | | | | 10,225,406 | |
Trust 2006-W1 1A3, 7.50%, 12/25/45 | | | 141,241 | | | | 165,533 | |
Trust 2006-W1 1A4, 8.00%, 12/25/45 | | | 10,046,158 | | | | 12,231,658 | |
Trust 2007-W10 1A, 6.231%, 8/25/47 | | | 45,018,634 | | | | 50,920,298 | |
Trust 2007-W10 2A, 6.211%, 8/25/47 | | | 13,028,050 | | | | 14,708,244 | |
Freddie Mac | | | | | | | | |
Series 3312 AB, 6.50%, 6/15/32 | | | 13,554,835 | | | | 14,466,239 | |
Series T-41 2A, 6.618%, 7/25/32 | | | 50,889 | | | | 58,590 | |
Series T-48 1A, 6.313%, 7/25/33 | | | 4,875,355 | | | | 5,492,578 | |
Series T-051 1A, 6.50%, 9/25/43 | | | 106,517 | | | | 120,183 | |
| | | | | | | | |
| | | | 613,395,470 | |
| | | | | | | | |
| | |
| | | PAR VALUE | | | VALUE | |
FEDERAL AGENCY MORTGAGE PASS-THROUGH: 38.2% | |
Fannie Mae, 10 Year | | | | | | | | |
6.00%, 11/1/16 | | $ | 4,714,060 | | | $ | 5,148,342 | |
Fannie Mae, 15 Year | | | | | | | | |
5.50%, 1/1/18-1/1/25 | | | 867,749,389 | | | | 942,740,428 | |
6.00%, 7/1/16-3/1/23 | | | 377,193,314 | | | | 408,593,056 | |
6.50%, 11/1/12-12/1/19 | | | 54,029,660 | | | | 59,127,450 | |
7.00%, 9/1/14-11/1/17 | | | 67,517 | | | | 72,741 | |
7.50%, 11/1/14-8/1/17 | | | 4,300,436 | | | | 4,617,517 | |
8.00%, 2/1/13 | | | 393 | | | | 399 | |
Fannie Mae, 20 Year | | | | | | | | |
6.00%, 2/1/28 | | | 21,294,751 | | | | 23,464,906 | |
6.50%, 4/1/19-10/1/24 | | | 23,676,501 | | | | 26,355,740 | |
Fannie Mae, 30 Year | | | | | | | | |
5.50%, 2/1/33-9/1/39 | | | 670,449,785 | | | | 733,062,348 | |
6.00%, 11/1/28-10/1/40 | | | 2,262,001,000 | | | | 2,501,273,755 | |
6.50%, 12/1/32-8/1/39 | | | 719,291,681 | | | | 803,591,079 | |
7.00%, 4/1/32-12/1/37 | | | 480,544,525 | | | | 548,829,927 | |
Fannie Mae, Hybrid ARM | | | | | | | | |
1.957%, 8/1/34 | | | 6,074,151 | | | | 6,263,095 | |
1.965%, 11/1/35 | | | 5,458,094 | | | | 5,690,092 | |
2.049%, 1/1/35 | | | 6,796,132 | | | | 7,040,440 | |
2.12%, 4/1/35 | | | 8,049,080 | | | | 8,415,977 | |
2.123%, 9/1/34 | | | 7,580,229 | | | | 7,915,826 | |
2.134%, 10/1/34 | | | 6,407,572 | | | | 6,658,707 | |
2.139%, 8/1/35 | | | 7,063,006 | | | | 7,349,649 | |
2.174%, 7/1/35 | | | 4,741,588 | | | | 4,936,117 | |
2.189%, 7/1/35 | | | 4,908,423 | | | | 5,107,541 | |
2.201%, 8/1/35 | | | 17,418,856 | | | | 18,108,081 | |
2.287%, 8/1/34 | | | 1,752,495 | | | | 1,844,085 | |
2.305%, 10/1/33 | | | 6,488,940 | | | | 6,812,914 | |
2.398%, 10/1/35 | | | 8,758,605 | | | | 9,250,773 | |
2.443%, 1/1/36 | | | 10,291,864 | | | | 10,646,763 | |
2.452%, 7/1/34 | | | 6,730,670 | | | | 7,068,750 | |
2.458%, 12/1/35 | | | 6,232,921 | | | | 6,575,153 | |
2.461%, 1/1/36 | | | 11,025,874 | | | | 11,647,756 | |
2.489%, 11/1/36 | | | 7,109,764 | | | | 7,515,253 | |
2.495%, 12/1/36 | | | 9,180,761 | | | | 9,700,416 | |
2.498%, 10/1/35 | | | 5,087,191 | | | | 5,373,479 | |
2.50%, 6/1/35-7/1/35 | | | 8,825,499 | | | | 9,289,526 | |
2.517%, 9/1/35 | | | 8,863,473 | | | | 9,375,634 | |
2.983%, 1/1/35 | | | 3,831,334 | | | | 4,051,809 | |
3.327%, 1/1/37 | | | 8,796,728 | | | | 9,312,214 | |
4.368%, 2/1/37 | | | 18,441,679 | | | | 19,565,867 | |
4.843%, 8/1/35 | | | 19,339,004 | | | | 20,473,132 | |
5.111%, 7/1/35 | | | 5,590,193 | | | | 5,935,400 | |
5.203%, 9/1/38 | | | 3,405,473 | | | | 3,644,529 | |
5.206%, 10/1/38 | | | 31,081,409 | | | | 33,143,696 | |
5.242%, 10/1/38 | | | 11,132,823 | | | | 11,910,551 | |
5.261%, 9/1/38 | | | 3,188,364 | | | | 3,419,629 | |
5.294%, 10/1/38 | | | 17,838,793 | | | | 19,151,916 | |
| | |
| PAGE 9 § DODGE & COX INCOME FUND | | See accompanying Notes to Financial Statements |
| | | | |
PORTFOLIO OF INVESTMENTS | | | December 31, 2011 | |
| | | | | | | | |
| FIXED INCOME SECURITIES (continued) | |
| | |
| | | PAR VALUE | | | VALUE | |
5.591%, 4/1/37 | | $ | 4,981,052 | | | $ | 5,375,577 | |
5.79%, 11/1/37 | | | 12,050,194 | | | | 13,040,512 | |
Fannie Mae, Multifamily DUS | | | | | | | | |
Pool 555728, 4.021%, 8/1/13 | | | 184,618 | | | | 190,827 | |
Pool 760744, 4.75%, 3/1/15 | | | 13,590,000 | | | | 14,711,313 | |
Pool 555162, 4.826%, 1/1/13 | | | 13,688,515 | | | | 13,975,343 | |
Pool 555191, 4.857%, 2/1/13 | | | 13,514,106 | | | | 13,839,974 | |
Pool 555317, 4.879%, 4/1/13 | | | 22,660 | | | | 23,276 | |
Pool 735745, 4.989%, 1/1/17 | | | 191,787 | | | | 206,387 | |
Pool 555806, 5.159%, 10/1/13 | | | 80,377 | | | | 84,298 | |
Pool 745629, 5.16%, 1/1/18 | | | 367,852 | | | | 408,284 | |
Pool 545892, 5.217%, 10/1/12 | | | 32,524,972 | | | | 32,840,304 | |
Pool 462084, 5.275%, 11/1/15 | | | 58,177 | | | | 63,501 | |
Pool 888559, 5.424%, 6/1/17 | | | 35,634,195 | | | | 38,929,112 | |
Pool 888381, 5.506%, 4/1/17 | | | 86,061 | | | | 96,058 | |
Pool 888015, 5.543%, 11/1/16 | | | 46,503,986 | | | | 51,618,878 | |
Pool 555172, 5.678%, 12/1/12 | | | 2,725,577 | | | | 2,723,533 | |
Pool 545685, 5.688%, 4/1/12 | | | 2,036,413 | | | | 2,034,876 | |
Pool 545987, 5.835%, 9/1/12 | | | 17,874,637 | | | | 18,055,801 | |
Pool 545387, 5.969%, 1/1/12 | | | 32,267 | | | | 32,266 | |
Pool 545547, 6.038%, 3/1/12 | | | 4,873,338 | | | | 4,939,404 | |
Pool 745936, 6.083%, 8/1/16 | | | 884,903 | | | | 1,015,180 | |
Pool 545708, 6.123%, 5/1/12 | | | 961,368 | | | | 971,105 | |
Pool 545527, 6.183%, 2/1/12 | | | 3,292,589 | | | | 3,292,434 | |
Freddie Mac, 30 Year | | | | | | | | |
5.50%, 9/1/34 - 1/1/35 | | | 34,394,015 | | | | 37,463,819 | |
6.00%, 5/1/38 - 2/1/39 | | | 202,245,997 | | | | 223,103,244 | |
6.50%, 10/1/37 | | | 247,583 | | | | 277,805 | |
Freddie Mac, Hybrid ARM | | | | | | | | |
1.858%, 1/1/36 | | | 6,138,992 | | | | 6,360,466 | |
2.063%, 8/1/36 | | | 7,492,638 | | | | 7,897,071 | |
2.373%, 4/1/35 | | | 3,138,049 | | | | 3,285,969 | |
2.375%, 1/1/35 | | | 6,341,671 | | | | 6,642,681 | |
2.396%, 1/1/36 | | | 8,851,139 | | | | 9,358,339 | |
2.403%, 10/1/35 | | | 7,837,868 | | | | 8,278,900 | |
2.45%, 1/1/36 | | | 23,601,970 | | | | 24,804,934 | |
2.499%, 2/1/34 | | | 16,232,079 | | | | 16,881,809 | |
2.529%, 9/1/33 | | | 22,758,856 | | | | 24,046,781 | |
2.538%, 8/1/35 | | | 5,263,663 | | | | 5,559,977 | |
2.548%, 8/1/34 | | | 3,572,867 | | | | 3,805,798 | |
2.558%, 3/1/35 | | | 3,927,317 | | | | 4,149,050 | |
2.573%, 9/1/35 | | | 9,120,543 | | | | 9,676,374 | |
2.62%, 8/1/35 | | | 8,212,015 | | | | 8,721,476 | |
2.635%, 4/1/36 | | | 12,715,240 | | | | 13,484,892 | |
4.832%, 2/1/35 | | | 2,890,855 | | | | 3,022,218 | |
4.877%, 6/1/38 | | | 19,911,101 | | | | 21,222,238 | |
4.918%, 4/1/38 | | | 25,807,647 | | | | 27,474,313 | |
5.108%, 4/1/38 | | | 30,230,157 | | | | 32,272,724 | |
5.128%, 5/1/37 | | | 10,542,048 | | | | 11,214,927 | |
5.143%, 1/1/37 | | | 8,574,848 | | | | 9,009,761 | |
5.249%, 4/1/38 | | | 34,573,842 | | | | 37,092,473 | |
5.277%, 2/1/38 | | | 21,941,399 | | | | 23,382,232 | |
| | | | | | | | |
| | |
| | | PAR VALUE | | | VALUE | |
5.329%, 7/1/37 | | $ | 24,476,584 | | | $ | 26,081,359 | |
5.363%, 4/1/37 | | | 5,437,992 | | | | 5,791,485 | |
5.377%, 10/1/38 | | | 5,991,435 | | | | 6,452,135 | |
5.386%, 3/1/37 | | | 12,652,876 | | | | 13,272,870 | |
5.424%, 10/1/38 | | | 13,491,953 | | | | 14,485,448 | |
5.494%, 4/1/37 | | | 14,134,890 | | | | 15,054,385 | |
5.763%, 9/1/37 | | | 10,176,687 | | | | 10,961,432 | |
5.864%, 1/1/38 | | | 7,001,593 | | | | 7,604,872 | |
Freddie Mac Gold, 10 Year | | | | | | | | |
6.00%, 9/1/16 | | | 2,161,860 | | | | 2,348,579 | |
Freddie Mac Gold, 15 Year | | | | | | | | |
5.50%, 10/1/16 - 12/1/24 | | | 58,179,020 | | | | 63,533,807 | |
6.00%, 8/1/16 - 11/1/23 | | | 116,449,450 | | | | 126,822,215 | |
6.50%, 6/1/12 - 9/1/18 | | | 17,520,146 | | | | 19,111,717 | |
7.00%, 3/1/12 | | | 595 | | | | 593 | |
Freddie Mac Gold, 20 Year | | | | | | | | |
5.50%, 11/1/23 | | | 24,646,942 | | | | 26,931,505 | |
6.00%, 7/1/25 - 12/1/27 | | | 127,603,267 | | | | 140,208,801 | |
6.50%, 7/1/21 - 10/1/26 | | | 13,659,230 | | | | 15,241,195 | |
Freddie Mac Gold, 30 Year | | | | | | | | |
5.50%, 3/1/34 - 8/1/38 | | | 375,851,430 | | | | 409,378,418 | |
6.00%, 2/1/33 - 6/1/38 | | | 824,000,329 | | | | 907,940,573 | |
6.50%, 5/1/17 - 10/1/38 | | | 168,583,494 | | | | 188,972,511 | |
7.00%, 4/1/31 - 11/1/38 | | | 23,886,169 | | | | 27,394,303 | |
7.90%, 2/17/21 | | | 1,179,384 | | | | 1,348,310 | |
Ginnie Mae, 30 Year | | | | | | | | |
7.00%, 5/15/28 | | | 965,648 | | | | 1,114,308 | |
7.50%, 9/15/17 - 5/15/25 | | | 3,412,472 | | | | 4,025,450 | |
7.80%, 6/15/20 - 1/15/21 | | | 952,689 | | | | 1,091,899 | |
7.85%, 1/15/21 - 10/15/21 | | | 18,743 | | | | 19,466 | |
8.00%, 9/15/20 | | | 17,033 | | | | 19,105 | |
| | | | | | | | |
| | | | 9,192,237,713 | |
PRIVATE LABEL CMO & REMIC(f): 0.0% | |
GSMPS Mortgage Loan Trust(b) | | | | | | | | |
Series 2004-4 1A4, | | | | | | | | |
8.50%, 6/25/34 | | | 7,801,758 | | | | 7,982,330 | |
| | | | | | | | |
| | | | 9,813,615,513 | |
| ASSET-BACKED: 0.1% | | | | | | | | |
STUDENT LOAN: 0.1% | | | | | | | | |
SLM Student Loan Trust | | | | | | | | |
Series 2008-3 A1, 0.918%, 1/25/14 | | | 2,044,107 | | | | 2,045,928 | |
Series 2007-8 A1, 0.648%, 7/27/15 | | | 325,849 | | | | 324,497 | |
Series 2005-2 A4, 0.498%, 4/25/17 | | | 5,037,151 | | | | 5,032,042 | |
Series 2007-3 A2, 0.428%, 10/25/17 | | | 7,110,676 | | | | 7,057,243 | |
| | | | | | | | |
| | | | 14,459,710 | |
| CORPORATE: 47.8% | | | | | | | | |
FINANCIALS: 20.3% | | | | | | | | |
Ally Financial, Inc. | | | | | | | | |
6.875%, 8/28/12 | | | 42,295,000 | | | | 42,823,688 | |
4.50%, 2/11/14 | | | 319,083,000 | | | | 307,915,095 | |
| | |
| See accompanying Notes to Financial Statements | | DODGE & COX INCOME FUND §PAGE 10 |
| | | | |
| PORTFOLIO OF INVESTMENTS | | | December 31, 2011 | |
| | | | | | | | |
| FIXED INCOME SECURITIES (continued) | |
| | |
| | | PAR VALUE | | | VALUE | |
American International Group, Inc. | | | | | | | | |
4.25%, 9/15/14 | | $ | 44,515,000 | | | $ | 43,229,763 | |
8.25%, 8/15/18 | | | 121,045,000 | | | | 128,126,254 | |
Bank of America Corp. | | | | | | | | |
5.30%, 3/15/17 | | | 105,400,000 | | | | 95,061,419 | |
7.625%, 6/1/19 | | | 294,706,000 | | | | 304,789,955 | |
5.625%, 7/1/20 | | | 80,990,000 | | | | 74,790,311 | |
8.00%, 12/15/26(a) | | | 15,420,000 | | | | 13,839,450 | |
6.625%, 5/23/36(a) | | | 200,703,000 | | | | 176,029,175 | |
Barclays PLC(c) (United Kingdom) | | | | | | | | |
6.75%, 5/22/19 | | | 12,525,000 | | | | 13,885,503 | |
5.125%, 1/8/20 | | | 166,255,000 | | | | 170,780,627 | |
Boston Properties, Inc. | | | | | | | | |
6.25%, 1/15/13 | | | 18,241,000 | | | | 18,957,725 | |
5.625%, 4/15/15 | | | 35,570,000 | | | | 39,240,148 | |
5.00%, 6/1/15 | | | 17,569,000 | | | | 19,026,718 | |
3.70%, 11/15/18 | | | 29,300,000 | | | | 30,190,095 | |
5.875%, 10/15/19 | | | 49,019,000 | | | | 55,254,066 | |
5.625%, 11/15/20 | | | 53,115,000 | | | | 59,277,774 | |
4.125%, 5/15/21 | | | 16,225,000 | | | | 16,327,201 | |
2.875%, 2/15/37 | | | 27,300,000 | | | | 27,300,000 | |
Capital One Financial Corp. | | | | | | | | |
7.375%, 5/23/14 | | | 44,855,000 | | | | 49,282,727 | |
6.75%, 9/15/17 | | | 200,405,000 | | | | 224,557,209 | |
4.75%, 7/15/21 | | | 119,255,000 | | | | 122,726,871 | |
CIGNA Corp. | | | | | | | | |
8.50%, 5/1/19 | | | 76,576,000 | | | | 95,921,165 | |
4.00%, 2/15/22 | | | 40,700,000 | | | | 40,318,119 | |
7.65%, 3/1/23 | | | 6,172,000 | | | | 7,214,648 | |
7.875%, 5/15/27 | | | 29,865,000 | | | | 36,892,582 | |
8.30%, 1/15/33 | | | 7,750,000 | | | | 9,961,939 | |
6.15%, 11/15/36 | | | 86,714,000 | | | | 93,017,501 | |
Citigroup, Inc. | | | | | | | | |
4.75%, 5/19/15 | | | 28,905,000 | | | | 29,273,799 | |
6.125%, 11/21/17 | | | 193,228,000 | | | | 206,218,912 | |
2.157%, 5/15/18 | | | 172,795,000 | | | | 146,439,769 | |
7.875%, 10/30/40(a) | | | 137,891,725 | | | | 144,786,311 | |
Equity Residential | | | | | | | | |
4.625%, 12/15/21 | | | 69,550,000 | | | | 70,923,891 | |
General Electric Co. | | | | | | | | |
5.90%, 5/13/14 | | | 29,530,000 | | | | 32,339,839 | |
5.625%, 5/1/18 | | | 15,000,000 | | | | 16,800,030 | |
5.50%, 1/8/20 | | | 180,940,000 | | | | 199,086,835 | |
4.375%, 9/16/20 | | | 65,775,000 | | | | 67,214,486 | |
4.625%, 1/7/21 | | | 16,895,000 | | | | 17,527,752 | |
4.65%, 10/17/21 | | | 31,975,000 | | | | 33,371,252 | |
Health Net, Inc. | | | | | | | | |
6.375%, 6/1/17 | | | 84,072,000 | | | | 87,434,880 | |
HSBC Holdings PLC(c) (United Kingdom) | | | | | |
5.10%, 4/5/21 | | | 53,250,000 | | | | 56,583,077 | |
9.30%, 6/1/21 | | | 100,000 | | | | 114,361 | |
6.50%, 5/2/36 | | | 135,011,000 | | | | 136,415,925 | |
6.50%, 9/15/37 | | | 109,432,000 | | | | 108,019,342 | |
| | | | | | | | |
| | |
| | | PAR VALUE | | | VALUE | |
JPMorgan Chase & Co. | | | | | | | | |
4.95%, 3/25/20 | | $ | 46,340,000 | | | $ | 49,253,350 | |
8.75%, 9/1/30(a) | | | 46,463,000 | | | | 58,523,314 | |
5.85%, 8/1/35(a) | | | 28,070,000 | | | | 28,277,072 | |
6.80%, 10/1/37(a) | | | 28,253,000 | | | | 28,358,949 | |
Liberty Mutual Group, Inc. | | | | | | | | |
7.25%, 9/1/12(b) | | | 18,215,000 | | | | 18,775,439 | |
Royal Bank of Scotland Group PLC(c) (United Kingdom) | | | | | | | | |
4.375%, 3/16/16 | | | 58,615,000 | | | | 55,918,300 | |
5.625%, 8/24/20 | | | 59,492,000 | | | | 57,060,324 | |
6.125%, 1/11/21 | | | 172,375,000 | | | | 170,052,936 | |
SLM Corp. | | | | | | | | |
8.45%, 6/15/18 | | | 134,779,000 | | | | 138,822,370 | |
Travelers Cos., Inc. | | | | | | | | |
5.50%, 12/1/15 | | | 14,312,000 | | | | 16,055,202 | |
6.25%, 6/20/16 | | | 44,745,000 | | | | 52,139,648 | |
5.75%, 12/15/17 | | | 36,090,000 | | | | 42,125,764 | |
3.90%, 11/1/20 | | | 20,075,000 | | | | 21,381,059 | |
Unum Group | | | | | | | | |
6.85%, 11/15/15(b) | | | 21,180,000 | | | | 23,449,352 | |
7.19%, 2/1/28 | | | 11,640,000 | | | | 13,297,780 | |
7.25%, 3/15/28 | | | 25,730,000 | | | | 27,470,763 | |
6.75%, 12/15/28 | | | 8,240,000 | | | | 8,698,399 | |
WellPoint, Inc. | | | | | | | | |
5.00%, 12/15/14 | | | 15,750,000 | | | | 17,208,261 | |
5.25%, 1/15/16 | | | 139,398,000 | | | | 156,064,425 | |
5.875%, 6/15/17 | | | 16,511,000 | | | | 19,025,014 | |
7.00%, 2/15/19 | | | 70,928,000 | | | | 85,579,739 | |
Wells Fargo & Co. | | | | | | | | |
6.00%, 11/15/17 | | | 86,500,000 | | | | 95,515,290 | |
5.625%, 12/11/17 | | | 15,000 | | | | 17,093 | |
5.75%, 2/1/18 | | | 36,525,000 | | | | 41,493,204 | |
| | | | | | | | |
| | | | 4,893,851,236 | |
INDUSTRIALS: 27.5% | | | | | | | | |
AT&T, Inc. | | | | | | | | |
8.00%, 11/15/31 | | | 160,190,000 | | | | 226,277,826 | |
BHP Billiton, Ltd.(c) (Australia) | | | | | | | | |
5.50%, 4/1/14 | | | 49,875,000 | | | | 54,822,999 | |
Boston Scientific Corp. | | | | | | | | |
5.45%, 6/15/14 | | | 71,258,000 | | | | 76,147,011 | |
6.25%, 11/15/15 | | | 15,000,000 | | | | 16,627,830 | |
6.40%, 6/15/16 | | | 112,089,000 | | | | 125,670,152 | |
6.00%, 1/15/20 | | | 15,965,000 | | | | 17,822,352 | |
Burlington Northern Santa Fe Corp.(e) | | | | | |
4.30%, 7/1/13 | | | 7,883,000 | | | | 8,242,126 | |
4.875%, 1/15/15 | | | 13,285,000 | | | | 14,477,143 | |
4.70%, 10/1/19 | | | 77,795,000 | | | | 87,307,617 | |
7.57%, 1/2/21 | | | 18,125,704 | | | | 21,842,105 | |
8.251%, 1/15/21 | | | 6,140,630 | | | | 7,431,390 | |
4.967%, 4/1/23 | | | 25,860 | | | | 29,093 | |
5.72%, 1/15/24 | | | 22,481,302 | | | | 25,710,099 | |
| | |
| PAGE 11 § DODGE & COX INCOME FUND | | See accompanying Notes to Financial Statements |
| | | | |
| PORTFOLIO OF INVESTMENTS | | | December 31, 2011 | |
| | | | | | | | |
| FIXED INCOME SECURITIES (continued) | |
| | |
| | | PAR VALUE | | | VALUE | |
5.996%, 4/1/24 | | $ | 58,874,115 | | | $ | 67,897,963 | |
5.342%, 4/1/24 | | | 7,687,236 | | | | 8,693,731 | |
5.629%, 4/1/24 | | | 32,478,040 | | | | 36,770,460 | |
Canadian Pacific Railway Ltd.(c) (Canada) | | | | | |
5.75%, 1/15/42 | | | 42,675,000 | | | | 45,112,212 | |
Comcast Corp. | | | | | | | | |
5.85%, 11/15/15 | | | 25,435,000 | | | | 28,938,112 | |
5.90%, 3/15/16 | | | 41,990,000 | | | | 48,061,418 | |
6.50%, 1/15/17 | | | 42,070,000 | | | | 49,481,766 | |
6.30%, 11/15/17 | | | 16,445,000 | | | | 19,451,113 | |
5.875%, 2/15/18 | | | 70,335,000 | | | | 81,326,039 | |
5.70%, 5/15/18 | | | 2,700,000 | | | | 3,107,049 | |
6.45%, 3/15/37 | | | 3,120,000 | | | | 3,782,198 | |
6.95%, 8/15/37 | | | 38,974,000 | | | | 49,586,932 | |
6.40%, 5/15/38 | | | 12,700,000 | | | | 15,258,199 | |
Consolidated Rail Corp. | | | | | | | | |
6.76%, 5/25/15 | | | 108,172 | | | | 116,997 | |
Covidien PLC(c) (Ireland) | | | | | | | | |
6.00%, 10/15/17 | | | 32,790,000 | | | | 38,856,183 | |
Cox Communications, Inc. | | | | | | | | |
5.45%, 12/15/14 | | | 48,064,000 | | | | 53,352,338 | |
5.50%, 10/1/15 | | | 50,000 | | | | 56,262 | |
5.875%, 12/1/16(b) | | | 78,515,000 | | | | 90,650,278 | |
9.375%, 1/15/19(b) | | | 144,319,000 | | | | 195,218,435 | |
CSX Corp. | | | | | | | | |
8.375%, 10/15/14 | | | 44,020 | | | | 50,123 | |
9.75%, 6/15/20 | | | 10,377,000 | | | | 14,193,640 | |
6.251%, 1/15/23 | | | 19,665,652 | | | | 22,530,068 | |
Dillard’s, Inc. | | | | | | | | |
7.85%, 10/1/12 | | | 2,300,000 | | | | 2,374,750 | |
7.13%, 8/1/18 | | | 24,115,000 | | | | 24,265,719 | |
7.75%, 7/15/26 | | | 21,666,000 | | | | 20,366,040 | |
7.75%, 5/15/27 | | | 13,013,000 | | | | 12,102,090 | |
7.00%, 12/1/28 | | | 28,950,000 | | | | 26,634,000 | |
Dow Chemical Co. | | | | | | | | |
8.55%, 5/15/19 | | | 129,742,000 | | | | 169,745,091 | |
7.375%, 11/1/29 | | | 49,544,000 | | | | 62,876,901 | |
9.40%, 5/15/39 | | | 107,863,000 | | | | 162,129,091 | |
FedEx Corp. | | | | | | | | |
7.375%, 1/15/14 | | | 22,740,000 | | | | 25,406,265 | |
8.00%, 1/15/19 | | | 18,610,000 | | | | 24,436,624 | |
6.72%, 7/15/23 | | | 20,559,607 | | | | 23,838,080 | |
7.65%, 7/15/24 | | | 2,442,878 | | | | 2,930,130 | |
Ford Motor Credit Co.(e) | | | | | | | | |
7.80%, 6/1/12 | | | 525,000 | | | | 536,183 | |
5.625%, 9/15/15 | | | 183,355,000 | | | | 189,763,074 | |
5.75%, 2/1/21 | | | 198,125,000 | | | | 206,472,204 | |
HCA, Inc. | | | | | | | | |
6.95%, 5/1/12 | | | 152,243,000 | | | | 153,765,430 | |
6.30%, 10/1/12 | | | 51,122,000 | | | | 52,016,635 | |
6.25%, 2/15/13 | | | 72,788,000 | | | | 74,243,760 | |
6.75%, 7/15/13 | | | 81,941,000 | | | | 84,604,082 | |
5.75%, 3/15/14 | | | 64,871,000 | | | | 66,168,420 | |
| | | | | | | | |
| | |
| | | PAR VALUE | | | VALUE | |
6.375%, 1/15/15 | | $ | 5,000,000 | | | $ | 5,093,750 | |
6.50%, 2/15/16 | | | 101,926,000 | | | | 103,454,890 | |
Hewlett-Packard Co. | | | | | | | | |
6.125%, 3/1/14 | | | 116,875,000 | | | | 126,020,702 | |
3.30%, 12/9/16 | | | 92,585,000 | | | | 94,538,914 | |
Lafarge SA(c) (France) | | | | | | | | |
6.20%, 7/9/15(b) | | | 148,500,000 | | | | 151,125,331 | |
6.50%, 7/15/16 | | | 119,026,000 | | | | 121,407,591 | |
Liberty Media Corp. | | | | | | | | |
8.50%, 7/15/29 | | | 12,117,000 | | | | 11,753,490 | |
8.25%, 2/1/30 | | | 29,479,000 | | | | 28,336,689 | |
Macy’s, Inc. | | | | | | | | |
8.125%, 7/15/15 | | | 48,470,000 | | | | 55,961,669 | |
5.90%, 12/1/16 | | | 17,311,000 | | | | 19,344,558 | |
6.65%, 7/15/24 | | | 40,251,000 | | | | 44,893,631 | |
7.00%, 2/15/28 | | | 26,765,000 | | | | 30,326,304 | |
6.70%, 9/15/28 | | | 23,175,000 | | | | 24,209,254 | |
6.90%, 4/1/29 | | | 50,394,000 | | | | 55,425,337 | |
6.90%, 1/15/32 | | | 54,020,000 | | | | 59,149,717 | |
6.70%, 7/15/34 | | | 86,392,000 | | | | 95,356,811 | |
6.375%, 3/15/37 | | | 18,950,000 | | | | 22,014,253 | |
News Corp. | | | | | | | | |
6.20%, 12/15/34 | | | 7,640,000 | | | | 8,213,329 | |
6.40%, 12/15/35 | | | 29,715,000 | | | | 32,561,459 | |
6.15%, 3/1/37 | | | 8,760,000 | | | | 9,575,670 | |
6.65%, 11/15/37 | | | 8,625,000 | | | | 9,771,547 | |
Nordstrom, Inc. | | | | | | | | |
6.75%, 6/1/14 | | | 44,300,000 | | | | 49,675,096 | |
6.25%, 1/15/18 | | | 16,835,000 | | | | 19,911,041 | |
6.95%, 3/15/28 | | | 12,970,000 | | | | 16,228,349 | |
Norfolk Southern Corp. | | | | | | | | |
7.70%, 5/15/17 | | | 29,475,000 | | | | 37,826,505 | |
9.75%, 6/15/20 | | | 14,188,000 | | | | 20,529,327 | |
Pfizer, Inc. | | | | | | | | |
5.50%, 2/1/14 | | | 39,440,000 | | | | 43,236,494 | |
5.50%, 2/15/16 | | | 55,525,000 | | | | 64,574,687 | |
5.45%, 4/1/17 | | | 63,508,000 | | | | 74,399,050 | |
6.20%, 3/15/19 | | | 36,008,000 | | | | 44,430,523 | |
Reed Elsevier PLC(c) (United Kingdom) | | | | | |
7.75%, 1/15/14 | | | 6,300,000 | | | | 7,029,036 | |
8.625%, 1/15/19 | | | 129,850,000 | | | | 162,063,837 | |
Roche Holding AG(c) (Switzerland) | | | | | | | | |
6.00%, 3/1/19(b) | | | 18,040,000 | | | | 21,926,051 | |
Sprint Nextel Corp. | | | | | | | | |
6.00%, 12/1/16 | | | 121,305,000 | | | | 100,683,150 | |
6.90%, 5/1/19 | | | 31,170,000 | | | | 25,637,325 | |
6.875%, 11/15/28 | | | 24,335,000 | | | | 17,338,688 | |
Telecom Italia SPA(c) (Italy) | | | | | | | | |
5.25%, 11/15/13 | | | 43,569,000 | | | | 41,851,684 | |
6.175%, 6/18/14 | | | 31,300,000 | | | | 30,106,375 | |
4.95%, 9/30/14 | | | 64,029,000 | | | | 59,431,974 | |
6.999%, 6/4/18 | | | 34,951,000 | | | | 32,675,550 | |
7.175%, 6/18/19 | | | 79,815,000 | | | | 74,795,275 | |
| | |
| See accompanying Notes to Financial Statements | | DODGE & COX INCOME FUND §PAGE 12 |
| | | | |
PORTFOLIO OF INVESTMENTS | | | December 31, 2011 | |
| | | | | | | | |
| FIXED INCOME SECURITIES (continued) | |
| | |
| | | PAR VALUE | | | VALUE | |
Time Warner Cable, Inc. | | | | | | | | |
8.75%, 2/14/19 | | $ | 83,364,000 | | | $ | 106,449,909 | |
8.25%, 4/1/19 | | | 180,738,000 | | | | 227,009,097 | |
5.00%, 2/1/20 | | | 8,450,000 | | | | 9,258,090 | |
4.00%, 9/1/21 | | | 4,050,000 | | | | 4,097,498 | |
Time Warner, Inc. | | | | | | | | |
7.625%, 4/15/31 | | | 186,818,000 | | | | 241,159,807 | |
7.70%, 5/1/32 | | | 157,688,000 | | | | 205,733,168 | |
Union Pacific Corp. | | | | | | | | |
5.375%, 5/1/14 | | | 7,136,000 | | | | 7,754,905 | |
4.875%, 1/15/15 | | | 10,764,000 | | | | 11,803,404 | |
6.85%, 1/2/19 | | | 5,390,908 | | | | 6,181,235 | |
6.70%, 2/23/19 | | | 5,759,785 | | | | 6,549,031 | |
7.60%, 1/2/20 | | | 1,339,245 | | | | 1,626,992 | |
6.125%, 2/15/20 | | | 47,890,000 | | | | 58,622,388 | |
4.163%, 7/15/22 | | | 25,527,000 | | | | 27,706,266 | |
6.061%, 1/17/23 | | | 14,587,000 | | | | 16,485,691 | |
4.698%, 1/2/24 | | | 5,230,417 | | | | 5,712,129 | |
5.082%, 1/2/29 | | | 10,089,857 | | | | 11,213,257 | |
5.866%, 7/2/30 | | | 53,549,481 | | | | 61,515,159 | |
6.176%, 1/2/31 | | | 39,409,380 | | | | 47,634,240 | |
Vulcan Materials Co. | | | | | | | | |
6.50%, 12/1/16 | | | 34,525,000 | | | | 35,647,063 | |
7.50%, 6/15/21 | | | 89,030,000 | | | | 96,152,400 | |
Xerox Corp. | | | | | | | | |
8.25%, 5/15/14 | | | 36,000,000 | | | | 40,621,716 | |
6.40%, 3/15/16 | | | 73,116,000 | | | | 81,812,125 | |
7.20%, 4/1/16 | | | 25,841,000 | | | | 29,318,062 | |
6.75%, 2/1/17 | | | 64,004,000 | | | | 73,315,558 | |
6.35%, 5/15/18 | | | 109,312,000 | | | | 123,135,596 | |
5.625%, 12/15/19 | | | 68,622,000 | | | | 74,961,369 | |
| | | | | | | | |
| | | | 6,603,934,896 | |
| | | | | | | | |
| | | | 11,497,786,132 | |
| | | | | | | | |
TOTAL FIXED INCOME SECURITIES
(Cost $21,987,455,023) | | | $ | 23,379,489,572 | |
|
| SHORT-TERM INVESTMENTS: 2.3% | |
COMMERCIAL PAPER: 0.3% | |
Hewlett-Packard Co.(b) | | | | | | | | |
1/9/12 | | | 50,000,000 | | | | 49,995,000 | |
WellPoint, Inc.(b) | | | | | | | | |
1/6/12 | | | 25,000,000 | | | | 24,999,305 | |
| | | | | | | | |
| | | | 74,994,305 | |
MONEY MARKET FUND: 0.1% | |
SSgA U.S. Treasury Money Market Fund | | | 24,019,335 | | | | 24,019,335 | |
| | | | | | | | |
| | |
| | | PAR VALUE | | | VALUE | |
REPURCHASE AGREEMENT: 1.9% | |
Fixed Income Clearing Corporation(d)
0.01%, dated 12/30/11, due 1/3/12, maturity value $456,426,507 | | $ | 456,426,000 | | | $ | 456,426,000 | |
| | | | | | | | |
TOTAL SHORT-TERM INVESTMENTS
(Cost $555,439,640) | | | $ | 555,439,640 | |
| | | | | | | | |
TOTAL INVESTMENTS
(Cost $22,542,894,663) | | | 99.5 | % | | $ | 23,934,929,212 | |
OTHER ASSETS LESS LIABILITIES | | | 0.5 | % | | | 116,286,725 | |
| | | | | | | | |
| NET ASSETS | | | 100.0 | % | | $ | 24,051,215,937 | |
| | | | | | | | |
| (a) | Cumulative preferred security |
| (b) | Security exempt from registration under Rule 144A of the Securities Act of 1933. The security may be resold in transactions exempt from registration, normally to qualified institutional buyers. As of December 31, 2011, all such securities in total represented $559,122,216 or 2.3% of net assets. These securities have been deemed liquid by Dodge & Cox, investment manager, pursuant to procedures approved by the Fund’s Board of Trustees. |
| (c) | Security denominated in U.S. dollars |
| (d) | Repurchase agreement is collateralized by Federal Home Loan Bank 0.42%, 6/21/13; and U.S. Treasury Note 0.375%-2.50%, 3/31/13-7/31/13. Total collateral value is $465,556,000. |
| (e) | Subsidiary (see below) |
Fixed income securities are grouped by parent company unless otherwise noted. Actual securities may be issued by the listed parent company or one of its subsidiaries.
ARM: Adjustable Rate Mortgage
CMO: Collateralized Mortgage Obligation
DUS: Delegated Underwriting and Servicing
REMIC: Real Estate Mortgage Investment Conduit
TREASURY FUTURES CONTRACTS
| | | | | | | | | | | | |
| Description | | Number of
Contracts | | Expiration
Date | | Notional
Amount | | | Unrealized
Depreciation | |
| 10 Year U.S. Treasury Note – Short Position | | 11,474 | | Mar 2012 | | $ | (1,504,528,250 | ) | | $ | (13,131,236 | ) |
| | |
| PAGE 13 § DODGE & COX INCOME FUND | | See accompanying Notes to Financial Statements |
| | | | |
STATEMENT OF ASSETS AND LIABILITIES | |
| |
| | | December 31, 2011 | |
ASSETS: | | | | |
Investments, at value (cost $22,542,894,663) | | $ | 23,934,929,212 | |
Cash held at broker | | | 18,358,400 | |
Receivable for investments sold | | | 8,531,677 | |
Receivable for Fund shares sold | | | 26,622,361 | |
Interest receivable | | | 250,080,452 | |
Prepaid expenses and other assets | | | 141,277 | |
| | | | |
| | | 24,238,663,379 | |
| | | | |
LIABILITIES: | | | | |
Payable for investments purchased | | | 128,862,674 | |
Payable for Fund shares redeemed | | | 45,797,828 | |
Payable to broker for futures variation margin | | | 3,227,062 | |
Management fees payable | | | 8,139,613 | |
Accrued expenses | | | 1,420,265 | |
| | | | |
| | | 187,447,442 | |
| | | | |
NET ASSETS | | $ | 24,051,215,937 | |
| | | | |
NET ASSETS CONSIST OF: | | | | |
Paid in capital | | $ | 23,168,535,772 | |
Undistributed net investment income | | | 8,637,825 | |
Accumulated net realized loss | | | (504,860,973 | ) |
Net unrealized appreciation | | | 1,378,903,313 | |
| | | | |
| | $ | 24,051,215,937 | |
| | | | |
Fund shares outstanding (par value $0.01 each, unlimited shares authorized) | | | 1,808,384,795 | |
Net asset value per share | | | $13.30 | |
|
STATEMENT OF OPERATIONS | |
| |
| | | Year Ended
December 31, 2011 | |
INVESTMENT INCOME: | | | | |
Interest | | $ | 1,069,339,386 | |
| |
EXPENSES: | | | | |
Management fees | | | 94,070,507 | |
Custody and fund accounting fees | | | 402,542 | |
Transfer agent fees | | | 4,231,899 | |
Professional services | | | 181,190 | |
Shareholder reports | | | 1,029,320 | |
Registration fees | | | 408,522 | |
Trustees’ fees | | | 214,500 | |
Miscellaneous | | | 273,209 | |
| | | | |
| | | 100,811,689 | |
| | | | |
NET INVESTMENT INCOME | | | 968,527,697 | |
| | | | |
REALIZED AND UNREALIZED GAIN (LOSS): | | | | |
Net realized gain (loss) | | | | |
Investments | | | 107,206,025 | |
Treasury futures contracts | | | (122,689,435 | ) |
Net change in unrealized appreciation/depreciation | | | | |
Investments | | | 173,854,979 | |
Treasury futures contracts | | | (49,976,532 | ) |
| | | | |
Net realized and unrealized gain | | | 108,395,037 | |
| | | | |
NET INCREASE IN NET ASSETS FROM OPERATIONS | | $ | 1,076,922,734 | |
| | | | |
| | | | | | | | |
STATEMENT OF CHANGES IN NET ASSETS | |
| | |
| | | Year Ended
December 31, 2011 | | | Year Ended
December 31, 2010 | |
OPERATIONS: | | | | | | | | |
Net investment income | | $ | 968,527,697 | | | $ | 916,558,678 | |
Net realized loss | | | (15,483,410 | ) | | | (69,245,777 | ) |
Net change in unrealized appreciation | | | 123,878,447 | | | | 632,750,463 | |
| | | | | | | | |
| | | 1,076,922,734 | | | | 1,480,063,364 | |
| | | | | | | | |
| | |
DISTRIBUTIONS TO SHAREHOLDERS FROM: | | | | | | | | |
Net investment income | | | (970,846,088 | ) | | | (1,056,317,953 | ) |
Net realized gain | | | — | | | | — | |
| | | | | | | | |
Total distributions | | | (970,846,088 | ) | | | (1,056,317,953 | ) |
| | | | | | | | |
| | |
FUND SHARE TRANSACTIONS: | | | | | | | | |
Proceeds from sale of shares | | | 6,655,820,213 | | | | 7,309,467,777 | |
Reinvestment of distributions | | | 810,130,084 | | | | 895,374,075 | |
Cost of shares redeemed | | | (5,902,091,793 | ) | | | (5,501,071,495 | ) |
| | | | | | | | |
Net increase from Fund share transactions | | | 1,563,858,504 | | | | 2,703,770,357 | |
| | | | | | | | |
Total increase in net assets | | | 1,669,935,150 | | | | 3,127,515,768 | |
| | |
NET ASSETS: | | | | | | | | |
Beginning of year | | | 22,381,280,787 | | | | 19,253,765,019 | |
| | | | | | | | |
End of year (including undistributed net investment income of $8,637,825 and $10,956,216, respectively) | | $ | 24,051,215,937 | | | $ | 22,381,280,787 | |
| | | | | | | | |
| | |
SHARE INFORMATION: | | | | | | | | |
Shares sold | | | 497,177,426 | | | | 552,137,773 | |
Distributions reinvested | | | 60,983,342 | | | | 67,865,383 | |
Shares redeemed | | | (441,183,941 | ) | | | (414,517,600 | ) |
| | | | | | | | |
Net increase in shares outstanding | | | 116,976,827 | | | | 205,485,556 | |
| | | | | | | | |
| | |
| See accompanying Notes to Financial Statements | | DODGE & COX INCOME FUND §PAGE 14 |
NOTES TO FINANCIAL STATEMENTS
NOTE 1—ORGANIZATION AND SIGNIFICANT ACCOUNTING POLICIES
Dodge & Cox Income Fund (the “Fund”) is one of the series constituting the Dodge & Cox Funds (the “Trust” or the “Funds”). The Trust is organized as a Delaware statutory trust and is registered under the Investment Company Act of 1940, as amended, as a diversified, open-end management investment company. The Fund commenced operations on January 3, 1989, and seeks high and stable current income consistent with long-term preservation of capital. Risk considerations and investment strategies of the Fund are discussed in the Fund’s Prospectus.
The financial statements have been prepared in conformity with accounting principles generally accepted in the United States of America, which require the use of estimates and assumptions by management. Actual results may differ from those estimates. Significant accounting policies are as follows:
Security valuation The Fund’s net assets are valued as of the close of trading on the New York Stock Exchange (NYSE), generally 4:00 p.m. Eastern Time, each day that the NYSE is open for business. Fixed income securities are priced on the basis of valuations furnished by independent pricing services which utilize both dealer-supplied valuations and pricing models. Under certain circumstances, fixed income securities that are not valued by pricing services are temporarily valued by the investment manager utilizing both dealer-supplied valuations and pricing models. Pricing models may consider quoted prices for similar securities, interest rates, prepayment speeds, and credit risk. Futures contracts are valued daily at the closing settlement price on the exchange. Security values are not discounted based on the size of the Fund’s position. Securities for which market quotations are not readily available are valued at fair value as determined in good faith by or under the direction of the Board of Trustees. Short-term securities are valued at amortized cost which approximates current value. All securities held by the Fund are denominated in U.S. dollars.
Security transactions, investment income, expenses, and distributions Security transactions are recorded on the trade date. Realized gains and losses on securities sold are determined on the basis of identified cost.
Interest income is recorded on the accrual basis. Interest income includes coupon interest, amortization of premium and accretion of discount on debt securities, and gain/loss on paydowns of mortgage-backed securities. The ability of the issuers of the debt securities held by the Fund to meet their obligations may be affected by economic developments in a specific industry, state, or region. Debt obligations may be placed on non-accrual status and related interest income may be reduced by ceasing current accruals and writing off interest receivables when the collection of all or a portion of interest has become doubtful. A debt obligation is removed from non-accrual status when the issuer resumes interest payments or when collectibility of interest is reasonably assured.
Expenses are recorded on the accrual basis. Most expenses of the Trust can be directly attributed to a specific series. Expenses which cannot be directly attributed are allocated among the Funds in the Trust based on relative net assets or other expense methodologies determined by the nature of the expense.
Distributions to shareholders are recorded on the ex-dividend date.
Repurchase agreements The Fund enters into repurchase agreements, secured by U.S. government or agency securities, which involve the purchase of securities from a counterparty with a simultaneous commitment to resell the securities at an agreed-upon date and price. It is the Fund’s policy that its custodian take possession of the underlying collateral securities, the fair value of which exceeds the principal amount of the repurchase transaction, including accrued interest, at all times. In the event of default by the counterparty, the Fund has the contractual right to liquidate the securities and to apply the proceeds in satisfaction of the obligation.
Treasury Futures Contracts Futures contracts involve an obligation to purchase or sell (depending on whether the Fund has entered a long or short futures contract, respectively) an asset at a future date, at a price set at the time of the contract. Upon entering into a
PAGE 15 § DODGE & COX INCOME FUND
NOTES TO FINANCIAL STATEMENTS
futures contract, the Fund is required to deposit an amount of cash or liquid assets (referred to as initial margin) in a segregated account with the clearing broker. Subsequent payments (referred to as variation margin) to and from the clearing broker are made on a daily basis based on changes in the market value of futures contracts. Futures are traded publicly and their market value changes daily. Changes in the market value of open futures contracts are recorded as unrealized appreciation or depreciation in the Statement of Operations. Realized gains and losses on futures contracts are recorded in the Statement of Operations at the closing or expiration of futures contracts. Cash deposited with a broker as initial margin is recorded on the Statement of Assets and Liabilities. A receivable and/or payable to brokers for daily variation margin is also recorded on the Statement of Assets and Liabilities.
Investments in futures contracts may include certain risks, which may be different from, and potentially greater than, those of the underlying securities. To the extent the Fund uses Treasury futures, it is exposed to additional volatility and potential losses resulting from leverage.
The Fund has entered into short Treasury futures contracts to assist with the management of the portfolio’s interest rate exposure. During the year ended December 31, 2011, the Fund remained consistently invested in short Treasury futures contracts. Notional values during the year were approximately 6% of net assets.
Indemnification Under the Trust’s organizational documents, its officers and trustees are indemnified against certain liabilities arising out of the performance of their duties to the Trust. In addition, in the normal course of business the Trust enters into contracts that provide general indemnities to other parties. The Trust’s maximum exposure under these arrangements is unknown as this would involve future claims that may be made against the Trust that have not yet occurred.
NOTE 2—VALUATION MEASUREMENTS
Various inputs are used in determining the value of the Fund’s investments. These inputs are summarized in the three broad levels listed below.
| § | | Level 1: Quoted prices in active markets for identical securities |
| § | | Level 2: Other significant observable inputs (including quoted prices for similar securities, market indices, interest rates, credit risk, etc.) |
| § | | Level 3: Significant unobservable inputs (including Fund management’s assumptions in determining the fair value of investments) |
The inputs or methodology used for valuing securities are not necessarily an indication of the risk associated with investing in those securities.
The following is a summary of the inputs used to value the Fund’s holdings as of December 31, 2011:
| | | | | | | | |
| Classification(a) | | LEVEL 1
(Quoted Prices) | | | LEVEL 2
(Other Significant
Observable Inputs) | |
Securities | | | | | | | | |
Fixed Income Securities | | | | | | | | |
U.S. Treasury | | $ | 275,722,650 | | | $ | — | |
Government Related | | | — | | | | 1,777,905,567 | |
Mortgage-Related Securities | | | — | | | | 9,813,615,513 | |
Asset-backed Securities | | | — | | | | 14,459,710 | |
Corporate | | | — | | | | 11,497,786,132 | |
Commercial Paper | | | — | | | | 74,994,305 | |
Money Market Fund | | | 24,019,335 | | | | — | |
Repurchase Agreement | | | — | | | | 456,426,000 | |
| | | | | | | | |
Total Securities | | $ | 299,741,985 | | | $ | 23,635,187,227 | |
| | | | | | | | |
Other Financial
Instruments | | | | | | | | |
Futures Contracts | | $ | (13,131,236 | )(b) | | $ | — | |
| | | | | | | | | |
| (a) | There were no transfers between Level 1 and Level 2 during the year ended December 31, 2011. There were no Level 3 securities at December 31, 2011 and 2010, and there were no transfers to Level 3 during the year. |
| (b) | Represents unrealized depreciation on futures contracts. |
DODGE & COX INCOME FUND §PAGE 16
NOTES TO FINANCIAL STATEMENTS
NOTE 3—RELATED PARTY TRANSACTIONS
Management fees Under a written agreement approved by a unanimous vote of the Board of Trustees, the Fund pays an annual management fee of 0.50% of the Fund’s average daily net assets up to $100 million and 0.40% of the Fund’s average daily net assets in excess of $100 million to Dodge & Cox, investment manager of the Fund. The agreement further provides that Dodge & Cox shall waive its fee to the extent that such fee plus all other ordinary operating expenses of the Fund exceed 1% of the average daily net assets for the year.
Fund officers and trustees All officers and three of the trustees of the Trust are officers or employees of Dodge & Cox. The Trust pays a fee only to those trustees who are not affiliated with Dodge & Cox.
NOTE 4—INCOME TAX INFORMATION AND DISTRIBUTIONS TO SHAREHOLDERS
A provision for federal income taxes is not required since the Fund intends to continue to qualify as a regulated investment company under Subchapter M of the Internal Revenue Code and distribute all of its taxable income to shareholders. Distributions are determined in accordance with income tax regulations, and such amounts may differ from net investment income and realized gains for financial reporting purposes. Financial reporting records are adjusted for permanent book/tax differences to reflect tax character.
Book/tax differences are primarily due to differing treatments of wash sales, net short-term realized gain (loss), and Treasury futures contracts. At December 31, 2011, the cost of investments for federal income tax purposes was $22,542,895,272.
Distributions during the years ended December 31, 2011 and 2010 were characterized as follows for federal income tax purposes:
| | | | | | | | |
| | | Year Ended December 31, 2011 | | | Year Ended December 31, 2010 | |
Ordinary income | | | $970,846,088 | | | | $1,056,317,953 | |
| | | ($0.551 per share) | | | | ($0.645 per share) | |
Long-term capital gain | | | — | | | | — | |
At December 31, 2011, the tax basis components of distributable earnings were as follows:
| | | | |
Unrealized appreciation | | $ | 1,499,626,824 | |
Unrealized depreciation | | | (107,592,884 | ) |
| | | | |
Net unrealized appreciation | | | 1,392,033,940 | |
Undistributed ordinary income | | | 8,637,825 | |
Capital Loss carryforward(a) | | | (517,991,601 | ) |
| (a) | Represents accumulated capital loss as of December 31, 2011, which may be carried forward to offset future capital gains. During 2011, capital loss carryforwards of $3,015,471 expired unutilized. If not utilized, the remaining capital loss carryforward expires as follows: |
| | | | |
Expiring in 2012 | | $ | 32,528,048 | |
Expiring in 2013 | | | 19,963,019 | |
Expiring in 2014 | | | 39,482,767 | |
Expiring in 2017 | | | 174,777,813 | |
Expiring in 2018 | | | 117,611,247 | |
No expiration | | | 133,628,707 | |
| | | | |
| | $ | 517,991,601 | |
| | | | |
Under the recently enacted Regulated Investment Company Modernization Act of 2010, capital losses incurred by the Fund after January 1, 2011, will not be subject to expiration. In addition, such losses must be utilized prior to the losses incurred in the years preceding enactment.
Fund management has reviewed the tax positions for open periods (three years and four years, respectively, from filing the Fund’s Federal and State tax returns) as applicable to the Fund, and has determined that no provision for income tax is required in the Fund’s financial statements.
NOTE 5—LOAN FACILITIES
Pursuant to an exemptive order issued by the Securities and Exchange Commission (SEC), the Fund may participate in an interfund lending facility (Facility). The Facility allows the Fund to borrow money from or loan money to the Funds. Loans under the Facility are made for temporary or emergency purposes, such as to fund shareholder redemption requests. Interest on borrowings is the average of the current repurchase agreement rate and the bank loan rate. There was no activity in the Facility during the period.
PAGE 17 § DODGE & COX INCOME FUND
NOTES TO FINANCIAL STATEMENTS
All Funds in the Trust participate in a committed credit facility (Line of Credit) with State Street Bank and Trust Company, to be utilized for temporary or emergency purposes to fund shareholder redemptions or for other short-term liquidity purposes. The total amount of the Line of Credit was increased from $200 million to $500 million on June 28, 2011. The maximum amount available to the Fund is $250 million. Each Fund pays an annual commitment fee on its pro-rata portion of the Line of Credit. The Fund’s commitment fee for the year ended December 31, 2011, amounted to $79,209 and is reflected as a Miscellaneous Expense in the Statement of Operations. Interest on borrowings is charged at the prevailing rate. There were no borrowings on the Line of Credit during the period.
NOTE 6—PURCHASES AND SALES OF INVESTMENTS
For the year ended December 31, 2011, purchases and sales of securities, other than short-term securities and U.S. government securities, aggregated $3,220,969,771 and $1,789,022,766, respectively. For the year ended December 31, 2011, purchases and sales of U.S. government securities aggregated $5,555,489,863 and $5,358,936,583, respectively.
NOTE 7—SUBSEQUENT EVENTS
Fund management has determined that no material events or transactions occurred subsequent to December 31, 2011, and through the date of the Fund’s financial statements issuance, which require additional disclosure in the Fund’s financial statements.
DODGE & COX INCOME FUND §PAGE 18
FINANCIAL HIGHLIGHTS
| | | | | | | | | | | | | | | | | | | | |
SELECTED DATA AND RATIOS (for a share outstanding throughout each year) | | Year Ended December 31, | |
| | | 2011 | | | 2010 | | | 2009 | | | 2008 | | | 2007 | |
| | | | |
Net asset value, beginning of year | | | $13.23 | | | | $12.96 | | | | $11.79 | | | | $12.51 | | | | $12.57 | |
Income from investment operations: | | | | | | | | | | | | | | | | | | | | |
Net investment income | | | 0.55 | | | | 0.57 | | | | 0.65 | | | | 0.68 | | | | 0.63 | |
Net realized and unrealized gain (loss) | | | 0.07 | | | | 0.35 | | | | 1.20 | | | | (0.72 | ) | | | (0.05 | ) |
| | | | |
Total from investment operations | | | 0.62 | | | | 0.92 | | | | 1.85 | | | | (0.04 | ) | | | 0.58 | |
| | | | |
Distributions to shareholders from: | | | | | | | | | | | | | | | | | | | | |
Net investment income | | | (0.55 | ) | | | (0.65 | ) | | | (0.68 | ) | | | (0.68 | ) | | | (0.64 | ) |
Net realized gain | | | — | | | | — | | | | — | | | | — | | | | — | |
| | | | |
Total distributions | | | (0.55 | ) | | | (0.65 | ) | | | (0.68 | ) | | | (0.68 | ) | | | (0.64 | ) |
| | | | |
Net asset value, end of year | | | $13.30 | | | | $13.23 | | | | $12.96 | | | | $11.79 | | | | $12.51 | |
| | | | |
Total return | | | 4.76 | % | | | 7.17 | % | | | 16.05 | % | | | (0.29 | )% | | | 4.68 | % |
Ratios/supplemental data: | | | | | | | | | | | | | | | | | | | | |
Net assets, end of year (millions) | | | $24,051 | | | | $22,381 | | | | $19,254 | | | | $13,808 | | | | $15,932 | |
Ratio of expenses to average net assets | | | 0.43 | % | | | 0.43 | % | | | 0.43 | % | | | 0.43 | % | | | 0.44 | % |
Ratio of net investment income to average net assets | | | 4.12 | % | | | 4.26 | % | | | 5.29 | % | | | 5.40 | % | | | 5.07 | % |
Portfolio turnover rate | | | 27 | % | | | 28 | % | | | 20 | % | | | 24 | % | | | 27 | % |
See accompanying Notes to Financial Statements
PAGE 19 § DODGE & COX INCOME FUND
REPORT OF INDEPENDENT REGISTERED PUBLIC ACCOUNTING FIRM
To the Trustees of Dodge & Cox Funds and Shareholders of Dodge & Cox Income Fund
In our opinion, the accompanying statement of assets and liabilities, including the portfolio of investments, and the related statements of operations and of changes in net assets and the financial highlights present fairly, in all material respects, the financial position of Dodge & Cox Income Fund (the “Fund”, one of the series constituting Dodge & Cox Funds) at December 31, 2011, the results of its operations for the year then ended, the changes in its net assets for each of the two years in the period then ended and the financial highlights for each of the five years in the period then ended, in conformity with accounting principles generally accepted in the United States of America. These financial statements and financial highlights (hereafter referred to as “financial statements”) are the responsibility of the Fund’s management; our responsibility is to express an opinion on these financial statements based on our audits. We conducted our audits of these financial statements in accordance with the standards of the Public Company Accounting Oversight Board (United States). Those standards require that we plan and perform the audit to obtain reasonable assurance about whether the financial statements are free of material misstatement. An audit includes examining, on a test basis, evidence supporting the amounts and disclosures in the financial statements, assessing the accounting principles used and significant estimates made by management, and evaluating the overall financial statement presentation. We believe that our audits, which included confirmation of securities at December 31, 2011, by correspondence with the custodian and brokers, provide a reasonable basis for our opinion.
PricewaterhouseCoopers LLP
San Francisco, California
February 21, 2012
DODGE & COX INCOME FUND §PAGE 20
BOARD APPROVAL OF FUNDS’ INVESTMENT MANAGEMENT AGREEMENTS AND MANAGEMENT FEES (unaudited)
The Board of Trustees is responsible for overseeing the performance of the Dodge & Cox Funds’ investment manager and determining whether to continue the Investment Management Agreements between the Funds and Dodge & Cox each year (the “Agreements”). At a meeting of the Board of Trustees of the Trust held on December 14, 2011, the Trustees, by a unanimous vote (including a separate vote of those Trustees who are not “interested persons” (as defined in the Investment Company Act of 1940) (the “Independent Trustees”)), approved the renewal of the Agreements for an additional one-year term through December 31, 2012. During the course of the year, the Board received a wide variety of materials relating to the services provided by Dodge & Cox and the performance of each of the Funds.
INFORMATION RECEIVED
In advance of the meeting, the Board, including each of the Independent Trustees, requested, received, and reviewed materials relating to the Agreements and the services provided by Dodge & Cox. The Independent Trustees retained Morningstar® to prepare an independent expense and performance summary for each Fund and comparable funds managed by other advisers identified by Morningstar®. The Morningstar® materials included information regarding advisory fee rates, expense ratios, and transfer agency, custodial, and distribution expenses, as well as appropriate performance comparisons to a Fund’s peer group and an index or combination of indices. The Morningstar® materials also included a comparison of expenses of various share classes offered by comparable funds. The materials reviewed by the Board contained information concerning, among other things, Dodge & Cox’s profitability, financial results and condition, advisory fee revenue, and separate account advisory fee schedules. The Board additionally considered the Funds’ brokerage commissions, turnover rates, sales and redemption data for the Funds, and the fact that Dodge & Cox paid for all third party research used in managing the Funds out of its profits, rather than using “soft dollars” generated from portfolio trading commissions. The Board
received and reviewed a memorandum summarizing information provided throughout the year regarding Dodge & Cox’s services to the Funds as well as information regarding (i) the different fees, services, costs, and risks associated with separate accounts managed by Dodge & Cox as compared to the Dodge & Cox Funds; (ii) the differences in performance between the Funds and separately managed accounts; and (iii) Fund share subscription and redemption activity. In addition, the Board requested and received additional information regarding attribution analyses and recent Fund performance. Throughout the process of reviewing the services provided by Dodge & Cox and preparing for the meeting, the Independent Trustees found Dodge & Cox to be open, forthright, detailed, and very helpful in answering questions about all issues. The Board received copies of the Agreements and a memorandum from the independent legal counsel to the Independent Trustees discussing the factors generally regarded as appropriate to consider in evaluating advisory arrangements. The Trust’s Contract Review Committee, consisting solely of Independent Trustees, met with the independent legal counsel on November 3, 2011, and again on December 14, 2011, to discuss whether to renew the Agreements. The Board, including the Independent Trustees, subsequently concluded that the existing Agreements are fair and reasonable and voted to approve the Agreements.
In considering the Agreements, the Board, including the Independent Trustees, did not identify any single factor or particular information as all-important or controlling. In reaching the decision to approve the Agreements, the Board considered several factors, discussed below, to be key factors and reached the conclusions described below.
NATURE, QUALITY, AND EXTENT OF THE SERVICES
The Board considered that Dodge & Cox provides a wide range of services to the Funds in addition to portfolio management and that the quality of these services has been excellent in all respects. The extensive nature of services provided by Dodge & Cox has been documented in materials provided to the Board and in presentations
PAGE 21 § DODGE & COX INCOME FUND
made to the Board throughout the year. In particular, the Board considered the nature, quality, and extent of portfolio management, administrative, and shareholder services performed by Dodge & Cox. With regard to portfolio management services, the Board considered Dodge & Cox’s established long-term history of care and conscientiousness in the management of the Funds; its demonstrated consistency in investment approach and depth; the background and experience of the Dodge & Cox Investment Policy Committee, International Investment Policy Committee, Global Investment Policy Committee, Fixed Income Investment Policy Committee, and research analysts responsible for managing the Funds; its methods for assessing the regulatory and investment climate in various jurisdictions; Dodge & Cox’s overall high level of attention to its core investment management function; and its commitment to the Funds and their shareholders.
In the area of administrative and shareholder services, the Board considered the excellent quality of Dodge & Cox’s work in areas such as compliance, legal services, trading, proxy voting, oversight of the Funds’ transfer agent and custodian, tax compliance, and shareholder communication through its web site and other means. The Board also noted Dodge & Cox’s diligent disclosure policy, its favorable compliance record and its reputation as a trusted, shareholder-friendly mutual fund family.
In addition, the Board considered that Dodge & Cox manages approximately $112 billion in Fund assets with fewer professionals than most comparable funds, and that on average these professionals have more experience and longer tenure than investment professionals at comparable funds. The Board also noted that Dodge & Cox is an investment research-oriented firm with no other business endeavors to distract management’s attention from its research efforts, and that its investment professionals adhere to a consistent investment approach across the Funds. The Board further considered the Funds’ favorable stewardship and Gold ratings by Morningstar®. The Board concluded that it was satisfied with the nature, extent, and quality of investment management and other services provided to the Funds by Dodge & Cox.
INVESTMENT PERFORMANCE
The Board considered short-term and long-term investment performance for each Fund (including periods of outperformance or underperformance) as compared to both relevant indices and the performance of such Fund’s peer group. In light of recent market volatility, the Board also reviewed recent performance in the context of long-term investment goals. The Board noted that the Fund’s three and ten year returns have been favorable relative to its peers and benchmark index. The Board determined after extensive review and inquiry that Dodge & Cox’s historic, long-term, team-oriented bottom up investment approach remains consistent and that Dodge & Cox continues to be distinguished by its integrity, thoroughness, and independence.
The Board noted that longer-term comparisons demonstrated favorable performance in comparison to peer group funds and was in keeping with the stated goals in the Funds’ Prospectus. The Board considered that the performance of the Funds is the result of a team-oriented investment management process that emphasizes a long-term investment horizon, comprehensive independent research, price discipline, and focus. The Board also considered that the investment performance delivered by Dodge & Cox to the Funds appeared to be consistent with the relevant performance delivered for other (non-fund) clients of Dodge & Cox. The Board concluded that Dodge & Cox has delivered favorable long-term performance for Fund investors consistent with the long-term investment strategies being pursued by the Funds.
COSTS AND ANCILLARY BENEFITS
Costs of Services to Funds: Fees and Expenses. The Board considered each Fund’s management fee rate and expense ratio relative to similar mutual funds and relative to management fees charged by Dodge & Cox to other clients. In particular, the Board considered that the Funds continue to be substantially below their peer group median in expense ratios and management fee rates and that many media and industry reports specifically comment on the low expense ratios of the Funds, which have been a defining characteristic of the Funds for many years. The Board also evaluated the operating structures of
DODGE & COX INCOME FUND §PAGE 22
the Funds and Dodge & Cox, noting that Dodge & Cox does not charge front-end sales commissions or distribution fees and bears, among other things, third party research and distribution-related costs, reimbursement for recordkeeping and administrative costs to third-party retirement plan administrators, and administrative and office overhead. The Board noted that expenses are well below industry averages. The Board also considered that the Funds receive numerous administrative, regulatory compliance, and shareholder support services from Dodge & Cox without any additional administrative fee and the fact that the Funds have relatively low transaction costs and portfolio turnover rates. The Board reviewed Morningstar® data showing that the few peer group funds with lower expense ratios often have other share classes with significantly higher expense ratios.
In comparing the range of services provided to the Funds under the Agreements to the services Dodge & Cox provides under its separate advisory client agreements, the Board determined that part of the difference is due to higher risks as well as legal and management costs of sponsoring the Funds and noted that separate accounts incur other expenses that should be considered when comparing Fund expenses to separate account expenses. In light of that, the greater risks and regulatory burdens associated with sponsoring a high profile mutual fund business, and the fact that these are different lines of business, there is reasonable justification for differences in fee rates charged between the two. The Board further noted that, with respect to non-U.S. funds sponsored and managed by Dodge & Cox that are comparable to the Funds in many respects, the fee rates charged by Dodge & Cox are the same as or higher than the fee rates charged to the Funds. The Board concluded that costs incurred by the Funds for the services they receive (including the management fee paid to Dodge & Cox) are reasonable and that the fees are acceptable based upon the qualifications, experience, reputation, and performance of Dodge & Cox and the low overall expense ratios of the Funds.
Profitability and Costs of Services to Dodge & Cox; “Fall-out” Benefits. The Board reviewed reports of Dodge & Cox’s financial position,
profitability, and estimated overall value, and considered Dodge & Cox’s overall profitability within its context as a private, employee-owned S-Corporation and relative to the favorable services provided. The Board noted that net revenues for 2011 are projected to increase from 2010. The Board noted in particular that Dodge & Cox’s profits are not generated by high fee rates, but reflect an extraordinarily streamlined, efficient, and focused business approach toward investment management. The Board recognized the importance of Dodge & Cox’s profitability—which is derived solely from management fees and does not include other business ventures—to maintain its independence, stability, company culture and ethics, and management continuity. The Board also considered that the compensation/profit structure at Dodge & Cox is vital for remaining independent and facilitating retention of its management and investment professionals.
The Board considered potential “fall-out” benefits (including the receipt of research from unaffiliated brokers) that Dodge & Cox might receive as a result of its association with the Funds and determined that they are not significant. The Board also noted the extent of additional administrative services performed by Dodge & Cox for the Funds, and that the magnitude of costs and risks borne by Dodge & Cox in rendering advisory services to the Funds (including risks in the regulatory compliance, securities valuation, and investment management processes) are continuing to increase. The Board concluded that the profitability of Dodge & Cox’s relationship with the Funds (including fall-out benefits) was fair and reasonable.
THE BENEFIT OF ECONOMIES OF SCALE
The Board considered whether there have been economies of scale with respect to the management of each Fund, whether the Funds have appropriately benefited from any economies of scale, and whether the management fee rate is reasonable in relation to the Fund assets and any economies of scale that may exist. In the Board’s view, any consideration of economies of scale must take account of the Funds’ low fee structure and the considerable efficiencies of the Funds’ organization and fee structure that has been realized by shareholders at the
PAGE 23 § DODGE & COX INCOME FUND
outset of their investment (i.e., from the first dollar). The Board noted that Dodge & Cox has shared economies of scale by adding or enhancing services to the Funds over time, and that the internal costs of providing investment management, up-to-date technology, administrative, and compliance services to the Funds are continuing to increase. For example, Dodge & Cox has increased its global research staff and investment resources over the years to address the increased complexity of investing in multinational and non-U.S. companies. In addition, Dodge & Cox has made substantial expenditures in other staff and infrastructure to enable it to integrate credit and equity analyses and to be able to implement its strategy in a more effective and secure manner. The Board determined that the Funds provide access by small investors to high quality investment management at a relatively low cost. The Board’s decision to renew the Agreements was made after consideration of economies of scale and review of peer group fund expense ratios and historical expense ratio patterns for the Funds. The Board concluded that the current Dodge & Cox fee structure is fair and reasonable and adequately shares economies of scale that may exist.
CONCLUSION
Based on their evaluation of all material factors and assisted by the advice of independent legal counsel to the Independent Trustees, the Board, including the Independent Trustees, concluded that the advisory fee structure was fair and reasonable, that each Fund was paying a competitive fee for the services provided, that the scope and quality of Dodge & Cox’s services has provided substantial value for Fund shareholders over the long term, and that approval of the Agreements was in the best interests of each Fund and its shareholders.
FUND HOLDINGS
The Fund provides a complete list of its holdings four times each fiscal year, as of the end of each quarter. The Fund files the lists with the Securities and Exchange Commission (SEC) on Form N-CSR (second and fourth quarters) and Form N-Q (first and third quarters). Shareholders may view the Fund’s Forms N-CSR and N-Q on the SEC’s website at www.sec.gov. Forms N-CSR and N-Q may also be reviewed and copied at the SEC’s Public Reference Room in
Washington, DC. Information regarding the operations of the Public Reference Room may be obtained by calling 1-202-942-8090 (direct) or 1-800-732-0330 (general SEC number). A complete list of the Fund’s quarter-end holdings is also available at www.dodgeandcox.com on or about 15 days following each quarter end and remains available on the web site until the list is updated in the subsequent quarter.
PROXY VOTING
For a free copy of the Fund’s proxy voting policies and procedures, please call 1-800-621-3979, visit the Fund’s website at www.dodgeandcox.com, or visit the SEC’s website at www.sec.gov. Information regarding how the Fund voted proxies relating to portfolio securities during the most recent 12-month period ending June 30 is also available at www.dodgeandcox.com or at www.sec.gov.
HOUSEHOLD MAILINGS
The Fund routinely mails shareholder reports and summary prospectuses to shareholders and, on occasion, proxy statements. In order to reduce the volume of mail, when possible, only one copy of these documents will be sent to shareholders who are part of the same family and share the same residential address.
If you have a direct account with the Funds and you do not want the mailing of shareholder reports and summary prospectuses combined with other members in your household, contact the Funds at 1-800-621-3979. Your request will be implemented within 30 days.
DODGE & COX INCOME FUND §PAGE 24
THIS PAGE INTENTIONALLY LEFT BLANK
PAGE 25 § DODGE & COX INCOME FUND
THIS PAGE INTENTIONALLY LEFT BLANK
DODGE & COX INCOME FUND §PAGE 26
DODGE & COX FUNDS—EXECUTIVE OFFICER & TRUSTEE INFORMATION
| | | | | | |
Name (Age) and
Address* | | Position with Trust (Year of Election or
Appointment) | | Principal Occupation During Past 5 Years | | Other Directorships Held by Trustees |
| INTERESTED TRUSTEES AND OFFICERS |
| Kenneth E. Olivier (59) | | Chairman, President, and Trustee (Trustee since 2005) | | Chairman (since March 2011), Chief Executive Officer (since 2010), President (until March 2011), and Director of Dodge & Cox; Portfolio Manager and member of Investment Policy Committee (IPC) | | — |
| Dana M. Emery (50) | | Senior Vice President and Trustee (Trustee since 1993) | | Co-President (since March 2011), Executive Vice President (until March 2011), and Director of Dodge & Cox; Director of Fixed Income, Portfolio Manager, and member of Fixed Income Investment Policy Committee (FIIPC) | | — |
| John A. Gunn (68) | | Trustee (Trustee since 1985) | | Chairman Emeritus (since March 2011), Chairman (2007-March 2011), Chief Executive Officer (2007-2010), and Director of Dodge & Cox; Portfolio Manager and member of IPC, Global Investment Policy Committee (GIPC) (since 2008), International Investment Policy Committee (IIPC), and FIIPC (until 2008) | | — |
| Charles F. Pohl (53) | | Senior Vice President (Officer since 2004) | | Co-President (since March 2011), Senior Vice President (until March 2011), and Director of Dodge & Cox; Chief Investment Officer (since 2007), Director of Credit Research, Portfolio Manager, Investment Analyst, and member of IPC, GIPC (since 2008), IIPC (since 2007), and FIIPC | | — |
| Diana S. Strandberg (52) | | Senior Vice President (Officer since 2006) | | Senior Vice President (since May 2011), Vice President (until May 2011), and Director (since May 2011) of Dodge & Cox; Director of International Equity (since 2009), Portfolio Manager, Investment Analyst, and member of IPC, GIPC (since 2008), and IIPC | | — |
| David H. Longhurst (54) | | Treasurer (Officer since 2006) | | Vice President (since 2008) and Assistant Treasurer (since 2007) of Dodge & Cox; Fund Administration and Accounting Senior Manager (until 2007) | | — |
| Thomas M. Mistele (58) | | Secretary (Officer since 1998) | | Chief Operating Officer, Director, Secretary, Senior Counsel (since May 2011), and General Counsel (until May 2011) of Dodge & Cox | | — |
| Katherine M. Primas (36) | | Chief Compliance Officer (Officer since 2009) | | Chief Compliance Officer of Dodge & Cox (since 2008) and Associate Chief Compliance Officer of Dodge & Cox (until 2008) | | — |
| INDEPENDENT TRUSTEES |
| William F. Ausfahl (71) | | Trustee (Since 2002) | | CFO, The Clorox Co. (1982-1997); Director, The Clorox Co. (1984-1997) | | — |
| L. Dale Crandall (70) | | Trustee (Since 1999) | | President, Kaiser Foundation Health Plan, Inc. and Kaiser Foundation Hospitals (2000-2002); Senior Vice President—Finance and Administration & CFO, Kaiser Foundation Health Plan, Inc. and Kaiser Foundation Hospitals (1998-2000) | | Director, Ansell Limited (medical equipment and supplies) (2002-present); Director, Coventry Health Care, Inc. (managed health care) (2004-present); Bridgeport Education, Inc. (education services) (2008 to present) |
| Thomas A. Larsen (62) | | Trustee (Since 2002) | | Partner of Arnold & Porter LLP (law firm) (since 2012); Director of Howard, Rice, Nemerovski, Canady, Falk & Rabkin (1977-2011) | | — |
| Ann Mather (51) | | Trustee (Since 2011) | | CFO, Pixar Animation Studios (1999-2004) | | Director, Google, Inc. (internet information services) (2005-present); Director, Glu Mobile, Inc. (multimedia software) (2005-present); Director, Netflix, Inc. (video services) (2010-present); Director, MoneyGram International, Inc. (business services) (2010-present) |
| Robert B. Morris III (59) | | Trustee (Since 2011) | | Advisory Director, Presidio Financial Partners (since 2005) | | — |
| John B. Taylor (65) | | Trustee (Since 2005) (and 1998-2001) | | Professor of Economics, Stanford University; Senior Fellow, Hoover Institution; Under Secretary for International Affairs, United States Treasury (2001-2005) | | — |
| * | | The address for each Officer and Trustee is 555 California Street, 40th Floor, San Francisco, California 94104. Each Officer and Trustee oversees all five series in the Dodge & Cox Funds complex and serves for an indefinite term. |
Additional information about the Trust’s Trustees and Officers is available in the Trust’s Statement of Additional Information (SAI). You can get a free copy of the SAI by visiting the Funds’ website at www.dodgeandcox.com or calling
1-800-621-3979.
PAGE 27 § DODGE & COX INCOME FUND
ITEM 2. CODE OF ETHICS.
A code of ethics, as defined in Item 2 of Form N-CSR, adopted by the registrant and applicable to the registrant’s principal executive officer and principal financial officer was in effect during the entire period covered by this report. A copy of the code of ethics as revised December 15, 2008 is filed as an exhibit to this Form N-CSR. No substantive amendments were approved or waivers were granted to this code of ethics during the period covered by this report.
ITEM 3. AUDIT COMMITTEE FINANCIAL EXPERT.
The Board of Trustees of the registrant has determined that William F. Ausfahl, L. Dale Crandall, Ann Mather, and Robert B. Morris III, members of the registrant’s Audit and Compliance Committee, are each an “audit committee financial expert” and are “independent, ” as defined in Item 3 of Form N-CSR. Mr. Ausfahl retired from the Board effective February 16, 2012. Ms. Mather and Mr. Morris were designated as audit committee financial experts on February 16, 2012.
ITEM 4. PRINCIPAL ACCOUNTANT FEES AND SERVICES.
(a) - (d) Aggregate fees billed to the registrant for the fiscal years ended December 31, 2011 and December 31, 2010 for professional services rendered by the registrant’s principal accountant were as follows:
| | | | | | | | |
| | | 2011 | | | 2010 | |
(a) Audit Fees | | $ | 246,500 | | | $ | 230,500 | |
(b) Audit-Related Fees | | | — | | | | — | |
(c) Tax Fees | | | 228,500 | | | | 281,650 | |
(d) All Other Fees | | | — | | | | — | |
Audit fees include amounts related to the audit of the registrant’s annual financial statements and services normally provided by the accountant in connection with statutory and regulatory filings. Tax fees include amounts related to tax advice and tax return preparation, compliance, and reviews.
(e) (1) The registrant’s Audit and Compliance Committee has adopted policies and procedures (“Policies”) which require the registrant’s Audit and Compliance Committee to pre-approve all audit and non-audit services provided by the principal accountant to the registrant. The policies also require the Audit and Compliance Committee to pre-approve any engagement of the principal accountant to provide non-audit services to the registrant’s investment adviser, if the services directly impact the registrant’s operations and financial reporting. The Policies do not apply in the case of audit services that the principal accountant provides to the registrant’s adviser. If a service (other than the engagement of the principal accountant to audit the registrant’s financial statements) is required to be pre-approved under the Policies between regularly scheduled Audit and Compliance Committee meetings, pre-approval may be authorized by a designated Audit and Compliance Committee member with ratification at the next scheduled Audit and Compliance Committee meeting.
(e) (2) No services included in (b) - (d) above were approved pursuant to paragraph (c) (7) (i) (C) of Rule 2-01 of Regulation S-X.
(f) Less than 50% of the hours expended on the principal accountant’s engagement to audit the registrant’s financial statements for the most recent fiscal year were attributed to work performed by persons other than the principal accountant’s full-time, permanent employees.
(g) For the fiscal years ended December 31, 2011 and December 31, 2010, the aggregate fees billed by the registrant’s principal accountant for non-audit services rendered to the registrant, for non-audit services rendered to the registrant’s investment adviser, and for non-audit services rendered to entities controlled by the adviser were $650,700 and $682,650, respectively.
(h) All non-audit services described under (g) above that were not pre-approved by the registrant’s Audit and Compliance Committee were considered by the registrant’s Audit and Compliance Committee and found to be compatible with maintaining the principal accountant’s independence.
ITEM 5. AUDIT COMMITTEE OF LISTED REGISTRANTS.
Not applicable.
ITEM 6. SCHEDULE OF INVESTMENTS.
Not applicable. The complete schedule of investments is included in Item 1 of this Form N-CSR.
ITEM 7. DISCLOSURE OF PROXY VOTING POLICIES AND PROCEDURES FOR CLOSED-END MANAGEMENT INVESTMENT COMPANIES.
Not applicable.
ITEM 8. PORTFOLIO MANAGERS OF CLOSED-END MANAGEMENT INVESTMENT COMPANIES.
Not applicable.
ITEM 9. PURCHASES OF EQUITY SECURITIES BY CLOSED-END MANAGEMENT INVESTMENT COMPANY AND AFFILIATED PURCHASERS.
Not applicable.
ITEM 10. SUBMISSION OF MATTERS TO A VOTE OF SECURITY HOLDERS.
The registrant has adopted the following procedures by which shareholders may recommend nominees to the registrant’s Board of Trustees.
1. The shareholder must submit any such recommendation in writing to the registrant to the attention of the Secretary at the address of the principal executive offices of the registrant. The shareholder’s recommendation is then considered by the registrant’s Nominating Committee.
2. The shareholder recommendation must include:
(i) A statement in writing setting forth (a) the name, date of birth, business address and residence address of the person recommended by the shareholder (the “candidate”); and (b) whether the recommending shareholder believes that the candidate is or will be an “interested person” of the registrant (as defined in the Investment Company Act of 1940) and, if not an “interested person,” information regarding the candidate that will be sufficient for the registrant to make such determination and, if applicable, similar information regarding whether the candidate would satisfy the standards for independence of a Board member under listing standards of the New York Stock Exchange or other applicable securities exchange.
(ii) The written and manually signed consent of the candidate to be named as a nominee and to serve as a Trustee if elected;
(iii) The recommending shareholder’s name as it appears on the registrant’s books and the number of all shares of the registrant owned beneficially and of record by the recommending shareholder (as evidenced to the Nominating Committee’s satisfaction by a recent brokerage or account statement); and
(iv) A description of all arrangements or understandings between the recommending shareholder and the candidate and any other person or persons (including their names) pursuant to which the recommendation is being made by the recommending shareholder.
In addition, the Nominating Committee may require the candidate to furnish such other information as it may reasonably require or deem necessary to determine the eligibility of such candidate to serve on the Board or to satisfy applicable law and information regarding the candidate that would be required to be disclosed if the candidate were a nominee in a proxy statement or other filing required to be made in connection with solicitation of proxies for election of Trustees.
ITEM 11. CONTROLS AND PROCEDURES.
(a) An evaluation was performed within 90 days of the filing of this report, under the supervision and with the participation of the registrant’s management, including the principal executive officer and principal financial officer, of the effectiveness of the design and operation of the registrant’s disclosure controls and procedures. Based on that evaluation, the principal executive officer and principal financial officer concluded that the registrant’s disclosure controls and procedures were effective.
(b) The registrant’s principal executive officer and principal financial officer are aware of no changes in the registrant’s internal control over financial reporting that occurred during the second fiscal quarter of the period covered by this report that has materially affected, or is reasonably likely to materially affect, the registrant’s internal control over financial reporting.
ITEM 12. EXHIBITS.
(a) (1) The registrant’s code of ethics pursuant to Item 2 of Form N-CSR is attached. (EX.99A)
(a) (2) Certifications pursuant to Section 302 of the Sarbanes-Oxley Act of 2002 are attached. (EX.99B)
(a) (3) Not applicable.
(b) Certifications pursuant to Section 906 of the Sarbanes-Oxley Act of 2002 are attached. (EX.99C)
SIGNATURES
Pursuant to the requirements of the Securities Exchange Act of 1934 and the Investment Company Act of 1940, the registrant has duly caused this report to be signed on its behalf by the undersigned, thereunto duly authorized.
| | |
| Dodge & Cox Funds |
| |
By | | /s/ Kenneth E. Olivier |
| | Kenneth E. Olivier |
| | Chairman – Principal Executive Officer |
| |
Date: | | March 1, 2012 |
Pursuant to the requirements of the Securities Exchange Act of 1934 and the Investment Company Act of 1940, this report has been signed below by the following persons on behalf of the registrant and in the capacities and on the dates indicated.
| | |
| Dodge & Cox Funds |
| |
By | | /s/ Kenneth E. Olivier |
| | Kenneth E. Olivier |
| | Chairman – Principal Executive Officer |
| |
By | | /s/ David H. Longhurst |
| | David H. Longhurst |
| | Treasurer – Principal Financial Officer |
| |
Date: | | March 1, 2012 |