UNITED STATES
SECURITIES AND EXCHANGE COMMISSION
Washington, D.C. 20549
FORM N-CSR
CERTIFIED SHAREHOLDER REPORT OF REGISTERED
MANAGEMENT INVESTMENT COMPANIES
Investment Company Act file number 811-173
DODGE & COX FUNDS
(Exact name of registrant as specified in charter)
555 California Street, 40th Floor
San Francisco, CA 94104
(Address of principal executive offices) (Zip code)
Thomas M. Mistele, Esq.
555 California Street, 40th Floor
San Francisco, CA 94104
(Name and address of agent for service)
Registrant’s telephone number, including area code: 415-981-1710
Date of fiscal year end: DECEMBER 31, 2013
Date of reporting period: DECEMBER 31, 2013
Form N-CSR is to be used by management investment companies to file reports with the Commission not later than 10 days after the transmission to stockholders of any report that is required to be transmitted to stockholders under Rule 30e-1 under the Investment Company Act of 1940 (17 CFR 270.30e-1). The Commission may use the information provided on Form N-CSR in its regulatory, disclosure review, inspection, and policymaking roles.
A registrant is required to disclose the information specified by Form N-CSR, and the Commission will make this information public. A registrant is not required to respond to the collection of information contained in Form N-CSR unless the Form displays a currently valid Office of Management and Budget (“OMB”) control number. Please direct comments concerning the accuracy of the information collection burden estimate and any suggestions for reducing the burden to Secretary, Securities and Exchange Commission, 450 Fifth Street, NW, Washington, DC 20549-0609. The OMB has reviewed this collection of information under the clearance requirements of 44 U.S.C. ss. 3507.
ITEM 1. REPORTS TO STOCKHOLDERS.
The following are the December 31, 2013 annual reports for the Dodge & Cox Funds, a Delaware statutory trust, consisting of five series: Dodge & Cox Stock Fund, Dodge & Cox Global Stock Fund, Dodge & Cox International Stock Fund, Dodge & Cox Balanced Fund and Dodge & Cox Income Fund. The reports of each series were transmitted to their respective shareholders on February 25, 2014.
| | | | |
 | | | |  |
www.dodgeandcox.com
For Fund literature, transactions, and account
information, please visit the Funds’ website.
or write or call:
DODGE & COX FUNDS
c/o Boston Financial Data Services
P.O. Box 8422
Boston, Massachusetts 02266-8422
(800) 621-3979
INVESTMENT MANAGER
Dodge & Cox
555 California Street, 40th Floor
San Francisco, California 94104
(415) 981-1710
This report is submitted for the general information of the shareholders of the Fund. The report is not authorized for distribution to prospective investors in the Fund unless it is accompanied by a current prospectus.
This report reflects our views, opinions, and portfolio holdings as of December 31, 2013, the end of the reporting period. Any such views are subject to change at any time based upon market or other conditions and Dodge & Cox disclaims any responsibility to update such views. These views may not be relied on as investment advice and, because investment decisions for a Dodge & Cox Fund are based on numerous factors, may not be relied on as an indication of trading intent on behalf of any Dodge & Cox Fund.
12/13 SF AR  Printed on recycled paper
Annual Report
December 31, 2013
Stock Fund
ESTABLISHED 1965
TICKER: DODGX
TO OUR SHAREHOLDERS
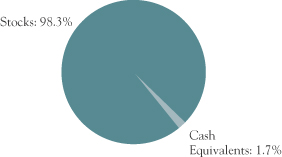
The Dodge & Cox Stock Fund had a total return of 19.6% for the six months ending December 31, 2013, compared to a return of 16.3% for the S&P 500 Index. For 2013, the Fund had a total return of 40.6%, compared to 32.4% for the S&P 500 Index. At year end, the Fund had net assets of $54.8 billion with a cash position of 1.7%.
MARKET COMMENTARY
U.S. equity markets were exceptionally strong in 2013, rising to an all-time high on December 31. The S&P 500 (up 32%) had its best annual gain since 1997, with every sector of the market generating positive returns. Substantially higher valuations reflected both earnings growth and higher investor confidence in light of an improving economy. Recent economic statistics show that the economy is growing at a moderate pace, the job market is improving, and consumer wealth is continuing to increase as home prices and other assets trend higher. As a first step toward normalizing U.S. monetary policy, the U.S. Federal Reserve (the Fed) announced its intent to reduce its quantitative easing program in 2014. This action reflects the Fed’s assessment that the economy is continuing to make progress, but has further to go to reach “normal” conditions. Despite concerns about U.S. trade and budget deficits, we remain optimistic about the long-term prospects for corporate earnings growth.
INVESTMENT STRATEGY
While U.S. equity market valuations have increased, we believe valuations are still reasonable: the S&P 500 traded at 17 times forward earnings at year end, compared to its 10-year historical average of 16 times.(a) It is important to note the Fund is not designed to replicate the overall market. Rather, it is an actively managed, diversified portfolio of equity securities. The Fund’s portfolio of 71 holdings—valued at 14 times forward earnings—is trading at a meaningful discount to the S&P 500.
Utilizing our bottom-up research process, we believe we have selected holdings with attractive long-term prospects. We employ a consistent and disciplined approach that focuses on intensive fundamental research, a three- to five-year investment horizon, and strict price discipline. Through meetings with management,
competitors, customers, and suppliers, our global industry analysts build an in-depth understanding of individual companies. Investment risks and opportunities are evaluated on a company-by-company basis. We apply our time-tested process to determine whether a company’s long-term fundamentals are appropriately incorporated into its stock price.
As a result of our individual security selection, the Fund is overweight key areas of the market we believe are particularly compelling, including Health Care (18.9% of the Fund compared to 13.0% for the S&P 500) and Financials (22.5% of the Fund compared to 16.2% for the S&P 500).
Health Care
Four of the eight new holdings purchased in the Fund during 2013 were in the Health Care sector (Cigna, Express Scripts, Forest Laboratories, and UnitedHealth Group(b)). Health care services was a particular area of opportunity, as concerns over the implementation of the Affordable Care Act (ACA) lowered valuations and attracted our attention to several leading companies.
One such example is UnitedHealth, a diversified health care services company providing managed care, pharmacy benefit management, and other specialty products and services. The company faces significant ACA-related headwinds in its Medicare (reimbursement concerns) and commercial (e.g., loss of individual membership, changes of underwriting rules) segments. Nevertheless, we believe these challenges could be offset by Medicaid expansion and rapid growth in Optum, its diversified health care delivery and IT services division. We initiated a position in the company based on UnitedHealth’s valuation in relation to its market leadership, innovative culture, and diversity of products, customers, and geographies. UnitedHealth (0.9% position) was the Fund’s largest new purchase within the Health Care sector during 2013.
Financials
In the Financials sector, the Fund has significant investments (13.9% of Fund assets) in companies with a U.S. consumer banking focus (e.g., checking accounts,
PAGE 1 § DODGE & COX STOCK FUND
savings accounts, credit cards, home and personal loans). Capital One, Wells Fargo, and Bank of America are among the Fund’s largest positions within this category. While each company has diversified lines of business and derives its profitability from numerous customers, U.S. consumer banking has emerged as a dominant theme as a result of our bottom-up research process.
For each investment opportunity, we consider the balance between company fundamentals (what we are buying) and valuation (what we are paying). The higher the valuation, the stronger the company fundamentals must be for us to invest. Although U.S. consumer banks are trading broadly in-line with their historical discount to the market, we believe that the quality of bank earnings today is superior to the quality of earnings ten years ago. After several years of intense regulatory scrutiny, most banks now have higher capital, better liquidity, fewer competitors, and the ability to improve profitability. In our opinion, banks could enter a period of loan growth, expanding margins, and positive operating leverage, while maintaining charge-offs below historical levels. Lastly, cyclical factors could work in their favor. For example, higher short-term rates and a steeper yield curve could increase the value of banks with low-cost deposits.
Capital One (the Fund’s largest position at 4.0%) is a consumer finance firm with credit card, auto lending, and banking businesses. The company has a strong franchise, attractive growth opportunities, and a disciplined management team with a solid track record and long-term focus. Capital One has grown market share while achieving high return on equity through its data analytics, which have led to sophisticated marketing and strong underwriting. Its acquisitions of ING Direct and HSBC’s credit card portfolio appear to be strategically sound. While regulatory reform could force changes in business practices that could adversely affect the industry, we believe Capital One—trading at 11 times forward earnings—is an attractive long-term investment opportunity.
IN CLOSING
After an exceptionally strong year, our market outlook is more tempered than at the beginning of 2013. In our opinion, the Fund’s portfolio, valued at a discount to the S&P 500, remains well positioned to benefit from
long-term global growth opportunities over our three- to five-year investment horizon. Acknowledging that market timing is difficult, and that stock prices can be volatile over the short term, we encourage our fellow shareholders to remain focused on the long term.
Thank you for your continued confidence in our firm. As always, we welcome your comments and questions.
For the Board of Trustees,
| | |
 | |  |
Kenneth E. Olivier, Chairman and President | | Charles F. Pohl, Senior Vice President |
January 30, 2014
| (a) | Unless otherwise specified, all weightings and characteristics are as of December 31, 2013. |
| (b) | The use of specific examples does not imply that they are more attractive investments than the Fund’s other holdings. |
DODGE & COX STOCK FUND §PAGE 2
ANNUAL PERFORMANCE REVIEW
The Fund outperformed the S&P 500 by 8.1 percentage points in 2013.
Key Contributors to Relative Results
| | § | | The Fund’s overweight position and holdings in the Information Technology sector (up 54% compared to up 29% for the S&P 500 sector) significantly contributed to results. Nokia (up 105%), Hewlett-Packard (up 101%), Xerox (up 83%), and Molex (up 78% to date of acquisition by Koch Industries) were among the strongest contributors. | |
| | § | | Strong returns for the Fund’s holdings in the Financials sector (up 42% compared to up 36% for the S&P 500 sector) and a higher average weighting (22% versus 16%) helped results. Notable contributors included Charles Schwab (up 83%), and insurance companies Genworth (up 74% to date of sale) and MetLife (up 67%). | |
| | § | | Relative returns from holdings in the Telecommunication Services sector (up 94% compared to up 12% for the S&P 500 sector) contributed to results. Vodafone (up 64%) and Sprint (up 27% to date of merger with Softbank and up 71% post-merger) performed well. | |
| | § | | The Fund’s holdings in the Consumer Discretionary sector (up 46% compared to up 43% for the S&P 500 sector), combined with a higher average weighting (15% versus 12%), aided results. Panasonic (up 93%), DISH Network (up 59%), Twenty-First Century Fox (up 57%), and Time Warner (up 49%) were among the best performers. | |
| | § | | Additional contributors included Boston Scientific (up 110%), FedEx (up 58%), and Roche (up 43%). | |
Key Detractors from Relative Results
| | § | | Relative returns from holdings in the Health Care sector (up 34% compared to up 41% for the S&P 500 sector) detracted from results. UnitedHealth (up 15% since date of purchase) and Sanofi (up 16%) were relatively weak. | |
| | § | | Additional detractors included J.C. Penney (down 21% to date of sale) and ADT Corp. (down 12%). | |
KEY CHARACTERISTICS OF DODGE & COX
Independent Organization
Dodge & Cox is one of the largest privately owned investment managers in the world. We remain committed to independence, with a goal of providing the highest quality investment management service to our existing clients.
Over 80 Years of Investment Experience
Dodge & Cox was founded in 1930. We have a stable and well-qualified team of investment professionals, most of whom have spent their entire careers at Dodge & Cox.
Experienced Investment Team
The Investment Policy Committee, which is the decision-making body for the Stock Fund, is a nine-member committee with an average tenure at Dodge & Cox of 25 years.
One Business with a Single Research Office
Dodge & Cox manages domestic, international, and global equity, fixed income, and balanced investments, operating from one office in San Francisco.
Consistent Investment Approach
Our team decision-making process involves thorough, bottom-up fundamental analysis of each investment.
Long-Term Focus and Low Expenses
We invest with a three- to five-year investment horizon, which has historically resulted in low turnover relative to our peers. We manage Funds that maintain low expense ratios.
PAGE 3 § DODGE & COX STOCK FUND
GROWTH OF $10,000 OVER 10 YEARS
FOR AN INVESTMENT MADE ON DECEMBER 31, 2003
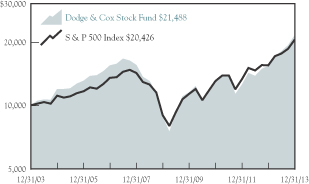
AVERAGE ANNUAL TOTAL RETURN
FOR PERIODS ENDED DECEMBER 31, 2013
| | | | | | | | | | | | | | | | |
| | | 1 Year | | | 5 Years | | | 10 Years | | | 20 Years | |
Dodge & Cox Stock Fund | | | 40.55 | % | | | 19.63 | % | | | 7.95 | % | | | 11.63 | % |
S&P 500 | | | 32.41 | | | | 17.94 | | | | 7.41 | | | | 9.22 | |
Returns represent past performance and do not guarantee future results. Investment return and share price will fluctuate with market conditions, and investors may have
a gain or loss when shares are sold. Fund performance changes over time and currently may be significantly lower than stated. Performance is updated and published monthly. Visit the Fund’s website at www.dodgeandcox.com or call 800-621-3979 for current performance figures.
The Fund’s total returns include the reinvestment of dividend and capital gain distributions, but have not been adjusted for any income taxes payable by shareholders on these distributions or on Fund share redemptions. Index returns include dividends but, unlike Fund returns, do not reflect fees or expenses. The S&P 500 Index is a market capitalization-weighted index of 500 large-capitalization stocks commonly used to represent the U.S. equity market.
S&P 500® is a trademark of McGraw Hill Financial.
Risks: The Fund is subject to stock market risk, meaning stocks in the Fund may decline in value for extended periods due to the financial prospects of individual companies, or due to general market and economic conditions. Please read the prospectus and summary prospectus for specific details regarding the Fund’s risk profile.
FUND EXPENSE EXAMPLE
As a Fund shareholder, you incur ongoing Fund costs, including management fees and other Fund expenses. All mutual funds have ongoing costs, sometimes referred to as operating expenses. The following example shows ongoing costs of investing in the Fund and can help you understand these costs and compare them with those of other mutual funds. The example assumes a $1,000 investment held for the six months indicated.
ACTUAL EXPENSES
The first line of the table below provides information about actual account values and expenses based on the Fund’s actual returns. You may use the information in this line, together with your account balance, to estimate the expenses that you paid over the period. Simply divide your account value by $1,000 (for example, an $8,600 account value divided by $1,000 = 8.6), then multiply the result by the number in the first line under the heading “Expenses Paid During Period” to estimate the expenses you paid on your account during this period.
HYPOTHETICAL EXAMPLE FOR COMPARISON WITH OTHER MUTUAL FUNDS
Information on the second line of the table can help you compare ongoing costs of investing in the Fund with those of other mutual funds. This information may not be used to estimate the actual ending account balance or expenses you paid during the period. The hypothetical “Ending Account Value” is based on the actual expense ratio of the Fund and an assumed 5% annual rate of return before expenses (not the Fund’s actual return). The amount under the heading “Expense Paid During the Period” shows the hypothetical expenses your account would have incurred under this scenario. You can compare this figure with the 5% hypothetical examples that appear in shareholder reports of other mutual funds.
| | | | | | | | | | | | |
Six Months Ended
December 31, 2013 | | Beginning Account Value
7/1/2013 | | | Ending Account Value
12/31/2013 | | | Expenses Paid
During Period* | |
Based on Actual Fund Return | | $ | 1,000.00 | | | $ | 1,195.60 | | | $ | 2.85 | |
Based on Hypothetical 5% Yearly Return | | | 1,000.00 | | | | 1,022.61 | | | | 2.63 | |
| * | Expenses are equal to the Fund’s annualized expense ratio of 0.52%, multiplied by the average account value over the period, multiplied by 184/365 (to reflect the one-half year period). |
The expenses shown in the table highlight ongoing costs only and do not reflect any transactional fees or account maintenance fees. Though other mutual funds may charge such fees, please note that the Fund does not charge transaction fees (e.g., redemption fees, sales loads) or universal account maintenance fees (e.g., small account fees).
DODGE & COX STOCK FUND §PAGE 4
| | | | |
| FUND INFORMATION | | | December 31, 2013 | |
| | | | |
| GENERAL INFORMATION | | | |
Net Asset Value Per Share | | | $168.87 | |
Total Net Assets (billions) | | | $54.8 | |
Expense Ratio | | | 0.52% | |
Portfolio Turnover Rate | | | 15% | |
30-Day SEC Yield(a) | | | 1.23% | |
Fund Inception | | | 1965 | |
No sales charges or distribution fees | | | | |
Investment Manager: Dodge & Cox, San Francisco. Managed by the Investment Policy Committee, whose nine members’ average tenure at Dodge & Cox is 25 years.
| | | | | | | | |
| PORTFOLIO CHARACTERISTICS | | Fund | | | S&P 500 | |
Number of Stocks | | | 71 | | | | 500 | |
Median Market Capitalization (billions) | | | $34 | | | | $17 | |
Weighted Average Market Capitalization (billions) | | | $108 | | | | $122 | |
Price-to-Earnings Ratio(b) | | | 14.0x | | | | 16.7x | |
Foreign Stocks not in the S&P 500(c) | | | 16.5% | | | | 0.0% | |
| | | | |
| TEN LARGEST HOLDINGS (%)(d) | | Fund | |
Capital One Financial Corp. | | | 4.0 | |
Hewlett-Packard Co. | | | 3.7 | |
Wells Fargo & Co. | | | 3.7 | |
Microsoft Corp. | | | 3.5 | |
Comcast Corp. | | | 3.4 | |
Time Warner, Inc. | | | 2.8 | |
General Electric Co. | | | 2.8 | |
Novartis AG (Switzerland) | | | 2.7 | |
Schlumberger, Ltd. | | | 2.7 | |
Merck & Co., Inc. | | | 2.7 | |
|
| ASSET ALLOCATION |
|
|
| | | | | | | | |
| SECTOR DIVERSIFICATION (%) | | Fund | | | S&P 500 | |
Financials | | | 22.5 | | | | 16.2 | |
Information Technology | | | 21.6 | | | | 18.6 | |
Health Care | | | 18.9 | | | | 13.0 | |
Consumer Discretionary | | | 14.4 | | | | 12.6 | |
Energy | | | 7.7 | | | | 10.3 | |
Industrials | | | 7.5 | | | | 10.9 | |
Materials | | | 2.4 | | | | 3.4 | |
Consumer Staples | | | 2.0 | | | | 9.8 | |
Telecommunication Services | | | 1.3 | | | | 2.3 | |
Utilities | | | 0.0 | | | | 2.9 | |
| (a) | SEC Yield is an annualization of the Fund’s total net investment income per share for the 30-day period ended on the last day of the month. |
| (b) | Price-to-earnings (P/E) ratios are calculated using 12-month forward earnings estimates from third-party sources. |
| (c) | Foreign stocks are U.S. dollar denominated. |
| (d) | The Fund’s portfolio holdings are subject to change without notice. The mention of specific securities is not a recommendation to buy, sell, or hold any particular security and is not indicative of Dodge & Cox’s current or future trading activity. |
PAGE 5 § DODGE & COX STOCK FUND
| | | | |
| PORTFOLIO OF INVESTMENTS | | | December 31, 2013 | |
| | | | | | | | |
| COMMON STOCKS: 98.3% | |
| | |
| | | SHARES | | | VALUE | |
| CONSUMER DISCRETIONARY: 14.4% | |
CONSUMER DURABLES & APPAREL: 1.6% | | | | | |
Coach, Inc. | | | 9,173,800 | | | $ | 514,925,394 | |
NVR, Inc.(a) | | | 80,600 | | | | 82,696,406 | |
Panasonic Corp. ADR(b) (Japan) | | | 25,028,897 | | | | 291,836,939 | |
| | | | | | | | |
| | | | | | | 889,458,739 | |
MEDIA: 11.7% | | | | | | | | |
Comcast Corp., Class A | | | 36,331,197 | | | | 1,887,950,652 | |
DISH Network Corp., Class A(a) | | | 9,390,849 | | | | 543,917,974 | |
News Corp., Class A(a) | | | 6,967,906 | | | | 125,561,666 | |
Time Warner Cable, Inc. | | | 9,487,310 | | | | 1,285,530,505 | |
Time Warner, Inc. | | | 22,069,732 | | | | 1,538,701,715 | |
Twenty-First Century Fox, Inc. | | | 29,071,626 | | | | 1,022,739,803 | |
| | | | | | | | |
| | | | | | | 6,404,402,315 | |
RETAILING: 1.1% | | | | | | | | |
CarMax, Inc.(a) | | | 4,927,850 | | | | 231,707,507 | |
Liberty Interactive, Series A(a) | | | 13,893,875 | | | | 407,785,231 | |
| | | | | | | | |
| | | | | | | 639,492,738 | |
| | | | | | | | |
| | | | | | | 7,933,353,792 | |
| CONSUMER STAPLES: 2.0% | | | | | | | | |
FOOD & STAPLES RETAILING: 1.5% | | | | | |
Wal-Mart Stores, Inc. | | | 10,458,650 | | | | 822,991,169 | |
| |
FOOD, BEVERAGE & TOBACCO: 0.5% | | | | | |
Unilever PLC ADR(b)
(United Kingdom) | | | 6,273,600 | | | | 258,472,320 | |
| | | | | | | | |
| | | | | | | 1,081,463,489 | |
| ENERGY: 7.7% | | | | | | | | |
Apache Corp. | | | 8,125,705 | | | | 698,323,088 | |
Baker Hughes, Inc. | | | 13,727,350 | | | | 758,573,361 | |
Chevron Corp. | | | 6,955,480 | | | | 868,809,007 | |
Schlumberger, Ltd.(b)
(Curacao/United States) | | | 16,581,845 | | | | 1,494,190,053 | |
Weatherford International, Ltd.(a),(b) (Switzerland) | | | 25,000,000 | | | | 387,250,000 | |
| | | | | | | | |
| | | | | | | 4,207,145,509 | |
| FINANCIALS: 22.5% | | | | | | | | |
BANKS: 5.7% | | | | | | | | |
BB&T Corp. | | | 10,879,144 | | | | 406,009,654 | |
HSBC Holdings PLC ADR(b)
(United Kingdom) | | | 6,110,329 | | | | 336,862,438 | |
SunTrust Banks, Inc. | | | 10,470,533 | | | | 385,420,320 | |
Wells Fargo & Co. | | | 44,297,041 | | | | 2,011,085,661 | |
| | | | | | | | |
| | | | | | | 3,139,378,073 | |
DIVERSIFIED FINANCIALS: 14.7% | | | | | | | | |
Bank of America Corp. | | | 77,214,700 | | | | 1,202,232,879 | |
Bank of New York Mellon Corp. | | | 34,417,324 | | | | 1,202,541,300 | |
Capital One Financial Corp.(c) | | | 28,876,111 | | | | 2,212,198,864 | |
Charles Schwab Corp. | | | 54,054,200 | | | | 1,405,409,200 | |
Goldman Sachs Group, Inc. | | | 6,996,500 | | | | 1,240,199,590 | |
| | | | | | | | |
| | |
| | | SHARES | | | VALUE | |
JPMorgan Chase & Co. | | | 7,521,900 | | | $ | 439,880,712 | |
McGraw-Hill Financial, Inc. | | | 4,935,825 | | | | 385,981,515 | |
| | | | | | | | |
| | | | | | | 8,088,444,060 | |
INSURANCE: 2.1% | | | | | | | | |
AEGON NV(b) (Netherlands) | | | 65,915,794 | | | | 624,881,727 | |
MetlLife, Inc. | | | 9,399,600 | | | | 506,826,432 | |
| | | | | | | | |
| | | | | | | 1,131,708,159 | |
| | | | | | | | |
| | | | | | | 12,359,530,292 | |
| HEALTH CARE: 18.9% | | | | | | | | |
HEALTH CARE EQUIPMENT & SERVICES: 3.1% | |
Boston Scientific Corp.(a) | | | 27,699,200 | | | | 332,944,384 | |
Cigna Corp. | | | 3,373,784 | | | | 295,138,624 | |
Express Scripts Holding Co.(a) | | | 3,701,953 | | | | 260,025,179 | |
Medtronic, Inc. | | | 5,435,000 | | | | 311,914,650 | |
UnitedHealth Group, Inc. | | | 6,793,100 | | | | 511,520,430 | |
| | | | | | | | |
| | | | | | | 1,711,543,267 | |
PHARMACEUTICALS, BIOTECHNOLOGY & LIFE SCIENCES: 15.8% | |
Forest Laboratories, Inc.(a) | | | 5,080,313 | | | | 304,971,190 | |
GlaxoSmithKline PLC ADR(b) (United Kingdom) | | | 24,703,400 | | | | 1,318,914,526 | |
Merck & Co., Inc. | | | 29,748,700 | | | | 1,488,922,435 | |
Novartis AG ADR(b) (Switzerland) | | | 18,750,400 | | | | 1,507,157,152 | |
Pfizer, Inc. | | | 40,543,764 | | | | 1,241,855,491 | |
Roche Holding AG ADR(b) (Switzerland) | | | 18,370,500 | | | | 1,289,609,100 | |
Sanofi ADR(b) (France) | | | 27,670,629 | | | | 1,483,975,833 | |
| | | | | | | | |
| | | | | | | 8,635,405,727 | |
| | | | | | | | |
| | | | | | | 10,346,948,994 | |
| INDUSTRIALS: 7.5% | | | | | | | | |
CAPITAL GOODS: 3.4% | | | | | | | | |
General Electric Co. | | | 53,906,075 | | | | 1,510,987,282 | |
Koninklijke Philips NV(b) (Netherlands) | | | 8,639,387 | | | | 319,398,138 | |
| | | | | | | | |
| | | | | | | 1,830,385,420 | |
COMMERCIAL & PROFESSIONAL SERVICES: 1.7% | |
ADT Corp.(c) | | | 12,073,537 | | | | 488,616,042 | |
Tyco International, Ltd.(b) (Switzerland) | | | 10,890,275 | | | | 446,936,886 | |
| | | | | | | | |
| | | | | | | 935,552,928 | |
TRANSPORTATION: 2.4% | | | | | | | | |
FedEx Corp. | | | 9,247,199 | | | | 1,329,469,800 | |
| | | | | | | | |
| | | | | | | 4,095,408,148 | |
| | |
| See accompanying Notes to Financial Statements | | DODGE & COX STOCK FUND §PAGE 6 |
| | | | |
| PORTFOLIO OF INVESTMENTS | | | December 31, 2013 | |
| | | | | | | | |
| COMMON STOCKS (continued) | |
| | |
| | | SHARES | | | VALUE | |
| INFORMATION TECHNOLOGY: 21.6% | |
SEMICONDUCTORS & SEMICONDUCTOR EQUIPMENT: 0.5% | |
Maxim Integrated Products, Inc. | | | 10,277,500 | | | $ | 286,845,025 | |
| | |
SOFTWARE & SERVICES: 11.5% | | | | | | | | |
Adobe Systems, Inc.(a) | | | 6,412,141 | | | | 383,959,003 | |
AOL, Inc.(a),(c) | | | 5,997,054 | | | | 279,582,657 | |
Cadence Design Systems, Inc.(a) | | | 11,593,400 | | | | 162,539,468 | |
Computer Sciences Corp.(c) | | | 6,214,562 | | | | 347,269,725 | |
eBay, Inc.(a) | | | 11,382,246 | | | | 624,771,483 | |
Google, Inc., Class A(a) | | | 776,500 | | | | 870,231,315 | |
Microsoft Corp. | | | 51,451,100 | | | | 1,925,814,673 | |
Symantec Corp.(c) | | | 50,304,000 | | | | 1,186,168,320 | |
Synopsys, Inc.(a),(c) | | | 13,596,636 | | | | 551,615,523 | |
| | | | | | | | |
| | | | | | | 6,331,952,167 | |
TECHNOLOGY, HARDWARE & EQUIPMENT: 9.6% | |
Corning, Inc. | | | 35,006,300 | | | | 623,812,266 | |
EMC Corp. | | | 2,071,100 | | | | 52,088,165 | |
Hewlett-Packard Co. | | | 72,623,495 | | | | 2,032,005,390 | |
NetApp, Inc. | | | 14,635,500 | | | | 602,104,470 | |
Nokia Corp. ADR(a),(b) (Finland) | | | 108,557,500 | | | | 880,401,325 | |
TE Connectivity, Ltd.(b) (Switzerland) | | | 13,763,275 | | | | 758,494,085 | |
Xerox Corp.(c) | | | 24,999,382 | | | | 304,242,479 | |
| | | | | | | | |
| | | | | | | 5,253,148,180 | |
| | | | | | | | |
| | | | | | | 11,871,945,372 | |
| MATERIALS: 2.4% | | | | | | | | |
Celanese Corp., Series A(c) | | | 9,419,271 | | | | 520,979,879 | |
Domtar Corp. | | | 667,749 | | | | 62,995,441 | |
Dow Chemical Co. | | | 10,651,389 | | | | 472,921,671 | |
Vulcan Materials Co. | | | 4,169,652 | | | | 247,760,722 | |
| | | | | | | | |
| | | | | | | 1,304,657,713 | |
| TELECOMMUNICATION SERVICES: 1.3% | |
Sprint Corp.(a) | | | 39,059,996 | | | | 419,894,957 | |
Vodafone Group PLC ADR(b) (United Kingdom) | | | 8,349,300 | | | | 328,210,983 | |
| | | | | | | | |
| | | | | | | 748,105,940 | |
| | | | | | | | |
TOTAL COMMON STOCKS
(Cost $37,114,320,099) | | | $ | 53,948,559,249 | |
| | | | | | | | |
| SHORT-TERM INVESTMENTS: 2.5% | | | | |
| | |
| | | PAR VALUE | | | VALUE | |
MONEY MARKET FUND: 0.1% | | | | | |
SSgA U.S. Treasury Money Market Fund | | $ | 55,086,158 | | | $ | 55,086,158 | |
| |
REPURCHASE AGREEMENT: 2.4% | | | | | |
Fixed Income Clearing Corporation(d) 0.00%, dated 12/31/13, due 1/2/14, maturity value $1,296,983,000 | | | 1,296,983,000 | | | | 1,296,983,000 | |
| | | | | | | | |
TOTAL SHORT-TERM INVESTMENTS
(Cost $1,352,069,158) | | | $ | 1,352,069,158 | |
| | | | | | | | |
TOTAL INVESTMENTS
(Cost $38,466,389,257) | | | 100.8 | % | | $ | 55,300,628,407 | |
OTHER ASSETS LESS LIABILITIES | | | (0.8 | %) | | | (453,112,875 | ) |
| | | | | | | | |
| NET ASSETS | | | 100.0 | % | | $ | 54,847,515,532 | |
| | | | | | | | |
| (b) | Security denominated in U.S. dollars |
| (c) | See Note 9 regarding holdings of 5% voting securities |
| (d) | Repurchase agreement is collateralized by U.S. Treasury Notes 1.00%-3.75%, 8/31/18-9/30/19. Total collateral value is $1,322,935,427. |
| | In determining a company’s country designation, the Fund generally references the country of incorporation. In cases where the Fund considers the country of incorporation to be a “jurisdiction of convenience” chosen primarily for tax purposes, the Fund uses the country designation of an appropriate broad-based market index. In that circumstance, two countries are listed - the country of incorporation and the country designated by an appropriate index, respectively. |
ADR: American Depositary Receipt
| | |
| PAGE 7 § DODGE & COX STOCK FUND | | See accompanying Notes to Financial Statements |
| | | | |
STATEMENT OF ASSETS AND LIABILITIES | |
| |
| | | December 31, 2013 | |
ASSETS: | | | | |
Investments, at value | | | | |
Unaffiliated issuers (cost $34,823,342,980) | | $ | 50,061,467,122 | |
Affiliated issuers (cost $3,643,046,277) | | | 5,239,161,285 | |
| | | | |
| | | 55,300,628,407 | |
Receivable for Fund shares sold | | | 49,314,034 | |
Dividends and interest receivable | | | 85,611,630 | |
Prepaid expenses and other assets | | | 270,188 | |
| | | | |
| | | 55,435,824,259 | |
| | | | |
LIABILITIES: | | | | |
Payable for investments purchased | | | 49,534,169 | |
Payable for Fund shares redeemed | | | 514,590,531 | |
Management fees payable | | | 22,981,100 | |
Accrued expenses | | | 1,202,927 | |
| | | | |
| | | 588,308,727 | |
| | | | |
NET ASSETS | | $ | 54,847,515,532 | |
| | | | |
NET ASSETS CONSIST OF: | | | | |
Paid in capital | | $ | 38,461,930,224 | |
Undistributed net investment income | | | 8,002,123 | |
Accumulated net realized loss | | | (456,655,965 | ) |
Net unrealized appreciation | | | 16,834,239,150 | |
| | | | |
| | $ | 54,847,515,532 | |
| | | | |
Fund shares outstanding (par value $0.01 each, unlimited shares authorized) | | | 324,793,489 | |
Net asset value per share | | $ | 168.87 | |
| |
STATEMENT OF OPERATIONS | | | | |
| | | Year Ended
December 31, 2013 | |
INVESTMENT INCOME: | | | | |
Dividends (net of foreign taxes of $19,403,102) | | | | |
Unaffiliated issuers | | $ | 868,430,305 | |
Affiliated issuers | | | 69,737,145 | |
Interest | | | 108,645 | |
| | | | |
| | | 938,276,095 | |
| | | | |
EXPENSES: | | | | |
Management fees | | | 238,546,912 | |
Custody and fund accounting fees | | | 972,014 | |
Transfer agent fees | | | 3,997,942 | |
Professional services | | | 389,699 | |
Shareholder reports | | | 922,445 | |
Registration fees | | | 332,485 | |
Trustees’ fees | | | 215,000 | |
Miscellaneous | | | 1,427,782 | |
| | | | |
| | | 246,804,279 | |
| | | | |
NET INVESTMENT INCOME | | | 691,471,816 | |
| | | | |
REALIZED AND UNREALIZED GAIN: | | | | |
Net realized gain | | | | |
Unaffiliated issuers | | | 2,082,530,648 | |
Affiliated issuers | | | 859,666,054 | |
Net change in unrealized appreciation/depreciation | | | 12,466,351,142 | |
| | | | |
Net realized and unrealized gain | | | 15,408,547,844 | |
| | | | |
NET INCREASE IN NET ASSETS
FROM OPERATIONS | | $ | 16,100,019,660 | |
| | | | |
| | | | | | | | |
STATEMENT OF CHANGES IN NET ASSETS | |
| | |
| | | Year Ended
December 31, 2013 | | | Year Ended
December 31, 2012 | |
OPERATIONS: | | | | | | | | |
Net investment income | | $ | 691,471,816 | | | $ | 676,447,198 | |
Net realized gain | | | 2,942,196,702 | | | | 2,915,244,773 | |
Net change in unrealized appreciation/depreciation | | | 12,466,351,142 | | | | 4,107,467,284 | |
| | | | | | | | |
| | | 16,100,019,660 | | | | 7,699,159,255 | |
| | | | | | | | |
| |
DISTRIBUTIONS TO
SHAREHOLDERS FROM: | | | | | |
Net investment income | | | (688,649,453 | ) | | | (677,796,823 | ) |
Net realized gain | | | — | | | | — | |
| | | | | | | | |
Total distributions | | | (688,649,453 | ) | | | (677,796,823 | ) |
| | | | | | | | |
| | |
FUND SHARE TRANSACTIONS: | | | | | | | | |
Proceeds from sale of shares | | | 7,505,695,700 | | | | 5,342,166,537 | |
Reinvestment of distributions | | | 638,450,488 | | | | 631,503,635 | |
Cost of shares redeemed | | | (8,549,348,435 | ) | | | (9,716,062,236 | ) |
| | | | | | | | |
Net decrease from Fund
share transactions | | | (405,202,247 | ) | | | (3,742,392,064 | ) |
| | | | | | | | |
Total increase in net assets | | | 15,006,167,960 | | | | 3,278,970,368 | |
| | |
NET ASSETS: | | | | | | | | |
Beginning of year | | | 39,841,347,572 | | | | 36,562,377,204 | |
| | | | | | | | |
End of year (including undistributed net investment income of $8,002,123 and $5,179,760, respectively) | | $ | 54,847,515,532 | | | $ | 39,841,347,572 | |
| | | | | | | | |
| | |
SHARE INFORMATION: | | | | | | | | |
Shares sold | | | 52,247,087 | | | | 47,112,087 | |
Distributions reinvested | | | 4,391,872 | | | | 5,518,679 | |
Shares redeemed | | | (58,685,059 | ) | | | (85,519,079 | ) |
| | | | | | | | |
Net decrease in shares
outstanding | | | (2,046,100 | ) | | | (32,888,313 | ) |
| | | | | | | | |
| | |
| See accompanying Notes to Financial Statements | | DODGE & COX STOCK FUND §PAGE 8 |
NOTES TO FINANCIAL STATEMENTS
NOTE 1—ORGANIZATION AND SIGNIFICANT ACCOUNTING POLICIES
Dodge & Cox Stock Fund (the “Fund”) is one of the series constituting the Dodge & Cox Funds (the “Trust” or the “Funds”). The Trust is organized as a Delaware statutory trust and is registered under the Investment Company Act of 1940, as amended, as a diversified, open-end management investment company. The Fund commenced operations on January 4, 1965, and seeks long-term growth of principal and income. Risk considerations and investment strategies of the Fund are discussed in the Fund’s Prospectus.
The financial statements have been prepared in conformity with accounting principles generally accepted in the United States of America, which require the use of estimates and assumptions by management. Actual results may differ from those estimates. Significant accounting policies are as follows:
Security valuation The Fund’s net assets are valued as of the close of trading on the New York Stock Exchange (NYSE), generally 4:00 p.m. Eastern Time, each day that the NYSE is open for business. Portfolio securities and other financial instruments for which market quotes are readily available are valued at market value. Listed securities are generally valued using the official quoted close price or the last sale on the exchange that is determined to be the primary market for the security. Security values are not discounted based on the size of the Fund’s position. Securities for which market quotations are not readily available are valued at fair value as determined in good faith by or under the direction of the Board of Trustees. Short-term securities less than 60 days to maturity may be valued at amortized cost if amortized cost approximates current value. All securities held by the Fund are denominated in U.S. dollars.
Security transactions, investment income, expenses, and distributions Security transactions are recorded on the trade date. Realized gains and losses on securities sold are determined on the basis of identified cost.
Dividend income and corporate action transactions are recorded on the ex-dividend date, or when the Fund first learns of the dividend/corporate action if the ex-dividend date has passed. Withholding taxes on foreign dividends have been provided for in accordance with the
Fund’s understanding of the applicable country’s tax rules and rates. Non-cash dividends included in dividend income, if any, are recorded at the fair market value of the securities received. Dividends characterized as return of capital for U.S. tax purposes are recorded as a reduction of cost of investments and/or realized gain. Interest income is recorded on the accrual basis.
Expenses are recorded on the accrual basis. Most expenses of the Trust can be directly attributed to a specific series. Expenses which cannot be directly attributed are allocated among the Funds in the Trust based on relative net assets or other expense methodologies determined by the nature of the expense.
Distributions to shareholders are recorded on the ex-dividend date.
Repurchase agreements The Fund enters into repurchase agreements, secured by U.S. government or agency securities, which involve the purchase of securities from a counterparty with a simultaneous commitment to resell the securities at an agreed-upon date and price. It is the Fund’s policy that its custodian take possession of the underlying collateral securities, the fair value of which exceeds the principal amount of the repurchase transaction, including accrued interest, at all times. In the event of default by the counterparty, the Fund has the contractual right to liquidate the collateral securities and to apply the proceeds in satisfaction of the obligation.
Indemnification Under the Trust’s organizational documents, its officers and trustees are indemnified against certain liabilities arising out of the performance of their duties to the Trust. In addition, in the normal course of business the Trust enters into contracts that provide general indemnities to other parties. The Trust’s maximum exposure under these arrangements is unknown as this would involve future claims that may be made against the Trust that have not yet occurred.
PAGE 9 § DODGE & COX STOCK FUND
NOTES TO FINANCIAL STATEMENTS
NOTE 2—VALUATION MEASUREMENTS
Various inputs are used in determining the value of the Fund’s investments. These inputs are summarized in the three broad levels listed below.
| § | | Level 1: Quoted prices in active markets for identical securities |
| § | | Level 2: Other significant observable inputs (including quoted prices for similar securities, market indices, interest rates, credit risk, etc.) |
| § | | Level 3: Significant unobservable inputs (including Fund management’s assumptions in determining the fair value of investments) |
The inputs or methodology used for valuing securities are not necessarily an indication of the risk associated with investing in those securities.
The following is a summary of the inputs used to value the Fund’s holdings as of December 31, 2013:
| | | | | | | | |
| Security Classification(a) | | LEVEL 1
(Quoted Prices) | | | LEVEL 2
(Other Significant
Observable Inputs) | |
Common Stocks(b) | | $ | 53,948,559,249 | | | $ | — | |
Short-term Investments | | | | | | | | |
Money Market Fund | | | 55,086,158 | | | | — | |
Repurchase Agreement | | | — | | | | 1,296,983,000 | |
| | | | | | | | |
Total | | $ | 54,003,645,407 | | | $ | 1,296,983,000 | |
| | | | | | | | |
| | | | | | | | | |
| (a) | There were no transfers between Level 1 and Level 2 during the year ended December 31, 2013. There were no Level 3 securities at December 31, 2013 and 2012, and there were no transfers to Level 3 during the year. |
| (b) | All common stocks held in the Fund are Level 1 securities. For a detailed break-out of common stocks by major industry classification, please refer to the Portfolio of Investments. |
NOTE 3—RELATED PARTY TRANSACTIONS
Management fees Under a written agreement approved by a unanimous vote of the Board of Trustees, the Fund pays an annual management fee of 0.50% of the Fund’s average daily net assets to Dodge & Cox, investment manager of the Fund. The agreement further provides that Dodge & Cox shall waive its fee to the extent that such fee plus all other ordinary operating expenses of the Fund exceed 0.75% of the average daily net assets for the year.
Fund officers and trustees All officers and three of the trustees of the Trust are officers or employees of Dodge & Cox. The Trust pays a fee only to those trustees who are not affiliated with Dodge & Cox.
NOTE 4—INCOME TAX INFORMATION AND DISTRIBUTIONS TO SHAREHOLDERS
A provision for federal income taxes is not required since the Fund intends to continue to qualify as a regulated investment company under Subchapter M of the Internal Revenue Code and distribute all of its taxable income to shareholders. Distributions are determined in accordance with income tax regulations, and such amounts may differ from net investment income and realized gains for financial reporting purposes. Financial reporting records are adjusted for permanent book/tax differences at year end to reflect tax character.
Book/tax differences are primarily due to differing treatments of wash sales, in-kind redemptions, and net short-term realized gain (loss). During the year, the Fund recognized net realized gains of $118,496,078 from the delivery of appreciated securities in an in-kind redemption transaction. For federal income tax purposes, this gain is not recognized as taxable income to the Fund and therefore will not be distributed to shareholders. At December 31, 2013, the cost of investments for federal income tax purposes was $38,482,418,995.
Distributions during the years noted below were characterized as follows for federal income tax purposes:
| | | | | | |
| | | Year Ended December 31, 2013 | | Year Ended
December 31, 2012 | |
Ordinary income | | $688,649,453 | | | $677,796,823 | |
| | ($2.105 per share) | | | ($1.975 per share) | |
| | |
Long-term capital gain | | — | | | — | |
At December 31, 2013, the tax basis components of distributable earnings were as follows:
| | | | |
Unrealized appreciation | | $ | 17,481,631,006 | |
Unrealized depreciation | | | (663,421,594 | ) |
| | | | |
Net unrealized appreciation | | | 16,818,209,412 | |
Undistributed ordinary income | | | 8,002,123 | |
Capital loss carryforward(a) | | | (440,626,227 | ) |
| (a) | Represents accumulated capital loss as of December 31, 2013, which may be carried forward to offset future capital gains. During 2013, the Fund utilized $2,791,744,593 of the capital loss carryforward. If not utilized, the remaining capital loss carryforward will expire in 2017. |
DODGE & COX STOCK FUND §PAGE 10
NOTES TO FINANCIAL STATEMENTS
Under the Regulated Investment Company Modernization Act of 2010, capital losses incurred by the Fund after January 1, 2011, are not subject to expiration. In addition, such losses must be utilized prior to the losses incurred in the years preceding enactment.
Fund management has reviewed the tax positions for open periods (three years and four years, respectively, from filing the Fund’s Federal and State tax returns) as applicable to the Fund, and has determined that no provision for income tax is required in the Fund’s financial statements.
NOTE 5—LOAN FACILITIES
Pursuant to an exemptive order issued by the Securities and Exchange Commission (SEC), the Fund may participate in an interfund lending facility (Facility). The Facility allows the Fund to borrow money from or loan money to the Funds. Loans under the Facility are made for temporary or emergency purposes, such as to fund shareholder redemption requests. Interest on borrowings is the average of the current repurchase agreement rate and the bank loan rate. There was no activity in the Facility during the year.
All Funds in the Trust participate in a $500 million committed credit facility (Line of Credit) with State Street Bank and Trust Company, to be utilized for temporary or emergency purposes to fund shareholder redemptions or for other short-term liquidity purposes. The maximum amount available to the Fund is $250 million. Each Fund pays an annual commitment fee on its pro-rata portion of the Line of Credit. The Fund’s commitment fee for the year ended December 31, 2013, amounted to $157,721 and is reflected as a Miscellaneous Expense in the Statement of Operations. Interest on borrowings is charged at the prevailing rate. There were no borrowings on the Line of Credit during the year.
NOTE 6—PURCHASES AND SALES OF INVESTMENTS
For the year ended December 31, 2013, purchases and sales of securities, other than short-term securities, aggregated $7,162,683,304 and $8,060,538,798, respectively.
NOTE 7—ACCOUNTING PRONOUNCEMENTS
Effective January 1, 2013, the Fund adopted Accounting Standards Update (ASU) No. 2011-11, Balance Sheet (Topic 210): Disclosures about Offsetting Assets and Liabilities and ASU No. 2013-01, Balance Sheet (Topic 210): Clarifying the Scope of Disclosures about Offsetting Assets and Liabilities. These amendments to Topic 210 require enhanced disclosures about offsetting of financial assets and liabilities, including derivative instruments, to enable investors to understand the effect of these arrangements on a fund’s financial position. There was no impact to these financial statements as a result of applying these ASUs.
NOTE 8—SUBSEQUENT EVENTS
Fund management has determined that no material events or transactions occurred subsequent to December 31, 2013, and through the date of the Fund’s financial statements issuance, which require additional disclosure in the Fund’s financial statements.
PAGE 11 § DODGE & COX STOCK FUND
NOTES TO FINANCIAL STATEMENTS
NOTE 9—HOLDINGS OF 5% VOTING SECURITIES
Each of the companies listed below was considered to be an affiliate of the Fund because the Fund owned 5% or more of the company’s voting securities during all or part of the year ended December 31, 2013. Purchase and sale transactions and dividend income earned during the period on these securities were as follows:
| | | | | | | | | | | | | | | | | | | | | | | | |
| | | Shares at
Beginning of Period | | | Additions | | | Reductions | | | Shares at
End of Period | | | Dividend
Income(a) | | | Value at End of Period | |
ADT Corp. | | | 2,545,137 | | | | 9,550,000 | | | | (21,600 | ) | | | 12,073,537 | | | | 1,509,192 | | | | 488,616,042 | |
AOL, Inc. | | | 4,697,054 | | | | 1,300,000 | | | | — | | | | 5,997,054 | | | | — | (b) | | | 279,582,657 | |
BMC Software, Inc. | | | 7,402,540 | | | | — | | | | (7,402,540 | ) | | | — | | | | — | (b) | | | — | |
Capital One Financial Corp. | | | 29,207,211 | | | | — | | | | (331,100 | ) | | | 28,876,111 | | | | 27,534,190 | | | | 2,212,198,864 | |
Celanese Corp., Series A | | | 9,280,071 | | | | 200,000 | | | | (60,800 | ) | | | 9,419,271 | | | | 4,886,149 | | | | 520,979,879 | |
Computer Sciences Corp. | | | 8,982,762 | | | | — | | | | (2,768,200 | ) | | | 6,214,562 | | | | 5,605,290 | | | | — | (c) |
Compuware Corp. | | | 14,549,712 | | | | — | | | | (14,549,712 | ) | | | — | | | | 1,769,552 | | | | — | |
Sprint Nextel Corp. | | | 183,015,570 | | | | 28,775,069 | | | | (211,790,639 | ) | | | — | | | | — | (b) | | | — | |
Symantec Corp. | | | 33,751,300 | | | | 16,800,000 | | | | (247,300 | ) | | | 50,304,000 | | | | 17,791,740 | | | | 1,186,168,320 | |
Synopsys, Inc. | | | 12,694,669 | | | | 1,020,267 | | | | (118,300 | ) | | | 13,596,636 | | | | — | (b) | | | 551,615,523 | |
Xerox Corp. | | | 65,746,682 | | | | — | | | | (40,747,300 | ) | | | 24,999,382 | | | | 10,641,032 | | | | — | (c) |
| | | | | | | | | | | | | | | | | | | | | | | | |
| | | | | | | | | | | | | | | | | | $ | 69,737,145 | | | $ | 5,239,161,285 | |
| | | | | | | | | | | | | | | | | | | | | | | | |
| | | | | | | | | | | | | | | | | | | | | | | | | |
| (a) | Net of foreign taxes, if any |
| (c) | Company was not an affiliate at period end |
FINANCIAL HIGHLIGHTS
| | | | | | | | | | | | | | | | | | | | |
SELECTED DATA AND RATIOS (for a share outstanding throughout each year) | | Year Ended December 31, | |
| | | 2013 | | | 2012 | | | 2011 | | | 2010 | | | 2009 | |
| | | | |
Net asset value, beginning of year | | | $121.90 | | | | $101.64 | | | | $107.76 | | | | $96.14 | | | | $74.37 | |
Income from investment operations: | | | | | | | | | | | | | | | | | | | | |
Net investment income | | | 2.11 | | | | 1.98 | | | | 1.76 | | | | 1.23 | | | | 1.15 | |
Net realized and unrealized gain (loss) | | | 46.97 | | | | 20.26 | | | | (6.13 | ) | | | 11.62 | | | | 21.82 | |
| | | | |
Total from investment operations | | | 49.08 | | | | 22.24 | | | | (4.37 | ) | | | 12.85 | | | | 22.97 | |
| | | | |
Distributions to shareholders from: | | | | | | | | | | | | | | | | | | | | |
Net investment income | | | (2.11 | ) | | | (1.98 | ) | | | (1.75 | ) | | | (1.23 | ) | | | (1.20 | ) |
Net realized gain | | | — | | | | — | | | | — | | | | — | | | | — | |
| | | | |
Total distributions | | | (2.11 | ) | | | (1.98 | ) | | | (1.75 | ) | | | (1.23 | ) | | | (1.20 | ) |
| | | | |
Net asset value, end of year | | | $168.87 | | | | $121.90 | | | | $101.64 | | | | $107.76 | | | | $96.14 | |
| | | | |
Total return | | | 40.55 | % | | | 22.01 | % | | | (4.08 | )% | | | 13.48 | % | | | 31.27 | % |
Ratios/supplemental data: | | | | | | | | | | | | | | | | | | | | |
Net assets, end of year (millions) | | | $54,848 | | | | $39,841 | | | | $36,562 | | | | $43,038 | | | | $39,991 | |
Ratio of expenses to average net assets | | | 0.52 | % | | | 0.52 | % | | | 0.52 | % | | | 0.52 | % | | | 0.52 | % |
Ratio of net investment income to average net assets | | | 1.45 | % | | | 1.72 | % | | | 1.62 | % | | | 1.25 | % | | | 1.42 | % |
Portfolio turnover rate | | | 15 | % | | | 11 | % | | | 16 | % | | | 12 | % | | | 18 | % |
See accompanying Notes to Financial Statements
DODGE & COX STOCK FUND §PAGE 12
REPORT OF INDEPENDENT REGISTERED PUBLIC ACCOUNTING FIRM
To the Trustees of Dodge & Cox Funds and Shareholders of Dodge & Cox Stock Fund
In our opinion, the accompanying statement of assets and liabilities, including the portfolio of investments, and the related statements of operations and of changes in net assets and the financial highlights present fairly, in all material respects, the financial position of Dodge & Cox Stock Fund (the “Fund”, one of the series constituting Dodge & Cox Funds) at December 31, 2013, the results of its operations for the year then ended, the changes in its net assets for each of the two years in the period then ended and the financial highlights for each of the five years in the period then ended, in conformity with accounting principles generally accepted in the United States of America. These financial statements and financial highlights (hereafter referred to as “financial statements”) are the responsibility of the Fund’s management; our responsibility is to express an opinion on these financial statements based on our audits. We conducted our audits of these financial statements in accordance with the standards of the Public Company Accounting Oversight Board (United States). Those standards require that we plan and perform the audit to obtain reasonable assurance about whether the financial statements are free of material misstatement. An audit includes examining, on a test basis, evidence supporting the amounts and disclosures in the financial statements, assessing the accounting principles used and significant estimates made by management, and evaluating the overall financial statement presentation. We believe that our audits, which included confirmation of securities at December 31, 2013, by correspondence with the custodian and brokers, provide a reasonable basis for our opinion.
PricewaterhouseCoopers LLP
San Francisco, California
February 25, 2014
PAGE 13 § DODGE & COX STOCK FUND
SPECIAL 2013 TAX INFORMATION (unaudited)
The following information is provided pursuant to provisions of the Internal Revenue Code:
The Fund designates up to a maximum amount of $957,090,748 of its distributions paid to shareholders in 2013 as qualified dividends (treated for federal income tax purposes in the hands of shareholders as taxable at a maximum rate of 20%).
For shareholders that are corporations, the Fund designates 95% of its ordinary dividends paid to shareholders in 2013 as dividends from domestic corporations eligible for the corporate dividends received deduction, provided that the shareholder otherwise satisfies applicable requirements to claim that deduction.
BOARD APPROVAL OF FUNDS’ INVESTMENT MANAGEMENT AGREEMENTS AND MANAGEMENT FEES
(unaudited)
The Board of Trustees is responsible for overseeing the performance of the Dodge & Cox Funds’ investment manager and determining whether to continue the Investment Management Agreements between the Funds and Dodge & Cox each year (the “Agreements”). At a meeting of the Board of Trustees of the Trust held on December 17, 2013, the Trustees, by a unanimous vote (including a separate vote of those Trustees who are not “interested persons” (as defined in the Investment Company Act of 1940) (the “Independent Trustees”)), approved the renewal of the Agreements for an additional one-year term through December 31, 2014. During the course of the year, the Board received a wide variety of materials relating to the services provided by Dodge & Cox and the performance of each of the Funds.
INFORMATION RECEIVED
In advance of the meeting, the Board, including each of the Independent Trustees, requested, received, and reviewed materials relating to the Agreements and the services provided by Dodge & Cox. The Independent Trustees retained Morningstar® to prepare an independent expense and performance summary for each Fund and comparable funds managed by other advisers identified by Morningstar. The Morningstar materials included information regarding advisory fee rates, expense ratios,
and transfer agency, custodial, and distribution expenses, as well as appropriate performance comparisons to each Fund’s peer group and an index or combination of indices. The Morningstar materials also included a comparison of expenses of various share classes offered by comparable funds.
The materials reviewed by the Board contained information concerning, among other things, Dodge & Cox’s profitability, financial results and condition, advisory fee revenue, and separate account and sub-adviser fund fee schedules. The Board additionally considered the Funds’ brokerage commissions, turnover rates, sales and redemption data and the significant investment that Dodge & Cox makes in research used in managing the Funds. The Board received and reviewed a memorandum summarizing information provided throughout the year regarding Dodge & Cox’s services to the Funds as well as information regarding (i) the different fees, services, costs, and risks associated with other accounts managed by Dodge & Cox as compared to the Dodge & Cox Funds; (ii) the differences in performance between the Funds and separately managed accounts; and (iii) Fund shares subscription and redemption activity. Throughout the process of reviewing the services provided by Dodge & Cox and preparing for the meeting, the Independent Trustees found Dodge & Cox to be open, forthright, detailed, and very helpful in answering questions about all issues.
The Board received copies of the Agreements and a memorandum from the independent legal counsel to the Independent Trustees discussing the factors generally regarded as appropriate to consider in evaluating advisory arrangements. The Trust’s Contract Review Committee, consisting solely of Independent Trustees, met with the independent legal counsel on October 30, 2013, and again on December 17, 2013, to discuss whether to renew the Agreements. The Board, including the Independent Trustees, subsequently concluded that the existing Agreements are fair and reasonable and voted to approve the Agreements.
In considering the Agreements, the Board, including the Independent Trustees, did not identify any single factor or particular information as all-important or controlling. In reaching the decision to approve the Agreements, the Board considered several factors, discussed below, to be key factors and reached the conclusions described below.
DODGE & COX STOCK FUND §PAGE 14
NATURE, QUALITY, AND EXTENT OF THE SERVICES
The Board considered that Dodge & Cox provides a wide range of services to the Funds in addition to portfolio management and that the quality of these services has been excellent in all respects. The extensive nature of services provided by Dodge & Cox has been documented in materials provided to the Board and in presentations made to the Board throughout the year. In particular, the Board considered the nature, quality, and extent of portfolio management, administrative, and shareholder services performed by Dodge & Cox. With regard to portfolio management services, the Board considered Dodge & Cox’s established long-term history of care and conscientiousness in the management of the Funds; its demonstrated consistency in investment approach and depth; the background and experience of the Dodge & Cox Investment Policy Committee, International Investment Policy Committee, Global Stock Investment Policy Committee, Fixed Income Investment Policy Committee, and research analysts responsible for managing the Funds; its methods for assessing the regulatory and investment climate in various jurisdictions; Dodge & Cox’s overall high level of attention to its core investment management function; and its commitment to the Funds and their shareholders.
In the area of administrative and shareholder services, the Board considered the excellent quality of Dodge & Cox’s work in areas such as compliance, legal services, trading, proxy voting, oversight of the Funds’ transfer agent and custodian, tax compliance, and shareholder communication through its website and other means. The Board also noted Dodge & Cox’s diligent disclosure policy, its favorable compliance record, and its reputation as a trusted, shareholder-friendly mutual fund family.
In addition, the Board considered that Dodge & Cox manages approximately $140 billion in Fund assets with fewer professionals than most comparable funds, and that on average these professionals have more experience and longer tenure than investment professionals at comparable funds. The Board also noted that Dodge & Cox is an investment research-oriented firm with no other business endeavors to distract management’s attention from its research efforts, and that its investment professionals
adhere to a consistent investment approach across the Funds. The Board further considered the favorable stewardship and “Gold” analyst ratings awarded to each of the Funds by Morningstar. The Board concluded that it was satisfied with the nature, extent, and quality of investment management and other services provided to the Funds by Dodge & Cox.
INVESTMENT PERFORMANCE
The Board considered short-term and long-term investment performance for each Fund (including periods of outperformance or underperformance) as compared to both relevant indices and the performance of such Fund’s peer group. The Board noted that each Fund demonstrated favorable short-term and longer-term performance relative to its benchmark and peer group. The Board determined after extensive review and inquiry that Dodge & Cox’s historic, long-term, team-oriented, bottom up investment approach remains consistent and that Dodge & Cox continues to be distinguished by its integrity, transparency, and independence.
The Board considered that the performance of the Funds is the result of a team-oriented investment management process that emphasizes a long-term investment horizon, comprehensive independent research, price discipline, and focus. The Board also considered that the investment performance delivered by Dodge & Cox to the Funds appeared to be consistent with the relevant performance delivered for other clients of Dodge & Cox. The Board concluded that Dodge & Cox has delivered favorable long-term performance for Fund investors consistent with the long-term investment strategies being pursued by the Funds
COSTS AND ANCILLARY BENEFITS
Costs of Services to Funds: Fees and Expenses. The Board considered each Fund’s management fee rate and expense ratio relative to similar mutual funds and relative to management fees charged by Dodge & Cox to other clients. In particular, the Board considered that the Funds continue to be substantially below their peer group median in expense ratios and management fee rates and that many media and industry reports specifically comment on the low expense ratios of the Funds, which have been a defining characteristic of the Funds for many
PAGE 15 § DODGE & COX STOCK FUND
years. The Board also evaluated the operating structures of the Funds and Dodge & Cox, noting that the Funds do not charge front-end sales commissions or distribution fees, and Dodge & Cox bears, among other things, the significant cost of third party research, reimbursement for recordkeeping and administrative costs to third-party retirement plan administrators, and administrative and office overhead. The Board noted that expenses are well below industry averages. The Board also considered that the Funds receive numerous administrative, regulatory compliance, legal, technology and shareholder support services from Dodge & Cox without any additional administrative fee and the fact that the Funds have relatively low transaction costs and portfolio turnover rates. The Board reviewed Morningstar data showing that the few peer group funds with lower expense ratios often have other share classes with significantly higher expense ratios.
The Board reviewed information regarding the fee rates Dodge & Cox charges to separate accounts and sub-advised funds that have investment programs similar to those of the Funds, including instances where separate account and sub-advised fund fees are lower than Fund fees. The Board considered differences in the nature and scope of services Dodge & Cox provides to the Funds as compared to other client accounts, differences in regulatory, litigation, and other risks as between Dodge & Cox Funds and other types of clients, and certain characteristics of the market for institutional separate account management services. The Board further noted that, with respect to non-U.S. funds sponsored and managed by Dodge & Cox that are comparable to the Funds in many respects, the fee rates charged by Dodge & Cox are the same as or higher than the fee rates charged to the Funds. After consideration of these matters, the Board concluded that the overall costs incurred by the Funds for the services they receive (including the management fee paid to Dodge & Cox) are reasonable and that the fees are acceptable based upon the qualifications, experience, reputation, and performance of Dodge & Cox and the low overall expense ratios of the Funds.
Profitability and Costs of Services to Dodge & Cox; “Fall-out” Benefits. The Board reviewed reports of Dodge & Cox’s financial position, profitability, and estimated overall value, and considered Dodge & Cox’s overall profitability within its context as a private, employee-owned S-Corporation and relative to the favorable services provided. The Board noted in particular that Dodge & Cox’s profits are not generated by high fee rates, but reflect an extraordinarily streamlined, efficient, and focused business approach toward investment management. The Board recognized the importance of Dodge & Cox’s profitability—which is derived solely from management fees and does not include other business ventures—to maintain its independence, stability, company culture and ethics, and management continuity. The Board also considered that the compensation/profit structure at Dodge & Cox is vital for remaining independent and facilitating retention of its management and investment professionals.
The Board considered potential “fall-out” benefits (including the receipt of research from unaffiliated brokers and reputational benefits to non-U.S. funds sponsored and managed by Dodge & Cox) that Dodge & Cox might receive as a result of its association with the Funds and determined that they are not significant. The Board also noted the extent of additional administrative services performed by Dodge & Cox for the Funds, and that the magnitude of costs and risks borne by Dodge & Cox in rendering advisory services to the Funds (including risks in the regulatory compliance, securities valuation, and investment management processes) are continuing to increase. The Board concluded that the profitability of Dodge & Cox’s relationship with the Funds (including fall-out benefits) was fair and reasonable.
THE BENEFIT OF ECONOMIES OF SCALE
The Board considered whether there have been economies of scale with respect to the management of each Fund, whether the Funds have appropriately benefited from any economies of scale, and whether the management fee rate is reasonable in relation to the Fund assets and any economies of scale that may exist. In the Board’s view, any consideration of economies of scale
DODGE & COX STOCK FUND §PAGE 16
must take account of the Funds’ low fee structure and the considerable efficiencies of the Funds’ organization and fee structure that has been realized by shareholders from the time of each Fund’s inception (i.e., from the first dollar). The Board noted that Dodge & Cox has shared economies of scale by adding or enhancing services to the Funds over time, and that the internal costs of providing investment management, up-to-date technology, administrative, legal and compliance services to the Funds are continuing to increase. For example, Dodge & Cox has increased its global research staff and investment resources over the years to address the increased complexity of investing in multinational and non-U.S. companies. In addition, Dodge & Cox has made substantial expenditures in other staff and infrastructure to enable it to integrate credit and equity analyses and to be able to implement its strategy in a more effective and secure manner. The Board determined that the Funds provide access for small investors to high quality investment management at a relatively low cost. The Board’s decision to renew the Agreements was made after consideration of economies of scale and review of peer group fund expense ratios and historical expense ratio patterns for the Funds. The Board concluded that the current Dodge & Cox fee structure is fair and reasonable and adequately shares economies of scale that may exist.
CONCLUSION
Based on their evaluation of all material factors and assisted by the advice of independent legal counsel to the Independent Trustees, the Board, including the Independent Trustees, concluded that the advisory fee structure was fair and reasonable, that each Fund was paying a competitive fee for the services provided, that the scope and quality of Dodge & Cox’s services has provided substantial value for Fund shareholders over the long term, and that approval of the Agreements was in the best interests of each Fund and its shareholders.
FUND HOLDINGS
The Fund provides a complete list of its holdings four times each fiscal year, as of the end of each quarter. The Fund files the lists with the Securities and Exchange Commission (SEC) on Form N-CSR (second and fourth quarters) and Form N-Q (first and third quarters). Shareholders may view the Fund’s Forms N-CSR and N-Q on the SEC’s website at www.sec.gov. Forms N-CSR and N-Q may also be reviewed and copied at the SEC’s Public Reference Room in Washington, DC. Information regarding the operations of the Public Reference Room may be obtained by calling 202-551-8090 (direct) or 800-732-0330 (general SEC number). A list of the Fund’s quarter-end holdings is also available at www.dodgeandcox.com on or about 15 days following each quarter end and remains available on the website until the list is updated in the subsequent quarter.
PROXY VOTING
For a free copy of the Fund’s proxy voting policies and procedures, please call 800-621-3979, visit the Fund’s website at www.dodgeandcox.com, or visit the SEC’s website at www.sec.gov. Information regarding how the Fund voted proxies relating to portfolio securities during the most recent 12-month period ending June 30 is also available at www.dodgeandcox.com or at www.sec.gov.
HOUSEHOLD MAILINGS
The Fund routinely mails shareholder reports and summary prospectuses to shareholders and, on occasion, proxy statements. In order to reduce the volume of mail, when possible, only one copy of these documents will be sent to shareholders who are part of the same family and share the same residential address.
If you have a direct account with the Funds and you do not want the mailing of shareholder reports and summary prospectuses combined with other members in your household, contact the Funds at 800-621-3979. Your request will be implemented within 30 days.
PAGE 17 § DODGE & COX STOCK FUND
THIS PAGE INTENTIONALLY LEFT BLANK
DODGE & COX STOCK FUND §PAGE 18
DODGE & COX FUNDS—EXECUTIVE OFFICER & TRUSTEE INFORMATION
| | | | | | |
Name (Age) and
Address* | | Position with Trust (Year of Election or
Appointment) | | Principal Occupation During Past 5 Years | | Other Directorships Held by Trustees |
| INTERESTED TRUSTEES AND OFFICERS |
| Kenneth E. Olivier (61) | | Chairman, President, and Trustee (Trustee since 2005) | | Chairman Emeritus (since 2013), Chairman (2011-2013), Chief Executive Officer (2010-2013), President (until 2011), and Director of Dodge & Cox; Portfolio Manager and member of Investment Policy Committee (IPC) (until 2013) | | — |
| Dana M. Emery (52) | | Senior Vice President and Trustee (Trustee since 1993) | | Chief Executive Officer (since 2013), President (since 2011), Executive Vice President (until March 2011), and Director of Dodge & Cox; Director of Fixed Income, Portfolio Manager, and member of Fixed Income Investment Policy Committee (FIIPC) | | — |
| John A. Gunn (70) | | Trustee (Trustee since 1985) | | Chairman Emeritus (2011-2013), Chairman (2007-2011), Chief Executive Officer (2007-2010), and Director of Dodge & Cox; Portfolio Manager and member of IPC, Global Stock Investment Policy Committee (GSIPC) (since 2008), and International Investment Policy Committee (IIPC) | | — |
| Charles F. Pohl (55) | | Senior Vice President (Officer since 2004) | | Chairman (since 2013), Co-President (2011-2013), Senior Vice President (until 2011), and Director of Dodge & Cox; Chief Investment Officer (since 2007), Portfolio Manager, Investment Analyst, and member of IPC, GSIPC, IIPC, and FIIPC | | — |
| Diana S. Strandberg (54) | | Senior Vice President (Officer since 2006) | | Senior Vice President (since 2011), Vice President (until 2011), and Director (since 2011) of Dodge & Cox; Director of International Equity (since 2009), Portfolio Manager, Investment Analyst, and member of IPC, GSIPC, and IIPC | | — |
| David H. Longhurst (56) | | Treasurer (Officer since 2006) | | Vice President and Assistant Treasurer of Dodge & Cox | | — |
| Thomas M. Mistele (60) | | Secretary (Officer since 1998) | | Chief Operating Officer, Director, Secretary, Senior Counsel (since 2011), and General Counsel (until 2011) of Dodge & Cox | | — |
| Katherine M. Primas (39) | | Chief Compliance Officer (Officer since 2009) | | Chief Compliance Officer of Dodge & Cox | | — |
| INDEPENDENT TRUSTEES |
| L. Dale Crandall (72) | | Trustee (Since 1999) | | President, Piedmont Corporate Advisors, Inc. (since 2003); President, Kaiser Foundation Health Plan, Inc. and Kaiser Foundation Hospitals (2000-2002); Senior Vice President—Finance and Administration & CFO, Kaiser Foundation Health Plan, Inc. and Kaiser Foundation Hospitals (1998-2000) | | Director, Ansell Limited (medical equipment and supplies) (since 2002); Bridgepoint Education, Inc. (education services) (since 2008); and Endurance International Group, Inc. (internet services) (since 2013) |
| Thomas A. Larsen (64) | | Trustee (Since 2002) | | Senior Counsel of Arnold & Porter LLP (law firm) (since 2013); Partner of Arnold & Porter LLP (since 2012); Director of Howard, Rice, Nemerovski, Canady, Falk & Rabkin (1977-2011) | | — |
| Ann Mather (53) | | Trustee (Since 2011) | | CFO, Pixar Animation Studios (1999-2004) | | Director, Google, Inc. (internet information services) (since 2005); Director, Glu Mobile, Inc. (multimedia software) (since 2005); Director, Netflix, Inc. (video services) (since 2010); Director, Shutterfly, Inc. (internet photography services/publishing) (since 2013); Director, Solazyme Inc. (renewable oils) (since 2011) |
| Robert B. Morris III (61) | | Trustee (Since 2011) | | Adviser to various financial services firms | | — |
| Gary Roughead (62) | | Trustee (Since 2013) | | Annenberg Distinguished Visiting Fellow, Hoover Institution (since 2011); Admiral, United States Navy (Ret.); U.S. Navy Chief of Naval Operations (2007-2011) | | Director, Northrop Grumman Corp. (global security) (since 2012) |
| John B. Taylor (67) | | Trustee (Since 2005) (and 1998-2001) | | Professor of Economics, Stanford University; Senior Fellow, Hoover Institution; Under Secretary for International Affairs, United States Treasury (2001-2005) | | — |
| * | | The address for each Officer and Trustee is 555 California Street, 40th Floor, San Francisco, California 94104. Each Officer and Trustee oversees all five series in the Dodge & Cox Funds complex and serves for an indefinite term. |
Additional information about the Trust’s Trustees and Officers is available in the Trust’s Statement of Additional Information (SAI). You can get a free copy of the SAI by visiting the Funds’ website at www.dodgeandcox.com or calling
800-621-3979.
PAGE 19 § DODGE & COX STOCK FUND
| | | | |
| | | | |
www.dodgeandcox.com
For Fund literature, transactions, and account information, please visit the Funds’ website.
or write or call:
DODGE & COX FUNDS
c/o Boston Financial Data Services
P.O. Box 8422
Boston, Massachusetts 02266-8422
(800) 621-3979
INVESTMENT MANAGER
Dodge & Cox
555 California Street, 40th Floor
San Francisco, California 94104
(415) 981-1710
This report is submitted for the general information of the shareholders of the Fund. The report is not authorized for distribution to prospective investors in the Fund unless it is accompanied by a current prospectus.
This report reflects our views, opinions, and portfolio holdings as of December 31, 2013, the end of the reporting period. Any such views are subject to change at any time based upon market or other conditions and Dodge & Cox disclaims any responsibility to update such views. These views may not be relied on as investment advice and, because investment decisions for a Dodge & Cox Fund are based on numerous factors, may not be relied on as an indication of trading intent on behalf of any Dodge & Cox Fund.
12/13 GSF AR Printed on recycled paper
Annual Report
December 31, 2013
Global Stock
Fund
ESTABLISHED 2008
TICKER: DODWX
TO OUR SHAREHOLDERS
The Dodge & Cox Global Stock Fund had a total return of 19.4% for the six months ending December 31, 2013, compared to a return of 16.8% for the MSCI World Index. For 2013, the Fund had a total return of 33.2%, compared to 26.7% for the MSCI World. At year end, the Fund had net assets of $3.9 billion with a cash position of 4.1%.
MARKET COMMENTARY
Developed equity markets were particularly strong (MSCI World up 27%) during 2013, with every sector of the market generating positive returns. The United States was the best performing region of the market (S&P 500 up 32%); higher U.S. valuations reflected both earnings growth and increased investor confidence in light of an improving economy. Europe (MSCI Europe up 25%) continued to show signs of economic improvement, and Japan (MSCI Japan up 27%) also performed well. Emerging market performance was weak (MSCI Emerging Markets down 3%). The U.S. Federal Reserve (the Fed) decided to begin tapering its quantitative easing program, and certain countries reliant on external funding (e.g., India, Brazil, Turkey) proved vulnerable with significant currency and/or market declines.
INVESTMENT STRATEGY
In selecting the Fund’s investments, we employ a consistent approach that focuses on intensive fundamental research, a three- to five-year investment horizon, and strict price discipline. Through meetings with management, competitors, customers, and suppliers, our global industry analysts build an in-depth understanding of individual companies. Investment risks and opportunities are evaluated on a company-by-company basis.
Utilizing our bottom-up research process, we have selected holdings that we believe have attractive long-term prospects and that are generally trading at below-average valuations. As a result of our individual security selection, the Fund has significant exposure to key areas of the market we think are particularly compelling, including Health Care and emerging markets.
Health Care
The Fund has an overweight position in the Health Care sector (14.3% compared to 11.3% for the MSCI World(a)). We initiated two new positions in this sector during 2013: Express Scripts and UnitedHealth Group.(b) Health care services was a particular area of opportunity, as concerns over the implementation of the Affordable Care Act (ACA) lowered valuations of several leading companies.
UnitedHealth is a diversified health care services company providing managed care, pharmacy benefit management, and other specialty products and services. The company has an attractive valuation in relation to its market leadership, innovative culture, and diversity of products, customers, and geographies. UnitedHealth faces significant ACA-related headwinds in its Medicare (reimbursement concerns) and commercial (e.g., loss of individual membership, changes of underwriting rules) segments. Nevertheless, we believe these challenges could be offset by Medicaid expansion and rapid growth in Optum, its diversified healthcare delivery and IT services division. UnitedHealth (0.9% position) was the Fund’s largest new purchase within the Health Care sector during 2013.
Emerging Markets
Valuations decreased in many emerging market countries during 2013. While we continue to believe economic development in emerging markets will be a significant driver of global economic growth in the years to come, we evaluate each company individually. We increased the Fund’s exposure to the developing world by selectively adding to holdings such as America Movil (largest wireless services provider in Latin America). In addition, we initiated five new positions: Baidu (dominant search engine in China), ICICI Bank (second largest Indian bank by assets), Itau Unibanco (largest Latin American bank), Kasikornbank (leading bank in Thailand), and Samsung Electronics (a leading technology company based in South Korea). At year end, 14.1% of the Fund was invested in companies domiciled in emerging markets.
PAGE 1 § DODGE & COX GLOBAL STOCK FUND
ICICI Bank
Following the Fed’s guidance in May that it might begin tapering its quantitative easing program, U.S. interest rates increased and the Indian Rupee depreciated against the U.S. dollar. Concerns arose that India might struggle to fund its current account deficit with higher U.S. and global interest rates. In response to currency and macroeconomic weakness, ICICI Bank’s share price dropped 48% from its peak in May to its trough in September; the bank’s valuation declined to 9 times forward earnings and 1.3 times book value, which were low levels relative to history.
For investments in financial services, our equity and fixed income teams analyze, among other factors, the health of balance sheets, durability of earnings drivers, funding stability, and regulatory environment. In light of ICICI Bank’s declining valuation and our continued analysis, we added to the Fund’s position that was initiated in April. Management has executed well against its strategic plan to improve the bank’s capital levels, asset quality, operating costs, and low-cost deposit funding. We believe that ICICI Bank can further increase its return on equity. Over the long term, the company stands to benefit from improvement to the Indian economy, which has an attractive combination of high potential GDP growth, youthful demographics, and low penetration of retail financial services. ICICI Bank was the largest new purchase in the Fund during 2013.
Samsung Electronics
Samsung Electronics is a global leader with significant market share in mobile handsets and memory semiconductors, as well as a global appliance manufacturer. While we acknowledge concerns about potential eroding market share and declining margins in the intensely competitive handset business, we believe Samsung Electronics’ strong position in semiconductors is underappreciated. The combination of the company’s significant scale and a more consolidated industry structure with high barriers to entry should provide the underpinning for more durable semiconductor profitability than in the past. Furthermore, Samsung Electronics has a long-standing track record of generating attractive return on capital and free cash flow in industries where many other companies struggle. We believe that the company’s
valuation at 6 times forward earnings is attractive. Samsung Electronics was a 1.0% position in the Fund at year end.
IN CLOSING
After a particularly strong year, our market outlook is more tempered than at the beginning of 2013. Acknowledging that markets can be volatile over the short term, we encourage our fellow shareholders to remain focused on the long term. While global equity market valuations have increased, we believe they are still reasonable: the MSCI World traded at 15 times forward earnings at year end, compared to a 20-year average of 16 times. The Fund’s portfolio of 85 holdings—valued at 13 times forward earnings—is trading at a discount to the overall market. We continue to find companies that we believe will benefit from long-term global growth opportunities over our three- to five-year investment horizon.
Thank you for your continued confidence in our firm. As always, we welcome your comments and questions.
For the Board of Trustees,
| | |
| | |
Kenneth E. Olivier, Chairman and President | | Charles F. Pohl, Senior Vice President |
January 30, 2014
| (a) | Unless otherwise specified, all weightings and characteristics are as of December 31, 2013. |
| (b) | The use of specific examples does not imply that they are more attractive investments than the Fund’s other holdings. |
DODGE & COX GLOBAL STOCK FUND §PAGE 2
ANNUAL PERFORMANCE REVIEW
The Fund outperformed the MSCI World by 6.5 percentage points in 2013.
Key Contributors to Relative Results
| | § | | The Fund’s holdings in the Information Technology sector (up 60% compared to up 29% for the MSCI World sector) had a positive impact. Nokia (up 108%), Hewlett-Packard (up 101%), and Baidu (up 87% from date of purchase) were strong performers. | |
| | § | | Within the Materials sector, the Fund’s underweight position in the Metals & Mining industry (0% versus 2%), which was the worst performing industry in the market (down 15%), also helped. | |
| | § | | The Fund’s holdings in the Industrials sector (up 47% compared to up 32% for the MSCI World sector) contributed. Nidec (up 71%) performed well. | |
| | § | | Additional contributors included Panasonic (up 94%), Charles Schwab (up 83%), and Naspers (up 64%). | |
Key Detractors from Relative Results
| | § | | The Fund’s holdings in the Telecommunication Services sector (up 27% compared to up 31% for the MSCI World sector) hurt results. MTN Group (up 3%) was a detractor. | |
| | § | | Additional detractors included BR Malls (down 44%), Anadolu Efes (down 24%), Petrobras (down 22%), and J.C. Penney (down 21% to date of sale). | |
KEY CHARACTERISTICS OF DODGE & COX
Independent Organization
Dodge & Cox is one of the largest privately owned investment managers in the world. We remain committed to independence, with a goal of providing the highest quality investment management service to our existing clients.
Over 80 Years of Investment Experience
Dodge & Cox was founded in 1930. We have a stable and well-qualified team of investment professionals, most of whom have spent their entire careers at Dodge & Cox.
Experienced Investment Team
The Global Stock Investment Policy Committee, which is the decision-making body for the Global Stock Fund, is a seven-member committee with an average tenure at Dodge & Cox of 22 years.
One Business with a Single Research Office
Dodge & Cox manages domestic, international, and global equity, fixed income, and balanced investments, operating from one office in San Francisco.
Consistent Investment Approach
Our team decision-making process involves thorough, bottom-up fundamental analysis of each investment.
Long-Term Focus and Low Expenses
We invest with a three- to five-year investment horizon, which has historically resulted in low turnover relative to our peers. We manage Funds that maintain low expense ratios.
PAGE 3 § DODGE & COX GLOBAL STOCK FUND
GROWTH OF $10,000 SINCE INCEPTION
FOR AN INVESTMENT MADE ON MAY 1, 2008
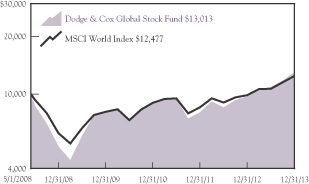
AVERAGE ANNUAL TOTAL RETURN
FOR PERIODS ENDED DECEMBER 31, 2013
| | | | | | | | | | | | | | | | |
| | | 1 Year | | | 3 Years | | | 5 Years | | | Since
Inception
(5/1/08) | |
Dodge & Cox Global Stock Fund | | | 33.17 | % | | | 12.64 | % | | | 19.33 | % | | | 4.76 | % |
MSCI World Index | | | 26.68 | | | | 11.50 | | | | 15.03 | | | | 3.98 | |
Returns represent past performance and do not guarantee future results. Investment return and share price will fluctuate with market conditions, and investors may have a gain or loss when shares are sold. Fund performance
changes over time and currently may be significantly lower than stated. Performance is updated and published monthly. Visit the Fund’s website at www.dodgeandcox.com or call 800-621-3979 for current performance figures.
The Fund’s total returns include the reinvestment of dividend and capital gain distributions, but have not been adjusted for any income taxes payable by shareholders on these distributions or on Fund share redemptions. Index returns include dividends but, unlike Fund returns, do not reflect fees or expenses. The MSCI World Index is a broad-based, unmanaged equity market index aggregated from 23 developed market country indices, including the United States. MSCI makes no express or implied warranties or representations and shall have no liability whatsoever with respect to any MSCI data contained herein. The MSCI data may not be further redistributed or used as a basis for other indices or any securities or financial products. This report is not approved, reviewed, or produced by MSCI.
MSCI World is a service mark of MSCI Barra.
Risks: The Fund is subject to stock market risk, meaning stocks in the Fund may decline in value for extended periods due to the financial prospects of individual companies, or due to general market and economic conditions. Investing in non-U.S. securities may entail risk due to foreign economic and political developments; this risk may be increased when investing in emerging markets. Please read the prospectus and summary prospectus for specific details regarding the Fund’s risk profile.
FUND EXPENSE EXAMPLE
As a Fund shareholder, you incur ongoing Fund costs, including management fees and other Fund expenses. All mutual funds have ongoing costs, sometimes referred to as operating expenses. The following example shows ongoing costs of investing in the Fund and can help you understand these costs and compare them with those of other mutual funds. The example assumes a $1,000 investment held for the six months indicated.
ACTUAL EXPENSES
The first line of the table below provides information about actual account values and expenses based on the Fund’s actual returns. You may use the information in this line, together with your account balance, to estimate the expenses that you paid over the period. Simply divide your account value by $1,000 (for example, an $8,600 account value divided by $1,000 = 8.6), then multiply the result by the number in the first line under the heading “Expenses Paid During Period” to estimate the expenses you paid on your account during this period.
HYPOTHETICAL EXAMPLE FOR COMPARISON WITH OTHER MUTUAL FUNDS
Information on the second line of the table can help you compare ongoing costs of investing in the Fund with those of other mutual funds. This information may not be used to estimate the actual ending account balance or expenses you paid during the period. The hypothetical “Ending Account Value” is based on the actual expense ratio of the Fund and an assumed 5% annual rate of return before expenses (not the Fund’s actual return). The amount under the heading “Expense Paid During the Period” shows the hypothetical expenses your account would have incurred under this scenario. You can compare this figure with the 5% hypothetical examples that appear in shareholder reports of other mutual funds.
| | | | | | | | | | | | |
Six Months Ended December 31, 2013 | | Beginning Account Value
7/1/2013 | | | Ending Account Value
12/31/2013 | | | Expenses Paid During Period* | |
Based on Actual Fund Return | | $ | 1,000.00 | | | $ | 1,193.60 | | | $ | 3.53 | |
Based on Hypothetical 5% Yearly Return | | | 1,000.00 | | | | 1,021.99 | | | | 3.25 | |
| * | Expenses are equal to the Fund’s annualized expense ratio of 0.64%, multiplied by the average account value over the period, multiplied by 184/365 (to reflect the one-half year period). |
The expenses shown in the table highlight ongoing costs only and do not reflect any transactional fees or account maintenance fees. Though other mutual funds may charge such fees, please note that the Fund does not charge transaction fees (e.g., redemption fees, sales loads) or universal account maintenance fees (e.g., small account fees).
DODGE & COX GLOBAL STOCK FUND §PAGE 4
| | |
| GLOBAL STOCK FUND | | December 31, 2013 |
| | | | |
| GENERAL INFORMATION | | | |
Net Asset Value Per Share | | | $11.48 | |
Total Net Assets (billions) | | | $3.9 | |
Expense Ratio | | | 0.65% | |
Portfolio Turnover Rate | | | 24% | |
30-Day SEC Yield(a) | | | 1.30% | |
Fund Inception | | | 2008 | |
No sales charges or distribution fees | | | | |
Investment Manager: Dodge & Cox, San Francisco. Managed by the Global Stock Investment Policy Committee, whose seven members’ average tenure at Dodge & Cox is 22 years.
| | | | | | | | |
| PORTFOLIO CHARACTERISTICS | | Fund | | | MSCI
World | |
Number of Stocks | | | 85 | | | | 1,610 | |
Median Market Capitalization (billions) | | | $34 | | | | $11 | |
Weighted Average Market | | | | | | | | |
Capitalization (billions) | | | $81 | | | | $88 | |
Price-to-Earnings Ratio(b) | | | 12.9x | | | | 14.8x | |
Countries Represented | | | 22 | | | | 23 | |
Emerging Markets (Brazil, China, India, Mexico, South Africa, South Korea, Thailand, Turkey) | | | 14.1% | | | | 0.0% | |
| | | | |
| TEN LARGEST HOLDINGS (%) (c) | | Fund | |
Hewlett-Packard Co. (United States) | | | 3.8 | |
Microsoft Corp. (United States) | | | 2.9 | |
Roche Holding AG (Switzerland) | | | 2.6 | |
Sanofi (France) | | | 2.5 | |
GlaxoSmithKline PLC (United Kingdom) | | | 2.4 | |
Novartis AG (Switzerland) | | | 2.2 | |
Naspers, Ltd. (South Africa) | | | 2.1 | |
Charles Schwab Corp. (United States) | | | 2.1 | |
Capital One Financial Corp. (United States) | | | 2.1 | |
Wells Fargo & Co. (United States) | | | 2.0 | |
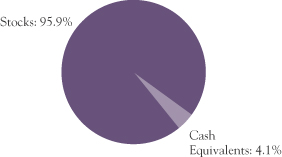
| | | | | | | | |
| REGION DIVERSIFICATION (%)(d) | | Fund | | | MSCI
World | |
United States | | | 39.7 | | | | 54.4 | |
Europe (excluding United Kingdom) | | | 29.4 | | | | 18.6 | |
Pacific (excluding Japan) | | | 6.4 | | | | 4.9 | |
United Kingdom | | | 6.2 | | | | 9.1 | |
Japan | | | 6.2 | | | | 8.7 | |
Latin America | | | 4.9 | | | | 0.0 | |
Africa/Middle East | | | 3.1 | | | | 0.2 | |
Canada | | | 0.0 | | | | 4.1 | |
| | | | | | | | |
| SECTOR DIVERSIFICATION (%) | | Fund | | | MSCI
World | |
Financials | | | 24.6 | | | | 20.9 | |
Information Technology | | | 19.1 | | | | 12.1 | |
Health Care | | | 14.3 | | | | 11.3 | |
Consumer Discretionary | | | 12.6 | | | | 12.3 | |
Industrials | | | 8.0 | | | | 11.5 | |
Telecommunication Services | | | 6.1 | | | | 3.8 | |
Energy | | | 5.5 | | | | 9.4 | |
Materials | | | 3.9 | | | | 5.7 | |
Consumer Staples | | | 1.8 | | | | 9.9 | |
Utilities | | | 0.0 | | | | 3.1 | |
| (a) | SEC Yield is an annualization of the Fund’s total net investment income per share for the 30-day period ended on the last day of the month. |
| (b) | Price-to-earnings (P/E) ratios are calculated using 12-month forward earnings estimates from third-party sources. |
| (c) | The Fund’s portfolio holdings are subject to change without notice. The mention of specific securities is not a recommendation to buy, sell, or hold any particular security and is not indicative of Dodge & Cox’s current or future trading activity. |
| (d) | The Fund may classify a company in a different category than the MSCI World. The Fund generally classifies a company based on its country of incorporation, but may designate a different country in certain circumstances. |
PAGE 5 § DODGE & COX GLOBAL STOCK FUND
| | | | |
| PORTFOLIO OF INVESTMENTS | | | December 31, 2013 | |
| | | | | | | | |
| COMMON STOCKS: 93.8% | |
| | |
| | | SHARES | | | VALUE | |
| CONSUMER DISCRETIONARY: 12.6% | |
AUTOMOBILES & COMPONENTS: 2.2% | |
Bayerische Motoren Werke AG (Germany) | | | 308,500 | | | $ | 36,167,646 | |
Mahindra & Mahindra, Ltd. (India) | | | 1,815,332 | | | | 27,647,458 | |
Yamaha Motor Co., Ltd. (Japan) | | | 1,658,000 | | | | 24,828,278 | |
| | | | | | | | |
| | | | | | | 88,643,382 | |
CONSUMER DURABLES & APPAREL: 2.0% | |
Coach, Inc. (United States) | | | 587,400 | | | | 32,970,762 | |
Panasonic Corp. (Japan) | | | 3,897,040 | | | | 45,294,625 | |
| | | | | | | | |
| | | | | | | 78,265,387 | |
MEDIA: 8.4% | |
Comcast Corp., Class A (United States) | | | 1,040,600 | | | | 54,074,779 | |
DISH Network Corp., Class A(a) (United States) | | | 583,100 | | | | 33,773,152 | |
Grupo Televisa SAB ADR (Mexico) | | | 1,112,700 | | | | 33,670,302 | |
Naspers, Ltd. (South Africa) | | | 791,600 | | | | 82,707,485 | |
Television Broadcasts, Ltd. (Hong Kong) | | | 2,606,200 | | | | 17,376,235 | |
Time Warner Cable, Inc. (United States) | | | 517,071 | | | | 70,063,120 | |
Time Warner, Inc. (United States) | | | 535,966 | | | | 37,367,550 | |
| | | | | | | | |
| | | | | | | 329,032,623 | |
| | | | | | | | |
| | | | | | | 495,941,392 | |
| CONSUMER STAPLES: 1.8% | |
FOOD, BEVERAGE & TOBACCO: 1.8% | |
Anadolu Efes Biracilik ve Malt Sanayii AS (Turkey) | | | 2,156,285 | | | | 23,328,817 | |
Unilever PLC (United Kingdom) | | | 1,201,700 | | | | 49,390,683 | |
| | | | | | | | |
| | | | | | | 72,719,500 | |
| ENERGY: 4.1% | |
Baker Hughes, Inc. (United States) | | | 561,387 | | | | 31,022,246 | |
Saipem SPA (Italy) | | | 1,238,343 | | | | 26,507,824 | |
Schlumberger, Ltd. (Curacao/United States) | | | 803,500 | | | | 72,403,385 | |
Weatherford International, Ltd.(a) (Switzerland) | | | 2,063,575 | | | | 31,964,777 | |
| | | | | | | | |
| | | | | | | 161,898,232 | |
| FINANCIALS: 24.3% | |
BANKS: 8.1% | |
Banco Santander SA (Spain) | | | 4,874,268 | | | | 43,626,161 | |
Barclays PLC (United Kingdom) | | | 9,523,400 | | | | 42,887,259 | |
HSBC Holdings PLC (United Kingdom) | | | 3,018,162 | | | | 33,106,256 | |
ICICI Bank, Ltd. (India) | | | 2,859,200 | | | | 50,754,209 | |
Kasikornbank PCL Foreign (Thailand) | | | 5,674,900 | | | | 27,372,844 | |
Mitsubishi UFJ Financial Group, Inc. (Japan) | | | 2,679,200 | | | | 17,656,109 | |
Standard Chartered PLC (United Kingdom) | | | 1,051,683 | | | | 23,684,867 | |
Wells Fargo & Co. (United States) | | | 1,722,973 | | | | 78,222,974 | |
| | | | | | | | |
| | | | | | | 317,310,679 | |
| | | | | | | | |
| | |
| | | SHARES | | | VALUE | |
DIVERSIFIED FINANCIALS: 10.6% | |
Bank of America Corp. (United States) | | | 3,200,300 | | | $ | 49,828,671 | |
Bank of New York Mellon Corp. (United States) | | | 1,837,700 | | | | 64,209,238 | |
Capital One Financial Corp. (United States) | | | 1,058,200 | | | | 81,068,702 | |
Charles Schwab Corp. (United States) | | | 3,153,300 | | | | 81,985,800 | |
Credit Suisse Group AG (Switzerland) | | | 2,285,004 | | | | 69,852,653 | |
Goldman Sachs Group, Inc. (United States) | | | 309,200 | | | | 54,808,792 | |
Haci Omer Sabanci Holding AS (Turkey) | | | 3,344,188 | | | | 13,445,223 | |
| | | | | | | | |
| | | | | | | 415,199,079 | |
INSURANCE: 3.8% | |
AEGON NV (Netherlands) | | | 7,371,958 | | | | 69,591,645 | |
Dai-ichi Life Insurance Co., Ltd. (Japan) | | | 1,030,000 | | | | 17,184,598 | |
Swiss Life Holding AG (Switzerland) | | | 70,600 | | | | 14,657,385 | |
Swiss Re AG (Switzerland) | | | 521,000 | | | | 47,921,137 | |
| | | | | | | | |
| | | | | | | 149,354,765 | |
REAL ESTATE: 1.8% | |
BR Malls Participacoes SA (Brazil) | | | 5,612,400 | | | | 40,560,101 | |
Hang Lung Group, Ltd. (Hong Kong) | | | 5,853,900 | | | | 29,668,477 | |
| | | | | | | | |
| | | | | | | 70,228,578 | |
| | | | | | | | |
| | | | | | | 952,093,101 | |
| HEALTH CARE: 14.3% | |
HEALTH CARE EQUIPMENT & SERVICES: 1.2% | |
Express Scripts Holding Co.(a) (United States) | | | 157,700 | | | | 11,076,848 | |
UnitedHealth Group, Inc. (United States) | | | 493,500 | | | | 37,160,550 | |
| | | | | | | | |
| | | | | | | 48,237,398 | |
PHARMACEUTICALS, BIOTECHNOLOGY & LIFE SCIENCES: 13.1% | |
Bayer AG (Germany) | | | 435,720 | | | | 61,110,841 | |
GlaxoSmithKline PLC (United Kingdom) | | | 1,973,200 | | | | 52,656,091 | |
GlaxoSmithKline PLC ADR (United Kingdom) | | | 782,100 | | | | 41,756,319 | |
Merck & Co., Inc. (United States) | | | 1,056,600 | | | | 52,882,830 | |
Novartis AG (Switzerland) | | | 472,700 | | | | 37,729,096 | |
Novartis AG ADR (Switzerland) | | | 609,700 | | | | 49,007,686 | |
Pfizer, Inc. (United States) | | | 560,900 | | | | 17,180,367 | |
Roche Holding AG (Switzerland) | | | 367,300 | | | | 102,607,656 | |
Sanofi (France) | | | 913,562 | | | | 96,923,388 | |
| | | | | | | | |
| | | | | | | 511,854,274 | |
| | | | | | | | |
| | | | | | | 560,091,672 | |
| | |
| See accompanying Notes to Financial Statements | | DODGE & COX GLOBAL STOCK FUND §PAGE 6 |
| | | | |
| PORTFOLIO OF INVESTMENTS | | | December 31, 2013 | |
| | | | | | | | |
| COMMON STOCKS (continued) | |
| | |
| | | SHARES | | | VALUE | |
| INDUSTRIALS: 8.0% | | | | | | | | |
CAPITAL GOODS: 5.2% | | | | | | | | |
Koninklijke Philips NV (Netherlands) | | | 904,301 | | | $ | 33,147,614 | |
Mitsubishi Electric Corp. (Japan) | | | 2,990,700 | | | | 37,486,696 | |
Nidec Corp. (Japan) | | | 648,100 | | | | 63,388,377 | |
Schneider Electric SA (France) | | | 599,578 | | | | 52,294,798 | |
Wienerberger AG (Austria) | | | 1,134,702 | | | | 17,990,627 | |
| | | | | | | | |
| | | | | | | 204,308,112 | |
COMMERCIAL & PROFESSIONAL SERVICES: 1.5% | |
ADT Corp. (United States) | | | 913,000 | | | | 36,949,110 | |
Tyco International, Ltd. (Switzerland) | | | 573,100 | | | | 23,520,024 | |
| | | | | | | | |
| | | | | | | 60,469,134 | |
TRANSPORTATION: 1.3% | |
FedEx Corp. (United States) | | | 343,100 | | | | 49,327,487 | |
| | | | | | | | |
| | | | | | | 314,104,733 | |
| INFORMATION TECHNOLOGY: 18.7% | |
SEMICONDUCTORS & SEMICONDUCTOR EQUIPMENT: 0.6% | |
Samsung Electronics Co., Ltd. (South Korea) | | | 17,971 | | | | 23,363,066 | |
|
SOFTWARE & SERVICES: 9.3% | |
AOL, Inc.(a) (United States) | | | 560,769 | | | | 26,143,051 | |
Baidu, Inc. ADR(a)
(Cayman Islands/China) | | | 268,600 | | | | 47,778,568 | |
eBay, Inc.(a) (United States) | | | 541,500 | | | | 29,722,935 | |
Google, Inc., Class A(a) (United States) | | | 53,600 | | | | 60,070,056 | |
Microsoft Corp. (United States) | | | 3,079,600 | | | | 115,269,428 | |
Nintendo Co., Ltd. (Japan) | | | 275,400 | | | | 36,638,059 | |
Symantec Corp. (United States) | | | 1,415,600 | | | | 33,379,848 | |
Synopsys, Inc.(a) (United States) | | | 346,800 | | | | 14,069,676 | |
| | | | | | | | |
| | | | | | | 363,071,621 | |
TECHNOLOGY, HARDWARE & EQUIPMENT: 8.8% | |
Corning, Inc. (United States) | | | 2,529,800 | | | | 45,081,036 | |
EMC Corp. (United States) | | | 75,400 | | | | 1,896,310 | |
Hewlett-Packard Co. (United States) | | | 5,298,400 | | | | 148,249,232 | |
NetApp, Inc. (United States) | | | 977,200 | | | | 40,202,008 | |
Nokia Oyj(a) (Finland) | | | 5,583,525 | | | | 44,704,886 | |
TE Connectivity, Ltd. (Switzerland) | | | 684,115 | | | | 37,701,577 | |
Telefonaktiebolaget LM Ericsson (Sweden) | | | 2,303,947 | | | | 28,119,412 | |
| | | | | | | | |
| | | | | | | 345,954,461 | |
| | | | | | | | |
| | | | | | | 732,389,148 | |
| MATERIALS: 3.9% | |
Akzo Nobel NV (Netherlands) | | | 241,228 | | | | 18,696,835 | |
Celanese Corp., Series A (United States) | | | 712,600 | | | | 39,413,906 | |
Domtar Corp. (United States) | | | 390,016 | | | | 36,794,109 | |
Lafarge SA (France) | | | 783,995 | | | | 58,748,152 | |
| | | | | | | | |
| | | | | | | 153,653,002 | |
| | | | | | | | |
| | |
| | | SHARES | | | VALUE | |
| TELECOMMUNICATION SERVICES: 6.1% | |
America Movil SAB de CV, Series L (Mexico) | | | 45,502,800 | | | $ | 52,938,194 | |
Bharti Airtel, Ltd. (India) | | | 2,105,182 | | | | 11,246,583 | |
Millicom International Cellular SA SDR (Luxembourg) | | | 620,600 | | | | 61,800,928 | |
MTN Group, Ltd. (South Africa) | | | 1,812,100 | | | | 37,489,222 | |
Sprint Corp.(a) (United States) | | | 1,964,691 | | | | 21,120,428 | |
Telecom Italia SPA- RSP (Italy) | | | 48,586,984 | | | | 38,032,577 | |
Telekom Austria AG (Austria) | | | 1,990,197 | | | | 15,069,472 | |
| | | | | | | | |
| | | | | | | 237,697,404 | |
| | | | | | | | |
TOTAL COMMON STOCKS
(Cost $2,652,750,530) | | | | | | $ | 3,680,588,184 | |
|
| PREFERRED STOCKS: 2.1% | |
| ENERGY: 1.4% | |
Petroleo Brasileiro SA ADR (Brazil) | | | 3,712,500 | | | | 54,536,625 | |
|
| FINANCIALS: 0.3% | |
BANKS: 0.3% | |
Itau Unibanco Holding SA (Brazil) | | | 962,100 | | | | 12,784,501 | |
|
| INFORMATION TECHNOLOGY: 0.4% | |
SEMICONDUCTORS & SEMICONDUCTOR EQUIPMENT: 0.4% | |
Samsung Electronics Co., Ltd.
(South Korea) | | | 15,151 | | | | 14,543,008 | |
| | | | | | | | |
TOTAL PREFERRED STOCKS
(Cost $98,595,398) | | | | | | $ | 81,864,134 | |
| | |
| PAGE 7 § DODGE & COX GLOBAL STOCK FUND | | See accompanying Notes to Financial Statements |
| | | | |
| PORTFOLIO OF INVESTMENTS | | | December 31, 2013 | |
| | | | | | | | |
| SHORT-TERM INVESTMENTS: 3.4% | |
| | |
| | | PAR VALUE | | | VALUE | |
MONEY MARKET FUND: 0.1% | |
SSgA U.S. Treasury Money
Market Fund | | $ | 3,857,014 | | | $ | 3,857,014 | |
|
REPURCHASE AGREEMENT: 3.3% | |
Fixed Income Clearing Corporation(b) 0.00%, dated 12/31/13, due 1/2/14, maturity value $131,583,000 | | | 131,583,000 | | | | 131,583,000 | |
|
TREASURY BILL: 0.0%(c) | |
Swedish Treasury Bill (Sweden) 2/19/14 | | | 70,000 | | | | 10,872 | |
| | | | | | | | |
TOTAL SHORT-TERM INVESTMENTS
(Cost $135,450,589) | | | $ | 135,450,886 | |
| | | | | | | | |
TOTAL INVESTMENTS
(Cost $2,886,796,517) | | | 99.3 | % | | $ | 3,897,903,204 | |
OTHER ASSETS LESS LIABILITIES | | | 0.7 | % | | | 26,086,892 | |
| | | | | | | | |
| NET ASSETS | | | 100.0 | % | | $ | 3,923,990,096 | |
| | | | | | | | |
| (b) | Repurchase agreement is collateralized by U.S. Treasury Note 1.875%, 9/30/17. Total collateral value is $138,445,313. |
In determining a company’s country designation, the Fund generally references the country of incorporation. In cases where the Fund considers the country of incorporation to be a “jurisdiction of convenience” chosen primarily for tax purposes, the Fund uses the country designation of an appropriate broad-based market index. In that circumstance, two countries are listed - the country of incorporation and the country designated by an appropriate index, respectively.
ADR: American Depositary Receipt
SDR: Swedish Depository Receipt
Forward Currency Contracts
As of December 31, 2013, open forward currency contracts are summarized as follows:
| | | | | | | | | | | | | | | | |
| | | | | | Contract Amount | | | | |
| Counterparty | | Settlement
Date | | | Receive U.S. Dollar | | | Deliver
Foreign
Currency | | | Unrealized
Appreciation/
(Depreciation) | |
Contracts to sell EUR: | |
Citibank | | | 2/5/2014 | | | | 26,443,950 | | | | 19,500,000 | | | $ | (381,784 | ) |
UBS | | | 2/12/2014 | | | | 26,339,820 | | | | 19,500,000 | | | | (485,865 | ) |
Credit Suisse | | | 3/5/2014 | | | | 26,528,363 | | | | 19,500,000 | | | | (297,190 | ) |
Deutsche Bank | | | 3/12/2014 | | | | 26,487,227 | | | | 19,400,000 | | | | (200,758 | ) |
Barclays | | | 3/19/2014 | | | | 26,131,384 | | | | 19,000,000 | | | | (6,334 | ) |
HSBC | | | 3/19/2014 | | | | 15,216,797 | | | | 11,000,000 | | | | 84,434 | |
| | | | | | | | | | | | | | | | |
| | | | | | | | | | | | | | $ | (1,287,497 | ) |
| | | | | | | | | | | | | | | | |
| | | | | | | | | | | | | | | | | |
| | |
| See accompanying Notes to Financial Statements | | DODGE & COX GLOBAL STOCK FUND §PAGE 8 |
| | | | |
STATEMENT OF ASSETS AND LIABILITIES | |
| |
| | | December 31, 2013 | |
ASSETS: | | | | |
Investments, at value (cost $2,886,796,517) | | $ | 3,897,903,204 | |
Cash denominated in foreign currency (cost $748) | | | 751 | |
Unrealized appreciation on forward currency contracts | | | 84,434 | |
Receivable for Fund shares sold | | | 58,069,234 | |
Dividends and interest receivable | | | 5,872,168 | |
Prepaid expenses and other assets | | | 18,617 | |
| | | | |
| | | 3,961,948,408 | |
| | | | |
LIABILITIES: | | | | |
Unrealized depreciation on forward currency contracts | | | 1,371,931 | |
Payable for investments purchased | | | 33,883,469 | |
Payable for Fund shares redeemed | | | 479,930 | |
Management fees payable | | | 1,900,863 | |
Accrued expenses | | | 322,119 | |
| | | | |
| | | 37,958,312 | |
| | | | |
NET ASSETS | | $ | 3,923,990,096 | |
| | | | |
NET ASSETS CONSIST OF: | | | | |
Paid in capital | | $ | 2,906,896,848 | |
Undistributed net investment income | | | (27,832 | ) |
Undistributed net realized gain | | | 7,218,654 | |
Net unrealized appreciation | | | 1,009,902,426 | |
| | | | |
| | $ | 3,923,990,096 | |
| | | | |
Fund shares outstanding (par value $0.01 each, unlimited shares authorized) | | | 341,733,071 | |
Net asset value per share | | $ | 11.48 | |
| |
STATEMENT OF OPERATIONS | | | | |
| | | Year Ended
December 31, 2013 | |
INVESTMENT INCOME: | | | | |
Dividends (net of foreign taxes of $3,520,141) | | $ | 72,552,055 | |
Interest | | | 36,699 | |
| | | | |
| | | 72,588,754 | |
| | | | |
EXPENSES: | | | | |
Management fees | | | 19,554,607 | |
Custody and fund accounting fees | | | 353,204 | |
Transfer agent fees | | | 247,373 | |
Professional services | | | 299,531 | |
Shareholder reports | | | 63,896 | |
Registration fees | | | 167,123 | |
Trustees’ fees | | | 215,000 | |
Miscellaneous | | | 116,626 | |
| | | | |
| | | 21,017,360 | |
| | | | |
NET INVESTMENT INCOME | | | 51,571,394 | |
| | | | |
|
REALIZED AND UNREALIZED GAIN (LOSS): | |
Net realized gain | | | | |
Investments | | | 105,311,956 | |
Forward currency contracts | | | 2,989,211 | |
Foreign currency transactions | | | (695,984 | ) |
Net change in unrealized appreciation/depreciation Investments | | | 779,555,433 | |
Forward currency contracts | | | (2,623,537 | ) |
Foreign currency translation | | | 64,751 | |
| | | | |
Net realized and unrealized gain | | | 884,601,830 | |
| | | | |
NET INCREASE IN NET ASSETS
FROM OPERATIONS | | $ | 936,173,224 | |
| | | | |
| | | | | | | | |
STATEMENT OF CHANGES IN NET ASSETS | |
| | | Year Ended
December 31, 2013 | | | Year Ended
December 31, 2012
| |
OPERATIONS: | | | | | | | | |
Net investment income | | $ | 51,571,394 | | | $ | 42,547,120 | |
Net realized gain | | | 107,605,183 | | | | 47,095,335 | |
Net change in unrealized appreciation/depreciation | | | 776,996,647 | | | | 334,338,960 | |
| | | | | | | | |
| | | 936,173,224 | | | | 423,981,415 | |
| | | | | | | | |
| |
DISTRIBUTIONS TO
SHAREHOLDERS FROM: | | | | | |
Net investment income | | | (51,208,519 | ) | | | (42,084,059 | ) |
Net realized gain | | | (100,724,648 | ) | | | (48,458,943 | ) |
| | | | | | | | |
Total distributions | | | (151,933,167 | ) | | | (90,543,002 | ) |
| | | | | | | | |
| |
FUND SHARE
TRANSACTIONS: | | | | | |
Proceeds from sale of shares | | | 867,041,207 | | | | 761,898,134 | |
Reinvestment of distributions | | | 147,064,049 | | | | 87,874,010 | |
Cost of shares redeemed | | | (569,072,368 | ) | | | (363,483,545 | ) |
| | | | | | | | |
Net increase from Fund
share transactions | | | 445,032,888 | | | | 486,288,599 | |
| | | | | | | | |
Total increase in net assets | | | 1,229,272,945 | | | | 819,727,012 | |
| | |
NET ASSETS: | | | | | | | | |
Beginning of year | | | 2,694,717,151 | | | | 1,874,990,139 | |
| | | | | | | | |
End of year (including undistributed net investment income of $(27,832) and $305,276, respectively) | | $ | 3,923,990,096 | | | $ | 2,694,717,151 | |
| | | | | | | | |
| |
SHARE INFORMATION: | | | | | |
Shares sold | | | 84,147,647 | | | | 88,250,537 | |
Distributions reinvested | | | 13,130,720 | | | | 9,742,130 | |
Shares redeemed | | | (55,260,639 | ) | | | (42,378,520 | ) |
| | | | | | | | |
Net increase in shares outstanding | | | 42,017,728 | | | | 55,614,147 | |
| | | | | | | | |
| | |
| PAGE 9 § DODGE & COX GLOBAL STOCK FUND | | See accompanying Notes to Financial Statements |
NOTES TO FINANCIAL STATEMENTS
NOTE 1—ORGANIZATION AND SIGNIFICANT ACCOUNTING POLICIES
Dodge & Cox Global Stock Fund (the “Fund”) is one of the series constituting the Dodge & Cox Funds (the “Trust” or the “Funds”). The Trust is organized as a Delaware statutory trust and is registered under the Investment Company Act of 1940, as amended, as a diversified, open-end management investment company. The Fund commenced operations on May 1, 2008, and seeks long-term growth of principal and income. The Fund invests primarily in a diversified portfolio of U.S. and foreign equity securities. Foreign investing, especially in developing countries, has special risks such as currency and market volatility and political and social instability. These and other risk considerations are discussed in the Fund’s Prospectus.
The financial statements have been prepared in conformity with accounting principles generally accepted in the United States of America, which require the use of estimates and assumptions by management. Actual results may differ from those estimates. Significant accounting policies are as follows:
Security valuation The Fund’s net assets are valued as of the close of trading on the New York Stock Exchange (NYSE), generally 4:00 p.m. Eastern Time, each day that the NYSE is open for business. Portfolio securities and other financial investments for which market quotes are readily available are valued at market value. Listed securities are generally valued using the official quoted close price or the last sale on the exchange that is determined to be the primary market for the security. Security values are not discounted based on the size of the Fund’s position. Short-term securities less than 60 days to maturity may be valued at amortized cost if amortized cost approximates current value.
Investments initially valued in currencies other than the U.S. dollar are converted to the U.S. dollar using prevailing exchange rates. As a result, the Fund’s net assets may be affected by changes in the value of currencies in relation to the U.S. dollar.
If market quotations are not readily available or if a security’s value has materially changed after the close of the security’s primary market but before the close of trading on the NYSE, the security is valued at fair value as determined in good faith by or under the direction of the Board of Trustees. The Fund may use fair value pricing in calculating its net asset value per share (NAV) when, for example, (i) the primary market for a security is closed or
if trading of a security is suspended or limited, (ii) the Fund determines that the price provided by a pricing service is inaccurate or unreliable, or (iii) the Fund determines that a significant event affecting the value of a security has occurred before the close of the NYSE but after the close of the security’s primary market. An event is considered significant if there is both an affirmative expectation that the security’s value will materially change in response to the event and a reasonable basis exists for quantifying a resulting change in value. Because trading in securities on most non-U.S. exchanges is normally completed before the close of the NYSE, the value of foreign securities can change by the time the Fund calculates its NAV. To address these changes, the Fund may utilize adjustment factors provided by an independent pricing service to systematically value foreign securities at fair value. These adjustment factors are based on statistical analyses of subsequent movements and changes in securities indices, specific security prices, and exchange rates in foreign markets. When fair value pricing is employed, the prices of securities used by the Fund to calculate its net asset value may differ from quoted or published prices for the same securities. In addition, fair values may not reflect the price that the Fund could obtain for a security if it were to dispose of that security at the time of pricing.
Security transactions, investment income, expenses, and distributions Security transactions are recorded on the trade date. Realized gains and losses on securities sold are determined on the basis of identified cost.
Dividend income and corporate action transactions are recorded on the ex-dividend date, or when the Fund first learns of the dividend/corporate action if the ex-dividend date has passed. Non-cash dividends included in dividend income, if any, are recorded at the fair market value of the securities received. Dividends characterized as return of capital for U.S. tax purposes are recorded as a reduction of cost of investments and/or realized gain. Interest income is recorded on the accrual basis.
Expenses are recorded on the accrual basis. Most expenses of the Trust can be directly attributed to a specific series. Expenses which cannot be directly attributed are allocated among the Funds in the Trust based on relative net assets or other expense methodologies determined by the nature of the expense.
Distributions to shareholders are recorded on the ex-dividend date.
DODGE & COX GLOBAL STOCK FUND §PAGE 10
NOTES TO FINANCIAL STATEMENTS
Repurchase agreements The Fund enters into repurchase agreements, secured by U.S. government or agency securities, which involve the purchase of securities from a counterparty with a simultaneous commitment to resell the securities at an agreed-upon date and price. It is the Fund’s policy that its custodian take possession of the underlying collateral securities, the fair value of which exceeds the principal amount of the repurchase transaction, including accrued interest, at all times. In the event of default by the counterparty, the Fund has the contractual right to liquidate the collateral securities and to apply the proceeds in satisfaction of the obligation.
Foreign taxes The Fund is subject to foreign taxes which may be imposed by certain countries in which the Fund invests. The Fund endeavors to record foreign taxes based on applicable foreign tax law. Withholding taxes are incurred on certain foreign dividends and are accrued at the time the associated dividend is recorded. The Fund files withholding tax reclaims in certain jurisdictions to recover a portion of amounts previously withheld. The Fund records a reclaim receivable based on, among other things, a jurisdiction’s legal obligation to pay reclaims as well as payment history and market convention. In consideration of recent decisions rendered by European courts, the Fund has filed for additional reclaims related to prior years. However, a corresponding receivable amount has not yet been recorded because there is no historical precedent for collecting such reclaims and the amount, if any, that the Fund might recover is uncertain. Such amounts, if and when recorded, could result in an increase in the Fund’s net asset value per share.
Capital gains taxes are incurred upon disposition of certain foreign securities. Capital gains taxes on appreciated securities are accrued as unrealized losses and are reflected as realized losses upon the sale of the related security. Currency taxes may be incurred when the Fund purchases certain foreign currencies related to securities transactions and are recorded as realized losses on foreign currency transactions.
Forward currency contracts A forward currency contract represents an obligation to purchase or sell a specific foreign currency at a future date at a price set at the time of the contract. Losses from these transactions may arise from unfavorable changes in currency values or if the counterparties do not perform under a contract’s terms.
The values of the forward currency contracts are adjusted daily based on the applicable exchange rate of the underlying currency. Changes in the value of open contracts are recorded as unrealized appreciation or depreciation in the Statement of Operations. When the forward currency contract is closed, the Fund records a realized gain or loss in the Statement of Operations equal to the difference between the value at the time the contract was opened and the value at the time it was closed.
During the year, the Fund maintained forward currency contracts to hedge foreign currency risks associated with portfolio investments denominated in Japanese Yen and Euro. These Japanese Yen and Euro forward currency contracts had U.S. dollar total values of less than 1% and 4% of net assets during the year, respectively.
Foreign currency translation The books and records of the Funds are maintained in U.S. dollars. Foreign currency amounts are translated into U.S. dollars at the prevailing exchange rates of such currencies against the U.S. dollar. The market value of investment securities and other assets and liabilities are translated at the exchange rate as of the valuation date. Purchases and sales of investment securities, income, and expenses are translated at the exchange rate prevailing on the transaction date.
Reported realized and unrealized gain (loss) on investments include foreign currency gain (loss) related to investment transactions.
Reported realized and unrealized gain (loss) on foreign currency transactions and translation include the following: disposing/holding of foreign currency, the difference between the trade and settlement dates on securities transactions, the difference between the accrual and payment dates on dividends, and currency losses on the purchase of foreign currency in certain countries that impose taxes on such transactions.
Indemnification Under the Trust’s organizational documents, its officers and trustees are indemnified against certain liabilities arising out of the performance of their duties to the Trust. In addition, in the normal course of business the Trust enters into contracts that provide general indemnities to other parties. The Trust’s maximum exposure under these arrangements is unknown as this would involve future claims that may be made against the Trust that have not yet occurred.
PAGE 11 § DODGE & COX GLOBAL STOCK FUND
NOTES TO FINANCIAL STATEMENTS
NOTE 2—VALUATION MEASUREMENTS
Various inputs are used in determining the value of the Fund’s investments and other financial instruments. These inputs are summarized in the three broad levels listed below.
| § | | Level 1: Quoted prices in active markets for identical securities |
| § | | Level 2: Other significant observable inputs (including quoted prices for similar securities, market indices, interest rates, credit risk, etc.) |
| § | | Level 3: Significant unobservable inputs (including Fund management’s assumptions in determining the fair value of investments) |
The inputs or methodology used for valuing securities are not necessarily an indication of the risk associated with investing in those securities.
The following is a summary of the inputs used to value the Fund’s holdings as of December 31, 2013:
| | | | | | | | |
| Security Classification(a) | | LEVEL 1
(Quoted Prices) | | | LEVEL 2
(Other Significant
Observable Inputs) | |
Securities | | | | | | | | |
Common Stocks | | | | | | | | |
Consumer Discretionary | | $ | 495,941,392 | | | $ | — | |
Consumer Staples | | | 72,719,500 | | | | — | |
Energy | | | 161,898,232 | | | | — | |
Financials | | | 952,093,101 | | | | — | |
Health Care | | | 560,091,672 | | | | — | |
Industrials | | | 314,104,733 | | | | — | |
Information Technology | | | 732,389,148 | | | | — | |
Materials | | | 153,653,002 | | | | — | |
Telecommunication Services | | | 237,697,404 | | | | — | |
Preferred Stocks | | | | | | | | |
Energy | | | 54,536,625 | | | | — | |
Financials | | | 12,784,501 | | | | — | |
Information Technology | | | 14,543,008 | | | | — | |
Short-term Investments | | | | | | | | |
Money Market Fund | | | 3,857,014 | | | | — | |
Repurchase Agreement | | | — | | | | 131,583,000 | |
Treasury Bill | | | — | | | | 10,872 | |
| | | | | | | | |
Total Securities | | $ | 3,766,309,332 | | | $ | 131,593,872 | |
| | | | | | | | |
Other Financial Instruments | | | | | | | | |
Forward Currency Contracts | | $ | — | | | $ | (1,287,497 | )(b) |
| | | | | | | | | |
| (a) | | Transfers during the year between Level 1 and Level 2 relate to the use of systematic fair valuation. On days when systematic fair valuation is used, securities whose primary market closes before the NYSE are classified as Level 2. There were no Level 3 securities at December 31, 2013 and 2012, and there were no transfers to Level 3 during the year. |
| (b) | | Represents net unrealized depreciation on forward currency contracts. |
NOTE 3—ADDITIONAL DERIVATIVES INFORMATION
The Fund has entered into over-the-counter derivatives and foreign exchange transactions, such as forward currency contracts (collectively, the “Transactions”) governed by a master agreement published by the International Swaps and Derivatives Association (an “ISDA Master Agreement”). An ISDA Master Agreement, which the Fund separately negotiates with each of its counterparties, is a bilateral agreement that governs the Transactions and typically contains, among other things, collateral posting terms and termination and netting provisions that apply in the event of a default, such as the bankruptcy or insolvency of one of the parties to the agreement, and/or termination event (a “Close-Out Event”). These provisions typically permit a counterparty to: 1) terminate some or all of the Transactions upon the occurrence of a Close-Out Event; and 2) determine a single net payment owed to or by it in respect of the terminated Transactions.
The collateral requirements under an ISDA Master Agreement are typically calculated by netting the mark-to-market amount for all of the Transactions outstanding under such agreement, and comparing that amount to the value of any collateral currently pledged by the parties. None of the ISDA Master Agreements entered into by the Fund require collateral to be posted by either the Fund or the counterparty. To the extent amounts due to the Fund are not collateralized, the Fund bears the risk of loss from counterparty non-performance. The Fund attempts to mitigate its counterparty risk by only entering into Transactions with counterparties that it believes are of good standing and by monitoring the financial stability of those counterparties.
NOTE 4—RELATED PARTY TRANSACTIONS
Management fees Under a written agreement approved by a unanimous vote of the Board of Trustees, the Fund pays an annual management fee of 0.60% of the Fund’s average daily net assets to Dodge & Cox, investment manager of the Fund.
Fund officers and trustees All officers and three of the trustees of the Trust are officers or employees of Dodge & Cox. The Trust pays a fee only to those trustees who are not affiliated with Dodge & Cox.
NOTE 5—INCOME TAX INFORMATION AND DISTRIBUTIONS TO SHAREHOLDERS
A provision for federal income taxes is not required since the Fund intends to qualify as a regulated investment
DODGE & COX GLOBAL STOCK FUND §PAGE 12
NOTES TO FINANCIAL STATEMENTS
company under Subchapter M of the Internal Revenue Code and distribute all of its taxable income to shareholders. Distributions are determined in accordance with income tax regulations, and such amounts may differ from net investment income and realized gains for financial reporting purposes. Financial reporting records are adjusted for permanent book/tax differences at year end to reflect tax character.
Book/tax differences are primarily due to differing treatments of wash sales, net short-term realized gain (loss) on investments, investments in passive foreign investment companies, foreign capital gain taxes, and foreign currency realized gain (loss). At December 31, 2013, the cost of investments for federal income tax purposes was $2,892,362,451.
Distributions during the years noted below were characterized as follows for federal income tax purposes:
| | | | | | | | |
| | | Year Ended December 31, 2013 | | | Year Ended December 31, 2012 | |
Ordinary income | | | $57,838,261 | | | | $43,399,487 | |
| | | ($0.184 per share) | | | | ($0.150 per share) | |
| | |
Long-term capital gain | | | $94,094,906 | | | | $47,143,515 | |
| | | ($0.296 per share) | | | | ($0.162 per share) | |
At December 31, 2013, the tax basis components of distributable earnings were as follows:
| | | | |
Unrealized appreciation | | | $1,050,590,617 | |
Unrealized depreciation | | | (45,049,864 | ) |
| | | | |
Net unrealized appreciation | | | 1,005,540,753 | |
Undistributed ordinary income | | | 10,003,020 | |
Undistributed long-term capital gain | | | 1,466,240 | |
Fund management has reviewed the tax positions for open periods (three years and four years, respectively, from filing the Fund’s Federal and State tax returns) as applicable to the Fund, and has determined that no provision for income tax is required in the Fund’s financial statements.
NOTE 6—LOAN FACILITIES
Pursuant to an exemptive order issued by the Securities and Exchange Commission (SEC), the Fund may participate in an interfund lending facility (Facility). The Facility allows the Fund to borrow money from or loan money to the
Funds. Loans under the Facility are made for temporary or emergency purposes, such as to fund shareholder redemption requests. Interest on borrowings is the average of the current repurchase agreement rate and the bank loan rate. There was no activity in the Facility during the year.
All the Funds in the Trust participate in a $500 million committed credit facility (Line of Credit) with State Street Bank and Trust Company, to be utilized for temporary or emergency purposes to fund shareholder redemptions or for other short-term liquidity purposes. The maximum amount available to the Fund is $250 million. Each Fund pays an annual commitment fee on its pro-rata portion of the Line of Credit. The Fund’s commitment fee for the year ended December 31, 2013, amounted to $11,275 and is reflected as a Miscellaneous Expense in the Statement of Operations. Interest on borrowings is charged at the prevailing rate. There were no borrowings on the Line of Credit during the year.
NOTE 7—PURCHASES AND SALES OF INVESTMENTS
For the year ended December 31, 2013, purchases and sales of securities, other than short-term securities, aggregated $977,035,382 and $751,659,226, respectively.
NOTE 8—ACCOUNTING PRONOUNCEMENTS
Effective January 1, 2013, the Fund adopted Accounting Standards Update (ASU) No. 2011-11, Balance Sheet (Topic 210): Disclosures about Offsetting Assets and Liabilities and ASU No. 2013-01, Balance Sheet (Topic 210): Clarifying the Scope of Disclosures about Offsetting Assets and Liabilities. These amendments to Topic 210 require enhanced disclosures about offsetting of financial assets and liabilities, including derivative instruments, to enable investors to understand the effect of these arrangements on a fund’s financial position. The financial statements have been modified to provide enhanced disclosures on the Fund’s counterparty exposure and master netting arrangements. These disclosures are included in Note 3—Additional Derivatives Information.
NOTE 9—SUBSEQUENT EVENTS
Fund management has determined that no material events or transactions occurred subsequent to December 31, 2013, and through the date of the Fund’s financial statements issuance, which require additional disclosure in the Fund’s financial statements.
PAGE 13 § DODGE & COX GLOBAL STOCK FUND
FINANCIAL HIGHLIGHTS
| | | | | | | | | | | | | | | | | | | | |
SELECTED DATA AND RATIOS (for a share outstanding throughout the year) | | Year Ended December 31, | |
| | | 2013 | | | 2012 | | | 2011 | | | 2010 | | | 2009 | |
| | | | |
Net asset value, beginning of year | | | $8.99 | | | | $7.68 | | | | $8.90 | | | | $7.91 | | | | $5.34 | |
Income from investment operations: | | | | | | | | | | | | | | | | | | | | |
Net investment income | | | 0.16 | | | | 0.15 | | | | 0.16 | | | | 0.08 | | | | 0.06 | |
Net realized and unrealized gain (loss) | | | 2.81 | | | | 1.48 | | | | (1.18 | ) | | | 0.99 | | | | 2.57 | |
| | | | |
Total from investment operations | | | 2.97 | | | | 1.63 | | | | (1.02 | ) | | | 1.07 | | | | 2.63 | |
| | | | |
Distributions to shareholders from: | | | | | | | | | | | | | | | | | | | | |
Net investment income | | | (0.16 | ) | | | (0.15 | ) | | | (0.15 | ) | | | (0.08 | ) | | | (0.06 | ) |
Net realized gain | | | (0.32 | ) | | | (0.17 | ) | | | (0.05 | ) | | | — | | | | — | |
| | | | |
Total distributions | | | (0.48 | ) | | | (0.32 | ) | | | (0.20 | ) | | | (0.08 | ) | | | (0.06 | ) |
| | | | |
Net asset value, end of year | | | $11.48 | | | | $8.99 | | | | $7.68 | | | | $8.90 | | | | $7.91 | |
| | | | |
Total return | | | 33.17 | % | | | 21.11 | % | | | (11.39 | )% | | | 13.51 | % | | | 49.18 | % |
Ratios/supplemental data: | | | | | | | | | | | | | | | | | | | | |
Net assets, end of year (millions) | | | $3,924 | | | | $2,695 | | | | $1,875 | | | | $1,817 | | | | $914 | |
Ratio of expenses to average net assets | | | 0.65 | % | | | 0.65 | % | | | 0.66 | % | | | 0.69 | % | | | 0.74 | % |
Ratio of net investment income to average net assets | | | 1.58 | % | | | 1.93 | % | | | 1.94 | % | | | 1.19 | % | | | 1.09 | % |
Portfolio turnover rate | | | 24 | % | | | 12 | % | | | 19 | % | | | 14 | % | | | 20 | % |
See accompanying Notes to Financial Statements
REPORT OF INDEPENDENT REGISTERED PUBLIC ACCOUNTING FIRM
To the Trustees of Dodge & Cox Funds and Shareholders of Dodge & Cox Global Stock Fund
In our opinion, the accompanying statement of assets and liabilities, including the portfolio of investments, and the related statements of operations and of changes in net assets and the financial highlights present fairly, in all material respects, the financial position of Dodge & Cox Global Stock Fund (the “Fund”, one of the series constituting Dodge & Cox Funds) at December 31, 2013, the results of its operations for the year then ended, the changes in its net assets for each of the two years in the period then ended and the financial highlights for each of the five years in the period then ended, in conformity with accounting principles generally accepted in the United States of America. These financial statements and financial highlights (hereafter referred to as “financial statements”) are the responsibility of the Fund’s management; our responsibility is to express an opinion on these financial statements based on our audits. We conducted our audits of these financial statements in accordance with the standards of the Public Company Accounting Oversight Board (United States). Those standards require that we plan and perform the audit to obtain reasonable assurance about whether the financial statements are free of material misstatement. An audit includes examining, on a test basis, evidence supporting the amounts and disclosures in the financial statements, assessing the accounting principles used and significant estimates made by management, and evaluating the overall financial statement presentation. We believe that our audits, which included confirmation of securities at December 31, 2013, by correspondence with the custodian and brokers, provide a reasonable basis for our opinion.
PricewaterhouseCoopers LLP
San Francisco, California
February 25, 2013
DODGE & COX GLOBAL STOCK FUND §PAGE 14
SPECIAL 2013 TAX INFORMATION
(unaudited)
The following information is provided pursuant to provisions of the Internal Revenue Code:
In 2013, the Fund elected to pass through to shareholders foreign source income of $52,336,546 and foreign taxes paid of $3,520,141.
The Fund designates up to a maximum of $74,687,873 of its distributions paid to shareholders in 2013 as qualified dividends (treated for federal income tax purposes in the hands of shareholders as taxable at a maximum rate of 20%).
For shareholders that are corporations, the Fund designates 33% of its ordinary dividends paid to shareholders in 2013 as dividends from domestic corporations eligible for the corporate dividends received deduction, provided that the shareholder otherwise satisfies applicable requirements to claim that deduction.
BOARD APPROVAL OF FUNDS’ INVESTMENT MANAGEMENT AGREEMENTS AND MANAGEMENT FEES (unaudited)
The Board of Trustees is responsible for overseeing the performance of the Dodge & Cox Funds’ investment manager and determining whether to continue the Investment Management Agreements between the Funds and Dodge & Cox each year (the “Agreements”). At a meeting of the Board of Trustees of the Trust held on December 17, 2013, the Trustees, by a unanimous vote (including a separate vote of those Trustees who are not “interested persons” (as defined in the Investment Company Act of 1940) (the “Independent Trustees”)), approved the renewal of the Agreements for an additional one-year term through December 31, 2014. During the course of the year, the Board received a wide variety of materials relating to the services provided by Dodge & Cox and the performance of each of the Funds.
INFORMATION RECEIVED
In advance of the meeting, the Board, including each of the Independent Trustees, requested, received, and reviewed materials relating to the Agreements and the services provided by Dodge & Cox. The Independent Trustees retained Morningstar® to prepare an independent
expense and performance summary for each Fund and comparable funds managed by other advisers identified by Morningstar. The Morningstar materials included information regarding advisory fee rates, expense ratios, and transfer agency, custodial, and distribution expenses, as well as appropriate performance comparisons to each Fund’s peer group and an index or combination of indices. The Morningstar materials also included a comparison of expenses of various share classes offered by comparable funds.
The materials reviewed by the Board contained information concerning, among other things, Dodge & Cox’s profitability, financial results and condition, advisory fee revenue, and separate account and sub-adviser fund fee schedules. The Board additionally considered the Funds’ brokerage commissions, turnover rates, sales and redemption data and the significant investment that Dodge & Cox makes in research used in managing the Funds. The Board received and reviewed a memorandum summarizing information provided throughout the year regarding Dodge & Cox’s services to the Funds as well as information regarding (i) the different fees, services, costs, and risks associated with other accounts managed by Dodge & Cox as compared to the Dodge & Cox Funds; (ii) the differences in performance between the Funds and separately managed accounts; and (iii) Fund shares subscription and redemption activity. Throughout the process of reviewing the services provided by Dodge & Cox and preparing for the meeting, the Independent Trustees found Dodge & Cox to be open, forthright, detailed, and very helpful in answering questions about all issues.
The Board received copies of the Agreements and a memorandum from the independent legal counsel to the Independent Trustees discussing the factors generally regarded as appropriate to consider in evaluating advisory arrangements. The Trust’s Contract Review Committee, consisting solely of Independent Trustees, met with the independent legal counsel on October 30, 2013, and again on December 17, 2013, to discuss whether to renew the Agreements. The Board, including the Independent Trustees, subsequently concluded that the existing Agreements are fair and reasonable and voted to approve the Agreements.
PAGE 15 § DODGE & COX GLOBAL STOCK FUND
In considering the Agreements, the Board, including the Independent Trustees, did not identify any single factor or particular information as all-important or controlling. In reaching the decision to approve the Agreements, the Board considered several factors, discussed below, to be key factors and reached the conclusions described below.
NATURE, QUALITY, AND EXTENT
OF THE SERVICES
The Board considered that Dodge & Cox provides a wide range of services to the Funds in addition to portfolio management and that the quality of these services has been excellent in all respects. The extensive nature of services provided by Dodge & Cox has been documented in materials provided to the Board and in presentations made to the Board throughout the year. In particular, the Board considered the nature, quality, and extent of portfolio management, administrative, and shareholder services performed by Dodge & Cox. With regard to portfolio management services, the Board considered Dodge & Cox’s established long-term history of care and conscientiousness in the management of the Funds; its demonstrated consistency in investment approach and depth; the background and experience of the Dodge & Cox Investment Policy Committee, International Investment Policy Committee, Global Stock Investment Policy Committee, Fixed Income Investment Policy Committee, and research analysts responsible for managing the Funds; its methods for assessing the regulatory and investment climate in various jurisdictions; Dodge & Cox’s overall high level of attention to its core investment management function; and its commitment to the Funds and their shareholders.
In the area of administrative and shareholder services, the Board considered the excellent quality of Dodge & Cox’s work in areas such as compliance, legal services, trading, proxy voting, oversight of the Funds’ transfer agent and custodian, tax compliance, and shareholder communication through its website and other means. The Board also noted Dodge & Cox’s diligent disclosure policy, its favorable compliance record, and its reputation as a trusted, shareholder-friendly mutual fund family.
In addition, the Board considered that Dodge & Cox manages approximately $140 billion in Fund assets with fewer professionals than most comparable funds, and that on average these professionals have more experience and longer tenure than investment professionals at comparable funds. The Board also noted that Dodge & Cox is an investment research-oriented firm with no other business endeavors to distract management’s attention from its research efforts, and that its investment professionals adhere to a consistent investment approach across the Funds. The Board further considered the favorable stewardship and “Gold” analyst ratings awarded to each of the Funds by Morningstar. The Board concluded that it was satisfied with the nature, extent, and quality of investment management and other services provided to the Funds by Dodge & Cox.
INVESTMENT PERFORMANCE
The Board considered short-term and long-term investment performance for each Fund (including periods of outperformance or underperformance) as compared to both relevant indices and the performance of such Fund’s peer group. The Board noted that each Fund demonstrated favorable short-term and longer-term performance relative to its benchmark and peer group. The Board determined after extensive review and inquiry that Dodge & Cox’s historic, long-term, team-oriented, bottom up investment approach remains consistent and that Dodge & Cox continues to be distinguished by its integrity, transparency, and independence.
The Board considered that the performance of the Funds is the result of a team-oriented investment management process that emphasizes a long-term investment horizon, comprehensive independent research, price discipline, and focus. The Board also considered that the investment performance delivered by Dodge & Cox to the Funds appeared to be consistent with the relevant performance delivered for other clients of Dodge & Cox. The Board concluded that Dodge & Cox has delivered favorable long-term performance for Fund investors consistent with the long-term investment strategies being pursued by the Funds.
DODGE & COX GLOBAL STOCK FUND §PAGE 16
COSTS AND ANCILLARY BENEFITS
Costs of Services to Funds: Fees and Expenses. The Board considered each Fund’s management fee rate and expense ratio relative to similar mutual funds and relative to management fees charged by Dodge & Cox to other clients. In particular, the Board considered that the Funds continue to be substantially below their peer group median in expense ratios and management fee rates and that many media and industry reports specifically comment on the low expense ratios of the Funds, which have been a defining characteristic of the Funds for many years. The Board also evaluated the operating structures of the Funds and Dodge & Cox, noting that the Funds do not charge front-end sales commissions or distribution fees, and Dodge & Cox bears, among other things, the significant cost of third party research, reimbursement for recordkeeping and administrative costs to third-party retirement plan administrators, and administrative and office overhead. The Board noted that expenses are well below industry averages. The Board also considered that the Funds receive numerous administrative, regulatory compliance, legal, technology and shareholder support services from Dodge & Cox without any additional administrative fee and the fact that the Funds have relatively low transaction costs and portfolio turnover rates. The Board reviewed Morningstar data showing that the few peer group funds with lower expense ratios often have other share classes with significantly higher expense ratios.
The Board reviewed information regarding the fee rates Dodge & Cox charges to separate accounts and sub-advised funds that have investment programs similar to those of the Funds, including instances where separate account and sub-advised fund fees are lower than Fund fees. The Board considered differences in the nature and scope of services Dodge & Cox provides to the Funds as compared to other client accounts, differences in regulatory, litigation, and other risks as between Dodge & Cox Funds and other types of clients, and certain characteristics of the market for institutional separate account management services. The Board further noted that, with respect to non-U.S. funds sponsored and managed by Dodge & Cox that are comparable to the Funds in many respects, the fee rates charged by Dodge & Cox are the same as or higher than the fee rates charged
to the Funds. After consideration of these matters, the Board concluded that the overall costs incurred by the Funds for the services they receive (including the management fee paid to Dodge & Cox) are reasonable and that the fees are acceptable based upon the qualifications, experience, reputation, and performance of Dodge & Cox and the low overall expense ratios of the Funds.
Profitability and Costs of Services to Dodge & Cox; “Fall-out” Benefits. The Board reviewed reports of Dodge & Cox’s financial position, profitability, and estimated overall value, and considered Dodge & Cox’s overall profitability within its context as a private, employee-owned S-Corporation and relative to the favorable services provided. The Board noted in particular that Dodge & Cox’s profits are not generated by high fee rates, but reflect an extraordinarily streamlined, efficient, and focused business approach toward investment management. The Board recognized the importance of Dodge & Cox’s profitability—which is derived solely from management fees and does not include other business ventures—to maintain its independence, stability, company culture and ethics, and management continuity. The Board also considered that the compensation/profit structure at Dodge & Cox is vital for remaining independent and facilitating retention of its management and investment professionals.
The Board considered potential “fall-out” benefits (including the receipt of research from unaffiliated brokers and reputational benefits to non-U.S. funds sponsored and managed by Dodge & Cox) that Dodge & Cox might receive as a result of its association with the Funds and determined that they are not significant. The Board also noted the extent of additional administrative services performed by Dodge & Cox for the Funds, and that the magnitude of costs and risks borne by Dodge & Cox in rendering advisory services to the Funds (including risks in the regulatory compliance, securities valuation, and investment management processes) are continuing to increase. The Board concluded that the profitability of Dodge & Cox’s relationship with the Funds (including fall-out benefits) was fair and reasonable.
PAGE 17 § DODGE & COX GLOBAL STOCK FUND
THE BENEFIT OF ECONOMIES OF SCALE
The Board considered whether there have been economies of scale with respect to the management of each Fund, whether the Funds have appropriately benefited from any economies of scale, and whether the management fee rate is reasonable in relation to the Fund assets and any economies of scale that may exist. In the Board’s view, any consideration of economies of scale must take account of the Funds’ low fee structure and the considerable efficiencies of the Funds’ organization and fee structure that has been realized by shareholders from the time of each Fund’s inception (i.e., from the first dollar). The Board noted that Dodge & Cox has shared economies of scale by adding or enhancing services to the Funds over time, and that the internal costs of providing investment management, up-to-date technology, administrative, legal and compliance services to the Funds are continuing to increase. For example, Dodge & Cox has increased its global research staff and investment resources over the years to address the increased complexity of investing in multinational and non-U.S. companies. In addition, Dodge & Cox has made substantial expenditures in other staff and infrastructure to enable it to integrate credit and equity analyses and to be able to implement its strategy in a more effective and secure manner. The Board determined that the Funds provide access for small investors to high quality investment management at a relatively low cost. The Board’s decision to renew the Agreements was made after consideration of economies of scale and review of peer group fund expense ratios and historical expense ratio patterns for the Funds. The Board concluded that the current Dodge & Cox fee structure is fair and reasonable and adequately shares economies of scale that may exist.
CONCLUSION
Based on their evaluation of all material factors and assisted by the advice of independent legal counsel to the Independent Trustees, the Board, including the Independent Trustees, concluded that the advisory fee structure was fair and reasonable, that each Fund was paying a competitive fee for the services provided, that the scope and quality of Dodge & Cox’s services has provided substantial value for Fund shareholders over the
long term, and that approval of the Agreements was in the best interests of each Fund and its shareholders.
FUND HOLDINGS
The Fund provides a complete list of its holdings four times each fiscal year, as of the end of each quarter. The Fund files the lists with the Securities and Exchange Commission (SEC) on Form N-CSR (second and fourth quarters) and Form N-Q (first and third quarters). Shareholders may view the Fund’s Forms N-CSR and N-Q on the SEC’s website at www.sec.gov. Forms N-CSR and N-Q may also be reviewed and copied at the SEC’s Public Reference Room in Washington, DC. Information regarding the operations of the Public Reference Room may be obtained by calling 202-551-8090 (direct) or 800-732-0330 (general SEC number). A list of the Fund’s quarter-end holdings is also available at www.dodgeandcox.com on or about 15 days following each quarter end and remains available on the website until the list is updated in the subsequent quarter.
PROXY VOTING
For a free copy of the Fund’s proxy voting policies and procedures, please call 800-621-3979, visit the Fund’s website at www.dodgeandcox.com, or visit the SEC’s website at www.sec.gov. Information regarding how the Fund voted proxies relating to portfolio securities during the most recent 12-month period ending June 30 is also available at www.dodgeandcox.com or at www.sec.gov.
HOUSEHOLD MAILINGS
The Fund routinely mails shareholder reports and summary prospectuses to shareholders and, on occasion, proxy statements. In order to reduce the volume of mail, when possible, only one copy of these documents will be sent to shareholders who are part of the same family and share the same residential address.
If you have a direct account with the Funds and you do not want the mailing of shareholder reports and summary prospectuses combined with other members in your household, contact the Funds at 800-621-3979. Your request will be implemented within 30 days.
DODGE & COX GLOBAL STOCK FUND §PAGE 18
DODGE & COX FUNDS—EXECUTIVE OFFICER & TRUSTEE INFORMATION
| | | | | | |
Name (Age) and
Address* | | Position with Trust (Year of Election or
Appointment) | | Principal Occupation During Past 5 Years | | Other Directorships Held by Trustees |
| INTERESTED TRUSTEES AND OFFICERS |
| Kenneth E. Olivier (61) | | Chairman, President, and Trustee (Trustee since 2005) | | Chairman Emeritus (since 2013), Chairman (2011-2013), Chief Executive Officer ( 2010-2013), President (until 2011), and Director of Dodge & Cox; Portfolio Manager and member of Investment Policy Committee (IPC) (until 2013) | | — |
| Dana M. Emery (52) | | Senior Vice President and Trustee (Trustee since 1993) | | Chief Executive Officer (since 2013), President (since 2011), Executive Vice President (until March 2011), and Director of Dodge & Cox; Director of Fixed Income, Portfolio Manager, and member of Fixed Income Investment Policy Committee (FIIPC) | | — |
| John A. Gunn (70) | | Trustee (Trustee since 1985) | | Chairman Emeritus (2011-2013), Chairman (2007-2011), Chief Executive Officer (2007-2010), and Director of Dodge & Cox; Portfolio Manager and member of IPC, Global Stock Investment Policy Committee (GSIPC) (since 2008), and International Investment Policy Committee (IIPC) | | — |
| Charles F. Pohl (55) | | Senior Vice President (Officer since 2004) | | Chairman (since 2013), Co-President (2011-2013), Senior Vice President (until 2011), and Director of Dodge & Cox; Chief Investment Officer (since 2007), Portfolio Manager, Investment Analyst, and member of IPC, GSIPC, IIPC, and FIIPC | | — |
| Diana S. Strandberg (54) | | Senior Vice President (Officer since 2006) | | Senior Vice President (since 2011), Vice President (until 2011), and Director (since 2011) of Dodge & Cox; Director of International Equity (since 2009), Portfolio Manager, Investment Analyst, and member of IPC, GSIPC, and IIPC | | — |
| David H. Longhurst (56) | | Treasurer (Officer since 2006) | | Vice President and Assistant Treasurer of Dodge & Cox | | — |
| Thomas M. Mistele (60) | | Secretary (Officer since 1998) | | Chief Operating Officer, Director, Secretary, Senior Counsel (since 2011), and General Counsel (until 2011) of Dodge & Cox | | — |
| Katherine M. Primas (39) | | Chief Compliance Officer (Officer since 2009) | | Chief Compliance Officer of Dodge & Cox | | — |
| INDEPENDENT TRUSTEES |
| L. Dale Crandall (72) | | Trustee (Since 1999) | | President, Piedmont Corporate Advisors, Inc. (since 2003); President, Kaiser Foundation Health Plan, Inc. and Kaiser Foundation Hospitals (2000-2002); Senior Vice President—Finance and Administration & CFO, Kaiser Foundation Health Plan, Inc. and Kaiser Foundation Hospitals (1998-2000) | | Director, Ansell Limited (medical equipment and supplies) (since 2002); Bridgepoint Education, Inc. (education services) (since 2008); and Endurance International Group, Inc. (internet services) (since 2013) |
| Thomas A. Larsen (64) | | Trustee (Since 2002) | | Senior Counsel of Arnold & Porter LLP (law firm) (since 2013); Partner of Arnold & Porter LLP (since 2012); Director of Howard, Rice, Nemerovski, Canady, Falk & Rabkin (1977-2011) | | — |
| Ann Mather (53) | | Trustee (Since 2011) | | CFO, Pixar Animation Studios (1999-2004) | | Director, Google, Inc. (internet information services) (since 2005); Director, Glu Mobile, Inc. (multimedia software) (since 2005); Director, Netflix, Inc. (video services) (since 2010); Director, Shutterfly, Inc. (internet photography services/publishing) (since 2013); Director, Solazyme Inc. (renewable oils) (since 2011) |
| Robert B. Morris III (61) | | Trustee (Since 2011) | | Adviser to various financial services firms | | — |
| Gary Roughead (62) | | Trustee (Since 2013) | | Annenberg Distinguished Visiting Fellow, Hoover Institution (since 2011); Admiral, United States Navy (Ret.); U.S. Navy Chief of Naval Operations (2007-2011) | | Director, Northrop Grumman Corp. (global security) (since 2012) |
| John B. Taylor (67) | | Trustee (Since 2005) (and 1998-2001) | | Professor of Economics, Stanford University; Senior Fellow, Hoover Institution; Under Secretary for International Affairs, United States Treasury (2001-2005) | | — |
| * | | The address for each Officer and Trustee is 555 California Street, 40th Floor, San Francisco, California 94104. Each Officer and Trustee oversees all five series in the Dodge & Cox Funds complex and serves for an indefinite term. |
Additional information about the Trust’s Trustees and Officers is available in the Trust’s Statement of Additional Information (SAI). You can get a free copy of the SAI by visiting the Funds’ website at www.dodgeandcox.com or calling
800-621-3979.
PAGE 19 § DODGE & COX GLOBAL STOCK FUND
| | | | |
| | | | |
www.dodgeandcox.com
For Fund literature, transactions, and account information, please visit the Funds’ website.
or write or call:
DODGE & COX FUNDS
c/o Boston Financial Data Services
P.O. Box 8422
Boston, Massachusetts 02266-8422
(800) 621-3979
INVESTMENT MANAGER
Dodge & Cox
555 California Street, 40th Floor
San Francisco, California 94104
(415) 981-1710
This report is submitted for the general information of the shareholders of the Fund. The report is not authorized for distribution to prospective investors in the Fund unless it is accompanied by a current prospectus.
This report reflects our views, opinions, and portfolio holdings as of December 31, 2013, the end of the reporting period. Any such views are subject to change at any time based upon market or other conditions and Dodge & Cox disclaims any responsibility to update such views. These views may not be relied on as investment advice and, because investment decisions for a Dodge & Cox Fund are based on numerous factors, may not be relied on as an indication of trading intent on behalf of any Dodge & Cox Fund.
12/13 ISF AR Printed on recycled paper
Annual Report
December 31, 2013
International Stock Fund
ESTABLISHED 2001
TICKER: DODFX
TO OUR SHAREHOLDERS
The Dodge & Cox International Stock Fund had a total return of 19.9% for the six months ending December 31, 2013, compared to a return of 17.9% for the MSCI EAFE (Europe, Australasia, Far East) Index. For 2013, the Fund had a total return of 26.3%, compared to 22.8% for the MSCI EAFE. At year end, the Fund had net assets of $53.6 billion with a cash position of 1.0%.
MARKET COMMENTARY
Developed equity markets were particularly strong (MSCI EAFE up 23%) during 2013, with every sector of the market generating positive returns. Europe—one of the best performing regions of the market (MSCI Europe up 25%)—continued to show signs of economic improvement. For example, manufacturing in the Eurozone ended 2013 with its highest growth rate in 31 months. Japan was exceptionally strong in local currency (up 55%); however, it was only up 27% in U.S. dollars as the Japanese Yen’s depreciation against the U.S. dollar was a significant headwind. Investors were encouraged by Prime Minister Abe’s efforts to stimulate growth and boost the economy through his “three arrows” agenda of aggressive monetary policy, fiscal stimulus, and structural reform. Emerging market performance was weak (MSCI Emerging Markets down 3%). The U.S. Federal Reserve (the Fed) decided to begin tapering its quantitative easing program, and certain countries reliant on external funding (e.g., India, Brazil, Turkey) proved vulnerable with significant currency and/or market declines.
INVESTMENT STRATEGY
Although developed market valuations have increased, we believe they are still reasonable in a historical context. The MSCI EAFE traded at 14 times forward earnings at year end, compared to a 20-year average of 17 times. Unlike the United States, earnings have not recovered fully and margins, while they have risen, are still below the peak levels of 2007. Valuation disparities have narrowed within the developed world, and we are identifying more companies with attractive top-line growth and reinvestment opportunities at reasonable valuations than before. The Fund remains overweight the Technology, Media, and Telecom (TMT) and Health
Care areas of the market.(a) In addition, we significantly added to companies in the Oil Services industry during 2013 and are now equal weight the overall Energy sector.
Oil Services
For 2013, Energy was one of the weaker sectors of the market (MSCI EAFE sector up 12%). Although the oil and gas producers were up 14% due to high commodity prices and improving cash flow generation prospects, project delays and operational challenges led the Oil Services industry to be down 6% for the year. While our investment decisions are based primarily on company-specific factors, we also consider external factors (e.g., industry trends, regulations, geopolitical risk) in our analysis. We believe oil services companies are positioned to benefit from a number of favorable industry dynamics. First, the industry is consolidating and the major players are getting stronger as producers are looking to manage complex projects more effectively with fewer suppliers. Second, technology is playing a larger role since oil is becoming increasingly difficult to extract due to complicated geologies. Third, resource holders need to utilize their services to extract hydrocarbons, essentially making these companies toll-takers. We started new positions in Saipem(b) and Weatherford International during 2013, and the Fund is overweight the Oil Services industry (3.7% versus 0.7% for the MSCI EAFE).
Saipem
Domiciled in Italy, Saipem is one of the largest engineering and contracting companies serving the oil and gas industry, with an emphasis on development work for complex offshore projects. It derives the majority of its revenue from oil producing countries in the Middle East, West Africa, and the Americas. When we initiated a position, the price had declined almost 60% from its peak due to several profit warnings that stemmed from an investigation into the company’s Algerian contracts, low-margin contracts signed a few years ago, and operational delays on North American projects. As a result, the company’s valuation has declined and is now trading at 1.5 times book value, which is historically low.
PAGE 1 § DODGE & COX INTERNATIONAL STOCK FUND
We believe Saipem is an attractive long-term investment opportunity. Margins should improve as less profitable contracts are completed and replaced with higher-margin contracts during our three- to five-year investment horizon. Saipem replaced senior management, and the new team is operationally focused and addressing the company’s North American execution issues. In addition, the offshore engineering and construction area of the market is in a secular growth phase. The boom in deep-water discoveries and associated developments provides strong demand for the most sophisticated pipeline installation vessels, which are Saipem’s specialty. On December 31, Saipem was a 0.8% position in the Fund.
Emerging Markets
Against a backdrop of generally weaker performance, valuations decreased in many emerging market countries during 2013. After two years of trimming, we viewed this as an opportunity to increase our exposure to the developing world. While we continue to believe economic development in the emerging markets will be a significant driver of global economic growth in the years to come, we look at each investment individually.
As we revisited and retested our thinking, we meaningfully added to selected holdings, such as ICICI Bank (second largest Indian bank by assets, discussed below) and America Movil (largest wireless services provider in Latin America). We also initiated three new positions: Baidu (dominant search engine in China), Itau Unibanco (largest Latin American bank), and Samsung Electronics (leading technology company based in South Korea, discussed below). In addition, during the fourth quarter, we trimmed Naspers and Baidu at higher valuations.
At year end, 17.5% of the Fund was invested in companies domiciled in emerging markets, and 37.1% of the Fund was invested in companies that derive more than 40% of their revenues from the developing world, regardless of domicile.
Samsung Electronics
Samsung Electronics is a leader with significant market share in mobile handsets and memory semiconductors, as well as a global appliance manufacturer. We initiated a position during the third quarter after the company’s
valuation decreased. Many investors have been concerned about potential eroding market share and declining margins in the intensely competitive handset business. While we acknowledge these concerns, we believe Samsung Electronics’ strong position in semiconductors is underappreciated. The combination of the company’s significant scale and a more consolidated industry structure with high barriers to entry should provide the underpinning for more durable semiconductor profitability than in the past. Furthermore, Samsung Electronics has a long-standing track record of generating attractive return on capital and free cash flow in industries where many other companies struggle. We believe that the company’s valuation at 6 times forward earnings is attractive and reflects skepticism about the mobile phone segment’s outlook. Samsung Electronics (1.1% position) was the largest new purchase in the Fund during 2013.
ICICI Bank
Following the Fed’s guidance in May that it might begin tapering its quantitative easing program, U.S. interest rates increased and the Indian Rupee depreciated against the U.S. dollar. Concerns arose that India might struggle to fund its current account deficit with higher U.S. and global interest rates. In response to currency and macroeconomic weakness, ICICI Bank’s share price dropped 48% from its peak in May to its trough in September; the bank’s valuation declined to 9 times forward earnings and 1.3 times book value, which were low levels relative to history.
For investments in financial services, our equity and fixed income teams analyze, among other factors, the health of balance sheets, durability of earnings drivers, funding stability, and regulatory environment. In light of ICICI Bank’s lower valuation and our continued analysis, we added to the Fund’s position. Management has executed well against its strategic plan to improve the bank’s capital levels, asset quality, operating costs, and low-cost deposit funding. We believe that ICICI Bank can further increase its return on equity. Over the long term, the company stands to benefit from improvement to the Indian economy, which has an attractive combination of high potential GDP growth, youthful demographics, and low penetration of retail financial services. ICICI Bank was a 1.0% position in the Fund at year end.
DODGE & COX INTERNATIONAL STOCK FUND §PAGE 2
IN CLOSING
While we have a more tempered outlook than at the beginning of 2013, we continue to be optimistic about the long-term opportunity for international equities and the Fund. For the market overall, valuations are reasonable, corporate balance sheets are strong, and cash flows continue to be attractive. Given a narrower range of valuations in the market, we believe it is critical to distinguish those companies that have more attractive prospects from the rest. In-depth knowledge of individual companies is a core strength of our firm. We continue to find companies that we believe will benefit from long-term global growth opportunities over our three- to five-year investment horizon. Acknowledging that markets can be volatile over the short term, we encourage our fellow shareholders to remain focused on the long term.
Thank you for your continued confidence in our firm. As always, we welcome your comments and questions.
For the Board of Trustees,
| | |
| |  |
Kenneth E. Olivier, Chairman and President | | Diana S. Strandberg, Senior Vice President |
January 30, 2014
| (a) | Unless otherwise specified, all weightings and characteristics are as of December 31, 2013. |
| (b) | The use of specific examples does not imply that they are more attractive investments than the Fund’s other holdings. |
PAGE 3 § DODGE & COX INTERNATIONAL STOCK FUND
ANNUAL PERFORMANCE REVIEW
The Fund outperformed the MSCI EAFE by 3.5 percentage points in 2013.
Key Contributors to Relative Results
| | § | | The Fund’s average overweight position (13% versus 4%) and holdings in the Information Technology sector (up 53% compared to up 26% for the MSCI EAFE sector) significantly helped performance. Nokia (up 108%), Hewlett-Packard (up 101%), Baidu (up 87% from date of purchase), and TE Connectivity (up 52%) were particularly strong. | |
| | § | | The Fund’s holdings in the Industrials sector (up 43% compared to up 25% for the MSCI EAFE sector), especially in Japan, contributed to results. Nidec (up 71%), Mitsubishi Electric (up 50%), and Philips (up 44%) were key contributors. | |
| | § | | The Fund’s average underweight position in the Metals & Mining industry (1% compared to 4% for the MSCI EAFE industry), a weaker area of the market (down 8%), aided performance. | |
| | § | | The Fund’s average overweight position (16% versus 10%) and holdings in the Health Care sector (up 33% compared to up 29% for the MSCI EAFE sector) helped results. Bayer (up 51%), Roche (up 43%), and Novartis (up 31%) performed well. | |
| | § | | Selected additional contributors included Panasonic (up 94%), Vodafone (up 65%), and Naspers (up 64%). | |
Key Detractors from Relative Results
| | § | | Weak returns from the Fund’s emerging market holdings in the Financials sector (down 23%) hurt results. BR Malls (down 44%), Yapi Kredi (down 40%), Sabanci Holding (down 26%), and Kasikornbank (down 23%) performed poorly. | |
| | § | | The Fund’s underperformance in the Telecommunication Services sector (up 20% compared to up 46% for the MSCI EAFE sector), the strongest sector of the market, hindered performance. MTN Group and America Movil, which were both up 3%, lagged. | |
| | § | | Selected additional detractors included Lanxess (down 23%), Petrobras (down 22%), and Standard Chartered (down 9%). | |
KEY CHARACTERISTICS OF DODGE & COX
Independent Organization
Dodge & Cox is one of the largest privately owned investment managers in the world. We remain committed to independence, with a goal of providing the highest quality investment management service to our existing clients.
Over 80 Years of Investment Experience
Dodge & Cox was founded in 1930. We have a stable and well-qualified team of investment professionals, most of whom have spent their entire careers at Dodge & Cox.
Experienced Investment Team
The International Investment Policy Committee, which is the decision-making body for the International Stock Fund, is an nine-member committee with an average tenure at Dodge & Cox of 23 years.
One Business with a Single Research Office
Dodge & Cox manages domestic, international, and global equity, fixed income, and balanced investments, operating from one office in San Francisco.
Consistent Investment Approach
Our team decision-making process involves thorough, bottom-up fundamental analysis of each investment.
Long-Term Focus and Low Expenses
We invest with a three- to five-year investment horizon, which has historically resulted in low turnover relative to our peers. We manage Funds that maintain low expense ratios.
DODGE & COX INTERNATIONAL STOCK FUND §PAGE 4
GROWTH OF $10,000 OVER 10 YEARS
FOR AN INVESTMENT MADE ON DECEMBER 31, 2003
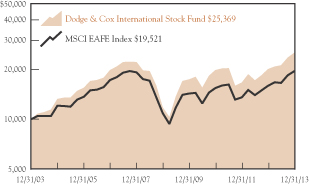
AVERAGE ANNUAL TOTAL RETURN
FOR PERIODS ENDED DECEMBER 31, 2013
| | | | | | | | | | | | | | | | |
| | | 1 Year | | | 3 Years | | | 5 Years | | | 10 Years | |
Dodge & Cox International
Stock Fund | | | 26.31 | % | | | 8.71 | % | | | 16.58 | % | | | 9.77 | % |
MSCI EAFE | | | 22.79 | | | | 8.17 | | | | 12.44 | | | | 6.91 | |
Returns represent past performance and do not guarantee future results. Investment return and share price will fluctuate with market conditions, and investors may have a gain or loss when shares are sold. Fund performance changes over time and currently may be significantly lower than stated. Performance is
updated and published monthly. Visit the Fund’s website at www.dodgeandcox.com or call 800-621-3979 for current performance figures.
The Fund’s total returns include the reinvestment of dividend and capital gain distributions, but have not been adjusted for any income taxes payable by shareholders on these distributions or on Fund share redemptions. Index returns include dividends but, unlike Fund returns, do not reflect fees or expenses. The MSCI EAFE (Europe, Australasia, Far East) Index is a broad-based, unmanaged equity market index aggregated from 21 developed market country indices, excluding the United States. MSCI makes no express or implied warranties or representations and shall have no liability whatsoever with respect to any MSCI data contained herein. The MSCI data may not be further redistributed or used as a basis for other indices or any securities or financial products. This report is not approved, reviewed, or produced by MSCI.
MSCI EAFE is a service mark of MSCI Barra.
Risks: The Fund is subject to stock market risk, meaning stocks in the Fund may decline in value for extended periods due to the financial prospects of individual companies, or due to general market and economic conditions. Investing in non-U.S. securities may entail risk due to foreign economic and political developments; this risk may be increased when investing in emerging markets. Please read the prospectus and summary prospectus for specific details regarding the Fund’s risk profile.
FUND EXPENSE EXAMPLE
As a Fund shareholder, you incur ongoing Fund costs, including management fees and other Fund expenses. All mutual funds have ongoing costs, sometimes referred to as operating expenses. The following example shows ongoing costs of investing in the Fund and can help you understand these costs and compare them with those of other mutual funds. The example assumes a $1,000 investment held for the six months indicated.
ACTUAL EXPENSES
The first line of the table below provides information about actual account values and expenses based on the Fund’s actual returns. You may use the information in this line, together with your account balance, to estimate the expenses that you paid over the period. Simply divide your account value by $1,000 (for example, an $8,600 account value divided by $1,000 = 8.6), then multiply the result by the number in the first line under the heading “Expenses Paid During Period” to estimate the expenses you paid on your account during this period.
HYPOTHETICAL EXAMPLE FOR COMPARISON WITH OTHER MUTUAL FUNDS
Information on the second line of the table can help you compare ongoing costs of investing in the Fund with those of other mutual funds. This information may not be used to estimate the actual ending account balance or expenses you paid during the period. The hypothetical “Ending Account Value” is based on the actual expense ratio of the Fund and an assumed 5% annual rate of return before expenses (not the Fund’s actual return). The amount under the heading “Expense Paid During the Period” shows the hypothetical expenses your account would have incurred under this scenario. You can compare this figure with the 5% hypothetical examples that appear in shareholder reports of other mutual funds.
| | | | | | | | | | | | |
Six Months Ended December 31, 2013 | | Beginning Account Value
7/1/2013 | | | Ending Account Value
12/31/2013 | | | Expenses Paid During Period* | |
Based on Actual Fund Return | | $ | 1,000.00 | | | $ | 1,198.50 | | | $ | 3.50 | |
Based on Hypothetical 5% Yearly Return | | | 1,000.00 | | | | 1,022.02 | | | | 3.22 | |
| * | Expenses are equal to the Fund’s annualized expense ratio of 0.63%, multiplied by the average account value over the period, multiplied by 184/365 (to reflect the one-half year period). |
The expenses shown in the table highlight ongoing costs only and do not reflect any transactional fees or account maintenance fees. Though other mutual funds may charge such fees, please note that the Fund does not charge transaction fees (e.g., redemption fees, sales loads) or universal account maintenance fees (e.g., small account fees).
PAGE 5 § DODGE & COX INTERNATIONAL STOCK FUND
| | | | |
| FUND INFORMATION | | | December 31, 2013 | |
| | | | |
| GENERAL INFORMATION | | | |
Net Asset Value Per Share | | | $43.04 | |
Total Net Assets (billions) | | | $53.6 | |
Expense Ratio | | | 0.64% | |
Portfolio Turnover Rate | | | 13% | |
30-Day SEC Yield(a) | | | 1.51% | |
Fund Inception | | | 2001 | |
No sales charges or distribution fees | | | | |
Investment Manager: Dodge & Cox, San Francisco. Managed by the International Investment Policy Committee, whose nine members’ average tenure at Dodge & Cox is 23 years.
| | | | | | | | |
| PORTFOLIO CHARACTERISTICS | | Fund | | | MSCI
EAFE | |
Number of Stocks | | | 81 | | | | 904 | |
Median Market Capitalization (billions) | | | $27 | | | | $9 | |
Weighted Average Market Capitalization (billions) | | | 73 | | | | $63 | |
Price-to-Earnings Ratio(b) | | | 12.5x | | | | 13.9x | |
Countries Represented | | | 24 | | | | 21 | |
Emerging Markets (Brazil, China, India, Mexico, South Africa, South Korea, Thailand, Turkey, United Arab Emirates) | | | 17.5% | | | | 0.0% | |
| | | | |
| TEN LARGEST HOLDINGS(%)(c) | | Fund | |
Naspers, Ltd. (South Africa) | | | 3.9 | |
Roche Holding AG (Switzerland) | | | 3.9 | |
Sanofi (France) | | | 3.3 | |
GlaxoSmithKline PLC (United Kingdom) | | | 3.2 | |
Novartis AG (Switzerland) | | | 2.7 | |
Lafarge SA (France) | | | 2.7 | |
Credit Suisse Group AG (Switzerland) | | | 2.6 | |
Koninklijke Philips NV (Netherlands) | | | 2.6 | |
Bayer AG (Germany) | | | 2.5 | |
Hewlett-Packard Co. (United States) | | | 2.5 | |
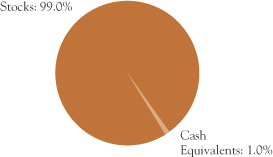
| | | | | | | | |
| REGION DIVERSIFICATION(%)(d) | | Fund | | | MSCI
EAFE | |
Europe (excluding United Kingdom) | | | 48.8 | | | | 44.8 | |
United Kingdom | | | 15.0 | | | | 21.9 | |
Japan | | | 12.6 | | | | 20.9 | |
Africa/Middle East | | | 6.5 | | | | 0.4 | |
Pacific (excluding Japan) | | | 6.2 | | | | 12.0 | |
United States | | | 5.2 | | | | 0.0 | |
Latin America | | | 4.7 | | | | 0.0 | |
| | | | | | | | |
| SECTOR DIVERSIFICATION(%) | | Fund | | | MSCI
EAFE | |
Financials | | | 24.0 | | | | 25.6 | |
Health Care | | | 15.6 | | | | 10.1 | |
Information Technology | | | 15.0 | | | | 4.5 | |
Consumer Discretionary | | | 12.5 | | | | 11.9 | |
Industrials | | | 10.8 | | | | 12.9 | |
Telecommunication Services | | | 7.5 | | | | 5.7 | |
Energy | | | 6.9 | | | | 6.8 | |
Materials | | | 5.1 | | | | 8.0 | |
Consumer Staples | | | 1.6 | | | | 11.0 | |
Utilities | | | 0.0 | | | | 3.5 | |
| (a) | SEC Yield is an annualization of the Fund’s total net investment income per share for the 30-day period ended on the last day of the month. |
| (b) | Price-to-earnings (P/E) ratios are calculated using 12-month forward earnings estimates from third-party sources. |
| (c) | The Fund’s portfolio holdings are subject to change without notice. The mention of specific securities is not a recommendation to buy, sell, or hold any particular security and is not indicative of Dodge & Cox’s current or future trading activity. |
| (d) | The Fund may classify a company in a different category than the MSCI EAFE. The Fund generally classifies a company based on its country of incorporation, but may designate a different country in certain circumstances. |
DODGE & COX INTERNATIONAL STOCK FUND §PAGE 6
| | | | |
| PORTFOLIO OF INVESTMENTS | | | December 31, 2013 | |
| | | | | | | | |
| COMMON STOCKS: 97.5% | | | | | | |
| | |
| | | SHARES | | | VALUE | |
| CONSUMER DISCRETIONARY: 12.5% | |
AUTOMOBILES & COMPONENTS: 4.2% | |
Bayerische Motoren Werke AG (Germany) | | | 7,886,400 | | | $ | 924,578,669 | |
Honda Motor Co., Ltd. (Japan) | | | 1,160,000 | | | | 47,695,375 | |
Honda Motor Co., Ltd. ADR (Japan) | | | 6,758,400 | | | | 279,459,840 | |
Mahindra & Mahindra, Ltd. (India) | | | 12,792,016 | | | | 194,822,062 | |
NGK Spark Plug Co., Ltd.(b) (Japan) | | | 16,720,000 | | | | 395,335,676 | |
Yamaha Motor Co., Ltd.(b) (Japan) | | | 28,851,100 | | | | 432,040,497 | |
| | | | | | | | |
| | | | | | | 2,273,932,119 | |
CONSUMER DURABLES & APPAREL: 1.8% | |
Panasonic Corp. (Japan) | | | 81,287,034 | | | | 944,785,202 | |
|
MEDIA: 6.5% | |
Grupo Televisa SAB ADR (Mexico) | | | 20,060,592 | | | | 607,033,514 | |
Liberty Global PLC, Series A(a) (United Kingdom) | | | 2,481,805 | | | | 220,855,827 | |
Liberty Global PLC, Series C(a) (United Kingdom) | | | 3,574,971 | | | | 301,441,554 | |
Naspers, Ltd.(b) (South Africa) | | | 20,160,895 | | | | 2,106,438,754 | |
Television Broadcasts, Ltd.(b) (Hong Kong) | | | 37,596,400 | | | | 250,665,293 | |
| | | | | | | | |
| | | | | | | 3,486,434,942 | |
| | | | | | | | |
| | | | | | | 6,705,152,263 | |
| CONSUMER STAPLES: 1.6% | | | | | | | | |
FOOD, BEVERAGE & TOBACCO: 1.6% | |
Anadolu Efes Biracilik ve Malt Sanayii AS (Turkey) | | | 24,301,444 | | | | 262,916,972 | |
Unilever PLC (United Kingdom) | | | 14,890,000 | | | | 611,989,078 | |
| | | | | | | | |
| | | | | | | 874,906,050 | |
| ENERGY: 5.8% | |
Royal Dutch Shell PLC ADR (United Kingdom) | | | 10,632,443 | | | | 757,774,213 | |
Saipem SPA (Italy) | | | 19,820,000 | | | | 424,264,585 | |
Schlumberger, Ltd.
(Curacao/United States) | | | 12,452,217 | | | | 1,122,069,274 | |
Total SA (France) | | | 6,218,600 | | | | 380,950,771 | |
Weatherford International, Ltd.(a) (Switzerland) | | | 26,741,792 | | | | 414,230,358 | |
| | | | | | | | |
| | | | | | | 3,099,289,201 | |
| FINANCIALS: 23.8% | | | | | | | | |
BANKS: 13.5% | |
Banco Santander SA (Spain) | | | 71,700,740 | | | | 641,743,141 | |
Barclays PLC (United Kingdom) | | | 165,745,898 | | | | 746,412,748 | |
BNP Paribas SA (France) | | | 6,394,558 | | | | 498,349,451 | |
HSBC Holdings PLC (United Kingdom) | | | 108,404,921 | | | | 1,189,094,902 | |
ICICI Bank, Ltd. (India) | | | 31,461,148 | | | | 558,472,888 | |
Kasikornbank PCL Foreign (Thailand) | | | 95,826,527 | | | | 462,218,641 | |
| | | | | | | | |
| | |
| | | SHARES | | | VALUE | |
Lloyds Banking Group PLC(a) (United Kingdom) | | | 383,000,000 | | | $ | 500,279,690 | |
Mitsubishi UFJ Financial Group, Inc. (Japan) | | | 74,899,900 | | | | 493,595,391 | |
Standard Bank Group, Ltd. (South Africa) | | | 28,198,309 | | | | 347,895,629 | |
Standard Chartered PLC (United Kingdom) | | | 33,913,224 | | | | 763,756,963 | |
UniCredit SPA (Italy) | | | 102,892,588 | | | | 761,535,065 | |
Yapi ve Kredi Bankasi AS (Turkey) | | | 168,737,068 | | | | 292,090,225 | |
| | | | | | | | |
| | | | | | | 7,255,444,734 | |
DIVERSIFIED FINANCIALS: 4.4% | |
Credit Suisse Group AG (Switzerland) | | | 45,427,105 | | | | 1,388,708,204 | |
Deutsche Boerse AG (Germany) | | | 4,892,000 | | | | 405,141,263 | |
Haci Omer Sabanci Holding AS (Turkey) | | | 64,895,354 | | | | 260,910,125 | |
ING Groep NV(a) (Netherlands) | | | 21,062,319 | | | | 292,651,732 | |
| | | | | | | | |
| | | | | | | 2,347,411,324 | |
INSURANCE: 4.3% | |
AEGON NV (Netherlands) | | | 84,986,863 | | | | 802,280,158 | |
Dai-ichi Life Insurance Co., Ltd. (Japan) | | | 15,269,300 | | | | 254,754,156 | |
Swiss Life Holding AG (Switzerland) | | | 1,520,000 | | | | 315,569,755 | |
Swiss Re AG (Switzerland) | | | 10,171,868 | | | | 935,599,764 | |
| | | | | | | | |
| | | | | | | 2,308,203,833 | |
REAL ESTATE: 1.6% | |
BR Malls Participacoes SA(b) (Brazil) | | | 46,424,100 | | | | 335,501,073 | |
Hang Lung Group, Ltd.(b) (Hong Kong) | | | 68,625,500 | | | | 347,804,721 | |
Hang Lung Properties, Ltd. (Hong Kong) | | | 45,464,000 | | | | 144,231,510 | |
| | | | | | | | |
| | | | | | | 827,537,304 | |
| | | | | | | | |
| | | | | | | 12,738,597,195 | |
| HEALTH CARE: 15.6% | | | | | | | | |
PHARMACEUTICALS, BIOTECHNOLOGY & LIFE SCIENCES: 15.6% | |
Bayer AG (Germany) | | | 9,720,350 | | | | 1,363,303,883 | |
GlaxoSmithKline PLC (United Kingdom) | | | 24,770,000 | | | | 661,003,125 | |
GlaxoSmithKline PLC ADR (United Kingdom) | | | 19,853,749 | | | | 1,059,991,659 | |
Novartis AG (Switzerland) | | | 1,860,000 | | | | 148,458,046 | |
Novartis AG ADR (Switzerland) | | | 16,305,000 | | | | 1,310,595,900 | |
Roche Holding AG (Switzerland) | | | 7,395,400 | | | | 2,065,953,343 | |
Sanofi (France) | | | 16,354,120 | | | | 1,735,072,953 | |
| | | | | | | | |
| | | | | | | 8,344,378,909 | |
| | |
| PAGE 7 § DODGE & COX INTERNATIONAL STOCK FUND | | See accompanying Notes to Financial Statements |
| | | | |
| PORTFOLIO OF INVESTMENTS | | | December 31, 2013 | |
| | | | | | | | |
| COMMON STOCKS (continued) | |
| | |
| | | SHARES | | | VALUE | |
| INDUSTRIALS: 10.8% | | | | | | | | |
CAPITAL GOODS: 9.2% | |
Compagnie de Saint-Gobain SA (France) | | | 6,082,882 | | | $ | 334,519,472 | |
Koninklijke Philips NV (Netherlands) | | | 37,291,948 | | | | 1,366,955,363 | |
Mitsubishi Electric Corp.(b) (Japan) | | | 98,239,800 | | | | 1,231,379,128 | |
Nexans SA(b) (France) | | | 2,065,736 | | | | 104,650,453 | |
Nidec Corp.(b) (Japan) | | | 7,290,500 | | | | 713,058,114 | |
Schneider Electric SA (France) | | | 10,974,546 | | | | 957,192,661 | |
Wienerberger AG(b) (Austria) | | | 13,185,029 | | | | 209,047,781 | |
| | | | | | | | |
| | | | | | | 4,916,802,972 | |
COMMERCIAL & PROFESSIONAL SERVICES: 1.4% | |
ADT Corp. (United States) | | | 7,476,860 | | | | 302,588,524 | |
Tyco International, Ltd. (Switzerland) | | | 10,608,920 | | | | 435,390,077 | |
| | | | | | | | |
| | | | | | | 737,978,601 | |
TRANSPORTATION: 0.2% | |
DP World, Ltd. (United Arab Emirates) | | | 8,122,304 | | | | 143,846,004 | |
| | | | | | | | |
| | | | | | | 5,798,627,577 | |
| INFORMATION TECHNOLOGY: 14.8% | |
SEMICONDUCTORS & SEMICONDUCTOR EQUIPMENT: 2.2% | |
Infineon Technologies AG(b) (Germany) | | | 63,788,456 | | | | 680,969,013 | |
Samsung Electronics Co., Ltd. (South Korea) | | | 389,000 | | | | 505,716,587 | |
| | | | | | | | |
| | | | | | | 1,186,685,600 | |
SOFTWARE & SERVICES: 3.3% | |
Baidu, Inc. ADR(a) (Cayman Islands/China) | | | 3,416,487 | | | | 607,724,708 | |
Fujitsu, Ltd. (a),(b) (Japan) | | | 103,523,000 | | | | 534,768,892 | |
Nintendo Co., Ltd. (Japan) | | | 4,869,600 | | | | 647,831,127 | |
| | | | | | | | |
| | | | | | | 1,790,324,727 | |
TECHNOLOGY, HARDWARE & EQUIPMENT: 9.3% | |
Brother Industries, Ltd.(b) (Japan) | | | 18,185,100 | | | | 248,143,469 | |
Hewlett-Packard Co. (United States) | | | 47,849,204 | | | | 1,338,820,728 | |
Kyocera Corp. (Japan) | | | 10,467,800 | | | | 521,849,302 | |
Nokia Oyj(a) (Finland) | | | 161,029,200 | | | | 1,289,291,616 | |
TE Connectivity, Ltd. (Switzerland) | | | 12,270,462 | | | | 676,225,161 | |
Telefonaktiebolaget LM Ericsson (Sweden) | | | 74,422,200 | | | | 908,314,513 | |
| | | | | | | | |
| | | | | | | 4,982,644,789 | |
| | | | | | | | |
| | | | | | | 7,959,655,116 | |
| MATERIALS: 5.1% | |
Akzo Nobel NV (Netherlands) | | | 4,027,471 | | | | 312,156,802 | |
BHP Billiton PLC (United Kingdom) | | | 12,284,454 | | | | 380,200,213 | |
Lafarge SA(b) (France) | | | 19,314,291 | | | | 1,447,303,740 | |
Lanxess AG(b) (Germany) | | | 3,441,980 | | | | 229,535,413 | |
Linde AG (Germany) | | | 1,025,205 | | | | 214,447,348 | |
Norsk Hydro ASA (Norway) | | | 34,026,190 | | | | 151,862,062 | |
| | | | | | | | |
| | | | | | | 2,735,505,578 | |
| | | | | | | | |
| | |
| | | SHARES | | | VALUE | |
| TELECOMMUNICATION SERVICES: 7.5% | |
America Movil SAB de CV, Series L (Mexico) | | | 763,815,000 | | | $ | 888,626,343 | |
Bharti Airtel, Ltd. (India) | | | 36,972,804 | | | | 197,521,026 | |
Millicom International Cellular SA SDR(b) (Luxembourg) | | | 6,580,880 | | | | 655,340,787 | |
MTN Group, Ltd. (South Africa) | | | 42,860,300 | | | | 886,705,654 | |
Telecom Italia SPA (Italy) | | | 201,500,000 | | | | 199,863,668 | |
Telecom Italia SPA- RSP (Italy) | | | 314,830,886 | | | | 246,441,099 | |
Telekom Austria AG (Austria) | | | 12,767,576 | | | | 96,674,162 | |
Vodafone Group PLC (United Kingdom) | | | 215,592,300 | | | | 846,113,818 | |
| | | | | | | | |
| | | | | | | 4,017,286,557 | |
| | | | | | | | |
TOTAL COMMON STOCKS
(Cost $43,386,937,875) | | | | | | $ | 52,273,398,446 | |
|
| PREFERRED STOCKS: 1.5% | |
| ENERGY: 1.1% | |
Petroleo Brasileiro SA ADR (Brazil) | | | 41,436,000 | | | | 608,694,840 | |
|
| FINANCIALS: 0.2% | |
BANKS: 0.2% | |
Itau Unibanco Holding SA (Brazil) | | | 7,347,100 | | | | 97,629,156 | |
|
| INFORMATION TECHNOLOGY: 0.2% | |
SEMICONDUCTORS & SEMICONDUCTOR EQUIPMENT: 0.2% | |
Samsung Electronics Co., Ltd. (South Korea) | | | 76,000 | | | | 72,950,206 | |
| | | | | | | | |
| | |
TOTAL PREFERRED STOCKS
(Cost $885,859,673) | | | | | | $ | 779,274,202 | |
| | |
| See accompanying Notes to Financial Statements | | DODGE & COX INTERNATIONAL STOCK FUND §PAGE 8 |
| | | | |
| PORTFOLIO OF INVESTMENTS | | | December 31, 2013 | |
| | | | | | | | |
| SHORT-TERM INVESTMENTS: 1.1% | |
| | |
| | | PAR VALUE | | | VALUE | |
MONEY MARKET FUND: 0.1% | |
SSgA U.S. Treasury Money
Market Fund | | $ | 53,536,173 | | | $ | 53,536,173 | |
|
REPURCHASE AGREEMENT: 1.0% | |
Fixed Income Clearing Corporation(c) 0.00%, dated 12/31/13, due 1/2/14, maturity value $532,003,000 | | | 532,003,000 | | | | 532,003,000 | |
|
TREASURY BILL: 0.0%(d) | |
Swedish Treasury Bill (Sweden) 2/19/14 | | | 131,510,000 | | | | 20,425,018 | |
| | | | | | | | |
TOTAL SHORT-TERM INVESTMENTS
(Cost $605,406,500) | | | $ | 605,964,191 | |
| | | | | | | | |
TOTAL INVESTMENTS
(Cost $44,878,204,048) | | | 100.1 | % | | $ | 53,658,636,839 | |
OTHER ASSETS LESS LIABILITIES | | | (0.1 | %) | | | (42,419,881 | ) |
| | | | | | | | |
| NET ASSETS | | | 100.0 | % | | $ | 53,616,216,958 | |
| | | | | | | | |
| (b) | See Note 10 regarding holdings of 5% voting securities |
| (c) | Repurchase agreement is collateralized by U.S. Treasury Notes 0.75%-2.875%, 3/31/18-12/31/20. Total collateral value is $542,651,338. |
| | In determining a company’s country designation, the Fund generally references the country of incorporation. In cases where the Fund considers the country of incorporation to be a “jurisdiction of convenience” chosen primarily for tax purposes, the Fund uses the country designation of an appropriate broad-based market index. In that circumstance, two countries are listed - the country of incorporation and the country designated by an appropriate index, respectively. |
ADR: American Depositary Receipt
NVDR: Non-Voting Depositary Receipt
SDR: Swedish Depository Receipt
Forward Currency Contracts
As of December 31, 2013, open forward currency contracts are summarized as follows:
| | | | | | | | | | | | | | | | |
| | | | | | Contract Amount | | | | |
| Counterparty | | Settlement
Date | | | Receive U.S. Dollar | | | Deliver
Foreign
Currency | | | Unrealized
Appreciation/
(Depreciation) | |
Contracts to sell EUR: | | | | | |
Citibank | | | 2/5/2014 | | | | 678,050,000 | | | | 500,000,000 | | | $ | (9,789,329 | ) |
UBS | | | 2/12/2014 | | | | 675,380,000 | | | | 500,000,000 | | | | (12,458,079 | ) |
Credit Suisse | | | 3/5/2014 | | | | 680,214,429 | | | | 500,000,000 | | | | (7,620,257 | ) |
Deutsche Bank | | | 3/12/2014 | | | | 682,660,500 | | | | 500,000,000 | | | | (5,174,185 | ) |
Barclays | | | 3/19/2014 | | | | 687,668,000 | | | | 500,000,000 | | | | (166,685 | ) |
HSBC | | | 3/19/2014 | | | | 415,003,549 | | | | 300,000,000 | | | | 2,302,737 | |
| | | | | | | | | | | | | | | | |
| | | | | | | | | | | | | | $ | (32,905,798 | ) |
| | | | | | | | | | | | | | | | |
| | | | | | | | | | | | | | | | | |
| | |
| PAGE 9 § DODGE & COX INTERNATIONAL STOCK FUND | | See accompanying Notes to Financial Statements |
| | |
STATEMENT OF ASSETS AND LIABILITIES |
| | | | |
| |
| | | December 31, 2013 | |
ASSETS: | | | | |
Investments, at value | | | | |
Unaffiliated issuers (cost $38,955,423,295) | | $ | 47,408,657,783 | |
Affiliated issuers (cost $5,922,780,753) | | | 6,249,979,056 | |
| | | | |
| | | 53,658,636,839 | |
Cash denominated in foreign currency
(cost $2,013,474) | | | 2,013,548 | |
Unrealized appreciation on forward currency contracts | | | 2,302,737 | |
Receivable for Fund shares sold | | | 92,879,821 | |
Dividends and interest receivable | | | 101,767,063 | |
Prepaid expenses and other assets | | | 254,948 | |
| | | | |
| | | 53,857,854,956 | |
| | | | |
LIABILITIES: | | | | |
Unrealized depreciation on forward currency contracts | | | 35,208,535 | |
Payable for investments purchased | | | 33,447,453 | |
Payable for Fund shares redeemed | | | 143,319,886 | |
Management fees payable | | | 26,642,226 | |
Accrued expenses | | | 3,019,898 | |
| | | | |
| | | 241,637,998 | |
| | | | |
NET ASSETS | | $ | 53,616,216,958 | |
| | | | |
NET ASSETS CONSIST OF: | | | | |
Paid in capital | | $ | 50,210,782,440 | |
Undistributed net investment income | | | 8,560,984 | |
Accumulated net realized loss | | | (5,353,125,769 | ) |
Net unrealized appreciation | | | 8,749,999,303 | |
| | | | |
| | $ | 53,616,216,958 | |
| | | | |
Fund shares outstanding (par value $0.01 each, unlimited shares authorized) | | | 1,245,805,426 | |
Net asset value per share | | $ | 43.04 | |
| |
STATEMENT OF OPERATIONS | | | | |
| |
| | | Year Ended
December 31, 2013 | |
INVESTMENT INCOME: | | | | |
Dividends (net of foreign taxes of $81,171,449) | | | | |
Unaffiliated issuers | | $ | 1,037,251,852 | |
Affiliated issuers | | | 112,828,048 | |
Interest | | | 784,240 | |
| | | | |
| | | 1,150,864,140 | |
| | | | |
EXPENSES: | | | | |
Management fees | | | 277,562,377 | |
Custody and fund accounting fees | | | 5,948,400 | |
Transfer agent fees | | | 6,751,981 | |
Professional services | | | 526,311 | |
Shareholder reports | | | 1,116,997 | |
Registration fees | | | 484,231 | �� |
Trustees’ fees | | | 215,000 | |
Miscellaneous | | | 1,173,686 | |
| | | | |
| | | 293,778,983 | |
| | | | |
NET INVESTMENT INCOME | | | 857,085,157 | |
| | | | |
|
REALIZED AND UNREALIZED GAIN (LOSS): | |
Net realized gain | | | | |
Investments in unaffiliated issuers | | | 644,462,868 | |
Investments in affiliated issuers | | | 501,890,906 | |
Forward currency contracts | | | 125,626,881 | |
Foreign currency transactions | | | (8,259,114 | ) |
Net change in unrealized appreciation/depreciation | | | | |
Investments | | | 8,883,130,937 | |
Forward currency contracts | | | (89,037,410 | ) |
Foreign currency translation | | | 2,437,464 | |
| | | | |
Net realized and unrealized gain | | | 10,060,252,532 | |
| | | | |
NET INCREASE IN NET ASSETS
FROM OPERATIONS | | $ | 10,917,337,689 | |
| | | | |
| | | | | | | | |
STATEMENT OF CHANGES IN NET ASSETS | |
| | |
| | | Year Ended
December 31, 2013
| | | Year Ended
December 31, 2012 | |
OPERATIONS: | | | | | | | | |
Net investment income | | $ | 857,085,157 | | | $ | 878,743,223 | |
Net realized gain | | | 1,263,721,541 | | | | 1,220,028,414 | |
Net change in unrealized appreciation/depreciation | | | 8,796,530,991 | | | | 5,151,756,105 | |
| | | | | | | | |
| | | 10,917,337,689 | | | | 7,250,527,742 | |
| | | | | | | | |
| | |
DISTRIBUTIONS TO
SHAREHOLDERS FROM: | | | | | | | | |
Net investment income | | | (852,149,250 | ) | | | (865,782,642 | ) |
Net realized gain | | | — | | | | — | |
| | | | | | | | |
Total distributions | | | (852,149,250 | ) | | | (865,782,642 | ) |
| | | | | | | | |
| | |
FUND SHARE TRANSACTIONS: | | | | | | | | |
Proceeds from sale of shares | | | 9,707,933,665 | | | | 6,188,958,946 | |
Reinvestment of distributions | | | 718,344,743 | | | | 744,920,426 | |
Cost of shares redeemed | | | (7,431,440,582 | ) | | | (8,685,963,235 | ) |
| | | | | | | | |
Net increase (decrease) from Fund share transactions | | | 2,994,837,826 | | | | (1,752,083,863 | ) |
| | | | | | | | |
Total increase in net assets | | | 13,060,026,265 | | | | 4,632,661,237 | |
| | |
NET ASSETS: | | | | | | | | |
Beginning of year | | | 40,556,190,693 | | | | 35,923,529,456 | |
| | | | | | | | |
End of year (including undistributed net investment income of $8,560,984 and $7,563,230, respectively) | | $ | 53,616,216,958 | | | $ | 40,556,190,693 | |
| | | | | | | | |
| | |
SHARE INFORMATION: | | | | | | | | |
Shares sold | | | 250,919,903 | | | | 194,599,589 | |
Distributions reinvested | | | 17,172,926 | | | | 21,566,891 | |
Shares redeemed | | | (193,199,816 | ) | | | (273,859,180 | ) |
| | | | | | | | |
Net increase (decrease) in
shares outstanding | | | 74,893,013 | | | | (57,692,700 | ) |
| | | | | | | | |
| | |
| See accompanying Notes to Financial Statements | | DODGE & COX INTERNATIONAL STOCK FUND §PAGE 10 |
NOTES TO FINANCIAL STATEMENTS
NOTE 1—ORGANIZATION AND SIGNIFICANT ACCOUNTING POLICIES
Dodge & Cox International Stock Fund (the “Fund”) is one of the series constituting the Dodge & Cox Funds (the “Trust” or the “Funds”). The Trust is organized as a Delaware statutory trust and is registered under the Investment Company Act of 1940, as amended, as a diversified, open-end management investment company. The Fund commenced operations on May 1, 2001, and seeks long-term growth of principal and income. The Fund invests primarily in a diversified portfolio of foreign equity securities. Foreign investing, especially in developing countries, has special risks such as currency and market volatility and political and social instability. These and other risk considerations are discussed in the Fund’s Prospectus.
The financial statements have been prepared in conformity with accounting principles generally accepted in the United States of America, which require the use of estimates and assumptions by management. Actual results may differ from those estimates. Significant accounting policies are as follows:
Security valuation The Fund’s net assets are valued as of the close of trading on the New York Stock Exchange (NYSE), generally 4:00 p.m. Eastern Time, each day that the NYSE is open for business. Portfolio securities and other financial instruments for which market quotes are readily available are valued at market value. Listed securities are generally valued at market, using the official quoted close price or the last sale on the exchange that is determined to be the primary market for the security. Security values are not discounted based on the size of the Fund’s position. Short-term securities less than 60 days to maturity may be valued at amortized cost if amortized cost approximates current value.
Investments initially valued in currencies other than the U.S. dollar are converted to the U.S. dollar using prevailing exchange rates. As a result, the Fund’s net assets may be affected by changes in the value of currencies in relation to the U.S. dollar.
If market quotations are not readily available or if a security’s value has materially changed after the close of the security’s primary market but before the close of trading on the NYSE, the security is valued at fair value as
determined in good faith by or under the direction of the Board of Trustees. The Fund may use fair value pricing in calculating its net asset value per share (NAV) when, for example, (i) the primary market for a security is closed or if trading of a security is suspended or limited, (ii) the Fund determines that the price provided by a pricing service is inaccurate or unreliable, or (iii) the Fund determines that a significant event affecting the value of a security has occurred before the close of the NYSE but after the close of the security’s primary market. An event is considered significant if there is both an affirmative expectation that the security’s value will materially change in response to the event and a reasonable basis exists for quantifying a resulting change in value. Because trading in securities on most non-U.S. exchanges is normally completed before the close of the NYSE, the value of foreign securities can change by the time the Fund calculates its NAV. To address these changes, the Fund may utilize adjustment factors provided by an independent pricing service to systematically value foreign securities at fair value. These adjustment factors are based on statistical analyses of subsequent movements and changes in securities indices, specific security prices, and exchange rates in foreign markets. When fair value pricing is employed, the prices of securities used by the Fund to calculate its net asset value may differ from quoted or published prices for the same securities. In addition, fair values may not reflect the price that the Fund could obtain for a security if it were to dispose of that security at the time of pricing.
Security transactions, investment income, expenses, and distributions Security transactions are recorded on the trade date. Realized gains and losses on securities sold are determined on the basis of identified cost.
Dividend income and corporate action transactions are recorded on the ex-dividend date, or when the Fund first learns of the dividend/corporate action if the ex-dividend date has passed. Non-cash dividends included in dividend income, if any, are recorded at the fair market value of the securities received. Dividends characterized as return of capital for U.S. tax purposes are recorded as a reduction of cost of investments and/or realized gain. Interest income is recorded on the accrual basis.
PAGE 11 § DODGE & COX INTERNATIONAL STOCK FUND
NOTES TO FINANCIAL STATEMENTS
Expenses are recorded on the accrual basis. Most expenses of the Trust can be directly attributed to a specific series. Expenses which cannot be directly attributed are allocated among the Funds in the Trust based on relative net assets or other expense methodologies determined by the nature of the expense.
Distributions to shareholders are recorded on the ex-dividend date.
Repurchase agreements The Fund enters into repurchase agreements, secured by U.S. government or agency securities, which involve the purchase of securities from a counterparty with a simultaneous commitment to resell the securities at an agreed-upon date and price. It is the Fund’s policy that its custodian take possession of the underlying collateral securities, the fair value of which exceeds the principal amount of the repurchase transaction, including accrued interest, at all times. In the event of default by the counterparty, the Fund has the contractual right to liquidate the collateral securities and to apply the proceeds in satisfaction of the obligation.
Foreign taxes The Fund is subject to foreign taxes which may be imposed by certain countries in which the Fund invests. The Fund endeavors to record foreign taxes based on applicable foreign tax law. Withholding taxes are incurred on certain foreign dividends and are accrued at the time the associated dividend is recorded. The Fund files withholding tax reclaims in certain jurisdictions to recover a portion of amounts previously withheld. The Fund records a reclaim receivable based on, among other things, a jurisdiction’s legal obligation to pay reclaims as well as payment history and market convention. In consideration of recent decisions rendered by European courts, the Fund has filed for additional reclaims related to prior years. However, a corresponding receivable amount has not yet been recorded because there is no historical precedent for collecting such reclaims and the amount, if any, that the Fund might recover is uncertain. Such amounts, if and when recorded, could result in an increase in the Fund’s net asset value per share.
Capital gains taxes are incurred upon disposition of certain foreign securities. Capital gains taxes on appreciated securities are accrued as unrealized losses and are reflected as realized losses upon the sale of the related
security. Currency taxes may be incurred when the Fund purchases certain foreign currencies related to securities transactions and are recorded as realized losses on foreign currency transactions.
Forward currency contracts A forward currency contract represents an obligation to purchase or sell a specific foreign currency at a future date at a price set at the time of the contract. Losses from these transactions may arise from unfavorable changes in currency values or if the counterparties do not perform under a contract’s terms.
The values of the forward currency contracts are adjusted daily based on the applicable exchange rate of the underlying currency. Changes in the value of open contracts are recorded as unrealized appreciation or depreciation in the Statement of Operations. When the forward currency contract is closed, the Fund records a realized gain or loss in the Statement of Operations equal to the difference between the value at the time the contract was opened and the value at the time it was closed.
During the year, the Fund maintained forward currency contracts to hedge foreign currency risks associated with portfolio investments denominated in Japanese Yen and Euro. These Japanese Yen and Euro forward currency contracts had U.S. dollar total values of less than 2% and 7% of net assets during the year, respectively.
Foreign currency translation The books and records of the Funds are maintained in U.S. dollars. Foreign currency amounts are translated into U.S. dollars at the prevailing exchange rates of such currencies against the U.S. dollar. The market value of investment securities and other assets and liabilities are translated at the exchange rate as of the valuation date. Purchases and sales of investment securities, income, and expenses are translated at the exchange rate prevailing on the transaction date.
Reported realized and unrealized gain (loss) on investments include foreign currency gain (loss) related to investment transactions.
Reported realized and unrealized gain (loss) on foreign currency transactions and translation include the
DODGE & COX INTERNATIONAL STOCK FUND §PAGE 12
NOTES TO FINANCIAL STATEMENTS
following: disposing/holding of foreign currency, the difference between the trade and settlement dates on securities transactions, the difference between the accrual and payment dates on dividends, and currency losses on the purchase of foreign currency in certain countries that impose taxes on such transactions.
Indemnification Under the Trust’s organizational documents, its officers and trustees are indemnified against certain liabilities arising out of the performance of their duties to the Trust. In addition, in the normal course of business the Trust enters into contracts that provide general indemnities to other parties. The Trust’s maximum exposure under these arrangements is unknown as this would involve future claims that may be made against the Trust that have not yet occurred.
NOTE 2—VALUATION MEASUREMENTS
Various inputs are used in determining the value of the Fund’s investments and other financial instruments. These inputs are summarized in the three broad levels listed below.
| § | | Level 1: Quoted prices in active markets for identical securities |
| § | | Level 2: Other significant observable inputs (including quoted prices for similar securities, market indices, interest rates, credit risk, etc.) |
| § | | Level 3: Significant unobservable inputs (including Fund management’s assumptions in determining the fair value of investments) |
The inputs or methodology used for valuing securities are not necessarily an indication of the risk associated with investing in those securities.
The following is a summary of the inputs used to value the Fund’s holdings as of December 31, 2013:
| | | | | | | | |
| Security Classification(a) | | LEVEL 1
(Quoted Prices) | | | LEVEL 2
(Other Significant
Observable Inputs) | |
Securities | | | | | | | | |
Common Stocks | | | | | | | | |
Consumer Discretionary | | $ | 6,705,152,263 | | | $ | — | |
Consumer Staples | | | 874,906,050 | | | | — | |
Energy | | | 3,099,289,201 | | | | — | |
Financials | | | 12,738,597,195 | | | | — | |
Health Care | | | 8,344,378,909 | | | | — | |
Industrials | | | 5,798,627,577 | | | | — | |
Information Technology | | | 7,959,655,116 | | | | — | |
Materials | | | 2,735,505,578 | | | | — | |
Telecommunication Services | | | 4,017,286,557 | | | | — | |
Preferred Stocks | | | | | | | | |
Energy | | | 608,694,840 | | | | — | |
Financials | | | 97,629,156 | | | | — | |
Information Technology | | | 72,950,206 | | | | — | |
Short-term Investments | | | | | | | | |
Money Market Fund | | | 53,536,173 | | | | — | |
Repurchase Agreement | | | — | | | | 532,003,000 | |
Treasury Bill | | | — | | | | 20,425,018 | |
| | | | | | | | |
Total Securities | | $ | 53,106,208,821 | | | $ | 552,428,018 | |
| | |
Other Financial Instruments | | | | | | | | |
Forward Currency Contracts | | $ | — | | | $ | (32,905,798 | )(b) |
| | | | | | | | | |
| (a) | Transfers during the year between Level 1 and Level 2 relate to the use of systematic fair valuation. On days when systematic fair valuation is used, securities whose primary market closes before the NYSE are classified as Level 2. There were no Level 3 securities at December 31, 2013 and 2012, and there were no transfers to Level 3 during the year. |
| (b) | Represents net unrealized depreciation on forward currency contracts. |
NOTE 3—ADDITIONAL DERIVATIVES INFORMATION
The Fund has entered into over-the-counter derivatives and foreign exchange transactions, such as forward currency contracts (collectively, the “Transactions”) governed by a master agreement published by the International Swaps and Derivatives Association (an “ISDA Master Agreement”). An ISDA Master Agreement, which the Fund separately negotiates with each of its counterparties, is a bilateral agreement that governs the Transactions and typically contains,
PAGE 13 § DODGE & COX INTERNATIONAL STOCK FUND
NOTES TO FINANCIAL STATEMENTS
among other things, collateral posting terms and termination and netting provisions that apply in the event of a default, such as the bankruptcy or insolvency of one of the parties to the agreement, and/or termination event (a “Close-Out Event”). These provisions typically permit a counterparty to: 1) terminate some or all of the Transactions upon the occurrence of a Close-Out Event; and 2) determine a single net payment owed to or by it in respect of the terminated Transactions.
The collateral requirements under an ISDA Master Agreement are typically calculated by netting the mark-to-market amount for all of the Transactions outstanding under such agreement, and comparing that amount to the value of any collateral currently pledged by the parties. None of the ISDA Master Agreements entered into by the Fund require collateral to be posted by either the Fund or the counterparty. To the extent amounts due to the Fund are not collateralized, the Fund bears the risk of loss from counterparty non-performance. The Fund attempts to mitigate its counterparty risk by only entering into Transactions with counterparties that it believes are of good standing and by monitoring the financial stability of those counterparties.
NOTE 4—RELATED PARTY TRANSACTIONS
Management fees Under a written agreement approved by a unanimous vote of the Board of Trustees, the Fund pays an annual management fee of 0.60% of the Fund’s average daily net assets to Dodge & Cox, investment manager of the Fund.
Fund officers and trustees All officers and three of the trustees of the Trust are officers or employees of Dodge & Cox. The Trust pays a fee only to those trustees who are not affiliated with Dodge & Cox.
NOTE 5—INCOME TAX INFORMATION AND DISTRIBUTIONS TO SHAREHOLDERS
A provision for federal income taxes is not required since the Fund intends to continue to qualify as a regulated investment company under Subchapter M of the Internal Revenue Code and distribute all of its taxable income to shareholders. Distributions are determined in accordance with income tax regulations, and such amounts may differ from net investment income and realized gains for financial reporting purposes.
Financial reporting records are adjusted for permanent book/tax differences at year end to reflect tax character.
Book/tax differences are primarily due to differing treatments of wash sales, net short-term realized gain (loss) on investments, investments in passive foreign investment companies, foreign capital gain taxes, and foreign currency realized gain (loss). At December 31, 2013, the cost of investments for federal income tax purposes was $44,929,104,102.
Distributions during the periods noted below were characterized as follows for federal income tax purposes.
| | | | | | | | |
| | | Year Ended December 31, 2013 | | | Year Ended
December 31, 2012 | |
Ordinary income | | | $852,149,250 | | | | $865,782,642 | |
| | | ($0.695 per share) | | | | ($0.747 per share) | |
| | |
Long-term capital gain | | | — | | | | — | |
At December 31, 2013, the tax basis components of distributable earnings were as follows:
| | | | |
Unrealized appreciation | | $ | 12,685,350,528 | |
Unrealized depreciation | | | (3,955,817,791 | ) |
| | | | |
Net unrealized appreciation | | | 8,729,532,737 | |
Undistributed ordinary income | | | 18,420,105 | |
Capital loss carryforward(a) | | | (5,344,990,635 | ) |
| (a) | Represents accumulated capital loss as of December 31, 2013, which may be carried forward to offset future capital gains. During 2013, the Fund utilized $1,154,962,358 of the capital loss carryforward. If not utilized, the remaining capital loss carryforward will expire as follows: |
| | | | |
Expiring in 2017 | | $ | 4,224,870,406 | |
Expiring in 2018 | | | 1,120,120,229 | |
| | | | |
| | $ | 5,344,990,635 | |
| | | | |
Under the Regulated Investment Company Modernization Act of 2010, capital losses incurred by the Fund after January 1, 2011, are not subject to expiration. In addition, such losses must be utilized prior to the losses incurred in the years preceding enactment.
Fund management has reviewed the tax positions for open periods (three years and four years, respectively, from filing the Fund’s Federal and State tax returns) as applicable to the Fund, and has determined that no provision for income tax is required in the Fund’s financial statements.
DODGE & COX INTERNATIONAL STOCK FUND §PAGE 14
NOTES TO FINANCIAL STATEMENTS
NOTE 6—LOAN FACILITIES
Pursuant to an exemptive order issued by the Securities and Exchange Commission (SEC), the Fund may participate in an interfund lending facility (Facility). The Facility allows the Fund to borrow money from or loan money to the Funds. Loans under the Facility are made for temporary or emergency purposes, such as to fund shareholder redemption requests. Interest on borrowings is the average of the current repurchase agreement rate and the bank loan rate. There was no activity in the Facility during the year.
All Funds in the Trust participate in a $500 million committed credit facility (Line of Credit) with State Street Bank and Trust Company, to be utilized for temporary or emergency purposes to fund shareholder redemptions or for other short-term liquidity purposes. The maximum amount available to the Fund is $250 million. Each Fund pays an annual commitment fee on its pro-rata portion of the Line of Credit. The Fund’s commitment fee for the year ended December 31, 2013, amounted to $154,614 and is reflected as a Miscellaneous Expense in the Statement of Operations. Interest on borrowings is charged at the prevailing rate. There were no borrowings on the Line of Credit during the year.
NOTE 7—PURCHASES AND SALES OF INVESTMENTS
For the year ended December 31, 2013, purchases and sales of securities, other than short-term securities, aggregated $8,874,139,631 and $5,878,622,390 respectively.
NOTE 8—ACCOUNTING PRONOUNCEMENTS
Effective January 1, 2013, the Fund adopted Accounting Standards Update (ASU) No. 2011-11, Balance Sheet (Topic 210): Disclosures about Offsetting Assets and Liabilities and ASU No. 2013-01, Balance Sheet (Topic 210): Clarifying the Scope of Disclosures about Offsetting Assets and Liabilities. These amendments to Topic 210 require enhanced disclosures about offsetting of financial assets and liabilities, including derivative instruments, to enable investors to understand the effect of these arrangements on a fund’s financial position. The financial statements have been modified to provide enhanced disclosures on the Fund’s counterparty exposure and master netting arrangements. These disclosures are included in Note 3—Additional Derivatives Information.
NOTE 9—SUBSEQUENT EVENTS
Fund management has determined that no material events or transactions occurred subsequent to December 31, 2013, and through the date of the Fund’s financial statements issuance, which require additional disclosure in the Fund’s financial statements.
PAGE 15 § DODGE & COX INTERNATIONAL STOCK FUND
NOTES TO FINANCIAL STATEMENTS
NOTE 10—HOLDINGS OF 5% VOTING SECURITIES
Each of the companies listed below was considered to be an affiliate of the Fund because the Fund owned 5% or more of the company’s voting securities during all or part of the year ended December 31, 2013. Purchase and sale transactions and dividend income earned during the period on these securities were as follows:
| | | | | | | | | | | | | | | | | | | | | | | | |
| | | Shares at
Beginning of Period | | | Additions | | | Reductions | | | Shares at
End of Period | | | Dividend
Income(a) | | | Value at
End of Period | |
BR Malls Participacoes SA (Brazil) | | | 14,789,100 | | | | 31,635,000 | | | | — | | | | 46,424,100 | | | $ | 3,656,551 | | | $ | 335,501,073 | |
Brother Industries, Ltd. (Japan) | | | 22,885,100 | | | | — | | | | (4,700,000 | ) | | | 18,185,100 | | | | 4,917,469 | | | | 248,143,469 | |
Corporacion Geo SAB de CV,
Series B (Mexico) | | | 50,305,400 | | | | — | | | | (50,305,400 | ) | | | — | | | | — | (b) | | | — | |
Fujitsu, Ltd. (Japan) | | | 100,723,000 | | | | 2,800,000 | | | | — | | | | 103,523,000 | | | | — | (b) | | | 534,768,892 | |
Hang Lung Group, Ltd. (Hong Kong) | | | 51,625,500 | | | | 17,000,000 | | | | — | | | | 68,625,500 | | | | 5,471,506 | | | | 347,804,721 | |
Infineon Technologies AG (Germany) | | | 66,288,456 | | | | — | | | | (2,500,000 | ) | | | 63,788,456 | | | | 10,328,267 | | | | 680,969,013 | |
Lafarge SA (France) | | | 21,344,291 | | | | — | | | | (2,030,000 | ) | | | 19,314,291 | | | | 23,264,269 | | | | 1,447,303,740 | |
Lanxess AG (Germany) | | | 4,299,784 | | | | — | | | | (857,804 | ) | | | 3,441,980 | | | | 3,783,056 | | | | — | (c) |
Millicom International Cellular SA SDR (Luxembourg) | | | 4,427,494 | | | | 2,153,386 | | | | — | | | | 6,580,880 | | | | 12,368,462 | | | | 655,340,787 | |
Mitsubishi Electric Corp. (Japan) | | | 102,589,800 | | | | 7,150,000 | | | | (11,500,000 | ) | | | 98,239,800 | | | | 12,263,866 | | | | — | (c) |
Naspers, Ltd. (South Africa) | | | 25,160,895 | | | | 200,000 | | | | (5,200,000 | ) | | | 20,160,895 | | | | 7,996,209 | | | | — | (c) |
Nexans SA (France) | | | 1,690,258 | | | | 706,290 | | | | (330,812 | ) | | | 2,065,736 | | | | 921,224 | | | | — | (c) |
NGK Spark Plug Co., Ltd. (Japan) | | | 16,720,000 | | | | — | | | | — | | | | 16,720,000 | | | | 3,849,775 | | | | 395,335,676 | |
Nidec Corp. (Japan) | | | 4,674,200 | | | | 2,616,300 | | | | — | | | | 7,290,500 | | | | 5,748,702 | | | | 713,058,114 | |
Television Broadcasts, Ltd. (Hong Kong) | | | 34,015,100 | | | | 5,279,500 | | | | (1,698,200 | ) | | | 37,596,400 | | | | 11,031,770 | | | | 250,665,293 | |
Wienerberger AG (Austria) | | | 12,250,041 | | | | 1,873,794 | | | | (938,806 | ) | | | 13,185,029 | | | | 1,860,862 | | | | 209,047,781 | |
Yamaha Motor Co., Ltd. (Japan) | | | 30,430,000 | | | | — | | | | (1,578,900 | ) | | | 28,851,100 | | | | 5,366,060 | | | | 432,040,497 | |
| | | | | | | | | | | | | | | | | | | | | | | | |
| | | | | | | | | | | | | | | | | | $ | 112,828,048 | | | $ | 6,249,979,056 | |
| | | | | | | | | | | | | | | | | | | | | | | | |
| | | | | | | | | | | | | | | | | | | | | | | | | |
| (a) | Net of foreign taxes, if any |
| (c) | Company was not an affiliate at period end |
FINANCIAL HIGHLIGHTS
| | | | | | | | | | | | | | | | | | | | |
SELECTED DATA AND RATIOS (for a share outstanding throughout each year) | | Year Ended December 31, | |
| | | 2013 | | | 2012 | | | 2011 | | | 2010 | | | 2009 | |
| | | | |
Net asset value, beginning of year | | | $34.64 | | | | $29.24 | | | | $35.71 | | | | $31.85 | | | | $21.90 | |
Income from investment operations: | | | | | | | | | | | | | | | | | | | | |
Net investment income | | | 0.70 | | | | 0.76 | | | | 0.78 | | | | 0.51 | | | | 0.41 | |
Net realized and unrealized gain (loss) | | | 8.40 | | | | 5.39 | | | | (6.49 | ) | | | 3.85 | | | | 9.98 | |
| | | | |
Total from investment operations | | | 9.10 | | | | 6.15 | | | | (5.71 | ) | | | 4.36 | | | | 10.39 | |
| | | | |
Distributions to shareholders from: | | | | | | | | | | | | | | | | | | | | |
Net investment income | | | (0.70 | ) | | | (0.75 | ) | | | (0.76 | ) | | | (0.50 | ) | | | (0.44 | ) |
Net realized gain | | | — | | | | — | | | | — | | | | — | | | | — | |
| | | | |
Total distributions | | | (0.70 | ) | | | (0.75 | ) | | | (0.76 | ) | | | (0.50 | ) | | | (0.44 | ) |
| | | | |
Net asset value, end of year | | | $43.04 | | | | $34.64 | | | | $29.24 | | | | $35.71 | | | | $31.85 | |
| | | | |
Total return | | | 26.31 | % | | | 21.03 | % | | | (15.97 | )% | | | 13.69 | % | | | 47.46 | % |
Ratios/supplemental data: | | | | | | | | | | | | | | | | | | | | |
Net assets, end of year (millions) | | | $53,616 | | | | $40,556 | | | | $35,924 | | | | $43,406 | | | | $36,748 | |
Ratio of expenses to average net assets | | | 0.64 | % | | | 0.64 | % | | | 0.64 | % | | | 0.65 | % | | | 0.65 | % |
Ratio of net investment income to average net assets | | | 1.85 | % | | | 2.31 | % | | | 2.23 | % | | | 1.58 | % | | | 1.58 | % |
Portfolio turnover rate | | | 13 | % | | | 10 | % | | | 16 | % | | | 15 | % | | | 21 | % |
See accompanying Notes to Financial Statements
DODGE & COX INTERNATIONAL STOCK FUND §PAGE 16
REPORT OF INDEPENDENT REGISTERED PUBLIC ACCOUNTING FIRM
To the Trustees of Dodge & Cox Funds and Shareholders of Dodge & Cox International Stock Fund
In our opinion, the accompanying statement of assets and liabilities, including the portfolio of investments, and the related statements of operations and of changes in net assets and the financial highlights present fairly, in all material respects, the financial position of Dodge & Cox International Stock Fund (the “Fund”, one of the series constituting Dodge & Cox Funds) at December 31, 2013, the results of its operations for the year then ended, the changes in its net assets for each of the two years in the period then ended and the financial highlights for each of the five years in the period then ended, in conformity with accounting principles generally accepted in the United States of America. These financial statements and financial highlights (hereafter referred to as “financial statements”) are the responsibility of the Fund’s management; our responsibility is to express an opinion on these financial statements based on our audits. We conducted our audits of these financial statements in accordance with the standards of the Public Company Accounting Oversight Board (United States). Those standards require that we plan and perform the audit to obtain reasonable assurance about whether the financial statements are free of material misstatement. An audit includes examining, on a test basis, evidence supporting the amounts and disclosures in the financial statements, assessing the accounting principles used and significant estimates made by management, and evaluating the overall financial statement presentation. We believe that our audits, which included confirmation of securities at December 31, 2013, by correspondence with the custodian and brokers, provide a reasonable basis for our opinion.
PricewaterhouseCoopers LLP
San Francisco, California
February 25, 2014
PAGE 17 § DODGE & COX INTERNATIONAL STOCK FUND
SPECIAL 2013 TAX INFORMATION
(unaudited)
The following information is provided pursuant to provisions of the Internal Revenue Code:
In 2013, the Fund elected to pass through to shareholders foreign source income of $1,205,124,657 and foreign taxes paid of $81,171,449.
The Fund designates up to a maximum of $1,206,580,591 of its distributions paid to shareholders in 2013 as qualified dividends (treated for federal income tax purposes in the hands of shareholders as taxable at a maximum rate of 20%).
For shareholders that are corporations, the Fund designates 3% of its ordinary dividends paid to shareholders in 2013 as dividends from domestic corporations eligible for the corporate dividends received deduction, provided that the shareholder otherwise satisfies applicable requirements to claim that deduction.
BOARD APPROVAL OF FUNDS’ INVESTMENT MANAGEMENT AGREEMENTS AND MANAGEMENT FEES
(unaudited)
The Board of Trustees is responsible for overseeing the performance of the Dodge & Cox Funds’ investment manager and determining whether to continue the Investment Management Agreements between the Funds and Dodge & Cox each year (the “Agreements”). At a meeting of the Board of Trustees of the Trust held on December 17, 2013, the Trustees, by a unanimous vote (including a separate vote of those Trustees who are not “interested persons” (as defined in the Investment Company Act of 1940) (the “Independent Trustees”)), approved the renewal of the Agreements for an additional one-year term through December 31, 2014. During the course of the year, the Board received a wide variety of materials relating to the services provided by Dodge & Cox and the performance of each of the Funds.
INFORMATION RECEIVED
In advance of the meeting, the Board, including each of the Independent Trustees, requested, received, and reviewed materials relating to the Agreements and the services provided by Dodge & Cox. The Independent Trustees retained Morningstar® to prepare an independent
expense and performance summary for each Fund and comparable funds managed by other advisers identified by Morningstar. The Morningstar materials included information regarding advisory fee rates, expense ratios, and transfer agency, custodial, and distribution expenses, as well as appropriate performance comparisons to each Fund’s peer group and an index or combination of indices. The Morningstar materials also included a comparison of expenses of various share classes offered by comparable funds.
The materials reviewed by the Board contained information concerning, among other things, Dodge & Cox’s profitability, financial results and condition, advisory fee revenue, and separate account and sub-adviser fund fee schedules. The Board additionally considered the Funds’ brokerage commissions, turnover rates, sales and redemption data and the significant investment that Dodge & Cox makes in research used in managing the Funds. The Board received and reviewed a memorandum summarizing information provided throughout the year regarding Dodge & Cox’s services to the Funds as well as information regarding (i) the different fees, services, costs, and risks associated with other accounts managed by Dodge & Cox as compared to the Dodge & Cox Funds; (ii) the differences in performance between the Funds and separately managed accounts; and (iii) Fund shares subscription and redemption activity. Throughout the process of reviewing the services provided by Dodge & Cox and preparing for the meeting, the Independent Trustees found Dodge & Cox to be open, forthright, detailed, and very helpful in answering questions about all issues.
The Board received copies of the Agreements and a memorandum from the independent legal counsel to the Independent Trustees discussing the factors generally regarded as appropriate to consider in evaluating advisory arrangements. The Trust’s Contract Review Committee, consisting solely of Independent Trustees, met with the independent legal counsel on October 30, 2013, and again on December 17, 2013, to discuss whether to renew the Agreements. The Board, including the Independent Trustees, subsequently concluded that the existing Agreements are fair and reasonable and voted to approve the Agreements.
DODGE & COX INTERNATIONAL STOCK FUND §PAGE 18
In considering the Agreements, the Board, including the Independent Trustees, did not identify any single factor or particular information as all-important or controlling. In reaching the decision to approve the Agreements, the Board considered several factors, discussed below, to be key factors and reached the conclusions described below.
NATURE, QUALITY, AND EXTENT OF THE SERVICES
The Board considered that Dodge & Cox provides a wide range of services to the Funds in addition to portfolio management and that the quality of these services has been excellent in all respects. The extensive nature of services provided by Dodge & Cox has been documented in materials provided to the Board and in presentations made to the Board throughout the year. In particular, the Board considered the nature, quality, and extent of portfolio management, administrative, and shareholder services performed by Dodge & Cox. With regard to portfolio management services, the Board considered Dodge & Cox’s established long-term history of care and conscientiousness in the management of the Funds; its demonstrated consistency in investment approach and depth; the background and experience of the Dodge & Cox Investment Policy Committee, International Investment Policy Committee, Global Stock Investment Policy Committee, Fixed Income Investment Policy Committee, and research analysts responsible for managing the Funds; its methods for assessing the regulatory and investment climate in various jurisdictions; Dodge & Cox’s overall high level of attention to its core investment management function; and its commitment to the Funds and their shareholders.
In the area of administrative and shareholder services, the Board considered the excellent quality of Dodge & Cox’s work in areas such as compliance, legal services, trading, proxy voting, oversight of the Funds’ transfer agent and custodian, tax compliance, and shareholder communication through its website and other means. The Board also noted Dodge & Cox’s diligent disclosure policy, its favorable compliance record, and its reputation as a trusted, shareholder-friendly mutual fund family.
In addition, the Board considered that Dodge & Cox manages approximately $140 billion in Fund assets with fewer professionals than most comparable funds, and that on average these professionals have more experience and longer tenure than investment professionals at comparable funds. The Board also noted that Dodge & Cox is an investment research-oriented firm with no other business endeavors to distract management’s attention from its research efforts, and that its investment professionals adhere to a consistent investment approach across the Funds. The Board further considered the favorable stewardship and “Gold” analyst ratings awarded to each of the Funds by Morningstar. The Board concluded that it was satisfied with the nature, extent, and quality of investment management and other services provided to the Funds by Dodge & Cox.
INVESTMENT PERFORMANCE
The Board considered short-term and long-term investment performance for each Fund (including periods of out performance or underperformance) as compared to both relevant indices and the performance of such Fund’s peer group. The Board noted that each Fund demonstrated favorable short-term and longer-term performance relative to its benchmark and peer group. The Board determined after extensive review and inquiry that Dodge & Cox’s historic, long-term, team-oriented, bottom up investment approach remains consistent and that Dodge & Cox continues to be distinguished by its integrity, transparency, and independence.
The Board considered that the performance of the Funds is the result of a team-oriented investment management process that emphasizes a long-term investment horizon, comprehensive independent research, price discipline, and focus. The Board also considered that the investment performance delivered by Dodge & Cox to the Funds appeared to be consistent with the relevant performance delivered for other clients of Dodge & Cox. The Board concluded that Dodge & Cox has delivered favorable long-term performance for Fund investors consistent with the long-term investment strategies being pursued by the Funds.
PAGE 19 § DODGE & COX INTERNATIONAL STOCK FUND
COSTS AND ANCILLARY BENEFITS
Costs of Services to Funds: Fees and Expenses. The Board considered each Fund’s management fee rate and expense ratio relative to similar mutual funds and relative to management fees charged by Dodge & Cox to other clients. In particular, the Board considered that the Funds continue to be substantially below their peer group median in expense ratios and management fee rates and that many media and industry reports specifically comment on the low expense ratios of the Funds, which have been a defining characteristic of the Funds for many years. The Board also evaluated the operating structures of the Funds and Dodge & Cox, noting that the Funds do not charge front-end sales commissions or distribution fees, and Dodge & Cox bears, among other things, the significant cost of third party research, reimbursement for recordkeeping and administrative costs to third-party retirement plan administrators, and administrative and office overhead. The Board noted that expenses are well below industry averages. The Board also considered that the Funds receive numerous administrative, regulatory compliance, legal, technology and shareholder support services from Dodge & Cox without any additional administrative fee and the fact that the Funds have relatively low transaction costs and portfolio turnover rates. The Board reviewed Morningstar data showing that the few peer group funds with lower expense ratios often have other share classes with significantly higher expense ratios.
The Board reviewed information regarding the fee rates Dodge & Cox charges to separate accounts and sub-advised funds that have investment programs similar to those of the Funds, including instances where separate account and sub-advised fund fees are lower than Fund fees. The Board considered differences in the nature and scope of services Dodge & Cox provides to the Funds as compared to other client accounts, differences in regulatory, litigation, and other risks as between Dodge & Cox Funds and other types of clients, and certain characteristics of the market for institutional separate account management services. The Board further noted that, with respect to non-U.S. funds sponsored and managed by Dodge & Cox that are comparable to the Funds in many respects, the fee rates charged by Dodge & Cox are the same as or higher than the fee rates charged to the Funds. After consideration of these
matters, the Board concluded that the overall costs incurred by the Funds for the services they receive (including the management fee paid to Dodge & Cox) are reasonable and that the fees are acceptable based upon the qualifications, experience, reputation, and performance of Dodge & Cox and the low overall expense ratios of the Funds.
Profitability and Costs of Services to Dodge & Cox; “Fall-out” Benefits. The Board reviewed reports of Dodge & Cox’s financial position, profitability, and estimated overall value, and considered Dodge & Cox’s overall profitability within its context as a private, employee-owned S-Corporation and relative to the favorable services provided. The Board noted in particular that Dodge & Cox’s profits are not generated by high fee rates, but reflect an extraordinarily streamlined, efficient, and focused business approach toward investment management. The Board recognized the importance of Dodge & Cox’s profitability—which is derived solely from management fees and does not include other business ventures—to maintain its independence, stability, company culture and ethics, and management continuity. The Board also considered that the compensation/profit structure at Dodge & Cox is vital for remaining independent and facilitating retention of its management and investment professionals.
The Board considered potential “fall-out” benefits (including the receipt of research from unaffiliated brokers and reputational benefits to non-U.S. funds sponsored and managed by Dodge & Cox) that Dodge & Cox might receive as a result of its association with the Funds and determined that they are not significant. The Board also noted the extent of additional administrative services performed by Dodge & Cox for the Funds, and that the magnitude of costs and risks borne by Dodge & Cox in rendering advisory services to the Funds (including risks in the regulatory compliance, securities valuation, and investment management processes) are continuing to increase. The Board concluded that the profitability of Dodge & Cox’s relationship with the Funds (including fall-out benefits) was fair and reasonable.
THE BENEFIT OF ECONOMIES OF SCALE
The Board considered whether there have been economies of scale with respect to the management of each Fund, whether the Funds have appropriately
DODGE & COX INTERNATIONAL STOCK FUND §PAGE 20
benefited from any economies of scale, and whether the management fee rate is reasonable in relation to the Fund assets and any economies of scale that may exist. In the Board’s view, any consideration of economies of scale must take account of the Funds’ low fee structure and the considerable efficiencies of the Funds’ organization and fee structure that has been realized by shareholders from the time of each Fund’s inception (i.e., from the first dollar). The Board noted that Dodge & Cox has shared economies of scale by adding or enhancing services to the Funds over time, and that the internal costs of providing investment management, up-to-date technology, administrative, legal and compliance services to the Funds are continuing to increase. For example, Dodge & Cox has increased its global research staff and investment resources over the years to address the increased complexity of investing in multinational and non-U.S. companies. In addition, Dodge & Cox has made substantial expenditures in other staff and infrastructure to enable it to integrate credit and equity analyses and to be able to implement its strategy in a more effective and secure manner. The Board determined that the Funds provide access for small investors to high quality investment management at a relatively low cost. The Board’s decision to renew the Agreements was made after consideration of economies of scale and review of peer group fund expense ratios and historical expense ratio patterns for the Funds. The Board concluded that the current Dodge & Cox fee structure is fair and reasonable and adequately shares economies of scale that may exist.
CONCLUSION
Based on their evaluation of all material factors and assisted by the advice of independent legal counsel to the Independent Trustees, the Board, including the Independent Trustees, concluded that the advisory fee structure was fair and reasonable, that each Fund was paying a competitive fee for the services provided, that the scope and quality of Dodge & Cox’s services has provided substantial value for Fund shareholders over the
long term, and that approval of the Agreements was in the best interests of each Fund and its shareholders.
FUND HOLDINGS
The Fund provides a complete list of its holdings four times each fiscal year, as of the end of each quarter. The Fund files the lists with the Securities and Exchange Commission (SEC) on Form N-CSR (second and fourth quarters) and Form N-Q (first and third quarters). Shareholders may view the Fund’s Forms N-CSR and N-Q on the SEC’s website at www.sec.gov. Forms N-CSR and N-Q may also be reviewed and copied at the SEC’s Public Reference Room in Washington, DC. Information regarding the operations of the Public Reference Room may be obtained by calling 202-551-8090 (direct) or 800-732-0330 (general SEC number). A list of the Fund’s quarter-end holdings is also available at www.dodgeandcox.com on or about 15 days following each quarter end and remains available on the website until the list is updated in the subsequent quarter.
PROXY VOTING
For a free copy of the Fund’s proxy voting policies and procedures, please call 800-621-3979, visit the Fund’s website at www.dodgeandcox.com, or visit the SEC’s website at www.sec.gov. Information regarding how the Fund voted proxies relating to portfolio securities during the most recent 12-month period ending June 30 is also available at www.dodgeandcox.com or at www.sec.gov.
HOUSEHOLD MAILINGS
The Fund routinely mails shareholder reports and summary prospectuses to shareholders and, on occasion, proxy statements. In order to reduce the volume of mail, when possible, only one copy of these documents will be sent to shareholders who are part of the same family and share the same residential address.
If you have a direct account with the Funds and you do not want the mailing of shareholder reports and summary prospectuses combined with other members in your household, contact the Funds at 800-621-3979. Your request will be implemented within 30 days.
PAGE 21 § DODGE & COX INTERNATIONAL STOCK FUND
THIS PAGE INTENTIONALLY LEFT BLANK
DODGE & COX INTERNATIONAL STOCK FUND §PAGE 22
DODGE & COX FUNDS—EXECUTIVE OFFICER & TRUSTEE INFORMATION
| | | | | | |
Name (Age) and
Address* | | Position with Trust (Year of Election or
Appointment) | | Principal Occupation During Past 5 Years | | Other Directorships Held by Trustees |
| INTERESTED TRUSTEES AND OFFICERS |
| Kenneth E. Olivier (61) | | Chairman, President, and Trustee (Trustee since 2005) | | Chairman Emeritus (since 2013), Chairman (2011-2013), Chief Executive Officer (2010-2013), President (until 2011), and Director of Dodge & Cox; Portfolio Manager and member of Investment Policy Committee (IPC) (until 2013) | | — |
| Dana M. Emery (52) | | Senior Vice President and Trustee (Trustee since 1993) | | Chief Executive Officer (since 2013), President (since 2011), Executive Vice President (until March 2011), and Director of Dodge & Cox; Director of Fixed Income, Portfolio Manager, and member of Fixed Income Investment Policy Committee (FIIPC) | | — |
| John A. Gunn (70) | | Trustee (Trustee since 1985) | | Chairman Emeritus (2011-2013), Chairman (2007-2011), Chief Executive Officer (2007-2010), and Director of Dodge & Cox; Portfolio Manager and member of IPC, Global Stock Investment Policy Committee (GSIPC) (since 2008), and International Investment Policy Committee (IIPC) | | — |
| Charles F. Pohl (55) | | Senior Vice President (Officer since 2004) | | Chairman (since 2013), Co-President (2011-2013), Senior Vice President (until 2011), and Director of Dodge & Cox; Chief Investment Officer (since 2007), Portfolio Manager, Investment Analyst, and member of IPC, GSIPC, IIPC, and FIIPC | | — |
| Diana S. Strandberg (54) | | Senior Vice President (Officer since 2006) | | Senior Vice President (since 2011), Vice President (until 2011), and Director (since 2011) of Dodge & Cox; Director of International Equity (since 2009), Portfolio Manager, Investment Analyst, and member of IPC, GSIPC, and IIPC | | — |
| David H. Longhurst (56) | | Treasurer (Officer since 2006) | | Vice President and Assistant Treasurer of Dodge & Cox | | — |
| Thomas M. Mistele (60) | | Secretary (Officer since 1998) | | Chief Operating Officer, Director, Secretary, Senior Counsel (since 2011), and General Counsel (until 2011) of Dodge & Cox | | — |
| Katherine M. Primas (39) | | Chief Compliance Officer (Officer since 2009) | | Chief Compliance Officer of Dodge & Cox | | — |
| INDEPENDENT TRUSTEES |
| L. Dale Crandall (72) | | Trustee (Since 1999) | | President, Piedmont Corporate Advisors, Inc. (since 2003); President, Kaiser Foundation Health Plan, Inc. and Kaiser Foundation Hospitals (2000-2002); Senior Vice President—Finance and Administration & CFO, Kaiser Foundation Health Plan, Inc. and Kaiser Foundation Hospitals (1998-2000) | | Director, Ansell Limited (medical equipment and supplies) (since 2002); Bridgepoint Education, Inc. (education services) (since 2008); and Endurance International Group, Inc. (internet services) (since 2013) |
| Thomas A. Larsen (64) | | Trustee (Since 2002) | | Senior Counsel of Arnold & Porter LLP (law firm) (since 2013); Partner of Arnold & Porter LLP (since 2012); Director of Howard, Rice, Nemerovski, Canady, Falk & Rabkin (1977-2011) | | — |
| Ann Mather (53) | | Trustee (Since 2011) | | CFO, Pixar Animation Studios (1999-2004) | | Director, Google, Inc. (internet information services) (since 2005); Director, Glu Mobile, Inc. (multimedia software) (since 2005); Director, Netflix, Inc. (video services) (since 2010); Director, Shutterfly, Inc. (internet photography services/publishing) (since 2013); Director, Solazyme Inc. (renewable oils) (since 2011) |
| Robert B. Morris III (61) | | Trustee (Since 2011) | | Adviser to various financial services firms | | — |
| Gary Roughead (62) | | Trustee (Since 2013) | | Annenberg Distinguished Visiting Fellow, Hoover Institution (since 2011); Admiral, United States Navy (Ret.); U.S. Navy Chief of Naval Operations (2007-2011) | | Director, Northrop Grumman Corp. (global security) (since 2012) |
| John B. Taylor (67) | | Trustee (Since 2005) (and 1998-2001) | | Professor of Economics, Stanford University; Senior Fellow, Hoover Institution; Under Secretary for International Affairs, United States Treasury (2001-2005) | | — |
| * | | The address for each Officer and Trustee is 555 California Street, 40th Floor, San Francisco, California 94104. Each Officer and Trustee oversees all five series in the Dodge & Cox Funds complex and serves for an indefinite term. |
Additional information about the Trust’s Trustees and Officers is available in the Trust’s Statement of Additional Information (SAI). You can get a free copy of the SAI by visiting the Funds’ website at www.dodgeandcox.com or calling
800-621-3979.
PAGE 23 § DODGE & COX INTERNATIONAL STOCK FUND
| | | | |
| | | | |
www.dodgeandcox.com
For Fund literature, transactions, and account information, please visit the Funds’ website.
or write or call:
DODGE & COX FUNDS
c/o Boston Financial Data Services
P.O. Box 8422
Boston, Massachusetts 02266-8422
(800) 621-3979
INVESTMENT MANAGER
Dodge & Cox
555 California Street, 40th Floor
San Francisco, California 94104
(415) 981-1710
This report is submitted for the general information of the shareholders of the Fund. The report is not authorized for distribution to prospective investors in the Fund unless it is accompanied by a current prospectus.
This report reflects our views, opinions, and portfolio holdings as of December 31, 2013, the end of the reporting period. Any such views are subject to change at any time based upon market or other conditions and Dodge & Cox disclaims any responsibility to update such views. These views may not be relied on as investment advice and, because investment decisions for a Dodge & Cox Fund are based on numerous factors, may not be relied on as an indication of trading intent on behalf of any Dodge & Cox Fund.
12/13 BF AR Printed on recycled paper
Annual Report
December 31, 2013
Balanced Fund
ESTABLISHED 1931
TICKER: DODBX
TO OUR SHAREHOLDERS
The Dodge & Cox Balanced Fund had a total return of 14.0% for the six months ending December 31, 2013, compared to 9.8% for the Combined Index(a) (a 60/40 blend of stocks and fixed income securities). For 2013, the Fund had a total return of 28.4%, compared to 17.6% for the Combined Index. At year end, the Fund’s net assets of $14.4 billion were invested in 65.8% stocks, 29.3% fixed income securities, and 4.9% cash.
MARKET COMMENTARY
U.S. equity markets were exceptionally strong in 2013, rising to an all-time high on December 31. The S&P 500 (up 32%) had its best annual gain since 1997, with every sector of the market generating positive returns. Substantially higher valuations reflected both earnings growth and higher investor confidence in light of an improving economy. Recent economic statistics show that the economy is growing at a moderate pace, the job market is improving, and consumer wealth is continuing to increase as home prices and other assets trend higher. As a first step toward normalizing U.S. monetary policy, the U.S. Federal Reserve (the Fed) announced its intent to reduce its quantitative easing program in 2014. This action reflects the Fed’s assessment that the economy is continuing to make progress, but has further to go to reach “normal” conditions. Despite concerns about U.S. trade and budget deficits, we remain optimistic about the long-term prospects for corporate earnings growth.
In fixed income, price declines associated with substantially higher U.S. interest rates led to a -2.0% return for the broad U.S. bond market, its worst calendar-year return since 1994 and the first negative return since 1999. Stronger U.S. economic data contributed to higher U.S. Treasury yields, but Fed policy was the dominant source of interest rate volatility. The U.S. Treasury sector(b) was the worst-performing broad market sector with a -2.8% annual return. Other market segments performed better, but were still negative. Investment-grade corporate bonds posted a -1.5% return, while Agency-guaranteed(c) mortgage-backed securities (MBS) returned -1.4%.
INVESTMENT STRATEGY
We continue to set the Fund’s asset allocation based on our long-term outlook for the Fund’s equity and fixed income holdings, which currently favors equities. At quarter end, the Fund’s equity weighting was 65.8% due
to our view that the total return potential for equities is greater than that of investment-grade bonds. We reduced the overweight to equities by 7.1 percentage points during the year due to rising equity valuations and higher interest rates.
Equity Strategy
While U.S. equity market valuations have increased, we believe valuations are still reasonable. The S&P 500 traded at 17 times forward earnings at year end, compared to its 10-year historical average of 16 times.(d) The Fund’s equity portfolio of 70 holdings—valued at 14 times forward earnings—is trading at a meaningful discount to the S&P 500.
Utilizing our bottom-up research process, we believe we have selected holdings with attractive long-term prospects. We employ a consistent and disciplined approach that focuses on intensive fundamental research, a three- to five-year investment horizon, and strict price discipline. As a result of our individual security selection, the Fund is overweight key areas of the market we believe are particularly compelling, including Health Care (19.0% of the equity portfolio compared to 13.0% for the S&P 500) and Financials (23.2% of the equity portfolio compared to 16.2% for the S&P 500).
Health Care
Four of the nine new holdings purchased in the equity portfolio during 2013 were in the Health Care sector (Cigna, Express Scripts, Forest Laboratories, and UnitedHealth Group(e)). Health care services was a particular area of opportunity, as concerns over the implementation of the Affordable Care Act (ACA) lowered valuations and attracted our attention to several leading companies.
One such example is UnitedHealth, a diversified health care services company providing managed care, pharmacy benefit management, and other specialty products and services. The company faces significant ACA-related headwinds in its Medicare (reimbursement concerns) and commercial (e.g., loss of individual membership, changes of underwriting rules) segments. Nevertheless, we believe these challenges could be offset by Medicaid expansion and rapid growth in Optum, its diversified health care delivery and IT services division. We initiated a position in the company based on UnitedHealth’s valuation in relation to its market
PAGE 1 § DODGE & COX BALANCED FUND
leadership, innovative culture, and diversity of products, customers, and geographies. UnitedHealth (1.0% position) was the equity portfolio’s largest new purchase within the Health Care sector during 2013.
Financials
Within the Financials sector, the Fund has significant investments (14.3% of equity portfolio assets) in companies with a U.S. consumer banking focus (e.g., checking accounts, savings accounts, credit cards, home and personal loans). Capital One, Wells Fargo, and Bank of America are among the Fund’s largest positions within this category. While each company has diversified lines of business and derives its profitability from numerous customers, U.S. consumer banking has emerged as a dominant theme as a result of our bottom-up research process.
For each investment opportunity, we consider the balance between company fundamentals (what we are buying) and valuation (what we are paying). The higher the valuation, the stronger the company fundamentals must be for us to invest. Although U.S. consumer banks are trading broadly in-line with their historical discount to the market, we believe that the quality of bank earnings today is superior to the quality of earnings ten years ago. After several years of intense regulatory scrutiny, most banks now have higher capital, better liquidity, fewer competitors, and the ability to improve profitability. In our opinion, banks could enter a period of loan growth, expanding margins, and positive operating leverage, while maintaining charge-offs below historical levels. Lastly, cyclical factors could work in their favor.
Capital One (the equity portfolio’s second-largest position at 4.2%) is a consumer finance firm with credit card, auto lending, and banking businesses. The company has a strong franchise, attractive growth opportunities, and a disciplined management team with a solid track record and long-term focus. Capital One has grown market share while achieving high return on equity through its data analytics, which have led to sophisticated marketing and strong underwriting. Its acquisitions of ING Direct and HSBC’s credit card portfolio appear to be strategically sound. While regulatory reform could force changes in business practices that could adversely affect the industry, we believe Capital One—trading at 11 times forward earnings—is an attractive long-term investment opportunity.
Fixed Income Strategy
The fixed income portfolio delivered a small positive return in a very challenging market environment for bonds in 2013 but trailed equity returns by a substantial margin. Relative returns were quite strong, driven primarily by the fixed income portfolio’s shorter relative duration(f) and an overweight to corporates.
Corporate Focus: Pockets of Opportunity Despite Fuller Valuations
The fixed income portfolio’s allocation to corporate bonds declined during the year, with the overall weight reduced from 48% to 44%. Most of this reduction occurred in the Financial sector, where the weighting declined by 4% due to higher valuations (yield premiums for Financials are now below those of Industrials) and better opportunities elsewhere in the credit and Agency MBS markets. Away from Financials, the corporate weighting remained steady as we reduced weightings in rails and certain cyclical companies (e.g., Macy’s, Dow) offset by new investments in other companies, most notably Verizon.
2013’s strong (relative) performance in the corporate sector has raised valuations. Nevertheless, we believe a large weighting—and a significant overweight relative to the Barclays U.S. Aggregate—remains warranted. The economic environment continues to improve, creating a solid underpinning for already-strong corporate credit fundamentals. Valuations are reasonable, both in a historical context (yield premiums are close to long-term medians) and relative to the underlying strength of the issuers we hold in the fixed income portfolio. At the same time, we continue to be mindful of the risks inherent in corporate bond investing today, most notably event risk and releveraging risk, both of which could negatively affect the prospects for individual holdings.
Agency MBS: Cash Flow Stability and Attractive Return Prospects
Another area of emphasis and incremental change for the fixed income portfolio has been Agency MBS, which comprised 38% of the fixed income portfolio at year-end versus 30% of the Barclays U.S. Aggregate. The fixed income portfolio’s MBS differ markedly from those in the benchmark in that the Fund features MBS with lower relative interest rate exposure and higher current income.
As with corporates, we analyze MBS on an individual basis to assess the attractiveness of their total return prospects. A key part of this analysis is determining whether valuations provide adequate compensation for
DODGE & COX BALANCED FUND §PAGE 2
the attendant risks. For Agency MBS, the primary risk is from the variability of principal prepayments: receiving principal at an inopportune time (when rates are low and reinvestment occurs at these lower rates) or, conversely, having principal returned at a slower pace than expected (when rates are higher and reinvestment looks attractive). MBS investors must constantly balance the promised yield of an MBS and the potentially negative effects of prepayment risk to the security’s prospective return. In doing so, we focus on specific loan or borrower characteristics that might mitigate prepayment risk and, importantly, whose beneficial effects might not be fully appreciated (and therefore priced in) by the market. For example, we are attracted to higher coupon 15-year Agency MBS as their prepayment risk declines as loan balances amortize and the borrower’s potential refinancing savings decrease.
Defensively Positioned Regarding Interest Rate Risk
We have continued to position the fixed income portfolio with a shorter relative duration given our modestly positive outlook for continued U.S. and global economic growth and Treasury yields that remain below historical averages on a nominal and inflation-adjusted basis. Though we lengthened duration slightly in 2013—as absolute and real yields rose and as we identified attractive individual opportunities—the fixed income portfolio’s duration was 84% of the Barclays U.S. Aggregate’s at year end. U.S. growth is modest and we, like others, are concerned about the longer-term issues presented by structural changes in employment and other factors.
IN CLOSING
After an exceptionally strong year in 2013, our market outlook is more tempered than at the beginning of last year. Acknowledging that markets can be volatile over the short term, we encourage our fellow shareholders to remain focused on the long term. In our opinion, the Fund’s equity portfolio, valued at a discount to the S&P 500, remains well positioned to benefit from long-term global growth opportunities. And the fixed income portfolio, with its defensive duration posture and higher yield than the Barclay’s U.S. Aggregate, is designed to weather further increases in interest rates that could reduce fixed income asset values.
Thank you for your continued confidence in our firm. As always, we welcome your comments and questions.
For the Board of Trustees,
| | |
| | 
|
Kenneth E. Olivier, Chairman and President | | Dana M. Emery, Senior Vice President |
January 30, 2014
| (a) | The Combined Index reflects an unmanaged portfolio (rebalanced monthly) of 60% of the S&P 500 Index, which is a market capitalization-weighted index of 500 large capitalization stocks commonly used to represent the U.S. equity market, and 40% of the Barclays U.S. Aggregate Bond Index (Barclays U.S. Agg), which is a widely recognized, unmanaged index of U.S. dollar-denominated, investment-grade, taxable fixed income securities. |
| (b) | Sector returns as calculated and reported by Barclays. |
| (c) | The U.S. Government does not guarantee the Fund’s shares, yield, or net asset value. The agency guarantee (by, for example, Ginnie Mae, Fannie Mae, or Freddie Mac) does not eliminate market risk. |
| (d) | Unless otherwise specified, all weightings and characteristics are as of December 31, 2013. |
| (e) | The use of specific examples does not imply that they are more attractive investments than the Fund’s other holdings. |
| (f) | Duration is a measure of a bond’s (or a bond portfolio’s) price sensitivity to changes in interest rates. |
Risks: The Fund is subject to stock market risk, meaning stocks in the Fund may decline in value for extended periods due to the financial prospects of individual companies, or due to general market and economic conditions. The Fund also invests in individual bonds whose yields and market values fluctuate, so that your investment may be worth more or less than its original cost. Bond investments are subject to interest rate risk, credit risk, and prepayment risk, all of which could have adverse effects on the value of the Fund. A low interest rate environment creates an elevated risk of future negative returns. Please read the prospectus and summary prospectus for specific details regarding the Fund’s risk profile.
PAGE 3 § DODGE & COX BALANCED FUND
ANNUAL PERFORMANCE REVIEW
The Fund outperformed the Combined Index by 10.8 percentage points in 2013. The Fund’s higher allocation to equities had a positive impact on relative results.
EQUITY PORTFOLIO
| | § | | The portfolio’s overweight position and holdings in the Information Technology sector (up 53% compared to up 29% for the S&P 500 sector) significantly contributed to results. Nokia (up 105%), Hewlett-Packard (up 101%), and Xerox (up 83%) were among the strongest contributors. | |
| | § | | Strong returns for the Fund’s holdings in the Financials sector (up 44% compared to up 36% for the S&P 500 sector) and a higher average weighting (23% versus 16%) helped results. | |
| | § | | Relative returns from holdings in the Telecommunication Services sector (up 95% compared to up 12% for the S&P 500 sector) contributed to results. Vodafone (up 64%) and Sprint (up 27% to date of merger with Softbank and up 71% post-merger) performed well. | |
| | § | | Relative returns from holdings in the Health Care sector (up 34% compared to up 41% for the S&P 500 sector) detracted from results. | |
FIXED INCOME PORTFOLIO
| | § | | The portfolio’s shorter relative duration (73% of the Barclays U.S. Agg’s duration) added to relative returns. | |
| | § | | Many of the portfolio’s corporate bond holdings performed well, including Dillard’s, HCA, Hewlett-Packard, SLM Corp., Sprint, Verizon (purchased in September), and Vulcan Materials. | |
| | § | | The portfolio’s large overweight position in the Financial Institutions sub-sector (nearly three times that of the Barclays U.S. Agg) added to relative returns, as did the higher weighting in corporate bonds (49% versus 22% for the Barclays U.S. Agg). | |
| | § | | While issue-specific performance was positive overall, certain holdings underperformed during the year, including AT&T, Cox Communications, Petrobras, Time Warner Cable, and Twenty-First Century Fox. | |
KEY CHARACTERISTICS OF DODGE & COX
Independent Organization
Dodge & Cox is one of the largest privately owned investment managers in the world. We remain committed to independence, with a goal of providing the highest quality investment management service to our existing clients.
Over 80 Years of Investment Experience
Dodge & Cox was founded in 1930. We have a stable and well-qualified team of investment professionals, most of whom have spent their entire careers at Dodge & Cox.
Experienced Investment Team
The Investment Policy Committee, which is the decision-making body for the equity portion of the Balanced Fund, is a nine-member committee with an average tenure at Dodge & Cox of 25 years. The Fixed Income Investment Policy Committee, which is the decision-making body for the Fixed Income portion of the Balanced Fund, is a ten-member committee with an average tenure of 18 years.
One Business with a Single Research Office
Dodge & Cox manages domestic, international, and global equity, fixed income, and balanced investments, operating from one office in San Francisco.
Consistent Investment Approach
Our team decision-making process involves thorough, bottom-up fundamental analysis of each investment.
Long-Term Focus and Low Expenses
We invest with a three- to five-year investment horizon, which has historically resulted in low turnover relative to our peers. We manage Funds that maintain low expense ratios.
DODGE & COX BALANCED FUND §PAGE 4
GROWTH OF $10,000 OVER 10 YEARS
FOR AN INVESTMENT MADE ON DECEMBER 31, 2003
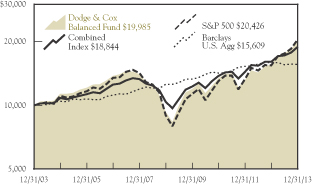
AVERAGE ANNUAL TOTAL RETURN
FOR PERIODS ENDED DECEMBER 31, 2013
| | | | | | | | | | | | | | | | |
| | | 1 Year | | | 5 Years | | | 10 Years | | | 20 Years | |
| | | | | | | | | | | | | | | | |
Dodge & Cox Balanced Fund | | | 28.37 | % | | | 16.57 | % | | | 7.18 | % | | | 9.93 | % |
Combined Index(a) | | | 17.56 | | | | 12.71 | | | | 6.54 | | | | 8.13 | |
S&P 500 | | | 32.41 | | | | 17.94 | | | | 7.41 | | | | 9.22 | |
Barclays U.S. Aggregate Bond Index (Barclays U.S. Agg) | | | -2.02 | | | | 4.46 | | | | 4.55 | | | | 5.74 | |
Returns represent past performance and do not guarantee future results. Investment return and share price will fluctuate with market conditions, and investors may have a gain or loss when shares are sold. Fund performance changes over time and currently may be significantly lower than stated. Performance is updated and published monthly. Visit the Fund’s website at www.dodgeandcox.com or call 800-621-3979 for current performance figures.
The Fund’s total returns include the reinvestment of dividend and capital gain distributions, but have not been adjusted for any income taxes payable by shareholders on these distributions or on Fund share redemptions. Index returns include dividends and/or interest income but, unlike Fund returns, do not reflect fees or expenses.
Standard & Poor’s, Standard & Poor’s 500, and S&P 500® are trademarks of McGraw Hill Financial. Barclays® is a trademark of Barclays Bank PLC.
| (a) | The Combined Index reflects an unmanaged portfolio (rebalanced monthly) of 60% of the S&P 500 Index, which is a market capitalization-weighted index of 500 large-capitalization stocks commonly used to represent the U.S. equity market, and 40% of the Barclays U.S. Aggregate Bond Index (Barclays U.S. Agg), which is a widely recognized, unmanaged index of U.S. dollar-denominated, investment-grade, taxable fixed income securities. The Fund may, however, invest up to 75% of its total assets in stocks. |
FUND EXPENSE EXAMPLE
As a Fund shareholder, you incur ongoing Fund costs, including management fees and other Fund expenses. All mutual funds have ongoing costs, sometimes referred to as operating expenses. The following example shows ongoing costs of investing in the Fund and can help you understand these costs and compare them with those of other mutual funds. The example assumes a $1,000 investment held for the six months indicated.
ACTUAL EXPENSES
The first line of the table below provides information about actual account values and expenses based on the Fund’s actual returns. You may use the information in this line, together with your account balance, to estimate the expenses that you paid over the period. Simply divide your account value by $1,000 (for example, an $8,600 account value divided by $1,000 = 8.6), then multiply the result by the number in the first line under the heading “Expenses Paid During Period” to estimate the expenses you paid on your account during this period.
HYPOTHETICAL EXAMPLE FOR COMPARISON WITH OTHER MUTUAL FUNDS
Information on the second line of the table can help you compare ongoing costs of investing in the Fund with those of other mutual funds. This information may not be used to estimate the actual ending account balance or expenses you paid during the period. The hypothetical “Ending Account Value” is based on the actual expense ratio of the Fund and an assumed 5% annual rate of return before expenses (not the Fund’s actual return). The amount under the heading “Expense Paid During the Period” shows the hypothetical expenses your account would have incurred under this scenario. You can compare this figure with the 5% hypothetical examples that appear in shareholder reports of other mutual funds.
| | | | | | | | | | | | |
Six Months Ended
December 31, 2013 | | Beginning Account Value
7/1/2013 | | | Ending Account Value
12/31/2013 | | | Expenses Paid
During Period* | |
Based on Actual Fund Return | | $ | 1,000.00 | | | $ | 1,140.10 | | | $ | 2.80 | |
Based on Hypothetical 5% Yearly Return | | | 1,000.00 | | | | 1,022.59 | | | | 2.64 | |
| * | | Expenses are equal to the Fund’s annualized expense ratio of 0.52%, multiplied by the average account value over the period, multiplied by 184/365 (to reflect the one-half year period). |
The expenses shown in the table highlight ongoing costs only and do not reflect any transactional fees or account maintenance fees. Though other mutual funds may charge such fees, please note that the Fund does not charge transaction fees (e.g., redemption fees, sales loads) or universal account maintenance fees (e.g., small account fees).
PAGE 5 § DODGE & COX BALANCED FUND
| | | | |
| FUND INFORMATION | | | December 31, 2013 | |
| | | | |
| GENERAL INFORMATION | | | |
Net Asset Value Per Share | | | $98.30 | |
Total Net Assets (billions) | | | $14.4 | |
30-Day SEC Yield(a) | | | 1.75% | |
Expense Ratio | | | 0.53% | |
Portfolio Turnover Rate | | | 25% | |
Fund Inception | | | 1931 | |
No sales charges or distribution fees | | | | |
Investment Manager: Dodge & Cox, San Francisco. Managed by the Investment Policy Committee, whose nine members’ average tenure at Dodge & Cox is 25 years, and by the Fixed Income Investment Policy Committee, whose ten members’ average tenure is 18 years.
| | | | |
| STOCK PORTFOLIO (65.8%) | | Fund | |
Number of Stocks | | | 70 | |
Median Market Capitalization (billions) | | | $36 | |
Price-to-Earnings Ratio(b) | | | 13.8x | |
Foreign Stocks not in the S&P 500(c) | | | 10.7% | |
| | | | |
| SECTOR DIVERSIFICATION(%) (FIVE LARGEST) | |
Financials | | | 15.3 | |
Information Technology | | | 14.8 | |
Health Care | | | 12.5 | |
Consumer Discretionary | | | 9.4 | |
Energy | | | 5.1 | |
| | | | |
| TEN LARGEST STOCKS(%)(d) | | | |
Hewlett-Packard Co. | | | 3.0 | |
Capital One Financial Corp. | | | 2.8 | |
Microsoft Corp. | | | 2.6 | |
Wells Fargo & Co. | | | 2.4 | |
Comcast Corp. | | | 2.3 | |
Sanofi (France) | | | 1.9 | |
Novartis AG (Switzerland) | | | 1.9 | |
General Electric Co. | | | 1.8 | |
Charles Schwab Corp. | | | 1.8 | |
Time Warner, Inc. | | | 1.8 | |
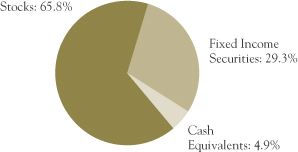
| | | | |
| FIXED INCOME PORTFOLIO (29.3%) | | Fund | |
Number of Fixed Income Securities | | | 331 | |
Effective Maturity (years)(e) | | | 8.1 | |
Effective Duration (years)(f) | | | 4.7 | |
| | | | |
| SECTOR DIVERSIFICATION(%) | | | |
U.S. Treasury(e) | | | 2.1 | |
Government-Related | | | 2.6 | |
Mortgage-Related | | | 11.2 | |
Corporate | | | 13.0 | |
Asset-Backed | | | 0.4 | |
| | | | |
| CREDIT QUALITY(%)(g) | | | |
U.S. Treasury/Agency/GSE(e) | | | 13.4 | |
Aaa | | | 0.5 | |
Aa | | | 0.6 | |
A | | | 3.3 | |
Baa | | | 8.0 | |
Ba | | | 2.8 | |
B | | | 0.7 | |
| | | | |
| FIVE LARGEST CORPORATE ISSUERS(%)(d) | | | |
Ford Motor Credit Co. LLC | | | 0.7 | |
Bank of America Corp. | | | 0.6 | |
Time Warner Cable, Inc. | | | 0.6 | |
Verizon Communications, Inc. | | | 0.6 | |
Citigroup, Inc. | | | 0.5 | |
| (a) | SEC Yield is an annualization of the Fund’s total net investment income per share for the 30-day period ended on the last day of the month. |
| (b) | Price-to-earnings (P/E) ratio is calculated using 12-month forward earnings estimates from third-party sources. |
| (c) | Foreign stocks are U.S. dollar denominated. |
| (d) | The Fund’s portfolio holdings are subject to change without notice. The mention of specific securities is not a recommendation to buy, sell, or hold any particular security and is not indicative of Dodge & Cox’s current or future trading activity. |
| (e) | Data as presented excludes the effect of the Fund’s short position in 10-year Treasury futures contracts (notional value = 0.5% of the Fund’s net assets). If exposure to Treasury futures contracts had been included, the effective maturity would be 0.1 years lower. |
| (f) | Data as presented includes the effect of Treasury futures contracts. |
| (g) | The credit quality distribution shown for the Fund is based on the middle of Moody’s, Standard & Poor’s, and Fitch ratings, which is the methodology used by Barclays in constructing its indices. If a security is rated by only two agencies, the lower of the two ratings is used. Please note the Fund applies the highest of Moody’s, Standard & Poor’s, and Fitch ratings to comply with the quality requirements stated in its prospectus. The credit quality of the investments in the portfolio does not apply to the stability or safety of the Fund or its shares. |
DODGE & COX BALANCED FUND §PAGE 6
| | | | |
| PORTFOLIO OF INVESTMENTS | | | December 31, 2013 | |
| | | | | | | | |
| COMMON STOCKS: 65.5% | | | | | | |
| | |
| | | SHARES | | | VALUE | |
| CONSUMER DISCRETIONARY: 9.1% | | | | | |
CONSUMER DURABLES & APPAREL: 0.9% | | | | | |
Coach, Inc. | | | 1,535,036 | | | $ | 86,161,571 | |
Panasonic Corp. ADR(b) (Japan) | | | 3,797,887 | | | | 44,283,362 | |
| | | | | | | | |
| | | | | | | 130,444,933 | |
MEDIA: 7.5% | | | | | | | | |
Comcast Corp., Class A | | | 6,379,774 | | | | 331,524,956 | |
DISH Network Corp., Class A(a) | | | 1,632,732 | | | | 94,567,837 | |
News Corp., Class A(a) | | | 928,050 | | | | 16,723,461 | |
Time Warner Cable, Inc. | | | 1,455,883 | | | | 197,272,146 | |
Time Warner, Inc. | | | 3,767,066 | | | | 262,639,842 | |
Twenty-First Century Fox, Inc. | | | 4,932,200 | | | | 173,514,796 | |
| | | | | | | | |
| | | | | | | 1,076,243,038 | |
RETAILING: 0.7% | | | | | | | | |
CarMax, Inc.(a) | | | 701,000 | | | | 32,961,020 | |
Liberty Interactive, Series A(a) | | | 2,309,650 | | | | 67,788,228 | |
| | | | | | | | |
| | | | | | | 100,749,248 | |
| | | | | | | | |
| | | | | | | 1,307,437,219 | |
| CONSUMER STAPLES: 1.2% | | | | | |
FOOD & STAPLES RETAILING: 1.0% | |
Wal-Mart Stores, Inc. | | | 1,951,900 | | | | 153,595,011 | |
| |
FOOD, BEVERAGE & TOBACCO: 0.2% | | | | | |
Unilever PLC ADR(b)
(United Kingdom) | | | 602,400 | | | | 24,818,880 | |
| | | | | | | | |
| | | | | | | 178,413,891 | |
| ENERGY: 5.1% | | | | | | | | |
Apache Corp. | | | 1,437,078 | | | | 123,502,483 | |
Baker Hughes, Inc. | | | 2,352,079 | | | | 129,975,886 | |
Chevron Corp. | | | 1,208,579 | | | | 150,963,603 | |
Schlumberger, Ltd.(b)
(Curacao/United States) | | | 2,901,521 | | | | 261,456,057 | |
Weatherford International, Ltd.(a),(b) (Switzerland) | | | 4,800,000 | | | | 74,352,000 | |
| | | | | | | | |
| | | | | | | 740,250,029 | |
| FINANCIALS: 15.3% | | | | | | | | |
BANKS: 3.7% | | | | | | | | |
BB&T Corp. | | | 1,839,584 | | | | 68,653,275 | |
HSBC Holdings PLC ADR(b)
(United Kingdom) | | | 970,561 | | | | 53,507,028 | |
SunTrust Banks, Inc. | | | 1,534,490 | | | | 56,484,577 | |
Wells Fargo & Co. | | | 7,768,506 | | | | 352,690,172 | |
| | | | | | | | |
| | | | | | | 531,335,052 | |
DIVERSIFIED FINANCIALS: 10.2% | | | | | | | | |
Bank of America Corp. | | | 13,615,600 | | | | 211,994,892 | |
Bank of New York Mellon Corp. | | | 6,639,800 | | | | 231,994,612 | |
Capital One Financial Corp. | | | 5,232,659 | | | | 400,874,006 | |
Charles Schwab Corp. | | | 10,199,900 | | | | 265,197,400 | |
Goldman Sachs Group, Inc. | | | 1,227,000 | | | | 217,498,020 | |
JPMorgan Chase & Co. | | | 1,449,900 | | | | 84,790,152 | |
McGraw-Hill Financial, Inc. | | | 651,971 | | | | 50,984,132 | |
| | | | | | | | |
| | | | | | | 1,463,333,214 | |
| | | | | | | | |
| | |
| | | SHARES | | | VALUE | |
INSURANCE: 1.4% | | | | | | | | |
AEGON NV(b) (Netherlands) | | | 11,900,794 | | | $ | 112,819,527 | |
MetlLife, Inc. | | | 1,750,000 | | | | 94,360,000 | |
| | | | | | | | |
| | | | | | | 207,179,527 | |
| | | | | | | | |
| | | | | | | 2,201,847,793 | |
| HEALTH CARE: 12.5% | | | | | | | | |
HEALTH CARE EQUIPMENT & SERVICES: 2.0% | |
Boston Scientific Corp.(a) | | | 3,991,300 | | | | 47,975,426 | |
Cigna Corp. | | | 506,216 | | | | 44,283,776 | |
Express Scripts Holding Co.(a) | | | 773,944 | | | | 54,361,826 | |
Medtronic, Inc. | | | 750,200 | | | | 43,053,978 | |
UnitedHealth Group, Inc. | | | 1,220,762 | | | | 91,923,379 | |
| | | | | | | | |
| | | | | | | 281,598,385 | |
|
PHARMACEUTICALS, BIOTECHNOLOGY & LIFE SCIENCES: 10.5% | |
Forest Laboratories, Inc.(a) | | | 833,325 | | | | 50,024,500 | |
GlaxoSmithKline PLC ADR(b)
(United Kingdom) | | | 4,910,600 | | | | 262,176,934 | |
Merck & Co., Inc. | | | 5,086,975 | | | | 254,603,099 | |
Novartis AG ADR(b) (Switzerland) | | | 3,374,900 | | | | 271,274,462 | |
Pfizer, Inc. | | | 6,586,217 | | | | 201,735,826 | |
Roche Holding AG ADR(b) (Switzerland) | | | 2,800,000 | | | | 196,560,000 | |
Sanofi ADR(b) (France) | | | 5,215,165 | | | | 279,689,299 | |
| | | | | | | | |
| | | | | | | 1,516,064,120 | |
| | | | | | | | |
| | | | | | | 1,797,662,505 | |
| INDUSTRIALS: 5.1% | | | | | | | | |
CAPITAL GOODS: 2.2% | | | | | | | | |
General Electric Co. | | | 9,472,200 | | | | 265,505,766 | |
Koninklijke Philips NV(b) (Netherlands) | | | 1,413,341 | | | | 52,251,217 | |
| | | | | | | | |
| | | | | | | 317,756,983 | |
COMMERCIAL & PROFESSIONAL SERVICES: 1.3% | |
ADT Corp. | | | 2,217,717 | | | | 89,751,007 | |
Tyco International, Ltd.(b) (Switzerland) | | | 2,295,434 | | | | 94,204,611 | |
| | | | | | | | |
| | | | | | | 183,955,618 | |
TRANSPORTATION: 1.6% | | | | | | | | |
FedEx Corp. | | | 1,602,954 | | | | 230,456,697 | |
| | | | | | | | |
| | | | | | | 732,169,298 | |
| INFORMATION TECHNOLOGY: 14.8% | |
SEMICONDUCTORS & SEMICONDUCTOR EQUIPMENT: 0.3% | |
Maxim Integrated Products, Inc. | | | 1,706,258 | | | | 47,621,661 | |
| | |
SOFTWARE & SERVICES: 7.7% | | | | | | | | |
Adobe Systems, Inc.(a) | | | 921,997 | | | | 55,209,180 | |
AOL, Inc.(a) | | | 689,074 | | | | 32,124,630 | |
Cadence Design Systems, Inc.(a) | | | 1,570,700 | | | | 22,021,214 | |
Computer Sciences Corp. | | | 801,032 | | | | 44,761,668 | |
eBay, Inc.(a) | | | 2,034,122 | | | | 111,652,957 | |
Google, Inc., Class A(a) | | | 138,000 | | | | 154,657,980 | |
| | |
| PAGE 7 § DODGE & COX BALANCED FUND | | See accompanying Notes to Financial Statements |
| | | | |
| PORTFOLIO OF INVESTMENTS | | | December 31, 2013 | |
| | | | | | | | |
| COMMON STOCKS (continued) | |
| | |
| | | SHARES | | | VALUE | |
Microsoft Corp. | | | 10,094,900 | | | $ | 377,852,107 | |
Symantec Corp. | | | 9,094,000 | | | | 214,436,520 | |
Synopsys, Inc.(a) | | | 2,376,100 | | | | 96,398,377 | |
| | | | | | | | |
| | | | | | | 1,109,114,633 | |
TECHNOLOGY, HARDWARE & EQUIPMENT: 6.8% | |
Corning, Inc. | | | 6,805,000 | | | | 121,265,100 | |
EMC Corp. | | | 333,700 | | | | 8,392,555 | |
Hewlett-Packard Co. | | | 15,311,412 | | | | 428,413,308 | |
NetApp, Inc. | | | 2,758,985 | | | | 113,504,643 | |
Nokia Corp. ADR(a),(b) (Finland) | | | 14,640,260 | | | | 118,732,509 | |
TE Connectivity, Ltd.(b) (Switzerland) | | | 2,570,536 | | | | 141,662,239 | |
Xerox Corp. | | | 3,974,950 | | | | 48,375,141 | |
| | | | | | | | |
| | | | | | | 980,345,495 | |
| | | | | | | | |
| | | | | | | 2,137,081,789 | |
| MATERIALS: 1.6% | | | | | | | | |
Celanese Corp., Series A | | | 1,825,960 | | | | 100,993,847 | |
Domtar Corp. | | | 133,391 | | | | 12,584,107 | |
Dow Chemical Co. | | | 1,610,754 | | | | 71,517,478 | |
Vulcan Materials Co. | | | 639,377 | | | | 37,991,781 | |
| | | | | | | | |
| | | | | | | 223,087,213 | |
| TELECOMMUNICATION SERVICES: 0.8% | |
Sprint Corp.(a) | | | 6,363,601 | | | | 68,408,711 | |
Vodafone Group PLC ADR(b)
(United Kingdom) | | | 1,126,398 | | | | 44,278,705 | |
| | | | | | | | |
| | | | | | | 112,687,416 | |
| | | | | | | | |
TOTAL COMMON STOCKS
(Cost $6,273,802,548) | | | | | | $ | 9,430,637,153 | |
| | |
| PREFERRED STOCKS: 0.3% | | | | | | |
| CONSUMER DISCRETIONARY: 0.3% | | | | | |
MEDIA: 0.3% | | | | | | | | |
NBC Universal Enterprise, Inc. 5.25%(d) | | | 52,610 | | | | 52,083,900 | |
| | | | | | | | |
TOTAL PREFERRED STOCKS
(Cost $52,617,082) | | | $ | 52,083,900 | |
|
| FIXED INCOME SECURITIES: 29.3% | |
| | |
| | | PAR VALUE | | | VALUE | |
| U.S. TREASURY: 2.1% | | | | | | | | |
U.S. Treasury Note | | | | | | | | |
0.25%, 1/31/14 | | $ | 119,075,000 | | | $ | 119,093,576 | |
0.25%, 2/28/14 | | | 135,000,000 | | | | 135,031,590 | |
0.125%, 7/31/14 | | | 50,000,000 | | | | 50,005,850 | |
| | | | | | | | |
| | | | | | | 304,131,016 | |
| | | | | | | | |
| | |
| | | PAR VALUE | | | VALUE | |
| GOVERNMENT-RELATED: 2.6% | | | | | |
FEDERAL AGENCY: 0.2% | | | | | | | | |
Arkansas Dev. Finance Authority
9.75%, 11/15/14 | | $ | 54,443 | | | $ | 55,416 | |
Small Business Admin. - 504 Program | | | | | |
Series 1996-20L 1, 6.70%, 12/1/16 | | | 277,864 | | | | 290,316 | |
Series 1997-20F 1, 7.20%, 6/1/17 | | | 429,897 | | | | 460,534 | |
Series 1997-20I 1, 6.90%, 9/1/17 | | | 712,583 | | | | 762,748 | |
Series 1998-20D 1, 6.15%, 4/1/18 | | | 686,005 | | | | 728,259 | |
Series 1998-20I 1, 6.00%, 9/1/18 | | | 578,340 | | | | 615,684 | |
Series 1999-20F 1, 6.80%, 6/1/19 | | | 495,806 | | | | 540,162 | |
Series 2000-20D 1, 7.47%, 4/1/20 | | | 1,746,040 | | | | 1,929,184 | |
Series 2000-20E 1, 8.03%, 5/1/20 | | | 782,906 | | | | 877,417 | |
Series 2000-20G 1, 7.39%, 7/1/20 | | | 1,149,003 | | | | 1,269,623 | |
Series 2000-20I 1, 7.21%, 9/1/20 | | | 853,576 | | | | 941,659 | |
Series 2001-20E 1, 6.34%, 5/1/21 | | | 1,947,998 | | | | 2,126,963 | |
Series 2001-20G 1, 6.625%, 7/1/21 | | | 1,918,169 | | | | 2,108,479 | |
Series 2003-20J 1, 4.92%, 10/1/23 | | | 6,469,822 | | | | 6,939,111 | |
Series 2007-20F 1, 5.71%, 6/1/27 | | | 5,689,226 | | | | 6,273,612 | |
| | | | | | | | |
| | | | | | | 25,919,167 | |
FOREIGN AGENCY: 0.6% | | | | | | | | |
Export-Import Bank of Korea(b) (South Korea) 4.00%, 1/11/17 | | | 15,000,000 | | | | 15,890,865 | |
Petroleo Brasileiro SA(b) (Brazil) | | | | | | | | |
5.375%, 1/27/21 | | | 38,035,000 | | | | 37,745,477 | |
4.375%, 5/20/23 | | | 29,800,000 | | | | 26,548,582 | |
| | | | | | | | |
| | | | | | | 80,184,924 | |
LOCAL AUTHORITY: 1.7% | | | | | | | | |
L.A. Unified School District GO
6.758%, 7/1/34 | | | 19,000,000 | | | | 23,353,660 | |
New Jersey Turnpike Authority RB | | | | | | | | |
7.414%, 1/1/40 | | | 3,350,000 | | | | 4,410,778 | |
7.102%, 1/1/41 | | | 22,436,000 | | | | 28,570,900 | |
State of California GO | | | | | | | | |
7.50%, 4/1/34 | | | 41,295,000 | | | | 52,687,052 | |
7.55%, 4/1/39 | | | 25,975,000 | | | | 33,597,883 | |
7.30%, 10/1/39 | | | 13,730,000 | | | | 17,259,983 | |
7.625%, 3/1/40 | | | 8,790,000 | | | | 11,496,177 | |
State of Illinois GO | | | | | | | | |
4.961%, 3/1/16 | | | 3,215,000 | | | | 3,422,335 | |
5.365%, 3/1/17 | | | 37,215,000 | | | | 40,387,579 | |
5.665%, 3/1/18 | | | 26,160,000 | | | | 28,487,717 | |
| | | | | | | | |
| | | | | | | 243,674,064 | |
SOVEREIGN: 0.1% | | | | | | | | |
Kingdom of Spain(b) (Spain)
4.00%, 3/6/18(d) | | | 18,350,000 | | | | 18,643,068 | |
| | | | | | | | |
| | | | | | | 368,421,223 | |
| | |
| See accompanying Notes to Financial Statements | | DODGE & COX BALANCED FUND §PAGE 8 |
| | | | |
| PORTFOLIO OF INVESTMENTS | | | December 31, 2013 | |
| | | | | | | | |
| FIXED INCOME SECURITIES (continued) | |
| | |
| | | PAR VALUE | | | VALUE | |
| MORTGAGE-RELATED: 11.2% | |
FEDERAL AGENCY CMO & REMIC: 3.0% | |
Dept. of Veterans Affairs | | | | | | | | |
Series 1995-1 1, 7.224%, 2/15/25 | | $ | 548,669 | | | $ | 622,182 | |
Series 1995-2C 3A, 8.793%, 6/15/25 | | | 241,526 | | | | 291,616 | |
Series 2002-1 2J, 6.50%, 8/15/31 | | | 14,261,009 | | | | 16,227,118 | |
Fannie Mae | | | | | | | | |
Trust 2001-T5 A3, 7.50%, 6/19/30 | | | 813,940 | | | | 960,016 | |
Trust 2002-33 A1, 7.00%, 6/25/32 | | | 2,618,775 | | | | 3,005,199 | |
Trust 2002-86 PE, 6.00%, 8/25/32 | | | 362,870 | | | | 365,728 | |
Trust 2005-W4 1A2, 6.50%, 8/25/35 | | | 9,667,813 | | | | 10,930,593 | |
Trust 2009-66 ET, 6.00%, 5/25/39 | | | 11,365,439 | | | | 12,222,166 | |
Trust 2009-30 AG, 6.50%, 5/25/39 | | | 6,177,682 | | | | 6,734,414 | |
Trust 2001-T7 A1, 7.50%, 2/25/41 | | | 2,260,994 | | | | 2,651,952 | |
Trust 2001-T4 A1, 7.50%, 7/25/41 | | | 2,137,206 | | | | 2,530,424 | |
Trust 2001-T8 A1, 7.50%, 7/25/41 | | | 2,157,036 | | | | 2,517,333 | |
Trust 2001-W3 A, 7.00%, 9/25/41 | | | 1,778,767 | | | | 2,032,101 | |
Trust 2001-T10 A2, 7.50%, 12/25/41 | | | 1,932,783 | | | | 2,251,682 | |
Trust 2013-106 MA, 4.00%, 2/25/42 | | | 15,852,018 | | | | 16,720,629 | |
Trust 2002-W6 2A1, 6.502%, 6/25/42 | | | 2,276,675 | | | | 2,641,455 | |
Trust 2002-W8 A2, 7.00%, 6/25/42 | | | 2,665,632 | | | | 3,089,326 | |
Trust 2003-W2 1A1, 6.50%, 7/25/42 | | | 4,369,224 | | | | 4,927,226 | |
Trust 2003-W2 1A2, 7.00%, 7/25/42 | | | 1,729,204 | | | | 1,979,507 | |
Trust 2003-W4 4A, 7.085%, 10/25/42 | | | 2,658,777 | | | | 3,052,072 | |
Trust 2012-121 NB, 7.00%, 11/25/42 | | | 5,180,310 | | | | 5,754,542 | |
Trust 2012-134 FK, 0.515%, 12/25/42 | | | 18,705,705 | | | | 18,505,367 | |
Trust 2013-15 FA, 0.515%, 3/25/43 | | | 26,657,668 | | | | 26,340,388 | |
Trust 2013-98 FA, 0.715%, 9/25/43 | | | 12,372,427 | | | | 12,368,332 | |
Trust 2013-92 FA, 0.715%, 9/25/43 | | | 53,056,868 | | | | 53,038,563 | |
Trust 2004-T1 1A2, 6.50%, 1/25/44 | | | 2,938,807 | | | | 3,323,270 | |
Trust 2004-W2 5A, 7.50%, 3/25/44 | | | 6,946,458 | | | | 8,126,327 | |
Trust 2004-W8 3A, 7.50%, 6/25/44 | | | 1,058,970 | | | | 1,231,913 | |
Trust 2009-11 MP, 7.00%, 3/25/49 | | | 15,063,232 | | | | 16,782,338 | |
Freddie Mac | | | | | | | | |
Series 1078 GZ, 6.50%, 5/15/21 | | | 288,510 | | | | 305,056 | |
Series 16 PK, 7.00%, 8/25/23 | | | 3,753,998 | | | | 4,247,172 | |
Series T-48 1A4, 5.538%, 7/25/33 | | | 39,453,158 | | | | 43,077,325 | |
Series 4240 FA, 0.667%, 8/15/43 | | | 11,950,854 | | | | 11,882,447 | |
Series 314 F2, 0.777%, 9/15/43 | | | 25,647,778 | | | | 25,642,055 | |
Series T-51 1A, 6.50%, 9/25/43 | | | 258,987 | | | | 293,818 | |
Series T-59 1A1, 6.50%, 10/25/43 | | | 14,058,985 | | | | 15,447,985 | |
Series 4281 BC, 6.876%, 12/15/43 | | | 76,760,905 | | | | 84,871,774 | |
| | | | | | | | |
| | | | | | | 426,991,411 | |
FEDERAL AGENCY MORTGAGE PASS-THROUGH: 8.2% | |
Fannie Mae, 15 Year | | | | | | | | |
4.00%, 2/1/27 | | | 57,162,337 | | | | 60,589,622 | |
4.50%, 1/1/25-1/1/27 | | | 33,328,952 | | | | 35,491,957 | |
6.00%, 7/1/16-3/1/22 | | | 10,247,643 | | | | 10,824,976 | |
6.50%, 12/1/14-11/1/18 | | | 11,650,161 | | | | 12,287,120 | |
7.00%, 11/1/18 | | | 907,363 | | | | 958,353 | |
7.50%, 9/1/15-8/1/17 | | | 3,951,964 | | | | 4,108,664 | |
Fannie Mae, 20 Year | | | | | | | | |
4.00%, 11/1/30-11/1/31 | | | 162,897,864 | | | | 169,634,632 | |
4.50%, 1/1/31-6/1/31 | | | 58,665,404 | | | | 62,776,358 | |
6.50%, 1/1/22-10/1/26 | | | 4,566,267 | | | | 5,128,399 | |
| | | | | | | | |
| | |
| | | PAR VALUE | | | VALUE | |
Fannie Mae, 30 Year | | | | | | | | |
5.50%, 7/1/33-8/1/37 | | $ | 31,735,304 | | | $ | 34,919,280 | |
6.00%, 9/1/36-3/1/40 | | | 52,605,354 | | | | 58,551,505 | |
6.50%, 12/1/28-8/1/39 | | | 65,127,556 | | | | 72,136,765 | |
7.00%, 4/1/37-8/1/37 | | | 16,828,383 | | | | 18,761,954 | |
Fannie Mae, Hybrid ARM | | | | | | | | |
1.916%, 1/1/35 | | | 4,836,797 | | | | 5,107,847 | |
2.051%, 12/1/34 | | | 3,043,350 | | | | 3,169,558 | |
2.13%, 9/1/34 | | | 2,894,771 | | | | 3,072,563 | |
2.329%, 8/1/35 | | | 2,617,476 | | | | 2,768,952 | |
2.487%, 1/1/35 | | | 2,189,816 | | | | 2,329,515 | |
2.967%, 8/1/38 | | | 6,438,655 | | | | 6,835,333 | |
3.324%, 6/1/41 | | | 31,925,354 | | | | 33,369,390 | |
3.603%, 12/1/40 | | | 8,367,831 | | | | 8,718,887 | |
3.698%, 11/1/40 | | | 3,744,800 | | | | 3,920,720 | |
4.257%, 7/1/39 | | | 5,389,413 | | | | 5,708,654 | |
5.617%, 5/1/37 | | | 3,522,367 | | | | 3,659,779 | |
6.308%, 9/1/36 | | | 934,839 | | | | 967,404 | |
Fannie Mae, Multifamily DUS | | | | | | | | |
Pool 735387, 4.909%, 4/1/15 | | | 5,131,298 | | | | 5,301,627 | |
Pool 461628, 5.32%, 4/1/14 | | | 1,418,576 | | | | 1,423,215 | |
Pool 462086, 5.355%, 11/1/15 | | | 17,751,609 | | | | 18,842,095 | |
Freddie Mac, Hybrid ARM | | | | | | | | |
2.33%, 4/1/37 | | | 3,529,853 | | | | 3,715,781 | |
2.711%, 5/1/34 | | | 3,946,438 | | | | 4,200,576 | |
2.94%, 2/1/38 | | | 8,589,414 | | | | 9,088,449 | |
3.568%, 10/1/38 | | | 4,269,837 | | | | 4,556,582 | |
3.628%, 10/1/41 | | | 3,265,191 | | | | 3,405,637 | |
5.326%, 10/1/35 | | | 6,400,919 | | | | 6,724,190 | |
5.834%, 7/1/38 | | | 1,209,133 | | | | 1,296,185 | |
6.033%, 9/1/37 | | | 2,077,898 | | | | 2,132,103 | |
6.101%, 1/1/38 | | | 1,476,399 | | | | 1,545,322 | |
Freddie Mac Gold, 15 Year | | | | | | | | |
4.00%, 3/1/25-11/1/26 | | | 82,146,421 | | | | 86,792,034 | |
4.50%, 9/1/24-9/1/26 | | | 24,038,237 | | | | 25,781,188 | |
6.00%, 2/1/18 | | | 1,377,117 | | | | 1,446,722 | |
6.50%, 7/1/14-9/1/18 | | | 5,696,553 | | | | 5,978,215 | |
7.00%, 4/1/15 | | | 19 | | | | 19 | |
Freddie Mac Gold, 20 Year | | | | | | | | |
4.50%, 4/1/31-6/1/31 | | | 20,156,068 | | | | 21,692,475 | |
5.00%, 11/1/25 | | | 20,830,758 | | | | 22,724,984 | |
6.50%, 10/1/26 | | | 8,296,085 | | | | 9,218,778 | |
Freddie Mac Gold, 30 Year | | | | | | | | |
4.50%, 9/1/41-3/1/42 | | | 141,817,472 | | | | 150,182,529 | |
5.50%, 11/1/37-3/1/41 | | | 88,875,523 | | | | 96,889,592 | |
6.00%, 9/1/37-3/1/40 | | | 34,503,608 | | | | 38,115,523 | |
6.50%, 12/1/32-4/1/33 | | | 12,377,395 | | | | 13,915,654 | |
7.00%, 11/1/37-9/1/38 | | | 14,978,362 | | | | 16,554,270 | |
7.47%, 3/17/23 | | | 143,313 | | | | 152,792 | |
7.75%, 7/25/21 | | | 547,777 | | | | 627,317 | |
Ginnie Mae, 30 Year | | | | | | | | |
7.50%, 11/15/24-10/15/25 | | | 1,469,335 | | | | 1,682,043 | |
7.97%, 4/15/20-1/15/21 | | | 745,096 | | | | 819,289 | |
| | | | | | | | |
| | | | | | | 1,180,603,373 | |
| | | | | | | | |
| | | | | | | 1,607,594,784 | |
| | |
| PAGE 9 § DODGE & COX BALANCED FUND | | See accompanying Notes to Financial Statements |
| | | | |
| PORTFOLIO OF INVESTMENTS | | | December 31, 2013 | |
| | | | | | | | |
| FIXED INCOME SECURITIES (continued) | |
| | |
| | | PAR VALUE | | | VALUE | |
| ASSET-BACKED: 0.4% | | | | | | | | |
CREDIT CARD: 0.3% | | | | | | | | |
Chase Issuance Trust Series 2012-A8,
0.54%, 10/16/17 | | $ | 41,753,000 | | | $ | 41,696,132 | |
| | |
STUDENT LOAN: 0.1% | | | | | | | | |
SLM Student Loan Trust Securities (Private Loans) | | | | | | | | |
Series 2012-E A2A,2.09%, 6/15/45(d) | | | 13,775,000 | | | | 13,578,872 | |
Series 2012-B A2, 3.48%, 10/15/30(d) | | | 9,725,000 | | | | 10,157,636 | |
| | | | | | | | |
| | | | | | | 23,736,508 | |
| | | | | | | | |
| | | | | | | 65,432,640 | |
| CORPORATE: 13.0% | | | | | | | | |
FINANCIALS: 4.7% | | | | | | | | |
Ally Financial, Inc.
4.50%, 2/11/14 | | | 43,330,000 | | | | 43,492,488 | |
American International Group, Inc.
4.25%, 9/15/14 | | | 4,750,000 | | | | 4,868,726 | |
Bank of America Corp. | | | | | | | | |
5.30%, 3/15/17 | | | 29,000,000 | | | | 31,964,438 | |
7.625%, 6/1/19 | | | 12,440,000 | | | | 15,429,668 | |
6.625%, 5/23/36(c) | | | 37,275,000 | | | | 40,049,676 | |
Boston Properties, Inc. | | | | | | | | |
5.625%, 4/15/15 | | | 5,900,000 | | | | 6,260,006 | |
5.875%, 10/15/19 | | | 7,960,000 | | | | 9,209,048 | |
5.625%, 11/15/20 | | | 3,850,000 | | | | 4,331,419 | |
3.85%, 2/1/23 | | | 7,800,000 | | | | 7,620,974 | |
3.125%, 9/1/23 | | | 15,725,000 | | | | 14,363,042 | |
3.80%, 2/1/24 | | | 6,400,000 | | | | 6,137,357 | |
Capital One Financial Corp. | | | | | | | | |
4.75%, 7/15/21 | | | 759,000 | | | | 807,082 | |
3.50%, 6/15/23 | | | 47,877,000 | | | | 44,942,523 | |
Cigna Corp. | | | | | | | | |
7.65%, 3/1/23 | | | 9,705,000 | | | | 11,730,278 | |
7.875%, 5/15/27 | | | 21,888,000 | | | | 27,184,705 | |
8.30%, 1/15/33 | | | 8,845,000 | | | | 10,615,548 | |
6.15%, 11/15/36 | | | 1,590,000 | | | | 1,791,728 | |
Citigroup, Inc. | | | | | | | | |
6.125%, 11/21/17 | | | 17,450,000 | | | | 20,114,772 | |
4.05%, 7/30/22 | | | 12,195,000 | | | | 12,059,111 | |
7.875%, 10/30/40(c) | | | 40,695,925 | | | | 44,194,147 | |
Equity Residential | | | | | | | | |
4.625%, 12/15/21 | | | 14,054,000 | | | | 14,816,542 | |
3.00%, 4/15/23 | | | 14,775,000 | | | | 13,491,658 | |
General Electric Co. | | | | | | | | |
5.50%, 1/8/20 | | | 25,095,000 | | | | 28,737,865 | |
4.375%, 9/16/20 | | | 8,475,000 | | | | 9,185,112 | |
4.625%, 1/7/21 | | | 5,750,000 | | | | 6,270,070 | |
4.65%, 10/17/21 | | | 9,825,000 | | | | 10,703,827 | |
Health Net, Inc.
6.375%, 6/1/17 | | | 13,275,000 | | | | 14,303,813 | |
| | | | | | | | |
| | |
| | | PAR VALUE | | | VALUE | |
HSBC Holdings PLC(b)
(United Kingdom) | | | | | | | | |
5.10%, 4/5/21 | | $ | 3,625,000 | | | $ | 4,029,003 | |
6.50%, 5/2/36 | | | 30,190,000 | | | | 35,761,021 | |
6.50%, 9/15/37 | | | 8,940,000 | | | | 10,573,660 | |
JPMorgan Chase & Co.
8.75%, 9/1/30(c) | | | 23,042,000 | | | | 29,527,171 | |
Legg Mason, Inc.
5.50%, 5/21/19 | | | 17,377,000 | | | | 19,051,105 | |
Royal Bank of Scotland PLC(b)
(United Kingdom) | | | | | | | | |
4.375%, 3/16/16 | | | 2,900,000 | | | | 3,094,851 | |
5.625%, 8/24/20 | | | 11,540,000 | | | | 12,919,284 | |
6.125%, 12/15/2 | | | 39,228,000 | | | | 40,091,055 | |
6.00%, 12/19/23 | | | 3,725,000 | | | | 3,751,522 | |
SLM Corp. | | | | | | | | |
3.875%, 9/10/15 | | | 7,625,000 | | | | 7,882,344 | |
6.00%, 1/25/17 | | | 14,285,000 | | | | 15,463,513 | |
4.625%, 9/25/17 | | | 3,900,000 | | | | 4,048,286 | |
8.45%, 6/15/18 | | | 11,855,000 | | | | 13,811,075 | |
Unum Group | | | | | | | | |
7.19%, 2/1/28 | | | 8,305,000 | | | | 9,077,144 | |
7.25%, 3/15/28 | | | 2,030,000 | | | | 2,334,167 | |
6.75%, 12/15/28 | | | 11,368,000 | | | | 12,550,806 | |
| | | | | | | | |
| | | | | | | 678,641,630 | |
INDUSTRIALS: 8.3% | | | | | | | | |
AT&T, Inc. | | | | | | | | |
6.55%, 2/15/39 | | | 7,675,000 | | | | 8,713,420 | |
5.35%, 9/1/40 | | | 26,250,000 | | | | 25,972,590 | |
Boston Scientific Corp. | | | | | | | | |
6.25%, 11/15/15 | | | 1,055,000 | | | | 1,152,340 | |
6.40%, 6/15/16 | | | 24,811,000 | | | | 27,670,741 | |
Burlington Northern Santa Fe LLC(f) | | | | | | | | |
8.251%, 1/15/21 | | | 849,264 | | | | 1,007,957 | |
4.967%, 4/1/23 | | | 8,095,740 | | | | 8,865,156 | |
5.72%, 1/15/24 | | | 10,753,587 | | | | 11,993,170 | |
5.342%, 4/1/24 | | | 11,461,319 | �� | | | 12,490,202 | |
5.629%, 4/1/24 | | | 17,755,791 | | | | 19,634,827 | |
Canadian Pacific Railway, Ltd.(b) (Canada)
5.75%, 1/15/42 | | | 4,850,000 | | | | 5,215,035 | |
Cemex SAB de CV(b) (Mexico)
6.50%, 12/10/19(d) | | | 17,500,000 | | | | 18,077,500 | |
Comcast Corp. | | | | | | | | |
6.30%, 11/15/17 | | | 5,865,000 | | | | 6,830,590 | |
5.875%, 2/15/18 | | | 4,475,000 | | | | 5,132,798 | |
6.45%, 3/15/37 | | | 4,998,000 | | | | 5,800,394 | |
6.95%, 8/15/37 | | | 1,700,000 | | | | 2,089,810 | |
Cox Communications, Inc. | | | | | | | | |
5.50%, 10/1/15 | | | 4,705,000 | | | | 5,050,258 | |
5.875%, 12/1/16(d) | | | 24,570,000 | | | | 27,349,014 | |
3.25%, 12/15/22(d) | | | 15,740,000 | | | | 14,242,874 | |
2.95%, 6/30/23(d) | | | 32,991,000 | | | | 28,828,888 | |
| | |
| See accompanying Notes to Financial Statements | | DODGE & COX BALANCED FUND §PAGE 10 |
| | | | |
| PORTFOLIO OF INVESTMENTS | | | December 31, 2013 | |
| | | | | | | | |
| FIXED INCOME SECURITIES (continued) | |
| | |
| | | PAR VALUE | | | VALUE | |
CSX Corp.
9.75%, 6/15/20 | | $ | 5,231,000 | | | $ | 7,008,619 | |
Dillard’s, Inc. | | | | | | | | |
7.13%, 8/1/18 | | | 3,606,000 | | | | 4,083,795 | |
7.875%, 1/1/23 | | | 8,660,000 | | | | 9,569,300 | |
7.75%, 7/15/26 | | | 50,000 | | | | 53,000 | |
7.75%, 5/15/27 | | | 540,000 | | | | 572,400 | |
7.00%, 12/1/28 | | | 15,135,000 | | | | 15,437,700 | |
Dow Chemical Co. | | | | | | | | |
8.55%, 5/15/19 | | | 21,553,000 | | | | 27,829,104 | |
7.375%, 11/1/29 | | | 15,330,000 | | | | 19,661,192 | |
9.40%, 5/15/39 | | | 6,127,000 | | | | 9,153,180 | |
Eaton Corp. PLC(b) (Ireland) | | | | | | | | |
1.50%, 11/2/17 | | | 2,885,000 | | | | 2,828,258 | |
2.75%, 11/2/22 | | | 7,500,000 | | | | 6,996,435 | |
Enel SPA(b) (Italy) | | | | | | | | |
6.80%, 9/15/37(d) | | | 14,100,000 | | | | 14,614,932 | |
6.00%, 10/7/39(d) | | | 2,500,000 | | | | 2,397,838 | |
8.75%, 9/24/73(d) | | | 8,100,000 | | | | 8,807,673 | |
FedEx Corp. | | | | | | | | |
8.00%, 1/15/19 | | | 6,965,000 | | | | 8,655,670 | |
6.72%, 7/15/23 | | | 11,868,172 | | | | 13,676,924 | |
Ford Motor Credit Co. LLC(f) | | | | | | | | |
5.625%, 9/15/15 | | | 19,250,000 | | | | 20,718,198 | |
8.125%, 1/15/20 | | | 8,320,000 | | | | 10,403,744 | |
5.75%, 2/1/21 | | | 35,625,000 | | | | 39,909,512 | |
5.875%, 8/2/21 | | | 11,350,000 | | | | 12,867,597 | |
4.25%, 9/20/22 | | | 9,593,000 | | | | 9,637,089 | |
4.375%, 8/6/23 | | | 3,775,000 | | | | 3,795,230 | |
HCA, Inc. | | | | | | | | |
5.75%, 3/15/14 | | | 200,000 | | | | 201,800 | |
6.375%, 1/15/15 | | | 10,375,000 | | | | 10,893,750 | |
6.50%, 2/15/16 | | | 43,180,000 | | | | 47,228,125 | |
Hewlett-Packard Co.
3.30%, 12/9/16 | | | 14,955,000 | | | | 15,652,292 | |
Lafarge SA(b) (France) | | | | | | | | |
6.20%, 7/9/15(d) | | | 4,600,000 | | | | 4,839,405 | |
6.50%, 7/15/16 | | | 35,915,000 | | | | 39,686,075 | |
Liberty Interactive Corp. | | | | | | | | |
8.50%, 7/15/29 | | | 9,462,000 | | | | 10,195,305 | |
8.25%, 2/1/30 | | | 7,291,000 | | | | 7,764,915 | |
Macy’s, Inc.
6.90%, 1/15/32 | | | 49,699,000 | | | | 56,216,744 | |
Naspers, Ltd.(b) (South Africa) 6.00%, 7/18/20(d) | | | 12,300,000 | | | | 13,401,911 | |
Norfolk Southern Corp.
9.75%, 6/15/20 | | | 7,224,000 | | | | 9,832,586 | |
Reed Elsevier PLC(b)
(United Kingdom) | | | | | | | | |
8.625%, 1/15/19 | | | 4,901,000 | | | | 6,144,477 | |
3.125%, 10/15/22 | | | 22,133,000 | | | | 20,467,580 | |
Sprint Corp.
6.00%, 12/1/16 | | | 15,150,000 | | | | 16,532,438 | |
| | | | | | | | |
| | |
| | | PAR VALUE | | | VALUE | |
Telecom Italia SPA(b) (Italy) | | | | | | | | |
6.175%, 6/18/14 | | $ | 3,678,000 | | | $ | 3,760,755 | |
6.999%, 6/4/18 | | | 17,100,000 | | | | 18,938,250 | |
7.175%, 6/18/19 | | | 25,427,000 | | | | 28,541,807 | |
7.20%, 7/18/36 | | | 6,050,000 | | | | 5,823,125 | |
7.721%, 6/4/38 | | | 1,000,000 | | | | 1,000,000 | |
Time Warner Cable, Inc. | | | | | | | | |
8.75%, 2/14/19 | | | 20,265,000 | | | | 24,172,943 | |
8.25%, 4/1/19 | | | 33,815,000 | | | | 39,614,442 | |
6.55%, 5/1/37 | | | 12,200,000 | | | | 11,289,307 | |
7.30%, 7/1/38 | | | 12,400,000 | | | | 12,365,020 | |
Time Warner, Inc. | | | | | | | | |
7.625%, 4/15/31 | | | 36,348,000 | | | | 46,000,793 | |
7.70%, 5/1/32 | | | 14,374,000 | | | | 18,455,799 | |
Twenty-First Century Fox, Inc. | | | | | | | | |
6.40%, 12/15/35 | | | 5,355,000 | | | | 6,087,318 | |
6.15%, 3/1/37 | | | 15,000,000 | | | | 16,486,335 | |
6.65%, 11/15/37 | | | 1,638,000 | | | | 1,911,975 | |
Union Pacific Corp. | | | | | | | | |
5.866%, 7/2/30 | | | 28,854,269 | | | | 32,247,243 | |
6.176%, 1/2/31 | | | 10,233,855 | | | | 11,661,490 | |
Verizon Communications, Inc. | | | | | | | | |
5.15%, 9/15/23 | | | 10,250,000 | | | | 11,005,343 | |
6.55%, 9/15/43 | | | 57,550,000 | | | | 67,331,140 | |
Vulcan Materials Co. | | | | | | | | |
6.50%, 12/1/16 | | | 5,250,000 | | | | 5,880,000 | |
7.50%, 6/15/21 | | | 13,905,000 | | | | 15,851,700 | |
Xerox Corp. | | | | | | | | |
6.35%, 5/15/18 | | | 28,585,000 | | | | 32,669,225 | |
5.625%, 12/15/19 | | | 13,665,000 | | | | 15,068,682 | |
4.50%, 5/15/21 | | | 27,476,000 | | | | 28,280,690 | |
| | | | | | | | |
| | | | | | | 1,198,295,739 | |
| | | | | | | | |
| | | | | | | 1,876,937,369 | |
| | | | | | | | |
TOTAL FIXED INCOME SECURITIES
(Cost $4,045,403,772) | | | $ | 4,222,517,032 | |
| | |
| PAGE 11 § DODGE & COX BALANCED FUND | | See accompanying Notes to Financial Statements |
| | | | |
| PORTFOLIO OF INVESTMENTS | | | December 31, 2013 | |
| | | | | | | | |
| SHORT-TERM INVESTMENTS: 5.6% | | | | |
| | |
| | | PAR VALUE | | | VALUE | |
MONEY MARKET FUND: 0.1% | | | | | |
SSgA U.S. Treasury Money
Market Fund | | $ | 14,359,007 | | | $ | 14,359,007 | |
| |
REPURCHASE AGREEMENT: 5.5% | | | | | |
Fixed Income Clearing Corporation(e) 0.00%, dated 12/31/13, due 1/2/14, maturity value $790,850,000 | | | 790,850,000 | | | | 790,850,000 | |
| | | | | | | | |
TOTAL SHORT-TERM INVESTMENTS
(Cost $805,209,007) | | | $ | 805,209,007 | |
| | |
TOTAL INVESTMENTS
(Cost $11,177,032,409) | | | 100.7 | % | | $ | 14,510,447,092 | |
OTHER ASSETS LESS LIABILITIES | | | (0.7 | %) | | | (106,521,986 | ) |
| | | | | | | | |
| NET ASSETS | | | 100.0 | % | | $ | 14,403,925,106 | |
| | | | | | | | |
| (b) | Security denominated in U.S. dollars |
| (c) | Cumulative preferred security |
| (d) | Security exempt from registration under Rule 144A of the Securities Act of 1933. The security may be resold in transactions exempt from registration, normally to qualified institutional buyers. As of December 31, 2013, all such securities in total represented $227,023,511 or 1.6% of net assets. These securities have been deemed liquid by Dodge & Cox, investment manager, pursuant to procedures approved by the Fund’s Board of Trustees. |
| (e) | Repurchase agreement is collateralized by U.S. Treasury Notes 1.00%-4.25%, 12/31/15-5/31/18. Total collateral value is $806,671,962. |
| (f) | Subsidiary (see below) |
In determining a company’s country designation, the Fund generally references the country of incorporation. In cases where the Fund considers the country of incorporation to be a “jurisdiction of convenience” chosen primarily for tax purposes, the Fund uses the country designation of an appropriate broad-based market index. In that circumstance, two countries are listed—the country of incorporation and the country designated by an appropriate index, respectively.
Fixed income securities are grouped by parent company unless otherwise noted. Actual securities may be issued by the listed parent company or one of its subsidiaries.
ADR: American Depositary Receipt
ARM: Adjustable Rate Mortgage
CMO: Collateralized Mortgage Obligation
DUS: Delegated Underwriting and Servicing
GO: General Obligation
RB: Revenue Bond
REMIC: Real Estate Mortgage Investment Conduit
FUTURES CONTRACTS
| | | | | | | | | | | | | | | | |
| Description | | Number of
Contracts | | | Expiration
Date | | | Notional
Amount | | | Unrealized
Appreciation | |
10 Year U.S. Treasury Note - Short Position | | | 622 | | | | Mar 2014 | | | $ | (76,535,156 | ) | | $ | 911,181 | |
| | |
| See accompanying Notes to Financial Statements | | DODGE & COX BALANCED FUND §PAGE 12 |
| | | | |
STATEMENT OF ASSETS AND LIABILITIES | |
| |
| | |
December 31, 2013 | |
ASSETS: | | | | |
Investments, at value (cost $11,177,032,409) | | $ | 14,510,447,092 | |
Cash held at broker | | | 917,478 | |
Receivable for investments sold | | | 28,505,617 | |
Receivable for Fund shares sold | | | 13,339,868 | |
Receivable from broker for futures variation margin | | | 106,903 | |
Dividends and interest receivable | | | 53,469,404 | |
Prepaid expenses and other assets | | | 78,317 | |
| | | | |
| | | 14,606,864,679 | |
| | | | |
LIABILITIES: | | | | |
Payable for investments purchased | | | 183,848,875 | |
Payable for Fund shares redeemed | | | 12,419,106 | |
Management fees payable | | | 6,024,539 | |
Accrued expenses | | | 647,053 | |
| | | | |
| | | 202,939,573 | |
| | | | |
NET ASSETS | | $ | 14,403,925,106 | |
| | | | |
NET ASSETS CONSIST OF: | | | | |
Paid in capital | | $ | 10,993,121,632 | |
Undistributed net investment income | | | 3,632,727 | |
Undistributed net realized gain | | | 72,843,782 | |
Net unrealized appreciation | | | 3,334,326,965 | |
| | | | |
| | $ | 14,403,925,106 | |
| | | | |
Fund shares outstanding (par value $0.01 each, unlimited shares authorized) | | | 146,528,052 | |
Net asset value per share | | $ | 98.30 | |
|
STATEMENT OF OPERATIONS | |
| |
| | | Year Ended
December 31, 2013 | |
INVESTMENT INCOME: | | | | |
Dividends (net of foreign taxes of $3,999,114) | | $ | 190,555,923 | |
Interest | | | 127,625,815 | |
| | | | |
| | | 318,181,738 | |
| | | | |
EXPENSES: | | | | |
Management fees | | | 66,981,438 | |
Custody and fund accounting fees | | | 303,654 | |
Transfer agent fees | | | 1,939,649 | |
Professional services | | | 238,488 | |
Shareholder reports | | | 229,910 | |
Registration fees | | | 140,758 | |
Trustees’ fees | | | 215,000 | |
Miscellaneous | | | 338,275 | |
| | | | |
| | | 70,387,172 | |
| | | | |
NET INVESTMENT INCOME | | | 247,794,566 | |
| | | | |
REALIZED AND UNREALIZED GAIN (LOSS): | |
Net realized gain | | | | |
Investments | | | 1,089,331,544 | |
Treasury futures contracts | | | 9,899,392 | |
Net change in unrealized appreciation/depreciation | | | | |
Investments | | | 1,976,657,915 | |
Treasury futures contracts | | | (705,233 | ) |
| | | | |
Net realized and unrealized gain | | | 3,075,183,618 | |
| | | | |
NET INCREASE IN NET ASSETS
FROM OPERATIONS | | $ | 3,322,978,184 | |
| | | | |
| | | | | | | | |
STATEMENT OF CHANGES IN NET ASSETS | |
| | |
| | | Year Ended
December 31, 2013 | | | Year Ended
December 31, 2012 | |
OPERATIONS: | | | | | | | | |
Net investment income | | $ | 247,794,566 | | | $ | 275,246,139 | |
Net realized gain | | | 1,099,230,936 | | | | 1,077,624,088 | |
Net change in unrealized appreciation/depreciation | | | 1,975,952,682 | | | | 746,295,668 | |
| | | | | | | | |
| | | 3,322,978,184 | | | | 2,099,165,895 | |
| | | | | | | | |
| |
DISTRIBUTIONS TO
SHAREHOLDERS FROM: | | | | | |
Net investment income | | | (246,397,862 | ) | | | (275,763,170 | ) |
Net realized gain | | | (9,642,637 | ) | | | — | |
| | | | | | | | |
Total distributions | | | (256,040,499 | ) | | | (275,763,170 | ) |
| | | | | | | | |
| | |
FUND SHARE
TRANSACTIONS: | | | | | | | | |
Proceeds from sale of shares | | | 1,558,477,176 | | | | 943,080,584 | |
Reinvestment of distributions | | | 242,306,286 | | | | 262,462,160 | |
Cost of shares redeemed | | | (2,681,100,500 | ) | | | (3,032,125,676 | ) |
| | | | | | | | |
Net decrease from Fund
share transactions | | | (880,317,038 | ) | | | (1,826,582,932 | ) |
| | | | | | | | |
Total increase in net assets | | | 2,186,620,647 | | | | (3,180,207 | ) |
| |
NET ASSETS: | | | | | |
Beginning of year | | | 12,217,304,459 | | | | 12,220,484,666 | |
| | | | | | | | |
End of year (including undistributed net investment income of $3,632,727 and $2,236,023, respectively) | | $ | 14,403,925,106 | | | $ | 12,217,304,459 | |
| | | | | | | | |
| |
SHARE INFORMATION: | | | | | |
Shares sold | | | 17,648,446 | | | | 12,767,972 | |
Distributions reinvested | | | 2,717,903 | | | | 3,526,509 | |
Shares redeemed | | | (30,347,088 | ) | | | (40,973,081 | ) |
| | | | | | | | |
Net decrease in shares outstanding | | | (9,980,739 | ) | | | (24,678,600 | ) |
| | | | | | | | |
| | |
| PAGE 13 § DODGE & COX BALANCED FUND | | See accompanying Notes to Financial Statements |
NOTES TO FINANCIAL STATEMENTS
NOTE 1—ORGANIZATION AND SIGNIFICANT ACCOUNTING POLICIES
Dodge & Cox Balanced Fund (the “Fund”) is one of the series constituting the Dodge & Cox Funds (the “Trust” or the “Funds”). The Trust is organized as a Delaware statutory trust and is registered under the Investment Company Act of 1940, as amended, as a diversified, open-end management investment company. The Fund commenced operations on June 26, 1931, and seeks regular income, conservation of principal, and an opportunity for long-term growth of principal and income. Risk considerations and investment strategies of the Fund are discussed in the Fund’s Prospectus.
The financial statements have been prepared in conformity with accounting principles generally accepted in the United States of America, which require the use of estimates and assumptions by management. Actual results may differ from those estimates. Significant accounting policies are as follows:
Security valuation The Fund’s net assets are valued as of the close of trading on the New York Stock Exchange (NYSE), generally 4:00 p.m. Eastern Time, each day that the NYSE is open for business. Portfolio securities and other financial instruments for which market quotes are readily available are valued at market value. Listed securities are generally valued using the official quoted close price or the last sale on the exchange that is determined to be the primary market for the security. Fixed income securities (including certain preferred stocks) are valued based on prices received from independent pricing services which utilize both dealer-supplied valuations and pricing models. Pricing models may consider quoted prices for similar securities, interest rates, prepayment speeds, and credit risk. Exchange-traded derivatives are valued at the settlement price determined by the relevant exchange. Security values are not discounted based on the size of the Fund’s position. Securities for which market quotations are not readily available are valued at fair value as determined in good faith by or under the direction of the Board of Trustees. Short-term securities less than 60 days to maturity may be valued at amortized cost if amortized cost approximates current value. All securities held by the Fund are denominated in U.S. dollars.
Security transactions, investment income, expenses, and distributions Security transactions are recorded on the trade date. Realized gains and losses on securities sold are determined on the basis of identified cost.
Dividend income and corporate action transactions are recorded on the ex-dividend date, or when the Fund first learns of the dividend/corporate action if the ex-dividend date has passed. Withholding taxes on foreign dividends have been provided for in accordance with the Fund’s understanding of the applicable country’s tax rules and rates. Non-cash dividends included in dividend income, if any, are recorded at the fair market value of the securities received. Dividends characterized as return of capital for U.S. tax purposes are recorded as a reduction of cost of investments and/or realized gain.
Interest income is recorded on the accrual basis. Interest income includes coupon interest, amortization of premium and accretion of discount on debt securities, and gain/loss on paydowns of mortgage-backed securities. The ability of the issuers of the debt securities held by the Fund to meet their obligations may be affected by economic developments in a specific industry, state, or region. Debt obligations may be placed on non-accrual status and related interest income may be reduced by ceasing current accruals and writing off interest receivables when the collection of all or a portion of interest has become doubtful. A debt obligation is removed from non-accrual status when the issuer resumes interest payments or when collectibility of interest is reasonably assured.
Expenses are recorded on the accrual basis. Most expenses of the Trust can be directly attributed to a specific series. Expenses which cannot be directly attributed are allocated among the Funds in the Trust based on relative net assets or other expense methodologies determined by the nature of the expense.
Distributions to shareholders are recorded on the ex-dividend date.
Repurchase agreements The Fund enters into repurchase agreements, secured by U.S. government or agency securities, which involve the purchase of securities from a counterparty with a simultaneous commitment to
DODGE & COX BALANCED FUND §PAGE 14
NOTES TO FINANCIAL STATEMENTS
resell the securities at an agreed-upon date and price. It is the Fund’s policy that its custodian take possession of the underlying collateral securities, the fair value of which exceeds the principal amount of the repurchase transaction, including accrued interest, at all times. In the event of default by the counterparty, the Fund has the contractual right to liquidate the collateral securities and to apply the proceeds in satisfaction of the obligation.
Treasury Futures Contracts Futures contracts involve an obligation to purchase or sell (depending on whether the Fund has entered a long or short futures contract, respectively) an asset at a future date, at a price set at the time of the contract. Upon entering into a futures contract, the Fund is required to deposit an amount of cash or liquid assets (referred to as initial margin) in a segregated account with the clearing broker. Subsequent payments (referred to as variation margin) to and from the clearing broker are made on a daily basis based on changes in the market value of futures contracts. Futures are traded publicly and their market value changes daily. Changes in the market value of open futures contracts are recorded as unrealized appreciation or depreciation in the Statement of Operations. Realized gains and losses on futures contracts are recorded in the Statement of Operations at the closing or expiration of futures contracts. Cash deposited with a broker as initial margin is recorded on the Statement of Assets and Liabilities. A receivable and/or payable to brokers for daily variation margin is also recorded on the Statement of Assets and Liabilities.
Investments in futures contracts may include certain risks, which may be different from, and potentially greater than, those of the underlying securities. To the extent the Fund uses Treasury futures, it is exposed to additional volatility and potential losses resulting from leverage.
The Fund has entered into short Treasury futures contracts to assist with the management of the portfolio’s interest rate exposure. During the year ended December 31, 2013, the Fund remained consistently invested in short Treasury futures contracts. These Treasury futures contracts had notional values ranging from 0.1% to 4% of net assets.
Indemnification Under the Trust’s organizational documents, its officers and trustees are indemnified against certain liabilities arising out of the performance of their duties to the Trust. In addition, in the normal course of business the Trust enters into contracts that provide general indemnities to other parties. The Trust’s maximum exposure under these arrangements is unknown as this would involve future claims that may be made against the Trust that have not yet occurred.
NOTE 2—VALUATION MEASUREMENTS
Various inputs are used in determining the value of the Fund’s investments. These inputs are summarized in the three broad levels listed below.
| § | | Level 1: Quoted prices in active markets for identical securities |
| § | | Level 2: Other significant observable inputs (including quoted prices for similar securities, market indices, interest rates, credit risk, etc.) |
| § | | Level 3: Significant unobservable inputs (including Fund management’s assumptions in determining the fair value of investments) |
The inputs or methodology used for valuing securities are not necessarily an indication of the risk associated with investing in those securities.
PAGE 15 § DODGE & COX BALANCED FUND
NOTES TO FINANCIAL STATEMENTS
The following is a summary of the inputs used to value the Fund’s holdings as of December 31, 2013:
| | | | | | | | |
| Classification(a) | | LEVEL 1
(Quoted Prices) | | | LEVEL 2
(Other Significant
Observable Inputs) | |
Securities | | | | | | | | |
Common Stocks(b) | | $ | 9,430,637,153 | | | $ | — | |
Preferred Stocks | | | — | | | | 52,083,900 | |
Fixed Income Securities | | | | | | | | |
U.S. Treasury | | | 304,131,016 | | | | — | |
Government-Related
| | | — | | | | 368,421,223 | |
Mortgage-Related | | | — | | | | 1,607,594,784 | |
Asset-Backed | | | — | | | | 65,432,640 | |
Corporate | | | — | | | | 1,876,937,369 | |
Short-term Investments | | | | | | | | |
Money Market Fund | | | 14,359,007 | | | | — | |
Repurchase Agreement | | | — | | | | 790,850,000 | |
| | | | | | | | |
| | | | | | | | |
Total Securities | | $ | 9,749,127,176 | | | $ | 4,761,319,916 | |
| | | | | | | | |
Other Financial Instruments | | | | | | | | |
Treasury Futures Contracts | | $ | 911,181 | (c) | | $ | — | |
| | | | | | | | | |
| (a) | There were no transfers between Level 1 and Level 2 during the year ended December 31, 2013. There were no Level 3 securities at December 31, 2013 and 2012, and there were no transfers to Level 3 during the year. |
| (b) | All common stocks held in the Fund are Level 1 securities. For a detailed break-out of common stocks by major industry classification, please refer to the Portfolio of Investments. |
| (c) | Represents unrealized appreciation on Treasury futures contracts. |
NOTE 3—RELATED PARTY TRANSACTIONS
Management fees Under a written agreement approved by a unanimous vote of the Board of Trustees, the Fund pays an annual management fee of 0.50% of the Fund’s average daily net assets to Dodge & Cox, investment manager of the Fund.
Fund officers and trustees All officers and three of the trustees of the Trust are officers or employees of Dodge & Cox. The Trust pays a fee only to those trustees who are not affiliated with Dodge & Cox.
NOTE 4—INCOME TAX INFORMATION AND DISTRIBUTIONS TO SHAREHOLDERS
A provision for federal income taxes is not required since the Fund intends to continue to qualify as a regulated investment company under Subchapter M of the Internal
Revenue Code and distribute all of its taxable income to shareholders. Distributions are determined in accordance with income tax regulations, and such amounts may differ from net investment income and realized gains for financial reporting purposes. Financial reporting records are adjusted for permanent book/tax differences at year end to reflect tax character.
Book/tax differences are primarily due to differing treatments of wash sales, net short-term realized gain (loss), and Treasury futures contracts. At December 31, 2013, the cost of investments for federal income tax purposes was $11,177,032,412.
Distributions during the years noted below were characterized as follows for federal income tax purposes:
| | | | | | | | |
| | | Year Ended
December 31, 2013 | | | Year Ended
December 31, 2012 | |
Ordinary income | | | $246,397,862 | | | | $275,763,170 | |
| | | ($1.650 per share) | | | | ($1.655 per share) | |
| | |
Long-term capital gain | | | $9,642,637 | | | | — | |
| | | ($0.066 per share) | | | | | |
At December 31, 2013, the tax basis components of distributable earnings were as follows:
| | | | |
Unrealized appreciation | | $ | 3,419,085,203 | |
Unrealized depreciation | | | (85,670,523 | ) |
| | | | |
Net unrealized appreciation | | | 3,333,414,680 | |
Undistributed ordinary income | | | 3,632,727 | |
Undistributed long-term capital gain | | | 73,756,067 | |
During 2013, the Fund utilized all of its capital loss carryforward, which amounted to $1,004,697,824.
Under the Regulated Investment Company Modernization Act of 2010, capital losses incurred by the Fund after January 1, 2011, are not subject to expiration. In addition, such losses must be utilized prior to the losses incurred in the years preceding enactment.
Fund management has reviewed the tax positions for open periods (three years and four years, respectively, from filing the Fund’s Federal and State tax returns) as applicable to the Fund, and has determined that no provision for income tax is required in the Fund’s financial statements.
DODGE & COX BALANCED FUND §PAGE 16
NOTES TO FINANCIAL STATEMENTS
NOTE 5—LOAN FACILITIES
Pursuant to an exemptive order issued by the Securities and Exchange Commission (SEC), the Fund may participate in an interfund lending facility (Facility). The Facility allows the Fund to borrow money from or loan money to the Funds. Loans under the Facility are made for temporary or emergency purposes, such as to fund shareholder redemption requests. Interest on borrowings is the average of the current repurchase agreement rate and the bank loan rate. There was no activity in the Facility during the year.
All Funds in the Trust participate in a $500 million committed credit facility (Line of Credit) with State Street Bank and Trust Company, to be utilized for temporary or emergency purposes to fund shareholder redemptions or for other short-term liquidity purposes. The maximum amount available to the Fund is $250 million. Each Fund pays an annual commitment fee on its pro-rata portion of the Line of Credit. The Fund’s commitment fee for the year ended December 31, 2013, amounted to $43,588 and is reflected as a Miscellaneous Expense in the Statement of Operations. Interest on borrowings is charged at the prevailing rate. There were no borrowings on the Line of Credit during the year.
NOTE 6—PURCHASES AND SALES OF INVESTMENTS
For the year ended December 31, 2013, purchases and sales of securities, other than short-term securities and U.S. government securities, aggregated $1,932,348,809 and $3,947,592,073, respectively. For the year ended December 31, 2013, purchases and sales of U.S. government securities aggregated $1,602,288,029 and $917,023,848, respectively.
NOTE 7—ACCOUNTING PRONOUNCEMENTS
Effective January 1, 2013, the Fund adopted Accounting Standards Update (ASU) No. 2011-11, Balance Sheet (Topic 210): Disclosures about Offsetting Assets and Liabilities and ASU No. 2013-01, Balance Sheet (Topic 210): Clarifying the Scope of Disclosures about Offsetting Assets and Liabilities. These amendments to Topic 210 require enhanced disclosures about offsetting of financial assets and liabilities, including derivative instruments, to enable investors to understand the effect of these arrangements on a fund’s financial position. There was no impact to these financial statements as a result of applying these ASUs.
NOTE 8—SUBSEQUENT EVENTS
Fund management has determined that no material events or transactions occurred subsequent to December 31, 2013, and through the date of the Fund’s financial statements issuance, which require additional disclosure in the Fund’s financial statements.
PAGE 17 § DODGE & COX BALANCED FUND
FINANCIAL HIGHLIGHTS
| | | | | | | | | | | | | | | | | | | | |
SELECTED DATA AND RATIOS (for a share outstanding throughout each year) | | Year Ended December 31, | |
| | | 2013 | | | 2012 | | | 2011 | | | 2010 | | | 2009 | |
| | | | |
Net asset value, beginning of year | | | $78.06 | | | | $67.45 | | | | $70.22 | | | | $64.03 | | | | $51.26 | |
Income from investment operations: | | | | | | | | | | | | | | | | | | | | |
Net investment income | | | 1.66 | | | | 1.65 | | | | 1.62 | | | | 1.41 | | | | 1.46 | |
Net realized and unrealized gain (loss) | | | 20.30 | | | | 10.62 | | | | (2.77 | ) | | | 6.30 | | | | 12.82 | |
| | | | |
Total from investment operations | | | 21.96 | | | | 12.27 | | | | (1.15 | ) | | | 7.71 | | | | 14.28 | |
| | | | |
Distributions to shareholders from: | | | | | | | | | | | | | | | | | | | | |
Net investment income | | | (1.65 | ) | | | (1.66 | ) | | | (1.62 | ) | | | (1.52 | ) | | | (1.51 | ) |
Net realized gain | | | (0.07 | ) | | | — | | | | — | | | | — | | | | — | |
| | | | |
Total distributions | | | (1.72 | ) | | | (1.66 | ) | | | (1.62 | ) | | | (1.52 | ) | | | (1.51 | ) |
| | | | |
Net asset value, end of year | | | $98.30 | | | | $78.06 | | | | $67.45 | | | | $70.22 | | | | $64.03 | |
| | | | |
Total return | | | 28.37 | % | | | 18.32 | % | | | (1.66 | )% | | | 12.23 | % | | | 28.37 | % |
Ratios/supplemental data: | | | | | | | | | | | | | | | | | | | | |
Net assets, end of year (millions) | | | 14,404 | | | | $12,217 | | | | $12,220 | | | | $14,849 | | | | $15,448 | |
Ratio of expenses to average net assets | | | 0.53 | % | | | 0.53 | % | | | 0.53 | % | | | 0.53 | % | | | 0.53 | % |
Ratio of net investment income to average net assets | | | 1.85 | % | | | 2.21 | % | | | 2.26 | % | | | 2.13 | % | | | 2.61 | % |
Portfolio turnover rate | | | 25 | % | | | 16 | % | | | 19 | % | | | 12 | % | | | 19 | % |
See accompanying Notes to Financial Statements
REPORT OF INDEPENDENT REGISTERED PUBLIC ACCOUNTING FIRM
To the Trustees of Dodge & Cox Funds and Shareholders of Dodge & Cox Balanced Fund
In our opinion, the accompanying statement of assets and liabilities, including the portfolio of investments, and the related statements of operations and of changes in net assets and the financial highlights present fairly, in all material respects, the financial position of Dodge & Cox Balanced Fund (the “Fund”, one of the series constituting Dodge & Cox Funds) at December 31, 2013, the results of its operations for the year then ended, the changes in its net assets for each of the two years in the period then ended and the financial highlights for each of the five years in the period then ended, in conformity with accounting principles generally accepted in the United States of America. These financial statements and financial highlights (hereafter referred to as “financial statements”) are the responsibility of the Fund’s management; our responsibility is to express an opinion on these financial statements based on our audits. We conducted our audits of these financial statements in accordance with the standards of the Public Company Accounting Oversight Board (United States). Those standards require that we plan and perform the audit to obtain reasonable assurance about whether the financial statements are free of material misstatement. An audit includes examining, on a test basis, evidence supporting the amounts and disclosures in the financial statements, assessing the accounting principles used and significant estimates made by management, and evaluating the overall financial statement presentation. We believe that our audits, which included confirmation of securities at December 31, 2013, by correspondence with the custodian and brokers, provide a reasonable basis for our opinion.
PricewaterhouseCoopers LLP
San Francisco, California
February 25, 2014
DODGE & COX BALANCED FUND §PAGE 18
SPECIAL 2013 TAX INFORMATION
(unaudited)
The following information is provided pursuant to provisions of the Internal Revenue Code:
The Fund designates $192,534,850 of its distributions paid to shareholders in 2013 as qualified dividends (treated for federal income tax purposes in the hands of shareholders as taxable at a maximum rate of 20%).
For shareholders that are corporations, the Fund designates 53% of its ordinary dividends paid to shareholders in 2013 as dividends from domestic corporations eligible for the corporate dividends received deduction, provided that the shareholder otherwise satisfies applicable requirements to claim that deduction.
BOARD APPROVAL OF FUNDS’ INVESTMENT MANAGEMENT AGREEMENTS AND MANAGEMENT FEES
(unaudited)
The Board of Trustees is responsible for overseeing the performance of the Dodge & Cox Funds’ investment manager and determining whether to continue the Investment Management Agreements between the Funds and Dodge & Cox each year (the “Agreements”). At a meeting of the Board of Trustees of the Trust held on December 17, 2013, the Trustees, by a unanimous vote (including a separate vote of those Trustees who are not “interested persons” (as defined in the Investment Company Act of 1940) (the “Independent Trustees”)), approved the renewal of the Agreements for an additional one-year term through December 31, 2014. During the course of the year, the Board received a wide variety of materials relating to the services provided by Dodge & Cox and the performance of each of the Funds.
INFORMATION RECEIVED
In advance of the meeting, the Board, including each of the Independent Trustees, requested, received, and reviewed materials relating to the Agreements and the services provided by Dodge & Cox. The Independent Trustees retained Morningstar® to prepare an independent expense and performance summary for each Fund and comparable funds managed by other advisers identified by Morningstar. The Morningstar materials included information regarding advisory fee rates, expense ratios,
and transfer agency, custodial, and distribution expenses, as well as appropriate performance comparisons to each Fund’s peer group and an index or combination of indices. The Morningstar materials also included a comparison of expenses of various share classes offered by comparable funds.
The materials reviewed by the Board contained information concerning, among other things, Dodge & Cox’s profitability, financial results and condition, advisory fee revenue, and separate account and sub-adviser fund fee schedules. The Board additionally considered the Funds’ brokerage commissions, turnover rates, sales and redemption data and the significant investment that Dodge & Cox makes in research used in managing the Funds. The Board received and reviewed a memorandum summarizing information provided throughout the year regarding Dodge & Cox’s services to the Funds as well as information regarding (i) the different fees, services, costs, and risks associated with other accounts managed by Dodge & Cox as compared to the Dodge & Cox Funds; (ii) the differences in performance between the Funds and separately managed accounts; and (iii) Fund shares subscription and redemption activity. Throughout the process of reviewing the services provided by Dodge & Cox and preparing for the meeting, the Independent Trustees found Dodge & Cox to be open, forthright, detailed, and very helpful in answering questions about all issues.
The Board received copies of the Agreements and a memorandum from the independent legal counsel to the Independent Trustees discussing the factors generally regarded as appropriate to consider in evaluating advisory arrangements. The Trust’s Contract Review Committee, consisting solely of Independent Trustees, met with the independent legal counsel on October 30, 2013, and again on December 17, 2013, to discuss whether to renew the Agreements. The Board, including the Independent Trustees, subsequently concluded that the existing Agreements are fair and reasonable and voted to approve the Agreements.
In considering the Agreements, the Board, including the Independent Trustees, did not identify any single factor or particular information as all-important or controlling. In reaching the decision to approve the Agreements, the Board considered several factors,
PAGE 19 § DODGE & COX BALANCED FUND
discussed below, to be key factors and reached the conclusions described below.
NATURE, QUALITY, AND EXTENT OF THE SERVICES
The Board considered that Dodge & Cox provides a wide range of services to the Funds in addition to portfolio management and that the quality of these services has been excellent in all respects. The extensive nature of services provided by Dodge & Cox has been documented in materials provided to the Board and in presentations made to the Board throughout the year. In particular, the Board considered the nature, quality, and extent of portfolio management, administrative, and shareholder services performed by Dodge & Cox. With regard to portfolio management services, the Board considered Dodge & Cox’s established long-term history of care and conscientiousness in the management of the Funds; its demonstrated consistency in investment approach and depth; the background and experience of the Dodge & Cox Investment Policy Committee, International Investment Policy Committee, Global Stock Investment Policy Committee, Fixed Income Investment Policy Committee, and research analysts responsible for managing the Funds; its methods for assessing the regulatory and investment climate in various jurisdictions; Dodge & Cox’s overall high level of attention to its core investment management function; and its commitment to the Funds and their shareholders.
In the area of administrative and shareholder services, the Board considered the excellent quality of Dodge & Cox’s work in areas such as compliance, legal services, trading, proxy voting, oversight of the Funds’ transfer agent and custodian, tax compliance, and shareholder communication through its website and other means. The Board also noted Dodge & Cox’s diligent disclosure policy, its favorable compliance record, and its reputation as a trusted, shareholder-friendly mutual fund family.
In addition, the Board considered that Dodge & Cox manages approximately $140 billion in Fund assets with fewer professionals than most comparable funds, and that on average these professionals have more experience and longer tenure than investment professionals at comparable funds. The Board also noted that Dodge & Cox is an
investment research-oriented firm with no other business endeavors to distract management’s attention from its research efforts, and that its investment professionals adhere to a consistent investment approach across the Funds. The Board further considered the favorable stewardship and “Gold” analyst ratings awarded to each of the Funds by Morningstar. The Board concluded that it was satisfied with the nature, extent, and quality of investment management and other services provided to the Funds by Dodge & Cox.
INVESTMENT PERFORMANCE
The Board considered short-term and long-term investment performance for each Fund (including periods of outperformance or underperformance) as compared to both relevant indices and the performance of such Fund’s peer group. The Board noted that each Fund demonstrated favorable short-term and longer-term performance relative to its benchmark and peer group. The Board determined after extensive review and inquiry that Dodge & Cox’s historic, long-term, team-oriented, bottom up investment approach remains consistent and that Dodge & Cox continues to be distinguished by its integrity, transparency, and independence.
The Board considered that the performance of the Funds is the result of a team-oriented investment management process that emphasizes a long-term investment horizon, comprehensive independent research, price discipline, and focus. The Board also considered that the investment performance delivered by Dodge & Cox to the Funds appeared to be consistent with the relevant performance delivered for other clients of Dodge & Cox. The Board concluded that Dodge & Cox has delivered favorable long-term performance for Fund investors consistent with the long-term investment strategies being pursued by the Funds.
COSTS AND ANCILLARY BENEFITS
Costs of Services to Funds: Fees and Expenses. The Board considered each Fund’s management fee rate and expense ratio relative to similar mutual funds and relative to management fees charged by Dodge & Cox to other clients. In particular, the Board considered that the Funds continue to be substantially below their peer group median in expense ratios and management fee rates and
DODGE & COX BALANCED FUND §PAGE 20
that many media and industry reports specifically comment on the low expense ratios of the Funds, which have been a defining characteristic of the Funds for many years. The Board also evaluated the operating structures of the Funds and Dodge & Cox, noting that the Funds do not charge front-end sales commissions or distribution fees, and Dodge & Cox bears, among other things, the significant cost of third party research, reimbursement for recordkeeping and administrative costs to third-party retirement plan administrators, and administrative and office overhead. The Board noted that expenses are well below industry averages. The Board also considered that the Funds receive numerous administrative, regulatory compliance, legal, technology and shareholder support services from Dodge & Cox without any additional administrative fee and the fact that the Funds have relatively low transaction costs and portfolio turnover rates. The Board reviewed Morningstar data showing that the few peer group funds with lower expense ratios often have other share classes with significantly higher expense ratios.
The Board reviewed information regarding the fee rates Dodge & Cox charges to separate accounts and sub-advised funds that have investment programs similar to those of the Funds, including instances where separate account and sub-advised fund fees are lower than Fund fees. The Board considered differences in the nature and scope of services Dodge & Cox provides to the Funds as compared to other client accounts, differences in regulatory, litigation, and other risks as between Dodge & Cox Funds and other types of clients, and certain characteristics of the market for institutional separate account management services. The Board further noted that, with respect to non-U.S. funds sponsored and managed by Dodge & Cox that are comparable to the Funds in many respects, the fee rates charged by Dodge & Cox are the same as or higher than the fee rates charged to the Funds. After consideration of these matters, the Board concluded that the overall costs incurred by the Funds for the services they receive (including the management fee paid to Dodge & Cox) are reasonable and that the fees are acceptable based upon the qualifications, experience, reputation, and performance of Dodge & Cox and the low overall expense ratios of the Funds.
Profitability and Costs of Services to Dodge & Cox; “Fall-out” Benefits. The Board reviewed reports of Dodge & Cox’s financial position, profitability, and estimated overall value, and considered Dodge & Cox’s overall profitability within its context as a private, employee-owned S-Corporation and relative to the favorable services provided. The Board noted in particular that Dodge & Cox’s profits are not generated by high fee rates, but reflect an extraordinarily streamlined, efficient, and focused business approach toward investment management. The Board recognized the importance of Dodge & Cox’s profitability—which is derived solely from management fees and does not include other business ventures—to maintain its independence, stability, company culture and ethics, and management continuity. The Board also considered that the compensation/profit structure at Dodge & Cox is vital for remaining independent and facilitating retention of its management and investment professionals.
The Board considered potential “fall-out” benefits (including the receipt of research from unaffiliated brokers and reputational benefits to non-U.S. funds sponsored and managed by Dodge & Cox) that Dodge & Cox might receive as a result of its association with the Funds and determined that they are not significant. The Board also noted the extent of additional administrative services performed by Dodge & Cox for the Funds, and that the magnitude of costs and risks borne by Dodge & Cox in rendering advisory services to the Funds (including risks in the regulatory compliance, securities valuation, and investment management processes) are continuing to increase. The Board concluded that the profitability of Dodge & Cox’s relationship with the Funds (including fall-out benefits) was fair and reasonable.
THE BENEFIT OF ECONOMIES OF SCALE
The Board considered whether there have been economies of scale with respect to the management of each Fund, whether the Funds have appropriately benefited from any economies of scale, and whether the management fee rate is reasonable in relation to the Fund assets and any economies of scale that may exist. In the Board’s view, any consideration of economies of scale must take account of the Funds’ low fee structure and the
PAGE 21 § DODGE & COX BALANCED FUND
considerable efficiencies of the Funds’ organization and fee structure that has been realized by shareholders from the time of each Fund’s inception (i.e., from the first dollar). The Board noted that Dodge & Cox has shared economies of scale by adding or enhancing services to the Funds over time, and that the internal costs of providing investment management, up-to-date technology, administrative, legal and compliance services to the Funds are continuing to increase. For example, Dodge & Cox has increased its global research staff and investment resources over the years to address the increased complexity of investing in multinational and non-U.S. companies. In addition, Dodge & Cox has made substantial expenditures in other staff and infrastructure to enable it to integrate credit and equity analyses and to be able to implement its strategy in a more effective and secure manner. The Board determined that the Funds provide access for small investors to high quality investment management at a relatively low cost. The Board’s decision to renew the Agreements was made after consideration of economies of scale and review of peer group fund expense ratios and historical expense ratio patterns for the Funds. The Board concluded that the current Dodge & Cox fee structure is fair and reasonable and adequately shares economies of scale that may exist.
CONCLUSION
Based on their evaluation of all material factors and assisted by the advice of independent legal counsel to the Independent Trustees, the Board, including the Independent Trustees, concluded that the advisory fee structure was fair and reasonable, that each Fund was paying a competitive fee for the services provided, that the scope and quality of Dodge & Cox’s services has provided substantial value for Fund shareholders over the long term, and that approval of the Agreements was in the best interests of each Fund and its shareholders.
FUND HOLDINGS
The Fund provides a complete list of its holdings four times each fiscal year, as of the end of each quarter. The Fund files the lists with the SEC on Form N-CSR (second and fourth quarters) and Form N-Q (first and third quarters). Shareholders may view the Fund’s Forms N-CSR and N-Q on the SEC’s website at www.sec.gov. Forms N-CSR and N-Q may also be reviewed and copied at the SEC’s Public Reference Room in Washington, DC. Information regarding the operations of the Public Reference Room may be obtained by calling 202-551-8090 (direct) or 800-732-0330 (general SEC number). A list of the Fund’s quarter-end holdings is also available at www.dodgeandcox.com on or about 15 days following each quarter end and remains available on the website until the list is updated in the subsequent quarter.
PROXY VOTING
For a free copy of the Fund’s proxy voting policies and procedures, please call 800-621-3979, visit the Fund’s website at www.dodgeandcox.com, or visit the SEC’s website at www.sec.gov. Information regarding how the Fund voted proxies relating to portfolio securities during the most recent 12-month period ending June 30 is also available at www.dodgeandcox.com or at www.sec.gov.
HOUSEHOLD MAILINGS
The Fund routinely mails shareholder reports and summary prospectuses to shareholders and, on occasion, proxy statements. In order to reduce the volume of mail, when possible, only one copy of these documents will be sent to shareholders who are part of the same family and share the same residential address.
If you have a direct account with the Funds and you do not want the mailing of shareholder reports and summary prospectuses combined with other members in your household, contact the Funds at 800-621-3979. Your request will be implemented within 30 days.
DODGE & COX BALANCED FUND §PAGE 22
DODGE & COX FUNDS—EXECUTIVE OFFICER & TRUSTEE INFORMATION
| | | | | | |
Name (Age) and
Address* | | Position with Trust (Year of Election or
Appointment) | | Principal Occupation During Past 5 Years | | Other Directorships Held by Trustees |
| INTERESTED TRUSTEES AND OFFICERS |
| Kenneth E. Olivier (61) | | Chairman, President, and Trustee (Trustee since 2005) | | Chairman Emeritus (since 2013), Chairman (2011-2013), Chief Executive Officer (2010-2013), President (until 2011), and Director of Dodge & Cox; Portfolio Manager and member of Investment Policy Committee (IPC) (until 2013) | | — |
| Dana M. Emery (52) | | Senior Vice President and Trustee (Trustee since 1993) | | Chief Executive Officer (since 2013), President (since 2011), Executive Vice President (until March 2011), and Director of Dodge & Cox; Director of Fixed Income, Portfolio Manager, and member of Fixed Income Investment Policy Committee (FIIPC) | | — |
| John A. Gunn (70) | | Trustee (Trustee since 1985) | | Chairman Emeritus (2011-2013), Chairman (2007-2011), Chief Executive Officer (2007-2010), and Director of Dodge & Cox; Portfolio Manager and member of IPC, Global Stock Investment Policy Committee (GSIPC) (since 2008), and International Investment Policy Committee (IIPC) | | — |
| Charles F. Pohl (55) | | Senior Vice President (Officer since 2004) | | Chairman (since 2013), Co-President (2011-2013), Senior Vice President (until 2011), and Director of Dodge & Cox; Chief Investment Officer (since 2007), Portfolio Manager, Investment Analyst, and member of IPC, GSIPC, IIPC, and FIIPC | | — |
| Diana S. Strandberg (54) | | Senior Vice President (Officer since 2006) | | Senior Vice President (since 2011), Vice President (until 2011), and Director (since 2011) of Dodge & Cox; Director of International Equity (since 2009), Portfolio Manager, Investment Analyst, and member of IPC, GSIPC, and IIPC | | — |
| David H. Longhurst (56) | | Treasurer (Officer since 2006) | | Vice President and Assistant Treasurer of Dodge & Cox | | — |
| Thomas M. Mistele (60) | | Secretary (Officer since 1998) | | Chief Operating Officer, Director, Secretary, Senior Counsel (since 2011), and General Counsel (until 2011) of Dodge & Cox | | — |
| Katherine M. Primas (39) | | Chief Compliance Officer (Officer since 2009) | | Chief Compliance Officer of Dodge & Cox | | — |
| INDEPENDENT TRUSTEES |
| L. Dale Crandall (72) | | Trustee (Since 1999) | | President, Piedmont Corporate Advisors, Inc. (since 2003); President, Kaiser Foundation Health Plan, Inc. and Kaiser Foundation Hospitals (2000-2002); Senior Vice President—Finance and Administration & CFO, Kaiser Foundation Health Plan, Inc. and Kaiser Foundation Hospitals (1998-2000) | | Director, Ansell Limited (medical equipment and supplies) (since 2002); Bridgepoint Education, Inc. (education services) (since 2008); and Endurance International Group, Inc. (internet services) (since 2013) |
| Thomas A. Larsen (64) | | Trustee (Since 2002) | | Senior Counsel of Arnold & Porter LLP (law firm) (since 2013); Partner of Arnold & Porter LLP (since 2012); Director of Howard, Rice, Nemerovski, Canady, Falk & Rabkin (1977-2011) | | — |
| Ann Mather (53) | | Trustee (Since 2011) | | CFO, Pixar Animation Studios (1999-2004) | | Director, Google, Inc. (internet information services) (since 2005); Director, Glu Mobile, Inc. (multimedia software) (since 2005); Director, Netflix, Inc. (video services) (since 2010); Director, Shutterfly, Inc. (internet photography services/publishing) (since 2013); Director, Solazyme Inc. (renewable oils) (since 2011) |
| Robert B. Morris III (61) | | Trustee (Since 2011) | | Adviser to various financial services firms | | — |
| Gary Roughead (62) | | Trustee (Since 2013) | | Annenberg Distinguished Visiting Fellow, Hoover Institution (since 2011); Admiral, United States Navy (Ret.); U.S. Navy Chief of Naval Operations (2007-2011) | | Director, Northrop Grumman Corp. (global security) (since 2012) |
| John B. Taylor (67) | | Trustee (Since 2005) (and 1998-2001) | | Professor of Economics, Stanford University; Senior Fellow, Hoover Institution; Under Secretary for International Affairs, United States Treasury (2001-2005) | | — |
| * | | The address for each Officer and Trustee is 555 California Street, 40th Floor, San Francisco, California 94104. Each Officer and Trustee oversees all five series in the Dodge & Cox Funds complex and serves for an indefinite term. |
Additional information about the Trust’s Trustees and Officers is available in the Trust’s Statement of Additional Information (SAI). You can get a free copy of the SAI by visiting the Funds’ website at www.dodgeandcox.com or calling
800-621-3979.
PAGE 23 § DODGE & COX BALANCED FUND
| | | | |
| | | | |
www.dodgeandcox.com
For Fund literature, transactions, and account
information, please visit the Funds’ website.
or write or call:
DODGE & COX FUNDS
c/o Boston Financial Data Services
P.O. Box 8422
Boston, Massachusetts 02266-8422
(800) 621-3979
INVESTMENT MANAGER
Dodge & Cox
555 California Street, 40th Floor
San Francisco, California 94104
(415) 981-1710
This report is submitted for the general information of the shareholders of the Fund. The report is not authorized for distribution to prospective investors in the Fund unless it is accompanied by a current prospectus.
This report reflects our views, opinions, and portfolio holdings as of December 31, 2013, the end of the reporting period. Any such views are subject to change at any time based upon market or other conditions and Dodge & Cox disclaims any responsibility to update such views. These views may not be relied on as investment advice and, because investment decisions for a Dodge & Cox Fund are based on numerous factors, may not be relied on as an indication of trading intent on behalf of any Dodge & Cox Fund.
12/13 IF AR Printed on recycled paper
Annual Report
December 31, 2013
Income Fund
ESTABLISHED 1989
TICKER: DODIX
TO OUR SHAREHOLDERS
The Dodge & Cox Income Fund had a total return of 2.0% for the six months ending December 31, 2013, compared to a total return of 0.4% for the Barclays U.S. Aggregate Bond Index (Barclays U.S. Aggregate). For 2013, the Fund had a total return of 0.6%, compared to -2.0% for the Barclays U.S. Aggregate. At year end, the Fund had net assets of $24.7 billion with a cash position of 2.2%.
MARKET COMMENTARY
Price declines associated with substantially higher U.S. interest rates led to a -2.0% return for the broad U.S. bond market, its worst calendar-year return since 1994 and the first negative return since 1999. Stronger U.S. economic data contributed to higher U.S. Treasury yields, but Federal Reserve (the Fed) policy was the dominant source of interest rate volatility. In the spring, the Fed signaled that it might begin tapering its $85 billion-a-month asset purchase program (i.e., quantitative easing or QE3), and bond prices fell in connection with this expectation. September brought a market surprise, and buoyant bond prices, when the Fed opted not to taper its asset purchases until it saw sustained progress in economic conditions. In December, an improving labor market and rising housing prices and consumer spending led the Fed to announce a modest taper, reducing monthly asset purchases by $10 billion starting in January. At the same time, Fed officials strongly signaled a commitment to continued policy accommodation, particularly with regards to the federal funds rate.
In the wake of this, the U.S. Treasury sector(a) was the worst-performing broad market sector with a -2.8% annual return. Longer-term Treasuries suffered significant losses—for example, the 10-year U.S. Treasury had a total return of -7.8% in 2013. Other market segments performed better, but were still negative. Investment-grade corporate bonds posted a -1.5% return, while Agency-guaranteed(b) mortgage-backed securities (MBS) returned -1.4%. Within the Corporate sector, Financial Institutions performed best, managing a positive 0.9% return, versus Industrials (-2.6% return) and Utilities (-3.2% return). Robust investment-grade new issuance fed strong investor demand as net new issuance for investment-grade debt hit another record in 2013. Within the MBS market, higher-coupon securities outperformed lower coupons despite the negative effect of faster prepayments on these securities.
INVESTMENT STRATEGY
The Fund delivered a small positive return in a very challenging market environment for bonds in 2013. In addition, relative returns were quite strong (2.7 percentage points above the Barclays U.S. Aggregate), driven primarily by the Fund’s shorter relative duration(c) and an overweight to corporates, specifically Financial Institutions.
A key tenet of our firm’s investment approach has been a focus on long-term capital preservation and controlling downside risk. The Fund’s positioning reflects these goals in multiple ways. The Fund’s defensive posture toward interest rate risk seeks to preserve the value of principal in a rising interest rate environment. Its durable yield advantage seeks to enhance absolute returns through a higher income stream. And the in-depth research and collective judgment behind the Fund’s diversified portfolio of holdings gives us confidence in the long-term return prospects for the Fund. This overall positioning provided an important source of absolute return during a rare “down” year for bonds.
Another pillar of our approach is a long-term investment horizon; we construct the Fund’s portfolio with the goal of outperforming the broad market over a three- to five-year timeframe. Not surprisingly, the Fund’s strong relative performance in 2013 was largely the result of longstanding portfolio themes (supplemented by well-timed incremental shifts when relative value opportunities arose) being rewarded by the market. As always, we built these positions from the bottom up, based on our assessment of both fundamental and relative value at the individual security level. In light of shifting valuations in a volatile year for the bond markets, we did make a number of incremental changes, described in greater detail in the following sections.
Corporate Focus: Pockets of Opportunity Despite Fuller Valuations
While the Fund’s corporate bond weighting,(d) year-over-year, remained at 47%, we modestly shifted the mix within various sub-sectors of the corporate portfolio during the year. For example, we selectively reduced the Fund’s Financial sector holdings by three percentage points due to higher valuations (yield premiums for Financials are now below those of Industrials) and better opportunities elsewhere in the credit and Agency MBS
PAGE 1 § DODGE & COX INCOME FUND
markets. Despite the reduction, we view the prospects for the Fund’s holdings in this area with optimism, given the financial strength and positive credit trends of the Fund’s holdings. Away from Financials, we added just over three percentage points to the Fund’s other corporate holdings in 2013 through a combination of small adds to existing positions and new issuers entering the Fund’s portfolio. Examples of new and/or increased positions included Enel(e) and Verizon, among numerous others.
One area of increased focus for the Fund in recent years has been international credit. We hold just under 11% of the Fund in U.S. dollar-denominated securities of non-U.S. issuers, compared to less than 2% five years ago. We continue to find non-U.S. domiciled investments an area of opportunity as macro and geopolitical events in recent years have created uncertainty. In addition to non-U.S. domiciled corporates, we also hold positions in sovereign or sovereign-related credits such as the Kingdom of Spain, a new holding in 2013, and Petrobras. Analysis of both the credit characteristics of each issuer and the sovereign/macro dynamics are critical to developing a thesis on these types of investments, and we have a strong and experienced team in place to evaluate these factors.
2013’s strong (relative) performance in the corporate sector has raised valuations. Nevertheless, we believe a large weighting—and a significant overweight relative to the Barclays U.S. Aggregate—remains warranted. The economic environment continues to improve, creating a solid underpinning for already-strong corporate credit fundamentals. Valuations are reasonable, both in a historical context (yield premiums are close to long-term medians) and relative to the underlying strength of the issuers we hold in the Fund. At the same time, we continue to be mindful of the risks inherent in corporate bond investing today, most notably event risk and releveraging risk, both of which could negatively affect the prospects for individual holdings.
Agency MBS: Weighting Increase and Compositional Changes
Another area of emphasis and incremental change for the Fund has been the Agency MBS portfolio. MBS comprise 36% of the Fund at year-end, representing a seven percentage point increase during 2013. We added to MBS at several distinct points in 2013, opportunistically taking advantage of relative value changes. In addition to the weighting increase, we made important compositional changes as well. For example, the Fund’s weighting in
seasoned, high coupon 30-year MBS with exposure to the Administration’s HARP(f) program was particularly dynamic last year. We added significantly to this portion of the Fund’s MBS portfolio in the first half of 2013, taking advantage of a drop in their valuations which, in our view, provided sufficient compensation for faster-than-expected prepayment rates. Later, as valuations increased for these HARP-eligible, high coupon 30-year MBS in the third quarter (thus providing far less of a safety cushion for an extended period of higher prepayment rates), we substantially reduced these holdings in favor of somewhat lower coupon 30-year MBS that are not HARP-eligible.
The Fund’s MBS differ markedly from those in the Barclays U.S. Aggregate; the Fund features a much higher proportion of premium coupon 30-year and 15-year MBS, with less overall interest rate exposure. As with corporates, we analyze MBS on an individual basis to assess the attractiveness of their total return prospects. A key part of this is determining whether valuations provide adequate compensation for the attendant risks. For Agency MBS, the primary risk is from the variability of principal prepayments: receiving principal at an inopportune time (when rates are low and reinvestment occurs at these lower rates) or, conversely, having principal returned at a slower pace than expected (when rates are higher and reinvestment looks attractive). MBS investors must constantly balance the promised yield of an MBS and the potentially negative effects of prepayment risk to the security’s prospective return. In doing so, we focus on specific loan or borrower characteristics that might mitigate prepayment risk and, importantly, whose beneficial effects might not be fully appreciated (and therefore priced in) by the market. For example, we are attracted to higher coupon 15-year Agency MBS as their prepayment risk declines as loan balances amortize and the borrower’s potential refinancing savings decrease.
Defensively Positioned Regarding Interest Rate Risk
We have continued to position the Fund with a shorter relative duration, as described earlier. In our view, the health of the corporate sector, the reduced drag from fiscal restraint, and brighter global economic prospects bode well for the broad U.S. economy. In this environment, and in light of Treasury yields that remain below historical averages on both a nominal and inflation-adjusted basis, there remains a substantial risk that Treasury yields rise further.
DODGE & COX INCOME FUND §PAGE 2
Though we lengthened Fund duration slightly in 2013—as absolute and real yields rose and as we identified attractive individual opportunities—we positioned the Fund with a duration that was approximately 80% of the Barclays U.S. Aggregate’s at year end.
IN CLOSING
As we mark another passing year, it seems appropriate to reflect on the past five years since the financial crisis. It has been a period of high volatility in fixed income markets, with the 10-year Treasury note fluctuating between 1.4% and 4.0% and corporate bond yield premiums ranging between 5.5 and 1.1 percentage points over Treasuries. Over this time, the Fund has posted an annualized return of 7.2%, nearly three percentage points per year in excess of the Barclays U.S. Aggregate’s return. One key to this success has been our willingness to deviate—at times meaningfully—from the Fund’s benchmark. We build the Fund’s portfolio from the bottom up, based on our appraisal of fundamental and relative value and the long-term prospects of individual securities and sectors. These decisions, collectively, form the Fund’s aggregate positioning and often result in substantial differences between the Fund and the benchmark. This approach has been critical in achieving the strong results of the past five years. To cite two examples: we started building a sizable Financials weighting in 2007 at the onset of the financial crisis when valuations began to decline; at its peak, the Fund’s weighting in Financial issuers (which we selected on an individual basis) was three times that of the benchmark. Another example is our significant underweighting of Treasuries despite their growing presence in the Barclays U.S. Aggregate. Both of these relative positions have benefited the Fund over the past five years, as Financials were among the best-performing segments of the bond market over this time, and long-term Treasuries were the worst-performing segment. In this way we have been able to achieve attractive absolute and relative returns for the Fund over the past five years and, importantly, in 2013’s challenging bond market.
Thank you for your continued confidence in our firm. As always, we welcome your comments and questions.
For the Board of Trustees,
| | |
| |
|
Kenneth E. Olivier, Chairman and President | | Dana M. Emery, Senior Vice President |
January 30, 2014
| (a) | Sector returns as calculated and reported by Barclays. |
| (b) | The U.S. Government does not guarantee the Fund’s shares, yield, or net asset value. The agency guarantee (by, for example, Ginnie Mae, Fannie Mae, or Freddie Mac) does not eliminate market risk. |
| (c) | Duration is a measure of a bond’s (or a bond portfolio’s) price sensitivity to changes in interest rates. |
| (d) | Unless otherwise specified, all weightings and characteristics are as of December 31, 2013. |
| (e) | The use of specific examples does not imply that they are more attractive than the Fund’s other holdings. |
| (f) | Home Affordable Refinance Program. |
Risks: The Fund invests in individual bonds whose yields and market values fluctuate, so that your investment may be worth more or less than its original cost. Bond investments are subject to interest rate risk, credit risk, and prepayment risk, all of which could have adverse effects on the value of the Fund. A low interest rate environment creates an elevated risk of future negative returns. Please read the prospectus and summary prospectus for specific details regarding the Fund’s risk profile.
PAGE 3 § DODGE & COX INCOME FUND
ANNUAL PERFORMANCE REVIEW
The Fund outperformed the Barclays U.S. Aggregate by 2.7 percentage points in 2013.
Key Contributors To Relative Results
| | § | | The Fund’s shorter relative duration (72% of the Barclays U.S. Aggregate’s duration) added to relative returns. | |
| | § | | Many of the Fund’s corporate bond holdings performed well, including Citigroup floating rate notes, Dillard’s, HCA, Hewlett-Packard, Sprint, Verizon (purchased in September), and Vulcan Materials. State of California general obligation bonds also outperformed similar-duration alternatives. | |
| | § | | The Fund’s large overweight position in the Financial Institutions sub-sector (nearly three times that of the Barclays U.S. Aggregate) added to relative returns, as did the higher weighting in corporate bonds (47% versus 22% for the Barclays U.S. Aggregate). | |
| | § | | The Fund’s nominal yield advantage was a positive factor. | |
| | § | | The Fund’s Agency MBS outperformed similar-duration alternatives. | |
Key Detractors From Relative Results
| | § | | While issue-specific performance was positive overall, certain holdings underperformed for the year, including AT&T, Cox Communications, Petrobras, Time Warner Cable, and Twenty-First Century Fox. | |
KEY CHARACTERISTICS OF DODGE & COX
Independent Organization
Dodge & Cox is one of the largest privately owned investment managers in the world. We remain committed to independence, with a goal of providing the highest quality investment management service to our existing clients.
Over 80 Years of Investment Experience
Dodge & Cox was founded in 1930. We have a stable and well-qualified team of investment professionals, most of whom have spent their entire careers at Dodge & Cox.
Experienced Investment Team
The Fixed Income Investment Policy Committee, which is the decision-making body for the Income Fund, is a ten-member committee with an average tenure at Dodge & Cox of 18 years.
One Business with a Single Research Office
Dodge & Cox manages domestic, international, and global equity, fixed income, and balanced investments, operating from one office in San Francisco.
Consistent Investment Approach
Our team decision-making process involves thorough, bottom-up fundamental analysis of each investment.
Long-Term Focus and Low Expenses
We invest with a three- to five-year investment horizon, which has historically resulted in low turnover relative to our peers. We manage Funds that maintain low expense ratios.
DODGE & COX INCOME FUND §PAGE 4
GROWTH OF $10,000 OVER 10 YEARS
FOR AN INVESTMENT MADE ON DECEMBER 31, 2003
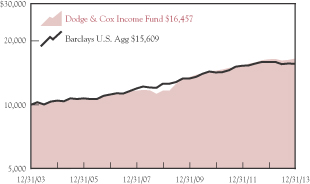
AVERAGE ANNUAL TOTAL RETURN
FOR PERIODS ENDED DECEMBER 31, 2013
| | | | | | | | | | | | | | | | |
| | | 1 Year | | | 5 Years | | | 10 Years | | | 20 Years | |
| | | | | | | | | | | | | | | | |
Dodge & Cox Income Fund | | | 0.64 | % | | | 7.20 | % | | | 5.10 | % | | | 6.25 | % |
Barclays U.S. Aggregate Bond Index (Barclays U.S. Agg) | | | -2.02 | | | | 4.46 | | | | 4.55 | | | | 5.74 | |
Returns represent past performance and do not guarantee future results. Investment return and share price will fluctuate with market conditions, and investors may have a gain or loss when shares are sold. Fund performance changes over time and currently may be significantly lower than stated. Performance is updated and published monthly. Visit the Fund’s website at www.dodgeandcox.com or call 800-621-3979 for current performance figures.
The Fund’s total returns include the reinvestment of dividend and capital gain distributions, but have not been adjusted for any income taxes payable by shareholders on these distributions or on Fund share redemptions. Index returns include interest income but, unlike Fund returns, do not reflect fees or expenses. The Barclays U.S. Aggregate Bond Index (Barclays U.S. Agg) is a widely recognized, unmanaged index of U.S. dollar-denominated, investment-grade, taxable fixed income securities.
Barclays® is a trademark of Barclays Bank PLC.
FUND EXPENSE EXAMPLE
As a Fund shareholder, you incur ongoing Fund costs, including management fees and other Fund expenses. All mutual funds have ongoing costs, sometimes referred to as operating expenses. The following example shows ongoing costs of investing in the Fund and can help you understand these costs and compare them with those of other mutual funds. The example assumes a $1,000 investment held for the six months indicated.
ACTUAL EXPENSES
The first line of the table below provides information about actual account values and expenses based on the Fund’s actual returns. You may use the information in this line, together with your account balance, to estimate the expenses that you paid over the period. Simply divide your account value by $1,000 (for example, an $8,600 account value divided by $1,000 = 8.6), then multiply the result by the number in the first line under the heading “Expenses Paid During Period” to estimate the expenses you paid on your account during this period.
HYPOTHETICAL EXAMPLE FOR COMPARISON WITH OTHER MUTUAL FUNDS
Information on the second line of the table can help you compare ongoing costs of investing in the Fund with those of other mutual funds. This information may not be used to estimate the actual ending account balance or expenses you paid during the period. The hypothetical “Ending Account Value” is based on the actual expense ratio of the Fund and an assumed 5% annual rate of return before expenses (not the Fund’s actual return). The amount under the heading “Expense Paid During the Period” shows the hypothetical expenses your account would have incurred under this scenario. You can compare this figure with the 5% hypothetical examples that appear in shareholder reports of other mutual funds.
| | | | | | | | | | | | |
Six Months Ended December 31, 2013 | | Beginning Account Value
7/1/2013 | | | Ending Account Value
12/31/2013 | | | Expenses Paid
During Period* | |
Based on Actual Fund Return | | $ | 1,000.00 | | | $ | 1,019.70 | | | $ | 2.20 | |
Based on Hypothetical 5% Yearly Return | | | 1,000.00 | | | | 1,023.03 | | | | 2.20 | |
| * | | Expenses are equal to the Fund’s annualized expense ratio of 0.43%, multiplied by the average account value over the period, multiplied by 184/365 (to reflect the one-half year period). |
The expenses shown in the table highlight ongoing costs only and do not reflect any transactional fees or account maintenance fees. Though other mutual funds may charge such fees, please note that the Fund does not charge transaction fees (e.g., redemption fees, sales loads) or universal account maintenance fees (e.g., small account fees).
PAGE 5 § DODGE & COX INCOME FUND
| | | | |
| FUND INFORMATION | | | December 31, 2013 | |
| | | | |
| GENERAL INFORMATION | | | |
Net Asset Value Per Share | | | $13.53 | |
Total Net Assets (billions) | | | $24.7 | |
30-Day SEC Yield(a) | | | 2.74% | |
Expense Ratio | | | 0.43% | |
Portfolio Turnover Rate | | | 38% | |
Fund Inception | | | 1989 | |
No sales charges or distribution fees | | | | |
Investment Manager: Dodge & Cox, San Francisco. Managed by the Fixed Income Investment Policy Committee, whose ten members’ average tenure at Dodge & Cox is 18 years.
| | | | | | | | |
| PORTFOLIO CHARACTERISTICS | | Fund | | | Barclays
U.S. Agg | |
Number of Fixed Income Securities | | | 766 | | | | 8,727 | |
Effective Maturity (years)(b) | | | 7.9 | | | | 7.6 | |
Effective Duration (years)(c) | | | 4.4 | | | | 5.6 | |
| | | | |
| FIVE LARGEST CORPORATE ISSUERS(d) | | Fund | |
Bank of America Corp. | | | 2.2 | |
Ford Motor Credit Co. LLC | | | 2.0 | |
Time Warner Cable, Inc. | | | 2.0 | |
Citigroup, Inc. | | | 1.8 | |
Xerox Corp. | | | 1.8 | |
| | | | | | | | |
| CREDIT QUALITY (%)(e) | | Fund | | | Barclays
U.S. Agg | |
U.S. Treasury/Agency/GSE(b) | | | 40.4 | | | | 69.5 | |
Aaa | | | 1.8 | | | | 4.0 | |
Aa | | | 2.1 | | | | 3.8 | |
A | | | 13.2 | | | | 11.1 | |
Baa | | | 27.9 | | | | 11.6 | |
Ba | | | 9.7 | | | | 0.0 | |
B | | | 2.7 | | | | 0.0 | |
Caa | | | 0.0 | (g) | | | 0.0 | |
Cash Equivalents | | | 2.2 | | | | 0.0 | |
|
| ASSET ALLOCATION |
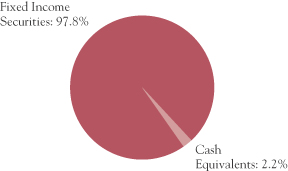
|
| | | | | | | | |
| SECTOR DIVERSIFICATION (%) | | Fund | | | Barclays
U.S. Agg | |
U.S. Treasury(b) | | | 3.4 | | | | 35.7 | |
Government-Related | | | 9.6 | | | | 10.0 | |
Mortgage-Related | | | 36.3 | | | | 29.8 | |
Corporate | | | 46.7 | | | | 22.3 | |
Asset-Backed/Commercial Mortgage-Backed(f) | | | 1.8 | | | | 2.2 | |
Cash Equivalents | | | 2.2 | | | | 0.0 | |
| | | | | | | | |
| MATURITY DIVERSIFICATION (%) | | Fund | | | Barclays
U.S. Agg | |
0-1 Years to Maturity | | | 8.5 | | | | 0.0 | |
1-5 | | | 39.0 | | | | 43.9 | |
5-10(b) | | | 32.6 | | | | 37.4 | |
10-15 | | | 3.6 | | | | 8.2 | |
15-20 | | | 4.3 | | | | 1.6 | |
20-25 | | | 6.7 | | | | 2.5 | |
25 and Over | | | 5.3 | | | | 6.4 | |
| (a) | SEC Yield is an annualization of the Fund’s total net investment income per share for the 30-day period ended on the last day of the month. |
| (b) | Data as presented excludes the effect of the Fund’s short position in 10-year Treasury futures contracts (notional value = 2.2% of the Fund’s net assets). If exposure to Treasury futures contracts had been included, the effective maturity would be 0.2 years lower. |
| (c) | Data as presented includes the effect of Treasury futures contracts. |
| (d) | The Fund’s portfolio holdings are subject to change without notice. The mention of specific securities is not a recommendation to buy, sell, or hold any particular security and is not indicative of Dodge & Cox’s current or future trading activity. |
| (e) | The credit quality distributions shown for the Fund and the Index are based on the middle of Moody’s, Standard & Poor’s, and Fitch ratings, which is the methodology used by Barclays in constructing its indices. If a security is rated by only two agencies, the lower of the two ratings is used. Please note the Fund applies the highest of Moody’s, Standard & Poor’s, and Fitch ratings to comply with the quality requirements stated in its prospectus. On that basis, the Fund held 69.0% in securities rated A—or better and 8.4% in securities rated below investment grade. The credit quality of the investments in the portfolio does not apply to the stability or safety of the Fund or its shares. |
| (f) | Commercial mortgage-backed securities are a component of the Barclays U.S. Aggregate but are not currently held by the Fund. |
DODGE & COX INCOME FUND §PAGE 6
| | | | |
PORTFOLIO OF INVESTMENTS | | | December 31, 2013 | |
| | | | | | | | |
| FIXED INCOME SECURITIES: 97.8% | |
| | |
| | | PAR VALUE | | | VALUE | |
| U.S. TREASURY: 3.4% | |
U.S. Treasury Note | | | | | | | | |
1.00%, 5/15/14 | | $ | 171,570,000 | | | $ | 172,139,613 | |
0.25%, 6/30/14 | | | 211,245,000 | | | | 211,409,982 | |
0.125%, 7/31/14 | | | 246,495,000 | | | | 246,523,840 | |
0.25%, 10/31/14 | | | 200,000,000 | | | | 200,171,800 | |
| | | | | | | | |
| | | | 830,245,235 | |
| GOVERNMENT-RELATED: 9.6% | |
FEDERAL AGENCY: 0.7% | | | | | | | | |
Arkansas Dev. Finance Authority
9.75%, 11/15/14 | | | 6,777 | | | | 6,898 | |
Small Business Admin. - 504 Program | | | | | | | | |
Series 1994-20A 1, 6.50%, 1/1/14 | | | 45,013 | | | | 45,021 | |
Series 1994-20D 1, 7.70%, 4/1/14 | | | 11,123 | | | | 11,296 | |
Series 1994-20E 1, 7.75%, 5/1/14 | | | 56,598 | | | | 57,747 | |
Series 1994-20F 1, 7.60%, 6/1/14 | | | 34,332 | | | | 35,181 | |
Series 1994-20G 1, 8.00%, 7/1/14 | | | 62,576 | | | | 63,676 | |
Series 1994-20H 1, 7.95%, 8/1/14 | | | 30,711 | | | | 31,356 | |
Series 1994-20I 1, 7.85%, 9/1/14 | | | 23,793 | | | | 24,196 | |
Series 1994-20K 1, 8.65%, 11/1/14 | | | 30,745 | | | | 31,730 | |
Series 1994-20L 1, 8.40%, 12/1/14 | | | 25,944 | | | | 26,797 | |
Series 1995-20A 1, 8.50%, 1/1/15 | | | 22,657 | | | | 23,565 | |
Series 1995-20C 1, 8.10%, 3/1/15 | | | 47,391 | | | | 48,742 | |
Series 1997-20E 1, 7.30%, 5/1/17 | | | 112,387 | | | | 119,057 | |
Series 1997-20H 1, 6.80%, 8/1/17 | | | 22,013 | | | | 23,227 | |
Series 1997-20J 1, 6.55%, 10/1/17 | | | 278,556 | | | | 297,819 | |
Series 1997-20L 1, 6.55%, 12/1/17 | | | 13,181 | | | | 13,973 | |
Series 1998-20B 1, 6.15%, 2/1/18 | | | 41,508 | | | | 43,903 | |
Series 1998-20C 1, 6.35%, 3/1/18 | | | 1,171,964 | | | | 1,244,373 | |
Series 1998-20H 1, 6.15%, 8/1/18 | | | 519,426 | | | | 552,670 | |
Series 1998-20L 1, 5.80%, 12/1/18 | | | 296,370 | | | | 318,410 | |
Series 1999-20C 1, 6.30%, 3/1/19 | | | 287,982 | | | | 312,340 | |
Series 1999-20E 1, 6.30%, 5/1/19 | | | 7,893 | | | | 8,614 | |
Series 1999-20G 1, 7.00%, 7/1/19 | | | 660,871 | | | | 718,876 | |
Series 1999-20I 1, 7.30%, 9/1/19 | | | 199,127 | | | | 217,778 | |
Series 2000-20C 1, 7.625%, 3/1/20 | | | 16,894 | | | | 18,571 | |
Series 2000-20G 1, 7.39%, 7/1/20 | | | 12,189 | | | | 13,469 | |
Series 2001-20G 1, 6.625%, 7/1/21 | | | 2,312,997 | | | | 2,542,481 | |
Series 2001-20L 1, 5.78%, 12/1/21 | | | 5,908,283 | | | | 6,444,187 | |
Series 2002-20A 1, 6.14%, 1/1/22 | | | 41,496 | | | | 45,279 | |
Series 2002-20L 1, 5.10%, 12/1/22 | | | 1,691,312 | | | | 1,836,233 | |
Series 2003-20G 1, 4.35%, 7/1/23 | | | 115,842 | | | | 122,830 | |
Series 2004-20L 1, 4.87%, 12/1/24 | | | 2,637,874 | | | | 2,823,807 | |
Series 2005-20B 1, 4.625%, 2/1/25 | | | 4,137,612 | | | | 4,390,922 | |
Series 2005-20D 1, 5.11%, 4/1/25 | | | 191,603 | | | | 205,205 | |
Series 2005-20E 1, 4.84%, 5/1/25 | | | 6,816,732 | | | | 7,257,728 | |
Series 2005-20G 1, 4.75%, 7/1/25 | | | 7,713,708 | | | | 8,217,994 | |
Series 2005-20H 1, 5.11%, 8/1/25 | | | 95,699 | | | | 103,893 | |
Series 2005-20I 1, 4.76%, 9/1/25 | | | 8,252,927 | | | | 8,789,497 | |
Series 2006-20A 1, 5.21%, 1/1/26 | | | 8,886,241 | | | | 9,583,170 | |
Series 2006-20B 1, 5.35%, 2/1/26 | | | 2,644,636 | | | | 2,887,358 | |
Series 2006-20C 1, 5.57%, 3/1/26 | | | 12,078,080 | | | | 13,200,038 | |
| | | | | | | | |
| | |
| | | PAR VALUE | | | VALUE | |
Series 2006-20G 1, 6.07%, 7/1/26 | | $ | 23,053,481 | | | $ | 25,659,612 | |
Series 2006-20H 1, 5.70%, 8/1/26 | | | 180,856 | | | | 197,634 | |
Series 2006-20I 1, 5.54%, 9/1/26 | | | 394,627 | | | | 431,175 | |
Series 2006-20J 1, 5.37%, 10/1/26 | | | 7,236,685 | | | | 7,823,586 | |
Series 2006-20L 1, 5.12%, 12/1/26 | | | 5,658,737 | | | | 6,013,246 | |
Series 2007-20A 1, 5.32%, 1/1/27 | | | 12,988,004 | | | | 14,139,114 | |
Series 2007-20C 1, 5.23%, 3/1/27 | | | 19,700,524 | | | | 21,351,257 | |
Series 2007-20D 1, 5.32%, 4/1/27 | | | 20,009,360 | | | | 21,822,751 | |
Series 2007-20G 1, 5.82%, 7/1/27 | | | 13,585,344 | | | | 15,033,379 | |
| | | | | | | | |
| | | | 185,231,661 | |
FOREIGN AGENCY: 2.2% | | | | | | | | |
Export-Import Bank of Korea(c)
(South Korea) 4.00%, 1/11/17 | | | 146,385,000 | | | | 155,078,951 | |
Petroleo Brasileiro SA(c) (Brazil) | | | | | | | | |
5.75%, 1/20/20 | | | 43,955,000 | | | | 45,227,014 | |
5.375%, 1/27/21 | | | 288,355,000 | | | | 286,160,042 | |
4.375%, 5/20/23 | | | 58,575,000 | | | | 52,183,999 | |
| | | | | | | | |
| | | | 538,650,006 | |
LOCAL AUTHORITY: 6.1% | | | | | | | | |
L.A. Unified School District GO | | | | | | | | |
5.75%, 7/1/34 | | | 1,830,000 | | | | 2,025,938 | |
6.758%, 7/1/34 | | | 134,085,000 | | | | 164,809,237 | |
New Jersey Turnpike Authority RB | | | | | | | | |
7.414%, 1/1/40 | | | 31,485,000 | | | | 41,454,725 | |
7.102%, 1/1/41 | | | 171,503,000 | | | | 218,398,780 | |
New Valley Generation
4.929%, 1/15/21 | | | 416,575 | | | | 460,265 | |
State of California GO | | | | | | | | |
7.50%, 4/1/34 | | | 137,165,000 | | | | 175,004,709 | |
7.55%, 4/1/39 | | | 229,265,000 | | | | 296,547,400 | |
7.30%, 10/1/39 | | | 37,250,000 | | | | 46,826,975 | |
7.625%, 3/1/40 | | | 60,410,000 | | | | 79,008,427 | |
7.60%, 11/1/40 | | | 26,465,000 | | | | 34,865,785 | |
State of Illinois GO | | | | | | | | |
4.961%, 3/1/16 | | | 54,290,000 | | | | 57,791,162 | |
5.365%, 3/1/17 | | | 186,160,000 | | | | 202,030,140 | |
5.665%, 3/1/18 | | | 165,595,000 | | | | 180,329,643 | |
| | | | | | | | |
| | | | 1,499,553,186 | |
SOVEREIGN: 0.6% | | | | | | | | |
Kingdom of Spain(c) (Spain)
4.00%, 3/6/18(b) | | | 141,165,000 | | | | 143,419,546 | |
| | | | | | | | |
| | | | 2,366,854,399 | |
| MORTGAGE-RELATED: 36.3% | | | | | | | | |
FEDERAL AGENCY CMO & REMIC: 8.2% | | | | | |
Dept. of Veterans Affairs | | | | | | | | |
Series 1995-2D 4A, 9.293%, 5/15/25 | | | 179,661 | | | | 214,987 | |
Series 1997-2 Z, 7.50%, 6/15/27 | | | 13,578,594 | | | | 15,468,422 | |
Series 1998-2 2A, 8.765%, 8/15/27 | | | 49,146 | | | | 58,859 | |
Series 1998-1 1A, 8.223%, 3/15/28 | | | 355,380 | | | | 404,032 | |
| | |
| PAGE 7 § DODGE & COX INCOME FUND | | See accompanying Notes to Financial Statements |
| | | | |
| PORTFOLIO OF INVESTMENTS | | | December 31, 2013 | |
| | | | | | | | |
| FIXED INCOME SECURITIES (continued) | |
| | |
| | | PAR VALUE | | | VALUE | |
Fannie Mae | | | | | | | | |
Trust 1998-58 PX, 6.50%, 9/25/28 | | $ | 666,814 | | | $ | 749,719 | |
Trust 1998-58 PC, 6.50%, 10/25/28 | | | 3,450,808 | | | | 3,880,851 | |
Trust 2001-T5 A2, 6.991%, 2/19/30 | | | 66,446 | | | | 75,828 | |
Trust 2001-T5 A3, 7.50%, 6/19/30 | | | 311,062 | | | | 366,888 | |
Trust 2001-69 PQ, 6.00%, 12/25/31 | | | 4,139,807 | | | | 4,599,268 | |
Trust 2002-33 A1, 7.00%, 6/25/32 | | | 3,136,008 | | | | 3,598,755 | |
Trust 2002-69 Z, 5.50%, 10/25/32 | | | 646,183 | | | | 702,560 | |
Trust 2008-24 GD, 6.50%, 3/25/37 | | | 5,179,651 | | | | 5,590,244 | |
Trust 2009-30 AG, 6.50%, 5/25/39 | | | 26,316,494 | | | | 28,688,136 | |
Trust 2009-53 QM, 5.50%, 5/25/39 | | | 6,711,223 | | | | 7,277,194 | |
Trust 2009-40 TB, 6.00%, 6/25/39 | | | 13,616,790 | | | | 14,905,579 | |
Trust 2001-T3 A1, 7.50%, 11/25/40 | | | 169,403 | | | | 196,784 | |
Trust 2010-123 WT, 7.00%, 11/25/40 | | | 87,933,476 | | | | 97,775,166 | |
Trust 2001-T7 A1, 7.50%, 2/25/41 | | | 116,280 | | | | 136,386 | |
Trust 2001-T4 A1, 7.50%, 7/25/41 | | | 2,734,377 | | | | 3,237,467 | |
Trust 2001-T10 A1, 7.00%, 12/25/41 | | | 3,378,106 | | | | 3,926,555 | |
Trust 2013-106 MA, 4.00%, 2/25/42 | | | 35,602,328 | | | | 37,553,157 | |
Trust 2002-T12 A3, 7.50%, 5/25/42 | | | 64,364 | | | | 76,355 | |
Trust 2002-90 A1, 6.50%, 6/25/42 | | | 6,757,118 | | | | 7,769,098 | |
Trust 2002-W6 2A1, 6.502%, 6/25/42 | | | 4,170,596 | | | | 4,838,829 | |
Trust 2002-W8 A2, 7.00%, 6/25/42 | | | 2,197,187 | | | | 2,546,423 | |
Trust 2002-T16 A3, 7.50%, 7/25/42 | | | 4,929,529 | | | | 5,624,573 | |
Trust 2003-W2 1A2, 7.00%, 7/25/42 | | | 10,839,407 | | | | 12,408,412 | |
Trust 2003-W4 3A, 6.633%, 10/25/42 | | | 3,962,908 | | | | 4,499,189 | |
Trust 2012-121 NB, 7.00%, 11/25/42 | | | 2,763,121 | | | | 3,069,410 | |
Trust 2003-7 A1, 6.50%, 12/25/42 | | | 5,532,491 | | | | 6,372,655 | |
Trust 2003-W1 1A1, 5.963%, 12/25/42 | | | 8,183,900 | | | | 9,158,292 | |
Trust 2003-W1 2A, 6.716%, 12/25/42 | | | 3,981,764 | | | | 4,592,726 | |
Trust 2012-133 HF, 0.515%, 12/25/42 | | | 63,725,219 | | | | 63,284,942 | |
Trust 2012-133 JF, 0.515%, 12/25/42 | | | 22,010,347 | | | | 21,872,673 | |
Trust 2012-134 FD, 0.515%, 12/25/42 | | | 1,691,852 | | | | 1,668,240 | |
Trust 2012-134 FT, 0.515%, 12/25/42 | | | 89,222,853 | | | | 89,344,642 | |
Trust 2012-148 LF, 0.465%, 1/25/43 | | | 74,931,276 | | | | 74,300,205 | |
Trust 2013-6 FL, 0.565%, 2/25/43 | | | 204,601,820 | | | | 203,433,339 | |
Trust 2013-15 FA, 0.515%, 3/25/43 | | | 2,394,525 | | | | 2,366,025 | |
Trust 2013-98 FA, 0.715%, 9/25/43 | | | 56,534,314 | | | | 56,515,601 | |
Trust 2013-101 CF, 0.765%, 10/25/43 | | | 27,966,311 | | | | 27,983,483 | |
Trust 2013-101 FE, 0.765%, 10/25/43 | | | 44,472,627 | | | | 44,570,022 | |
Trust 2004-T1 1A2, 6.50%, 1/25/44 | | | 3,736,089 | | | | 4,224,856 | |
Trust 2004-W2 2A2, 7.00%, 2/25/44 | | | 227,939 | | | | 264,187 | |
Trust 2004-W2 5A, 7.50%, 3/25/44 | | | 10,963,072 | | | | 12,825,171 | |
Trust 2004-W8 3A, 7.50%, 6/25/44 | | | 7,525,043 | | | | 8,753,973 | |
Trust 2004-W14 1AF, 0.565%, 7/25/44 | | | 2,456,075 | | | | 2,406,639 | |
Trust 2004-W15 1A2, 6.50%, 8/25/44 | | | 1,715,548 | | | | 1,925,560 | |
Trust 2005-W1 1A3, 7.00%, 10/25/44 | | | 9,102,825 | | | | 10,372,533 | |
Trust 2001-79 BA, 7.00%, 3/25/45 | | | 1,134,143 | | | | 1,288,061 | |
Trust 2006-W1 1A1, 6.50%, 12/25/45 | | | 828,136 | | | | 934,156 | |
Trust 2006-W1 1A2, 7.00%, 12/25/45 | | | 5,969,911 | | | | 6,695,195 | |
Trust 2006-W1 1A3, 7.50%, 12/25/45 | | | 104,603 | | | | 120,530 | |
Trust 2006-W1 1A4, 8.00%, 12/25/45 | | | 7,081,866 | | | | 8,314,040 | |
Trust 2007-W10 1A, 6.265%, 8/25/47 | | | 28,135,578 | | | | 31,583,312 | |
Trust 2007-W10 2A, 6.296%, 8/25/47 | | | 8,326,249 | | | | 9,380,127 | |
| | | | | | | | |
| | |
| | | PAR VALUE | | | VALUE | |
Freddie Mac | | | | | | | | |
Series 2456 CJ, 6.50%, 6/15/32 | | $ | 390,911 | | | $ | 436,302 | |
Series 3312 AB, 6.50%, 6/15/32 | | | 7,049,887 | | | | 7,818,691 | |
Series T-41 2A, 6.314%, 7/25/32 | | | 250,231 | | | | 276,016 | |
Series 2587 ZU, 5.50%, 3/15/33 | | | 12,293,239 | | | | 13,362,664 | |
Series 2610 UA, 4.00%, 5/15/33 | | | 3,894,201 | | | | 4,073,537 | |
Series T-48 1A, 5.85%, 7/25/33 | | | 4,016,698 | | | | 4,539,122 | |
Series 2708 ZD, 5.50%, 11/15/33 | | | 46,993,125 | | | | 51,262,544 | |
Series 3330 GZ, 5.50%, 6/15/37 | | | 15,713,987 | | | | 17,023,684 | |
Series 4091 JF, 0.667%, 6/15/41 | | | 35,441,307 | | | | 34,998,716 | |
Series 4120 YF, 0.517%, 10/15/42 | | | 97,508,449 | | | | 96,894,146 | |
Series 4122 FP, 0.567%, 10/15/42 | | | 51,261,150 | | | | 50,569,227 | |
Series 309 F4, 0.697%, 8/15/43 | | | 98,628,381 | | | | 98,490,836 | |
Series 311 F1, 0.717%, 8/15/43 | | | 140,385,663 | | | | 140,609,460 | |
Series 4240 FA, 0.667%, 8/15/43 | | | 24,171,728 | | | | 24,033,369 | |
Series T-51 1A, 6.50%, 9/25/43 | | | 88,055 | | | | 99,898 | |
Series 4259 FA, 0.667%, 10/15/43 | | | 48,759,960 | | | | 48,709,054 | |
Series 4281 BC, 6.876%, 12/15/43 | | | 209,428,788 | | | | 231,557,884 | |
Series 4283 DW, 6.816%, 12/15/43 | | | 126,715,000 | | | | 139,747,638 | |
Series 4283 EW, 6.816%, 12/15/43 | | | 77,372,565 | | | | 84,880,799 | |
| | | | | | | | |
| | | | 2,024,173,898 | |
|
FEDERAL AGENCY MORTGAGE PASS-THROUGH: 28.1% | |
Fannie Mae, 10 Year
6.00%, 11/1/16 | | | 1,805,485 | | | | 1,894,176 | |
Fannie Mae, 15 Year | | | | | | | | |
4.00%, 9/1/25-2/1/27 | | | 133,107,996 | | | | 141,071,823 | |
5.00%, 9/1/25 | | | 141,964,677 | | | | 153,196,028 | |
5.50%, 1/1/18-7/1/25 | | | 390,231,893 | | | | 427,076,604 | |
6.00%, 7/1/16-3/1/23 | | | 169,348,842 | | | | 182,632,158 | |
6.50%, 12/1/14-12/1/19 | | | 23,027,007 | | | | 24,337,772 | |
7.00%, 9/1/14-11/1/17 | | | 73,025 | | | | 76,299 | |
7.50%, 11/1/14-8/1/17 | | | 1,385,509 | | | | 1,442,726 | |
Fannie Mae, 20 Year | | | | | | | | |
4.00%, 10/1/30-10/1/31 | | | 210,262,923 | | | | 219,665,030 | |
4.50%, 3/1/29-1/1/34 | | | 741,469,091 | | | | 793,210,331 | |
6.00%, 6/1/27-2/1/28 | | | 10,668,735 | | | | 11,879,955 | |
6.50%, 4/1/19-10/1/24 | | | 12,724,350 | | | | 14,143,887 | |
Fannie Mae, 30 Year | | | | | | | | |
4.50%, 12/1/41 | | | 3,427,680 | | | | 3,642,398 | |
5.50%, 2/1/33-11/1/39 | | | 470,065,476 | | | | 518,013,454 | |
6.00%, 11/1/28-6/1/40 | | | 543,166,897 | | | | 600,816,929 | |
6.50%, 12/1/32-8/1/39 | | | 232,700,983 | | | | 256,944,538 | |
7.00%, 4/1/32-2/1/39 | | | 209,726,325 | | | | 233,839,385 | |
Fannie Mae, Hybrid ARM | | | | | | | | |
1.793%, 8/1/34 | | | 3,559,782 | | | | 3,740,061 | |
1.87%, 1/1/35 | | | 4,694,302 | | | | 4,953,064 | |
1.879%, 6/1/43 | | | 7,992,233 | | | | 8,075,916 | |
1.945%, 11/1/35 | | | 3,776,485 | | | | 3,953,035 | |
1.964%, 9/1/43 | | | 18,158,357 | | | | 18,361,182 | |
1.988%, 10/1/34 | | | 3,821,801 | | | | 4,047,498 | |
2.053%, 8/1/35 | | | 3,309,022 | | | | 3,516,305 | |
2.121%, 9/1/34 | | | 5,191,767 | | | | 5,408,679 | |
| | |
| See accompanying Notes to Financial Statements | | DODGE & COX INCOME FUND §PAGE 8 |
| | | | |
| PORTFOLIO OF INVESTMENTS | | | December 31, 2013 | |
| | | | | | | | |
| FIXED INCOME SECURITIES (continued) | |
| | |
| | | PAR VALUE | | | VALUE | |
2.139%, 8/1/35 | | $ | 11,825,598 | | | $ | 12,573,362 | |
2.166%, 7/1/35 | | | 2,688,034 | | | | 2,828,007 | |
2.184%, 7/1/35 | | | 2,809,494 | | | | 2,954,798 | |
2.243%, 4/1/35 | | | 5,808,646 | | | | 6,196,372 | |
2.267%, 10/1/33-8/1/34 | | | 5,441,276 | | | | 5,777,821 | |
2.275%, 12/1/36 | | | 5,473,512 | | | | 5,795,261 | |
2.296%, 12/1/35 | | | 3,823,114 | | | | 4,029,678 | |
2.301%, 10/1/35 | | | 5,492,309 | | | | 5,809,666 | |
2.316%, 1/1/36 | | | 7,298,587 | | | | 7,767,016 | |
2.338%, 10/1/38 | | | 7,026,068 | | | | 7,360,956 | |
2.348%, 7/1/35 | | | 3,239,056 | | | | 3,456,082 | |
2.373%, 10/1/35 | | | 3,332,915 | | | | 3,520,171 | |
2.379%, 10/1/38 | | | 12,579,523 | | | | 13,305,804 | |
2.412%, 9/1/35 | | | 4,742,872 | | | | 5,021,311 | |
2.426%, 1/1/36 | | | 8,105,299 | | | | 8,564,436 | |
2.439%, 1/1/37 | | | 5,632,959 | | | | 5,971,462 | |
2.453%, 11/1/36 | | | 4,951,819 | | | | 5,233,586 | |
2.462%, 7/1/34 | | | 4,364,702 | | | | 4,615,368 | |
2.479%, 8/1/35 | | | 7,484,243 | | | | 7,969,240 | |
2.50%, 6/1/35-7/1/35 | | | 4,683,259 | | | | 4,951,431 | |
2.511%, 9/1/38 | | | 1,245,411 | | | | 1,325,133 | |
2.689%, 2/1/43 | | | 18,764,853 | | | | 19,553,439 | |
2.718%, 1/1/35 | | | 2,115,284 | | | | 2,254,755 | |
2.826%, 2/1/37 | | | 13,000,476 | | | | 13,905,139 | |
3.857%, 10/1/38 | | | 4,016,147 | | | | 4,258,941 | |
4.155%, 12/1/39 | | | 6,217,874 | | | | 6,599,105 | |
4.941%, 5/1/38 | | | 6,363,485 | | | | 6,814,430 | |
5.092%, 4/1/38 | | | 1,626,340 | | | | 1,745,823 | |
5.217%, 8/1/37 | | | 866,762 | | | | 933,324 | |
5.549%, 6/1/39 | | | 2,998,937 | | | | 3,156,409 | |
5.621%, 7/1/36 | | | 73,376 | | | | 77,153 | |
5.645%, 4/1/37 | | | 1,370,502 | | | | 1,466,033 | |
5.723%, 11/1/37 | | | 4,234,775 | | | | 4,539,462 | |
5.787%, 12/1/36 | | | 2,976,193 | | | | 3,203,225 | |
5.873%, 8/1/37 | | | 7,106,181 | | | | 7,681,986 | |
Fannie Mae, Multifamily DUS | | | | | | | | |
Pool 735745, 4.99%, 1/1/17 | | | 153,545 | | | | 158,159 | |
Pool 745629, 5.195%, 1/1/18 | | | 323,885 | | | | 349,180 | |
Pool 462084, 5.275%, 11/1/15 | | | 126,406 | | | | 131,722 | |
Pool 888559, 5.452%, 6/1/17 | | | 21,425,352 | | | | 23,582,387 | |
Pool 888381, 5.508%, 4/1/17 | | | 631,931 | | | | 689,053 | |
Pool 888015, 5.538%, 11/1/16 | | | 39,074,753 | | | | 42,888,169 | |
Pool 745936, 6.084%, 8/1/16 | | | 794,793 | | | | 883,923 | |
Freddie Mac, Hybrid ARM | | | | | | | | |
1.824%, 1/1/36 | | | 4,736,844 | | | | 4,955,688 | |
1.99%, 8/1/36 | | | 5,216,613 | | | | 5,520,036 | |
2.214%, 2/1/38 | | | 14,646,311 | | | | 15,492,483 | |
2.25%, 4/1/35 | | | 1,730,983 | | | | 1,839,013 | |
2.276%, 1/1/36 | | | 5,587,352 | | | | 5,921,173 | |
2.308%, 10/1/35 | | | 5,366,688 | | | | 5,719,729 | |
2.33%, 4/1/37 | | | 2,208,400 | | | | 2,324,723 | |
2.375%, 5/1/37-7/1/37 | | | 21,435,230 | | | | 22,759,112 | |
2.383%, 2/1/35 | | | 1,901,430 | | | | 2,009,784 | |
| | | | | | | | |
| | |
| | | PAR VALUE | | | VALUE | |
2.396%, 1/1/36 | | $ | 13,961,362 | | | $ | 14,804,133 | |
2.435%, 9/1/33 | | | 12,221,437 | | | | 12,909,562 | |
2.439%, 6/1/38 | | | 7,817,168 | | | | 8,294,570 | |
2.445%, 3/1/37 | | | 7,631,036 | | | | 8,080,792 | |
2.449%, 9/1/35 | | | 5,697,163 | | | | 6,036,692 | |
2.45%, 2/1/34 | | | 9,502,644 | | | | 9,965,042 | |
2.451%, 8/1/34 | | | 2,059,586 | | | | 2,161,580 | |
2.46%, 8/1/35 | | | 3,415,437 | | | | 3,609,035 | |
2.477%, 4/1/37 | | | 3,885,889 | | | | 4,038,218 | |
2.50%, 1/1/35 | | | 3,191,940 | | | | 3,369,184 | |
2.528%, 8/1/35 | | | 4,767,589 | | | | 5,058,981 | |
2.543%, 4/1/38 | | | 12,136,450 | | | | 12,853,167 | |
2.602%, 3/1/35 | | | 2,547,716 | | | | 2,711,672 | |
2.656%, 4/1/38 | | | 15,505,510 | | | | 16,648,108 | |
2.666%, 4/1/36 | | | 8,401,332 | | | | 8,934,916 | |
2.687%, 1/1/37 | | | 5,266,498 | | | | 5,642,818 | |
2.891%, 10/1/38 | | | 4,787,672 | | | | 5,093,055 | |
3.568%, 10/1/38 | | | 2,103,014 | | | | 2,244,244 | |
5.018%, 11/1/34 | | | 3,082,347 | | | | 3,232,019 | |
5.053%, 6/1/38 | | | 3,132,734 | | | | 3,274,025 | |
5.471%, 11/1/39 | | | 10,692,393 | | | | 11,278,463 | |
5.809%, 1/1/38 | | | 3,114,348 | | | | 3,261,265 | |
6.112%, 12/1/36 | | | 4,073,694 | | | | 4,259,564 | |
6.225%, 10/1/37 | | | 2,369,225 | | | | 2,464,838 | |
Freddie Mac Gold, 15 Year | | | | | | | | |
4.00%, 6/1/26-6/1/27 | | | 628,111,845 | | | | 664,475,937 | |
4.50%, 3/1/25-6/1/26 | | | 44,171,977 | | | | 47,378,798 | |
5.50%, 10/1/20-12/1/24 | | | 24,916,669 | | | | 27,048,347 | |
6.00%, 8/1/16-11/1/23 | | | 54,113,280 | | | | 58,560,340 | |
6.50%, 7/1/14-9/1/18 | | | 7,546,390 | | | | 7,964,704 | |
Freddie Mac Gold, 20 Year | | | | | | | | |
4.00%, 9/1/31 | | | 99,312,823 | | | | 103,904,821 | |
4.50%, 5/1/30-7/1/31 | | | 234,029,787 | | | | 251,902,771 | |
5.50%, 11/1/23 | | | 11,900,868 | | | | 12,992,632 | |
6.00%, 7/1/25-12/1/27 | | | 57,766,930 | | | | 63,940,760 | |
6.50%, 7/1/21-10/1/26 | | | 6,989,804 | | | | 7,769,615 | |
Freddie Mac Gold, 30 Year | | | | | | | | |
4.50%, 7/1/39-12/1/43 | | | 406,108,158 | | | | 430,288,488 | |
5.50%, 3/1/34-8/1/40 | | | 432,044,799 | | | | 471,774,028 | |
6.00%, 2/1/33-5/1/40 | | | 509,687,023 | | | | 563,018,064 | |
6.50%, 12/1/32-10/1/38 | | | 47,034,505 | | | | 52,020,349 | |
7.00%, 4/1/31-11/1/38 | | | 11,639,327 | | | | 12,955,725 | |
7.90%, 2/17/21 | | | 728,276 | | | | 778,119 | |
Ginnie Mae, 30 Year | | | | | | | | |
7.00%, 5/15/28 | | | 635,202 | | | | 730,560 | |
7.50%, 9/15/17-5/15/25 | | | 2,370,423 | | | | 2,677,323 | |
7.80%, 6/15/20-1/15/21 | | | 569,989 | | | | 624,385 | |
7.85%, 1/15/21-10/15/21 | | | 10,166 | | | | 10,297 | |
8.00%, 9/15/20 | | | 11,865 | | | | 13,592 | |
| | | | | | | | |
| | | | 6,913,435,350 | |
| | |
| PAGE 9 § DODGE & COX INCOME FUND | | See accompanying Notes to Financial Statements |
| | | | |
| PORTFOLIO OF INVESTMENTS | | | December 31, 2013 | |
| | | | | | | | |
| FIXED INCOME SECURITIES (continued) | |
| | |
| | | PAR VALUE | | | VALUE | |
PRIVATE LABEL CMO & REMIC: 0.0%(f) | | | | | |
GSMPS Mortgage Loan Trust | | | | | | | | |
Series 2004-4 1A4, 8.50%, 6/25/34 30 Year(b) | | $ | 6,363,627 | | | $ | 6,733,831 | |
| | | | | | | | |
| | | | 8,944,343,079 | |
| ASSET-BACKED: 1.8% | | | | | | | | |
STUDENT LOAN: 0.7% | | | | | | | | |
SLM Student Loan Trust Securities | | | | | | | | |
Series 2007-3 A2, 0.248%, 10/25/17 | | | 3,024,303 | | | | 3,014,879 | |
SLM Student Loan Trust Securities (Private Loans) | | | | | | | | |
Series 2013-A A2A, 1.77%, 5/17/27(b) | | | 9,116,000 | | | | 8,842,046 | |
Series 2012-B A2, 3.48%, 10/15/30(b) | | | 48,950,000 | | | | 51,127,639 | |
Series 2013-C A2A, 2.94%, 10/15/31(b) | | | 22,000,000 | | | | 22,231,858 | |
Series 2012-E A2A, 2.09%, 6/15/45(b) | | | 10,100,000 | | | | 9,956,196 | |
Series 2012-C A2, 3.31%, 10/15/46(b) | | | 88,513,000 | | | | 91,532,621 | |
| | | | | | | | |
| | | | 186,705,239 | |
CREDIT CARD: 1.1% | | | | | | | | |
Chase Issuance Trust | | | | | | | | |
Series 2012-A8, 0.54%, 10/16/17 | | | 262,360,000 | | | | 262,002,666 | |
| | | | | | | | |
| | | | 448,707,905 | |
| CORPORATE: 46.7% | | | | | | | | |
FINANCIALS: 17.0% | | | | | | | | |
Ally Financial, Inc. | | | | | | | | |
4.50%, 2/11/14 | | | 311,103,000 | | | | 312,269,636 | |
American International Group, Inc. | | | | | |
4.25%, 9/15/14 | | | 43,270,000 | | | | 44,351,534 | |
Bank of America Corp. | | | | | | | | |
7.625%, 6/1/19 | | | 219,362,000 | | | | 272,080,611 | |
6.625%, 5/23/36(a) | | | 240,193,000 | | | | 258,072,486 | |
Boston Properties, Inc. | | | | | | | | |
5.625%, 4/15/15 | | | 34,495,000 | | | | 36,599,816 | |
3.70%, 11/15/18 | | | 28,620,000 | | | | 30,190,639 | |
5.875%, 10/15/19 | | | 48,044,000 | | | | 55,582,855 | |
5.625%, 11/15/20 | | | 64,385,000 | | | | 72,435,958 | |
4.125%, 5/15/21 | | | 23,340,000 | | | | 23,844,004 | |
3.85%, 2/1/23 | | | 20,641,000 | | | | 20,167,248 | |
3.125%, 9/1/23 | | | 23,745,000 | | | | 21,688,422 | |
3.80%, 2/1/24 | | | 55,875,000 | | | | 53,582,002 | |
Capital One Financial Corp. | | | | | | | | |
4.75%, 7/15/21 | | | 80,045,000 | | | | 85,115,771 | |
3.50%, 6/15/23 | | | 176,115,000 | | | | 165,320,559 | |
Cigna Corp. | | | | | | | | |
8.50%, 5/1/19 | | | 74,756,000 | | | | 95,508,789 | |
4.00%, 2/15/22 | | | 39,595,000 | | | | 40,252,521 | |
7.65%, 3/1/23 | | | 6,317,000 | | | | 7,635,257 | |
7.875%, 5/15/27 | | | 29,345,000 | | | | 36,446,234 | |
8.30%, 1/15/33 | | | 8,120,000 | | | | 9,745,421 | |
6.15%, 11/15/36 | | | 101,954,000 | | | | 114,889,210 | |
Citigroup, Inc. | | | | | | | | |
1.941%, 5/15/18 | | | 140,295,000 | | | | 145,896,986 | |
4.05%, 7/30/22 | | | 60,529,000 | | | | 59,854,525 | |
7.875%, 10/30/40(a) | | | 220,242,575 | | | | 239,174,627 | |
| | | | | | | | |
| | |
| | | PAR VALUE | | | VALUE | |
Equity Residential | | | | | | | | |
4.625%, 12/15/21 | | $ | 78,832,000 | | | $ | 83,109,267 | |
3.00%, 4/15/23 | | | 45,775,000 | | | | 41,799,029 | |
General Electric Co. | | | | | | | | |
5.50%, 1/8/20 | | | 176,845,000 | | | | 202,516,351 | |
4.375%, 9/16/20 | | | 64,135,000 | | | | 69,508,807 | |
4.65%, 10/17/21 | | | 47,950,000 | | | | 52,239,032 | |
Health Net, Inc. | | | | | | | | |
6.375%, 6/1/17 | | | 90,532,000 | | | | 97,548,230 | |
HSBC Holdings PLC(c)
(United Kingdom) | | | | | | | | |
5.10%, 4/5/21 | | | 52,165,000 | | | | 57,978,737 | |
9.30%, 6/1/21 | | | 100,000 | | | | 126,664 | |
6.50%, 5/2/36 | | | 131,906,000 | | | | 156,246,878 | |
6.50%, 9/15/37 | | | 81,937,000 | | | | 96,909,840 | |
JPMorgan Chase & Co. | | | | | | | | |
4.95%, 3/25/20 | | | 28,030,000 | | | | 31,086,195 | |
3.375%, 5/1/23 | | | 56,735,000 | | | | 52,877,020 | |
8.75%, 9/1/30(a) | | | 48,403,000 | | | | 62,026,024 | |
Legg Mason, Inc. | | | | | | | | |
5.50%, 5/21/19 | | | 136,605,000 | | | | 149,765,560 | |
Royal Bank of Scotland PLC(c)
(United Kingdom) | | | | | | | | |
4.375%, 3/16/16 | | | 23,180,000 | | | | 24,737,464 | |
6.125%, 1/11/21 | | | 60,735,000 | | | | 68,743,578 | |
6.125%, 12/15/22 | | | 194,969,000 | | | | 199,258,513 | |
6.00%, 12/19/23 | | | 52,185,000 | | | | 52,556,557 | |
SLM Corp. | | | | | | | | |
3.875%, 9/10/15 | | | 56,685,000 | | | | 58,598,119 | |
6.00%, 1/25/17 | | | 141,845,000 | | | | 153,547,212 | |
4.625%, 9/25/17 | | | 41,602,000 | | | | 43,183,791 | |
Unum Group | | | | | | | | |
6.85%, 11/15/15(b) | | | 20,695,000 | | | | 22,651,009 | |
7.19%, 2/1/28 | | | 11,295,000 | | | | 12,345,134 | |
7.25%, 3/15/28 | | | 25,035,000 | | | | 28,786,144 | |
6.75%, 12/15/28 | | | 8,107,000 | | | | 8,950,509 | |
WellPoint, Inc. | | | | | | | | |
5.25%, 1/15/16 | | | 50,068,000 | | | | 54,134,723 | |
5.875%, 6/15/17 | | | 16,016,000 | | | | 18,064,783 | |
7.00%, 2/15/19 | | | 83,470,000 | | | | 99,036,905 | |
| | | | | | | | |
| | | | 4,199,037,186 | |
INDUSTRIALS: 29.7% | | | | | | | | |
AT&T, Inc. | | | | | | | | |
8.00%, 11/15/31 | | | 151,477,000 | | | | 201,604,981 | |
5.35%, 9/1/40 | | | 14,895,000 | | | | 14,737,590 | |
BHP Billiton, Ltd.(c) (Australia) | | | | | | | | |
5.50%, 4/1/14 | | | 48,375,000 | | | | 48,992,023 | |
Boston Scientific Corp. | | | | | | | | |
6.25%, 11/15/15 | | | 14,550,000 | | | | 15,892,456 | |
6.40%, 6/15/16 | | | 109,689,000 | | | | 122,331,864 | |
6.00%, 1/15/20 | | | 15,690,000 | | | | 18,012,606 | |
| | |
| See accompanying Notes to Financial Statements | | DODGE & COX INCOME FUND §PAGE 10 |
| | | | |
| PORTFOLIO OF INVESTMENTS | | | December 31, 2013 | |
| | | | | | | | |
| FIXED INCOME SECURITIES (continued) | |
| | |
| | | PAR VALUE | | | VALUE | |
Burlington Northern Santa Fe LLC(e) | | | | | | | | |
4.70%, 10/1/19 | | $ | 75,445,000 | | | $ | 82,763,919 | |
7.57%, 1/2/21 | | | 15,011,736 | | | | 17,543,879 | |
8.251%, 1/15/21 | | | 5,494,439 | | | | 6,521,125 | |
4.10%, 6/1/21 | | | 5,820,000 | | | | 5,978,752 | |
3.05%, 9/1/22 | | | 14,755,000 | | | | 13,834,199 | |
5.943%, 1/15/23 | | | 93,145 | | | | 99,957 | |
3.85%, 9/1/23 | | | 70,425,000 | | | | 69,272,847 | |
5.72%, 1/15/24 | | | 18,812,381 | | | | 20,980,914 | |
5.342%, 4/1/24 | | | 6,364,236 | | | | 6,935,553 | |
5.629%, 4/1/24 | | | 26,361,429 | | | | 29,151,172 | |
5.996%, 4/1/24 | | | 49,906,259 | | | | 54,991,882 | |
Cemex SAB de CV(c) (Mexico) | | | | | | | | |
6.50%, 12/10/19(b) | | | 128,775,000 | | | | 133,024,575 | |
Comcast Corp. | | | | | | | | |
5.85%, 11/15/15 | | | 24,745,000 | | | | 27,072,985 | |
5.90%, 3/15/16 | | | 40,840,000 | | | | 45,103,247 | |
6.50%, 1/15/17 | | | 40,975,000 | | | | 46,940,878 | |
6.30%, 11/15/17 | | | 16,175,000 | | | | 18,837,987 | |
5.875%, 2/15/18 | | | 68,310,000 | | | | 78,351,160 | |
5.70%, 5/15/18 | | | 2,645,000 | | | | 3,037,132 | |
6.45%, 3/15/37 | | | 3,250,000 | | | | 3,771,765 | |
6.95%, 8/15/37 | | | 37,804,000 | | | | 46,472,457 | |
Cox Communications, Inc. | | | | | | | | |
5.45%, 12/15/14 | | | 14,915,000 | | | | 15,586,936 | |
5.50%, 10/1/15 | | | 150,000 | | | | 161,007 | |
5.875%, 12/1/16(b) | | | 76,215,000 | | | | 84,835,374 | |
9.375%, 1/15/19(b) | | | 145,119,000 | | | | 182,574,939 | |
3.25%, 12/15/22(b) | | | 49,452,000 | | | | 44,748,324 | |
2.95%, 6/30/23(b) | | | 90,030,000 | | | | 78,671,905 | |
CSX Corp. | | | | | | | | |
8.375%, 10/15/14 | | | 39,857 | | | | 42,068 | |
9.75%, 6/15/20 | | | 10,067,000 | | | | 13,488,008 | |
6.251%, 1/15/23 | | | 17,337,488 | | | | 19,904,970 | |
Dillard’s, Inc. | | | | | | | | |
7.13%, 8/1/18 | | | 23,565,000 | | | | 26,687,362 | |
7.875%, 1/1/23 | | | 275,000 | | | | 303,875 | |
7.75%, 7/15/26 | | | 21,016,000 | | | | 22,276,960 | |
7.75%, 5/15/27 | | | 12,748,000 | | | | 13,512,880 | |
7.00%, 12/1/28 | | | 28,225,000 | | | | 28,789,500 | |
Dow Chemical Co. | | | | | | | | |
8.55%, 5/15/19 | | | 106,966,000 | | | | 138,113,857 | |
7.375%, 11/1/29 | | | 48,974,000 | | | | 62,810,648 | |
9.40%, 5/15/39 | | | 122,633,000 | | | | 183,202,542 | |
Eaton Corp. PLC(c) (Ireland) | | | | | | | | |
1.50%, 11/2/17 | | | 22,620,000 | | | | 22,175,110 | |
2.75%, 11/2/22 | | | 61,810,000 | | | | 57,659,953 | |
Enel SPA(c) (Italy) | | | | | | | | |
6.80%, 9/15/37(b) | | | 82,615,000 | | | | 85,632,100 | |
6.00%, 10/7/39(b) | | | 46,581,000 | | | | 44,677,467 | |
8.75%, 9/24/73(b) | | | 33,050,000 | | | | 35,937,479 | |
| | | | | | | | |
| | |
| | | PAR VALUE | | | VALUE | |
FedEx Corp. | | | | | | | | |
7.375%, 1/15/14 | | $ | 22,060,000 | | | $ | 22,110,738 | |
8.00%, 1/15/19 | | | 18,050,000 | | | | 22,431,421 | |
6.72%, 7/15/23 | | | 17,770,510 | | | | 20,478,800 | |
7.65%, 7/15/24 | | | 2,216,526 | | | | 2,657,856 | |
Ford Motor Credit Co. LLC(e) | | | | | | | | |
5.625%, 9/15/15 | | | 49,025,000 | | | | 52,764,137 | |
8.125%, 1/15/20 | | | 6,425,000 | | | | 8,034,141 | |
5.75%, 2/1/21 | | | 237,506,000 | | | | 266,070,134 | |
5.875%, 8/2/21 | | | 80,875,000 | | | | 91,688,715 | |
4.25%, 9/20/22 | | | 44,075,000 | | | | 44,277,569 | |
4.375%, 8/6/23 | | | 41,425,000 | | | | 41,646,997 | |
HCA, Inc. | | | | | | | | |
5.75%, 3/15/14 | | | 63,356,000 | | | | 63,926,204 | |
6.375%, 1/15/15 | | | 80,193,000 | | | | 84,202,650 | |
6.50%, 2/15/16 | | | 235,225,000 | | | | 257,277,344 | |
Hewlett-Packard Co. | | | | | | | | |
6.125%, 3/1/14 | | | 113,340,000 | | | | 114,299,876 | |
3.30%, 12/9/16 | | | 90,705,000 | | | | 94,934,211 | |
Lafarge SA(c) (France) | | | | | | | | |
6.20%, 7/9/15(b) | | | 153,560,000 | | | | 161,551,976 | |
6.50%, 7/15/16 | | | 126,396,000 | | | | 139,667,580 | |
Liberty Interactive Corp. | | | | | | | | |
8.50%, 7/15/29 | | | 11,915,000 | | | | 12,838,413 | |
8.25%, 2/1/30 | | | 28,876,000 | | | | 30,752,940 | |
Macy’s, Inc. | | | | | | | | |
7.875%, 7/15/15 | | | 17,055,000 | | | | 18,805,347 | |
5.90%, 12/1/16 | | | 16,796,000 | | | | 18,839,704 | |
6.65%, 7/15/24 | | | 39,631,000 | | | | 45,526,938 | |
7.00%, 2/15/28 | | | 25,985,000 | | | | 29,429,831 | |
6.70%, 9/15/28 | | | 26,965,000 | | | | 29,747,545 | |
6.90%, 4/1/29 | | | 50,907,000 | | | | 57,768,195 | |
6.90%, 1/15/32 | | | 52,640,000 | | | | 59,543,439 | |
6.70%, 7/15/34 | | | 84,217,000 | | | | 95,827,492 | |
6.375%, 3/15/37 | | | 37,091,000 | | | | 41,391,145 | |
Naspers, Ltd.(c) (South Africa) | | | | | | | | |
6.00%, 7/18/20(b) | | | 92,725,000 | | | | 101,031,889 | |
Nordstrom, Inc. | | | | | | | | |
6.75%, 6/1/14 | | | 42,965,000 | | | | 44,069,115 | |
6.95%, 3/15/28 | | | 12,700,000 | | | | 15,331,681 | |
Norfolk Southern Corp. | | | | | | | | |
7.70%, 5/15/17 | | | 28,585,000 | | | | 33,928,994 | |
9.75%, 6/15/20 | | | 13,763,000 | | | | 18,732,819 | |
Reed Elsevier PLC(c) (United Kingdom) | | | | | | | | |
8.625%, 1/15/19 | | | 27,733,000 | | | | 34,769,389 | |
3.125%, 10/15/22 | | | 125,126,000 | | | | 115,710,769 | |
Sprint Corp. | | | | | | | | |
6.00%, 12/1/16 | | | 118,100,000 | | | | 128,876,625 | |
Telecom Italia SPA(c) (Italy) | | | | | | | | |
6.175%, 6/18/14 | | | 37,712,000 | | | | 38,560,520 | |
6.999%, 6/4/18 | | | 115,022,000 | | | | 127,386,865 | |
| | |
| PAGE 11 § DODGE & COX INCOME FUND | | See accompanying Notes to Financial Statements |
| | | | |
| PORTFOLIO OF INVESTMENTS | | | December 31, 2013 | |
| | | | | | | | |
| FIXED INCOME SECURITIES (continued) | |
| | |
| | | PAR VALUE | | | VALUE | |
7.175%, 6/18/19 | | $ | 137,086,000 | | | $ | 153,879,035 | |
7.20%, 7/18/36 | | | 8,740,000 | | | | 8,412,250 | |
7.721%, 6/4/38 | | | 29,575,000 | | | | 29,575,000 | |
Time Warner Cable, Inc. | | | | | | | | |
8.75%, 2/14/19 | | | 81,779,000 | | | | 97,549,426 | |
8.25%, 4/1/19 | | | 221,533,000 | | | | 259,527,017 | |
5.00%, 2/1/20 | | | 8,200,000 | | | | 8,325,944 | |
4.00%, 9/1/21 | | | 4,085,000 | | | | 3,793,956 | |
6.55%, 5/1/37 | | | 21,396,000 | | | | 19,798,853 | |
7.30%, 7/1/38 | | | 56,835,000 | | | | 56,674,668 | |
6.75%, 6/15/39 | | | 22,060,000 | | | | 20,773,946 | |
5.875%, 11/15/40 | | | 12,650,000 | | | | 10,942,832 | |
5.50%, 9/1/41 | | | 13,655,000 | | | | 11,314,724 | |
Time Warner, Inc. | | | | | | | | |
7.625%, 4/15/31 | | | 162,788,000 | | | | 206,018,958 | |
7.70%, 5/1/32 | | | 154,748,000 | | | | 198,691,944 | |
Twenty-First Century Fox, Inc. | | | | | | | | |
6.20%, 12/15/34 | | | 7,440,000 | | | | 8,235,820 | |
6.40%, 12/15/35 | | | 29,145,000 | | | | 33,130,695 | |
6.15%, 3/1/37 | | | 29,205,000 | | | | 32,098,894 | |
6.65%, 11/15/37 | | | 12,535,000 | | | | 14,631,629 | |
6.15%, 2/15/41 | | | 29,795,000 | | | | 33,207,272 | |
Union Pacific Corp. | | | | | | | | |
5.375%, 5/1/14 | | | 6,926,000 | | | | 7,030,957 | |
4.875%, 1/15/15 | | | 10,449,000 | | | | 10,914,691 | |
6.85%, 1/2/19 | | | 3,925,793 | | | | 4,314,595 | |
6.70%, 2/23/19 | | | 4,586,102 | | | | 5,112,548 | |
7.60%, 1/2/20 | | | 1,555,089 | | | | 1,815,190 | |
4.163%, 7/15/22 | | | 29,962,000 | | | | 30,824,426 | |
6.061%, 1/17/23 | | | 9,541,077 | | | | 10,642,188 | |
4.698%, 1/2/24 | | | 4,542,774 | | | | 4,926,774 | |
3.646%, 2/15/24(b) | | | 42,961,000 | | | | 41,510,766 | |
5.082%, 1/2/29 | | | 9,092,080 | | | | 9,918,178 | |
5.866%, 7/2/30 | | | 47,611,864 | | | | 53,210,543 | |
6.176%, 1/2/31 | | | 35,181,404 | | | | 40,089,252 | |
Verizon Communications, Inc. | | | | | | | | |
5.15%, 9/15/23 | | | 57,075,000 | | | | 61,280,971 | |
6.55%, 9/15/43 | | | 314,280,000 | | | | 367,694,715 | |
Vulcan Materials Co. | |
6.50%, 12/1/16 | | | 33,830,000 | | | | 37,889,600 | |
7.50%, 6/15/21 | | | 94,710,000 | | | | 107,969,400 | |
Xerox Corp. | | | | | | | | |
8.25%, 5/15/14 | | | 5,895,000 | | | | 6,052,992 | |
6.40%, 3/15/16 | | | 72,137,000 | | | | 79,732,305 | |
7.20%, 4/1/16 | | | 25,511,000 | | | | 28,614,490 | |
6.75%, 2/1/17 | | | 62,799,000 | | | | 71,323,839 | |
2.95%, 3/15/17 | | | 1,125,000 | | | | 1,154,913 | |
6.35%, 5/15/18 | | | 106,052,000 | | | | 121,204,710 | |
5.625%, 12/15/19 | | | 66,572,000 | | | | 73,410,342 | |
4.50%, 5/15/21 | | | 54,230,000 | | | | 55,818,234 | |
| | | | | | | | |
| | | | | | | 7,319,980,655 | |
| | | | | | | | |
| | | | | | | 11,519,017,841 | |
| | | | | | | | |
TOTAL FIXED INCOME SECURITIES
(Cost $22,967,096,678) | | | $ | 24,109,168,459 | |
| | | | | | | | |
| SHORT-TERM INVESTMENTS: 3.5% | |
| | |
| | | PAR VALUE | | | VALUE | |
MONEY MARKET FUND: 0.1% | | | | | | | | |
SSgA U.S. Treasury Money
Market Fund | | $ | 24,692,317 | | | $ | 24,692,317 | |
| |
REPURCHASE AGREEMENT: 3.4% | | | | | |
Fixed Income Clearing Corporation(d) 0.00%, dated 12/31/13, due 1/2/14, maturity value $832,595,000 | | | 832,595,000 | | | | 832,595,000 | |
| | | | | | | | |
TOTAL SHORT-TERM INVESTMENTS
(Cost $857,287,317) | | | $ | 857,287,317 | |
| | | | | | | | |
TOTAL INVESTMENTS
(Cost $23,824,383,995) | | | 101.3 | % | | $ | 24,966,455,776 | |
OTHER ASSETS LESS LIABILITIES | | | (1.3 | %) | | | (312,371,675 | ) |
| | | | | | | | |
| NET ASSETS | | | 100.0 | % | | $ | 24,654,084,101 | |
| | | | | | | | |
| (a) | Cumulative preferred security |
| (b) | Security exempt from registration under Rule 144A of the Securities Act of 1933. The security may be resold in transactions exempt from registration, normally to qualified institutional buyers. As of December 31, 2013, all such securities in total represented $1,350,691,540 or 5.5% of net assets. These securities have been deemed liquid by Dodge & Cox, investment manager, pursuant to procedures approved by the Fund’s Board of Trustees. |
| (c) | Security denominated in U.S. dollars |
| (d) | Repurchase agreement is collateralized by U.S. Treasury Notes 1.375%-4.00%, 6/30/18-8/31/18. Total collateral value is $849,254,913. |
| (e) | Subsidiary (see below) |
Fixed income securities are grouped by parent company unless otherwise noted. Actual securities may be issued by the listed parent company or one of its subsidiaries.
ARM: Adjustable Rate Mortgage
CMO: Collateralized Mortgage Obligation
DUS: Delegated Underwriting and Servicing
GO: General Obligation
RB: Revenue Bond
REMIC: Real Estate Mortgage Investment Conduit
FUTURES CONTRACTS
| | | | | | | | | | | | | | | | |
| Description | | Number of
Contracts | | | Expiration
Date | | | Notional
Amount | | | Unrealized
Appreciation | |
10 Year U.S. Treasury
Note - Short Position | | | 4,501 | | | | Mar 2014 | | | $ | (553,833,984 | ) | | $ | 10,605,673 | |
| | |
| See accompanying Notes to Financial Statements | | DODGE & COX INCOME FUND §PAGE 12 |
| | | | |
STATEMENT OF ASSETS AND LIABILITIES | |
| |
| | | December 31, 2013 | |
ASSETS: | | | | |
Investments, at value (cost $23,824,383,995) | | $ | 24,966,455,776 | |
Cash held at broker | | | 7,053,246 | |
Receivable for investments sold | | | 4,201,160 | |
Receivable for Fund shares sold | | | 45,963,822 | |
Receivable from broker for futures variation margin | | | 773,587 | |
Interest receivable | | | 235,968,387 | |
Prepaid expenses and other assets | | | 155,892 | |
| | | | |
| | | 25,260,571,870 | |
| | | | |
LIABILITIES: | | | | |
Payable for investments purchased | | | 563,613,319 | |
Payable for Fund shares redeemed | | | 33,012,374 | |
Management fees payable | | | 8,354,579 | |
Accrued expenses | | | 1,507,497 | |
| | | | |
| | | 606,487,769 | |
| | | | |
NET ASSETS | | $ | 24,654,084,101 | |
| | | | |
NET ASSETS CONSIST OF: | | | | |
Paid in capital | | $ | 23,424,913,513 | |
Undistributed net investment income | | | 7,228,684 | |
Undistributed net realized gain | | | 69,256,484 | |
Net unrealized appreciation | | | 1,152,685,420 | |
| | | | |
| | $ | 24,654,084,101 | |
| | | | |
Fund shares outstanding (par value $0.01 each, unlimited shares authorized) | | | 1,822,367,493 | |
Net asset value per share | | $ | 13.53 | |
|
STATEMENT OF OPERATIONS | |
| |
| | | Year Ended
December 31, 2013 | |
INVESTMENT INCOME: | | | | |
Dividends | | $ | 14,874,369 | |
Interest | | | 876,076,916 | |
| | | | |
| | | 890,951,285 | |
| | | | |
EXPENSES: | | | | |
Management fees | | | 103,980,437 | |
Custody and fund accounting fees | | | 450,575 | |
Transfer agent fees | | | 5,420,559 | |
Professional services | | | 219,180 | |
Shareholder reports | | | 1,007,533 | |
Registration fees | | | 210,681 | |
Trustees’ fees | | | 215,000 | |
Miscellaneous | | | 303,097 | |
| | | | |
| | | 111,807,062 | |
| | | | |
NET INVESTMENT INCOME | | | 779,144,223 | |
| | | | |
REALIZED AND UNREALIZED GAIN (LOSS): | |
Net realized gain | | | | |
Investments | | | 427,022,358 | |
Treasury futures contracts | | | 66,807,451 | |
Net change in unrealized appreciation/depreciation Investments | | | (1,125,181,447 | ) |
Treasury futures contracts | | | 3,693,878 | |
| | | | |
Net realized and unrealized loss | | | (627,657,760 | ) |
| | | | |
NET INCREASE IN NET ASSETS FROM OPERATIONS | | $ | 151,486,463 | |
| | | | |
| | | | | | | | |
STATEMENT OF CHANGES IN NET ASSETS | |
| | |
| | | Year Ended December 31, 2013 | | | Year Ended
December 31, 2012 | |
OPERATIONS: | | | | | | | | |
Net investment income | | $ | 779,144,223 | | | $ | 894,952,448 | |
Net realized gain | | | 493,829,809 | | | | 124,605,040 | |
Net change in unrealized appreciation/depreciation | | | (1,121,487,569 | ) | | | 895,269,676 | |
| | | | | | | | |
| | | 151,486,463 | | | | 1,914,827,164 | |
| | | | | | | | |
| | |
DISTRIBUTIONS TO SHAREHOLDERS FROM: | | | | | | | | |
Net investment income | | | (778,582,064 | ) | | | (896,923,748 | ) |
Net realized gain | | | — | | | | — | |
| | | | | | | | |
Total distributions | | | (778,582,064 | ) | | | (896,923,748 | ) |
| | | | | | | | |
| | |
FUND SHARE TRANSACTIONS: | | | | | | | | |
Proceeds from sale of shares | | | 6,918,977,679 | | | | 6,763,162,980 | |
Reinvestment of distributions | | | 617,308,718 | | | | 733,665,789 | |
Cost of shares redeemed | | | (8,793,657,789 | ) | | | (6,027,397,028 | ) |
| | | | | | | | |
Net decrease from Fund
share transactions | | | (1,257,371,392 | ) | | | 1,469,431,741 | |
| | | | | | | | |
Total increase (decrease) in net assets | | | (1,884,466,993 | ) | | | 2,487,335,157 | |
| | |
NET ASSETS: | | | | | | | | |
Beginning of year | | | 26,538,551,094 | | | | 24,051,215,937 | |
| | | | | | | | |
End of year (including undistributed net investment income of $7,228,684 and $6,666,525, respectively) | | $ | 24,654,084,101 | | | $ | 26,538,551,094 | |
| | | | | | | | |
| | |
SHARE INFORMATION: | | | | | | | | |
Shares sold | | | 505,482,231 | | | | 492,596,832 | |
Distributions reinvested | | | 45,502,994 | | | | 53,579,893 | |
Shares redeemed | | | (643,772,319 | ) | | | (439,406,933 | ) |
| | | | | | | | |
Net increase (decrease) in shares outstanding | | | (92,787,094 | ) | | | 106,769,792 | |
| | | | | | | | |
| | |
| PAGE 13 § DODGE & COX INCOME FUND | | See accompanying Notes to Financial Statements |
NOTES TO FINANCIAL STATEMENTS
NOTE 1—ORGANIZATION AND SIGNIFICANT ACCOUNTING POLICIES
Dodge & Cox Income Fund (the “Fund”) is one of the series constituting the Dodge & Cox Funds (the “Trust” or the “Funds”). The Trust is organized as a Delaware statutory trust and is registered under the Investment Company Act of 1940, as amended, as a diversified, open-end management investment company. The Fund commenced operations on January 3, 1989, and seeks high and stable current income consistent with long-term preservation of capital. Risk considerations and investment strategies of the Fund are discussed in the Fund’s Prospectus.
The financial statements have been prepared in conformity with accounting principles generally accepted in the United States of America, which require the use of estimates and assumptions by management. Actual results may differ from those estimates. Significant accounting policies are as follows:
Security valuation The Fund’s net assets are valued as of the close of trading on the New York Stock Exchange (NYSE), generally 4:00 p.m. Eastern Time, each day that the NYSE is open for business. Fixed income securities are valued based on prices received from independent pricing services which utilize both dealer-supplied valuations and pricing models. Pricing models may consider quoted prices for similar securities, interest rates, prepayment speeds, and credit risk. Exchange-traded derivatives are valued at the settlement price determined by the relevant exchange. Security values are not discounted based on the size of the Fund’s position. Securities for which market quotations are not readily available are valued at fair value as determined in good faith by or under the direction of the Board of Trustees. Short-term securities less than 60 days to maturity may be valued at amortized cost if amortized cost approximates current value. All securities held by the Fund are denominated in U.S. dollars.
Security transactions, investment income, expenses, and distributions Security transactions are recorded on the trade date. Realized gains and losses on securities sold are determined on the basis of identified cost.
Interest income is recorded on the accrual basis. Interest income includes coupon interest, amortization of premium and accretion of discount on debt securities, and gain/loss on paydowns of mortgage-backed securities. The ability of the issuers of the debt securities held by the Fund to meet their obligations may be affected by economic developments in a specific industry, state, or region. Debt obligations may be placed on non-accrual status and related interest income may be reduced by ceasing current accruals and writing off interest receivables when the collection of all or a portion of interest has become doubtful. A debt obligation is removed from non-accrual status when the issuer resumes interest payments or when collectibility of interest is reasonably assured.
Expenses are recorded on the accrual basis. Most expenses of the Trust can be directly attributed to a specific series. Expenses which cannot be directly attributed are allocated among the Funds in the Trust based on relative net assets or other expense methodologies determined by the nature of the expense.
Distributions to shareholders are recorded on the ex-dividend date.
Repurchase agreements The Fund enters into repurchase agreements, secured by U.S. government or agency securities, which involve the purchase of securities from a counterparty with a simultaneous commitment to resell the securities at an agreed-upon date and price. It is the Fund’s policy that its custodian take possession of the underlying collateral securities, the fair value of which exceeds the principal amount of the repurchase transaction, including accrued interest, at all times. In the event of default by the counterparty, the Fund has the contractual right to liquidate the securities and to apply the proceeds in satisfaction of the obligation.
Treasury Futures Contracts Futures contracts involve an obligation to purchase or sell (depending on whether the Fund has entered a long or short futures contract, respectively) an asset at a future date, at a price set at the time of the contract. Upon entering into a
DODGE & COX INCOME FUND §PAGE 14
NOTES TO FINANCIAL STATEMENTS
futures contract, the Fund is required to deposit an amount of cash or liquid assets (referred to as initial margin) in a segregated account with the clearing broker. Subsequent payments (referred to as variation margin) to and from the clearing broker are made on a daily basis based on changes in the market value of futures contracts. Futures are traded publicly and their market value changes daily. Changes in the market value of open futures contracts are recorded as unrealized appreciation or depreciation in the Statement of Operations. Realized gains and losses on futures contracts are recorded in the Statement of Operations at the closing or expiration of futures contracts. Cash deposited with a broker as initial margin is recorded on the Statement of Assets and Liabilities. A receivable and/or payable to brokers for daily variation margin is also recorded on the Statement of Assets and Liabilities.
Investments in futures contracts may include certain risks, which may be different from, and potentially greater than, those of the underlying securities. To the extent the Fund uses Treasury futures, it is exposed to additional volatility and potential losses resulting from leverage.
The Fund has entered into short Treasury futures contracts to assist with the management of the portfolio’s interest rate exposure. During the year ended December 31, 2013, the Fund remained consistently invested in short Treasury futures contracts. These Treasury futures contracts had notional values ranging from 1% to 8% of net assets.
Indemnification Under the Trust’s organizational documents, its officers and trustees are indemnified against certain liabilities arising out of the performance of their duties to the Trust. In addition, in the normal course of business the Trust enters into contracts that provide general indemnities to other parties. The Trust’s maximum exposure under these arrangements is unknown as this would involve future claims that may be made against the Trust that have not yet occurred.
NOTE 2—VALUATION MEASUREMENTS
Various inputs are used in determining the value of the Fund’s investments. These inputs are summarized in the three broad levels listed below.
| § | | Level 1: Quoted prices in active markets for identical securities |
| § | | Level 2: Other significant observable inputs (including quoted prices for similar securities, market indices, interest rates, credit risk, etc.) |
| § | | Level 3: Significant unobservable inputs (including Fund management’s assumptions in determining the fair value of investments) |
The inputs or methodology used for valuing securities are not necessarily an indication of the risk associated with investing in those securities.
The following is a summary of the inputs used to value the Fund’s holdings as of December 31, 2013:
| | | | | | | | |
| Classification(a) | | LEVEL 1
(Quoted Prices) | | | LEVEL 2
(Other Significant
Observable Inputs) | |
Securities | | | | | | | | |
Fixed Income Securities | | | | | | | | |
U.S. Treasury | | $ | 830,245,235 | | | $ | — | |
Government Related | | | — | | | | 2,366,854,399 | |
Mortgage-Related | | | — | | | | 8,944,343,079 | |
Asset-Backed | | | — | | | | 448,707,905 | |
Corporate | | | — | | | | 11,519,017,841 | |
Short-term Investments | | | | | | | | |
Money Market Fund | | | 24,692,317 | | | | — | |
Repurchase Agreement | | | — | | | | 832,595,000 | |
| | | | | | | | |
Total Securities | | $ | 854,937,552 | | | $ | 24,111,518,224 | |
| | | | | | | | |
Other Financial Instruments | | | | | | | | |
Treasury Futures Contracts | | $ | 10,605,673 | (b) | | $ | — | |
| | | | | | | | | |
| (a) | There were no transfers between Level 1 and Level 2 during the year ended December 31, 2013. There were no Level 3 securities at December 31, 2013 and 2012, and there were no transfers to Level 3 during the year. |
| (b) | Represents unrealized appreciation on Treasury futures contracts. |
NOTE 3—RELATED PARTY TRANSACTIONS
Management fees Under a written agreement approved by a unanimous vote of the Board of Trustees, the Fund pays an annual management fee of 0.50% of the Fund’s average daily net assets up to $100 million and 0.40% of
PAGE 15 § DODGE & COX INCOME FUND
NOTES TO FINANCIAL STATEMENTS
the Fund’s average daily net assets in excess of $100 million to Dodge & Cox, investment manager of the Fund. The agreement further provides that Dodge & Cox shall waive its fee to the extent that such fee plus all other ordinary operating expenses of the Fund exceed 1% of the average daily net assets for the year.
Fund officers and trustees All officers and three of the trustees of the Trust are officers or employees of Dodge & Cox. The Trust pays a fee only to those trustees who are not affiliated with Dodge & Cox.
NOTE 4—INCOME TAX INFORMATION AND DISTRIBUTIONS TO SHAREHOLDERS
A provision for federal income taxes is not required since the Fund intends to continue to qualify as a regulated investment company under Subchapter M of the Internal Revenue Code and distribute all of its taxable income to shareholders. Distributions are determined in accordance with income tax regulations, and such amounts may differ from net investment income and realized gains for financial reporting purposes. Financial reporting records are adjusted for permanent book/tax differences at year end to reflect tax character.
Book/tax differences are primarily due to differing treatments of wash sales, in-kind redemptions, net short-term realized gain (loss), and Treasury futures contracts. During the year, the Fund recognized net realized gains of $21,632,525 from the delivery of appreciated securities in an in-kind redemption transaction. For federal income tax purposes, this gain is not recognized as taxable income to the Fund and therefore will not be distributed to shareholders. At December 31, 2013, the cost of investments for federal income tax purposes was $23,824,433,341.
Distributions during the periods noted below were characterized as follows for federal income tax purposes:
| | | | | | | | |
| | | Year Ended December 31, 2013 | | | Year Ended December 31, 2012 | |
Ordinary income | | | $778,582,064 | | | | $896,923,748 | |
| | | ($0.415 per share) | | | | ($0.484 per share) | |
Long-term capital gain | | | — | | | | — | |
At December 31, 2013, the tax basis components of distributable earnings were as follows:
| | | | |
Unrealized appreciation | | $ | 1,253,958,490 | |
Unrealized depreciation | | | (111,936,055 | ) |
| | | | |
Net unrealized appreciation | | | 1,142,022,435 | |
Undistributed ordinary income | | | 7,228,684 | |
Undistributed long-term capital gain | | | 79,919,469 | |
During 2013, the Fund utilized all of its capital loss carryforward, which amounted to $396,020,432.
Under the Regulated Investment Company Modernization Act of 2010, capital losses incurred by the Fund after January 1, 2011, are not subject to expiration. In addition, such losses must be utilized prior to the losses incurred in the years preceding enactment.
Fund management has reviewed the tax positions for open periods (three years and four years, respectively, from filing the Fund’s Federal and State tax returns) as applicable to the Fund, and has determined that no provision for income tax is required in the Fund’s financial statements.
NOTE 5—LOAN FACILITIES
Pursuant to an exemptive order issued by the Securities and Exchange Commission (SEC), the Fund may participate in an interfund lending facility (Facility). The Facility allows the Fund to borrow money from or loan money to the Funds. Loans under the Facility are made for temporary or emergency purposes, such as to fund shareholder redemption requests. Interest on borrowings is the average of the current repurchase agreement rate and the bank loan rate. There was no activity in the Facility during the year.
All Funds in the Trust participate in a $500 million committed credit facility (Line of Credit) with State Street Bank and Trust Company, to be utilized for temporary or emergency purposes to fund shareholder redemptions or for other short-term liquidity purposes. The maximum amount available to the Fund is $250 million. Each Fund pays an annual commitment fee on its pro-rata portion of the Line of Credit. The Fund’s commitment fee for the year ended December 31, 2013,
DODGE & COX INCOME FUND §PAGE 16
NOTES TO FINANCIAL STATEMENTS
amounted to $85,152 and is reflected as a Miscellaneous Expense in the Statement of Operations. Interest on borrowings is charged at the prevailing rate. There were no borrowings on the Line of Credit during the year.
NOTE 6—PURCHASES AND SALES OF INVESTMENTS
For the year ended December 31, 2013, purchases and sales of securities, other than short-term securities and U.S. government securities, aggregated $3,218,001,001 and $3,174,547,705, respectively. For the year ended December 31, 2013, purchases and sales of U.S. government securities aggregated $6,831,652,326 and $7,792,860,529, respectively.
NOTE 7—ACCOUNTING PRONOUNCEMENTS
Effective January 1, 2013, the Fund adopted Accounting Standards Update (ASU) No. 2011-11, Balance Sheet (Topic 210): Disclosures about Offsetting Assets and
Liabilities and ASU No. 2013-01, Balance Sheet (Topic 210): Clarifying the Scope of Disclosures about Offsetting Assets and Liabilities. These amendments to Topic 210 require enhanced disclosures about offsetting of financial assets and liabilities, including derivative instruments, to enable investors to understand the effect of these arrangements on a fund’s financial position. There was no impact to these financial statements as a result of applying these ASUs.
NOTE 8—SUBSEQUENT EVENTS
Fund management has determined that no material events or transactions occurred subsequent December 31, 2013, and through the date of the Fund’s financial statements issuance, which require additional disclosure in the Fund’s financial statements.
PAGE 17 § DODGE & COX INCOME FUND
FINANCIAL HIGHLIGHTS
| | | | | | | | | | | | | | | | | | | | |
SELECTED DATA AND RATIOS (for a share outstanding throughout each year) | | Year Ended December 31, | |
| | | 2013 | | | 2012 | | | 2011 | | | 2010 | | | 2009 | |
| | | | |
Net asset value, beginning of year | | | $13.86 | | | | $13.30 | | | | $13.23 | | | | $12.96 | | | | $11.79 | |
Income from investment operations: | | | | | | | | | | | | | | | | | | | | |
Net investment income | | | 0.42 | | | | 0.48 | | | | 0.55 | | | | 0.57 | | | | 0.65 | |
Net realized and unrealized gain (loss) | | | (0.33 | ) | | | 0.56 | | | | 0.07 | | | | 0.35 | | | | 1.20 | |
| | | | |
Total from investment operations | | | 0.09 | | | | 1.04 | | | | 0.62 | | | | 0.92 | | | | 1.85 | |
| | | | |
Distributions to shareholders from: | | | | | | | | | | | | | | | | | | | | |
Net investment income | | | (0.42 | ) | | | (0.48 | ) | | | (0.55 | ) | | | (0.65 | ) | | | (0.68 | ) |
Net realized gain | | | — | | | | — | | | | — | | | | — | | | | — | |
| | | | |
Total distributions | | | (0.42 | ) | | | (0.48 | ) | | | (0.55 | ) | | | (0.65 | ) | | | (0.68 | ) |
| | | | |
Net asset value, end of year | | | $13.53 | | | | $13.86 | | | | $13.30 | | | | $13.23 | | | | $12.96 | |
| | | | |
Total return | | | 0.64 | % | | | 7.94 | % | | | 4.76 | % | | | 7.17 | % | | | 16.05 | % |
Ratios/supplemental data: | | | | | | | | | | | | | | | | | | | | |
Net assets, end of year (millions) | | | $24,654 | | | | $26,539 | | | | $24,051 | | | | $22,381 | | | | $19,254 | |
Ratio of expenses to average net assets | | | 0.43 | % | | | 0.43 | % | | | 0.43 | % | | | 0.43 | % | | | 0.43 | % |
Ratio of net investment income to average net assets | | | 3.00 | % | | | 3.52 | % | | | 4.12 | % | | | 4.26 | % | | | 5.29 | % |
Portfolio turnover rate | | | 38 | % | | | 26 | % | | | 27 | % | | | 28 | % | | | 20 | % |
See accompanying Notes to Financial Statements
REPORT OF INDEPENDENT REGISTERED PUBLIC ACCOUNTING FIRM
To the Trustees of Dodge & Cox Funds and Shareholders of Dodge & Cox Income Fund
In our opinion, the accompanying statement of assets and liabilities, including the portfolio of investments, and the related statements of operations and of changes in net assets and the financial highlights present fairly, in all material respects, the financial position of Dodge & Cox Income Fund (the “Fund”, one of the series constituting Dodge & Cox Funds) at December 31, 2013, the results of its operations for the year then ended, the changes in its net assets for each of the two years in the period then ended and the financial highlights for each of the five years in the period then ended, in conformity with accounting principles generally accepted in the United States of America. These financial statements and financial highlights (hereafter referred to as “financial statements”) are the responsibility of the Fund’s management; our responsibility is to express an opinion on these financial statements based on our audits. We conducted our audits of these financial statements in accordance with the standards of the Public Company Accounting Oversight Board (United States). Those standards require that we plan and perform the audit to obtain reasonable assurance about whether the financial statements are free of material misstatement. An audit includes examining, on a test basis, evidence supporting the amounts and disclosures in the financial statements, assessing the accounting principles used and significant estimates made by management, and evaluating the overall financial statement presentation. We believe that our audits, which included confirmation of securities at December 31, 2013, by correspondence with the custodian and brokers, provide a reasonable basis for our opinion.
PricewaterhouseCoopers LLP
San Francisco, California
February 25, 2014
DODGE & COX INCOME FUND §PAGE 18
BOARD APPROVAL OF FUNDS’ INVESTMENT MANAGEMENT AGREEMENTS AND MANAGEMENT FEES
(unaudited)
The Board of Trustees is responsible for overseeing the performance of the Dodge & Cox Funds’ investment manager and determining whether to continue the Investment Management Agreements between the Funds and Dodge & Cox each year (the “Agreements”). At a meeting of the Board of Trustees of the Trust held on December 17, 2013, the Trustees, by a unanimous vote (including a separate vote of those Trustees who are not “interested persons” (as defined in the Investment Company Act of 1940) (the “Independent Trustees”)), approved the renewal of the Agreements for an additional one-year term through December 31, 2014. During the course of the year, the Board received a wide variety of materials relating to the services provided by Dodge & Cox and the performance of each of the Funds.
INFORMATION RECEIVED
In advance of the meeting, the Board, including each of the Independent Trustees, requested, received, and reviewed materials relating to the Agreements and the services provided by Dodge & Cox. The Independent Trustees retained Morningstar® to prepare an independent expense and performance summary for each Fund and comparable funds managed by other advisers identified by Morningstar. The Morningstar materials included information regarding advisory fee rates, expense ratios, and transfer agency, custodial, and distribution expenses, as well as appropriate performance comparisons to each Fund’s peer group and an index or combination of indices. The Morningstar materials also included a comparison of expenses of various share classes offered by comparable funds.
The materials reviewed by the Board contained information concerning, among other things, Dodge & Cox’s profitability, financial results and condition, advisory fee revenue, and separate account and sub-adviser fund fee schedules. The Board additionally considered the Funds’ brokerage commissions, turnover rates, sales and redemption data and the significant investment that Dodge & Cox makes in research used in managing the Funds. The Board received and reviewed a memorandum summarizing
information provided throughout the year regarding Dodge & Cox’s services to the Funds as well as information regarding (i) the different fees, services, costs, and risks associated with other accounts managed by Dodge & Cox as compared to the Dodge & Cox Funds; (ii) the differences in performance between the Funds and separately managed accounts; and (iii) Fund shares subscription and redemption activity. Throughout the process of reviewing the services provided by Dodge & Cox and preparing for the meeting, the Independent Trustees found Dodge & Cox to be open, forthright, detailed, and very helpful in answering questions about all issues.
The Board received copies of the Agreements and a memorandum from the independent legal counsel to the Independent Trustees discussing the factors generally regarded as appropriate to consider in evaluating advisory arrangements. The Trust’s Contract Review Committee, consisting solely of Independent Trustees, met with the independent legal counsel on October 30, 2013, and again on December 17, 2013, to discuss whether to renew the Agreements. The Board, including the Independent Trustees, subsequently concluded that the existing Agreements are fair and reasonable and voted to approve the Agreements.
In considering the Agreements, the Board, including the Independent Trustees, did not identify any single factor or particular information as all-important or controlling. In reaching the decision to approve the Agreements, the Board considered several factors, discussed below, to be key factors and reached the conclusions described below.
NATURE, QUALITY, AND EXTENT OF THE SERVICES
The Board considered that Dodge & Cox provides a wide range of services to the Funds in addition to portfolio management and that the quality of these services has been excellent in all respects. The extensive nature of services provided by Dodge & Cox has been documented in materials provided to the Board and in presentations made to the Board throughout the year. In particular, the Board considered the nature, quality, and extent of portfolio management, administrative, and shareholder services performed by Dodge & Cox. With regard to portfolio management services, the Board considered
PAGE 19 § DODGE & COX INCOME FUND
Dodge & Cox’s established long-term history of care and conscientiousness in the management of the Funds; its demonstrated consistency in investment approach and depth; the background and experience of the Dodge & Cox Investment Policy Committee, International Investment Policy Committee, Global Stock Investment Policy Committee, Fixed Income Investment Policy Committee, and research analysts responsible for managing the Funds; its methods for assessing the regulatory and investment climate in various jurisdictions; Dodge & Cox’s overall high level of attention to its core investment management function; and its commitment to the Funds and their shareholders.
In the area of administrative and shareholder services, the Board considered the excellent quality of Dodge & Cox’s work in areas such as compliance, legal services, trading, proxy voting, oversight of the Funds’ transfer agent and custodian, tax compliance, and shareholder communication through its website and other means. The Board also noted Dodge & Cox’s diligent disclosure policy, its favorable compliance record, and its reputation as a trusted, shareholder-friendly mutual fund family.
In addition, the Board considered that Dodge & Cox manages approximately $140 billion in Fund assets with fewer professionals than most comparable funds, and that on average these professionals have more experience and longer tenure than investment professionals at comparable funds. The Board also noted that Dodge & Cox is an investment research-oriented firm with no other business endeavors to distract management’s attention from its research efforts, and that its investment professionals adhere to a consistent investment approach across the Funds. The Board further considered the favorable stewardship and “Gold” analyst ratings awarded to each of the Funds by Morningstar. The Board concluded that it was satisfied with the nature, extent, and quality of investment management and other services provided to the Funds by Dodge & Cox.
INVESTMENT PERFORMANCE
The Board considered short-term and long-term investment performance for each Fund (including periods of outperformance or underperformance) as compared to both relevant indices and the performance of such Fund’s peer group. The Board noted that each Fund
demonstrated favorable short-term and longer-term performance relative to its benchmark and peer group. The Board determined after extensive review and inquiry that Dodge & Cox’s historic, long-term, team-oriented, bottom up investment approach remains consistent and that Dodge & Cox continues to be distinguished by its integrity, transparency, and independence.
The Board considered that the performance of the Funds is the result of a team-oriented investment management process that emphasizes a long-term investment horizon, comprehensive independent research, price discipline, and focus. The Board also considered that the investment performance delivered by Dodge & Cox to the Funds appeared to be consistent with the relevant performance delivered for other clients of Dodge & Cox. The Board concluded that Dodge & Cox has delivered favorable long-term performance for Fund investors consistent with the long-term investment strategies being pursued by the Funds.
COSTS AND ANCILLARY BENEFITS
Costs of Services to Funds: Fees and Expenses. The Board considered each Fund’s management fee rate and expense ratio relative to similar mutual funds and relative to management fees charged by Dodge & Cox to other clients. In particular, the Board considered that the Funds continue to be substantially below their peer group median in expense ratios and management fee rates and that many media and industry reports specifically comment on the low expense ratios of the Funds, which have been a defining characteristic of the Funds for many years. The Board also evaluated the operating structures of the Funds and Dodge & Cox, noting that the Funds do not charge front-end sales commissions or distribution fees, and Dodge & Cox bears, among other things, the significant cost of third party research, reimbursement for recordkeeping and administrative costs to third-party retirement plan administrators, and administrative and office overhead. The Board noted that expenses are well below industry averages. The Board also considered that the Funds receive numerous administrative, regulatory compliance, legal, technology and shareholder support services from Dodge & Cox without any additional administrative fee and the fact that the Funds have relatively low transaction costs and portfolio turnover
DODGE & COX INCOME FUND §PAGE 20
rates. The Board reviewed Morningstar data showing that the few peer group funds with lower expense ratios often have other share classes with significantly higher expense ratios.
The Board reviewed information regarding the fee rates Dodge & Cox charges to separate accounts and sub-advised funds that have investment programs similar to those of the Funds, including instances where separate account and sub-advised fund fees are lower than Fund fees. The Board considered differences in the nature and scope of services Dodge & Cox provides to the Funds as compared to other client accounts, differences in regulatory, litigation, and other risks as between Dodge & Cox Funds and other types of clients, and certain characteristics of the market for institutional separate account management services. The Board further noted that, with respect to non-U.S. funds sponsored and managed by Dodge & Cox that are comparable to the Funds in many respects, the fee rates charged by Dodge & Cox are the same as or higher than the fee rates charged to the Funds. After consideration of these matters, the Board concluded that the overall costs incurred by the Funds for the services they receive (including the management fee paid to Dodge & Cox) are reasonable and that the fees are acceptable based upon the qualifications, experience, reputation, and performance of Dodge & Cox and the low overall expense ratios of the Funds.
Profitability and Costs of Services to Dodge & Cox; “Fall-out” Benefits. The Board reviewed reports of Dodge & Cox’s financial position, profitability, and estimated overall value, and considered Dodge & Cox’s overall profitability within its context as a private, employee-owned S-Corporation and relative to the favorable services provided. The Board noted in particular that Dodge & Cox’s profits are not generated by high fee rates, but reflect an extraordinarily streamlined, efficient, and focused business approach toward investment management. The Board recognized the importance of Dodge & Cox’s profitability—which is derived solely from management fees and does not include other business ventures—to maintain its independence, stability, company culture and ethics, and management continuity. The Board also considered that the compensation/profit structure at Dodge & Cox is vital for
remaining independent and facilitating retention of its management and investment professionals.
The Board considered potential “fall-out” benefits (including the receipt of research from unaffiliated brokers and reputational benefits to non-U.S. funds sponsored and managed by Dodge & Cox) that Dodge & Cox might receive as a result of its association with the Funds and determined that they are not significant. The Board also noted the extent of additional administrative services performed by Dodge & Cox for the Funds, and that the magnitude of costs and risks borne by Dodge & Cox in rendering advisory services to the Funds (including risks in the regulatory compliance, securities valuation, and investment management processes) are continuing to increase. The Board concluded that the profitability of Dodge & Cox’s relationship with the Funds (including fall-out benefits) was fair and reasonable.
THE BENEFIT OF ECONOMIES OF SCALE
The Board considered whether there have been economies of scale with respect to the management of each Fund, whether the Funds have appropriately benefited from any economies of scale, and whether the management fee rate is reasonable in relation to the Fund assets and any economies of scale that may exist. In the Board’s view, any consideration of economies of scale must take account of the Funds’ low fee structure and the considerable efficiencies of the Funds’ organization and fee structure that has been realized by shareholders from the time of each Fund’s inception (i.e., from the first dollar). The Board noted that Dodge & Cox has shared economies of scale by adding or enhancing services to the Funds over time, and that the internal costs of providing investment management, up-to-date technology, administrative, legal and compliance services to the Funds are continuing to increase. For example, Dodge & Cox has increased its global research staff and investment resources over the years to address the increased complexity of investing in multinational and non-U.S. companies. In addition, Dodge & Cox has made substantial expenditures in other staff and infrastructure to enable it to integrate credit and equity analyses and to be able to implement its strategy in a more effective and secure manner. The Board determined that the Funds provide access for small investors to high quality
PAGE 21 § DODGE & COX INCOME FUND
investment management at a relatively low cost. The Board’s decision to renew the Agreements was made after consideration of economies of scale and review of peer group fund expense ratios and historical expense ratio patterns for the Funds. The Board concluded that the current Dodge & Cox fee structure is fair and reasonable and adequately shares economies of scale that may exist.
CONCLUSION
Based on their evaluation of all material factors and assisted by the advice of independent legal counsel to the Independent Trustees, the Board, including the Independent Trustees, concluded that the advisory fee structure was fair and reasonable, that each Fund was paying a competitive fee for the services provided, that the scope and quality of Dodge & Cox’s services has provided substantial value for Fund shareholders over the long term, and that approval of the Agreements was in the best interests of each Fund and its shareholders.
FUND HOLDINGS
The Fund provides a complete list of its holdings four times each fiscal year, as of the end of each quarter. The Fund files the lists with the Securities and Exchange Commission (SEC) on Form N-CSR (second and fourth quarters) and Form N-Q (first and third quarters). Shareholders may view the Fund’s Forms N-CSR and N-Q on the SEC’s website at www.sec.gov. Forms N-CSR and N-Q may also be reviewed and copied at the SEC’s Public Reference Room in Washington, DC. Information
regarding the operations of the Public Reference Room may be obtained by calling 202-551-8090 (direct) or 800-732-0330 (general SEC number). A list of the Fund’s quarter-end holdings is also available at www.dodgeandcox.com on or about 15 days following each quarter end and remains available on the web site until the list is updated in the subsequent quarter.
PROXY VOTING
For a free copy of the Fund’s proxy voting policies and procedures, please call 800-621-3979, visit the Fund’s website at www.dodgeandcox.com, or visit the SEC’s website at www.sec.gov. Information regarding how the Fund voted proxies relating to portfolio securities during the most recent 12-month period ending June 30 is also available at www.dodgeandcox.com or at www.sec.gov.
HOUSEHOLD MAILINGS
The Fund routinely mails shareholder reports and summary prospectuses to shareholders and, on occasion, proxy statements. In order to reduce the volume of mail, when possible, only one copy of these documents will be sent to shareholders who are part of the same family and share the same residential address.
If you have a direct account with the Funds and you do not want the mailing of shareholder reports and summary prospectuses combined with other members in your household, contact the Funds at 800-621-3979. Your request will be implemented within 30 days
DODGE & COX INCOME FUND §PAGE 22
DODGE & COX FUNDS—EXECUTIVE OFFICER & TRUSTEE INFORMATION
| | | | | | |
Name (Age) and
Address* | | Position with Trust (Year of Election or
Appointment) | | Principal Occupation During Past 5 Years | | Other Directorships Held by Trustees |
| INTERESTED TRUSTEES AND OFFICERS |
| Kenneth E. Olivier (61) | | Chairman, President, and Trustee (Trustee since 2005) | | Chairman Emeritus (since 2013), Chairman (since 2011), Chief Executive Officer (2010-2013), President (until 2011), and Director of Dodge & Cox; Portfolio Manager and member of Investment Policy Committee (IPC) (until 2013) | | — |
| Dana M. Emery (52) | | Senior Vice President and Trustee (Trustee since 1993) | | Chief Executive Officer (since 2013), President (since 2011), Executive Vice President (until March 2011), and Director of Dodge & Cox; Director of Fixed Income, Portfolio Manager, and member of Fixed Income Investment Policy Committee (FIIPC) | | — |
| John A. Gunn (70) | | Trustee (Trustee since 1985) | | Chairman Emeritus (2011-2013), Chairman (2007-2011), Chief Executive Officer (2007-2010), and Director of Dodge & Cox; Portfolio Manager and member of IPC, Global Stock Investment Policy Committee (GSIPC) (since 2008), and International Investment Policy Committee (IIPC) | | — |
| Charles F. Pohl (55) | | Senior Vice President (Officer since 2004) | | Chairman (since 2013), Co-President (2011-2013), Senior Vice President (until 2011), and Director of Dodge & Cox; Chief Investment Officer (since 2007), Portfolio Manager, Investment Analyst, and member of IPC, GSIPC, IIPC, and FIIPC | | — |
| Diana S. Strandberg (54) | | Senior Vice President (Officer since 2006) | | Senior Vice President (since 2011), Vice President (until 2011), and Director (since 2011) of Dodge & Cox; Director of International Equity (since 2009), Portfolio Manager, Investment Analyst, and member of IPC, GSIPC, and IIPC | | — |
| David H. Longhurst (56) | | Treasurer (Officer since 2006) | | Vice President and Assistant Treasurer of Dodge & Cox | | — |
| Thomas M. Mistele (60) | | Secretary (Officer since 1998) | | Chief Operating Officer, Director, Secretary, Senior Counsel (since 2011), and General Counsel (until 2011) of Dodge & Cox | | — |
| Katherine M. Primas (39) | | Chief Compliance Officer (Officer since 2009) | | Chief Compliance Officer of Dodge & Cox | | — |
| INDEPENDENT TRUSTEES |
| L. Dale Crandall (72) | | Trustee (Since 1999) | | President, Piedmont Corporate Advisors, Inc. (since 2003); President, Kaiser Foundation Health Plan, Inc. and Kaiser Foundation Hospitals (2000-2002); Senior Vice President—Finance and Administration & CFO, Kaiser Foundation Health Plan, Inc. and Kaiser Foundation Hospitals (1998-2000) | | Director, Ansell Limited (medical equipment and supplies) (since 2002); Bridgepoint Education, Inc. (education services) (since 2008); and Endurance International Group, Inc. (internet services) (since 2013) |
| Thomas A. Larsen (64) | | Trustee (Since 2002) | | Senior Counsel of Arnold & Porter LLP (law firm) (since 2013); Partner of Arnold & Porter LLP (since 2012); Director of Howard, Rice, Nemerovski, Canady, Falk & Rabkin (1977-2011) | | — |
| Ann Mather (53) | | Trustee (Since 2011) | | CFO, Pixar Animation Studios (1999-2004) | | Director, Google, Inc. (internet information services) (since 2005); Director, Glu Mobile, Inc. (multimedia software) (since 2005); Director, Netflix, Inc. (video services) (since 2010); Director, Shutterfly, Inc. (internet photography services/publishing) (since 2013); Director, Solazyme Inc. (renewable oils) (since 2011) |
| Robert B. Morris III (61) | | Trustee (Since 2011) | | Adviser to various financial services firms | | — |
| Gary Roughead (62) | | Trustee (Since 2013) | | Annenberg Distinguished Visiting Fellow, Hoover Institution (since 2011); Admiral United States Navy (Ret); U.S. Navy Chief of Naval Operations (2007-2011) | | Director, Northrop Grumman Corp. (global security) (since 2012) |
| John B. Taylor (67) | | Trustee (Since 2005) (and 1998-2001) | | Professor of Economics, Stanford University; Senior Fellow, Hoover Institution; Under Secretary for International Affairs, United States Treasury (2001-2005) | | — |
| * | | The address for each Officer and Trustee is 555 California Street, 40th Floor, San Francisco, California 94104. Each Officer and Trustee oversees all five series in the Dodge & Cox Funds complex and serves for an indefinite term. |
Additional information about the Trust’s Trustees and Officers is available in the Trust’s Statement of Additional Information (SAI). You can get a free copy of the SAI by visiting the Funds’ website at www.dodgeandcox.com or calling
800-621-3979.
PAGE 23 § DODGE & COX INCOME FUND
ITEM 2. CODE OF ETHICS.
A code of ethics, as defined in Item 2 of Form N-CSR, adopted by the registrant and applicable to the registrant’s principal executive officer and principal financial officer was in effect during the entire period covered by this report. A copy of the code of ethics as revised December 15, 2008 is filed as an exhibit to this Form N-CSR. No substantive amendments were approved or waivers were granted to this code of ethics during the period covered by this report.
ITEM 3. AUDIT COMMITTEE FINANCIAL EXPERT.
The Board of Trustees of the registrant has determined that Ann Mather and Robert B. Morris III, members of the registrant’s Audit and Compliance Committee, are each an “audit committee financial expert” and are “independent”, as defined in Item 3 of Form N-CSR.
ITEM 4. PRINCIPAL ACCOUNTANT FEES AND SERVICES.
(a) – (d) Aggregate fees billed to the registrant for the fiscal years ended December 31, 2013 and December 31, 2012 for professional services rendered by the registrant’s principal accountant were as follows:
| | | | | | | | |
| | | 2013 | | | 2012 | |
(a) Audit Fees | | $ | 264,000 | | | $ | 256,300 | |
(b) Audit-Related Fees | | | — | | | | — | |
(c) Tax Fees | | | 165,000 | | | | 176,900 | |
(d) All Other Fees | | | — | | | | — | |
Audit fees include amounts related to the audit of the registrant’s annual financial statements and services normally provided by the accountant in connection with statutory and regulatory filings. Tax fees include amounts related to tax advice and tax return preparation, compliance, and reviews.
(e)(1) The registrant’s Audit and Compliance Committee has adopted policies and procedures (“Policies”) which require the registrant’s Audit and Compliance Committee to pre-approve all audit and non-audit services provided by the principal accountant to the registrant. The policies also require the Audit and Compliance Committee to pre-approve any engagement of the principal accountant to provide non-audit services to the registrant’s investment adviser, if the services directly impact the registrant’s operations and financial reporting. The Policies do not apply in the case of audit services that the principal accountant provides to the registrant’s adviser. If a service (other than the engagement of the principal accountant to audit the registrant’s financial statements) is required to be pre-approved under the Policies between regularly scheduled Audit and Compliance Committee meetings, pre-approval may be authorized by a designated Audit and Compliance Committee member with ratification at the next scheduled Audit and Compliance Committee meeting.
(e)(2) No services included in (b) – (d) above were approved pursuant to paragraph (c)(7)(i)(C) of Rule 2-01 of Regulation S-X.
(f) Less than 50% of the hours expended on the principal accountant’s engagement to audit the registrant’s financial statements for the most recent fiscal year were attributed to work performed by persons other than the principal accountant’s full-time, permanent employees.
(g) For the fiscal years ended December 31, 2013 and December 31, 2012, the aggregate fees billed by the registrant’s principal accountant for non-audit services rendered to the registrant, for non-audit services rendered to the registrant’s investment adviser, and for non-audit services rendered to entities controlled by the adviser were $549,000 and $636,200*, respectively.
*Amount is less than the amount disclosed in the filing of Form N-CSR as of December 31, 2012.
(h) All non-audit services described under (g) above that were not pre-approved by the registrant’s Audit and Compliance Committee were considered by the registrant’s Audit and Compliance Committee and found to be compatible with maintaining the principal accountant’s independence.
ITEM 5. AUDIT COMMITTEE OF LISTED REGISTRANTS.
Not applicable.
ITEM 6. SCHEDULE OF INVESTMENTS.
Not applicable. The complete schedule of investments is included in Item 1 of this Form N-CSR.
ITEM 7. DISCLOSURE OF PROXY VOTING POLICIES AND PROCEDURES FOR CLOSED-END MANAGEMENT INVESTMENT COMPANIES.
Not applicable.
ITEM 8. PORTFOLIO MANAGERS OF CLOSED-END MANAGEMENT INVESTMENT COMPANIES.
Not applicable.
ITEM 9. PURCHASES OF EQUITY SECURITIES BY CLOSED-END MANAGEMENT INVESTMENT COMPANY AND AFFILIATED PURCHASERS.
Not applicable.
ITEM 10. SUBMISSION OF MATTERS TO A VOTE OF SECURITY HOLDERS.
The registrant has adopted the following procedures by which shareholders may recommend nominees to the registrant’s Board of Trustees.
1. The shareholder must submit any such recommendation in writing to the registrant to the attention of the Secretary at the address of the principal executive offices of the registrant. The shareholder’s recommendation is then considered by the registrant’s Nominating Committee.
2. The shareholder recommendation must include:
(i) A statement in writing setting forth (a) the name, date of birth, business address and residence address of the person recommended by the shareholder (the “candidate”); and (b) whether the recommending shareholder believes that the candidate is or will be an “interested person” of the registrant (as defined in the Investment Company Act of 1940) and, if not an “interested person,” information regarding the candidate that will be sufficient for the registrant to make such determination and, if applicable, similar information regarding whether the candidate would satisfy the standards for independence of a Board
member under listing standards of the New York Stock Exchange or other applicable securities exchange.
(ii) The written and manually signed consent of the candidate to be named as a nominee and to serve as a Trustee if elected;
(iii) The recommending shareholder’s name as it appears on the registrant’s books and the number of all shares of the registrant owned beneficially and of record by the recommending shareholder (as evidenced to the Nominating Committee’s satisfaction by a recent brokerage or account statement); and
(iv) A description of all arrangements or understandings between the recommending shareholder and the candidate and any other person or persons (including their names) pursuant to which the recommendation is being made by the recommending shareholder.
In addition, the Nominating Committee may require the candidate to furnish such other information as it may reasonably require or deem necessary to determine the eligibility of such candidate to serve on the Board or to satisfy applicable law and information regarding the candidate that would be required to be disclosed if the candidate were a nominee in a proxy statement or other filing required to be made in connection with solicitation of proxies for election of Trustees.
ITEM 11. CONTROLS AND PROCEDURES.
(a) An evaluation was performed within 90 days of the filing of this report, under the supervision and with the participation of the registrant’s management, including the principal executive officer and principal financial officer, of the effectiveness of the design and operation of the registrant’s disclosure controls and procedures. Based on that evaluation, the principal executive officer and principal financial officer concluded that the registrant’s disclosure controls and procedures were effective.
(b) The registrant’s principal executive officer and principal financial officer are aware of no changes in the registrant’s internal control over financial reporting that occurred during the second fiscal quarter of the period covered by this report that has materially affected, or is reasonably likely to materially affect, the registrant’s internal control over financial reporting.
ITEM 12. EXHIBITS.
(a)(1) The registrant’s code of ethics pursuant to Item 2 of Form N-CSR is attached. (EX.99A)
(a)(2) Certifications pursuant to Section 302 of the Sarbanes-Oxley Act of 2002 are attached. (EX.99B)
(a)(3) Not applicable.
(b) Certifications pursuant to Section 906 of the Sarbanes-Oxley Act of 2002 are attached. (EX.99C)
SIGNATURES
Pursuant to the requirements of the Securities Exchange Act of 1934 and the Investment Company Act of 1940, the registrant has duly caused this report to be signed on its behalf by the undersigned, thereunto duly authorized.
Dodge & Cox Funds
| | |
| By | | /s/ Kenneth E. Olivier |
| | Kenneth E. Olivier |
| | Chairman – Principal Executive Officer |
Date February 27, 2014
Pursuant to the requirements of the Securities Exchange Act of 1934 and the Investment Company Act of 1940, this report has been signed below by the following persons on behalf of the registrant and in the capacities and on the dates indicated.
Dodge & Cox Funds
| | |
| By | | /s/ Kenneth E. Olivier |
| | Kenneth E. Olivier |
| | Chairman – Principal Executive Officer |
| | |
| By | | /s/ David H. Longhurst |
| | David H. Longhurst |
| | Treasurer – Principal Financial Officer |
Date February 27, 2014