UNITED STATES
SECURITIES AND EXCHANGE COMMISSION
Washington, D.C. 20549
FORM N-CSR
AMENDMENT NO. 2
CERTIFIED SHAREHOLDER REPORT OF REGISTERED MANAGEMENT
INVESTMENT COMPANIES
Investment Company Act file number 811-173
DODGE & COX FUNDS
(Exact name of registrant as specified in charter)
555 California Street, 40th Floor
San Francisco, CA 94104
(Address of principal executive offices) (Zip code)
Thomas M. Mistele, Esq.
555 California Street, 40th Floor
San Francisco, CA 94104
(Name and address of agent for service)
Registrant’s telephone number, including area code: 415-981-1710
Date of fiscal year end: DECEMBER 31, 2014
Date of reporting period: DECEMBER 31, 2014
Form N-CSR is to be used by management investment companies to file reports with the Commission not later than 10 days after the transmission to stockholders of any report that is required to be transmitted to stockholders under Rule 30e-1 under the Investment Company Act of 1940 (17 CFR 270.30e-1). The Commission may use the information provided on Form N-CSR in its regulatory, disclosure review, inspection, and policymaking roles.
A registrant is required to disclose the information specified by Form N-CSR, and the Commission will make this information public. A registrant is not required to respond to the collection of information contained in Form N-CSR unless the Form displays a currently valid Office of Management and Budget (“OMB”) control number. Please direct comments concerning the accuracy of the information collection burden estimate and any suggestions for reducing the burden to Secretary, Securities and Exchange Commission, 450 Fifth Street, NW, Washington, DC 20549-0609. The OMB has reviewed this collection of information under the clearance requirements of 44 U.S.C. ss. 3507.
ITEM 1. REPORTS TO STOCKHOLDERS.
The following are the December 31, 2014 annual reports for the Dodge & Cox Funds, a Delaware statutory trust, consisting of six series: Dodge & Cox Stock Fund, Dodge & Cox Global Stock Fund, Dodge & Cox International Stock Fund, Dodge & Cox Balanced Fund, Dodge & Cox Income Fund, and Dodge & Cox Global Bond Fund. The reports of each series were transmitted to their respective shareholders on February 17, 2015.
| | | | |
 | | | |  |
www.dodgeandcox.com
For Fund literature, transactions, and account
information, please visit the Funds’ website.
or write or call:
DODGE & COX FUNDS
c/o Boston Financial Data Services
P.O. Box 8422
Boston, Massachusetts 02266-8422
(800) 621-3979
INVESTMENT MANAGER
Dodge & Cox
555 California Street, 40th Floor
San Francisco, California 94104
(415) 981-1710
This report is submitted for the general information of the shareholders of the Fund. The report is not authorized for distribution to prospective investors in the Fund unless it is accompanied by a current prospectus.
This report reflects our views, opinions, and portfolio holdings as of December 31, 2014, the end of the reporting period. Any such views are subject to change at any time based upon market or other conditions and Dodge & Cox disclaims any responsibility to update such views. These views may not be relied on as investment advice and, because investment decisions for a Dodge & Cox Fund are based on numerous factors, may not be relied on as an indication of trading intent on behalf of any Dodge & Cox Fund.
12/14 SF AR  Printed on recycled paper
Annual Report
December 31, 2014
Stock Fund
ESTABLISHED 1965
TICKER: DODGX
TO OUR SHAREHOLDERS
The Dodge & Cox Stock Fund had a total return of 10.4% for the year ending December 31, 2014, compared to a return of 13.7% for the S&P 500 Index. At year end, the Fund had net assets of $60.3 billion with a cash position of 1.2%.
MARKET COMMENTARY
U.S. equity markets were strong during 2014: the S&P 500 closed on December 31 near its record high. Utilities and Health Care were the best performing sectors in the S&P 500, while Energy was the weakest, and the only sector to post a negative return. Global oil prices dropped approximately 50%, due to lower-than-expected demand growth and modestly higher-than-expected supply growth. The U.S. dollar strengthened against most major currencies, allowing American companies and consumers to pay lower prices for imported foreign goods. However, in aggregate, the stronger currency dampens profitability of U.S. multinational corporations and makes U.S. exports less competitive.
After declining in the first quarter, U.S. economic activity rebounded and continued to expand at a moderate pace through December. U.S. labor market conditions improved: job gains were solid and the unemployment rate declined. While the recovery in the housing sector remained modest, household wealth and spending rose, and consumer sentiment reached a seven-year high. Corporate profitability was robust, and businesses increased investment in fixed assets. The U.S. Federal Reserve announced the end of its historic asset-purchase program, but retained an accommodative stance and signaled its intention to take a slow approach toward raising interest rates in 2015. Despite concerns about global economic growth, our long-term outlook for equities continues to be positive.
INVESTMENT STRATEGY
Our disciplined investment process combines in-depth, bottom-up research and rigorous debate of ideas among our experienced investment professionals; the Fund benefits from the collective judgment of our team. We evaluate potential investments based on a three- to five-year investment horizon and have a strict price discipline.
While individual company research is the primary factor in determining the Fund’s portfolio composition, we can identify themes that cut across many industries. Innovation is a pervasive theme in the Fund and is factored into our analysis. We highlight examples of our current investment theses within the Information Technology and Energy sectors below.(a)
Information Technology
In the Information Technology sector, investors can have limited visibility of future earnings because growth is often driven by innovation and disruption; companies are required to make significant investments in research & development (R&D) with uncertain outcomes. In addition, companies face intense competition, have short product cycles, and must combat product obsolescence. As a result, we typically look for companies with reasonable valuations that incorporate modest expectations, industry leadership (e.g., brand, distribution, market share), sustained R&D efforts, a strong intellectual property portfolio, and financial stability. We believe that these characteristics can help offset the inherent uncertainty of changes in technology.
On December 31, 2014, 23.7% of the Fund was invested in the Information Technology sector compared to 19.7% of the S&P 500.(b) Information Technology is not a homogeneous sector: the Fund holds 16 technology companies with differing business models and diversified revenue streams and geographic exposures. We evaluate each investment opportunity on a standalone basis and weigh a company’s valuation against its risks and opportunities to ascertain whether it is an attractive investment opportunity. Technology holdings ranged from Hewlett-Packard at 0.7 times sales to Google at 5.5 times sales.
Hewlett-Packard
Hewlett-Packard, a long-term holding in the Fund, is an example of how our patience, persistence, and ability to build conviction in the face of uncertainty have benefited recent performance (up 101% in 2013 and up 46% in 2014, and the largest contributor to Fund results in both years). We believe that Hewlett-Packard remains an
PAGE 1 § DODGE & COX STOCK FUND
attractive investment opportunity with strong business prospects given its large valuation discount to the overall market. As the world’s largest enterprise technology company, Hewlett-Packard has a strong, well-recognized brand and serves more than one billion end users in more than 170 countries. The company generates high, recurring free cash flow. Over our three- to five-year investment horizon, Hewlett-Packard is positioned to benefit from growth opportunities in the cloud, security, and converged network infrastructure markets. Furthermore, we believe that the competent management of the company’s operating businesses is underappreciated by the market. Current risks to the business include the possibility of expensive acquisitions, macroeconomic weakness, and competitive threats in PCs, services, and enterprise server/storage/networking. While these risks are significant, we believe that the valuation reflects an overly pessimistic outlook.
In October, the company announced plans to separate the business into two companies—Hewlett-Packard Enterprise and HP Inc.—and expects to complete the transaction by October 2015. Hewlett-Packard Enterprise will consist of technology infrastructure, software, and services, with a focus on growth opportunities from cloud, big data, security, and mobility. HP Inc. will consist of the personal computing and printing businesses, which generate strong cash flow; the new company intends to invest in innovative technologies, such as 3-D printing. We believe that the proposed separation could build long-term shareholder value. The announcement comes four years into Hewlett-Packard’s five-year turnaround strategy. Management believes that the separation will provide greater focus, flexibility, and management alignment for each new company. Additionally, we believe the proposed capital structures and capital allocation strategy would be better tailored for each company’s respective growth profile. On December 31, Hewlett-Packard was a 4.1% position in the Fund.
Google
As the most popular internet destination in the world, Google has extremely high search engine market share in both developed and emerging markets: ~70% desktop share and over 90% mobile share globally. The company is well-positioned to benefit from continued growth in its
core search business as internet penetration increases (currently at approximately 40% globally), users spend more time online, e-commerce expands, and more advertising revenue is earned online. Google also has meaningful non-search assets in display advertising (e.g., YouTube, DoubleClick), mobile (e.g., Android), and social (e.g., Google+). The company is led by a long-term, product-focused management team with significant economic ownership and a demonstrated focus on shareholders and financial returns. However, Google faces increasing competition, greater regulatory scrutiny around the world, and declining margins due to rising R&D expenses. Despite these issues, we believe that its valuation at 17 times forward estimated earnings(c) is reasonable considering its strong long-term growth prospects and cash generation potential. Recently, we added to the Fund’s position; Google was a 2.3% holding at year end.
Energy
In the Energy sector, technological innovation has improved exploration success and oil recovery, increased efficiency of energy conservation, and reduced the environmental impact of energy extraction. We have identified attractive energy investment opportunities, especially within the Energy Equipment & Services (Oil Services) industry. The Fund is overweight Oil Services compared to the S&P 500 (5.2% versus 1.4%, respectively).
To evaluate each potential energy investment, we consider scenarios using a range of oil and gas prices. Our approach tends to be contrarian: we are often more skeptical as other investors become more optimistic, and our interest increases when other investors become more pessimistic. Given the recent collapse in oil prices and lower stock prices, we have reassessed and retested our investment theses and increased positions selectively in the Energy sector with technology leaders, such as Schlumberger. We continue to assess the impact of lower commodity prices on the entire portfolio.
Schlumberger
Schlumberger, the world’s leading oil services company, is the most technologically focused company among the integrated oilfield service companies, with double the
DODGE & COX STOCK FUND §PAGE 2
R&D budget of its closest peer. We believe that its consistent spending on technology (e.g., enhanced recovery techniques, seismic interpretation, directional drilling) has provided the company with a competitive advantage that is sustainable over time. The company’s innovation efforts have enabled the industry to extract oil and gas from deepwater and shale resources that were previously cost-prohibitive or physically challenging to reach.
Schlumberger is the dominant international provider in key markets, including the Middle East and Russia. The majority of its revenues come from outside the United States, and its international business has higher margins than its U.S. operations. We believe that Schlumberger is well positioned to continue to benefit from the long-term relationships it has with international oil companies and producing nations. If the price of oil remains low, the company will face a challenging environment. Relative to competitors, its strong franchises, and solid balance sheet and cash flow should allow the company to endure an extended downturn. Weighing this risk with Schlumberger’s valuation and opportunities, we believe that the company (a 2.5% position in the Fund) remains an attractive investment opportunity.
IN CLOSING
The U.S. equity market remains reasonably valued: the S&P 500 traded at 15.2 times forward estimated earnings at year end, which was in line with its 10-year historical average of 15.4 times. We are optimistic about the long-term prospects for sales and earnings growth and believe that cash returned to shareholders can continue to increase. Balance sheets and cash flows continue to be strong for companies within our investment universe. In our opinion, the Fund’s portfolio is well positioned to benefit from long-term global growth opportunities. Acknowledging that markets can be volatile in the short term, we encourage shareholders to remain focused on the long term.
Thank you for your continued confidence in our firm. As always, we welcome your comments and questions.
For the Board of Trustees,
| | |
 | |  |
Charles F. Pohl, Chairman | | Dana M. Emery, President |
January 27, 2015
| (a) | | The use of specific examples does not imply that they are more attractive investments than the Fund’s other holdings. |
| (b) | | Unless otherwise specified, all weightings and characteristics are as of December 31, 2014. |
| (c) | | Google’s consensus forward estimated earnings exclude stock-based compensation expense (they are non-GAAP earnings). |
PAGE 3 § DODGE & COX STOCK FUND
ANNUAL PERFORMANCE REVIEW
The Fund underperformed the S&P 500 by 3.3 percentage points in 2014.
Key Detractors from Relative Results
| | § | | The Fund’s holdings in the Health Care sector (up 9% compared to up 25% for the S&P 500 sector) hurt results. GlaxoSmithKline (down 16%) and Sanofi (down 13%) lagged. | |
| | § | | Returns from holdings in the Financials sector (up 13% compared to up 15% for the S&P 500 sector) hindered performance. Key detractors included AEGON (down 18%) and the Fund’s lack of holdings in the Real Estate Investment Trusts industry, which outpaced the overall market (up 31%). | |
| | § | | The Fund’s underweight position in the Utilities sector (no holdings compared to 3% for the S&P 500 sector) detracted from results as it was the best performing sector of the market (up 29%). | |
| | § | | Returns from holdings in the Industrials sector (up 4% compared to up 10% for the S&P 500 sector) hurt performance. Philips (down 19%), ADT Corp. (down 8%), and General Electric (down 7%) were weak. | |
| | § | | Selected additional detractors included Sprint (down 61%), Coach (down 31%), Apache (down 26%), and Weatherford International (down 26%). | |
Key Contributors to Relative Results
| | § | | The Fund’s holdings in the Consumer Discretionary sector (up 16% compared to up 10% for the S&P 500 sector) helped returns. CarMax (up 42%), Target (up 31% since date of purchase), and Time Warner (up 30%) were strong. | |
| | § | | Returns from holdings in the Materials sector (up 14% compared to up 6% for the S&P 500 sector) aided performance. Dow Chemical (up 22% to date of sale) and the Fund’s lack of holdings in the Metals & Mining industry, a weaker area of the market (down 14%), were relative positives. | |
| | § | | The Fund’s average underweight position in the Energy sector (9% compared to 10% for the S&P 500 sector) slightly contributed to results since the sector lagged the overall market. | |
| | § | | Selected additional contributors included Forest Laboratories (up 52% to date of sale), Hewlett-Packard (up 46%), Microsoft (up 28%), and Wells Fargo (up 24%). | |
KEY CHARACTERISTICS OF DODGE & COX
Independent Organization
Dodge & Cox is one of the largest privately owned investment managers in the world. We remain committed to independence, with a goal of providing the highest quality investment management service to our existing clients.
Over 80 Years of Investment Experience
Dodge & Cox was founded in 1930. We have a stable and well-qualified team of investment professionals, most of whom have spent their entire careers at Dodge & Cox.
Experienced Investment Team
The Investment Policy Committee, which is the decision-making body for the Stock Fund, is a nine-member committee with an average tenure at Dodge & Cox of 26 years.
One Business with a Single Research Office
Dodge & Cox manages equity (domestic, international, and global), fixed income (domestic and global), and balanced investments, operating from one office in San Francisco.
Consistent Investment Approach
Our team decision-making process involves thorough, bottom-up fundamental analysis of each investment.
Long-Term Focus and Low Expenses
We invest with a three- to five-year investment horizon, which has historically resulted in low turnover relative to our peers. We manage Funds that maintain low expense ratios.
Risks: The Fund is subject to stock market risk, meaning stocks in the Fund may decline in value for extended periods due to the financial prospects of individual companies, or due to general market and economic conditions. Please read the prospectus and summary prospectus for specific details regarding the Fund’s risk profile.
DODGE & COX STOCK FUND §PAGE 4
GROWTH OF $10,000 OVER 10 YEARS
FOR AN INVESTMENT MADE ON DECEMBER 31, 2004
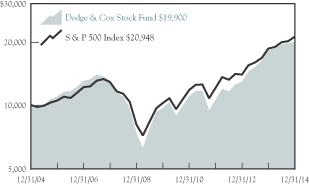
AVERAGE ANNUAL TOTAL RETURN
FOR PERIODS ENDED DECEMBER 31, 2014
| | | | | | | | | | | | | | | | |
| | | 1 Year | | | 5 Years | | | 10 Years | | | 20 Years | |
Dodge & Cox Stock Fund | | | 10.43 | % | | | 15.56 | % | | | 7.13 | % | | | 11.90 | % |
S&P 500 | | | 13.69 | | | | 15.46 | | | | 7.68 | | | | 9.85 | |
Returns represent past performance and do not guarantee future results. Investment return and share price will fluctuate with market conditions, and investors may have a gain or loss when shares are sold. Fund performance changes over time and currently may be significantly lower than stated. Performance is updated and published monthly. Visit the Fund’s website at www.dodgeandcox.com or call 800-621-3979 for current performance figures.
The Fund’s total returns include the reinvestment of dividend and capital gain distributions, but have not been adjusted for any income taxes payable by shareholders on these distributions or on Fund share redemptions. Index returns include dividends but, unlike Fund returns, do not reflect fees or expenses. The S&P 500 Index is a market capitalization-weighted index of 500 large-capitalization stocks commonly used to represent the U.S. equity market.
S&P 500® is a trademark of McGraw Hill Financial.
FUND EXPENSE EXAMPLE
As a Fund shareholder, you incur ongoing Fund costs, including management fees and other Fund expenses. All mutual funds have ongoing costs, sometimes referred to as operating expenses. The following example shows ongoing costs of investing in the Fund and can help you understand these costs and compare them with those of other mutual funds. The example assumes a $1,000 investment held for the six months indicated.
ACTUAL EXPENSES
The first line of the table below provides information about actual account values and expenses based on the Fund’s actual returns. You may use the information in this line, together with your account balance, to estimate the expenses that you paid over the period. Simply divide your account value by $1,000 (for example, an $8,600 account value divided by $1,000 = 8.6), then multiply the result by the number in the first line under the heading “Expenses Paid During Period” to estimate the expenses you paid on your account during this period.
HYPOTHETICAL EXAMPLE FOR COMPARISON WITH OTHER MUTUAL FUNDS
Information on the second line of the table can help you compare ongoing costs of investing in the Fund with those of other mutual funds. This information may not be used to estimate the actual ending account balance or expenses you paid during the period. The hypothetical “Ending Account Value” is based on the actual expense ratio of the Fund and an assumed 5% annual rate of return before expenses (not the Fund’s actual return). The amount under the heading “Expense Paid During the Period” shows the hypothetical expenses your account would have incurred under this scenario. You can compare this figure with the 5% hypothetical examples that appear in shareholder reports of other mutual funds.
| | | | | | | | | | | | |
Six Months Ended
December 31, 2014 | | Beginning Account Value
7/1/2014 | | | Ending Account Value
12/31/2014 | | | Expenses Paid
During Period* | |
Based on Actual Fund Return | | $ | 1,000.00 | | | $ | 1,031.70 | | | $ | 2.65 | |
Based on Hypothetical 5% Yearly Return | | | 1,000.00 | | | | 1,022.60 | | | | 2.64 | |
| * | | Expenses are equal to the Fund’s annualized expense ratio of 0.52%, multiplied by the average account value over the period, multiplied by 184/365 (to reflect the one-half year period). |
The expenses shown in the table highlight ongoing costs only and do not reflect any transactional fees or account maintenance fees. Though other mutual funds may charge such fees, please note that the Fund does not charge transaction fees (e.g., redemption fees, sales loads) or universal account maintenance fees (e.g., small account fees).
PAGE 5 § DODGE & COX STOCK FUND
| | | | |
| FUND INFORMATION | | | December 31, 2014 | |
| | | | |
| GENERAL INFORMATION | | | |
Net Asset Value Per Share | | | $180.94 | |
Total Net Assets (billions) | | | $60.3 | |
Expense Ratio | | | 0.52% | |
Portfolio Turnover Rate | | | 17% | |
30-Day SEC Yield(a) | | | 1.25% | |
Fund Inception | | | 1965 | |
No sales charges or distribution fees | | | | |
Investment Manager: Dodge & Cox, San Francisco. Managed by the Investment Policy Committee, whose nine members’ average tenure at Dodge & Cox is 26 years.
| | | | | | | | |
| PORTFOLIO CHARACTERISTICS | | Fund | | | S&P 500 | |
Number of Equity Securities | | | 66 | | | | 502 | |
Median Market Capitalization (billions) | | | $41 | | | | $19 | |
Weighted Average Market Capitalization (billions) | | | $115 | | | | $134 | |
Price-to-Earnings Ratio(b) | | | 14.9x | | | | 15.2x | |
Foreign Securities not in the S&P 500(c) | | | 10.5% | | | | 0.0% | |
| | | | |
| TEN LARGEST HOLDINGS (%)(d) | | Fund | |
Hewlett-Packard Co. | | | 4.1 | |
Wells Fargo & Co. | | | 4.0 | |
Capital One Financial Corp. | | | 3.9 | |
Microsoft Corp. | | | 3.8 | |
Novartis AG (Switzerland) | | | 3.2 | |
Time Warner, Inc. | | | 3.2 | |
Time Warner Cable, Inc. | | | 2.9 | |
Charles Schwab Corp. | | | 2.8 | |
Bank of America Corp. | | | 2.8 | |
Bank of New York Mellon Corp. | | | 2.7 | |

| | | | | | | | |
| SECTOR DIVERSIFICATION (%) | | Fund | | | S&P 500 | |
Financials | | | 23.9 | | | | 16.6 | |
Information Technology | | | 23.7 | | | | 19.7 | |
Health Care | | | 16.9 | | | | 14.2 | |
Consumer Discretionary | | | 15.2 | | | | 12.3 | |
Energy | | | 8.6 | | | | 8.4 | |
Industrials | | | 6.5 | | | | 10.4 | |
Consumer Staples | | | 2.7 | | | | 9.8 | |
Materials | | | 0.9 | | | | 3.1 | |
Telecommunication Services | | | 0.4 | | | | 2.3 | |
Utilities | | | 0.0 | | | | 3.2 | |
| (a) | SEC Yield is an annualization of the Fund’s total net investment income per share for the 30-day period ended on the last day of the month. |
| (b) | Price-to-earnings (P/E) ratios are calculated using 12-month forward earnings estimates from third-party sources. |
| (c) | Foreign securities are U.S. dollar denominated. |
| (d) | The Fund’s portfolio holdings are subject to change without notice. The mention of specific securities is not a recommendation to buy, sell, or hold any particular security and is not indicative of Dodge & Cox’s current or future trading activity. |
DODGE & COX STOCK FUND §PAGE 6
| | | | |
| PORTFOLIO OF INVESTMENTS | | | December 31, 2014 | |
| | | | | | | | |
| COMMON STOCKS: 98.8% | |
| | |
| | | SHARES | | | VALUE | |
| CONSUMER DISCRETIONARY: 15.2% | |
CONSUMER DURABLES & APPAREL: 0.8% | | | | | |
Coach, Inc. | | | 10,316,700 | | | $ | 387,495,252 | |
NVR, Inc.(a) | | | 70,900 | | | | 90,420,897 | |
| | | | | | | | |
| | | | | | | 477,916,149 | |
MEDIA: 11.8% | | | | | | | | |
Comcast Corp., Class A | | | 27,569,897 | | | | 1,599,329,725 | |
DISH Network Corp., Class A(a) | | | 6,819,649 | | | | 497,084,216 | |
News Corp., Class A(a) | | | 6,326,406 | | | | 99,261,310 | |
Time Warner Cable, Inc. | | | 11,589,110 | | | | 1,762,240,067 | |
Time Warner, Inc. | | | 22,619,432 | | | | 1,932,151,881 | |
Time, Inc. | | | 4,754,341 | | | | 117,004,332 | |
Twenty-First Century Fox, Inc. | | | 28,214,826 | | | | 1,083,590,392 | |
| | | | | | | | |
| | | | | | | 7,090,661,923 | |
RETAILING: 2.6% | | | | | | | | |
CarMax, Inc.(a) | | | 4,824,050 | | | | 321,185,249 | |
Liberty Interactive Corp., Series A(a) | | | 13,101,375 | | | | 385,442,453 | |
Liberty Ventures, Series A(a) | | | 1,933,707 | | | | 72,939,428 | |
Target Corp. | | | 10,670,686 | | | | 810,011,774 | |
| | | | | | | | |
| | | | | | | 1,589,578,904 | |
| | | | | | | | |
| | | | | | | 9,158,156,976 | |
| CONSUMER STAPLES: 2.7% | | | | | |
FOOD & STAPLES RETAILING: 2.7% | | | | | |
Wal-Mart Stores, Inc. | | | 18,655,350 | | | | 1,602,121,458 | |
| |
| ENERGY: 8.6% | | | | | |
Apache Corp. | | | 18,390,028 | | | | 1,152,503,055 | |
Baker Hughes, Inc. | | | 14,018,450 | | | | 786,014,492 | |
Chevron Corp. | | | 7,792,280 | | | | 874,137,970 | |
National Oilwell Varco, Inc. | | | 8,582,900 | | | | 562,437,437 | |
Schlumberger, Ltd.(b)
(Curacao/United States) | | | 17,665,245 | | | | 1,508,788,575 | |
Weatherford International PLC(a),(b) (Ireland) | | | 24,773,700 | | | | 283,658,865 | |
| | | | | | | | |
| | | | | | | 5,167,540,394 | |
| FINANCIALS: 23.9% | | | | | | | | |
BANKS: 10.1% | | | | | | | | |
Bank of America Corp. | | | 93,511,800 | | | | 1,672,926,102 | |
BB&T Corp. | | | 17,105,244 | | | | 665,222,939 | |
JPMorgan Chase & Co. | | | 15,006,400 | | | | 939,100,512 | |
SunTrust Banks, Inc. | | | 10,250,133 | | | | 429,480,573 | |
Wells Fargo & Co. | | | 43,860,341 | | | | 2,404,423,893 | |
| | | | | | | | |
| | | | | | | 6,111,154,019 | |
DIVERSIFIED FINANCIALS: 11.8% | | | | | |
Bank of New York Mellon Corp. | | | 40,373,124 | | | | 1,637,937,641 | |
Capital One Financial Corp.(c) | | | 28,169,211 | | | | 2,325,368,368 | |
Charles Schwab Corp. | | | 56,605,900 | | | | 1,708,932,121 | |
Goldman Sachs Group, Inc. | | | 7,463,400 | | | | 1,446,630,822 | |
| | | | | | | | |
| | | | | | | 7,118,868,952 | |
| | | | | | | | |
| | |
| | | SHARES | | | VALUE | |
INSURANCE: 2.0% | | | | | | | | |
AEGON NV(b) (Netherlands) | | | 66,753,197 | | | $ | 500,648,978 | |
MetLife, Inc. | | | 12,901,700 | | | | 697,852,953 | |
| | | | | | | | |
| | | | | | | 1,198,501,931 | |
| | | | | | | | |
| | | | | | | 14,428,524,902 | |
| HEALTH CARE: 16.9% | | | | | | | | |
HEALTH CARE EQUIPMENT & SERVICES: 5.0% | |
Cigna Corp. | | | 6,144,784 | | | | 632,359,722 | |
Express Scripts Holding Co.(a) | | | 11,388,600 | | | | 964,272,762 | |
Medtronic, Inc. | | | 5,370,000 | | | | 387,714,000 | |
UnitedHealth Group, Inc. | | | 9,915,600 | | | | 1,002,368,004 | |
| | | | | | | | |
| | | | | | | 2,986,714,488 | |
PHARMACEUTICALS, BIOTECHNOLOGY &
LIFE SCIENCES: 11.9% | |
GlaxoSmithKline PLC ADR(b) (United Kingdom) | | | 11,381,400 | | | | 486,441,036 | |
Merck & Co., Inc. | | | 20,357,600 | | | | 1,156,108,104 | |
Novartis AG ADR(b) (Switzerland) | | | 21,110,700 | | | | 1,956,117,462 | |
Pfizer, Inc. | | | 28,771,064 | | | | 896,218,643 | |
Roche Holding AG ADR(b) (Switzerland) | | | 42,969,500 | | | | 1,460,533,305 | |
Sanofi ADR(b) (France) | | | 27,088,029 | | | | 1,235,485,003 | |
| | | | | | | | |
| | | | | | | 7,190,903,553 | |
| | | | | | | | |
| | | | | | | 10,177,618,041 | |
| INDUSTRIALS: 6.5% | | | | | | | | |
CAPITAL GOODS: 2.4% | | | | | | | | |
Danaher Corp. | | | 6,675,009 | | | | 572,115,022 | |
General Electric Co. | | | 23,414,475 | | | | 591,683,783 | |
Koninklijke Philips NV(b) (Netherlands) | | | 7,383,475 | | | | 214,120,775 | |
NOW, Inc.(a) | | | 2,090,700 | | | | 53,793,711 | |
| | | | | | | | |
| | | | | | | 1,431,713,291 | |
COMMERCIAL & PROFESSIONAL SERVICES: 1.6% | |
ADT Corp.(c) | | | 11,819,337 | | | | 428,214,580 | |
Tyco International PLC(b) (Ireland) | | | 12,660,975 | | | | 555,310,363 | |
| | | | | | | | |
| | | | | | | 983,524,943 | |
TRANSPORTATION: 2.5% | | | | | | | | |
FedEx Corp. | | | 8,824,299 | | | | 1,532,427,764 | |
| | | | | | | | |
| | | | | | | 3,947,665,998 | |
| | |
| PAGE 7 § DODGE & COX STOCK FUND | | See accompanying Notes to Financial Statements |
| | | | |
| PORTFOLIO OF INVESTMENTS | | | December 31, 2014 | |
| | | | | | | | |
| COMMON STOCKS (continued) | |
| | |
| | | SHARES | | | VALUE | |
| INFORMATION TECHNOLOGY: 23.7% | |
SEMICONDUCTORS & SEMICONDUCTOR EQUIPMENT: 0.9% | |
Maxim Integrated Products, Inc.(c) | | | 16,326,840 | | | $ | 520,336,391 | |
| |
SOFTWARE & SERVICES: 11.7% | | | | | |
AOL, Inc.(a),(c) | | | 7,100,754 | | | | 327,841,812 | |
Cadence Design Systems, Inc.(a) | | | 10,099,300 | | | | 191,583,721 | |
eBay, Inc.(a) | | | 16,424,109 | | | | 921,720,997 | |
Google, Inc., Class A(a) | | | 795,200 | | | | 421,980,832 | |
Google, Inc., Class C(a) | | | 1,877,200 | | | | 988,158,080 | |
Microsoft Corp. | | | 49,217,900 | | | | 2,286,171,455 | |
Symantec Corp.(c) | | | 51,921,000 | | | | 1,332,033,255 | |
Synopsys, Inc.(a),(c) | | | 13,627,969 | | | | 592,407,813 | |
| | | | | | | | |
| | | | | | | 7,061,897,965 | |
TECHNOLOGY, HARDWARE & EQUIPMENT: 11.1% | |
Cisco Systems, Inc. | | | 18,518,211 | | | | 515,084,039 | |
Corning, Inc. | | | 34,269,300 | | | | 785,795,049 | |
EMC Corp. | | | 24,850,400 | | | | 739,050,896 | |
Hewlett-Packard Co. | | | 62,145,595 | | | | 2,493,902,727 | |
Juniper Networks, Inc. | | | 8,968,479 | | | | 200,176,451 | |
NetApp, Inc.(c) | | | 19,794,000 | | | | 820,461,300 | |
Nokia Corp. ADR(b) (Finland) | | | 18,753,500 | | | | 147,402,510 | |
TE Connectivity, Ltd.(b) (Switzerland) | | | 15,376,575 | | | | 972,568,369 | |
| | | | | | | | |
| | | | | | | 6,674,441,341 | |
| | | | | | | | |
| | | | | | | 14,256,675,697 | |
| MATERIALS: 0.9% | | | | | |
Celanese Corp., Series A(c) | | | 9,220,971 | | | | 552,889,421 | |
|
| TELECOMMUNICATION SERVICES: 0.4% | |
Sprint Corp.(a) | | | 64,778,296 | | | | 268,829,928 | |
| | | | | | | | |
TOTAL COMMON STOCKS
(Cost $40,318,283,795) | | | | | | $ | 59,560,022,815 | |
| | | | | | | | |
| SHORT-TERM INVESTMENTS: 1.2% | |
| | |
| | | PAR VALUE | | | VALUE | |
MONEY MARKET FUND: 0.1% | |
SSgA U.S. Treasury Money
Market Fund | | $ | 60,874,430 | | | $ | 60,874,430 | |
|
REPURCHASE AGREEMENT: 1.1% | |
Fixed Income Clearing Corporation(d) 0.01%, dated 12/31/14, due 1/2/15, maturity value $656,866,365 | | | 656,866,000 | | | | 656,866,000 | |
| | | | | | | | |
TOTAL SHORT-TERM INVESTMENTS
(Cost $717,740,430) | | | $ | 717,740,430 | |
| | | | | | | | |
TOTAL INVESTMENTS
(Cost $41,036,024,225) | | | 100.0 | % | | $ | 60,277,763,245 | |
OTHER ASSETS LESS LIABILITIES | | | 0.0 | % | | | (17,642,220 | ) |
| | | | | | | | |
| NET ASSETS | | | 100.0 | % | | $ | 60,260,121,025 | |
| | | | | | | | |
| (b) | Security denominated in U.S. dollars |
| (c) | See Note 9 regarding holdings of 5% voting securities |
| (d) | Repurchase agreement is collateralized by U.S. Treasury Note 1.00%-2.375%, 5/31/18-7/31/18. Total collateral value is $670,008,188. |
In determining a company’s country designation, the Fund generally references the country of incorporation. In cases where the Fund considers the country of incorporation to be a “jurisdiction of convenience” chosen primarily for tax purposes, the Fund uses the country designation of an appropriate broad-based market index. In that circumstance, two countries are listed - the country of incorporation and the country designated by an appropriate index, respectively.
ADR: American Depositary Receipt
| | |
| See accompanying Notes to Financial Statements | | DODGE & COX STOCK FUND §PAGE 8 |
| | | | |
STATEMENT OF ASSETS AND LIABILITIES | |
| |
| | | December 31, 2014 | |
ASSETS: | | | | |
Investments, at value | | | | |
Unaffiliated issuers (cost $36,203,044,072) | | $ | 53,378,210,305 | |
Affiliated issuers (cost $4,832,980,153) | | | 6,899,552,940 | |
| | | | |
| | | 60,277,763,245 | |
| | | | |
Receivable for Fund shares sold | | | 77,337,450 | |
Dividends and interest receivable | | | 53,846,884 | |
Prepaid expenses and other assets | | | 289,850 | |
| | | | |
| | | 60,409,237,429 | |
| | | | |
LIABILITIES: | | | | |
Payable for investments purchased | | | 13,943,690 | |
Payable for Fund shares redeemed | | | 106,826,720 | |
Management fees payable | | | 25,560,977 | |
Accrued expenses | | | 2,785,017 | |
| | | | |
| | | 149,116,404 | |
| | | | |
NET ASSETS | | $ | 60,260,121,025 | |
| | | | |
NET ASSETS CONSIST OF: | | | | |
Paid in capital | | $ | 40,545,844,119 | |
Undistributed net investment income | | | 19,383,384 | |
Undistributed net realized gain | | | 453,154,502 | |
Net unrealized appreciation | | | 19,241,739,020 | |
| | | | |
| | $ | 60,260,121,025 | |
| | | | |
Fund shares outstanding (par value $0.01 each, unlimited shares authorized) | | | 333,044,877 | |
Net asset value per share | | $ | 180.94 | |
|
STATEMENT OF OPERATIONS | |
| | | Year Ended December 31, 2014 | |
INVESTMENT INCOME: | | | | |
Dividends (net of foreign taxes of $30,137,316) | | | | |
Unaffiliated issuers | | $ | 1,107,988,550 | |
Affiliated issuers | | | 109,081,196 | |
Interest | | | 6,381 | |
| | | | |
| | | 1,217,076,127 | |
| | | | |
EXPENSES: | | | | |
Management fees | | | 284,657,421 | |
Custody and fund accounting fees | | | 1,092,587 | |
Transfer agent fees | | | 4,465,255 | |
Professional services | | | 287,794 | |
Shareholder reports | | | 1,147,414 | |
Proxy expenses | | | 1,979,172 | |
Registration fees | | | 434,294 | |
Trustees’ fees | | | 258,072 | |
Miscellaneous | | | 2,919,729 | |
| | | | |
| | | 297,241,738 | |
| | | | |
NET INVESTMENT INCOME | | | 919,834,389 | |
| | | | |
REALIZED AND UNREALIZED GAIN: | | | | |
Net realized gain | | | | |
Unaffiliated issuers | | | 2,255,513,744 | |
Affiliated issuers | | | 77,846,110 | |
Net change in unrealized appreciation/depreciation | | | 2,407,499,870 | |
| | | | |
Net realized and unrealized gain | | | 4,740,859,724 | |
| | | | |
NET INCREASE IN NET ASSETS FROM OPERATIONS | | $ | 5,660,694,113 | |
| | | | |
| | | | | | | | |
STATEMENT OF CHANGES IN NET ASSETS | |
| | |
| | | Year Ended December 31, 2014 | | | Year Ended
December 31, 2013 | |
OPERATIONS: | | | | | | | | |
Net investment income | | $ | 919,834,389 | | | $ | 691,471,816 | |
Net realized gain | | | 2,333,359,854 | | | | 2,942,196,702 | |
Net change in unrealized appreciation/depreciation | | | 2,407,499,870 | | | | 12,466,351,142 | |
| | | | | | | | |
| | | 5,660,694,113 | | | | 16,100,019,660 | |
| | | | | | | | |
| | |
DISTRIBUTIONS TO SHAREHOLDERS FROM: | | | | | | | | |
Net investment income | | | (908,453,128 | ) | | | (688,649,453 | ) |
Net realized gain | | | (840,004,493 | ) | | | — | |
| | | | | | | | |
Total distributions | | | (1,748,457,621 | ) | | | (688,649,453 | ) |
| | | | | | | | |
| | |
FUND SHARE TRANSACTIONS: | | | | | | | | |
Proceeds from sale of shares | | | 9,175,796,977 | | | | 7,505,695,700 | |
Reinvestment of distributions | | | 1,609,896,035 | | | | 638,450,488 | |
Cost of shares redeemed | | | (9,285,324,011 | ) | | | (8,549,348,435 | ) |
| | | | | | | | |
Net increase/(decrease) from Fund share transactions | | | 1,500,369,001 | | | | (405,202,247 | ) |
| | | | | | | | |
Total increase in net assets | | | 5,412,605,493 | | | | 15,006,167,960 | |
| | |
NET ASSETS: | | | | | | | | |
Beginning of year | | | 54,847,515,532 | | | | 39,841,347,572 | |
| | | | | | | | |
End of year (including undistributed net investment income of $19,383,384 and $8,002,123, respectively) | | $ | 60,260,121,025 | | | $ | 54,847,515,532 | |
| | | | | | | | |
| | |
SHARE INFORMATION: | | | | | | | | |
Shares sold | | | 52,472,086 | | | | 52,247,087 | |
Distributions reinvested | | | 9,034,682 | | | | 4,391,872 | |
Shares redeemed | | | (53,255,380 | ) | | | (58,685,059 | ) |
| | | | | | | | |
Net increase/(decrease) in shares outstanding | | | 8,251,388 | | | | (2,046,100 | ) |
| | | | | | | | |
| | |
| PAGE 9 § DODGE & COX STOCK FUND | | See accompanying Notes to Financial Statements |
NOTES TO FINANCIAL STATEMENTS
NOTE 1—ORGANIZATION AND SIGNIFICANT ACCOUNTING POLICIES
Dodge & Cox Stock Fund (the “Fund”) is one of the series constituting the Dodge & Cox Funds (the “Trust” or the “Funds”). The Trust is organized as a Delaware statutory trust and is registered under the Investment Company Act of 1940, as amended, as an open-end management investment company. The Fund commenced operations on January 4, 1965, and seeks long-term growth of principal and income. Risk considerations and investment strategies of the Fund are discussed in the Fund’s Prospectus.
The financial statements have been prepared in conformity with accounting principles generally accepted in the United States of America, which require the use of estimates and assumptions by management. Actual results may differ from those estimates. Significant accounting policies are as follows:
Security valuation The Fund’s net assets are valued as of the close of trading on the New York Stock Exchange (NYSE), generally 4:00 p.m. Eastern Time, each day that the NYSE is open for business. Portfolio securities and other financial instruments for which market quotes are readily available are valued at market value. Listed securities are generally valued using the official quoted close price or the last sale on the exchange that is determined to be the primary market for the security. Security values are not discounted based on the size of the Fund’s position. Securities for which market quotations are not readily available are valued at fair value as determined in good faith by or under the direction of the Board of Trustees. Short-term securities less than 60 days to maturity may be valued at amortized cost if amortized cost approximates current value. All securities held by the Fund are denominated in U.S. dollars.
The Board of Trustees has delegated authority to Dodge & Cox, the Fund’s investment manager, to make fair value determinations in accordance with the Dodge & Cox Funds Valuation Policies (“Valuation Policies”), subject to Board oversight. Dodge & Cox has established a Pricing Committee that is comprised of representatives from Treasury, Legal, Compliance, and Operations. The Pricing Committee is responsible for implementing the Valuation Policies, including determining the fair value of
securities when market quotations or market-based valuations are not readily available or are deemed unreliable. The Pricing Committee considers relevant indications of value that are reasonably available to it in determining the fair value assigned to a particular security, such as the value of similar financial instruments, trading volumes, contractual restrictions on disposition, related corporate actions, and changes in economic conditions.
Valuing securities at fair value involves greater reliance on judgment than valuation of securities based on readily available market quotations. In some instances, lack of information and uncertainty as to the significance of information may lead to a conclusion that a prior valuation is the best indication of a security’s present value. When fair value pricing is employed, the prices of securities used by the Fund to calculate its net asset value may differ from quoted or published prices for the same securities.
Security transactions, investment income, expenses, and distributions Security transactions are recorded on the trade date. Realized gains and losses on securities sold are determined on the basis of identified cost.
Dividend income and corporate action transactions are recorded on the ex-dividend date, or when the Fund first learns of the dividend/corporate action if the ex-dividend date has passed. Withholding taxes on foreign dividends have been provided for in accordance with the Fund’s understanding of the applicable country’s tax rules and rates. Non-cash dividends included in dividend income, if any, are recorded at the fair market value of the securities received. Dividends characterized as return of capital for U.S. tax purposes are recorded as a reduction of cost of investments and/or realized gain. Interest income is recorded on the accrual basis.
Expenses are recorded on the accrual basis. Most expenses of the Trust can be directly attributed to a specific series. Expenses which cannot be directly attributed are allocated among the Funds in the Trust based on relative net assets or other expense methodologies determined by the nature of the expense.
Distributions to shareholders are recorded on the ex-dividend date.
DODGE & COX STOCK FUND §PAGE 10
NOTES TO FINANCIAL STATEMENTS
Repurchase agreements The Fund enters into repurchase agreements, secured by U.S. government or agency securities, which involve the purchase of securities from a counterparty with a simultaneous commitment to resell the securities at an agreed-upon date and price. It is the Fund’s policy that its custodian take possession of the underlying collateral securities, the fair value of which exceeds the principal amount of the repurchase transaction, including accrued interest, at all times. In the event of default by the counterparty, the Fund has the contractual right to liquidate the collateral securities and to apply the proceeds in satisfaction of the obligation.
Indemnification Under the Trust’s organizational documents, its officers and trustees are indemnified against certain liabilities arising out of the performance of their duties to the Trust. In addition, in the normal course of business the Trust enters into contracts that provide general indemnities to other parties. The Trust’s maximum exposure under these arrangements is unknown as this would involve future claims that may be made against the Trust that have not yet occurred.
NOTE 2—VALUATION MEASUREMENTS
Various inputs are used in determining the value of the Fund’s investments. These inputs are summarized in the three broad levels listed below.
| § | | Level 1: Quoted prices in active markets for identical securities |
| § | | Level 2: Other significant observable inputs (including quoted prices for similar securities, market indices, interest rates, credit risk, etc.) |
| § | | Level 3: Significant unobservable inputs (including Fund management’s assumptions in determining the fair value of investments) |
The inputs or methodology used for valuing securities are not necessarily an indication of the risk associated with investing in those securities.
The following is a summary of the inputs used to value the Fund’s holdings at December 31, 2014:
| | | | | | | | |
| Security Classification(a) | | LEVEL 1
(Quoted Prices) | | | LEVEL 2
(Other Significant
Observable Inputs) | |
Common Stocks(b) | | $ | 59,560,022,815 | | | $ | — | |
Short-term Investments | | | | | | | | |
Money Market Fund | | | 60,874,430 | | | | — | |
Repurchase Agreement | | | — | | | | 656,866,000 | |
| | | | | | | | |
Total | | $ | 59,620,897,245 | | | $ | 656,866,000 | |
| | | | | | | | |
| | | | | | | | | |
| (a) | There were no transfers between Level 1 and Level 2 during the year ended December 31, 2014. There were no Level 3 securities at December 31, 2014 and 2013, and there were no transfers to Level 3 during the year. |
| (b) | All common stocks held in the Fund are Level 1 securities. For a detailed break-out of common stocks by major industry classification, please refer to the Portfolio of Investments. |
NOTE 3—RELATED PARTY TRANSACTIONS
Management fees Under a written agreement approved by a unanimous vote of the Board of Trustees, the Fund pays an annual management fee of 0.50% of the Fund’s average daily net assets to Dodge & Cox, investment manager of the Fund. The agreement further provides that Dodge & Cox shall waive its fee to the extent that such fee plus all other ordinary operating expenses of the Fund exceed 0.75% of the average daily net assets for the year.
Fund officers and trustees All officers and two of the trustees of the Trust are officers or employees of Dodge & Cox. The Trust pays a fee only to those trustees who are not affiliated with Dodge & Cox.
NOTE 4—INCOME TAX INFORMATION AND DISTRIBUTIONS TO SHAREHOLDERS
A provision for federal income taxes is not required since the Fund intends to continue to qualify as a regulated investment company under Subchapter M of the Internal Revenue Code and distribute all of its taxable income to shareholders. Distributions are determined in accordance with income tax regulations, and such amounts may differ from net investment income and realized gains for financial reporting purposes. Financial reporting records are adjusted for permanent book/tax differences at year end to reflect tax character.
PAGE 11 § DODGE & COX STOCK FUND
NOTES TO FINANCIAL STATEMENTS
Book/tax differences are primarily due to differing treatments of wash sales, in-kind redemptions, and net short-term realized gain (loss). During the year, the Fund recognized net realized gains of $583,544,894 from the delivery of appreciated securities in two in-kind redemption transactions. For federal income tax purposes, this gain is not recognized as taxable income to the Fund and therefore will not be distributed to shareholders. At December 31, 2014, the cost of investments for federal income tax purposes was $41,038,354,404.
Distributions during the years noted below were characterized as follows for federal income tax purposes:
| | | | | | |
| | | Year Ended December 31, 2014 | | Year Ended
December 31, 2013 | |
Ordinary income | | $908,453,128 | | | $688,649,453 | |
| | ($2.800 per share) | | | ($2.105 per share) | |
| | |
Long-term capital gain | | $840,004,493 | | | — | |
| | ($2.560 per share) | | | | |
At December 31, 2014, the tax basis components of distributable earnings were as follows:
| | | | |
Unrealized appreciation | | $ | 20,324,503,253 | |
Unrealized depreciation | | | (1,085,094,412 | ) |
| | | | |
Net unrealized appreciation | | | 19,239,408,841 | |
Undistributed ordinary income | | | 19,383,384 | |
Undistributed long-term capital gain | | | 455,484,681 | |
During 2014, the Fund utilized all of its capital loss carryforward, which amounted to $440,626,227.
Under the Regulated Investment Company Modernization Act of 2010, capital losses incurred by the Fund after January 1, 2011, are not subject to expiration. In addition, such losses must be utilized prior to the losses incurred in the years preceding enactment.
Fund management has reviewed the tax positions for open periods (three years and four years, respectively, from filing the Fund’s Federal and State tax returns) as applicable to the Fund, and has determined that no provision for income tax is required in the Fund’s financial statements.
NOTE 5—LOAN FACILITIES
Pursuant to an exemptive order issued by the Securities and Exchange Commission (SEC), the Fund may participate in
an interfund lending facility (Facility). The Facility allows the Fund to borrow money from or loan money to the Funds. Loans under the Facility are made for temporary or emergency purposes, such as to fund shareholder redemption requests. Interest on borrowings is the average of the current repurchase agreement rate and the bank loan rate. There was no activity in the Facility during the year.
All Funds in the Trust participate in a $500 million committed credit facility (Line of Credit) with State Street Bank and Trust Company, to be utilized for temporary or emergency purposes to fund shareholder redemptions or for other short-term liquidity purposes. The maximum amount available to the Fund is $250 million. Each Fund pays an annual commitment fee on its pro-rata portion of the Line of Credit. The Fund’s commitment fee for the year ended December 31, 2014, amounted to $158,594 and is reflected as a Miscellaneous Expense in the Statement of Operations. Interest on borrowings is charged at the prevailing rate. There were no borrowings on the Line of Credit during the year.
NOTE 6—PURCHASES AND SALES OF INVESTMENTS
For the year ended December 31, 2014, purchases and sales of securities, other than short-term securities, aggregated $11,606,261,860 and $10,725,926,031, respectively.
NOTE 7—ACCOUNTING PRONOUNCEMENTS
In June 2014, the Financial Accounting Standards Board issued Accounting Standards Update (ASU) No. 2014-11, Transfers and Servicing (Topic 860), Repurchase-to-Maturity Transactions, Repurchase Financings, and Disclosures. The ASU changes the accounting for certain repurchase agreements and expands disclosure requirements related to repurchase agreements and similar transactions. Management is currently evaluating the impact, if any, of applying this ASU effective January 1, 2015.
NOTE 8—SUBSEQUENT EVENTS
Fund management has determined that no material events or transactions occurred subsequent to December 31, 2014, and through the date of the Fund’s financial statements issuance, which require additional disclosure in the Fund’s financial statements.
DODGE & COX STOCK FUND §PAGE 12
NOTES TO FINANCIAL STATEMENTS
NOTE 9—HOLDINGS OF 5% VOTING SECURITIES
Each of the companies listed below was considered to be an affiliate of the Fund because the Fund owned 5% or more of the company’s voting securities during all or part of the year ended December 31, 2014. Purchase and sale transactions and dividend income earned during the period on these securities were as follows:
| | | | | | | | | | | | | | | | | | | | | | | | |
| | | Shares at
Beginning of Period | | | Additions | | | Reductions | | | Shares at
End of Period | | | Dividend
Income(a) | | | Value at End of Period | |
ADT Corp. | | | 12,073,537 | | | | — | | | | (254,200 | ) | | | 11,819,337 | | | $ | 9,504,750 | | | $ | 428,214,580 | |
AOL, Inc. | | | 5,997,054 | | | | 1,550,000 | | | | (446,300 | ) | | | 7,100,754 | | | | — | (b) | | | 327,841,812 | |
Capital One Financial Corp. | | | 28,876,111 | | | | 100,000 | | | | (806,900 | ) | | | 28,169,211 | | | | 33,979,153 | | | | 2,325,368,368 | |
Celanese Corp., Series A | | | 9,419,271 | | | | — | | | | (198,300 | ) | | | 9,220,971 | | | | 8,616,826 | | | | 552,889,421 | |
Maxim Integrated Products, Inc. | | | 10,277,500 | | | | 6,301,040 | | | | (251,700 | ) | | | 16,326,840 | | | | 15,049,561 | | | | 520,336,391 | |
NetApp, Inc. | | | 14,635,500 | | | | 5,513,000 | | | | (354,500 | ) | | | 19,794,000 | | | | 11,173,496 | | | | 820,461,300 | |
Symantec Corp. | | | 50,304,000 | | | | 2,700,000 | | | | (1,083,000 | ) | | | 51,921,000 | | | | 30,757,410 | | | | 1,332,033,255 | |
Synopsys, Inc. | | | 13,596,636 | | | | 579,733 | | | | (548,400 | ) | | | 13,627,969 | | | | — | (b) | | | 592,407,813 | |
| | | | | | | | | | | | | | | | | | | | | | | | |
| | | | | | | | | | | | | | | | | | $ | 109,081,196 | | | $ | 6,899,552,940 | |
| | | | | | | | | | | | | | | | | | | | | | | | |
| | | | | | | | | | | | | | | | | | | | | | | | | |
| (a) | Net of foreign taxes, if any |
FINANCIAL HIGHLIGHTS
| | | | | | | | | | | | | | | | | | | | |
SELECTED DATA AND RATIOS (for a share outstanding throughout each year) | | Year Ended December 31, | |
| | | 2014 | | | 2013 | | | 2012 | | | 2011 | | | 2010 | |
| | | | |
Net asset value, beginning of year | | | $168.87 | | | | $121.90 | | | | $101.64 | | | | $107.76 | | | | $96.14 | |
Income from investment operations: | | | | | | | | | | | | | | | | | | | | |
Net investment income | | | 2.83 | | | | 2.11 | | | | 1.98 | | | | 1.76 | | | | 1.23 | |
Net realized and unrealized gain (loss) | | | 14.60 | | | | 46.97 | | | | 20.26 | | | | (6.13 | ) | | | 11.62 | |
| | | | |
Total from investment operations | | | 17.43 | | | | 49.08 | | | | 22.24 | | | | (4.37 | ) | | | 12.85 | |
| | | | |
Distributions to shareholders from: | | | | | | | | | | | | | | | | | | | | |
Net investment income | | | (2.80 | ) | | | (2.11 | ) | | | (1.98 | ) | | | (1.75 | ) | | | (1.23 | ) |
Net realized gain | | | (2.56 | ) | | | — | | | | — | | | | — | | | | — | |
| | | | |
Total distributions | | | (5.36 | ) | | | (2.11 | ) | | | (1.98 | ) | | | (1.75 | ) | | | (1.23 | ) |
| | | | |
Net asset value, end of year | | | $180.94 | | | | $168.87 | | | | $121.90 | | | | $101.64 | | | | $107.76 | |
| | | | |
Total return | | | 10.43 | % | | | 40.55 | % | | | 22.01 | % | | | (4.08 | )% | | | 13.48 | % |
Ratios/supplemental data: | | | | | | | | | | | | | | | | | | | | |
Net assets, end of year (millions) | | | $60,260 | | | | $54,848 | | | | $39,841 | | | | $36,562 | | | | $43,038 | |
Ratio of expenses to average net assets | | | 0.52 | % | | | 0.52 | % | | | 0.52 | % | | | 0.52 | % | | | 0.52 | % |
Ratio of net investment income to average net assets | | | 1.62 | % | | | 1.45 | % | | | 1.72 | % | | | 1.62 | % | | | 1.25 | % |
Portfolio turnover rate | | | 17 | % | | | 15 | % | | | 11 | % | | | 16 | % | | | 12 | % |
See accompanying Notes to Financial Statements
PAGE 13 § DODGE & COX STOCK FUND
REPORT OF INDEPENDENT REGISTERED PUBLIC ACCOUNTING FIRM
To the Trustees of Dodge & Cox Funds and Shareholders of Dodge & Cox Stock Fund
In our opinion, the accompanying statement of assets and liabilities, including the portfolio of investments, and the related statements of operations and of changes in net assets and the financial highlights present fairly, in all material respects, the financial position of Dodge & Cox Stock Fund (the “Fund”, one of the series constituting Dodge & Cox Funds) at December 31, 2014, the results of its operations for the year then ended, the changes in its net assets for each of the two years in the period then ended and the financial highlights for each of the five years in the period then ended, in conformity with accounting principles generally accepted in the United States of America. These financial statements and financial highlights (hereafter referred to as financial statements) are the responsibility of the Fund’s management. Our responsibility is to express an opinion on these financial statements based on our audits. We conducted our audits of these financial statements in accordance with the standards of the Public Company Accounting Oversight Board (United States). Those standards require that we plan and perform the audit to obtain reasonable assurance about whether the financial statements are free of material misstatement. An audit includes examining, on a test basis, evidence supporting the amounts and disclosures in the financial statements, assessing the accounting principles used and significant estimates made by management, and evaluating the overall financial statement presentation. We believe that our audits, which included confirmation of securities at December 31, 2014, by correspondence with the custodian and brokers, provide a reasonable basis for our opinion.
PricewaterhouseCoopers LLP
San Francisco, California
February 17, 2015
DODGE & COX STOCK FUND §PAGE 14
SPECIAL 2014 TAX INFORMATION (unaudited)
The following information is provided pursuant to provisions of the Internal Revenue Code:
The Fund designates up to a maximum amount of $1,246,603,033 of its distributions paid to shareholders in 2014 as qualified dividends (treated for federal income tax purposes in the hands of shareholders as taxable at a maximum rate of 20%).
For shareholders that are corporations, the Fund designates 83% of its ordinary dividends paid to shareholders in 2014 as dividends from domestic corporations eligible for the corporate dividends received deduction, provided that the shareholder otherwise satisfies applicable requirements to claim that deduction.
BOARD APPROVAL OF FUNDS’ INVESTMENT MANAGEMENT AGREEMENTS AND MANAGEMENT FEES
(unaudited)
The Board of Trustees is responsible for overseeing the performance of the Dodge & Cox Funds’ investment manager and determining whether to continue the Investment Management Agreements between the Funds and Dodge & Cox each year (the “Agreements”). At a meeting of the Board of Trustees of the Trust held on December 17, 2014, the Trustees, by a unanimous vote (including a separate vote of those Trustees who are not “interested persons” (as defined in the Investment Company Act of 1940) (the “Independent Trustees”)), approved the renewal of the Agreements for an additional one-year term through December 31, 2015 with respect to each Fund other than the Dodge & Cox Global Bond Fund. The Agreement for the Dodge & Cox Global Bond Fund was not subject to renewal at this time. During the course of the year, the Board received a wide variety of materials relating to the services provided by Dodge & Cox and the performance of each of the Funds.
INFORMATION RECEIVED
In advance of the meeting, the Board, including each of the Independent Trustees, requested, received, and reviewed materials relating to the Agreements and the services provided by Dodge & Cox. The Independent Trustees retained Morningstar® to prepare an independent expense and performance summary for each Fund and
comparable funds managed by other advisers identified by Morningstar. The Morningstar materials included information regarding advisory fee rates, expense ratios, and transfer agency, custodial, and distribution expenses, as well as appropriate performance comparisons to each Fund’s peer group and an index or combination of indices. The Morningstar materials also included a comparison of expenses of various share classes offered by comparable funds.
The materials reviewed by the Board contained information concerning, among other things, Dodge & Cox’s profitability, financial results and condition, advisory fee revenue, and separate account and sub-adviser fund fee schedules. The Board additionally considered the Funds’ brokerage commissions, turnover rates, sales and redemption data and the significant investment that Dodge & Cox makes in research used in managing the Funds. The Board received and reviewed a memorandum summarizing information provided throughout the year regarding Dodge & Cox’s services to the Funds as well as information regarding (i) the different fees, services, costs, and risks associated with other accounts managed by Dodge & Cox as compared to the Dodge & Cox Funds; (ii) the differences in performance between the Funds and separately managed accounts; and (iii) Fund shares subscription and redemption activity. Throughout the process of reviewing the services provided by Dodge & Cox and preparing for the meeting, the Independent Trustees found Dodge & Cox to be open, forthright, detailed, and very helpful in answering questions about all issues.
The Board received copies of the Agreements and a memorandum from the independent legal counsel to the Independent Trustees discussing the factors generally regarded as appropriate to consider in evaluating advisory arrangements. The Trust’s Contract Review Committee, consisting solely of Independent Trustees, met with the independent legal counsel on November 3, 2014, and again on December 17, 2014, to discuss whether to renew the Agreements. The Board, including the Independent Trustees, subsequently concluded that the existing Agreements are fair and reasonable and voted to approve the Agreements.
In considering the Agreements, the Board, including the Independent Trustees, did not identify any single
PAGE 15 § DODGE & COX STOCK FUND
factor or particular information as all-important or controlling. In reaching the decision to approve the Agreements, the Board considered several factors, discussed below, to be key factors and reached the conclusions described below.
NATURE, QUALITY, AND EXTENT OF THE SERVICES
The Board considered that Dodge & Cox provides a wide range of services to the Funds in addition to portfolio management and that the quality of these services has been excellent in all respects. The extensive nature of services provided by Dodge & Cox has been documented in materials provided to the Board and in presentations made to the Board throughout the year. In particular, the Board considered the nature, quality, and extent of portfolio management, administrative, and shareholder services performed by Dodge & Cox. With regard to portfolio management services, the Board considered Dodge & Cox’s established long-term history of care and conscientiousness in the management of the Funds; its demonstrated consistency in investment approach and depth; the background and experience of the Dodge & Cox Investment Policy Committee, International Investment Policy Committee, Global Stock Investment Policy Committee, Fixed Income Investment Policy Committee, and Global Bond Investment Policy Committee, and research analysts responsible for managing the Funds; its methods for assessing the regulatory and investment climate in various jurisdictions; Dodge & Cox’s overall high level of attention to its core investment management function; and its commitment to the Funds and their shareholders.
In the area of administrative and shareholder services, the Board considered the excellent quality of Dodge & Cox’s work in areas such as compliance, legal services, trading, proxy voting, technology, oversight of the Funds’ transfer agent and custodian, tax compliance, and shareholder communication through its website and other means. The Board also noted Dodge & Cox’s diligent disclosure policy, its favorable compliance record, and its reputation as a trusted, shareholder-friendly mutual fund family.
In addition, the Board considered that Dodge & Cox manages approximately $180 billion in Fund assets with
fewer professionals than most comparable funds, and that on average these professionals have more experience and longer tenure than investment professionals at comparable funds. The Board also noted that Dodge & Cox is an investment research-oriented firm with no other business endeavors to distract management’s attention from its research efforts, and that its investment professionals adhere to a consistent investment approach across the Funds. The Board further considered the favorable stewardship and “Gold” analyst ratings awarded to each of the Funds by Morningstar. The Board concluded that it was satisfied with the nature, extent, and quality of investment management and other services provided to the Funds by Dodge & Cox.
INVESTMENT PERFORMANCE
The Board considered short-term and long-term investment performance for each Fund (including periods of outperformance or underperformance) as compared to both relevant indices and the performance of such Fund’s peer group. The Board noted that each Fund demonstrated favorable longer-term performance relative to its benchmark and peer group. The Board determined after extensive review and inquiry that Dodge & Cox’s historic, long-term, team-oriented, bottom up investment approach remains consistent and that Dodge & Cox continues to be distinguished by its integrity, transparency, and independence.
The Board considered that the performance of the Funds is the result of a team-oriented investment management process that emphasizes a long-term investment horizon, comprehensive independent research, price discipline, and focus. The Board also considered that the investment performance delivered by Dodge & Cox to the Funds appeared to be consistent with the relevant performance delivered for other clients of Dodge & Cox. The Board concluded that Dodge & Cox has delivered favorable long-term performance for Fund investors consistent with the long-term investment strategies being pursued by the Funds.
COSTS AND ANCILLARY BENEFITS
Costs of Services to Funds: Fees and Expenses. The Board considered each Fund’s management fee rate and expense ratio relative to similar mutual funds and relative
DODGE & COX STOCK FUND §PAGE 16
to management fees charged by Dodge & Cox to other clients. In particular, the Board considered that the Funds continue to be substantially below their peer group median in expense ratios and management fee rates and that many media and industry reports specifically comment on the low expense ratios of the Funds, which have been a defining characteristic of the Funds for many years. The Board also evaluated the operating structures of the Funds and Dodge & Cox, noting that the Funds do not charge front-end sales commissions or distribution fees, and Dodge & Cox bears, among other things, the significant cost of third party research, reimbursement for recordkeeping and administrative costs to third-party retirement plan administrators, and administrative and office overhead. The Board noted that expenses are well below industry averages. The Board also considered that the Funds receive numerous administrative, regulatory compliance, legal, technology and shareholder support services from Dodge & Cox without any additional administrative fee and the fact that the Funds have relatively low transaction costs and portfolio turnover rates. The Board reviewed Morningstar data showing that the few peer group funds with lower expense ratios often have other share classes with significantly higher expense ratios.
The Board reviewed information regarding the fee rates Dodge & Cox charges to separate accounts and subadvised funds that have investment programs similar to those of the Funds, including instances where separate account and sub-advised fund fees are lower than Fund fees. The Board considered differences in the nature and scope of services Dodge & Cox provides to the Funds as compared to other client accounts, differences in regulatory, litigation, and other risks as between Dodge & Cox Funds and other types of clients, and certain characteristics of the market for institutional separate account management services. The Board further noted that, with respect to non-U.S. funds sponsored and managed by Dodge & Cox that are comparable to the Funds in many respects, the fee rates charged by Dodge & Cox are the same as or higher than the fee rates charged to the Funds. After consideration of these matters, the Board concluded that the overall costs incurred by the Funds for the services they receive (including the management fee paid to Dodge & Cox) are reasonable
and that the fees are acceptable based upon the qualifications, experience, reputation, and performance of Dodge & Cox and the low overall expense ratios of the Funds.
Profitability and Costs of Services to Dodge & Cox; “Fall-out” Benefits. The Board reviewed reports of Dodge & Cox’s financial position, profitability, and estimated overall value, and considered Dodge & Cox’s overall profitability within its context as a private, employee-owned S-Corporation and relative to the favorable services provided. The Board noted in particular that Dodge & Cox’s profits are not generated by high fee rates, but reflect an extraordinarily streamlined, efficient, and focused business approach toward investment management. The Board recognized the importance of Dodge & Cox’s profitability—which is derived solely from management fees and does not include other business ventures—to maintain its independence, stability, company culture and ethics, and management continuity. The Board also considered that the compensation/profit structure at Dodge & Cox includes a return on shareholder employees’ investment in the firm, which is vital for remaining independent and facilitating retention of management and investment professionals.
The Board considered that Dodge & Cox recently recommended closing the International Stock Fund to new investors to pro-actively manage the growth of the Fund. The Stock Fund and Balanced Fund were similarly closed to new investors during periods of significant growth in the past. While these actions are intended to benefit existing shareholders, the effect is to reduce potential revenues to Dodge & Cox from new shareholders.
The Board also considered potential “fall-out” benefits (including the receipt of research from unaffiliated brokers and reputational benefits to non-U.S. funds sponsored and managed by Dodge & Cox) that Dodge & Cox might receive as a result of its association with the Funds and determined that they are not significant. The Board also noted the extent of additional administrative services performed by Dodge & Cox for the Funds, and that the magnitude of costs and risks borne by Dodge & Cox in rendering advisory services to the Funds (including risks in the regulatory compliance, securities valuation, and investment management processes) are
PAGE 17 § DODGE & COX STOCK FUND
continuing to increase. The Board concluded that the profitability of Dodge & Cox’s relationship with the Funds (including fall-out benefits) was fair and reasonable.
THE BENEFIT OF ECONOMIES OF SCALE
The Board considered whether there have been economies of scale with respect to the management of each Fund, whether the Funds have appropriately benefited from any economies of scale, and whether the management fee rate is reasonable in relation to the Fund assets and any economies of scale that may exist. In the Board’s view, any consideration of economies of scale must take account of the Funds’ low fee structure and the considerable efficiencies of the Funds’ organization and fee structure that has been realized by shareholders from the time of each Fund’s inception (i.e., from the first dollar). An assessment of economies of scale must also take into account that Dodge & Cox has capped expenses when offering new funds. In addition, the Board noted that Dodge & Cox has shared economies of scale by adding or enhancing services to the Funds over time, and that the internal costs of providing investment management, up-to-date technology, administrative, legal, and compliance services to the Funds are continuing to increase. For example, Dodge & Cox has increased its global research staff and investment resources over the years to address the increased complexity of investing in multinational and non-U.S. companies. In addition, Dodge & Cox has made substantial expenditures in other staff, technology, and infrastructure to enable it to integrate credit and equity analyses and to be able to implement its strategy in a more effective and secure manner. The Board determined that the Funds provide access for small investors to high quality investment management at a relatively low cost. The Board’s decision to renew the Agreements was made after consideration of economies of scale and review of peer group fund expense ratios and historical expense ratio patterns for the Funds. The Board concluded that the current Dodge & Cox fee structure is fair and reasonable and adequately shares economies of scale that may exist.
CONCLUSION
Based on their evaluation of all material factors and assisted by the advice of independent legal counsel to the Independent Trustees, the Board, including the Independent Trustees, concluded that the advisory fee
structure was fair and reasonable, that each Fund was paying a competitive fee for the services provided, that the scope and quality of Dodge & Cox’s services has provided substantial value for Fund shareholders over the long term, and that approval of the Agreements was in the best interests of each Fund and its shareholders.
FUND HOLDINGS
The Fund provides a complete list of its holdings four times each fiscal year, as of the end of each quarter. The Fund files the lists with the Securities and Exchange Commission (SEC) on Form N-CSR (second and fourth quarters) and Form N-Q (first and third quarters). Shareholders may view the Fund’s Forms N-CSR and N-Q on the SEC’s website at www.sec.gov. Forms N-CSR and N-Q may also be reviewed and copied at the SEC’s Public Reference Room in Washington, DC. Information regarding the operations of the Public Reference Room may be obtained by calling 202-551-8090 (direct) or 800-732-0330 (general SEC number). A list of the Fund’s quarter-end holdings is also available at www.dodgeandcox.com on or about 15 days following each quarter end and remains available on the website until the list is updated in the subsequent quarter.
PROXY VOTING
For a free copy of the Fund’s proxy voting policies and procedures, please call 800-621-3979, visit the Fund’s website at www.dodgeandcox.com, or visit the SEC’s website at www.sec.gov. Information regarding how the Fund voted proxies relating to portfolio securities during the most recent 12-month period ending June 30 is also available at www.dodgeandcox.com or at www.sec.gov.
HOUSEHOLD MAILINGS
The Fund routinely mails shareholder reports and summary prospectuses to shareholders and, on occasion, proxy statements. In order to reduce the volume of mail, when possible, only one copy of these documents will be sent to shareholders who are part of the same family and share the same residential address.
If you have a direct account with the Funds and you do not want the mailing of shareholder reports and summary prospectuses combined with other members in your household, contact the Funds at 800-621-3979. Your request will be implemented within 30 days.
DODGE & COX STOCK FUND §PAGE 18
DODGE & COX FUNDS—EXECUTIVE OFFICER & TRUSTEE INFORMATION
| | | | | | |
Name (Age) and
Address* | | Position with Trust (Year of Election or
Appointment) | | Principal Occupation During Past 5 Years | | Other Directorships Held by Trustees |
| INTERESTED TRUSTEES AND OFFICERS |
| Charles F. Pohl (56) | | Chairman and Trustee (Officer since 2004) | | Chairman (since 2013), Co-President (2011-2013), Senior Vice President (until 2011), and Director of Dodge & Cox; Chief Investment Officer, Portfolio Manager, Investment Analyst, and member of Investment Policy Committee (IPC), Global Stock Investment Policy Committee (GSIPC), International Investment Policy Committee (IIPC), and Fixed Income Investment Policy Committee (FIIPC) | | — |
| Dana M. Emery (53) | | President and Trustee (Trustee since 1993) | | Chief Executive Officer (since 2013), President (since 2011), Executive Vice President (until 2011), and Director of Dodge & Cox; Director of Fixed Income, Portfolio Manager, and member of FIIPC and Global Bond Investment Policy Committee (GBIPC) | | — |
| John A. Gunn (71) | | Senior Vice President (Officer since 1998) | | Chairman Emeritus (2011-2013), Chairman (until 2011), Chief Executive Officer (until 2010), and Director of Dodge & Cox; Portfolio Manager and member of IPC, GSIPC (until 2014), and IIPC | | — |
| Diana S. Strandberg (55) | | Senior Vice President (Officer since 2006) | | Senior Vice President (since 2011), Vice President (until 2011), and Director (since 2011) of Dodge & Cox; Director of International Equity (since 2009), Portfolio Manager, Investment Analyst, and member of IPC, GSIPC, IIPC, and GBIPC | | — |
| David H. Longhurst (57) | | Treasurer (Officer since 2006) | | Vice President and Assistant Treasurer of Dodge & Cox | | — |
| Thomas M. Mistele (61) | | Secretary (Officer since 1998) | | Chief Operating Officer, Director, Secretary, Senior Counsel (since 2011), and General Counsel (until 2011) of Dodge & Cox | | — |
| Katherine M. Primas (40) | | Chief Compliance Officer (Officer since 2009) | | Vice President (since 2011) and Chief Compliance Officer of Dodge & Cox | | — |
| INDEPENDENT TRUSTEES |
| Thomas A. Larsen (65) | | Trustee (Since 2002) | | Senior Counsel of Arnold & Porter LLP (law firm) (since 2013); Partner of Arnold & Porter LLP (since 2012); Director of Howard, Rice, Nemerovski, Canady, Falk & Rabkin (1977-2011) | | — |
| Ann Mather (54) | �� | Trustee (Since 2011) | | CFO, Pixar Animation Studios (1999-2004) | | Director, Google, Inc. (internet information services) (since 2005); Director, Glu Mobile, Inc. (multimedia software) (since 2005); Director, Arista Networks (since 2013); Director, Netflix, Inc. (video services) (since 2010); Director, Shutterfly, Inc. (internet photography services/publishing) (since 2013) |
| Robert B. Morris III (62) | | Trustee (Since 2011) | | Advisory Director, The Presidio Group (since 2005) | | — |
| Gary Roughead (63) | | Trustee (Since 2013) | | Annenberg Distinguished Visiting Fellow, Hoover Institution (since 2011); Admiral, United States Navy (Ret.); U.S. Navy Chief of Naval Operations (2007-2011) | | Director, Northrop Grumman Corp. (global security) (since 2012) |
| Mark E. Smith (63) | | Trustee (Since 2014) | | Executive Vice President, Managing Director—Fixed Income at Loomis Sayles & Company, L.P. (2003-2011) | | — |
| John B. Taylor (68) | | Trustee (Since 2005) (and 1995-2001) | | Professor of Economics, Stanford University; Senior Fellow, Hoover Institution; Under Secretary for International Affairs, United States Treasury (2001-2005) | | — |
| * | | The address for each Officer and Trustee is 555 California Street, 40th Floor, San Francisco, California 94104. Each Officer and Trustee oversees all six series in the Dodge & Cox Funds complex and serves for an indefinite term. |
Additional information about the Trust’s Trustees and Officers is available in the Trust’s Statement of Additional Information (SAI). You can get a free copy of the SAI by visiting the Funds’ website at www.dodgeandcox.com or calling
800-621-3979.
PAGE 19 § DODGE & COX STOCK FUND
| | | | |
| | | | |
www.dodgeandcox.com
For Fund literature, transactions, and account information, please visit the Funds’ website.
or write or call:
DODGE & COX FUNDS
c/o Boston Financial Data Services
P.O. Box 8422
Boston, Massachusetts 02266-8422
(800) 621-3979
INVESTMENT MANAGER
Dodge & Cox
555 California Street, 40th Floor
San Francisco, California 94104
(415) 981-1710
This report is submitted for the general information of the shareholders of the Fund. The report is not authorized for distribution to prospective investors in the Fund unless it is accompanied by a current prospectus.
This report reflects our views, opinions, and portfolio holdings as of December 31, 2014, the end of the reporting period. Any such views are subject to change at any time based upon market or other conditions and Dodge & Cox disclaims any responsibility to update such views. These views may not be relied on as investment advice and, because investment decisions for a Dodge & Cox Fund are based on numerous factors, may not be relied on as an indication of trading intent on behalf of any Dodge & Cox Fund.
12/14 GSF AR Printed on recycled paper
Annual Report
December 31, 2014
Global Stock
Fund
ESTABLISHED 2008
TICKER: DODWX
TO OUR SHAREHOLDERS
The Dodge & Cox Global Stock Fund had a total return of 6.9%, compared to a return of 4.9% for the MSCI World Index for the year ending December 31, 2014. At year end, the Fund had net assets of $5.9 billion with a cash position of 3.1%.
MARKET COMMENTARY
During 2014, global equity markets continued to increase. U.S. dollar appreciation detracted from returns: the MSCI World was up 10% in local currency and up 5% in U.S. dollars; the MSCI Emerging Markets Index was up 5% in local currency and down 2% in U.S. dollars.
Economic activity expanded at a moderate pace in some major markets (e.g., United States, United Kingdom). In the United States (S&P 500 up 14%), the economy rebounded and continued to expand through December. U.S. labor market conditions improved: job gains were solid and the unemployment rate declined. While the recovery in the housing sector remained modest, household wealth and spending rose, and consumer sentiment reached a seven-year high. Corporate profitability was robust, and businesses increased investment in fixed assets. The U.S. Federal Reserve (Fed) announced the end of its historic asset-purchase program, but retained an accommodative stance and signaled its intention to take a slow approach toward raising interest rates in 2015.
Internationally, the Eurozone showed significant weakness, as stagnation and deflation concerns rose and manufacturing data disappointed. Economic activity contracted in Japan on the heels of a sales tax hike and declines in business investment. Slowing growth in China weighed on commodity prices.
Global oil prices plummeted approximately 50% amid lower-than-expected demand growth and modestly higher-than-expected supply growth. OPEC did not cut production as many had expected. While consumers and oil importers benefited from lower oil prices, many oil-exporting countries suffered. Despite some mixed news about global economic growth, our long-term outlook for equities continues to be positive.
INVESTMENT STRATEGY
Our disciplined investment process combines in-depth, bottom-up research and rigorous debate of ideas among our experienced investment professionals. The Fund benefits from the collective judgment of our team. We evaluate potential investments based on a three- to five-year investment horizon and have a strict price discipline. Individual company research is the primary factor in determining the Fund’s portfolio composition.
The best investment opportunities often arise during periods of great uncertainty. Macroeconomic conditions are many times not embedded appropriately in company valuations, and we find opportunities when other investors are exceptionally pessimistic. For example, in 2013 the Fed decided to begin tapering its quantitative easing program, and certain countries reliant on external funding (e.g., India, Brazil, Turkey) proved vulnerable, and experienced significant currency and/or market declines. Valuations decreased to the point where we saw investment opportunities arise in certain developing world companies. As a result, we added to select holdings in emerging markets and started new positions that have since outperformed and contributed to the Fund’s strong relative performance in 2014.
During 2014, we identified numerous investment opportunities within the Financials sector where valuations reflected meaningful pessimism about the macroeconomic backdrop, significant changes in commodity prices, and the banking industry’s ability to earn a return with greater regulatory oversight. Standard Chartered and Siam Commercial Bank (a new holding) are two such examples.(a) The Fund’s sector and industry positioning results from individual security selection: 23.6% of the Fund was invested in Financials compared to 20.9% of the MSCI World on December 31.(b)
Standard Chartered
Domiciled in the United Kingdom, Standard Chartered has extensive geographic reach. The company provides consumer and wholesale banking products to customers throughout the emerging markets (especially in Asia, Africa, and the Middle East); approximately a third of the
PAGE 1 § DODGE & COX GLOBAL STOCK FUND
company’s deposits are located in Greater China. Falling commodity prices, concerns about asset quality, regulatory fines, and increasing capital requirements in the United Kingdom weighed on the company’s share price, and its valuation fell to 0.8 times book value in October, a historically low level.
Standard Chartered has been held in the Fund since 2008. Over the years, we have spent considerable time researching and analyzing the company in various market environments. Standard Chartered’s broad network across the developing world would be very difficult to replicate today. The company’s global payments and trade business is a particular strength: local roots from its longstanding presence allow for local currency funding, and cooperation across the network provides integrated wholesale banking services to clients. The bank is exposed to economic growth and increasing trade flows in emerging markets.
We acknowledge the current risks and believe that Standard Chartered’s inexpensive valuation, coupled with its long-term growth opportunities, makes it an attractive investment. We substantially increased the Fund’s exposure to Standard Chartered during 2014. On December 31, Standard Chartered was a 1.7% position in the Fund.
Siam Commercial Bank
Siam Commercial Bank, the largest retail bank in Thailand, is a new addition to the Fund. During late 2013 and early 2014, Thailand lacked a functioning government, and the country’s stock market suffered. Siam Commercial’s stock was no exception, as its valuation declined to eight times forward earnings. During prior periods of political uncertainty, the Thai economy continued to grow, and Siam Commercial delivered an attractive return on shareholder’s equity and increased its book value per share.
As a part of our due diligence process for owning Kasikornbank in Thailand, we had closely followed Siam Commercial to understand the competitive landscape. After conducting additional in-depth research, we concluded that these political concerns provided us with a long-term investment opportunity at a low valuation. Siam Commercial’s leading positions in retail banking and fee-related financial services provide it with a durable
franchise. We believe that the company’s high return on equity—generated by a combination of stable net interest margins, high fee income, ample provisions, efficient operations, and moderate leverage—is sustainable over our investment horizon. Furthermore, we believe that Siam Commercial is well prepared to absorb economic volatility, given its high profitability, capital levels, and loan loss reserves. After weighing these opportunities against the political risk, we initiated a position; Siam Commercial was a 0.4% holding in the Fund at year end.
IN CLOSING
We continue to see long-term opportunity for global equities as we look for attractively valued investments in both developed and emerging markets. Global equity valuations remain reasonable: the MSCI World traded at 15.5 times forward estimated earnings (compared to a 20-year average of 16.1 times) with a 2.4% dividend yield at year end. Corporate balance sheets and cash flows continue to be strong. The Fund is invested in companies that we believe have favorable long-term prospects over our three- to five-year investment horizon. Acknowledging that both share prices and currencies can be volatile in the short term, we encourage shareholders to remain focused on the long term.
Thank you for your continued confidence in our firm. As always, we welcome your comments and questions.
For the Board of Trustees,
| | |
| | |
Charles F. Pohl, Chairman | | Dana M. Emery, President |
January 27, 2015
| (a) | | The use of specific examples does not imply that they are more attractive investments than the Fund’s other holdings. |
| (b) | | Unless otherwise specified, all weightings and characteristics are as of December 31, 2014. |
DODGE & COX GLOBAL STOCK FUND §PAGE 2
ANNUAL PERFORMANCE REVIEW
The Fund outperformed the MSCI World by 2.0 percentage points in 2014.
Key Contributors to Relative Results
| | § | | The Fund’s holdings in the Consumer Discretionary sector (up 14% compared to up 4% for the MSCI World sector) helped results. Time Warner (up 30%), Target (up 30% since date of purchase), and Naspers (up 26%) performed well. | |
| | § | | Relative returns in the Financials sector (up 8% compared to up 3% for the MSCI World sector) had a positive impact, due largely to the Fund’s holdings in emerging markets. ICICI Bank (up 60%) and Kasikornbank (up 47%) were particularly strong. | |
| | § | | The Fund’s higher average weighting in the Information Technology sector (20% compared to 13% for the MSCI World sector), the second-strongest sector of the market (up 16%), aided performance. Hewlett-Packard (up 46%), Corning (up 31%), Baidu (up 28%), and Microsoft (up 27%) contributed to results. | |
| | § | | Selected additional contributors included UnitedHealth Group (up 36%), Nidec (up 29% to date of sale), and China Mobile (up 24% since date of purchase). | |
Key Detractors from Relative Results
| | § | | Relative returns in the Health Care sector (up 6% compared to up 18% for the MSCI World sector) had a negative impact. Sanofi (down 12%) was a notable detractor. | |
| | § | | The Fund’s underweight position in the Utilities sector (no holdings versus 3% for the MSCI World sector), a stronger sector of the market (up 15%), detracted from results. | |
| | § | | Selected additional detractors included Saipem (down 51%), Petrobras (down 46%), Coach (down 31%), Standard Chartered (down 30%), Millicom International Cellular (down 24%), AEGON (down 17%), and Credit Suisse (down 15%). | |
KEY CHARACTERISTICS OF DODGE & COX
Independent Organization
Dodge & Cox is one of the largest privately owned investment managers in the world. We remain committed to independence, with a goal of providing the highest quality investment management service to our existing clients.
Over 80 Years of Investment Experience
Dodge & Cox was founded in 1930. We have a stable and well-qualified team of investment professionals, most of whom have spent their entire careers at Dodge & Cox.
Experienced Investment Team
The Global Stock Investment Policy Committee, which is the decision-making body for the Global Stock Fund, is a seven-member committee with an average tenure at Dodge & Cox of 18 years.
One Business with a Single Research Office
Dodge & Cox manages equity (domestic, international, and global), fixed income (domestic and global), and balanced investments, operating from one office in San Francisco.
Consistent Investment Approach
Our team decision-making process involves thorough, bottom-up fundamental analysis of each investment.
Long-Term Focus and Low Expenses
We invest with a three- to five-year investment horizon, which has historically resulted in low turnover relative to our peers. We manage Funds that maintain low expense ratios.
Risks: The Fund is subject to stock market risk, meaning stocks in the Fund may decline in value for extended periods due to the financial prospects of individual companies, or due to general market and economic conditions. Investing in non-U.S. securities may entail risk due to foreign economic and political developments; this risk may be increased when investing in emerging markets. The Fund is also subject to currency risk. Please read the prospectus and summary prospectus for specific details regarding the Fund’s risk profile.
PAGE 3 § DODGE & COX GLOBAL STOCK FUND
GROWTH OF $10,000 SINCE INCEPTION
FOR AN INVESTMENT MADE ON MAY 1, 2008
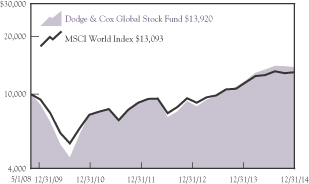
AVERAGE ANNUAL TOTAL RETURN
FOR PERIODS ENDED DECEMBER 31, 2014
| | | | | | | | | | | | | | | | |
| | | 1 Year | | | 3 Years | | | 5 Years | | | Since
Inception
(5/1/08) | |
Dodge & Cox Global Stock Fund | | | 6.95 | % | | | 19.93 | % | | | 11.65 | % | | | 5.09 | % |
MSCI World Index | | | 4.94 | | | | 15.48 | | | | 10.20 | | | | 4.12 | |
Returns represent past performance and do not guarantee future results. Investment return and share price will fluctuate with market conditions, and investors may have a gain or loss when shares are sold. Fund performance changes over time and currently may be significantly lower than stated. Performance is updated and published monthly. Visit the Fund’s website at www.dodgeandcox.com or call 800-621-3979 for current performance figures.
The Fund’s total returns include the reinvestment of dividend and capital gain distributions, but have not been adjusted for any income taxes payable by shareholders on these distributions or on Fund share redemptions. Index returns include dividends but, unlike Fund returns, do not reflect fees or expenses. The MSCI World Index is a broad-based, unmanaged equity market index aggregated from 23 developed market country indices, including the United States. MSCI makes no express or implied warranties or representations and shall have no liability whatsoever with respect to any MSCI data contained herein. The MSCI data may not be further redistributed or used as a basis for other indices or any securities or financial products. This report is not approved, reviewed, or produced by MSCI.
MSCI World is a service mark of MSCI Barra.
FUND EXPENSE EXAMPLE
As a Fund shareholder, you incur ongoing Fund costs, including management fees and other Fund expenses. All mutual funds have ongoing costs, sometimes referred to as operating expenses. The following example shows ongoing costs of investing in the Fund and can help you understand these costs and compare them with those of other mutual funds. The example assumes a $1,000 investment held for the six months indicated.
ACTUAL EXPENSES
The first line of the table below provides information about actual account values and expenses based on the Fund’s actual returns. You may use the information in this line, together with your account balance, to estimate the expenses that you paid over the period. Simply divide your account value by $1,000 (for example, an $8,600 account value divided by $1,000 = 8.6), then multiply the result by the number in the first line under the heading “Expenses Paid During Period” to estimate the expenses you paid on your account during this period.
HYPOTHETICAL EXAMPLE FOR COMPARISON WITH OTHER MUTUAL FUNDS
Information on the second line of the table can help you compare ongoing costs of investing in the Fund with those of other mutual funds. This information may not be used to estimate the actual ending account balance or expenses you paid during the period. The hypothetical “Ending Account Value” is based on the actual expense ratio of the Fund and an assumed 5% annual rate of return before expenses (not the Fund’s actual return). The amount under the heading “Expense Paid During the Period” shows the hypothetical expenses your account would have incurred under this scenario. You can compare this figure with the 5% hypothetical examples that appear in shareholder reports of other mutual funds.
| | | | | | | | | | | | |
Six Months Ended December 31, 2014 | | Beginning Account Value
7/1/2014 | | | Ending Account Value
12/31/2014 | | | Expenses Paid During Period* | |
Based on Actual Fund Return | | $ | 1,000.00 | | | $ | 983.80 | | | $ | 3.18 | |
Based on Hypothetical 5% Yearly Return | | | 1,000.00 | | | | 1,022.00 | | | | 3.24 | |
| * | | Expenses are equal to the Fund’s annualized expense ratio of 0.64%, multiplied by the average account value over the period, multiplied by 184/365 (to reflect the one-half year period). |
The expenses shown in the table highlight ongoing costs only and do not reflect any transactional fees or account maintenance fees. Though other mutual funds may charge such fees, please note that the Fund does not charge transaction fees (e.g., redemption fees, sales loads) or universal account maintenance fees (e.g., small account fees).
DODGE & COX GLOBAL STOCK FUND §PAGE 4
| | |
| FUND INFORMATION | | December 31, 2014 |
| | | | |
| GENERAL INFORMATION | | | |
Net Asset Value Per Share | | | $11.83 | |
Total Net Assets (billions) | | | $5.9 | |
Expense Ratio | | | 0.65% | |
Portfolio Turnover Rate | | | 17% | |
30-Day SEC Yield(a) | | | 1.22% | |
Fund Inception | | | 2008 | |
No sales charges or distribution fees | | | | |
Investment Manager: Dodge & Cox, San Francisco. Managed by the Global Stock Investment Policy Committee, whose seven members’ average tenure at Dodge & Cox is 18 years.
| | | | | | | | |
| PORTFOLIO CHARACTERISTICS | | Fund | | | MSCI
World | |
Number of Equity Securities | | | 91 | | | | 1,636 | |
Median Market Capitalization (billions) | | | $34 | | | | $11 | |
Weighted Average Market Capitalization (billions) | | | $88 | | | | $93 | |
Price-to-Earnings Ratio(b) | | | 14.0x | | | | 15.5x | |
Countries Represented | | | 20 | | | | 23 | |
Emerging Markets (Brazil, China, India, Mexico, South Africa, South Korea, Thailand, Turkey) | | | 16.6% | | | | 0.0% | |
| | | | |
| TEN LARGEST HOLDINGS (%)(c) | | Fund | |
Hewlett-Packard Co. (United States) | | | 2.7 | |
Samsung Electronics Co., Ltd. (South Korea) | | | 2.7 | |
Novartis AG (Switzerland) | | | 2.5 | |
Roche Holding AG (Switzerland) | | | 2.4 | |
Google, Inc. (United States) | | | 2.3 | |
Microsoft Corp. (United States) | | | 2.3 | |
Time Warner Cable, Inc. (United States) | | | 2.2 | |
Wal-Mart Stores, Inc. (United States) | | | 2.1 | |
Naspers, Ltd. (South Africa) | | | 2.1 | |
Time Warner, Inc. (United States) | | | 2.0 | |
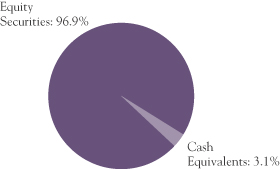
| | | | | | | | |
| REGION DIVERSIFICATION (%)(d) | | Fund | | | MSCI
World | |
United States | | | 44.4 | | | | 58.4 | |
Europe (excluding United Kingdom) | | | 24.6 | | | | 16.9 | |
Pacific (excluding Japan) | | | 9.8 | | | | 4.6 | |
United Kingdom | | | 6.6 | | | | 7.9 | |
Japan | | | 5.0 | | | | 8.0 | |
Latin America | | | 3.6 | | | | 0.0 | |
Africa/Middle East | | | 2.9 | | | | 0.2 | |
Canada | | | 0.0 | | | | 4.0 | |
| | | | | | | | |
| SECTOR DIVERSIFICATION (%) | | Fund | | | MSCI
World | |
Financials | | | 23.6 | | | | 20.9 | |
Information Technology | | | 18.8 | | | | 13.4 | |
Consumer Discretionary | | | 17.9 | | | | 12.4 | |
Health Care | | | 13.7 | | | | 12.7 | |
Energy | | | 6.5 | | | | 8.0 | |
Industrials | | | 4.9 | | | | 10.9 | |
Telecommunication Services | | | 3.9 | | | | 3.3 | |
Consumer Staples | | | 3.9 | | | | 9.9 | |
Materials | | | 3.7 | | | | 5.1 | |
Utilities | | | 0.0 | | | | 3.4 | |
| (a) | SEC Yield is an annualization of the Fund’s total net investment income per share for the 30-day period ended on the last day of the month. |
| (b) | Price-to-earnings (P/E) ratios are calculated using 12-month forward earnings estimates from third-party sources. |
| (c) | The Fund’s portfolio holdings are subject to change without notice. The mention of specific securities is not a recommendation to buy, sell, or hold any particular security and is not indicative of Dodge & Cox’s current or future trading activity. |
| (d) | The Fund may classify a company in a different category than the MSCI World. The Fund generally classifies a company based on its country of incorporation, but may designate a different country in certain circumstances. |
PAGE 5 § DODGE & COX GLOBAL STOCK FUND
| | | | |
| CONSOLIDATED PORTFOLIO OF INVESTMENTS | | | December 31, 2014 | |
| | | | | | | | |
| COMMON STOCKS: 94.4% | |
| | |
| | | SHARES | | | VALUE | |
| CONSUMER DISCRETIONARY: 17.9% | |
AUTOMOBILES & COMPONENTS: 4.4% | | | | | |
Bayerische Motoren Werke AG (Germany) | | | 436,500 | | | $ | 47,405,571 | |
Honda Motor Co., Ltd. (Japan) | | | 2,312,000 | | | | 67,232,260 | |
Mahindra & Mahindra, Ltd. (India) | | | 2,398,426 | | | | 46,714,636 | |
Nissan Motor Co., Ltd. (Japan) | | | 8,489,600 | | | | 73,946,479 | |
Yamaha Motor Co., Ltd. (Japan) | | | 1,233,000 | | | | 24,797,348 | |
| | | | | | | | |
| | | | | | | 260,096,294 | |
CONSUMER DURABLES & APPAREL: 0.9% | | | | | |
Coach, Inc. (United States) | | | 1,000,800 | | | | 37,590,048 | |
Panasonic Corp. (Japan) | | | 1,513,640 | | | | 17,783,261 | |
| | | | | | | | |
| | | | | | | 55,373,309 | |
CONSUMER SERVICES: 0.2% | | | | | |
New Oriental Education & Technology Group, Inc. ADR(a)
(Cayman Islands/China) | | | 675,800 | | | | 13,793,078 | |
| |
MEDIA: 11.2% | | | | | |
Comcast Corp., Class A (United States) | | | 1,320,800 | | | | 76,619,608 | |
DISH Network Corp., Class A(a) (United States) | | | 854,200 | | | | 62,262,638 | |
Grupo Televisa SAB ADR (Mexico) | | | 1,442,700 | | | | 49,138,362 | |
Liberty Global PLC, Series C(a) (United Kingdom) | | | 1,373,100 | | | | 66,334,461 | |
Naspers, Ltd. (South Africa) | | | 931,700 | | | | 119,954,544 | |
Television Broadcasts, Ltd. (Hong Kong) | | | 2,778,100 | | | | 16,125,969 | |
Time Warner Cable, Inc. (United States) | | | 865,171 | | | | 131,557,903 | |
Time Warner, Inc. (United States) | | | 1,401,666 | | | | 119,730,310 | |
Time, Inc. (United States) | | | 658,446 | | | | 16,204,356 | |
| | | | | | | | |
| | | | | | | 657,928,151 | |
RETAILING: 1.2% | | | | | |
Target Corp. (United States) | | | 901,900 | | | | 68,463,229 | |
| | | | | | | | |
| | | | | | | 1,055,654,061 | |
| CONSUMER STAPLES: 3.9% | | | | | |
FOOD & STAPLES RETAILING: 2.1% | | | | | |
Wal-Mart Stores, Inc. (United States) | | | 1,447,500 | | | | 124,311,300 | |
| |
FOOD, BEVERAGE & TOBACCO: 1.8% | | | | | |
Anadolu Efes Biracilik ve Malt Sanayii AS(a) (Turkey) | | | 4,098,485 | | | | 39,834,328 | |
Unilever PLC (United Kingdom) | | | 1,596,700 | | | | 64,859,172 | |
| | | | | | | | |
| | | | | | | 104,693,500 | |
| | | | | | | | |
| | | | | | | 229,004,800 | |
| | | | | | | | |
| | |
| | | SHARES | | | VALUE | |
| ENERGY: 5.9% | | | | | | | | |
Apache Corp. (United States) | | | 855,332 | | | $ | 53,603,656 | |
Baker Hughes, Inc. (United States) | | | 1,349,287 | | | | 75,654,522 | |
National Oilwell Varco, Inc. (United States) | | | 774,500 | | | | 50,752,985 | |
Saipem SPA(a) (Italy) | | | 3,653,143 | | | | 38,366,436 | |
Schlumberger, Ltd.
(Curacao/United States) | | | 1,006,500 | | | | 85,965,165 | |
Weatherford International PLC(a) (Ireland) | | | 3,885,575 | | | | 44,489,834 | |
| | | | | | | | |
| | | | | | | 348,832,598 | |
| FINANCIALS: 22.8% | | | | | |
BANKS: 9.2% | | | | | |
Bank of America Corp. (United States) | | | 4,658,100 | | | | 83,333,409 | |
Barclays PLC (United Kingdom) | | | 16,171,700 | | | | 60,797,557 | |
ICICI Bank, Ltd. (India) | | | 15,651,315 | | | | 86,721,387 | |
Kasikornbank PCL- Foreign (Thailand) | | | 8,448,100 | | | | 58,701,391 | |
Siam Commercial Bank PCL- Foreign (Thailand) | | | 4,537,100 | | | | 25,067,001 | |
Standard Chartered PLC (United Kingdom) | | | 6,684,483 | | | | 100,247,221 | |
Wells Fargo & Co. (United States) | | | 1,722,973 | | | | 94,453,380 | |
Yapi ve Kredi Bankasi AS (Turkey) | | | 16,421,817 | | | | 34,113,478 | |
| | | | | | | | |
| | | | | | | 543,434,824 | |
DIVERSIFIED FINANCIALS: 8.0% | | | | | |
Bank of New York Mellon Corp. (United States) | | | 2,149,700 | | | | 87,213,329 | |
Capital One Financial Corp. (United States) | | | 1,178,200 | | | | 97,260,410 | |
Charles Schwab Corp. (United States) | | | 3,403,300 | | | | 102,745,627 | |
Credit Suisse Group AG (Switzerland) | | | 3,433,604 | | | | 86,076,415 | |
Goldman Sachs Group, Inc. (United States) | | | 309,200 | | | | 59,932,236 | |
Haci Omer Sabanci Holding AS (Turkey) | | | 8,386,388 | | | | 36,433,260 | |
| | | | | | | | |
| | | | | | | 469,661,277 | |
INSURANCE: 3.5% | | | | | |
AEGON NV (Netherlands) | | | 11,353,815 | | | | 85,187,712 | |
Aviva PLC (United Kingdom) | | | 6,750,800 | | | | 50,584,888 | |
Dai-ichi Life Insurance Co., Ltd. (Japan) | | | 1,957,000 | | | | 29,696,906 | |
Swiss Re AG (Switzerland) | | | 508,000 | | | | 42,506,039 | |
| | | | | | | | |
| | | | | | | 207,975,545 | |
REAL ESTATE: 2.1% | | | | | |
BR Malls Participacoes SA (Brazil) | | | 7,750,800 | | | | 47,393,780 | |
Hang Lung Group, Ltd. (Hong Kong) | | | 11,321,000 | | | | 51,196,122 | |
Hang Lung Properties, Ltd. (Hong Kong) | | | 9,228,400 | | | | 25,718,520 | |
| | | | | | | | |
| | | | | | | 124,308,422 | |
| | | | | | | | |
| | | | | | | 1,345,380,068 | |
| | |
| See accompanying Notes to Consolidated Financial Statements | | DODGE & COX GLOBAL STOCK FUND §PAGE 6 |
| | | | |
| CONSOLIDATED PORTFOLIO OF INVESTMENTS | | | December 31, 2014 | |
| | | | | | | | |
| COMMON STOCKS (continued) | |
| | |
| | | SHARES | | | VALUE | |
| HEALTH CARE: 13.7% | | | | | |
HEALTH CARE EQUIPMENT & SERVICES: 4.4% | |
Cigna Corp. (United States) | | | 610,000 | | | $ | 62,775,100 | |
Express Scripts Holding Co.(a) (United States) | | | 1,228,100 | | | | 103,983,227 | |
UnitedHealth Group, Inc. (United States) | | | 941,600 | | | | 95,186,344 | |
| | | | | | | | |
| | | | | | | 261,944,671 | |
PHARMACEUTICALS, BIOTECHNOLOGY & LIFE SCIENCES: 9.3% | |
Bayer AG (Germany) | | | 435,620 | | | | 59,553,357 | |
GlaxoSmithKline PLC (United Kingdom) | | | 2,131,400 | | | | 45,601,411 | |
Merck & Co., Inc. (United States) | | | 669,200 | | | | 38,003,868 | |
Novartis AG (Switzerland) | | | 959,000 | | | | 88,196,817 | |
Novartis AG ADR (Switzerland) | | | 609,700 | | | | 56,494,802 | |
Roche Holding AG (Switzerland) | | | 527,400 | | | | 142,946,740 | |
Sanofi (France) | | | 1,277,762 | | | | 116,450,022 | |
| | | | | | | | |
| | | | | | | 547,247,017 | |
| | | | | | | | |
| | | | | | | 809,191,688 | |
| INDUSTRIALS: 4.9% | | | | | |
CAPITAL GOODS: 2.4% | | | | | |
Koninklijke Philips NV (Netherlands) | | | 1,579,470 | | | | 45,860,165 | |
Mitsubishi Electric Corp. (Japan) | | | 1,987,100 | | | | 23,658,476 | |
NOW, Inc.(a) (United States) | | | 165,300 | | | | 4,253,169 | |
Schneider Electric SA (France) | | | 939,278 | | | | 68,249,683 | |
| | | | | | | | |
| | | | | | | 142,021,493 | |
COMMERCIAL & PROFESSIONAL SERVICES: 1.5% | |
ADT Corp. (United States) | | | 913,000 | | | | 33,077,990 | |
Tyco International PLC (Ireland) | | | 1,263,300 | | | | 55,408,338 | |
| | | | | | | | |
| | | | | | | 88,486,328 | |
TRANSPORTATION: 1.0% | | | | | |
FedEx Corp. (United States) | | | 316,600 | | | | 54,980,756 | |
| | | | | | | | |
| | | | | | | 285,488,577 | |
| |
| INFORMATION TECHNOLOGY: 17.7% | | | | | |
SEMICONDUCTORS & SEMICONDUCTOR EQUIPMENT: 1.6% | |
Samsung Electronics Co., Ltd. (South Korea) | | | 78,217 | | | | 94,020,905 | |
| |
SOFTWARE & SERVICES: 8.2% | | | | | |
AOL, Inc.(a) (United States) | | | 603,969 | | | | 27,885,249 | |
Baidu, Inc. ADR(a)
(Cayman Islands/China) | | | 205,000 | | | | 46,733,850 | |
eBay, Inc.(a) (United States) | | | 998,900 | | | | 56,058,268 | |
Google, Inc., Class A(a) (United States) | | | 60,600 | | | | 32,157,996 | |
Google, Inc., Class C(a) (United States) | | | 193,400 | | | | 101,805,760 | |
Microsoft Corp. (United States) | | | 2,859,800 | | | | 132,837,710 | |
Nintendo Co., Ltd. (Japan) | | | 276,200 | | | | 28,785,921 | |
Symantec Corp. (United States) | | | 1,565,600 | | | | 40,165,468 | |
Synopsys, Inc.(a) (United States) | | | 446,800 | | | | 19,422,396 | |
| | | | | | | | |
| | | | | | | 485,852,618 | |
| | | | | | | | |
| | |
| | | SHARES | | | VALUE | |
TECHNOLOGY, HARDWARE & EQUIPMENT: 7.9% | |
Corning, Inc. (United States) | | | 2,879,800 | | | $ | 66,033,814 | |
EMC Corp. (United States) | | | 1,844,400 | | | | 54,852,456 | |
Hewlett-Packard Co. (United States) | | | 3,995,200 | | | | 160,327,376 | |
Kyocera Corp. (Japan) | | | 602,700 | | | | 27,624,031 | |
NetApp, Inc. (United States) | | | 1,286,400 | | | | 53,321,280 | |
TE Connectivity, Ltd. (Switzerland) | | | 1,020,115 | | | | 64,522,274 | |
Telefonaktiebolaget LM Ericsson (Sweden) | | | 3,153,747 | | | | 38,194,833 | |
| | | | | | | | |
| | | | | | | 464,876,064 | |
| | | | | | | | |
| | | | | | | 1,044,749,587 | |
| |
| MATERIALS: 3.7% | | | | | |
Akzo Nobel NV (Netherlands) | | | 714,968 | | | | 49,579,222 | |
Celanese Corp., Series A (United States) | | | 931,300 | | | | 55,840,748 | |
Lafarge SA (France) | | | 730,171 | | | | 51,246,574 | |
Linde AG (Germany) | | | 306,710 | | | | 57,207,478 | |
| | | | | | | | |
| | | | | | | 213,874,022 | |
|
| TELECOMMUNICATION SERVICES: 3.9% | |
America Movil SAB de CV, Series L (Mexico) | | | 29,340,500 | | | | 32,693,913 | |
China Mobile, Ltd. (Hong Kong/China) | | | 3,823,100 | | | | 45,011,613 | |
Millicom International Cellular SA SDR (Luxembourg) | | | 842,800 | | | | 62,679,751 | |
MTN Group, Ltd. (South Africa) | | | 2,546,200 | | | | 48,318,692 | |
Telecom Italia SPA- RSP (Italy) | | | 50,281,384 | | | | 42,026,936 | |
| | | | | | | | |
| | | | | | | 230,730,905 | |
| | | | | | | | |
TOTAL COMMON STOCKS
(Cost $4,462,182,058) | | | | | | $ | 5,562,906,306 | |
| |
| PREFERRED STOCKS: 2.5% | | | | |
| ENERGY: 0.6% | | | | | |
Petroleo Brasileiro SA ADR (Brazil) | | | 4,888,700 | | | | 37,056,346 | |
| |
| FINANCIALS: 0.8% | | | | | |
BANKS: 0.8% | |
Itau Unibanco Holding SA (Brazil) | | | 3,476,330 | | | | 45,200,675 | |
|
| INFORMATION TECHNOLOGY: 1.1% | |
SEMICONDUCTORS & SEMICONDUCTOR EQUIPMENT: 1.1% | |
Samsung Electronics Co., Ltd. (South Korea) | | | 70,814 | | | | 66,260,477 | |
| | | | | | | | |
TOTAL PREFERRED STOCKS
(Cost $174,777,106) | | | | | | $ | 148,517,498 | |
| | |
| PAGE 7 § DODGE & COX GLOBAL STOCK FUND | | See accompanying Notes to Consolidated Financial Statements |
| | | | |
| CONSOLIDATED PORTFOLIO OF INVESTMENTS | | | December 31, 2014 | |
| | | | | | | | |
| SHORT-TERM INVESTMENTS: 2.9% | |
| | |
| | | PAR VALUE | | | VALUE | |
MONEY MARKET FUND: 0.1% | |
SSgA U.S. Treasury Money Market Fund | | $ | 5,918,640 | | | $ | 5,918,640 | |
|
REPURCHASE AGREEMENT: 2.8% | |
Fixed Income Clearing Corporation(b) 0.01%, dated 12/31/14, due 1/2/15, maturity value $166,990,093 | | | 166,990,000 | | | | 166,990,000 | |
| | | | | | | | |
TOTAL SHORT-TERM INVESTMENTS
(Cost $172,908,640) | | | $ | 172,908,640 | |
| | | | | | | | |
TOTAL INVESTMENTS
(Cost $4,809,867,804) | | | 99.8 | % | | $ | 5,884,332,444 | |
OTHER ASSETS LESS LIABILITIES | | | 0.2 | % | | | 10,998,080 | |
| | | | | | | | |
| NET ASSETS | | | 100.0 | % | | $ | 5,895,330,524 | |
| | | | | | | | |
| (b) | Repurchase agreement is collateralized by Freddie Mac 1.25%, 10/2/19 and U.S. Treasury Note 1.00%-1.50%, 9/30/19-10/31/19. Total collateral value is $170,333,650. |
In determining a company’s country designation, the Fund generally references the country of incorporation. In cases where the Fund considers the country of incorporation to be a “jurisdiction of convenience” chosen primarily for tax purposes, the Fund uses the country designation of an appropriate broad-based market index. In that circumstance, two countries are listed - the country of incorporation and the country designated by an appropriate index, respectively.
ADR: American Depositary Receipt
SDR: Swedish Depository Receipt
FORWARD CURRENCY CONTRACTS
| | | | | | | | | | | | | | | | |
| | | | Contract Amount | | | | |
| Counterparty | | Settlement
Date | | | Receive
U.S.
Dollar | | | Deliver
Foreign
Currency | | | Unrealized
Appreciation/
(Depreciation) | |
Contracts to sell EUR: | |
JPMorgan | | | 2/11/15 | | | | 21,805,263 | | | | 17,500,000 | | | $ | 621,372 | |
UBS | | | 2/11/15 | | | | 24,264,045 | | | | 19,500,000 | | | | 659,138 | |
Credit Suisse | | | 2/18/15 | | | | 33,946,878 | | | | 27,250,000 | | | | 958,695 | |
Deutsche Bank | | | 3/11/15 | | | | 23,887,783 | | | | 19,400,000 | | | | 398,647 | |
Barclays | | | 3/18/15 | | | | 23,641,225 | | | | 19,000,000 | | | | 635,072 | |
HSBC | | | 3/18/15 | | | | 13,690,050 | | | | 11,000,000 | | | | 370,698 | |
| | | | |
| Counterparty | | Settlement
Date | | | Deliver
U.S.
Dollar | | | Receive
Foreign
Currency | | | Unrealized
Appreciation/
(Depreciation) | |
Contracts to buy EUR: | |
UBS | | | 2/11/15 | | | | 23,868,000 | | | | 19,500,000 | | | $ | (263,093 | ) |
| | | | | | | | | | | | | | | | |
| | | $ | 3,380,529 | |
| | | | | | | | | | | | | | | | |
| | |
| See accompanying Notes to Consolidated Financial Statements | | DODGE & COX GLOBAL STOCK FUND §PAGE 8 |
| | | | |
CONSOLIDATED STATEMENT OF ASSETS AND LIABILITIES | |
| |
| | | December 31, 2014 | |
ASSETS: | | | | |
Investments, at value (cost $4,809,867,804) | | $ | 5,884,332,444 | |
Cash | | | 100 | |
Cash denominated in foreign currency (cost $9,872) | | | 9,696 | |
Receivable for investments sold | | | 6,729,515 | |
Unrealized appreciation on forward currency contracts | | | 3,643,622 | |
Receivable for Fund shares sold | | | 7,660,136 | |
Dividends and interest receivable | | | 7,858,933 | |
Prepaid expenses and other assets | | | 43,462 | |
| | | | |
| | | 5,910,277,908 | |
| | | | |
LIABILITIES: | | | | |
Payable for investments purchased | | | 9,568,691 | |
Unrealized depreciation on forward currency contracts | | | 263,093 | |
Payable for Fund shares redeemed | | | 1,419,817 | |
Management fees payable | | | 2,963,380 | |
Accrued expenses | | | 732,403 | |
| | | | |
| | | 14,947,384 | |
| | | | |
NET ASSETS | | $ | 5,895,330,524 | |
| | | | |
NET ASSETS CONSIST OF: | | | | |
Paid in capital | | $ | 4,787,622,375 | |
Undistributed net investment income | | | (306,245 | ) |
Undistributed net realized gain | | | 30,374,447 | |
Net unrealized appreciation | | | 1,077,639,947 | |
| | | | |
| | $ | 5,895,330,524 | |
| | | | |
Fund shares outstanding (par value $0.01 each, unlimited shares authorized) | | | 498,170,933 | |
Net asset value per share | | $ | 11.83 | |
| | | | |
| |
CONSOLIDATED STATEMENT OF OPERATIONS | | | | |
| | | Year Ended
December 31, 2014 | |
INVESTMENT INCOME: | | | | |
Dividends (net of foreign taxes of $5,930,875) | | $ | 106,666,081 | |
Interest | | | 1,047 | |
| | | | |
| | | 106,667,128 | |
| | | | |
EXPENSES: | | | | |
Management fees | | | 30,927,124 | |
Custody and fund accounting fees | | | 657,994 | |
Transfer agent fees | | | 275,371 | |
Professional services | | | 342,907 | |
Shareholder reports | | | 173,319 | |
Proxy expenses | | | 120,895 | |
Registration fees | | | 486,070 | |
Trustees’ fees | | | 258,072 | |
Miscellaneous | | | 145,217 | |
| | | | |
| | | 33,386,969 | |
| | | | |
NET INVESTMENT INCOME | | | 73,280,159 | |
| | | | |
| |
REALIZED AND UNREALIZED GAIN (LOSS): | | | | |
Net realized gain (loss) | | | | |
Investments (net of foreign taxes of $214,037) | | | 144,630,824 | |
Forward currency contracts | | | 17,141,320 | |
Foreign currency transactions | | | (870,321 | ) |
Net change in unrealized appreciation/depreciation | | | | |
Investments | | | 63,357,953 | |
Forward currency contracts | | | 4,668,026 | |
Foreign currency translation | | | (288,458 | ) |
| | | | |
Net realized and unrealized gain | | | 228,639,344 | |
| | | | |
NET INCREASE IN NET ASSETS
FROM OPERATIONS | | $ | 301,919,503 | |
| | | | |
| | | | | | | | |
CONSOLIDATED STATEMENT OF CHANGES IN NET ASSETS | |
| | |
| | | Year Ended
December 31, 2014 | | | Year Ended
December 31, 2013
| |
OPERATIONS: | | | | | | | | |
Net investment income | | $ | 73,280,159 | | | $ | 51,571,394 | |
Net realized gain | | | 160,901,823 | | | | 107,605,183 | |
Net change in unrealized appreciation/depreciation | | | 67,737,521 | | | | 776,996,647 | |
| | | | | | | | |
| | | 301,919,503 | | | | 936,173,224 | |
| | | | | | | | |
| | |
DISTRIBUTIONS TO SHAREHOLDERS FROM: | | | | | | | | |
Net investment income | | | (72,474,215 | ) | | | (51,208,519 | ) |
Net realized gain | | | (138,830,388 | ) | | | (100,724,648 | ) |
| | | | | | | | |
Total distributions | | | (211,304,603 | ) | | | (151,933,167 | ) |
| | | | | | | | |
| | |
FUND SHARE
TRANSACTIONS: | | | | | | | | |
Proceeds from sale of shares | | | 2,482,518,668 | | | | 867,041,207 | |
Reinvestment of distributions | | | 204,987,790 | | | | 147,064,049 | |
Cost of shares redeemed | | | (806,780,930 | ) | | | (569,072,368 | ) |
| | | | | | | | |
Net increase from Fund share transactions | | | 1,880,725,528 | | | | 445,032,888 | |
| | | | | | | | |
Total increase in net assets | | | 1,971,340,428 | | | | 1,229,272,945 | |
| | |
NET ASSETS: | | | | | | | | |
Beginning of year | | | 3,923,990,096 | | | | 2,694,717,151 | |
| | | | | | | | |
End of year (including undistributed net investment income of $(306,245) and
$(27,832), respectively) | | $ | 5,895,330,524 | | | $ | 3,923,990,096 | |
| | | | | | | | |
| | |
SHARE INFORMATION: | | | | | | | | |
Shares sold | | | 205,490,704 | | | | 84,147,647 | |
Distributions reinvested | | | 17,283,962 | | | | 13,130,720 | |
Shares redeemed | | | (66,336,804 | ) | | | (55,260,639 | ) |
| | | | | | | | |
Net increase in shares outstanding | | | 156,437,862 | | | | 42,017,728 | |
| | | | | | | | |
| | |
| PAGE 9 § DODGE & COX GLOBAL STOCK FUND | | See accompanying Notes to Consolidated Financial Statements |
NOTES TO CONSOLIDATED FINANCIAL STATEMENTS
NOTE 1—ORGANIZATION AND SIGNIFICANT ACCOUNTING POLICIES
Dodge & Cox Global Stock Fund (the “Fund”) is one of the series constituting the Dodge & Cox Funds (the “Trust” or the “Funds”). The Trust is organized as a Delaware statutory trust and is registered under the Investment Company Act of 1940, as amended, as an open-end management investment company. The Fund commenced operations on May 1, 2008, and seeks long-term growth of principal and income. The Fund invests primarily in a diversified portfolio of U.S. and foreign equity securities. Foreign investing, especially in developing countries, has special risks such as currency and market volatility and political and social instability. These and other risk considerations are discussed in the Fund’s Prospectus.
The financial statements have been prepared in conformity with accounting principles generally accepted in the United States of America, which require the use of estimates and assumptions by management. Actual results may differ from those estimates. Significant accounting policies are as follows:
Security valuation The Fund’s net assets are valued as of the close of trading on the New York Stock Exchange (NYSE), generally 4:00 p.m. Eastern Time, each day that the NYSE is open for business. Portfolio securities and other financial instruments for which market quotes are readily available are valued at market value. Listed securities are generally valued using the official quoted close price or the last sale on the exchange that is determined to be the primary market for the security. Security values are not discounted based on the size of the Fund’s position. Short-term securities less than 60 days to maturity may be valued at amortized cost if amortized cost approximates current value.
Investments initially valued in currencies other than the U.S. dollar are converted to the U.S. dollar using prevailing exchange rates. As a result, the Fund’s net assets may be affected by changes in the value of currencies in relation to the U.S. dollar.
If market quotations are not readily available or if a security’s value has materially changed after the close of the security’s primary market but before the close of trading on the NYSE, the security is valued at fair value as determined in good faith by or under the direction of the Board of Trustees. The Fund may use fair value pricing in
calculating its net asset value per share (NAV) when, for example, (i) the primary market for a security is closed or if trading of a security is suspended or limited, (ii) the Fund determines that the price provided by a pricing service is inaccurate or unreliable, or (iii) the Fund determines that a significant event affecting the value of a security has occurred before the close of the NYSE but after the close of the security’s primary market. An event is considered significant if there is both an affirmative expectation that the security’s value will materially change in response to the event and a reasonable basis exists for quantifying a resulting change in value. Because trading in securities on most foreign exchanges is normally completed before the close of the NYSE, the value of non-U.S. securities can change by the time the Fund calculates its NAV. To address these changes, the Fund may utilize adjustment factors provided by an independent pricing service to systematically value non-U.S. securities at fair value. These adjustment factors are based on statistical analyses of subsequent movements and changes in securities indices, specific security prices, and exchange rates in foreign markets.
The Board of Trustees has delegated authority to Dodge & Cox, the Fund’s investment manager, to make fair value determinations in accordance with the Dodge & Cox Funds Valuation Policies (“Valuation Policies”), subject to Board oversight. Dodge & Cox has established a Pricing Committee that is comprised of representatives from Treasury, Legal, Compliance, and Operations. The Pricing Committee is responsible for implementing the Valuation Policies, including determining the fair value of securities when market quotations or market-based valuations are not readily available or are deemed unreliable. The Pricing Committee considers relevant indications of value that are reasonably available to it in determining the fair value assigned to a particular security, such as the value of similar financial instruments, trading volumes, contractual restrictions on disposition, related corporate actions, and changes in economic conditions.
Valuing securities at fair value involves greater reliance on judgment than valuation of securities based on readily available market quotations. In some instances, lack of information and uncertainty as to the significance of information may lead to a conclusion that a prior valuation is the best indication of a security’s present value. When fair value pricing is employed, the prices of
DODGE & COX GLOBAL STOCK FUND §PAGE 10
NOTES TO CONSOLIDATED FINANCIAL STATEMENTS
securities used by the Fund to calculate its net asset value may differ from quoted or published prices for the same securities.
Security transactions, investment income, expenses, and distributions Security transactions are recorded on the trade date. Realized gains and losses on securities sold are determined on the basis of identified cost.
Dividend income and corporate action transactions are recorded on the ex-dividend date, or when the Fund first learns of the dividend/corporate action if the ex-dividend date has passed. Non-cash dividends included in dividend income, if any, are recorded at the fair market value of the securities received. Dividends characterized as return of capital for U.S. tax purposes are recorded as a reduction of cost of investments and/or realized gain. Interest income is recorded on the accrual basis.
Expenses are recorded on the accrual basis. Most expenses of the Trust can be directly attributed to a specific series. Expenses which cannot be directly attributed are allocated among the Funds in the Trust based on relative net assets or other expense methodologies determined by the nature of the expense.
Distributions to shareholders are recorded on the ex-dividend date.
Foreign taxes The Fund is subject to foreign taxes which may be imposed by certain countries in which the Fund invests. The Fund endeavors to record foreign taxes based on applicable foreign tax law. Withholding taxes are incurred on certain foreign dividends and are accrued at the time the associated dividend is recorded. The Fund files withholding tax reclaims in certain jurisdictions to recover a portion of amounts previously withheld. The Fund records a reclaim receivable based on, among other things, a jurisdiction’s legal obligation to pay reclaims as well as payment history and market convention. In consideration of recent decisions rendered by European courts, the Fund has filed for additional reclaims related to prior years. However, a corresponding receivable amount has not yet been recorded because there is limited historical precedent for collecting such reclaims and the amount, if any, that the Fund might ultimately recover is uncertain. Such amounts, if and when recorded, could result in an increase in the Fund’s net asset value per share.
Capital gains taxes are incurred upon disposition of certain foreign securities. Capital gains taxes on
appreciated securities are accrued as unrealized losses and are reflected as realized losses upon the sale of the related security. Currency taxes may be incurred when the Fund purchases certain foreign currencies related to securities transactions and are recorded as realized losses on foreign currency transactions.
Repurchase agreements The Fund enters into repurchase agreements, secured by U.S. government or agency securities, which involve the purchase of securities from a counterparty with a simultaneous commitment to resell the securities at an agreed-upon date and price. It is the Fund’s policy that its custodian take possession of the underlying collateral securities, the fair value of which exceeds the principal amount of the repurchase transaction, including accrued interest, at all times. In the event of default by the counterparty, the Fund has the contractual right to liquidate the collateral securities and to apply the proceeds in satisfaction of the obligation.
Forward currency contracts A forward currency contract represents an obligation to purchase or sell a specific foreign currency at a future date at a price set at the time of the contract. Losses from these transactions may arise from unfavorable changes in currency values or if the counterparties do not perform under a contract’s terms.
The values of the forward currency contracts are adjusted daily based on the applicable exchange rate of the underlying currency. Changes in the value of open contracts are recorded as unrealized appreciation or depreciation in the Consolidated Statement of Operations. When the forward currency contract is closed, the Fund records a realized gain or loss in the Consolidated Statement of Operations equal to the difference between the value at the time the contract was opened and the value at the time it was closed.
During the year, the Fund maintained forward currency contracts to hedge foreign currency risks associated with portfolio investments denominated in euro. These euro forward currency contracts had U.S. dollar total values ranging from 2% to 4% of net assets during the year.
Foreign currency translation The books and records of the Fund are maintained in U.S. dollars. Foreign currency amounts are translated into U.S. dollars at the prevailing exchange rates of such currencies against the U.S. dollar. The market value of investment securities and
PAGE 11 § DODGE & COX GLOBAL STOCK FUND
NOTES TO CONSOLIDATED FINANCIAL STATEMENTS
other assets and liabilities are translated at the exchange rate as of the valuation date. Purchases and sales of investment securities, income, and expenses are translated at the exchange rate prevailing on the transaction date.
Reported realized and unrealized gain (loss) on investments include foreign currency gain (loss) related to investment transactions.
Reported realized and unrealized gain (loss) on foreign currency transactions and translation include the following: disposing/holding of foreign currency, the difference between the trade and settlement dates on securities transactions, the difference between the accrual and payment dates on dividends, and currency losses on the purchase of foreign currency in certain countries that impose taxes on such transactions.
Consolidation The Fund may invest in certain securities through its wholly owned subsidiary, Dodge & Cox Global Stock Fund Cayman, Ltd. (the “Subsidiary”). The Subsidiary is a Cayman Islands exempted company and invests in certain securities consistent with the investment objective of the Fund. The Fund’s Consolidated Financial Statements, including the Consolidated Portfolio of Investments, consist of the holdings and accounts of the Fund and the Subsidiary. All intercompany transactions and balances have been eliminated. At December 31, 2014, the Subsidiary had net assets of $100, which represented less than 0.01% of the Fund’s consolidated net assets.
Indemnification Under the Trust’s organizational documents, its officers and trustees are indemnified against certain liabilities arising out of the performance of their duties to the Trust. In addition, in the normal course of business the Trust enters into contracts that provide general indemnities to other parties. The Trust’s maximum exposure under these arrangements is unknown as this would involve future claims that may be made against the Trust that have not yet occurred.
NOTE 2—VALUATION MEASUREMENTS
Various inputs are used in determining the value of the Fund’s investments and other financial instruments. These inputs are summarized in the three broad levels listed below.
| § | | Level 1: Quoted prices in active markets for identical securities |
| § | | Level 2: Other significant observable inputs (including quoted prices for similar securities, market indices, interest rates, credit risk, etc.) |
| § | | Level 3: Significant unobservable inputs (including Fund management’s assumptions in determining the fair value of investments) |
The inputs or methodology used for valuing securities are not necessarily an indication of the risk associated with investing in those securities.
The following is a summary of the inputs used to value the Fund’s holdings at December 31, 2014:
| | | | | | | | |
| Classification(a) | | LEVEL 1
(Quoted Prices) | | | LEVEL 2
(Other Significant
Observable Inputs) | |
Securities | | | | | | | | |
Common Stocks | | | | | | | | |
Consumer Discretionary | | $ | 641,693,992 | | | $ | 413,960,069 | |
Consumer Staples | | | 124,311,300 | | | | 104,693,500 | |
Energy | | | 310,466,162 | | | | 38,366,436 | |
Financials | | | 524,938,391 | | | | 820,441,677 | |
Health Care | | | 356,443,341 | | | | 452,748,347 | |
Industrials | | | 147,720,253 | | | | 137,768,324 | |
Information Technology | | | 856,123,896 | | | | 188,625,691 | |
Materials | | | 55,840,748 | | | | 158,033,274 | |
Telecommunication Services | | | 32,693,913 | | | | 198,036,992 | |
Preferred Stocks | | | | | | | | |
Energy | | | 37,056,346 | | | | — | |
Financials | | | — | | | | 45,200,675 | |
Information Technology | | | — | | | | 66,260,477 | |
Short-term Investments | | | | | | | | |
Money Market Fund | | | 5,918,640 | | | | — | |
Repurchase Agreement | | | — | | | | 166,990,000 | |
| | | | | | | | |
Total Securities | | $ | 3,093,206,982 | | | $ | 2,791,125,462 | |
| | | | | | | | |
| | |
Other Financial Instruments | | | | | | | | |
Forward Currency Contracts | | $ | — | | | $ | 3,380,529 | (b) |
| | | | | | | | | |
| (a) | | Transfers during the year between Level 1 and Level 2 relate to the use of systematic fair valuation (see Note 1). On days when systematic fair valuation is used, securities whose primary market closes before the NYSE are classified as Level 2. There were no Level 3 securities at December 31, 2014 and 2013, and there were no transfers to Level 3 during the year. |
| (b) | | Represents net unrealized appreciation/(depreciation). |
DODGE & COX GLOBAL STOCK FUND §PAGE 12
NOTES TO CONSOLIDATED FINANCIAL STATEMENTS
NOTE 3—ADDITIONAL DERIVATIVES INFORMATION
The Fund has entered into over-the-counter derivatives, such as forward currency contracts (each, a “Derivative”). Each Derivative is subject to a negotiated master agreement (based on a form published by the International Swaps and Derivatives Association (“ISDA”)) governing all Derivatives between the Fund and the relevant dealer counterparty. The master agreements specify (i) events of default and other events permitting a party to terminate some or all of the Derivatives thereunder and (ii) the process by which those Derivatives will be valued for purposes of determining termination payments. If some or all of the Derivatives under a master agreement are terminated because of an event of default or similar event, the values of all terminated Derivatives must be netted to determine a single payment owed by one party to the other. Some master agreements contain collateral terms requiring the parties to post collateral in respect of some or all of the Derivatives thereunder based on the net market value of those Derivatives, subject to a minimum exposure threshold. To the extent amounts owed to the Fund by its counterparties are not collateralized, the Fund is at risk of those counterparties’ non-performance. The Fund attempts to mitigate counterparty credit risk by entering into Derivatives only with counterparties it believes to be of good credit quality and by monitoring the financial stability of those counterparties.
For financial reporting purposes, the Fund does not offset financial assets and liabilities that are subject to an ISDA Master Agreement in the Consolidated Statement of Assets and Liabilities. The net amount for Derivatives is disclosed on the Consolidated Portfolio of Investments. At December 31, 2014, no collateral is pledged or held by the Fund for Derivatives.
NOTE 4—RELATED PARTY TRANSACTIONS
Management fees Under a written agreement approved by a unanimous vote of the Board of Trustees, the Fund pays an annual management fee of 0.60% of the Fund’s average daily net assets to Dodge & Cox, investment manager of the Fund.
Fund officers and trustees All officers and two of the trustees of the Trust are officers or employees of Dodge & Cox. The Trust pays a fee only to those trustees who are not affiliated with Dodge & Cox.
NOTE 5—INCOME TAX INFORMATION AND DISTRIBUTIONS TO SHAREHOLDERS
A provision for federal income taxes is not required since the Fund intends to qualify as a regulated investment company under Subchapter M of the Internal Revenue Code and distribute all of its taxable income to shareholders. Distributions are determined in accordance with income tax regulations, and such amounts may differ from net investment income and realized gains for financial reporting purposes. Financial reporting records are adjusted for permanent book/tax differences at year end to reflect tax character.
Book/tax differences are primarily due to differing treatments of wash sales, net short-term realized gain (loss) on investments, investments in passive foreign investment companies, foreign capital gain taxes, and foreign currency realized gain (loss). At December 31, 2014, the cost of investments for federal income tax purposes was $4,812,574,577.
Distributions during the years noted below were characterized as follows for federal income tax purposes:
| | | | | | | | |
| | | Year Ended December 31, 2014 | | | Year Ended December 31, 2013 | |
Ordinary income | | | $100,240,292 | | | | $57,838,261 | |
| | | ($0.213 per share) | | | | ($0.184 per share) | |
| | |
Long-term capital gain | | | $111,064,311 | | | | $94,094,906 | |
| | | ($0.236 per share) | | | | ($0.296 per share) | |
At December 31, 2014, the tax basis components of distributable earnings were as follows:
| | | | |
Unrealized appreciation | | | $1,285,901,921 | |
Unrealized depreciation | | | (214,144,054 | ) |
| | | | |
Net unrealized appreciation | | | 1,071,757,867 | |
Undistributed ordinary income | | | 10,294,975 | |
Undistributed long-term capital gain | | | 25,860,529 | |
Fund management has reviewed the tax positions for open periods (three years and four years, respectively, from filing the Fund’s Federal and State tax returns) as applicable to the Fund, and has determined that no provision for income tax is required in the Fund’s financial statements.
PAGE 13 § DODGE & COX GLOBAL STOCK FUND
NOTES TO CONSOLIDATED FINANCIAL STATEMENTS
NOTE 6—LOAN FACILITIES
Pursuant to an exemptive order issued by the Securities and Exchange Commission (SEC), the Fund may participate in an interfund lending facility (Facility). The Facility allows the Fund to borrow money from or loan money to the Funds. Loans under the Facility are made for temporary or emergency purposes, such as to fund shareholder redemption requests. Interest on borrowings is the average of the current repurchase agreement rate and the bank loan rate. There was no activity in the Facility during the year.
All Funds in the Trust participate in a $500 million committed credit facility (Line of Credit) with State Street Bank and Trust Company, to be utilized for temporary or emergency purposes to fund shareholder redemptions or for other short-term liquidity purposes. The maximum amount available to the Fund is $250 million. Each Fund pays an annual commitment fee on its pro-rata portion of the Line of Credit. The Fund’s commitment fee for the year ended December 31, 2014, amounted to $14,744 and is reflected as a Miscellaneous Expense in the Consolidated Statement of Operations. Interest on borrowings is charged at the prevailing rate. There were no borrowings on the Line of Credit during the year.
NOTE 7—PURCHASES AND SALES OF INVESTMENTS
For the year ended December 31, 2014, purchases and sales of securities, other than short-term securities, aggregated $2,584,681,066 and $843,845,025, respectively.
NOTE 8—ACCOUNTING PRONOUNCEMENTS
In June 2014, the Financial Accounting Standards Board issued Accounting Standards Update (ASU) No. 2014-11, Transfers and Servicing (Topic 860), Repurchase-to-Maturity Transactions, Repurchase Financings, and Disclosures. The ASU changes the accounting for certain repurchase agreements and expands disclosure requirements related to repurchase agreements and similar transactions. Management is currently evaluating the impact, if any, of applying this ASU effective January 1, 2015.
NOTE 9—SUBSEQUENT EVENTS
Fund management has determined that no material events or transactions occurred subsequent to December 31, 2014, and through the date of the Fund’s financial statements issuance, which require additional disclosure in the Fund’s financial statements.
DODGE & COX GLOBAL STOCK FUND §PAGE 14
CONSOLIDATED FINANCIAL HIGHLIGHTS
| | | | | | | | | | | | | | | | | | | | |
SELECTED DATA AND RATIOS (for a share outstanding throughout the year) | | Year Ended December 31, | |
| | | 2014 | | | 2013 | | | 2012 | | | 2011 | | | 2010 | |
| | | | |
Net asset value, beginning of year | | | $11.48 | | | | $8.99 | | | | $7.68 | | | | $8.90 | | | | $7.91 | |
Income from investment operations: | | | | | | | | | | | | | | | | | | | | |
Net investment income | | | 0.16 | | | | 0.16 | | | | 0.15 | | | | 0.16 | | | | 0.08 | |
Net realized and unrealized gain (loss) | | | 0.64 | | | | 2.81 | | | | 1.48 | | | | (1.18 | ) | | | 0.99 | |
| | | | |
Total from investment operations | | | 0.80 | | | | 2.97 | | | | 1.63 | | | | (1.02 | ) | | | 1.07 | |
| | | | |
Distributions to shareholders from: | | | | | | | | | | | | | | | | | | | | |
Net investment income | | | (0.15 | ) | | | (0.16 | ) | | | (0.15 | ) | | | (0.15 | ) | | | (0.08 | ) |
Net realized gain | | | (0.30 | ) | | | (0.32 | ) | | | (0.17 | ) | | | (0.05 | ) | | | — | |
| | | | |
Total distributions | | | (0.45 | ) | | | (0.48 | ) | | | (0.32 | ) | | | (0.20 | ) | | | (0.08 | ) |
| | | | |
Net asset value, end of year | | | $11.83 | | | | $11.48 | | | | $8.99 | | | | $7.68 | | | | $8.90 | |
| | | | |
Total return | | | 6.95 | % | | | 33.17 | % | | | 21.11 | % | | | (11.39 | )% | | | 13.51 | % |
Ratios/supplemental data: | | | | | | | | | | | | | | | | | | | | |
Net assets, end of year (millions) | | | $5,895 | | | | $3,924 | | | | $2,695 | | | | $1,875 | | | | $1,817 | |
Ratio of expenses to average net assets | | | 0.65 | % | | | 0.65 | % | | | 0.65 | % | | | 0.66 | % | | | 0.69 | % |
Ratio of net investment income to average net assets | | | 1.42 | % | | | 1.58 | % | | | 1.93 | % | | | 1.94 | % | | | 1.19 | % |
Portfolio turnover rate | | | 17 | % | | | 24 | % | | | 12 | % | | | 19 | % | | | 14 | % |
See accompanying Notes to Consolidated Financial Statements
PAGE 15 § DODGE & COX GLOBAL STOCK FUND
REPORT OF INDEPENDENT REGISTERED PUBLIC ACCOUNTING FIRM
To the Trustees of Dodge & Cox Funds and Shareholders of Dodge & Cox Global Stock Fund
In our opinion, the accompanying consolidated statement of assets and liabilities, including the consolidated portfolio of investments, and the related consolidated statements of operations and of changes in net assets and the consolidated financial highlights present fairly, in all material respects, the financial position of Dodge & Cox Global Stock Fund (the “Fund”, one of the series constituting Dodge & Cox Funds) at December 31, 2014, the results of its operations for the year then ended, the changes in its net assets for each of the two years in the period then ended and the financial highlights for each of the five years in the period then ended, in conformity with accounting principles generally accepted in the United States of America. These consolidated financial statements and consolidated financial highlights (hereafter referred to as financial statements) are the responsibility of the Fund’s management. Our responsibility is to express an opinion on these financial statements based on our audits. We conducted our audits of these financial statements in accordance with the standards of the Public Company Accounting Oversight Board (United States). Those standards require that we plan and perform the audit to obtain reasonable assurance about whether the financial statements are free of material misstatement. An audit includes examining, on a test basis, evidence supporting the amounts and disclosures in the financial statements, assessing the accounting principles used and significant estimates made by management, and evaluating the overall financial statement presentation. We believe that our audits, which included confirmation of securities at December 31, 2014, by correspondence with the custodian and brokers, provide a reasonable basis for our opinion.
PricewaterhouseCoopers LLP
San Francisco, California
February 17, 2015
DODGE & COX GLOBAL STOCK FUND §PAGE 16
SPECIAL 2014 TAX INFORMATION
(unaudited)
The following information is provided pursuant to provisions of the Internal Revenue Code:
In 2014, the Fund elected to pass through to shareholders foreign source income of $80,757,152 and foreign taxes paid of $6,144,911.
The Fund designates up to a maximum of $105,019,221 of its distributions paid to shareholders in 2014 as qualified dividends (treated for federal income tax purposes in the hands of shareholders as taxable at a maximum rate of 20%).
For shareholders that are corporations, the Fund designates 31% of its ordinary dividends paid to shareholders in 2014 as dividends from domestic corporations eligible for the corporate dividends received deduction, provided that the shareholder otherwise satisfies applicable requirements to claim that deduction.
BOARD APPROVAL OF FUNDS’ INVESTMENT MANAGEMENT AGREEMENTS AND MANAGEMENT FEES
(unaudited)
The Board of Trustees is responsible for overseeing the performance of the Dodge & Cox Funds’ investment manager and determining whether to continue the Investment Management Agreements between the Funds and Dodge & Cox each year (the “Agreements”). At a meeting of the Board of Trustees of the Trust held on December 17, 2014, the Trustees, by a unanimous vote (including a separate vote of those Trustees who are not “interested persons” (as defined in the Investment Company Act of 1940) (the “Independent Trustees”)), approved the renewal of the Agreements for an additional one-year term through December 31, 2015 with respect to each Fund other than the Dodge & Cox Global Bond Fund. The Agreement for the Dodge & Cox Global Bond Fund was not subject to renewal at this time. During the course of the year, the Board received a wide variety of materials relating to the services provided by Dodge & Cox and the performance of each of the Funds.
INFORMATION RECEIVED
In advance of the meeting, the Board, including each of the Independent Trustees, requested, received, and reviewed materials relating to the Agreements and the
services provided by Dodge & Cox. The Independent Trustees retained Morningstar® to prepare an independent expense and performance summary for each Fund and comparable funds managed by other advisers identified by Morningstar. The Morningstar materials included information regarding advisory fee rates, expense ratios, and transfer agency, custodial, and distribution expenses, as well as appropriate performance comparisons to each Fund’s peer group and an index or combination of indices. The Morningstar materials also included a comparison of expenses of various share classes offered by comparable funds.
The materials reviewed by the Board contained information concerning, among other things, Dodge & Cox’s profitability, financial results and condition, advisory fee revenue, and separate account and sub-adviser fund fee schedules. The Board additionally considered the Funds’ brokerage commissions, turnover rates, sales and redemption data and the significant investment that Dodge & Cox makes in research used in managing the Funds. The Board received and reviewed a memorandum summarizing information provided throughout the year regarding Dodge & Cox’s services to the Funds as well as information regarding (i) the different fees, services, costs, and risks associated with other accounts managed by Dodge & Cox as compared to the Dodge & Cox Funds; (ii) the differences in performance between the Funds and separately managed accounts; and (iii) Fund shares subscription and redemption activity. Throughout the process of reviewing the services provided by Dodge & Cox and preparing for the meeting, the Independent Trustees found Dodge & Cox to be open, forthright, detailed, and very helpful in answering questions about all issues.
The Board received copies of the Agreements and a memorandum from the independent legal counsel to the Independent Trustees discussing the factors generally regarded as appropriate to consider in evaluating advisory arrangements. The Trust’s Contract Review Committee, consisting solely of Independent Trustees, met with the independent legal counsel on November 3, 2014, and again on December 17, 2014, to discuss whether to renew the Agreements. The Board, including the Independent Trustees, subsequently concluded that the existing Agreements are fair and reasonable and voted to approve the Agreements.
PAGE 17 § DODGE & COX GLOBAL STOCK FUND
In considering the Agreements, the Board, including the Independent Trustees, did not identify any single factor or particular information as all-important or controlling. In reaching the decision to approve the Agreements, the Board considered several factors, discussed below, to be key factors and reached the conclusions described below.
NATURE, QUALITY, AND EXTENT OF THE SERVICES
The Board considered that Dodge & Cox provides a wide range of services to the Funds in addition to portfolio management and that the quality of these services has been excellent in all respects. The extensive nature of services provided by Dodge & Cox has been documented in materials provided to the Board and in presentations made to the Board throughout the year. In particular, the Board considered the nature, quality, and extent of portfolio management, administrative, and shareholder services performed by Dodge & Cox. With regard to portfolio management services, the Board considered Dodge & Cox’s established long-term history of care and conscientiousness in the management of the Funds; its demonstrated consistency in investment approach and depth; the background and experience of the Dodge & Cox Investment Policy Committee, International Investment Policy Committee, Global Stock Investment Policy Committee, Fixed Income Investment Policy Committee, and Global Bond Investment Policy Committee, and research analysts responsible for managing the Funds; its methods for assessing the regulatory and investment climate in various jurisdictions; Dodge & Cox’s overall high level of attention to its core investment management function; and its commitment to the Funds and their shareholders.
In the area of administrative and shareholder services, the Board considered the excellent quality of Dodge & Cox’s work in areas such as compliance, legal services, trading, proxy voting, technology, oversight of the Funds’ transfer agent and custodian, tax compliance, and shareholder communication through its website and other means. The Board also noted Dodge & Cox’s diligent disclosure policy, its favorable compliance record, and its reputation as a trusted, shareholder-friendly mutual fund family.
In addition, the Board considered that Dodge & Cox manages approximately $180 billion in Fund assets with fewer professionals than most comparable funds, and that on average these professionals have more experience and longer tenure than investment professionals at comparable funds. The Board also noted that Dodge & Cox is an investment research-oriented firm with no other business endeavors to distract management’s attention from its research efforts, and that its investment professionals adhere to a consistent investment approach across the Funds. The Board further considered the favorable stewardship and “Gold” analyst ratings awarded to each of the Funds by Morningstar. The Board concluded that it was satisfied with the nature, extent, and quality of investment management and other services provided to the Funds by Dodge & Cox.
INVESTMENT PERFORMANCE
The Board considered short-term and long-term investment performance for each Fund (including periods of outperformance or underperformance) as compared to both relevant indices and the performance of such Fund’s peer group. The Board noted that each Fund demonstrated favorable longer-term performance relative to its benchmark and peer group. The Board determined after extensive review and inquiry that Dodge & Cox’s historic, long-term, team-oriented, bottom up investment approach remains consistent and that Dodge & Cox continues to be distinguished by its integrity, transparency, and independence.
The Board considered that the performance of the Funds is the result of a team-oriented investment management process that emphasizes a long-term investment horizon, comprehensive independent research, price discipline, and focus. The Board also considered that the investment performance delivered by Dodge & Cox to the Funds appeared to be consistent with the relevant performance delivered for other clients of Dodge & Cox. The Board concluded that Dodge & Cox has delivered favorable long-term performance for Fund investors consistent with the long-term investment strategies being pursued by the Funds.
DODGE & COX GLOBAL STOCK FUND §PAGE 18
COSTS AND ANCILLARY BENEFITS
Costs of Services to Funds: Fees and Expenses. The Board considered each Fund’s management fee rate and expense ratio relative to similar mutual funds and relative to management fees charged by Dodge & Cox to other clients. In particular, the Board considered that the Funds continue to be substantially below their peer group median in expense ratios and management fee rates and that many media and industry reports specifically comment on the low expense ratios of the Funds, which have been a defining characteristic of the Funds for many years. The Board also evaluated the operating structures of the Funds and Dodge & Cox, noting that the Funds do not charge front-end sales commissions or distribution fees, and Dodge & Cox bears, among other things, the significant cost of third party research, reimbursement for recordkeeping and administrative costs to third-party retirement plan administrators, and administrative and office overhead. The Board noted that expenses are well below industry averages. The Board also considered that the Funds receive numerous administrative, regulatory compliance, legal, technology and shareholder support services from Dodge & Cox without any additional administrative fee and the fact that the Funds have relatively low transaction costs and portfolio turnover rates. The Board reviewed Morningstar data showing that the few peer group funds with lower expense ratios often have other share classes with significantly higher expense ratios.
The Board reviewed information regarding the fee rates Dodge & Cox charges to separate accounts and subadvised funds that have investment programs similar to those of the Funds, including instances where separate account and sub-advised fund fees are lower than Fund fees. The Board considered differences in the nature and scope of services Dodge & Cox provides to the Funds as compared to other client accounts, differences in regulatory, litigation, and other risks as between Dodge & Cox Funds and other types of clients, and certain characteristics of the market for institutional separate account management services. The Board further noted that, with respect to non-U.S. funds sponsored and managed by Dodge & Cox that are comparable to the Funds in many respects, the fee rates charged by Dodge & Cox are the same as or higher than the fee rates charged to the Funds. After consideration of these matters, the Board concluded that the overall costs incurred by the Funds for the services they receive (including the management fee paid to Dodge & Cox) are reasonable
and that the fees are acceptable based upon the qualifications, experience, reputation, and performance of Dodge & Cox and the low overall expense ratios of the Funds.
Profitability and Costs of Services to Dodge & Cox; “Fall-out” Benefits. The Board reviewed reports of Dodge & Cox’s financial position, profitability, and estimated overall value, and considered Dodge & Cox’s overall profitability within its context as a private, employee-owned S-Corporation and relative to the favorable services provided. The Board noted in particular that Dodge & Cox’s profits are not generated by high fee rates, but reflect an extraordinarily streamlined, efficient, and focused business approach toward investment management. The Board recognized the importance of Dodge & Cox’s profitability—which is derived solely from management fees and does not include other business ventures—to maintain its independence, stability, company culture and ethics, and management continuity. The Board also considered that the compensation/profit structure at Dodge & Cox includes a return on shareholder employees’ investment in the firm, which is vital for remaining independent and facilitating retention of management and investment professionals.
The Board considered that Dodge & Cox recently recommended closing the International Stock Fund to new investors to pro-actively manage the growth of the Fund. The Stock Fund and Balanced Fund were similarly closed to new investors during periods of significant growth in the past. While these actions are intended to benefit existing shareholders, the effect is to reduce potential revenues to Dodge & Cox from new shareholders.
The Board also considered potential “fall-out” benefits (including the receipt of research from unaffiliated brokers and reputational benefits to non-U.S. funds sponsored and managed by Dodge & Cox) that Dodge & Cox might receive as a result of its association with the Funds and determined that they are not significant. The Board also noted the extent of additional administrative services performed by Dodge & Cox for the Funds, and that the magnitude of costs and risks borne by Dodge & Cox in rendering advisory services to the Funds (including risks in the regulatory compliance, securities valuation, and investment management processes) are continuing to increase. The Board concluded that the profitability of Dodge & Cox’s relationship with the Funds (including fall-out benefits) was fair and reasonable.
PAGE 19 § DODGE & COX GLOBAL STOCK FUND
THE BENEFIT OF ECONOMIES OF SCALE
The Board considered whether there have been economies of scale with respect to the management of each Fund, whether the Funds have appropriately benefited from any economies of scale, and whether the management fee rate is reasonable in relation to the Fund assets and any economies of scale that may exist. In the Board’s view, any consideration of economies of scale must take account of the Funds’ low fee structure and the considerable efficiencies of the Funds’ organization and fee structure that has been realized by shareholders from the time of each Fund’s inception (i.e., from the first dollar). An assessment of economies of scale must also take into account that Dodge & Cox has capped expenses when offering new funds. In addition, the Board noted that Dodge & Cox has shared economies of scale by adding or enhancing services to the Funds over time, and that the internal costs of providing investment management, up-to-date technology, administrative, legal, and compliance services to the Funds are continuing to increase. For example, Dodge & Cox has increased its global research staff and investment resources over the years to address the increased complexity of investing in multinational and non-U.S. companies. In addition, Dodge & Cox has made substantial expenditures in other staff, technology, and infrastructure to enable it to integrate credit and equity analyses and to be able to implement its strategy in a more effective and secure manner. The Board determined that the Funds provide access for small investors to high quality investment management at a relatively low cost. The Board’s decision to renew the Agreements was made after consideration of economies of scale and review of peer group fund expense ratios and historical expense ratio patterns for the Funds. The Board concluded that the current Dodge & Cox fee structure is fair and reasonable and adequately shares economies of scale that may exist.
CONCLUSION
Based on their evaluation of all material factors and assisted by the advice of independent legal counsel to the Independent Trustees, the Board, including the Independent Trustees, concluded that the advisory fee structure was fair and reasonable, that each Fund was
paying a competitive fee for the services provided, that the scope and quality of Dodge & Cox’s services has provided substantial value for Fund shareholders over the long term, and that approval of the Agreements was in the best interests of each Fund and its shareholders.
FUND HOLDINGS
The Fund provides a complete list of its holdings four times each fiscal year, as of the end of each quarter. The Fund files the lists with the Securities and Exchange Commission (SEC) on Form N-CSR (second and fourth quarters) and Form N-Q (first and third quarters). Shareholders may view the Fund’s Forms N-CSR and N-Q on the SEC’s website at www.sec.gov. Forms N-CSR and N-Q may also be reviewed and copied at the SEC’s Public Reference Room in Washington, DC. Information regarding the operations of the Public Reference Room may be obtained by calling 202-551-8090 (direct) or 800-732-0330 (general SEC number). A list of the Fund’s quarter-end holdings is also available at www.dodgeandcox.com on or about 15 days following each quarter end and remains available on the website until the list is updated in the subsequent quarter.
PROXY VOTING
For a free copy of the Fund’s proxy voting policies and procedures, please call 800-621-3979, visit the Fund’s website at www.dodgeandcox.com, or visit the SEC’s website at www.sec.gov. Information regarding how the Fund voted proxies relating to portfolio securities during the most recent 12-month period ending June 30 is also available at www.dodgeandcox.com or at www.sec.gov.
HOUSEHOLD MAILINGS
The Fund routinely mails shareholder reports and summary prospectuses to shareholders and, on occasion, proxy statements. In order to reduce the volume of mail, when possible, only one copy of these documents will be sent to shareholders who are part of the same family and share the same residential address.
If you have a direct account with the Funds and you do not want the mailing of shareholder reports and summary prospectuses combined with other members in your household, contact the Funds at 800-621-3979. Your request will be implemented within 30 days.
DODGE & COX GLOBAL STOCK FUND §PAGE 20
THIS PAGE INTENTIONALLY LEFT BLANK
DODGE & COX GLOBAL STOCK FUND §PAGE 21
THIS PAGE INTENTIONALLY LEFT BLANK
PAGE 22 § DODGE & COX GLOBAL STOCK FUND
DODGE & COX FUNDS—EXECUTIVE OFFICER & TRUSTEE INFORMATION
| | | | | | |
Name (Age) and
Address* | | Position with Trust (Year of Election or
Appointment) | | Principal Occupation During Past 5 Years | | Other Directorships Held by Trustees |
| INTERESTED TRUSTEES AND OFFICERS |
| Charles F. Pohl (56) | | Chairman and Trustee (Officer since 2004) | | Chairman (since 2013), Co-President (2011-2013), Senior Vice President (until 2011), and Director of Dodge & Cox; Chief Investment Officer, Portfolio Manager, Investment Analyst, and member of Investment Policy Committee (IPC), Global Stock Investment Policy Committee (GSIPC), International Investment Policy Committee (IIPC), and Fixed Income Investment Policy Committee (FIIPC) | | — |
| Dana M. Emery (53) | | President and Trustee (Trustee since 1993) | | Chief Executive Officer (since 2013), President (since 2011), Executive Vice President (until 2011), and Director of Dodge & Cox; Director of Fixed Income, Portfolio Manager, and member of FIIPC and Global Bond Investment Policy Committee (GBIPC) | | — |
| John A. Gunn (71) | | Senior Vice President (Officer since 1998) | | Chairman Emeritus (2011-2013), Chairman (until 2011), Chief Executive Officer (until 2010), and Director of Dodge & Cox; Portfolio Manager and member of IPC, GSIPC (until 2014), and IIPC | | — |
| Diana S. Strandberg (55) | | Senior Vice President (Officer since 2006) | | Senior Vice President (since 2011), Vice President (until 2011), and Director (since 2011) of Dodge & Cox; Director of International Equity (since 2009), Portfolio Manager, Investment Analyst, and member of IPC, GSIPC, IIPC, and GBIPC | | — |
| David H. Longhurst (57) | | Treasurer (Officer since 2006) | | Vice President and Assistant Treasurer of Dodge & Cox | | — |
| Thomas M. Mistele (61) | | Secretary (Officer since 1998) | | Chief Operating Officer, Director, Secretary, Senior Counsel (since 2011), and General Counsel (until 2011) of Dodge & Cox | | — |
| Katherine M. Primas (40) | | Chief Compliance Officer (Officer since 2009) | | Vice President (since 2011) and Chief Compliance Officer of Dodge & Cox | | — |
| INDEPENDENT TRUSTEES |
| Thomas A. Larsen (65) | | Trustee (Since 2002) | | Senior Counsel of Arnold & Porter LLP (law firm) (since 2013); Partner of Arnold & Porter LLP (since 2012); Director of Howard, Rice, Nemerovski, Canady, Falk & Rabkin (1977-2011) | | — |
| Ann Mather (54) | | Trustee (Since 2011) | | CFO, Pixar Animation Studios (1999-2004) | | Director, Google, Inc. (internet information services) (since 2005); Director, Glu Mobile, Inc. (multimedia software) (since 2005); Director, Arista Networks (since 2013); Director, Netflix, Inc. (video services) (since 2010); Director, Shutterfly, Inc. (internet photography services/publishing) (since 2013) |
| Robert B. Morris III (62) | | Trustee (Since 2011) | | Advisory Director, The Presidio Group (since 2005) | | — |
| Gary Roughead (63) | | Trustee (Since 2013) | | Annenberg Distinguished Visiting Fellow, Hoover Institution (since 2011); Admiral, United States Navy (Ret.); U.S. Navy Chief of Naval Operations (2007-2011) | | Director, Northrop Grumman Corp. (global security) (since 2012) |
| Mark E. Smith (63) | | Trustee (Since 2014) | | Executive Vice President, Managing Director—Fixed Income at Loomis Sayles & Company, L.P. (2003-2011) | | — |
| John B. Taylor (68) | | Trustee (Since 2005) (and 1995-2001) | | Professor of Economics, Stanford University; Senior Fellow, Hoover Institution; Under Secretary for International Affairs, United States Treasury (2001-2005) | | — |
| * | | The address for each Officer and Trustee is 555 California Street, 40th Floor, San Francisco, California 94104. Each Officer and Trustee oversees all six series in the Dodge & Cox Funds complex and serves for an indefinite term. |
Additional information about the Trust’s Trustees and Officers is available in the Trust’s Statement of Additional Information (SAI). You can get a free copy of the SAI by visiting the Funds’ website at www.dodgeandcox.com or calling
800-621-3979.
DODGE & COX GLOBAL STOCK FUND §PAGE 23
| | | | |
| | | | |
www.dodgeandcox.com
For Fund literature, transactions, and account information, please visit the Funds’ website.
or write or call:
DODGE & COX FUNDS
c/o Boston Financial Data Services
P.O. Box 8422
Boston, Massachusetts 02266-8422
(800) 621-3979
INVESTMENT MANAGER
Dodge & Cox
555 California Street, 40th Floor
San Francisco, California 94104
(415) 981-1710
This report is submitted for the general information of the shareholders of the Fund. The report is not authorized for distribution to prospective investors in the Fund unless it is accompanied by a current prospectus.
This report reflects our views, opinions, and portfolio holdings as of December 31, 2014, the end of the reporting period. Any such views are subject to change at any time based upon market or other conditions and Dodge & Cox disclaims any responsibility to update such views. These views may not be relied on as investment advice and, because investment decisions for a Dodge & Cox Fund are based on numerous factors, may not be relied on as an indication of trading intent on behalf of any Dodge & Cox Fund.
12/14 ISF AR Printed on recycled paper
Annual Report
December 31, 2014
International Stock Fund
ESTABLISHED 2001
TICKER: DODFX
(Closed to New Investors)
TO OUR SHAREHOLDERS
The Dodge & Cox International Stock Fund had a total return of 0.1% for the year ending December 31, 2014, compared to a return of -4.9% for the MSCI EAFE (Europe, Australasia, Far East) Index. At year end, the Fund had net assets of $64.0 billion with a cash position of 1.6%.
MARKET COMMENTARY
During 2014, global equity markets increased in local currency. However, the U.S. dollar’s appreciation against both developed and emerging market currencies was a meaningful headwind to returns. The MSCI EAFE was up 6% in local currency and down 5% in U.S. dollars; Japan (up 9% in local currency) was a particularly strong area of the market. The MSCI Emerging Markets Index was up 5% in local currency and down 2% in U.S. dollars.
Global oil prices plummeted approximately 50% amid lower-than-expected demand growth and modestly higher-than-expected supply growth. OPEC did not cut production as many had expected. While consumers and oil importers benefited from lower oil prices, many oil-exporting countries suffered.
Although economic activity expanded at a moderate pace in some major markets (e.g., United Kingdom, United States), interest rates remained low across the developed world as concerns about global economic growth persisted. The Eurozone showed significant weakness, as stagnation and deflation concerns rose and manufacturing data disappointed. Economic activity contracted in Japan on the heels of a sales tax hike and declines in business investment. Slowing growth in China weighed on commodity prices. As we assess whether these economic developments create long-term opportunities or risks for companies, we are continuing to find attractive investments across the globe.
INVESTMENT STRATEGY
Our investment approach focuses on intensive bottom-up research, a three- to five-year investment horizon, a strict price discipline, and a team decision-making process. We analyze each company’s business model, competitive position, financial characteristics, and corporate governance structure, paying close attention to the strength and depth of its management team. We also incorporate external factors
(e.g., geopolitical risk, regulations, demographics, state of the economy, currency, trade policies, etc.) and think about how they might affect a particular company’s operations and future prospects. To assess how the stock price reflects investors’ concern or optimism, we weigh these elements in relation to the company’s current valuation.
The best investment opportunities often arise during periods of great uncertainty. Macroeconomic conditions are many times not embedded appropriately in company valuations, and we find opportunities when other investors are exceptionally pessimistic. For example, in 2013 the U.S. Federal Reserve decided to begin tapering its quantitative easing program, and certain countries reliant on external funding (e.g., India, Brazil, Turkey) proved vulnerable, and experienced significant currency and/or market declines. Valuations decreased to the point where we saw investment opportunities arise in developing world companies. As a result, we added to selected holdings in emerging markets and started new positions that have since outperformed significantly and contributed to the Fund’s strong relative performance in 2014.
During 2014, we identified numerous investment opportunities within the Financials sector where valuations reflected meaningful pessimism about the macroeconomic backdrop, significant changes in commodity prices, and the banking industry’s ability to earn a return with greater regulatory oversight. Standard Chartered and Siam Commercial Bank (a new holding) are two such examples.(a) The Fund’s sector and industry positioning results from individual security selection: 27.0% of the Fund was invested in Financials compared to 25.9% of the MSCI EAFE on December 31.(b)
Standard Chartered
Domiciled in the United Kingdom, Standard Chartered has extensive geographic reach. The company provides consumer and wholesale banking products to customers throughout emerging markets (especially in Asia, Africa, and the Middle East); approximately a third of the company’s deposits are located in Greater China. Falling commodity prices, concerns about asset quality, regulatory fines, and increasing capital requirements in the United Kingdom weighed on the company’s share price, and its
PAGE 1 § DODGE & COX INTERNATIONAL STOCK FUND
valuation fell to 0.8 times book value in October, a historically low level.
Standard Chartered has been held in the Fund since 2002. Over the years, we have spent considerable time researching and analyzing the company in various market environments. We have traveled to visit the company numerous times and have met with managers in various positions, segments, and geographies. From our meetings, we have found management to be competent and focused on long-term shareholder value. Standard Chartered’s broad network across the developing world would be very difficult to replicate today. The company’s global payments and trade business is a particular strength: local roots from its longstanding presence allow for local currency funding, and cooperation across the network provides integrated wholesale banking services to clients. The bank is exposed to economic growth and increasing trade flows in emerging markets, where a growing entrepreneurial class wants to expand internationally.
We acknowledge the current risks and believe that Standard Chartered’s inexpensive valuation, coupled with its long-term growth opportunities, makes it an attractive investment. We substantially increased the Fund’s exposure to Standard Chartered during 2014. On December 31, Standard Chartered was a 2.4% position in the Fund.
Siam Commercial Bank
Siam Commercial Bank, the largest retail bank in Thailand, is a new addition to the Fund. During late 2013 and early 2014, Thailand lacked a functioning government, and the country’s stock market suffered. Siam Commercial’s stock was no exception, and its valuation declined to eight times forward earnings. During prior periods of political uncertainty, the Thai economy continued to grow, and Siam Commercial delivered an attractive return on shareholder’s equity and increased its book value per share.
As a part of our due diligence process for owning Kasikornbank in Thailand, we had closely followed Siam Commercial to understand the competitive landscape. After conducting additional in-depth research, we concluded that these political concerns provided us with a long-term investment opportunity at a low valuation. Siam Commercial’s leading positions in retail banking and
fee-related financial services provide it with a durable franchise. We believe that the company’s high return on equity—generated by a combination of stable net interest margins, high fee income, ample provisions, efficient operations, and moderate leverage—is sustainable over our investment horizon. Furthermore, we believe that Siam Commercial is well prepared to absorb economic volatility, given its high profitability, capital levels, and loan loss reserves. We have been impressed with management’s track record for profitable growth and improvement of the bank over time. After weighing these opportunities against the political risk, we initiated a position; Siam Commercial was a 0.6% holding in the Fund at year end.
IN CLOSING
We continue to see long-term opportunity for international equities as we look for attractively valued investments in both developed and emerging markets. International equity valuations remain reasonable: the MSCI EAFE traded at 14.0 times forward estimated earnings (compared to a 20-year average of 16.1 times) with a 3.1% dividend yield at quarter end. Corporate balance sheets and cash flows continue to be strong. The Fund is invested in companies that we believe have favorable long-term prospects over our three- to five-year investment horizon. Acknowledging that both share prices and currencies can be volatile in the short term, we encourage shareholders to remain focused on the long term.
Thank you for your continued confidence in our firm. As always, we welcome your comments and questions.
For the Board of Trustees,
| | |
| | |
Charles F. Pohl, Chairman | | Dana M. Emery, President |
January 27, 2015
| (a) | | The use of specific examples does not imply that they are more attractive investments than the Fund’s other holdings. |
| (b) | | Unless otherwise specified, all weightings and characteristics are as of December 31, 2014. |
DODGE & COX INTERNATIONAL STOCK FUND §PAGE 2
International Stock Fund Soft Close
On January 16, 2015, the Dodge & Cox International Stock Fund closed to new investors, with limited exceptions. Complete rules on eligibility to invest in the International Stock Fund are available in a supplement to the Fund’s prospectus, dated January 6, 2015.
We closed the International Stock Fund to new investors to proactively “tap the brakes” on the Fund’s growth. We believe this decision is in the best long-term interests of the Fund’s existing shareholders, as it allows us to have stable and balanced growth within the Fund. Over the past couple of years, the International Stock Fund experienced significant, but manageable asset flows. A meaningful portion of these flows came from existing shareholders, and we wanted to preserve their ability to continue to invest with us. Thus, current shareholders in the Fund will be able to make additional investments. We remain confident in our ability to continue to find and invest in attractive international opportunities with the assets entrusted to us.
Five of the six Dodge & Cox Funds (Stock Fund, Global Stock Fund, Balanced Fund, Income Fund, and Global Bond Fund) remain open to new investors.
ANNUAL PERFORMANCE REVIEW
The Fund outperformed the MSCI EAFE by 5.0 percentage points in 2014.
Key Contributors to Relative Results
| | § | | The Fund’s holdings in emerging markets (up 14%), particularly in the Financials sector (up 26%), significantly contributed to results. ICICI Bank (up 60%), Kasikornbank (up 47%), and China Mobile (up 24% since date of purchase) were notable performers. | |
| | § | | Strong returns from the Fund’s holdings in the Media industry (up 21% compared to up 1% for the MSCI EAFE industry) helped performance, especially Naspers (up 26%). | |
| | § | | The Fund’s average overweight position (16% versus 5%) and holdings in the Information Technology sector (up 10% compared to down 1% for the MSCI EAFE sector) aided results. Hewlett-Packard (up 46%) and Baidu (up 28%) were strong performers. | |
| | § | | Additional contributors included Yamaha Motor (up 38%), Nidec (up 35%), NGK Spark Plug (up 31%), and Novartis (up 19%). | |
Key Detractors from Relative Results
| | § | | The Fund’s average overweight position (15% versus 11%) and selection of holdings in the Health Care sector (down 3% compared to up 6% for the MSCI EAFE sector) hindered performance. GlaxoSmithKline (down 16%) and Sanofi (down 12%) performed poorly. | |
| | § | | The Fund’s underweight position in the Utilities sector (no holdings versus 4% for the MSCI EAFE sector), the second-strongest sector of the market (up 4%), hurt results. | |
| | § | | Additional detractors included Saipem (down 51%), Petrobras (down 46%), Standard Chartered (down 30%), and Millicom International Cellular (down 24%). | |
PAGE 3 § DODGE & COX INTERNATIONAL STOCK FUND
KEY CHARACTERISTICS OF DODGE & COX
Independent Organization
Dodge & Cox is one of the largest privately owned investment managers in the world. We remain committed to independence, with a goal of providing the highest quality investment management service to our existing clients.
Over 80 Years of Investment Experience
Dodge & Cox was founded in 1930. We have a stable and well-qualified team of investment professionals, most of whom have spent their entire careers at Dodge & Cox.
Experienced Investment Team
The International Investment Policy Committee, which is the decision-making body for the International Stock Fund, is an nine-member committee with an average tenure at Dodge & Cox of 24 years.
One Business with a Single Research Office
Dodge & Cox manages equity (domestic, international, and global), fixed income (domestic and global), and balanced investments, operating from one office in San Francisco.
Consistent Investment Approach
Our team decision-making process involves thorough, bottom-up fundamental analysis of each investment.
Long-Term Focus and Low Expenses
We invest with a three- to five-year investment horizon, which has historically resulted in low turnover relative to our peers. We manage Funds that maintain low expense ratios.
Risks: The Fund is subject to stock market risk, meaning stocks in the Fund may decline in value for extended periods due to the financial prospects of individual companies, or due to general market and economic conditions. Investing in non-U.S. securities may entail risk due to foreign economic and political developments; this risk may be increased when investing in emerging markets. The Fund is also subject to currency risk. Please read the prospectus and summary prospectus for specific details regarding the Fund’s risk profile.
DODGE & COX INTERNATIONAL STOCK FUND §PAGE 4
GROWTH OF $10,000 OVER 10 YEARS
FOR AN INVESTMENT MADE ON DECEMBER 31, 2004

AVERAGE ANNUAL TOTAL RETURN
FOR PERIODS ENDED DECEMBER 31, 2014
| | | | | | | | | | | | | | | | |
| | | 1 Year | | | 3 Years | | | 5 Years | | | 10 Years | |
Dodge & Cox International
Stock Fund | | | 0.07 | % | | | 15.23 | % | | | 7.89 | % | | | 6.73 | % |
MSCI EAFE | | | -4.90 | | | | 11.06 | | | | 5.34 | | | | 4.43 | |
Returns represent past performance and do not guarantee future results. Investment return and share price will fluctuate with market conditions, and investors may have a gain or loss when shares are sold. Fund performance changes over time and currently may be significantly lower than stated. Performance is updated and published monthly. Visit the Fund’s website at www.dodgeandcox.com or call 800-621-3979 for current performance figures.
The Fund’s total returns include the reinvestment of dividend and capital gain distributions, but have not been adjusted for any income taxes payable by shareholders on these distributions or on Fund share redemptions. Index returns include dividends but, unlike Fund returns, do not reflect fees or expenses. The MSCI EAFE (Europe, Australasia, Far East) Index is a broad-based, unmanaged equity market index aggregated from 21 developed market country indices, excluding the United States and Canada. MSCI makes no express or implied warranties or representations and shall have no liability whatsoever with respect to any MSCI data contained herein. The MSCI data may not be further redistributed or used as a basis for other indices or any securities or financial products. This report is not approved, reviewed, or produced by MSCI.
MSCI EAFE is a service mark of MSCI Barra.
FUND EXPENSE EXAMPLE
As a Fund shareholder, you incur ongoing Fund costs, including management fees and other Fund expenses. All mutual funds have ongoing costs, sometimes referred to as operating expenses. The following example shows ongoing costs of investing in the Fund and can help you understand these costs and compare them with those of other mutual funds. The example assumes a $1,000 investment held for the six months indicated.
ACTUAL EXPENSES
The first line of the table below provides information about actual account values and expenses based on the Fund’s actual returns. You may use the information in this line, together with your account balance, to estimate the expenses that you paid over the period. Simply divide your account value by $1,000 (for example, an $8,600 account value divided by $1,000 = 8.6), then multiply the result by the number in the first line under the heading “Expenses Paid During Period” to estimate the expenses you paid on your account during this period.
HYPOTHETICAL EXAMPLE FOR COMPARISON WITH OTHER MUTUAL FUNDS
Information on the second line of the table can help you compare ongoing costs of investing in the Fund with those of other mutual funds. This information may not be used to estimate the actual ending account balance or expenses you paid during the period. The hypothetical “Ending Account Value” is based on the actual expense ratio of the Fund and an assumed 5% annual rate of return before expenses (not the Fund’s actual return). The amount under the heading “Expense Paid During the Period” shows the hypothetical expenses your account would have incurred under this scenario. You can compare this figure with the 5% hypothetical examples that appear in shareholder reports of other mutual funds.
| | | | | | | | | | | | |
Six Months Ended December 31, 2014 | | Beginning Account Value
7/1/2014 | | | Ending Account Value
12/31/2014 | | | Expenses Paid During Period* | |
Based on Actual Fund Return | | $ | 1,000.00 | | | $ | 927.50 | | | $ | 3.10 | |
Based on Hypothetical 5% Yearly Return | | | 1,000.00 | | | | 1,021.99 | | | | 3.25 | |
| * | Expenses are equal to the Fund’s annualized expense ratio of 0.64%, multiplied by the average account value over the period, multiplied by 184/365 (to reflect the one-half year period). |
The expenses shown in the table highlight ongoing costs only and do not reflect any transactional fees or account maintenance fees. Though other mutual funds may charge such fees, please note that the Fund does not charge transaction fees (e.g., redemption fees, sales loads) or universal account maintenance fees (e.g., small account fees).
PAGE 5 § DODGE & COX INTERNATIONAL STOCK FUND
| | | | |
| FUND INFORMATION | | | December 31, 2014 | |
| | | | |
| GENERAL INFORMATION | | | |
Net Asset Value Per Share | | | $42.11 | |
Total Net Assets (billions) | | | $64.0 | |
Expense Ratio | | | 0.64% | |
Portfolio Turnover Rate | | | 12% | |
30-Day SEC Yield(a) | | | 1.59% | |
Fund Inception | | | 2001 | |
No sales charges or distribution fees | | | | |
Investment Manager: Dodge & Cox, San Francisco. Managed by the International Investment Policy Committee, whose nine members’ average tenure at Dodge & Cox is 24 years.
| | | | | | | | |
| PORTFOLIO CHARACTERISTICS | | Fund | | | MSCI
EAFE | |
Number of Equity Securities | | | 80 | | | | 910 | |
Median Market Capitalization (billions) | | | $27 | | | | $9 | |
Weighted Average Market Capitalization (billions) | | | $69 | | | | $57 | |
Price-to-Earnings Ratio(b) | | | 13.3x | | | | 14.0x | |
Countries Represented | | | 24 | | | | 21 | |
Emerging Markets (Brazil, China, India, Mexico, South Africa, South Korea, Thailand, Turkey, United Arab Emirates) | | | 22.4% | | | | 0.0% | |
| | | | |
| TEN LARGEST HOLDINGS (%)(c) | | Fund | |
Naspers, Ltd. (South Africa) | | | 3.9 | |
Novartis AG (Switzerland) | | | 3.5 | |
Roche Holding AG (Switzerland) | | | 3.3 | |
Sanofi (France) | | | 2.8 | |
Samsung Electronics Co., Ltd. (South Korea) | | | 2.8 | |
Hewlett-Packard Co. (United States) | | | 2.4 | |
Standard Chartered PLC (United Kingdom) | | | 2.4 | |
Schlumberger, Ltd. (United States) | | | 2.4 | |
Lafarge SA (France) | | | 2.2 | |
Credit Suisse Group AG (Switzerland) | | | 2.2 | |
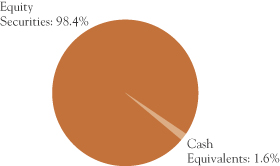
| | | | | | | | |
| REGION DIVERSIFICATION (%)(d) | | Fund | | | MSCI
EAFE | |
Europe (excluding United Kingdom) | | | 43.0 | | | | 44.8 | |
United Kingdom | | | 15.8 | | | | 21.1 | |
Japan | | | 12.3 | | | | 21.2 | |
Pacific (excluding Japan) | | | 11.4 | | | | 12.3 | |
Africa/Middle East | | | 6.2 | | | | 0.6 | |
United States | | | 5.2 | | | | 0.0 | |
Latin America | | | 4.5 | | | | 0.0 | |
| | | | | | | | |
| SECTOR DIVERSIFICATION (%) | | Fund | | | MSCI
EAFE | |
Financials | | | 27.0 | | | | 25.9 | |
Information Technology | | | 16.2 | | | | 4.8 | |
Consumer Discretionary | | | 14.7 | | | | 12.4 | |
Health Care | | | 13.1 | | | | 11.0 | |
Industrials | | | 8.3 | | | | 12.6 | |
Telecommunication Services | | | 5.9 | | | | 5.0 | |
Energy | | | 5.6 | | | | 5.7 | |
Materials | | | 4.5 | | | | 7.6 | |
Consumer Staples | | | 3.1 | | | | 11.1 | |
Utilities | | | 0.0 | | | | 3.9 | |
| (a) | SEC Yield is an annualization of the Fund’s total net investment income per share for the 30-day period ended on the last day of the month. |
| (b) | Price-to-earnings (P/E) ratios are calculated using 12-month forward earnings estimates from third-party sources. |
| (c) | The Fund’s portfolio holdings are subject to change without notice. The mention of specific securities is not a recommendation to buy, sell, or hold any particular security and is not indicative of Dodge & Cox’s current or future trading activity. |
| (d) | The Fund may classify a company in a different category than the MSCI EAFE. The Fund generally classifies a company based on its country of incorporation, but may designate a different country in certain circumstances. |
DODGE & COX INTERNATIONAL STOCK FUND §PAGE 6
| | | | |
| CONSOLIDATED PORTFOLIO OF INVESTMENTS | | | December 31, 2014 | |
| | | | | | | | |
| COMMON STOCKS: 95.7% | |
| | |
| | | SHARES | | | VALUE | |
| CONSUMER DISCRETIONARY: 14.7% | |
AUTOMOBILES & COMPONENTS: 5.7% | | | | | |
Bayerische Motoren Werke AG (Germany) | | | 8,676,300 | | | $ | 942,279,396 | |
Honda Motor Co., Ltd. (Japan) | | | 18,239,600 | | | | 530,402,048 | |
Honda Motor Co., Ltd. ADR (Japan) | | | 6,758,400 | | | | 199,507,968 | |
Mahindra & Mahindra, Ltd. (India) | | | 13,923,429 | | | | 271,189,489 | |
NGK Spark Plug Co., Ltd.(b) (Japan) | | | 14,009,700 | | | | 423,054,875 | |
Nissan Motor Co., Ltd. (Japan) | | | 74,457,100 | | | | 648,539,435 | |
Yamaha Motor Co., Ltd.(b) (Japan) | | | 31,550,100 | | | | 634,516,458 | |
| | | | | | | | |
| | | | | | | 3,649,489,669 | |
CONSUMER DURABLES & APPAREL: 1.4% | |
Panasonic Corp. (Japan) | | | 77,951,134 | | | | 915,822,368 | |
| | |
CONSUMER SERVICES: 0.2% | | | | | | | | |
New Oriental Education & Technology Group, Inc. ADR(a) (Cayman Islands/China) | | | 5,733,700 | | | | 117,024,817 | |
| | |
MEDIA: 7.4% | | | | | | | | |
Grupo Televisa SAB ADR (Mexico) | | | 21,265,992 | | | | 724,319,687 | |
Liberty Global PLC, Series A(a) (United Kingdom) | | | 11,043,805 | | | | 554,454,230 | |
Liberty Global PLC, Series C(a) (United Kingdom) | | | 14,903,247 | | | | 719,975,863 | |
Naspers, Ltd. (South Africa) | | | 19,421,895 | | | | 2,500,530,817 | |
Television Broadcasts, Ltd.(b) (Hong Kong) | | | 40,022,900 | | | | 232,319,948 | |
| | | | | | | | |
| | | | | | | 4,731,600,545 | |
| | | | | | | | |
| | | | | | | 9,413,937,399 | |
| CONSUMER STAPLES: 3.1% | | | | | | | | |
FOOD, BEVERAGE & TOBACCO: 3.1% | |
Anadolu Efes Biracilik ve Malt Sanayii AS(a) (Turkey) | | | 28,262,444 | | | | 274,690,641 | |
Imperial Tobacco Group PLC (United Kingdom) | | | 22,874,300 | | | | 1,001,737,550 | |
Unilever PLC (United Kingdom) | | | 17,987,500 | | | | 730,665,970 | |
| | | | | | | | |
| | | | | | | 2,007,094,161 | |
| ENERGY: 4.9% | | | | | | | | |
Royal Dutch Shell PLC ADR (United Kingdom) | | | 8,052,716 | | | | 539,129,336 | |
Saipem SPA(a),(b) (Italy) | | | 35,889,000 | | | | 376,917,360 | |
Schlumberger, Ltd. (Curacao/United States) | | | 17,582,117 | | | | 1,501,688,613 | |
Total SA (France) | | | 6,524,600 | | | | 336,403,333 | |
Weatherford International PLC(a) (Ireland) | | | 31,817,592 | | | | 364,311,428 | |
| | | | | | | | |
| | | | | | | 3,118,450,070 | |
| | | | | | | | |
| | |
| | | SHARES | | | VALUE | |
| FINANCIALS: 25.7% | | | | | | | | |
BANKS: 16.8% | | | | | | | | |
Banco Santander SA (Spain) | | | 54,541,604 | | | $ | 456,067,313 | |
Barclays PLC (United Kingdom) | | | 361,753,502 | | | | 1,360,013,441 | |
BNP Paribas SA (France) | | | 17,056,007 | | | | 1,002,284,092 | |
HSBC Holdings PLC (United Kingdom) | | | 88,737,229 | | | | 838,609,627 | |
ICICI Bank, Ltd. (India) | | | 216,633,785 | | | | 1,200,332,514 | |
Kasikornbank PCL- Foreign(b) (Thailand) | | | 123,826,527 | | | | 860,405,220 | |
Lloyds Banking Group PLC(a) (United Kingdom) | | | 798,341,600 | | | | 942,734,693 | |
Mitsubishi UFJ Financial Group, Inc. (Japan) | | | 116,265,800 | | | | 637,269,483 | |
Siam Commercial Bank PCL- Foreign (Thailand) | | | 66,952,500 | | | | 369,905,525 | |
Standard Bank Group, Ltd. (South Africa) | | | 28,198,309 | | | | 346,538,537 | |
Standard Chartered PLC (United Kingdom) | | | 102,660,839 | | | | 1,539,605,051 | |
UniCredit SPA (Italy) | | | 112,234,764 | | | | 715,329,235 | |
Yapi ve Kredi Bankasi AS(b) (Turkey) | | | 234,711,168 | | | | 487,571,771 | |
| | | | | | | | |
| | | | | | | 10,756,666,502 | |
DIVERSIFIED FINANCIALS: 3.3% | | | | | | | | |
Credit Suisse Group AG (Switzerland) | | | 54,969,105 | | | | 1,378,010,829 | |
Deutsche Boerse AG (Germany) | | | 5,992,000 | | | | 429,410,952 | |
Haci Omer Sabanci Holding AS (Turkey) | | | 75,195,354 | | | | 326,673,638 | |
| | | | | | | | |
| | | | | | | 2,134,095,419 | |
INSURANCE: 4.1% | | | | | | | | |
AEGON NV(b) (Netherlands) | | | 125,227,471 | | | | 939,582,134 | |
Aviva PLC (United Kingdom) | | | 74,574,301 | | | | 558,797,872 | |
Dai-ichi Life Insurance Co., Ltd. (Japan) | | | 28,746,900 | | | | 436,225,847 | |
Swiss Re AG (Switzerland) | | | 7,852,668 | | | | 657,058,694 | |
| | | | | | | | |
| | | | | | | 2,591,664,547 | |
REAL ESTATE: 1.5% | | | | | | | | |
BR Malls Participacoes SA(b) (Brazil) | | | 54,870,300 | | | | 335,515,164 | |
Hang Lung Group, Ltd.(b) (Hong Kong) | | | 90,430,600 | | | | 408,947,624 | |
Hang Lung Properties, Ltd. (Hong Kong) | | | 84,171,400 | | | | 234,576,286 | |
| | | | | | | | |
| | | | | | | 979,039,074 | |
| | | | | | | | |
| | | | | | | 16,461,465,542 | |
| | |
| PAGE 7 § DODGE & COX INTERNATIONAL STOCK FUND | | See accompanying Notes to Consolidated Financial Statements |
| | | | |
| CONSOLIDATED PORTFOLIO OF INVESTMENTS | | | December 31, 2014 | |
| | | | | | | | |
| COMMON STOCKS (continued) | |
| | |
| | | SHARES | | | VALUE | |
| HEALTH CARE: 13.1% | | | | | | | | |
PHARMACEUTICALS, BIOTECHNOLOGY & LIFE SCIENCES: 13.1% | |
Bayer AG (Germany) | | | 9,847,650 | | | $ | 1,346,266,506 | |
GlaxoSmithKline PLC (United Kingdom) | | | 28,895,000 | | | | 618,209,993 | |
GlaxoSmithKline PLC ADR (United Kingdom) | | | 5,459,749 | | | | 233,349,672 | |
Novartis AG (Switzerland) | | | 7,965,570 | | | | 732,573,427 | |
Novartis AG ADR (Switzerland) | | | 16,305,000 | | | | 1,510,821,300 | |
Roche Holding AG (Switzerland) | | | 7,782,400 | | | | 2,109,345,305 | |
Sanofi (France) | | | 20,130,722 | | | | 1,834,631,969 | |
| | | | | | | | |
| | | | | | | 8,385,198,172 | |
| INDUSTRIALS: 8.3% | | | | | | | | |
CAPITAL GOODS: 6.6% | | | | | | | | |
Koninklijke Philips NV (Netherlands) | | | 44,346,081 | | | | 1,287,595,576 | |
Mitsubishi Electric Corp. (Japan) | | | 62,004,100 | | | | 738,222,785 | |
Nidec Corp.(b) (Japan) | | | 9,554,800 | | | | 619,748,341 | |
Schneider Electric SA (France) | | | 14,831,746 | | | | 1,077,702,197 | |
Smiths Group PLC(b) (United Kingdom) | | | 26,840,600 | | | | 454,280,003 | |
Wienerberger AG(b) (Austria) | | | 4,135,764 | | | | 56,973,706 | |
| | | | | | | | |
| | | | | | | 4,234,522,608 | |
COMMERCIAL & PROFESSIONAL SERVICES: 1.4% | |
ADT Corp. (United States) | | | 7,476,860 | | | | 270,886,638 | |
Tyco International PLC (Ireland) | | | 14,848,620 | | | | 651,260,473 | |
| | | | | | | | |
| | | | | | | 922,147,111 | |
TRANSPORTATION: 0.3% | | | | | | | | |
DP World, Ltd. (United Arab Emirates) | | | 8,256,304 | | | | 173,382,384 | |
| | | | | | | | |
| | | | | | | 5,330,052,103 | |
| INFORMATION TECHNOLOGY: 15.5% | |
SEMICONDUCTORS & SEMICONDUCTOR EQUIPMENT: 3.3% | |
Infineon Technologies AG(b) (Germany) | | | 66,414,456 | | | | 712,032,433 | |
Samsung Electronics Co., Ltd. (South Korea) | | | 1,153,792 | | | | 1,386,918,040 | |
| | | | | | | | |
| | | | | | | 2,098,950,473 | |
SOFTWARE & SERVICES: 2.6% | | | | | | | | |
Baidu, Inc. ADR(a) (Cayman Islands/China) | | | 3,543,387 | | | | 807,785,934 | |
Fujitsu, Ltd.(b) (Japan) | | | 59,312,900 | | | | 315,951,657 | |
Nintendo Co., Ltd. (Japan) | | | 5,276,200 | | | | 549,892,385 | |
| | | | | | | | |
| | | | | | | 1,673,629,976 | |
TECHNOLOGY, HARDWARE & EQUIPMENT: 9.6% | |
Brother Industries, Ltd.(b) (Japan) | | | 18,185,100 | | | | 329,927,874 | |
Hewlett-Packard Co. (United States) | | | 38,986,504 | | | | 1,564,528,406 | |
Kyocera Corp.(b) (Japan) | | | 20,248,000 | | | | 928,042,771 | |
Nokia Oyj (Finland) | | | 148,011,000 | | | | 1,164,925,833 | |
TE Connectivity, Ltd. (Switzerland) | | | 13,646,362 | | | | 863,132,396 | |
Telefonaktiebolaget LM Ericsson (Sweden) | | | 109,599,300 | | | | 1,327,350,303 | |
| | | | | | | | |
| | | | | | | 6,177,907,583 | |
| | | | | | | | |
| | | | | | | 9,950,488,032 | |
| | | | | | | | |
| | |
| | | SHARES | | | VALUE | |
| MATERIALS: 4.5% | |
Akzo Nobel NV (Netherlands) | | | 6,231,893 | | | $ | 432,148,583 | |
Lafarge SA(b) (France) | | | 20,035,291 | | | | 1,406,163,778 | |
Lanxess AG (Germany) | | | 4,539,680 | | | | 211,200,738 | |
Linde AG (Germany) | | | 4,498,205 | | | | 839,004,156 | |
| | | | | | | | |
| | | | | | | 2,888,517,255 | |
| TELECOMMUNICATION SERVICES: 5.9% | |
America Movil SAB de CV, Series L (Mexico) | | | 515,662,100 | | | | 574,598,656 | |
Bharti Airtel, Ltd. (India) | | | 42,077,904 | | | | 233,460,489 | |
China Mobile, Ltd.
(Hong Kong/China) | | | 63,278,900 | | | | 745,019,835 | |
Millicom International Cellular SA SDR(b) (Luxembourg) | | | 10,088,392 | | | | 750,282,272 | |
MTN Group, Ltd. (South Africa) | | | 49,559,500 | | | | 940,480,021 | |
Telecom Italia SPA(a) (Italy) | | | 201,500,000 | | | | 213,694,669 | |
Telecom Italia SPA- RSP (Italy) | | | 352,735,486 | | | | 294,828,633 | |
| | | | | | | | |
| | | | | | | 3,752,364,575 | |
| | | | | | | | |
TOTAL COMMON STOCKS
(Cost $56,064,743,237) | | | | | | $ | 61,307,567,309 | |
|
| PREFERRED STOCKS: 2.7% | |
| ENERGY: 0.7% | |
Petroleo Brasileiro SA ADR (Brazil) | | | 58,383,858 | | | | 442,549,644 | |
|
| FINANCIALS: 1.3% | |
BANKS: 1.3% | |
Itau Unibanco Holding SA (Brazil) | | | 63,626,350 | | | | 827,296,027 | |
|
| INFORMATION TECHNOLOGY: 0.7% | |
SEMICONDUCTORS & SEMICONDUCTOR EQUIPMENT: 0.7% | |
Samsung Electronics Co., Ltd. (South Korea) | | | 467,787 | | | | 437,707,086 | |
| | | | | | | | |
TOTAL PREFERRED STOCKS
(Cost $2,156,781,074) | | | $ | 1,707,552,757 | |
| | |
| See accompanying Notes to Consolidated Financial Statements | | DODGE & COX INTERNATIONAL STOCK FUND §PAGE 8 |
| | | | |
| CONSOLIDATED PORTFOLIO OF INVESTMENTS | | | December 31, 2014 | |
| | | | | | | | |
| SHORT-TERM INVESTMENTS: 1.4% | |
| | |
| | | PAR VALUE | | | VALUE | |
MONEY MARKET FUND: 0.1% | |
SSgA U.S. Treasury Money
Market Fund | | $ | 64,410,932 | | | $ | 64,410,932 | |
| |
REPURCHASE AGREEMENT: 1.3% | | | | | |
Fixed Income Clearing Corporation(c) 0.01%, dated 12/31/14, due 1/2/15, maturity value $852,264,473 | | | 852,264,000 | | | | 852,264,000 | |
| | | | | | | | |
TOTAL SHORT-TERM INVESTMENTS
(Cost $916,674,932) | | | $ | 916,674,932 | |
| | | | | | | | |
TOTAL INVESTMENTS
(Cost $59,138,199,243) | | | 99.8 | % | | $ | 63,931,794,998 | |
OTHER ASSETS LESS LIABILITIES | | | 0.2 | % | | | 107,961,246 | |
| | | | | | | | |
| NET ASSETS | | | 100.0 | % | | $ | 64,039,756,244 | |
| | | | | | | | |
| (b) | See Note 10 regarding holdings of 5% voting securities |
| (c) | Repurchase agreement is collateralized by U.S. Treasury Note 1.25%-3.125%, 10/31/18-5/15/19. Total collateral value is $869,313,082. |
In determining a company’s country designation, the Fund generally references the country of incorporation. In cases where the Fund considers the country of incorporation to be a “jurisdiction of convenience” chosen primarily for tax purposes, the Fund uses the country designation of an appropriate broad-based market index. In that circumstance, two countries are listed - the country of incorporation and the country designated by an appropriate index, respectively.
ADR: American Depositary Receipt
SDR: Swedish Depository Receipt
FORWARD CURRENCY CONTRACTS
| | | | | | | | | | | | | | | | |
| | | | | | Contract Amount | | | | |
| Counterparty | | Settlement
Date | | | Receive U.S. Dollar | | | Deliver
Foreign
Currency | | | Unrealized
Appreciation/
(Depreciation) | |
Contracts to sell EUR: | | | | | |
JPMorgan | | | 2/11/15 | | | | 623,007,500 | | | | 500,000,000 | | | $ | 17,753,480 | |
UBS | | | 2/11/15 | | | | 622,155,000 | | | | 500,000,000 | | | | 16,900,980 | |
Credit Suisse | | | 2/18/15 | | | | 622,878,500 | | | | 500,000,000 | | | | 17,590,733 | |
Deutsche Bank | | | 3/11/15 | | | | 615,664,500 | | | | 500,000,000 | | | | 10,274,410 | |
Barclays | | | 3/18/15 | | | | 622,137,500 | | | | 500,000,000 | | | | 16,712,414 | |
HSBC | | | 3/18/15 | | | | 373,365,000 | | | | 300,000,000 | | | | 10,109,949 | |
| | | | |
| Counterparty | | Settlement
Date | | | Deliver
U.S. Dollar | | | Receive
Foreign
Currency | | | Unrealized
Appreciation /
(Depreciation) | |
Contracts to buy EUR: | | | | | |
UBS | | | 2/11/15 | | | | 612,000,000 | | | | 500,000,000 | | | $ | (6,745,980 | ) |
| | | | | | | | | | | | | | | | |
| | | | | | | | | | | | | | $ | 82,595,986 | |
| | | | | | | | | | | | | | | | |
| | |
| PAGE 9 § DODGE & COX INTERNATIONAL STOCK FUND | | See accompanying Notes to Consolidated Financial Statements |
| | | | |
CONSOLIDATED STATEMENT OF ASSETS AND LIABILITIES | |
| |
| | | December 31, 2014 | |
ASSETS: | | | | |
Investments, at value | | | | |
Unaffiliated issuers (cost $49,943,561,684) | | $ | 54,652,235,313 | |
Affiliated issuers (cost $9,194,637,559) | | | 9,279,559,685 | |
| | | | |
| | | 63,931,794,998 | |
Cash | | | 100 | |
Cash denominated in foreign currency (cost $17,218,099) | | | 16,942,271 | |
Receivable for investments sold | | | 24,311,771 | |
Unrealized appreciation on forward currency contracts | | | 89,341,966 | |
Receivable for Fund shares sold | | | 205,490,882 | |
Dividends and interest receivable | | | 96,719,118 | |
Prepaid expenses and other assets | | | 316,804 | |
| | | | |
| | | 64,364,917,910 | |
| | | | |
LIABILITIES: | | | | |
Payable for investments purchased | | | 73,454,072 | |
Unrealized depreciation on forward currency contracts | | | 6,745,980 | |
Payable for Fund shares redeemed | | | 206,635,476 | |
Management fees payable | | | 32,892,033 | |
Accrued expenses | | | 5,434,105 | |
| | | | |
| | | 325,161,666 | |
| | | | |
NET ASSETS | | $ | 64,039,756,244 | |
| | | | |
NET ASSETS CONSIST OF: | | | | |
Paid in capital | | $ | 62,477,524,064 | |
Undistributed net investment income | | | 9,485,734 | |
Accumulated net realized loss | | | (3,323,201,361 | ) |
Net unrealized appreciation | | | 4,875,947,807 | |
| | | | |
| | | 64,039,756,244 | |
| | | | |
Fund shares outstanding (par value $0.01 each, unlimited shares authorized) | | | 1,520,738,809 | |
Net asset value per share | | $ | 42.11 | |
|
CONSOLIDATED STATEMENT OF OPERATIONS | |
| |
| | | Year Ended
December 31, 2014 | |
INVESTMENT INCOME: | | | | |
Dividends (net of foreign taxes of $118,202,887) | | | | |
Unaffiliated issuers | | $ | 1,662,972,217 | |
Affiliated issuers | | | 178,738,563 | |
Interest | | | 105,770 | |
| | | | |
| | | 1,841,816,550 | |
| | | | |
EXPENSES: | | | | |
Management fees | | | 363,818,941 | |
Custody and fund accounting fees | | | 8,898,982 | |
Transfer agent fees | | | 8,351,408 | |
Professional services | | | 584,730 | |
Shareholder reports | | | 1,735,258 | |
Proxy expenses | | | 2,535,349 | |
Registration fees | | | 2,023,960 | |
Trustees’ fees | | | 258,073 | |
Miscellaneous | | | 2,061,465 | |
| | | | |
| | | 390,268,166 | |
| | | | |
NET INVESTMENT INCOME | | | 1,451,548,384 | |
| | | | |
| |
REALIZED AND UNREALIZED GAIN (LOSS): | | | | |
Net realized gain (loss) | | | | |
Investments in unaffiliated issuers | | | 1,345,973,094 | |
Investments in affiliated issuers | | | 266,021,236 | |
Forward currency contracts | | | 417,930,078 | |
Foreign currency transactions | | | (10,372,586 | ) |
Net change in unrealized appreciation/depreciation | | | | |
Investments | | | (3,986,837,036 | ) |
Forward currency contracts | | | 115,501,784 | |
Foreign currency translation | | | (2,716,244 | ) |
| | | | |
Net realized and unrealized loss | | | (1,854,499,674 | ) |
| | | | |
NET DECREASE IN NET ASSETS
FROM OPERATIONS | | $ | (402,951,290 | ) |
| | | | |
| | | | |
CONSOLIDATED STATEMENT OF CHANGES IN NET ASSETS |
| | | | | | | | |
| | |
| | | Year Ended
December 31, 2014 | | | Year Ended
December 31, 2013 | |
OPERATIONS: | | | | | | | | |
Net investment income | | $ | 1,451,548,384 | | | $ | 857,085,157 | |
Net realized gain | | | 2,019,551,822 | | | | 1,263,721,541 | |
Net change in unrealized appreciation/depreciation | | | (3,874,051,496 | ) | | | 8,796,530,991 | |
| | | | | | | | |
| | | (402,951,290 | ) | | | 10,917,337,689 | |
| | | | | | | | |
| |
DISTRIBUTIONS TO
SHAREHOLDERS FROM: | | | | | |
Net investment income | | | (1,440,251,048 | ) | | | (852,149,250 | ) |
Net realized gain | | | — | | | | — | |
| | | | | | | | |
Total distributions | | | (1,440,251,048 | ) | | | (852,149,250 | ) |
| | | | | | | | |
| | |
FUND SHARE TRANSACTIONS: | | | | | | | | |
Proceeds from sale of shares | | | 19,083,592,819 | | | | 9,707,933,665 | |
Reinvestment of distributions | | | 1,176,502,813 | | | | 718,344,743 | |
Cost of shares redeemed | | | (7,993,354,008 | ) | | | (7,431,440,582 | ) |
| | | | | | | | |
Net increase from Fund share transactions | | | 12,266,741,624 | | | | 2,994,837,826 | |
| | | | | | | | |
Total increase in net assets | | | 10,423,539,286 | | | | 13,060,026,265 | |
| | |
NET ASSETS: | | | | | | | | |
Beginning of year | | | 53,616,216,958 | | | | 40,556,190,693 | |
| | | | | | | | |
End of year (including undistributed net investment income of $9,485,734 and $8,560,984, respectively) | | $ | 64,039,756,244 | | | $ | 53,616,216,958 | |
| | | | | | | | |
| | |
SHARE INFORMATION: | | | | | | | | |
Shares sold | | | 427,948,359 | | | | 250,919,903 | |
Distributions reinvested | | | 27,741,165 | | | | 17,172,926 | |
Shares redeemed | | | (180,756,140 | ) | | | (193,199,816 | ) |
| | | | | | | | |
Net increase in shares outstanding | | | 274,933,384 | | | | 74,893,013 | |
| | | | | | | | |
| | |
| See accompanying Notes to Consolidated Financial Statements | | DODGE & COX INTERNATIONAL STOCK FUND §PAGE 10 |
NOTES TO CONSOLIDATED FINANCIAL STATEMENTS
NOTE 1—ORGANIZATION AND SIGNIFICANT ACCOUNTING POLICIES
Dodge & Cox International Stock Fund (the “Fund”) is one of the series constituting the Dodge & Cox Funds (the “Trust” or the “Funds”). The Trust is organized as a Delaware statutory trust and is registered under the Investment Company Act of 1940, as amended, as an open-end management investment company. The Fund commenced operations on May 1, 2001, and seeks long-term growth of principal and income. The Fund invests primarily in a diversified portfolio of foreign equity securities. Foreign investing, especially in developing countries, has special risks such as currency and market volatility and political and social instability. These and other risk considerations are discussed in the Fund’s Prospectus.
The financial statements have been prepared in conformity with accounting principles generally accepted in the United States of America, which require the use of estimates and assumptions by management. Actual results may differ from those estimates. Significant accounting policies are as follows:
Security valuation The Fund’s net assets are valued as of the close of trading on the New York Stock Exchange (NYSE), generally 4:00 p.m. Eastern Time, each day that the NYSE is open for business. Portfolio securities and other financial instruments for which market quotes are readily available are valued at market value. Listed securities are generally valued using the official quoted close price or the last sale on the exchange that is determined to be the primary market for the security. Security values are not discounted based on the size of the Fund’s position. Short-term securities less than 60 days to maturity may be valued at amortized cost if amortized cost approximates current value.
Investments initially valued in currencies other than the U.S. dollar are converted to the U.S. dollar using prevailing exchange rates. As a result, the Fund’s net assets may be affected by changes in the value of currencies in relation to the U.S. dollar.
If market quotations are not readily available or if a security’s value has materially changed after the close of the security’s primary market but before the close of trading on the NYSE, the security is valued at fair value as determined in good faith by or under the direction of the
Board of Trustees. The Fund may use fair value pricing in calculating its net asset value per share (NAV) when, for example, (i) the primary market for a security is closed or if trading of a security is suspended or limited, (ii) the Fund determines that the price provided by a pricing service is inaccurate or unreliable, or (iii) the Fund determines that a significant event affecting the value of a security has occurred before the close of the NYSE but after the close of the security’s primary market. An event is considered significant if there is both an affirmative expectation that the security’s value will materially change in response to the event and a reasonable basis exists for quantifying a resulting change in value. Because trading in securities on most foreign exchanges is normally completed before the close of the NYSE, the value of non-U.S. securities can change by the time the Fund calculates its NAV. To address these changes, the Fund may utilize adjustment factors provided by an independent pricing service to systematically value non-U.S. securities at fair value. These adjustment factors are based on statistical analyses of subsequent movements and changes in securities indices, specific security prices, and exchange rates in foreign markets.
The Board of Trustees has delegated authority to Dodge & Cox, the Fund’s investment manager, to make fair value determinations in accordance with the Dodge & Cox Funds Valuation Policies (“Valuation Policies”), subject to Board oversight. Dodge & Cox has established a Pricing Committee that is comprised of representatives from Treasury, Legal, Compliance, and Operations. The Pricing Committee is responsible for implementing the Valuation Policies, including determining the fair value of securities when market quotations or market-based valuations are not readily available or are deemed unreliable. The Pricing Committee considers relevant indications of value that are reasonably available to it in determining the fair value assigned to a particular security, such as the value of similar financial instruments, trading volumes, contractual restrictions on disposition, related corporate actions, and changes in economic conditions.
Valuing securities at fair value involves greater reliance on judgment than valuation of securities based on readily available market quotations. In some instances, lack of information and uncertainty as to the significance of
PAGE 11 § DODGE & COX INTERNATIONAL STOCK FUND
NOTES TO CONSOLIDATED FINANCIAL STATEMENTS
information may lead to a conclusion that a prior valuation is the best indication of a security’s present value. When fair value pricing is employed, the prices of securities used by the Fund to calculate its net asset value may differ from quoted or published prices for the same securities.
Security transactions, investment income, expenses, and distributions Security transactions are recorded on the trade date. Realized gains and losses on securities sold are determined on the basis of identified cost.
Dividend income and corporate action transactions are recorded on the ex-dividend date, or when the Fund first learns of the dividend/corporate action if the ex-dividend date has passed. Non-cash dividends included in dividend income, if any, are recorded at the fair market value of the securities received. Dividends characterized as return of capital for U.S. tax purposes are recorded as a reduction of cost of investments and/or realized gain. Interest income is recorded on the accrual basis.
Expenses are recorded on the accrual basis. Most expenses of the Trust can be directly attributed to a specific series. Expenses which cannot be directly attributed are allocated among the Funds in the Trust based on relative net assets or other expense methodologies determined by the nature of the expense.
Distributions to shareholders are recorded on the ex-dividend date.
Foreign taxes The Fund is subject to foreign taxes which may be imposed by certain countries in which the Fund invests. The Fund endeavors to record foreign taxes based on applicable foreign tax law. Withholding taxes are incurred on certain foreign dividends and are accrued at the time the associated dividend is recorded. The Fund files withholding tax reclaims in certain jurisdictions to recover a portion of amounts previously withheld. The Fund records a reclaim receivable based on, among other things, a jurisdiction’s legal obligation to pay reclaims as well as payment history and market convention. In consideration of recent decisions rendered by European courts, the Fund has filed for additional reclaims related to prior years. However, a corresponding receivable amount has not yet been recorded because there is limited historical precedent for collecting such reclaims and the amount, if any, that the Fund might ultimately recover is uncertain. Such amounts, if and when recorded, could
result in an increase in the Fund’s net asset value per share.
Capital gains taxes are incurred upon disposition of certain foreign securities. Capital gains taxes on appreciated securities are accrued as unrealized losses and are reflected as realized losses upon the sale of the related security. Currency taxes may be incurred when the Fund purchases certain foreign currencies related to securities transactions and are recorded as realized losses on foreign currency transactions.
Repurchase agreements The Fund enters into repurchase agreements, secured by U.S. government or agency securities, which involve the purchase of securities from a counterparty with a simultaneous commitment to resell the securities at an agreed-upon date and price. It is the Fund’s policy that its custodian take possession of the underlying collateral securities, the fair value of which exceeds the principal amount of the repurchase transaction, including accrued interest, at all times. In the event of default by the counterparty, the Fund has the contractual right to liquidate the collateral securities and to apply the proceeds in satisfaction of the obligation.
Forward currency contracts A forward currency contract represents an obligation to purchase or sell a specific foreign currency at a future date at a price set at the time of the contract. Losses from these transactions may arise from unfavorable changes in currency values or if the counterparties do not perform under a contract’s terms.
The values of the forward currency contracts are adjusted daily based on the applicable exchange rate of the underlying currency. Changes in the value of open contracts are recorded as unrealized appreciation or depreciation in the Consolidated Statement of Operations. When the forward currency contract is closed, the Fund records a realized gain or loss in the Consolidated Statement of Operations equal to the difference between the value at the time the contract was opened and the value at the time it was closed.
During the year, the Fund maintained forward currency contracts to hedge foreign currency risks associated with portfolio investments denominated in euro. These euro forward currency contracts had U.S. dollar total values ranging from 4% to 8% of net assets during the year.
Foreign currency translation The books and records of the Fund are maintained in U.S. dollars. Foreign currency amounts are translated into U.S. dollars at the
DODGE & COX INTERNATIONAL STOCK FUND §PAGE 12
NOTES TO CONSOLIDATED FINANCIAL STATEMENTS
prevailing exchange rates of such currencies against the U.S. dollar. The market value of investment securities and other assets and liabilities are translated at the exchange rate as of the valuation date. Purchases and sales of investment securities, income, and expenses are translated at the exchange rate prevailing on the transaction date.
Reported realized and unrealized gain (loss) on investments include foreign currency gain (loss) related to investment transactions.
Reported realized and unrealized gain (loss) on foreign currency transactions and translation include the following: disposing/holding of foreign currency, the difference between the trade and settlement dates on securities transactions, the difference between the accrual and payment dates on dividends, and currency losses on the purchase of foreign currency in certain countries that impose taxes on such transactions.
Consolidation The Fund may invest in certain securities through its wholly owned subsidiary, Dodge & Cox International Stock Fund Cayman, Ltd. (the “Subsidiary”). The Subsidiary is a Cayman Islands exempted company and invests in certain securities consistent with the investment objective of the Fund. The Fund’s Consolidated Financial Statements, including the Consolidated Portfolio of Investments, consist of the holdings and accounts of the Fund and the Subsidiary. All intercompany transactions and balances have been eliminated. At December 31, 2014, the Subsidiary had net assets of $100, which represented less than 0.01% of the Fund’s consolidated net assets.
Indemnification Under the Trust’s organizational documents, its officers and trustees are indemnified against certain liabilities arising out of the performance of their duties to the Trust. In addition, in the normal course of business the Trust enters into contracts that provide general indemnities to other parties. The Trust’s maximum exposure under these arrangements is unknown as this would involve future claims that may be made against the Trust that have not yet occurred.
NOTE 2—VALUATION MEASUREMENTS
Various inputs are used in determining the value of the Fund’s investments and other financial instruments. These inputs are summarized in the three broad levels listed below.
| § | | Level 1: Quoted prices in active markets for identical securities |
| § | | Level 2: Other significant observable inputs (including quoted prices for similar securities, market indices, interest rates, credit risk, etc.) |
| § | | Level 3: Significant unobservable inputs (including Fund management’s assumptions in determining the fair value of investments) |
The inputs or methodology used for valuing securities are not necessarily an indication of the risk associated with investing in those securities.
The following is a summary of the inputs used to value the Fund’s holdings at December 31, 2014:
| | | | | | | | |
| Classification(a) | | LEVEL 1
(Quoted Prices) | | | LEVEL 2
(Other Significant
Observable Inputs) | |
Securities | | | | | | | | |
Common Stocks | | | | | | | | |
Consumer Discretionary | | $ | 2,315,282,565 | | | $ | 7,098,654,834 | |
Consumer Staples | | | — | | | | 2,007,094,161 | |
Energy | | | 2,405,129,377 | | | | 713,320,693 | |
Financials | | | — | | | | 16,461,465,542 | |
Health Care | | | 1,744,170,972 | | | | 6,641,027,200 | |
Industrials | | | 1,095,529,495 | | | | 4,234,522,608 | |
Information Technology | | | 3,235,446,736 | | | | 6,715,041,296 | |
Materials | | | — | | | | 2,888,517,255 | |
Telecommunication Services | | | 574,598,656 | | | | 3,177,765,919 | |
Preferred Stocks | | | | | | | | |
Energy | | | 442,549,644 | | | | — | |
Financials | | | — | | | | 827,296,027 | |
Information Technology | | | — | | | | 437,707,086 | |
Short-term Investments | | | | | | | | |
Money Market Fund | | | 64,410,932 | | | | — | |
Repurchase Agreement | | | — | | | | 852,264,000 | |
| | | | | | | | |
Total Securities | | $ | 11,877,118,377 | | | $ | 52,054,676,621 | |
| | | | | | | | |
| | |
Other Financial Instruments | | | | | | | | |
Forward Currency
Contracts | | $ | — | | | $ | 82,595,986 | (b) |
| | | | | | | | | |
| (a) | Transfers during the year between Level 1 and Level 2 relate to the use of systematic fair valuation (see Note 1). On days when systematic fair valuation is used, securities whose primary market closes before the NYSE are classified as Level 2. There were no Level 3 securities at December 31, 2014 and 2013, and there were no transfers to Level 3 during the year. |
| (b) | Represents net unrealized appreciation/(depreciation). |
PAGE 13 § DODGE & COX INTERNATIONAL STOCK FUND
NOTES TO CONSOLIDATED FINANCIAL STATEMENTS
NOTE 3—ADDITIONAL DERIVATIVES INFORMATION
The Fund has entered into over-the-counter derivatives, such as forward currency contracts (each, a “Derivative”). Each Derivative is subject to a negotiated master agreement (based on a form published by the International Swaps and Derivatives Association (“ISDA”)) governing all Derivatives between the Fund and the relevant dealer counterparty. The master agreements specify (i) events of default and other events permitting a party to terminate some or all of the Derivatives thereunder and (ii) the process by which those Derivatives will be valued for purposes of determining termination payments. If some or all of the Derivatives under a master agreement are terminated because of an event of default or similar event, the values of all terminated Derivatives must be netted to determine a single payment owed by one party to the other. Some master agreements contain collateral terms requiring the parties to post collateral in respect of some or all of the Derivatives thereunder based on the net market value of those Derivatives, subject to a minimum exposure threshold. To the extent amounts owed to the Fund by its counterparties are not collateralized, the Fund is at risk of those counterparties’ non-performance. The Fund attempts to mitigate counterparty credit risk by entering into Derivatives only with counterparties it believes to be of good credit quality and by monitoring the financial stability of those counterparties.
For financial reporting purposes, the Fund does not offset financial assets and liabilities that are subject to an ISDA Master Agreement in the Consolidated Statement of Assets and Liabilities. The net amount for Derivatives is disclosed on the Consolidated Portfolio of Investments. At December 31, 2014, no collateral is pledged or held by the Fund for Derivatives.
NOTE 4—RELATED PARTY TRANSACTIONS
Management fees Under a written agreement approved by a unanimous vote of the Board of Trustees, the Fund pays an annual management fee of 0.60% of the Fund’s average daily net assets to Dodge & Cox, investment manager of the Fund.
Fund officers and trustees All officers and two of the trustees of the Trust are officers or employees of Dodge & Cox. The Trust pays a fee only to those trustees who are not affiliated with Dodge & Cox.
NOTE 5—INCOME TAX INFORMATION AND DISTRIBUTIONS TO SHAREHOLDERS
A provision for federal income taxes is not required since the Fund intends to continue to qualify as a regulated investment company under Subchapter M of the Internal Revenue Code and distribute all of its taxable income to shareholders. Distributions are determined in accordance with income tax regulations, and such amounts may differ from net investment income and realized gains for financial reporting purposes. Financial reporting records are adjusted for permanent book/tax differences at year end to reflect tax character.
Book/tax differences are primarily due to differing treatments of wash sales, net short-term realized gain (loss) on investments, investments in passive foreign investment companies, foreign capital gain taxes, and foreign currency realized gain (loss). At December 31, 2014, the cost of investments for federal income tax purposes was $59,180,711,611.
Distributions during the years noted below were characterized as follows for federal income tax purposes.
| | | | | | | | |
| | | Year Ended December 31, 2014 | | | Year Ended
December 31, 2013 | |
Ordinary income | | | $1,440,251,048 | | | | $852,149,250 | |
| | | ($0.970 per share) | | | | ($0.695 per share) | |
| | |
Long-term capital gain | | | — | | | | — | |
At December 31, 2014, the tax basis components of distributable earnings were as follows:
| | | | |
Unrealized appreciation | | $ | 11,614,762,854 | |
Unrealized depreciation | | | (6,863,679,467 | ) |
| | | | |
Net unrealized appreciation | | | 4,751,083,387 | |
Undistributed ordinary income | | | 10,957,138 | |
Capital loss carryforward(a) | | | (3,199,564,411 | ) |
| (a) | Represents accumulated capital loss as of December 31, 2014, which may be carried forward to offset future capital gains. During 2014, the Fund utilized $2,145,426,224 of the capital loss carryforward. If not utilized, the remaining capital loss carryforward will expire as follows: |
| | | | |
Expiring in 2017 | | $ | 2,079,444,182 | |
Expiring in 2018 | | | 1,120,120,229 | |
| | | | |
| | $ | 3,199,564,411 | |
| | | | |
DODGE & COX INTERNATIONAL STOCK FUND §PAGE 14
NOTES TO CONSOLIDATED FINANCIAL STATEMENTS
Under the Regulated Investment Company Modernization Act of 2010, capital losses incurred by the Fund after January 1, 2011, are not subject to expiration. In addition, such losses must be utilized prior to the losses incurred in the years preceding enactment.
Fund management has reviewed the tax positions for open periods (three years and four years, respectively, from filing the Fund’s Federal and State tax returns) as applicable to the Fund, and has determined that no provision for income tax is required in the Fund’s financial statements.
NOTE 6—LOAN FACILITIES
Pursuant to an exemptive order issued by the Securities and Exchange Commission (SEC), the Fund may participate in an interfund lending facility (Facility). The Facility allows the Fund to borrow money from or loan money to the Funds. Loans under the Facility are made for temporary or emergency purposes, such as to fund shareholder redemption requests. Interest on borrowings is the average of the current repurchase agreement rate and the bank loan rate. There was no activity in the Facility during the year.
All Funds in the Trust participate in a $500 million committed credit facility (Line of Credit) with State Street Bank and Trust Company, to be utilized for temporary or emergency purposes to fund shareholder redemptions or for other short-term liquidity purposes. The maximum amount available to the Fund is $250 million. Each Fund pays an annual commitment fee on its pro-rata portion of the Line of Credit. The Fund’s commitment fee for the year ended December 31, 2014, amounted to $168,919 and is reflected as a Miscellaneous Expense in the Consolidated Statement of Operations. Interest on borrowings is charged at the prevailing rate. There were no borrowings on the Line of Credit during the year.
NOTE 7—PURCHASES AND SALES OF INVESTMENTS
For the year ended December 31, 2014, purchases and sales of securities, other than short-term securities, aggregated $19,554,072,830 and $7,219,579,009 respectively.
NOTE 8—ACCOUNTING PRONOUNCEMENTS
In June 2014, the Financial Accounting Standards Board issued Accounting Standards Update (ASU) No. 2014-11, Transfers and Servicing (Topic 860), Repurchase-to-Maturity Transactions, Repurchase Financings, and Disclosures. The ASU changes the accounting for certain repurchase agreements and expands disclosure requirements related to repurchase agreements and similar transactions. Management is currently evaluating the impact, if any, of applying this ASU effective January 1, 2015.
NOTE 9—SUBSEQUENT EVENTS
Fund management has determined that no material events or transactions occurred subsequent to December 31, 2014, and through the date of the Fund’s financial statements issuance, which require additional disclosure in the Fund’s financial statements.
PAGE 15 § DODGE & COX INTERNATIONAL STOCK FUND
NOTES TO CONSOLIDATED FINANCIAL STATEMENTS
NOTE 10—HOLDINGS OF 5% VOTING SECURITIES
Each of the companies listed below was considered to be an affiliate of the Fund because the Fund owned 5% or more of the company’s voting securities during all or part of the year ended December 31, 2014. Purchase and sale transactions and dividend income earned during the period on these securities were as follows:
| | | | | | | | | | | | | | | | | | | | | | | | |
| | | Shares at
Beginning of Period | | | Additions | | | Reductions | | | Shares at
End of Period | | | Dividend
Income(a) | | | Value at
End of Period | |
AEGON NV (Netherlands) | | | 84,986,863 | | | | 41,840,609 | | | | (1,600,001 | ) | | | 125,227,471 | | | | 24,895,839 | | | | 939,582,134 | |
BR Malls Participacoes SA (Brazil) | | | 46,424,100 | | | | 8,446,200 | | | | — | | | | 54,870,300 | | | | 11,036,191 | | | | 335,515,164 | |
Brother Industries, Ltd. (Japan) | | | 18,185,100 | | | | — | | | | — | | | | 18,185,100 | | | | 4,168,575 | | | | 329,927,874 | |
Fujitsu, Ltd. (Japan) | | | 103,523,000 | | | | — | | | | (44,210,100 | ) | | | 59,312,900 | | | | 6,568,570 | | | | — | (c) |
Hang Lung Group, Ltd. (Hong Kong) | | | 68,625,500 | | | | 21,805,100 | | | | — | | | | 90,430,600 | | | | 8,137,789 | | | | 408,947,624 | |
Infineon Technologies AG (Germany) | | | 63,788,456 | | | | 2,626,000 | | | | — | | | | 66,414,456 | | | | 10,476,101 | | | | 712,032,433 | |
Kasikornbank PCL- Foreign (Thailand) | | | 95,826,527 | | | | 28,000,000 | | | | — | | | | 123,826,527 | | | | 11,025,949 | | | | 860,405,220 | |
Kyocera Corp. (Japan) | | | 10,467,800 | | | | 9,780,200 | | | | — | | | | 20,248,000 | | | | 9,866,799 | | | | 928,042,771 | |
Lafarge SA (France) | | | 19,314,291 | | | | 921,000 | | | | (200,000 | ) | | | 20,035,291 | | | | 22,683,332 | | | | 1,406,163,778 | |
Millicom International Cellular SA SDR (Luxembourg) | | | 6,580,880 | | | | 3,507,512 | | | | — | | | | 10,088,392 | | | | 19,624,813 | | | | 750,282,272 | |
NGK Spark Plug Co., Ltd. (Japan) | | | 16,720,000 | | | | — | | | | (2,710,300 | ) | | | 14,009,700 | | | | 4,447,189 | | | | 423,054,875 | |
Nidec Corp. (Japan) | | | 7,290,500 | | | | 7,290,500 | | | | (5,026,200 | ) | | | 9,554,800 | | | | 6,314,142 | | | | — | (c) |
Saipem SPA (Italy) | | | 19,820,000 | | | | 16,069,000 | | | | — | | | | 35,889,000 | | | | — | (b) | | | 376,917,360 | |
Smiths Group PLC (United Kingdom) | | | — | | | | 26,840,600 | | | | — | | | | 26,840,600 | | | | 7,107,781 | | | | 454,280,003 | |
Television Broadcasts, Ltd. (Hong Kong) | | | 37,596,400 | | | | 2,426,500 | | | | — | | | | 40,022,900 | | | | 13,423,800 | | | | 232,319,948 | |
Wienerberger AG (Austria) | | | 13,185,029 | | | | — | | | | (9,049,265 | ) | | | 4,135,764 | | | | 577,742 | | | | — | (c) |
Yamaha Motor Co., Ltd. (Japan) | | | 28,851,100 | | | | 2,699,000 | | | | — | | | | 31,550,100 | | | | 10,022,113 | | | | 634,516,458 | |
Yapi ve Kredi Bankasi AS (Turkey) | | | 168,737,068 | | | | 65,974,100 | | | | — | | | | 234,711,168 | | | | 8,361,838 | | | | 487,571,771 | |
| | | | | | | | | | | | | | | | | | | | | | | | |
| | | | | | | | | | | | | | | | | | $ | 178,738,563 | | | $ | 9,279,559,685 | |
| | | | | | | | | | | | | | | | | | | | | | | | |
| | | | | | | | | | | | | | | | | | | | | | | | | |
| (a) | Net of foreign taxes, if any |
| (c) | Company was not an affiliate at period end |
DODGE & COX INTERNATIONAL STOCK FUND §PAGE 16
CONSOLIDATED FINANCIAL HIGHLIGHTS
| | | | | | | | | | | | | | | | | | | | |
SELECTED DATA AND RATIOS (for a share outstanding throughout each year) | | Year Ended December 31, | |
| | | 2014 | | | 2013 | | | 2012 | | | 2011 | | | 2010 | |
| | | | |
Net asset value, beginning of year | | | $43.04 | | | | $34.64 | | | | $29.24 | | | | $35.71 | | | | $31.85 | |
Income from investment operations: | | | | | | | | | | | | | | | | | | | | |
Net investment income | | | 0.98 | | | | 0.70 | | | | 0.76 | | | | 0.78 | | | | 0.51 | |
Net realized and unrealized gain (loss) | | | (0.94 | ) | | | 8.40 | | | | 5.39 | | | | (6.49 | ) | | | 3.85 | |
| | | | |
Total from investment operations | | | 0.04 | | | | 9.10 | | | | 6.15 | | | | (5.71 | ) | | | 4.36 | |
| | | | |
Distributions to shareholders from: | | | | | | | | | | | | | | | | | | | | |
Net investment income | | | (0.97 | ) | | | (0.70 | ) | | | (0.75 | ) | | | (0.76 | ) | | | (0.50 | ) |
Net realized gain | | | — | | | | — | | | | — | | | | — | | | | — | |
| | | | |
Total distributions | | | (0.97 | ) | | | (0.70 | ) | | | (0.75 | ) | | | (0.76 | ) | | | (0.50 | ) |
| | | | |
Net asset value, end of year | | | $42.11 | | | | $43.04 | | | | $34.64 | | | | $29.24 | | | | $35.71 | |
| | | | |
Total return | | | 0.07 | % | | | 26.31 | % | | | 21.03 | % | | | (15.97 | )% | | | 13.69 | % |
Ratios/supplemental data: | | | | | | | | | | | | | | | | | | | | |
Net assets, end of year (millions) | | | $64,040 | | | | $53,616 | | | | $40,556 | | | | $35,924 | | | | $43,406 | |
Ratio of expenses to average net assets | | | 0.64 | % | | | 0.64 | % | | | 0.64 | % | | | 0.64 | % | | | 0.65 | % |
Ratio of net investment income to average net assets | | | 2.39 | % | | | 1.85 | % | | | 2.31 | % | | | 2.23 | % | | | 1.58 | % |
Portfolio turnover rate | | | 12 | % | | | 13 | % | | | 10 | % | | | 16 | % | | | 15 | % |
See accompanying Notes to Consolidated Financial Statements
PAGE 17 § DODGE & COX INTERNATIONAL STOCK FUND
REPORT OF INDEPENDENT REGISTERED PUBLIC ACCOUNTING FIRM
To the Trustees of Dodge & Cox Funds and Shareholders of Dodge & Cox International Stock Fund
In our opinion, the accompanying consolidated statement of assets and liabilities, including the consolidated portfolio of investments, and the related consolidated statements of operations and of changes in net assets and the consolidated financial highlights present fairly, in all material respects, the financial position of Dodge & Cox International Stock Fund (the “Fund”, one of the series constituting Dodge & Cox Funds) at December 31, 2014, the results of its operations for the year then ended, the changes in its net assets for each of the two years in the period then ended and the financial highlights for each of the five years in the period then ended, in conformity with accounting principles generally accepted in the United States of America. These consolidated financial statements and consolidated financial highlights (hereafter referred to as financial statements) are the responsibility of the Fund’s management. Our responsibility is to express an opinion on these financial statements based on our audits. We conducted our audits of these financial statements in accordance with the standards of the Public Company Accounting Oversight Board (United States). Those standards require that we plan and perform the audit to obtain reasonable assurance about whether the financial statements are free of material misstatement. An audit includes examining, on a test basis, evidence supporting the amounts and disclosures in the financial statements, assessing the accounting principles used and significant estimates made by management, and evaluating the overall financial statement presentation. We believe that our audits, which included confirmation of securities at December 31, 2014, by correspondence with the custodian and brokers, provide a reasonable basis for our opinion.
PricewaterhouseCoopers LLP
San Francisco, California
February 17, 2015
DODGE & COX INTERNATIONAL STOCK FUND §PAGE 18
SPECIAL 2014 TAX INFORMATION
(unaudited)
The following information is provided pursuant to provisions of the Internal Revenue Code:
In 2014, the Fund elected to pass through to shareholders foreign source income of $1,926,716,842 and foreign taxes paid of $118,202,887.
The Fund designates up to a maximum of $1,872,058,543 of its distributions paid to shareholders in 2014 as qualified dividends (treated for federal income tax purposes in the hands of shareholders as taxable at a maximum rate of 20%).
For shareholders that are corporations, the Fund designates 2% of its ordinary dividends paid to shareholders in 2014 as dividends from domestic corporations eligible for the corporate dividends received deduction, provided that the shareholder otherwise satisfies applicable requirements to claim that deduction.
BOARD APPROVAL OF FUNDS’
INVESTMENT MANAGEMENT AGREEMENTS AND MANAGEMENT FEES (unaudited)
The Board of Trustees is responsible for overseeing the performance of the Dodge & Cox Funds’ investment manager and determining whether to continue the Investment Management Agreements between the Funds and Dodge & Cox each year (the “Agreements”). At a meeting of the Board of Trustees of the Trust held on December 17, 2014, the Trustees, by a unanimous vote (including a separate vote of those Trustees who are not “interested persons” (as defined in the Investment Company Act of 1940) (the “Independent Trustees”)), approved the renewal of the Agreements for an additional one-year term through December 31, 2015 with respect to each Fund other than the Dodge & Cox Global Bond Fund. The Agreement for the Dodge & Cox Global Bond Fund was not subject to renewal at this time. During the course of the year, the Board received a wide variety of materials relating to the services provided by Dodge & Cox and the performance of each of the Funds.
INFORMATION RECEIVED
In advance of the meeting, the Board, including each of the Independent Trustees, requested, received, and reviewed materials relating to the Agreements and the services provided by Dodge & Cox. The Independent
Trustees retained Morningstar® to prepare an independent expense and performance summary for each Fund and comparable funds managed by other advisers identified by Morningstar. The Morningstar materials included information regarding advisory fee rates, expense ratios, and transfer agency, custodial, and distribution expenses, as well as appropriate performance comparisons to each Fund’s peer group and an index or combination of indices. The Morningstar materials also included a comparison of expenses of various share classes offered by comparable funds.
The materials reviewed by the Board contained information concerning, among other things, Dodge & Cox’s profitability, financial results and condition, advisory fee revenue, and separate account and sub-adviser fund fee schedules. The Board additionally considered the Funds’ brokerage commissions, turnover rates, sales and redemption data and the significant investment that Dodge & Cox makes in research used in managing the Funds. The Board received and reviewed a memorandum summarizing information provided throughout the year regarding Dodge & Cox’s services to the Funds as well as information regarding (i) the different fees, services, costs, and risks associated with other accounts managed by Dodge & Cox as compared to the Dodge & Cox Funds; (ii) the differences in performance between the Funds and separately managed accounts; and (iii) Fund shares subscription and redemption activity. Throughout the process of reviewing the services provided by Dodge & Cox and preparing for the meeting, the Independent Trustees found Dodge & Cox to be open, forthright, detailed, and very helpful in answering questions about all issues.
The Board received copies of the Agreements and a memorandum from the independent legal counsel to the Independent Trustees discussing the factors generally regarded as appropriate to consider in evaluating advisory arrangements. The Trust’s Contract Review Committee, consisting solely of Independent Trustees, met with the independent legal counsel on November 3, 2014, and again on December 17, 2014, to discuss whether to renew the Agreements. The Board, including the Independent Trustees, subsequently concluded that the existing Agreements are fair and reasonable and voted to approve the Agreements.
In considering the Agreements, the Board, including the Independent Trustees, did not identify any single
PAGE 19 § DODGE & COX INTERNATIONAL STOCK FUND
factor or particular information as all-important or controlling. In reaching the decision to approve the Agreements, the Board considered several factors, discussed below, to be key factors and reached the conclusions described below.
NATURE, QUALITY, AND EXTENT
OF THE SERVICES
The Board considered that Dodge & Cox provides a wide range of services to the Funds in addition to portfolio management and that the quality of these services has been excellent in all respects. The extensive nature of services provided by Dodge & Cox has been documented in materials provided to the Board and in presentations made to the Board throughout the year. In particular, the Board considered the nature, quality, and extent of portfolio management, administrative, and shareholder services performed by Dodge & Cox. With regard to portfolio management services, the Board considered Dodge & Cox’s established long-term history of care and conscientiousness in the management of the Funds; its demonstrated consistency in investment approach and depth; the background and experience of the Dodge & Cox Investment Policy Committee, International Investment Policy Committee, Global Stock Investment Policy Committee, Fixed Income Investment Policy Committee, and Global Bond Investment Policy Committee, and research analysts responsible for managing the Funds; its methods for assessing the regulatory and investment climate in various jurisdictions; Dodge & Cox’s overall high level of attention to its core investment management function; and its commitment to the Funds and their shareholders.
In the area of administrative and shareholder services, the Board considered the excellent quality of Dodge & Cox’s work in areas such as compliance, legal services, trading, proxy voting, technology, oversight of the Funds’ transfer agent and custodian, tax compliance, and shareholder communication through its website and other means. The Board also noted Dodge & Cox’s diligent disclosure policy, its favorable compliance record, and its reputation as a trusted, shareholder-friendly mutual fund family.
In addition, the Board considered that Dodge & Cox manages approximately $180 billion in Fund assets with fewer professionals than most comparable funds, and that on average these professionals have more experience and
longer tenure than investment professionals at comparable funds. The Board also noted that Dodge & Cox is an investment research-oriented firm with no other business endeavors to distract management’s attention from its research efforts, and that its investment professionals adhere to a consistent investment approach across the Funds. The Board further considered the favorable stewardship and “Gold” analyst ratings awarded to each of the Funds by Morningstar. The Board concluded that it was satisfied with the nature, extent, and quality of investment management and other services provided to the Funds by Dodge & Cox.
INVESTMENT PERFORMANCE
The Board considered short-term and long-term investment performance for each Fund (including periods of outperformance or underperformance) as compared to both relevant indices and the performance of such Fund’s peer group. The Board noted that each Fund demonstrated favorable longer-term performance relative to its benchmark and peer group. The Board determined after extensive review and inquiry that Dodge & Cox’s historic, long-term, team-oriented, bottom up investment approach remains consistent and that Dodge & Cox continues to be distinguished by its integrity, transparency, and independence.
The Board considered that the performance of the Funds is the result of a team-oriented investment management process that emphasizes a long-term investment horizon, comprehensive independent research, price discipline, and focus. The Board also considered that the investment performance delivered by Dodge & Cox to the Funds appeared to be consistent with the relevant performance delivered for other clients of Dodge & Cox. The Board concluded that Dodge & Cox has delivered favorable long-term performance for Fund investors consistent with the long-term investment strategies being pursued by the Funds.
COSTS AND ANCILLARY BENEFITS
Costs of Services to Funds: Fees and Expenses. The Board considered each Fund’s management fee rate and expense ratio relative to similar mutual funds and relative to management fees charged by Dodge & Cox to other clients. In particular, the Board considered that the Funds continue to be substantially below their peer group median in expense
DODGE & COX INTERNATIONAL STOCK FUND §PAGE 20
ratios and management fee rates and that many media and industry reports specifically comment on the low expense ratios of the Funds, which have been a defining characteristic of the Funds for many years. The Board also evaluated the operating structures of the Funds and Dodge & Cox, noting that the Funds do not charge front-end sales commissions or distribution fees, and Dodge & Cox bears, among other things, the significant cost of third party research, reimbursement for recordkeeping and administrative costs to third-party retirement plan administrators, and administrative and office overhead. The Board noted that expenses are well below industry averages. The Board also considered that the Funds receive numerous administrative, regulatory compliance, legal, technology and shareholder support services from Dodge & Cox without any additional administrative fee and the fact that the Funds have relatively low transaction costs and portfolio turnover rates. The Board reviewed Morningstar data showing that the few peer group funds with lower expense ratios often have other share classes with significantly higher expense ratios.
The Board reviewed information regarding the fee rates Dodge & Cox charges to separate accounts and subadvised funds that have investment programs similar to those of the Funds, including instances where separate account and sub-advised fund fees are lower than Fund fees. The Board considered differences in the nature and scope of services Dodge & Cox provides to the Funds as compared to other client accounts, differences in regulatory, litigation, and other risks as between Dodge & Cox Funds and other types of clients, and certain characteristics of the market for institutional separate account management services. The Board further noted that, with respect to non-U.S. funds sponsored and managed by Dodge & Cox that are comparable to the Funds in many respects, the fee rates charged by Dodge & Cox are the same as or higher than the fee rates charged to the Funds. After consideration of these matters, the Board concluded that the overall costs incurred by the Funds for the services they receive (including the management fee paid to Dodge & Cox) are reasonable and that the fees are acceptable based upon the qualifications, experience, reputation, and performance of Dodge & Cox and the low overall expense ratios of the Funds.
Profitability and Costs of Services to Dodge & Cox; “Fall-out” Benefits. The Board reviewed reports of Dodge & Cox’s financial position, profitability, and estimated overall value, and considered Dodge & Cox’s
overall profitability within its context as a private, employee-owned S-Corporation and relative to the favorable services provided. The Board noted in particular that Dodge & Cox’s profits are not generated by high fee rates, but reflect an extraordinarily streamlined, efficient, and focused business approach toward investment management. The Board recognized the importance of Dodge & Cox’s profitability—which is derived solely from management fees and does not include other business ventures—to maintain its independence, stability, company culture and ethics, and management continuity. The Board also considered that the compensation/profit structure at Dodge & Cox includes a return on shareholder employees’ investment in the firm, which is vital for remaining independent and facilitating retention of management and investment professionals.
The Board considered that Dodge & Cox recently recommended closing the International Stock Fund to new investors to pro-actively manage the growth of the Fund. The Stock Fund and Balanced Fund were similarly closed to new investors during periods of significant growth in the past. While these actions are intended to benefit existing shareholders, the effect is to reduce potential revenues to Dodge & Cox from new shareholders.
The Board also considered potential “fall-out” benefits (including the receipt of research from unaffiliated brokers and reputational benefits to non-U.S. funds sponsored and managed by Dodge & Cox) that Dodge & Cox might receive as a result of its association with the Funds and determined that they are not significant. The Board also noted the extent of additional administrative services performed by Dodge & Cox for the Funds, and that the magnitude of costs and risks borne by Dodge & Cox in rendering advisory services to the Funds (including risks in the regulatory compliance, securities valuation, and investment management processes) are continuing to increase. The Board concluded that the profitability of Dodge & Cox’s relationship with the Funds (including fall-out benefits) was fair and reasonable.
THE BENEFIT OF ECONOMIES OF SCALE
The Board considered whether there have been economies of scale with respect to the management of each Fund, whether the Funds have appropriately benefited from any economies of scale, and whether the management fee rate is reasonable in relation to the Fund assets and any economies of scale that may exist. In the
PAGE 21 § DODGE & COX INTERNATIONAL STOCK FUND
Board’s view, any consideration of economies of scale must take account of the Funds’ low fee structure and the considerable efficiencies of the Funds’ organization and fee structure that has been realized by shareholders from the time of each Fund’s inception (i.e., from the first dollar). An assessment of economies of scale must also take into account that Dodge & Cox has capped expenses when offering new funds. In addition, the Board noted that Dodge & Cox has shared economies of scale by adding or enhancing services to the Funds over time, and that the internal costs of providing investment management, up-to-date technology, administrative, legal, and compliance services to the Funds are continuing to increase. For example, Dodge & Cox has increased its global research staff and investment resources over the years to address the increased complexity of investing in multinational and non-U.S. companies. In addition, Dodge & Cox has made substantial expenditures in other staff, technology, and infrastructure to enable it to integrate credit and equity analyses and to be able to implement its strategy in a more effective and secure manner. The Board determined that the Funds provide access for small investors to high quality investment management at a relatively low cost. The Board’s decision to renew the Agreements was made after consideration of economies of scale and review of peer group fund expense ratios and historical expense ratio patterns for the Funds. The Board concluded that the current Dodge & Cox fee structure is fair and reasonable and adequately shares economies of scale that may exist.
CONCLUSION
Based on their evaluation of all material factors and assisted by the advice of independent legal counsel to the Independent Trustees, the Board, including the Independent Trustees, concluded that the advisory fee structure was fair and reasonable, that each Fund was paying a competitive fee for the services provided, that the scope and quality of Dodge & Cox’s services has provided substantial value for Fund shareholders over the long term, and that approval of the Agreements was in the best interests of each Fund and its shareholders.
FUND HOLDINGS
The Fund provides a complete list of its holdings four times each fiscal year, as of the end of each quarter. The Fund files the lists with the Securities and Exchange Commission (SEC) on Form N-CSR (second and fourth quarters) and Form N-Q (first and third quarters). Shareholders may view the Fund’s Forms N-CSR and N-Q on the SEC’s website at www.sec.gov. Forms N-CSR and N-Q may also be reviewed and copied at the SEC’s Public Reference Room in Washington, DC. Information regarding the operations of the Public Reference Room may be obtained by calling 202-551-8090 (direct) or 800-732-0330 (general SEC number). A list of the Fund’s quarter-end holdings is also available at www.dodgeandcox.com on or about 15 days following each quarter end and remains available on the website until the list is updated in the subsequent quarter.
PROXY VOTING
For a free copy of the Fund’s proxy voting policies and procedures, please call 800-621-3979, visit the Fund’s website at www.dodgeandcox.com, or visit the SEC’s website at www.sec.gov. Information regarding how the Fund voted proxies relating to portfolio securities during the most recent 12-month period ending June 30 is also available at www.dodgeandcox.com or at www.sec.gov.
HOUSEHOLD MAILINGS
The Fund routinely mails shareholder reports and summary prospectuses to shareholders and, on occasion, proxy statements. In order to reduce the volume of mail, when possible, only one copy of these documents will be sent to shareholders who are part of the same family and share the same residential address.
If you have a direct account with the Funds and you do not want the mailing of shareholder reports and summary prospectuses combined with other members in your household, contact the Funds at 800-621-3979. Your request will be implemented within 30 days.
DODGE & COX INTERNATIONAL STOCK FUND §PAGE 22
DODGE & COX FUNDS—EXECUTIVE OFFICER & TRUSTEE INFORMATION
| | | | | | |
Name (Age) and
Address* | | Position with Trust (Year of Election or
Appointment) | | Principal Occupation During Past 5 Years | | Other Directorships Held by Trustees |
| INTERESTED TRUSTEES AND OFFICERS |
| Charles F. Pohl (56) | | Chairman and Trustee (Officer since 2004) | | Chairman (since 2013), Co-President (2011-2013), Senior Vice President (until 2011), and Director of Dodge & Cox; Chief Investment Officer, Portfolio Manager, Investment Analyst, and member of Investment Policy Committee (IPC), Global Stock Investment Policy Committee (GSIPC), International Investment Policy Committee (IIPC), and Fixed Income Investment Policy Committee (FIIPC) | | — |
| Dana M. Emery (53) | | President and Trustee (Trustee since 1993) | | Chief Executive Officer (since 2013), President (since 2011), Executive Vice President (until 2011), and Director of Dodge & Cox; Director of Fixed Income, Portfolio Manager, and member of FIIPC and Global Bond Investment Policy Committee (GBIPC) | | — |
| John A. Gunn (71) | | Senior Vice President (Officer since 1998) | | Chairman Emeritus (2011-2013), Chairman (until 2011), Chief Executive Officer (until 2010), and Director of Dodge & Cox; Portfolio Manager and member of IPC, GSIPC (until 2014), and IIPC | | — |
| Diana S. Strandberg (55) | | Senior Vice President (Officer since 2006) | | Senior Vice President (since 2011), Vice President (until 2011), and Director (since 2011) of Dodge & Cox; Director of International Equity (since 2009), Portfolio Manager, Investment Analyst, and member of IPC, GSIPC, IIPC, and GBIPC | | — |
| David H. Longhurst (57) | | Treasurer (Officer since 2006) | | Vice President and Assistant Treasurer of Dodge & Cox | | — |
| Thomas M. Mistele (61) | | Secretary (Officer since 1998) | | Chief Operating Officer, Director, Secretary, Senior Counsel (since 2011), and General Counsel (until 2011) of Dodge & Cox | | — |
| Katherine M. Primas (40) | | Chief Compliance Officer (Officer since 2009) | | Vice President (since 2011) and Chief Compliance Officer of Dodge & Cox | | — |
| INDEPENDENT TRUSTEES |
| Thomas A. Larsen (65) | | Trustee (Since 2002) | | Senior Counsel of Arnold & Porter LLP (law firm) (since 2013); Partner of Arnold & Porter LLP (since 2012); Director of Howard, Rice, Nemerovski, Canady, Falk & Rabkin (1977-2011) | | — |
| Ann Mather (54) | | Trustee (Since 2011) | | CFO, Pixar Animation Studios (1999-2004) | | Director, Google, Inc. (internet information services) (since 2005); Director, Glu Mobile, Inc. (multimedia software) (since 2005); Director, Arista Networks (since 2013); Director, Netflix, Inc. (video services) (since 2010); Director, Shutterfly, Inc. (internet photography services/publishing) (since 2013) |
| Robert B. Morris III (62) | | Trustee (Since 2011) | | Advisory Director, The Presidio Group (since 2005) | | — |
| Gary Roughead (63) | | Trustee (Since 2013) | | Annenberg Distinguished Visiting Fellow, Hoover Institution (since 2011); Admiral, United States Navy (Ret.); U.S. Navy Chief of Naval Operations (2007-2011) | | Director, Northrop Grumman Corp. (global security) (since 2012) |
| Mark E. Smith (63) | | Trustee (Since 2014) | | Executive Vice President, Managing Director—Fixed Income at Loomis Sayles & Company, L.P. (2003-2011) | | — |
| John B. Taylor (68) | | Trustee (Since 2005) (and 1995-2001) | | Professor of Economics, Stanford University; Senior Fellow, Hoover Institution; Under Secretary for International Affairs, United States Treasury (2001-2005) | | — |
| * | | The address for each Officer and Trustee is 555 California Street, 40th Floor, San Francisco, California 94104. Each Officer and Trustee oversees all six series in the Dodge & Cox Funds complex and serves for an indefinite term. |
Additional information about the Trust’s Trustees and Officers is available in the Trust’s Statement of Additional Information (SAI). You can get a free copy of the SAI by visiting the Funds’ website at www.dodgeandcox.com or calling
800-621-3979.
PAGE 23 § DODGE & COX INTERNATIONAL STOCK FUND
| | | | |
| | | | |
www.dodgeandcox.com
For Fund literature, transactions, and account information, please visit the Funds’ website.
or write or call:
DODGE & COX FUNDS
c/o Boston Financial Data Services
P.O. Box 8422
Boston, Massachusetts 02266-8422
(800) 621-3979
INVESTMENT MANAGER
Dodge & Cox
555 California Street, 40th Floor
San Francisco, California 94104
(415) 981-1710
This report is submitted for the general information of the shareholders of the Fund. The report is not authorized for distribution to prospective investors in the Fund unless it is accompanied by a current prospectus.
This report reflects our views, opinions, and portfolio holdings as of December 31, 2014, the end of the reporting period. Any such views are subject to change at any time based upon market or other conditions and Dodge & Cox disclaims any responsibility to update such views. These views may not be relied on as investment advice and, because investment decisions for a Dodge & Cox Fund are based on numerous factors, may not be relied on as an indication of trading intent on behalf of any Dodge & Cox Fund.
12/14 BF AR Printed on recycled paper
Annual Report
December 31, 2014
Balanced Fund
ESTABLISHED 1931
TICKER: DODBX
TO OUR SHAREHOLDERS
The Dodge & Cox Balanced Fund had a total return of 8.9%, compared to 10.6% for the Combined Index(a) (a 60/40 blend of stocks and fixed income securities) for the year ending December 31, 2014. At year end, the Fund’s net assets of $15.5 billion were invested in 68.7% equities,(b) 29.8% fixed income securities, and 1.5% cash.
MARKET COMMENTARY
U.S. equity markets were strong during 2014: the S&P 500 closed on December 31 near its record high. Utilities and Health Care were the best performing sectors in the S&P 500, while Energy was the weakest, and the only sector to post a negative return. Global oil prices dropped approximately 50% due to lower-than-expected demand growth and modestly higher-than-expected supply growth. The U.S. dollar strengthened against most major currencies, allowing American companies and consumers to pay lower prices for imported foreign goods. However, in aggregate, the stronger currency dampens profitability of U.S. multinational corporations and makes U.S. exports less competitive.
The first half of the year saw low levels of volatility, substantially declining interest rates, and strong returns among non-Treasury sectors. This relatively benign market environment gave way to a second half featuring a marked uptick in volatility, further interest rate declines (despite clear improvements in U.S. economic activity), and rising yield premiums, resulting in underperformance for corporate bonds and Agency-guaranteed(c) mortgage-backed securities (MBS). The volatility and risk aversion in the second half were driven by the plunge in oil prices, as well as concerns that weakness among important global economies (e.g., Eurozone, China, Japan) could threaten the U.S. economic recovery and delay the Federal Reserve’s (Fed) anticipated plans to tighten monetary policy starting in 2015.
INVESTMENT STRATEGY
We continue to set the Fund’s asset allocation based on our long-term outlook for the Fund’s equity and fixed income holdings, which currently favors equities. We increased the allocation to equities by 2.9 percentage points during the year due to declining interest rates,
reasonable equity valuations, and an increase in the Fund’s position in preferred stocks (2.0% at year end).
Equity Strategy
Our disciplined investment process combines in-depth, bottom-up research and rigorous debate of ideas among our experienced investment professionals; the portfolio benefits from the collective judgment of our team. We evaluate potential investments based on a three- to five-year investment horizon and have a strict price discipline. While individual company research is the primary factor in determining the portfolio’s composition, we can identify themes that cut across many industries. Innovation is a pervasive theme in the portfolio and is factored into our analysis. We highlight examples of our current investment theses within the Information Technology and Energy sectors below.(d)
Information Technology
In the Information Technology sector, investors can have limited visibility of future earnings because growth is often driven by innovation and disruption; companies are required to make significant investments in research & development (R&D) with uncertain outcomes. In addition, companies face intense competition, have short product cycles, and must combat product obsolescence. As a result, we typically look for companies with reasonable valuations that incorporate modest expectations, industry leadership (e.g., brand, distribution, market share), sustained R&D efforts, a strong intellectual property portfolio, and financial stability. On December 31, 23.4% of the equity portfolio was invested in the Information Technology sector compared to 19.7% of the S&P 500.(e)
Hewlett-Packard, a long-term holding in the portfolio, is an example of how our patience, persistence, and ability to build conviction in the face of uncertainty have benefited recent performance (up 101% in 2013 and up 46% in 2014, and the largest contributor to equity portfolio results in both years). We believe that Hewlett-Packard remains an attractive investment opportunity with strong business prospects given its large valuation discount to the overall market. As the world’s largest enterprise technology company, Hewlett-Packard has a strong, well-recognized
PAGE 1 § DODGE & COX BALANCED FUND
brand and serves more than one billion end users in more than 170 countries. The company generates high, recurring free cash flow. Over our three- to five-year investment horizon, Hewlett-Packard is positioned to benefit from growth opportunities in the cloud, security, and converged network infrastructure markets. Furthermore, we believe that the competent management of the company’s operating businesses is underappreciated by the market. Current risks to the business include the possibility of expensive acquisitions, macroeconomic weakness, and competitive threats in PCs, services, and enterprise server/storage/networking. While these risks are significant, we believe that the valuation reflects an overly pessimistic outlook.
In October, the company announced plans to separate the business into two companies—Hewlett-Packard Enterprise and HP Inc.—and expects to complete the transaction by October 2015. We believe that the proposed separation could build long-term shareholder value. On December 31, Hewlett-Packard was a 4.1% position in the equity portfolio.
Energy
In the Energy sector, technological innovation has improved exploration success and oil recovery, increased efficiency of energy conservation, and reduced the environmental impact of energy extraction. We have identified attractive energy investment opportunities, especially within the Energy Equipment & Services (Oil Services) industry. The equity portfolio is overweight Oil Services compared to the S&P 500 (5.1% versus 1.4%, respectively).
Schlumberger, the world’s leading oil services company, is the most technologically-focused company among the integrated oilfield service companies, with double the R&D budget of its closest peer. We believe that its consistent spending on technology (e.g., enhanced recovery techniques, seismic interpretation, directional drilling) has provided the company with a competitive advantage that is sustainable over time. The company’s innovation efforts have enabled the industry to extract oil and gas from deepwater and shale resources that were previously cost-prohibitive or physically challenging to reach. Schlumberger is the dominant international provider in key markets, including the Middle East and Russia. The majority of its revenues come
from outside the United States, and its international business has higher margins than its U.S. operations. We believe that Schlumberger is well positioned to continue to benefit from the long-term relationships it has with international oil companies and producing nations. If the price of oil remains low, the company will face a challenging environment. Relative to competitors, its strong franchises and solid balance sheet and cash flow should allow the company to endure an extended downturn. Weighing this risk with Schlumberger’s valuation and opportunities, we believe that the company (a 2.4% position in the equity portfolio) remains an attractive investment opportunity.
Fixed Income Strategy
A valuation focus and identification of possible misalignments between market pricing and underlying fundamentals are critical elements of our fixed income investment approach. We believe these principles are key to generating attractive long-term returns. Be it at the security, issuer, or sector level, we are guided by the interaction of market opportunity and fundamental research across the fixed income market. Changes to the portfolio’s composition are a direct result of this discipline. For example, we seek to avoid those issuers where we believe the downside risks are not adequately compensated through current valuations. On the other hand, when we see attractive valuations and our research gives us confidence that creditworthiness will be maintained or improved over our investment horizon, we seek to add incremental yield to the portfolio, even during volatile times. The actions we took during the past year illustrate the degree to which valuation influences portfolio positioning.
Dynamic Credit Valuations Prompt Portfolio Shifts
Corporate bonds performed well for the first half of 2014, as solid underlying fundamentals and strong demand for higher-yielding assets contributed to narrowing yield premiums.(f) In fact, before widening in the third quarter, corporate bond yield premiums narrowed to mid-2007 levels. We responded to these higher valuations by reducing numerous corporate holdings (amounting to 2.0% of the fixed income portfolio) through the end of September.
DODGE & COX BALANCED FUND §PAGE 2
Later in the year, as the triple threat of plunging oil prices, global economic weakness, and overall risk aversion hit corporate and quasi-corporate (government-related) yield premiums, we reassessed the opportunity set at new, more attractive valuations. Consequently, we gradually increased the portfolio’s corporate weighting again; it ended the year at 44% of the fixed income portfolio. A particular area of interest for us has been non-U.S. issuers spanning corporate, government-related, and asset-backed security (ABS) issuers. Of note, we established new positions in two European banks (BNP Paribas and Lloyds Bank), added to Cemex, and built positions in Pemex and Rio Oil(g) (a structured note backed by oil and gas royalties in Brazil). In the case of Rio Oil, we increased the portfolio’s weighting at a more attractive valuation (due to fourth quarter underperformance); the debt service coverage metrics and structural characteristics of the security are important to our investment thesis.
MBS Portfolio: Changes in Mix
The portfolio’s Agency MBS holdings performed well in 2014 as the Fed’s quantitative easing (QE) program, low levels of interest rate volatility, and subdued prepayments drove positive absolute returns for the year and excess returns(h) over shorter-duration(i) alternatives. Similar to the credit portion of the portfolio, valuation has been a key driver of shifts within the portfolio’s MBS holdings. In the past year, the portfolio’s MBS weighting remained relatively constant— ranging between 33% and 38% of the fixed income portfolio—but we made intra-sector shifts to portfolio positioning based on changes in relative valuations within the sector.
Notably, we greatly reduced the portfolio’s holdings in higher-coupon 30-year MBS by capitalizing on rich valuations and the market’s belief that prepayments would continue to be subdued. At the same time, we uncovered investment opportunities among the 15-year and 20-year sectors of the universe; together they comprise a small part of the Barclays U.S. Agg but are a growing part of the portfolio’s MBS position. These inherently defensive cash flows benefit from a short amortization schedule, which limits the range of outcomes insofar as prepayment savings must be somewhat higher for these securities relative to 30-year MBS in order to spur refinancings. Similarly, we
increased holdings in hybrid ARMs—loans that are fixed for a period of time and then become floating. The floating rate component of these loans mitigates adverse price declines due to their shorter relative durations. In addition, their prices relative to par are lower than their longer-duration, high-coupon counterparts. Lastly, we added several new ABS holdings to the portfolio during the year. The portfolio’s ABS (7% of the fixed income portfolio at year end) in general offer an attractive combination of quality collateral, robust structure, proven liquidity, and incremental yield over short-term Treasuries.
We believe that the portfolio’s current holdings in structured products, including recent shifts, improve long-term risk-adjusted total return prospects across a variety of interest rate and prepayment environments. We rely on the bottom-up valuation and fundamental research framework to help navigate future uncertainty and volatility.
Duration Discussion
The portfolio’s relative interest rate positioning over the course of 2014 was dynamic as Treasury yields shifted meaningfully. We began the year with a fixed income portfolio duration that was roughly 84% of the Barclays U.S. Agg’s, having lengthened modestly into the rising interest rates of 2013. As interest rates declined in the first half of 2014, we reversed the duration extension of 2013 to roughly 72% of the Barclays U.S. Agg’s at year end. The magnitude of interest rate declines in 2014 was unexpected, given the solid footing of the U.S. economy, the benefits of lower oil prices to the end consumer, and the Fed’s ending of QE and guidance to begin raising short-term interest rates over the coming months. It is our view that the fundamentals do not justify the current low
level of interest rates in light of the strength of the U.S. economy, even considering the potential impact of global economic weakness on the United States. Market valuations imply very low expectations for future inflation and a slow pace of rate hikes by the Fed (with a low “terminal rate”(j)). We believe it is important to remain defensive at this time in order to mitigate the negative effect of price declines on fixed income instruments resulting from potential increases in interest rates.
PAGE 3 § DODGE & COX BALANCED FUND
IN CLOSING
In our opinion, the Fund’s equity portfolio remains well positioned to benefit from long-term global growth opportunities. The U.S. equity market remains reasonably valued: the S&P 500 traded at 15.2 times forward estimated earnings at year end, which was in line with its 10-year historical average of 15.4 times. We are optimistic about the long-term prospects for sales and earnings growth and believe that cash returned to shareholders can continue to increase. The fixed income portfolio, with its defensive duration posture and higher yield than the Barclays U.S. Agg, is positioned to soften the effects of increases in interest rates that could reduce fixed income asset values. Acknowledging that markets can be volatile in the short term, we encourage shareholders to remain focused on the long term.
Thank you for your continued confidence in our firm. As always, we welcome your comments and questions.
For the Board of Trustees,
| | |
| |
|
Charles F. Pohl, Chairman | | Dana M. Emery, President |
January 27, 2015
| (a) | | The Combined Index reflects an unmanaged portfolio (rebalanced monthly) of 60% of the S&P 500 Index, which is a market capitalization-weighted index of 500 large capitalization stocks commonly used to represent the U.S. equity market, and 40% of the Barclays U.S. Aggregate Bond Index (Barclays U.S. Agg), which is a widely recognized, unmanaged index of U.S. dollar-denominated, investment-grade, taxable fixed income securities. |
| (b) | | The Fund’s equity portfolio includes a 66.7% weighting in common stocks and a 2.0% weighting in preferred stocks. |
| (c) | | The U.S. Government does not guarantee the Fund’s shares, yield, or net asset value. The agency guarantee (by, for example, Ginnie Mae, Fannie Mae, or Freddie Mac) does not eliminate market risk. |
| (d) | | The use of specific examples does not imply that they are more attractive investments than the Fund’s other holdings. |
| (e) | | Unless otherwise specified, all weightings and characteristics are as of December 31, 2014. |
| (f) | | Yield premiums are one way to measure a security’s valuation. Narrowing yield premiums results in a higher valuation. Widening yield premiums results in a lower valuation. |
| (g) | | Rio Oil is an asset-backed security but is discussed here in relation to the portfolio’s increase in non-U.S.-related holdings. |
| (h) | | “Excess returns” refers to duration-adjusted returns for a given sector; it is calculated and reported by Barclays. |
| (i) | | Duration is a measure of a bond’s (or a bond portfolio’s) price sensitivity to changes in interest rates. |
| (j) | | “Terminal rate” refers to the ending Fed funds rate at the conclusion of the Fed’s tightening cycle. |
DODGE & COX BALANCED FUND §PAGE 4
ANNUAL PERFORMANCE REVIEW
The Fund underperformed the Combined Index by 1.8 percentage points in 2014. The Fund’s higher allocation to equities had a positive impact on relative results.
Equity Portfolio
| | § | | The Fund’s holdings in the Health Care sector (up 9% compared to up 25% for the S&P 500 sector) hurt results. GlaxoSmithKline (down 16%) and Sanofi (down 13%) lagged. | |
| | § | | Returns from holdings in the Financials sector (up 13% compared to up 15% for the S&P 500 sector) hindered performance. Key detractors included AEGON (down 18%) and the Fund’s lack of holdings in the Real Estate Investment Trusts industry, which outpaced the overall market (up 31%). | |
| | § | | The portfolio’s holdings in the Consumer Discretionary sector (up 15% compared to up 10% for the S&P 500 sector) helped returns. CarMax (up 42%), Target (up 30% since date of purchase), and Time Warner (up 30%) were strong. | |
| | § | | Returns from holdings in the Materials sector (up 14% compared to up 6% for the S&P 500 sector) aided performance. | |
Fixed Income Portfolio
| | § | | The portfolio’s defensive duration positioning (approximately 84% of the Barclays U.S. Agg’s duration at the start of 2014) hampered relative returns as interest rates generally declined year-over-year. | |
| | § | | The portfolio’s overweight to corporate bonds (44% versus 22% for the Barclays U.S. Agg) detracted mildly from relative returns given the sector’s relative underperformance. | |
| | § | | Security selection was positive, particularly among the portfolio’s non-U.S. domiciled and/or lower-rated holdings. Strong performers included Bank of America and JPMorgan capital securities, Enel, Cigna, Telecom Italia, Twenty-First Century Fox, Macy’s, and Time Warner Cable. | |
| | § | | The portfolio’s taxable municipal holdings (5% versus 1% for the Barclays U.S. Agg) performed well, particularly State of California general obligation bonds. | |
| | | | Unless otherwise noted, figures cited in this section denote portfolio positioning at the beginning of the period. | |
KEY CHARACTERISTICS OF DODGE & COX
Independent Organization
Dodge & Cox is one of the largest privately owned investment managers in the world. We remain committed to independence, with a goal of providing the highest quality investment management service to our existing clients.
Over 80 Years of Investment Experience
Dodge & Cox was founded in 1930. We have a stable and well-qualified team of investment professionals, most of whom have spent their entire careers at Dodge & Cox.
Experienced Investment Team
The Investment Policy Committee, which is the decision-making body for the equity portion of the Balanced Fund, is a nine-member committee with an average tenure at Dodge & Cox of 26 years. The Fixed Income Investment Policy Committee, which is the decision-making body for the Fixed Income portion of the Balanced Fund, is a nine-member committee with an average tenure of 18 years.
One Business with a Single Research Office
Dodge & Cox manages equity (domestic, international, and global), fixed income (domestic and global), and balanced investments, operating from one office in San Francisco.
Consistent Investment Approach
Our team decision-making process involves thorough, bottom-up fundamental analysis of each investment.
Long-Term Focus and Low Expenses
We invest with a three- to five-year investment horizon, which has historically resulted in low turnover relative to our peers. We manage Funds that maintain low expense ratios.
Risks: The Fund is subject to market risk, meaning stocks may decline in value for extended periods due to the financial prospects of individual companies or general market conditions. The Fund also invests in debt securities whose yields and market values fluctuate, so that an investment may be worth more or less than its original cost. Debt securities are subject to interest rate risk, credit risk, and prepayment risk, all of which could have adverse effects on the value of the Fund. A low interest rate environment creates an elevated risk of future negative returns. Financial intermediaries may restrict their market making activities for certain debt securities, which may reduce the liquidity and increase the volatility of such securities. Please read the prospectus and summary prospectus for specific details regarding the Fund’s risk profile.
PAGE 5 § DODGE & COX BALANCED FUND
GROWTH OF $10,000 OVER 10 YEARS
FOR AN INVESTMENT MADE ON DECEMBER 31, 2004
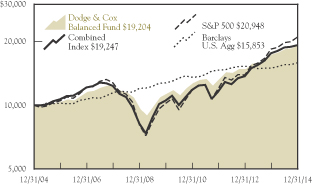
AVERAGE ANNUAL TOTAL RETURN
FOR PERIODS ENDED DECEMBER 31, 2014
| | | | | | | | | | | | | | | | |
| | | 1 Year | | | 5 Years | | | 10 Years | | | 20 Years | |
| | | | | | | | | | | | | | | | |
Dodge & Cox Balanced Fund | | | 8.85 | % | | | 12.78 | % | | | 6.75 | % | | | 10.29 | % |
Combined Index(a) | | | 10.62 | | | | 11.19 | | | | 6.77 | | | | 8.70 | |
S&P 500 | | | 13.69 | | | | 15.46 | | | | 7.68 | | | | 9.85 | |
Barclays U.S. Aggregate Bond Index (Barclays U.S. Agg) | | | 5.95 | | | | 4.46 | | | | 4.71 | | | | 6.21 | |
Returns represent past performance and do not guarantee future results. Investment return and share price will fluctuate with market conditions, and investors may have a gain or loss when shares are sold. Fund performance changes over time and currently may be significantly lower than stated. Performance is updated and published monthly. Visit the Fund’s website at www.dodgeandcox.com or call 800-621-3979 for current performance figures.
The Fund’s total returns include the reinvestment of dividend and capital gain distributions, but have not been adjusted for any income taxes payable by shareholders on these distributions or on Fund share redemptions. Index returns include dividends and/or interest income but, unlike Fund returns, do not reflect fees or expenses.
Standard & Poor’s, Standard & Poor’s 500, and S&P 500® are trademarks of McGraw Hill Financial. Barclays® is a trademark of Barclays Bank PLC.
| (a) | The Combined Index reflects an unmanaged portfolio (rebalanced monthly) of 60% of the S&P 500 Index, which is a market capitalization-weighted index of 500 large-capitalization stocks commonly used to represent the U.S. equity market, and 40% of the Barclays U.S. Aggregate Bond Index (Barclays U.S. Agg), which is a widely recognized, unmanaged index of U.S. dollar-denominated, investment-grade, taxable fixed income securities. The Fund may, however, invest up to 75% of its total assets in equity securities. |
FUND EXPENSE EXAMPLE
As a Fund shareholder, you incur ongoing Fund costs, including management fees and other Fund expenses. All mutual funds have ongoing costs, sometimes referred to as operating expenses. The following example shows ongoing costs of investing in the Fund and can help you understand these costs and compare them with those of other mutual funds. The example assumes a $1,000 investment held for the six months indicated.
ACTUAL EXPENSES
The first line of the table below provides information about actual account values and expenses based on the Fund’s actual returns. You may use the information in this line, together with your account balance, to estimate the expenses that you paid over the period. Simply divide your account value by $1,000 (for example, an $8,600 account value divided by $1,000 = 8.6), then multiply the result by the number in the first line under the heading “Expenses Paid During Period” to estimate the expenses you paid on your account during this period.
HYPOTHETICAL EXAMPLE FOR COMPARISON WITH OTHER MUTUAL FUNDS
Information on the second line of the table can help you compare ongoing costs of investing in the Fund with those of other mutual funds. This information may not be used to estimate the actual ending account balance or expenses you paid during the period. The hypothetical “Ending Account Value” is based on the actual expense ratio of the Fund and an assumed 5% annual rate of return before expenses (not the Fund’s actual return). The amount under the heading “Expense Paid During the Period” shows the hypothetical expenses your account would have incurred under this scenario. You can compare this figure with the 5% hypothetical examples that appear in shareholder reports of other mutual funds.
| | | | | | | | | | | | |
Six Months Ended
December 31, 2014 | | Beginning Account Value
7/1/2014 | | | Ending Account Value
12/31/2014 | | | Expenses Paid
During Period* | |
Based on Actual Fund Return | | $ | 1,000.00 | | | $ | 1,024.60 | | | $ | 2.69 | |
Based on Hypothetical 5% Yearly Return | | | 1,000.00 | | | | 1,022.55 | | | | 2.68 | |
| * | | Expenses are equal to the Fund’s annualized expense ratio of 0.53%, multiplied by the average account value over the period, multiplied by 184/365 (to reflect the one-half year period). |
The expenses shown in the table highlight ongoing costs only and do not reflect any transactional fees or account maintenance fees. Though other mutual funds may charge such fees, please note that the Fund does not charge transaction fees (e.g., redemption fees, sales loads) or universal account maintenance fees (e.g., small account fees).
DODGE & COX BALANCED FUND §PAGE 6
| | | | |
| FUND INFORMATION | | | December 31, 2014 | |
| | | | |
| GENERAL INFORMATION | | | |
Net Asset Value Per Share | | | $102.48 | |
Total Net Assets (billions) | | | $15.5 | |
30-Day SEC Yield(a) | | | 1.78% | |
Expense Ratio | | | 0.53% | |
Portfolio Turnover Rate | | | 23% | |
Fund Inception | | | 1931 | |
No sales charges or distribution fees | | | | |
Investment Manager: Dodge & Cox, San Francisco. Managed by the Investment Policy Committee, whose nine members’ average tenure at Dodge & Cox is 26 years, and by the Fixed Income Investment Policy Committee, whose nine members’ average tenure is 18 years.
| | | | |
| EQUITY PORTFOLIO (68.7%) | | Fund | |
Number of Equity Securities | | | 65 | |
Median Market Capitalization (billions) | | | $43 | |
Price-to-Earnings Ratio(b) | | | 14.7x | |
Foreign Securities not in the S&P 500(c) | | | 7.2% | |
| | | | |
| SECTOR DIVERSIFICATION (%) (FIVE LARGEST) | |
Financials | | | 17.9 | |
Information Technology | | | 16.1 | |
Health Care | | | 11.3 | |
Consumer Discretionary | | | 10.5 | |
Energy | | | 5.8 | |
| | | | |
| TEN LARGEST EQUITY SECURITIES (%)(d) | | | |
Hewlett-Packard Co. | | | 2.8 | |
Wells Fargo & Co. | | | 2.7 | |
Capital One Financial Corp. | | | 2.7 | |
JPMorgan Chase & Co. | | | 2.7 | |
Microsoft Corp. | | | 2.6 | |
Novartis AG (Switzerland) | | | 2.2 | |
Time Warner, Inc. | | | 2.1 | |
Time Warner Cable, Inc. | | | 2.0 | |
Charles Schwab Corp. | | | 1.9 | |
Bank of America Corp. | | | 1.9 | |
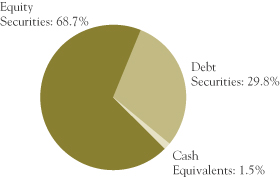
| | | | |
| FIXED INCOME PORTFOLIO (29.8%) | | Fund | |
Number of Debt Securities | | | 341 | |
Effective Duration (years) | | | 4.0 | |
| | | | |
| SECTOR DIVERSIFICATION (%) | | | |
U.S. Treasury(e) | | | 2.7 | |
Government-Related | | | 2.0 | |
Mortgage-Related(f) | | | 10.0 | |
Corporate | | | 13.1 | |
Asset-Backed | | | 2.0 | |
| | | | |
| CREDIT QUALITY (%)(g) | | | |
U.S. Treasury/Agency/GSE(e) | | | 12.8 | |
Aaa | | | 1.4 | |
Aa | | | 0.3 | |
A | | | 2.8 | |
Baa | | | 8.8 | |
Ba | | | 2.9 | |
B | | | 0.8 | |
| | | | |
| FIVE LARGEST CORPORATE ISSUERS (%)(d) | | | |
Cox Enterprises, Inc. | | | 0.6 | |
Bank of America Corp. | | | 0.6 | |
Verizon Communications, Inc. | | | 0.5 | |
Time Warner Cable, Inc. | | | 0.5 | |
Macy’s, Inc. | | | 0.4 | |
| (a) | SEC Yield is an annualization of the Fund’s total net investment income per share for the 30-day period ended on the last day of the month. |
| (b) | Price-to-earnings (P/E) ratio is calculated using 12-month forward earnings estimates from third-party sources. |
| (c) | Foreign stocks are U.S. dollar denominated. |
| (d) | The Fund’s portfolio holdings are subject to change without notice. The mention of specific securities is not a recommendation to buy, sell, or hold any particular security and is not indicative of Dodge & Cox’s current or future trading activity. |
| (e) | Data as presented excludes the effect of the Fund’s position in Treasury futures contracts. |
| (f) | The fixed income portfolio holds 0.4% in Agency multifamily mortgage securities; the Index classifies these securities under CMBS – Agency. |
| (g) | The credit quality distribution shown for the Fund is based on the middle of Moody’s, S&P’s, and Fitch ratings, which is the methodology used by Barclays in constructing its indices. If a security is rated by only two agencies, the lower of the two ratings is used. Please note the Fund applies the highest of Moody’s, S&P’s, and Fitch ratings to determine compliance with the quality requirements stated in its prospectus. The credit quality of the investments in the portfolio does not apply to the stability or safety of the Fund or its shares. |
PAGE 7 § DODGE & COX BALANCED FUND
| | | | |
| PORTFOLIO OF INVESTMENTS | | | December 31, 2014 | |
| | | | | | | | |
| COMMON STOCKS: 66.7% | |
| | |
| | | SHARES | | | VALUE | |
| CONSUMER DISCRETIONARY: 10.1% | |
CONSUMER DURABLES & APPAREL: 0.4% | | | | | |
Coach, Inc. | | | 1,715,036 | | | $ | 64,416,752 | |
| |
MEDIA: 7.9% | | | | | |
Comcast Corp., Class A | | | 5,054,774 | | | | 293,227,440 | |
DISH Network Corp., Class A(a) | | | 1,145,032 | | | | 83,461,382 | |
News Corp., Class A(a) | | | 728,050 | | | | 11,423,104 | |
Time Warner Cable, Inc. | | | 2,035,883 | | | | 309,576,369 | |
Time Warner, Inc. | | | 3,817,066 | | | | 326,053,778 | |
Time, Inc. | | | 664,633 | | | | 16,356,618 | |
Twenty-First Century Fox, Inc. | | | 4,832,200 | | | | 185,580,641 | |
| | | | | | | | |
| | | | | | | 1,225,679,332 | |
RETAILING: 1.8% | | | | | | | | |
CarMax, Inc.(a) | | | 701,000 | | | | 46,672,580 | |
Liberty Interactive Corp., Series A(a) | | | 2,309,650 | | | | 67,949,903 | |
Liberty Ventures, Series A(a) | | | 328,362 | | | | 12,385,815 | |
Target Corp. | | | 1,885,900 | | | | 143,158,669 | |
| | | | | | | | |
| | | | | | | 270,166,967 | |
| | | | | | | | |
| | | | | | | 1,560,263,051 | |
| CONSUMER STAPLES: 1.8% | |
FOOD & STAPLES RETAILING: 1.8% | | | | | |
Wal-Mart Stores, Inc. | | | 3,201,900 | | | | 274,979,172 | |
| | | | | | | | |
| ENERGY: 5.8% | | | | | | | | |
Apache Corp. | | | 3,205,378 | | | | 200,881,039 | |
Baker Hughes, Inc. | | | 2,497,579 | | | | 140,039,255 | |
Chevron Corp. | | | 1,348,579 | | | | 151,283,592 | |
National Oilwell Varco, Inc. | | | 1,480,000 | | | | 96,984,400 | |
Schlumberger, Ltd.(b) (Curacao/United States) | | | 2,929,021 | | | | 250,167,684 | |
Weatherford International PLC(a),(b) (Ireland) | | | 4,600,000 | | | | 52,670,000 | |
| | | | | | | | |
| | | | | | | 892,025,970 | |
| FINANCIALS: 16.3% | | | | | | | | |
BANKS: 6.8% | | | | | | | | |
Bank of America Corp. | | | 16,665,600 | | | | 298,147,584 | |
BB&T Corp. | | | 2,889,584 | | | | 112,375,922 | |
JPMorgan Chase & Co. | | | 2,579,900 | | | | 161,450,142 | |
SunTrust Banks, Inc. | | | 1,384,490 | | | | 58,010,131 | |
Wells Fargo & Co. | | | 7,698,506 | | | | 422,032,099 | |
| | | | | | | | |
| | | | | | | 1,052,015,878 | |
DIVERSIFIED FINANCIALS: 8.1% | |
Bank of New York Mellon Corp. | | | 7,284,800 | | | | 295,544,336 | |
Capital One Financial Corp. | | | 5,082,659 | | | | 419,573,500 | |
Charles Schwab Corp. | | | 10,049,900 | | | | 303,406,481 | |
Goldman Sachs Group, Inc. | | | 1,257,000 | | | | 243,644,310 | |
| | | | | | | | |
| | | | | | | 1,262,168,627 | |
INSURANCE: 1.4% | | | | | | | | |
AEGON NV(b) (Netherlands) | | | 12,311,165 | | | | 92,333,738 | |
MetLife, Inc. | | | 2,230,000 | | | | 120,620,700 | |
| | | | | | | | |
| | | | | | | 212,954,438 | |
| | | | | | | | |
| | | | | | | 2,527,138,943 | |
| | | | | | | | |
| | |
| | | SHARES | | | VALUE | |
| HEALTH CARE: 11.3% | |
HEALTH CARE EQUIPMENT & SERVICES: 3.1% | |
Cigna Corp. | | | 976,216 | | | $ | 100,462,388 | |
Express Scripts Holding Co.(a) | | | 1,940,000 | | | | 164,259,800 | |
Medtronic, Inc. | | | 720,200 | | | | 51,998,440 | |
UnitedHealth Group, Inc. | | | 1,720,762 | | | | 173,951,831 | |
| | | | | | | | |
| | | | | | | 490,672,459 | |
PHARMACEUTICALS, BIOTECHNOLOGY & LIFE SCIENCES: 8.2% | |
GlaxoSmithKline PLC ADR(b) (United Kingdom) | | | 2,008,600 | | | | 85,847,564 | |
Merck & Co., Inc. | | | 3,327,175 | | | | 188,950,268 | |
Novartis AG ADR(b) (Switzerland) | | | 3,684,900 | | | | 341,442,834 | |
Pfizer, Inc. | | | 5,248,417 | | | | 163,488,189 | |
Roche Holding AG ADR(b) (Switzerland) | | | 7,550,000 | | | | 256,624,500 | |
Sanofi ADR(b) (France) | | | 5,045,165 | | | | 230,109,976 | |
| | | | | | | | |
| | | | | | | 1,266,463,331 | |
| | | | | | | | |
| | | | | | | 1,757,135,790 | |
| INDUSTRIALS: 4.4% | | | | | | | | |
CAPITAL GOODS: 1.6% | | | | | | | | |
Danaher Corp. | | | 1,201,132 | | | | 102,949,024 | |
General Electric Co. | | | 3,959,500 | | | | 100,056,565 | |
Koninklijke Philips NV(b) (Netherlands) | | | 1,258,599 | | | | 36,499,371 | |
NOW, Inc.(a) | | | 370,000 | | | | 9,520,100 | |
| | | | | | | | |
| | | | | | | 249,025,060 | |
COMMERCIAL & PROFESSIONAL SERVICES: 1.1% | |
ADT Corp. | | | 2,217,717 | | | | 80,347,887 | |
Tyco International PLC(b) (Ireland) | | | 2,295,434 | | | | 100,677,735 | |
| | | | | | | | |
| | | | | | | 181,025,622 | |
TRANSPORTATION: 1.7% | | | | | | | | |
FedEx Corp. | | | 1,492,954 | | | | 259,266,391 | |
| | | | | | | | |
| | | | | | | 689,317,073 | |
| INFORMATION TECHNOLOGY: 16.1% | |
SEMICONDUCTORS & SEMICONDUCTOR EQUIPMENT: 0.6% | |
Maxim Integrated Products, Inc. | | | 2,793,791 | | | | 89,038,119 | |
|
SOFTWARE & SERVICES: 7.9% | |
AOL, Inc.(a) | | | 1,019,074 | | | | 47,050,647 | |
Cadence Design Systems, Inc.(a) | | | 1,370,700 | | | | 26,002,179 | |
eBay, Inc.(a) | | | 2,813,331 | | | | 157,884,136 | |
Google, Inc., Class A(a) | | | 138,000 | | | | 73,231,080 | |
Google, Inc., Class C(a) | | | 326,000 | | | | 171,606,400 | |
Microsoft Corp. | | | 8,494,900 | | | | 394,588,105 | |
Symantec Corp. | | | 9,344,000 | | | | 239,720,320 | |
Synopsys, Inc.(a) | | | 2,503,100 | | | | 108,809,757 | |
| | | | | | | | |
| | | | | | | 1,218,892,624 | |
| | |
| See accompanying Notes to Financial Statements | | DODGE & COX BALANCED FUND §PAGE 8 |
| | | | |
| PORTFOLIO OF INVESTMENTS | | | December 31, 2014 | |
| | | | | | | | |
| COMMON STOCKS (continued) | |
| | |
| | | SHARES | | | VALUE | |
TECHNOLOGY, HARDWARE & EQUIPMENT: 7.6% | |
Cisco Systems, Inc. | | | 3,451,100 | | | $ | 95,992,346 | |
Corning, Inc. | | | 6,505,000 | | | | 149,159,650 | |
EMC Corp. | | | 4,650,000 | | | | 138,291,000 | |
Hewlett-Packard Co. | | | 10,925,512 | | | | 438,440,797 | |
Juniper Networks, Inc. | | | 1,748,026 | | | | 39,015,940 | |
NetApp, Inc. | | | 3,607,187 | | | | 149,517,901 | |
Nokia Corp. ADR(b) (Finland) | | | 2,789,460 | | | | 21,925,156 | |
TE Connectivity, Ltd.(b) (Switzerland) | | | 2,280,536 | | | | 144,243,902 | |
| | | | | | | | |
| | | | | | | 1,176,586,692 | |
| | | | | | | | |
| | | | | | | 2,484,517,435 | |
| MATERIALS: 0.6% | | | | | | | | |
Celanese Corp., Series A | | | 1,555,960 | | | | 93,295,362 | |
|
TELECOMMUNICATION SERVICES: 0.3% | |
Sprint Corp.(a) | | | 10,715,891 | | | | 44,470,948 | |
| | | | | | | | |
TOTAL COMMON STOCKS
(Cost $6,681,561,044) | | | $ | 10,323,143,744 | |
|
| PREFERRED STOCKS: 2.0% | |
| CONSUMER DISCRETIONARY: 0.4% | |
MEDIA: 0.4% | | | | | | | | |
NBCUniversal Enterprise, Inc. 5.25%(d) | | | 52,710 | | | | 54,686,625 | |
| | |
| FINANCIALS: 1.6% | | | | | | | | |
BANKS: 1.6% | | | | | | | | |
JPMorgan Chase & Co. 6.10% | | | 254,565 | | | | 253,928,587 | |
| | | | | | | | |
TOTAL PREFERRED STOCKS
(Cost $307,283,249) | | | $ | 308,615,212 | |
|
| DEBT SECURITIES: 29.8% | |
| | |
| | | PAR VALUE | | | VALUE | |
| U.S. TREASURY: 2.7% | |
U.S. Treasury Note | | | | | | | | |
0.25%, 11/30/15 | | $ | 44,480,000 | | | $ | 44,478,265 | |
1.50%, 7/31/16 | | | 71,000,000 | | | | 72,073,307 | |
0.625%, 2/15/17 | | | 56,655,000 | | | | 56,495,686 | |
0.50%, 7/31/17 | | | 102,000,000 | | | | 100,820,676 | |
1.50%, 2/28/19 | | | 44,580,000 | | | | 44,593,909 | |
1.625%, 7/31/19 | | | 95,000,000 | | | | 95,140,980 | |
| | | | | | | | |
| | | | | | | 413,602,823 | |
| GOVERNMENT-RELATED: 2.0% | |
FEDERAL AGENCY: 0.1% | | | | | | | | |
Small Business Admin. — 504 Program | |
Series 1996-20L 1, 6.70%, 12/1/16 | | | 164,277 | | | | 169,971 | |
Series 1997-20F 1, 7.20%, 6/1/17 | | | 278,544 | | | | 292,069 | |
Series 1997-20I 1, 6.90%, 9/1/17 | | | 438,055 | | | | 460,778 | |
Series 1998-20D 1, 6.15%, 4/1/18 | | | 445,644 | | | | 464,297 | |
| | | | | | | | |
| | |
| | | PAR VALUE | | | VALUE | |
Series 1998-20I 1, 6.00%, 9/1/18 | | $ | 373,994 | | | $ | 390,321 | |
Series 1999-20F 1, 6.80%, 6/1/19 | | | 356,020 | | | | 378,922 | |
Series 2000-20D 1, 7.47%, 4/1/20 | | | 1,333,706 | | | | 1,454,043 | |
Series 2000-20E 1, 8.03%, 5/1/20 | | | 425,296 | | | | 470,076 | |
Series 2000-20G 1, 7.39%, 7/1/20 | | | 683,481 | | | | 741,388 | |
Series 2000-20I 1, 7.21%, 9/1/20 | | | 492,380 | | | | 536,244 | |
Series 2001-20E 1, 6.34%, 5/1/21 | | | 1,282,044 | | | | 1,384,978 | |
Series 2001-20G 1, 6.625%, 7/1/21 | | | 1,387,936 | | | | 1,507,618 | |
Series 2003-20J 1, 4.92%, 10/1/23 | | | 4,377,492 | | | | 4,711,380 | |
Series 2007-20F 1, 5.71%, 6/1/27 | | | 4,724,701 | | | | 5,306,113 | |
| | | | | | | | |
| | | | | | | 18,268,198 | |
FOREIGN AGENCY: 0.6% | | | | | | | | |
Export-Import Bank of Korea(b)
(South Korea)
4.00%, 1/11/17 | | | 4,350,000 | | | | 4,560,236 | |
Petroleo Brasileiro SA(b) (Brazil) | | | | | | | | |
5.375%, 1/27/21 | | | 12,710,000 | | | | 11,776,705 | |
4.375%, 5/20/23 | | | 29,800,000 | | | | 25,630,384 | |
6.25%, 3/17/24 | | | 8,400,000 | | | | 7,992,936 | |
Petroleos Mexicanos(b) (Mexico) | | | | | | | | |
4.25%, 1/15/25(d) | | | 22,685,000 | | | | 22,537,547 | |
6.625%, 6/15/35 | | | 3,075,000 | | | | 3,551,625 | |
6.375%, 1/23/45 | | | 17,125,000 | | | | 19,394,062 | |
| | | | | | | | |
| | | | | | | 95,443,495 | |
LOCAL AUTHORITY: 1.2% | | | | | | | | |
New Jersey Turnpike Authority RB | | | | | | | | |
7.414%, 1/1/40 | | | 3,350,000 | | | | 5,034,179 | |
7.102%, 1/1/41 | | | 12,436,000 | | | | 18,036,304 | |
State of California GO | | | | | | | | |
7.50%, 4/1/34 | | | 13,470,000 | | | | 20,024,232 | |
7.55%, 4/1/39 | | | 16,525,000 | | | | 25,501,215 | |
7.30%, 10/1/39 | | | 13,730,000 | | | | 20,224,153 | |
7.625%, 3/1/40 | | | 8,790,000 | | | | 13,492,650 | |
State of Illinois GO | | | | | | | | |
4.961%, 3/1/16 | | | 3,215,000 | | | | 3,349,162 | |
5.365%, 3/1/17 | | | 37,215,000 | | | | 39,840,518 | |
5.665%, 3/1/18 | | | 26,160,000 | | | | 28,645,985 | |
| | | | | | | | |
| | | | | | | 174,148,398 | |
SOVEREIGN: 0.1% | | | | | | | | |
Spain Government International(b) (Spain)
4.00%, 3/6/18(d) | | | 11,850,000 | | | | 12,467,504 | |
| | | | | | | | |
| | | | | | | 300,327,595 | |
| MORTGAGE-RELATED: 10.0% | |
FEDERAL AGENCY CMO & REMIC: 2.5% | |
Dept. of Veterans Affairs | | | | | | | | |
Series 1995-1 1, 7.23%, 2/15/25 | | | 471,058 | | | | 536,223 | |
Series 1995-2C 3A, 8.793%, 6/15/25 | | | 210,560 | | | | 250,605 | |
Series 2002-1 2J, 6.50%, 8/15/31 | | | 12,423,079 | | | | 14,316,605 | |
Fannie Mae | | | | | | | | |
Trust 2002-33 A1, 7.00%, 6/25/32 | | | 2,334,093 | | | | 2,658,880 | |
Trust 2005-W4 1A2, 6.50%, 8/25/35 | | | 7,925,660 | | | | 8,938,258 | |
| | |
| PAGE 9 § DODGE & COX BALANCED FUND | | See accompanying Notes to Financial Statements |
| | | | |
| PORTFOLIO OF INVESTMENTS | | | December 31, 2014 | |
| | | | | | | | |
| DEBT SECURITIES (continued) | |
| | |
| | | PAR VALUE | | | VALUE | |
Trust 2009-66 ET, 6.00%, 5/25/39 | | $ | 7,496,317 | | | $ | 8,272,418 | |
Trust 2009-30 AG, 6.50%, 5/25/39 | | | 4,245,705 | | | | 4,606,943 | |
Trust 2001-T7 A1, 7.50%, 2/25/41 | | | 1,971,128 | | | | 2,258,922 | |
Trust 2001-T5 A3, 7.50%, 6/19/41 | | | 757,108 | | | | 869,372 | |
Trust 2001-T4 A1, 7.50%, 7/25/41 | | | 1,921,884 | | | | 2,285,515 | |
Trust 2001-T8 A1, 7.50%, 7/25/41 | | | 1,892,469 | | | | 2,130,797 | |
Trust 2001-W3 A, 6.918%, 9/25/41 | | | 1,449,825 | | | | 1,656,837 | |
Trust 2001-T10 A2, 7.50%, 12/25/41 | | | 1,686,813 | | | | 1,950,408 | |
Trust 2013-106 MA, 4.00%, 2/25/42 | | | 13,607,398 | | | | 14,311,690 | |
Trust 2002-W6 2A1, 6.45%, 6/25/42 | | | 1,965,366 | | | | 2,252,685 | |
Trust 2002-W8 A2, 7.00%, 6/25/42 | | | 2,453,404 | | | | 2,825,403 | |
Trust 2003-W2 1A1, 6.50%, 7/25/42 | | | 3,952,282 | | | | 4,549,056 | |
Trust 2003-W2 1A2, 7.00%, 7/25/42 | | | 1,527,512 | | | | 1,782,867 | |
Trust 2003-W4 4A, 7.017%, 10/25/42 | | | 2,225,714 | | | | 2,547,937 | |
Trust 2012-121 NB, 7.00%, 11/25/42 | | | 4,010,316 | | | | 4,638,095 | |
Trust 2012-134 FK, 0.52%, 12/25/42 | | | 16,824,534 | | | | 16,762,468 | |
Trust 2013-15 FA, 0.52%, 3/25/43 | | | 23,718,628 | | | | 23,774,889 | |
Trust 2013-98 FA, 0.72%, 9/25/43 | | | 11,642,597 | | | | 11,762,772 | |
Trust 2013-92 FA, 0.72%, 9/25/43 | | | 50,120,468 | | | | 50,660,215 | |
Trust 2004-T1 1A2, 6.50%, 1/25/44 | | | 2,525,656 | | | | 2,878,384 | |
Trust 2004-W2 5A, 7.50%, 3/25/44 | | | 5,424,584 | | | | 6,201,107 | |
Trust 2004-W8 3A, 7.50%, 6/25/44 | | | 888,485 | | | | 1,035,394 | |
Trust 2009-11 MP, 7.00%, 3/25/49 | | | 9,968,681 | | | | 11,352,972 | |
Freddie Mac | | | | | | | | |
Series 1078 GZ, 6.50%, 5/15/21 | | | 207,773 | | | | 217,458 | |
Series 16 PK, 7.00%, 8/25/23 | | | 3,041,208 | | | | 3,388,508 | |
Series T-48 1A4, 5.538%, 7/25/33 | | | 35,109,050 | | | | 38,988,003 | |
Series 4240 FA, 0.661%, 8/15/43 | | | 11,110,806 | | | | 11,133,417 | |
Series 314 F2, 0.771%, 9/15/43 | | | 24,282,885 | | | | 24,476,520 | |
Series T-51 1A, 6.50%, 9/25/43 | | | 236,570 | | | | 270,891 | |
Series T-59 1A1, 6.50%, 10/25/43 | | | 12,690,420 | | | | 14,664,986 | |
Series 4281 BC, 5.968%, 12/15/43 | | | 76,760,905 | | | | 85,077,872 | |
| | | | | | | | |
| | | | | | | 386,285,372 | |
FEDERAL AGENCY MORTGAGE PASS-THROUGH: 7.5% | |
Fannie Mae, 15 Year | | | | | | | | |
4.00%, 2/1/27-5/1/27 | | | 96,213,877 | | | | 102,865,811 | |
4.50%, 1/1/25-1/1/27 | | | 25,332,098 | | | | 27,363,581 | |
6.00%, 7/1/16-3/1/22 | | | 5,895,622 | | | | 6,161,944 | |
6.50%, 8/1/15-11/1/18 | | | 6,167,069 | | | | 6,426,122 | |
7.00%, 11/1/18 | | | 452,476 | | | | 471,001 | |
7.50%, 9/1/15-8/1/17 | | | 1,186,778 | | | | 1,213,869 | |
Fannie Mae, 20 Year | | | | | | | | |
4.00%, 11/1/30-12/1/34 | | | 170,740,484 | | | | 183,972,259 | |
4.50%, 1/1/31-5/1/32 | | | 81,170,139 | | | | 88,581,259 | |
6.50%, 1/1/22-10/1/26 | | | 3,278,313 | | | | 3,732,996 | |
Fannie Mae, 30 Year | | | | | | | | |
4.50%, 1/1/39-9/1/41 | | | 34,727,464 | | | | 38,070,483 | |
5.50%, 7/1/33-8/1/37 | | | 24,346,184 | | | | 27,381,400 | |
6.00%, 9/1/36-6/1/38 | | | 36,579,391 | | | | 41,585,451 | |
6.50%, 12/1/28-8/1/39 | | | 48,246,393 | | | | 54,988,542 | |
7.00%, 4/1/37-8/1/37 | | | 11,851,771 | | | | 13,291,166 | |
| | | | | | | | |
| | |
| | | PAR VALUE | | | VALUE | |
Fannie Mae, Hybrid ARM | | | | | | | | |
1.914%, 1/1/35 | | $ | 4,297,115 | | | $ | 4,522,521 | |
1.959%, 12/1/34 | | | 2,732,815 | | | | 2,884,138 | |
2.105%, 8/1/35 | | | 2,395,772 | | | | 2,542,991 | |
2.135%, 9/1/34 | | | 2,181,467 | | | | 2,327,854 | |
2.20%, 1/1/35 | | | 1,866,394 | | | | 2,003,367 | |
2.30%, 8/1/38 | | | 5,460,863 | | | | 5,843,350 | |
2.553%, 11/1/43 | | | 12,537,435 | | | | 12,982,454 | |
2.713%, 4/1/44 | | | 25,930,282 | | | | 26,818,563 | |
2.83%, 12/1/44 | | | 22,754,789 | | | | 23,473,103 | |
2.854%, 11/1/44 | | | 39,465,691 | | | | 40,740,962 | |
3.304%, 6/1/41 | | | 23,986,964 | | | | 25,266,448 | |
3.585%, 12/1/40 | | | 7,314,792 | | | | 7,665,242 | |
3.708%, 11/1/40 | | | 3,410,874 | | | | 3,582,527 | |
4.189%, 7/1/39 | | | 4,567,565 | | | | 4,825,247 | |
5.595%, 5/1/37 | | | 2,400,254 | | | | 2,476,956 | |
6.35%, 9/1/36 | | | 422,678 | | | | 436,305 | |
Fannie Mae, Multifamily DUS | | | | | | | | |
Pool 735387, 4.878%, 4/1/15 | | | 2,711,837 | | | | 2,706,955 | |
Pool 462086, 5.355%, 11/1/15 | | | 15,119,263 | | | | 15,474,352 | |
Freddie Mac, Hybrid ARM | | | | | | | | |
2.095%, 4/1/37 | | | 3,171,539 | | | | 3,362,701 | |
2.275%, 9/1/37 | | | 1,705,033 | | | | 1,816,178 | |
2.461%, 5/1/34 | | | 3,414,837 | | | | 3,668,791 | |
2.637%, 8/1/42 | | | 18,071,493 | | | | 18,652,048 | |
2.657%, 10/1/38 | | | 3,426,295 | | | | 3,645,946 | |
2.69%, 2/1/38 | | | 7,882,856 | | | | 8,507,292 | |
2.944%, 5/1/44 | | | 4,285,876 | | | | 4,436,413 | |
2.991%, 5/1/44 | | | 31,612,256 | | | | 32,745,221 | |
3.039%, 6/1/44 | | | 8,044,180 | | | | 8,342,748 | |
3.213%, 6/1/44 | | | 12,073,147 | | | | 12,641,546 | |
3.605%, 10/1/41 | | | 2,671,555 | | | | 2,797,992 | |
5.317%, 10/1/35 | | | 4,801,226 | | | | 5,054,468 | |
5.833%, 7/1/38 | | | 726,391 | | | | 779,110 | |
6.099%, 1/1/38 | | | 830,594 | | | | 888,042 | |
Freddie Mac Gold, 15 Year | | | | | | | | |
4.00%, 3/1/25-11/1/26 | | | 64,042,819 | | | | 68,464,756 | |
4.50%, 9/1/24-9/1/26 | | | 18,176,896 | | | | 19,627,699 | |
6.00%, 2/1/18 | | | 776,901 | | | | 810,755 | |
6.50%, 5/1/16-9/1/18 | | | 2,865,040 | | | | 2,970,551 | |
Freddie Mac Gold, 20 Year | | | | | | | | |
4.50%, 4/1/31-6/1/31 | | | 17,280,808 | | | | 18,831,027 | |
6.50%, 10/1/26 | | | 6,421,479 | | | | 7,295,023 | |
Freddie Mac Gold, 30 Year | | | | | | | | |
4.50%, 9/1/41-1/1/44 | | | 109,536,781 | | | | 118,769,036 | |
5.50%, 12/1/37 | | | 1,547,934 | | | | 1,739,761 | |
6.00%, 2/1/39 | | | 4,032,725 | | | | 4,593,740 | |
6.50%, 12/1/32-4/1/33 | | | 9,808,410 | | | | 11,192,339 | |
7.00%, 11/1/37-9/1/38 | | | 9,888,997 | | | | 11,021,929 | |
7.47%, 3/17/23 | | | 129,964 | | | | 145,647 | |
7.75%, 7/25/21 | | | 430,308 | | | | 478,071 | |
| | |
| See accompanying Notes to Financial Statements | | DODGE & COX BALANCED FUND §PAGE 10 |
| | | | |
| PORTFOLIO OF INVESTMENTS | | | December 31, 2014 | |
| | | | | | | | |
| DEBT SECURITIES (continued) | |
| | |
| | | PAR VALUE | | | VALUE | |
Ginnie Mae, 30 Year | | | | | | | | |
7.50%, 11/15/24-10/15/25 | | $ | 1,165,744 | | | $ | 1,357,537 | |
7.97%, 4/15/20-1/15/21 | | | 594,173 | | | | 646,090 | |
| | | | | | | | |
| | | | | | | 1,157,961,676 | |
| | | | | | | | |
| | | | | | | 1,544,247,048 | |
| | |
| ASSET-BACKED: 2.0% | | | | | | | | |
AUTO LOAN: 0.1% | | | | | | | | |
Ford Credit Auto Owner Trust
Series 2014-C A3, 1.06%, 5/15/19 | | | 23,000,000 | | | | 22,940,315 | |
| | |
CREDIT CARD: 1.0% | | | | | | | | |
American Express Master Trust
Series 2014-3 A, 1.49%, 4/15/20 | | | 16,025,000 | | | | 16,071,937 | |
Chase Issuance Trust | | | | | | | | |
Series 2013-A5 A, 0.47%, 5/15/17 | | | 12,175,000 | | | | 12,173,247 | |
Series 2012-A5 A5, 0.59%, 8/15/17 | | | 21,920,000 | | | | 21,926,642 | |
Series 2012-A8 A8, 0.54%, 10/16/17 | | | 54,983,000 | | | | 54,955,013 | |
Series 2013-A8 A8, 1.01%, 10/15/18 | | | 14,000,000 | | | | 13,997,998 | |
Series 2014-A1 A1, 1.15%, 1/15/19 | | | 18,400,000 | | | | 18,396,596 | |
Series 2014-A7 A, 1.38%, 11/15/19 | | | 23,000,000 | | | | 22,911,381 | |
| | | | | | | | |
| | | | | | | 160,432,814 | |
OTHER: 0.6% | | | | | | | | |
Rio Oil Finance Trust(b) (Brazil) | | | | | | | | |
6.25%, 7/6/24(d) | | | 53,625,000 | | | | 50,818,804 | |
6.75%, 1/6/27(d) | | | 42,925,000 | | | | 40,993,375 | |
| | | | | | | | |
| | | | | | | 91,812,179 | |
STUDENT LOAN: 0.3% | | | | | | | | |
SLM Student Loan Trust Securities (Private Loans) | | | | | | | | |
Series 2014-A A2A, 2.59%, 1/15/26(d) | | | 5,250,000 | | | | 5,315,210 | |
Series 2012-B A2, 3.48%, 10/15/30(d) | | | 9,725,000 | | | | 10,105,909 | |
Series 2012-E A2A, 2.09%, 6/15/45(d) | | | 13,775,000 | | | | 13,761,721 | |
Series 2012-C A2, 3.31%, 10/15/46(d) | | | 10,100,000 | | | | 10,471,862 | |
| | | | | | | | |
| | | | | | | 39,654,702 | |
| | | | | | | | |
| | | | | | | 314,840,010 | |
| | |
| CORPORATE: 13.1% | | | | | | | | |
FINANCIALS: 4.8% | | | | | | | | |
Anthem, Inc.
4.35%, 8/15/20 | | | 29,305,000 | | | | 31,748,890 | |
Bank of America Corp. | | | | | | | | |
5.30%, 3/15/17 | | | 19,000,000 | | | | 20,410,294 | |
7.625%, 6/1/19 | | | 6,800,000 | | | | 8,218,562 | |
5.625%, 7/1/20 | | | 5,030,000 | | | | 5,727,108 | |
4.20%, 8/26/24 | | | 9,325,000 | | | | 9,499,611 | |
6.625%, 5/23/36(c) | | | 37,275,000 | | | | 45,166,594 | |
Barclays PLC(b) (United Kingdom)
4.375%, 9/11/24 | | | 23,275,000 | | | | 22,479,278 | |
BNP Paribas SA(b) (France)
4.25%, 10/15/24 | | | 31,175,000 | | | | 31,560,011 | |
| | | | | | | | |
| | |
| | | PAR VALUE | | | VALUE | |
Boston Properties, Inc. | | | | | | | | |
5.875%, 10/15/19 | | $ | 7,960,000 | | | $ | 9,117,583 | |
5.625%, 11/15/20 | | | 3,850,000 | | | | 4,392,661 | |
3.85%, 2/1/23 | | | 7,800,000 | | | | 8,097,001 | |
3.125%, 9/1/23 | | | 17,550,000 | | | | 17,136,434 | |
3.80%, 2/1/24 | | | 11,175,000 | | | | 11,484,201 | |
Capital One Financial Corp. | | | | | | | | |
4.75%, 7/15/21 | | | 759,000 | | | | 836,523 | |
3.50%, 6/15/23 | | | 49,579,000 | | | | 50,107,165 | |
Cigna Corp. | | | | | | | | |
5.125%, 6/15/20 | | | 1,820,000 | | | | 2,028,244 | |
7.65%, 3/1/23 | | | 9,705,000 | | | | 12,402,825 | |
7.875%, 5/15/27 | | | 21,888,000 | | | | 29,905,859 | |
8.30%, 1/15/33 | | | 8,845,000 | | | | 12,090,016 | |
Citigroup, Inc. | | | | | | | | |
6.125%, 11/21/17 | | | 22,890,000 | | | | 25,526,104 | |
7.875%, 10/30/40(c) | | | 43,080,925 | | | | 45,803,639 | |
Equity Residential | | | | | | | | |
4.625%, 12/15/21 | | | 14,054,000 | | | | 15,375,217 | |
3.00%, 4/15/23 | | | 14,775,000 | | | | 14,409,939 | |
General Electric Co. | | | | | | | | |
5.50%, 1/8/20 | | | 25,095,000 | | | | 28,723,135 | |
4.375%, 9/16/20 | | | 8,475,000 | | | | 9,282,125 | |
4.625%, 1/7/21 | | | 5,750,000 | | | | 6,408,893 | |
4.65%, 10/17/21 | | | 9,825,000 | | | | 11,074,042 | |
Health Net, Inc.
6.375%, 6/1/17 | | | 13,275,000 | | | | 14,337,000 | |
HSBC Holdings PLC(b)
(United Kingdom) | | | | | | | | |
5.10%, 4/5/21 | | | 3,625,000 | | | | 4,097,693 | |
6.50%, 5/2/36 | | | 30,190,000 | | | | 38,774,043 | |
6.50%, 9/15/37 | | | 15,315,000 | | | | 19,678,029 | |
JPMorgan Chase & Co.
8.75%, 9/1/30(c) | | | 23,042,000 | | | | 33,281,243 | |
Lloyds Banking Group PLC(b)
(United Kingdom)
4.50%, 11/4/24 | | | 11,550,000 | | | | 11,655,555 | |
Navient Corp. | | | | | | | | |
3.875%, 9/10/15 | | | 7,625,000 | | | | 7,682,188 | |
6.00%, 1/25/17 | | | 14,285,000 | | | | 14,963,537 | |
4.625%, 9/25/17 | | | 9,550,000 | | | | 9,693,250 | |
8.45%, 6/15/18 | | | 11,855,000 | | | | 13,218,325 | |
Royal Bank of Scotland Group PLC(b) (United Kingdom) | | | | | | | | |
6.125%, 12/15/22 | | | 48,416,000 | | | | 52,696,265 | |
6.00%, 12/19/23 | | | 5,750,000 | | | | 6,223,789 | |
Unum Group | | | | | | | | |
7.19%, 2/1/28 | | | 8,305,000 | | | | 10,104,212 | |
7.25%, 3/15/28 | | | 2,030,000 | | | | 2,575,418 | |
6.75%, 12/15/28 | | | 11,368,000 | | | | 14,003,398 | |
| | | | | | | | |
| | | | | | | 741,995,899 | |
| | |
| PAGE 11 § DODGE & COX BALANCED FUND | | See accompanying Notes to Financial Statements |
| | | | |
| PORTFOLIO OF INVESTMENTS | | | December 31, 2014 | |
| | | | | | | | |
| DEBT SECURITIES (continued) | |
| | |
| | | PAR VALUE | | | VALUE | |
INDUSTRIALS: 7.9% | | | | | | | | |
AT&T, Inc. | | | | | | | | |
6.55%, 2/15/39 | | $ | 7,675,000 | | | $ | 9,460,021 | |
5.35%, 9/1/40 | | | 26,250,000 | | | | 28,424,051 | |
Becton, Dickinson and Co.
3.734%, 12/15/24 | | | 5,725,000 | | | | 5,891,924 | |
Boston Scientific Corp. | | | | | | | | |
6.25%, 11/15/15 | | | 1,055,000 | | | | 1,099,135 | |
6.40%, 6/15/16 | | | 24,811,000 | | | | 26,553,253 | |
Burlington Northern Santa Fe LLC(f) | | | | | | | | |
8.251%, 1/15/21 | | | 763,430 | | | | 888,394 | |
4.967%, 4/1/23 | | | 7,320,404 | | | | 7,963,260 | |
3.85%, 9/1/23 | | | 2,150,000 | | | | 2,267,850 | |
5.72%, 1/15/24 | | | 9,705,500 | | | | 11,078,409 | |
5.342%, 4/1/24 | | | 10,305,402 | | | | 11,349,854 | |
5.629%, 4/1/24 | | | 15,837,333 | | | | 17,870,234 | |
Cemex SAB de CV(b) (Mexico) | | | | | | | | |
6.50%, 12/10/19(d) | | | 22,500,000 | | | | 23,051,250 | |
6.00%, 4/1/24(d) | | | 10,575,000 | | | | 10,310,625 | |
5.70%, 1/11/25(d) | | | 12,475,000 | | | | 12,100,750 | |
Comcast Corp. | | | | | | | | |
6.30%, 11/15/17 | | | 5,865,000 | | | | 6,642,916 | |
5.875%, 2/15/18 | | | 4,475,000 | | | | 5,034,925 | |
Cox Enterprises, Inc. | | | | | | | | |
5.875%, 12/1/16(d) | | | 19,245,000 | | | | 20,808,310 | |
3.25%, 12/15/22(d) | | | 15,740,000 | | | | 15,454,146 | |
2.95%, 6/30/23(d) | | | 37,166,000 | | | | 35,640,038 | |
3.85%, 2/1/25(d) | | | 19,625,000 | | | | 19,809,809 | |
CSX Corp. | | | | | | | | |
9.75%, 6/15/20 | | | 5,231,000 | | | | 6,924,494 | |
Dillard’s, Inc. | | | | | | | | |
7.13%, 8/1/18 | | | 3,606,000 | | | | 4,038,720 | |
7.875%, 1/1/23 | | | 8,660,000 | | | | 10,002,300 | |
7.75%, 7/15/26 | | | 50,000 | | | | 55,625 | |
7.75%, 5/15/27 | | | 540,000 | | | | 603,450 | |
7.00%, 12/1/28 | | | 15,135,000 | | | | 16,043,100 | |
Dow Chemical Co. | | | | | | | | |
8.55%, 5/15/19 | | | 21,553,000 | | | | 26,795,681 | |
7.375%, 11/1/29 | | | 17,000,000 | | | | 22,630,706 | |
9.40%, 5/15/39 | | | 9,677,000 | | | | 15,701,252 | |
5.25%, 11/15/41 | | | 3,845,000 | | | | 4,146,894 | |
FedEx Corp. | | | | | | | | |
8.00%, 1/15/19 | | | 6,965,000 | | | | 8,478,968 | |
6.72%, 7/15/23 | | | 11,169,454 | | | | 13,068,261 | |
Ford Motor Credit Co. LLC(f) | | | | | | | | |
5.625%, 9/15/15 | | | 11,000,000 | | | | 11,351,505 | |
8.125%, 1/15/20 | | | 8,320,000 | | | | 10,305,643 | |
5.75%, 2/1/21 | | | 17,700,000 | | | | 20,282,996 | |
5.875%, 8/2/21 | | | 11,350,000 | | | | 13,140,894 | |
4.25%, 9/20/22 | | | 9,593,000 | | | | 10,178,797 | |
4.375%, 8/6/23 | | | 3,775,000 | | | | 4,035,645 | |
HCA Holdings, Inc. | | | | | | | | |
6.375%, 1/15/15 | | | 10,375,000 | | | | 10,375,000 | |
6.50%, 2/15/16 | | | 43,180,000 | | | | 45,069,125 | |
| | | | | | | | |
| | |
| | | PAR VALUE | | | VALUE | |
Hewlett-Packard Co.
3.30%, 12/9/16 | | $ | 14,955,000 | | | $ | 15,448,964 | |
Kinder Morgan, Inc.
4.30%, 6/1/25 | | | 36,515,000 | | | | 36,637,508 | |
Lafarge SA(b) (France) | | | | | | | | |
6.20%, 7/9/15(d) | | | 4,600,000 | | | | 4,705,340 | |
6.50%, 7/15/16 | | | 35,915,000 | | | | 38,249,475 | |
Liberty Interactive Corp. | | | | | | | | |
8.50%, 7/15/29 | | | 9,462,000 | | | | 10,360,890 | |
8.25%, 2/1/30 | | | 7,291,000 | | | | 7,874,280 | |
Macy’s, Inc. | | | | | | | | |
6.90%, 4/1/29 | | | 4,282,000 | | | | 5,450,494 | |
6.90%, 1/15/32 | | | 49,699,000 | | | | 64,663,021 | |
6.70%, 7/15/34 | | | 1,390,000 | | | | 1,776,977 | |
Naspers, Ltd.(b) (South Africa)
6.00%, 7/18/20(d) | | | 21,900,000 | | | | 23,925,750 | |
Norfolk Southern Corp.
9.75%, 6/15/20 | | | 7,224,000 | | | | 9,632,236 | |
Reed Elsevier PLC(b)
(United Kingdom) | | | | | | | | |
8.625%, 1/15/19 | | | 4,901,000 | | | | 5,994,565 | |
3.125%, 10/15/22 | | | 22,133,000 | | | | 21,907,775 | |
Sprint Corp.
6.00%, 12/1/16 | | | 15,150,000 | | | | 15,847,279 | |
Telecom Italia SPA(b) (Italy) | | | | | | | | |
6.999%, 6/4/18 | | | 17,100,000 | | | | 18,981,000 | |
7.175%, 6/18/19 | | | 27,527,000 | | | | 31,518,415 | |
7.20%, 7/18/36 | | | 11,596,000 | | | | 12,465,700 | |
7.721%, 6/4/38 | | | 7,062,000 | | | | 7,874,130 | |
Time Warner Cable, Inc. | | | | | | | | |
8.75%, 2/14/19 | | | 25,265,000 | | | | 31,274,356 | |
8.25%, 4/1/19 | | | 33,815,000 | | | | 41,394,396 | |
Time Warner, Inc. | | | | | | | | |
7.625%, 4/15/31 | | | 36,348,000 | | | | 50,674,019 | |
7.70%, 5/1/32 | | | 14,374,000 | | | | 20,418,569 | |
Twenty-First Century Fox, Inc. | | | | | | | | |
6.40%, 12/15/35 | | | 5,355,000 | | | | 6,989,132 | |
6.15%, 3/1/37 | | | 15,000,000 | | | | 18,799,590 | |
6.65%, 11/15/37 | | | 1,638,000 | | | | 2,187,156 | |
Union Pacific Corp. | | | | | | | | |
5.866%, 7/2/30 | | | 27,509,089 | | | | 32,163,316 | |
6.176%, 1/2/31 | | | 9,781,123 | | | | 11,714,362 | |
Verizon Communications, Inc. | | | | | | | | |
5.15%, 9/15/23 | | | 10,250,000 | | | | 11,318,388 | |
4.15%, 3/15/24 | | | 12,750,000 | | | | 13,199,233 | |
6.55%, 9/15/43 | | | 38,476,000 | | | | 49,293,489 | |
Vulcan Materials Co. | | | | | | | | |
6.50%, 12/1/16 | | | 704,000 | | | | 749,760 | |
7.50%, 6/15/21 | | | 20,340,000 | | | | 23,696,100 | |
Xerox Corp. | | | | | | | | |
6.35%, 5/15/18 | | | 28,585,000 | | | | 32,321,631 | |
5.625%, 12/15/19 | | | 5,645,000 | | | | 6,344,257 | |
4.50%, 5/15/21 | | | 19,161,000 | | | | 20,476,383 | |
| | | | | | | | |
| | | | | | | 1,231,256,146 | |
| | |
| See accompanying Notes to Financial Statements | | DODGE & COX BALANCED FUND §PAGE 12 |
| | | | |
| PORTFOLIO OF INVESTMENTS | | | December 31, 2014 | |
| | | | | | | | |
| DEBT SECURITIES (continued) | |
| | |
| | | PAR VALUE | | | VALUE | |
UTILITIES: 0.4% | | | | | | | | |
Dominion Resources, Inc.
5.75%, 10/1/54 | | $ | 21,175,000 | | | $ | 22,094,313 | |
Enel SPA(b) (Italy) | | | | | | | | |
6.80%, 9/15/37(d) | | | 18,700,000 | | | | 23,908,885 | |
6.00%, 10/7/39(d) | | | 8,550,000 | | | | 10,045,985 | |
8.75%, 9/24/73(d) | | | 925,000 | | | | 1,074,156 | |
| | | | | | | | |
| | | | | | | 57,123,339 | |
| | | | | | | | |
| | | | | | | 2,030,375,384 | |
| | | | | | | | |
TOTAL DEBT SECURITIES
(Cost $4,337,303,190) | | | | | | $ | 4,603,392,860 | |
| |
| SHORT-TERM INVESTMENTS: 2.8% | | | | |
MONEY MARKET FUND: 0.1% | | | | | |
SSgA U.S. Treasury Money Market Fund | | | 15,782,522 | | | | 15,782,522 | |
| |
REPURCHASE AGREEMENT: 2.7% | | | | | |
Fixed Income Clearing Corporation(e)
0.01%, dated 12/31/14, due 1/2/15, maturity value $416,144,231 | | | 416,144,000 | | | | 416,144,000 | |
| | | | | | | | |
TOTAL SHORT-TERM INVESTMENTS
(Cost $431,926,522) | | | $ | 431,926,522 | |
| | | | | | | | |
TOTAL INVESTMENTS
(Cost $11,758,074,005) | | | 101.3 | % | | $ | 15,667,078,338 | |
OTHER ASSETS LESS LIABILITIES | | | (1.3 | %) | | | (202,000,772 | ) |
| | | | | | | | |
| NET ASSETS | | | 100.0 | % | | $ | 15,465,077,566 | |
| | | | | | | | |
| (b) | Security denominated in U.S. dollars |
| (c) | Cumulative preferred security |
| (d) | Security exempt from registration under Rule 144A of the Securities Act of 1933. The security may be resold in transactions exempt from registration, normally to qualified institutional buyers. As of December 31, 2014, all such securities in total represented $421,993,601 or 2.7% of net assets. These securities have been deemed liquid by Dodge & Cox, investment manager, pursuant to procedures approved by the Fund’s Board of Trustees. |
| (e) | Repurchase agreement is collateralized by Freddie Mac 1.375%, 5/1/20 and U.S. Treasury Note 1.000%-3.375%, 10/31/19-5/31/20. Total collateral value is $424,469,056. |
| (f) | Subsidiary (see below) |
In determining a company’s country designation, the Fund generally references the country of incorporation. In cases where the Fund considers the country of incorporation to be a “jurisdiction of convenience” chosen primarily for tax purposes, the Fund uses the country designation of an appropriate broad-based market index. In that circumstance, two countries are listed - the country of incorporation and the country designated by an appropriate index, respectively.
Debt securities are grouped by parent company unless otherwise noted. Actual securities may be issued by the listed parent company or one of its subsidiaries.
ADR: American Depositary Receipt
ARM: Adjustable Rate Mortgage
CMO: Collateralized Mortgage Obligation
DUS: Delegated Underwriting and Servicing
GO: General Obligation
RB: Revenue Bond
REMIC: Real Estate Mortgage Investment Conduit
FUTURES CONTRACTS
| | | | | | | | | | | | | | | | |
| Description | | Number of Contracts | | | Expiration Date | | | Notional Amount | | | Unrealized Appreciation/ (Depreciation) | |
10 Year U.S. Treasury Note—Short Position | | | 1,386 | | | | Mar 2015 | | | $ | (175,740,469 | ) | | $ | (1,101,897 | ) |
| | | | | | | | | | | | | | | | |
Long-Term U.S. Treasury Bond—Short Position | | | 877 | | | | Mar 2015 | | | | (144,869,437 | ) | | | (6,569,841 | ) |
| | | | | | | | | | | | | | | | |
| | | | | | | | | | | | | | $ | (7,671,738 | ) |
| | | | | | | | | | | | | | | | |
| | |
| PAGE 13 § DODGE & COX BALANCED FUND | | See accompanying Notes to Financial Statements |
| | | | |
STATEMENT OF ASSETS AND LIABILITIES | |
| |
| | |
December 31, 2014 | |
ASSETS: | | | | |
Investments, at value (cost $11,758,074,005) | | $ | 15,667,078,338 | |
Cash held at broker | | | 4,446,143 | |
Receivable for investments sold | | | 9,352,308 | |
Receivable for Fund shares sold | | | 20,902,842 | |
Dividends and interest receivable | | | 51,848,304 | |
Prepaid expenses and other assets | | | 92,952 | |
| | | | |
| | | 15,753,720,887 | |
| | | | |
LIABILITIES: | | | | |
Payable for investments purchased | | | 35,418,791 | |
Payable for Fund shares redeemed | | | 245,011,031 | |
Payable to broker for variation margin | | | 604,656 | |
Management fees payable | | | 6,636,039 | |
Accrued expenses | | | 972,804 | |
| | | | |
| | | 288,643,321 | |
| | | | |
NET ASSETS | | $ | 15,465,077,566 | |
| | | | |
NET ASSETS CONSIST OF: | | | | |
Paid in capital | | $ | 11,446,593,341 | |
Undistributed net investment income | | | 3,500,381 | |
Undistributed net realized gain | | | 113,647,176 | |
Net unrealized appreciation | | | 3,901,336,668 | |
| | | | |
| | $ | 15,465,077,566 | |
| | | | |
Fund shares outstanding (par value $0.01 each, unlimited shares authorized) | | | 150,911,685 | |
Net asset value per share | | $ | 102.48 | |
|
STATEMENT OF OPERATIONS | |
| | | Year Ended
December 31, 2014 | |
INVESTMENT INCOME: | | | | |
Dividends (net of foreign taxes of $5,222,465) | | $ | 211,836,695 | |
Interest (net of foreign taxes of $9,973) | | | 165,994,824 | |
| | | | |
| | | 377,831,519 | |
| | | | |
EXPENSES: | | | | |
Management fees | | | 74,717,761 | |
Custody and fund accounting fees | | | 307,954 | |
Transfer agent fees | | | 2,089,806 | |
Professional services | | | 290,761 | |
Shareholder reports | | | 315,032 | |
Proxy expenses | | | 510,237 | |
Registration fees | | | 199,582 | |
Trustees’ fees | | | 258,072 | |
Miscellaneous | | | 397,502 | |
| | | | |
| | | 79,086,707 | |
| | | | |
NET INVESTMENT INCOME | | | 298,744,812 | |
| | | | |
|
REALIZED AND UNREALIZED GAIN (LOSS): | |
Net realized gain (loss) | | | | |
Investments | | | 415,313,084 | |
Treasury futures contracts | | | (15,394,027 | ) |
Net change in unrealized appreciation/depreciation | | | | |
Investments | | | 575,589,650 | |
Treasury futures contracts | | | (8,579,947 | ) |
| | | | |
Net realized and unrealized gain | | | 966,928,760 | |
| | | | |
NET INCREASE IN NET ASSETS FROM OPERATIONS | | $ | 1,265,673,572 | |
| | | | |
| | | | | | | | |
STATEMENT OF CHANGES IN NET ASSETS | |
| | |
| | | Year Ended
December 31, 2014 | | | Year Ended
December 31, 2013 | |
OPERATIONS: | | | | | | | | |
Net investment income | | $ | 298,744,812 | | | $ | 247,794,566 | |
Net realized gain | | | 399,919,057 | | | | 1,099,230,936 | |
Net change in unrealized appreciation/depreciation | | | 567,009,703 | | | | 1,975,952,682 | |
| | | | | | | | |
| | | 1,265,673,572 | | | | 3,322,978,184 | |
| | | | | | | | |
| | |
DISTRIBUTIONS TO SHAREHOLDERS FROM: | | | | | | | | |
Net investment income | | | (298,877,158 | ) | | | (246,397,862 | ) |
Net realized gain | | | (359,115,663 | ) | | | (9,642,637 | ) |
| | | | | | | | |
Total distributions | | | (657,992,821 | ) | | | (256,040,499 | ) |
| | | | | | | | |
| | |
FUND SHARE TRANSACTIONS: | | | | | | | | |
Proceeds from sale of shares | | | 1,944,425,723 | | | | 1,558,477,176 | |
Reinvestment of distributions | | | 624,013,075 | | | | 242,306,286 | |
Cost of shares redeemed | | | (2,114,967,089 | ) | | | (2,681,100,500 | ) |
| | | | | | | | |
Net increase/(decrease) from Fund share transactions | | | 453,471,709 | | | | (880,317,038 | ) |
| | | | | | | | |
Total increase in net assets | | | 1,061,152,460 | | | | 2,186,620,647 | |
| | |
NET ASSETS: | | | | | | | | |
Beginning of year | | | 14,403,925,106 | | | | 12,217,304,459 | |
| | | | | | | | |
End of year (including undistributed net investment income of $3,500,381 and $3,632,727, respectively) | | $ | 15,465,077,566 | | | $ | 14,403,925,106 | |
| | | | | | | | |
| | |
SHARE INFORMATION: | | | | | | | | |
Shares sold | | | 19,199,410 | | | | 17,648,446 | |
Distributions reinvested | | | 6,142,973 | | | | 2,717,903 | |
Shares redeemed | | | (20,958,749 | ) | | | (30,347,088 | ) |
| | | | | | | | |
Net increase/(decrease) in shares outstanding | | | 4,383,634 | | | | (9,980,739 | ) |
| | | | | | | | |
| | |
| See accompanying Notes to Financial Statements | | DODGE & COX BALANCED FUND §PAGE 14 |
NOTES TO FINANCIAL STATEMENTS
NOTE 1—ORGANIZATION AND SIGNIFICANT ACCOUNTING POLICIES
Dodge & Cox Balanced Fund (the “Fund”) is one of the series constituting the Dodge & Cox Funds (the “Trust” or the “Funds”). The Trust is organized as a Delaware statutory trust and is registered under the Investment Company Act of 1940, as amended, as an open-end management investment company. The Fund commenced operations on June 26, 1931, and seeks regular income, conservation of principal, and an opportunity for long-term growth of principal and income. Risk considerations and investment strategies of the Fund are discussed in the Fund’s Prospectus.
The financial statements have been prepared in conformity with accounting principles generally accepted in the United States of America, which require the use of estimates and assumptions by management. Actual results may differ from those estimates. Significant accounting policies are as follows:
Security valuation The Fund’s net assets are valued as of the close of trading on the New York Stock Exchange (NYSE), generally 4:00 p.m. Eastern Time, each day that the NYSE is open for business. Portfolio securities and other financial instruments for which market quotes are readily available are valued at market value. Listed securities are generally valued using the official quoted close price or the last sale on the exchange that is determined to be the primary market for the security. Debt securities (including certain preferred stocks) are valued based on prices received from independent pricing services which utilize both dealer-supplied valuations and pricing models. Pricing models may consider quoted prices for similar securities, interest rates, prepayment speeds, and credit risk. Exchange-traded derivatives are valued at the settlement price determined by the relevant exchange. Security values are not discounted based on the size of the Fund’s position. Securities for which market quotations are not readily available are valued at fair value as determined in good faith by or under the direction of the Board of Trustees. Short-term securities less than 60 days to maturity may be valued at amortized cost if amortized cost approximates current value. All securities held by the Fund are denominated in U.S. dollars.
The Board of Trustees has delegated authority to Dodge & Cox, the Fund’s investment manager, to make
fair value determinations in accordance with the Dodge & Cox Funds Valuation Policies (“Valuation Policies”), subject to Board oversight. Dodge & Cox has established a Pricing Committee that is comprised of representatives from Treasury, Legal, Compliance, and Operations. The Pricing Committee is responsible for implementing the Valuation Policies, including determining the fair value of securities when market quotations or market-based valuations are not readily available or are deemed unreliable. The Pricing Committee considers relevant indications of value that are reasonably available to it in determining the fair value assigned to a particular security, such as the value of similar financial instruments, trading volumes, contractual restrictions on disposition, related corporate actions, and changes in economic conditions.
Valuing securities at fair value involves greater reliance on judgment than valuation of securities based on readily available market quotations. In some instances, lack of information and uncertainty as to the significance of information may lead to a conclusion that a prior valuation is the best indication of a security’s present value. When fair value pricing is employed, the prices of securities used by the Fund to calculate its net asset value may differ from quoted or published prices for the same securities.
Security transactions, investment income, expenses, and distributions Security transactions are recorded on the trade date. Realized gains and losses on securities sold are determined on the basis of identified cost.
Dividend income and corporate action transactions are recorded on the ex-dividend date, or when the Fund first learns of the dividend/corporate action if the ex-dividend date has passed. Withholding taxes on foreign dividends have been provided for in accordance with the Fund’s understanding of the applicable country’s tax rules and rates. Non-cash dividends included in dividend income, if any, are recorded at the fair market value of the securities received. Dividends characterized as return of capital for U.S. tax purposes are recorded as a reduction of cost of investments and/or realized gain.
Interest income is recorded on the accrual basis. Interest income includes coupon interest, amortization of premium and accretion of discount on debt securities, and gain/loss on paydowns. The ability of the issuers of the
PAGE 15 § DODGE & COX BALANCED FUND
NOTES TO FINANCIAL STATEMENTS
debt securities held by the Fund to meet their obligations may be affected by economic developments in a specific industry, state, or region. Debt obligations may be placed on non-accrual status and related interest income may be reduced by ceasing current accruals and writing off interest receivables when the collection of all or a portion of interest has become doubtful. A debt obligation is removed from non-accrual status when the issuer resumes interest payments or when collectibility of interest is reasonably assured.
Expenses are recorded on the accrual basis. Most expenses of the Trust can be directly attributed to a specific series. Expenses which cannot be directly attributed are allocated among the Funds in the Trust based on relative net assets or other expense methodologies determined by the nature of the expense.
Distributions to shareholders are recorded on the ex-dividend date.
Repurchase agreements The Fund enters into repurchase agreements, secured by U.S. government or agency securities, which involve the purchase of securities from a counterparty with a simultaneous commitment to resell the securities at an agreed-upon date and price. It is the Fund’s policy that its custodian take possession of the underlying collateral securities, the fair value of which exceeds the principal amount of the repurchase transaction, including accrued interest, at all times. In the event of default by the counterparty, the Fund has the contractual right to liquidate the collateral securities and to apply the proceeds in satisfaction of the obligation.
Futures Contracts Futures contracts involve an obligation to purchase or sell (depending on whether the Fund has entered a long or short futures contract, respectively) an asset at a future date, at a price set at the time of the contract. Upon entering into a futures contract, the Fund is required to deposit an amount of cash or liquid assets (referred to as initial margin) in a segregated account with the clearing broker. Subsequent payments (referred to as variation margin) to and from the clearing broker are made on a daily basis based on changes in the market value of the contracts. Futures contracts are traded publicly and their market value changes daily. Changes in the market value of open futures contracts are recorded as unrealized appreciation or depreciation in the Statement of Operations. Realized gains and losses on
futures contracts are recorded in the Statement of Operations at the closing or expiration of futures contracts. Cash deposited with a broker as initial margin is recorded on the Statement of Assets and Liabilities. A receivable and/or payable to brokers for daily variation margin is also recorded on the Statement of Assets and Liabilities.
Investments in futures contracts may include certain risks, which may be different from, and potentially greater than, those of the underlying securities. To the extent the Fund uses futures, it is exposed to additional volatility and potential losses resulting from leverage.
The Fund has entered into short Treasury futures contracts to assist with the management of the portfolio’s interest rate exposure. During the year ended December 31, 2014, these Treasury futures contracts had notional values ranging from less than 1% to 2% of net assets.
Indemnification Under the Trust’s organizational documents, its officers and trustees are indemnified against certain liabilities arising out of the performance of their duties to the Trust. In addition, in the normal course of business the Trust enters into contracts that provide general indemnities to other parties. The Trust’s maximum exposure under these arrangements is unknown as this would involve future claims that may be made against the Trust that have not yet occurred.
NOTE 2—VALUATION MEASUREMENTS
Various inputs are used in determining the value of the Fund’s investments. These inputs are summarized in the three broad levels listed below.
| § | | Level 1: Quoted prices in active markets for identical securities |
| § | | Level 2: Other significant observable inputs (including quoted prices for similar securities, market indices, interest rates, credit risk, etc.) |
| § | | Level 3: Significant unobservable inputs (including Fund management’s assumptions in determining the fair value of investments) |
The inputs or methodology used for valuing securities are not necessarily an indication of the risk associated with investing in those securities.
DODGE & COX BALANCED FUND §PAGE 16
NOTES TO FINANCIAL STATEMENTS
The following is a summary of the inputs used to value the Fund’s holdings at December 31, 2014:
| | | | | | | | |
| Classification(a) | | LEVEL 1 (Quoted Prices) | | | LEVEL 2 (Other Significant Observable Inputs) | |
Securities | | | | | | | | |
Common Stocks(b) | | $ | 10,323,143,744 | | | $ | — | |
Preferred Stocks | | | — | | | | 308,615,212 | |
Debt Securities | | | | | | | | |
U.S. Treasury | | | 413,602,823 | | | | — | |
Government-Related | | | — | | | | 300,327,595 | |
Mortgage-Related | | | — | | | | 1,544,247,048 | |
Asset-Backed | | | — | | | | 314,840,010 | |
Corporate | | | — | | | | 2,030,375,384 | |
Short-term Investments | | | | | | | | |
Money Market Fund | | | 15,782,522 | | | | — | |
Repurchase Agreement | | | — | | | | 416,144,000 | |
| | | | | | | | |
Total Securities | | $ | 10,752,529,089 | | | $ | 4,914,549,249 | |
| | | | | | | | |
| | |
Other Financial Instruments | | | | | | | | |
Treasury Futures Contracts | | $ | (7,671,738 | )(c) | | $ | — | |
| | | | | | | | | |
| (a) | There were no transfers between Level 1 and Level 2 during the year ended December 31, 2014. There were no Level 3 securities at December 31, 2014 and 2013, and there were no transfers to Level 3 during the year. |
| (b) | All common stocks held in the Fund are Level 1 securities. For a detailed break-out of common stocks by major industry classification, please refer to the Portfolio of Investments. |
| (c) | Represents net unrealized appreciation/(depreciation). |
NOTE 3—RELATED PARTY TRANSACTIONS
Management fees Under a written agreement approved by a unanimous vote of the Board of Trustees, the Fund pays an annual management fee of 0.50% of the Fund’s average daily net assets to Dodge & Cox, investment manager of the Fund.
Fund officers and trustees All officers and two of the trustees of the Trust are officers or employees of Dodge & Cox. The Trust pays a fee only to those trustees who are not affiliated with Dodge & Cox.
NOTE 4—INCOME TAX INFORMATION AND DISTRIBUTIONS TO SHAREHOLDERS
A provision for federal income taxes is not required since the Fund intends to continue to qualify as a regulated investment company under Subchapter M of the Internal Revenue Code and distribute all of its taxable income to shareholders. Distributions are determined in accordance with income tax regulations, and such amounts may differ from net investment income and realized gains for financial reporting purposes. Financial reporting records are adjusted for permanent book/tax differences at year end to reflect tax character.
Book/tax differences are primarily due to differing treatments of wash sales, net short-term realized gain (loss), and Treasury futures contracts. At December 31, 2014, the cost of investments for federal income tax purposes was $11,758,074,013.
Distributions during the years noted below were characterized as follows for federal income tax purposes:
| | | | | | | | |
| | | Year Ended
December 31, 2014 | | | Year Ended
December 31, 2013 | |
Ordinary income | | | $357,296,853 | | | | $246,397,862 | |
| | | ($2.417 per share) | | | | ($1.650 per share) | |
| | |
Long-term capital gain | | | $300,695,968 | | | | $9,642,637 | |
| | | ($2.020 per share) | | | | ($0.066 per share) | |
At December 31, 2014, the tax basis components of distributable earnings were as follows:
| | | | |
Unrealized appreciation | | $ | 4,050,646,600 | |
Unrealized depreciation | | | (141,642,275 | ) |
| | | | |
Net unrealized appreciation | | | 3,909,004,325 | |
Undistributed ordinary income | | | 7,212,239 | |
Undistributed long-term capital gain | | | 102,267,661 | |
Fund management has reviewed the tax positions for open periods (three years and four years, respectively, from filing the Fund’s Federal and State tax returns) as applicable to the Fund, and has determined that no provision for income tax is required in the Fund’s financial statements.
PAGE 17 § DODGE & COX BALANCED FUND
NOTES TO FINANCIAL STATEMENTS
NOTE 5—LOAN FACILITIES
Pursuant to an exemptive order issued by the Securities and Exchange Commission (SEC), the Fund may participate in an interfund lending facility (Facility). The Facility allows the Fund to borrow money from or loan money to the Funds. Loans under the Facility are made for temporary or emergency purposes, such as to fund shareholder redemption requests. Interest on borrowings is the average of the current repurchase agreement rate and the bank loan rate. There was no activity in the Facility during the year.
All Funds in the Trust participate in a $500 million committed credit facility (Line of Credit) with State Street Bank and Trust Company, to be utilized for temporary or emergency purposes to fund shareholder redemptions or for other short-term liquidity purposes. The maximum amount available to the Fund is $250 million. Each Fund pays an annual commitment fee on its pro-rata portion of the Line of Credit. The Fund’s commitment fee for the year ended December 31, 2014, amounted to $40,653 and is reflected as a Miscellaneous Expense in the Statement of Operations. Interest on borrowings is charged at the prevailing rate. There were no borrowings on the Line of Credit during the year.
NOTE 6—PURCHASES AND SALES OF INVESTMENTS
For the year ended December 31, 2014, purchases and sales of securities, other than short-term securities and U.S. government securities, aggregated $2,857,656,227 and $2,317,949,019, respectively. For the year ended December 31, 2014, purchases and sales of U.S. government securities aggregated $1,224,875,718 and $952,607,970, respectively.
NOTE 7—ACCOUNTING PRONOUNCEMENTS
In June 2014, the Financial Accounting Standards Board issued Accounting Standards Update (ASU) No. 2014-11, Transfers and Servicing (Topic 860), Repurchase-to-Maturity Transactions, Repurchase Financings, and Disclosures. The ASU changes the accounting for certain repurchase agreements and expands disclosure requirements related to repurchase agreements and similar transactions. Management is currently evaluating the impact, if any, of applying this ASU effective January 1, 2015.
NOTE 8—SUBSEQUENT EVENTS
Fund management has determined that no material events or transactions occurred subsequent to December 31, 2014, and through the date of the Fund’s financial statements issuance, which require additional disclosure in the Fund’s financial statements.
DODGE & COX BALANCED FUND §PAGE 18
FINANCIAL HIGHLIGHTS
| | | | | | | | | | | | | | | | | | | | |
SELECTED DATA AND RATIOS (for a share outstanding throughout each year) | | Year Ended December 31, | |
| | | 2014 | | | 2013 | | | 2012 | | | 2011 | | | 2010 | |
| | | | |
Net asset value, beginning of year | | | $98.30 | | | | $78.06 | | | | $67.45 | | | | $70.22 | | | | $64.03 | |
Income from investment operations: | | | | | | | | | | | | | | | | | | | | |
Net investment income | | | 2.03 | | | | 1.66 | | | | 1.65 | | | | 1.62 | | | | 1.41 | |
Net realized and unrealized gain (loss) | | | 6.59 | | | | 20.30 | | | | 10.62 | | | | (2.77 | ) | | | 6.30 | |
| | | | |
Total from investment operations | | | 8.62 | | | | 21.96 | | | | 12.27 | | | | (1.15 | ) | | | 7.71 | |
| | | | |
Distributions to shareholders from: | | | | | | | | | | | | | | | | | | | | |
Net investment income | | | (2.03 | ) | | | (1.65 | ) | | | (1.66 | ) | | | (1.62 | ) | | | (1.52 | ) |
Net realized gain | | | (2.41 | ) | | | (0.07 | ) | | | — | | | | — | | | | — | |
| | | | |
Total distributions | | | (4.44 | ) | | | (1.72 | ) | | | (1.66 | ) | | | (1.62 | ) | | | (1.52 | ) |
| | | | |
Net asset value, end of year | | | $102.48 | | | | $98.30 | | | | $78.06 | | | | $67.45 | | | | $70.22 | |
| | | | |
Total return | | | 8.85 | % | | | 28.37 | % | | | 18.32 | % | | | (1.66 | )% | | | 12.23 | % |
Ratios/supplemental data: | | | | | | | | | | | | | | | | | | | | |
Net assets, end of year (millions) | | | $15,465 | | | | 14,404 | | | | $12,217 | | | | $12,220 | | | | $14,849 | |
Ratio of expenses to average net assets | | | 0.53 | % | | | 0.53 | % | | | 0.53 | % | | | 0.53 | % | | | 0.53 | % |
Ratio of net investment income to average net assets | | | 2.00 | % | | | 1.85 | % | | | 2.21 | % | | | 2.26 | % | | | 2.13 | % |
Portfolio turnover rate | | | 23 | % | | | 25 | % | | | 16 | % | | | 19 | % | | | 12 | % |
See accompanying Notes to Financial Statements
PAGE 19 § DODGE & COX BALANCED FUND
REPORT OF INDEPENDENT REGISTERED PUBLIC ACCOUNTING FIRM
To the Trustees of Dodge & Cox Funds and Shareholders of Dodge & Cox Balanced Fund
In our opinion, the accompanying statement of assets and liabilities, including the portfolio of investments, and the related statements of operations and of changes in net assets and the financial highlights present fairly, in all material respects, the financial position of Dodge & Cox Balanced Fund (the “Fund”, one of the series constituting Dodge & Cox Funds) at December 31, 2014, the results of its operations for the year then ended, the changes in its net assets for each of the two years in the period then ended and the financial highlights for each of the five years in the period then ended, in conformity with accounting principles generally accepted in the United States of America. These financial statements and financial highlights (hereafter referred to as financial statements) are the responsibility of the Fund’s management. Our responsibility is to express an opinion on these financial statements based on our audits. We conducted our audits of these financial statements in accordance with the standards of the Public Company Accounting Oversight Board (United States). Those standards require that we plan and perform the audit to obtain reasonable assurance about whether the financial statements are free of material misstatement. An audit includes examining, on a test basis, evidence supporting the amounts and disclosures in the financial statements, assessing the accounting principles used and significant estimates made by management, and evaluating the overall financial statement presentation. We believe that our audits, which included confirmation of securities at December 31, 2014, by correspondence with the custodian and brokers, provide a reasonable basis for our opinion.
PricewaterhouseCoopers LLP
San Francisco, California
February 17, 2015
DODGE & COX BALANCED FUND §PAGE 20
SPECIAL 2014 TAX INFORMATION
(unaudited)
The following information is provided pursuant to provisions of the Internal Revenue Code:
The Fund designates $213,675,904 of its distributions paid to shareholders in 2014 as qualified dividends (treated for federal income tax purposes in the hands of shareholders as taxable at a maximum rate of 20%).
For shareholders that are corporations, the Fund designates 37% of its ordinary dividends paid to shareholders in 2014 as dividends from domestic corporations eligible for the corporate dividends received deduction, provided that the shareholder otherwise satisfies applicable requirements to claim that deduction.
BOARD APPROVAL OF FUNDS’ INVESTMENT MANAGEMENT AGREEMENTS AND MANAGEMENT FEES
(unaudited)
The Board of Trustees is responsible for overseeing the performance of the Dodge & Cox Funds’ investment manager and determining whether to continue the Investment Management Agreements between the Funds and Dodge & Cox each year (the “Agreements”). At a meeting of the Board of Trustees of the Trust held on December 17, 2014, the Trustees, by a unanimous vote (including a separate vote of those Trustees who are not “interested persons” (as defined in the Investment Company Act of 1940) (the “Independent Trustees”)), approved the renewal of the Agreements for an additional one-year term through December 31, 2015 with respect to each Fund other than the Dodge & Cox Global Bond Fund. The Agreement for the Dodge & Cox Global Bond Fund was not subject to renewal at this time. During the course of the year, the Board received a wide variety of materials relating to the services provided by Dodge & Cox and the performance of each of the Funds.
INFORMATION RECEIVED
In advance of the meeting, the Board, including each of the Independent Trustees, requested, received, and reviewed materials relating to the Agreements and the services provided by Dodge & Cox. The Independent Trustees retained Morningstar® to prepare an independent expense and performance summary for each Fund and
comparable funds managed by other advisers identified by Morningstar. The Morningstar materials included information regarding advisory fee rates, expense ratios, and transfer agency, custodial, and distribution expenses, as well as appropriate performance comparisons to each Fund’s peer group and an index or combination of indices. The Morningstar materials also included a comparison of expenses of various share classes offered by comparable funds.
The materials reviewed by the Board contained information concerning, among other things, Dodge & Cox’s profitability, financial results and condition, advisory fee revenue, and separate account and sub-adviser fund fee schedules. The Board additionally considered the Funds’ brokerage commissions, turnover rates, sales and redemption data and the significant investment that Dodge & Cox makes in research used in managing the Funds. The Board received and reviewed a memorandum summarizing information provided throughout the year regarding Dodge & Cox’s services to the Funds as well as information regarding (i) the different fees, services, costs, and risks associated with other accounts managed by Dodge & Cox as compared to the Dodge & Cox Funds; (ii) the differences in performance between the Funds and separately managed accounts; and (iii) Fund shares subscription and redemption activity. Throughout the process of reviewing the services provided by Dodge & Cox and preparing for the meeting, the Independent Trustees found Dodge & Cox to be open, forthright, detailed, and very helpful in answering questions about all issues.
The Board received copies of the Agreements and a memorandum from the independent legal counsel to the Independent Trustees discussing the factors generally regarded as appropriate to consider in evaluating advisory arrangements. The Trust’s Contract Review Committee, consisting solely of Independent Trustees, met with the independent legal counsel on November 3, 2014, and again on December 17, 2014, to discuss whether to renew the Agreements. The Board, including the Independent Trustees, subsequently concluded that the existing Agreements are fair and reasonable and voted to approve the Agreements.
PAGE 21 § DODGE & COX BALANCED FUND
In considering the Agreements, the Board, including the Independent Trustees, did not identify any single factor or particular information as all-important or controlling. In reaching the decision to approve the Agreements, the Board considered several factors, discussed below, to be key factors and reached the conclusions described below.
NATURE, QUALITY, AND EXTENT OF THE SERVICES
The Board considered that Dodge & Cox provides a wide range of services to the Funds in addition to portfolio management and that the quality of these services has been excellent in all respects. The extensive nature of services provided by Dodge & Cox has been documented in materials provided to the Board and in presentations made to the Board throughout the year. In particular, the Board considered the nature, quality, and extent of portfolio management, administrative, and shareholder services performed by Dodge & Cox. With regard to portfolio management services, the Board considered Dodge & Cox’s established long-term history of care and conscientiousness in the management of the Funds; its demonstrated consistency in investment approach and depth; the background and experience of the Dodge & Cox Investment Policy Committee, International Investment Policy Committee, Global Stock Investment Policy Committee, Fixed Income Investment Policy Committee, and Global Bond Investment Policy Committee, and research analysts responsible for managing the Funds; its methods for assessing the regulatory and investment climate in various jurisdictions; Dodge & Cox’s overall high level of attention to its core investment management function; and its commitment to the Funds and their shareholders.
In the area of administrative and shareholder services, the Board considered the excellent quality of Dodge & Cox’s work in areas such as compliance, legal services, trading, proxy voting, technology, oversight of the Funds’ transfer agent and cus todian, tax compliance, and shareholder communication through its website and other means. The Board also noted Dodge & Cox’s diligent disclosure policy, its favorable compliance record, and its reputation as a trusted, shareholder-friendly mutual fund family.
In addition, the Board considered that Dodge & Cox manages approximately $180 billion in Fund assets with fewer professionals than most comparable funds, and that on average these professionals have more experience and longer tenure than investment professionals at comparable funds. The Board also noted that Dodge & Cox is an investment research-oriented firm with no other business endeavors to distract management’s attention from its research efforts, and that its investment professionals adhere to a consistent investment approach across the Funds. The Board further considered the favorable stewardship and “Gold” analyst ratings awarded to each of the Funds by Morningstar. The Board concluded that it was satisfied with the nature, extent, and quality of investment management and other services provided to the Funds by Dodge & Cox.
INVESTMENT PERFORMANCE
The Board considered short-term and long-term investment performance for each Fund (including periods of outperformance or underperformance) as compared to both relevant indices and the performance of such Fund’s peer group. The Board noted that each Fund demonstrated favorable longer-term performance relative to its benchmark and peer group. The Board determined after extensive review and inquiry that Dodge & Cox’s historic, long-term, team-oriented, bottom up investment approach remains consistent and that Dodge & Cox continues to be distinguished by its integrity, transparency, and independence.
The Board considered that the performance of the Funds is the result of a team-oriented investment management process that emphasizes a long-term investment horizon, comprehensive independent research, price discipline, and focus. The Board also considered that the investment performance delivered by Dodge & Cox to the Funds appeared to be consistent with the relevant performance delivered for other clients of Dodge & Cox. The Board concluded that Dodge & Cox has delivered favorable long-term performance for Fund investors consistent with the long-term investment strategies being pursued by the Funds.
DODGE & COX BALANCED FUND §PAGE 22
COSTS AND ANCILLARY BENEFITS
Costs of Services to Funds: Fees and Expenses. The Board considered each Fund’s management fee rate and expense ratio relative to similar mutual funds and relative to management fees charged by Dodge & Cox to other clients. In particular, the Board considered that the Funds continue to be substantially below their peer group median in expense ratios and management fee rates and that many media and industry reports specifically comment on the low expense ratios of the Funds, which have been a defining characteristic of the Funds for many years. The Board also evaluated the operating structures of the Funds and Dodge & Cox, noting that the Funds do not charge front-end sales commissions or distribution fees, and Dodge & Cox bears, among other things, the significant cost of third party research, reimbursement for recordkeeping and administrative costs to third-party retirement plan administrators, and administrative and office overhead. The Board noted that expenses are well below industry averages. The Board also considered that the Funds receive numerous administrative, regulatory compliance, legal, technology and shareholder support services from Dodge & Cox without any additional administrative fee and the fact that the Funds have relatively low transaction costs and portfolio turnover rates. The Board reviewed Morningstar data showing that the few peer group funds with lower expense ratios often have other share classes with significantly higher expense ratios.
The Board reviewed information regarding the fee rates Dodge & Cox charges to separate accounts and subadvised funds that have investment programs similar to those of the Funds, including instances where separate account and sub-advised fund fees are lower than Fund fees. The Board considered differences in the nature and scope of services Dodge & Cox provides to the Funds as compared to other client accounts, differences in regulatory, litigation, and other risks as between Dodge & Cox Funds and other types of clients, and certain characteristics of the market for institutional separate account management services. The Board further noted that, with respect to non-U.S. funds sponsored and managed by Dodge & Cox that are comparable to the Funds in many respects, the fee rates charged by Dodge & Cox are the same as or higher than the fee rates charged to the Funds. After consideration of these matters, the Board concluded that the overall costs
incurred by the Funds for the services they receive (including the management fee paid to Dodge & Cox) are reasonable and that the fees are acceptable based upon the qualifications, experience, reputation, and performance of Dodge & Cox and the low overall expense ratios of the Funds.
Profitability and Costs of Services to Dodge & Cox; “Fall-out” Benefits. The Board reviewed reports of Dodge & Cox’s financial position, profitability, and estimated overall value, and considered Dodge & Cox’s overall profitability within its context as a private, employee-owned S-Corporation and relative to the favorable services provided. The Board noted in particular that Dodge & Cox’s profits are not generated by high fee rates, but reflect an extraordinarily streamlined, efficient, and focused business approach toward investment management. The Board recognized the importance of Dodge & Cox’s profitability—which is derived solely from management fees and does not include other business ventures—to maintain its independence, stability, company culture and ethics, and management continuity. The Board also considered that the compensation/profit structure at Dodge & Cox includes a return on shareholder employees’ investment in the firm, which is vital for remaining independent and facilitating retention of management and investment professionals.
The Board considered that Dodge & Cox recently recommended closing the International Stock Fund to new investors to pro-actively manage the growth of the Fund. The Stock Fund and Balanced Fund were similarly closed to new investors during periods of significant growth in the past. While these actions are intended to benefit existing shareholders, the effect is to reduce potential revenues to Dodge & Cox from new shareholders.
The Board also considered potential “fall-out” benefits (including the receipt of research from unaffiliated brokers and reputational benefits to non-U.S. funds sponsored and managed by Dodge & Cox) that Dodge & Cox might receive as a result of its association with the Funds and determined that they are not significant. The Board also noted the extent of additional administrative services performed by Dodge & Cox for the Funds, and that the magnitude of costs and risks borne by Dodge & Cox in rendering advisory services to the Funds (including risks in the regulatory compliance, securities valuation, and investment management processes) are
PAGE 23 § DODGE & COX BALANCED FUND
continuing to increase. The Board concluded that the profitability of Dodge & Cox’s relationship with the Funds (including fall-out benefits) was fair and reasonable.
THE BENEFIT OF ECONOMIES OF SCALE
The Board considered whether there have been economies of scale with respect to the management of each Fund, whether the Funds have appropriately benefited from any economies of scale, and whether the management fee rate is reasonable in relation to the Fund assets and any economies of scale that may exist. In the Board’s view, any consideration of economies of scale must take account of the Funds’ low fee structure and the considerable efficiencies of the Funds’ organization and fee structure that has been realized by shareholders from the time of each Fund’s inception (i.e., from the first dollar). An assessment of economies of scale must also take into account that Dodge & Cox has capped expenses when offering new funds. In addition, the Board noted that Dodge & Cox has shared economies of scale by adding or enhancing services to the Funds over time, and that the internal costs of providing investment management, up-to-date technology, administrative, legal, and compliance services to the Funds are continuing to increase. For example, Dodge & Cox has increased its global research staff and investment resources over the years to address the increased complexity of investing in multinational and non-U.S. companies. In addition, Dodge & Cox has made substantial expenditures in other staff, technology, and infrastructure to enable it to integrate credit and equity analyses and to be able to implement its strategy in a more effective and secure manner. The Board determined that the Funds provide access for small investors to high quality investment management at a relatively low cost. The Board’s decision to renew the Agreements was made after consideration of economies of scale and review of peer group fund expense ratios and historical expense ratio patterns for the Funds. The Board concluded that the current Dodge & Cox fee structure is fair and reasonable and adequately shares economies of scale that may exist.
CONCLUSION
Based on their evaluation of all material factors and assisted by the advice of independent legal counsel to the Independent Trustees, the Board, including the
Independent Trustees, concluded that the advisory fee structure was fair and reasonable, that each Fund was paying a competitive fee for the services provided, that the scope and quality of Dodge & Cox’s services has provided substantial value for Fund shareholders over the long term, and that approval of the Agreements was in the best interests of each Fund and its shareholders.
FUND HOLDINGS
The Fund provides a complete list of its holdings four times each fiscal year, as of the end of each quarter. The Fund files the lists with the SEC on Form N-CSR (second and fourth quarters) and Form N-Q (first and third quarters). Shareholders may view the Fund’s Forms N-CSR and N-Q on the SEC’s website at www.sec.gov. Forms N-CSR and N-Q may also be reviewed and copied at the SEC’s Public Reference Room in Washington, DC. Information regarding the operations of the Public Reference Room may be obtained by calling 202-551-8090 (direct) or 800-732-0330 (general SEC number). A list of the Fund’s quarter-end holdings is also available at www.dodgeandcox.com on or about 15 days following each quarter end and remains available on the website until the list is updated in the subsequent quarter.
PROXY VOTING
For a free copy of the Fund’s proxy voting policies and procedures, please call 800-621-3979, visit the Fund’s website at www.dodgeandcox.com, or visit the SEC’s website at www.sec.gov. Information regarding how the Fund voted proxies relating to portfolio securities during the most recent 12-month period ending June 30 is also available at www.dodgeandcox.com or at www.sec.gov.
HOUSEHOLD MAILINGS
The Fund routinely mails shareholder reports and summary prospectuses to shareholders and, on occasion, proxy statements. In order to reduce the volume of mail, when possible, only one copy of these documents will be sent to shareholders who are part of the same family and share the same residential address.
If you have a direct account with the Funds and you do not want the mailing of shareholder reports and summary prospectuses combined with other members in your household, contact the Funds at 800-621-3979. Your request will be implemented within 30 days.
DODGE & COX BALANCED FUND §PAGE 24
THIS PAGE INTENTIONALLY LEFT BLANK
PAGE 25 § DODGE & COX BALANCED FUND
THIS PAGE INTENTIONALLY LEFT BLANK
DODGE & COX BALANCED FUND §PAGE 26
DODGE & COX FUNDS—EXECUTIVE OFFICER & TRUSTEE INFORMATION
| | | | | | |
Name (Age) and
Address* | | Position with Trust (Year of Election or
Appointment) | | Principal Occupation During Past 5 Years | | Other Directorships Held by Trustees |
| INTERESTED TRUSTEES AND OFFICERS |
| Charles F. Pohl (56) | | Chairman and Trustee (Officer since 2004) | | Chairman (since 2013), Co-President (2011-2013), Senior Vice President (until 2011), and Director of Dodge & Cox; Chief Investment Officer, Portfolio Manager, Investment Analyst, and member of Investment Policy Committee (IPC), Global Stock Investment Policy Committee (GSIPC), International Investment Policy Committee (IIPC), and Fixed Income Investment Policy Committee (FIIPC) | | — |
| Dana M. Emery (53) | | President and Trustee (Trustee since 1993) | | Chief Executive Officer (since 2013), President (since 2011), Executive Vice President (until 2011), and Director of Dodge & Cox; Director of Fixed Income, Portfolio Manager, and member of FIIPC and Global Bond Investment Policy Committee (GBIPC) | | — |
| John A. Gunn (71) | | Senior Vice President (Officer since 1998) | | Chairman Emeritus (2011-2013), Chairman (until 2011), Chief Executive Officer (until 2010), and Director of Dodge & Cox; Portfolio Manager and member of IPC, GSIPC (until 2014), and IIPC | | — |
| Diana S. Strandberg (55) | | Senior Vice President (Officer since 2006) | | Senior Vice President (since 2011), Vice President (until 2011), and Director (since 2011) of Dodge & Cox; Director of International Equity (since 2009), Portfolio Manager, Investment Analyst, and member of IPC, GSIPC, IIPC, and GBIPC | | — |
| David H. Longhurst (57) | | Treasurer (Officer since 2006) | | Vice President and Assistant Treasurer of Dodge & Cox | | — |
| Thomas M. Mistele (61) | | Secretary (Officer since 1998) | | Chief Operating Officer, Director, Secretary, Senior Counsel (since 2011), and General Counsel (until 2011) of Dodge & Cox | | — |
| Katherine M. Primas (40) | | Chief Compliance Officer (Officer since 2009) | | Vice President (since 2011) and Chief Compliance Officer of Dodge & Cox | | — |
| INDEPENDENT TRUSTEES |
| Thomas A. Larsen (65) | | Trustee (Since 2002) | | Senior Counsel of Arnold & Porter LLP (law firm) (since 2013); Partner of Arnold & Porter LLP (since 2012); Director of Howard, Rice, Nemerovski, Canady, Falk & Rabkin (1977-2011) | | — |
| Ann Mather (54) | | Trustee (Since 2011) | | CFO, Pixar Animation Studios (1999-2004) | | Director, Google, Inc. (internet information services) (since 2005); Director, Glu Mobile, Inc. (multimedia software) (since 2005); Director, Arista Networks (since 2013); Director, Netflix, Inc. (video services) (since 2010); Director, Shutterfly, Inc. (internet photography services/publishing) (since 2013) |
| Robert B. Morris III (62) | | Trustee (Since 2011) | | Advisory Director, The Presidio Group (since 2005) | | — |
| Gary Roughead (63) | | Trustee (Since 2013) | | Annenberg Distinguished Visiting Fellow, Hoover Institution (since 2011); Admiral, United States Navy (Ret.); U.S. Navy Chief of Naval Operations (2007-2011) | | Director, Northrop Grumman Corp. (global security) (since 2012) |
| Mark E. Smith (63) | | Trustee (Since 2014) | | Executive Vice President, Managing Director—Fixed Income at Loomis Sayles & Company, L.P. (2003-2011) | | — |
| John B. Taylor (68) | | Trustee (Since 2005) (and 1995-2001) | | Professor of Economics, Stanford University; Senior Fellow, Hoover Institution; Under Secretary for International Affairs, United States Treasury (2001-2005) | | — |
| * | | The address for each Officer and Trustee is 555 California Street, 40th Floor, San Francisco, California 94104. Each Officer and Trustee oversees all six series in the Dodge & Cox Funds complex and serves for an indefinite term. |
Additional information about the Trust’s Trustees and Officers is available in the Trust’s Statement of Additional Information (SAI). You can get a free copy of the SAI by visiting the Funds’ website at www.dodgeandcox.com or calling
800-621-3979.
PAGE 27 § DODGE & COX BALANCED FUND
| | | | |
| | | | |
www.dodgeandcox.com
For Fund literature, transactions, and account
information, please visit the Funds’ website.
or write or call:
DODGE & COX FUNDS
c/o Boston Financial Data Services
P.O. Box 8422
Boston, Massachusetts 02266-8422
(800) 621-3979
INVESTMENT MANAGER
Dodge & Cox
555 California Street, 40th Floor
San Francisco, California 94104
(415) 981-1710
This report is submitted for the general information of the shareholders of the Fund. The report is not authorized for distribution to prospective investors in the Fund unless it is accompanied by a current prospectus.
This report reflects our views, opinions, and portfolio holdings as of December 31, 2014, the end of the reporting period. Any such views are subject to change at any time based upon market or other conditions and Dodge & Cox disclaims any responsibility to update such views. These views may not be relied on as investment advice and, because investment decisions for a Dodge & Cox Fund are based on numerous factors, may not be relied on as an indication of trading intent on behalf of any Dodge & Cox Fund.
12/14 IF AR Printed on recycled paper
Annual Report
December 31, 2014
Income Fund
ESTABLISHED 1989
TICKER: DODIX
TO OUR SHAREHOLDERS
The Dodge & Cox Income Fund had a total return of 5.5% for the year ending December 31, 2014, compared to a total return of 6.0% for the Barclays U.S. Aggregate Bond Index (Barclays U.S. Agg). At year end, the Fund had net assets of $39.1 billion with a cash position of 2.9%.
MARKET COMMENTARY
The year 2014 can best be described as a tale of two halves, the combination of which delivered a robust 6% return(a) for the investment-grade bond market. The first half of the year saw low levels of volatility, substantially declining interest rates, and strong returns among non-Treasury sectors. This relatively benign market environment gave way to a second half featuring a marked uptick in volatility, further interest rate declines (despite clear improvements in U.S. economic activity), and rising yield premiums, resulting in underperformance for corporate bonds and Agency-guaranteed(b) mortgage-backed securities (MBS). The volatility and risk aversion in the second half were driven by a plunge in oil prices, which declined by approximately 50%, as well as concerns that weakness among important global economies (e.g., Eurozone, China, Japan) could threaten the U.S. economic recovery and delay the Federal Reserve’s (Fed) anticipated plans to tighten monetary policy starting in 2015.
Although the U.S. economy struggled early in the year largely due to extreme winter weather, the economic picture brightened as the year progressed. Particularly noteworthy were improvements in labor market conditions, highlighted by a six-year low in the unemployment rate (5.6%, released just after year end) and the highest level of job creation in 15 years. In addition, consumer spending, consumer sentiment, and activity in the manufacturing and service sectors all increased. One major outlier was the housing market, which remained sluggish despite extremely low mortgage rates. The Fed left short-term interest rates near zero throughout 2014 but announced the conclusion to its third asset-purchase program in October. Through its post-meeting communications, the Fed has set the stage for beginning to normalize the stance of monetary policy in 2015. Despite this, some market participants question the likelihood of a 2015 start to the tightening cycle in light of low inflation (in the United States and globally) and a weaker outlook for global growth.
For the year, the U.S. Treasury sector generated a 5.0% return. Investment-grade corporate bonds returned 7.5% but underperformed Treasuries by half a percent on an “excess return”(c) basis, due entirely to poor second-half performance. While the fundamental backdrop for credit remained generally healthy, the uptick in volatility contributed to the sector’s underperformance, led lower by commodity-related issuers. As energy-related issuers constitute a large component of the high yield universe, below investment-grade corporate bonds also performed poorly. Agency MBS returned 6.1% for the year and outperformed comparable-duration(d) Treasuries by 0.4 percentage points for the year (notwithstanding poor second-half performance) amid a relatively stable prepayment environment.
INVESTMENT STRATEGY
A focus on valuation is a critical element of our investment approach. “Valuation” refers to a price (and a corresponding yield) that reflects current market opinion on the risks and potential return of an investment. For Dodge & Cox, a “focus on valuation” means we are disciplined in seeking investment opportunities where we believe the current market consensus either understates the potential return or overstates the potential risks of a security. The ability to identify misalignments between market pricing and underlying fundamentals, be it at the security, issuer, or sector level, is key to generating attractive long-term returns. The gradual changes we make to the Fund’s composition are a direct result of this discipline. For example, we avoid issuers when we believe the downside risks are significant and not adequately compensated through current valuations. On the other hand, when we see attractive relative value and our research gives us confidence that creditworthiness will be maintained or improved over our investment horizon, we seek to add incremental yield to the portfolio, even during volatile times. The actions we took during the past year illustrate the degree to which valuation influences Fund positioning.
Dynamic Credit Valuations Prompt Portfolio Shifts
Corporate bonds performed well for the first half of 2014, as solid underlying fundamentals and strong demand for higher-yielding assets contributed to declining yield
PAGE 1 § DODGE & COX INCOME FUND
premiums.(e) In fact, before widening in the third quarter, corporate bond yield premiums narrowed to mid-2007 levels. We responded to less compelling valuations by reducing numerous corporate holdings (amounting to 9% of the Fund) through the end of September. The trims were evenly split between the Financials and Industrials sub-sectors, driven by our assessment of issue- and issuer-level relative value within and across these segments. For example, Time Warner Cable agreed in February to be acquired by Comcast, triggering significant price improvement in its bonds and providing an excellent opportunity to reduce the Fund’s exposure to the combined entities. We also selectively reduced certain issuers when we felt inadequately compensated for the risk of activities (such as debt-financed share repurchases) which could lead to greater leverage. Within Financials, we continued to gradually reduce the Fund’s overall weighting, which peaked in mid-2012, in light of fuller valuations. For several holdings (e.g., Royal Bank of Scotland, Bank of America), we lowered issuer-level weightings and shifted the mix of holdings from senior debt to subordinated debt. These shifts reflected our view that, for these issuers, the additional yield offered by the subordinated debt provided adequate compensation for higher risk of loss in an adverse outcome, which we believed was remote due to their enhanced capital levels.
Later in the year, as the triple threat of plunging oil prices, global economic weakness, and overall risk aversion hit corporate and quasi-corporate (government-related) yield premiums, we reassessed the opportunity set at new, more attractive valuations. Consequently, we gradually increased the Fund’s corporate weighting again; it ended the year at 39%. A particular area of interest for us has been non-U.S. issuers(f) spanning corporate, government-related, and asset-backed security (ABS) issuers. Our industry, credit, and sovereign analysts closely follow companies, industries, and countries across the globe. This analysis is critical as we assess specific areas of the market where negative market sentiment may have caused valuations to deteriorate more than fundamentals warrant. Of note, we established new positions in two European banks (BNP Paribas and Lloyds Bank), added to Cemex, and built positions in Pemex and Rio Oil(g) (a structured note backed by oil and gas royalties in Brazil).
In the case of Rio Oil, we modestly increased the Fund’s weighting at a more attractive valuation (due to fourth quarter underperformance); the debt service coverage metrics and structural characteristics of the security are important to our investment thesis.
Elsewhere in the credit portfolio, we reduced the Fund’s holdings in the general obligation bonds of the states of California and Illinois following strong performance. While taxable municipal securities now constitute a smaller part of the Fund (5% at the end of 2014 versus 7% at the peak in 2012), we continue to view their risk/reward trade-off favorably, with attractive diversification benefits and better downside protection compared to corporate alternatives. We remain constructive on credit (corporate bonds and government-related securities) given valuations that, while not quite as attractive as at other points in recent years, continue to provide adequate compensation for attendant risks. As always, we continuously monitor the interaction between relative valuation and fundamentals within and across the credit market in order to take advantage of new opportunities as they arise.
MBS Portfolio: Changes in Mix
The Fund’s Agency MBS holdings performed well in 2014 as the Fed’s quantitative easing (QE) program, low levels of interest rate volatility, and subdued prepayments drove positive absolute returns for the year and excess returns over shorter-duration alternatives. Similar to the credit portion of the Fund, valuation has been a key driver of shifts within the Fund’s MBS portfolio. In the past year, the Fund’s MBS weighting remained relatively constant—ranging between 33% and 37%—but we made intra-sector shifts to Fund positioning based on changes in relative valuations within the sector.
Notably, we greatly reduced the Fund’s holdings in higher-coupon 30-year MBS by capitalizing on rich valuations and the market’s belief that prepayments would continue to be subdued. At the same time, we uncovered investment opportunities among the 15-year and 20-year sectors of the universe; together they comprise a small part of the Barclays U.S. Agg but are a growing part of the Fund’s portfolio. These inherently defensive cash flows benefit from a short amortization schedule, which limits
DODGE & COX INCOME FUND §PAGE 2
the range of outcomes insofar as prepayment savings must be somewhat higher for these securities relative to 30-year MBS in order to spur refinancings. Similarly, we increased holdings in hybrid ARMs—loans that are fixed for a period of time and then become floating. The floating rate component of these loans mitigates adverse price declines due to their shorter relative durations. In addition, their prices relative to par are lower than their longer-duration, high-coupon counterparts. Lastly, we added several new ABS holdings to the Fund during the year. The Fund’s ABS (7% at year end) in general offer an attractive combination of quality collateral, robust structure, proven liquidity, and incremental yield over short-term Treasuries.
We believe that the Fund’s current holdings in structured products, including recent shifts, improve long-term risk-adjusted total return prospects across a variety of interest rate and prepayment environments. We rely on the bottom-up valuation and fundamental research framework to help navigate future uncertainty and volatility.
Duration Discussion
The Fund’s relative interest rate positioning over the course of 2014 was dynamic as Treasury yields shifted meaningfully. We began the year with a Fund duration that was roughly 80% of the Barclays U.S. Agg’s, having lengthened modestly into the rising interest rates of 2013. As interest rates declined in the first half of 2014, we reversed the duration extension of 2013 to roughly 70% of the Barclays U.S. Agg’s at year end. The magnitude of interest rate declines in 2014 was unexpected, given the solid footing of the U.S. economy, the benefits of lower oil prices to the end consumer, and the Fed’s ending of QE and guidance to begin raising short-term interest rates over the coming months. It is our view that the fundamentals do not justify the current low level of interest rates in light of the strength of the U.S. economy, even considering the potential impact of global economic weakness on the United States. Market valuations imply very low expectations for future inflation and a slow pace of rate hikes by the Fed (with a low “terminal rate”(h)). We believe it is important to remain defensive at this time in order to mitigate the negative effect of price declines on fixed income instruments resulting from potential increases in interest rates.
IN CLOSING
As we mark the passing of an eventful year, we acknowledge the growth of the Income Fund, with significant inflows particularly in the fourth quarter. We have invested inflows of nearly $9 billion over the past three months, representing a 30% increase in Fund assets, and welcome new shareholders to the Fund alongside our many longstanding investors. We have been able to invest new assets promptly, reaching desired portfolio targets even in a somewhat liquidity-challenged environment. However, Dodge & Cox will continue to carefully monitor inflows. We seek to be proactive in protecting the interests of existing shareholders and are prepared to take steps to manage the pace of growth if needed. We envision no near-term issues with investment capacity given the massive breadth of the fixed income markets and the large number of issuers and securities covered by our investment team.
Thank you for your continued confidence in our firm. As always, we welcome your comments and questions.
For the Board of Trustees,
| | |
| |
|
Charles F. Pohl, Chairman | | Dana M. Emery, President |
January 27, 2015
| (a) | | Sector returns as calculated and reported by Barclays. |
| (b) | | The U.S. Government does not guarantee the Fund’s shares, yield, or net asset value. The agency guarantee (by, for example, Ginnie Mae, Fannie Mae, or Freddie Mac) does not eliminate market risk. |
| (c) | | “Excess returns” refers to duration-adjusted returns for a given sector; it is calculated and reported by Barclays. |
| (d) | | Duration is a measure of a bond’s (or a bond portfolio’s) price sensitivity to changes in interest rates. |
| (e) | | Yield premiums are one way to measure a security’s valuation. Narrowing yield premiums results in a higher valuation. Widening yield premiums results in a lower valuation. |
| (f) | | The Fund held 13% in U.S. dollar-denominated securities of non-U.S. issuers as of December 31, 2014. |
| (g) | | Rio Oil is an asset-backed security but is discussed here in relation to the Fund’s increase in non-U.S. issuers. |
| (h) | | “Terminal rate” refers to the ending Fed funds rate at the conclusion of the Fed’s tightening cycle. |
PAGE 3 § DODGE & COX INCOME FUND
ANNUAL PERFORMANCE REVIEW
The Fund underperformed the Barclays U.S. Agg by 0.5 percentage points in 2014.
Key Detractors from Relative Results
| | § | | The Fund’s defensive duration positioning (approximately 80% of the Barclays U.S. Agg’s duration at the start of 2014) hampered relative returns as interest rates generally declined year-over-year. | |
| | § | | The Fund’s overweight to corporate bonds (47% versus 22% for the Barclays U.S. Agg) detracted mildly from relative returns given the sector’s relative underperformance. | |
| | § | | The Fund’s Agency MBS holdings lagged longer-duration alternatives such as the MBS in the Barclays U.S. Agg due to compositional differences, although they outperformed similar short-duration Treasuries. | |
Key Contributors to Relative Results
| | § | | Security selection was positive, particularly among the Fund’s non-U.S. domiciled* and/or lower-rated holdings. Strong performers included Bank of America and JPMorgan capital securities, Enel, Kingdom of Spain, Macy’s, Telecom Italia, Time Warner Cable, and Twenty-First Century Fox. | |
| | § | | The Fund’s taxable municipal holdings (6% versus 1% for the Barclays U.S. Agg) performed well, particularly State of California general obligation bonds. | |
| | § | | The Fund’s nominal yield advantage benefited returns. | |
| | * | | The Fund held 13.3% in non-U.S. domiciled securities as of 12/31/14; all of the Fund’s non-U.S. holdings are denominated in U.S. dollars. | |
| | | | Unless otherwise noted, figures cited in this section denote Fund positioning at the beginning of the period. | |
KEY CHARACTERISTICS OF DODGE & COX
Independent Organization
Dodge & Cox is one of the largest privately owned investment managers in the world. We remain committed to independence, with a goal of providing the highest quality investment management service to our existing clients.
Over 80 Years of Investment Experience
Dodge & Cox was founded in 1930. We have a stable and well-qualified team of investment professionals, most of whom have spent their entire careers at Dodge & Cox.
Experienced Investment Team
The Fixed Income Investment Policy Committee, which is the decision-making body for the Income Fund, is a nine-member committee with an average tenure at Dodge & Cox of 18 years.
One Business with a Single Research Office
Dodge & Cox manages equity (domestic, international, and global), fixed income (domestic and global), and balanced investments, operating from one office in San Francisco.
Consistent Investment Approach
Our team decision-making process involves thorough, bottom-up fundamental analysis of each investment.
Long-Term Focus and Low Expenses
We invest with a three- to five-year investment horizon, which has historically resulted in low turnover relative to our peers. We manage Funds that maintain low expense ratios.
Risks: The Fund invests in debt securities whose yields and market values fluctuate, so that an investment may be worth more or less than its original cost. Debt securities are subject to interest rate risk, credit risk, and prepayment risk, all of which could have adverse effects on the value of the Fund. A low interest rate environment creates an elevated risk of future negative returns. Financial intermediaries may restrict their market making activities for certain debt securities, which may reduce the liquidity and increase the volatility of such securities. Please read the prospectus and summary prospectus for specific details regarding the Fund’s risk profile.
DODGE & COX INCOME FUND §PAGE 4
GROWTH OF $10,000 OVER 10 YEARS
FOR AN INVESTMENT MADE ON DECEMBER 31, 2004
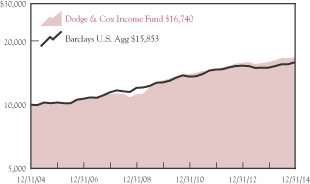
AVERAGE ANNUAL TOTAL RETURN
FOR PERIODS ENDED DECEMBER 31, 2014
| | | | | | | | | | | | | | | | |
| | | 1 Year | | | 5 Years | | | 10 Years | | | 20 Years | |
| | | | | | | | | | | | | | | | |
Dodge & Cox Income Fund | | | 5.48 | % | | | 5.17 | % | | | 5.28 | % | | | 6.69 | % |
Barclays U.S. Aggregate Bond Index (Barclays U.S. Agg) | | | 5.95 | | | | 4.46 | | | | 4.71 | | | | 6.21 | |
Returns represent past performance and do not guarantee future results. Investment return and share price will fluctuate with market conditions, and investors may have a gain or loss when shares are sold. Fund performance changes over time and currently may be significantly lower than stated. Performance is updated and published monthly. Visit the Fund’s website at www.dodgeandcox.com or call 800-621-3979 for current performance figures.
The Fund’s total returns include the reinvestment of dividend and capital gain distributions, but have not been adjusted for any income taxes payable by shareholders on these distributions or on Fund share redemptions. Index returns include interest income but, unlike Fund returns, do not reflect fees or expenses. The Barclays U.S. Aggregate Bond Index (Barclays U.S. Agg) is a widely recognized, unmanaged index of U.S. dollar-denominated, investment-grade, taxable debt securities.
Barclays® is a trademark of Barclays Bank PLC.
FUND EXPENSE EXAMPLE
As a Fund shareholder, you incur ongoing Fund costs, including management fees and other Fund expenses. All mutual funds have ongoing costs, sometimes referred to as operating expenses. The following example shows ongoing costs of investing in the Fund and can help you understand these costs and compare them with those of other mutual funds. The example assumes a $1,000 investment held for the six months indicated.
ACTUAL EXPENSES
The first line of the table below provides information about actual account values and expenses based on the Fund’s actual returns. You may use the information in this line, together with your account balance, to estimate the expenses that you paid over the period. Simply divide your account value by $1,000 (for example, an $8,600 account value divided by $1,000 = 8.6), then multiply the result by the number in the first line under the heading “Expenses Paid During Period” to estimate the expenses you paid on your account during this period.
HYPOTHETICAL EXAMPLE FOR COMPARISON WITH OTHER MUTUAL FUNDS
Information on the second line of the table can help you compare ongoing costs of investing in the Fund with those of other mutual funds. This information may not be used to estimate the actual ending account balance or expenses you paid during the period. The hypothetical “Ending Account Value” is based on the actual expense ratio of the Fund and an assumed 5% annual rate of return before expenses (not the Fund’s actual return). The amount under the heading “Expense Paid During the Period” shows the hypothetical expenses your account would have incurred under this scenario. You can compare this figure with the 5% hypothetical examples that appear in shareholder reports of other mutual funds.
| | | | | | | | | | | | |
Six Months Ended December 31, 2014 | | Beginning Account Value
7/1/2014 | | | Ending Account Value
12/31/2014 | | | Expenses Paid
During Period* | |
Based on Actual Fund Return | | $ | 1,000.00 | | | $ | 1,008.80 | | | $ | 2.24 | |
Based on Hypothetical 5% Yearly Return | | | 1,000.00 | | | | 1,022.97 | | | | 2.26 | |
| * | | Expenses are equal to the Fund’s annualized expense ratio of 0.44%, multiplied by the average account value over the period, multiplied by 184/365 (to reflect the one-half year period). |
The expenses shown in the table highlight ongoing costs only and do not reflect any transactional fees or account maintenance fees. Though other mutual funds may charge such fees, please note that the Fund does not charge transaction fees (e.g., redemption fees, sales loads) or universal account maintenance fees (e.g., small account fees).
PAGE 5 § DODGE & COX INCOME FUND
| | | | |
| FUND INFORMATION | | | December 31, 2014 | |
| | | | |
| GENERAL INFORMATION | | | |
Net Asset Value Per Share | | | $13.78 | |
Total Net Assets (billions) | | | $39.1 | |
30-Day SEC Yield(a) | | | 2.59% | |
2013 Expense Ratio (per 5/1/14 Prospectus) | | | 0.43% | |
2014 Expense Ratio | | | 0.44% | |
Portfolio Turnover Rate | | | 27% | |
Fund Inception | | | 1989 | |
No sales charges or distribution fees | | | | |
Investment Manager: Dodge & Cox, San Francisco. Managed by the Fixed Income Investment Policy Committee, whose nine members’ average tenure at Dodge & Cox is 18 years.
| | | | | | | | |
| PORTFOLIO CHARACTERISTICS | | Fund | | | Barclays
U.S. Agg | |
Number of Debt Securities | | | 884 | | | | 9,079 | |
Effective Duration (years) | | | 3.9 | | | | 5.6 | |
| | | | |
| FIVE LARGEST CORPORATE ISSUERS (%)(b) | | Fund | |
Bank of America Corp. | | | 2.0 | |
Verizon Communications, Inc. | | | 1.9 | |
Cox Enterprises, Inc. | | | 1.8 | |
Time Warner, Inc. | | | 1.6 | |
Citigroup, Inc. | | | 1.4 | |
| | | | | | | | |
| CREDIT QUALITY (%)(c) | | Fund | | | Barclays
U.S. Agg | |
U.S. Treasury/Agency/GSE(d) | | | 45.2 | | | | 68.0 | |
Aaa | | | 4.5 | | | | 4.7 | |
Aa | | | 1.2 | | | | 3.7 | |
A | | | 9.8 | | | | 11.7 | |
Baa | | | 25.8 | | | | 11.9 | |
Ba | | | 8.3 | | | | 0.0 | |
B | | | 2.3 | | | | 0.0 | |
Caa | | | 0.0 | (e) | | | 0.0 | |
Cash Equivalents | | | 2.9 | | | | 0.0 | |
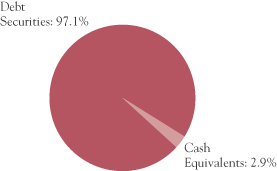
| | | | | | | | |
| SECTOR DIVERSIFICATION (%) | | Fund | | | Barclays
U.S. Agg | |
U.S. Treasury(d) | | | 11.1 | | | | 35.8 | |
Government-Related | | | 7.0 | | | | 9.5 | |
Mortgage-Related(f) | | | 33.8 | | | | 28.8 | |
Corporate | | | 38.7 | | | | 23.3 | |
Asset-Backed/Commercial Mortgage-Backed(g) | | | 6.5 | | | | 2.6 | |
Cash Equivalents | | | 2.9 | | | | 0.0 | |
| | | | | | | | |
| MATURITY DIVERSIFICATION (%)(d) | | Fund | | | Barclays
U.S. Agg | |
0-1 Years to Maturity | | | 5.1 | | | | 0.0 | |
1-5 | | | 49.9 | | | | 45.6 | |
5-10 | | | 28.8 | | | | 40.2 | |
10-15 | | | 2.0 | | | | 1.5 | |
15-20 | | | 4.3 | | | | 1.8 | |
20-25 | | | 6.7 | | | | 3.3 | |
25 and Over | | | 3.2 | | | | 7.6 | |
| (a) | SEC Yield is an annualization of the Fund’s total net investment income per share for the 30-day period ended on the last day of the month. |
| (b) | The Fund’s portfolio holdings are subject to change without notice. The mention of specific securities is not a recommendation to buy, sell, or hold any particular security and is not indicative of Dodge & Cox’s current or future trading activity. |
| (c) | The credit quality distributions shown for the Fund and the Index are based on the middle of Moody’s, S&P’s, and Fitch ratings, which is the methodology used by Barclays in constructing its indices. If a security is rated by only two agencies, the lower of the two ratings is used. Please note the Fund applies the highest of Moody’s, S&P’s, and Fitch ratings to determine compliance with the quality requirements stated in its prospectus. On that basis, the Fund held 5.7% in securities rated below investment grade. The credit quality of the investments in the portfolio does not apply to the stability or safety of the Fund or its shares. |
| (d) | Data as presented excludes the effect of the Fund’s position in Treasury futures contracts. |
| (f) | The Fund holds 0.3% in Agency multifamily mortgage securities; the Index classifies these securities under CMBS – Agency. |
| (g) | Commercial mortgage-backed securities are a component of the Barclays U.S. Aggregate but are not currently held by the Fund. |
DODGE & COX INCOME FUND §PAGE 6
| | | | |
| PORTFOLIO OF INVESTMENTS | | | December 31, 2014 | |
| | | | | | | | |
| DEBT SECURITIES: 97.1% | | | | | | |
| | |
| | | PAR VALUE | | | VALUE | |
| U.S. TREASURY: 11.1% | | | | | | | | |
U.S. Treasury Note | | | | | | | | |
0.75%, 3/15/17 | | $ | 525,000,000 | | | $ | 524,794,725 | |
0.875%, 5/15/17 | | | 750,000,000 | | | | 750,175,500 | |
0.50%, 7/31/17 | | | 621,000,000 | | | | 613,819,998 | |
0.625%, 9/30/17 | | | 600,000,000 | | | | 593,296,800 | |
1.50%, 8/31/18 | | | 750,000,000 | | | | 753,456,750 | |
1.50%, 2/28/19 | | | 496,995,000 | | | | 497,150,062 | |
1.625%, 7/31/19 | | | 600,000,000 | | | | 600,890,400 | |
| | | | | | | | |
| | | | | | | 4,333,584,235 | |
| GOVERNMENT-RELATED: 7.0% | | | | | |
FEDERAL AGENCY: 0.4% | | | | | | | | |
Small Business Admin. — 504 Program | | | | | |
Series 1995-20A 1, 8.50%, 1/1/15 | | | 6,673 | | | | 6,674 | |
Series 1995-20C 1, 8.10%, 3/1/15 | | | 11,572 | | | | 11,710 | |
Series 1997-20E 1, 7.30%, 5/1/17 | | | 60,817 | | | | 63,467 | |
Series 1997-20H 1, 6.80%, 8/1/17 | | | 14,680 | | | | 15,256 | |
Series 1997-20J 1, 6.55%, 10/1/17 | | | 185,116 | | | | 194,641 | |
Series 1997-20L 1, 6.55%, 12/1/17 | | | 8,023 | | | | 8,362 | |
Series 1998-20B 1, 6.15%, 2/1/18 | | | 22,961 | | | | 23,862 | |
Series 1998-20C 1, 6.35%, 3/1/18 | | | 687,227 | | | | 716,138 | |
Series 1998-20H 1, 6.15%, 8/1/18 | | | 370,739 | | | | 386,915 | |
Series 1998-20L 1, 5.80%, 12/1/18 | | | 196,249 | | | | 208,727 | |
Series 1999-20C 1, 6.30%, 3/1/19 | | | 191,916 | | | | 203,032 | |
Series 1999-20E 1, 6.30%, 5/1/19 | | | 5,777 | | | | 6,155 | |
Series 1999-20G 1, 7.00%, 7/1/19 | | | 345,431 | | | | 367,307 | |
Series 1999-20I 1, 7.30%, 9/1/19 | | | 164,143 | | | | 175,938 | |
Series 2000-20C 1, 7.625%, 3/1/20 | | | 10,747 | | | | 11,657 | |
Series 2000-20G 1, 7.39%, 7/1/20 | | | 7,251 | | | | 7,865 | |
Series 2001-20G 1, 6.625%, 7/1/21 | | | 1,673,623 | | | | 1,817,940 | |
Series 2001-20L 1, 5.78%, 12/1/21 | | | 4,486,848 | | | | 4,838,861 | |
Series 2002-20A 1, 6.14%, 1/1/22 | | | 31,763 | | | | 34,262 | |
Series 2002-20L 1, 5.10%, 12/1/22 | | | 1,313,686 | | | | 1,416,649 | |
Series 2003-20G 1, 4.35%, 7/1/23 | | | 80,435 | | | | 84,790 | |
Series 2004-20L 1, 4.87%, 12/1/24 | | | 1,904,557 | | | | 2,040,091 | |
Series 2005-20B 1, 4.625%, 2/1/25 | | | 3,302,681 | | | | 3,505,235 | |
Series 2005-20D 1, 5.11%, 4/1/25 | | | 150,479 | | | | 163,602 | |
Series 2005-20E 1, 4.84%, 5/1/25 | | | 5,484,847 | | | | 5,900,775 | |
Series 2005-20G 1, 4.75%, 7/1/25 | | | 5,522,446 | | | | 5,889,107 | |
Series 2005-20H 1, 5.11%, 8/1/25 | | | 76,231 | | | | 82,538 | |
Series 2005-20I 1, 4.76%, 9/1/25 | | | 6,613,336 | | | | 7,057,020 | |
Series 2006-20A 1, 5.21%, 1/1/26 | | | 6,617,034 | | | | 7,147,224 | |
Series 2006-20B 1, 5.35%, 2/1/26 | | | 2,110,910 | | | | 2,282,940 | |
Series 2006-20C 1, 5.57%, 3/1/26 | | | 9,247,616 | | | | 10,137,509 | |
Series 2006-20G 1, 6.07%, 7/1/26 | | | 18,175,471 | | | | 20,400,283 | |
Series 2006-20H 1, 5.70%, 8/1/26 | | | 146,842 | | | | 163,013 | |
Series 2006-20I 1, 5.54%, 9/1/26 | | | 302,294 | | | | 331,498 | |
Series 2006-20J 1, 5.37%, 10/1/26 | | | 5,950,798 | | | | 6,465,170 | |
Series 2006-20L 1, 5.12%, 12/1/26 | | | 4,509,240 | | | | 4,893,743 | |
Series 2007-20A 1, 5.32%, 1/1/27 | | | 10,997,531 | | | | 12,142,212 | |
Series 2007-20C 1, 5.23%, 3/1/27 | | | 16,762,515 | | | | 18,431,102 | |
Series 2007-20D 1, 5.32%, 4/1/27 | | | 16,891,819 | | | | 18,646,417 | |
Series 2007-20G 1, 5.82%, 7/1/27 | | | 10,961,541 | | | | 12,253,743 | |
| | | | | | | | |
| | | | | | | 148,533,430 | |
| | | | | | | | |
| | |
| | | PAR VALUE | | | VALUE | |
FOREIGN AGENCY: 1.9% | | | | | | | | |
Export-Import Bank of Korea(c)
(South Korea)
4.00%, 1/11/17 | | $ | 19,780,000 | | | $ | 20,735,967 | |
Petroleo Brasileiro SA(c) (Brazil) | | | | | | | | |
5.75%, 1/20/20 | | | 43,955,000 | | | | 42,407,960 | |
5.375%, 1/27/21 | | | 187,220,000 | | | | 173,472,435 | |
4.375%, 5/20/23 | | | 38,625,000 | | | | 33,220,590 | |
6.25%, 3/17/24 | | | 80,805,000 | | | | 76,889,190 | |
Petroleos Mexicanos(c) (Mexico) | | | | | | | | |
4.875%, 1/18/24 | | | 109,415,000 | | | | 113,682,185 | |
4.25%, 1/15/25(b) | | | 89,415,000 | | | | 88,833,803 | |
6.625%, 6/15/35 | | | 58,625,000 | | | | 67,711,875 | |
5.50%, 6/27/44(b) | | | 36,075,000 | | | | 36,796,500 | |
6.375%, 1/23/45 | | | 86,255,000 | | | | 97,683,787 | |
| | | | | | | | |
| | | | | | | 751,434,292 | |
LOCAL AUTHORITY: 4.5% | | | | | | | | |
L.A. Unified School District GO | | | | | | | | |
5.75%, 7/1/34 | | | 5,235,000 | | | | 6,606,047 | |
6.758%, 7/1/34 | | | 153,490,000 | | | | 213,866,827 | |
New Jersey Turnpike Authority RB | | | | | | | | |
7.414%, 1/1/40 | | | 31,485,000 | | | | 47,313,769 | |
7.102%, 1/1/41 | | | 123,498,000 | | | | 179,112,854 | |
New Valley Generation
4.929%, 1/15/21 | | | 383,260 | | | | 425,694 | |
State of California GO | | | | | | | | |
7.50%, 4/1/34 | | | 158,646,000 | | | | 235,839,971 | |
7.55%, 4/1/39 | | | 200,880,000 | | | | 309,996,007 | |
7.30%, 10/1/39 | | | 83,765,000 | | | | 123,385,007 | |
7.625%, 3/1/40 | | | 85,165,000 | | | | 130,728,275 | |
7.60%, 11/1/40 | | | 61,410,000 | | | | 95,819,865 | |
State of Illinois GO | | | | | | | | |
4.961%, 3/1/16 | | | 54,290,000 | | | | 56,555,522 | |
5.365%, 3/1/17 | | | 186,245,000 | | | | 199,384,585 | |
5.665%, 3/1/18 | | | 170,335,000 | | | | 186,521,935 | |
| | | | | | | | |
| | | | | | | 1,785,556,358 | |
SOVEREIGN: 0.2% | | | | | | | | |
Spain Government International(c) (Spain)
4.00%, 3/6/18(b) | | | 74,765,000 | | | | 78,661,004 | |
| | | | | | | | |
| | | | | | | 2,764,185,084 | |
| MORTGAGE-RELATED: 33.8% | |
FEDERAL AGENCY CMO & REMIC: 5.0% | |
Dept. of Veterans Affairs | | | | | | | | |
Series 1995-2D 4A, 9.293%, 5/15/25 | | | 163,346 | | | | 197,288 | |
Series 1997-2 Z, 7.50%, 6/15/27 | | | 11,473,267 | | | | 13,077,103 | |
Series 1998-2 2A, 8.727%, 8/15/27 | | | 43,200 | | | | 51,245 | |
Series 1998-1 1A, 8.214%, 3/15/28 | | | 274,439 | | | | 321,132 | |
Fannie Mae | | | | | | | | |
Trust 2014-M13 ASQ2,
1.637%, 11/25/17 | | | 65,099,373 | | | | 65,547,061 | |
Trust 1998-58 PX, 6.50%, 9/25/28 | | | 537,571 | | | | 598,326 | |
Trust 1998-58 PC, 6.50%, 10/25/28 | | | 2,777,284 | | | | 3,092,994 | |
| | |
| PAGE 7 § DODGE & COX INCOME FUND | | See accompanying Notes to Financial Statements |
| | | | |
| PORTFOLIO OF INVESTMENTS | | | December 31, 2014 | |
| | | | | | | | |
| DEBT SECURITIES (continued) | | | | | | |
| | |
| | | PAR VALUE | | | VALUE | |
Trust 2001-69 PQ, 6.00%, 12/25/31 | | $ | 3,306,541 | | | $ | 3,640,935 | |
Trust 2002-33 A1, 7.00%, 6/25/32 | | | 2,795,099 | | | | 3,184,035 | |
Trust 2002-69 Z, 5.50%, 10/25/32 | | | 458,876 | | | | 508,207 | |
Trust 2008-24 GD, 6.50%, 3/25/37 | | | 3,475,223 | | | | 3,851,784 | |
Trust 2009-30 AG, 6.50%, 5/25/39 | | | 18,086,409 | | | | 19,625,255 | |
Trust 2009-53 QM, 5.50%, 5/25/39 | | | 4,943,185 | | | | 5,326,262 | |
Trust 2009-40 TB, 6.00%, 6/25/39 | | | 8,790,605 | | | | 9,609,520 | |
Trust 2001-T3 A1, 7.50%, 11/25/40 | | | 151,003 | | | | 176,088 | |
Trust 2010-123 WT, 7.00%, 11/25/40 | | | 67,633,737 | | | | 76,304,856 | |
Trust 2001-T7 A1, 7.50%, 2/25/41 | | | 101,372 | | | | 116,173 | |
Trust 2001-T5 A2, 6.99%, 6/19/41 | | | 60,214 | | | | 68,164 | |
Trust 2001-T5 A3, 7.50%, 6/19/41 | | | 289,343 | | | | 332,246 | |
Trust 2001-T4 A1, 7.50%, 7/25/41 | | | 2,695,161 | | | | 3,205,099 | |
Trust 2011-58 AT, 4.00%, 7/25/41 | | | 15,553,820 | | | | 16,230,271 | |
Trust 2001-T10 A1, 7.00%, 12/25/41 | | | 3,033,605 | | | | 3,538,785 | |
Trust 2013-106 MA, 4.00%, 2/25/42 | | | 30,561,096 | | | | 32,142,877 | |
Trust 2002-T12 A3, 7.50%, 5/25/42 | | | 57,935 | | | | 67,837 | |
Trust 2002-90 A1, 6.50%, 6/25/42 | | | 6,185,855 | | | | 7,044,997 | |
Trust 2002-W6 2A1, 6.45%, 6/25/42 | | | 3,600,316 | | | | 4,126,649 | |
Trust 2002-W8 A2, 7.00%, 6/25/42 | | | 2,022,255 | | | | 2,328,881 | |
Trust 2002-T16 A3, 7.50%, 7/25/42 | | | 4,450,684 | | | | 5,047,646 | |
Trust 2003-W2 1A2, 7.00%, 7/25/42 | | | 9,575,114 | | | | 11,175,786 | |
Trust 2003-W4 3A, 6.575%, 10/25/42 | | | 3,141,992 | | | | 3,566,224 | |
Trust 2012-121 NB, 7.00%, 11/25/42 | | | 2,139,059 | | | | 2,473,909 | |
Trust 2003-7 A1, 6.50%, 12/25/42 | | | 5,036,998 | | | | 5,690,296 | |
Trust 2003-W1 2A, 6.552%, 12/25/42 | | | 3,585,875 | | | | 4,123,566 | |
Trust 2012-133 HF, 0.52%, 12/25/42 | | | 57,462,905 | | | | 57,234,261 | |
Trust 2012-133 JF, 0.52%, 12/25/42 | | | 19,875,617 | | | | 19,985,052 | |
Trust 2012-134 FD, 0.52%, 12/25/42 | | | 1,560,501 | | | | 1,548,333 | |
Trust 2012-134 FT, 0.52%, 12/25/42 | | | 80,800,670 | | | | 81,416,775 | |
Trust 2012-148 LF, 0.47%, 1/25/43 | | | 67,674,840 | | | | 67,119,500 | |
Trust 2013-6 FL, 0.57%, 2/25/43 | | | 178,414,507 | | | | 180,077,865 | |
Trust 2013-15 FA, 0.52%, 3/25/43 | | | 2,130,526 | | | | 2,135,579 | |
Trust 2013-98 FA, 0.72%, 9/25/43 | | | 53,199,441 | | | | 53,748,566 | |
Trust 2013-101 CF, 0.77%, 10/25/43 | | | 26,391,392 | | | | 26,695,949 | |
Trust 2013-101 FE, 0.77%, 10/25/43 | | | 42,105,207 | | | | 42,588,828 | |
Trust 2004-T1 1A2, 6.50%, 1/25/44 | | | 3,210,853 | | | | 3,659,275 | |
Trust 2004-W2 2A2, 7.00%, 2/25/44 | | | 180,629 | | | | 207,262 | |
Trust 2004-W2 5A, 7.50%, 3/25/44 | | | 8,561,212 | | | | 9,786,741 | |
Trust 2004-W8 3A, 7.50%, 6/25/44 | | | 6,313,576 | | | | 7,357,507 | |
Trust 2004-W14 1AF, 0.57%, 7/25/44 | | | 2,161,615 | | | | 2,124,649 | |
Trust 2004-W15 1A2, 6.50%, 8/25/44 | | | 1,426,413 | | | | 1,587,863 | |
Trust 2005-W1 1A3, 7.00%, 10/25/44 | | | 7,967,957 | | | | 9,146,625 | |
Trust 2001-79 BA, 7.00%, 3/25/45 | | | 995,061 | | | | 1,160,626 | |
Trust 2006-W1 1A1, 6.50%, 12/25/45 | | | 653,227 | | | | 738,940 | |
Trust 2006-W1 1A2, 7.00%, 12/25/45 | | | 5,010,175 | | | | 5,811,252 | |
Trust 2006-W1 1A3, 7.50%, 12/25/45 | | | 87,767 | | | | 101,736 | |
Trust 2006-W1 1A4, 8.00%, 12/25/45 | | | 5,754,797 | | | | 6,880,614 | |
Trust 2007-W10 1A, 6.294%, 8/25/47 | | | 23,194,047 | | | | 26,004,701 | |
Trust 2007-W10 2A, 6.297%, 8/25/47 | | | 6,671,359 | | | | 7,533,799 | |
| | | | | | | | |
| | |
| | | PAR VALUE | | | VALUE | |
Freddie Mac | | | | | | | | |
Series 2456 CJ, 6.50%, 6/15/32 | | $ | 292,017 | | | $ | 327,368 | |
Series 3312 AB, 6.50%, 6/15/32 | | | 5,469,472 | | | | 6,162,197 | |
Series T-41 2A, 6.088%, 7/25/32 | | | 343,330 | | | | 397,645 | |
Series 2587 ZU, 5.50%, 3/15/33 | | | 9,319,741 | | | | 10,069,794 | |
Series 2610 UA, 4.00%, 5/15/33 | | | 3,101,656 | | | | 3,236,488 | |
Series T-48 1A, 5.652%, 7/25/33 | | | 3,574,427 | | | | 4,045,669 | |
Series 2708 ZD, 5.50%, 11/15/33 | | | 36,423,195 | | | | 40,325,940 | |
Series 3330 GZ, 5.50%, 6/15/37 | | | 10,146,553 | | | | 10,936,401 | |
Series 4091 JF, 0.661%, 6/15/41 | | | 35,441,306 | | | | 35,634,107 | |
Series 4120 YF, 0.511%, 10/15/42 | | | 88,110,787 | | | | 87,805,571 | |
Series 4122 FP, 0.561%, 10/15/42 | | | 46,543,680 | | | | 46,573,933 | |
Series 309 F4, 0.691%, 8/15/43 | | | 93,432,650 | | | | 94,509,874 | |
Series 311 F1, 0.711%, 8/15/43 | | | 129,860,371 | | | | 131,476,110 | |
Series 4240 FA, 0.661%, 8/15/43 | | | 22,472,652 | | | | 22,518,384 | |
Series T-51 1A, 6.50%, 9/25/43 | | | 80,434 | | | | 92,103 | |
Series 4259 FA, 0.661%, 10/15/43 | | | 41,727,062 | | | | 42,072,186 | |
Series 4281 BC, 5.968%, 12/15/43 | | | 209,428,788 | | | | 232,120,188 | |
Series 4283 DW, 5.996%, 12/15/43 | | | 126,715,000 | | | | 141,684,983 | |
Series 4283 EW, 5.928%, 12/15/43 | | | 77,420,658 | | | | 85,240,609 | |
Series 4310 FA, 0.711%, 2/15/44 | | | 3,304,559 | | | | 3,335,443 | |
Series 4319 MA, 6.174%, 3/15/44 | | | 38,337,000 | | | | 42,718,612 | |
| | | | | | | | |
| | | | | | | 1,962,327,400 | |
FEDERAL AGENCY MORTGAGE PASS-THROUGH: 28.8% | |
Fannie Mae, 10 Year
6.00%, 11/1/16 | | | 844,460 | | | | 871,937 | |
Fannie Mae, 15 Year | | | | | | | | |
3.50%, 8/1/26-9/1/28 | | | 636,689,589 | | | | 673,348,395 | |
4.00%, 9/1/25-5/1/27 | | | 209,114,551 | | | | 223,535,355 | |
5.00%, 9/1/25 | | | 103,749,320 | | | | 113,275,079 | |
5.50%, 1/1/18-7/1/25 | | | 282,434,743 | | | | 309,676,631 | |
6.00%, 7/1/16-3/1/23 | | | 113,312,817 | | | | 122,095,432 | |
6.50%, 5/1/16-12/1/19 | | | 12,941,586 | | | | 13,524,044 | |
7.00%, 11/1/17 | | | 27,783 | | | | 28,694 | |
7.50%, 8/1/17 | | | 431,859 | | | | 442,279 | |
Fannie Mae, 20 Year | | | | | | | | |
4.00%, 9/1/30-12/1/34 | | | 1,623,142,673 | | | | 1,746,752,674 | |
4.50%, 3/1/29-1/1/34 | | | 955,582,749 | | | | 1,041,108,797 | |
6.00%, 6/1/27-2/1/28 | | | 7,791,464 | | | | 8,835,693 | |
6.50%, 4/1/19-10/1/24 | | | 9,433,105 | | | | 10,741,419 | |
Fannie Mae, 30 Year | | | | | | | | |
4.50%, 6/1/36-8/1/44 | | | 686,976,791 | | | | 749,585,451 | |
5.00%, 7/1/37 | | | 21,541,133 | | | | 23,792,902 | |
5.50%, 2/1/33-11/1/39 | | | 358,447,013 | | | | 403,752,956 | |
6.00%, 11/1/28-2/1/39 | | | 332,899,962 | | | | 376,215,902 | |
6.50%, 12/1/32-8/1/39 | | | 157,275,006 | | | | 178,208,464 | |
7.00%, 4/1/32-2/1/39 | | | 146,045,838 | | | | 163,739,935 | |
Fannie Mae, 40 Year
4.50%, 1/1/52 | | | 17,602,226 | | | | 18,946,220 | |
Fannie Mae, Hybrid ARM | | | | | | | | |
1.794%, 8/1/34 | | | 2,767,062 | | | | 2,929,358 | |
1.853%, 10/1/34 | | | 3,399,312 | | | | 3,591,935 | |
| | |
| See accompanying Notes to Financial Statements | | DODGE & COX INCOME FUND §PAGE 8 |
| | | | |
| PORTFOLIO OF INVESTMENTS | | | December 31, 2014 | |
| | | | | | | | |
| DEBT SECURITIES (continued) | | | | | | |
| | |
| | | PAR VALUE | | | VALUE | |
1.87%, 1/1/35 | | $ | 4,145,708 | | | $ | 4,388,901 | |
1.877%, 6/1/43 | | | 7,478,684 | | | | 7,664,843 | |
1.898%, 8/1/35 | | | 3,088,698 | | | | 3,294,259 | |
1.907%, 7/1/35 | | | 2,188,410 | | | | 2,316,323 | |
1.945%, 11/1/35 | | | 3,123,167 | | | | 3,293,221 | |
1.947%, 9/1/43 | | | 17,045,196 | | | | 17,484,361 | |
1.958%, 7/1/35 | | | 2,327,677 | | | | 2,464,220 | |
1.962%, 8/1/35 | | | 10,446,304 | | | | 11,260,081 | |
2.006%, 4/1/35 | | | 4,936,898 | | | | 5,236,580 | |
2.085%, 7/1/35 | | | 2,805,634 | | | | 3,018,777 | |
2.12%, 9/1/34 | | | 4,150,358 | | | | 4,357,169 | |
2.129%, 1/1/37 | | | 5,146,015 | | | | 5,481,060 | |
2.151%, 10/1/38 | | | 10,725,198 | | | | 11,464,465 | |
2.168%, 10/1/35 | | | 3,921,279 | | | | 4,211,778 | |
2.182%, 1/1/36 | | | 5,602,199 | | | | 6,012,449 | |
2.189%, 12/1/35 | | | 2,514,090 | | | | 2,687,280 | |
2.205%, 10/1/38 | | | 6,196,707 | | | | 6,552,759 | |
2.215%, 11/1/36 | | | 3,339,325 | | | | 3,543,931 | |
2.248%, 10/1/35 | | | 3,019,068 | | | | 3,227,432 | |
2.25%, 6/1/35-7/1/35 | | | 3,854,244 | | | | 4,097,775 | |
2.256%, 7/1/34 | | | 3,797,936 | | | | 4,036,533 | |
2.259%, 1/1/36 | | | 7,052,629 | | | | 7,517,155 | |
2.267%, 9/1/35 | | | 3,540,270 | | | | 3,783,516 | |
2.268%, 8/1/34 | | | 872,993 | | | | 929,623 | |
2.27%, 10/1/33 | | | 3,846,126 | | | | 4,106,416 | |
2.273%, 12/1/36 | | | 4,417,098 | | | | 4,705,069 | |
2.317%, 8/1/35 | | | 5,924,497 | | | | 6,371,213 | |
2.341%, 2/1/44 | | | 6,121,021 | | | | 6,291,121 | |
2.374%, 9/1/38 | | | 1,229,775 | | | | 1,332,008 | |
2.383%, 9/1/42 | | | 21,246,119 | | | | 21,733,222 | |
2.425%, 2/1/43 | | | 27,017,202 | | | | 27,703,101 | |
2.493%, 5/1/44 | | | 33,237,677 | | | | 34,222,483 | |
2.496%, 11/1/42 | | | 17,598,359 | | | | 18,030,545 | |
2.499%, 10/1/44 | | | 13,143,639 | | | | 13,408,366 | |
2.51%, 1/1/35 | | | 2,005,091 | | | | 2,151,757 | |
2.609%, 2/1/37 | | | 12,272,982 | | | | 13,218,797 | |
2.675%, 10/1/44 | | | 26,483,210 | | | | 27,236,958 | |
2.69%, 4/1/44 | | | 35,441,077 | | | | 36,644,370 | |
2.708%, 2/1/43 | | | 15,136,289 | | | | 15,853,945 | |
2.718%, 11/1/43 | | | 32,212,995 | | | | 33,010,673 | |
2.726%, 12/1/44 | | | 13,474,419 | | | | 13,875,364 | |
2.747%, 11/1/44 | | | 10,018,975 | | | | 10,324,894 | |
2.751%, 10/1/44 | | | 22,288,281 | | | | 22,978,596 | |
2.752%, 12/1/44 | | | 10,056,953 | | | | 10,354,745 | |
2.758%, 9/1/44 | | | 23,534,102 | | | | 24,272,360 | |
2.786%, 11/1/44 | | | 18,098,649 | | | | 18,661,516 | |
2.788%, 9/1/44 | | | 22,653,516 | | | | 23,382,646 | |
2.799%, 10/1/44 | | | 22,296,154 | | | | 23,006,415 | |
2.802%, 12/1/44 | | | 66,800,028 | | | | 68,542,529 | |
2.813%, 10/1/44 | | | 72,291,906 | | | | 74,626,197 | |
2.823%, 12/1/44 | | | 31,058,559 | | | | 32,122,815 | |
2.829%, 8/1/44 | | | 23,945,221 | | | | 24,721,990 | |
2.831%, 10/1/44 | | | 40,075,307 | | | | 41,369,917 | |
2.835%, 10/1/44 | | | 24,594,735 | | | | 25,389,347 | |
| | | | | | | | |
| | |
| | | PAR VALUE | | | VALUE | |
2.84%, 8/1/44 | | $ | 64,128,701 | | | $ | 66,575,619 | |
2.85%, 10/1/44 | | | 29,763,185 | | | | 30,731,567 | |
2.856%, 2/1/44 | | | 13,893,111 | | | | 14,344,225 | |
2.86%, 11/1/44 | | | 39,950,771 | | | | 41,253,266 | |
2.864%, 11/1/44 | | | 39,049,097 | | | | 40,338,947 | |
2.869%, 7/1/44 | | | 35,628,076 | | | | 36,828,931 | |
2.892%, 10/1/44 | | | 11,306,573 | | | | 11,694,760 | |
2.906%, 9/1/44 | | | 10,261,404 | | | | 10,613,530 | |
2.909%, 10/1/44 | | | 23,453,213 | | | | 24,354,804 | |
2.91%, 9/1/44 | | | 81,776,016 | | | | 84,629,142 | |
2.914%, 9/1/43 | | | 15,336,352 | | | | 15,823,099 | |
2.916%, 7/1/44 | | | 25,685,439 | | | | 26,590,525 | |
2.924%, 11/1/44 | | | 39,827,134 | | | | 41,167,629 | |
2.928%, 8/1/44 | | | 15,915,673 | | | | 16,476,407 | |
2.946%, 10/1/44 | | | 49,065,865 | | | | 50,803,678 | |
2.955%, 4/1/44 | | | 14,649,005 | | | | 15,198,754 | |
2.956%, 7/1/44 | | | 21,708,754 | | | | 22,471,186 | |
2.969%, 10/1/44-11/1/44 | | | 67,522,707 | | | | 69,958,227 | |
2.971%, 4/1/44 | | | 14,070,491 | | | | 14,587,252 | |
2.973%, 7/1/44 | | | 14,222,212 | | | | 14,741,958 | |
3.003%, 9/1/44 | | | 44,057,990 | | | | 45,709,980 | |
3.03%, 8/1/44 | | | 20,226,695 | | | | 21,005,542 | |
3.198%, 10/1/38 | | | 2,777,132 | | | | 2,949,763 | |
3.463%, 7/1/41 | | | 98,678,502 | | | | 104,338,856 | |
4.123%, 12/1/39 | | | 4,829,824 | | | | 5,110,623 | |
4.964%, 4/1/38 | | | 1,129,337 | | | | 1,208,913 | |
4.981%, 5/1/38 | | | 4,243,094 | | | | 4,512,052 | |
5.217%, 8/1/37 | | | 866,735 | | | | 924,285 | |
5.50%, 6/1/39 | | | 1,981,136 | | | | 2,109,820 | |
5.512%, 11/1/37 | | | 2,818,666 | | | | 3,017,400 | |
5.596%, 4/1/37 | | | 760,485 | | | | 805,136 | |
5.621%, 7/1/36 | | | 71,458 | | | | 72,397 | |
5.878%, 12/1/36 | | | 1,673,133 | | | | 1,792,936 | |
5.889%, 8/1/37 | | | 4,747,809 | | | | 5,112,150 | |
Fannie Mae, Multifamily DUS | | | | | | | | |
Pool AL6028, 2.84%, 7/1/21 | | | 6,657,361 | | | | 6,867,741 | |
Pool 735745, 5.003%, 1/1/17 | | | 42,115 | | | | 42,077 | |
Pool 745629, 5.205%, 1/1/18 | | | 221,239 | | | | 230,948 | |
Pool 462084, 5.275%, 11/1/15 | | | 104,308 | | | | 105,462 | |
Pool 888559, 5.452%, 6/1/17 | | | 21,077,465 | | | | 22,571,580 | |
Pool 888015, 5.526%, 11/1/16 | | | 34,936,011 | | | | 36,959,179 | |
Pool 745936, 6.08%, 8/1/16 | | | 769,290 | | | | 813,700 | |
Freddie Mac, Hybrid ARM | | | | | | | | |
1.79%, 1/1/36 | | | 4,027,942 | | | | 4,250,090 | |
1.996%, 8/1/36 | | | 4,437,648 | | | | 4,680,814 | |
2.066%, 2/1/38 | | | 13,621,834 | | | | 14,418,758 | |
2.095%, 4/1/37 | | | 1,984,226 | | | | 2,103,823 | |
2.125%, 10/1/35-7/1/37 | | | 23,296,008 | | | | 24,799,613 | |
2.159%, 1/1/36 | | | 4,861,145 | | | | 5,171,300 | |
2.195%, 3/1/37 | | | 6,104,890 | | | | 6,474,612 | |
2.219%, 4/1/37 | | | 3,373,906 | | | | 3,534,636 | |
2.242%, 8/1/35 | | | 2,775,478 | | | | 2,966,206 | |
2.25%, 1/1/35-6/1/38 | | | 11,140,598 | | | | 11,904,738 | |
2.279%, 9/1/33 | | | 10,314,292 | | | | 11,011,355 | |
| | |
| PAGE 9 § DODGE & COX INCOME FUND | | See accompanying Notes to Financial Statements |
| | | | |
| PORTFOLIO OF INVESTMENTS | | | December 31, 2014 | |
| | | | | | | | |
| DEBT SECURITIES (continued) | | | | | | |
| | |
| | | PAR VALUE | | | VALUE | |
2.294%, 4/1/38 | | $ | 11,338,988 | | | $ | 12,154,501 | |
2.298%, 8/1/34 | | | 1,644,055 | | | | 1,760,922 | |
2.327%, 9/1/35 | | | 4,330,730 | | | | 4,642,441 | |
2.343%, 1/1/37 | | | 4,377,426 | | | | 4,685,566 | |
2.368%, 10/1/38 | | | 4,180,148 | | | | 4,467,977 | |
2.37%, 8/1/35-1/1/36 | | | 16,570,501 | | | | 17,781,633 | |
2.375%, 2/1/34-2/1/35 | | | 11,888,876 | | | | 12,664,119 | |
2.38%, 3/1/35 | | | 2,150,110 | | | | 2,291,429 | |
2.436%, 4/1/38 | | | 13,621,385 | | | | 14,635,088 | |
2.441%, 4/1/36 | | | 6,698,028 | | | | 7,208,124 | |
2.47%, 7/1/43 | | | 14,699,734 | | | | 15,229,292 | |
2.657%, 10/1/38 | | | 1,687,546 | | | | 1,795,731 | |
2.763%, 10/1/43 | | | 5,501,932 | | | | 5,650,353 | |
2.793%, 9/1/44 | | | 23,281,611 | | | | 23,988,858 | |
2.842%, 9/1/44-11/1/44 | | | 39,408,644 | | | | 40,622,511 | |
2.843%, 11/1/44 | | | 29,943,359 | | | | 30,869,379 | |
2.845%, 1/1/45 | | | 23,256,104 | | | | 23,983,799 | |
2.85%, 10/1/44 | | | 43,172,570 | | | | 44,505,237 | |
2.857%, 10/1/44 | | | 30,296,293 | | | | 31,242,790 | |
2.885%, 6/1/44 | | | 15,628,089 | | | | 16,165,207 | |
2.907%, 8/1/44 | | | 20,101,242 | | | | 20,768,935 | |
2.933%, 12/1/44 | | | 47,116,214 | | | | 48,671,877 | |
2.936%, 12/1/44 | | | 39,786,297 | | | | 41,163,356 | |
2.943%, 11/1/44 | | | 20,950,388 | | | | 21,656,119 | |
2.959%, 1/1/44 | | | 13,678,716 | | | | 14,166,669 | |
2.971%, 11/1/44 | | | 19,279,485 | | | | 19,952,128 | |
2.982%, 11/1/44-12/1/44 | | | 62,321,537 | | | | 64,559,245 | |
2.986%, 9/1/44 | | | 18,307,914 | | | | 18,956,953 | |
3.002%, 11/1/44 | | | 31,858,158 | | | | 32,990,419 | |
3.022%, 10/1/44 | | | 29,362,743 | | | | 30,436,762 | |
3.035%, 10/1/44 | | | 32,433,671 | | | | 33,636,504 | |
3.041%, 5/1/44 | | | 256,489,056 | | | | 266,075,332 | |
3.046%, 7/1/44 | | | 15,677,643 | | | | 16,252,476 | |
3.05%, 8/1/44 | | | 25,343,578 | | | | 26,293,600 | |
3.091%, 4/1/44 | | | 20,513,372 | | | | 21,259,438 | |
3.103%, 6/1/44 | | | 52,155,740 | | | | 54,177,281 | |
3.104%, 7/1/44 | | | 19,286,374 | | | | 20,035,336 | |
3.114%, 8/1/44 | | | 26,648,048 | | | | 27,622,588 | |
3.152%, 4/1/44 | | | 8,757,917 | | | | 9,112,326 | |
3.196%, 1/1/44 | | | 13,810,362 | | | | 14,425,414 | |
3.597%, 6/1/41 | | | 14,865,997 | | | | 15,629,957 | |
3.716%, 9/1/41 | | | 20,239,711 | | | | 21,518,381 | |
5.011%, 6/1/38 | | | 2,507,110 | | | | 2,661,777 | |
5.442%, 11/1/39 | | | 6,337,328 | | | | 6,743,421 | |
5.794%, 1/1/38 | | | 2,196,570 | | | | 2,338,383 | |
6.127%, 10/1/37 | | | 1,795,957 | | | | 1,910,184 | |
6.172%, 12/1/36 | | | 2,449,995 | | | | 2,621,799 | |
Freddie Mac Gold, 10 Year
6.00%, 9/1/16 | | | 327,478 | | | | 336,912 | |
Freddie Mac Gold, 15 Year | | | | | | | | |
4.00%, 6/1/26-6/1/27 | | | 496,907,208 | | | | 530,956,674 | |
4.50%, 3/1/25-6/1/26 | | | 33,604,752 | | | | 36,293,094 | |
5.50%, 10/1/20-12/1/24 | | | 18,087,897 | | | | 19,616,311 | |
6.00%, 8/1/16-11/1/23 | | | 36,623,474 | | | | 39,851,619 | |
6.50%, 5/1/16-9/1/18 | | | 3,892,909 | | | | 4,044,245 | |
| | | | | | | | |
| | |
| | | PAR VALUE | | | VALUE | |
Freddie Mac Gold, 20 Year | | | | | | | | |
4.00%, 9/1/31-11/1/34 | | $ | 367,167,578 | | | $ | 394,708,215 | |
4.50%, 5/1/30-1/1/34 | | | 230,673,649 | | | | 251,407,874 | |
6.00%, 7/1/25-12/1/27 | | | 44,580,794 | | | | 50,458,073 | |
6.50%, 7/1/21-10/1/26 | | | 5,428,073 | | | | 6,166,480 | |
Freddie Mac Gold, 30 Year | | | | | | | | |
4.50%, 3/1/39-7/1/44 | | | 447,629,274 | | | | 487,684,818 | |
5.50%, 3/1/34-12/1/38 | | | 127,022,321 | | | | 143,013,374 | |
6.00%, 2/1/33-2/1/39 | | | 53,740,475 | | | | 61,187,563 | |
6.50%, 12/1/32-10/1/38 | | | 30,782,304 | | | | 34,857,326 | |
7.00%, 4/1/31-11/1/38 | | | 8,299,067 | | | | 9,385,500 | |
7.90%, 2/17/21 | | | 515,931 | | | | 567,416 | |
Ginnie Mae, 30 Year | | | | | | | | |
7.00%, 5/15/28 | | | 529,214 | | | | 613,221 | |
7.50%, 9/15/17-5/15/25 | | | 1,924,201 | | | | 2,234,452 | |
7.80%, 6/15/20-1/15/21 | | | 438,073 | | | | 474,359 | |
7.85%, 1/15/21-10/15/21 | | | 8,401 | | | | 8,494 | |
8.00%, 9/15/20 | | | 8,866 | | | | 9,881 | |
| | | | | | | | |
| | | | | | | 11,245,590,927 | |
PRIVATE LABEL CMO & REMIC: 0.0%(f) | | | | | |
GSMPS Mortgage Loan Trust
Series 2004-4 1A4,
8.50%, 6/25/34(b) | | | 5,662,253 | | | | 6,114,628 | |
| | | | | | | | |
| | | | | | | 13,214,032,955 | |
| ASSET-BACKED: 6.5% | | | | | | | | |
AUTO LOAN: 0.3% | | | | | | | | |
Ford Credit Auto Owner Trust
Series 2014-C A3, 1.06%, 5/15/19 | | | 9,025,000 | | | | 9,001,580 | |
Toyota Auto Recievables Owner Trust | | | | | | | | |
Series 2014-C A3, 0.93%, 7/16/18 | | | 100,000,000 | | | | 99,966,900 | |
Series 2014-C A4, 1.44%, 4/15/20 | | | 20,975,000 | | | | 20,978,587 | |
| | | | | | | | |
| | | | | | | 129,947,067 | |
CREDIT CARD: 3.6% | | | | | | | | |
American Express Master Trust | | | | | | | | |
Series 2014-2 A, 1.26%, 1/15/20 | | | 10,900,000 | | | | 10,876,456 | |
Series 2014-3 A, 1.49%, 4/15/20 | | | 375,450,000 | | | | 376,549,693 | |
Series 2014-4 A, 1.43%, 6/15/20 | | | 179,201,000 | | | | 178,873,241 | |
Chase Issuance Trust | | | | | | | | |
Series 2012-A3 A3, 0.79%, 6/15/17 | | | 24,011,000 | | | | 24,042,646 | |
Series 2012-A5 A5, 0.59%, 8/15/17 | | | 66,332,000 | | | | 66,352,099 | |
Series 2012-A8 A8, 0.54%, 10/16/17 | | | 358,637,000 | | | | 358,454,454 | |
Series 2006-A2 A2, 5.16%, 4/16/18 | | | 17,465,000 | | | | 18,320,593 | |
Series 2013-A8 A8, 1.01%, 10/15/18 | | | 11,740,000 | | | | 11,738,321 | |
Series 2014-A1 A1, 1.15%, 1/15/19 | | | 85,181,000 | | | | 85,165,241 | |
Series 2014-A6 A6, 1.26%, 7/15/19 | | | 24,285,000 | | | | 24,209,814 | |
Series 2014-A7 A, 1.38%, 11/15/19 | | | 242,130,000 | | | | 241,197,073 | |
| | | | | | | | |
| | | | | | | 1,395,779,631 | |
OTHER: 2.0% | | | | | | | | |
Rio Oil Finance Trust(c) (Brazil) | | | | | | | | |
6.25%, 7/6/24(b) | | | 469,500,000 | | | | 444,931,065 | |
6.75%, 1/6/27(b) | | | 368,775,000 | | | | 352,180,125 | |
| | | | | | | | |
| | | | | | | 797,111,190 | |
| | |
| See accompanying Notes to Financial Statements | | DODGE & COX INCOME FUND §PAGE 10 |
| | | | |
| PORTFOLIO OF INVESTMENTS | | | December 31, 2014 | |
| | | | | | | | |
| DEBT SECURITIES (continued) | | | | | | |
| | |
| | | PAR VALUE | | | VALUE | |
STUDENT LOAN: 0.6% | | | | | | | | |
Navient Student Loan Trust (Private Loans)
Series 2014-AA A2A,
2.74%, 2/15/29(b) | | $ | 35,880,000 | | | $ | 35,946,486 | |
SLM Student Loan Trust Securities | | | | | | | | |
Series 2007-3 A2, 0.244%, 10/25/17 | | | 1,450,937 | | | | 1,448,920 | |
SLM Student Loan Trust Securities (Private Loans) | | | | | | | | |
Series 2013-A A2A, 1.77%, 5/17/27(b) | | | 9,116,000 | | | | 9,013,536 | |
Series 2012-B A2, 3.48%, 10/15/30(b) | | | 57,240,000 | | | | 59,481,976 | |
Series 2013-C A2A, 2.94%, 10/15/31(b) | | | 22,000,000 | | | | 22,469,260 | |
Series 2012-E A2A, 2.09%, 6/15/45(b) | | | 10,100,000 | | | | 10,090,264 | |
Series 2012-C A2, 3.31%, 10/15/46(b) | | | 88,513,000 | | | | 91,771,872 | |
| | | | | | | | |
| | | | | | | 230,222,314 | |
| | | | | | | | |
| | | | | | | 2,553,060,202 | |
| CORPORATE: 38.7% | | | | | | | | |
FINANCIALS: 14.7% | | | | | | | | |
Anthem, Inc. | | | | | | | | |
5.875%, 6/15/17 | | | 16,016,000 | | | | 17,610,297 | |
7.00%, 2/15/19 | | | 83,470,000 | | | | 98,355,289 | |
2.25%, 8/15/19 | | | 7,400,000 | | | | 7,325,815 | |
4.35%, 8/15/20 | | | 5,000,000 | | | | 5,416,975 | |
3.70%, 8/15/21 | | | 48,839,000 | | | | 51,053,067 | |
Bank of America Corp. | | | | | | | | |
7.625%, 6/1/19 | | | 198,582,000 | | | | 240,008,588 | |
5.625%, 7/1/20 | | | 62,515,000 | | | | 71,178,954 | |
4.20%, 8/26/24 | | | 115,930,000 | | | | 118,100,789 | |
4.25%, 10/22/26 | | | 60,574,000 | | | | 60,438,011 | |
6.625%, 5/23/36(a) | | | 240,328,000 | | | | 291,208,509 | |
Barclays PLC(c) (United Kingdom)
4.375%, 9/11/24 | | | 241,729,000 | | | | 233,464,808 | |
BNP Paribas SA(c) (France)
4.25%, 10/15/24 | | | 260,480,000 | | | | 263,696,928 | |
Boston Properties, Inc. | | | | | | | | |
3.70%, 11/15/18 | | | 46,967,000 | | | | 49,523,461 | |
5.875%, 10/15/19 | | | 48,079,000 | | | | 55,070,889 | |
5.625%, 11/15/20 | | | 79,385,000 | | | | 90,574,395 | |
4.125%, 5/15/21 | | | 24,365,000 | | | | 25,934,666 | |
3.85%, 2/1/23 | | | 30,840,000 | | | | 32,014,295 | |
3.125%, 9/1/23 | | | 27,375,000 | | | | 26,729,908 | |
3.80%, 2/1/24 | | | 55,900,000 | | | | 57,446,697 | |
Capital One Financial Corp. | | | | | | | | |
4.75%, 7/15/21 | | | 177,095,000 | | | | 195,183,129 | |
3.50%, 6/15/23 | | | 184,986,000 | | | | 186,956,656 | |
3.75%, 4/24/24 | | | 26,425,000 | | | | 26,995,754 | |
Cigna Corp. | | | | | | | | |
8.50%, 5/1/19 | | | 74,756,000 | | | | 92,410,003 | |
4.00%, 2/15/22 | | | 48,241,000 | | | | 50,832,458 | |
| | | | | | | | |
| | |
| | | PAR VALUE | | | VALUE | |
7.65%, 3/1/23 | | $ | 6,317,000 | | | $ | 8,073,019 | |
7.875%, 5/15/27 | | | 29,355,000 | | | | 40,108,118 | |
8.30%, 1/15/33 | | | 8,195,000 | | | | 11,201,547 | |
6.15%, 11/15/36 | | | 87,922,000 | | | | 109,585,453 | |
5.875%, 3/15/41 | | | 13,073,000 | | | | 16,275,885 | |
5.375%, 2/15/42 | | | 12,674,000 | | | | 14,987,829 | |
Citigroup, Inc. | | | | | | | | |
1.932%, 5/15/18 | | | 140,345,000 | | | | 144,979,473 | |
3.50%, 5/15/23 | | | 76,001,000 | | | | 73,986,213 | |
7.875%, 10/30/40(a) | | | 318,604,250 | | | | 338,740,039 | |
Equity Residential | | | | | | | | |
4.75%, 7/15/20 | | | 3,600,000 | | | | 3,955,061 | |
4.625%, 12/15/21 | | | 85,972,000 | | | | 94,054,228 | |
3.00%, 4/15/23 | | | 47,300,000 | | | | 46,131,312 | |
General Electric Co. | | | | | | | | |
5.50%, 1/8/20 | | | 193,920,000 | | | | 221,956,178 | |
4.375%, 9/16/20 | | | 99,591,000 | | | | 109,075,648 | |
4.625%, 1/7/21 | | | 75,536,000 | | | | 84,191,670 | |
4.65%, 10/17/21 | | | 79,525,000 | | | | 89,634,934 | |
Health Net, Inc.
6.375%, 6/1/17 | | | 120,854,000 | | | | 130,522,320 | |
HSBC Holdings PLC(c) (United Kingdom) | | | | | | | | |
5.10%, 4/5/21 | | | 76,954,000 | | | | 86,988,648 | |
9.30%, 6/1/21 | | | 100,000 | | | | 133,864 | |
6.50%, 5/2/36 | | | 164,630,000 | | | | 211,439,906 | |
6.50%, 9/15/37 | | | 148,470,000 | | | | 190,767,024 | |
6.80%, 6/1/38 | | | 20,000,000 | | | | 26,523,480 | |
JPMorgan Chase & Co. | | | | | | | | |
4.95%, 3/25/20 | | | 28,030,000 | | | | 30,964,881 | |
3.375%, 5/1/23 | | | 86,724,000 | | | | 85,797,267 | |
4.125%, 12/15/26 | | | 39,925,000 | | | | 39,816,085 | |
8.75%, 9/1/30(a) | | | 48,438,000 | | | | 69,962,539 | |
Lloyds Banking Group PLC(c) (United Kingdom) | | | | | | | | |
4.50%, 11/4/24 | | | 133,170,000 | | | | 134,387,041 | |
Navient Corp. | | | | | | | | |
3.875%, 9/10/15 | | | 56,710,000 | | | | 57,135,325 | |
6.00%, 1/25/17 | | | 143,715,000 | | | | 150,541,462 | |
4.625%, 9/25/17 | | | 97,902,000 | | | | 99,370,530 | |
8.45%, 6/15/18 | | | 90,658,000 | | | | 101,083,670 | |
Royal Bank of Scotland Group PLC(c)
(United Kingdom) | | | | | | | | |
6.125%, 12/15/22 | | | 270,234,000 | | | | 294,124,307 | |
6.00%, 12/19/23 | | | 214,767,000 | | | | 232,463,371 | |
Unum Group | | | | | | | | |
6.85%, 11/15/15(b) | | | 10,588,000 | | | | 11,090,369 | |
7.19%, 2/1/28 | | | 11,295,000 | | | | 13,741,971 | |
7.25%, 3/15/28 | | | 25,060,000 | | | | 31,793,096 | |
6.75%, 12/15/28 | | | 8,107,000 | | | | 9,986,413 | |
| | | | | | | | |
| | | | | | | 5,763,100,517 | |
| | |
| PAGE 11 § DODGE & COX INCOME FUND | | See accompanying Notes to Financial Statements |
| | | | |
| PORTFOLIO OF INVESTMENTS | | | December 31, 2014 | |
| | | | | | | | |
| DEBT SECURITIES (continued) | | | | | | |
| | |
| | | PAR VALUE | | | VALUE | |
INDUSTRIALS: 22.8% | | | | | | | | |
AT&T, Inc. | | | | | | | | |
8.00%, 11/15/31 | | $ | 151,477,000 | | | $ | 223,204,238 | |
6.55%, 2/15/39 | | | 34,000,000 | | | | 41,907,584 | |
5.35%, 9/1/40 | | | 19,895,000 | | | | 21,542,724 | |
Becton, Dickinson and Co.
3.734%, 12/15/24 | | | 46,675,000 | | | | 48,035,903 | |
Boston Scientific Corp. | | | | | | | | |
6.25%, 11/15/15 | | | 14,550,000 | | | | 15,158,685 | |
6.40%, 6/15/16 | | | 109,769,000 | | | | 117,477,089 | |
6.00%, 1/15/20 | | | 15,690,000 | | | | 17,682,301 | |
Burlington Northern Santa Fe LLC(e) | | | | | | | | |
4.70%, 10/1/19 | | | 75,445,000 | | | | 83,398,940 | |
7.57%, 1/2/21 | | | 12,978,007 | | | | 14,625,426 | |
8.251%, 1/15/21 | | | 4,939,122 | | | | 5,747,597 | |
4.10%, 6/1/21 | | | 5,820,000 | | | | 6,312,483 | |
3.05%, 9/1/22 | | | 39,535,000 | | | | 39,786,087 | |
5.943%, 1/15/23 | | | 68,198 | | | | 73,869 | |
3.85%, 9/1/23 | | | 89,340,000 | | | | 94,237,083 | |
5.72%, 1/15/24 | | | 16,978,852 | | | | 19,380,626 | |
3.75%, 4/1/24 | | | 20,000,000 | | | | 20,799,280 | |
5.342%, 4/1/24 | | | 5,722,378 | | | | 6,302,341 | |
5.629%, 4/1/24 | | | 23,513,159 | | | | 26,531,339 | |
5.996%, 4/1/24 | | | 45,180,397 | | | | 51,494,809 | |
Cemex SAB de CV(c) (Mexico) | | | | | | | | |
6.50%, 12/10/19(b) | | | 138,875,000 | | | | 142,277,437 | |
7.25%, 1/15/21(b) | | | 75,000,000 | | | | 78,562,500 | |
6.00%, 4/1/24(b) | | | 79,475,000 | | | | 77,488,125 | |
5.70%, 1/11/25(b) | | | 56,200,000 | | | | 54,514,000 | |
Comcast Corp. | | | | | | | | |
5.85%, 11/15/15 | | | 14,745,000 | | | | 15,422,680 | |
6.50%, 1/15/17 | | | 36,215,000 | | | | 39,990,957 | |
6.30%, 11/15/17 | | | 16,175,000 | | | | 18,320,403 | |
5.875%, 2/15/18 | | | 68,310,000 | | | | 76,857,152 | |
5.70%, 5/15/18 | | | 2,645,000 | | | | 2,978,415 | |
Cox Enterprises, Inc. | | | | | | | | |
5.50%, 10/1/15 | | | 265,000 | | | | 274,001 | |
5.875%, 12/1/16(b) | | | 76,215,000 | | | | 82,406,097 | |
9.375%, 1/15/19(b) | | | 145,119,000 | | | | 182,635,454 | |
3.25%, 12/15/22(b) | | | 141,381,000 | | | | 138,813,380 | |
2.95%, 6/30/23(b) | | | 231,748,000 | | | | 222,232,891 | |
3.85%, 2/1/25(b) | | | 89,190,000 | | | | 90,029,902 | |
CSX Corp. | | | | | | | | |
9.75%, 6/15/20 | | | 10,067,000 | | | | 13,326,111 | |
6.251%, 1/15/23 | | | 16,255,473 | | | | 19,124,662 | |
3.40%, 8/1/24 | | | 38,025,000 | | | | 38,514,838 | |
Dillard’s, Inc. | | | | | | | | |
7.13%, 8/1/18 | | | 23,565,000 | | | | 26,392,800 | |
7.875%, 1/1/23 | | | 275,000 | | | | 317,625 | |
7.75%, 7/15/26 | | | 21,016,000 | | | | 23,380,300 | |
7.75%, 5/15/27 | | | 12,848,000 | | | | 14,357,640 | |
7.00%, 12/1/28 | | | 28,225,000 | | | | 29,918,500 | |
| | | | | | | | |
| | |
| | | PAR VALUE | | | VALUE | |
Dow Chemical Co. | | | | | | | | |
8.55%, 5/15/19 | | $ | 156,085,000 | | | $ | 194,052,052 | |
4.25%, 11/15/20 | | | 12,475,000 | | | | 13,337,409 | |
3.00%, 11/15/22 | | | 24,240,000 | | | | 23,683,983 | |
7.375%, 11/1/29 | | | 55,999,000 | | | | 74,546,877 | |
9.40%, 5/15/39 | | | 135,313,000 | | | | 219,549,808 | |
5.25%, 11/15/41 | | | 12,378,000 | | | | 13,349,871 | |
Eaton Corp. PLC(c) (Ireland) | | | | | | | | |
1.50%, 11/2/17 | | | 22,630,000 | | | | 22,500,579 | |
2.75%, 11/2/22 | | | 61,835,000 | | | | 60,746,518 | |
FedEx Corp. | | | | | | | | |
8.00%, 1/15/19 | | | 18,050,000 | | | | 21,973,492 | |
6.72%, 7/15/23 | | | 16,724,303 | | | | 19,567,434 | |
7.65%, 7/15/24 | | | 2,103,350 | | | | 2,524,020 | |
Ford Motor Credit Co. LLC(e) | | | | | | | | |
5.625%, 9/15/15 | | | 49,025,000 | | | | 50,591,594 | |
8.125%, 1/15/20 | | | 16,910,000 | | | | 20,945,724 | |
5.75%, 2/1/21 | | | 165,710,000 | | | | 189,892,392 | |
5.875%, 8/2/21 | | | 153,240,000 | | | | 177,419,433 | |
4.25%, 9/20/22 | | | 44,075,000 | | | | 46,766,440 | |
4.375%, 8/6/23 | | | 27,875,000 | | | | 29,799,629 | |
HCA Holdings, Inc. | | | | | | | | |
6.375%, 1/15/15 | | | 80,218,000 | | | | 80,218,000 | |
6.50%, 2/15/16 | | | 235,325,000 | | | | 245,620,469 | |
Hewlett-Packard Co.
3.30%, 12/9/16 | | | 90,750,000 | | | | 93,747,472 | |
Kinder Morgan, Inc. | | | | | | | | |
5.625%, 11/15/23(b) | | | 12,500,000 | | | | 13,380,325 | |
4.15%, 2/1/24 | | | 6,482,000 | | | | 6,465,419 | |
4.30%, 6/1/25 | | | 64,530,000 | | | | 64,746,498 | |
Lafarge SA(c) (France) | | | | | | | | |
6.20%, 7/9/15(b) | | | 153,560,000 | | | | 157,076,524 | |
6.50%, 7/15/16 | | | 126,496,000 | | | | 134,718,240 | |
Liberty Interactive Corp. | | | | | | | | |
8.50%, 7/15/29 | | | 11,937,000 | | | | 13,071,015 | |
8.25%, 2/1/30 | | | 28,876,000 | | | | 31,186,080 | |
Macy’s, Inc. | | | | | | | | |
5.90%, 12/1/16 | | | 16,796,000 | | | | 18,229,303 | |
6.65%, 7/15/24 | | | 39,631,000 | | | | 49,146,007 | |
7.00%, 2/15/28 | | | 25,985,000 | | | | 32,381,650 | |
6.70%, 9/15/28 | | | 26,965,000 | | | | 33,027,838 | |
6.90%, 4/1/29 | | | 51,067,000 | | | | 65,002,418 | |
6.90%, 1/15/32 | | | 54,820,000 | | | | 71,325,918 | |
6.70%, 7/15/34 | | | 103,914,000 | | | | 132,843,762 | |
4.50%, 12/15/34 | | | 85,225,000 | | | | 85,817,143 | |
6.375%, 3/15/37 | | | 51,257,000 | | | | 64,860,454 | |
Naspers, Ltd.(c) (South Africa)
6.00%, 7/18/20(b) | | | 157,263,000 | | | | 171,809,827 | |
Nordstrom, Inc.
6.95%, 3/15/28 | | | 12,700,000 | | | | 16,735,539 | |
Norfolk Southern Corp. | | | | | | | | |
7.70%, 5/15/17 | | | 28,585,000 | | | | 32,662,593 | |
9.75%, 6/15/20 | | | 13,813,000 | | | | 18,417,785 | |
| | |
| See accompanying Notes to Financial Statements | | DODGE & COX INCOME FUND §PAGE 12 |
| | | | |
| PORTFOLIO OF INVESTMENTS | | | December 31, 2014 | |
| | | | | | | | |
| DEBT SECURITIES (continued) | | | | | | |
| | |
| | | PAR VALUE | | | VALUE | |
Reed Elsevier PLC(c)
(United Kingdom) | | | | | | | | |
8.625%, 1/15/19 | | $ | 28,613,000 | | | $ | 34,997,447 | |
3.125%, 10/15/22 | | | 138,937,000 | | | | 137,523,177 | |
Sprint Corp.
6.00%, 12/1/16 | | | 219,935,000 | | | | 230,057,508 | |
Telecom Italia SPA(c) (Italy) | | | | | | | | |
6.999%, 6/4/18 | | | 121,067,000 | | | | 134,384,370 | |
7.175%, 6/18/19 | | | 153,261,000 | | | | 175,483,845 | |
5.303%, 5/30/24(b) | | | 41,860,000 | | | | 42,383,250 | |
7.20%, 7/18/36 | | | 52,188,000 | | | | 56,102,100 | |
7.721%, 6/4/38 | | | 107,080,000 | | | | 119,394,200 | |
Time Warner Cable, Inc. | | | | | | | | |
8.75%, 2/14/19 | | | 130,460,000 | | | | 161,490,302 | |
8.25%, 4/1/19 | | | 237,543,000 | | | | 290,786,601 | |
5.00%, 2/1/20 | | | 20,700,000 | | | | 22,811,090 | |
4.125%, 2/15/21 | | | 16,500,000 | | | | 17,658,135 | |
4.00%, 9/1/21 | | | 35,609,000 | | | | 37,898,374 | |
Time Warner, Inc. | | | | | | | | |
7.625%, 4/15/31 | | | 230,695,000 | | | | 321,619,974 | |
7.70%, 5/1/32 | | | 197,949,000 | | | | 281,190,711 | |
Twenty-First Century Fox, Inc. | | | | | | | | |
6.20%, 12/15/34 | | | 7,440,000 | | | | 9,500,091 | |
6.40%, 12/15/35 | | | 29,170,000 | | | | 38,071,517 | |
6.15%, 3/1/37 | | | 30,280,000 | | | | 37,950,106 | |
6.65%, 11/15/37 | | | 58,380,000 | | | | 77,952,479 | |
6.15%, 2/15/41 | | | 36,083,000 | | | | 45,921,030 | |
Union Pacific Corp. | | | | | | | | |
4.875%, 1/15/15 | | | 10,449,000 | | | | 10,461,340 | |
6.85%, 1/2/19 | | | 2,816,599 | | | | 3,105,941 | |
6.70%, 2/23/19 | | | 3,537,727 | | | | 3,850,485 | |
7.60%, 1/2/20 | | | 1,332,079 | | | | 1,561,186 | |
4.163%, 7/15/22 | | | 40,342,000 | | | | 44,318,713 | |
6.061%, 1/17/23 | | | 8,154,908 | | | | 9,026,088 | |
4.698%, 1/2/24 | | | 3,972,421 | | | | 4,335,660 | |
3.646%, 2/15/24 | | | 54,661,000 | | | | 57,853,585 | |
3.75%, 3/15/24 | | | 9,550,000 | | | | 10,213,381 | |
5.082%, 1/2/29 | | | 8,623,982 | | | | 9,564,834 | |
5.866%, 7/2/30 | | | 45,392,209 | | | | 53,072,058 | |
6.176%, 1/2/31 | | | 33,625,027 | | | | 40,271,012 | |
Verizon Communications, Inc. | | | | | | | | |
5.15%, 9/15/23 | | | 141,725,000 | | | | 156,497,422 | |
4.15%, 3/15/24 | | | 66,000,000 | | | | 68,325,444 | |
3.50%, 11/1/24 | | | 169,000,000 | | | | 166,042,331 | |
6.55%, 9/15/43 | | | 262,930,000 | | | | 336,852,507 | |
Vulcan Materials Co. | | | | | | | | |
6.50%, 12/1/16 | | | 4,531,000 | | | | 4,825,515 | |
7.00%, 6/15/18 | | | 5,000,000 | | | | 5,500,000 | |
7.50%, 6/15/21 | | | 132,080,000 | | | | 153,873,200 | |
Xerox Corp. | | | | | | | | |
6.40%, 3/15/16 | | | 72,137,000 | | | | 76,541,469 | |
7.20%, 4/1/16 | | | 25,586,000 | | | | 27,402,120 | |
6.75%, 2/1/17 | | | 62,799,000 | | | | 69,222,459 | |
2.95%, 3/15/17 | | | 1,125,000 | | | | 1,156,014 | |
| | | | | | | | |
| | |
| | | PAR VALUE | | | VALUE | |
6.35%, 5/15/18 | | $ | 106,052,000 | | | $ | 119,915,117 | |
5.625%, 12/15/19 | | | 66,647,000 | | | | 74,902,697 | |
4.50%, 5/15/21 | | | 61,877,000 | | | | 66,124,794 | |
| | | | | | | | |
| | | | | | | 8,903,563,487 | |
UTILITIES: 1.2% | | | | | | | | |
Dominion Resources, Inc.
5.75%, 10/1/54 | | | 171,190,000 | | | | 178,622,214 | |
Enel SPA(c) (Italy) | | | | | | | | |
6.80%, 9/15/37(b) | | | 109,279,000 | | | | 139,718,665 | |
6.00%, 10/7/39(b) | | | 105,582,000 | | | | 124,055,577 | |
8.75%, 9/24/73(b) | | | 33,050,000 | | | | 38,379,313 | |
| | | | | | | | |
| | | | | | | 480,775,769 | |
| | | | | | | | |
| | | | | | | 15,147,439,773 | |
| | | | | | | | |
TOTAL DEBT SECURITIES
(Cost $36,388,710,701) | | | | | | $ | 38,012,302,249 | |
|
| SHORT-TERM INVESTMENTS: 2.4% | |
| | |
| | | PAR VALUE | | | VALUE | |
MONEY MARKET FUND: 0.1% | | | | | | | | |
SSgA U.S. Treasury Money
Market Fund | | $ | 38,837,498 | | | $ | 38,837,498 | |
| |
REPURCHASE AGREEMENT: 2.3% | | | | | |
Fixed Income Clearing Corporation(d) 0.01%, dated 12/31/14, due 1/2/15, maturity value $893,791,497 | | | 893,791,000 | | | | 893,791,000 | |
| | | | | | | | |
TOTAL SHORT-TERM INVESTMENTS
(Cost $932,628,498) | | | $ | 932,628,498 | |
| | | | | | | | |
TOTAL INVESTMENTS
(Cost $37,321,339,199) | | | 99.5 | % | | $ | 38,944,930,747 | |
OTHER ASSETS LESS LIABILITIES | | | 0.5 | % | | | 183,005,884 | |
| | | | | | | | |
| NET ASSETS | | | 100.0 | % | | $ | 39,127,936,631 | |
| | | | | | | | |
| (a) | Cumulative preferred security |
| (b) | Security exempt from registration under Rule 144A of the Securities Act of 1933. The security may be resold in transactions exempt from registration, normally to qualified institutional buyers. As of December 31, 2014, all such securities in total represented $3,003,144,155 or 7.7% of net assets. These securities have been deemed liquid by Dodge & Cox, investment manager, pursuant to procedures approved by the Fund’s Board of Trustees. |
| (c) | Security denominated in U.S. dollars |
| (d) | Repurchase agreement is collateralized by Fannie Mae 1.75%, 6/20/19, Freddie Mac 1.83%-2.00%, 7/30/19-9/18/19, and U.S. Treasury Note 1.00%-3.125%, 7/31/18-10/31/21. Total collateral value is $911,672,150. |
| (e) | Subsidiary (see below) |
| | |
| PAGE 13 § DODGE & COX INCOME FUND | | See accompanying Notes to Financial Statements |
| | | | |
| PORTFOLIO OF INVESTMENTS | | | December 31, 2014 | |
Debt securities are grouped by parent company unless otherwise noted. Actual securities may be issued by the listed parent company or one of its subsidiaries. In determining a parent company’s country designation, the Fund generally references the country of incorporation.
ARM: Adjustable Rate Mortgage
CMO: Collateralized Mortgage Obligation
DUS: Delegated Underwriting and Servicing
GO: General Obligation
RB: Revenue Bond
REMIC: Real Estate Mortgage Investment Conduit
FUTURES CONTRACTS
| | | | | | | | | | | | | | | | |
| Description | | Number of
Contracts | | | Expiration
Date | | | Notional
Amount | | | Unrealized
Appreciation/
(Depreciation) | |
10 Year U.S. Treasury Note— Short Position | | | 12,144 | | | | Mar 2015 | | | $ | (1,539,821,250 | ) | | $ | (8,978,508 | ) |
Long-Term U.S. Treasury Bond— Short Position | | | 7,216 | | | | Mar 2015 | | | | (1,191,993,000 | ) | | | (53,246,544 | ) |
| | | | | | | | | | | | | | | | |
| | | | | | | | | | | | | | $ | (62,225,052 | ) |
| | | | | | | | | | | | | | | | |
| | | | | | | | | | | | | | | | | |
| | |
| See accompanying Notes to Financial Statements | | DODGE & COX INCOME FUND §PAGE 14 |
| | | | |
STATEMENT OF ASSETS AND LIABILITIES | |
| |
| | | December 31, 2014 | |
ASSETS: | | | | |
Investments, at value (cost $37,321,339,199) | | $ | 38,944,930,747 | |
Cash held at broker | | | 34,056,161 | |
Receivable for investments sold | | | 15,736,609 | |
Receivable for Fund shares sold | | | 193,163,823 | |
Interest receivable | | | 297,662,073 | |
Prepaid expenses and other assets | | | 153,648 | |
| | | | |
| | | 39,485,703,061 | |
| | | | |
LIABILITIES: | | | | |
Payable for investments purchased | | | 263,165,978 | |
Payable for Fund shares redeemed | | | 72,028,948 | |
Payable to broker for variation margin | | | 5,137,000 | |
Management fees payable | | | 13,013,849 | |
Accrued expenses | | | 4,420,655 | |
| | | | |
| | | 357,766,430 | |
| | | | |
NET ASSETS | | $ | 39,127,936,631 | |
| | | | |
NET ASSETS CONSIST OF: | | | | |
Paid in capital | | $ | 37,532,287,745 | |
Undistributed net investment income | | | 12,221,948 | |
Undistributed net realized gain | | | 22,025,595 | |
Net unrealized appreciation | | | 1,561,401,343 | |
| | | | |
| | $ | 39,127,936,631 | |
| | | | |
Fund shares outstanding (par value $0.01 each, unlimited shares authorized) | | | 2,839,933,564 | |
Net asset value per share | | $ | 13.78 | |
|
STATEMENT OF OPERATIONS | |
| |
| | | Year Ended
December 31, 2014 | |
INVESTMENT INCOME: | | | | |
Dividends | | $ | 18,901,157 | |
Interest (net of foreign taxes of $91,506) | | | 952,224,462 | |
| | | | |
| | | 971,125,619 | |
| | | | |
EXPENSES: | | | | |
Management fees | | | 116,721,472 | |
Custody and fund accounting fees | | | 494,991 | |
Transfer agent fees | | | 6,320,309 | |
Professional services | | | 293,630 | |
Shareholder reports | | | 1,330,959 | |
Proxy expenses | | | 1,837,815 | |
Registration fees | | | 1,968,809 | |
Trustees’ fees | | | 258,072 | |
Miscellaneous | | | 282,167 | |
| | | | |
| | | 129,508,224 | |
| | | | |
NET INVESTMENT INCOME | | | 841,617,395 | |
| | | | |
|
REALIZED AND UNREALIZED GAIN (LOSS): | |
Net realized gain (loss) | | | | |
Investments | | | 244,807,521 | |
Treasury futures contracts | | | (59,936,786 | ) |
Net change in unrealized appreciation/depreciation | | | | |
Investments | | | 481,519,767 | |
Treasury futures contracts | | | (72,803,844 | ) |
| | | | |
Net realized and unrealized gain | | | 593,586,658 | |
| | | | |
NET INCREASE IN NET ASSETS
FROM OPERATIONS | | $ | 1,435,204,053 | |
| | | | |
| | | | | | | | |
STATEMENT OF CHANGES IN NET ASSETS | |
| | |
| | | Year Ended
December 31, 2014 | | | Year Ended
December 31, 2013 | |
OPERATIONS: | | | | | | | | |
Net investment income | | $ | 841,617,395 | | | $ | 779,144,223 | |
Net realized gain | | | 184,870,735 | | | | 493,829,809 | |
Net change in unrealized appreciation/depreciation | | | 408,715,923 | | | | (1,121,487,569 | ) |
| | | | | | | | |
| | | 1,435,204,053 | | | | 151,486,463 | |
| | | | | | | | |
| | |
DISTRIBUTIONS TO SHAREHOLDERS FROM: | | | | | | | | |
Net investment income | | | (836,624,131 | ) | | | (778,582,064 | ) |
Net realized gain | | | (232,101,623 | ) | | | — | |
| | | | | | | | |
Total distributions | | | (1,068,725,754 | ) | | | (778,582,064 | ) |
| | | | | | | | |
| |
FUND SHARE
TRANSACTIONS: | | | | | |
Proceeds from sale of shares | | | 18,587,943,566 | | | | 6,918,977,679 | |
Reinvestment of distributions | | | 840,852,670 | | | | 617,308,718 | |
Cost of shares redeemed | | | (5,321,422,005 | ) | | | (8,793,657,789 | ) |
| | | | | | | | |
Net increase/(decrease) from Fund share transactions | | | 14,107,374,231 | | | | (1,257,371,392 | ) |
| | | | | | | | |
Total increase/(decrease) in
net assets | | | 14,473,852,530 | | | | (1,884,466,993 | ) |
| |
NET ASSETS: | | | | | |
Beginning of year | | | 24,654,084,101 | | | | 26,538,551,094 | |
| | | | | | | | |
End of year (including undistributed net investment income of $12,221,948 and $7,228,684, respectively) | | $ | 39,127,936,631 | | | $ | 24,654,084,101 | |
| | | | | | | | |
| | |
SHARE INFORMATION: | | | | | | | | |
Shares sold | | | 1,341,256,318 | | | | 505,482,231 | |
Distributions reinvested | | | 61,052,395 | | | | 45,502,994 | |
Shares redeemed | | | (384,742,642 | ) | | | (643,772,319 | ) |
| | | | | | | | |
Net increase/(decrease) in shares outstanding | | | 1,017,566,071 | | | | (92,787,094 | ) |
| | | | | | | | |
| | |
| PAGE 15 § DODGE & COX INCOME FUND | | See accompanying Notes to Financial Statements |
NOTES TO FINANCIAL STATEMENTS
NOTE 1—ORGANIZATION AND SIGNIFICANT ACCOUNTING POLICIES
Dodge & Cox Income Fund (the “Fund”) is one of the series constituting the Dodge & Cox Funds (the “Trust” or the “Funds”). The Trust is organized as a Delaware statutory trust and is registered under the Investment Company Act of 1940, as amended, as an open-end management investment company. The Fund commenced operations on January 3, 1989, and seeks high and stable current income consistent with long-term preservation of capital. Risk considerations and investment strategies of the Fund are discussed in the Fund’s Prospectus.
The financial statements have been prepared in conformity with accounting principles generally accepted in the United States of America, which require the use of estimates and assumptions by management. Actual results may differ from those estimates. Significant accounting policies are as follows:
Security valuation The Fund’s net assets are valued as of the close of trading on the New York Stock Exchange (NYSE), generally 4:00 p.m. Eastern Time, each day that the NYSE is open for business. Debt securities are valued based on prices received from independent pricing services which utilize both dealer-supplied valuations and pricing models. Pricing models may consider quoted prices for similar securities, interest rates, prepayment speeds, and credit risk. Exchange-traded derivatives are valued at the settlement price determined by the relevant exchange. Other financial instruments for which market quotes are readily available are valued at market value. Security values are not discounted based on the size of the Fund’s position. Securities for which market quotations are not readily available are valued at fair value as determined in good faith by or under the direction of the Board of Trustees. Short-term securities less than 60 days to maturity may be valued at amortized cost if amortized cost approximates current value. All securities held by the Fund are denominated in U.S. dollars.
The Board of Trustees has delegated authority to Dodge & Cox, the Fund’s investment manager, to make fair value determinations in accordance with the Dodge & Cox Funds Valuation Policies (“Valuation Policies”), subject to Board oversight. Dodge & Cox has established a
Pricing Committee that is comprised of representatives from Treasury, Legal, Compliance, and Operations. The Pricing Committee is responsible for implementing the Valuation Policies, including determining the fair value of securities when market quotations or market-based valuations are not readily available or are deemed unreliable. The Pricing Committee considers relevant indications of value that are reasonably available to it in determining the fair value assigned to a particular security, such as the value of similar financial instruments, trading volumes, contractual restrictions on disposition, related corporate actions, and changes in economic conditions.
Valuing securities at fair value involves greater reliance on judgment than valuation of securities based on readily available market quotations. In some instances, lack of information and uncertainty as to the significance of information may lead to a conclusion that a prior valuation is the best indication of a security’s present value. When fair value pricing is employed, the prices of securities used by the Fund to calculate its net asset value may differ from quoted or published prices for the same securities.
Security transactions, investment income, expenses, and distributions Security transactions are recorded on the trade date. Realized gains and losses on securities sold are determined on the basis of identified cost.
Interest income is recorded on the accrual basis. Interest income includes coupon interest, amortization of premium and accretion of discount on debt securities, and gain/loss on paydowns. The ability of the issuers of the debt securities held by the Fund to meet their obligations may be affected by economic developments in a specific industry, state, or region. Debt obligations may be placed on non-accrual status and related interest income may be reduced by ceasing current accruals and writing off interest receivables when the collection of all or a portion of interest has become doubtful. A debt obligation is removed from non-accrual status when the issuer resumes interest payments or when collectibility of interest is reasonably assured. Dividend income is recorded on the ex-dividend date.
Expenses are recorded on the accrual basis. Most expenses of the Trust can be directly attributed to a
DODGE & COX INCOME FUND §PAGE 16
NOTES TO FINANCIAL STATEMENTS
specific series. Expenses which cannot be directly attributed are allocated among the Funds in the Trust based on relative net assets or other expense methodologies determined by the nature of the expense.
Distributions to shareholders are recorded on the ex-dividend date.
Repurchase agreements The Fund enters into repurchase agreements, secured by U.S. government or agency securities, which involve the purchase of securities from a counterparty with a simultaneous commitment to resell the securities at an agreed-upon date and price. It is the Fund’s policy that its custodian take possession of the underlying collateral securities, the fair value of which exceeds the principal amount of the repurchase transaction, including accrued interest, at all times. In the event of default by the counterparty, the Fund has the contractual right to liquidate the securities and to apply the proceeds in satisfaction of the obligation.
Futures Contracts Futures contracts involve an obligation to purchase or sell (depending on whether the Fund has entered a long or short futures contract, respectively) an asset at a future date, at a price set at the time of the contract. Upon entering into a futures contract, the Fund is required to deposit an amount of cash or liquid assets (referred to as initial margin) in a segregated account with the clearing broker. Subsequent payments (referred to as variation margin) to and from the clearing broker are made on a daily basis based on changes in the market value of the contracts. Futures contracts are traded publicly and their market value changes daily. Changes in the market value of open futures contracts are recorded as unrealized appreciation or depreciation in the Statement of Operations. Realized gains and losses on futures contracts are recorded in the Statement of Operations at the closing or expiration of futures contracts. Cash deposited with a broker as initial margin is recorded on the Statement of Assets and Liabilities. A receivable and/or payable to brokers for daily variation margin is also recorded on the Statement of Assets and Liabilities.
Investments in futures contracts may include certain risks, which may be different from, and potentially greater
than, those of the underlying securities. To the extent the Fund uses futures, it is exposed to additional volatility and potential losses resulting from leverage.
The Fund has entered into short Treasury futures contracts to assist with the management of the portfolio’s interest rate exposure. During the year ended December 31, 2014, these Treasury futures contracts had notional values ranging from less than 1% to 7% of net assets.
Indemnification Under the Trust’s organizational documents, its officers and trustees are indemnified against certain liabilities arising out of the performance of their duties to the Trust. In addition, in the normal course of business the Trust enters into contracts that provide general indemnities to other parties. The Trust’s maximum exposure under these arrangements is unknown as this would involve future claims that may be made against the Trust that have not yet occurred.
NOTE 2—VALUATION MEASUREMENTS
Various inputs are used in determining the value of the Fund’s investments. These inputs are summarized in the three broad levels listed below.
| § | | Level 1: Quoted prices in active markets for identical securities |
| § | | Level 2: Other significant observable inputs (including quoted prices for similar securities, market indices, interest rates, credit risk, etc.) |
| § | | Level 3: Significant unobservable inputs (including Fund management’s assumptions in determining the fair value of investments) |
The inputs or methodology used for valuing securities are not necessarily an indication of the risk associated with investing in those securities.
PAGE 17 § DODGE & COX INCOME FUND
NOTES TO FINANCIAL STATEMENTS
The following is a summary of the inputs used to value the Fund’s holdings at December 31, 2014:
| | | | | | | | |
| Classification(a) | | LEVEL 1 (Quoted Prices) | | | LEVEL 2 (Other Significant
Observable Inputs) | |
Securities | | | | | | | | |
Debt Securities | | | | | | | | |
U.S. Treasury | | $ | 4,333,584,235 | | | $ | — | |
Government-Related | | | — | | | | 2,764,185,084 | |
Mortgage-Related | | | — | | | | 13,214,032,955 | |
Asset-Backed | | | — | | | | 2,553,060,202 | |
Corporate | | | — | | | | 15,147,439,773 | |
Short-term Investments | | | | | | | | |
Money Market Fund | | | 38,837,498 | | | | — | |
Repurchase Agreement | | | — | | | | 893,791,000 | |
| | | | | | | | |
Total Securities | | $ | 4,372,421,733 | | | $ | 34,572,509,014 | |
| | | | | | | | |
Other Financial Instruments | | | | | |
Treasury Futures Contracts | | $ | (62,225,052 | )(b) | | $ | — | |
| | | | | | | | | |
| (a) | There were no transfers between Level 1 and Level 2 during the year ended December 31, 2014. There were no Level 3 securities at December 31, 2014 and 2013, and there were no transfers to Level 3 during the year. |
| (b) | Represents net unrealized appreciation/(depreciation). |
NOTE 3—RELATED PARTY TRANSACTIONS
Management fees Under a written agreement approved by a unanimous vote of the Board of Trustees, the Fund pays an annual management fee of 0.50% of the Fund’s average daily net assets up to $100 million and 0.40% of the Fund’s average daily net assets in excess of $100 million to Dodge & Cox, investment manager of the Fund. The agreement further provides that Dodge & Cox shall waive its fee to the extent that such fee plus all other ordinary operating expenses of the Fund exceed 1% of the average daily net assets for the year.
Fund officers and trustees All officers and two of the trustees of the Trust are officers or employees of Dodge & Cox. The Trust pays a fee only to those trustees who are not affiliated with Dodge & Cox.
NOTE 4—INCOME TAX INFORMATION AND DISTRIBUTIONS TO SHAREHOLDERS
A provision for federal income taxes is not required since the Fund intends to continue to qualify as a regulated investment company under Subchapter M of the Internal Revenue Code and distribute all of its taxable income to shareholders. Distributions are determined in accordance with income tax regulations, and such amounts may differ from net investment income and realized gains for financial reporting purposes. Financial reporting records are adjusted for permanent book/tax differences at year end to reflect tax character.
Book/tax differences are primarily due to differing treatments of wash sales, net short-term realized gain (loss), and Treasury futures contracts. At December 31, 2014, the cost of investments for federal income tax purposes was $37,321,384,526.
Distributions during the years noted below were characterized as follows for federal income tax purposes:
| | | | | | | | |
| | | Year Ended December 31, 2014 | | | Year Ended December 31, 2013 | |
Ordinary income | | | $864,273,705 | | | | $778,582,064 | |
| | | ($0.397 per share) | | | | ($0.415 per share) | |
Long-term capital gain | | | $204,452,049 | | | | — | |
| | | ($0.088 per share) | | | | | |
At December 31, 2014, the tax basis components of distributable earnings were as follows:
| | | | |
Unrealized appreciation | | $ | 1,740,852,794 | |
Unrealized depreciation | | | (117,306,573 | ) |
| | | | |
Net unrealized appreciation | | | 1,623,546,221 | |
Undistributed ordinary income | | | 18,821,143 | |
Undistributed long-term capital gain | | | 2,236,309 | |
Deferred loss(a) | | | (48,954,787 | ) |
| (a) | Represents net realized loss incurred between November 1, 2014 and December 31, 2014. As permitted by tax regulations, the Fund has elected to treat this loss as arising in 2015. |
DODGE & COX INCOME FUND §PAGE 18
NOTES TO FINANCIAL STATEMENTS
Fund management has reviewed the tax positions for open periods (three years and four years, respectively, from filing the Fund’s Federal and State tax returns) as applicable to the Fund, and has determined that no provision for income tax is required in the Fund’s financial statements.
NOTE 5—LOAN FACILITIES
Pursuant to an exemptive order issued by the Securities and Exchange Commission (SEC), the Fund may participate in an interfund lending facility (Facility). The Facility allows the Fund to borrow money from or loan money to the Funds. Loans under the Facility are made for temporary or emergency purposes, such as to fund shareholder redemption requests. Interest on borrowings is the average of the current repurchase agreement rate and the bank loan rate. There was no activity in the Facility during the year.
All Funds in the Trust participate in a $500 million committed credit facility (Line of Credit) with State Street Bank and Trust Company, to be utilized for temporary or emergency purposes to fund shareholder redemptions or for other short-term liquidity purposes. The maximum amount available to the Fund is $250 million. Each Fund pays an annual commitment fee on its pro-rata portion of the Line of Credit. The Fund’s commitment fee for the year ended December 31, 2014, amounted to $74,510 and is reflected as a Miscellaneous Expense in the Statement of Operations. Interest on borrowings is charged at the prevailing rate. There were no borrowings on the Line of Credit during the year.
NOTE 6—PURCHASES AND SALES OF INVESTMENTS
For the year ended December 31, 2014, purchases and sales of securities, other than short-term securities and U.S. government securities, aggregated $8,067,414,537 and $2,427,990,658, respectively. For the year ended December 31, 2014, purchases and sales of U.S. government securities aggregated $13,047,754,006 and $5,286,113,365, respectively.
NOTE 7—ACCOUNTING PRONOUNCEMENTS
In June 2014, the Financial Accounting Standards Board issued Accounting Standards Update (ASU) No. 2014-11, Transfers and Servicing (Topic 860), Repurchase-to-Maturity Transactions, Repurchase Financings, and Disclosures. The ASU changes the accounting for certain repurchase agreements and expands disclosure requirements related to repurchase agreements and similar transactions. Management is currently evaluating the impact, if any, of applying this ASU effective January 1, 2015.
NOTE 8—SUBSEQUENT EVENTS
Fund management has determined that no material events or transactions occurred subsequent to December 31, 2014, and through the date of the Fund’s financial statements issuance, which require additional disclosure in the Fund’s financial statements.
PAGE 19 § DODGE & COX INCOME FUND
FINANCIAL HIGHLIGHTS
| | | | | | | | | | | | | | | | | | | | |
SELECTED DATA AND RATIOS (for a share outstanding throughout each year) | | Year Ended December 31, | |
| | | 2014 | | | 2013 | | | 2012 | | | 2011 | | | 2010 | |
| | | | |
Net asset value, beginning of year | | | $13.53 | | | | $13.86 | | | | $13.30 | | | | $13.23 | | | | $12.96 | |
Income from investment operations: | | | | | | | | | | | | | | | | | | | | |
Net investment income | | | 0.39 | | | | 0.42 | | | | 0.48 | | | | 0.55 | | | | 0.57 | |
Net realized and unrealized gain (loss) | | | 0.35 | | | | (0.33 | ) | | | 0.56 | | | | 0.07 | | | | 0.35 | |
| | | | |
Total from investment operations | | | 0.74 | | | | 0.09 | | | | 1.04 | | | | 0.62 | | | | 0.92 | |
| | | | |
Distributions to shareholders from: | | | | | | | | | | | | | | | | | | | | |
Net investment income | | | (0.39 | ) | | | (0.42 | ) | | | (0.48 | ) | | | (0.55 | ) | | | (0.65 | ) |
Net realized gain | | | (0.10 | ) | | | — | | | | — | | | | — | | | | — | |
| | | | |
Total distributions | | | (0.49 | ) | | | (0.42 | ) | | | (0.48 | ) | | | (0.55 | ) | | | (0.65 | ) |
| | | | |
Net asset value, end of year | | | $13.78 | | | | $13.53 | | | | $13.86 | | | | $13.30 | | | | $13.23 | |
| | | | |
Total return | | | 5.48 | % | | | 0.64 | % | | | 7.94 | % | | | 4.76 | % | | | 7.17 | % |
Ratios/supplemental data: | | | | | | | | | | | | | | | | | | | | |
Net assets, end of year (millions) | | | $39,128 | | | | $24,654 | | | | $26,539 | | | | $24,051 | | | | $22,381 | |
Ratio of expenses to average net assets | | | 0.44 | % | | | 0.43 | % | | | 0.43 | % | | | 0.43 | % | | | 0.43 | % |
Ratio of net investment income to average net assets | | | 2.89 | % | | | 3.00 | % | | | 3.52 | % | | | 4.12 | % | | | 4.26 | % |
Portfolio turnover rate | | | 27 | % | | | 38 | % | | | 26 | % | | | 27 | % | | | 28 | % |
See accompanying Notes to Financial Statements
DODGE & COX INCOME FUND §PAGE 20
REPORT OF INDEPENDENT REGISTERED PUBLIC ACCOUNTING FIRM
To the Trustees of Dodge & Cox Funds and Shareholders of Dodge & Cox Income Fund
In our opinion, the accompanying statement of assets and liabilities, including the portfolio of investments, and the related statements of operations and of changes in net assets and the financial highlights present fairly, in all material respects, the financial position of Dodge & Cox Income Fund (the “Fund”, one of the series constituting Dodge & Cox Funds) at December 31, 2014, the results of its operations for the year then ended, the changes in its net assets for each of the two years in the period then ended and the financial highlights for each of the five years in the period then ended, in conformity with accounting principles generally accepted in the United States of America. These financial statements and financial highlights (hereafter referred to as financial statements) are the responsibility of the Fund’s management. Our responsibility is to express an opinion on these financial statements based on our audits. We conducted our audits of these financial statements in accordance with the standards of the Public Company Accounting Oversight Board (United States). Those standards require that we plan and perform the audit to obtain reasonable assurance about whether the financial statements are free of material misstatement. An audit includes examining, on a test basis, evidence supporting the amounts and disclosures in the financial statements, assessing the accounting principles used and significant estimates made by management, and evaluating the overall financial statement presentation. We believe that our audits, which included confirmation of securities at December 31, 2014, by correspondence with the custodian and brokers, provide a reasonable basis for our opinion.
PricewaterhouseCoopers LLP
San Francisco, California
February 17, 2015
PAGE 21 § DODGE & COX INCOME FUND
BOARD APPROVAL OF FUNDS’ INVESTMENT MANAGEMENT AGREEMENTS AND MANAGEMENT FEES
(unaudited)
The Board of Trustees is responsible for overseeing the performance of the Dodge & Cox Funds’ investment manager and determining whether to continue the Investment Management Agreements between the Funds and Dodge & Cox each year (the “Agreements”). At a meeting of the Board of Trustees of the Trust held on December 17, 2014, the Trustees, by a unanimous vote (including a separate vote of those Trustees who are not “interested persons” (as defined in the Investment Company Act of 1940) (the “Independent Trustees”)), approved the renewal of the Agreements for an additional one-year term through December 31, 2015 with respect to each Fund other than the Dodge & Cox Global Bond Fund. The Agreement for the Dodge & Cox Global Bond Fund was not subject to renewal at this time. During the course of the year, the Board received a wide variety of materials relating to the services provided by Dodge & Cox and the performance of each of the Funds.
INFORMATION RECEIVED
In advance of the meeting, the Board, including each of the Independent Trustees, requested, received, and reviewed materials relating to the Agreements and the services provided by Dodge & Cox. The Independent Trustees retained Morningstar® to prepare an independent expense and performance summary for each Fund and comparable funds managed by other advisers identified by Morningstar. The Morningstar materials included information regarding advisory fee rates, expense ratios, and transfer agency, custodial, and distribution expenses, as well as appropriate performance comparisons to each Fund’s peer group and an index or combination of indices. The Morningstar materials also included a comparison of expenses of various share classes offered by comparable funds.
The materials reviewed by the Board contained information concerning, among other things, Dodge & Cox’s profitability, financial results and condition, advisory fee revenue, and separate account and sub-adviser fund fee schedules. The Board additionally considered the Funds’ brokerage commissions, turnover
rates, sales and redemption data and the significant investment that Dodge & Cox makes in research used in managing the Funds. The Board received and reviewed a memorandum summarizing information provided throughout the year regarding Dodge & Cox’s services to the Funds as well as information regarding (i) the different fees, services, costs, and risks associated with other accounts managed by Dodge & Cox as compared to the Dodge & Cox Funds; (ii) the differences in performance between the Funds and separately managed accounts; and (iii) Fund shares subscription and redemption activity. Throughout the process of reviewing the services provided by Dodge & Cox and preparing for the meeting, the Independent Trustees found Dodge & Cox to be open, forthright, detailed, and very helpful in answering questions about all issues.
The Board received copies of the Agreements and a memorandum from the independent legal counsel to the Independent Trustees discussing the factors generally regarded as appropriate to consider in evaluating advisory arrangements. The Trust’s Contract Review Committee, consisting solely of Independent Trustees, met with the independent legal counsel on November 3, 2014, and again on December 17, 2014, to discuss whether to renew the Agreements. The Board, including the Independent Trustees, subsequently concluded that the existing Agreements are fair and reasonable and voted to approve the Agreements.
In considering the Agreements, the Board, including the Independent Trustees, did not identify any single factor or particular information as all-important or controlling. In reaching the decision to approve the Agreements, the Board considered several factors, discussed below, to be key factors and reached the conclusions described below.
NATURE, QUALITY, AND EXTENT OF THE SERVICES
The Board considered that Dodge & Cox provides a wide range of services to the Funds in addition to portfolio management and that the quality of these services has been excellent in all respects. The extensive nature of services provided by Dodge & Cox has been documented in materials provided to the Board and in presentations made to the Board throughout the year. In particular, the
DODGE & COX INCOME FUND §PAGE 22
Board considered the nature, quality, and extent of portfolio management, administrative, and shareholder services performed by Dodge & Cox. With regard to portfolio management services, the Board considered Dodge & Cox’s established long-term history of care and conscientiousness in the management of the Funds; its demonstrated consistency in investment approach and depth; the background and experience of the Dodge & Cox Investment Policy Committee, International Investment Policy Committee, Global Stock Investment Policy Committee, Fixed Income Investment Policy Committee, and Global Bond Investment Policy Committee, and research analysts responsible for managing the Funds; its methods for assessing the regulatory and investment climate in various jurisdictions; Dodge & Cox’s overall high level of attention to its core investment management function; and its commitment to the Funds and their shareholders.
In the area of administrative and shareholder services, the Board considered the excellent quality of Dodge & Cox’s work in areas such as compliance, legal services, trading, proxy voting, technology, oversight of the Funds’ transfer agent and custodian, tax compliance, and shareholder communication through its website and other means. The Board also noted Dodge & Cox’s diligent disclosure policy, its favorable compliance record, and its reputation as a trusted, shareholder-friendly mutual fund family.
In addition, the Board considered that Dodge & Cox manages approximately $180 billion in Fund assets with fewer professionals than most comparable funds, and that on average these professionals have more experience and longer tenure than investment professionals at comparable funds. The Board also noted that Dodge & Cox is an investment research-oriented firm with no other business endeavors to distract management’s attention from its research efforts, and that its investment professionals adhere to a consistent investment approach across the Funds. The Board further considered the favorable stewardship and “Gold” analyst ratings awarded to each of the Funds by Morningstar. The Board concluded that it was satisfied with the nature, extent, and quality of investment management and other services provided to the Funds by Dodge & Cox.
INVESTMENT PERFORMANCE
The Board considered short-term and long-term investment performance for each Fund (including periods of outperformance or underperformance) as compared to both relevant indices and the performance of such Fund’s peer group. The Board noted that each Fund demonstrated favorable longer-term performance relative to its benchmark and peer group. The Board determined after extensive review and inquiry that Dodge & Cox’s historic, long-term, team-oriented, bottom up investment approach remains consistent and that Dodge & Cox continues to be distinguished by its integrity, transparency, and independence.
The Board considered that the performance of the Funds is the result of a team-oriented investment management process that emphasizes a long-term investment horizon, comprehensive independent research, price discipline, and focus. The Board also considered that the investment performance delivered by Dodge & Cox to the Funds appeared to be consistent with the relevant performance delivered for other clients of Dodge & Cox. The Board concluded that Dodge & Cox has delivered favorable long-term performance for Fund investors consistent with the long-term investment strategies being pursued by the Funds.
COSTS AND ANCILLARY BENEFITS
Costs of Services to Funds: Fees and Expenses. The Board considered each Fund’s management fee rate and expense ratio relative to similar mutual funds and relative to management fees charged by Dodge & Cox to other clients. In particular, the Board considered that the Funds continue to be substantially below their peer group median in expense ratios and management fee rates and that many media and industry reports specifically comment on the low expense ratios of the Funds, which have been a defining characteristic of the Funds for many years. The Board also evaluated the operating structures of the Funds and Dodge & Cox, noting that the Funds do not charge front-end sales commissions or distribution fees, and Dodge & Cox bears, among other things, the significant cost of third party research, reimbursement for recordkeeping and administrative costs to third-party retirement plan administrators, and administrative and
office overhead. The Board noted that expenses are well
PAGE 23 § DODGE & COX INCOME FUND
below industry averages. The Board also considered that the Funds receive numerous administrative, regulatory compliance, legal, technology and shareholder support services from Dodge & Cox without any additional administrative fee and the fact that the Funds have relatively low transaction costs and portfolio turnover rates. The Board reviewed Morningstar data showing that the few peer group funds with lower expense ratios often have other share classes with significantly higher expense ratios.
The Board reviewed information regarding the fee rates Dodge & Cox charges to separate accounts and subadvised funds that have investment programs similar to those of the Funds, including instances where separate account and sub-advised fund fees are lower than Fund fees. The Board considered differences in the nature and scope of services Dodge & Cox provides to the Funds as compared to other client accounts, differences in regulatory, litigation, and other risks as between Dodge & Cox Funds and other types of clients, and certain characteristics of the market for institutional separate account management services. The Board further noted that, with respect to non-U.S. funds sponsored and managed by Dodge & Cox that are comparable to the Funds in many respects, the fee rates charged by Dodge & Cox are the same as or higher than the fee rates charged to the Funds. After consideration of these matters, the Board concluded that the overall costs incurred by the Funds for the services they receive (including the management fee paid to Dodge & Cox) are reasonable and that the fees are acceptable based upon the qualifications, experience, reputation, and performance of Dodge & Cox and the low overall expense ratios of the Funds.
Profitability and Costs of Services to Dodge & Cox; “Fall-out” Benefits. The Board reviewed reports of Dodge & Cox’s financial position, profitability, and estimated overall value, and considered Dodge & Cox’s overall profitability within its context as a private, employee-owned S-Corporation and relative to the favorable services provided. The Board noted in particular that Dodge & Cox’s profits are not generated by high fee rates, but reflect an extraordinarily streamlined, efficient, and focused business approach toward investment
management. The Board recognized the importance of Dodge & Cox’s profitability—which is derived solely from management fees and does not include other business ventures—to maintain its independence, stability, company culture and ethics, and management continuity. The Board also considered that the compensation/profit structure at Dodge & Cox includes a return on shareholder employees’ investment in the firm, which is vital for remaining independent and facilitating retention of management and investment professionals.
The Board considered that Dodge & Cox recently recommended closing the International Stock Fund to new investors to pro-actively manage the growth of the Fund. The Stock Fund and Balanced Fund were similarly closed to new investors during periods of significant growth in the past. While these actions are intended to benefit existing shareholders, the effect is to reduce potential revenues to Dodge & Cox from new shareholders.
The Board also considered potential “fall-out” benefits (including the receipt of research from unaffiliated brokers and reputational benefits to non-U.S. funds sponsored and managed by Dodge & Cox) that Dodge & Cox might receive as a result of its association with the Funds and determined that they are not significant. The Board also noted the extent of additional administrative services performed by Dodge & Cox for the Funds, and that the magnitude of costs and risks borne by Dodge & Cox in rendering advisory services to the Funds (including risks in the regulatory compliance, securities valuation, and investment management processes) are continuing to increase. The Board concluded that the profitability of Dodge & Cox’s relationship with the Funds (including fall-out benefits) was fair and reasonable.
THE BENEFIT OF ECONOMIES OF SCALE
The Board considered whether there have been economies of scale with respect to the management of each Fund, whether the Funds have appropriately benefited from any economies of scale, and whether the management fee rate is reasonable in relation to the Fund assets and any economies of scale that may exist. In the Board’s view, any consideration of economies of scale must take account of the Funds’ low fee structure and the
DODGE & COX INCOME FUND §PAGE 24
considerable efficiencies of the Funds’ organization and fee structure that has been realized by shareholders from the time of each Fund’s inception (i.e., from the first dollar). An assessment of economies of scale must also take into account that Dodge & Cox has capped expenses when offering new funds. In addition, the Board noted that Dodge & Cox has shared economies of scale by adding or enhancing services to the Funds over time, and that the internal costs of providing investment management, up-to-date technology, administrative, legal, and compliance services to the Funds are continuing to increase. For example, Dodge & Cox has increased its global research staff and investment resources over the years to address the increased complexity of investing in multinational and non-U.S. companies. In addition, Dodge & Cox has made substantial expenditures in other staff, technology, and infrastructure to enable it to integrate credit and equity analyses and to be able to implement its strategy in a more effective and secure manner. The Board determined that the Funds provide access for small investors to high quality investment management at a relatively low cost. The Board’s decision to renew the Agreements was made after consideration of economies of scale and review of peer group fund expense ratios and historical expense ratio patterns for the Funds. The Board concluded that the current Dodge & Cox fee structure is fair and reasonable and adequately shares economies of scale that may exist.
CONCLUSION
Based on their evaluation of all material factors and assisted by the advice of independent legal counsel to the Independent Trustees, the Board, including the Independent Trustees, concluded that the advisory fee structure was fair and reasonable, that each Fund was paying a competitive fee for the services provided, that the scope and quality of Dodge & Cox’s services has provided substantial value for Fund shareholders over the long term, and that approval of the Agreements was in the best interests of each Fund and its shareholders.
FUND HOLDINGS
The Fund provides a complete list of its holdings four times each fiscal year, as of the end of each quarter. The Fund files the lists with the Securities and Exchange Commission (SEC) on Form N-CSR (second and fourth quarters) and Form N-Q (first and third quarters). Shareholders may view the Fund’s Forms N-CSR and N-Q on the SEC’s website at www.sec.gov. Forms N-CSR and N-Q may also be reviewed and copied at the SEC’s Public Reference Room in Washington, DC. Information regarding the operations of the Public Reference Room may be obtained by calling 202-551-8090 (direct) or 800-732-0330 (general SEC number). A list of the Fund’s quarter-end holdings is also available at www.dodgeandcox.com on or about 15 days following each quarter end and remains available on the web site until the list is updated in the subsequent quarter.
PROXY VOTING
For a free copy of the Fund’s proxy voting policies and procedures, please call 800-621-3979, visit the Fund’s website at www.dodgeandcox.com, or visit the SEC’s website at www.sec.gov. Information regarding how the Fund voted proxies relating to portfolio securities during the most recent 12-month period ending June 30 is also available at www.dodgeandcox.com or at www.sec.gov.
HOUSEHOLD MAILINGS
The Fund routinely mails shareholder reports and summary prospectuses to shareholders and, on occasion, proxy statements. In order to reduce the volume of mail, when possible, only one copy of these documents will be sent to shareholders who are part of the same family and share the same residential address.
If you have a direct account with the Funds and you do not want the mailing of shareholder reports and summary prospectuses combined with other members in your household, contact the Funds at 800-621-3979. Your request will be implemented within 30 days
PAGE 25 § DODGE & COX INCOME FUND
THIS PAGE INTENTIONALLY LEFT BLANK
DODGE & COX INCOME FUND §PAGE 26
DODGE & COX FUNDS—EXECUTIVE OFFICER & TRUSTEE INFORMATION
| | | | | | |
Name (Age) and
Address* | | Position with Trust (Year of Election or
Appointment) | | Principal Occupation During Past 5 Years | | Other Directorships Held by Trustees |
| INTERESTED TRUSTEES AND OFFICERS |
| Charles F. Pohl (56) | | Chairman and Trustee (Officer since 2004) | | Chairman (since 2013), Co-President (2011-2013), Senior Vice President (until 2011), and Director of Dodge & Cox; Chief Investment Officer, Portfolio Manager, Investment Analyst, and member of Investment Policy Committee (IPC), Global Stock Investment Policy Committee (GSIPC), International Investment Policy Committee (IIPC), and Fixed Income Investment Policy Committee (FIIPC) | | — |
| Dana M. Emery (53) | | President and Trustee (Trustee since 1993) | | Chief Executive Officer (since 2013), President (since 2011), Executive Vice President (until 2011), and Director of Dodge & Cox; Director of Fixed Income, Portfolio Manager, and member of FIIPC and Global Bond Investment Policy Committee (GBIPC) | | — |
| John A. Gunn (71) | | Senior Vice President (Officer since 1998) | | Chairman Emeritus (2011-2013), Chairman (until 2011), Chief Executive Officer (until 2010), and Director of Dodge & Cox; Portfolio Manager and member of IPC, GSIPC (until 2014), and IIPC | | — |
| Diana S. Strandberg (55) | | Senior Vice President (Officer since 2006) | | Senior Vice President (since 2011), Vice President (until 2011), and Director (since 2011) of Dodge & Cox; Director of International Equity (since 2009), Portfolio Manager, Investment Analyst, and member of IPC, GSIPC, IIPC, and GBIPC | | — |
| David H. Longhurst (57) | | Treasurer (Officer since 2006) | | Vice President and Assistant Treasurer of Dodge & Cox | | — |
| Thomas M. Mistele (61) | | Secretary (Officer since 1998) | | Chief Operating Officer, Director, Secretary, Senior Counsel (since 2011), and General Counsel (until 2011) of Dodge & Cox | | — |
| Katherine M. Primas (40) | | Chief Compliance Officer (Officer since 2009) | | Vice President (since 2011) and Chief Compliance Officer of Dodge & Cox | | — |
| INDEPENDENT TRUSTEES |
| Thomas A. Larsen (65) | | Trustee (Since 2002) | | Senior Counsel of Arnold & Porter LLP (law firm) (since 2013); Partner of Arnold & Porter LLP (since 2012); Director of Howard, Rice, Nemerovski, Canady, Falk & Rabkin (1977-2011) | | — |
| Ann Mather (54) | | Trustee (Since 2011) | | CFO, Pixar Animation Studios (1999-2004) | | Director, Google, Inc. (internet information services) (since 2005); Director, Glu Mobile, Inc. (multimedia software) (since 2005); Director, Arista Networks (since 2013); Director, Netflix, Inc. (video services) (since 2010); Director, Shutterfly, Inc. (internet photography services/publishing) (since 2013) |
| Robert B. Morris III (62) | | Trustee (Since 2011) | | Advisory Director, The Presidio Group (since 2005) | | — |
| Gary Roughead (63) | | Trustee (Since 2013) | | Annenberg Distinguished Visiting Fellow, Hoover Institution (since 2011); Admiral, United States Navy (Ret.); U.S. Navy Chief of Naval Operations (2007-2011) | | Director, Northrop Grumman Corp. (global security) (since 2012) |
| Mark E. Smith (63) | | Trustee (Since 2014) | | Executive Vice President, Managing Director—Fixed Income at Loomis Sayles & Company, L.P. (2003-2011) | | — |
| John B. Taylor (68) | | Trustee (Since 2005) (and 1995-2001) | | Professor of Economics, Stanford University; Senior Fellow, Hoover Institution; Under Secretary for International Affairs, United States Treasury (2001-2005) | | — |
| * | | The address for each Officer and Trustee is 555 California Street, 40th Floor, San Francisco, California 94104. Each Officer and Trustee oversees all six series in the Dodge & Cox Funds complex and serves for an indefinite term. |
Additional information about the Trust’s Trustees and Officers is available in the Trust’s Statement of Additional Information (SAI). You can get a free copy of the SAI by visiting the Funds’ website at www.dodgeandcox.com or calling
800-621-3979.
PAGE 27 § DODGE & COX INCOME FUND
| | | | |
| | | | |
www.dodgeandcox.com
For Fund literature, transactions, and account
information, please visit the Funds’ website.
or write or call:
DODGE & COX FUNDS
c/o Boston Financial Data Services
P.O. Box 8422
Boston, Massachusetts 02266-8422
(800) 621-3979
INVESTMENT MANAGER
Dodge & Cox
555 California Street, 40th Floor
San Francisco, California 94104
(415) 981-1710
This report is submitted for the general information of the shareholders of the Fund. The report is not authorized for distribution to prospective investors in the Fund unless it is accompanied by a current prospectus.
This report reflects our views, opinions, and portfolio holdings as of December 31, 2014, the end of the reporting period. Any such views are subject to change at any time based upon market or other conditions and Dodge & Cox disclaims any responsibility to update such views. These views may not be relied on as investment advice and, because investment decisions for a Dodge & Cox Fund are based on numerous factors, may not be relied on as an indication of trading intent on behalf of any Dodge & Cox Fund.
12/31 GBF AR Printed on recycled paper
Annual Report
December 31, 2014
Global Bond Fund
ESTABLISHED 2014
TICKER: DODLX
TO OUR SHAREHOLDERS
The Dodge & Cox Global Bond Fund had a total return of 1.7% for the year ending December 31, 2014,(a) compared to 0.6% for the Barclays Global Aggregate Bond Index (Barclays Global Agg). At year end, the Fund had net assets of $64.7 million with a cash position of 3.6%.
MARKET COMMENTARY
During 2014, market volatility reached multi-year lows in the first half and multi-year highs in the second half. Weaker global growth prospects, significant monetary policy decisions, and plummeting oil prices (down approximately 50%) influenced global financial markets and drove interest rate declines across most markets. Despite these interest rate declines, the Barclays Global Agg returned just 0.6% for the year. Significant depreciation of most global currencies against the U.S. dollar (particularly in the second half) erased almost all of the price gains from falling interest rates.
Following an unexpected contraction in the first quarter, the U.S. economy rebounded as unemployment declined to a six-year low and private consumption increased. In contrast, the Eurozone showed significant weakness, as stagnation and deflation concerns rose. Japan’s economy slowed down sharply on the back of a sales tax hike. These developments drove important, and divergent, policy decisions across economies. These included the Federal Reserve’s (Fed) cessation of its historic asset-purchase program, the European Central Bank’s (ECB) rate cuts and increasingly dovish signals, and the Bank of Japan’s aggressive expansion of quantitative and qualitative easing measures. Ten-year interest rates in developed economies fell, ending at 2.17%, 0.54%, and 0.33% for the United States, Germany, and Japan, respectively. The Japanese yen and the euro both depreciated 12% against the U.S. dollar.
Emerging market performance was also mixed. The Chinese and Brazilian economies downshifted, while India and a few others accelerated relative to 2013. All currencies fell against the dollar but oil exporters suffered the most, with the Russian ruble and Colombian peso falling 46% and 19%, respectively. Conversely, Asian oil importers and countries with economic reform momentum fared best.
Unlike the past two years, corporate bond yield premiums widened in 2014. However, the path was not linear, as yield premiums narrowed in the first half of the year before widening in the second. Energy was the worst performing credit sector. From a regional standpoint, the euro credit market outperformed the U.S. credit market, supported by the increased likelihood of ECB quantitative easing in 2015.
INVESTMENT STRATEGY
In a challenging environment for investments outside the United States, the Fund’s 1.7% return was relatively strong (1.1 percentage points above the Barclays Global Agg), driven primarily by a significantly lower exposure to the Japanese yen and the euro than the index, as well as strong performance among many of the Fund’s credit holdings. Dodge & Cox’s emphasis on credit research and bottom-up security selection differentiates it from many other global bond fund managers; this approach to managing the Fund has been a significant driver of absolute and relative returns since its inception in December 2012.(a)
During the first half of 2014, interest rates fell, credit yield premiums narrowed, and the economic outlook outside of the United States generally deteriorated. We reduced risk across all three dimensions of the Fund—credit, currency, and interest rates—due to stretched valuations across interest rate and credit markets and fundamental deterioration in certain non-U.S. economies. During the second half of the year, we incrementally increased the Fund’s exposure to credit and currency to take advantage of widening yield premiums and lower currency valuations. These position shifts highlight two tenets of our investment philosophy—the importance of valuation and our focus on protecting against downside risks to fulfill the goal of long-term preservation of capital for our shareholders. These changes are described in greater detail in the following sections.
Credit Focus: Valuation at the Forefront
Valuation was central to our credit decision-making over the course of the year. Earlier in the year, credit yield premiums fell to multi-year lows, prompting our review of
PAGE 1 § DODGE & COX GLOBAL BOND FUND
the Fund’s individual holdings and a decision to make several valuation-based reductions (e.g., Dow Chemical, Xerox(b)). In addition, we trimmed credit holdings in the Fund that are domiciled in peripheral Europe as the Eurozone debt crisis abated and valuations rose. For example, we reduced the Fund’s Autonomous Community of Madrid position, which has been a strong performer in recent years, demonstrated by declining yields from nearly 8% at the end of 2012 to below 2.5% as of year end.
In the second half of 2014, credit yield premiums began to widen as economic concerns and a drop in commodity prices led to a flight to quality. One area in which we found value is in subordinated bank bonds. We established new positions in subordinated (Tier 2) debt of Barclays and BNP Paribas. These banks have strong and diverse franchises, and their balance sheets have improved on the heels of more stringent regulation and higher capital levels. Given our assessment of improved creditworthiness, we believe the higher yields of subordinated bonds relative to senior bonds sufficiently compensate us for the increased risk of loss in the event of an adverse outcome, which we believe to be unlikely. We have also found opportunities in emerging market credit. As credit premiums widened, we added to the Fund’s holdings in Cemex, a large Mexican building materials company, and Millicom International Cellular, a Luxembourg-domiciled telecom company that operates primarily in Latin America and Africa.
The Fund ended the year with 51% in corporate securities and 8% in government-related credits (down from 54% and 14% respectively at the end of 2013). We believe this substantial allocation to credit securities is warranted given current valuations and strong credit fundamentals. As always, we remain vigilant about assessing credit fundamentals, event risk, and macroeconomic factors that could negatively impact returns.
Currency: Positioning for a Strong U.S. Dollar
Currency was a headwind for the Fund’s absolute return given the unabated strength of the U.S. dollar in the second half of 2014. However, on a relative basis, the Fund’s currency positioning added to performance. Two themes expressed in the Fund during the year were positioning for the cyclical divergence between the
United States and most other developed economies and repositioning the Fund’s emerging market currency exposures based on changes in both valuation and fundamentals. As of year-end, approximately 20% of the Fund’s holdings were denominated in emerging market currencies.
Over the course of 2014, we shifted the Fund’s developed market currency exposure to reflect our positive view of the strength of the U.S. economy relative to those of other developed countries. Specifically, we increased the Fund’s U.S. dollar weighting from 54% to 61%, and reduced the Fund’s exposure to the Canadian dollar, euro, and British pound. This developed market currency positioning was a significant driver of the Fund’s relative performance. Looking forward, the economic outlook in the Eurozone remains challenging, with growth running significantly below 1% and inflation expectations very low. Monetary policy in the United States appears to be on a different trajectory than it is in Europe and Japan. This may lead to widening interest rate differentials in favor of the United States, and continued strength of the U.S. dollar. In addition, while the U.S. dollar is as strong as it has been since 2009, its valuation remains reasonable, and its recent appreciation looks modest relative to past periods of U.S. dollar strength.
For emerging market currencies, 2014 was a period of increased differentiation, as oil price exposure, economic reform momentum, and macroeconomic fundamentals led to a significant divergence in returns. Nonetheless, essentially all currencies depreciated against the U.S. dollar, with the Fund’s holdings in the Mexican peso, Polish zloty, and Colombian peso detracting most notably from returns. However, we believe that the broad sell-off provided opportunities for investors who have the patience to look through volatility and focus on the long term. In the fourth quarter, we increased the Fund’s exposure to the Mexican peso from 5% to 6%, reflecting our view of its attractive currency valuation, strong export sector that is tied to the United States, and supportive cyclical and structural factors. We also established a 0.9% position in the Indian rupee, based on renewed policy credibility and a more constructive outlook for inflation and the current account.
DODGE & COX GLOBAL BOND FUND §PAGE 2
Rates: Still Playing Defense
The downward trajectory of interest rates across nearly every market in 2014 boosted absolute returns but defied many expectations, including our own. In a falling rate environment, the Fund’s lower interest rate exposure detracted from relative performance.
We continue to believe interest rates in the United States are likely to rise, driven by the positive momentum of the current economic recovery. While inflation is likely to remain subdued, the effects of unwinding the Fed’s unprecedented accommodative policy measures are unknown and may result in unforeseen events.
As we enter 2015, the average of the 10-year interest rates in the United States, Germany, and Japan is below 1%, an all-time low. This presents a challenging environment, as the negative price impact of even a small increase in interest rates could overwhelm the income offered given low yields. Because we believe the return profile is asymmetric, we continue to be defensive in terms of taking interest rate risk. The year-end portfolio level duration(c) of the Fund was 3.7 years versus the Barclays Global Agg duration of 6.5 years (3.6 years versus 5.5 for U.S. dollar-denominated holdings). In certain markets with relatively high real rates and/or steep yield curves, we are more willing to accept interest rate risk.
IN CLOSING
As we look out on the year ahead for global bonds, we acknowledge the challenges of investing in a low-yield world where many countries face difficulties. However, we believe there are pockets of opportunity where we can leverage our established research effort and investment philosophy to seek attractive long-term returns for our shareholders. For example, we have been carefully analyzing the potential impact of falling oil prices on the Fund’s current holdings while evaluating new opportunities in the Energy sector and other areas where market pessimism may have driven prices below what is justified by long-term fundamentals. We view times of increasing volatility as times of long-term opportunity.
Thank you for your continued confidence in our firm. As always, we welcome your comments and questions.
For the Board of Trustees,
| | |
| |
|
Charles F. Pohl, Chairman | | Dana M. Emery, President |
January 27, 2015
| (a) | | Prior to the Fund’s opening on May 1, 2014, Dodge & Cox managed a private fund with an investment objective, policies, and strategies that were, in all material respects, the same as those of the Fund. The performance figures and characteristics described in this report for periods prior to May 1, 2014 are those of the private fund. For the Fund’s return for the period from May 1, 2014 to December 31, 2014, see the Financial Highlights. |
| (b) | | The use of specific examples does not imply that they are more attractive investments than the Fund’s other holdings. |
| (c) | | Duration is a measure of a bond’s (or a bond portfolio’s) price sensitivity to changes in interest rates. |
PAGE 3 § DODGE & COX GLOBAL BOND FUND
ANNUAL PERFORMANCE REVIEW
The Fund outperformed the Barclays Global Agg by 1.1 percentage points in 2014.
Key Contributors to Relative Results
| | § | | The Fund’s currency positioning contributed significantly to outperformance, driven by a large underweight to the euro (9% versus 27% in the Barclays Global Agg) and the Japanese yen (0% versus 16%), which both depreciated approximately 12%. | |
| | § | | Security selection was positive, led by strong performance of Time Warner Cable, as well as peripheral European credits such as Enel and the Autonomous Community of Madrid. | |
| | § | | The nominal yield advantage of the Fund was a positive factor. | |
Key Detractors from Relative Results
| | § | | The Fund’s lower exposure to interest rates in most developed markets detracted from relative returns as interest rates declined. | |
| | § | | The Fund’s overweight to select currencies, including the Swedish krona and Mexican peso, detracted from relative returns as currencies sensitive to oil prices and the euro underperformed. | |
| | | | Unless otherwise noted, figures cited in this section denote Fund positioning at the beginning of the period. | |
KEY CHARACTERISTICS OF DODGE & COX
Independent Organization
Dodge & Cox is one of the largest privately owned investment managers in the world. We remain committed to independence, with a goal of providing the highest quality investment management service to our existing clients.
Over 80 Years of Investment Experience
Dodge & Cox was founded in 1930. We have a stable and well-qualified team of investment professionals, most of whom have spent their entire careers at Dodge & Cox.
Experienced Investment Team
The Global Bond Investment Policy Committee, which is the decision-making body for the Global Bond Fund, is a six-member committee with an average tenure at Dodge & Cox of 19 years.
One Business with a Single Research Office
Dodge & Cox manages equity (domestic, international, and global), fixed income (domestic and global), and balanced investments, operating from one office in San Francisco.
Consistent Investment Approach
Our team decision-making process involves thorough, bottom-up fundamental analysis of each investment.
Long-Term Focus and Low Expenses
We invest with a three- to five-year investment horizon, which has historically resulted in low turnover relative to our peers. We manage Funds that maintain low expense ratios.
Risks: The Fund invests in debt securities whose yields and market values fluctuate, so that an investment may be worth more or less than its original cost. Debt securities are subject to interest rate risk, credit risk, and prepayment risk, all of which could have adverse effects on the value of the Fund. A low interest rate environment creates an elevated risk of future negative returns. Financial intermediaries may restrict their market making activities for certain debt securities, which may reduce the liquidity and increase the volatility of such securities. Investing in non-U.S. securities may entail risk due to foreign economic and political developments; this risk may be increased when investing in emerging markets. The Fund is also subject to currency risk. Please read the prospectus and summary prospectus for specific details regarding the Fund’s risk profile.
DODGE & COX GLOBAL BOND FUND §PAGE 4
GROWTH OF $10,000 SINCE INCEPTION
FOR AN INVESTMENT MADE ON DECEMBER 5, 2012
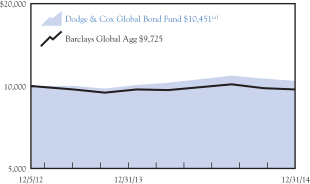
AVERAGE ANNUAL TOTAL RETURN
FOR PERIODS ENDED DECEMBER 31, 2014
| | | | | | | | |
| | | 1 Year | | | Since
Inception
(12/5/12) | |
| | | | | | | | |
Dodge & Cox Global Bond Fund(a) | | | 1.67 | % | | | 2.16 | % |
Barclays Global Aggregate Bond Index
(Barclays Global Agg) | | | 0.58 | | | | -1.32 | |
| (a) | | Expense reimbursements have been in effect for the Fund since its inception. Without the expense reimbursements, returns for the Fund would have been lower. The Fund’s return from May 1, 2014 to December 31, 2014 is as presented in the Financial Highlights. |
Returns represent past performance and do not guarantee future results. Investment return and share price will fluctuate with market conditions, and investors may have a gain or loss when shares are sold. Fund performance changes over time and currently may be significantly lower than stated. Performance is updated and published monthly. Visit the Fund’s website at www.dodgeandcox.com or call 800-621-3979 for current performance figures.
A private fund managed and funded by Dodge & Cox (the “Private Fund”) was reorganized into the Fund and the Fund commenced operations on May 1, 2014. The Private Fund commenced operations on December 5, 2012 and had an investment objective, policies, and strategies that were, in all material respects, the same as those of the Fund, and was managed in a manner that, in all material respects, complied with the investment guidelines and restrictions of the Fund. However, the Private Fund was not registered as an investment company under the Investment Company Act of 1940 (the “1940 Act”), and therefore was not subject to certain investment limitations, diversification requirements, liquidity requirements, and other restrictions imposed by the 1940 Act and the Internal Revenue Code, which, if applicable, may have adversely affected its performance.
The Fund’s total returns include the reinvestment of dividend and capital gain distributions, but have not been adjusted for any income taxes payable by shareholders on these distributions or on Fund share redemptions. Index returns include interest income but, unlike Fund returns, do not reflect fees or expenses. The Barclays Global Aggregate Bond Index (Barclays Global Agg) is a widely recognized, unmanaged index of multi-currency investment-grade, debt securities.
Barclays® is a trademark of Barclays Bank PLC.
PAGE 5 § DODGE & COX GLOBAL BOND FUND
FUND EXPENSE EXAMPLE
As a Fund shareholder, you incur ongoing Fund costs, including management fees and other Fund expenses. All mutual funds have ongoing costs, sometimes referred to as operating expenses. The following example shows ongoing costs of investing in the Fund and can help you understand these costs and compare them with those of other mutual funds. The example assumes a $1,000 investment held for the six months indicated.
ACTUAL EXPENSES
The first line of the table below provides information about actual account values and expenses based on the Fund’s actual returns. You may use the information in this line, together with your account balance, to estimate the expenses that you paid over the period. Simply divide your account value by $1,000 (for example, an $8,600 account value divided by $1,000 = 8.6), then multiply the result by the number in the first line under the heading “Expenses Paid During Period” to estimate the expenses you paid on your account during this period.
HYPOTHETICAL EXAMPLE FOR COMPARISON WITH OTHER MUTUAL FUNDS
Information on the second line of the table can help you compare ongoing costs of investing in the Fund with those of other mutual funds. This information may not be used to estimate the actual ending account balance or expenses you paid during the period. The hypothetical “Ending Account Value” is based on the actual expense ratio of the Fund and an assumed 5% annual rate of return before expenses (not the Fund’s actual return). The amount under the heading “Expense Paid During the Period” shows the hypothetical expenses your account would have incurred under this scenario. You can compare this figure with the 5% hypothetical examples that appear in shareholder reports of other mutual funds.
| | | | | | | | | | | | |
Six Months Ended December 31, 2014 | | Beginning Account Value
7/1/2014 | | | Ending Account Value
12/31/2014 | | | Expenses Paid
During Period* | |
Based on Actual Fund Return | | $ | 1,000.00 | | | $ | 958.90 | | | $ | 2.97 | |
Based on Hypothetical 5% Yearly Return | | | 1,000.00 | | | | 1,022.18 | | | | 3.06 | |
| * | | Expenses are equal to the Fund’s annualized net expense ratio of 0.60%, multiplied by the average account value over the period, multiplied by 184/365 (to reflect the one-half year period). |
The expenses shown in the table highlight ongoing costs only and do not reflect any transactional fees or account maintenance fees. Though other mutual funds may charge such fees, please note that the Fund does not charge transaction fees (e.g., redemption fees, sales loads) or universal account maintenance fees (e.g., small account fees).
DODGE & COX GLOBAL BOND FUND §PAGE 6
| | | | |
| FUND INFORMATION | | | December 31, 2014 | |
| | | | |
| GENERAL INFORMATION | | | |
Net Asset Value Per Share | | | $10.31 | |
Total Net Assets (millions) | | | $64.7 | |
30-Day SEC Yield (using net expenses)(a)(b) | | | 3.30% | |
30-Day SEC Yield (using gross expenses) | | | 1.72% | |
Net Expense Ratio(b) | | | 0.60% | |
Gross Expense Ratio (5/1/14 to 12/31/14, annualized) | | | 2.18% | |
Portfolio Turnover Rate (5/1/14 to 12/31/14, unannualized) | | | 36% | |
Fund Inception | | | May 1, 2014 | |
No sales charges or distribution fees | | | | |
Investment Manager: Dodge & Cox, San Francisco. Managed by the Global Bond Investment Policy Committee, whose six members’ average tenure at Dodge & Cox is 19 years.
| | | | | | | | |
| PORTFOLIO CHARACTERISTICS | | Fund | | | Barclays
Global Agg | |
Number of Debt Securities | | | 105 | | | | 16,268 | |
Effective Duration (years) | | | 3.7 | | | | 6.5 | |
Emerging Markets(c) | | | 28.3% | | | | 4.2% | |
| | | | |
| FIVE LARGEST CORPORATE ISSUERS (%)(d) | | Fund | |
Cemex SAB de CV | | | 2.4 | |
Millicom International Cellular SA | | | 2.3 | |
Imperial Tobacco Group PLC | | | 2.0 | |
Telecom Italia SPA | | | 1.9 | |
Enel SPA | | | 1.9 | |
| | | | | | | | |
| CREDIT QUALITY (%)(e)(f) | | Fund | | | Barclays
Global Agg | |
Aaa | | | 16.0 | | | | 41.3 | |
Aa | | | 4.0 | | | | 16.7 | |
A | | | 20.6 | | | | 26.1 | |
Baa | | | 37.4 | | | | 15.9 | |
Ba | | | 14.0 | | | | 0.0 | |
B | | | 4.4 | | | | 0.0 | |
Cash Equivalents | | | 3.6 | | | | 0.0 | |
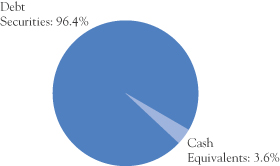
| | | | | | | | |
SECTOR
DIVERSIFICATION (%)(f) | | Fund | | | Barclays
Global Agg | |
Government | | | 24.9 | | | | 53.5 | |
Government-Related | | | 8.1 | | | | 13.4 | |
Securitized | | | 12.6 | | | | 15.6 | |
Corporate | | | 50.8 | | | | 17.5 | |
Cash Equivalents | | | 3.6 | | | | 0.0 | |
| | | | | | | | |
REGION
DIVERSIFICATION (%)(c)(f) | | Fund | | | Barclays
Global Agg | |
United States | | | 42.0 | | | | 37.0 | |
Latin America | | | 20.0 | | | | 1.4 | |
Europe (excluding United Kingdom) | | | 17.6 | | | | 27.9 | |
United Kingdom | | | 8.8 | | | | 6.5 | |
Pacific (excluding Japan) | | | 4.9 | | | | 4.7 | |
Canada | | | 1.6 | | | | 3.4 | |
Africa/Middle East | | | 1.5 | | | | 1.0 | |
Japan | | | 0.0 | | | | 15.6 | |
Other | | | 0.0 | | | | 2.5 | |
| (a) | SEC Yield is an annualization of the Fund’s total net investment income per share for the 30-day period ended on the last day of the month. |
| (b) | For the fiscal periods ending December 31, 2014 and 2015, Dodge & Cox has contractually agreed to reimburse the Fund for all ordinary expenses to the extent necessary to maintain Total Annual Fund Operating Expenses at 0.60%. The agreement is renewable annually thereafter and is subject to termination upon 30 days’ written notice by either party. |
| (c) | The Fund may classify an issuer in a different category than the Barclays Global Aggregate Bond Index. The Fund generally classifies a corporate issuer based on the country of incorporation of the parent company, but may designate a different country in certain circumstances. |
| (d) | The Fund’s portfolio holdings are subject to change without notice. The mention of specific securities is not a recommendation to buy, sell, or hold any particular security and is not indicative of Dodge & Cox’s current or future trading activity. |
| (e) | The credit quality distributions shown for the Fund and the Index are based on the middle of Moody’s, S&P’s, and Fitch ratings, which is the methodology used by Barclays in constructing its indices. If a security is rated by only two agencies, the lower of the two ratings is used. Please note the Fund applies the highest of Moody’s, S&P’s, and Fitch ratings to comply with the quality requirements stated in its prospectus. On that basis, the Fund held 11.6% in securities rated below investment grade. The credit quality of the investments in the portfolio does not apply to the stability or safety of the Fund or its shares. |
| (f) | Excludes the effect of the Fund’s derivative contracts. |
PAGE 7 § DODGE & COX GLOBAL BOND FUND
| | | | |
| PORTFOLIO OF INVESTMENTS | | | December 31, 2014 | |
| | | | | | | | | | | | |
| DEBT SECURITIES: 96.4% | |
| | | |
| | | | | | PAR VALUE | | | VALUE | |
| GOVERNMENT: 24.9% | |
Brazil Government (Brazil) | | | | | | | | | | | | |
Series B, 6.00%, 8/15/20(a) | | | BRL | | | | 1,365,000 | | | $ | 1,280,877 | |
Series F, 10.00%, 1/1/21 | | | BRL | | | | 1,840,000 | | | | 625,468 | |
Chile Government GDN (Chile) 6.00%, 1/1/18(d) | | | CLP | | | | 725,000,000 | | | | 1,281,375 | |
Colombia Government (Colombia)
9.85%, 6/28/27 | | | COP | | | | 2,425,000,000 | | | | 1,280,000 | |
Malaysia Government (Malaysia)
3.172%, 7/15/16 | | | MYR | | | | 6,725,000 | | | | 1,911,525 | |
Mexico Government (Mexico) | | | | | | | | | | | | |
2.00%, 6/9/22(a) | | | MXN | | | | 39,000,723 | | | | 2,596,658 | |
8.00%, 12/7/23 | | | MXN | | | | 16,600,000 | | | | 1,293,089 | |
Poland Government (Poland) 3.25%, 7/25/25 | | | PLN | | | | 4,000,000 | | | | 1,205,935 | |
South Korea Government (South Korea) | | | | | | | | | | | | |
4.50%, 3/10/15 | | | KRW | | | | 1,278,000,000 | | | | 1,167,620 | |
3.00%, 12/10/16 | | | KRW | | | | 135,000,000 | | | | 124,886 | |
Sweden Government (Sweden)
3.75%, 8/12/17 | | | SEK | | | | 8,425,000 | | | | 1,185,912 | |
U.S. Treasury Note (United States) | | | | | | | | | | | | |
0.375%, 5/31/16 | | | USD | | | | 220,000 | | | | 219,820 | |
0.625%, 10/15/16 | | | USD | | | | 1,925,000 | | | | 1,925,300 | |
| | | | | | | | | | | | |
| | | | | | | | | | | 16,098,465 | |
| GOVERNMENT-RELATED: 8.1% | |
Autonomous Community of Madrid (Spain)
4.30%, 9/15/26 | | | EUR | | | | 660,000 | | | | 961,894 | |
Chicago Transit Authority RB (United States) | | | | | | | | | | | | |
6.20%, 12/1/40 | | | USD | | | | 50,000 | | | | 59,335 | |
6.899%, 12/1/40 | | | USD | | | | 1,000,000 | | | | 1,262,739 | |
Petroleo Brasileiro SA (Brazil) 7.25%, 3/17/44 | | | USD | | | | 400,000 | | | | 395,000 | |
Petroleos Mexicanos (Mexico) | | | | | | | | | | | | |
4.25%, 1/15/25(d) | | | USD | | | | 300,000 | | | | 298,050 | |
5.50%, 6/27/44(d) | | | USD | | | | 175,000 | | | | 178,500 | |
6.375%, 1/23/45 | | | USD | | | | 385,000 | | | | 436,013 | |
State of California GO (United States) | | | | | | | | | | | | |
6.20%, 3/1/19 | | | USD | | | | 100,000 | | | | 114,903 | |
6.20%, 10/1/19 | | | USD | | | | 325,000 | | | | 380,481 | |
State of Illinois GO (United States) | | | | | | | | | | | | |
4.961%, 3/1/16 | | | USD | | | | 400,000 | | | | 416,692 | |
5.665%, 3/1/18 | | | USD | | | | 700,000 | | | | 766,521 | |
| | | | | | | | | | | | |
| | | | | | | | | | | 5,270,128 | |
| SECURITIZED: 12.6% | |
Chase Issuance Trust (United States) | | | | | | | | | | | | |
Series 2012-A8 A8,
0.54%, 10/16/17 | | | USD | | | | 650,000 | | | | 649,669 | |
| | | | | | | | | | | | |
| | | |
| | | | | | PAR VALUE | | | VALUE | |
Series 2013-A8 A8,
1.01%, 10/15/18 | | | USD | | | | 200,000 | | | $ | 199,971 | |
Series 2007-A3 A3,
5.23%, 4/15/19 | | | USD | | | | 419,000 | | | | 454,437 | |
Series 2014-A6 A6,
1.26%, 7/15/19 | | | USD | | | | 475,000 | | | | 473,530 | |
Fannie Mae, 15 Year (United States)
5.00%, 7/1/25 | | | USD | | | | 49,334 | | | | 53,608 | |
Fannie Mae, 20 Year (United States) | | | | | | | | | | | | |
4.50%, 6/1/31 | | | USD | | | | 343,656 | | | | 375,193 | |
4.00%, 8/1/31 | | | USD | | | | 159,512 | | | | 171,917 | |
4.00%, 2/1/32 | | | USD | | | | 238,735 | | | | 258,523 | |
4.00%, 10/1/34 | | | USD | | | | 421,700 | | | | 453,616 | |
Fannie Mae, 30 Year (United States)
6.00%, 5/1/37 | | | USD | | | | 150,312 | | | | 164,893 | |
Fannie Mae, Hybrid ARM
(United States) | | | | | | | | | | | | |
2.928%, 8/1/44 | | | USD | | | | 331,190 | | | | 342,859 | |
2.758%, 9/1/44 | | | USD | | | | 522,001 | | | | 538,376 | |
Freddie Mac (United States)
Series 4283 EW,
5.928%, 12/15/43 | | | USD | | | | 241,632 | | | | 266,038 | |
Freddie Mac, Hybrid ARM
(United States)
3.022%, 10/1/44 | | | USD | | | | 601,787 | | | | 623,799 | |
Freddie Mac Gold, 30 Year
(United States)
6.00%, 2/1/35 | | | USD | | | | 155,251 | | | | 177,825 | |
Rio Oil Finance Trust (Brazil) | | | | | | | | | | | | |
6.25%, 7/6/24(d) | | | USD | | | | 700,000 | | | | 663,369 | |
6.75%, 1/6/27(d) | | | USD | | | | 475,000 | | | | 453,625 | |
Svenska Handelsbanken AB (Sweden)
6.00%, 9/21/16(b) | | | SEK | | | | 13,000,000 | | | | 1,829,782 | |
| | | | | | | | | | | | |
| | | | | | | | | | | 8,151,030 | |
| CORPORATE: 50.8% | |
FINANCIALS: 17.7% | | | | | | | | | | | | |
Anthem, Inc. (United States) | | | | | | | | | | | | |
7.00%, 2/15/19 | | | USD | | | | 235,000 | | | | 276,908 | |
4.35%, 8/15/20 | | | USD | | | | 275,000 | | | | 297,933 | |
Bank of America Corp. (United States) | | | | | | | | | | | | |
6.125%, 9/15/21 | | | GBP | | | | 300,000 | | | | 566,109 | |
4.25%, 10/22/26 | | | USD | | | | 250,000 | | | | 249,439 | |
6.625%, 5/23/36(c) | | | USD | | | | 325,000 | | | | 393,807 | |
Barclays PLC (United Kingdom)
4.375%, 9/11/24 | | | USD | | | | 800,000 | | | | 772,650 | |
BNP Paribas SA (France)
5.75%, 1/24/22 | | | GBP | | | | 425,000 | | | | 754,937 | |
Boston Properties, Inc. (United States) | | | | | | | | | | | | |
5.625%, 11/15/20 | | | USD | | | | 650,000 | | | | 741,618 | |
4.125%, 5/15/21 | | | USD | | | | 425,000 | | | | 452,380 | |
| | |
| See accompanying Notes to Financial Statements | | DODGE & COX GLOBAL BOND FUND §PAGE 8 |
| | | | |
| PORTFOLIO OF INVESTMENTS | | | December 31, 2014 | |
| | | | | | | | | | | | |
| DEBT SECURITIES (continued) | |
| | | |
| | | | | | PAR VALUE | | | VALUE | |
Citigroup, Inc. (United States) 7.875%, 10/30/40(c) | | | USD | | | | 555,000 | | | $ | 590,076 | |
Equity Residential (United States)
4.75%, 7/15/20 | | | USD | | | | 550,000 | | | | 604,245 | |
General Electric Co. (United States)
4.55%, 1/17/17 | | | CAD | | | | 400,000 | | | | 363,532 | |
Health Net, Inc. (United States) 6.375%, 6/1/17 | | | USD | | | | 550,000 | | | | 594,000 | |
HSBC Holdings PLC (United Kingdom) | | | | | | | | | | | | |
6.50%, 5/2/36 | | | USD | | | | 200,000 | | | | 256,867 | |
6.50%, 9/15/37 | | | USD | | | | 525,000 | | | | 674,565 | |
JPMorgan Chase & Co. (United States)
3.375%, 5/1/23 | | | USD | | | | 625,000 | | | | 618,321 | |
Lloyds Banking Group PLC (United Kingdom)
6.50%, 3/24/20 | | | EUR | | | | 625,000 | | | | 931,622 | |
Navient Corp. (United States) | | | | | | | | | | | | |
6.00%, 1/25/17 | | | USD | | | | 370,000 | | | | 387,575 | |
4.625%, 9/25/17 | | | USD | | | | 243,000 | | | | 246,645 | |
Royal Bank of Scotland Group PLC (United Kingdom) | | | | | | | | | | | | |
6.934%, 4/9/18 | | | EUR | | | | 325,000 | | | | 452,806 | |
5.625%, 8/24/20 | | | USD | | | | 375,000 | | | | 427,012 | |
6.125%, 12/15/22 | | | USD | | | | 325,000 | | | | 353,732 | |
Wells Fargo & Co. (United States)
2.774%, 2/9/17 | | | CAD | | | | 475,000 | | | | 417,230 | |
| | | | | | | | | | | | |
| | | | | | | | | | | 11,424,009 | |
INDUSTRIALS: 30.7% | | | | | | | | | | | | |
Boston Scientific Corp. (United States)
6.00%, 1/15/20 | | | USD | | | | 325,000 | | | | 366,268 | |
Canadian Pacific Railway, Ltd. (Canada)
6.25%, 6/1/18 | | | CAD | | | | 1,050,000 | | | | 1,025,183 | |
Cemex SAB de CV (Mexico)
7.25%, 1/15/21(d) | | | USD | | | | 1,450,000 | | | | 1,518,875 | |
Compagnie de Saint-Gobain SA (France)
3.625%, 3/28/22 | | | EUR | | | | 200,000 | | | | 285,574 | |
Cox Enterprises, Inc. (United States) | | | | | | | | | | | | |
3.25%, 12/15/22(d) | | | USD | | | | 590,000 | | | | 579,285 | |
2.95%, 6/30/23(d) | | | USD | | | | 400,000 | | | | 383,577 | |
Ford Motor Credit Co. LLC(e) (United States)
8.125%, 1/15/20 | | | USD | | | | 725,000 | | | | 898,028 | |
Grupo Televisa SAB (Mexico)
8.50%, 3/11/32 | | | USD | | | | 475,000 | | | | 655,748 | |
HCA Holdings, Inc. (United States)
6.50%, 2/15/16 | | | USD | | | | 700,000 | | | | 730,625 | |
Hewlett-Packard Co. (United States) | | | | | | | | | | | | |
2.65%, 6/1/16 | | | USD | | | | 150,000 | | | | 152,878 | |
2.60%, 9/15/17 | | | USD | | | | 525,000 | | | | 534,894 | |
Imperial Tobacco Group PLC (United Kingdom)
9.00%, 2/17/22 | | | GBP | | | | 600,000 | | | | 1,283,183 | |
| | | | | | | | | | | | |
| | | |
| | | | | | PAR VALUE | | | VALUE | |
Kinder Morgan, Inc. (United States) | | | | | | | | | | | | |
4.30%, 6/1/25 | | | USD | | | | 100,000 | | | $ | 100,336 | |
6.95%, 1/15/38 | | | USD | | | | 450,000 | | | | 519,358 | |
Lafarge SA (France)
5.875%, 7/9/19 | | | EUR | | | | 600,000 | | | | 872,139 | |
Macy’s, Inc. (United States) | | | | | | | | | | | | |
6.70%, 9/15/28 | | | USD | | | | 50,000 | | | | 61,242 | |
6.90%, 4/1/29 | | | USD | | | | 75,000 | | | | 95,466 | |
6.70%, 7/15/34 | | | USD | | | | 425,000 | | | | 543,320 | |
6.375%, 3/15/37 | | | USD | | | | 175,000 | | | | 221,444 | |
Millicom International Cellular SA (Luxembourg)
6.625%, 10/15/21(d) | | | USD | | | | 1,450,000 | | | | 1,508,000 | |
Naspers, Ltd. (South Africa)
6.00%, 7/18/20(d) | | | USD | | | | 875,000 | | | | 955,938 | |
Nokia Oyj (Finland)
6.75%, 2/4/19 | | | EUR | | | | 200,000 | | | | 289,190 | |
Reed Elsevier PLC (United Kingdom) | | | | | | | | | | | | |
8.625%, 1/15/19 | | | USD | | | | 58,000 | | | | 70,942 | |
3.125%, 10/15/22 | | | USD | | | | 444,000 | | | | 439,482 | |
Sprint Corp. (United States)
6.00%, 12/1/16 | | | USD | | | | 575,000 | | | | 601,464 | |
Telecom Italia SPA (Italy) | | | | | | | | | | | | |
6.375%, 6/24/19 | | | GBP | | | | 350,000 | | | | 599,554 | |
7.721%, 6/4/38 | | | USD | | | | 575,000 | | | | 641,125 | |
Time Warner Cable, Inc. (United States) | | | | | | | | | | | | |
8.75%, 2/14/19 | | | USD | | | | 475,000 | | | | 587,980 | |
6.75%, 6/15/39 | | | USD | | | | 250,000 | | | | 326,808 | |
Time Warner, Inc. (United States) | | | | | | | | | | | | |
7.625%, 4/15/31 | | | USD | | | | 350,000 | | | | 487,947 | |
7.70%, 5/1/32 | | | USD | | | | 325,000 | | | | 461,669 | |
Twenty-First Century Fox, Inc. (United States) | | | | | | | | | | | | |
6.15%, 3/1/37 | | | USD | | | | 200,000 | | | | 250,661 | |
6.65%, 11/15/37 | | | USD | | | | 550,000 | | | | 734,393 | |
Verizon Communications, Inc. (United States) | | | | | | | | | | | | |
5.15%, 9/15/23 | | | USD | | | | 325,000 | | | | 358,876 | |
6.55%, 9/15/43 | | | USD | | | | 275,000 | | | | 352,316 | |
Vulcan Materials Co. (United States)
7.50%, 6/15/21 | | | USD | | | | 325,000 | | | | 378,625 | |
| | | | | | | | | | | | |
| | | | | | | | | | | 19,872,393 | |
UTILITIES: 2.4% | |
Dominion Resources, Inc. (United States)
5.75%, 10/1/54 | | | USD | | | | 300,000 | | | | 313,025 | |
Enel SPA (Italy) | | | | | | | | | | | | |
6.80%, 9/15/37(d) | | | USD | | | | 350,000 | | | | 447,492 | |
6.00%, 10/7/39(d) | | | USD | | | | 675,000 | | | | 793,104 | |
| | | | | | | | | | | | |
| | | | | | | | | | | 1,553,621 | |
| | | | | | | | | | | | |
| | | | | | | | | | | 32,850,023 | |
| | | | | | | | | | | | |
TOTAL DEBT SECURITIES
(Cost $64,275,782) | | | | | | | | | | $ | 62,369,646 | |
| | |
| PAGE 9 § DODGE & COX GLOBAL BOND FUND | | See accompanying Notes to Financial Statements |
| | | | |
| PORTFOLIO OF INVESTMENTS | | | December 31, 2014 | |
| | | | | | | | | | | | |
| SHORT-TERM INVESTMENTS: 5.0% | |
| | | |
| | | | | | PAR VALUE | | | VALUE | |
MONEY MARKET FUND: 0.1% | |
SSgA U.S. Treasury Money
Market Fund | | | USD | | | | 64,498 | | | $ | 64,498 | |
|
REPURCHASE AGREEMENT: 4.9% | |
Fixed Income Clearing Corporation(f) 0.01%, dated 12/31/14, due 1/2/15, maturity value $3,177,002 | | | USD | | | | 3,177,000 | | | | 3,177,000 | |
| | | | | | | | | | | | |
TOTAL SHORT-TERM INVESTMENTS
(Cost $3,241,498) | | | $ | 3,241,498 | |
| | | | | | | | | | | | |
TOTAL INVESTMENTS
(Cost $67,517,280) | | | | | | | 101.4 | % | | $ | 65,611,144 | |
OTHER ASSETS LESS LIABILITIES | | | | | | | (1.4 | %) | | | (921,783 | ) |
| | | | | | | | | | | | |
| NET ASSETS | | | | | | | 100.0 | % | | $ | 64,689,361 | |
| | | | | | | | | | | | |
| (c) | Cumulative preferred security |
| (d) | Security exempt from registration under Rule 144A of the Securities Act of 1933. The security may be resold in transactions exempt from registration, normally to qualified institutional buyers. As of December 31, 2014, all such securities in total represented $9,061,190 or 14.0% of total net assets. These securities have been deemed liquid by Dodge & Cox, investment manager, pursuant to procedures approved by the Fund’s Board of Trustees. |
| (e) | Subsidiary (see below) |
| (f) | Repurchase agreement is collateralized by U.S. Treasury Note 1.50%, 10/31/19. Total collateral value is $3,242,794. |
Debt securities are grouped by parent company unless otherwise noted. Actual securities may be issued by the listed parent company or one of its subsidiaries. In determining a parent company’s country designation, the Fund generally references the country of incorporation.
ARM: Adjustable Rate Mortgage
BRL: Brazilian Real
CAD: Canadian Dollar
CLP: Chilean Peso
COP: Columbian Peso
EUR: Euro
GBP: British Pound
GDN: Global Depositary Note
GO: General Obligation
INR: Indian Rupee
KRW: South Korean Won
MXN: Mexican Peso
MYR: Malaysian Ringgit
PLN: Polish Zloty
RB: Revenue Bond
RUB: Russian Ruble
SEK: Swedish Krona
USD: United States Dollar
FUTURES CONTRACTS
| | | | | | | | | | | | | | |
| Description | | Number of
Contracts | | | Expiration
Date | | Notional
Amount | | | Unrealized
Appreciation/
(Depreciation) | |
10 Year U.S. Treasury Note-Short Position | | | 7 | | | Mar 2015 | | $ | (887,578 | ) | | $ | (5,565 | ) |
| | | | |
Long-Term U.S. Treasury Bond-Short Position | | | 27 | | | Mar 2015 | | | (4,460,063 | ) | | | (202,212 | ) |
| | | | | | | | | | | | | | |
| | | | | | | | | | | | $ | (207,777 | ) |
| | | | | | | | | | | | | | |
CENTRALLY CLEARED INTEREST RATE SWAPS
| | | | | | | | | | | | | | | | |
| | | | | | Contract Amount | | | | |
Notional
Amount | | Expiration
Date | | | Fixed
Rate | | | Floating Rate | | | Unrealized
Appreciation/
(Depreciation) | |
Pay Fixed/Receive Floating: | | | | | |
$825,000 | | | 5/6/24 | | | | 2.72 | % | | | USD LIBOR 3-Month | | | $ | (37,217 | ) |
825,000 | | | 8/22/24 | | | | 2.57 | % | | | USD LIBOR 3-Month | | | | (30,128 | ) |
| | | | | | | | | | | | | | | | |
| | | | | | | | | | | | | | $ | (67,345 | ) |
| | | | | | | | | | | | | | | | |
FORWARD CURRENCY CONTRACTS
| | | | | | | | | | | | | | | | |
| | | | | | Contract Amount | | | | |
| Counterparty | | Settlement
Date | | | Receive
U.S.
Dollar | | | Deliver
Foreign
Currency | | | Unrealized
Appreciation/
(Depreciation) | |
Contracts to sell RUB: | | | | | |
Barclays | | | 4/8/15 | | | | 269,795 | | | | 11,500,000 | | | $ | 89,582 | |
| | | | |
| Counterparty | | Settlement
Date | | | Deliver
U.S.
Dollar | | | Receive
Foreign
Currency | | | Unrealized
Appreciation/
(Depreciation) | |
Contracts to buy INR: | |
Barclays | | | 4/8/15 | | | | 459,297 | | | | 29,000,000 | | | $ | (8,820 | ) |
Barclays | | | 4/8/15 | | | | 159,413 | | | | 10,000,000 | | | | (4,076 | ) |
Contracts to buy RUB: | |
Barclays | | | 4/8/15 | | | | 119,990 | | | | 5,000,000 | | | | (41,637 | ) |
Barclays | | | 4/8/15 | | | | 154,017 | | | | 6,500,000 | | | | (52,158 | ) |
| | | | | | | | | | | | | | | | |
| | | | | | | | | | | | | | $ | (17,109 | ) |
| | | | | | | | | | | | | | | | |
| | |
| See accompanying Notes to Financial Statements | | DODGE & COX GLOBAL BOND FUND §PAGE 10 |
| | | | |
STATEMENT OF ASSETS AND LIABILITIES | |
| | | December 31, 2014 | |
ASSETS: | | | | |
Investments, at value (cost $67,517,280) | | $ | 65,611,144 | |
Cash held at broker | | | 132,552 | |
Unrealized appreciation on forward currency contracts | | | 89,582 | |
Receivable for Fund shares sold | | | 131,051 | |
Dividends and interest receivable | | | 962,368 | |
Prepaid expenses and other assets | | | 19,011 | |
| | | | |
| | | 66,945,708 | |
| | | | |
LIABILITIES: | | | | |
Payable for investments purchased | | | 1,841,222 | |
Unrealized depreciation on forward currency contracts | | | 106,691 | |
Payable for Fund shares redeemed | | | 174,747 | |
Payable to broker for variation margin | | | 13,392 | |
Expense reimbursement received in advance | | | 49,174 | |
Accrued expenses | | | 71,121 | |
| | | | |
| | | 2,256,347 | |
| | | | |
NET ASSETS | | $ | 64,689,361 | |
| | | | |
NET ASSETS CONSIST OF: | | | | |
Paid in capital | | $ | 67,155,237 | |
Undistributed net investment income | | | (66,238 | ) |
Accumulated net realized loss | | | (177,008 | ) |
Net unrealized depreciation | | | (2,222,630 | ) |
| | | | |
| | | 64,689,361 | |
| | | | |
Fund shares outstanding (par value $0.01 each, unlimited shares authorized) | | | 6,272,242 | |
Net asset value per share | | $ | 10.31 | |
| |
STATEMENT OF OPERATIONS | | | | |
| | | Period Ended
December 31, 2014* | |
INVESTMENT INCOME: | | | | |
Dividends | | $ | 16,833 | |
Interest (net of foreign taxes of $3,898) | | | 887,889 | |
| | | | |
| | | 904,722 | |
| | | | |
EXPENSES: | | | | |
Management fees | | | 131,751 | |
Custody and fund accounting fees | | | 32,471 | |
Transfer agent fees | | | 8,088 | |
Professional services | | | 146,008 | |
Shareholder reports | | | 28,461 | |
Registration fees | | | 62,201 | |
Trustees’ fees | | | 158,910 | |
Miscellaneous | | | 7,010 | |
| | | | |
Total expenses | | | 574,900 | |
Expenses reimbursed by investment manager | | | (416,741 | ) |
| | | | |
Net expenses | | | 158,159 | |
| | | | |
NET INVESTMENT INCOME | | | 746,563 | |
| | | | |
| |
REALIZED AND UNREALIZED LOSS: | | | | |
Net realized loss | | | | |
Investments | | | (107,071 | ) |
Treasury futures contracts | | | (166,230 | ) |
Interest rate swaps | | | (9,744 | ) |
Forward currency contracts | | | (43,767 | ) |
Foreign currency transactions | | | (12,217 | ) |
Net change in unrealized appreciation/depreciation | | | | |
Investments | | | (1,906,136 | ) |
Treasury futures contracts | | | (207,777 | ) |
Interest rate swaps | | | (67,345 | ) |
Forward currency contracts | | | (17,109 | ) |
Foreign currency translation | | | (24,263 | ) |
| | | | |
Net realized and unrealized loss | | | (2,561,659 | ) |
| | | | |
NET DECREASE IN NET ASSETS
FROM OPERATIONS | | $ | (1,815,096 | ) |
| | | | |
| | | | |
STATEMENT OF CHANGES IN NET ASSETS | |
| | | Period Ended
December 31, 2014* | |
OPERATIONS: | | | | |
Net investment income | | $ | 746,563 | |
Net realized gain | | | (339,029 | ) |
Net change in unrealized appreciation/depreciation | | | (2,222,630 | ) |
| | | | |
| | | (1,815,096 | ) |
| | | | |
| |
DISTRIBUTIONS TO SHAREHOLDERS FROM: | | | | |
Net investment income | | | (650,780 | ) |
Net realized gain | | | — | |
| | | | |
Total distributions | | | (650,780 | ) |
| | | | |
| |
FUND SHARE TRANSACTIONS: | | | | |
Proceeds from sale of shares | | | 75,231,468 | |
Reinvestment of distributions | | | 582,706 | |
Cost of shares redeemed | | | (8,658,937 | ) |
| | | | |
Net increase from Fund
share transactions | | | 67,155,237 | |
| | | | |
Total increase in net assets | | | 64,689,361 | |
| |
NET ASSETS: | | | | |
Beginning of period | | | — | |
| | | | |
End of period (including undistributed
net investment income of $(66,238)) | | $ | 64,689,361 | |
| | | | |
| |
SHARE INFORMATION: | | | | |
Shares sold | | | 7,034,774 | |
Distributions reinvested | | | 55,846 | |
Shares redeemed | | | (818,378 | ) |
| | | | |
Net increase in shares outstanding | | | 6,272,242 | |
| | | | |
| * | Period from May 1, 2014 (commencement of operations) to December 31, 2014 |
| | |
| PAGE 11 § DODGE & COX GLOBAL BOND FUND | | See accompanying Notes to Financial Statements |
NOTES TO FINANCIAL STATEMENTS
NOTE 1—ORGANIZATION AND SIGNIFICANT ACCOUNTING POLICIES
Dodge & Cox Global Bond Fund (the “Fund”) is one of the series constituting the Dodge & Cox Funds (the “Trust” or the “Funds”). The Trust is organized as a Delaware statutory trust and is registered under the Investment Company Act of 1940, as amended, as an open-end management investment company. The Fund1 seeks a high rate of total return consistent with long-term preservation of capital. Foreign investing, especially in developing countries, has special risks such as currency and market volatility and political and social instability. These and other risk considerations are discussed in the Fund’s Prospectus.
The financial statements have been prepared in conformity with accounting principles generally accepted in the United States of America, which require the use of estimates and assumptions by management. Actual results may differ from those estimates. Significant accounting policies are as follows:
Security valuation The Fund’s net assets are valued as of the close of trading on the New York Stock Exchange (NYSE), generally 4:00 p.m. Eastern Time, each day that the NYSE is open for business. Debt securities are valued based on prices received from independent pricing services which utilize both dealer-supplied valuations and pricing models. Pricing models may consider quoted prices for similar securities, interest rates, prepayment speeds, and credit risk. Exchange-traded derivatives are valued at the settlement price determined by the relevant exchange. Interest rate swaps are valued daily based on prices received from independent pricing services, which represent the net present value of all future cash settlement amounts based on implied forward
| 1 | | The Fund’s predecessor, Dodge & Cox Global Bond Fund, L.L.C. (the “Private Fund”), was organized on August 31, 2012 and commenced operations on December 5, 2012 as a private investment fund that reorganized into, and had the same investment manager as, the Fund. The Fund commenced operations on May 1, 2014, upon the transfer of assets from the Private Fund. This transaction was accomplished through a transfer of Private Fund net assets valued at $10,725,688 in exchange for 1,000,000 shares of the Fund. Immediately after the transfer, the shares of the Fund were distributed to the sole owner of the Private Fund and the investment manager of the Fund, Dodge & Cox, which became the initial shareholder of the Fund. |
interest rates. Other financial instruments for which market quotes are readily available are valued at market value. Security values are not discounted based on the size of the Fund’s position. Securities for which market quotations are not readily available are valued at fair value as determined in good faith by or under the direction of the Board of Trustees. Short-term securities less than 60 days to maturity may be valued at amortized cost if amortized cost approximates current value.
Investments initially valued in currencies other than the U.S. dollar are converted to the U.S. dollar using prevailing exchange rates. As a result, the Fund’s net assets may be affected by changes in the value of currencies in relation to the U.S. dollar.
The Board of Trustees has delegated authority to Dodge & Cox, the Fund’s investment manager, to make fair value determinations in accordance with the Dodge & Cox Funds Valuation Policies (“Valuation Policies”), subject to Board oversight. Dodge & Cox has established a Pricing Committee that is comprised of representatives from Treasury, Legal, Compliance, and Operations. The Pricing Committee is responsible for implementing the Valuation Policies, including determining the fair value of securities when market quotations or market-based valuations are not readily available or are deemed unreliable. The Pricing Committee considers relevant indications of value that are reasonably available to it in determining the fair value assigned to a particular security, such as the value of similar financial instruments, trading volumes, contractual restrictions on disposition, related corporate actions, and changes in economic conditions.
Valuing securities at fair value involves greater reliance on judgment than valuation of securities based on readily available market quotations. In some instances, lack of information and uncertainty as to the significance of information may lead to a conclusion that a prior valuation is the best indication of a security’s present value. When fair value pricing is employed, the prices of securities used by the Fund to calculate its net asset value may differ from quoted or published prices for the same securities.
DODGE & COX GLOBAL BOND FUND §PAGE 12
NOTES TO FINANCIAL STATEMENTS
Security transactions, investment income, expenses, and distributions Security transactions are recorded on the trade date. Realized gains and losses on securities sold are determined on the basis of identified cost.
Interest income is recorded on the accrual basis. Interest income includes coupon interest, amortization of premium and accretion of discount on debt securities, gain/loss on paydowns, and inflation adjustments to the principal amount of inflation-indexed securities. The ability of the issuers of the debt securities held by the Fund to meet their obligations may be affected by economic developments in a specific industry, state, region, or country. Debt obligations may be placed on non-accrual status and related interest income may be reduced by ceasing current accruals and writing off interest receivables when the collection of all or a portion of interest has become doubtful. A debt obligation is removed from non-accrual status when the issuer resumes interest payments or when collectability of interest is reasonably assured. Dividend income is recorded on the ex-dividend date.
Expenses are recorded on the accrual basis. Most expenses of the Trust can be directly attributed to a specific series. Expenses which cannot be directly attributed are allocated among the Funds in the Trust based on relative net assets or other expense methodologies determined by the nature of the expense.
Distributions to shareholders are recorded on the ex-dividend date.
Foreign taxes The Fund is subject to foreign taxes which may be imposed by certain countries in which the Fund invests. The Fund endeavors to record foreign taxes based on applicable foreign tax law. Withholding taxes are incurred on certain foreign receipts and are accrued at the time the associated interest income is recorded.
Capital gains taxes are incurred upon disposition of certain foreign securities. Capital gains taxes on appreciated securities are accrued as unrealized losses and are reflected as realized losses upon the sale of the related security.
Repurchase agreements The Fund enters into repurchase agreements, secured by U.S. government or agency securities, which involve the purchase of securities from a counterparty with a simultaneous commitment to resell the securities at an agreed-upon date and price. It is
the Fund’s policy that its custodian take possession of the underlying collateral securities, the fair value of which exceeds the principal amount of the repurchase transaction, including accrued interest, at all times. In the event of default by the counterparty, the Fund has the contractual right to liquidate the securities and to apply the proceeds in satisfaction of the obligation.
Futures Contracts Futures contracts involve an obligation to purchase or sell (depending on whether the Fund has entered a long or short futures contract, respectively) an asset at a future date, at a price set at the time of the contract. Upon entering into a futures contract, the Fund is required to deposit an amount of cash or liquid assets (referred to as initial margin) in a segregated account with the clearing broker. Subsequent payments (referred to as variation margin) to and from the clearing broker are made on a daily basis based on changes in the market value of the contracts. Futures contracts are traded publicly and their market value changes daily. Changes in the market value of open futures contracts are recorded as unrealized appreciation or depreciation in the Statement of Operations. Realized gains and losses on futures contracts are recorded in the Statement of Operations at the closing or expiration of futures contracts. Cash deposited with a broker as initial margin is recorded on the Statement of Assets and Liabilities. A receivable and/or payable to brokers for daily variation margin is also recorded on the Statement of Assets and Liabilities.
Investments in futures contracts may include certain risks, which may be different from, and potentially greater than, those of the underlying securities. To the extent the Fund uses futures, it is exposed to additional volatility and potential losses resulting from leverage.
The Fund has entered into short Treasury futures contracts to assist with the management of the portfolio’s interest rate exposure. During the eight months ended December 31, 2014, these Treasury futures contracts had notional values ranging from 0% to 9% of net assets.
Interest rate swaps Interest rate swaps are agreements that obligate two parties to exchange a series of cash flows at specified payment dates calculated by reference to specified interest rates, such as an exchange of floating rate payments for fixed rate payments. Upon entering into a centrally cleared interest rate swap, the
PAGE 13 § DODGE & COX GLOBAL BOND FUND
NOTES TO FINANCIAL STATEMENTS
Fund is required to post an amount of cash or liquid assets (referred to as initial margin) in a segregated account with the clearing broker. Subsequent payments (referred to as variation margin) to and from the clearing broker are made on a daily basis based on changes in the market value of interest rate swaps. Changes in the market value on open interest rate swap contracts are recorded as unrealized appreciation or depreciation in the Statement of Operations. Realized gains and losses on interest rate swaps are recorded in the Statement of Operations, both upon the exchange of cash flows on each specified payment date and upon the closing or expiration of the swap. Cash deposited with the clearing broker as initial margin is recorded on the Statement of Assets and Liabilities. A receivable and/or payable to brokers for daily variation margin is also recorded on the Statement of Assets and Liabilities.
Investments in interest rate swaps may include certain risks including unfavorable changes in interest rates, or a default or failure by the clearing broker or clearinghouse.
The Fund entered into interest rate swaps in connection with the management of the interest rate exposure of its portfolio. During the eight months ended December 31, 2014, the Fund invested in interest rate swaps with U.S. dollar notional values ranging from 0% to 6% of net assets.
Forward currency contracts A forward currency contract represents an obligation to purchase or sell a specific foreign currency at a future date at a price set at the time of the contract. Losses from these transactions may arise from unfavorable changes in currency values or if the counterparties do not perform under a contract’s terms.
The values of the forward currency contracts are adjusted daily based on the applicable exchange rate of the underlying currency. Changes in the value of open contracts are recorded as unrealized appreciation or depreciation in the Statement of Operations. When the forward currency contract is closed, the Fund records a realized gain or loss in the Statement of Operations equal to the difference between the value at the time the contract was opened and the value at the time it was closed.
The Fund entered into forward currency contracts to increase its portfolio exposure to the South Korean won, Russian ruble, and Indian rupee. During the eight months ended December 31, 2014, the Fund’s South Korean won
forward currency contracts had U.S. dollar total values of 2% of net assets and were subsequently closed, and its Russian ruble and Indian rupee forward currency contracts had U.S. dollar total values of less than 1% of net assets.
Foreign currency translation The books and records of the Fund are maintained in U.S. dollars. Foreign currency amounts are translated into U.S. dollars at the prevailing exchange rates of such currencies against the U.S. dollar. The market value of investment securities and other assets and liabilities are translated at the exchange rate as of the valuation date. Purchases and sales of investment securities, income, and expenses are translated at the exchange rate prevailing on the transaction date.
Reported realized and unrealized gain (loss) on investments includes foreign currency gain (loss) related to investment transactions.
Reported realized and unrealized gain (loss) on foreign currency transactions and translation include the following: holding/disposing of foreign currency, the difference between the trade and settlement dates on securities transactions, the difference between the accrual and payment dates on interest, and currency losses on the purchase of foreign currency in certain countries that impose taxes on such transactions.
Indemnification Under the Trust’s organizational documents, its officers and trustees are indemnified against certain liabilities arising out of the performance of their duties to the Trust. In addition, in the normal course of business the Trust enters into contracts that provide general indemnities to other parties. The Trust’s maximum exposure under these arrangements is unknown as this would involve future claims that may be made against the Trust that have not yet occurred.
DODGE & COX GLOBAL BOND FUND §PAGE 14
NOTES TO FINANCIAL STATEMENTS
NOTE 2—VALUATION MEASUREMENTS
Various inputs are used in determining the value of the Fund’s investments. These inputs are summarized in the three broad levels listed below.
| § | | Level 1: Quoted prices in active markets for identical securities |
| § | | Level 2: Other significant observable inputs (including quoted prices for similar securities, market indices, interest rates, credit risk, etc.) |
| § | | Level 3: Significant unobservable inputs (including Fund management’s assumptions in determining the fair value of investments) |
The inputs or methodology used for valuing securities are not necessarily an indication of the risk associated with investing in those securities.
The following is a summary of the inputs used to value the Fund’s holdings at December 31, 2014:
| | | | | | | | |
| Classification(a) | | LEVEL 1
(Quoted Prices) | | | LEVEL 2
(Other Significant
Observable Inputs) | |
Securities | | | | | | | | |
Debt Securities | | | | | | | | |
Government | | $ | 2,145,120 | | | $ | 13,953,345 | |
Government-Related | | | — | | | | 5,270,128 | |
Securitized | | | — | | | | 8,151,030 | |
Corporate | | | — | | | | 32,850,023 | |
Short-term Investments | | | | | | | | |
Money Market Fund | | | 64,498 | | | | — | |
Repurchase Agreement | | | — | | | | 3,177,000 | |
| | | | | | | | |
Total Securities | | $ | 2,209,618 | | | $ | 63,401,526 | |
| | | | | | | | |
Other Financial Instruments | | | | | | | | |
Treasury Futures Contracts | | $ | (207,777 | )(b) | | $ | — | |
Interest Rate Swaps | | | — | | | | (67,345 | )(b) |
Forward Currency Contracts | | | — | | | | (17,109 | )(b) |
| | | | | | | | |
Total Other Financial Instruments | | $ | (207,777 | ) | | $ | (84,454 | ) |
| | | | | | | | |
| | | | | | | | | |
| (a) | There were no transfers between Level 1 and Level 2 during the eight months ended December 31, 2014. There were no Level 3 securities at December 31, 2014, and there were no transfers to Level 3 during the period. |
| (b) | Represents net unrealized appreciation/(depreciation). |
NOTE 3—ADDITIONAL DERIVATIVES INFORMATION
The Fund has entered into over-the-counter derivatives, such as foreign exchange forwards (each, a “Derivative”). Each Derivative is subject to a negotiated master
agreement (based on a form published by the International Swaps and Derivatives Association (“ISDA”)) governing all Derivatives between the Fund and the relevant dealer counterparty. The master agreements specify (i) events of default and other events permitting a party to terminate some or all of the Derivatives thereunder and (ii) the process by which those Derivatives will be valued for purposes of determining termination payments. If some or all of the Derivatives under a master agreement are terminated because of an event of default or similar event, the values of all terminated Derivatives must be netted to determine a single payment owed by one party to the other. Some master agreements contain collateral terms requiring the parties to post collateral in respect of some or all of the Derivatives thereunder based on the net market value of those Derivatives, subject to a minimum exposure threshold. To the extent amounts owed to the Fund by its counterparties are not collateralized, the Fund is at risk of those counterparties’ non-performance. The Fund attempts to mitigate counterparty credit risk by entering into Derivatives only with counterparties it believes to be of good credit quality and by monitoring the financial stability of those counterparties.
For financial reporting purposes, the Fund does not offset financial assets and liabilities that are subject to an ISDA Master Agreement in the Statement of Assets and Liabilities. The net amount for Derivatives is disclosed on the Portfolio of Investments. At December 31, 2014, no collateral is pledged or held by the Fund for Derivatives.
NOTE 4—RELATED PARTY TRANSACTIONS
Management fees Under a written agreement approved by a unanimous vote of the Board of Trustees, the Fund pays an annual management fee of 0.50% of the Fund’s average daily net assets to Dodge & Cox, investment manager of the Fund. Dodge & Cox has contractually agreed to reimburse the Fund to the extent that such fee plus all other ordinary operating expenses of the Fund exceed 0.60% of the average daily net assets for the fiscal periods ending December 31, 2014 and 2015.
Fund officers and trustees All officers and two of the trustees of the Trust are officers or employees of Dodge & Cox. The Trust pays a fee only to those trustees who are not affiliated with Dodge & Cox.
Share ownership At December 31, 2014, Dodge & Cox owned 16% of the Fund’s outstanding shares.
PAGE 15 § DODGE & COX GLOBAL BOND FUND
NOTES TO FINANCIAL STATEMENTS
NOTE 5—INCOME TAX INFORMATION AND DISTRIBUTIONS TO SHAREHOLDERS
A provision for federal income taxes is not required since the Fund intends to continue to qualify as a regulated investment company under Subchapter M of the Internal Revenue Code and distribute all of its taxable income to shareholders. Distributions are determined in accordance with income tax regulations, and such amounts may differ from net investment income and realized gains for financial reporting purposes. Financial reporting records are adjusted for permanent book/tax differences at year end to reflect tax character.
Book/tax differences are primarily due to differing treatments of wash sales, net short-term realized gain (loss), foreign capital gain taxes, foreign currency realized gain (loss), Treasury futures contracts, and interest rate swaps. At December 31, 2014, the cost of investments for federal income tax purposes was $67,517,280.
Distributions during the period noted below were characterized as follows for federal income tax purposes:
| | | | | | |
| | | | | Eight Months Ended December 31, 2014 | |
Ordinary income | | | | | $650,780 | |
| | | | | ($0.144 per share) | |
Long-term capital gain | | | | | — | |
At December 31, 2014, the tax basis components of distributable earnings were as follows:
| | | | |
Unrealized appreciation | | $ | 285,782 | |
Unrealized depreciation | | | (2,191,918 | ) |
| | | | |
Net unrealized depreciation | | | (1,906,136 | ) |
Undistributed ordinary income | | | 13,351 | |
Capital loss carryforward(a) | | | (401,894 | ) |
Deferred loss(b) | | | (79,589 | ) |
| (a) | Represents accumulated capital loss as of December 31, 2014, which may be carried forward to offset future capital gains. |
| | | | |
No expiration | | | | |
Short-term | | $ | 140,964 | |
Long-term | | | 260,930 | |
| | | | |
| | $ | 401,894 | |
| | | | |
| (b) | Represents net realized loss on foreign currency incurred between November 1, 2014 and December 31, 2014. As permitted by tax regulations, the Fund has elected to treat this loss as arising in 2015. |
Fund management has reviewed the tax positions for the open period applicable to the Fund, and has determined that no provision for income tax is required in the Fund’s financial statements.
NOTE 6—LOAN FACILITIES
Pursuant to an exemptive order issued by the Securities and Exchange Commission (SEC), the Fund may participate in an interfund lending facility (Facility). The Facility allows the Fund to borrow money from or loan money to the Funds. Loans under the Facility are made for temporary or emergency purposes, such as to fund shareholder redemption requests. Interest on borrowings is the average of the current repurchase agreement rate and the bank loan rate. There was no activity in the Facility during the period.
All Funds in the Trust participate in a $500 million committed credit facility (Line of Credit) with State Street Bank and Trust Company, to be utilized for temporary or emergency purposes to fund shareholder redemptions or for other short-term liquidity purposes. The maximum amount available to the Fund is $250 million. Each Fund pays an annual commitment fee on its pro-rata portion of the Line of Credit. The Fund’s commitment fee for the eight months ended December 31, 2014, amounted to $54 and is reflected as a Miscellaneous Expense in the Statement of Operations. Interest on borrowings is charged at the prevailing rate. There were no borrowings on the Line of Credit during the period.
NOTE 7—PURCHASES AND SALES OF INVESTMENTS
For the eight months ended December 31, 2014, purchases and sales of securities, other than short-term securities and U.S. government securities, aggregated $55,877,442 and $7,005,740, respectively. For the eight months ended December 31, 2014, purchases and sales of U.S. government securities aggregated $10,773,637 and $6,317,808, respectively. Transfers from the Private Fund to the Fund on May 1, 2014 of securities other than short-term securities and U.S. government securities
DODGE & COX GLOBAL BOND FUND §PAGE 16
NOTES TO FINANCIAL STATEMENTS
aggregated $9,014,763, and transfers of U.S. government securities aggregated $1,106,169.
NOTE 8—ACCOUNTING PRONOUNCEMENTS
In June 2014, the Financial Accounting Standards Board issued Accounting Standards Update (ASU) No. 2014-11, Transfers and Servicing (Topic 860), Repurchase-to-Maturity Transactions, Repurchase Financings, and Disclosures. The ASU changes the accounting for certain repurchase agreements and expands disclosure requirements
related to repurchase agreements and similar transactions. Management is currently evaluating the impact, if any, of applying this ASU effective January 1, 2015.
NOTE 9—SUBSEQUENT EVENTS
Fund management has determined that no material events or transactions occurred subsequent to December 31, 2014, and through the date of the Fund’s financial statements issuance, which require additional disclosure in the Fund’s financial statements.
FINANCIAL HIGHLIGHTS
| | | | |
SELECTED DATA AND RATIOS (for a share outstanding throughout the period) | | Period from May 1, 2014 (commencement of operations) to December 31, 2014 | |
Net asset value, beginning of period | | | $10.73 | |
Income from investment operations: | | | | |
Net investment income | | | 0.16 | |
Net realized and unrealized loss | | | (0.44 | ) |
| | | | |
Total from investment operations | | | (0.28 | ) |
| | | | |
Distributions to shareholders from: | | | | |
Net investment income | | | (0.14 | ) |
Net realized gain | | | — | |
| | | | |
Total distributions | | | (0.14 | ) |
| | | | |
Net asset value, end of period | | | $10.31 | |
| | | | |
Total return | | | (2.59 | )% |
Ratios/supplemental data: | | | | |
Net assets, end of period (millions) | | | $65 | |
Ratio of expenses to average net assets | | | 0.60 | %(a) |
Ratio of expenses to average net assets, before reimbursement by investment manager | | | 2.18 | %(a) |
Ratio of net investment income to average net assets | | | 2.83 | %(a) |
Portfolio turnover rate | | | 36 | % |
See accompanying Notes to Financial Statements
PAGE 17 § DODGE & COX GLOBAL BOND FUND
REPORT OF INDEPENDENT REGISTERED PUBLIC ACCOUNTING FIRM
To the Trustees of Dodge & Cox Funds and Shareholders of Dodge & Cox Global Bond Fund
In our opinion, the accompanying statement of assets and liabilities, including the portfolio of investments, and the related statements of operations and of changes in net assets and the financial highlights present fairly, in all material respects, the financial position of Dodge & Cox Global Bond Fund (the “Fund”, one of the series constituting Dodge & Cox Funds) at December 31, 2014, the results of its operations, the changes in its net assets, and financial highlights for the period from May 1, 2014 (commencement of operations) to December 31, 2014, in conformity with accounting principles generally accepted in the United States of America. These financial statements and financial highlights (hereafter referred to as financial statements) are the responsibility of the Fund’s management. Our responsibility is to express an opinion on these financial statements based on our audit. We conducted our audit of these financial statements in accordance with the standards of the Public Company Accounting Oversight Board (United States). Those standards require that we plan and perform the audit to obtain reasonable assurance about whether the financial statements are free of material misstatement. An audit includes examining, on a test basis, evidence supporting the amounts and disclosures in the financial statements, assessing the accounting principles used and significant estimates made by management, and evaluating the overall financial statement presentation. We believe that our audit, which included confirmation of securities at December 31, 2014, by correspondence with the custodian and brokers, provide a reasonable basis for our opinion.
PricewaterhouseCoopers LLP
San Francisco, California
February 17, 2015
FUND HOLDINGS
The Fund provides a complete list of its holdings four times each fiscal year, as of the end of each quarter. The Fund files the lists with the Securities and Exchange Commission (SEC) on Form N-CSR (second and fourth quarters) and Form N-Q (first and third quarters). Shareholders may view the Fund’s Forms N-CSR and N-Q on the SEC’s website at www.sec.gov. Forms N-CSR and N-Q may also be reviewed and copied at the SEC’s Public Reference Room in Washington, DC. Information regarding the operations of the Public Reference Room may be obtained by calling 202-942-8090 (direct) or 800-732-0330 (general SEC number). A list of the Fund’s quarter-end holdings is also available at www.dodgeandcox.com on or about 15 days following each quarter end and remains available on the web site until the list is updated in the subsequent quarter.
PROXY VOTING
For a free copy of the Fund’s proxy voting policies and procedures, please call 800-621-3979, visit the Fund’s website at www.dodgeandcox.com, or visit the SEC’s website at www.sec.gov. Information regarding how the Fund voted proxies relating to portfolio securities during the most recent 2-month period ending June 30 is also available at www.dodgeandcox.com or at www.sec.gov.
HOUSEHOLD MAILINGS
The Fund routinely mails shareholder reports and summary prospectuses to shareholders and, on occasion, proxy statements. In order to reduce the volume of mail, when possible, only one copy of these documents will be sent to shareholders who are part of the same family and share the same residential address.
If you have a direct account with the Funds and you do not want the mailing of shareholder reports and summary prospectuses combined with other members in your household, contact the Funds at 800-621-3979. Your request will be implemented within 30 days.
DODGE & COX GLOBAL BOND FUND §PAGE 18
DODGE & COX FUNDS—EXECUTIVE OFFICER & TRUSTEE INFORMATION
| | | | | | |
Name (Age) and
Address* | | Position with Trust (Year of Election or
Appointment) | | Principal Occupation During Past 5 Years | | Other Directorships Held by Trustees |
| INTERESTED TRUSTEES AND OFFICERS |
| Charles F. Pohl (56) | | Chairman and Trustee (Officer since 2004) | | Chairman (since 2013), Co-President (2011-2013), Senior Vice President (until 2011), and Director of Dodge & Cox; Chief Investment Officer, Portfolio Manager, Investment Analyst, and member of Investment Policy Committee (IPC), Global Stock Investment Policy Committee (GSIPC), International Investment Policy Committee (IIPC), and Fixed Income Investment Policy Committee (FIIPC) | | — |
| Dana M. Emery (53) | | President and Trustee (Trustee since 1993) | | Chief Executive Officer (since 2013), President (since 2011), Executive Vice President (until 2011), and Director of Dodge & Cox; Director of Fixed Income, Portfolio Manager, and member of FIIPC and Global Bond Investment Policy Committee (GBIPC) | | — |
| John A. Gunn (71) | | Senior Vice President (Officer since 1998) | | Chairman Emeritus (2011-2013), Chairman (until 2011), Chief Executive Officer (until 2010), and Director of Dodge & Cox; Portfolio Manager and member of IPC, GSIPC (until 2014), and IIPC | | — |
| Diana S. Strandberg (55) | | Senior Vice President (Officer since 2006) | | Senior Vice President (since 2011), Vice President (until 2011), and Director (since 2011) of Dodge & Cox; Director of International Equity (since 2009), Portfolio Manager, Investment Analyst, and member of IPC, GSIPC, IIPC, and GBIPC | | — |
| David H. Longhurst (57) | | Treasurer (Officer since 2006) | | Vice President and Assistant Treasurer of Dodge & Cox | | — |
| Thomas M. Mistele (61) | | Secretary (Officer since 1998) | | Chief Operating Officer, Director, Secretary, Senior Counsel (since 2011), and General Counsel (until 2011) of Dodge & Cox | | — |
| Katherine M. Primas (40) | | Chief Compliance Officer (Officer since 2009) | | Vice President (since 2011) and Chief Compliance Officer of Dodge & Cox | | — |
| INDEPENDENT TRUSTEES |
| Thomas A. Larsen (65) | | Trustee (Since 2002) | | Senior Counsel of Arnold & Porter LLP (law firm) (since 2013); Partner of Arnold & Porter LLP (since 2012); Director of Howard, Rice, Nemerovski, Canady, Falk & Rabkin (1977-2011) | | — |
| Ann Mather (54) | | Trustee (Since 2011) | | CFO, Pixar Animation Studios (1999-2004) | | Director, Google, Inc. (internet information services) (since 2005); Director, Glu Mobile, Inc. (multimedia software) (since 2005); Director, Arista Networks (since 2013); Director, Netflix, Inc. (video services) (since 2010); Director, Shutterfly, Inc. (internet photography services/publishing) (since 2013) |
| Robert B. Morris III (62) | | Trustee (Since 2011) | | Advisory Director, The Presidio Group (since 2005) | | — |
| Gary Roughead (63) | | Trustee (Since 2013) | | Annenberg Distinguished Visiting Fellow, Hoover Institution (since 2011); Admiral, United States Navy (Ret.); U.S. Navy Chief of Naval Operations (2007-2011) | | Director, Northrop Grumman Corp. (global security) (since 2012) |
| Mark E. Smith (63) | | Trustee (Since 2014) | | Executive Vice President, Managing Director—Fixed Income at Loomis Sayles & Company, L.P. (2003-2011) | | — |
| John B. Taylor (68) | | Trustee (Since 2005) (and 1995-2001) | | Professor of Economics, Stanford University; Senior Fellow, Hoover Institution; Under Secretary for International Affairs, United States Treasury (2001-2005) | | — |
| * | | The address for each Officer and Trustee is 555 California Street, 40th Floor, San Francisco, California 94104. Each Officer and Trustee oversees all six series in the Dodge & Cox Funds complex and serves for an indefinite term. |
Additional information about the Trust’s Trustees and Officers is available in the Trust’s Statement of Additional Information (SAI). You can get a free copy of the SAI by visiting the Funds’ website at www.dodgeandcox.com or calling
800-621-3979.
PAGE 19 § DODGE & COX GLOBAL BOND FUND
ITEM 2. CODE OF ETHICS.
A code of ethics, as defined in Item 2 of Form N-CSR, adopted by the registrant and applicable to the registrant’s principal executive officer and principal financial officer was in effect during the entire period covered by this report. A copy of the code of ethics as revised May 1, 2014 is filed as an exhibit to this Form N-CSR. No substantive amendments were approved or waivers were granted to this code of ethics during the period covered by this report.
ITEM 3. AUDIT COMMITTEE FINANCIAL EXPERT.
The Board of Trustees of the registrant has determined that Ann Mather and Robert B. Morris III, members of the registrant’s Audit and Compliance Committee, are each an “audit committee financial expert” and are “independent”, as defined in Item 3 of Form N-CSR.
ITEM 4. PRINCIPAL ACCOUNTANT FEES AND SERVICES.
(a) – (d) Aggregate fees billed to the registrant for the fiscal years ended December 31, 2014 and December 31, 2013 for professional services rendered by the registrant’s principal accountant were as follows:
| | | | | | | | |
| | | 2014 | | | 2013 | |
(a) Audit Fees | | $ | 317,000 | | | $ | 264,000 | |
(b) Audit-Related Fees | | | — | | | | — | |
(c) Tax Fees | | | 333,800 | | | | 165,000 | |
(d) All Other Fees | | | — | | | | — | |
Audit fees include amounts related to the audit of the registrant’s annual financial statements and services normally provided by the accountant in connection with statutory and regulatory filings. Tax fees include amounts related to tax advice and tax return preparation, compliance, and reviews.
(e) (1) The registrant’s Audit and Compliance Committee has adopted policies and procedures (“Policies”) which require the registrant’s Audit and Compliance Committee to pre-approve all audit and non-audit services provided by the principal accountant to the registrant. The policies also require the Audit and Compliance Committee to pre-approve any engagement of the principal accountant to provide non-audit services to the registrant’s investment adviser, if the services directly impact the registrant’s operations and financial reporting. The Policies do not apply in the case of audit services that the principal accountant provides to the registrant’s adviser. If a service (other than the engagement of the principal accountant to audit the registrant’s financial statements) is required to be pre-approved under the Policies between regularly scheduled Audit and Compliance Committee meetings, pre-approval may be authorized by a designated Audit and Compliance Committee member with ratification at the next scheduled Audit and Compliance Committee meeting.
(e) (2) No services included in (b) - (d) above were approved pursuant to paragraph (c)(7)(i)(C) of Rule 2-01 of Regulation S-X.
(f) Less than 50% of the hours expended on the principal accountant’s engagement to audit the registrant’s financial statements for the most recent fiscal year were attributed to work performed by persons other than the principal accountant’s full-time, permanent employees.
(g) For the fiscal years ended December 31, 2014 and December 31, 2013, the aggregate fees billed by the registrant’s principal accountant for non-audit services rendered to the registrant, for non-audit services rendered to the registrant’s investment adviser, and for non-audit services rendered to entities controlled by the adviser were $723,600 and $549,000, respectively.
(h) All non-audit services described under (g) above that were not pre-approved by the registrant’s Audit and Compliance Committee were considered by the registrant’s Audit and Compliance Committee and found to be compatible with maintaining the principal accountant’s independence.
ITEM 5. AUDIT COMMITTEE OF LISTED REGISTRANTS.
Not applicable.
ITEM 6. SCHEDULE OF INVESTMENTS.
Not applicable. The complete schedule of investments is included in Item 1 of this Form N-CSR.
ITEM 7. DISCLOSURE OF PROXY VOTING POLICIES AND PROCEDURES FOR CLOSED-END MANAGEMENT INVESTMENT COMPANIES.
Not applicable.
ITEM 8. PORTFOLIO MANAGERS OF CLOSED-END MANAGEMENT INVESTMENT COMPANIES.
Not applicable.
ITEM 9. PURCHASES OF EQUITY SECURITIES BY CLOSED-END MANAGEMENT INVESTMENT COMPANY AND AFFILIATED PURCHASERS.
Not applicable.
ITEM 10. SUBMISSION OF MATTERS TO A VOTE OF SECURITY HOLDERS.
The registrant has adopted the following procedures by which shareholders may recommend nominees to the registrant’s Board of Trustees.
1. The shareholder must submit any such recommendation in writing to the registrant to the attention of the Secretary at the address of the principal executive offices of the registrant. The shareholder’s recommendation is then considered by the registrant’s Nominating Committee.
2. The shareholder recommendation must include:
(i) A statement in writing setting forth (a) the name, date of birth, business address and residence address of the person recommended by the shareholder (the “candidate”); and (b) whether the recommending shareholder believes that the candidate is or will be an “interested person” of the registrant (as defined in the Investment Company Act of 1940) and, if not an “interested person,”
information regarding the candidate that will be sufficient for the registrant to make such determination and, if applicable, similar information regarding whether the candidate would satisfy the standards for independence of a Board member under listing standards of the New York Stock Exchange or other applicable securities exchange.
(ii) The written and manually signed consent of the candidate to be named as a nominee and to serve as a Trustee if elected;
(iii) The recommending shareholder’s name as it appears on the registrant’s books and the number of all shares of the registrant owned beneficially and of record by the recommending shareholder (as evidenced to the Nominating Committee’s satisfaction by a recent brokerage or account statement); and
(iv) A description of all arrangements or understandings between the recommending shareholder and the candidate and any other person or persons (including their names) pursuant to which the recommendation is being made by the recommending shareholder.
In addition, the Nominating Committee may require the candidate to furnish such other information as it may reasonably require or deem necessary to determine the eligibility of such candidate to serve on the Board or to satisfy applicable law and information regarding the candidate that would be required to be disclosed if the candidate were a nominee in a proxy statement or other filing required to be made in connection with solicitation of proxies for election of Trustees.
ITEM 11. CONTROLS AND PROCEDURES.
(a) An evaluation was performed within 90 days of the filing of this report, under the supervision and with the participation of the registrant’s management, including the principal executive officer and principal financial officer, of the effectiveness of the design and operation of the registrant’s disclosure controls and procedures. Based on that evaluation, the principal executive officer and principal financial officer concluded that the registrant’s disclosure controls and procedures were effective.
(b) The registrant’s principal executive officer and principal financial officer are aware of no changes in the registrant’s internal control over financial reporting that occurred during the second fiscal quarter of the period covered by this report that has materially affected, or is reasonably likely to materially affect, the registrant’s internal control over financial reporting.
ITEM 12. EXHIBITS.
(a) (1) The registrant’s code of ethics pursuant to Item 2 of Form N-CSR is attached. (EX.99A)
(a) (2) Certifications pursuant to Section 302 of the Sarbanes-Oxley Act of 2002 are attached. (EX.99B)
(a) (3) Not applicable.
(b) Certifications pursuant to Section 906 of the Sarbanes-Oxley Act of 2002 are attached. (EX.99C)
SIGNATURES
Pursuant to the requirements of the Securities Exchange Act of 1934 and the Investment Company Act of 1940, the registrant has duly caused this report to be signed on its behalf by the undersigned, thereunto duly authorized.
| | |
| Dodge & Cox Funds |
| |
| By | | /s/ Charles F. Pohl |
| | Charles F. Pohl |
| | Chairman – Principal Executive Officer |
Date February 26, 2015
Pursuant to the requirements of the Securities Exchange Act of 1934 and the Investment Company Act of 1940, this report has been signed below by the following persons on behalf of the registrant and in the capacities and on the dates indicated.
| | |
| Dodge & Cox Funds |
| |
| By | | /s/ Charles F. Pohl |
| | Charles F. Pohl |
| | Chairman – Principal Executive Officer |
| |
| By | | /s/ David H. Longhurst |
| | David H. Longhurst |
| | Treasurer – Principal Financial Officer |
Date February 26, 2015