UNITED STATES
SECURITIES AND EXCHANGE COMMISSION
Washington, D.C. 20549
FORM N-CSR
CERTIFIED SHAREHOLDER REPORT OF REGISTERED
MANAGEMENT INVESTMENT COMPANIES
Investment Company Act file number 811-173
DODGE & COX FUNDS
(Exact name of registrant as specified in charter)
555 California Street, 40th Floor
San Francisco, CA 94104
(Address of principal executive offices) (Zip code)
Thomas M. Mistele, Esq.
555 California Street, 40th Floor
San Francisco, CA 94104
(Name and address of agent for service)
Registrant’s telephone number, including area code: 415-981-1710
Date of fiscal year end: DECEMBER 31, 2015
Date of reporting period: DECEMBER 31, 2015
Form N-CSR is to be used by management investment companies to file reports with the Commission not later than 10 days after the transmission to stockholders of any report that is required to be transmitted to stockholders under Rule 30e-1 under the Investment Company Act of 1940 (17 CFR 270.30e-1). The Commission may use the information provided on Form N-CSR in its regulatory, disclosure review, inspection, and policymaking roles.
A registrant is required to disclose the information specified by Form N-CSR, and the Commission will make this information public. A registrant is not required to respond to the collection of information contained in Form N-CSR unless the Form displays a currently valid Office of Management and Budget (“OMB”) control number. Please direct comments concerning the accuracy of the information collection burden estimate and any suggestions for reducing the burden to Secretary, Securities and Exchange Commission, 450 Fifth Street, NW, Washington, DC 20549-0609. The OMB has reviewed this collection of information under the clearance requirements of 44 U.S.C. ss. 3507.
| ITEM 1. | REPORTS TO STOCKHOLDERS. |
The following are the December 31, 2015 annual reports for the Dodge & Cox Funds, a Delaware statutory trust, consisting of six series: Dodge & Cox Stock Fund, Dodge & Cox Global Stock Fund, Dodge & Cox International Stock Fund, Dodge & Cox Balanced Fund, Dodge & Cox Income Fund, and Dodge & Cox Global Bond Fund. The reports of each series were transmitted to their respective shareholders on February 26, 2016.

DODGE & COX FUNDS®
Annual Report
December 31, 2015
Stock Fund
ESTABLISHED 1965
TICKER: DODGX
12/15 SF AR  Printed on recycled paper
TO OUR SHAREHOLDERS
The Dodge & Cox Stock Fund had a total return of –4.5% for the year ending December 31, 2015, compared to a return of 1.4% for the S&P 500 Index.
MARKET COMMENTARY
U.S. equity markets were volatile in 2015: after a significant selloff in August and September, the S&P 500 rebounded during the fourth quarter to finish the year up just over 1%. Global oil prices declined 35% during the year, which aided U.S. household purchasing power and hindered the profitability of oil and gas companies. Consumer Discretionary was the strongest sector (up 10%) of the S&P 500, while Energy was the worst-performing sector (down 21%).
In the United States, economic activity expanded at a moderate pace: household spending and business investment increased, and the housing market strengthened. Labor market conditions continued to improve, with solid job gains and reduced unemployment. Growth was tempered by the stronger U.S. dollar and weaker demand for U.S. exports. In December, the U.S. Federal Reserve (Fed) raised the federal funds rate for the first time in nine years. The 0.25 percentage point increase ended a historic seven-year period with the federal funds rate close to 0%, aimed at stimulating the economy. Fed Chair Janet Yellen reiterated the Fed’s intent to normalize monetary policy gradually; the timing and size of future adjustments will be based on economic conditions in relation to the Fed’s goals of maximum employment and 2% inflation.
Global growth expectations declined and emerging markets faced significant macroeconomic challenges during the year. China’s slowing economic growth contributed to depressed commodity prices (e.g., global copper prices plummeted 24%) and weighed on the global economy. The stronger U.S. dollar and prospects for higher U.S. interest rates negatively affected economies in need of external financing, such as Brazil.
INVESTMENT STRATEGY
As a value-oriented manager, 2015 was a challenging year for absolute and relative performance. Across equities, value stocks (the lower valuation portion of the market) underperformed growth stocks (the higher valuation portion of the market) by one of the widest spreads since the global financial crisis. The Fund was significantly affected by this performance divergence. Many of the S&P 500’s higher-valuation growth companies, not held by the Fund, outperformed significantly. In addition, some individual Fund holdings (e.g., HP Inc.(a), Time Warner, Wal-Mart) significantly detracted from results for the year, and the Fund’s Energy holdings were negatively impacted by falling oil prices.
We extensively revisited and retested our thinking on many of the Fund’s holdings during 2015. Our equity and fixed income teams regularly work together to evaluate risk and reward as we look at investment opportunities across a company’s capital structure, and this collaboration intensified during the year. As a part of our bottom-up research process, our investment teams thoroughly investigated individual company concerns, challenged analyst assumptions, and conducted further due diligence. For
example, a group of portfolio managers and analysts travelled to Houston to better understand shale economics and met with company management teams, suppliers, competitors, and industry consultants. In addition, we conducted intensive reviews to evaluate the key factors affecting a company’s capital structure, end-market demand, and relative competitiveness. Through this comprehensive process, we reaffirmed our view that the Fund’s holdings have attractive valuations relative to their fundamental outlook over our three- to five-year investment horizon.
During the year, U.S. valuation disparities widened overall: companies with higher valuations became more expensive relative to companies with lower valuations. As valuations became more attractive, we added selectively to existing holdings, including Baker Hughes, Bank of America, Cigna, EMC Corp., HP Inc., and MetLife.(b) We also identified 8 new investment opportunities (including American Express, Anthem, Concho Resources, and VMware) and exited 13 holdings (including Chevron, General Electric, and PayPal).
We continue to be optimistic about the long-term outlook for the portfolio. Our value-oriented approach has led us to invest in companies where we believe the long-term potential is not reflected in the current price. Three examples—American Express, Hewlett Packard Enterprise, and HP Inc.—are discussed below.
American Express
American Express—the largest new purchase in the Fund during 2015—provides charge and credit card products and travel-related services to consumers and businesses worldwide. The company is the number one credit/charge card issuer and merchant acquirer in the United States measured by billed business, and its network is the second largest after Visa. Historically, American Express has generated attractive returns due to its vertical integration and strong value proposition for high-spending customers.
In 2015, American Express’ stock declined 24%(c) due to concerns that the company’s business model is under pressure: Costco U.S. and JetBlue terminated their exclusive relationships with the card company and the Department of Justice questioned American Express’ ability to enforce rules prohibiting merchants from steering customers to other credit cards. As a result, American Express’ valuation relative to the market is at a historically low level (13 times forward estimated earnings(d)). We initiated a position in the company because we believe these near-term concerns have obscured a long-term investment opportunity. The company has an attractive business model that produces high returns on capital by encouraging more affluent and creditworthy customers to use the company’s credit and charge cards. American Express’ highly perceived rewards program, customer service, and strong brand recognition help attract and retain wealthier customers. The company should benefit from a continued industry shift from paper to plastic payments and growth in its third-party issued cards business. We believe American Express will be able to maintain its strong return on equity and improve profitability in the long run. On December 31, American Express was a 1.4% position in the Fund.
PAGE 2 § DODGE & COX STOCK FUND
Hewlett Packard Enterprise and HP Inc.
After providing strong returns in 2013 and 2014, Hewlett-Packard was the Fund’s largest detractor from results during 2015. Hewlett-Packard recently split into two entities—Hewlett Packard Enterprise and HP Inc.—which should result in greater focus and flexibility for each company to achieve its strategic goals. To assess secular challenges and evaluate the risks and opportunities of each stand-alone business, we met numerous times with their management teams and competitors and spoke with industry consultants. As a result, we added to the Fund’s positions in both companies. On December 31, Hewlett Packard Enterprise was a 2.5% position and HP Inc. was a 1.8% position in the Fund.
Hewlett Packard Enterprise, one of the largest vendors in information technology (IT), consists of the enterprise technology infrastructure, software, and services segments of the old Hewlett-Packard. We acknowledge the company faces headwinds: the shift to the cloud has negatively impacted all on-premise IT vendors, continued public cloud adoption will likely erode the company’s market share, and competition is keen. Despite these risks, we believe Hewlett Packard Enterprise is an attractive investment due to its strong market positions across its portfolio (e.g., top provider of servers, number two position in IT services), scale advantages, and opportunities to improve its margin structure. Meg Whitman—the CEO of Hewlett Packard Enterprise—has overseen sound acquisitions (e.g., 3Par), new product launches, and cost reduction programs during her tenures at Hewlett-Packard and eBay. Management is actively cutting costs and retooling its product and service offerings to improve the company’s competitiveness. Margins in the Enterprise Services segment should expand as the company optimizes its contract mix and delivery models. The company trades at a compelling valuation (eight times forward estimated earnings), which is among the lowest in the S&P 500.
As the leader in printing and personal computer sales globally, HP Inc.’s key challenge is declining revenues. Partly due to the stronger U.S. dollar, consensus estimates have the company’s sales declining approximately 10% in 2016. Many investors believe a shrinking market for hardware and ink may be too difficult to overcome; we believe this view of the company’s prospects is too pessimistic. HP’s management is aggressively cutting costs and has plans to introduce more new products. For example, HP has portions of its printing business (e.g., high-end graphics production) that are currently growing and may increase share in the established copier market and in the more nascent 3D print market. Moreover, the company generates robust free cash flow. Trading at seven times forward estimated earnings, HP remains an attractive investment opportunity with strong business prospects given its large valuation discount to the overall market.
IN CLOSING
On December 31, the Fund’s portfolio of 63 companies traded at 13.8 times forward estimated earnings, a significant discount to the S&P 500 (17.4 times forward estimated earnings). We remain confident in the prospects for the portfolio over our three- to five-year investment horizon and believe it is positioned to benefit from long-term global growth opportunities.
Our experienced and stable team has weathered past periods of market turbulence by remaining steadfast in our investment philosophy and process. Our approach—constructing a diversified portfolio through in-depth, independent research, a long-term investment horizon, and a focus on valuation relative to underlying fundamentals—continues to guide us through this period. We remain confident that our enduring value-oriented approach will benefit the Fund in the years ahead.
Thank you for your continued confidence in our firm. As always, we welcome your comments and questions.
For the Board of Trustees,
| | |
 | |  |
Charles F. Pohl, Chairman | | Dana M. Emery, President |
January 29, 2016
| (a) | | After Hewlett-Packard Co. split into two companies, HP Inc. retained the HPQ ticker symbol. HP Inc.’s –37% return in 2015 includes Hewlett-Packard Co.’s performance through October 2015. |
| (b) | | The use of specific examples does not imply that they are more attractive investments than the Fund’s other holdings. |
| (c) | | All returns are total returns unless otherwise noted. |
| (d) | | Unless otherwise specified, all weightings and characteristics are as of December 31, 2015. |
DODGE & COX STOCK FUND §PAGE 3
ANNUAL PERFORMANCE REVIEW
The Fund underperformed the S&P 500 by 5.9 percentage points in 2015.
Key Detractors from Relative Results
| | § | | The Fund’s holdings in the Consumer Discretionary sector (down 6% compared to up 10% for the S&P 500 sector) hindered performance. Media holdings Twenty-First Century Fox (down 29%) and Time Warner (down 23%) were particularly weak. | |
| | § | | Wal-Mart, the Fund’s only holding in the Consumer Staples sector (down 27% compared to up 7% for the S&P 500 sector), hurt returns. | |
| | § | | The Fund’s holdings in the Information Technology sector (flat compared to up 6% for the S&P 500 sector) detracted from results. HP Inc. (down 37%) and NetApp (down 35%) performed poorly. | |
| | § | | The Fund’s holdings in the Energy sector (down 26% compared to down 21% for the S&P 500 sector) hurt results. National Oilwell Varco (down 47%), Apache (down 28%), and Schlumberger (down 16%) were key detractors. | |
| | § | | Capital One (down 11%) was also a detractor. | |
Key Contributors to Relative Results
| | § | | The Fund’s average overweight position (6% versus 3%) and holdings in the Health Care Providers & Services industry (up 18% compared to up 12% for the S&P 500 industry) helped returns. Cigna (up 42%) and UnitedHealth Group (up 18%) were particularly strong. | |
| | § | | In the Materials sector (up 14% compared to down 9% for the S&P 500 sector), the Fund’s only holding, Celanese, and lack of holdings in the Metals & Mining industry (down 39%) contributed to results. | |
| | § | | Additional contributors included Alphabet (up 45%), Time Warner Cable (up 25%), Maxim Integrated Products (up 23%), Microsoft (up 23%), and Charles Schwab (up 10%). | |
KEY CHARACTERISTICS OF DODGE & COX
Independent Organization
Dodge & Cox is one of the largest privately owned investment managers in the world. We remain committed to independence, with a goal of providing the highest quality investment management service to our existing clients.
Over 85 Years of Investment Experience
Dodge & Cox was founded in 1930. We have a stable and well-qualified team of investment professionals, most of whom have spent their entire careers at Dodge & Cox.
Experienced Investment Team
The Investment Policy Committee, which is the decision-making body for the Stock Fund, is a nine-member committee with an average tenure at Dodge & Cox of 27 years.
One Business with a Single Research Office
Dodge & Cox manages equity (domestic, international, and global), fixed income (domestic and global), and balanced investments, operating from one office in San Francisco.
Consistent Investment Approach
Our team decision-making process involves thorough, bottom-up fundamental analysis of each investment.
Long-Term Focus and Low Expenses
We invest with a three- to five-year investment horizon, which has historically resulted in low turnover relative to our peers. We manage Funds that maintain low expense ratios.
Risks: The Fund is subject to market risk, meaning holdings in the Fund may decline in value for extended periods due to the financial prospects of individual companies, or due to general market and economic conditions. Please read the prospectus and summary prospectus for specific details regarding the Fund’s risk profile.
PAGE 4 § DODGE & COX STOCK FUND
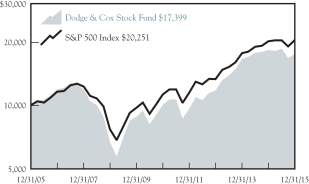
GROWTH OF $10,000 OVER 10 YEARS
FOR AN INVESTMENT MADE ON DECEMBER 31, 2005
AVERAGE ANNUAL TOTAL RETURN
FOR PERIODS ENDED DECEMBER 31, 2015
| | | | | | | | | | | | | | | | |
| | | 1 Year | | | 5 Years | | | 10 Years | | | 20 Years | |
Dodge & Cox Stock Fund | | | –4.47 | % | | | 11.64 | % | | | 5.69 | % | | | 10.05 | % |
S&P 500 Index | | | 1.41 | | | | 12.58 | | | | 7.31 | | | | 8.19 | |
Returns represent past performance and do not guarantee future results. Investment return and share price will fluctuate with market conditions, and investors may have a gain or loss when shares are sold. Fund performance changes over time and currently may be significantly lower than stated. Performance is updated and published monthly. Visit the Fund’s website at dodgeandcox.com or call 800-621-3979 for current performance figures.
The Fund’s total returns include the reinvestment of dividend and capital gain distributions, but have not been adjusted for any income taxes payable by shareholders on these distributions or on Fund share redemptions. Index returns include dividends but, unlike Fund returns, do not reflect fees or expenses. The S&P 500 Index is a market capitalization-weighted index of 500 large-capitalization stocks commonly used to represent the U.S. equity market.
S&P 500® is a trademark of McGraw Hill Financial.
FUND EXPENSE EXAMPLE
As a Fund shareholder, you incur ongoing Fund costs, including management fees and other Fund expenses. All mutual funds have ongoing costs, sometimes referred to as operating expenses. The following example shows ongoing costs of investing in the Fund and can help you understand these costs and compare them with those of other mutual funds. The example assumes a $1,000 investment held for the six months indicated.
ACTUAL EXPENSES
The first line of the table below provides information about actual account values and expenses based on the Fund’s actual returns. You may use the information in this line, together with your account balance, to estimate the expenses that you paid over the period. Simply divide your account value by $1,000 (for example, an $8,600 account value divided by $1,000 = 8.6), then multiply the result by the number in the first line under the heading “Expenses Paid During Period” to estimate the expenses you paid on your account during this period.
HYPOTHETICAL EXAMPLE FOR COMPARISON WITH OTHER MUTUAL FUNDS
Information on the second line of the table can help you compare ongoing costs of investing in the Fund with those of other mutual funds. This information may not be used to estimate the actual ending account balance or expenses you paid during the period. The hypothetical “Ending Account Value” is based on the actual expense ratio of the Fund and an assumed 5% annual rate of return before expenses (not the Fund’s actual return). The amount under the heading “Expenses Paid During Period” shows the hypothetical expenses your account would have incurred under this scenario. You can compare this figure with the 5% hypothetical examples that appear in shareholder reports of other mutual funds.
| | | | | | | | | | | | |
Six Months Ended
December 31, 2015 | | Beginning Account Value
7/1/2015 | | | Ending Account Value
12/31/2015 | | | Expenses Paid
During Period* | |
Based on Actual Fund Return | | $ | 1,000.00 | | | $ | 942.40 | | | $ | 2.51 | |
Based on Hypothetical 5% Yearly Return | | | 1,000.00 | | | | 1,022.63 | | | | 2.61 | |
| * | | Expenses are equal to the Fund’s annualized expense ratio of 0.51%, multiplied by the average account value over the period, multiplied by 184/365 (to reflect the one-half year period). |
The expenses shown in the table highlight ongoing costs only and do not reflect any transactional fees or account maintenance fees. Though other mutual funds may charge such fees, please note that the Fund does not charge transaction fees (e.g., redemption fees, sales loads) or universal account maintenance fees (e.g., small account fees).
DODGE & COX STOCK FUND §PAGE 5
| | | | |
| FUND INFORMATION (unaudited) | | | December 31, 2015 | |
| | | | |
| GENERAL INFORMATION | | | |
Net Asset Value Per Share | | | $162.77 | |
Total Net Assets (billions) | | | $54.8 | |
Expense Ratio | | | 0.52% | |
Portfolio Turnover Rate | | | 15% | |
30-Day SEC Yield(a) | | | 1.38% | |
Number of Companies | | | 63 | |
Fund Inception | | | 1965 | |
No sales charges or distribution fees | | | | |
Investment Manager: Dodge & Cox, San Francisco. Managed by the Investment Policy Committee, whose nine members’ average tenure at Dodge & Cox is 27 years.
| | | | | | | | |
| PORTFOLIO CHARACTERISTICS | | Fund | | | S&P 500 | |
Median Market Capitalization (billions) | | | $38 | | | | $18 | |
Weighted Average Market Capitalization (billions) | | | $116 | | | | $140 | |
Price-to-Earnings Ratio(b) | | | 13.8x | | | | 17.4x | |
Foreign Securities not in the S&P 500(c) | | | 9.1% | | | | 0.0% | |
| | | | |
| TEN LARGEST HOLDINGS (%)(d) | | Fund | |
Wells Fargo & Co. | | | 4.1 | |
Microsoft Corp. | | | 4.0 | |
Capital One Financial Corp. | | | 3.9 | |
Time Warner Cable, Inc. | | | 3.9 | |
Charles Schwab Corp. | | | 3.7 | |
Alphabet, Inc. | | | 3.4 | |
Bank of America Corp. | | | 3.4 | |
Novartis AG (Switzerland) | | | 2.9 | |
EMC Corp. | | | 2.7 | |
Schlumberger, Ltd. | | | 2.7 | |
| | | | | | | | |
| SECTOR DIVERSIFICATION (%) | | Fund | | | S&P 500 | |
Financials | | | 26.4 | | | | 16.5 | |
Information Technology | | | 24.6 | | | | 20.7 | |
Health Care | | | 16.5 | | | | 15.2 | |
Consumer Discretionary | | | 15.1 | | | | 13.0 | |
Energy | | | 7.3 | | | | 6.5 | |
Industrials | | | 4.2 | | | | 10.0 | |
Consumer Staples | | | 2.1 | | | | 10.1 | |
Materials | | | 0.9 | | | | 2.6 | |
Telecommunication Services | | | 0.7 | | | | 2.4 | |
Utilities | | | 0.0 | | | | 3.0 | |
| (a) | SEC Yield is an annualization of the Fund’s total net investment income per share for the 30-day period ended on the last day of the month. |
| (b) | Price-to-earnings (P/E) ratios for the equity securities held in the Fund and the S&P 500 are calculated using 12-month forward earnings estimates from third-party sources. |
| (c) | Foreign securities are U.S. dollar denominated. |
| (d) | The Fund’s portfolio holdings are subject to change without notice. The mention of specific securities is not a recommendation to buy, sell, or hold any particular security and is not indicative of Dodge & Cox’s current or future trading activity. |
| (e) | Net Cash & Other includes short-term investments (e.g., money market funds and repurchase agreements) and other assets less liabilities (e.g., cash, receivables, payables, and unrealized appreciation/depreciation on certain derivatives). A majority of the short-term investments position is equitized using futures contracts. |
PAGE 6 § DODGE & COX STOCK FUND
| | | | |
| PORTFOLIO OF INVESTMENTS | | | December 31, 2015 | |
| | | | | | | | |
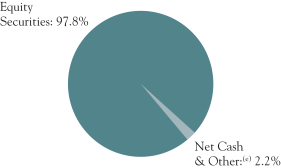
| COMMON STOCKS: 97.8% | | | | | | |
| | |
| | | SHARES | | | VALUE | |
| CONSUMER DISCRETIONARY: 15.1% | | | | | |
AUTOMOBILES & COMPONENTS: 0.4% | | | | | |
Harley-Davidson, Inc. | | | 4,886,500 | | | $ | 221,798,235 | |
| |
CONSUMER DURABLES & APPAREL: 0.6% | | | | | |
Coach, Inc. | | | 10,088,700 | | | | 330,203,151 | |
| | |
MEDIA: 11.8% | | | | | | | | |
Comcast Corp., Class A | | | 25,658,797 | | | | 1,447,925,915 | |
DISH Network Corp., Class A(a) | | | 6,691,149 | | | | 382,599,900 | |
News Corp., Class A | | | 4,912,806 | | | | 65,635,088 | |
Time Warner Cable, Inc. | | | 11,437,410 | | | | 2,122,668,922 | |
Time Warner, Inc. | | | 22,227,832 | | | | 1,437,473,895 | |
Twenty-First Century Fox, Inc., Class A | | | 28,934,626 | | | | 785,864,442 | |
Twenty-First Century Fox, Inc., Class B | | | 9,350,000 | | | | 254,600,500 | |
| | | | | | | | |
| | | | 6,496,768,662 | |
RETAILING: 2.3% | | | | | | | | |
Liberty Interactive Corp. QVC Group, Series A(a) | | | 12,317,275 | | | | 336,507,953 | |
Target Corp. | | | 5,760,586 | | | | 418,276,150 | |
The Priceline Group, Inc.(a) | | | 390,900 | | | | 498,377,955 | |
| | | | | | | | |
| | | | 1,253,162,058 | |
| | | | | | | | |
| | | | 8,301,932,106 | |
| CONSUMER STAPLES: 2.1% | | | | | | | | |
FOOD & STAPLES RETAILING: 2.1% | | | | | |
Wal-Mart Stores, Inc. | | | 18,678,550 | | | | 1,144,995,115 | |
| | |
| ENERGY: 7.3% | | | | | | | | |
Apache Corp.(c) | | | 15,359,845 | | | | 683,052,307 | |
Baker Hughes, Inc. | | | 20,362,050 | | | | 939,708,607 | |
Concho Resources, Inc.(a) | | | 3,115,000 | | | | 289,258,900 | |
National Oilwell Varco, Inc. | | | 12,598,000 | | | | 421,907,020 | |
Schlumberger, Ltd.(b) (Curacao/United States) | | | 20,848,845 | | | | 1,454,206,939 | |
Weatherford International PLC(a)(b) (Ireland) | | | 23,907,400 | | | | 200,583,086 | |
| | | | | | | | |
| | | | 3,988,716,859 | |
| FINANCIALS: 26.4% | | | | | | | | |
BANKS: 10.5% | | | | | | | | |
Bank of America Corp. | | | 110,553,200 | | | | 1,860,610,356 | |
BB&T Corp. | | | 14,494,144 | | | | 548,023,585 | |
JPMorgan Chase & Co. | | | 16,665,200 | | | | 1,100,403,156 | |
Wells Fargo & Co. | | | 41,962,641 | | | | 2,281,089,165 | |
| | | | | | | | |
| | | | 5,790,126,262 | |
DIVERSIFIED FINANCIALS: 13.6% | | | | | |
American Express Co. | | | 10,720,800 | | | | 745,631,640 | |
Bank of New York Mellon Corp. | | | 31,721,024 | | | | 1,307,540,609 | |
Capital One Financial Corp.(c) | | | 29,786,611 | | | | 2,149,997,582 | |
Charles Schwab Corp. | | | 61,864,400 | | | | 2,037,194,692 | |
Goldman Sachs Group, Inc. | | | 6,694,800 | | | | 1,206,603,804 | |
| | | | | | | | |
| | | | 7,446,968,327 | |
INSURANCE: 2.3% | | | | | | | | |
AEGON NV(b) (Netherlands) | | | 69,285,166 | | | | 392,846,891 | |
MetLife, Inc. | | | 17,662,700 | | | | 851,518,767 | |
| | | | | | | | |
| | | | 1,244,365,658 | |
| | | | | | | | |
| | | | 14,481,460,247 | |
| HEALTH CARE: 16.5% | | | | | | | | |
HEALTH CARE EQUIPMENT & SERVICES: 7.0% | | | | | |
Anthem, Inc. | | | 1,288,685 | | | | 179,694,237 | |
Cigna Corp. | | | 8,052,484 | | | | 1,178,319,984 | |
Express Scripts Holding Co.(a) | | | 14,813,071 | | | | 1,294,810,536 | |
Medtronic PLC(b) (Ireland) | | | 3,749,600 | | | | 288,419,232 | |
UnitedHealth Group, Inc. | | | 7,678,063 | | | | 903,247,331 | |
| | | | | | | | |
| | | | 3,844,491,320 | |
| | | | | | | | |
| | |
| | | SHARES | | | VALUE | |
PHARMACEUTICALS, BIOTECHNOLOGY & LIFE SCIENCES: 9.5% | |
AstraZeneca PLC ADR(b) (United Kingdom) | | | 7,564,200 | | | $ | 256,804,590 | |
Merck & Co., Inc. | | | 14,316,800 | | | | 756,213,376 | |
Novartis AG ADR(b) (Switzerland) | | | 18,828,500 | | | | 1,620,004,140 | |
Roche Holding AG ADR(b) (Switzerland) | | | 34,496,900 | | | | 1,189,108,143 | |
Sanofi ADR(b) (France) | | | 31,765,829 | | | | 1,354,812,607 | |
Thermo Fisher Scientific, Inc. | | | 226,010 | | | | 32,059,518 | |
| | | | | | | | |
| | | | 5,209,002,374 | |
| | | | | | | | |
| | | | 9,053,493,694 | |
| INDUSTRIALS: 4.2% | | | | | | | | |
CAPITAL GOODS: 0.9% | | | | | | | | |
Danaher Corp. | | | 4,719,600 | | | | 438,356,448 | |
NOW, Inc.(a) | | | 1,690,218 | | | | 26,739,249 | |
| | | | | | | | |
| | | | 465,095,697 | |
COMMERCIAL & PROFESSIONAL SERVICES: 1.4% | |
ADT Corp.(c) | | | 11,138,437 | | | | 367,345,652 | |
Tyco International PLC(b) (Ireland) | | | 12,974,975 | | | | 413,771,953 | |
| | | | | | | | |
| | | | 781,117,605 | |
TRANSPORTATION: 1.9% | | | | | | | | |
FedEx Corp. | | | 7,158,399 | | | | 1,066,529,867 | |
| | | | | | | | |
| | | | 2,312,743,169 | |
| INFORMATION TECHNOLOGY: 24.6% | | | | | |
SEMICONDUCTORS & SEMICONDUCTOR EQUIPMENT: 0.9% | |
Maxim Integrated Products, Inc.(c) | | | 13,535,740 | | | | 514,358,120 | |
| | |
SOFTWARE & SERVICES: 10.8% | | | | | | | | |
Alphabet, Inc., Class A(a) | | | 670,700 | | | | 521,811,307 | |
Alphabet, Inc., Class C(a) | | | 1,837,253 | | | | 1,394,254,556 | |
Cadence Design Systems, Inc.(a) | | | 7,977,200 | | | | 166,005,532 | |
eBay, Inc.(a) | | | 1,838,244 | | | | 50,514,945 | |
Microsoft Corp. | | | 39,336,600 | | | | 2,182,394,568 | |
Symantec Corp.(c) | | | 54,111,000 | | | | 1,136,331,000 | |
Synopsys, Inc.(a)(c) | | | 9,193,469 | | | | 419,314,121 | |
VMware, Inc.(a) | | | 1,309,375 | | | | 74,071,344 | |
| | | | | | | | |
| | | | 5,944,697,373 | |
TECHNOLOGY, HARDWARE & EQUIPMENT: 12.9% | | | | | |
Cisco Systems, Inc. | | | 39,857,711 | | | | 1,082,336,142 | |
Corning, Inc. | | | 33,952,000 | | | | 620,642,560 | |
EMC Corp. | | | 57,817,203 | | | | 1,484,745,773 | |
Hewlett Packard Enterprise Co.(c) | | | 90,984,995 | | | | 1,382,971,924 | |
HP, Inc. | | | 84,807,695 | | | | 1,004,123,109 | |
Juniper Networks, Inc. | | | 3,231,546 | | | | 89,190,670 | |
NetApp, Inc.(c) | | | 21,532,731 | | | | 571,263,353 | |
TE Connectivity, Ltd.(b) (Switzerland) | | | 12,541,775 | | | | 810,324,083 | |
| | | | | | | | |
| | | | 7,045,597,614 | |
| | | | | | | | |
| | | | 13,504,653,107 | |
| MATERIALS: 0.9% | | | | | | | | |
Celanese Corp., Series A(c) | | | 7,219,998 | | | | 486,122,465 | |
|
| TELECOMMUNICATION SERVICES: 0.7% | |
Sprint Corp.(a) | | | 107,816,127 | | | | 390,294,380 | |
| | | | | | | | |
TOTAL COMMON STOCKS
(Cost $40,821,453,282) | | | $ | 53,664,411,142 | |
| | |
| See accompanying Notes to Financial Statements | | DODGE & COX STOCK FUND §PAGE 7 |
| | | | |
| PORTFOLIO OF INVESTMENTS | | | December 31, 2015 | |
| | | | | | | | |
| SHORT-TERM INVESTMENTS: 2.3% | |
| | |
| | | PAR VALUE | | | VALUE | |
MONEY MARKET FUND: 0.1% | | | | | |
SSgA U.S. Treasury Money Market Fund | | $ | 55,422,858 | | | $ | 55,422,858 | |
| |
REPURCHASE AGREEMENT: 2.2% | | | | | |
Fixed Income Clearing Corporation(d)
0.08%, dated 12/31/15, due 1/4/16, maturity value $1,204,155,704 | | | 1,204,145,000 | | | | 1,204,145,000 | |
| | | | | | | | |
TOTAL SHORT-TERM INVESTMENTS
(Cost $1,259,567,858) | | | $ | 1,259,567,858 | |
| | | | | | | | |
TOTAL INVESTMENTS
(Cost $42,081,021,140) | | | 100.1 | % | | $ | 54,923,979,000 | |
OTHER ASSETS LESS LIABILITIES | | | (0.1 | %) | | | (78,854,493 | ) |
| | | | | | | | |
| NET ASSETS | | | 100.0 | % | | $ | 54,845,124,507 | |
| | | | | | | | |
| (b) | Security denominated in U.S. dollars |
| (c) | See Note 8 regarding holdings of 5% voting securities |
| (d) | Repurchase agreement is collateralized by U.S. Treasury Note 1.750%, 12/31/20. Total collateral value is $1,228,232,788. |
In determining a company’s country designation, the Fund generally references the country of incorporation. In cases where the Fund considers the country of incorporation to be a “jurisdiction of convenience” chosen primarily for tax purposes or in other limited circumstances, the Fund uses the country designation of an appropriate broad-based market index. In those cases, two countries are listed - the country of incorporation and the country designated by an appropriate index, respectively.
ADR: American Depositary Receipt
FUTURES CONTRACTS
| | | | | | | | | | | | | | | | |
| Description | | Number of
Contracts | | | Expiration
Date | | | Notional Amount | | | Unrealized
Appreciation/
(Depreciation) | |
E-mini S&P 500 Index—Long Position | | | 12,023 | | | | Mar 2016 | | | $ | 1,223,580,710 | | | $ | 1,713,207 | |
| | |
| PAGE 8 § DODGE & COX STOCK FUND | | See accompanying Notes to Financial Statements |
| | | | |
STATEMENT OF ASSETS AND LIABILITIES | |
| |
| | | December 31, 2015 | |
ASSETS: | | | | |
Investments, at value | | | | |
Unaffiliated issuers (cost $37,049,990,593) | | $ | 48,896,755,368 | |
Affiliated issuers (cost $5,031,030,547) | | | 6,027,223,632 | |
| | | | |
| | | 54,923,979,000 | |
Cash held at broker | | | 55,305,169 | |
Receivable for investments sold | | | 15,637,977 | |
Receivable for Fund shares sold | | | 61,926,918 | |
Dividends and interest receivable | | | 60,350,707 | |
Prepaid expenses and other assets | | | 309,904 | |
| | | | |
| | | 55,117,509,675 | |
| | | | |
LIABILITIES: | | | | |
Payable to broker for variation margin | | | 11,542,080 | |
Payable for investments purchased | | | 59,141,766 | |
Payable for Fund shares redeemed | | | 176,752,622 | |
Management fees payable | | | 23,485,250 | |
Accrued expenses | | | 1,463,450 | |
| | | | |
| | | 272,385,168 | |
| | | | |
NET ASSETS | | $ | 54,845,124,507 | |
| | | | |
NET ASSETS CONSIST OF: | | | | |
Paid in capital | | $ | 41,101,955,700 | |
Undistributed net investment income | | | 7,503,253 | |
Undistributed net realized gain | | | 890,994,487 | |
Net unrealized appreciation | | | 12,844,671,067 | |
| | | | |
| | $ | 54,845,124,507 | |
| | | | |
Fund shares outstanding (par value $0.01 each,
unlimited shares authorized) | | | 336,950,058 | |
Net asset value per share | | $ | 162.77 | |
|
STATEMENT OF OPERATIONS | |
| |
| | | Year Ended
December 31, 2015 | |
INVESTMENT INCOME: | | | | |
Dividends (net of foreign taxes of $20,876,250) | | | | |
Unaffiliated issuers | | $ | 954,579,629 | |
Affiliated issuers | | | 150,632,113 | |
Interest | | | 72,003 | |
| | | | |
| | | 1,105,283,745 | |
| | | | |
EXPENSES: | | | | |
Management fees | | | 293,725,621 | |
Custody and fund accounting fees | | | 724,423 | |
Transfer agent fees | | | 4,195,938 | |
Professional services | | | 231,414 | |
Shareholder reports | | | 1,262,127 | |
Registration fees | | | 262,297 | |
Trustees’ fees | | | 237,500 | |
Miscellaneous | | | 3,225,585 | |
| | | | |
| | | 303,864,905 | |
| | | | |
NET INVESTMENT INCOME | | | 801,418,840 | |
| | | | |
REALIZED AND UNREALIZED GAIN (LOSS): | | | | |
Net realized gain (loss) | | | | |
Unaffiliated issuers | | | 2,784,965,660 | |
Affiliated issuers | | | 212,205,714 | |
Index futures contracts | | | (14,553,232 | ) |
Net change in unrealized appreciation/depreciation | | | | |
Investments | | | (6,398,781,160 | ) |
Index futures contracts | | | 1,713,207 | |
| | | | |
Net realized and unrealized loss | | | (3,414,449,811 | ) |
| | | | |
NET DECREASE IN NET ASSETS FROM OPERATIONS | | $ | (2,613,030,971 | ) |
| | | | |
| | | | | | | | |
STATEMENT OF CHANGES IN NET ASSETS | |
| | |
| | | Year Ended
December 31, 2015 | | | Year Ended
December 31, 2014 | |
OPERATIONS: | | | | | | | | |
Net investment income | | $ | 801,418,840 | | | $ | 919,834,389 | |
Net realized gain | | | 2,982,618,142 | | | | 2,333,359,854 | |
Net change in unrealized
appreciation/depreciation | | | (6,397,067,953 | ) | | | 2,407,499,870 | |
| | | | | | | | |
| | | (2,613,030,971 | ) | | | 5,660,694,113 | |
| | | | | | | | |
| | |
DISTRIBUTIONS TO SHAREHOLDERS FROM: | | | | | | | | |
Net investment income | | | (813,298,971 | ) | | | (908,453,128 | ) |
Net realized gain | | | (2,475,923,268 | ) | | | (840,004,493 | ) |
| | | | | | | | |
Total distributions | | | (3,289,222,239 | ) | | | (1,748,457,621 | ) |
| | | | | | | | |
| | |
FUND SHARE
TRANSACTIONS: | | | | | | | | |
Proceeds from sale of shares | | | 7,399,154,348 | | | | 9,175,796,977 | |
Reinvestment of distributions | | | 3,094,798,205 | | | | 1,609,896,035 | |
Cost of shares redeemed | | | (10,006,695,861 | ) | | | (9,285,324,011 | ) |
| | | | | | | | |
Net increase from Fund share transactions | | | 487,256,692 | | | | 1,500,369,001 | |
| | | | | | | | |
Total increase/(decrease) in
net assets | | | (5,414,996,518 | ) | | | 5,412,605,493 | |
| | |
NET ASSETS: | | | | | | | | |
Beginning of year | | | 60,260,121,025 | | | | 54,847,515,532 | |
| | | | | | | | |
End of year (including undistributed
net investment income of $7,503,253 and $19,383,384, respectively) | | $ | 54,845,124,507 | | | $ | 60,260,121,025 | |
| | | | | | | | |
| | |
SHARE INFORMATION: | | | | | | | | |
Shares sold | | | 41,883,366 | | | | 52,472,086 | |
Distributions reinvested | | | 18,759,974 | | | | 9,034,682 | |
Shares redeemed | | | (56,738,159 | ) | | | (53,255,380 | ) |
| | | | | | | | |
Net increase in shares outstanding | | | 3,905,181 | | | | 8,251,388 | |
| | | | | | | | |
| | |
| See accompanying Notes to Financial Statements | | DODGE & COX STOCK FUND §PAGE 9 |
NOTES TO FINANCIAL STATEMENTS
NOTE 1—ORGANIZATION AND SIGNIFICANT ACCOUNTING POLICIES
Dodge & Cox Stock Fund (the “Fund”) is one of the series constituting the Dodge & Cox Funds (the “Trust” or the “Funds”). The Trust is organized as a Delaware statutory trust and is registered under the Investment Company Act of 1940, as amended, as an open-end management investment company. The Fund commenced operations on January 4, 1965, and seeks long-term growth of principal and income. Risk considerations and investment strategies of the Fund are discussed in the Fund’s Prospectus.
The financial statements have been prepared in conformity with accounting principles generally accepted in the United States of America, which require the use of estimates and assumptions by management. Actual results may differ from those estimates. Significant accounting policies are as follows:
Security valuation The Fund’s net assets are valued as of the close of trading on the New York Stock Exchange (NYSE), generally 4:00 p.m. Eastern Time, each day that the NYSE is open for business. If the NYSE is closed due to inclement weather, technology problems, or for any other reason on a day it would normally be open for business, or the NYSE has an unscheduled early closing on a day it has opened for business, the Fund reserves the right to calculate the Fund’s NAV as of the normally scheduled close of regular trading on the NYSE for that day, provided that Dodge & Cox believes that it can obtain reliable market quotes or valuations.
Portfolio securities and other financial instruments for which market quotes are readily available are valued at market value. Listed securities are generally valued using the official quoted close price or the last sale on the exchange that is determined to be the primary market for the security. Exchange-traded derivatives are valued at the settlement price determined by the relevant exchange. Security values are not discounted based on the size of the Fund’s position. Short-term securities less than 60 days to maturity may be valued at amortized cost if amortized cost approximates current value. Mutual funds are valued at their respective net asset values. All securities held by the Fund are denominated in U.S. dollars.
If market quotations are not readily available or if a security’s value is believed to have materially changed after the close of the security’s primary market but before the close of trading on the NYSE, the security is valued at fair value as determined in good faith by or under the direction of the Fund’s Board of Trustees. The Board of Trustees has appointed Dodge & Cox, the Fund’s investment manager, to make fair value determinations in accordance with the Dodge & Cox Funds Valuation Policies (“Valuation Policies”), subject to Board oversight. Dodge & Cox has established a Pricing Committee that is comprised of representatives from Treasury, Legal, Compliance, and Operations. The Pricing Committee is responsible for implementing the Valuation Policies, including determining the fair value of securities when market quotations or market-based valuations are
not readily available or are deemed unreliable. The Pricing Committee considers relevant indications of value that are reasonably available to it in determining the fair value assigned to a particular security, such as the value of similar financial instruments, trading volumes, contractual restrictions on disposition, related corporate actions, and changes in economic conditions. In doing so, the Pricing Committee employs various methods for calibrating fair valuation approaches, including a regular review of key inputs and assumptions, back-testing, and review of any related market activity.
Valuing securities through a fair value determination involves greater reliance on judgment than valuation of securities based on readily available market quotations. In some instances, lack of information and uncertainty as to the significance of information may lead to a conclusion that a prior valuation is the best indication of a security’s value. When fair value pricing is employed, the prices of securities used by the Fund to calculate its NAV may differ from quoted or published prices for the same securities.
Security transactions, investment income, expenses, and distributions Security transactions are recorded on the trade date. Realized gains and losses on securities sold are determined on the basis of identified cost.
Dividend income and corporate action transactions are recorded on the ex-dividend date, or when the Fund first learns of the dividend/corporate action if the ex-dividend date has passed. Withholding taxes on foreign dividends have been provided for in accordance with the Fund’s understanding of the applicable country’s tax rules and rates. Non-cash dividends included in dividend income, if any, are recorded at the fair market value of the securities received. Dividends characterized as return of capital for U.S. tax purposes are recorded as a reduction of cost of investments and/or realized gain. Interest income is recorded on the accrual basis.
Expenses are recorded on the accrual basis. Some expenses of the Trust can be directly attributed to a specific series. Expenses which cannot be directly attributed are allocated among the Funds in the Trust based on relative net assets or other expense methodologies determined by the nature of the expense.
Distributions to shareholders are recorded on the ex-dividend date.
Repurchase agreements The Fund enters into repurchase agreements, secured by U.S. government or agency securities, which involve the purchase of securities from a counterparty with a simultaneous commitment to resell the securities at an agreed-upon date and price. It is the Fund’s policy that its custodian take possession of the underlying collateral securities, the fair value of which exceeds the principal amount of the repurchase transaction, including accrued interest, at all times. In the event of default by the counterparty, the Fund has the contractual right to liquidate the collateral securities and to apply the proceeds in satisfaction of the obligation.
PAGE 10 § DODGE & COX STOCK FUND
NOTES TO FINANCIAL STATEMENTS
Futures Contracts Futures contracts involve an obligation to purchase or sell (depending on whether the Fund has entered a long or short futures contract, respectively) an asset at a future date, at a price set at the time of the contract. Upon entering into a futures contract, the Fund is required to deposit an amount of cash or liquid assets (referred to as initial margin) in a segregated account with the clearing broker. Subsequent payments (referred to as variation margin) to and from the clearing broker are made on a daily basis based on changes in the market value of futures contracts. Futures contracts are traded publicly and their market value changes daily. Changes in the market value of open futures contracts are recorded as unrealized appreciation or depreciation in the Statement of Operations. Realized gains and losses on futures contracts are recorded in the Statement of Operations at the closing or expiration of the contracts. Cash deposited with a broker as initial margin is recorded on the Statement of Assets and Liabilities. A receivable and/or payable to brokers for daily variation margin is also recorded on the Statement of Assets and Liabilities.
Investments in futures contracts may include certain risks, which may be different from, and potentially greater than, those of the underlying securities. To the extent the Fund uses futures, it is exposed to additional volatility and potential losses resulting from leverage.
The Fund entered into long S&P 500 futures contracts to provide equity exposure in an amount comparable to the Fund’s net cash position. During the year ended December 31, 2015, these S&P 500 futures contracts had notional values ranging from 0% to 2% of net assets.
Indemnification Under the Trust’s organizational documents, its officers and trustees are indemnified against certain liabilities arising out of the performance of their duties to the Trust. In addition, in the normal course of business the Trust enters into contracts that provide general indemnities to other parties. The Trust’s maximum exposure under these arrangements is unknown as this would involve future claims that may be made against the Trust that have not yet occurred.
NOTE 2—VALUATION MEASUREMENTS
Various inputs are used in determining the value of the Fund’s investments. These inputs are summarized in the three broad levels listed below.
| § | | Level 1: Quoted prices in active markets for identical securities |
| § | | Level 2: Other significant observable inputs (including quoted prices for similar securities, market indices, interest rates, credit risk, etc.) |
| § | | Level 3: Significant unobservable inputs (including Fund management’s assumptions in determining the fair value of investments) |
The inputs or methodology used for valuing securities are not necessarily an indication of the risk associated with investing in those securities.
The following is a summary of the inputs used to value the Fund’s holdings at December 31, 2015:
| | | | | | | | |
| Classification(a) | | LEVEL 1
(Quoted Prices) | | | LEVEL 2
(Other Significant
Observable Inputs) | |
Securities | | | | | | | | |
Common Stocks(b) | | $ | 53,664,411,142 | | | $ | — | |
Short-term Investments | | | | | | | | |
Money Market Fund | | | 55,422,858 | | | | — | |
Repurchase Agreement | | | — | | | | 1,204,145,000 | |
| | | | | | | | |
Total | | $ | 53,719,834,000 | | | $ | 1,204,145,000 | |
| | | | | | | | |
Other Financial Instruments(c) | | | | | | | | |
Index Futures Contracts | | | | | | | | |
Appreciation | | $ | 1,713,207 | | | $ | — | |
| | | | | | | | | |
| (a) | There were no transfers between Level 1 and Level 2 during the year ended December 31, 2015. There were no Level 3 securities at December 31, 2015 and 2014, and there were no transfers to Level 3 during the year. |
| (b) | All common stocks held in the Fund are Level 1 securities. For a detailed break-out of common stocks by major industry classification, please refer to the Portfolio of Investments. |
| (c) | Represents unrealized appreciation/(depreciation). |
NOTE 3—RELATED PARTY TRANSACTIONS
Management fees Under a written agreement approved by a unanimous vote of the Board of Trustees, the Fund pays an annual management fee of 0.50% of the Fund’s average daily net assets to Dodge & Cox, investment manager of the Fund. The agreement further provides that Dodge & Cox shall waive its fee to the extent that such fee plus all other ordinary operating expenses of the Fund exceed 0.75% of the average daily net assets for the year.
Fund officers and trustees All officers and two of the trustees of the Trust are officers or employees of Dodge & Cox. The Trust pays a fee only to those trustees who are not affiliated with Dodge & Cox.
NOTE 4—INCOME TAX INFORMATION AND DISTRIBUTIONS TO SHAREHOLDERS
A provision for federal income taxes is not required since the Fund intends to continue to qualify as a regulated investment company under Subchapter M of the Internal Revenue Code and distribute all of its taxable income to shareholders. Distributions are determined in accordance with income tax regulations, and such amounts may differ from net investment income and realized gains for financial reporting purposes. Financial reporting records are adjusted for permanent book to tax differences at year end to reflect tax character.
Book to tax differences are primarily due to differing treatments of wash sales, in-kind redemptions, net short-term realized gain (loss), and Index Futures Contracts. During the year, the Fund recognized net realized gains of $68,854,889 from the delivery of appreciated securities in an in-kind redemption transaction. For federal income tax purposes, this gain is not recognized as taxable income to the Fund and therefore will not be distributed to shareholders. At December 31, 2015, the cost of investments for federal income tax purposes was $42,086,555,899.
DODGE & COX STOCK FUND §PAGE 11
NOTES TO FINANCIAL STATEMENTS
Distributions during the years noted below were characterized as follows for federal income tax purposes:
| | | | | | | | |
| | | Year Ended December 31, 2015 | | | Year Ended
December 31, 2014 | |
Ordinary income | | | $813,298,971 | | | | $908,453,128 | |
| | | ($2.460 per share) | | | | ($2.800 per share) | |
| | |
Long-term capital gain | | | $2,475,923,268 | | | | $840,004,493 | |
| | | ($7.577 per share) | | | | ($2.560 per share) | |
At December 31, 2015, the tax basis components of distributable earnings were as follows:
| | | | |
Unrealized appreciation | | $ | 15,260,989,069 | |
Unrealized depreciation | | | (2,423,565,968 | ) |
| | | | |
Net unrealized appreciation | | | 12,837,423,101 | |
Undistributed ordinary income | | | 7,503,253 | |
Undistributed long-term capital gain | | | 898,242,453 | |
Fund management has reviewed the tax positions for open periods (three years and four years, respectively, from filing the Fund’s Federal and State tax returns) as applicable to the Fund, and has determined that no provision for income tax is required in the Fund’s financial statements.
NOTE 5—LOAN FACILITIES
Pursuant to an exemptive order issued by the Securities and Exchange Commission (SEC), the Fund may participate in an interfund lending facility (Facility). The Facility allows the Fund to borrow money from or loan money to the Funds. Loans under the Facility are made for temporary or emergency purposes, such as to fund shareholder redemption requests. Interest on borrowings is the average of the current repurchase agreement rate and the bank loan rate. There was no activity in the Facility during the year.
All Funds in the Trust participate in a $500 million committed credit facility (Line of Credit) with State Street Bank and Trust Company, to be utilized for temporary or emergency purposes to fund shareholder redemptions or for other short-term liquidity purposes. The maximum amount available to the Fund is $250 million. Each Fund pays an annual commitment fee on its pro-rata portion of the Line of Credit. For the year ended December 31, 2015, the Fund’s commitment fee amounted to $178,907 and is reflected as a Miscellaneous Expense in the Statement of Operations. Interest on borrowings is charged at the prevailing rate. There were no borrowings on the Line of Credit during the year.
NOTE 6—PURCHASES AND SALES OF INVESTMENTS
For the year ended December 31, 2015 purchases and sales of securities, other than short-term securities, aggregated $8,811,129,493 and $11,133,446,900, respectively.
NOTE 7—SUBSEQUENT EVENTS
Fund management has determined that no material events or transactions occurred subsequent to December 31, 2015, and through the date of the Fund’s financial statements issuance, which require additional disclosure in the Fund’s financial statements.
PAGE 12 § DODGE & COX STOCK FUND
NOTES TO FINANCIAL STATEMENTS
NOTE 8—HOLDINGS OF 5% VOTING SECURITIES
Each of the companies listed below was considered to be an affiliate of the Fund because the Fund owned 5% or more of the company’s voting securities during all or part of the year ended December 31, 2015. Purchase and sale transactions and dividend income earned during the year on these securities were as follows:
| | | | | | | | | | | | | | | | | | | | | | | | |
| | | Shares at
Beginning of Year | | | Additions | | | Reductions | | | Shares at
End of Year | | | Dividend
Income(a) | | | Value at End of Year | |
ADT Corp. | | | 11,819,337 | | | | — | | | | (680,900 | ) | | | 11,138,437 | | | $ | 9,613,243 | | | $ | 367,345,652 | |
AOL, Inc. | | | 7,100,754 | | | | — | | | | (7,100,754 | ) | | | — | | | | — | (b) | | | — | |
Apache Corp. | | | 18,390,028 | | | | 918,617 | | | | (3,948,800 | ) | | | 15,359,845 | | | | 17,987,095 | | | | — | (c) |
Capital One Financial Corp. | | | 28,169,211 | | | | 2,020,000 | | | | (402,600 | ) | | | 29,786,611 | | | | 43,659,793 | | | | 2,149,997,582 | |
Celanese Corp., Series A | | | 9,220,971 | | | | — | | | | (2,000,973 | ) | | | 7,219,998 | | | | 9,652,893 | | | | — | (c) |
Hewlett Packard Enterprise Co. | | | — | | | | 91,237,195 | | | | (252,200 | ) | | | 90,984,995 | | | | 5,004,175 | | | | 1,382,971,924 | |
Maxim Integrated Products, Inc. | | | 16,326,840 | | | | 500,000 | | | | (3,291,100 | ) | | | 13,535,740 | | | | 17,840,454 | | | | — | (c) |
NetApp, Inc. | | | 19,794,000 | | | | 2,800,000 | | | | (1,061,269 | ) | | | 21,532,731 | | | | 14,697,360 | | | | 571,263,353 | |
Symantec Corp. | | | 51,921,000 | | | | 2,340,000 | | | | (150,000 | ) | | | 54,111,000 | | | | 32,177,100 | | | | 1,136,331,000 | |
Synopsys, Inc. | | | 13,627,969 | | | | — | | | | (4,434,500 | ) | | | 9,193,469 | | | | — | (b) | | | 419,314,121 | |
| | | | | | | | | | | | | | | | | | | | | | | | |
| | | | | | | | | | | | | | | | | | $ | 150,632,113 | | | $ | 6,027,223,632 | |
| | | | | | | | | | | | | | | | | | | | | | | | |
| | | | | | | | | | | | | | | | | | | | | | | | | |
| (a) | Net of foreign taxes, if any |
| (c) | Company was not an affiliate at year end |
DODGE & COX STOCK FUND §PAGE 13
FINANCIAL HIGHLIGHTS
| | | | | | | | | | | | | | | | | | | | |
SELECTED DATA AND RATIOS (for a share outstanding throughout each year) | | Year Ended December 31, | |
| | | 2015 | | | 2014 | | | 2013 | | | 2012 | | | 2011 | |
| | | | |
Net asset value, beginning of year | | | $180.94 | | | | $168.87 | | | | $121.90 | | | | $101.64 | | | | $107.76 | |
Income from investment operations: | | | | | | | | | | | | | | | | | | | | |
Net investment income | | | 2.42 | | | | 2.83 | | | | 2.11 | | | | 1.98 | | | | 1.76 | |
Net realized and unrealized gain (loss) | | | (10.55 | ) | | | 14.60 | | | | 46.97 | | | | 20.26 | | | | (6.13 | ) |
| | | | |
Total from investment operations | | | (8.13 | ) | | | 17.43 | | | | 49.08 | | | | 22.24 | | | | (4.37 | ) |
| | | | |
Distributions to shareholders from: | | | | | | | | | | | | | | | | | | | | |
Net investment income | | | (2.46 | ) | | | (2.80 | ) | | | (2.11 | ) | | | (1.98 | ) | | | (1.75 | ) |
Net realized gain | | | (7.58 | ) | | | (2.56 | ) | | | — | | | | — | | | | — | |
| | | | |
Total distributions | | | (10.04 | ) | | | (5.36 | ) | | | (2.11 | ) | | | (1.98 | ) | | | (1.75 | ) |
| | | | |
Net asset value, end of year | | | $162.77 | | | | $180.94 | | | | $168.87 | | | | $121.90 | | | | $101.64 | |
| | | | |
Total return | | | (4.47 | )% | | | 10.43 | % | | | 40.55 | % | | | 22.01 | % | | | (4.08 | )% |
Ratios/supplemental data: | | | | | | | | | | | | | | | | | | | | |
Net assets, end of year (millions) | | | $54,845 | | | | $60,260 | | | | $54,848 | | | | $39,841 | | | | $36,562 | |
Ratio of expenses to average net assets | | | 0.52 | % | | | 0.52 | % | | | 0.52 | % | | | 0.52 | % | | | 0.52 | % |
Ratio of net investment income to average net assets | | | 1.36 | % | | | 1.62 | % | | | 1.45 | % | | | 1.72 | % | | | 1.62 | % |
Portfolio turnover rate | | | 15 | % | | | 17 | % | | | 15 | % | | | 11 | % | | | 16 | % |
See accompanying Notes to Financial Statements
PAGE 14 § DODGE & COX STOCK FUND
REPORT OF INDEPENDENT REGISTERED PUBLIC ACCOUNTING FIRM
To the Trustees of Dodge & Cox Funds and Shareholders of Dodge & Cox Stock Fund
In our opinion, the accompanying statement of assets and liabilities, including the portfolio of investments, and the related statements of operations and of changes in net assets and the financial highlights present fairly, in all material respects, the financial position of Dodge & Cox Stock Fund (the “Fund”, one of the series constituting Dodge & Cox Funds) at December 31, 2015, the results of its operations for the year then ended, the changes in its net assets for each of the two years in the period then ended and the financial highlights for each of the five years in the period then ended, in conformity with accounting principles generally accepted in the United States of America. These financial statements and financial highlights (hereafter referred to as financial statements) are the responsibility of the Fund’s management. Our responsibility is to express an opinion on these financial statements based on our audits. We conducted our audits of these financial statements in accordance with the standards of the Public Company Accounting Oversight Board (United States). Those standards require that we plan and perform the audit to obtain reasonable assurance about whether the financial statements are free of material misstatement. An audit includes examining, on a test basis, evidence supporting the amounts and disclosures in the financial statements, assessing the accounting principles used and significant estimates made by management, and evaluating the overall financial statement presentation. We believe that our audits, which included confirmation of securities at December 31, 2015, by correspondence with the custodian and brokers, provide a reasonable basis for our opinion.
PricewaterhouseCoopers LLP
San Francisco, California
February 25, 2016
DODGE & COX STOCK FUND §PAGE 15
SPECIAL 2015 TAX INFORMATION
(unaudited)
The following information is provided pursuant to provisions of the Internal Revenue Code:
The Fund designates up to a maximum amount of $1,125,715,182 of its distributions paid to shareholders in 2015 as qualified dividends (treated for federal income tax purposes in the hands of shareholders as taxable at a maximum rate of 20%).
For shareholders that are corporations, the Fund designates 100% of its ordinary dividends paid to shareholders in 2015 as dividends from domestic corporations eligible for the corporate dividends received deduction, provided that the shareholder otherwise satisfies applicable requirements to claim that deduction.
BOARD APPROVAL OF FUNDS’ INVESTMENT MANAGEMENT AGREEMENTS AND MANAGEMENT FEES
(unaudited)
The Board of Trustees is responsible for overseeing the performance of the Dodge & Cox Funds’ investment manager and determining whether to continue the Investment Management Agreements between the Funds and Dodge & Cox each year (the “Agreements”). At a meeting of the Board of Trustees of the Trust held on December 16, 2015, the Trustees, by a unanimous vote (including a separate vote of those Trustees who are not “interested persons” (as defined in the Investment Company Act of 1940) (the “Independent Trustees”)), approved the renewal of the Agreements for an additional one-year term through December 31, 2016 with respect to each Fund. During the course of the year, the Board received a wide variety of materials relating to the investment management and administrative services provided by Dodge & Cox and the performance of each of the Funds.
INFORMATION RECEIVED
In advance of the meeting, the Board, including each of the Independent Trustees, requested, received, and reviewed materials relating to the Agreements and the services provided by Dodge & Cox. The Independent Trustees retained Morningstar® to prepare an independent expense and performance summary for each Fund and comparable funds managed by other advisers identified by Morningstar. The Morningstar materials included information regarding advisory fee rates, expense ratios, and transfer agency, custodial, and distribution expenses, as well as appropriate performance comparisons to each Fund’s peer group and an index or combination of indices. The Morningstar materials also included a comparison of expenses of various share classes offered by comparable funds. The materials reviewed by the Board contained information concerning, among other things, Dodge & Cox’s profitability, financial results and condition, advisory fee revenue, and separate account and sub-adviser fund fee schedules. The Board additionally considered the Funds’ brokerage commissions, turnover rates, sales and redemption data and the significant investment that Dodge & Cox makes in research used in managing the Funds. The Board received and reviewed memoranda and related materials addressing, among other things, Dodge & Cox’s services to the Funds; how Dodge & Cox Funds’ fees compare to fees of peer group funds; the different fees, services, costs, and risks associated with
other accounts managed by Dodge & Cox as compared to the Dodge & Cox Funds; and the ways in which the Funds realize economies of scale. Throughout the process of reviewing the services provided by Dodge & Cox and preparing for the meeting, the Independent Trustees found Dodge & Cox to be open, forthright, detailed, and very helpful in answering questions about all issues. The Board received copies of the Agreements and a memorandum from the independent legal counsel to the Independent Trustees discussing the factors generally regarded as appropriate to consider in evaluating advisory arrangements. The Trust’s Contract Review Committee, consisting solely of Independent Trustees, met with the independent legal counsel on November 11, 2015, and again on December 16, 2015, to discuss whether to renew the Agreements. The Board, including the Independent Trustees, subsequently concluded that the existing Agreements are fair and reasonable and voted to approve the Agreements. In considering the Agreements, the Board, including the Independent Trustees, did not identify any single factor or particular information as all-important or controlling. In reaching the decision to approve the Agreements, the Board considered several factors, discussed below, to be key factors and reached the conclusions described below.
NATURE, QUALITY, AND EXTENT OF THE SERVICES
The Board considered that Dodge & Cox provides a wide range of services to the Funds in addition to portfolio management and that the quality of these services has been excellent in all respects. The extensive nature of services provided by Dodge & Cox has been documented in materials provided to the Board and in presentations made to the Board throughout the year. In particular, the Board considered the nature, quality, and extent of portfolio management, administrative, and shareholder services performed by Dodge & Cox. With regard to portfolio management services, the Board considered Dodge & Cox’s established long-term history of care and conscientiousness in the management of the Funds; its demonstrated consistency in investment approach and depth; the background and experience of the Dodge & Cox Investment Policy Committee, International Investment Policy Committee, Global Stock Investment Policy Committee, Fixed Income Investment Policy Committee, and Global Bond Investment Policy Committee, and research analysts responsible for managing the Funds; its methods for assessing the regulatory and investment climate in various jurisdictions; Dodge & Cox’s overall high level of attention to its core investment management function; and its commitment to the Funds and their shareholders. In the area of administrative and shareholder services, the Board considered the excellent quality of Dodge & Cox’s work in areas such as compliance, legal services, trading, proxy voting, technology, oversight of the Funds’ transfer agent and custodian, tax compliance, and shareholder communication through its website and other means. The Board also noted Dodge & Cox’s diligent disclosure policy, its favorable compliance record, and its reputation as a trusted, shareholder-friendly mutual fund family. In addition, the Board considered that Dodge & Cox manages approximately $185 billion in Fund assets with fewer professionals
PAGE 16 § DODGE & COX STOCK FUND
than most comparable funds, and that on average these professionals have more experience and longer tenure than investment professionals at comparable funds. The Board also noted that Dodge & Cox is an investment research-oriented firm with no other business endeavors to distract management’s attention from its research efforts, and that its investment professionals adhere to a consistent investment approach across the Funds. The Board further considered the favorable stewardship grades given by Morningstar to each of the Funds and the “Gold” analyst rating awarded by Morningstar to all of the Funds except the Global Bond Fund. The Board concluded that it was satisfied with the nature, extent, and quality of investment management and other services provided to the Funds by Dodge & Cox.
INVESTMENT PERFORMANCE
The Board considered short-term and long-term investment performance for each Fund (including periods of outperformance or underperformance) as compared to both relevant indices and the performance of such Fund’s peer group. The Board noted that the Funds had weak absolute and relative performance in 2015, but remained solid performers over longer periods. The Board determined after extensive review and inquiry that Dodge & Cox’s historic, long-term, team-oriented, bottom-up investment approach remains consistent and that Dodge & Cox continues to be distinguished by its integrity, transparency, and independence. The Board considered that the performance of the Funds is the result of a team-oriented investment management process that emphasizes a long-term investment horizon, comprehensive independent research, price discipline, low cost and low portfolio turnover. The Board also considered that the investment performance delivered by Dodge & Cox to the Funds appeared to be consistent with the relevant performance delivered for other clients of Dodge & Cox. The Board concluded that Dodge & Cox has delivered favorable long-term performance for Fund investors consistent with the long-term investment strategies being pursued by the Funds.
COSTS AND ANCILLARY BENEFITS
Costs of Services to Funds: Fees and Expenses. The Board considered each Fund’s management fee rate and expense ratio relative to each Fund’s peer group and relative to management fees charged by Dodge & Cox to other clients. In particular, the Board considered that the Funds continue to be substantially below their peer group median in expense ratios and that many media and industry reports specifically comment on the low expense ratios of the Funds, which have been a defining characteristic of the Funds for many years. The Board also evaluated the operating structures of the Funds and Dodge & Cox, noting that the Funds do not charge front-end sales commissions or distribution fees, and Dodge & Cox bears, among other things, the significant cost of third party research, reimbursement for recordkeeping and administrative costs to third-party retirement plan administrators, and administrative and office overhead.
The Board noted that expenses are well below industry averages. When compared to peer group funds, the Funds are in the quartile with the lowest expense ratios. The Board also
considered that the Funds receive numerous administrative, regulatory compliance, legal, technology and shareholder support services from Dodge & Cox without any additional administrative fee and the fact that the Funds have relatively low transaction costs and portfolio turnover rates. The Board noted the Funds’ unusual single-share-class structure and reviewed Morningstar data showing that the few peer group funds with lower expense ratios often have other share classes with significantly higher expense ratios. In this regard, the Board considered that many of the Funds’ shareholders would not be eligible to purchase comparably-priced shares of many peer group funds, which typically make their lower-priced share classes available only to institutional investors. The Board determined that the Funds provide access for small investors to high quality investment management at a relatively low cost.
The Board reviewed information regarding the fee rates Dodge & Cox charges to separate accounts and subadvised funds that have investment programs similar to those of the Funds, including instances where separate account and sub-advised fund fees are lower than Fund fees. The Board considered differences in the nature and scope of services Dodge & Cox provides to the Funds as compared to other client accounts, differences in regulatory, litigation, and other risks as between Dodge & Cox Funds and other types of clients. The Board also noted that different markets exist for mutual fund and institutional separate account management services. With respect to non-U.S. funds sponsored and managed by Dodge & Cox that are comparable to the Funds in many respects, the Board noted that the fee rates charged by Dodge & Cox are the same as or higher than the fee rates charged to the Funds. After consideration of these matters, the Board concluded that the overall costs incurred by the Funds for the services they receive (including the management fee paid to Dodge & Cox) are reasonable and that the fees are acceptable based upon the qualifications, experience, reputation, and performance of Dodge & Cox and the low overall expense ratios of the Funds.
Profitability and Costs of Services to Dodge & Cox; “Fall-out” Benefits. The Board reviewed reports of Dodge & Cox’s financial position, profitability, and estimated overall value, and considered Dodge & Cox’s overall profitability within its context as a private, employee-owned S-Corporation and relative to the favorable services provided. The Board noted in particular that Dodge & Cox’s profits are not generated by high fee rates, but reflect an extraordinarily streamlined, efficient, and focused business approach toward investment management. The Board recognized the importance of Dodge & Cox’s profitability—which is derived solely from management fees and does not include other business ventures—to maintain its independence, stability, company culture and ethics, and management continuity. The Board also considered that the compensation/profit structure at Dodge & Cox includes a return on shareholder employees’ investment in the firm, which is vital for remaining independent and facilitating retention of management and investment professionals. The Board considered independent research indicating that firms that grow organically, rather than through acquisition, tend to have better performance. Key to organic growth is the ability to retain talented and experienced analysts, portfolio managers and other professionals.
DODGE & COX STOCK FUND §PAGE 17
The Board also considered that in January 2015, Dodge & Cox closed the International Stock Fund to new investors to pro-actively manage the growth of the Fund. The Stock Fund and Balanced Fund were similarly closed to new investors during periods of significant growth in the past. While these actions are intended to benefit existing shareholders, the effect is to reduce potential revenues to Dodge & Cox from new shareholders. The Board also considered potential “fall-out” benefits (including the receipt of research from unaffiliated brokers and reputational benefits to non-U.S. funds sponsored and managed by Dodge & Cox) that Dodge & Cox might receive as a result of its association with the Funds and determined that they are acceptable. The Board also noted that Dodge & Cox continues to invest substantial sums in its business in order to provide enhanced services, systems and research capabilities, all of which benefit the Funds. The Board concluded that Dodge & Cox’s profitability is the keystone of its independence, stability and long-term investment performance and that the profitability of Dodge & Cox’s relationship with the Funds (including fall-out benefits) is fair and reasonable.
ECONOMIES OF SCALE
The Board considered whether there have been economies of scale with respect to the management of each Fund, whether the Funds have appropriately benefited from any economies of scale, and whether the management fee rate is reasonable in relation to the Fund assets and any economies of scale that may exist. In the Board’s view, any consideration of economies of scale must take account of the Funds’ low fee structure and the considerable efficiencies of the Funds’ organization and fee structure that has been realized by shareholders from the time of each Fund’s inception (i.e., from the first dollar). An assessment of economies of scale must also take into account that Dodge & Cox invests significant time and resources in each new Fund for months (and sometimes years) prior to launch; in addition, expenses are capped, which means that Dodge & Cox earns no revenue and subsidizes the operations of a new Fund for a period of time until it reaches scale.
In addition, the Board noted that Dodge & Cox has shared economies of scale by adding or enhancing services to the Funds over time, and that the internal costs of providing investment management, up-to-date technology, administrative, legal, and compliance services to the Funds continue to increase. For example, Dodge & Cox has increased its global research staff and investment resources over the years to address the increased complexity of investing in multinational and non-U.S. companies. In addition, Dodge & Cox has made substantial expenditures in other staff, technology, cybersecurity, and infrastructure to enable it to integrate credit and equity analyses and to be able to implement its strategy in a more effective and secure manner. Over the last ten years, Dodge & Cox has increased its spending on third party research, data services, trading systems, technology, and recordkeeping service expenses at a rate that has significantly outpaced the Funds’ growth rate during the same period.
The Board considered that Dodge & Cox has a history of voluntarily limiting asset growth in several Funds that experienced significant inflows by closing them to new investors in order to protect the Funds’ ability to achieve good investment returns for shareholders. The Board also observed that, even without fee breakpoints, the Funds are competitively priced in a very competitive market and that having a low fee from inception is better for shareholders than starting with a higher fee and adding breakpoints. The Board concluded that the current Dodge & Cox fee structure is fair and reasonable and adequately shares economies of scale that may exist.
CONCLUSION
Based on their evaluation of all material factors and assisted by the advice of independent legal counsel to the Independent Trustees, the Board, including the Independent Trustees, concluded that the advisory fee structure was fair and reasonable, that each Fund was paying a competitive fee for the services provided, that the scope and quality of Dodge & Cox’s services has provided substantial value for Fund shareholders over the long term, and that approval of the Agreements was in the best interests of each Fund and its shareholders.
FUND HOLDINGS
The Fund provides a complete list of its holdings four times each fiscal year, as of the end of each quarter. The Fund files the lists with the Securities and Exchange Commission (SEC) on Form N-CSR (second and fourth quarters) and Form N-Q (first and third quarters). Shareholders may view the Fund’s Forms N-CSR and N-Q on the SEC’s website at sec.gov. Forms N-CSR and N-Q may also be reviewed and copied at the SEC’s Public Reference Room in Washington, DC. Information regarding the operations of the Public Reference Room may be obtained by calling 202-551-8090 (direct) or 800-732-0330 (general SEC number). A list of the Fund’s quarter-end holdings is also available at dodgeandcox.com on or about 15 days following each quarter end and remains available on the website until the list is updated in the subsequent quarter.
PROXY VOTING
For a free copy of the Fund’s proxy voting policies and procedures, please call 800-621-3979, visit the Fund’s website at dodgeandcox.com, or visit the SEC’s website at sec.gov. Information regarding how the Fund voted proxies relating to portfolio securities during the most recent 12-month period ending June 30 is also available at dodgeandcox.com or at sec.gov.
HOUSEHOLD MAILINGS
The Fund routinely mails shareholder reports and summary prospectuses to shareholders and, on occasion, proxy statements. In order to reduce the volume of mail, when possible, only one copy of these documents will be sent to shareholders who are part of the same family and share the same residential address.
If you have a direct account with the Funds and you do not want the mailing of shareholder reports and summary prospectuses combined with other members in your household, contact the Funds at 800-621-3979. Your request will be implemented within 30 days.
PAGE 18 § DODGE & COX STOCK FUND
DODGE & COX FUNDS—EXECUTIVE OFFICER & TRUSTEE INFORMATION
| | | | | | |
Name (Age) and
Address* | | Position with Trust (Year of Election or
Appointment) | | Principal Occupation During Past 5 Years | | Other Directorships Held by Trustees |
| INTERESTED TRUSTEES AND EXECUTIVE OFFICERS |
| Charles F. Pohl (57) | | Chairman and Trustee (Officer since 2004) | | Chairman (since 2013), Co-President (2011-2013), Senior Vice President (until 2011), and Director of Dodge & Cox; Chief Investment Officer, Portfolio Manager, Investment Analyst, and member of Investment Policy Committee (IPC), Global Stock Investment Policy Committee (GSIPC), International Investment Policy Committee (IIPC), and Fixed Income Investment Policy Committee (FIIPC) | | — |
| Dana M. Emery (54) | | President and Trustee (Trustee since 1993) | | Chief Executive Officer (since 2013), President (since 2011), Executive Vice President (until 2011), and Director of Dodge & Cox; Director of Fixed Income, Portfolio Manager, and member of FIIPC and Global Bond Investment Policy Committee (GBIPC) | | — |
| John A. Gunn (72) | | Senior Vice President (Officer since 1998) | | Chairman Emeritus (2011-2013), Chairman (until 2011), Chief Executive Officer (until 2010), and Director (until 2013) of Dodge & Cox; Portfolio Manager and member of IPC, GSIPC (until 2014), and IIPC (until 2015) | | — |
| Diana S. Strandberg (56) | | Senior Vice President (Officer since 2006) | | Senior Vice President (since 2011), Vice President (until 2011), and Director (since 2011) of Dodge & Cox; Director of International Equity (since 2009), Portfolio Manager, Investment Analyst, and member of IPC, GSIPC, IIPC, and GBIPC | | — |
| David H. Longhurst (58) | | Treasurer (Officer since 2006) | | Vice President and Assistant Treasurer of Dodge & Cox | | — |
| Thomas M. Mistele (62) | | Secretary (Officer since 1998) | | Chief Operating Officer, Director, Secretary, Senior Counsel (since 2011), and General Counsel (until 2011) of Dodge & Cox | | — |
| Katherine M. Primas (41) | | Chief Compliance Officer (Officer since 2009) | | Vice President (since 2011) and Chief Compliance Officer of Dodge & Cox | | — |
| INDEPENDENT TRUSTEES |
| Thomas A. Larsen (66) | | Trustee (Since 2002) | | Senior Counsel of Arnold & Porter LLP (law firm) (since 2013); Partner of Arnold & Porter LLP (until 2012); Director of Howard, Rice, Nemerovski, Canady, Falk & Rabkin (1977-2011) | | — |
| Ann Mather (55) | | Trustee (Since 2011) | | CFO, Pixar Animation Studios (1999-2004) | | Director, Google, Inc. (internet information services) (since 2005); Director, Glu Mobile, Inc. (multimedia software) (since 2005); Director, Netflix, Inc. (internet television) (since 2010); Director, Arista Networks (cloud networking) (since 2013); Director, Shutterfly, Inc. (internet photography services/publishing) (since 2013) |
| Robert B. Morris III (63) | | Trustee (Since 2011) | | Advisory Director, The Presidio Group (since 2005) | | — |
| Gary Roughead (64) | | Trustee (Since 2013) | | Annenberg Distinguished Visiting Fellow, Hoover Institution (since 2012); Admiral, United States Navy (Ret.); U.S. Navy Chief of Naval Operations (2008-2011) | | Director, Northrop Grumman Corp. (global security) (since 2012) |
| Mark E. Smith (64) | | Trustee (Since 2014) | | Executive Vice President, Managing Director—Fixed Income at Loomis Sayles & Company, L.P. (2003-2011) | | — |
| John B. Taylor (69) | | Trustee (Since 2005) (and 1995-2001) | | Professor of Economics, Stanford University (since 1984); Senior Fellow, Hoover Institution (since 1996); Under Secretary for International Affairs, United States Treasury (2001-2005) | | — |
| * | | The address for each Officer and Trustee is 555 California Street, 40th Floor, San Francisco, California 94104. Each Officer and Trustee oversees all six series in the Dodge & Cox Funds complex and serves for an indefinite term. |
Additional information about the Trust’s Trustees and Officers is available in the Trust’s Statement of Additional Information (SAI). You can get a free copy of the SAI by visiting the Funds’ website at dodgeandcox.com or calling
800-621-3979.
DODGE & COX STOCK FUND §PAGE 19
dodgeandcox.com
For Fund literature, transactions, and account
information, please visit the Funds’ website.
or write or call:
DODGE & COX FUNDS
c/o Boston Financial Data Services
P.O. Box 8422
Boston, Massachusetts 02266-8422
(800) 621-3979
INVESTMENT MANAGER
Dodge & Cox
555 California Street, 40th Floor
San Francisco, California 94104
(415) 981-1710
This report is submitted for the general information of the shareholders of the Fund. The report is not authorized for distribution to prospective investors in the Fund unless it is accompanied by a current prospectus.
This report reflects our views, opinions, and portfolio holdings as of December 31, 2015, the end of the reporting period. Any such views are subject to change at any time based upon market or other conditions and Dodge & Cox disclaims any responsibility to update such views. These views may not be relied on as investment advice and, because investment decisions for a Dodge & Cox Fund are based on numerous factors, may not be relied on as an indication of trading intent on behalf of any Dodge & Cox Fund.
DODGE & COX FUNDS®
Annual Report
December 31, 2015
Global Stock Fund
ESTABLISHED 2008
TICKER: DODWX
12/15 GSF AR Printed on recycled paper
TO OUR SHAREHOLDERS
The Dodge & Cox Global Stock Fund had a total return of –8.1% for the year ending December 31, 2015, compared to a return of
–0.9% for the MSCI World Index.
MARKET COMMENTARY
Global growth expectations declined during 2015. Slower growth in China, the largest consumer of raw materials worldwide, was of particular significance as it negatively impacted commodity prices, as well as the currencies of commodity-driven economies. Global copper prices plummeted 24% and oil prices plunged 35%. The Brazilian real and South African rand depreciated 33% and 25%, respectively, relative to the U.S. dollar. Prospects for higher U.S. interest rates, coupled with the U.S. dollar’s sharp appreciation against major global currencies, further exacerbated conditions for those emerging market economies in need of external financing. As a result, while the MSCI Emerging Markets index was down 6% in local currency for the year, it was down 15% in U.S. dollars.
In Europe, a dampened economic recovery and a weaker inflation outlook led the European Central Bank to extend its asset purchase program aimed at reviving the economy. The Bank of Japan, in turn, introduced measures to supplement its already large Quantitative and Qualitative Easing Program, as economic activity softened and inflation hovered around zero. In contrast, economic activity in the United States expanded at a moderate pace: household spending and business investment increased, the housing market strengthened, and labor market conditions continued to improve, with solid job gains and reduced unemployment. After a significant selloff in August and September, the S&P 500 rebounded during the fourth quarter to finish the year up just over 1%.
INVESTMENT STRATEGY
As a value-oriented manager, 2015 was a challenging year for absolute and relative performance. Across equities, value stocks (the lower valuation portion of the market) underperformed growth stocks (the higher valuation portion of the market) by one of the widest spreads since the global financial crisis. The Fund was significantly affected by this performance divergence. For example, in the United States, many higher-valuation growth companies, not held by the Fund, outperformed significantly. In addition, emerging markets collectively underperformed developed markets. The Fund’s investments in individual companies domiciled in a number of especially weak emerging market countries (including Brazil, South Africa, and Turkey) negatively impacted results. Finally, several individual holdings—HP Inc(a), MTN Group, Petrobras, and Standard Chartered—meaningfully detracted from results for the year.
Throughout 2015, we continued to revisit and retest our thinking on many of the Fund’s holdings. Our equity and fixed income teams regularly work together to evaluate risk and reward as we look at investment opportunities around the world. As part of our bottom-up research process, our investment teams thoroughly investigated individual company concerns, challenged
analyst assumptions, and conducted further due diligence. In addition, we conducted macroeconomic reviews to evaluate the key factors affecting a company’s capital structure, end-market demand, and relative competitiveness. Through this comprehensive process, we reaffirmed our view that the Fund’s holdings have attractive valuations relative to their fundamental outlook over our three- to five-year investment horizon.
During the year, valuation disparities widened globally: companies with higher valuations became more expensive relative to companies with lower valuations. As valuations became more attractive, we added selectively to existing holdings, including Bank of America, EMC Corp., HP Inc., and Standard Chartered.(b) We also identified 6 new investment opportunities (including Anthem, Cisco, JD.com, and Priceline) and exited 17 holdings (including PayPal and Unilever).
We continue to be optimistic about the long-term outlook for the portfolio. Our value-oriented approach has led us to invest in companies where we believe the long-term potential is not reflected in the current price. Three examples—Standard Chartered, Hewlett Packard Enterprise, and HP Inc.—are discussed below.
Standard Chartered
Standard Chartered, domiciled in the United Kingdom, provides consumer and wholesale banking services to customers in Asia, Africa, and the Middle East. The company has a strong global franchise with a broad network across the developing world that would be very difficult to replicate. Standard Chartered’s global payments and trade business is a particular strength: local roots from its longstanding presence allow for local currency funding, and cooperation across the network provides integrated wholesale banking services to clients. During 2015, Standard Chartered’s performance suffered from the slowdown in emerging markets, large fines from legacy issues, rising restructuring costs, and deteriorating asset quality. As a result, Standard Chartered’s stock was down 39%(c) in U.S. dollars and its valuation fell to 0.6 times tangible book value, a historically low level.(d)
In 2015, we met with Standard Chartered’s new executive team on multiple occasions to better understand its strategy and priorities. This management team is focused on streamlining the organization and prioritizing profitability over growth. They have a realistic assessment of current balance sheet issues, as evidenced by the recent $5.1 billion capital raise that provides ample new capital to fortify the balance sheet, resolve legacy issues, and accelerate their restructuring plans. The company seeks to cut costs, exit peripheral businesses, and increase investments to improve systems and further diversify its geographic footprint. In addition, Standard Chartered has been able to attract high-caliber talent with some key new hires. Based on the bank’s leading franchise, strong balance sheet, management’s initiatives, and low valuation, we recently added to the holding. On December 31, Standard Chartered was a 2.1% position in the Fund.
PAGE 2 § DODGE & COX GLOBAL STOCK FUND
Hewlett Packard Enterprise and HP Inc.
After providing strong returns in 2013 and 2014, Hewlett-Packard was the Fund’s largest detractor from results during 2015. Hewlett-Packard recently split into two entities—Hewlett Packard Enterprise and HP Inc.—which should result in greater focus and flexibility for each company to achieve its strategic goals. To assess secular challenges and evaluate the risks and opportunities of each stand-alone business, we met numerous times with their management teams and competitors and spoke with industry consultants. As a result, Hewlett Packard Enterprise was a 1.8% position and HP Inc. was a 1.4% position in the Fund on December 31.
Hewlett Packard Enterprise, one of the largest vendors in information technology (IT), consists of the enterprise technology infrastructure, software, and services segments of the old Hewlett-Packard. We acknowledge the company faces headwinds: the shift to the cloud has negatively impacted all on-premise IT vendors, continued public cloud adoption will likely erode the company’s market share, and competition is keen. Despite these risks, we believe Hewlett Packard Enterprise is an attractive investment due to its strong market positions across its portfolio (e.g., top provider of servers, number two position in IT services), scale advantages, and opportunities to improve its margin structure. Meg Whitman—the CEO of Hewlett Packard Enterprise—has overseen sound acquisitions (e.g., 3Par), new product launches, and cost reduction programs during her tenures at Hewlett-Packard and eBay. Management is actively cutting costs and retooling its product and service offerings to improve the company’s competitiveness. Margins in the Enterprise Services segment should expand as the company optimizes its contract mix and delivery models. The company trades at a compelling valuation (eight times forward estimated earnings), which is among the lowest in the S&P 500.
As the leader in printing and personal computer sales globally, HP Inc.’s key challenge is declining revenues. Partly due to the stronger U.S. dollar, consensus estimates have the company’s sales declining approximately 10% in 2016. Many investors believe a shrinking market for hardware and ink may be too difficult to overcome; we believe this view of the company’s prospects is too pessimistic. HP’s management is aggressively cutting costs and has plans to introduce more new products. For example, HP has portions of its printing business (e.g., high-end graphics production) that are currently growing and may increase share in the established copier market and in the more nascent 3D print market. Moreover, the company generates robust free cash flow. Trading at seven times forward estimated earnings, HP remains an attractive investment opportunity with strong business prospects given its large valuation discount to the overall market.
IN CLOSING
Global equity valuations are attractive: the MSCI World traded at 15.7 times forward estimated earnings (compared to a 20-year average of 16.2 times) with a 2.6% dividend yield at year end. Valuation disparities have widened significantly, creating more opportunities for value-oriented investors. We are identifying
attractively valued investments in both developed and emerging markets and continue to be optimistic about the long-term outlook for the portfolio.
Our experienced and stable team has weathered past periods of market turbulence by remaining steadfast in our investment process and philosophy. Our approach—constructing a diversified portfolio through in-depth, independent research, a three- to five-year investment horizon, and a focus on valuation relative to underlying fundamentals—continues to guide us through this period. We remain confident that our enduring value-oriented approach will benefit the Fund in the years ahead.
Thank you for your continued confidence in our firm. As always, we welcome your comments and questions.
For the Board of Trustees,
| | |
| | |
Charles F. Pohl, Chairman | | Dana M. Emery, President |
January 29, 2016
| (a) | | After Hewlett-Packard Co. split into two companies, HP Inc. retained the HPQ ticker symbol. HP Inc.’s –37% return in 2015 includes Hewlett-Packard Co.’s performance through October 2015. |
| (b) | | The use of specific examples does not imply that they are more attractive investments than the Fund’s other holdings. |
| (c) | | All returns are total returns unless otherwise noted. |
| (d) | | Unless otherwise specified, all weightings and characteristics are as of December 31, 2015. |
DODGE & COX GLOBAL STOCK FUND §PAGE 3
ANNUAL PERFORMANCE REVIEW
The Fund underperformed the MSCI World by 7.2 percentage points in 2015.
Key Detractors from Relative Results
| | § | | The Fund’s average overweight position in emerging markets (17% versus 0% for the MSCI World), a particularly weak region of the portfolio (down 21%), significantly detracted from results. | |
| | § | | Relative returns in the Financials sector (down 15% compared to down 4% for the MSCI World sector), especially in the emerging markets, hurt performance. BR Malls (down 53%), Kasikornbank (down 39%), Standard Chartered (down 39%), and ICICI Bank (down 28%) all detracted. | |
| | § | | Weak returns in the Consumer Staples sector (down 18% compared to up 6% for the MSCI World sector) hurt results. Wal-Mart (down 27%) performed poorly. | |
| | § | | The Fund’s holdings in the Telecommunication Services sector (down 24% compared to up 2% for the MSCI World sector) had a negative impact. MTN Group (down 53%) was a meaningful detractor. | |
| | § | | Additional detractors included Teck Resources (down 69% since date of purchase), Petrobras (down 55%), HP Inc. (down 37%), and Time Warner (down 23%). | |
Key Contributors to Relative Results
| | § | | Strong returns from the Fund’s holdings in the Health Care Providers and Services industry (up 18% compared to up 12% for the MSCI World industry) contributed to results. Cigna (up 42%) and UnitedHealth Group (up 18%) were notable performers. | |
| | § | | The Fund’s holdings in the Automobiles industry (up 11% compared to up 1% for the MSCI World industry) aided performance. Nissan Motor (up 24%) and Honda Motor (up 13%) performed well. | |
| | § | | Additional contributors included Nintendo (up 61% to date of sale), New Oriental Education & Technology (up 54%), Alphabet (up 45%), and Time Warner Cable (up 25%). | |
KEY CHARACTERISTICS OF DODGE & COX
Independent Organization
Dodge & Cox is one of the largest privately owned investment managers in the world. We remain committed to independence, with a goal of providing the highest quality investment management service to our existing clients.
Over 85 Years of Investment Experience
Dodge & Cox was founded in 1930. We have a stable and well-qualified team of investment professionals, most of whom have spent their entire careers at Dodge & Cox.
Experienced Investment Team
The Global Stock Investment Policy Committee, which is the decision-making body for the Global Stock Fund, is a seven-member committee with an average tenure at Dodge & Cox of 19 years.
One Business with a Single Research Office
Dodge & Cox manages equity (domestic, international, and global), fixed income (domestic and global), and balanced investments, operating from one office in San Francisco.
Consistent Investment Approach
Our team decision-making process involves thorough, bottom-up fundamental analysis of each investment.
Long-Term Focus and Low Expenses
We invest with a three- to five-year investment horizon, which has historically resulted in low turnover relative to our peers. We manage Funds that maintain low expense ratios.
Risks: The Fund is subject to market risk, meaning holdings in the Fund may decline in value for extended periods due to the financial prospects of individual companies, or due to general market and economic conditions. Investing in non-U.S. securities may entail risk due to foreign economic and political developments; this risk may be increased when investing in emerging markets. The Fund is also subject to currency risk. Please read the prospectus and summary prospectus for specific details regarding the Fund’s risk profile.
PAGE 4 § DODGE & COX GLOBAL STOCK FUND
GROWTH OF $10,000 SINCE INCEPTION
FOR AN INVESTMENT MADE ON MAY 1, 2008
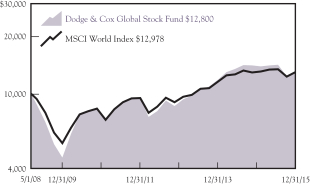
AVERAGE ANNUAL TOTAL RETURN
FOR PERIODS ENDED DECEMBER 31, 2015
| | | | | | | | | | | | | | | | |
| | | 1 Year | | | 3 Years | | | 5 Years | | | Since
Inception
(5/1/08) | |
Dodge & Cox Global Stock Fund | | | –8.05 | % | | | 9.41 | % | | | 7.04 | % | | | 3.27 | % |
MSCI World Index | | | –0.89 | | | | 9.63 | | | | 7.59 | | | | 3.45 | |
Returns represent past performance and do not guarantee future results. Investment return and share price will fluctuate with market conditions, and investors may have a gain or loss when shares are sold. Fund performance changes over time and currently may be significantly lower than stated. Performance is updated and published monthly. Visit the Fund’s website at dodgeandcox.com or call 800-621-3979 for current performance figures.
The Fund’s total returns include the reinvestment of dividend and capital gain distributions, but have not been adjusted for any income taxes payable by shareholders on these distributions or on Fund share redemptions. Index returns include dividends but, unlike Fund returns, do not reflect fees or expenses. The MSCI World Index is a broad-based, unmanaged equity market index aggregated from 23 developed market country indices, including the United States. MSCI makes no express or implied warranties or representations and shall have no liability whatsoever with respect to any MSCI data contained herein. The MSCI data may not be further redistributed or used as a basis for other indices or any securities or financial products. This report is not approved, reviewed, or produced by MSCI.
MSCI World is a service mark of MSCI Barra.
FUND EXPENSE EXAMPLE
As a Fund shareholder, you incur ongoing Fund costs, including management fees and other Fund expenses. All mutual funds have ongoing costs, sometimes referred to as operating expenses. The following example shows ongoing costs of investing in the Fund and can help you understand these costs and compare them with those of other mutual funds. The example assumes a $1,000 investment held for the six months indicated.
ACTUAL EXPENSES
The first line of the table below provides information about actual account values and expenses based on the Fund’s actual returns. You may use the information in this line, together with your account balance, to estimate the expenses that you paid over the period. Simply divide your account value by $1,000 (for example, an $8,600 account value divided by $1,000 = 8.6), then multiply the result by the number in the first line under the heading “Expenses Paid During Period” to estimate the expenses you paid on your account during this period.
HYPOTHETICAL EXAMPLE FOR COMPARISON WITH OTHER MUTUAL FUNDS
Information on the second line of the table can help you compare ongoing costs of investing in the Fund with those of other mutual funds. This information may not be used to estimate the actual ending account balance or expenses you paid during the period. The hypothetical “Ending Account Value” is based on the actual expense ratio of the Fund and an assumed 5% annual rate of return before expenses (not the Fund’s actual return). The amount under the heading “Expenses Paid During Period” shows the hypothetical expenses your account would have incurred under this scenario. You can compare this figure with the 5% hypothetical examples that appear in shareholder reports of other mutual funds.
| | | | | | | | | | | | |
Six Months Ended December 31, 2015 | | Beginning Account Value
7/1/2015 | | | Ending Account Value
12/31/2015 | | | Expenses Paid During Period* | |
Based on Actual Fund Return | | $ | 1,000.00 | | | $ | 899.80 | | | $ | 2.99 | |
Based on Hypothetical 5% Yearly Return | | | 1,000.00 | | | | 1,022.06 | | | | 3.18 | |
| * | | Expenses are equal to the Fund’s annualized expense ratio of 0.62%, multiplied by the average account value over the period, multiplied by 184/365 (to reflect the one-half year period). |
The expenses shown in the table highlight ongoing costs only and do not reflect any transactional fees or account maintenance fees. Though other mutual funds may charge such fees, please note that the Fund does not charge transaction fees (e.g., redemption fees, sales loads) or universal account maintenance fees (e.g., small account fees).
DODGE & COX GLOBAL STOCK FUND §PAGE 5
| | | | |
| FUND INFORMATION (unaudited) | | | December 31, 2015 | |
| | | | |
| GENERAL INFORMATION | | | |
Net Asset Value Per Share | | | $10.46 | |
Total Net Assets (billions) | | | $5.7 | |
2014 Expense Ratio (per 5/1/15 Prospectus) | | | 0.65% | |
2015 Expense Ratio | | | 0.63% | |
Portfolio Turnover Rate | | | 20% | |
30-Day SEC Yield(a) | | | 1.42% | |
Number of Companies | | | 83 | |
Fund Inception | | | 2008 | |
No sales charges or distribution fees | | | | |
Investment Manager: Dodge & Cox, San Francisco. Managed by the Global Stock Investment Policy Committee, whose seven members’ average tenure at Dodge & Cox is 19 years.
| | | | | | | | |
| PORTFOLIO CHARACTERISTICS | | Fund | | | MSCI
World | |
Median Market Capitalization (billions) | | | $31 | | | | $10 | |
Weighted Average Market Capitalization (billions) | | | $94 | | | | $93 | |
Price-to-Earnings Ratio(b) | | | 13.3x | | | | 15.7x | |
Countries Represented | | | 20 | | | | 23 | |
Emerging Markets (Brazil, China, India, Mexico, South Africa, South Korea, Thailand, Turkey) | | | 16.9% | | | | 0.0% | |
| | | | |
| TEN LARGEST HOLDINGS (%)(c) | | Fund | |
Alphabet, Inc. (United States) | | | 3.7 | |
Time Warner Cable, Inc. (United States) | | | 3.1 | |
Samsung Electronics Co., Ltd. (South Korea) | | | 2.9 | |
Bank of America Corp. (United States) | | | 2.6 | |
Naspers, Ltd. (South Africa) | | | 2.6 | |
Roche Holding AG (Switzerland) | | | 2.4 | |
Novartis AG (Switzerland) | | | 2.3 | |
Sanofi (France) | | | 2.3 | |
Time Warner, Inc. (United States) | | | 2.2 | |
Standard Chartered PLC (United Kingdom) | | | 2.1 | |
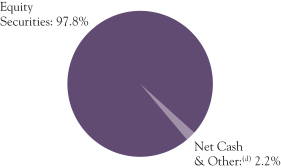
| | | | | | | | |
| REGION DIVERSIFICATION (%)(e) | | Fund | | | MSCI
World | |
United States | | | 50.6 | | | | 58.7 | |
Europe (excluding United Kingdom) | | | 19.7 | | | | 17.2 | |
Pacific (excluding Japan) | | | 10.6 | | | | 4.3 | |
United Kingdom | | | 6.2 | | | | 7.4 | |
Japan | | | 3.4 | | | | 9.0 | |
Africa/Middle East | | | 3.4 | | | | 0.3 | |
Latin America | | | 3.3 | | | | 0.0 | |
Canada | | | 0.6 | | | | 3.1 | |
| | | | | | | | |
| SECTOR DIVERSIFICATION (%) | | Fund | | | MSCI
World | |
Financials | | | 23.6 | | | | 20.8 | |
Consumer Discretionary | | | 21.3 | | | | 13.3 | |
Information Technology | | | 20.5 | | | | 14.2 | |
Health Care | | | 14.8 | | | | 13.5 | |
Energy | | | 6.4 | | | | 6.1 | |
Industrials | | | 3.7 | | | | 10.7 | |
Materials | | | 3.0 | | | | 4.4 | |
Telecommunication Services | | | 2.6 | | | | 3.4 | |
Consumer Staples | | | 1.9 | | | | 10.4 | |
Utilities | | | 0.0 | | | | 3.2 | |
| (a) | SEC Yield is an annualization of the Fund’s total net investment income per share for the 30-day period ended on the last day of the month. |
| (b) | Price-to-earnings (P/E) ratios are calculated using 12-month forward earnings estimates from third-party sources. |
| (c) | The Fund’s portfolio holdings are subject to change without notice. The mention of specific securities is not a recommendation to buy, sell, or hold any particular security and is not indicative of Dodge & Cox’s current or future trading activity. |
| (d) | Net Cash & Other includes short-term investments (e.g., money market funds and repurchase agreements) and other assets less liabilities (e.g., cash, receivables, payables, and unrealized appreciation/depreciation on certain derivatives). |
| (e) | The Fund may classify a company in a different category than the MSCI World. The Fund generally classifies a company based on its country of incorporation, but may designate a different country in certain circumstances. |
PAGE 6 § DODGE & COX GLOBAL STOCK FUND
| | | | |
| CONSOLIDATED PORTFOLIO OF INVESTMENTS | | | December 31, 2015 | |
| | | | | | | | |
| COMMON STOCKS: 94.2% | | | | | | |
| | |
| | | SHARES | | | VALUE | |
| CONSUMER DISCRETIONARY: 21.3% | |
AUTOMOBILES & COMPONENTS: 5.4% | | | | | |
Bayerische Motoren Werke AG (Germany) | | | 620,200 | | | $ | 65,318,528 | |
Honda Motor Co., Ltd. (Japan) | | | 3,109,700 | | | | 99,639,572 | |
Mahindra & Mahindra, Ltd. (India) | | | 2,543,374 | | | | 48,632,867 | |
Nissan Motor Co., Ltd. (Japan) | | | 5,816,300 | | | | 60,913,271 | |
Yamaha Motor Co., Ltd. (Japan) | | | 1,448,400 | | | | 32,456,868 | |
| | | | | | | | |
| | | | | | | 306,961,106 | |
CONSUMER DURABLES & APPAREL: 0.5% | |
Coach, Inc. (United States) | | | 971,500 | | | | 31,797,195 | |
|
CONSUMER SERVICES: 0.5% | |
New Oriental Education & Technology Group, Inc. ADR (Cayman Islands/China) | | | 853,567 | | | | 26,776,397 | |
| | |
MEDIA: 12.0% | | | | | | | | |
Comcast Corp., Class A (United States) | | | 1,265,400 | | | | 71,406,522 | |
DISH Network Corp., Class A(a) (United States) | | | 786,300 | | | | 44,960,634 | |
Grupo Televisa SAB ADR (Mexico) | | | 1,412,300 | | | | 38,428,683 | |
Liberty Global PLC LiLAC, Series C(a) (United Kingdom) | | | 63,185 | | | | 2,716,955 | |
Liberty Global PLC, Series C(a) (United Kingdom) | | | 1,566,800 | | | | 63,878,436 | |
Naspers, Ltd. (South Africa) | | | 1,059,300 | | | | 145,212,803 | |
Television Broadcasts, Ltd. (Hong Kong) | | | 2,599,500 | | | | 10,716,579 | |
Time Warner Cable, Inc. (United States) | | | 961,171 | | | | 178,383,726 | |
Time Warner, Inc. (United States) | | | 1,964,666 | | | | 127,054,950 | |
| | | | | | | | |
| | | | | | | 682,759,288 | |
RETAILING: 2.9% | | | | | | | | |
JD.com, Inc. ADR(a) (Cayman Islands/China) | | | 1,686,900 | | | | 54,427,829 | |
Target Corp. (United States) | | | 615,600 | | | | 44,698,716 | |
The Priceline Group, Inc.(a) (United States) | | | 53,200 | | | | 67,827,340 | |
| | | | | | | | |
| | | | | | | 166,953,885 | |
| | | | | | | | |
| | | | | | | 1,215,247,871 | |
| CONSUMER STAPLES: 1.9% | | | | | |
FOOD & STAPLES RETAILING: 1.4% | | | | | |
Wal-Mart Stores, Inc. (United States) | | | 1,298,200 | | | | 79,579,660 | |
| |
FOOD, BEVERAGE & TOBACCO: 0.5% | | | | | |
Anadolu Efes Biracilik ve Malt Sanayii AS (Turkey) | | | 4,023,248 | | | | 26,059,236 | |
| | | | | | | | |
| | | | | | | 105,638,896 | |
| ENERGY: 5.6% | | | | | | | | |
Apache Corp. (United States) | | | 1,028,432 | | | | 45,734,371 | |
Baker Hughes, Inc. (United States) | | | 1,494,087 | | | | 68,952,115 | |
National Oilwell Varco, Inc. (United States) | | | 960,200 | | | | 32,157,098 | |
Saipem SPA(a) (Italy) | | | 4,771,043 | | | | 38,352,249 | |
Schlumberger, Ltd. (Curacao/United States) | | | 1,450,200 | | | | 101,151,450 | |
Weatherford International PLC(a) (Ireland) | | | 3,779,375 | | | | 31,708,956 | |
| | | | | | | | |
| | | | | | | 318,056,239 | |
| FINANCIALS: 22.3% | | | | | | | | |
BANKS: 10.9% | | | | | | | | |
Bank of America Corp. (United States) | | | 8,918,400 | | | | 150,096,672 | |
Barclays PLC (United Kingdom) | | | 32,430,600 | | | | 104,654,320 | |
ICICI Bank, Ltd. (India) | | | 19,126,282 | | | | 75,457,113 | |
Kasikornbank PCL- Foreign (Thailand) | | | 12,934,700 | | | | 53,474,818 | |
Siam Commercial Bank PCL- Foreign (Thailand) | | | 5,156,300 | | | | 17,016,303 | |
Standard Chartered PLC (United Kingdom) | | | 14,588,077 | | | | 121,227,876 | |
Wells Fargo & Co. (United States) | | | 1,651,573 | | | | 89,779,508 | |
Yapi ve Kredi Bankasi AS (Turkey) | | | 7,580,017 | | | | 8,551,041 | |
| | | | | | | | |
| | | | | | | 620,257,651 | |
| | | | | | | | |
| | |
| | | SHARES | | | VALUE | |
DIVERSIFIED FINANCIALS: 7.7% | | | | | |
Bank of New York Mellon Corp. (United States) | | | 1,497,200 | | | $ | 61,714,584 | |
Capital One Financial Corp. (United States) | | | 1,206,900 | | | | 87,114,042 | |
Charles Schwab Corp. (United States) | | | 3,670,800 | | | | 120,879,444 | |
Credit Suisse Group AG (Switzerland) | | | 4,566,743 | | | | 98,702,568 | |
Goldman Sachs Group, Inc. (United States) | | | 271,900 | | | | 49,004,537 | |
Haci Omer Sabanci Holding AS (Turkey) | | | 7,957,588 | | | | 22,592,521 | |
| | | | | | | | |
| | | | | | | 440,007,696 | |
INSURANCE: 2.1% | | | | | | | | |
AEGON NV (Netherlands) | | | 11,121,459 | | | | 63,211,053 | |
Aviva PLC (United Kingdom) | | | 7,893,600 | | | | 60,045,606 | |
| | | | | | | | |
| | | | | | | 123,256,659 | |
REAL ESTATE: 1.6% | | | | | | | | |
BR Malls Participacoes SA (Brazil) | | | 7,033,500 | | | | 19,616,305 | |
Hang Lung Group, Ltd. (Hong Kong) | | | 14,438,300 | | | | 46,854,310 | |
Hang Lung Properties, Ltd. (Hong Kong) | | | 10,126,100 | | | | 23,048,161 | |
| | | | | | | | |
| | | | | | | 89,518,776 | |
| | | | | | | | |
| | | | | | | 1,273,040,782 | |
| HEALTH CARE: 14.8% | | | | | | | | |
HEALTH CARE EQUIPMENT & SERVICES: 6.3% | |
Anthem, Inc. (United States) | | | 341,688 | | | | 47,644,975 | |
Cigna Corp. (United States) | | | 665,000 | | | | 97,309,450 | |
Express Scripts Holding Co.(a) (United States) | | | 1,286,600 | | | | 112,461,706 | |
UnitedHealth Group, Inc. (United States) | | | 868,900 | | | | 102,217,396 | |
| | | | | | | | |
| | | | | | | 359,633,527 | |
PHARMACEUTICALS, BIOTECHNOLOGY & LIFE SCIENCES: 8.5% | |
Bayer AG (Germany) | | | 379,320 | | | | 47,589,978 | |
Merck & Co., Inc. (United States) | | | 644,400 | | | | 34,037,208 | |
Novartis AG (Switzerland) | | | 949,500 | | | | 81,160,026 | |
Novartis AG ADR (Switzerland) | | | 601,000 | | | | 51,710,040 | |
Roche Holding AG (Switzerland) | | | 499,800 | | | | 137,738,947 | |
Sanofi (France) | | | 1,549,862 | | | | 132,386,941 | |
| | | | | | | | |
| | | | | | | 484,623,140 | |
| | | | | | | | |
| | | | | | | 844,256,667 | |
| INDUSTRIALS: 3.7% | | | | | | | | |
CAPITAL GOODS: 1.5% | | | | | | | | |
Schneider Electric SA (France) | | | 1,531,078 | | | | 87,454,516 | |
| |
COMMERCIAL & PROFESSIONAL SERVICES: 1.2% | | | | | |
ADT Corp. (United States) | | | 858,800 | | | | 28,323,224 | |
Tyco International PLC (Ireland) | | | 1,279,100 | | | | 40,790,499 | |
| | | | | | | | |
| | | | | | | 69,113,723 | |
TRANSPORTATION: 1.0% | | | | | | | | |
FedEx Corp. (United States) | | | 382,400 | | | | 56,973,776 | |
| | | | | | | | |
| | | | | | | 213,542,015 | |
| INFORMATION TECHNOLOGY: 19.0% | |
SOFTWARE & SERVICES: 8.3% | | | | | | | | |
Alphabet, Inc., Class A(a) (United States) | | | 21,500 | | | | 16,727,215 | |
Alphabet, Inc., Class C(a) (United States) | | | 253,399 | | | | 192,299,433 | |
Baidu, Inc. ADR(a) (Cayman Islands/China) | | | 457,515 | | | | 86,488,636 | |
eBay, Inc.(a) (United States) | | | 164,300 | | | | 4,514,964 | |
Microsoft Corp. (United States) | | | 2,124,100 | | | | 117,845,068 | |
Symantec Corp. (United States) | | | 1,641,300 | | | | 34,467,300 | |
Synopsys, Inc.(a) (United States) | | | 425,100 | | | | 19,388,811 | |
| | | | | | | | |
| | | | | | | 471,731,427 | |
| | |
| See accompanying Notes to Consolidated Financial Statements | | DODGE & COX GLOBAL STOCK FUND §PAGE 7 |
| | | | |
| CONSOLIDATED PORTFOLIO OF INVESTMENTS | | | December 31, 2015 | |
| | | | | | | | |
| COMMON STOCKS (continued) | | | | | | |
| | |
| | | SHARES | | | VALUE | |
TECHNOLOGY, HARDWARE & EQUIPMENT: 10.7% | |
Cisco Systems, Inc. (United States) | | | 3,960,200 | | | $ | 107,539,231 | |
Corning, Inc. (United States) | | | 2,500,900 | | | | 45,716,452 | |
EMC Corp. (United States) | | | 4,470,200 | | | | 114,794,736 | |
Hewlett Packard Enterprise Co. (United States) | | | 6,642,900 | | | | 100,972,080 | |
HP, Inc. (United States) | | | 6,760,100 | | | | 80,039,584 | |
NetApp, Inc. (United States) | | | 755,780 | | | | 20,050,843 | |
Samsung Electronics Co., Ltd. (South Korea) | | | 72,517 | | | | 77,435,944 | |
TE Connectivity, Ltd. (Switzerland) | | | 1,022,115 | | | | 66,038,850 | |
| | | | | | | | |
| | | | | | | 612,587,720 | |
| | | | | | | | |
| | | | | | | 1,084,319,147 | |
| MATERIALS: 3.0% | | | | | |
Celanese Corp., Series A (United States) | | | 876,500 | | | | 59,014,745 | |
LafargeHolcim, Ltd. (Switzerland) | | | 656,020 | | | | 32,871,626 | |
Linde AG (Germany) | | | 327,710 | | | | 47,568,194 | |
Teck Resources, Ltd., Class B (Canada) | | | 8,396,569 | | | | 32,410,757 | |
| | | | | | | | |
| | | | | | | 171,865,322 | |
| TELECOMMUNICATION SERVICES: 2.6% | |
America Movil SAB de CV, Series L (Mexico) | | | 12,229,000 | | | | 8,585,738 | |
Millicom International Cellular SA SDR (Luxembourg) | | | 822,900 | | | | 46,870,485 | |
MTN Group, Ltd. (South Africa) | | | 5,560,200 | | | | 47,778,531 | |
Sprint Corp.(a) (United States) | | | 12,730,600 | | | | 46,084,772 | |
| | | | | | | | |
| | | | | | | 149,319,526 | |
| | | | | | | | |
TOTAL COMMON STOCKS
(Cost $4,967,081,960) | | | | | | $ | 5,375,286,465 | |
| | |
| PREFERRED STOCKS: 3.6% | | | | | | |
| ENERGY: 0.8% | | | | | | | | |
Petroleo Brasileiro SA ADR(a) (Brazil) | | | 14,428,003 | | | | 49,055,210 | |
| | |
| FINANCIALS: 1.3% | | | | | | | | |
BANKS: 1.3% | | | | | | | | |
Itau Unibanco Holding SA (Brazil) | | | 11,092,063 | | | | 72,481,734 | |
|
| INFORMATION TECHNOLOGY: 1.5% | |
TECHNOLOGY, HARDWARE & EQUIPMENT: 1.5% | |
Samsung Electronics Co., Ltd. (South Korea) | | | 91,514 | | | | 84,695,337 | |
| | | | | | | | |
TOTAL PREFERRED STOCKS
(Cost $302,069,322) | | | | | | $ | 206,232,281 | |
| | | | | | | | |
| SHORT-TERM INVESTMENTS: 2.7% | |
| | |
| | | PAR VALUE | | | VALUE | |
MONEY MARKET FUND: 0.1% | |
SSgA U.S. Treasury Money Market Fund | | $ | 5,773,394 | | | $ | 5,773,394 | |
|
REPURCHASE AGREEMENT: 0.2% | |
Fixed Income Clearing Corporation(b)
0.08%, dated 12/31/15, due 1/4/16,
maturity value $12,877,114 | | | 12,877,000 | | | | 12,877,000 | |
| | |
TREASURY BILL: 2.4% | | | | | | | | |
Canadian Treasury Bill (Canada) 2/11/16 | | | 192,000,000 | | | | 138,689,022 | |
| | | | | | | | |
TOTAL SHORT-TERM INVESTMENTS
(Cost $156,844,916) | | | | | | $ | 157,339,416 | |
| | | | | | | | |
TOTAL INVESTMENTS
(Cost $5,425,996,198) | | | 100.5 | % | | $ | 5,738,858,162 | |
OTHER ASSETS LESS LIABILITIES | | | (0.5 | %) | | | (31,079,480 | ) |
| | | | | | | | |
| NET ASSETS | | | 100.0 | % | | $ | 5,707,778,682 | |
| | | | | | | | |
| (b) | Repurchase agreement is collateralized by U.S. Treasury Note 1.625%, 7/31/20. Total collateral value is $13,136,400. |
In determining a company’s country designation, the Fund generally references the country of incorporation. In cases where the Fund considers the country of incorporation to be a “jurisdiction of convenience” chosen primarily for tax purposes or in other limited circumstances, the Fund uses the country designation of an appropriate broad-based market index. In those cases, two countries are listed - the country of incorporation and the country designated by an appropriate index, respectively.
ADR: American Depositary Receipt
SDR: Swedish Depository Receipt
FORWARD CURRENCY CONTRACTS
| | | | | | | | | | | | | | | | |
| | | | | | Contract Amount | | | | |
| Counterparty | | Settlement
Date | | | Receive U.S. Dollar | | | Deliver
Foreign
Currency | | | Unrealized
Appreciation/
(Depreciation) | |
Contracts to sell CHF: | | | | | | | | | | | | | |
Goldman Sachs | | | 1/27/16 | | | | 29,946,922 | | | | 29,000,000 | | | $ | 966,230 | |
Goldman Sachs | | | 2/3/16 | | | | 30,516,647 | | | | 30,000,000 | | | | 527,618 | |
UBS | | | 2/3/16 | | | | 30,404,686 | | | | 30,000,000 | | | | 415,658 | |
Contracts to sell EUR: | | | | | | | | | | | | | |
Credit Suisse | | | 2/24/16 | | | | 29,240,885 | | | | 27,250,000 | | | | (409,690 | ) |
JPMorgan | | | 2/24/16 | | | | 13,673,610 | | | | 12,750,000 | | | | (199,595 | ) |
Deutsche Bank | | | 3/2/16 | | | | 20,624,470 | | | | 19,400,000 | | | | (488,244 | ) |
Barclays | | | 3/9/16 | | | | 20,698,790 | | | | 19,000,000 | | | | 17,635 | |
HSBC | | | 3/9/16 | | | | 11,964,590 | | | | 11,000,000 | | | | (8,710 | ) |
| | | | | | | | | | | | | | | | |
| | | | | | | | | | | | | | $ | 820,902 | |
| | | | | | | | | | | | | | | | |
| | |
| PAGE 8 § DODGE & COX GLOBAL STOCK FUND | | See accompanying Notes to Consolidated Financial Statements |
| | | | |
CONSOLIDATED STATEMENT OF ASSETS AND LIABILITIES | |
| |
| | | December 31, 2015 | |
ASSETS: | | | | |
Investments, at value (cost $5,425,996,198) | | $ | 5,738,858,162 | |
Unrealized appreciation on forward currency contracts | | | 1,927,141 | |
Cash denominated in foreign currency (cost $739) | | | 731 | |
Cash | | | 100 | |
Receivable for investments sold | | | 5,858,071 | |
Receivable for Fund shares sold | | | 27,278,177 | |
Dividends and interest receivable | | | 11,146,371 | |
Prepaid expenses and other assets | | | 49,675 | |
| | | | |
| | | 5,785,118,428 | |
| | | | |
LIABILITIES: | | | | |
Unrealized depreciation on forward currency contracts | | | 1,106,239 | |
Payable for investments purchased | | | 14,773,671 | |
Payable for Fund shares redeemed | | | 58,056,720 | |
Management fees payable | | | 2,927,968 | |
Accrued expenses | | | 475,148 | |
| | | | |
| | | 77,339,746 | |
| | | | |
NET ASSETS | | $ | 5,707,778,682 | |
| | | | |
NET ASSETS CONSIST OF: | | | | |
Paid in capital | | $ | 5,342,564,016 | |
Undistributed net investment income | | | 337,857 | |
Undistributed net realized gain | | | 51,920,181 | |
Net unrealized appreciation | | | 312,956,628 | |
| | | | |
| | $ | 5,707,778,682 | |
| | | | |
Fund shares outstanding (par value $0.01 each,
unlimited shares authorized) | | | 545,831,312 | |
Net asset value per share | | $ | 10.46 | |
| |
CONSOLIDATED STATEMENT OF OPERATIONS | | | | |
| | | Year Ended
December 31, 2015 | |
INVESTMENT INCOME: | | | | |
Dividends (net of foreign taxes of $5,879,065) | | $ | 125,378,250 | |
Interest | | | 15,237 | |
| | | | |
| | | 125,393,487 | |
| | | | |
EXPENSES: | | | | |
Management fees | | | 37,258,811 | |
Custody and fund accounting fees | | | 620,606 | |
Transfer agent fees | | | 309,736 | |
Professional services | | | 219,650 | |
Shareholder reports | | | 100,505 | |
Registration fees | | | 196,886 | |
Trustees’ fees | | | 237,500 | |
Miscellaneous | | | 311,547 | |
| | | | |
| | | 39,255,241 | |
| | | | |
NET INVESTMENT INCOME | | | 86,138,246 | |
| | | | |
REALIZED AND UNREALIZED GAIN (LOSS): | | | | |
Net realized gain (loss) | | | | |
Investments | | | 135,300,729 | |
Forward currency contracts | | | 19,146,059 | |
Foreign currency transactions | | | (637,316 | ) |
Net change in unrealized appreciation/depreciation | | | | |
Investments | | | (761,602,676 | ) |
Forward currency contracts | | | (2,559,627 | ) |
Foreign currency translation | | | (521,016 | ) |
| | | | |
Net realized and unrealized loss | | | (610,873,847 | ) |
| | | | |
NET DECREASE IN NET ASSETS
FROM OPERATIONS | | $ | (524,735,601 | ) |
| | | | |
| | | | | | | | |
CONSOLIDATED STATEMENT OF CHANGES IN NET ASSETS | |
| | |
| | | Year Ended
December 31, 2015 | | | Year Ended
December 31, 2014
| |
OPERATIONS: | | | | | | | | |
Net investment income | | $ | 86,138,246 | | | $ | 73,280,159 | |
Net realized gain | | | 153,809,472 | | | | 160,901,823 | |
Net change in unrealized
appreciation/depreciation | | | (764,683,319 | ) | | | 67,737,521 | |
| | | | | | | | |
| | | (524,735,601 | ) | | | 301,919,503 | |
| | | | | | | | |
| | |
DISTRIBUTIONS TO SHAREHOLDERS FROM: | | | | | | | | |
Net investment income | | | (98,070,160 | ) | | | (72,474,215 | ) |
Net realized gain | | | (119,687,722 | ) | | | (138,830,388 | ) |
| | | | | | | | |
Total distributions | | | (217,757,882 | ) | | | (211,304,603 | ) |
| | | | | | | | |
| | |
FUND SHARE
TRANSACTIONS: | | | | | | | | |
Proceeds from sale of shares | | | 1,649,174,317 | | | | 2,482,518,668 | |
Reinvestment of distributions | | | 211,165,760 | | | | 204,987,790 | |
Cost of shares redeemed | | | (1,305,398,436 | ) | | | (806,780,930 | ) |
| | | | | | | | |
Net increase from Fund share transactions | | | 554,941,641 | | | | 1,880,725,528 | |
| | | | | | | | |
Total increase/(decrease) in net assets | | | (187,551,842 | ) | | | 1,971,340,428 | |
| | |
NET ASSETS: | | | | | | | | |
Beginning of year | | | 5,895,330,524 | | | | 3,923,990,096 | |
| | | | | | | | |
End of year (including undistributed net investment income of $337,857 and $(306,245), respectively) | | $ | 5,707,778,682 | �� | | $ | 5,895,330,524 | |
| | | | | | | | |
| | |
SHARE INFORMATION: | | | | | | | | |
Shares sold | | | 141,279,760 | | | | 205,490,704 | |
Distributions reinvested | | | 20,441,990 | | | | 17,283,962 | |
Shares redeemed | | | (114,061,371 | ) | | | (66,336,804 | ) |
| | | | | | | | |
Net increase in shares outstanding | | | 47,660,379 | | | | 156,437,862 | |
| | | | | | | | |
| | |
| See accompanying Notes to Consolidated Financial Statements | | DODGE & COX GLOBAL STOCK FUND §PAGE 9 |
NOTES TO CONSOLIDATED FINANCIAL STATEMENTS
NOTE 1—ORGANIZATION AND SIGNIFICANT ACCOUNTING POLICIES
Dodge & Cox Global Stock Fund (the “Fund”) is one of the series constituting the Dodge & Cox Funds (the “Trust” or the “Funds”). The Trust is organized as a Delaware statutory trust and is registered under the Investment Company Act of 1940, as amended, as an open-end management investment company. The Fund commenced operations on May 1, 2008, and seeks long-term growth of principal and income. The Fund invests primarily in a diversified portfolio of U.S. and foreign equity securities. Foreign investing, especially in developing countries, has special risks such as currency and market volatility and political and social instability. These and other risk considerations are discussed in the Fund’s Prospectus.
The financial statements have been prepared in conformity with accounting principles generally accepted in the United States of America, which require the use of estimates and assumptions by management. Actual results may differ from those estimates. Significant accounting policies are as follows:
Security valuation The Fund’s net assets are valued as of the close of trading on the New York Stock Exchange (NYSE), generally 4:00 p.m. Eastern Time, each day that the NYSE is open for business. If the NYSE is closed due to inclement weather, technology problems, or for any other reason on a day it would normally be open for business, or the NYSE has an unscheduled early closing on a day it has opened for business, the Fund reserves the right to calculate the Fund’s NAV as of the normally scheduled close of regular trading on the NYSE for that day, provided that Dodge & Cox believes that it can obtain reliable market quotes or valuations.
Portfolio securities and other financial instruments for which market quotes are readily available are valued at market value. Listed securities are generally valued using the official quoted close price or the last sale on the exchange that is determined to be the primary market for the security. Security values are not discounted based on the size of the Fund’s position. Short-term securities less than 60 days to maturity may be valued at amortized cost if amortized cost approximates current value. Mutual funds are valued at their respective net asset values.
Investments initially valued in currencies other than the U.S. dollar are converted to the U.S. dollar using prevailing exchange rates. As a result, the Fund’s net assets may be affected by changes in the value of currencies in relation to the U.S. dollar.
If market quotations are not readily available or if a security’s value is believed to have materially changed after the close of the security’s primary market but before the close of trading on the NYSE, the security is valued at fair value as determined in good faith by or under the direction of the Fund’s Board of Trustees. The Board of Trustees has appointed Dodge & Cox, the Fund’s investment manager, to make fair value determinations in accordance with the Dodge & Cox Funds Valuation Policies (“Valuation Policies”), subject to Board oversight. Dodge & Cox has established a Pricing Committee that is comprised of
representatives from Treasury, Legal, Compliance, and Operations. The Pricing Committee is responsible for implementing the Valuation Policies, including determining the fair value of securities when market quotations or market-based valuations are not readily available or are deemed unreliable. The Pricing Committee considers relevant indications of value that are reasonably available to it in determining the fair value assigned to a particular security, such as the value of similar financial instruments, trading volumes, contractual restrictions on disposition, related corporate actions, and changes in economic conditions. In doing so, the Pricing Committee employs various methods for calibrating fair valuation approaches, including a regular review of key inputs and assumptions, back-testing, and review of any related market activity.
As trading in securities on most foreign exchanges is normally completed before the close of the NYSE, the value of non-U.S. securities can change by the time the Fund calculates its NAV. To address these changes, the Fund may utilize adjustment factors provided by an independent pricing service to systematically value non-U.S. securities at fair value. These adjustment factors are based on statistical analyses of subsequent movements and changes in U.S. markets and financial instruments trading in U.S. markets that represent foreign securities or baskets of securities.
Valuing securities through a fair value determination involves greater reliance on judgment than valuation of securities based on readily available market quotations. In some instances, lack of information and uncertainty as to the significance of information may lead to a conclusion that a prior valuation is the best indication of a security’s value. When fair value pricing is employed, the prices of securities used by the Fund to calculate its NAV may differ from quoted or published prices for the same securities.
Security transactions, investment income, expenses, and distributions Security transactions are recorded on the trade date. Realized gains and losses on securities sold are determined on the basis of identified cost.
Dividend income and corporate action transactions are recorded on the ex-dividend date, or when the Fund first learns of the dividend/corporate action if the ex-dividend date has passed. Non-cash dividends included in dividend income, if any, are recorded at the fair market value of the securities received. Dividends characterized as return of capital for U.S. tax purposes are recorded as a reduction of cost of investments and/or realized gain. Interest income is recorded on the accrual basis.
Expenses are recorded on the accrual basis. Some expenses of the Trust can be directly attributed to a specific series. Expenses which cannot be directly attributed are allocated among the Funds in the Trust based on relative net assets or other expense methodologies determined by the nature of the expense.
Distributions to shareholders are recorded on the ex-dividend date.
Foreign taxes The Fund is subject to foreign taxes which may be imposed by certain countries in which the Fund invests.
PAGE 10 § DODGE & COX GLOBAL STOCK FUND
NOTES TO CONSOLIDATED FINANCIAL STATEMENTS
The Fund endeavors to record foreign taxes based on applicable foreign tax law. Withholding taxes are incurred on certain foreign dividends and are accrued at the time the associated dividend is recorded. The Fund files withholding tax reclaims in certain jurisdictions to recover a portion of amounts previously withheld. The Fund records a reclaim receivable based on, among other things, a jurisdiction’s legal obligation to pay reclaims as well as payment history and market convention. In consideration of recent decisions rendered by European courts, the Fund has filed for additional reclaims related to prior years. A corresponding receivable is established when both the amount is known and significant contingencies or uncertainties regarding collectability are removed. These amounts are reported in “dividends and interest receivable” on the Consolidated Statement of Assets and Liabilities.
Capital gains taxes are incurred upon disposition of certain foreign securities. Capital gains taxes on appreciated securities are accrued as unrealized losses and are reflected as realized losses upon the sale of the related security. Currency taxes may be incurred when the Fund purchases certain foreign currencies related to securities transactions and are recorded as realized losses on foreign currency transactions.
Repurchase agreements The Fund enters into repurchase agreements, secured by U.S. government or agency securities, which involve the purchase of securities from a counterparty with a simultaneous commitment to resell the securities at an agreed-upon date and price. It is the Fund’s policy that its custodian take possession of the underlying collateral securities, the fair value of which exceeds the principal amount of the repurchase transaction, including accrued interest, at all times. In the event of default by the counterparty, the Fund has the contractual right to liquidate the collateral securities and to apply the proceeds in satisfaction of the obligation.
Forward currency contracts A forward currency contract represents an obligation to purchase or sell a specific foreign currency at a future date at a price set at the time of the contract. Losses from these transactions may arise from unfavorable changes in currency values or if the counterparties do not perform under a contract’s terms.
The values of the forward currency contracts are adjusted daily based on the prevailing forward exchange rates of the underlying currencies. Changes in the value of open contracts are recorded as unrealized appreciation or depreciation in the Consolidated Statement of Operations. When the forward currency contract is closed, the Fund records a realized gain or loss in the Consolidated Statement of Operations equal to the difference between the value at the time the contract was opened and the value at the time it was closed.
During the year, the Fund maintained forward currency contracts to hedge foreign currency risks associated with portfolio investments denominated in the euro and Swiss franc. During the year ended December 31, 2015, these euro and Swiss franc forward
currency contracts had U.S. dollar total values ranging from 1% to 2% of net assets and 0% to 2% of net assets, respectively.
Foreign currency translation The books and records of the Fund are maintained in U.S. dollars. Foreign currency amounts are translated into U.S. dollars at the prevailing exchange rates of such currencies against the U.S. dollar. The market value of investment securities and other assets and liabilities are translated at the exchange rate as of the valuation date. Purchases and sales of investment securities, income, and expenses are translated at the exchange rate prevailing on the transaction date.
Reported realized and unrealized gain (loss) on investments include foreign currency gain (loss) related to investment transactions.
Reported realized and unrealized gain (loss) on foreign currency transactions and translation include the following: disposing/holding of foreign currency, the difference between the trade and settlement dates on securities transactions, the difference between the accrual and payment dates on dividends, and currency losses on the purchase of foreign currency in certain countries that impose taxes on such transactions.
Consolidation The Fund may invest in certain securities through its wholly owned subsidiary, Dodge & Cox Global Stock Fund Cayman, Ltd. (the “Subsidiary”). The Subsidiary is a Cayman Islands exempted company and invests in certain securities consistent with the investment objective of the Fund. The Fund’s Consolidated Financial Statements, including the Consolidated Portfolio of Investments, consist of the holdings and accounts of the Fund and the Subsidiary. All intercompany transactions and balances have been eliminated. At December 31, 2015, the Subsidiary had net assets of $100, which represented less than 0.01% of the Fund’s consolidated net assets.
Indemnification Under the Trust’s organizational documents, its officers and trustees are indemnified against certain liabilities arising out of the performance of their duties to the Trust. In addition, in the normal course of business the Trust enters into contracts that provide general indemnities to other parties. The Trust’s maximum exposure under these arrangements is unknown as this would involve future claims that may be made against the Trust that have not yet occurred.
NOTE 2—VALUATION MEASUREMENTS
Various inputs are used in determining the value of the Fund’s investments and other financial instruments. These inputs are summarized in the three broad levels listed below.
| § | | Level 1: Quoted prices in active markets for identical securities |
| § | | Level 2: Other significant observable inputs (including quoted prices for similar securities, market indices, interest rates, credit risk, etc.) |
| § | | Level 3: Significant unobservable inputs (including Fund management’s assumptions in determining the fair value of investments) |
DODGE & COX GLOBAL STOCK FUND §PAGE 11
NOTES TO CONSOLIDATED FINANCIAL STATEMENTS
The inputs or methodology used for valuing securities are not necessarily an indication of the risk associated with investing in those securities.
The following is a summary of the inputs used to value the Fund’s holdings at December 31, 2015:
| | | | | | | | |
| Classification(a) | | LEVEL 1
(Quoted Prices) | | | LEVEL 2
(Other Significant
Observable Inputs) | |
Securities | | | | | | | | |
Common Stocks | | | | | | | | |
Consumer Discretionary | | $ | 956,919,632 | | | $ | 258,328,239 | |
Consumer Staples | | | 105,638,896 | | | | — | |
Energy | | | 279,703,990 | | | | 38,352,249 | |
Financials | | | 1,084,230,788 | | | | 188,809,994 | |
Health Care | | | 577,767,715 | | | | 266,488,952 | |
Industrials | | | 213,542,015 | | | | — | |
Information Technology | | | 1,006,883,203 | | | | 77,435,944 | |
Materials | | | 91,425,502 | | | | 80,439,820 | |
Telecommunication Services | | | 102,449,041 | | | | 46,870,485 | |
Preferred Stocks | | | | | | | | |
Energy | | | 49,055,210 | | | | — | |
Financials | | | — | | | | 72,481,734 | |
Information Technology | | | — | | | | 84,695,337 | |
Short-term Investments | | | | | | | | |
Money Market Fund | | | 5,773,394 | | | | — | |
Repurchase Agreement | | | — | | | | 12,877,000 | |
Treasury Bill | | | — | | | | 138,689,022 | |
| | | | | | | | |
Total Securities | | $ | 4,473,389,386 | | | $ | 1,265,468,776 | |
| | | | | | | | |
| | |
Other Financial Instruments(b) | | | | | | | | |
Forward Currency Contracts | | | | | | | | |
Appreciation | | $ | — | | | $ | 1,927,141 | |
Depreciation | | | — | | | | (1,106,239 | ) |
| | | | | | | | | |
| (a) | | Transfers during the year between Level 1 and Level 2 relate to the use of systematic fair valuation (see Note 1). On days when systematic fair valuation is used, securities whose primary market closes before the NYSE are classified as Level 2. There were no Level 3 securities at December 31, 2015 and 2014, and there were no transfers to Level 3 during the year. |
| (b) | | Represents unrealized appreciation/(depreciation). |
NOTE 3—ADDITIONAL DERIVATIVES INFORMATION
The Fund has entered into over-the-counter derivatives, such as forward currency contracts (each, a “Derivative”). Each Derivative is subject to a negotiated master agreement (based on a form published by the International Swaps and Derivatives Association (“ISDA”)) governing all Derivatives between the Fund and the relevant dealer counterparty. The master agreements specify (i) events of default and other events permitting a party to terminate some or all of the Derivatives thereunder and (ii) the process by which those Derivatives will be valued for purposes of determining termination payments. If some or all of the Derivatives under a master agreement are terminated because of an event of default or similar event, the values of all terminated Derivatives must be netted to determine a single payment owed by one party to the other. Some master agreements contain collateral terms requiring the parties to post collateral in respect of some or all of the Derivatives thereunder based on the net market value of those Derivatives, subject to a minimum exposure threshold. To
the extent amounts owed to the Fund by its counterparties are not collateralized, the Fund is at risk of those counterparties’ non-performance. The Fund attempts to mitigate counterparty credit risk by entering into Derivatives only with counterparties it believes to be of good credit quality and by monitoring the financial stability of those counterparties.
At December 31, 2015, no Derivative position subject to a master netting arrangement qualifies for netting. For financial reporting purposes, the Fund does not offset financial assets and liabilities that are subject to a master netting arrangement in the Consolidated Statement of Assets and Liabilities. Gross assets and liabilities related to Derivatives are presented as “unrealized appreciation on forward currency contracts” and “unrealized depreciation on forward currency contracts,” respectively, in the Consolidated Statement of Assets and Liabilities. Derivative information by counterparty is presented in the Consolidated Portfolio of Investments. At December 31, 2015, no collateral is pledged or held by the Fund for Derivatives.
NOTE 4—RELATED PARTY TRANSACTIONS
Management fees Under a written agreement approved by a unanimous vote of the Board of Trustees, the Fund pays an annual management fee of 0.60% of the Fund’s average daily net assets to Dodge & Cox, investment manager of the Fund.
Fund officers and trustees All officers and two of the trustees of the Trust are officers or employees of Dodge & Cox. The Trust pays a fee only to those trustees who are not affiliated with Dodge & Cox.
NOTE 5—INCOME TAX INFORMATION AND DISTRIBUTIONS TO SHAREHOLDERS
A provision for federal income taxes is not required since the Fund intends to qualify as a regulated investment company under Subchapter M of the Internal Revenue Code and distribute all of its taxable income to shareholders. Distributions are determined in accordance with income tax regulations, and such amounts may differ from net investment income and realized gains for financial reporting purposes. Financial reporting records are adjusted for permanent book to tax differences at year end to reflect tax character.
Book to tax differences are primarily due to differing treatments of wash sales, net short-term realized gain (loss), investments in passive foreign investment companies, foreign capital gain taxes, and foreign currency realized gain (loss). At December 31, 2015, the cost of investments for federal income tax purposes was $5,438,868,248.
Distributions during the years noted below were characterized as follows for federal income tax purposes:
| | | | | | | | |
| | | Year Ended December 31, 2015 | | | Year Ended December 31, 2014 | |
Ordinary income | | | $112,306,144 | | | | $100,240,292 | |
| | | ($0.213 per share) | | | | ($0.213 per share) | |
| | |
Long-term capital gain | | | $105,451,738 | | | | $111,064,311 | |
| | | ($0.200 per share) | | | | ($0.236 per share) | |
PAGE 12 § DODGE & COX GLOBAL STOCK FUND
NOTES TO CONSOLIDATED FINANCIAL STATEMENTS
At December 31, 2015, the tax basis components of distributable earnings were as follows:
| | | | |
Unrealized appreciation | | | $973,534,707 | |
Unrealized depreciation | | | (673,544,793 | ) |
| | | | |
Net unrealized appreciation | | | 299,989,914 | |
Undistributed ordinary income | | | 337,857 | |
Undistributed long-term capital gain | | | 68,386,040 | |
Deferred loss(a) | | | (2,772,907 | ) |
| (a) | | Represents net short-term realized loss incurred between November 1, 2015 and December 31, 2015. As permitted by tax regulations, the Fund has elected to treat this loss as arising in 2016. |
Fund management has reviewed the tax positions for open periods (three years and four years, respectively, from filing the Fund’s Federal and State tax returns) as applicable to the Fund, and has determined that no provision for income tax is required in the Fund’s financial statements.
NOTE 6—LOAN FACILITIES
Pursuant to an exemptive order issued by the Securities and Exchange Commission (SEC), the Fund may participate in an interfund lending facility (Facility). The Facility allows the Fund to borrow money from or loan money to the Funds. Loans under the Facility are made for temporary or emergency purposes, such as to fund shareholder redemption requests. Interest on borrowings is the average of the current repurchase agreement rate and the bank loan rate. There was no activity in the Facility during the year.
All Funds in the Trust participate in a $500 million committed credit facility (Line of Credit) with State Street Bank and Trust Company, to be utilized for temporary or emergency purposes to fund shareholder redemptions or for other short-term liquidity purposes. The maximum amount available to the Fund is $250 million. Each Fund pays an annual commitment fee on its pro-rata portion of the Line of Credit. For the year ended December 31, 2015, the Fund’s commitment fee amounted to $19,178 and is reflected as a Miscellaneous Expense in the Consolidated Statement of Operations. Interest on borrowings is charged at the prevailing rate. There were no borrowings on the Line of Credit during the year.
NOTE 7—PURCHASES AND SALES OF INVESTMENTS
For the year ended December 31, 2015, purchases and sales of securities, other than short-term securities, aggregated $1,678,416,983 and $1,181,203,951, respectively.
NOTE 8—SUBSEQUENT EVENTS
Fund management has determined that no material events or transactions occurred subsequent to December 31, 2015, and through the date of the Fund’s financial statements issuance, which require additional disclosure in the Fund’s financial statements.
DODGE & COX GLOBAL STOCK FUND §PAGE 13
CONSOLIDATED FINANCIAL HIGHLIGHTS
| | | | | | | | | | | | | | | | | | | | |
SELECTED DATA AND RATIOS (for a share outstanding throughout each year) | | Year Ended December 31, | |
| | | 2015 | | | 2014 | | | 2013 | | | 2012 | | | 2011 | |
| | | | |
Net asset value, beginning of year | | | $11.83 | | | | $11.48 | | | | $8.99 | | | | $7.68 | | | | $8.90 | |
Income from investment operations: | | | | | | | | | | | | | | | | | | | | |
Net investment income | | | 0.16 | | | | 0.16 | | | | 0.16 | | | | 0.15 | | | | 0.16 | |
Net realized and unrealized gain (loss) | | | (1.11 | ) | | | 0.64 | | | | 2.81 | | | | 1.48 | | | | (1.18 | ) |
| | | | |
Total from investment operations | | | (0.95 | ) | | | 0.80 | | | | 2.97 | | | | 1.63 | | | | (1.02 | ) |
| | | | |
Distributions to shareholders from: | | | | | | | | | | | | | | | | | | | | |
Net investment income | | | (0.19 | ) | | | (0.15 | ) | | | (0.16 | ) | | | (0.15 | ) | | | (0.15 | ) |
Net realized gain | | | (0.23 | ) | | | (0.30 | ) | | | (0.32 | ) | | | (0.17 | ) | | | (0.05 | ) |
| | | | |
Total distributions | | | (0.42 | ) | | | (0.45 | ) | | | (0.48 | ) | | | (0.32 | ) | | | (0.20 | ) |
| | | | |
Net asset value, end of year | | | $10.46 | | | | $11.83 | | | | $11.48 | | | | $8.99 | | | | $7.68 | |
| | | | |
Total return | | | (8.05 | )% | | | 6.95 | % | | | 33.17 | % | | | 21.11 | % | | | (11.39 | )% |
Ratios/supplemental data: | | | | | | | | | | | | | | | | | | | | |
Net assets, end of year (millions) | | | $5,708 | | | | $5,895 | | | | $3,924 | | | | $2,695 | | | | $1,875 | |
Ratio of expenses to average net assets | | | 0.63 | % | | | 0.65 | % | | | 0.65 | % | | | 0.65 | % | | | 0.66 | % |
Ratio of net investment income to average net assets | | | 1.39 | % | | | 1.42 | % | | | 1.58 | % | | | 1.93 | % | | | 1.94 | % |
Portfolio turnover rate | | | 20 | % | | | 17 | % | | | 24 | % | | | 12 | % | | | 19 | % |
See accompanying Notes to Consolidated Financial Statements
PAGE 14 § DODGE & COX GLOBAL STOCK FUND
REPORT OF INDEPENDENT REGISTERED PUBLIC ACCOUNTING FIRM
To the Trustees of Dodge & Cox Funds and Shareholders of Dodge & Cox Global Stock Fund
In our opinion, the accompanying consolidated statement of assets and liabilities, including the consolidated portfolio of investments, and the related consolidated statements of operations and of changes in net assets and the consolidated financial highlights present fairly, in all material respects, the financial position of Dodge & Cox Global Stock Fund (the “Fund”, one of the series constituting Dodge & Cox Funds) at December 31, 2015, the results of its operations for the year then ended, the changes in its net assets for each of the two years in the period then ended and the financial highlights for each of the five years in the period then ended, in conformity with accounting principles generally accepted in the United States of America. These consolidated financial statements and consolidated financial highlights (hereafter referred to as financial statements) are the responsibility of the Fund’s management. Our responsibility is to express an opinion on these financial statements based on our audits. We conducted our audits of these financial statements in accordance with the standards of the Public Company Accounting Oversight Board (United States). Those standards require that we plan and perform the audit to obtain reasonable assurance about whether the financial statements are free of material misstatement. An audit includes examining, on a test basis, evidence supporting the amounts and disclosures in the financial statements, assessing the accounting principles used and significant estimates made by management, and evaluating the overall financial statement presentation. We believe that our audits, which included confirmation of securities at December 31, 2015, by correspondence with the custodian and brokers, provide a reasonable basis for our opinion.
PricewaterhouseCoopers LLP
San Francisco, California
February 25, 2016
DODGE & COX GLOBAL STOCK FUND §PAGE 15
SPECIAL 2015 TAX INFORMATION
(unaudited)
The following information is provided pursuant to provisions of the Internal Revenue Code:
In 2015, the Fund elected to pass through to shareholders foreign source income of $86,033,491 and foreign taxes paid of $5,878,958.
The Fund designates up to a maximum of $122,119,608 of its distributions paid to shareholders in 2015 as qualified dividends (treated for federal income tax purposes in the hands of shareholders as taxable at a maximum rate of 20%).
For shareholders that are corporations, the Fund designates 41% of its ordinary dividends paid to shareholders in 2015 as dividends from domestic corporations eligible for the corporate dividends received deduction, provided that the shareholder otherwise satisfies applicable requirements to claim that deduction.
BOARD APPROVAL OF FUNDS’ INVESTMENT MANAGEMENT AGREEMENTS AND MANAGEMENT FEES
(unaudited)
The Board of Trustees is responsible for overseeing the performance of the Dodge & Cox Funds’ investment manager and determining whether to continue the Investment Management Agreements between the Funds and Dodge & Cox each year (the “Agreements”). At a meeting of the Board of Trustees of the Trust held on December 16, 2015, the Trustees, by a unanimous vote (including a separate vote of those Trustees who are not “interested persons” (as defined in the Investment Company Act of 1940) (the “Independent Trustees”)), approved the renewal of the Agreements for an additional one-year term through December 31, 2016 with respect to each Fund. During the course of the year, the Board received a wide variety of materials relating to the investment management and administrative services provided by Dodge & Cox and the performance of each of the Funds.
INFORMATION RECEIVED
In advance of the meeting, the Board, including each of the Independent Trustees, requested, received, and reviewed materials relating to the Agreements and the services provided by Dodge & Cox. The Independent Trustees retained Morningstar® to prepare an independent expense and performance summary for each Fund and comparable funds managed by other advisers identified by Morningstar. The Morningstar materials included information regarding advisory fee rates, expense ratios, and transfer agency, custodial, and distribution expenses, as well as appropriate performance comparisons to each Fund’s peer group and an index or combination of indices. The Morningstar materials also included a comparison of expenses of various share classes offered by comparable funds. The materials reviewed by the Board contained information concerning, among other things, Dodge & Cox’s profitability, financial results and condition, advisory fee revenue, and separate account and sub-adviser fund fee schedules. The Board additionally considered the Funds’ brokerage commissions, turnover rates, sales and redemption data
and the significant investment that Dodge & Cox makes in research used in managing the Funds. The Board received and reviewed memoranda and related materials addressing, among other things, Dodge & Cox’s services to the Funds; how Dodge & Cox Funds’ fees compare to fees of peer group funds; the different fees, services, costs, and risks associated with other accounts managed by Dodge & Cox as compared to the Dodge & Cox Funds; and the ways in which the Funds realize economies of scale. Throughout the process of reviewing the services provided by Dodge & Cox and preparing for the meeting, the Independent Trustees found Dodge & Cox to be open, forthright, detailed, and very helpful in answering questions about all issues. The Board received copies of the Agreements and a memorandum from the independent legal counsel to the Independent Trustees discussing the factors generally regarded as appropriate to consider in evaluating advisory arrangements. The Trust’s Contract Review Committee, consisting solely of Independent Trustees, met with the independent legal counsel on November 11, 2015, and again on December 16, 2015, to discuss whether to renew the Agreements. The Board, including the Independent Trustees, subsequently concluded that the existing Agreements are fair and reasonable and voted to approve the Agreements. In considering the Agreements, the Board, including the Independent Trustees, did not identify any single factor or particular information as all-important or controlling. In reaching the decision to approve the Agreements, the Board considered several factors, discussed below, to be key factors and reached the conclusions described below.
NATURE, QUALITY, AND EXTENT OF THE SERVICES
The Board considered that Dodge & Cox provides a wide range of services to the Funds in addition to portfolio management and that the quality of these services has been excellent in all respects. The extensive nature of services provided by Dodge & Cox has been documented in materials provided to the Board and in presentations made to the Board throughout the year. In particular, the Board considered the nature, quality, and extent of portfolio management, administrative, and shareholder services performed by Dodge & Cox. With regard to portfolio management services, the Board considered Dodge & Cox’s established long-term history of care and conscientiousness in the management of the Funds; its demonstrated consistency in investment approach and depth; the background and experience of the Dodge & Cox Investment Policy Committee, International Investment Policy Committee, Global Stock Investment Policy Committee, Fixed Income Investment Policy Committee, and Global Bond Investment Policy Committee, and research analysts responsible for managing the Funds; its methods for assessing the regulatory and investment climate in various jurisdictions; Dodge & Cox’s overall high level of attention to its core investment management function; and its commitment to the Funds and their shareholders. In the area of administrative and shareholder services, the Board considered the excellent quality of Dodge & Cox’s work in areas such as compliance, legal services, trading, proxy voting, technology, oversight of the Funds’ transfer agent and custodian, tax compliance, and shareholder communication through its
PAGE 16 § DODGE & COX GLOBAL STOCK FUND
website and other means. The Board also noted Dodge & Cox’s diligent disclosure policy, its favorable compliance record, and its reputation as a trusted, shareholder-friendly mutual fund family. In addition, the Board considered that Dodge & Cox manages approximately $185 billion in Fund assets with fewer professionals than most comparable funds, and that on average these professionals have more experience and longer tenure than investment professionals at comparable funds. The Board also noted that Dodge & Cox is an investment research-oriented firm with no other business endeavors to distract management’s attention from its research efforts, and that its investment professionals adhere to a consistent investment approach across the Funds. The Board further considered the favorable stewardship grades given by Morningstar to each of the Funds and the “Gold” analyst rating awarded by Morningstar to all of the Funds except the Global Bond Fund. The Board concluded that it was satisfied with the nature, extent, and quality of investment management and other services provided to the Funds by Dodge & Cox.
INVESTMENT PERFORMANCE
The Board considered short-term and long-term investment performance for each Fund (including periods of outperformance or underperformance) as compared to both relevant indices and the performance of such Fund’s peer group. The Board noted that the Funds had weak absolute and relative performance in 2015, but remained solid performers over longer periods. The Board determined after extensive review and inquiry that Dodge & Cox’s historic, long-term, team-oriented, bottom-up investment approach remains consistent and that Dodge & Cox continues to be distinguished by its integrity, transparency, and independence. The Board considered that the performance of the Funds is the result of a team-oriented investment management process that emphasizes a long-term investment horizon, comprehensive independent research, price discipline, low cost and low portfolio turnover. The Board also considered that the investment performance delivered by Dodge & Cox to the Funds appeared to be consistent with the relevant performance delivered for other clients of Dodge & Cox. The Board concluded that Dodge & Cox has delivered favorable long-term performance for Fund investors consistent with the long-term investment strategies being pursued by the Funds.
COSTS AND ANCILLARY BENEFITS
Costs of Services to Funds: Fees and Expenses. The Board considered each Fund’s management fee rate and expense ratio relative to each Fund’s peer group and relative to management fees charged by Dodge & Cox to other clients. In particular, the Board considered that the Funds continue to be substantially below their peer group median in expense ratios and that many media and industry reports specifically comment on the low expense ratios of the Funds, which have been a defining characteristic of the Funds for many years. The Board also evaluated the operating structures of the Funds and Dodge & Cox, noting that the Funds do not charge front-end sales commissions or distribution fees, and Dodge & Cox bears, among other things, the significant cost of
third party research, reimbursement for recordkeeping and administrative costs to third-party retirement plan administrators, and administrative and office overhead.
The Board noted that expenses are well below industry averages. When compared to peer group funds, the Funds are in the quartile with the lowest expense ratios. The Board also considered that the Funds receive numerous administrative, regulatory compliance, legal, technology and shareholder support services from Dodge & Cox without any additional administrative fee and the fact that the Funds have relatively low transaction costs and portfolio turnover rates. The Board noted the Funds’ unusual single-share-class structure and reviewed Morningstar data showing that the few peer group funds with lower expense ratios often have other share classes with significantly higher expense ratios. In this regard, the Board considered that many of the Funds’ shareholders would not be eligible to purchase comparably-priced shares of many peer group funds, which typically make their lower-priced share classes available only to institutional investors. The Board determined that the Funds provide access for small investors to high quality investment management at a relatively low cost.
The Board reviewed information regarding the fee rates Dodge & Cox charges to separate accounts and subadvised funds that have investment programs similar to those of the Funds, including instances where separate account and sub-advised fund fees are lower than Fund fees. The Board considered differences in the nature and scope of services Dodge & Cox provides to the Funds as compared to other client accounts, differences in regulatory, litigation, and other risks as between Dodge & Cox Funds and other types of clients. The Board also noted that different markets exist for mutual fund and institutional separate account management services. With respect to non-U.S. funds sponsored and managed by Dodge & Cox that are comparable to the Funds in many respects, the Board noted that the fee rates charged by Dodge & Cox are the same as or higher than the fee rates charged to the Funds. After consideration of these matters, the Board concluded that the overall costs incurred by the Funds for the services they receive (including the management fee paid to Dodge & Cox) are reasonable and that the fees are acceptable based upon the qualifications, experience, reputation, and performance of Dodge & Cox and the low overall expense ratios of the Funds.
Profitability and Costs of Services to Dodge & Cox; “Fall-out” Benefits. The Board reviewed reports of Dodge & Cox’s financial position, profitability, and estimated overall value, and considered Dodge & Cox’s overall profitability within its context as a private, employee-owned S-Corporation and relative to the favorable services provided. The Board noted in particular that Dodge & Cox’s profits are not generated by high fee rates, but reflect an extraordinarily streamlined, efficient, and focused business approach toward investment management. The Board recognized the importance of Dodge & Cox’s profitability—which is derived solely from management fees and does not include other business ventures—to maintain its independence, stability, company culture and ethics, and management continuity. The Board also considered that the compensation/profit structure
DODGE & COX GLOBAL STOCK FUND §PAGE 17
at Dodge & Cox includes a return on shareholder employees’ investment in the firm, which is vital for remaining independent and facilitating retention of management and investment professionals. The Board considered independent research indicating that firms that grow organically, rather than through acquisition, tend to have better performance. Key to organic growth is the ability to retain talented and experienced analysts, portfolio managers and other professionals.
The Board also considered that in January 2015, Dodge & Cox closed the International Stock Fund to new investors to pro-actively manage the growth of the Fund. The Stock Fund and Balanced Fund were similarly closed to new investors during periods of significant growth in the past. While these actions are intended to benefit existing shareholders, the effect is to reduce potential revenues to Dodge & Cox from new shareholders. The Board also considered potential “fall-out” benefits (including the receipt of research from unaffiliated brokers and reputational benefits to non-U.S. funds sponsored and managed by Dodge & Cox) that Dodge & Cox might receive as a result of its association with the Funds and determined that they are acceptable. The Board also noted that Dodge & Cox continues to invest substantial sums in its business in order to provide enhanced services, systems and research capabilities, all of which benefit the Funds. The Board concluded that Dodge & Cox’s profitability is the keystone of its independence, stability and long-term investment performance and that the profitability of Dodge & Cox’s relationship with the Funds (including fall-out benefits) is fair and reasonable.
ECONOMIES OF SCALE
The Board considered whether there have been economies of scale with respect to the management of each Fund, whether the Funds have appropriately benefited from any economies of scale, and whether the management fee rate is reasonable in relation to the Fund assets and any economies of scale that may exist. In the Board’s view, any consideration of economies of scale must take account of the Funds’ low fee structure and the considerable efficiencies of the Funds’ organization and fee structure that has been realized by shareholders from the time of each Fund’s inception (i.e., from the first dollar). An assessment of economies of scale must also take into account that Dodge & Cox invests significant time and resources in each new Fund for months (and sometimes years) prior to launch; in addition, expenses are capped, which means that Dodge & Cox earns no revenue and subsidizes the operations of a new Fund for a period of time until it reaches scale.
In addition, the Board noted that Dodge & Cox has shared economies of scale by adding or enhancing services to the Funds over time, and that the internal costs of providing investment management, up-to-date technology, administrative, legal, and compliance services to the Funds continue to increase. For example, Dodge & Cox has increased its global research staff and investment resources over the years to address the increased complexity of investing in multinational and non-U.S. companies. In addition, Dodge & Cox has made substantial expenditures in other staff, technology, cybersecurity, and infrastructure to enable it to integrate credit and equity analyses and to be able to implement its strategy in a more effective and secure manner. Over the last ten years, Dodge & Cox has increased its spending on
third party research, data services, trading systems, technology, and recordkeeping service expenses at a rate that has significantly outpaced the Funds’ growth rate during the same period.
The Board considered that Dodge & Cox has a history of voluntarily limiting asset growth in several Funds that experienced significant inflows by closing them to new investors in order to protect the Funds’ ability to achieve good investment returns for shareholders. The Board also observed that, even without fee breakpoints, the Funds are competitively priced in a very competitive market and that having a low fee from inception is better for shareholders than starting with a higher fee and adding breakpoints. The Board concluded that the current Dodge & Cox fee structure is fair and reasonable and adequately shares economies of scale that may exist.
CONCLUSION
Based on their evaluation of all material factors and assisted by the advice of independent legal counsel to the Independent Trustees, the Board, including the Independent Trustees, concluded that the advisory fee structure was fair and reasonable, that each Fund was paying a competitive fee for the services provided, that the scope and quality of Dodge & Cox’s services has provided substantial value for Fund shareholders over the long term, and that approval of the Agreements was in the best interests of each Fund and its shareholders.
FUND HOLDINGS
The Fund provides a complete list of its holdings four times each fiscal year, as of the end of each quarter. The Fund files the lists with the Securities and Exchange Commission (SEC) on Form N-CSR (second and fourth quarters) and Form N-Q (first and third quarters). Shareholders may view the Fund’s Forms N-CSR and N-Q on the SEC’s website at sec.gov. Forms N-CSR and N-Q may also be reviewed and copied at the SEC’s Public Reference Room in Washington, DC. Information regarding the operations of the Public Reference Room may be obtained by calling 202-942-8090 (direct) or 800-732-0330 (general SEC number). A list of the Fund’s quarter-end holdings is also available at dodgeandcox.com on or about 15 days following each quarter end and remains available on the website until the list is updated in the subsequent quarter.
PROXY VOTING
For a free copy of the Fund’s proxy voting policies and procedures, please call 800-621-3979, visit the Fund’s website at dodgeandcox.com, or visit the SEC’s website at sec.gov. Information regarding how the Fund voted proxies relating to portfolio securities during the most recent 12-month period ending June 30 is also available at dodgeandcox.com or at sec.gov.
HOUSEHOLD MAILINGS
The Fund routinely mails shareholder reports and summary prospectuses to shareholders and, on occasion, proxy statements. In order to reduce the volume of mail, when possible, only one copy of these documents will be sent to shareholders who are part of the same family and share the same residential address.
If you have a direct account with the Funds and you do not want the mailing of shareholder reports and summary prospectuses combined with other members in your household, contact the Funds at 800-621-3979. Your request will be implemented within 30 days.
PAGE 18 § DODGE & COX GLOBAL STOCK FUND
DODGE & COX FUNDS—EXECUTIVE OFFICER & TRUSTEE INFORMATION
| | | | | | |
Name (Age) and
Address* | | Position with Trust (Year of Election or
Appointment) | | Principal Occupation During Past 5 Years | | Other Directorships Held by Trustees |
| INTERESTED TRUSTEES AND EXECUTIVE OFFICERS |
| Charles F. Pohl (57) | | Chairman and Trustee (Officer since 2004) | | Chairman (since 2013), Co-President (2011-2013), Senior Vice President (until 2011), and Director of Dodge & Cox; Chief Investment Officer, Portfolio Manager, Investment Analyst, and member of Investment Policy Committee (IPC), Global Stock Investment Policy Committee (GSIPC), International Investment Policy Committee (IIPC), and Fixed Income Investment Policy Committee (FIIPC) | | — |
| Dana M. Emery (54) | | President and Trustee (Trustee since 1993) | | Chief Executive Officer (since 2013), President (since 2011), Executive Vice President (until 2011), and Director of Dodge & Cox; Director of Fixed Income, Portfolio Manager, and member of FIIPC and Global Bond Investment Policy Committee (GBIPC) | | — |
| John A. Gunn (72) | | Senior Vice President (Officer since 1998) | | Chairman Emeritus (2011-2013), Chairman (until 2011), Chief Executive Officer (until 2010), and Director (until 2013) of Dodge & Cox; Portfolio Manager and member of IPC, GSIPC (until 2014), and IIPC (until 2015) | | — |
| Diana S. Strandberg (56) | | Senior Vice President (Officer since 2006) | | Senior Vice President (since 2011), Vice President (until 2011), and Director (since 2011) of Dodge & Cox; Director of International Equity (since 2009), Portfolio Manager, Investment Analyst, and member of IPC, GSIPC, IIPC, and GBIPC | | — |
| David H. Longhurst (58) | | Treasurer (Officer since 2006) | | Vice President and Assistant Treasurer of Dodge & Cox | | — |
| Thomas M. Mistele (62) | | Secretary (Officer since 1998) | | Chief Operating Officer, Director, Secretary, Senior Counsel (since 2011), and General Counsel (until 2011) of Dodge & Cox | | — |
| Katherine M. Primas (41) | | Chief Compliance Officer (Officer since 2009) | | Vice President (since 2011) and Chief Compliance Officer of Dodge & Cox | | — |
| INDEPENDENT TRUSTEES |
| Thomas A. Larsen (66) | | Trustee (Since 2002) | | Senior Counsel of Arnold & Porter LLP (law firm) (since 2013); Partner of Arnold & Porter LLP (until 2012); Director of Howard, Rice, Nemerovski, Canady, Falk & Rabkin (1977-2011) | | — |
| Ann Mather (55) | | Trustee (Since 2011) | | CFO, Pixar Animation Studios (1999-2004) | | Director, Google, Inc. (internet information services) (since 2005); Director, Glu Mobile, Inc. (multimedia software) (since 2005); Director, Netflix, Inc. (internet television) (since 2010); Director, Arista Networks (cloud networking) (since 2013); Director, Shutterfly, Inc. (internet photography services/publishing) (since 2013) |
| Robert B. Morris III (63) | | Trustee (Since 2011) | | Advisory Director, The Presidio Group (since 2005) | | — |
| Gary Roughead (64) | | Trustee (Since 2013) | | Annenberg Distinguished Visiting Fellow, Hoover Institution (since 2012); Admiral, United States Navy (Ret.); U.S. Navy Chief of Naval Operations (2008-2011) | | Director, Northrop Grumman Corp. (global security) (since 2012) |
| Mark E. Smith (64) | | Trustee (Since 2014) | | Executive Vice President, Managing Director—Fixed Income at Loomis Sayles & Company, L.P. (2003-2011) | | — |
| John B. Taylor (69) | | Trustee (Since 2005) (and 1995-2001) | | Professor of Economics, Stanford University (since 1984); Senior Fellow, Hoover Institution (since 1996); Under Secretary for International Affairs, United States Treasury (2001-2005) | | — |
| * | | The address for each Officer and Trustee is 555 California Street, 40th Floor, San Francisco, California 94104. Each Officer and Trustee oversees all six series in the Dodge & Cox Funds complex and serves for an indefinite term. |
Additional information about the Trust’s Trustees and Officers is available in the Trust’s Statement of Additional Information (SAI). You can get a free copy of the SAI by visiting the Funds’ website at dodgeandcox.com or calling
800-621-3979.
DODGE & COX GLOBAL STOCK FUND §PAGE 19
dodgeandcox.com
For Fund literature, transactions, and account information, please visit the Funds’ website.
or write or call:
DODGE & COX FUNDS
c/o Boston Financial Data Services
P.O. Box 8422
Boston, Massachusetts 02266-8422
(800) 621-3979
INVESTMENT MANAGER
Dodge & Cox
555 California Street, 40th Floor
San Francisco, California 94104
(415) 981-1710
This report is submitted for the general information of the shareholders of the Fund. The report is not authorized for distribution to prospective investors in the Fund unless it is accompanied by a current prospectus.
This report reflects our views, opinions, and portfolio holdings as of December 31, 2015, the end of the reporting period. Any such views are subject to change at any time based upon market or other conditions and Dodge & Cox disclaims any responsibility to update such views. These views may not be relied on as investment advice and, because investment decisions for a Dodge & Cox Fund are based on numerous factors, may not be relied on as an indication of trading intent on behalf of any Dodge & Cox Fund.
DODGE & COX FUNDS®
Annual Report
December 31, 2015
International Stock Fund
ESTABLISHED 2001
TICKER: DODFX
(Closed to New Investors)
12/15 ISF AR Printed on recycled paper
TO OUR SHAREHOLDERS
The Dodge & Cox International Stock Fund had a total return of
–11.4% for the year ending December 31, 2015, compared to a return of –0.8% for the MSCI EAFE (Europe, Australasia, Far East) Index.
MARKET COMMENTARY
In 2015, the U.S. dollar’s sharp appreciation against both developed and emerging market currencies was a meaningful headwind: the MSCI EAFE was up 5% in local currency and down 1% in U.S. dollars, while the MSCI Emerging Markets Index was down 6% in local currency and down 15% in U.S. dollars.
Global growth expectations declined and emerging markets faced significant macroeconomic challenges during the year. Fears of slowing growth in China were amplified by the government’s decision to devalue the renminbi. Since China is the world’s largest consumer of most raw materials, its weaker outlook negatively impacted commodity prices (e.g., global copper prices plummeted 24% and oil prices plunged 35%) and commodity-driven economies around the globe. For example, in South Africa, where mining accounts for approximately 50% of its foreign exchange earnings,(a) the rand depreciated 25% against the U.S. dollar. In addition, prospects for higher U.S. interest rates negatively affected those economies in need of external financing. Facing both fiscal and current account deficits, Brazil’s fiscal and political struggles intensified, and the Brazilian real depreciated 33% against the U.S. dollar during 2015.
In developed markets, a dampened economic recovery and a weaker inflation outlook in the Eurozone led the European Central Bank to extend its asset purchase program aimed at reviving the economy. The Bank of Japan, in turn, introduced measures to supplement its already large Quantitative and Qualitative Easing Program, as economic activity softened and inflation hovered around zero. In contrast, economic activity in the United States expanded at a moderate pace: household spending and business investment increased, the housing market strengthened, and labor market conditions continued to improve, with solid job gains and reduced unemployment.
INVESTMENT STRATEGY
The Fund’s results in 2015 were disappointing and stemmed from three main factors. First, value stocks (the lower valuation portion of the market) underperformed growth stocks (the higher valuation portion of the market) by one of the widest spreads since the global financial crisis. The Fund, which is value-oriented, was significantly affected by this performance divergence. Second, emerging markets collectively underperformed developed markets. The Fund’s investments in individual companies domiciled in a number of especially weak emerging market countries (including Brazil, South Africa, and Turkey) negatively impacted results. Third, some individual holdings—HP Inc.(b), MTN Group, Petrobras, and Standard Chartered—meaningfully detracted from results for the year.
During 2015, we extensively revisited and retested our thinking on many of the Fund’s holdings in the context of
changing macroeconomic conditions and valuations. Our equity and fixed income teams regularly work together to evaluate risk and reward as we look at investment opportunities around the world and across the capital structure; this collaboration intensified during 2015. As part of our bottom-up research process, a broad cross section of our team thoroughly investigated individual company concerns, vetted investment assumptions, and conducted further due diligence. For example, groups of portfolio managers and analysts travelled together across the globe to meet with company managements, government officials, suppliers, competitors, and consultants. In addition, we conducted macroeconomic reviews to evaluate the key factors affecting a company’s access to and cost of capital, end-market demand, and relative competitiveness. Through this comprehensive process, we reaffirmed our view that the Fund’s holdings have attractive valuations, strong competitive positions, and favorable growth prospects over our three- to five-year investment horizon.
In 2015, companies with higher valuations became more expensive relative to companies with lower valuations. As a result of changing valuations, we initiated 8 new holdings (including AstraZeneca, Cemex, Hyundai Motor, and JD.com(c)) and sold 11 holdings (including Imperial Tobacco Group and Standard Bank of South Africa) during the year. We also added to a number of our existing holdings domiciled in and exposed to the developing world as their valuations became increasingly attractive. At year end, 24.0% of the Fund was invested in companies domiciled in emerging markets, while 42.6% of the Fund was invested in companies that derive more than 40% of their revenues from the developing world, regardless of domicile.(d) Itau Unibanco (in Brazil), Schneider Electric (in France), and Standard Chartered (in the United Kingdom)—examples of such adds in the Fund—are discussed below.
Itau Unibanco
Itau Unibanco, Brazil’s leading bank, has strong market positions in consumer credit and payments and is exposed to under-penetrated areas of the financial market that are poised to grow over the next three to five years. Brazil’s struggling economy and sharp currency depreciation weighed substantially on Itau Unibanco’s stock during 2015 (down 41%(e) in U.S. dollars). We conducted both on-the-ground and other due diligence with company management and government officials to evaluate economic and company-specific concerns. What we found reaffirmed our view that Itau’s management has proactively managed credit risk by reducing exposures and raising provisions. Management is focused on enhancing shareholder value and has a solid track record of capital allocation. Beyond this cycle, management is investing for the future and strengthening Itau’s competitive advantage. For example, Itau continues to invest in online access to better serve the needs of affluent customers and more efficiently handle payments and transactions for its retail customer base. At 1.6 times tangible book value, Itau trades at a 10-year low valuation. While political and macroeconomic instability has plagued Brazil, we believe Itau is an attractive long-
PAGE 2 § DODGE & COX INTERNATIONAL STOCK FUND
term investment opportunity and added to the holding. On December 31, Itau was a 1.7% position in the Fund.
Schneider Electric
Schneider Electric, a 2.2% position in the Fund, is a global leader in electrical products, systems, and services such as low- and medium-voltage gear, factory automation equipment and systems, and uninterruptible power supply solutions for data centers. While incorporated in France, Schneider derives only 27% of its revenues from Western Europe and more than 40% of its sales come from emerging markets. Thus, Schneider is a prime example that a company’s domicile does not always reflect its true revenue exposure. Schneider’s stock performed poorly in 2015 (down 21% in U.S. dollars) due to lower than expected construction and industrial activity, driven in large part by a slowdown in China, Russia, and Brazil.
Despite these end-market headwinds, Schneider has high-quality business franchises with number one or two market positions in over 75% of its revenues and attractive returns on tangible capital. We believe the company can grow given its exposure to megatrends such as global electrification, energy efficiency, and factory automation. We have had numerous conversations with management and confirmed they are proactively managing the company’s cost structure, portfolio of businesses, and capital. Management recently initiated a EUR 1.0-1.5 billion share buyback program. Schneider has a strong balance sheet and trades at 13 times estimated forward earnings, a discount to its peers and the market.
Standard Chartered
Standard Chartered, domiciled in the United Kingdom, provides consumer and wholesale banking services to customers in Asia, Africa, and the Middle East. The company has a strong global franchise with a broad network across the developing world that would be very difficult to replicate. Standard Chartered’s global payments and trade business is a particular strength: local roots from its longstanding presence allow for local currency funding, and cooperation across the network provides integrated wholesale banking services to clients. During 2015, Standard Chartered’s performance suffered from the slowdown in emerging markets, large fines from legacy issues, rising restructuring costs, and deteriorating asset quality. As a result, Standard Chartered’s stock was down 39% in U.S. dollars and its valuation fell to 0.6 times tangible book value, a historically low level.
In 2015, we met with Standard Chartered’s new executive team on multiple occasions to better understand its strategy and priorities. This management team is focused on streamlining the organization and prioritizing profitability over growth. They have a realistic assessment of current balance sheet issues, as evidenced by the recent $5.1 billion capital raise that provides ample new capital to fortify the balance sheet, resolve legacy issues, and accelerate their restructuring plans. The company seeks to cut costs, exit peripheral businesses, and increase investments to improve systems and further diversify its geographic footprint. In addition, Standard Chartered has been able to attract high-caliber talent with some key new hires. Based on the bank’s leading
franchise, strong balance sheet, management’s initiatives, and low valuation, we recently added to the holding. On December 31, Standard Chartered was a 2.4% position in the Fund.
IN CLOSING
International equity valuations are attractive: the MSCI EAFE traded at 14.7 times forward estimated earnings (compared to a 20-year average of 15.9 times) with a 3.2% dividend yield at year end. Valuation disparities have widened significantly, creating more opportunities for value-oriented investors. We are identifying attractively valued investments in both developed and emerging markets and continue to be optimistic about the long-term outlook for the portfolio.
Our experienced and stable team has weathered past periods of market turbulence by remaining steadfast in our investment process and philosophy. Our approach—constructing a diversified portfolio through in-depth, independent research, a three- to five-year investment horizon, and a focus on valuation relative to underlying fundamentals—continues to guide us through this period. We remain confident that our enduring value-oriented approach will benefit the Fund in the years ahead.
Thank you for your continued confidence in our firm. As always, we welcome your comments and questions.
For the Board of Trustees,
| | |
| | |
Charles F. Pohl, Chairman | | Dana M. Emery, President |
January 29, 2016
| (a) | | Foreign exchange earnings are the proceeds from exporting goods and services and exchanging currencies in global markets. |
| (b) | | After Hewlett-Packard Co. split into two companies, HP Inc. retained the HPQ ticker symbol. HP Inc.’s –37% return in 2015 includes Hewlett-Packard Co.’s performance through October 2015. |
| (c) | | The use of specific examples does not imply that they are more attractive investments than the Fund’s other holdings. |
| (d) | | Unless otherwise specified, all weightings and characteristics are as of December 31, 2015. |
| (e) | | All returns are total returns unless otherwise noted. |
DODGE & COX INTERNATIONAL STOCK FUND §PAGE 3
ANNUAL PERFORMANCE REVIEW
The Fund underperformed the MSCI EAFE by 10.5 percentage points in 2015.
Key Detractors from Relative Results
| | § | | Weak returns from the Fund’s holdings in the Financials sector (down 19% compared to down 3% for the MSCI EAFE sector), especially in the developing world, hurt results. Itau Unibanco (down 41%), Kasikornbank (down 39%), Standard Chartered (down 39%), and ICICI Bank (down 28%) performed poorly. | |
| | § | | The Fund’s holdings in the Telecommunication Services sector (down 24% compared to up 3% for the MSCI EAFE sector) were notable detractors. MTN Group (down 53%) and America Movil (down 31%), both emerging market companies, were particularly weak. | |
| | § | | The Fund’s holdings in the Industrials sector (down 13% compared to flat for the MSCI EAFE sector) negatively impacted performance. Tyco International (down 26%) and Schneider Electric (down 21%) lagged. | |
| | § | | Additional detractors included Teck Resources (down 71% since date of purchase), Petrobras (down 55%), HP Inc. (down 37%), and Schlumberger (down 16%). | |
Key Contributors to Relative Results
| | § | | The Fund’s average underweight position in the Metals & Mining industry (0.4% versus 3% for the MSCI EAFE industry), a weaker area of the market (down 40%), helped performance. | |
| | § | | Strong returns from the Fund’s holdings in the Automobiles industry (up 12% compared to up 2% for the MSCI EAFE industry) aided results. Nissan Motor (up 24%), Yamaha Motor (up 14%), and Honda Motor (up 13%) performed well. | |
| | § | | Additional contributors included Infineon Technologies (up 40%), Nintendo (up 34%), Imperial Tobacco Group (up 24% to date of sale), and Naspers (up 5%). | |
KEY CHARACTERISTICS OF DODGE & COX
Independent Organization
Dodge & Cox is one of the largest privately owned investment managers in the world. We remain committed to independence, with a goal of providing the highest quality investment management service to our existing clients.
Over 85 Years of Investment Experience
Dodge & Cox was founded in 1930. We have a stable and well-qualified team of investment professionals, most of whom have spent their entire careers at Dodge & Cox.
Experienced Investment Team
The International Investment Policy Committee, which is the decision-making body for the International Stock Fund, is a nine-member committee with an average tenure at Dodge & Cox of 22 years.
One Business with a Single Research Office
Dodge & Cox manages equity (domestic, international, and global), fixed income (domestic and global), and balanced investments, operating from one office in San Francisco.
Consistent Investment Approach
Our team decision-making process involves thorough, bottom-up fundamental analysis of each investment.
Long-Term Focus and Low Expenses
We invest with a three- to five-year investment horizon, which has historically resulted in low turnover relative to our peers. We manage Funds that maintain low expense ratios.
Risks: The Fund is subject to market risk, meaning holdings in the Fund may decline in value for extended periods due to the financial prospects of individual companies, or due to general market and economic conditions. Investing in non-U.S. securities may entail risk due to foreign economic and political developments; this risk may be increased when investing in emerging markets. The Fund is also subject to currency risk. Please read the prospectus and summary prospectus for specific details regarding the Fund’s risk profile.
PAGE 4 § DODGE & COX INTERNATIONAL STOCK FUND
GROWTH OF $10,000 OVER 10 YEARS
FOR AN INVESTMENT MADE ON DECEMBER 31, 2005

AVERAGE ANNUAL TOTAL RETURN
FOR PERIODS ENDED DECEMBER 31, 2015
| | | | | | | | | | | | | | | | |
| | | 1 Year | | | 3 Years | | | 5 Years | | | 10 Years | |
Dodge & Cox International
Stock Fund | | | –11.35 | % | | | 3.87 | % | | | 2.65 | % | | | 3.83 | % |
MSCI EAFE Index | | | –0.82 | | | | 5.02 | | | | 3.61 | | | | 3.03 | |
Returns represent past performance and do not guarantee future results. Investment return and share price will fluctuate with market conditions, and investors may have a gain or loss when shares are sold. Fund performance changes over time and currently may be significantly lower than stated. Performance is updated and published monthly. Visit the Fund’s website at dodgeandcox.com or call 800-621-3979 for current performance figures.
The Fund’s total returns include the reinvestment of dividend and capital gain distributions, but have not been adjusted for any income taxes payable by shareholders on these distributions or on Fund share redemptions. Index returns include dividends but, unlike Fund returns, do not reflect fees or expenses. The MSCI EAFE (Europe, Australasia, Far East) Index is a broad-based, unmanaged equity market index aggregated from 21 developed market country indices, excluding the United States and Canada. MSCI makes no express or implied warranties or representations and shall have no liability whatsoever with respect to any MSCI data contained herein. The MSCI data may not be further redistributed or used as a basis for other indices or any securities or financial products. This report is not approved, reviewed, or produced by MSCI.
MSCI EAFE is a service mark of MSCI Barra.
FUND EXPENSE EXAMPLE
As a Fund shareholder, you incur ongoing Fund costs, including management fees and other Fund expenses. All mutual funds have ongoing costs, sometimes referred to as operating expenses. The following example shows ongoing costs of investing in the Fund and can help you understand these costs and compare them with those of other mutual funds. The example assumes a $1,000 investment held for the six months indicated.
ACTUAL EXPENSES
The first line of the table below provides information about actual account values and expenses based on the Fund’s actual returns. You may use the information in this line, together with your account balance, to estimate the expenses that you paid over the period. Simply divide your account value by $1,000 (for example, an $8,600 account value divided by $1,000 = 8.6), then multiply the result by the number in the first line under the heading “Expenses Paid During Period” to estimate the expenses you paid on your account during this period.
HYPOTHETICAL EXAMPLE FOR COMPARISON WITH OTHER MUTUAL FUNDS
Information on the second line of the table can help you compare ongoing costs of investing in the Fund with those of other mutual funds. This information may not be used to estimate the actual ending account balance or expenses you paid during the period. The hypothetical “Ending Account Value” is based on the actual expense ratio of the Fund and an assumed 5% annual rate of return before expenses (not the Fund’s actual return). The amount under the heading “Expenses Paid During Period” shows the hypothetical expenses your account would have incurred under this scenario. You can compare this figure with the 5% hypothetical examples that appear in shareholder reports of other mutual funds.
| | | | | | | | | | | | |
Six Months Ended December 31, 2015 | | Beginning Account Value
7/1/2015 | | | Ending Account Value
12/31/2015 | | | Expenses Paid During Period* | |
Based on Actual Fund Return | | $ | 1,000.00 | | | $ | 853.20 | | | $ | 2.96 | |
Based on Hypothetical 5% Yearly Return | | | 1,000.00 | | | | 1,022.01 | | | | 3.23 | |
| * | Expenses are equal to the Fund’s annualized expense ratio of 0.63%, multiplied by the average account value over the period, multiplied by 184/365 (to reflect the one-half year period). |
The expenses shown in the table highlight ongoing costs only and do not reflect any transactional fees or account maintenance fees. Though other mutual funds may charge such fees, please note that the Fund does not charge transaction fees (e.g., redemption fees, sales loads) or universal account maintenance fees (e.g., small account fees).
DODGE & COX INTERNATIONAL STOCK FUND §PAGE 5
| | | | |
| FUND INFORMATION (unaudited) | | | December 31, 2015 | |
| | | | |
GENERAL INFORMATION | | | |
Net Asset Value Per Share | | | $36.48 | |
Total Net Assets (billions) | | | $57.0 | |
Expense Ratio | | | 0.64% | |
Portfolio Turnover Rate | | | 18% | |
30-Day SEC Yield(a) | | | 1.80% | |
Number of Companies | | | 79 | |
Fund Inception | | | 2001 | |
No sales charges or distribution fees | | | | |
Investment Manager: Dodge & Cox, San Francisco. Managed by the International Investment Policy Committee, whose nine members’ average tenure at Dodge & Cox is 22 years.
| | | | | | | | |
| PORTFOLIO CHARACTERISTICS | | Fund | | | MSCI
EAFE | |
Median Market Capitalization (billions) | | | $25 | | | | $9 | |
Weighted Average Market Capitalization (billions) | | | $61 | | | | $54 | |
Price-to-Earnings Ratio(b) | | | 12.5x | | | | 14.7x | |
Countries Represented | | | 23 | | | | 21 | |
Emerging Markets (Brazil, China, India, Mexico, South Africa, South Korea, Thailand, Turkey, United Arab Emirates) | | | 24.0% | | | | 0.0% | |
| | | | |
| TEN LARGEST HOLDINGS (%)(c) | | Fund | |
Naspers, Ltd. (South Africa) | | | 4.2 | |
Samsung Electronics Co., Ltd. (South Korea) | | | 3.8 | |
Sanofi (France) | | | 3.7 | |
Schlumberger, Ltd. (United States) | | | 3.4 | |
Novartis AG (Switzerland) | | | 3.4 | |
Roche Holding AG (Switzerland) | | | 3.3 | |
Credit Suisse Group AG (Switzerland) | | | 2.7 | |
Barclays PLC (United Kingdom) | | | 2.5 | |
Standard Chartered PLC (United Kingdom) | | | 2.3 | |
Liberty Global PLC (United Kingdom) | | | 2.3 | |
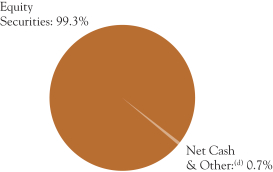
| | | | | | | | |
| REGION DIVERSIFICATION (%)(e) | | Fund | | | MSCI
EAFE | |
Europe (excluding United Kingdom) | | | 42.3 | | | | 45.1 | |
Japan | | | 13.4 | | | | 23.4 | |
Pacific (excluding Japan) | | | 13.0 | | | | 11.3 | |
United Kingdom | | | 12.1 | | | | 19.4 | |
United States | | | 6.7 | | | | 0.0 | |
Africa/Middle East | | | 5.7 | | | | 0.8 | |
Latin America | | | 5.5 | | | | 0.0 | |
Canada | | | 0.6 | | | | 0.0 | |
| | | | | | | | |
| SECTOR DIVERSIFICATION (%) | | Fund | | | MSCI
EAFE | |
Financials | | | 26.1 | | | | 25.6 | |
Consumer Discretionary | | | 18.8 | | | | 13.2 | |
Information Technology | | | 16.1 | | | | 5.2 | |
Health Care | | | 12.8 | | | | 11.9 | |
Industrials | | | 8.6 | | | | 12.6 | |
Energy | | | 7.3 | | | | 4.5 | |
Materials | | | 5.2 | | | | 6.4 | |
Telecommunication Services | | | 4.0 | | | | 4.9 | |
Consumer Staples | | | 0.4 | | | | 11.9 | |
Utilities | | | 0.0 | | | | 3.8 | |
| (a) | SEC Yield is an annualization of the Fund’s total net investment income per share for the 30-day period ended on the last day of the month. |
| (b) | Price-to-earnings (P/E) ratios are calculated using 12-month forward earnings estimates from third-party sources. |
| (c) | The Fund’s portfolio holdings are subject to change without notice. The mention of specific securities is not a recommendation to buy, sell, or hold any particular security and is not indicative of Dodge & Cox’s current or future trading activity. |
| (d) | Net Cash & Other includes short-term investments (e.g., money market funds and repurchase agreements) and other assets less liabilities (e.g., cash, receivables, payables, and unrealized appreciation/depreciation on certain derivatives). |
| (e) | The Fund may classify a company in a different category than the MSCI EAFE. The Fund generally classifies a company based on its country of incorporation, but may designate a different country in certain circumstances. |
PAGE 6 § DODGE & COX INTERNATIONAL STOCK FUND
| | | | |
| CONSOLIDATED PORTFOLIO OF INVESTMENTS | | | December 31, 2015 | |
| | | | | | | | |
| COMMON STOCKS: 95.5% | | | | | | |
| | |
| | | SHARES | | | VALUE | |
| CONSUMER DISCRETIONARY: 18.8% | |
AUTOMOBILES & COMPONENTS: 8.7% | |
Bayerische Motoren Werke AG (Germany) | | | 10,189,100 | | | $ | 1,073,100,643 | |
Honda Motor Co., Ltd. (Japan) | | | 33,966,400 | | | | 1,088,335,707 | |
Honda Motor Co., Ltd. ADR (Japan) | | | 5,749,300 | | | | 183,575,149 | |
Hyundai Motor Co. (South Korea) | | | 2,856,012 | | | | 359,872,991 | |
Mahindra & Mahindra, Ltd. (India) | | | 16,522,808 | | | | 315,939,191 | |
NGK Spark Plug Co., Ltd.(b) (Japan) | | | 10,341,300 | | | | 272,417,191 | |
Nissan Motor Co., Ltd. (Japan) | | | 93,132,200 | | | | 975,360,095 | |
Yamaha Motor Co., Ltd.(b) (Japan) | | | 31,550,100 | | | | 706,999,061 | |
| | | | | | | | |
| | | | 4,975,600,028 | |
CONSUMER DURABLES & APPAREL: 1.4% | |
Panasonic Corp. (Japan) | | | 76,711,434 | | | | 778,536,596 | |
| | |
CONSUMER SERVICES: 0.3% | | | | | | | | |
New Oriental Education & Technology Group, Inc. ADR(b) (Cayman Islands/China) | | | 6,369,328 | | | | 199,805,819 | |
| | |
MEDIA: 8.1% | | | | | | | | |
Grupo Televisa SAB ADR (Mexico) | | | 25,685,392 | | | | 698,899,516 | |
Liberty Global PLC LiLAC, Series A(a) (United Kingdom) | | | 580,950 | | | | 24,033,902 | |
Liberty Global PLC LiLAC, Series C(a) (United Kingdom) | | | 874,412 | | | | 37,599,716 | |
Liberty Global PLC, Series A(a) (United Kingdom) | | | 11,619,005 | | | | 492,181,052 | |
Liberty Global PLC, Series C(a) (United Kingdom) | | | 19,696,847 | | | | 803,040,452 | |
Naspers, Ltd. (South Africa) | | | 17,493,100 | | | | 2,398,019,528 | |
Television Broadcasts, Ltd.(b) (Hong Kong) | | | 40,022,900 | | | | 164,996,568 | |
| | | | | | | | |
| | | | 4,618,770,734 | |
RETAILING: 0.3% | | | | | | | | |
JD.com, Inc. ADR(a) (Cayman Islands/China) | | | 5,083,036 | | | | 164,004,157 | |
| | | | | | | | |
| | | | 10,736,717,334 | |
| CONSUMER STAPLES: 0.4% | |
FOOD, BEVERAGE & TOBACCO: 0.4% | |
Anadolu Efes Biracilik ve Malt Sanayii
AS(b) (Turkey) | | | 32,425,176 | | | | 210,023,170 | |
| | |
| ENERGY: 6.2% | | | | | | | | |
Royal Dutch Shell PLC ADR (United Kingdom) | | | 10,005,355 | | | | 458,145,205 | |
Saipem SPA(a)(b) (Italy) | | | 46,865,200 | | | | 376,728,063 | |
Schlumberger, Ltd. (Curacao/United States) | | | 27,754,124 | | | | 1,935,850,149 | |
Total SA (France) | | | 10,745,842 | | | | 481,894,390 | |
Weatherford International PLC(a) (Ireland) | | | 31,817,592 | | | | 266,949,597 | |
| | | | | | | | |
| | | | 3,519,567,404 | |
| FINANCIALS: 24.4% | | | | | | | | |
BANKS: 15.4% | | | | | | | | |
Banco Santander SA (Spain) | | | 68,776,836 | | | | 340,679,565 | |
Barclays PLC (United Kingdom) | | | 446,247,998 | | | | 1,440,052,935 | |
BNP Paribas SA (France) | | | 17,886,158 | | | | 1,015,235,180 | |
ICICI Bank, Ltd. (India) | | | 260,427,185 | | | | 1,027,438,757 | |
Kasikornbank PCL- Foreign(b) (Thailand) | | | 139,883,027 | | | | 578,306,373 | |
Lloyds Banking Group PLC (United Kingdom) | | | 834,782,400 | | | | 899,225,897 | |
Mitsubishi UFJ Financial Group, Inc. (Japan) | | | 91,382,100 | | | | 565,554,211 | |
Siam Commercial Bank PCL- Foreign (Thailand) | | | 78,078,500 | | | | 257,666,820 | |
Societe Generale SA (France) | | | 9,252,542 | | | | 428,049,787 | |
Standard Chartered PLC (United Kingdom) | | | 161,949,813 | | | | 1,345,813,561 | |
UniCredit SPA (Italy) | | | 118,398,593 | | | | 652,135,217 | |
Yapi ve Kredi Bankasi AS(b) (Turkey) | | | 204,376,868 | | | | 230,558,187 | |
| | | | | | | | |
| | | | 8,780,716,490 | |
| | | | | | | | |
| | |
| | | SHARES | | | VALUE | |
DIVERSIFIED FINANCIALS: 4.2% | | | | | | | | |
Credit Suisse Group AG (Switzerland) | | | 70,622,958 | | | $ | 1,526,397,979 | |
Haci Omer Sabanci Holding AS (Turkey) | | | 82,095,354 | | | | 233,078,292 | |
UBS Group AG (Switzerland) | | | 31,278,800 | | | | 601,926,154 | |
| | | | | | | | |
| | | | 2,361,402,425 | |
INSURANCE: 3.4% | | | | | | | | |
AEGON NV(b) (Netherlands) | | | 130,337,763 | | | | 740,800,935 | |
Aviva PLC (United Kingdom) | | | 80,919,501 | | | | 615,544,297 | |
Swiss Re AG (Switzerland) | | | 6,028,968 | | | | 586,486,877 | |
| | | | | | | | |
| | | | 1,942,832,109 | |
REAL ESTATE: 1.4% | | | | | | | | |
BR Malls Participacoes SA(b) (Brazil) | | | 54,870,300 | | | | 153,032,279 | |
Hang Lung Group, Ltd.(b) (Hong Kong) | | | 110,524,300 | | | | 358,666,866 | |
Hang Lung Properties, Ltd. (Hong Kong) | | | 126,187,300 | | | | 287,216,724 | |
| | | | | | | | |
| | | | 798,915,869 | |
| | | | | | | | |
| | | | 13,883,866,893 | |
| HEALTH CARE: 12.8% | | | | | | | | |
PHARMACEUTICALS, BIOTECHNOLOGY & LIFE SCIENCES: 12.8% | |
AstraZeneca PLC (United Kingdom) | | | 4,793,300 | | | | 326,214,954 | |
Bayer AG (Germany) | | | 8,199,050 | | | | 1,028,663,421 | |
Novartis AG (Switzerland) | | | 8,095,570 | | | | 691,981,754 | |
Novartis AG ADR (Switzerland) | | | 14,346,800 | | | | 1,234,398,672 | |
Roche Holding AG (Switzerland) | | | 6,942,700 | | | | 1,913,325,710 | |
Sanofi (France) | | | 24,946,522 | | | | 2,130,895,350 | |
| | | | | | | | |
| | | | 7,325,479,861 | |
| INDUSTRIALS: 8.6% | | | | | | | | |
CAPITAL GOODS: 6.9% | | | | | | | | |
Koninklijke Philips NV (Netherlands) | | | 31,282,995 | | | | 800,964,341 | |
Mitsubishi Electric Corp. (Japan) | | | 100,043,000 | | | | 1,048,902,987 | |
Nidec Corp. (Japan) | | | 5,430,700 | | | | 393,086,983 | |
Schneider Electric SA (France) | | | 21,750,646 | | | | 1,242,387,539 | |
Smiths Group PLC(b) (United Kingdom) | | | 33,926,200 | | | | 469,881,576 | |
| | | | | | | | |
| | | | 3,955,223,426 | |
COMMERCIAL & PROFESSIONAL SERVICES: 1.4% | |
ADT Corp. (United States) | | | 6,296,960 | | | | 207,673,741 | |
Tyco International PLC (Ireland) | | | 18,390,420 | | | | 586,470,494 | |
| | | | | | | | |
| | | | 794,144,235 | |
TRANSPORTATION: 0.3% | | | | | | | | |
DP World, Ltd. (United Arab Emirates) | | | 8,256,304 | | | | 167,602,971 | |
| | | | | | | | |
| | | | 4,916,970,632 | |
| INFORMATION TECHNOLOGY: 15.1% | |
SEMICONDUCTORS & SEMICONDUCTOR EQUIPMENT: 1.4% | |
Infineon Technologies AG(b) (Germany) | | | 55,762,370 | | | | 816,016,345 | |
| | |
SOFTWARE & SERVICES: 2.7% | | | | | | | | |
Baidu, Inc. ADR(a) (Cayman Islands/China) | | | 4,903,965 | | | | 927,045,544 | |
Nintendo Co., Ltd. (Japan) | | | 4,287,100 | | | | 590,170,122 | |
| | | | | | | | |
| | | | 1,517,215,666 | |
TECHNOLOGY, HARDWARE & EQUIPMENT: 11.0% | |
Brother Industries, Ltd.(b) (Japan) | | | 12,212,000 | | | | 140,035,217 | |
Hewlett Packard Enterprise Co. (United States) | | | 65,989,204 | | | | 1,003,035,901 | |
HP, Inc. (United States) | | | 57,407,104 | | | | 679,700,111 | |
Kyocera Corp.(b) (Japan) | | | 19,122,400 | | | | 886,308,045 | |
Samsung Electronics Co., Ltd. (South Korea) | | | 1,521,592 | | | | 1,624,804,017 | |
TE Connectivity, Ltd. (Switzerland) | | | 13,646,362 | | | | 881,691,449 | |
Telefonaktiebolaget LM Ericsson (Sweden) | | | 110,232,700 | | | | 1,067,791,477 | |
| | | | | | | | |
| | | | 6,283,366,217 | |
| | | | | | | | |
| | | | 8,616,598,228 | |
| | |
| See accompanying Notes to Consolidated Financial Statements | | DODGE & COX INTERNATIONAL STOCK FUND §PAGE 7 |
| | | | |
| CONSOLIDATED PORTFOLIO OF INVESTMENTS | | | December 31, 2015 | |
| | | | | | | | |
| COMMON STOCKS (continued) | |
| | |
| | | SHARES | | | VALUE | |
| MATERIALS: 5.2% | | | | | | | | |
Agrium, Inc. (Canada) | | | 2,079,983 | | | $ | 185,825,681 | |
Akzo Nobel NV (Netherlands) | | | 7,688,944 | | | | 515,395,513 | |
Cemex SAB de CV ADR (Mexico) | | | 43,079,635 | | | | 239,953,567 | |
LafargeHolcim, Ltd. (Switzerland) | | | 18,933,349 | | | | 948,705,791 | |
Lanxess AG(b) (Germany) | | | 4,228,334 | | | | 194,678,351 | |
Linde AG (Germany) | | | 4,987,605 | | | | 723,967,418 | |
Teck Resources, Ltd., Class B (Canada) | | | 46,287,792 | | | | 178,670,877 | |
| | | | | | | | |
| | | | 2,987,197,198 | |
| TELECOMMUNICATION SERVICES: 4.0% | |
America Movil SAB de CV, Series L (Mexico) | | | 618,430,000 | | | | 434,187,415 | |
Bharti Airtel, Ltd. (India) | | | 57,768,204 | | | | 295,144,494 | |
China Mobile, Ltd. (Hong Kong/China) | | | 27,348,200 | | | | 308,768,008 | |
Millicom International Cellular SA SDR(b) (Luxembourg) | | | 10,088,392 | | | | 574,611,534 | |
MTN Group, Ltd. (South Africa) | | | 77,635,000 | | | | 667,113,815 | |
| | | | | | | | |
| | | | 2,279,825,266 | |
| | | | | | | | |
TOTAL COMMON STOCKS
(Cost $58,346,485,140) | | | $ | 54,476,245,986 | |
| |
| PREFERRED STOCKS: 3.8% | | | | |
| ENERGY: 1.1% | | | | | | | | |
Petroleo Brasileiro SA ADR(a) (Brazil) | | | 178,018,900 | | | | 605,264,260 | |
| | |
| FINANCIALS: 1.7% | | | | | | | | |
BANKS: 1.7% | | | | | | | | |
Itau Unibanco Holding SA (Brazil) | | | 150,343,065 | | | | 982,425,551 | |
|
| INFORMATION TECHNOLOGY: 1.0% | |
TECHNOLOGY, HARDWARE & EQUIPMENT: 1.0% | |
Samsung Electronics Co., Ltd. (South Korea) | | | 586,116 | | | | 542,444,786 | |
| | | | | | | | |
| |
TOTAL PREFERRED STOCKS
(Cost $3,828,007,464) | | | $ | 2,130,134,597 | |
| | | | | | | | |
| SHORT-TERM INVESTMENTS: 0.2% | |
| | |
| | | PAR VALUE | | | VALUE | |
MONEY MARKET FUND: 0.1% | | | | | | | | |
SSgA U.S. Treasury Money Market Fund | | $ | 57,731,545 | | | $ | 57,731,545 | |
| | |
REPURCHASE AGREEMENT: 0.1% | | | | | | | | |
Fixed Income Clearing Corporation(c) 0.08%, dated 12/31/15, due 1/4/16, maturity value $72,314,643 | | | 72,314,000 | | | | 72,314,000 | |
| | | | | | | | |
TOTAL SHORT-TERM INVESTMENTS
(Cost $130,045,545) | | | $ | 130,045,545 | |
| | | | | | | | |
TOTAL INVESTMENTS
(Cost $62,304,538,149) | | | 99.5 | % | | $ | 56,736,426,128 | |
OTHER ASSETS LESS LIABILITIES | | | 0.5 | % | | | 292,177,735 | |
| | | | | | | | |
| NET ASSETS | | | 100.0 | % | | $ | 57,028,603,863 | |
| | | | | | | | |
| (b) | See Note 9 regarding holdings of 5% voting securities |
| (c) | Repurchase agreement is collateralized by U.S. Treasury Note 1.75%, 12/31/20. Total collateral value is $73,762,681. |
In determining a company’s country designation, the Fund generally references the country of incorporation. In cases where the Fund considers the country of incorporation to be a “jurisdiction of convenience” chosen primarily for tax purposes or in other limited circumstances, the Fund uses the country designation of an appropriate broad-based market index. In those cases, two countries are listed—the country of incorporation and the country designated by an appropriate index, respectively.
ADR: American Depositary Receipt
SDR: Swedish Depository Receipt
FORWARD CURRENCY CONTRACTS
| | | | | | | | | | | | | | | | |
| | | | | | Contract Amount | | | | |
| Counterparty | | Settlement
Date | | | Receive U.S. Dollar | | | Deliver
Foreign
Currency | | | Unrealized
Appreciation /
(Depreciation) | |
Contracts to sell CHF: | | | | | | | | | |
Goldman Sachs | | | 1/27/16 | | | | 413,060,988 | | | | 400,000,000 | | | $ | 13,327,311 | |
Goldman Sachs | | | 2/3/16 | | | | 528,955,212 | | | | 520,000,000 | | | | 9,145,375 | |
UBS | | | 2/3/16 | | | | 471,272,639 | | | | 465,000,000 | | | | 6,442,689 | |
Citibank | | | 3/2/16 | | | | 173,604,222 | | | | 175,000,000 | | | | (1,537,699 | ) |
Contracts to sell EUR: | | | | | | | | | |
Barclays | | | 2/24/16 | | | | 278,608,200 | | | | 260,000,000 | | | | (4,296,367 | ) |
Credit Suisse | | | 2/24/16 | | | | 536,530,000 | | | | 500,000,000 | | | | (7,517,244 | ) |
JPMorgan | | | 2/24/16 | | | | 536,220,000 | | | | 500,000,000 | | | | (7,827,244 | ) |
Deutsche Bank | | | 3/2/16 | | | | 531,558,500 | | | | 500,000,000 | | | | (12,583,615 | ) |
Barclays | | | 3/9/16 | | | | 653,646,000 | | | | 600,000,000 | | | | 556,905 | |
HSBC | | | 3/9/16 | | | | 326,307,000 | | | | 300,000,000 | | | | (237,547 | ) |
| | | | | | | | | | | | | | | | |
| | | | | | | | | | | | | | $ | (4,527,436 | ) |
| | | | | | | | | | | | | | | | |
| | |
| PAGE 8 § DODGE & COX INTERNATIONAL STOCK FUND | | See accompanying Notes to Consolidated Financial Statements |
| | | | |
CONSOLIDATED STATEMENT OF ASSETS AND LIABILITIES | |
| |
| | | December 31, 2015 | |
ASSETS: | | | | |
Investments, at value | | | | |
Unaffiliated issuers (cost $56,299,697,750) | | $ | 52,256,872,593 | |
Affiliated issuers (cost $6,004,840,399) | | | 4,479,553,535 | |
| | | | |
| | | 56,736,426,128 | |
Unrealized appreciation on forward currency contracts | | | 29,472,280 | |
Cash denominated in foreign currency (cost $6,826,649) | | | 6,790,936 | |
Cash | | | 100 | |
Receivable for investments sold | | | 218,815,943 | |
Receivable for Fund shares sold | | | 94,685,572 | |
Dividends and interest receivable | | | 148,753,606 | |
Prepaid expenses and other assets | | | 352,521 | |
| | | | |
| | | 57,235,297,086 | |
| | | | |
LIABILITIES: | | | | |
Unrealized depreciation on forward currency contracts | | | 33,999,716 | |
Payable for Fund shares redeemed | | | 140,460,556 | |
Management fees payable | | | 29,782,461 | |
Accrued expenses | | | 2,450,490 | |
| | | | |
| | | 206,693,223 | |
| | | | |
NET ASSETS | | $ | 57,028,603,863 | |
| | | | |
NET ASSETS CONSIST OF: | | | | |
Paid in capital | | $ | 64,423,134,152 | |
Distributions in excess of net investment income | | | (5,017,088 | ) |
Accumulated net realized loss | | | (1,813,517,131 | ) |
Net unrealized depreciation | | | (5,575,996,070 | ) |
| | | | |
| | $ | 57,028,603,863 | |
| | | | |
Fund shares outstanding (par value $0.01 each,
unlimited shares authorized) | | | 1,563,237,054 | |
Net asset value per share | | $ | 36.48 | |
|
CONSOLIDATED STATEMENT OF OPERATIONS | |
| |
| | | Year Ended
December 31, 2015 | |
INVESTMENT INCOME: | | | | |
Dividends (net of foreign taxes of $94,101,785) | | | | |
Unaffiliated issuers | | $ | 1,426,934,440 | |
Affiliated issuers | | | 226,416,324 | |
Interest | | | 268,570 | |
| | | | |
| | | 1,653,619,334 | |
| | | | |
EXPENSES: | | | | |
Management fees | | | 397,371,361 | |
Custody and fund accounting fees | | | 9,026,504 | |
Transfer agent fees | | | 9,712,021 | |
Professional services | | | 353,288 | |
Shareholder reports | | | 1,892,718 | |
Registration fees | | | 473,472 | |
Trustees’ fees | | | 237,500 | |
Miscellaneous | | | 4,262,360 | |
| | | | |
| | | 423,329,224 | |
| | | | |
NET INVESTMENT INCOME | | | 1,230,290,110 | |
| | | | |
| |
REALIZED AND UNREALIZED GAIN (LOSS): | | | | |
Net realized gain (loss) | | | | |
Investments in unaffiliated issuers | | | 765,542,221 | |
Investments in affiliated issuers | | | 339,270,796 | |
Forward currency contracts | | | 478,324,730 | |
Foreign currency transactions | | | (14,077,329 | ) |
Net change in unrealized appreciation/depreciation | | | | |
Investments | | | (10,361,707,776 | ) |
Forward currency contracts | | | (87,123,422 | ) |
Foreign currency translation | | | (3,112,679 | ) |
| | | | |
Net realized and unrealized loss | | | (8,882,883,459 | ) |
| | | | |
NET DECREASE IN NET ASSETS
FROM OPERATIONS | | $ | (7,652,593,349 | ) |
| | | | |
| | | | | | | | |
CONSOLIDATED STATEMENT OF CHANGES IN NET ASSETS | |
| | |
| | | Year Ended
December 31, 2015 | | | Year Ended
December 31, 2014 | |
OPERATIONS: | | | | | | | | |
Net investment income | | $ | 1,230,290,110 | | | $ | 1,451,548,384 | |
Net realized gain | | | 1,569,060,418 | | | | 2,019,551,822 | |
Net change in unrealized
appreciation/depreciation | | | (10,451,943,877 | ) | | | (3,874,051,496 | ) |
| | | | | | | | |
| | | (7,652,593,349 | ) | | | (402,951,290 | ) |
| | | | | | | | |
| | |
DISTRIBUTIONS TO SHAREHOLDERS FROM: | | | | | | | | |
Net investment income | | | (1,304,169,120 | ) | | | (1,440,251,048 | ) |
Net realized gain | | | — | | | | — | |
| | | | | | | | |
Total distributions | | | (1,304,169,120 | ) | | | (1,440,251,048 | ) |
| | | | | | | | |
| | |
FUND SHARE
TRANSACTIONS: | | | | | | | | |
Proceeds from sale of shares | | | 12,406,796,087 | | | | 19,083,592,819 | |
Reinvestment of distributions | | | 1,091,460,147 | | | | 1,176,502,813 | |
Cost of shares redeemed | | | (11,552,646,146 | ) | | | (7,993,354,008 | ) |
| | | | | | | | |
Net increase from
Fund share transactions | | | 1,945,610,088 | | | | 12,266,741,624 | |
| | | | | | | | |
Total increase/(decrease) in net assets | | | (7,011,152,381 | ) | | | 10,423,539,286 | |
| | |
NET ASSETS: | | | | | | | | |
Beginning of year | | | 64,039,756,244 | | | | 53,616,216,958 | |
| | | | | | | | |
End of year (including distributions in excess of net investment income of $(5,017,088) and undistributed net investment income of $9,485,734, respectively) | | $ | 57,028,603,863 | | | $ | 64,039,756,244 | |
| | | | | | | | |
| | |
SHARE INFORMATION: | | | | | | | | |
Shares sold | | | 295,300,198 | | | | 427,948,359 | |
Distributions reinvested | | | 30,234,353 | | | | 27,741,165 | |
Shares redeemed | | | (283,036,306 | ) | | | (180,756,140 | ) |
| | | | | | | | |
Net increase in shares outstanding | | | 42,498,245 | | | | 274,933,384 | |
| | | | | | | | |
| | |
| See accompanying Notes to Consolidated Financial Statements | | DODGE & COX INTERNATIONAL STOCK FUND §PAGE 9 |
NOTES TO CONSOLIDATED FINANCIAL STATEMENTS
NOTE 1—ORGANIZATION AND SIGNIFICANT ACCOUNTING POLICIES
Dodge & Cox International Stock Fund (the “Fund”) is one of the series constituting the Dodge & Cox Funds (the “Trust” or the “Funds”). The Trust is organized as a Delaware statutory trust and is registered under the Investment Company Act of 1940, as amended, as an open-end management investment company. On January 16th, 2015, the Fund closed to new investors. The Fund commenced operations on May 1, 2001, and seeks long-term growth of principal and income. The Fund invests primarily in a diversified portfolio of foreign equity securities. Foreign investing, especially in developing countries, has special risks such as currency and market volatility and political and social instability. These and other risk considerations are discussed in the Fund’s Prospectus.
The financial statements have been prepared in conformity with accounting principles generally accepted in the United States of America, which require the use of estimates and assumptions by management. Actual results may differ from those estimates. Significant accounting policies are as follows:
Security valuation The Fund’s net assets are valued as of the close of trading on the New York Stock Exchange (NYSE), generally 4:00 p.m. Eastern Time, each day that the NYSE is open for business. If the NYSE is closed due to inclement weather, technology problems, or for any other reason on a day it would normally be open for business, or the NYSE has an unscheduled early closing on a day it has opened for business, the Fund reserves the right to calculate the Fund’s NAV as of the normally scheduled close of regular trading on the NYSE for that day, provided that Dodge & Cox believes that it can obtain reliable market quotes or valuations.
Portfolio securities and other financial instruments for which market quotes are readily available are valued at market value. Listed securities are generally valued using the official quoted close price or the last sale on the exchange that is determined to be the primary market for the security. Security values are not discounted based on the size of the Fund’s position. Short-term securities less than 60 days to maturity may be valued at amortized cost if amortized cost approximates current value. Mutual funds are valued at their respective net asset values.
Investments initially valued in currencies other than the U.S. dollar are converted to the U.S. dollar using prevailing exchange rates. As a result, the Fund’s net assets may be affected by changes in the value of currencies in relation to the U.S. dollar.
If market quotations are not readily available or if a security’s value is believed to have materially changed after the close of the security’s primary market but before the close of trading on the NYSE, the security is valued at fair value as determined in good faith by or under the direction of the Fund’s Board of Trustees. The Board of Trustees has appointed Dodge & Cox, the Fund’s investment manager, to make fair value determinations in accordance with the Dodge & Cox Funds Valuation Policies (“Valuation Policies”), subject to Board oversight. Dodge & Cox has established a Pricing Committee that is comprised of
representatives from Treasury, Legal, Compliance, and Operations. The Pricing Committee is responsible for implementing the Valuation Policies, including determining the fair value of securities when market quotations or market-based valuations are not readily available or are deemed unreliable. The Pricing Committee considers relevant indications of value that are reasonably available to it in determining the fair value assigned to a particular security, such as the value of similar financial instruments, trading volumes, contractual restrictions on disposition, related corporate actions, and changes in economic conditions. In doing so, the Pricing Committee employs various methods for calibrating fair valuation approaches, including a regular review of key inputs and assumptions, back-testing, and review of any related market activity.
As trading in securities on most foreign exchanges is normally completed before the close of the NYSE, the value of non-U.S. securities can change by the time the Fund calculates its NAV. To address these changes, the Fund may utilize adjustment factors provided by an independent pricing service to systematically value non-U.S. securities at fair value. These adjustment factors are based on statistical analyses of subsequent movements and changes in U.S. markets and financial instruments trading in U.S. markets that represent foreign securities or baskets of securities.
Valuing securities through a fair value determination involves greater reliance on judgment than valuation of securities based on readily available market quotations. In some instances, lack of information and uncertainty as to the significance of information may lead to a conclusion that a prior valuation is the best indication of a security’s value. When fair value pricing is employed, the prices of securities used by the Fund to calculate its NAV may differ from quoted or published prices for the same securities.
Security transactions, investment income, expenses, and distributions Security transactions are recorded on the trade date. Realized gains and losses on securities sold are determined on the basis of identified cost.
Dividend income and corporate action transactions are recorded on the ex-dividend date, or when the Fund first learns of the dividend/corporate action if the ex-dividend date has passed. Non-cash dividends included in dividend income, if any, are recorded at the fair market value of the securities received. Dividends characterized as return of capital for U.S. tax purposes are recorded as a reduction of cost of investments and/or realized gain. Interest income is recorded on the accrual basis.
Expenses are recorded on the accrual basis. Some expenses of the Trust can be directly attributed to a specific series. Expenses which cannot be directly attributed are allocated among the Funds in the Trust based on relative net assets or other expense methodologies determined by the nature of the expense.
Distributions to shareholders are recorded on the ex-dividend date.
Foreign taxes The Fund is subject to foreign taxes which may be imposed by certain countries in which the Fund invests.
PAGE 10 § DODGE & COX INTERNATIONAL STOCK FUND
NOTES TO CONSOLIDATED FINANCIAL STATEMENTS
The Fund endeavors to record foreign taxes based on applicable foreign tax law. Withholding taxes are incurred on certain foreign dividends and are accrued at the time the associated dividend is recorded. The Fund files withholding tax reclaims in certain jurisdictions to recover a portion of amounts previously withheld. The Fund records a reclaim receivable based on, among other things, a jurisdiction’s legal obligation to pay reclaims as well as payment history and market convention. In consideration of recent decisions rendered by European courts, the Fund has filed for additional reclaims related to prior years. A corresponding receivable is established when both the amount is known and significant contingencies or uncertainties regarding collectability are removed. These amounts are reported in “dividends and interest receivable” on the Consolidated Statement of Assets and Liabilities.
Capital gains taxes are incurred upon disposition of certain foreign securities. Capital gains taxes on appreciated securities are accrued as unrealized losses and are reflected as realized losses upon the sale of the related security. Currency taxes may be incurred when the Fund purchases certain foreign currencies related to securities transactions and are recorded as realized losses on foreign currency transactions.
Repurchase agreements The Fund enters into repurchase agreements, secured by U.S. government or agency securities, which involve the purchase of securities from a counterparty with a simultaneous commitment to resell the securities at an agreed-upon date and price. It is the Fund’s policy that its custodian take possession of the underlying collateral securities, the fair value of which exceeds the principal amount of the repurchase transaction, including accrued interest, at all times. In the event of default by the counterparty, the Fund has the contractual right to liquidate the collateral securities and to apply the proceeds in satisfaction of the obligation.
Forward currency contracts A forward currency contract represents an obligation to purchase or sell a specific foreign currency at a future date at a price set at the time of the contract. Losses from these transactions may arise from unfavorable changes in currency values or if the counterparties do not perform under a contract’s terms.
The values of the forward currency contracts are adjusted daily based on the prevailing forward exchange rates of the underlying currencies. Changes in the value of open contracts are recorded as unrealized appreciation or depreciation in the Consolidated Statement of Operations. When the forward currency contract is closed, the Fund records a realized gain or loss in the Consolidated Statement of Operations equal to the difference between the value at the time the contract was opened and the value at the time it was closed.
The Fund maintained forward currency contracts to hedge foreign currency risks associated with portfolio investments denominated in the euro and Swiss franc. During the year ended December 31, 2015, these euro and Swiss franc forward currency
contracts had U.S. dollar total values ranging from 3% to 5% of net assets and 0% to 3% of net assets, respectively.
Foreign currency translation The books and records of the Fund are maintained in U.S. dollars. Foreign currency amounts are translated into U.S. dollars at the prevailing exchange rates of such currencies against the U.S. dollar. The market value of investment securities and other assets and liabilities are translated at the exchange rate as of the valuation date. Purchases and sales of investment securities, income, and expenses are translated at the exchange rate prevailing on the transaction date.
Reported realized and unrealized gain (loss) on investments include foreign currency gain (loss) related to investment transactions.
Reported realized and unrealized gain (loss) on foreign currency transactions and translation include the following: disposing/holding of foreign currency, the difference between the trade and settlement dates on securities transactions, the difference between the accrual and payment dates on dividends, and currency losses on the purchase of foreign currency in certain countries that impose taxes on such transactions.
Consolidation The Fund may invest in certain securities through its wholly owned subsidiary, Dodge & Cox International Stock Fund Cayman, Ltd. (the “Subsidiary”). The Subsidiary is a Cayman Islands exempted company and invests in certain securities consistent with the investment objective of the Fund. The Fund’s Consolidated Financial Statements, including the Consolidated Portfolio of Investments, consist of the holdings and accounts of the Fund and the Subsidiary. All intercompany transactions and balances have been eliminated. At December 31, 2015, the Subsidiary had net assets of $100, which represented less than 0.01% of the Fund’s consolidated net assets.
Indemnification Under the Trust’s organizational documents, its officers and trustees are indemnified against certain liabilities arising out of the performance of their duties to the Trust. In addition, in the normal course of business the Trust enters into contracts that provide general indemnities to other parties. The Trust’s maximum exposure under these arrangements is unknown as this would involve future claims that may be made against the Trust that have not yet occurred.
NOTE 2—VALUATION MEASUREMENTS
Various inputs are used in determining the value of the Fund’s investments and other financial instruments. These inputs are summarized in the three broad levels listed below.
| § | | Level 1: Quoted prices in active markets for identical securities |
| § | | Level 2: Other significant observable inputs (including quoted prices for similar securities, market indices, interest rates, credit risk, etc.) |
| § | | Level 3: Significant unobservable inputs (including Fund management’s assumptions in determining the fair value of investments) |
DODGE & COX INTERNATIONAL STOCK FUND §PAGE 11
NOTES TO CONSOLIDATED FINANCIAL STATEMENTS
The inputs or methodology used for valuing securities are not necessarily an indication of the risk associated with investing in those securities.
The following is a summary of the inputs used to value the Fund’s holdings at December 31, 2015:
| | | | | | | | |
| Classification(a) | | LEVEL 1
(Quoted Prices) | | | LEVEL 2
(Other Significant
Observable Inputs) | |
Securities | | | | | | | | |
Common Stocks | | | | | | | | |
Consumer Discretionary | | $ | 5,482,095,050 | | | $ | 5,254,622,284 | |
Consumer Staples | | | 210,023,170 | | | | — | |
Energy | | | 3,142,839,341 | | | | 376,728,063 | |
Financials | | | 8,962,360,983 | | | | 4,921,505,910 | |
Health Care | | | 3,691,508,976 | | | | 3,633,970,885 | |
Industrials | | | 3,474,980,662 | | | | 1,441,989,970 | |
Information Technology | | | 3,491,473,005 | | | | 5,125,125,223 | |
Materials | | | 1,119,845,638 | | | | 1,867,351,560 | |
Telecommunication Services | | | 1,705,213,732 | | | | 574,611,534 | |
Preferred Stocks | | | | | | | | |
Energy | | | 605,264,260 | | | | — | |
Financials | | | — | | | | 982,425,551 | |
Information Technology | | | — | | | | 542,444,786 | |
Short-term Investments | | | | | | | | |
Money Market Fund | | | 57,731,545 | | | | — | |
Repurchase Agreement | | | — | | | | 72,314,000 | |
| | | | | | | | |
Total Securities | | $ | 31,943,336,362 | | | $ | 24,793,089,766 | |
| | | | | | | | |
| | |
Other Financial Instruments(b) | | | | | | | | |
Forward Currency Contracts | | | | | | | | |
Appreciation | | $ | — | | | $ | 29,472,280 | |
Depreciation | | | — | | | | (33,999,716 | ) |
| | | | | | | | | |
| (a) | Transfers during the year between Level 1 and Level 2 relate to the use of systematic fair valuation (see Note 1). On days when systematic fair valuation is used, securities whose primary market closes before the NYSE are classified as Level 2. There were no Level 3 securities at December 31, 2015 and 2014, and there were no transfers to Level 3 during the year. |
| (b) | Represents unrealized appreciation/(depreciation). |
NOTE 3—ADDITIONAL DERIVATIVES INFORMATION
The Fund has entered into over-the-counter derivatives, such as forward currency contracts (each, a “Derivative”). Each Derivative is subject to a negotiated master agreement (based on a form published by the International Swaps and Derivatives Association (“ISDA”)) governing all Derivatives between the Fund and the relevant dealer counterparty. The master agreements specify (i) events of default and other events permitting a party to terminate some or all of the Derivatives thereunder and (ii) the process by which those Derivatives will be valued for purposes of determining termination payments. If some or all of the Derivatives under a master agreement are terminated because of an event of default or similar event, the values of all terminated Derivatives must be netted to determine a single payment owed by one party to the other. Some master agreements contain collateral terms requiring the parties to post collateral in respect of some or all of the Derivatives thereunder based on the net market value of those Derivatives, subject to a minimum exposure threshold. To
the extent amounts owed to the Fund by its counterparties are not collateralized, the Fund is at risk of those counterparties’ non-performance. The Fund attempts to mitigate counterparty credit risk by entering into Derivatives only with counterparties it believes to be of good credit quality and by monitoring the financial stability of those counterparties.
At December 31, 2015, no Derivative position subject to a master netting arrangement qualifies for netting. For financial reporting purposes, the Fund does not offset financial assets and liabilities that are subject to a master netting arrangement in the Consolidated Statement of Assets and Liabilities. Gross assets and liabilities related to Derivatives are presented as “unrealized appreciation on forward currency contracts” and “unrealized depreciation on forward currency contracts,” respectively, in the Consolidated Statement of Assets and Liabilities. Derivative information by counterparty is presented in the Consolidated Portfolio of Investments. At December 31, 2015, no collateral is pledged or held by the Fund for Derivatives.
NOTE 4—RELATED PARTY TRANSACTIONS
Management fees Under a written agreement approved by a unanimous vote of the Board of Trustees, the Fund pays an annual management fee of 0.60% of the Fund’s average daily net assets to Dodge & Cox, investment manager of the Fund.
Fund officers and trustees All officers and two of the trustees of the Trust are officers or employees of Dodge & Cox. The Trust pays a fee only to those trustees who are not affiliated with Dodge & Cox.
NOTE 5—INCOME TAX INFORMATION AND DISTRIBUTIONS TO SHAREHOLDERS
A provision for federal income taxes is not required since the Fund intends to continue to qualify as a regulated investment company under Subchapter M of the Internal Revenue Code and distribute all of its taxable income to shareholders. Distributions are determined in accordance with income tax regulations, and such amounts may differ from net investment income and realized gains for financial reporting purposes. Financial reporting records are adjusted for permanent book to tax differences at year end to reflect tax character.
Book to tax differences are primarily due to differing treatments of wash sales, net short-term realized gain (loss), investments in passive foreign investment companies, foreign capital gain taxes, and foreign currency realized gain (loss). At December 31, 2015, the cost of investments for federal income tax purposes was $62,340,216,132.
Distributions during the years noted below were characterized as follows for federal income tax purposes.
| | | | | | | | |
| | | Year Ended
December 31, 2015 | | | Year Ended
December 31, 2014 | |
Ordinary income | | | $1,304,169,120 | | | | $1,440,251,048 | |
| | | ($0.840 per share) | | | | ($0.970 per share) | |
| | |
Long-term capital gain | | | — | | | | — | |
PAGE 12 § DODGE & COX INTERNATIONAL STOCK FUND
NOTES TO CONSOLIDATED FINANCIAL STATEMENTS
At December 31, 2015, the tax basis components of distributable earnings were as follows:
| | | | |
Unrealized appreciation | | $ | 6,704,313,452 | |
Unrealized depreciation | | | (12,308,103,456 | ) |
| | | | |
Net unrealized depreciation | | | (5,603,790,004 | ) |
Undistributed ordinary income | | | 14,057,590 | |
Capital loss carryforward(a) | | | (1,783,220,989 | ) |
Deferred loss(b) | | | (18,220,273 | ) |
| (a) | Represents accumulated capital loss as of December 31, 2015, which may be carried forward to offset future capital gains. During 2015, the Fund utilized $1,416,343,422 of the capital loss carryforward. If not utilized, the remaining capital loss carryforward will expire as follows: |
| | | | |
Expiring in 2017 | | $ | 663,100,760 | |
Expiring in 2018 | | | 1,120,120,229 | |
| | | | |
| | $ | 1,783,220,989 | |
| | | | |
| (b) | Represents net realized specified loss incurred between November 1, 2015 and December 31, 2015. As permitted by tax regulations, the Fund has elected to treat this loss as arising in 2016. |
Under the Regulated Investment Company Modernization Act of 2010, capital losses incurred by the Fund after January 1, 2011, are not subject to expiration. In addition, such losses must be utilized prior to the losses incurred in the years preceding enactment.
Fund management has reviewed the tax positions for open periods (three years and four years, respectively, from filing the Fund’s Federal and State tax returns) as applicable to the Fund, and has determined that no provision for income tax is required in the Fund’s financial statements.
NOTE 6—LOAN FACILITIES
Pursuant to an exemptive order issued by the Securities and Exchange Commission (SEC), the Fund may participate in an interfund lending facility (Facility). The Facility allows the Fund to borrow money from or loan money to the Funds. Loans under the Facility are made for temporary or emergency purposes, such as to fund shareholder redemption requests. Interest on borrowings is the average of the current repurchase agreement rate and the bank loan rate. There was no activity in the Facility during the year.
All Funds in the Trust participate in a $500 million committed credit facility (Line of Credit) with State Street Bank and Trust Company, to be utilized for temporary or emergency purposes to fund shareholder redemptions or for other short-term liquidity purposes. The maximum amount available to the Fund is $250 million. Each Fund pays an annual commitment fee on its pro-rata portion of the Line of Credit. For the year ended December 31, 2015, the Fund’s commitment fee amounted to $204,009 and is reflected as a Miscellaneous Expense in the Consolidated Statement of Operations. Interest on borrowings is charged at the prevailing rate. There were no borrowings on the Line of Credit during the year.
NOTE 7—PURCHASES AND SALES OF INVESTMENTS
For the year ended December 31, 2015, purchases and sales of securities, other than short-term securities, aggregated $14,357,056,088 and $11,503,938,817 respectively.
NOTE 8—SUBSEQUENT EVENTS
Fund management has determined that no material events or transactions occurred subsequent to December 31, 2015, and through the date of the Fund’s financial statements issuance, which require additional disclosure in the Fund’s financial statements.
DODGE & COX INTERNATIONAL STOCK FUND §PAGE 13
NOTES TO CONSOLIDATED FINANCIAL STATEMENTS
NOTE 9—HOLDINGS OF 5% VOTING SECURITIES
Each of the companies listed below was considered to be an affiliate of the Fund because the Fund owned 5% or more of the company’s voting securities during all or part of the year ended December 31, 2015. Purchase and sale transactions and dividend income earned during the year on these securities were as follows:
| | | | | | | | | | | | | | | | | | | | | | | | |
| | | Shares at
Beginning of Year | | | Additions | | | Reductions | | | Shares at
End of Year | | | Dividend
Income(a) | | | Value at
End of Year | |
AEGON NV (Netherlands) | | | 125,227,471 | | | | 5,110,292 | | | | — | | | | 130,337,763 | | | | 33,876,341 | | | | — | (c) |
Anadolu Efes Biracilik ve Malt Sanayii AS (Turkey) | | | 28,262,444 | | | | 4,162,732 | | | | — | | | | 32,425,176 | | | | 4,579,929 | | | | 210,023,170 | |
BR Malls Participacoes SA (Brazil) | | | 54,870,300 | | | | — | | | | — | | | | 54,870,300 | | | | 8,160,027 | | | | 153,032,279 | |
Brother Industries, Ltd. (Japan) | | | 18,185,100 | | | | — | | | | (5,973,100 | ) | | | 12,212,000 | | | | 3,331,859 | | | | — | (c) |
Hang Lung Group, Ltd. (Hong Kong) | | | 90,430,600 | | | | 20,093,700 | | | | — | | | | 110,524,300 | | | | 11,468,203 | | | | 358,666,866 | |
Infineon Technologies AG (Germany) | | | 66,414,456 | | | | — | | | | (10,652,086 | ) | | | 55,762,370 | | | | 13,631,230 | | | | — | (c) |
Kasikornbank PCL—Foreign (Thailand) | | | 123,826,527 | | | | 16,056,500 | | | | — | | | | 139,883,027 | | | | 14,472,518 | | | | 578,306,373 | |
Kyocera Corp. (Japan) | | | 20,248,000 | | | | — | | | | (1,125,600 | ) | | | 19,122,400 | | | | 16,628,257 | | | | 886,308,045 | |
Lafarge SA (France) | | | 20,035,291 | | | | — | | | | (20,035,291 | ) | | | — | | | | 24,427,989 | | | | — | |
Lanxess AG (Germany) | | | 4,539,680 | | | | 462,000 | | | | (773,346 | ) | | | 4,228,334 | | | | 2,419,062 | | | | — | (c) |
Millicom International Cellular SA SDR (Luxembourg) | | | 10,088,392 | | | | — | | | | — | | | | 10,088,392 | | | | 22,755,923 | | | | 574,611,534 | |
New Oriental Education & Technology Group, Inc. ADR (Cayman Islands/China) | | | 5,733,700 | | | | 4,051,929 | | | | (3,416,301 | ) | | | 6,369,328 | | | | 3,528,539 | | | | — | (c) |
NGK Spark Plug Co., Ltd. (Japan) | | | 14,009,700 | | | | 1,118,700 | | | | (4,787,100 | ) | | | 10,341,300 | | | | 3,405,633 | | | | — | (c) |
Saipem SPA (Italy) | | | 35,889,000 | | | | 10,976,200 | | | | — | | | | 46,865,200 | | | | — | (b) | | | 376,728,063 | |
Smiths Group PLC (United Kingdom) | | | 26,840,600 | | | | 7,085,600 | | | | — | | | | 33,926,200 | | | | 21,009,124 | | | | 469,881,576 | |
Television Broadcasts, Ltd. (Hong Kong) | | | 40,022,900 | | | | — | | | | — | | | | 40,022,900 | | | | 25,299,505 | | | | 164,996,568 | |
Yamaha Motor Co., Ltd. (Japan) | | | 31,550,100 | | | | — | | | | — | | | | 31,550,100 | | | | 11,417,409 | | | | 706,999,061 | |
Yapi ve Kredi Bankasi AS (Turkey) | | | 234,711,168 | | | | 4,650,000 | | | | (34,984,300 | ) | | | 204,376,868 | | | | 6,004,776 | | | | — | (c) |
| | | | | | | | | | | | | | | | | | | | | | | | |
| | | | | | | | | | | | | | | | | | $ | 226,416,324 | | | $ | 4,479,553,535 | |
| | | | | | | | | | | | | | | | | | | | | | | | |
| | | | | | | | | | | | | | | | | | | | | | | | | |
| (a) | Net of foreign taxes, if any |
| (c) | Company was not an affiliate at year end |
PAGE 14 § DODGE & COX INTERNATIONAL STOCK FUND
CONSOLIDATED FINANCIAL HIGHLIGHTS
| | | | | | | | | | | | | | | | | | | | |
SELECTED DATA AND RATIOS (for a share outstanding throughout each year) | | Year Ended December 31, | |
| | | 2015 | | | 2014 | | | 2013 | | | 2012 | | | 2011 | |
| | | | |
Net asset value, beginning of year | | | $42.11 | | | | $43.04 | | | | $34.64 | | | | $29.24 | | | | $35.71 | |
Income from investment operations: | | | | | | | | | | | | | | | | | | | | |
Net investment income | | | 0.79 | | | | 0.98 | | | | 0.70 | | | | 0.76 | | | | 0.78 | |
Net realized and unrealized gain (loss) | | | (5.58 | ) | | | (0.94 | ) | | | 8.40 | | | | 5.39 | | | | (6.49 | ) |
| | | | |
Total from investment operations | | | (4.79 | ) | | | 0.04 | | | | 9.10 | | | | 6.15 | | | | (5.71 | ) |
| | | | |
Distributions to shareholders from: | | | | | | | | | | | | | | | | | | | | |
Net investment income | | | (0.84 | ) | | | (0.97 | ) | | | (0.70 | ) | | | (0.75 | ) | | | (0.76 | ) |
Net realized gain | | | — | | | | — | | | | — | | | | — | | | | — | |
| | | | |
Total distributions | | | (0.84 | ) | | | (0.97 | ) | | | (0.70 | ) | | | (0.75 | ) | | | (0.76 | ) |
| | | | |
Net asset value, end of year | | | $36.48 | | | | $42.11 | | | | $43.04 | | | | $34.64 | | | | $29.24 | |
| | | | |
Total return | | | (11.35 | )% | | | 0.07 | % | | | 26.31 | % | | | 21.03 | % | | | (15.97 | )% |
Ratios/supplemental data: | | | | | | | | | | | | | | | | | | | | |
Net assets, end of year (millions) | | | $57,029 | | | | $64,040 | | | | $53,616 | | | | $40,556 | | | | $35,924 | |
Ratio of expenses to average net assets | | | 0.64 | % | | | 0.64 | % | | | 0.64 | % | | | 0.64 | % | | | 0.64 | % |
Ratio of net investment income to average net assets | | | 1.86 | % | | | 2.39 | % | | | 1.85 | % | | | 2.31 | % | | | 2.23 | % |
Portfolio turnover rate | | | 18 | % | | | 12 | % | | | 13 | % | | | 10 | % | | | 16 | % |
See accompanying Notes to Consolidated Financial Statements
REPORT OF INDEPENDENT REGISTERED PUBLIC ACCOUNTING FIRM
To the Trustees of Dodge & Cox Funds and Shareholders of Dodge & Cox International Stock Fund
In our opinion, the accompanying consolidated statement of assets and liabilities, including the consolidated portfolio of investments, and the related consolidated statements of operations and of changes in net assets and the consolidated financial highlights present fairly, in all material respects, the financial position of Dodge & Cox International Stock Fund (the “Fund”, one of the series constituting Dodge & Cox Funds) at December 31, 2015, the results of its operations for the year then ended, the changes in its net assets for each of the two years in the period then ended and the financial highlights for each of the five years in the period then ended, in conformity with accounting principles generally accepted in the United States of America. These consolidated financial statements and consolidated financial highlights (hereafter referred to as financial statements) are the responsibility of the Fund’s management. Our responsibility is to express an opinion on these financial statements based on our audits. We conducted our audits of these financial statements in accordance with the standards of the Public Company Accounting Oversight Board (United States). Those standards require that we plan and perform the audit to obtain reasonable assurance about whether the financial statements are free of material misstatement. An audit includes examining, on a test basis, evidence supporting the amounts and disclosures in the financial statements, assessing the accounting principles used and significant estimates made by management, and evaluating the overall financial statement presentation. We believe that our audits, which included confirmation of securities at December 31, 2015, by correspondence with the custodian and brokers, provide a reasonable basis for our opinion.
PricewaterhouseCoopers LLP
San Francisco, California
February 25, 2016
DODGE & COX INTERNATIONAL STOCK FUND §PAGE 15
SPECIAL 2015 TAX INFORMATION
The following information is provided pursuant to provisions of the Internal Revenue Code:
In 2015, the Fund elected to pass through to shareholders foreign source income of $1,705,148,285 and foreign taxes paid of $93,902,146.
The Fund designates up to a maximum of $1,627,860,558 of its distributions paid to shareholders in 2015 as qualified dividends (treated for federal income tax purposes in the hands of shareholders as taxable at a maximum rate of 20%).
For shareholders that are corporations, the Fund designates 3% of its ordinary dividends paid to shareholders in 2015 as dividends from domestic corporations eligible for the corporate dividends received deduction, provided that the shareholder otherwise satisfies applicable requirements to claim that deduction.
BOARD APPROVAL OF FUNDS’ INVESTMENT MANAGEMENT AGREEMENTS AND MANAGEMENT FEES
(unaudited)
The Board of Trustees is responsible for overseeing the performance of the Dodge & Cox Funds’ investment manager and determining whether to continue the Investment Management Agreements between the Funds and Dodge & Cox each year (the “Agreements”). At a meeting of the Board of Trustees of the Trust held on December 16, 2015, the Trustees, by a unanimous vote (including a separate vote of those Trustees who are not “interested persons” (as defined in the Investment Company Act of 1940) (the “Independent Trustees”)), approved the renewal of the Agreements for an additional one-year term through December 31, 2016 with respect to each Fund. During the course of the year, the Board received a wide variety of materials relating to the investment management and administrative services provided by Dodge & Cox and the performance of each of the Funds.
INFORMATION RECEIVED
In advance of the meeting, the Board, including each of the Independent Trustees, requested, received, and reviewed materials relating to the Agreements and the services provided by Dodge & Cox. The Independent Trustees retained Morningstar® to prepare an independent expense and performance summary for each Fund and comparable funds managed by other advisers identified by Morningstar. The Morningstar materials included information regarding advisory fee rates, expense ratios, and transfer agency, custodial, and distribution expenses, as well as appropriate performance comparisons to each Fund’s peer group and an index or combination of indices. The Morningstar materials also included a comparison of expenses of various share classes offered by comparable funds. The materials reviewed by the Board contained information concerning, among other things, Dodge & Cox’s profitability, financial results and condition, advisory fee revenue, and separate account and sub-adviser fund fee schedules. The Board additionally considered the Funds’ brokerage commissions, turnover rates, sales and redemption data and the significant investment that Dodge & Cox makes in research used in managing the Funds. The Board received and reviewed
memoranda and related materials addressing, among other things, Dodge & Cox’s services to the Funds; how Dodge & Cox Funds’ fees compare to fees of peer group funds; the different fees, services, costs, and risks associated with other accounts managed by Dodge & Cox as compared to the Dodge & Cox Funds; and the ways in which the Funds realize economies of scale. Throughout the process of reviewing the services provided by Dodge & Cox and preparing for the meeting, the Independent Trustees found Dodge & Cox to be open, forthright, detailed, and very helpful in answering questions about all issues. The Board received copies of the Agreements and a memorandum from the independent legal counsel to the Independent Trustees discussing the factors generally regarded as appropriate to consider in evaluating advisory arrangements. The Trust’s Contract Review Committee, consisting solely of Independent Trustees, met with the independent legal counsel on November 11, 2015, and again on December 16, 2015, to discuss whether to renew the Agreements. The Board, including the Independent Trustees, subsequently concluded that the existing Agreements are fair and reasonable and voted to approve the Agreements. In considering the Agreements, the Board, including the Independent Trustees, did not identify any single factor or particular information as all-important or controlling. In reaching the decision to approve the Agreements, the Board considered several factors, discussed below, to be key factors and reached the conclusions described below.
NATURE, QUALITY, AND EXTENT OF THE SERVICES
The Board considered that Dodge & Cox provides a wide range of services to the Funds in addition to portfolio management and that the quality of these services has been excellent in all respects. The extensive nature of services provided by Dodge & Cox has been documented in materials provided to the Board and in presentations made to the Board throughout the year. In particular, the Board considered the nature, quality, and extent of portfolio management, administrative, and shareholder services performed by Dodge & Cox. With regard to portfolio management services, the Board considered Dodge & Cox’s established long-term history of care and conscientiousness in the management of the Funds; its demonstrated consistency in investment approach and depth; the background and experience of the Dodge & Cox Investment Policy Committee, International Investment Policy Committee, Global Stock Investment Policy Committee, Fixed Income Investment Policy Committee, and Global Bond Investment Policy Committee, and research analysts responsible for managing the Funds; its methods for assessing the regulatory and investment climate in various jurisdictions; Dodge & Cox’s overall high level of attention to its core investment management function; and its commitment to the Funds and their shareholders. In the area of administrative and shareholder services, the Board considered the excellent quality of Dodge & Cox’s work in areas such as compliance, legal services, trading, proxy voting, technology, oversight of the Funds’ transfer agent and custodian, tax compliance, and shareholder communication through its website and other means. The Board also noted Dodge & Cox’s diligent disclosure policy, its favorable compliance record, and its
PAGE 16 § DODGE & COX INTERNATIONAL STOCK FUND
reputation as a trusted, shareholder-friendly mutual fund family. In addition, the Board considered that Dodge & Cox manages approximately $185 billion in Fund assets with fewer professionals than most comparable funds, and that on average these professionals have more experience and longer tenure than investment professionals at comparable funds. The Board also noted that Dodge & Cox is an investment research-oriented firm with no other business endeavors to distract management’s attention from its research efforts, and that its investment professionals adhere to a consistent investment approach across the Funds. The Board further considered the favorable stewardship grades given by Morningstar to each of the Funds and the “Gold” analyst rating awarded by Morningstar to all of the Funds except the Global Bond Fund. The Board concluded that it was satisfied with the nature, extent, and quality of investment management and other services provided to the Funds by Dodge & Cox.
INVESTMENT PERFORMANCE
The Board considered short-term and long-term investment performance for each Fund (including periods of outperformance or underperformance) as compared to both relevant indices and the performance of such Fund’s peer group. The Board noted that the Funds had weak absolute and relative performance in 2015, but remained solid performers over longer periods. The Board determined after extensive review and inquiry that Dodge & Cox’s historic, long-term, team-oriented, bottom-up investment approach remains consistent and that Dodge & Cox continues to be distinguished by its integrity, transparency, and independence. The Board considered that the performance of the Funds is the result of a team-oriented investment management process that emphasizes a long-term investment horizon, comprehensive independent research, price discipline, low cost and low portfolio turnover. The Board also considered that the investment performance delivered by Dodge & Cox to the Funds appeared to be consistent with the relevant performance delivered for other clients of Dodge & Cox. The Board concluded that Dodge & Cox has delivered favorable long-term performance for Fund investors consistent with the long-term investment strategies being pursued by the Funds.
COSTS AND ANCILLARY BENEFITS
Costs of Services to Funds: Fees and Expenses. The Board considered each Fund’s management fee rate and expense ratio relative to each Fund’s peer group and relative to management fees charged by Dodge & Cox to other clients. In particular, the Board considered that the Funds continue to be substantially below their peer group median in expense ratios and that many media and industry reports specifically comment on the low expense ratios of the Funds, which have been a defining characteristic of the Funds for many years. The Board also evaluated the operating structures of the Funds and Dodge & Cox, noting that the Funds do not charge front-end sales commissions or distribution fees, and Dodge & Cox bears, among other things, the significant cost of third party research, reimbursement for recordkeeping and administrative costs to third-party retirement plan administrators, and administrative and office overhead.
The Board noted that expenses are well below industry averages. When compared to peer group funds, the Funds are in the quartile with the lowest expense ratios. The Board also considered that the Funds receive numerous administrative, regulatory compliance, legal, technology and shareholder support services from Dodge & Cox without any additional administrative fee and the fact that the Funds have relatively low transaction costs and portfolio turnover rates. The Board noted the Funds’ unusual single-share-class structure and reviewed Morningstar data showing that the few peer group funds with lower expense ratios often have other share classes with significantly higher expense ratios. In this regard, the Board considered that many of the Funds’ shareholders would not be eligible to purchase comparably-priced shares of many peer group funds, which typically make their lower-priced share classes available only to institutional investors. The Board determined that the Funds provide access for small investors to high quality investment management at a relatively low cost.
The Board reviewed information regarding the fee rates Dodge & Cox charges to separate accounts and subadvised funds that have investment programs similar to those of the Funds, including instances where separate account and sub-advised fund fees are lower than Fund fees. The Board considered differences in the nature and scope of services Dodge & Cox provides to the Funds as compared to other client accounts, differences in regulatory, litigation, and other risks as between Dodge & Cox Funds and other types of clients. The Board also noted that different markets exist for mutual fund and institutional separate account management services. With respect to non-U.S. funds sponsored and managed by Dodge & Cox that are comparable to the Funds in many respects, the Board noted that the fee rates charged by Dodge & Cox are the same as or higher than the fee rates charged to the Funds. After consideration of these matters, the Board concluded that the overall costs incurred by the Funds for the services they receive (including the management fee paid to Dodge & Cox) are reasonable and that the fees are acceptable based upon the qualifications, experience, reputation, and performance of Dodge & Cox and the low overall expense ratios of the Funds.
Profitability and Costs of Services to Dodge & Cox; “Fall-out” Benefits. The Board reviewed reports of Dodge & Cox’s financial position, profitability, and estimated overall value, and considered Dodge & Cox’s overall profitability within its context as a private, employee-owned S-Corporation and relative to the favorable services provided. The Board noted in particular that Dodge & Cox’s profits are not generated by high fee rates, but reflect an extraordinarily streamlined, efficient, and focused business approach toward investment management. The Board recognized the importance of Dodge & Cox’s profitability—which is derived solely from management fees and does not include other business ventures—to maintain its independence, stability, company culture and ethics, and management continuity. The Board also considered that the compensation/profit structure at Dodge & Cox includes a return on shareholder employees’ investment in the firm, which is vital for remaining independent and facilitating retention of management and investment
DODGE & COX INTERNATIONAL STOCK FUND §PAGE 17
professionals. The Board considered independent research indicating that firms that grow organically, rather than through acquisition, tend to have better performance. Key to organic growth is the ability to retain talented and experienced analysts, portfolio managers and other professionals.
The Board also considered that in January 2015, Dodge & Cox closed the International Stock Fund to new investors to pro-actively manage the growth of the Fund. The Stock Fund and Balanced Fund were similarly closed to new investors during periods of significant growth in the past. While these actions are intended to benefit existing shareholders, the effect is to reduce potential revenues to Dodge & Cox from new shareholders. The Board also considered potential “fall-out” benefits (including the receipt of research from unaffiliated brokers and reputational benefits to non-U.S. funds sponsored and managed by Dodge & Cox) that Dodge & Cox might receive as a result of its association with the Funds and determined that they are acceptable. The Board also noted that Dodge & Cox continues to invest substantial sums in its business in order to provide enhanced services, systems and research capabilities, all of which benefit the Funds. The Board concluded that Dodge & Cox’s profitability is the keystone of its independence, stability and long-term investment performance and that the profitability of Dodge & Cox’s relationship with the Funds (including fall-out benefits) is fair and reasonable.
ECONOMIES OF SCALE
The Board considered whether there have been economies of scale with respect to the management of each Fund, whether the Funds have appropriately benefited from any economies of scale, and whether the management fee rate is reasonable in relation to the Fund assets and any economies of scale that may exist. In the Board’s view, any consideration of economies of scale must take account of the Funds’ low fee structure and the considerable efficiencies of the Funds’ organization and fee structure that has been realized by shareholders from the time of each Fund’s inception (i.e., from the first dollar). An assessment of economies of scale must also take into account that Dodge & Cox invests significant time and resources in each new Fund for months (and sometimes years) prior to launch; in addition, expenses are capped, which means that Dodge & Cox earns no revenue and subsidizes the operations of a new Fund for a period of time until it reaches scale.
In addition, the Board noted that Dodge & Cox has shared economies of scale by adding or enhancing services to the Funds over time, and that the internal costs of providing investment management, up-to-date technology, administrative, legal, and compliance services to the Funds continue to increase. For example, Dodge & Cox has increased its global research staff and investment resources over the years to address the increased complexity of investing in multinational and non-U.S. companies. In addition, Dodge & Cox has made substantial expenditures in other staff, technology, cybersecurity, and infrastructure to enable it to integrate credit and equity analyses and to be able to implement its strategy in a more effective and secure manner. Over the last ten years, Dodge & Cox has increased its spending on third party research, data services, trading systems, technology, and recordkeeping service expenses at a rate that has significantly outpaced the Funds’ growth rate during the same period.
The Board considered that Dodge & Cox has a history of voluntarily limiting asset growth in several Funds that experienced significant inflows by closing them to new investors in order to protect the Funds’ ability to achieve good investment returns for shareholders. The Board also observed that, even without fee breakpoints, the Funds are competitively priced in a very competitive market and that having a low fee from inception is better for shareholders than starting with a higher fee and adding breakpoints. The Board concluded that the current Dodge & Cox fee structure is fair and reasonable and adequately shares economies of scale that may exist.
CONCLUSION
Based on their evaluation of all material factors and assisted by the advice of independent legal counsel to the Independent Trustees, the Board, including the Independent Trustees, concluded that the advisory fee structure was fair and reasonable, that each Fund was paying a competitive fee for the services provided, that the scope and quality of Dodge & Cox’s services has provided substantial value for Fund shareholders over the long term, and that approval of the Agreements was in the best interests of each Fund and its shareholders.
FUND HOLDINGS
The Fund provides a complete list of its holdings four times each fiscal year, as of the end of each quarter. The Fund files the lists with the Securities and Exchange Commission (SEC) on Form N-CSR (second and fourth quarters) and Form N-Q (first and third quarters). Shareholders may view the Fund’s Forms N-CSR and N-Q on the SEC’s website at sec.gov. Forms N-CSR and N-Q may also be reviewed and copied at the SEC’s Public Reference Room in Washington, DC. Information regarding the operations of the Public Reference Room may be obtained by calling 202-551-8090 (direct) or 800-732-0330 (general SEC number). A list of the Fund’s quarter-end holdings is also available at dodgeandcox.com on or about 15 days following each quarter end and remains available on the website until the list is updated in the subsequent quarter.
PROXY VOTING
For a free copy of the Fund’s proxy voting policies and procedures, please call 800-621-3979, visit the Fund’s website at dodgeandcox.com, or visit the SEC’s website at sec.gov. Information regarding how the Fund voted proxies relating to portfolio securities during the most recent 12-month period ending June 30 is also available at dodgeandcox.com or at sec.gov.
HOUSEHOLD MAILINGS
The Fund routinely mails shareholder reports and summary prospectuses to shareholders and, on occasion, proxy statements. In order to reduce the volume of mail, when possible, only one copy of these documents will be sent to shareholders who are part of the same family and share the same residential address.
If you have a direct account with the Funds and you do not want the mailing of shareholder reports and summary prospectuses combined with other members in your household, contact the Funds at 800-621-3979. Your request will be implemented within 30 days.
PAGE 18 § DODGE & COX INTERNATIONAL STOCK FUND
DODGE & COX FUNDS—EXECUTIVE OFFICER & TRUSTEE INFORMATION
| | | | | | |
Name (Age) and
Address* | | Position with Trust (Year of Election or
Appointment) | | Principal Occupation During Past 5 Years | | Other Directorships Held by Trustees |
| INTERESTED TRUSTEES AND EXECUTIVE OFFICERS |
| Charles F. Pohl (57) | | Chairman and Trustee (Officer since 2004) | | Chairman (since 2013), Co-President (2011-2013), Senior Vice President (until 2011), and Director of Dodge & Cox; Chief Investment Officer, Portfolio Manager, Investment Analyst, and member of Investment Policy Committee (IPC), Global Stock Investment Policy Committee (GSIPC), International Investment Policy Committee (IIPC), and Fixed Income Investment Policy Committee (FIIPC) | | — |
| Dana M. Emery (54) | | President and Trustee (Trustee since 1993) | | Chief Executive Officer (since 2013), President (since 2011), Executive Vice President (until 2011), and Director of Dodge & Cox; Director of Fixed Income, Portfolio Manager, and member of FIIPC and Global Bond Investment Policy Committee (GBIPC) | | — |
| John A. Gunn (72) | | Senior Vice President (Officer since 1998) | | Chairman Emeritus (2011-2013), Chairman (until 2011), Chief Executive Officer (until 2010), and Director (until 2013) of Dodge & Cox; Portfolio Manager and member of IPC, GSIPC (until 2014), and IIPC (until 2013) | | — |
| Diana S. Strandberg (56) | | Senior Vice President (Officer since 2006) | | Senior Vice President (since 2011), Vice President (until 2011), and Director (since 2011) of Dodge & Cox; Director of International Equity (since 2009), Portfolio Manager, Investment Analyst, and member of IPC, GSIPC, IIPC, and GBIPC | | — |
| David H. Longhurst (58) | | Treasurer (Officer since 2006) | | Vice President and Assistant Treasurer of Dodge & Cox | | — |
| Thomas M. Mistele (62) | | Secretary (Officer since 1998) | | Chief Operating Officer, Director, Secretary, Senior Counsel (since 2011), and General Counsel (until 2011) of Dodge & Cox | | — |
| Katherine M. Primas (41) | | Chief Compliance Officer (Officer since 2009) | | Vice President (since 2011) and Chief Compliance Officer of Dodge & Cox | | — |
| INDEPENDENT TRUSTEES |
| Thomas A. Larsen (66) | | Trustee (Since 2002) | | Senior Counsel of Arnold & Porter LLP (law firm) (since 2013); Partner of Arnold & Porter LLP (until 2012); Director of Howard, Rice, Nemerovski, Canady, Falk & Rabkin (1977-2011) | | — |
| Ann Mather (55) | | Trustee (Since 2011) | | CFO, Pixar Animation Studios (1999-2004) | | Director, Google, Inc. (internet information services) (since 2005); Director, Glu Mobile, Inc. (multimedia software) (since 2005); Director, Netflix, Inc. (internet television) (since 2010); Director, Arista Networks (cloud networking) (since 2013); Director, Shutterfly, Inc. (internet photography services/publishing) (since 2013) |
| Robert B. Morris III (63) | | Trustee (Since 2011) | | Advisory Director, The Presidio Group (since 2005) | | — |
| Gary Roughead (64) | | Trustee (Since 2013) | | Annenberg Distinguished Visiting Fellow, Hoover Institution (since 2012); Admiral, United States Navy (Ret.); U.S. Navy Chief of Naval Operations (2008-2011) | | Director, Northrop Grumman Corp. (global security) (since 2012) |
| Mark E. Smith (64) | | Trustee (Since 2014) | | Executive Vice President, Managing Director—Fixed Income at Loomis Sayles & Company, L.P. (2003-2011) | | — |
| John B. Taylor (69) | | Trustee (Since 2005) (and 1995-2001) | | Professor of Economics, Stanford University (since 1984); Senior Fellow, Hoover Institution (since 1996); Under Secretary for International Affairs, United States Treasury (2001-2005) | | — |
| * | | The address for each Officer and Trustee is 555 California Street, 40th Floor, San Francisco, California 94104. Each Officer and Trustee oversees all six series in the Dodge & Cox Funds complex and serves for an indefinite term. |
Additional information about the Trust’s Trustees and Officers is available in the Trust’s Statement of Additional Information (SAI). You can get a free copy of the SAI by visiting the Funds’ website at dodgeandcox.com or calling
800-621-3979.
DODGE & COX INTERNATIONAL STOCK FUND §PAGE 19
dodgeandcox.com
For Fund literature, transactions, and account information, please visit the Funds’ website.
or write or call:
DODGE & COX FUNDS
c/o Boston Financial Data Services
P.O. Box 8422
Boston, Massachusetts 02266-8422
(800) 621-3979
INVESTMENT MANAGER
Dodge & Cox
555 California Street, 40th Floor
San Francisco, California 94104
(415) 981-1710
This report is submitted for the general information of the shareholders of the Fund. The report is not authorized for distribution to prospective investors in the Fund unless it is accompanied by a current prospectus.
This report reflects our views, opinions, and portfolio holdings as of December 31, 2015, the end of the reporting period. Any such views are subject to change at any time based upon market or other conditions and Dodge & Cox disclaims any responsibility to update such views. These views may not be relied on as investment advice and, because investment decisions for a Dodge & Cox Fund are based on numerous factors, may not be relied on as an indication of trading intent on behalf of any Dodge & Cox Fund.
DODGE & COX FUNDS®
Annual Report
December 31, 2015
Balanced Fund
ESTABLISHED 1931
TICKER: DODBX
12/15 BF AR Printed on recycled paper
TO OUR SHAREHOLDERS
The Dodge & Cox Balanced Fund had a total return of –2.9% for the year ending December 31, 2015, compared to 1.3% for the Combined Index(a) (a 60/40 blend of stocks and fixed income securities).
MARKET COMMENTARY
U.S. equity markets were volatile in 2015: after a significant selloff in August and September, the S&P 500 rebounded during the fourth quarter to finish the year up just over 1%. Global oil prices declined 35% during the year, which aided U.S. household purchasing power and hindered the profitability of oil and gas companies. Consumer Discretionary was the strongest sector (up 10%) of the S&P 500, while Energy was the worst-performing sector (down 21%).
In the United States, economic activity expanded at a moderate pace: household spending and business investment increased, and the housing market strengthened. Labor market conditions continued to improve, with solid job gains and reduced unemployment. Growth was tempered by the stronger U.S. dollar and weaker demand for U.S. exports. In December, the U.S. Federal Reserve (Fed) raised its target federal funds rate for the first time in nine years. At that time, Fed Chair Janet Yellen reiterated the Fed’s intent to normalize monetary policy gradually; the timing and size of future adjustments will be based on economic conditions in relation to the Fed’s goals of maximum employment and 2% inflation.
Rising interest rates and wider credit yield premiums(b) resulted in a small positive return for the U.S. bond market in 2015. Some of the prominent factors affecting bond prices included changing expectations regarding Fed policy, diverging global economic conditions and monetary policy, and concerns about the effect of China’s decelerating economy. Investment-grade corporate bonds returned –0.7%(c) for 2015, underperforming comparable-duration(d) Treasuries by 1.6 percentage points in the sector’s poorest relative result since 2011. Agency-guaranteed(e) mortgage-backed securities (MBS) returned 1.5% for the year, roughly in line with comparable-duration Treasuries.
INVESTMENT STRATEGY
We continue to set the Fund’s asset allocation based on our long-term outlook for the Fund’s common stock, preferred stock, and fixed income holdings. We increased the allocation to preferred stock by 2.3 percentage points during the year due to attractive valuations and decreased our common stock and fixed income weightings by 0.8 percentage points and 1.6 percentage points, respectively.
Equity Strategy
As a value-oriented manager, 2015 was a challenging year for absolute and relative performance. Across equities, value stocks (the lower valuation portion of the market) underperformed growth stocks (the higher valuation portion of the market) by one of the widest spreads since the global financial crisis. The equity portfolio of the Fund was significantly affected by this performance divergence. Many of the S&P 500’s higher-valuation growth companies, not held in the
equity portfolio, outperformed significantly. In addition, some individual holdings (e.g., HP Inc.(f), Time Warner, Wal-Mart) significantly detracted from results for the year, and the portfolio’s Energy holdings were negatively impacted by falling oil prices.
We continue to be optimistic about the long-term outlook for the equity portfolio. Our value-oriented approach has led us to invest in companies where we believe the long-term potential is not reflected in the current valuation. Two examples of such companies—American Express and Hewlett Packard Enterprise—are discussed below.(g)
American Express
American Express—the largest new purchase in the equity portfolio during 2015—provides charge and credit card products and travel-related services to consumers and businesses worldwide. The company is the number one credit/charge card issuer and merchant acquirer in the United States measured by billed business, and its network is the second largest after Visa. Historically, American Express has generated attractive returns due to its vertical integration and strong value proposition for high-spending customers.
In 2015, American Express’ stock price declined 24% due to concerns that the company’s business model is under pressure: Costco U.S. and JetBlue terminated their exclusive relationships with the card company and the Department of Justice questioned American Express’ ability to enforce rules prohibiting merchants from steering customers to other credit cards. As a result, American Express’ valuation relative to the market is at a historically low level (13 times forward estimated earnings(h)). We initiated a position in the company because we believe these near-term concerns have obscured a long-term investment opportunity. The company has an attractive business model that produces high returns on capital by encouraging more affluent and creditworthy customers to use the company’s credit and charge cards. American Express’ highly perceived rewards program, customer service, and strong brand recognition help attract and retain wealthier customers. The company should benefit from a continued industry shift from paper to plastic payments and growth in its third-party issued cards business. We believe American Express will be able to maintain its strong return on equity and improve profitability in the long run. On December 31, American Express was a 1.4% position in the equity portfolio.
Hewlett Packard Enterprise
After providing strong returns in 2013 and 2014, Hewlett-Packard was the portfolio’s largest detractor from results during 2015. Hewlett-Packard recently split into two entities—Hewlett Packard Enterprise and HP Inc.—which should result in greater focus and flexibility for each company to achieve its strategic goals. To assess secular challenges and evaluate the risks and opportunities of each stand-alone business, we met numerous times with their management teams and competitors and spoke with industry consultants. As a result, we added to the portfolio’s positions in both companies. On December 31, Hewlett Packard Enterprise was a 2.4% position and HP Inc. was a 1.8% position in the equity portfolio.
PAGE 2 § DODGE & COX BALANCED FUND
Hewlett Packard Enterprise, one of the largest vendors in information technology (IT), consists of the enterprise technology infrastructure, software, and services segments of the old Hewlett-Packard. We acknowledge the company faces headwinds: the shift to the cloud has negatively impacted all on-premise IT vendors, continued public cloud adoption will likely erode the company’s market share, and competition is keen. Despite these risks, we believe Hewlett Packard Enterprise is an attractive investment due to its strong market positions across its portfolio (e.g., top provider of servers, number two position in IT services), scale advantages, and opportunities to improve its margin structure. Meg Whitman—the CEO of Hewlett Packard Enterprise—has overseen sound acquisitions (e.g., 3Par), new product launches, and cost reduction programs during her tenures at Hewlett-Packard and eBay. Management is actively cutting costs and retooling its product/service offerings to improve the company’s competitiveness. Margins in the Enterprise Services segment should expand as the company optimizes its contract mix and delivery models. The company trades at a compelling valuation (eight times forward estimated earnings), which is among the lowest in the S&P 500.
Fixed Income Strategy
We increased the fixed income portfolio weighting in credit investments to 55% in 2015 due to wider credit premiums and reduced our weighting in Treasuries to 8%. Most of the higher allocation to credit occurred in corporate bonds where the weighting rose to 46% from 44% at the end of 2014. A 36% allocation to structured products—Agency-guaranteed MBS (at 33%) and more traditional, AAA-rated asset-backed securities (3%)—rounds out the fixed income portfolio’s non-U.S. Treasury sector exposures.
Most of the increase in the credit position occurred in the third quarter, in part due to high levels of new issuance in connection with M&A financing. These transactions generally resulted in higher leverage and more attractive entry points for investors due to wider credit premiums at new issue. Much of the recent increase in investment-grade corporate leverage has been concentrated in highly-rated issuers engaging in strategic transactions that build scale and are expected to result in meaningful synergies. Examples of new or growing positions in the portfolio during 2015 related to strategic actions by corporate issuers included Allergan, Charter Communications, Hewlett Packard Enterprise, and Imperial Tobacco Group.
We have also found opportunities to invest in market sectors experiencing heightened volatility. In 2015, these segments were primarily the commodities sectors and the emerging markets, with the hardest-hit issuers exposed to both. Our analysis has focused on issuers whose securities appear undervalued relative to credit fundamentals, and has included in-depth assessments of the value of an issuer’s assets over a market cycle, as well as the issuer’s ability to survive a prolonged period of commodity price weakness. The result of this analysis has been new or increased exposures to BHP Billiton, Cemex, Codelco, Kinder Morgan, Teck Resources, and TransCanada. We have also maintained the Fund’s positions in Petrobras, Rio Oil Finance Trust, and Pemex (all of which
underperformed substantially in 2015), based in part on potential downside protection provided by strong government relationships and other sources of financial flexibility.
We continue to maintain a substantial position in subordinated securities issued by large U.S. and UK banks. 2015 presented opportunities to broaden these investments to include industrial hybrids, which are subordinated securities that are given partial equity treatment by the rating agencies. Examples include hybrid securities issued by TransCanada, a midstream energy company whose stability is supported by the long-term contractual nature of its business, and BHP Billiton, the world’s largest mining company with a strong balance sheet and attractive cost positions in its operations.
We remain constructive on the Fund’s credit holdings, which generally are diversified across market sectors, trade at attractive prices, and maintain financial flexibility to weather the current challenged environment. While we recognize that recent increases in corporate leverage and shareholder remuneration could result in weaker credit profiles, we believe that valuations provide adequate compensation for the current risks.
Turning to the portfolio’s Agency MBS, currently a 33% weighting, we shifted both the weighting and the mix of underlying holdings throughout the year in response to changing valuations. We likewise reduced the portfolio’s holdings of shorter-duration AAA-rated ABS to purchase relatively more attractive corporate bonds. We continue to view the portfolio’s MBS favorably in terms of their ability to generate regular income, provide an important source of liquidity, and add an element of defensiveness in a volatile market environment for credit markets.
With respect to interest rate risk, we believe it is prudent to mitigate the effect of price declines associated with rising interest rates through a shorter portfolio duration (roughly 70% of that of the Barclays U.S. Agg). We see a clear disconnect between the slow pace of rate increases implied by current U.S. Treasury valuations and the faster pace indicated by Fed expectations, particularly in the context of a modestly expanding economy (more than 2% growth is expected over the next several years) and an inflation rate likely to rise as energy and import prices increase. It is our view that interest rates will rise more quickly than the levels implied by the market’s very modest expectations.
IN CLOSING
On December 31, the Fund’s equity portfolio of 63 companies traded at 13.8 times forward estimated earnings, a significant discount to the S&P 500 (17.4 times forward estimated earnings). We remain confident in the prospects for the equity portfolio over our three- to five-year investment horizon and believe it is positioned to benefit from long-term global growth opportunities. The fixed income portfolio, with its defensive duration posture and higher yield than the Barclays U.S. Agg, is positioned to soften the effects of increases in interest rates that could reduce fixed income asset values.
Our experienced and stable team has weathered past periods of market turbulence by remaining steadfast in our investment philosophy and process. Our approach—constructing a diversified
DODGE & COX BALANCED FUND §PAGE 3
portfolio through in-depth, independent research, a three- to five-year investment horizon, and a focus on valuation relative to underlying fundamentals—continues to guide us through this period as well. We remain confident that our enduring value-oriented approach will benefit the Fund in the years ahead.
Thank you for your continued confidence in our firm. As always, we welcome your comments and questions.
For the Board of Trustees,
| | |
| |
|
Charles F. Pohl, Chairman | | Dana M. Emery, President |
January 29, 2016
| (a) | | The Combined Index reflects an unmanaged portfolio (rebalanced monthly) of 60% of the S&P 500 Index, which is a market capitalization-weighted index of 500 large capitalization stocks commonly used to represent the U.S. equity market, and 40% of the Barclays U.S. Aggregate Bond Index (Barclays U.S. Agg), which is a widely recognized, unmanaged index of U.S. dollar-denominated, investment-grade, taxable fixed income securities. |
| (b) | | Yield premiums are one way to measure a security’s valuation. Narrowing yield premiums result in a higher valuation. Widening yield premiums result in a lower valuation. |
| (c) | | Sector returns as calculated and reported by Barclays. |
| (d) | | Duration is a measure of a bond’s (or a bond portfolio’s) price sensitivity to changes in interest rates. |
| (e) | | The U.S. Government does not guarantee the Fund’s shares, yield, or net asset value. The agency guarantee (by, for example, Ginnie Mae, Fannie Mae, or Freddie Mac) does not eliminate market risk. |
| (f) | | After Hewlett-Packard Co. split into two companies, HP Inc. retained the HPQ ticker symbol. HP Inc.’s –37% return in 2015 includes Hewlett-Packard Co.’s performance through October 2015. |
| (g) | | The use of specific examples does not imply that they are more attractive investments than the Fund’s other holdings. |
| (h) | | Unless otherwise specified, all weightings and characteristics are as of December 31, 2015. |
PAGE 4 § DODGE & COX BALANCED FUND
ANNUAL PERFORMANCE REVIEW
The Fund underperformed the Combined Index by 4.2 percentage points in 2015. The Fund’s higher weighting in equities had a negative impact on results. Preferred equities were especially strong and contributed meaningfully.
Equity Portfolio
| | § | | The portfolio’s holdings in the Consumer Discretionary sector (down 6% compared to up 10% for the S&P 500 sector) hindered performance. Media holdings Twenty-First Century Fox (down 29%) and Time Warner (down 23%) were particularly weak. | |
| | § | | Wal-Mart, the portfolio’s only holding in the Consumer Staples sector (down 27% compared to up 7% for the S&P 500 sector), hurt returns. | |
| | § | | The portfolio’s holdings in the Information Technology sector (flat compared to up 6% for the S&P 500 sector) detracted from results. HP Inc. (down 37%) and NetApp (down 35%) performed poorly. | |
| | § | | The portfolio’s average overweight position (5% versus 3%) and holdings in the Health Care Providers & Services industry (up 18% compared to up 12% for the S&P 500 industry) helped returns. Cigna (up 42%) and UnitedHealth Group (up 18%) were particularly strong. | |
Fixed Income Portfolio
| | § | | Certain emerging market-related credit holdings underperformed for the year, including Pemex, Petrobras, and Rio Oil Finance Trust. | |
| | § | | The portfolio’s overweight to the Industrial sub-sector (27% versus 14% for the Barclays U.S. Agg) and underweight to U.S. Treasuries (9% versus 36% for the Barclays U.S. Agg) detracted from relative returns. | |
| | § | | Corporate security selection was slightly negative as a number of industrial issuers performed poorly. | |
| | § | | The portfolio’s shorter relative duration (approximately 72% of the Barclays U.S. Agg’s duration) added to relative returns. | |
| | | | Unless otherwise noted, figures cited in this section denote portfolio positioning at the beginning of the period. | |
KEY CHARACTERISTICS OF DODGE & COX
Independent Organization
Dodge & Cox is one of the largest privately owned investment managers in the world. We remain committed to independence, with a goal of providing the highest quality investment management service to our existing clients.
Over 85 Years of Investment Experience
Dodge & Cox was founded in 1930. We have a stable and well-qualified team of investment professionals, most of whom have spent their entire careers at Dodge & Cox.
Experienced Investment Team
The Investment Policy Committee, which is the decision-making body for the equity portion of the Balanced Fund, is a nine-member committee with an average tenure at Dodge & Cox of 27 years. The Fixed Income Investment Policy Committee, which is the decision-making body for the Fixed Income portion of the Balanced Fund, is an eight-member committee with an average tenure of 20 years.
One Business with a Single Research Office
Dodge & Cox manages equity (domestic, international, and global), fixed income (domestic and global), and balanced investments, operating from one office in San Francisco.
Consistent Investment Approach
Our team decision-making process involves thorough, bottom-up fundamental analysis of each investment.
Long-Term Focus and Low Expenses
We invest with a three- to five-year investment horizon, which has historically resulted in low turnover relative to our peers. We manage Funds that maintain low expense ratios.
Risks: The Fund is subject to market risk, meaning holdings in the Fund may decline in value for extended periods due to the financial prospects of individual companies or due to general market and economic conditions. The Fund also invests in individual bonds whose yields and market values fluctuate, so that an investment may be worth more or less than its original cost. Debt securities are subject to interest rate risk, credit risk, and prepayment and call risk, all of which could have adverse effects on the value of the Fund. A low interest rate environment creates an elevated risk of future negative returns. Financial intermediaries may restrict their market making activities for certain debt securities, which may reduce the liquidity and increase the volatility of such securities. Please read the prospectus and summary prospectus for specific details regarding the Fund’s risk profile.
DODGE & COX BALANCED FUND §PAGE 5
GROWTH OF $10,000 OVER 10 YEARS
FOR AN INVESTMENT MADE ON DECEMBER 31, 2005
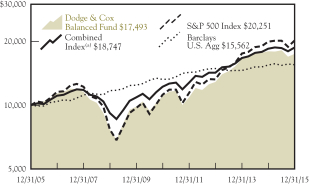
AVERAGE ANNUAL TOTAL RETURN
FOR PERIODS ENDED DECEMBER 31, 2015
| | | | | | | | | | | | | | | | |
| | | 1 Year | | | 5 Years | | | 10 Years | | | 20 Years | |
| | | | | | | | | | | | | | | | |
Dodge & Cox Balanced Fund | | | –2.88 | % | | | 9.58 | % | | | 5.76 | % | | | 8.78 | % |
Combined Index(a) | | | 1.31 | | | | 8.95 | | | | 6.49 | | | | 7.36 | |
S&P 500 Index | | | 1.41 | | | | 12.58 | | | | 7.31 | | | | 8.19 | |
Barclays U.S. Aggregate Bond Index (Barclays U.S. Agg) | | | 0.57 | | | | 3.26 | | | | 4.52 | | | | 5.34 | |
Returns represent past performance and do not guarantee future results. Investment return and share price will fluctuate with market conditions, and investors may have a gain or loss when shares are sold. Fund performance changes over time and currently may be significantly lower than stated. Performance is updated and published monthly. Visit the Fund’s website at dodgeandcox.com or call 800-621-3979 for current performance figures.
The Fund’s total returns include the reinvestment of dividend and capital gain distributions, but have not been adjusted for any income taxes payable by shareholders on these distributions or on Fund share redemptions. Index returns include dividends and/or interest income but, unlike Fund returns, do not reflect fees or expenses.
Standard & Poor’s, Standard & Poor’s 500, and S&P 500® are trademarks of McGraw Hill Financial. Barclays® is a trademark of Barclays Bank PLC.
| (a) | The Combined Index reflects an unmanaged portfolio (rebalanced monthly) of 60% of the S&P 500 Index, which is a market capitalization-weighted index of 500 large-capitalization stocks commonly used to represent the U.S. equity market, and 40% of the Barclays U.S. Aggregate Bond Index (Barclays U.S. Agg), which is a widely recognized, unmanaged index of U.S. dollar-denominated, investment-grade, taxable fixed income securities. The Fund may, however, invest up to 75% of its total assets in equity securities. |
FUND EXPENSE EXAMPLE
As a Fund shareholder, you incur ongoing Fund costs, including management fees and other Fund expenses. All mutual funds have ongoing costs, sometimes referred to as operating expenses. The following example shows ongoing costs of investing in the Fund and can help you understand these costs and compare them with those of other mutual funds. The example assumes a $1,000 investment held for the six months indicated.
ACTUAL EXPENSES
The first line of the table below provides information about actual account values and expenses based on the Fund’s actual returns. You may use the information in this line, together with your account balance, to estimate the expenses that you paid over the period. Simply divide your account value by $1,000 (for example, an $8,600 account value divided by $1,000 = 8.6), then multiply the result by the number in the first line under the heading “Expenses Paid During Period” to estimate the expenses you paid on your account during this period.
HYPOTHETICAL EXAMPLE FOR COMPARISON WITH OTHER MUTUAL FUNDS
Information on the second line of the table can help you compare ongoing costs of investing in the Fund with those of other mutual funds. This information may not be used to estimate the actual ending account balance or expenses you paid during the period. The hypothetical “Ending Account Value” is based on the actual expense ratio of the Fund and an assumed 5% annual rate of return before expenses (not the Fund’s actual return). The amount under the heading “Expenses Paid During Period” shows the hypothetical expenses your account would have incurred under this scenario. You can compare this figure with the 5% hypothetical examples that appear in shareholder reports of other mutual funds.
| | | | | | | | | | | | |
Six Months Ended
December 31, 2015 | | Beginning Account Value
7/1/2015 | | | Ending Account Value
12/31/2015 | | | Expenses Paid
During Period* | |
Based on Actual Fund Return | | $ | 1,000.00 | | | $ | 960.70 | | | $ | 2.57 | |
Based on Hypothetical 5% Yearly Return | | | 1,000.00 | | | | 1,022.58 | | | | 2.65 | |
| * | | Expenses are equal to the Fund’s annualized expense ratio of 0.52%, multiplied by the average account value over the period, multiplied by 184/365 (to reflect the one-half year period). |
The expenses shown in the table highlight ongoing costs only and do not reflect any transactional fees or account maintenance fees. Though other mutual funds may charge such fees, please note that the Fund does not charge transaction fees (e.g., redemption fees, sales loads) or universal account maintenance fees (e.g., small account fees).
PAGE 6 § DODGE & COX BALANCED FUND
| | | | |
| FUND INFORMATION (unaudited) | | | December 31, 2015 | |
| | | | |
| GENERAL INFORMATION | | | |
Net Asset Value Per Share | | | $94.42 | |
Total Net Assets (billions) | | | $14.3 | |
Expense Ratio | | | 0.53% | |
Portfolio Turnover Rate | | | 20% | |
30-Day SEC Yield(a) | | | 2.17% | |
Fund Inception | | | 1931 | |
No sales charges or distribution fees | | | | |
Investment Manager: Dodge & Cox, San Francisco. Managed by the Investment Policy Committee, whose nine members’ average tenure at Dodge & Cox is 27 years, and by the Fixed Income Investment Policy Committee, whose eight members’ average tenure is 20 years.
| | | | |
| EQUITY PORTFOLIO (70.2%) | | Fund | |
Number of Common Stocks | | | 63 | |
Number of Preferred Stocks | | | 5 | |
Median Market Capitalization (billions)(b) | | | $38 | |
Price-to-Earnings Ratio(b)(c) | | | 13.8x | |
Foreign Securities not in the S&P 500(d) | | | 6.2% | |
| | | | | | | | | | | | |
SECTOR DIVERSIFICATION (%) (FIVE LARGEST) | | Common | | | Preferred | | | Total | |
Financials | | | 17.9 | | | | 3.9 | | | | 21.8 | |
Information Technology | | | 16.5 | | | | — | | | | 16.5 | |
Health Care | | | 11.1 | | | | — | | | | 11.1 | |
Consumer Discretionary | | | 10.1 | | | | 0.4 | | | | 10.5 | |
Energy | | | 4.9 | | | | — | | | | 4.9 | |
| | | | | | | | | | | | |
TEN LARGEST EQUITY
SECURITIES (%)(e) | | Common | | | Preferred | | | Total | |
Wells Fargo & Co. | | | 2.8 | | | | 1.7 | | | | 4.5 | |
JPMorgan Chase & Co. | | | 1.3 | | | | 1.8 | | | | 3.1 | |
Microsoft Corp. | | | 2.7 | | | | — | | | | 2.7 | |
Capital One Financial Corp. | | | 2.6 | | | | — | | | | 2.6 | |
Charles Schwab Corp. | | | 2.6 | | | | — | | | | 2.6 | |
Time Warner Cable, Inc. | | | 2.6 | | | | — | | | | 2.6 | |
Alphabet, Inc. | | | 2.3 | | | | — | | | | 2.3 | |
Bank of America Corp. | | | 2.3 | | | | — | | | | 2.3 | |
Novartis AG (Switzerland) | | | 2.0 | | | | — | | | | 2.0 | |
EMC Corp. | | | 1.8 | | | | — | | | | 1.8 | |
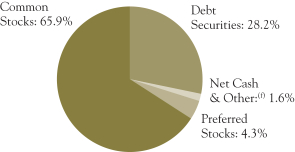
| | | | |
| FIXED INCOME PORTFOLIO (28.2%) | | Fund | |
Number of Credit Issuers | | | 60 | |
Effective Duration (years) | | | 4.0 | |
| | | | |
| SECTOR DIVERSIFICATION (%) | | | |
U.S. Treasury(g) | | | 2.2 | |
Government-Related | | | 2.0 | |
Mortgage-Related(h) | | | 9.5 | |
Corporate | | | 13.2 | |
Asset-Backed | | | 1.3 | |
| | | | |
| CREDIT QUALITY (%)(i) | | | |
U.S. Treasury/Agency/GSE(g) | | | 11.7 | |
Aaa | | | 0.9 | |
Aa | | | 0.8 | |
A | | | 1.3 | |
Baa | | | 10.1 | |
Ba | | | 2.8 | |
B | | | 0.6 | |
| | | | |
| FIVE LARGEST CREDIT ISSUERS (%)(e) | | | |
Telecom Italia SPA | | | 0.6 | |
Verizon Communications, Inc. | | | 0.6 | |
State of Illinois GO | | | 0.5 | |
State of California GO | | | 0.5 | |
Kinder Morgan, Inc. | | | 0.5 | |
| (a) | SEC Yield is an annualization of the Fund’s total net investment income per share for the 30-day period ended on the last day of the month. |
| (b) | Excludes the Fund’s preferred stock positions. |
| (c) | Price-to-earnings (P/E) ratio is calculated using 12-month forward earnings estimates from third-party sources. |
| (d) | Foreign stocks are U.S. dollar denominated. |
| (e) | The Fund’s portfolio holdings are subject to change without notice. The mention of specific securities is not a recommendation to buy, sell, or hold any particular security and is not indicative of Dodge & Cox’s current or future trading activity. |
| (f) | Net Cash & Other includes short-term investments (e.g., money market funds and repurchase agreements) and other assets less liabilities (e.g., cash, receivables, payables, and unrealized appreciation/depreciation on certain derivatives). |
| (g) | Data as presented excludes the Fund’s position in Treasury futures contracts. |
| (h) | The fixed income portfolio holds 0.16% in Agency multifamily mortgage securities; the Index classifies these securities under CMBS – Agency. |
| (i) | The credit quality distribution shown for the Fund is based on the middle of Moody’s, S&P’s, and Fitch ratings, which is the methodology used by Barclays in constructing its indices. If a security is rated by only two agencies, the lower of the two ratings is used. Please note the Fund applies the highest of Moody’s, S&P’s, and Fitch ratings to determine compliance with the quality requirements stated in its prospectus. The credit quality of the investments in the portfolio does not apply to the stability or safety of the Fund or its shares. |
DODGE & COX BALANCED FUND §PAGE 7
| | | | |
| PORTFOLIO OF INVESTMENTS | | | December 31, 2015 | |
| | | | | | | | |
| COMMON STOCKS: 65.9% | | | | | | |
| | |
| | | SHARES | | | VALUE | |
| CONSUMER DISCRETIONARY: 10.1% | | | | | |
AUTOMOBILES & COMPONENTS: 0.3% | | | | | | | | |
Harley-Davidson, Inc. | | | 860,000 | | | $ | 39,035,400 | |
| | |
CONSUMER DURABLES & APPAREL: 0.4% | | | | | | | | |
Coach, Inc. | | | 1,655,036 | | | | 54,169,328 | |
| | |
MEDIA: 7.9% | | | | | | | | |
Comcast Corp., Class A | | | 4,564,774 | | | | 257,590,197 | |
DISH Network Corp., Class A(a) | | | 1,165,032 | | | | 66,616,530 | |
News Corp., Class A | | | 688,050 | | | | 9,192,348 | |
Time Warner Cable, Inc. | | | 1,982,383 | | | | 367,910,461 | |
Time Warner, Inc. | | | 3,817,066 | | | | 246,849,658 | |
Twenty-First Century Fox, Inc., Class A | | | 4,882,200 | | | | 132,600,552 | |
Twenty-First Century Fox, Inc., Class B | | | 1,600,000 | | | | 43,568,000 | |
| | | | | | | | |
| | | | | | | 1,124,327,746 | |
RETAILING: 1.5% | | | | | | | | |
Liberty Interactive Corp. QVC Group, Series A(a) | | | 2,284,650 | | | | 62,416,638 | |
Target Corp. | | | 985,400 | | | | 71,549,894 | |
The Priceline Group, Inc.(a) | | | 67,000 | | | | 85,421,650 | |
| | | | | | | | |
| | | | | | | 219,388,182 | |
| | | | | | | | |
| | | | | | | 1,436,920,656 | |
| CONSUMER STAPLES: 1.4% | | | | | | | | |
FOOD & STAPLES RETAILING: 1.4% | | | | | | | | |
Wal-Mart Stores, Inc. | | | 3,201,900 | | | | 196,276,470 | |
| | |
| ENERGY: 4.9% | | | | | | | | |
Apache Corp. | | | 2,710,017 | | | | 120,514,456 | |
Baker Hughes, Inc. | | | 3,547,579 | | | | 163,720,771 | |
Concho Resources, Inc.(a) | | | 560,900 | | | | 52,085,174 | |
National Oilwell Varco, Inc. | | | 2,210,000 | | | | 74,012,900 | |
Schlumberger, Ltd.(b) (Curacao/United States) | | | 3,674,021 | | | | 256,262,964 | |
Weatherford International PLC(a)(b) (Ireland) | | | 4,250,000 | | | | 35,657,500 | |
| | | | | | | | |
| | | | | | | 702,253,765 | |
| FINANCIALS: 17.9% | | | | | | | | |
BANKS: 7.1% | | | | | | | | |
Bank of America Corp. | | | 19,257,100 | | | | 324,096,993 | |
BB&T Corp. | | | 2,714,584 | | | | 102,638,421 | |
JPMorgan Chase & Co. | | | 2,929,900 | | | | 193,461,297 | |
Wells Fargo & Co. | | | 7,408,506 | | | | 402,726,386 | |
| | | | | | | | |
| | | | | | | 1,022,923,097 | |
DIVERSIFIED FINANCIALS: 9.3% | | | | | | | | |
American Express Co. | | | 1,905,000 | | | | 132,492,750 | |
Bank of New York Mellon Corp. | | | 5,702,600 | | | | 235,061,172 | |
Capital One Financial Corp. | | | 5,169,959 | | | | 373,167,641 | |
Charles Schwab Corp. | | | 11,232,900 | | | | 369,899,397 | |
Goldman Sachs Group, Inc. | | | 1,182,000 | | | | 213,031,860 | |
| | | | | | | | |
| | | | | | | 1,323,652,820 | |
INSURANCE: 1.5% | | | | | | | | |
AEGON NV(b) (Netherlands) | | | 12,084,994 | | | | 68,521,916 | |
MetLife, Inc. | | | 3,077,000 | | | | 148,342,170 | |
| | | | | | | | |
| | | | | | | 216,864,086 | |
| | | | | | | | |
| | | | | | | 2,563,440,003 | |
| HEALTH CARE: 11.1% | | | | | | | | |
HEALTH CARE EQUIPMENT & SERVICES: 4.7% | | | | | |
Anthem, Inc. | | | 260,980 | | | | 36,391,051 | |
Cigna Corp. | | | 1,361,216 | | | | 199,186,737 | |
Express Scripts Holding Co.(a) | | | 2,599,568 | | | | 227,228,239 | |
Medtronic PLC(b) (Ireland) | | | 660,200 | | | | 50,782,584 | |
UnitedHealth Group, Inc. | | | 1,398,562 | | | | 164,526,834 | |
| | | | | | | | |
| | | | | | | 678,115,445 | |
PHARMACEUTICALS, BIOTECHNOLOGY & LIFE SCIENCES: 6.4% | |
AstraZeneca PLC ADR(b) (United Kingdom) | | | 1,270,100 | | | | 43,119,895 | |
Merck & Co., Inc. | | | 2,583,175 | | | | 136,443,304 | |
Novartis AG ADR(b) (Switzerland) | | | 3,294,900 | | | | 283,493,196 | |
| | | | | | | | |
| | |
| | | SHARES | | | VALUE | |
Roche Holding AG ADR(b) (Switzerland) | | | 5,980,000 | | | $ | 206,130,600 | |
Sanofi ADR(b) (France) | | | 5,515,165 | | | | 235,221,787 | |
Thermo Fisher Scientific, Inc. | | | 24,500 | | | | 3,475,325 | |
| | | | | | | | |
| | | | | | | 907,884,107 | |
| | | | | | | | |
| | | | | | | 1,585,999,552 | |
| INDUSTRIALS: 2.9% | | | | | | | | |
CAPITAL GOODS: 0.6% | | | | | | | | |
Danaher Corp. | | | 826,400 | | | | 76,756,032 | |
NOW, Inc.(a) | | | 340,950 | | | | 5,393,829 | |
| | | | | | | | |
| | | | | | | 82,149,861 | |
COMMERCIAL & PROFESSIONAL SERVICES: 1.0% | | | | | |
ADT Corp. | | | 2,017,717 | | | | 66,544,307 | |
Tyco International PLC(b) (Ireland) | | | 2,365,434 | | | | 75,433,690 | |
| | | | | | | | |
| | | | | | | 141,977,997 | |
TRANSPORTATION: 1.3% | | | | | | | | |
FedEx Corp. | | | 1,242,254 | | | | 185,083,423 | |
| | | | | | | | |
| | | | | | | 409,211,281 | |
| INFORMATION TECHNOLOGY: 16.5% | | | | | |
SEMICONDUCTORS & SEMICONDUCTOR EQUIPMENT: 0.6% | |
Maxim Integrated Products, Inc. | | | 2,377,091 | | | | 90,329,458 | |
| | |
SOFTWARE & SERVICES: 7.3% | | | | | | | | |
Alphabet, Inc., Class A(a) | | | 116,700 | | | | 90,793,767 | |
Alphabet, Inc., Class C(a) | | | 326,895 | | | | 248,074,078 | |
Cadence Design Systems, Inc.(a) | | | 1,170,700 | | | | 24,362,267 | |
eBay, Inc.(a) | | | 320,592 | | | | 8,809,868 | |
Microsoft Corp. | | | 6,901,700 | | | | 382,906,316 | |
Symantec Corp. | | | 9,214,000 | | | | 193,494,000 | |
Synopsys, Inc.(a) | | | 1,614,700 | | | | 73,646,467 | |
VMware, Inc.(a) | | | 326,300 | | | | 18,458,791 | |
| | | | | | | | |
| | | | | | | 1,040,545,554 | |
TECHNOLOGY, HARDWARE & EQUIPMENT: 8.6% | | | | | |
Cisco Systems, Inc. | | | 6,991,100 | | | | 189,843,321 | |
Corning, Inc. | | | 5,761,700 | | | | 105,323,876 | |
EMC Corp. | | | 10,174,000 | | | | 261,268,320 | |
Hewlett Packard Enterprise Co. | | | 15,984,712 | | | | 242,967,622 | |
HP, Inc. | | | 14,934,712 | | | | 176,826,990 | |
Juniper Networks, Inc. | | | 620,645 | | | | 17,129,802 | |
NetApp, Inc. | | | 3,826,491 | | | | 101,516,806 | |
TE Connectivity, Ltd.(b) (Switzerland) | | | 2,080,536 | | | | 134,423,431 | |
| | | | | | | | |
| | | | | | | 1,229,300,168 | |
| | | | | | | | |
| | | | | | | 2,360,175,180 | |
| MATERIALS: 0.6% | | | | | | | | |
Celanese Corp., Series A | | | 1,330,960 | | | | 89,613,537 | |
| |
| TELECOMMUNICATION SERVICES: 0.5% | | | | | |
Sprint Corp.(a) | | | 18,742,971 | | | | 67,849,555 | |
| | | | | | | | |
TOTAL COMMON STOCKS
(Cost $6,846,235,719) | | | | | | $ | 9,411,739,999 | |
| | |
| PREFERRED STOCKS: 4.3% | | | | | | |
| CONSUMER DISCRETIONARY: 0.4% | | | | | |
MEDIA: 0.4% | | | | | | | | |
NBCUniversal Enterprise, Inc. 5.25%(d) | | | 53,210 | | | | 56,402,600 | |
| | |
| FINANCIALS: 3.9% | | | | | | | | |
BANKS: 3.9% | | | | | | | | |
Citigroup, Inc. 5.95% | | | | | | | | |
12/31/49 | | | 60,975 | | | | 58,688,438 | |
7/29/49 | | | 5,175 | | | | 5,063,738 | |
JPMorgan Chase & Co. 6.10% | | | 254,565 | | | | 255,863,281 | |
Wells Fargo & Co. 5.875% | | | 227,645 | | | | 239,596,362 | |
| | | | | | | | |
| | | | | | | 559,211,819 | |
| | | | | | | | |
TOTAL PREFERRED STOCKS
(Cost $601,634,518) | | | $ | 615,614,419 | |
| | |
| PAGE 8 § DODGE & COX BALANCED FUND | | See accompanying Notes to Financial Statements |
| | | | |
| PORTFOLIO OF INVESTMENTS | | | December 31, 2015 | |
| | | | | | | | |
| DEBT SECURITIES: 28.2% | | | | | | |
| | |
| | | PAR VALUE | | | VALUE | |
| U.S. TREASURY: 2.2% | | | | | | | | |
U.S. Treasury Note/Bond | | | | | | | | |
0.50%, 3/31/17 | | $ | 50,600,000 | | | $ | 50,368,758 | |
0.875%, 1/15/18 | | | 148,000,000 | | | | 147,343,768 | |
1.00%, 3/15/18 | | | 81,500,000 | | | | 81,225,590 | |
1.625%, 7/31/19 | | | 13,315,000 | | | | 13,363,839 | |
1.625%, 11/30/20 | | | 23,000,000 | | | | 22,869,659 | |
| | | | | | | | |
| | | | | | | 315,171,614 | |
| GOVERNMENT-RELATED: 2.0% | | | | | |
FEDERAL AGENCY: 0.1% | | | | | | | | |
Small Business Admin. — 504 Program | | | | | | | | |
Series 1996-20L 1, 6.70%, 12/1/16 | | | 71,193 | | | | 72,524 | |
Series 1997-20F 1, 7.20%, 6/1/17 | | | 159,461 | | | | 163,598 | |
Series 1997-20I 1, 6.90%, 9/1/17 | | | 232,115 | | | | 238,998 | |
Series 1998-20D 1, 6.15%, 4/1/18 | | | 262,195 | | | | 275,691 | |
Series 1998-20I 1, 6.00%, 9/1/18 | | | 239,941 | | | | 251,340 | |
Series 1999-20F 1, 6.80%, 6/1/19 | | | 261,313 | | | | 271,606 | |
Series 2000-20D 1, 7.47%, 4/1/20 | | | 933,276 | | | | 990,642 | |
Series 2000-20E 1, 8.03%, 5/1/20 | | | 198,626 | | | | 212,663 | |
Series 2000-20G 1, 7.39%, 7/1/20 | | | 418,605 | | | | 442,963 | |
Series 2000-20I 1, 7.21%, 9/1/20 | | | 286,407 | | | | 303,850 | |
Series 2001-20E 1, 6.34%, 5/1/21 | | | 916,069 | | | | 994,336 | |
Series 2001-20G 1, 6.625%, 7/1/21 | | | 804,090 | | | | 873,338 | |
Series 2003-20J 1, 4.92%, 10/1/23 | | | 3,385,536 | | | | 3,641,847 | |
Series 2007-20F 1, 5.71%, 6/1/27 | | | 3,874,995 | | | | 4,332,510 | |
| | | | | | | | |
| | | | | | | 13,065,906 | |
FOREIGN AGENCY: 0.6% | | | | | | | | |
Corp. Nacional del Cobre de Chile(b) (Chile) | | | 11,100,000 | | | | 10,452,604 | |
4.50%, 9/16/25(d) | | | | | | | | |
Petroleo Brasileiro SA(b) (Brazil) | | | | | | | | |
4.375%, 5/20/23 | | | 29,800,000 | | | | 19,668,000 | |
6.25%, 3/17/24 | | | 4,225,000 | | | | 3,031,437 | |
Petroleos Mexicanos(b) (Mexico) | | | | | | | | |
4.25%, 1/15/25(d) | | | 22,685,000 | | | | 19,849,375 | |
6.625%, 6/15/35 | | | 9,425,000 | | | | 8,423,594 | |
6.375%, 1/23/45 | | | 17,125,000 | | | | 14,552,277 | |
5.625%, 1/23/46(d) | | | 16,675,000 | | | | 12,759,710 | |
| | | | | | | | |
| | | | | | | 88,736,997 | |
LOCAL AUTHORITY: 1.2% | | | | | | | | |
New Jersey Turnpike Authority RB | | | | | | | | |
7.414%, 1/1/40 | | | 3,350,000 | | | | 4,757,837 | |
7.102%, 1/1/41 | | | 12,436,000 | | | | 17,092,785 | |
State of California GO | | | | | | | | |
7.50%, 4/1/34 | | | 13,470,000 | | | | 18,795,634 | |
7.55%, 4/1/39 | | | 16,525,000 | | | | 24,002,728 | |
7.30%, 10/1/39 | | | 13,730,000 | | | | 19,216,371 | |
7.625%, 3/1/40 | | | 8,790,000 | | | | 12,800,613 | |
State of Illinois GO | | | | | | | | |
5.365%, 3/1/17 | | | 37,215,000 | | | �� | 38,596,793 | |
5.665%, 3/1/18 | | | 26,160,000 | | | | 27,699,516 | |
5.10%, 6/1/33 | | | 11,565,000 | | | | 10,936,442 | |
| | | | | | | | |
| | | | | | | 173,898,719 | |
SOVEREIGN: 0.1% | | | | | | | | |
Spain Government International(b) (Spain) | | | | | | | | |
4.00%, 3/6/18(d) | | | 11,850,000 | | | | 12,360,522 | |
| | | | | | | | |
| | | | | | | 288,062,144 | |
| | | | | | | | |
| | |
| | | PAR VALUE | | | VALUE | |
| MORTGAGE-RELATED: 9.5% | | | | | | | | |
FEDERAL AGENCY CMO & REMIC: 2.1% | | | | | |
Dept. of Veterans Affairs | | | | | | | | |
Series 1995-1 1, 7.243%, 2/15/25 | | $ | 395,926 | | | $ | 445,411 | |
Series 1995-2C 3A, 8.793%, 6/15/25 | | | 179,364 | | | | 217,524 | |
Series 2002-1 2J, 6.50%, 8/15/31 | | | 10,723,089 | | | | 12,247,566 | |
Fannie Mae | | | | | | | | |
Trust 2002-33 A1, 7.00%, 6/25/32 | | | 2,099,246 | | | | 2,351,752 | |
Trust 2009-66 ET, 6.00%, 5/25/39 | | | 4,796,186 | | | | 5,160,867 | |
Trust 2009-30 AG, 6.50%, 5/25/39 | | | 3,302,517 | | | | 3,576,862 | |
Trust 2001-T7 A1, 7.50%, 2/25/41 | | | 1,718,556 | | | | 2,008,262 | |
Trust 2001-T5 A3, 7.50%, 6/19/41 | | | 682,256 | | | | 811,245 | |
Trust 2001-T8 A1, 7.50%, 7/25/41 | | | 1,692,666 | | | | 1,957,987 | |
Trust 2001-T4 A1, 7.50%, 7/25/41 | | | 1,712,600 | | | | 2,025,133 | |
Trust 2001-W3 A, 6.808%, 9/25/41 | | | 1,160,859 | | | | 1,302,228 | |
Trust 2001-T10 A2, 7.50%, 12/25/41 | | | 1,489,256 | | | | 1,778,734 | |
Trust 2013-106 MA, 4.00%, 2/25/42 | | | 11,563,313 | | | | 12,242,707 | |
Trust 2002-W6 2A1, 6.321%, 6/25/42 | | | 1,718,690 | | | | 2,001,011 | |
Trust 2002-W8 A2, 7.00%, 6/25/42 | | | 2,234,030 | | | | 2,545,373 | |
Trust 2003-W2 1A1, 6.50%, 7/25/42 | | | 3,487,032 | | | | 3,980,360 | |
Trust 2003-W2 1A2, 7.00%, 7/25/42 | | | 1,341,223 | | | | 1,557,434 | |
Trust 2003-W4 4A, 7.028%, 10/25/42 | | | 1,803,821 | | | | 2,070,685 | |
Trust 2012-121 NB, 7.00%, 11/25/42 | | | 3,164,256 | | | | 3,648,919 | |
Trust 2013-98 FA, 0.972%, 9/25/43 | | | 10,693,645 | | | | 10,818,562 | |
Trust 2013-92 FA, 0.972%, 9/25/43 | | | 46,687,279 | | | | 46,951,706 | |
Trust 2004-T1 1A2, 6.50%, 1/25/44 | | | 2,211,506 | | | | 2,469,037 | |
Trust 2004-W2 5A, 7.50%, 3/25/44 | | | 4,324,224 | | | | 4,930,797 | |
Trust 2004-W8 3A, 7.50%, 6/25/44 | | | 723,254 | | | | 841,494 | |
Trust 2005-W4 1A2, 6.50%, 8/25/45 | | | 6,459,234 | | | | 7,647,394 | |
Trust 2009-11 MP, 7.00%, 3/25/49 | | | 6,673,247 | | | | 7,588,629 | |
Freddie Mac | | | | | | | | |
Series 1078 GZ, 6.50%, 5/15/21 | | | 134,068 | | | | 138,901 | |
Series 16 PK, 7.00%, 8/25/23 | | | 2,444,672 | | | | 2,705,203 | |
Series T-48 1A4, 5.538%, 7/25/33 | | | 31,624,028 | | | | 34,855,962 | |
Series 314 F2, 0.941%, 9/15/43 | | | 22,307,420 | | | | 22,317,611 | |
Series T-51 1A, 6.50%, 9/25/43 | | | 214,076 | | | | 249,417 | |
Series T-59 1A1, 6.50%, 10/25/43 | | | 11,105,448 | | | | 12,756,046 | |
Series 4281 BC, 4.786%, 12/15/43 | | | 76,760,905 | | | | 82,819,605 | |
| | | | | | | | |
| | | | | | | 299,020,424 | |
FEDERAL AGENCY MORTGAGE PASS-THROUGH: 7.4% | |
Fannie Mae, 15 Year | | | | | | | | |
3.50%, 12/1/29 | | | 11,970,331 | | | | 12,545,691 | |
4.00%, 2/1/27-5/1/27 | | | 73,221,983 | | | | 77,654,673 | |
4.50%, 1/1/25-1/1/27 | | | 19,067,881 | | | | 20,499,531 | |
6.00%, 7/1/16-3/1/22 | | | 2,681,738 | | | | 2,764,039 | |
6.50%, 9/1/16-11/1/18 | | | 2,289,141 | | | | 2,336,331 | |
7.00%, 11/1/18 | | | 151,009 | | | | 153,966 | |
7.50%, 12/1/16-8/1/17 | | | 166,511 | | | | 168,910 | |
Fannie Mae, 20 Year | | | | | | | | |
4.00%, 11/1/30-12/1/34 | | | 197,825,165 | | | | 211,580,702 | |
4.50%, 1/1/31-5/1/32 | | | 61,706,443 | | | | 67,109,133 | |
Fannie Mae, 30 Year | | | | | | | | |
4.50%, 1/1/39-2/1/45 | | | 75,323,091 | | | | 81,860,896 | |
5.50%, 7/1/33-8/1/37 | | | 18,624,348 | | | | 20,951,246 | |
6.00%, 9/1/36-8/1/37 | | | 24,376,674 | | | | 27,807,279 | |
6.50%, 12/1/28-8/1/39 | | | 27,831,830 | | | | 32,020,692 | |
7.00%, 4/1/37-8/1/37 | | | 8,954,789 | | | | 10,377,448 | |
Fannie Mae, Hybrid ARM | | | | | | | | |
2.00%, 1/1/35 | | | 3,146,535 | | | | 3,276,777 | |
2.246%, 12/1/34 | | | 2,396,886 | | | | 2,495,717 | |
2.266%, 9/1/34 | | | 1,643,186 | | | | 1,751,991 | |
2.272%, 1/1/35 | | | 1,596,759 | | | | 1,690,113 | |
2.319%, 8/1/35 | | | 1,820,017 | | | | 1,911,963 | |
2.436%, 8/1/38 | | | 4,655,366 | | | | 4,943,460 | |
2.525%, 11/1/43 | | | 8,927,599 | | | | 9,165,918 | |
2.707%, 4/1/44 | | | 20,208,801 | | | | 20,876,530 | |
| | |
| See accompanying Notes to Financial Statements | | DODGE & COX BALANCED FUND §PAGE 9 |
| | | | |
| PORTFOLIO OF INVESTMENTS | | | December 31, 2015 | |
| | | | | | | | |
| DEBT SECURITIES (continued) | | | | | | |
| | |
| | | PAR VALUE | | | VALUE | |
2.817%, 12/1/44 | | $ | 19,774,634 | | | $ | 20,236,265 | |
2.837%, 11/1/44 | | | 33,113,696 | | | | 33,900,264 | |
2.843%, 12/1/45 | | | 31,025,839 | | | | 31,690,646 | |
2.947%, 9/1/45 | | | 7,215,008 | | | | 7,395,642 | |
3.284%, 6/1/41 | | | 17,461,196 | | | | 18,333,013 | |
3.569%, 12/1/40 | | | 6,752,555 | | | | 7,043,894 | |
3.757%, 11/1/40 | | | 2,781,454 | | | | 2,909,755 | |
4.27%, 7/1/39 | | | 3,194,145 | | | | 3,406,023 | |
5.566%, 5/1/37 | | | 1,781,996 | | | | 1,890,037 | |
6.35%, 9/1/36 | | | 422,015 | | | | 445,578 | |
Fannie Mae, Multifamily DUS
Trust 2014-M9 ASQ2, 1.462%, 4/25/17 | | | 6,492,485 | | | | 6,500,988 | |
Freddie Mac, Hybrid ARM | | | | | | | | |
2.216%, 4/1/37 | | | 2,849,537 | | | | 3,010,044 | |
2.447%, 10/1/38 | | | 2,517,714 | | | | 2,659,540 | |
2.535%, 9/1/37 | | | 1,435,803 | | | | 1,526,716 | |
2.558%, 10/1/35 | | | 3,206,679 | | | | 3,387,835 | |
2.623%, 8/1/42 | | | 13,917,232 | | | | 14,321,510 | |
2.678%, 5/1/34 | | | 3,169,406 | | | | 3,387,139 | |
2.69%, 2/1/38 | | | 7,150,632 | | | | 7,602,865 | |
2.784%, 10/1/45 | | | 16,972,680 | | | | 17,287,286 | |
2.939%, 5/1/44 | | | 3,082,081 | | | | 3,164,477 | |
2.952%, 6/1/44 | | | 5,691,194 | | | | 5,837,153 | |
2.97%, 5/1/44 | | | 23,078,551 | | | | 23,727,620 | |
3.141%, 6/1/44 | | | 8,211,836 | | | | 8,459,960 | |
3.609%, 10/1/41 | | | 2,135,177 | | | | 2,222,316 | |
5.857%, 7/1/38 | | | 552,655 | | | | 589,911 | |
6.103%, 1/1/38 | | | 703,454 | | | | 746,787 | |
Freddie Mac Gold, 15 Year | | | | | | | | |
4.00%, 3/1/25-11/1/26 | | | 48,627,233 | | | | 51,359,897 | |
4.50%, 9/1/24-9/1/26 | | | 13,296,565 | | | | 14,246,687 | |
6.00%, 2/1/18 | | | 325,603 | | | | 332,847 | |
6.50%, 5/1/16-9/1/18 | | | 1,022,622 | | | | 1,041,584 | |
Freddie Mac Gold, 20 Year | | | | | | | | |
4.50%, 4/1/31-6/1/31 | | | 14,328,880 | | | | 15,560,529 | |
6.50%, 10/1/26 | | | 5,265,986 | | | | 5,996,930 | |
Freddie Mac Gold, 30 Year | | | | | | | | |
4.50%, 9/1/41-1/1/44 | | | 85,366,522 | | | | 92,170,526 | |
5.50%, 12/1/37 | | | 1,135,012 | | | | 1,273,791 | |
6.00%, 2/1/39 | | | 2,948,130 | | | | 3,357,630 | |
6.50%, 12/1/32-4/1/33 | | | 7,928,552 | | | | 9,202,337 | |
7.00%, 11/1/37-9/1/38 | | | 7,339,801 | | | | 8,428,452 | |
7.47%, 3/17/23 | | | 115,396 | | | | 126,666 | |
7.75%, 7/25/21 | | | 328,322 | | | | 354,645 | |
Ginnie Mae, 30 Year | | | | | | | | |
7.50%, 11/15/24-10/15/25 | | | 921,752 | | | | 1,043,115 | |
7.97%, 4/15/20-1/15/21 | | | 412,946 | | | | 443,203 | |
| | | | | | | | |
| | | | | | | 1,050,565,109 | |
| | | | | | | | |
| | | | | | | 1,349,585,533 | |
| ASSET-BACKED: 1.3% | | | | | | | | |
AUTO LOAN: 0.3% | | | | | | | | |
Ford Credit Auto Owner Trust | | | | | | | | |
Series 2014-C A3, 1.06%, 5/15/19 | | | 23,000,000 | | | | 22,944,850 | |
Series 2015-1 A, 2.12%, 7/15/26(d) | | | 16,450,000 | | | | 16,245,696 | |
| | | | | | | | |
| | | | | | | 39,190,546 | |
CREDIT CARD: 0.3% | | | | | | | | |
American Express Master Trust
Series 2014-3 A, 1.49%, 4/15/20 | | | 16,025,000 | | | | 16,029,651 | |
Chase Issuance Trust | | | | | | | | |
Series 2013-A8 A8, 1.01%, 10/15/18 | | | 14,000,000 | | | | 13,987,047 | |
Series 2014-A1 A1, 1.15%, 1/15/19 | | | 8,400,000 | | | | 8,393,246 | |
Series 2014-A6 A6, 1.26%, 7/15/19 | | | 6,500,000 | | | | 6,486,090 | |
| | | | | | | | |
| | | | | | | 44,896,034 | |
| | | | | | | | |
| | |
| | | PAR VALUE | | | VALUE | |
OTHER: 0.5% | | | | | | | | |
Rio Oil Finance Trust(b) (Brazil) | | | | | | | | |
9.25%, 7/6/24(d) | | $ | 49,425,000 | | | $ | 36,574,500 | |
9.75%, 1/6/27(d) | | | 42,925,000 | | | | 31,549,875 | |
| | | | | | | | |
| | | | | | | 68,124,375 | |
STUDENT LOAN: 0.2% | | | | | | | | |
SLM Student Loan Trust (Private Loans) | | | | | | | | |
Series 2014-A A2A, 2.59%, 1/15/26(d) | | | 5,250,000 | | | | 5,223,136 | |
Series 2012-B A2, 3.48%, 10/15/30(d) | | | 9,358,036 | | | | 9,486,544 | |
Series 2012-E A2A, 2.09%, 6/15/45(d) | | | 13,775,000 | | | | 13,661,272 | |
Series 2012-C A2, 3.31%, 10/15/46(d) | | | 10,100,000 | | | | 10,227,070 | |
| | | | | | | | |
| | | | | | | 38,598,022 | |
| | | | | | | | |
| | | | | | | 190,808,977 | |
| CORPORATE: 13.2% | | | | | | | | |
FINANCIALS: 4.2% | | | | | | | | |
Bank of America Corp. | | | | | | | | |
7.625%, 6/1/19 | | | 6,800,000 | | | | 7,868,810 | |
5.625%, 7/1/20 | | | 5,030,000 | | | | 5,589,210 | |
4.20%, 8/26/24 | | | 5,825,000 | | | | 5,833,458 | |
6.625%, 5/23/36(c) | | | 37,275,000 | | | | 42,454,249 | |
Barclays PLC(b) (United Kingdom)
4.375%, 9/11/24 | | | 23,275,000 | | | | 22,758,784 | |
BNP Paribas SA(b) (France) | | | | | | | | |
4.25%, 10/15/24 | | | 31,175,000 | | | | 30,899,756 | |
4.375%, 9/28/25(d) | | | 10,100,000 | | | | 9,892,778 | |
Boston Properties, Inc. | | | | | | | | |
3.85%, 2/1/23 | | | 7,800,000 | | | | 7,963,215 | |
3.125%, 9/1/23 | | | 17,550,000 | | | | 17,095,543 | |
3.80%, 2/1/24 | | | 11,175,000 | | | | 11,368,205 | |
Capital One Financial Corp. | | | | | | | | |
3.50%, 6/15/23 | | | 42,579,000 | | | | 42,342,857 | |
4.20%, 10/29/25 | | | 6,175,000 | | | | 6,100,066 | |
Cigna Corp. | | | | | | | | |
7.65%, 3/1/23 | | | 9,705,000 | | | | 11,771,777 | |
7.875%, 5/15/27 | | | 21,888,000 | | | | 28,780,706 | |
8.30%, 1/15/33 | | | 8,845,000 | | | | 11,617,775 | |
Citigroup, Inc.
6.692%, 10/30/40(c) | | | 43,080,925 | | | | 45,131,577 | |
Equity Residential | | | | | | | | |
4.625%, 12/15/21 | | | 14,054,000 | | | | 15,259,552 | |
3.00%, 4/15/23 | | | 14,775,000 | | | | 14,514,074 | |
Health Net, Inc.
6.375%, 6/1/17 | | | 13,275,000 | | | | 13,806,000 | |
HSBC Holdings PLC(b) (United Kingdom) | | | | | | | | |
5.10%, 4/5/21 | | | 3,625,000 | | | | 4,030,271 | |
6.50%, 5/2/36 | | | 23,190,000 | | | | 27,661,867 | |
6.50%, 9/15/37 | | | 15,315,000 | | | | 18,375,075 | |
JPMorgan Chase & Co.
8.75%, 9/1/30(c) | | | 23,042,000 | | | | 32,999,047 | |
Lloyds Banking Group PLC(b) (United Kingdom)
4.50%, 11/4/24 | | | 19,575,000 | | | | 19,873,480 | |
Navient Corp. | | | | | | | | |
6.00%, 1/25/17 | | | 14,285,000 | | | | 14,642,125 | |
4.625%, 9/25/17 | | | 9,550,000 | | | | 9,406,750 | |
8.45%, 6/15/18 | | | 15,755,000 | | | | 16,582,137 | |
Royal Bank of Scotland Group PLC(b) (United Kingdom) | | | | | | | | |
6.125%, 12/15/22 | | | 48,416,000 | | | | 52,710,935 | |
6.00%, 12/19/23 | | | 3,250,000 | | | | 3,500,270 | |
Unum Group | | | | | | | | |
7.19%, 2/1/28 | | | 8,305,000 | | | | 9,754,048 | |
7.25%, 3/15/28 | | | 2,030,000 | | | | 2,361,507 | |
6.75%, 12/15/28 | | | 11,368,000 | | | | 13,341,587 | |
Wells Fargo & Co.
4.30%, 7/22/27 | | | 20,710,000 | | | | 21,158,268 | |
| | | | | | | | |
| | | | | | | 597,445,759 | |
| | |
| PAGE 10 § DODGE & COX BALANCED FUND | | See accompanying Notes to Financial Statements |
| | | | |
| PORTFOLIO OF INVESTMENTS | | | December 31, 2015 | |
| | | | | | | | |
| DEBT SECURITIES (continued) | | | | | | |
| | |
| | | PAR VALUE | | | VALUE | |
INDUSTRIALS: 8.6% | | | | | | | | |
Allergan PLC(b) (Ireland) | | | | | | | | |
3.00%, 3/12/20 | | $ | 19,550,000 | | | $ | 19,534,419 | |
3.45%, 3/15/22 | | | 11,130,000 | | | | 11,147,775 | |
3.80%, 3/15/25 | | | 10,870,000 | | | | 10,815,487 | |
AT&T, Inc. | | | | | | | | |
3.40%, 5/15/25 | | | 6,725,000 | | | | 6,464,171 | |
6.55%, 2/15/39 | | | 7,675,000 | | | | 8,621,028 | |
5.35%, 9/1/40 | | | 27,575,000 | | | | 27,235,552 | |
4.75%, 5/15/46 | | | 7,000,000 | | | | 6,407,968 | |
Becton, Dickinson and Co.
3.734%, 12/15/24 | | | 5,725,000 | | | | 5,777,544 | |
BHP Billiton, Ltd.(b) (Australia)
6.75%, 10/19/75(c)(d) | | | 19,800,000 | | | | 19,107,000 | |
Burlington Northern Santa Fe LLC(f) | | | | | | | | |
8.251%, 1/15/21 | | | 664,677 | | | | 748,300 | |
3.85%, 9/1/23 | | | 2,150,000 | | | | 2,234,633 | |
5.72%, 1/15/24 | | | 9,037,276 | | | | 9,948,974 | |
5.342%, 4/1/24 | | | 9,407,801 | | | | 10,166,540 | |
5.629%, 4/1/24 | | | 14,244,488 | | | | 15,581,690 | |
Cemex SAB de CV(b) (Mexico) | | | | | | | | |
6.50%, 12/10/19(d) | | | 22,500,000 | | | | 21,712,500 | |
6.00%, 4/1/24(d) | | | 10,575,000 | | | | 9,068,062 | |
5.70%, 1/11/25(d) | | | 22,475,000 | | | | 18,794,719 | |
6.125%, 5/5/25(d) | | | 8,100,000 | | | | 6,925,500 | |
Charter Communications, Inc. | | | | | | | | |
4.908%, 7/23/25(d) | | | 11,600,000 | | | | 11,588,597 | |
6.484%, 10/23/45(d) | | | 8,150,000 | | | | 8,152,893 | |
Cox Enterprises, Inc. | | | | | | | | |
3.25%, 12/15/22(d) | | | 15,740,000 | | | | 14,307,550 | |
2.95%, 6/30/23(d) | | | 37,166,000 | | | | 32,742,651 | |
3.85%, 2/1/25(d) | | | 19,625,000 | | | | 17,993,868 | |
CRH PLC(b) (Ireland)
3.875%, 5/18/25(d) | | | 17,100,000 | | | | 16,991,740 | |
CSX Corp.
9.75%, 6/15/20 | | | 5,231,000 | | | | 6,646,169 | |
Dillard’s, Inc. | | | | | | | | |
7.13%, 8/1/18 | | | 3,606,000 | | | | 3,968,681 | |
7.875%, 1/1/23 | | | 8,660,000 | | | | 10,205,273 | |
7.75%, 7/15/26 | | | 50,000 | | | | 57,831 | |
7.75%, 5/15/27 | | | 540,000 | | | | 628,421 | |
7.00%, 12/1/28 | | | 15,135,000 | | | | 16,775,271 | |
Dow Chemical Co. | | | | | | | | |
8.55%, 5/15/19 | | | 12,775,000 | | | | 15,061,342 | |
7.375%, 11/1/29 | | | 17,000,000 | | | | 21,006,764 | |
9.40%, 5/15/39 | | | 9,677,000 | | | | 13,906,023 | |
FedEx Corp. | | | | | | | | |
8.00%, 1/15/19 | | | 6,965,000 | | | | 8,108,848 | |
6.72%, 7/15/23 | | | 5,156,509 | | | | 5,813,964 | |
Ford Motor Credit Co. LLC(f) | | | | | | | | |
5.75%, 2/1/21 | | | 12,700,000 | | | | 14,036,865 | |
5.875%, 8/2/21 | | | 11,350,000 | | | | 12,657,270 | |
4.25%, 9/20/22 | | | 9,593,000 | | | | 9,814,790 | |
4.375%, 8/6/23 | | | 14,575,000 | | | | 14,981,599 | |
Hewlett Packard Enterprise Co.
3.60%, 10/15/20(d) | | | 33,600,000 | | | | 33,680,640 | |
Imperial Tobacco Group PLC(b) (United Kingdom) | | | | | | | | |
3.75%, 7/21/22(d) | | | 10,475,000 | | | | 10,518,126 | |
4.25%, 7/21/25(d) | | | 31,825,000 | | | | 32,300,020 | |
Kinder Morgan, Inc. | | | | | | | | |
4.30%, 6/1/25 | | | 36,515,000 | | | | 31,565,647 | |
5.50%, 3/1/44 | | | 33,730,000 | | | | 26,307,646 | |
5.40%, 9/1/44 | | | 15,414,000 | | | | 11,648,452 | |
| | | | | | | | |
| | |
| | | PAR VALUE | | | VALUE | |
Macy’s, Inc. | | | | | | | | |
6.90%, 1/15/32 | | $ | 49,699,000 | | | $ | 54,850,351 | |
6.70%, 7/15/34 | | | 2,890,000 | | | | 3,002,626 | |
Naspers, Ltd. (b) (South Africa) | | | | | | | | |
6.00%, 7/18/20(d) | | | 21,900,000 | | | | 23,300,067 | |
5.50%, 7/21/25(d) | | | 17,575,000 | | | | 16,907,712 | |
Norfolk Southern Corp.
9.75%, 6/15/20 | | | 7,224,000 | | | | 9,220,403 | |
RELX PLC(b) (United Kingdom) | | | | | | | | |
8.625%, 1/15/19 | | | 4,901,000 | | | | 5,716,316 | |
3.125%, 10/15/22 | | | 22,133,000 | | | | 21,508,274 | |
Sprint Corp.
6.00%, 12/1/16 | | | 24,367,000 | | | | 24,245,165 | |
Teck Resources, Ltd.(b) (Canada)
5.20%, 3/1/42 | | | 17,773,000 | | | | 7,464,660 | |
Telecom Italia SPA(b) (Italy) | | | | | | | | |
6.999%, 6/4/18 | | | 17,100,000 | | | | 18,468,000 | |
7.175%, 6/18/19 | | | 27,527,000 | | | | 30,349,068 | |
5.303%, 5/30/24(d) | | | 11,500,000 | | | | 11,356,250 | |
7.20%, 7/18/36 | | | 11,596,000 | | | | 11,711,960 | |
7.721%, 6/4/38 | | | 7,062,000 | | | | 7,362,135 | |
The Kraft Heinz Co.
3.95%, 7/15/25(d) | | | 4,000,000 | | | | 4,038,724 | |
Time Warner Cable, Inc. | | | | | | | | |
8.75%, 2/14/19 | | | 13,840,000 | | | | 16,059,202 | |
8.25%, 4/1/19 | | | 33,815,000 | | | | 38,861,483 | |
6.55%, 5/1/37 | | | 11,000,000 | | | | 11,125,840 | |
6.75%, 6/15/39 | | | 2,110,000 | | | | 2,117,503 | |
Time Warner, Inc. | | | | | | | | |
7.625%, 4/15/31 | | | 31,348,000 | | | | 38,787,727 | |
7.70%, 5/1/32 | | | 14,374,000 | | | | 17,944,415 | |
TransCanada Corp.(b) (Canada)
5.625%, 5/20/75(c) | | | 20,570,000 | | | | 19,018,693 | |
Twenty-First Century Fox, Inc. | | | | | | | | |
6.15%, 3/1/37 | | | 15,000,000 | | | | 16,713,435 | |
6.65%, 11/15/37 | | | 1,638,000 | | | | 1,903,456 | |
Union Pacific Corp. | | | | | | | | |
5.866%, 7/2/30 | | | 26,119,175 | | | | 29,814,027 | |
6.176%, 1/2/31 | | | 9,262,594 | | | | 10,532,209 | |
Verizon Communications, Inc. | | | | | | | | |
4.15%, 3/15/24 | | | 12,750,000 | | | | 13,110,838 | |
4.272%, 1/15/36 | | | 11,847,000 | | | | 10,693,173 | |
6.55%, 9/15/43 | | | 46,476,000 | | | | 55,175,238 | |
Vulcan Materials Co.
7.50%, 6/15/21 | | | 20,340,000 | | | | 23,696,100 | |
Xerox Corp. | | | | | | | | |
6.35%, 5/15/18 | | | 20,585,000 | | | | 22,009,708 | |
4.50%, 5/15/21 | | | 19,161,000 | | | | 19,347,973 | |
Zoetis, Inc. | | | | | | | | |
3.45%, 11/13/20 | | | 8,960,000 | | | | 8,970,743 | |
4.50%, 11/13/25 | | | 7,985,000 | | | | 8,097,365 | |
| | | | | | | | |
| | | | | | | 1,225,239,642 | |
UTILITIES: 0.4% | | | | | | | | |
Dominion Resources, Inc.
5.75%, 10/1/54(c) | | | 22,950,000 | | | | 22,486,410 | |
Enel SPA(b) (Italy) | | | | | | | | |
6.80%, 9/15/37(d) | | | 18,700,000 | | | | 22,833,598 | |
6.00%, 10/7/39(d) | | | 8,550,000 | | | | 9,560,627 | |
| | | | | | | | |
| | | | | | | 54,880,635 | |
| | | | | | | | |
| | | | | | | 1,877,566,036 | |
| | | | | | | | |
TOTAL DEBT SECURITIES
(Cost $3,929,370,365) | | | $ | 4,021,194,304 | |
| | |
| See accompanying Notes to Financial Statements | | DODGE & COX BALANCED FUND §PAGE 11 |
| | | | |
| PORTFOLIO OF INVESTMENTS | | | December 31, 2015 | |
| | | | | | | | |
| SHORT-TERM INVESTMENTS: 1.4% | | | | |
| | |
| | | PAR VALUE | | | VALUE | |
MONEY MARKET FUND: 0.1% | | | | | | | | |
SSgA U.S. Treasury Money Market Fund | | $ | 14,374,610 | | | $ | 14,374,610 | |
| |
REPURCHASE AGREEMENT: 1.3% | | | | | |
Fixed Income Clearing Corporation(e)
0.08%, dated 12/31/15, due 1/4/16, maturity value $184,725,642 | | | 184,724,000 | | | | 184,724,000 | |
| | | | | | | | |
TOTAL SHORT-TERM INVESTMENTS
(Cost $199,098,610) | | | $ | 199,098,610 | |
| | | | | | | | |
TOTAL INVESTMENTS
(Cost $11,576,339,212) | | | 99.8 | % | | $ | 14,247,647,332 | |
OTHER ASSETS LESS LIABILITIES | | | 0.2 | % | | | 21,681,711 | |
| | | | | | | | |
| NET ASSETS | | | 100.0 | % | | $ | 14,269,329,043 | |
| | | | | | | | |
| (b) | Security denominated in U.S. dollars |
| (d) | Security exempt from registration under Rule 144A of the Securities Act of 1933. The security may be resold in transactions exempt from registration, normally to qualified institutional buyers. As of December 31, 2015, all such securities in total represented $586,566,526 or 4.1% of net assets. These securities have been deemed liquid by Dodge & Cox, investment manager, pursuant to procedures approved by the Fund’s Board of Trustees. |
| (e) | Repurchase agreement is collateralized by U.S. Treasury Notes 1.625%-1.75%, 7/31/20-3/31/22. Total collateral value is $188,420,119. |
| (f) | Subsidiary (see below) |
In determining a company’s country designation, the Fund generally references the country of incorporation. In cases where the Fund considers the country of incorporation to be a “jurisdiction of convenience” chosen primarily for tax purposes or in other limited circumstances, the Fund uses the country designation of an appropriate broad-based market index. In those cases, two countries are listed — the country of incorporation and the country designated by an appropriate index, respectively.
Debt securities are grouped by parent company unless otherwise noted. Actual securities may be issued by the listed parent company or one of its subsidiaries.
ADR: American Depositary Receipt
ARM: Adjustable Rate Mortgage
CMO: Collateralized Mortgage Obligation
DUS: Delegated Underwriting and Servicing
GO: General Obligation
RB: Revenue Bond
REMIC: Real Estate Mortgage Investment Conduit
FUTURES CONTRACTS
| | | | | | | | | | | | | | | | |
| Description | | Number of
Contracts | | | Expiration
Date | | | Notional
Amount | | | Unrealized
Appreciation/
(Depreciation) | |
10 Year U.S. Treasury Note—Short Position | | | 1,664 | | | | Mar 2016 | | | $ | (209,508,000 | ) | | $ | 781,542 | |
Long-Term U.S. Treasury Bond—Short Position | | | 1,040 | | | | Mar 2016 | | | | (165,035,000 | ) | | | (525,653 | ) |
| | | | | | | | | | | | | | | | |
| | | | | | | | | | | | | | $ | 255,889 | |
| | | | | | | | | | | | | | | | |
| | |
| PAGE 12 § DODGE & COX BALANCED FUND | | See accompanying Notes to Financial Statements |
| | | | |
STATEMENT OF ASSETS AND LIABILITIES | |
| |
| | |
December 31, 2015 | |
ASSETS: | | | | |
Investments, at value (cost $11,576,339,212) | | $ | 14,247,647,332 | |
Cash held at broker | | | 6,770,388 | |
Receivable for investments sold | | | 5,801,740 | |
Receivable for Fund shares sold | | | 8,024,925 | |
Dividends and interest receivable | | | 52,275,035 | |
Prepaid expenses and other assets | | | 93,831 | |
| | | | |
| | | 14,320,613,251 | |
| | | | |
LIABILITIES: | | | | |
Payable to broker for variation margin | | | 1,533,992 | |
Payable for investments purchased | | | 5,288,661 | |
Payable for Fund shares redeemed | | | 37,488,385 | |
Management fees payable | | | 6,113,609 | |
Accrued expenses | | | 859,561 | |
| | | | |
| | | 51,284,208 | |
| | | | |
| NET ASSETS | | $ | 14,269,329,043 | |
| | | | |
NET ASSETS CONSIST OF: | | | | |
Paid in capital | | $ | 11,444,166,191 | |
Undistributed net investment income | | | 3,251,258 | |
Undistributed net realized gain | | | 150,347,585 | |
Net unrealized appreciation | | | 2,671,564,009 | |
| | | | |
| | $ | 14,269,329,043 | |
| | | | |
Fund shares outstanding (par value $0.01 each,
unlimited shares authorized) | | | 151,122,480 | |
Net asset value per share | | $ | 94.42 | |
|
STATEMENT OF OPERATIONS | |
| | | Year Ended
December 31, 2015 | |
INVESTMENT INCOME: | | | | |
Dividends (net of foreign taxes of $3,724,034) | | $ | 197,425,260 | |
Interest | | | 190,225,233 | |
| | | | |
| | | 387,650,493 | |
| | | | |
EXPENSES: | | | | |
Management fees | | | 75,758,904 | |
Custody and fund accounting fees | | | 302,185 | |
Transfer agent fees | | | 1,780,717 | |
Professional services | | | 204,059 | |
Shareholder reports | | | 339,208 | |
Registration fees | | | 174,198 | |
Trustees’ fees | | | 237,500 | |
Miscellaneous | | | 1,065,235 | |
| | | | |
| | | 79,862,006 | |
| | | | |
NET INVESTMENT INCOME | | | 307,788,487 | |
| | | | |
| |
REALIZED AND UNREALIZED GAIN (LOSS): | | | | |
Net realized gain (loss) | | | | |
Investments | | | 501,033,067 | |
Treasury futures contracts | | | (8,435,099 | ) |
Net change in unrealized appreciation/depreciation | | | | |
Investments | | | (1,237,696,213 | ) |
Treasury futures contracts | | | 7,923,554 | |
| | | | |
Net realized and unrealized loss | | | (737,174,691 | ) |
| | | | |
NET DECREASE IN NET ASSETS FROM OPERATIONS | | $ | (429,386,204 | ) |
| | | | |
| | | | | | | | |
STATEMENT OF CHANGES IN NET ASSETS | |
| | |
| | | Year Ended
December 31, 2015 | | | Year Ended
December 31, 2014 | |
OPERATIONS: | | | | | | | | |
Net investment income | | $ | 307,788,487 | | | $ | 298,744,812 | |
Net realized gain | | | 492,597,968 | | | | 399,919,057 | |
Net change in unrealized
appreciation/depreciation | | | (1,229,772,659 | ) | | | 567,009,703 | |
| | | | | | | | |
| | | (429,386,204 | ) | | | 1,265,673,572 | |
| | | | | | | | |
| | |
DISTRIBUTIONS TO SHAREHOLDERS FROM: | | | | | | | | |
Net investment income | | | (308,037,610 | ) | | | (298,877,158 | ) |
Net realized gain | | | (455,897,559 | ) | | | (359,115,663 | ) |
| | | | | | | | |
Total distributions | | | (763,935,169 | ) | | | (657,992,821 | ) |
| | | | | | | | |
| | |
FUND SHARE
TRANSACTIONS: | | | | | | | | |
Proceeds from sale of shares | | | 1,416,791,531 | | | | 1,944,425,723 | |
Reinvestment of distributions | | | 725,183,002 | | | | 624,013,075 | |
Cost of shares redeemed | | | (2,144,401,683 | ) | | | (2,114,967,089 | ) |
| | | | | | | | |
Net increase/(decrease) from
Fund share transactions | | | (2,427,150 | ) | | | 453,471,709 | |
| | | | | | | | |
Total increase/(decrease) in
net assets | | | (1,195,748,523 | ) | | | 1,061,152,460 | |
| | |
NET ASSETS: | | | | | | | | |
Beginning of year | | | 15,465,077,566 | | | | 14,403,925,106 | |
| | | | | | | | |
End of year (including undistributed net investment income of $3,251,258 and $3,500,381, respectively) | | $ | 14,269,329,043 | | | $ | 15,465,077,566 | |
| | | | | | | | |
| | |
SHARE INFORMATION: | | | | | | | | |
Shares sold | | | 14,047,663 | | | | 19,199,410 | |
Distributions reinvested | | | 7,539,830 | | | | 6,142,973 | |
Shares redeemed | | | (21,376,698 | ) | | | (20,958,749 | ) |
| | | | | | | | |
Net increase in shares outstanding | | | 210,795 | | | | 4,383,634 | |
| | | | | | | | |
| | |
| See accompanying Notes to Financial Statements | | DODGE & COX BALANCED FUND §PAGE 13 |
NOTES TO FINANCIAL STATEMENTS
NOTE 1—ORGANIZATION AND SIGNIFICANT ACCOUNTING POLICIES
Dodge & Cox Balanced Fund (the “Fund”) is one of the series constituting the Dodge & Cox Funds (the “Trust” or the “Funds”). The Trust is organized as a Delaware statutory trust and is registered under the Investment Company Act of 1940, as amended, as an open-end management investment company. The Fund commenced operations on June 26, 1931, and seeks regular income, conservation of principal, and an opportunity for long-term growth of principal and income. Risk considerations and investment strategies of the Fund are discussed in the Fund’s Prospectus.
The financial statements have been prepared in conformity with accounting principles generally accepted in the United States of America, which require the use of estimates and assumptions by management. Actual results may differ from those estimates. Significant accounting policies are as follows:
Security valuation The Fund’s net assets are valued as of the close of trading on the New York Stock Exchange (NYSE), generally 4:00 p.m. Eastern Time, each day that the NYSE is open for business. If the NYSE is closed due to inclement weather, technology problems, or for any other reason on a day it would normally be open for business, or the NYSE has an unscheduled early closing on a day it has opened for business, the Fund reserves the right to calculate the Fund’s NAV as of the normally scheduled close of regular trading on the NYSE for that day, provided that Dodge & Cox believes that it can obtain reliable market quotes or valuations. Portfolio securities and other financial instruments for which market quotes are readily available are valued at market value. Listed securities are generally valued using the official quoted close price or the last sale on the exchange that is determined to be the primary market for the security.
Debt securities (including certain preferred stocks) and non-exchange traded derivatives are valued based on prices received from independent pricing services which utilize both dealer-supplied valuations and pricing models. Pricing models may consider quoted prices for similar securities, interest rates, prepayment speeds, and credit risk. Exchange-traded derivatives are valued at the settlement price determined by the relevant exchange. Security values are not discounted based on the size of the Fund’s position. Short-term securities less than 60 days to maturity may be valued at amortized cost if amortized cost approximates current value. Mutual funds are valued at their respective net asset values. All securities held by the Fund are denominated in U.S. dollars.
If market quotations are not readily available or if a security’s value is believed to have materially changed after the close of the security’s primary market but before the close of trading on the NYSE, the security is valued at fair value as determined in good faith by or under the direction of the Fund’s Board of Trustees. The Board of Trustees has appointed Dodge & Cox, the Fund’s investment manager, to make fair value determinations in accordance with the Dodge & Cox Funds Valuation Policies
(“Valuation Policies”), subject to Board oversight. Dodge & Cox has established a Pricing Committee that is comprised of representatives from Treasury, Legal, Compliance, and Operations. The Pricing Committee is responsible for implementing the Valuation Policies, including determining the fair value of securities when market quotations or market-based valuations are not readily available or are deemed unreliable. The Pricing Committee considers relevant indications of value that are reasonably available to it in determining the fair value assigned to a particular security, such as the value of similar financial instruments, trading volumes, contractual restrictions on disposition, related corporate actions, and changes in economic conditions. In doing so, the Pricing Committee employs various methods for calibrating fair valuation approaches, including a regular review of key inputs and assumptions, back-testing, and review of any related market activity.
Valuing securities through a fair value determination involves greater reliance on judgment than valuation of securities based on readily available market quotations. In some instances, lack of information and uncertainty as to the significance of information may lead to a conclusion that a prior valuation is the best indication of a security’s value. When fair value pricing is employed, the prices of securities used by the Fund to calculate its NAV may differ from quoted or published prices for the same securities.
Security transactions, investment income, expenses, and distributions Security transactions are recorded on the trade date. Realized gains and losses on securities sold are determined on the basis of identified cost.
Dividend income and corporate action transactions are recorded on the ex-dividend date, or when the Fund first learns of the dividend/corporate action if the ex-dividend date has passed. Withholding taxes on foreign dividends have been provided for in accordance with the Fund’s understanding of the applicable country’s tax rules and rates. Non-cash dividends included in dividend income, if any, are recorded at the fair market value of the securities received. Dividends characterized as return of capital for U.S. tax purposes are recorded as a reduction of cost of investments and/or realized gain.
Interest income is recorded on the accrual basis. Interest income includes coupon interest, amortization of premium and accretion of discount on debt securities, and gain/loss on paydowns. The ability of the issuers of the debt securities held by the Fund to meet their obligations may be affected by economic developments in a specific industry, state, or region. Debt obligations may be placed on non-accrual status and related interest income may be reduced by ceasing current accruals and writing off interest receivables when the collection of all or a portion of interest has become doubtful. A debt obligation is removed from non-accrual status when the issuer resumes interest payments or when collectibility of interest is reasonably assured.
Expenses are recorded on the accrual basis. Some expenses of the Trust can be directly attributed to a specific series. Expenses
PAGE 14 § DODGE & COX BALANCED FUND
NOTES TO FINANCIAL STATEMENTS
which cannot be directly attributed are allocated among the Funds in the Trust based on relative net assets or other expense methodologies determined by the nature of the expense.
Distributions to shareholders are recorded on the ex-dividend date.
Repurchase agreements The Fund enters into repurchase agreements, secured by U.S. government or agency securities, which involve the purchase of securities from a counterparty with a simultaneous commitment to resell the securities at an agreed-upon date and price. It is the Fund’s policy that its custodian take possession of the underlying collateral securities, the fair value of which exceeds the principal amount of the repurchase transaction, including accrued interest, at all times. In the event of default by the counterparty, the Fund has the contractual right to liquidate the collateral securities and to apply the proceeds in satisfaction of the obligation.
Futures Contracts Futures contracts involve an obligation to purchase or sell (depending on whether the Fund has entered a long or short futures contract, respectively) an asset at a future date, at a price set at the time of the contract. Upon entering into a futures contract, the Fund is required to deposit an amount of cash or liquid assets (referred to as initial margin) in a segregated account with the clearing broker. Subsequent payments (referred to as variation margin) to and from the clearing broker are made on a daily basis based on changes in the market value of futures contracts. Futures contracts are traded publicly and their market value changes daily. Changes in the market value of open futures contracts are recorded as unrealized appreciation or depreciation in the Statement of Operations. Realized gains and losses on futures contracts are recorded in the Statement of Operations at the closing or expiration of the contracts. Cash deposited with a broker as initial margin is recorded on the Statement of Assets and Liabilities. A receivable and/or payable to brokers for daily variation margin is also recorded on the Statement of Assets and Liabilities.
Investments in futures contracts may include certain risks, which may be different from, and potentially greater than, those of the underlying securities. To the extent the Fund uses futures, it is exposed to additional volatility and potential losses resulting from leverage.
The Fund has maintained short Treasury futures contracts to assist with the management of the portfolio’s interest rate exposure. During the year ended December 31, 2015, these Treasury futures contracts had notional values ranging from 1% to 3% of net assets.
Indemnification Under the Trust’s organizational documents, its officers and trustees are indemnified against certain liabilities arising out of the performance of their duties to the Trust. In addition, in the normal course of business the Trust enters into contracts that provide general indemnities to other parties. The Trust’s maximum exposure under these arrangements is unknown as this would involve future claims that may be made against the Trust that have not yet occurred.
NOTE 2—VALUATION MEASUREMENTS
Various inputs are used in determining the value of the Fund’s investments. These inputs are summarized in the three broad levels listed below.
| § | | Level 1: Quoted prices in active markets for identical securities |
| § | | Level 2: Other significant observable inputs (including quoted prices for similar securities, market indices, interest rates, credit risk, etc.) |
| § | | Level 3: Significant unobservable inputs (including Fund management’s assumptions in determining the fair value of investments) |
The inputs or methodology used for valuing securities are not necessarily an indication of the risk associated with investing in those securities.
The following is a summary of the inputs used to value the Fund’s holdings at December 31, 2015:
| | | | | | | | |
| Classification(a) | | LEVEL 1 (Quoted Prices) | �� | | LEVEL 2 (Other Significant Observable Inputs) | |
Securities | | | | | | | | |
Common Stocks(b) | | $ | 9,411,739,999 | | | | — | |
Preferred Stocks | | | — | | | | 615,614,419 | |
Debt Securities | | | | | | | | |
U.S. Treasury | | | — | | | | 315,171,614 | |
Government-Related | | | — | | | | 288,062,144 | |
Mortgage-Related | | | — | | | | 1,349,585,533 | |
Asset-Backed | | | — | | | | 190,808,977 | |
Corporate | | | — | | | | 1,877,566,036 | |
Short-term Investments | | | | | | | | |
Money Market Fund | | | 14,374,610 | | | | — | |
Repurchase Agreement | | | — | | | | 184,724,000 | |
| | | | | | | | |
Total Securities | | $ | 9,426,114,609 | | | $ | 4,821,532,723 | |
| | | | | | | | |
Other Financial Instruments(c) | | | | | | | | |
Treasury Futures Contracts | | | | | | | | |
Appreciation | | $ | 781,542 | | | $ | — | |
Depreciation | | | (525,653 | ) | | | — | |
| | | | | | | | | |
| (a) | U.S. Treasury securities were transferred from Level 1 to Level 2 during the year. There were no Level 3 securities at December 31, 2015 and 2014, and there were no transfers to Level 3 during the year. |
| (b) | All common stocks held in the Fund are Level 1 securities. For a detailed break-out of common stocks by major industry classification, please refer to the Portfolio of Investments. |
| (c) | Represents unrealized appreciation/(depreciation). |
NOTE 3—RELATED PARTY TRANSACTIONS
Management fees Under a written agreement approved by a unanimous vote of the Board of Trustees, the Fund pays an annual management fee of 0.50% of the Fund’s average daily net assets to Dodge & Cox, investment manager of the Fund.
Fund officers and trustees All officers and two of the trustees of the Trust are officers or employees of Dodge & Cox. The Trust pays a fee only to those trustees who are not affiliated with Dodge & Cox.
Cross trades Cross trading is the buying or selling of portfolio securities between funds to which Dodge & Cox serves as investment manager. At its regularly scheduled quarterly meetings,
DODGE & COX BALANCED FUND §PAGE 15
NOTES TO FINANCIAL STATEMENTS
the Board of Trustees reviews such transactions as of the most recent calendar quarter for compliance with the requirements and restrictions set forth by Rule 17a-7 under the Investment Company Act of 1940. During the year ending December 31, 2015, the Fund executed cross trades with the Dodge & Cox Income Fund pursuant to Rule 17a-7 under the Investment Company Act of 1940.
NOTE 4—INCOME TAX INFORMATION AND DISTRIBUTIONS TO SHAREHOLDERS
A provision for federal income taxes is not required since the Fund intends to continue to qualify as a regulated investment company under Subchapter M of the Internal Revenue Code and distribute all of its taxable income to shareholders. Distributions are determined in accordance with income tax regulations, and such amounts may differ from net investment income and realized gains for financial reporting purposes. Financial reporting records are adjusted for permanent book to tax differences at year end to reflect tax character.
Book to tax differences are primarily due to differing treatments of wash sales, net short-term realized gain (loss), and Treasury futures contracts. At December 31, 2015, the cost of investments for federal income tax purposes was $11,577,698,098.
Distributions during the years noted below were characterized as follows for federal income tax purposes:
| | | | | | | | |
| | | Year Ended
December 31, 2015 | | | Year Ended
December 31, 2014 | |
Ordinary income | | | $311,803,137 | | | | $357,296,853 | |
| | | ($2.085 per share) | | | | ($2.417 per share) | |
| | |
Long-term capital gain | | | $452,132,032 | | | | $300,695,968 | |
| | | ($3.049 per share) | | | | ($2.020 per share) | |
At December 31, 2015, the tax basis components of distributable earnings were as follows:
| | | | |
Unrealized appreciation | | $ | 3,115,795,334 | |
Unrealized depreciation | | | (445,846,100 | ) |
| | | | |
Net unrealized appreciation | | | 2,669,949,234 | |
Undistributed ordinary income | | | 3,197,590 | |
Undistributed long-term capital gain | | | 152,016,028 | |
Fund management has reviewed the tax positions for open periods (three years and four years, respectively, from filing the Fund’s Federal and State tax returns) as applicable to the Fund, and has determined that no provision for income tax is required in the Fund’s financial statements.
NOTE 5—LOAN FACILITIES
Pursuant to an exemptive order issued by the Securities and Exchange Commission (SEC), the Fund may participate in an interfund lending facility (Facility). The Facility allows the Fund to borrow money from or loan money to the Funds. Loans under the Facility are made for temporary or emergency purposes, such as to fund shareholder redemption requests. Interest on borrowings is the average of the current repurchase agreement rate and the bank loan rate. There was no activity in the Facility during the year.
All Funds in the Trust participate in a $500 million committed credit facility (Line of Credit) with State Street Bank and Trust Company, to be utilized for temporary or emergency purposes to fund shareholder redemptions or for other short-term liquidity purposes. The maximum amount available to the Fund is $250 million. Each Fund pays an annual commitment fee on its pro-rata portion of the Line of Credit. For the year ended December 31, 2015, the Fund’s commitment fee amounted to $46,840 and is reflected as a Miscellaneous Expense in the Statement of Operations. Interest on borrowings is charged at the prevailing rate. There were no borrowings on the Line of Credit during the year.
NOTE 6—PURCHASES AND SALES OF INVESTMENTS
For the year ended December 31, 2015, purchases and sales of securities, other than short-term securities and U.S. government securities, aggregated $2,404,105,515 and $2,555,199,624, respectively. For the year ended December 31, 2015, purchases and sales of U.S. government securities aggregated $592,405,701 and $862,581,661, respectively.
NOTE 7—SUBSEQUENT EVENTS
Fund management has determined that no material events or transactions occurred subsequent to December 31, 2015, and through the date of the Fund’s financial statements issuance, which require additional disclosure in the Fund’s financial statements.
PAGE 16 § DODGE & COX BALANCED FUND
FINANCIAL HIGHLIGHTS
| | | | | | | | | | | | | | | | | | | | |
SELECTED DATA AND RATIOS (for a share outstanding throughout each year) | | Year Ended December 31, | |
| | | 2015 | | | 2014 | | | 2013 | | | 2012 | | | 2011 | |
| | | | |
Net asset value, beginning of year | | | $102.48 | | | | $98.30 | | | | $78.06 | | | | $67.45 | | | | $70.22 | |
Income from investment operations: | | | | | | | | | | | | | | | | | | | | |
Net investment income | | | 2.06 | | | | 2.03 | | | | 1.66 | | | | 1.65 | | | | 1.62 | |
Net realized and unrealized gain (loss) | | | (4.99 | ) | | | 6.59 | | | | 20.30 | | | | 10.62 | | | | (2.77 | ) |
| | | | |
Total from investment operations | | | (2.93 | ) | | | 8.62 | | | | 21.96 | | | | 12.27 | | | | (1.15 | ) |
| | | | |
Distributions to shareholders from: | | | | | | | | | | | | | | | | | | | | |
Net investment income | | | (2.06 | ) | | | (2.03 | ) | | | (1.65 | ) | | | (1.66 | ) | | | (1.62 | ) |
Net realized gain | | | (3.07 | ) | | | (2.41 | ) | | | (0.07 | ) | | | — | | | | — | |
| | | | |
Total distributions | | | (5.13 | ) | | | (4.44 | ) | | | (1.72 | ) | | | (1.66 | ) | | | (1.62 | ) |
| | | | |
Net asset value, end of year | | | $94.42 | | | | $102.48 | | | | $98.30 | | | | $78.06 | | | | $67.45 | |
| | | | |
Total return | | | (2.88 | )% | | | 8.85 | % | | | 28.37 | % | | | 18.32 | % | | | (1.66 | )% |
Ratios/supplemental data: | | | | | | | | | | | | | | | | | | | | |
Net assets, end of year (millions) | | | $14,269 | | | | $15,465 | | | | $14,404 | | | | $12,217 | | | | $12,220 | |
Ratio of expenses to average net assets | | | 0.53 | % | | | 0.53 | % | | | 0.53 | % | | | 0.53 | % | | | 0.53 | % |
Ratio of net investment income to average net assets | | | 2.03 | % | | | 2.00 | % | | | 1.85 | % | | | 2.21 | % | | | 2.26 | % |
Portfolio turnover rate | | | 20 | % | | | 23 | % | | | 25 | % | | | 16 | % | | | 19 | % |
See accompanying Notes to Financial Statements
DODGE & COX BALANCED FUND §PAGE 17
REPORT OF INDEPENDENT REGISTERED PUBLIC ACCOUNTING FIRM
To the Trustees of Dodge & Cox Funds and Shareholders of Dodge & Cox Balanced Fund
In our opinion, the accompanying statement of assets and liabilities, including the portfolio of investments, and the related statements of operations and of changes in net assets and the financial highlights present fairly, in all material respects, the financial position of Dodge & Cox Balanced Fund (the “Fund”, one of the series constituting Dodge & Cox Funds) at December 31, 2015, the results of its operations for the year then ended, the changes in its net assets for each of the two years in the period then ended and the financial highlights for each of the five years in the period then ended, in conformity with accounting principles generally accepted in the United States of America. These financial statements and financial highlights (hereafter referred to as financial statements) are the responsibility of the Fund’s management. Our responsibility is to express an opinion on these financial statements based on our audits. We conducted our audits of these financial statements in accordance with the standards of the Public Company Accounting Oversight Board (United States). Those standards require that we plan and perform the audit to obtain reasonable assurance about whether the financial statements are free of material misstatement. An audit includes examining, on a test basis, evidence supporting the amounts and disclosures in the financial statements, assessing the accounting principles used and significant estimates made by management, and evaluating the overall financial statement presentation. We believe that our audits, which included confirmation of securities at December 31, 2015, by correspondence with the custodian and brokers, provide a reasonable basis for our opinion.
PricewaterhouseCoopers LLP
San Francisco, California
February 25, 2016
PAGE 18 § DODGE & COX BALANCED FUND
SPECIAL 2015 TAX INFORMATION
(unaudited)
The following information is provided pursuant to provisions of the Internal Revenue Code:
The Fund designates $197,654,566 of its distributions paid to shareholders in 2015 as qualified dividends (treated for federal income tax purposes in the hands of shareholders as taxable at a maximum rate of 20%).
For shareholders that are corporations, the Fund designates 50% of its ordinary dividends paid to shareholders in 2015 as dividends from domestic corporations eligible for the corporate dividends received deduction, provided that the shareholder otherwise satisfies applicable requirements to claim that deduction.
BOARD APPROVAL OF FUNDS’ INVESTMENT MANAGEMENT AGREEMENTS AND MANAGEMENT FEES
(unaudited)
The Board of Trustees is responsible for overseeing the performance of the Dodge & Cox Funds’ investment manager and determining whether to continue the Investment Management Agreements between the Funds and Dodge & Cox each year (the “Agreements”). At a meeting of the Board of Trustees of the Trust held on December 16, 2015, the Trustees, by a unanimous vote (including a separate vote of those Trustees who are not “interested persons” (as defined in the Investment Company Act of 1940) (the “Independent Trustees”)), approved the renewal of the Agreements for an additional one-year term through December 31, 2016 with respect to each Fund. During the course of the year, the Board received a wide variety of materials relating to the investment management and administrative services provided by Dodge & Cox and the performance of each of the Funds.
INFORMATION RECEIVED
In advance of the meeting, the Board, including each of the Independent Trustees, requested, received, and reviewed materials relating to the Agreements and the services provided by Dodge & Cox. The Independent Trustees retained Morningstar® to prepare an independent expense and performance summary for each Fund and comparable funds managed by other advisers identified by Morningstar. The Morningstar materials included information regarding advisory fee rates, expense ratios, and transfer agency, custodial, and distribution expenses, as well as appropriate performance comparisons to each Fund’s peer group and an index or combination of indices. The Morningstar materials also included a comparison of expenses of various share classes offered by comparable funds. The materials reviewed by the Board contained information concerning, among other things, Dodge & Cox’s profitability, financial results and condition, advisory fee revenue, and separate account and sub-adviser fund fee schedules. The Board additionally considered the Funds’ brokerage commissions, turnover rates, sales and redemption data and the significant investment that Dodge & Cox makes in research used in managing the Funds. The Board received and reviewed memoranda and related materials addressing, among
other things, Dodge & Cox’s services to the Funds; how Dodge & Cox Funds’ fees compare to fees of peer group funds; the different fees, services, costs, and risks associated with other accounts managed by Dodge & Cox as compared to the Dodge & Cox Funds; and the ways in which the Funds realize economies of scale. Throughout the process of reviewing the services provided by Dodge & Cox and preparing for the meeting, the Independent Trustees found Dodge & Cox to be open, forthright, detailed, and very helpful in answering questions about all issues. The Board received copies of the Agreements and a memorandum from the independent legal counsel to the Independent Trustees discussing the factors generally regarded as appropriate to consider in evaluating advisory arrangements. The Trust’s Contract Review Committee, consisting solely of Independent Trustees, met with the independent legal counsel on November 11, 2015, and again on December 16, 2015, to discuss whether to renew the Agreements. The Board, including the Independent Trustees, subsequently concluded that the existing Agreements are fair and reasonable and voted to approve the Agreements. In considering the Agreements, the Board, including the Independent Trustees, did not identify any single factor or particular information as all-important or controlling. In reaching the decision to approve the Agreements, the Board considered several factors, discussed below, to be key factors and reached the conclusions described below.
NATURE, QUALITY, AND EXTENT OF THE SERVICES
The Board considered that Dodge & Cox provides a wide range of services to the Funds in addition to portfolio management and that the quality of these services has been excellent in all respects. The extensive nature of services provided by Dodge & Cox has been documented in materials provided to the Board and in presentations made to the Board throughout the year. In particular, the Board considered the nature, quality, and extent of portfolio management, administrative, and shareholder services performed by Dodge & Cox. With regard to portfolio management services, the Board considered Dodge & Cox’s established long-term history of care and conscientiousness in the management of the Funds; its demonstrated consistency in investment approach and depth; the background and experience of the Dodge & Cox Investment Policy Committee, International Investment Policy Committee, Global Stock Investment Policy Committee, Fixed Income Investment Policy Committee, and Global Bond Investment Policy Committee, and research analysts responsible for managing the Funds; its methods for assessing the regulatory and investment climate in various jurisdictions; Dodge & Cox’s overall high level of attention to its core investment management function; and its commitment to the Funds and their shareholders. In the area of administrative and shareholder services, the Board considered the excellent quality of Dodge & Cox’s work in areas such as compliance, legal services, trading, proxy voting, technology, oversight of the Funds’ transfer agent and custodian, tax compliance, and shareholder communication through its website and other means. The Board also noted Dodge & Cox’s diligent disclosure policy, its favorable compliance record, and its reputation as a trusted, shareholder-friendly mutual fund family. In
DODGE & COX BALANCED FUND §PAGE 19
addition, the Board considered that Dodge & Cox manages approximately $185 billion in Fund assets with fewer professionals than most comparable funds, and that on average these professionals have more experience and longer tenure than investment professionals at comparable funds. The Board also noted that Dodge & Cox is an investment research-oriented firm with no other business endeavors to distract management’s attention from its research efforts, and that its investment professionals adhere to a consistent investment approach across the Funds. The Board further considered the favorable stewardship grades given by Morningstar to each of the Funds and the “Gold” analyst rating awarded by Morningstar to all of the Funds except the Global Bond Fund. The Board concluded that it was satisfied with the nature, extent, and quality of investment management and other services provided to the Funds by Dodge & Cox.
INVESTMENT PERFORMANCE
The Board considered short-term and long-term investment performance for each Fund (including periods of outperformance or underperformance) as compared to both relevant indices and the performance of such Fund’s peer group. The Board noted that the Funds had weak absolute and relative performance in 2015, but remained solid performers over longer periods. The Board determined after extensive review and inquiry that Dodge & Cox’s historic, long-term, team-oriented, bottom-up investment approach remains consistent and that Dodge & Cox continues to be distinguished by its integrity, transparency, and independence. The Board considered that the performance of the Funds is the result of a team-oriented investment management process that emphasizes a long-term investment horizon, comprehensive independent research, price discipline, low cost and low portfolio turnover. The Board also considered that the investment performance delivered by Dodge & Cox to the Funds appeared to be consistent with the relevant performance delivered for other clients of Dodge & Cox. The Board concluded that Dodge & Cox has delivered favorable long-term performance for Fund investors consistent with the long-term investment strategies being pursued by the Funds.
COSTS AND ANCILLARY BENEFITS
Costs of Services to Funds: Fees and Expenses. The Board considered each Fund’s management fee rate and expense ratio relative to each Fund’s peer group and relative to management fees charged by Dodge & Cox to other clients. In particular, the Board considered that the Funds continue to be substantially below their peer group median in expense ratios and that many media and industry reports specifically comment on the low expense ratios of the Funds, which have been a defining characteristic of the Funds for many years. The Board also evaluated the operating structures of the Funds and Dodge & Cox, noting that the Funds do not charge front-end sales commissions or distribution fees, and Dodge & Cox bears, among other things, the significant cost of third party research, reimbursement for recordkeeping and administrative costs to third-party retirement plan administrators, and administrative and office overhead.
The Board noted that expenses are well below industry averages. When compared to peer group funds, the Funds are in the quartile with the lowest expense ratios. The Board also considered that the Funds receive numerous administrative, regulatory compliance, legal, technology and shareholder support services from Dodge & Cox without any additional administrative fee and the fact that the Funds have relatively low transaction costs and portfolio turnover rates. The Board noted the Funds’ unusual single-share-class structure and reviewed Morningstar data showing that the few peer group funds with lower expense ratios often have other share classes with significantly higher expense ratios. In this regard, the Board considered that many of the Funds’ shareholders would not be eligible to purchase comparably-priced shares of many peer group funds, which typically make their lower-priced share classes available only to institutional investors. The Board determined that the Funds provide access for small investors to high quality investment management at a relatively low cost.
The Board reviewed information regarding the fee rates Dodge & Cox charges to separate accounts and subadvised funds that have investment programs similar to those of the Funds, including instances where separate account and sub-advised fund fees are lower than Fund fees. The Board considered differences in the nature and scope of services Dodge & Cox provides to the Funds as compared to other client accounts, differences in regulatory, litigation, and other risks as between Dodge & Cox Funds and other types of clients. The Board also noted that different markets exist for mutual fund and institutional separate account management services. With respect to non-U.S. funds sponsored and managed by Dodge & Cox that are comparable to the Funds in many respects, the Board noted that the fee rates charged by Dodge & Cox are the same as or higher than the fee rates charged to the Funds. After consideration of these matters, the Board concluded that the overall costs incurred by the Funds for the services they receive (including the management fee paid to Dodge & Cox) are reasonable and that the fees are acceptable based upon the qualifications, experience, reputation, and performance of Dodge & Cox and the low overall expense ratios of the Funds.
Profitability and Costs of Services to Dodge & Cox; “Fall-out” Benefits. The Board reviewed reports of Dodge & Cox’s financial position, profitability, and estimated overall value, and considered Dodge & Cox’s overall profitability within its context as a private, employee-owned S-Corporation and relative to the favorable services provided. The Board noted in particular that Dodge & Cox’s profits are not generated by high fee rates, but reflect an extraordinarily streamlined, efficient, and focused business approach toward investment management. The Board recognized the importance of Dodge & Cox’s profitability—which is derived solely from management fees and does not include other business ventures—to maintain its independence, stability, company culture and ethics, and management continuity. The Board also considered that the compensation/profit structure at Dodge & Cox includes a return on shareholder employees’ investment in the firm, which is vital for remaining independent and facilitating retention of management and investment professionals. The Board considered independent research
PAGE 20 § DODGE & COX BALANCED FUND
indicating that firms that grow organically, rather than through acquisition, tend to have better performance. Key to organic growth is the ability to retain talented and experienced analysts, portfolio managers and other professionals.
The Board also considered that in January 2015, Dodge & Cox closed the International Stock Fund to new investors to pro-actively manage the growth of the Fund. The Stock Fund and Balanced Fund were similarly closed to new investors during periods of significant growth in the past. While these actions are intended to benefit existing shareholders, the effect is to reduce potential revenues to Dodge & Cox from new shareholders. The Board also considered potential “fall-out” benefits (including the receipt of research from unaffiliated brokers and reputational benefits to non-U.S. funds sponsored and managed by Dodge & Cox) that Dodge & Cox might receive as a result of its association with the Funds and determined that they are acceptable. The Board also noted that Dodge & Cox continues to invest substantial sums in its business in order to provide enhanced services, systems and research capabilities, all of which benefit the Funds. The Board concluded that Dodge & Cox’s profitability is the keystone of its independence, stability and long-term investment performance and that the profitability of Dodge & Cox’s relationship with the Funds (including fall-out benefits) is fair and reasonable.
ECONOMIES OF SCALE
The Board considered whether there have been economies of scale with respect to the management of each Fund, whether the Funds have appropriately benefited from any economies of scale, and whether the management fee rate is reasonable in relation to the Fund assets and any economies of scale that may exist. In the Board’s view, any consideration of economies of scale must take account of the Funds’ low fee structure and the considerable efficiencies of the Funds’ organization and fee structure that has been realized by shareholders from the time of each Fund’s inception (i.e., from the first dollar). An assessment of economies of scale must also take into account that Dodge & Cox invests significant time and resources in each new Fund for months (and sometimes years) prior to launch; in addition, expenses are capped, which means that Dodge & Cox earns no revenue and subsidizes the operations of a new Fund for a period of time until it reaches scale.
In addition, the Board noted that Dodge & Cox has shared economies of scale by adding or enhancing services to the Funds over time, and that the internal costs of providing investment management, up-to-date technology, administrative, legal, and compliance services to the Funds continue to increase. For example, Dodge & Cox has increased its global research staff and investment resources over the years to address the increased complexity of investing in multinational and non-U.S. companies. In addition, Dodge & Cox has made substantial expenditures in other staff, technology, cybersecurity, and infrastructure to enable it to integrate credit and equity analyses and to be able to implement its strategy in a more effective and secure manner. Over the last ten years, Dodge & Cox has increased its spending on third party research, data services, trading systems, technology, and recordkeeping service expenses at a rate that has significantly outpaced the Funds’ growth rate during the same period.
The Board considered that Dodge & Cox has a history of voluntarily limiting asset growth in several Funds that experienced significant inflows by closing them to new investors in order to protect the Funds’ ability to achieve good investment returns for shareholders. The Board also observed that, even without fee breakpoints, the Funds are competitively priced in a very competitive market and that having a low fee from inception is better for shareholders than starting with a higher fee and adding breakpoints. The Board concluded that the current Dodge & Cox fee structure is fair and reasonable and adequately shares economies of scale that may exist.
CONCLUSION
Based on their evaluation of all material factors and assisted by the advice of independent legal counsel to the Independent Trustees, the Board, including the Independent Trustees, concluded that the advisory fee structure was fair and reasonable, that each Fund was paying a competitive fee for the services provided, that the scope and quality of Dodge & Cox’s services has provided substantial value for Fund shareholders over the long term, and that approval of the Agreements was in the best interests of each Fund and its shareholders.
FUND HOLDINGS
The Fund provides a complete list of its holdings four times each fiscal year, as of the end of each quarter. The Fund files the lists with the SEC on Form N-CSR (second and fourth quarters) and Form N-Q (first and third quarters). Shareholders may view the Fund’s Forms N-CSR and N-Q on the SEC’s website at sec.gov. Forms N-CSR and N-Q may also be reviewed and copied at the SEC’s Public Reference Room in Washington, DC. Information regarding the operations of the Public Reference Room may be obtained by calling 202-551-8090 (direct) or 800-732-0330 (general SEC number). A list of the Fund’s quarter-end holdings is also available at dodgeandcox.com on or about 15 days following each quarter end and remains available on the website until the list is updated in the subsequent quarter.
PROXY VOTING
For a free copy of the Fund’s proxy voting policies and procedures, please call 800-621-3979, visit the Fund’s website at dodgeandcox.com, or visit the SEC’s website at sec.gov. Information regarding how the Fund voted proxies relating to portfolio securities during the most recent 12-month period ending June 30 is also available at dodgeandcox.com or at sec.gov.
HOUSEHOLD MAILINGS
The Fund routinely mails shareholder reports and summary prospectuses to shareholders and, on occasion, proxy statements. In order to reduce the volume of mail, when possible, only one copy of these documents will be sent to shareholders who are part of the same family and share the same residential address.
If you have a direct account with the Funds and you do not want the mailing of shareholder reports and summary prospectuses combined with other members in your household, contact the Funds at 800-621-3979. Your request will be implemented within 30 days.
DODGE & COX BALANCED FUND §PAGE 21
THIS PAGE INTENTIONALLY LEFT BLANK
PAGE 22 § DODGE & COX BALANCED FUND
DODGE & COX FUNDS—EXECUTIVE OFFICER & TRUSTEE INFORMATION
| | | | | | |
Name (Age) and
Address* | | Position with Trust (Year of Election or
Appointment) | | Principal Occupation During Past 5 Years | | Other Directorships Held by Trustees |
| INTERESTED TRUSTEES AND EXECUTIVE OFFICERS |
| Charles F. Pohl (57) | | Chairman and Trustee (Officer since 2004) | | Chairman (since 2013), Co-President (2011-2013), Senior Vice President (until 2011), and Director of Dodge & Cox; Chief Investment Officer, Portfolio Manager, Investment Analyst, and member of Investment Policy Committee (IPC), Global Stock Investment Policy Committee (GSIPC), International Investment Policy Committee (IIPC), and Fixed Income Investment Policy Committee (FIIPC) | | — |
| Dana M. Emery (54) | | President and Trustee (Trustee since 1993) | | Chief Executive Officer (since 2013), President (since 2011), Executive Vice President (until 2011), and Director of Dodge & Cox; Director of Fixed Income, Portfolio Manager, and member of FIIPC and Global Bond Investment Policy Committee (GBIPC) | | — |
| John A. Gunn (72) | | Senior Vice President (Officer since 1998) | | Chairman Emeritus (2011-2013), Chairman (until 2011), Chief Executive Officer (until 2010), and Director (until 2013) of Dodge & Cox; Portfolio Manager and member of IPC, GSIPC (until 2014), and IIPC (until 2015) | | — |
| Diana S. Strandberg (56) | | Senior Vice President (Officer since 2006) | | Senior Vice President (since 2011), Vice President (until 2011), and Director (since 2011) of Dodge & Cox; Director of International Equity (since 2009), Portfolio Manager, Investment Analyst, and member of IPC, GSIPC, IIPC, and GBIPC | | — |
| David H. Longhurst (58) | | Treasurer (Officer since 2006) | | Vice President and Assistant Treasurer of Dodge & Cox | | — |
| Thomas M. Mistele (62) | | Secretary (Officer since 1998) | | Chief Operating Officer, Director, Secretary, Senior Counsel (since 2011), and General Counsel (until 2011) of Dodge & Cox | | — |
| Katherine M. Primas (41) | | Chief Compliance Officer (Officer since 2009) | | Vice President (since 2011) and Chief Compliance Officer of Dodge & Cox | | — |
| INDEPENDENT TRUSTEES |
| Thomas A. Larsen (66) | | Trustee (Since 2002) | | Senior Counsel of Arnold & Porter LLP (law firm) (since 2013); Partner of Arnold & Porter LLP (until 2012); Director of Howard, Rice, Nemerovski, Canady, Falk & Rabkin (1977-2011) | | — |
| Ann Mather (55) | | Trustee (Since 2011) | | CFO, Pixar Animation Studios (1999-2004) | | Director, Google, Inc. (internet information services) (since 2005); Director, Glu Mobile, Inc. (multimedia software) (since 2005); Director, Netflix, Inc. (internet television) (since 2010); Director, Arista Networks (cloud networking) (since 2013); Director, Shutterfly, Inc. (internet photography services/publishing) (since 2013) |
| Robert B. Morris III (63) | | Trustee (Since 2011) | | Advisory Director, The Presidio Group (since 2005) | | — |
| Gary Roughead (64) | | Trustee (Since 2013) | | Annenberg Distinguished Visiting Fellow, Hoover Institution (since 2012); Admiral, United States Navy (Ret.); U.S. Navy Chief of Naval Operations (2008-2011) | | Director, Northrop Grumman Corp. (global security) (since 2012) |
| Mark E. Smith (64) | | Trustee (Since 2014) | | Executive Vice President, Managing Director—Fixed Income at Loomis Sayles & Company, L.P. (2003-2011) | | — |
| John B. Taylor (69) | | Trustee (Since 2005) (and 1995-2001) | | Professor of Economics, Stanford University (since 1984); Senior Fellow, Hoover Institution (since 1996); Under Secretary for International Affairs, United States Treasury (2001-2005) | | — |
| * | | The address for each Officer and Trustee is 555 California Street, 40th Floor, San Francisco, California 94104. Each Officer and Trustee oversees all six series in the Dodge & Cox Funds complex and serves for an indefinite term. |
Additional information about the Trust’s Trustees and Officers is available in the Trust’s Statement of Additional Information (SAI). You can get a free copy of the SAI by visiting the Funds’ website at dodgeandcox.com or calling
800-621-3979.
DODGE & COX BALANCED FUND §PAGE 23
dodgeandcox.com
For Fund literature, transactions, and account information, please visit the Funds’ website.
or write or call:
DODGE & COX FUNDS
c/o Boston Financial Data Services
P.O. Box 8422
Boston, Massachusetts 02266-8422
(800) 621-3979
INVESTMENT MANAGER
Dodge & Cox
555 California Street, 40th Floor
San Francisco, California 94104
(415) 981-1710
This report is submitted for the general information of the shareholders of the Fund. The report is not authorized for distribution to prospective investors in the Fund unless it is accompanied by a current prospectus.
This report reflects our views, opinions, and portfolio holdings as of December 31, 2015, the end of the reporting period. Any such views are subject to change at any time based upon market or other conditions and Dodge & Cox disclaims any responsibility to update such views. These views may not be relied on as investment advice and, because investment decisions for a Dodge & Cox Fund are based on numerous factors, may not be relied on as an indication of trading intent on behalf of any Dodge & Cox Fund.
DODGE & COX FUNDS®
Annual Report
December 31, 2015
Income Fund
ESTABLISHED 1989
TICKER: DODIX
12/15 IF AR Printed on recycled paper
TO OUR SHAREHOLDERS
The Dodge & Cox Income Fund had a total return of –0.6% for the year ending December 31, 2015, compared to a total return of 0.6% for the Barclays U.S. Aggregate Bond Index (Barclays U.S. Agg).
MARKET COMMENTARY
The U.S. bond market’s low 2015 return reflected price declines associated with rising U.S. Treasury rates and widening credit yield premiums(a), the combination of which largely offset the relatively low level of income earned over the period. Many of the market themes influencing valuations in 2015 continued from late 2014, including changing expectations regarding U.S. Federal Reserve (Fed) policy, diverging global economic conditions and monetary policy, and concerns about the effect of China’s decelerating economy on the global growth outlook.
The U.S. economy continued to expand moderately in 2015. Highlights included robust labor market gains, a declining unemployment rate (to 5.0% by year end), an uptick in housing market activity, and increases in household and business spending. These factors were offset somewhat by a weak manufacturing sector and lower export demand. Outside the United States, flagging demand in Europe and China contributed to significant commodity price declines, causing many commodity-dependent emerging market economies to suffer.
After much anticipation, the Fed raised the target federal funds rate by 0.25 percentage points in December, marking the first rate increase from the so-called zero lower bound since late 2008. The Fed cited improving U.S. economic data and reiterated its intent to normalize monetary policy gradually. Headline inflation remained quite subdued—well below the Fed’s long-term 2% objective—but core CPI climbed throughout the year. Meanwhile, central bank policymakers elsewhere in the world moved in the opposite direction, easing monetary policies in Europe, China, and Japan as a means of catalyzing growth in those regions.
Investment-grade corporate bonds returned –0.7%(b) for 2015, underperforming comparable-duration(c) Treasuries by 1.6 percentage points in the sector’s poorest relative result since 2011. Almost all of the underperformance occurred in the third quarter, and returns varied dramatically by corporate sub-sector. Financials produced a positive absolute return (+1.5%) as earnings were generally positive and capital and liquidity profiles improved. In contrast, Industrial issuers performed poorly (–1.8% return and underperformance of 2.7 percentage points vs. comparable-duration Treasuries), influenced by heavy new issuance related to record M&A activity in 2015, lower commodity prices, global growth concerns, and higher levels of industrial leverage. Below-investment grade issuers fared even worse for the year (–4.5% return), with the largest declines in lower-rated, commodity-sensitive issuers. Agency-guaranteed(d) mortgage-backed securities (MBS) returned 1.5% for the year, roughly in line with comparable-duration Treasuries. The prepayment environment remained muted throughout most of 2015.
INVESTMENT STRATEGY
2015 was an active year in terms of shifts in the Fund’s positioning, particularly related to the overall size and constituents of the credit portion(e) of the Fund, as much of that market became more attractively priced. We have positioned the Fund with a substantial 46%(f) weighting in corporate bonds, up from 38% at the end of 2014, and a 7% weighting in government-related securities, which includes taxable municipal securities and securities of non-U.S. government entities. Including the Fund’s 1.7% position in Rio Oil (an asset-backed security that we group as a credit investment) brings the Fund’s total credit weighting to 55%, its highest in two years. A 37% allocation to structured products—Agency-guaranteed MBS (at 33%) and more traditional, AAA-rated asset-backed securities (4%)—rounds out the Fund’s non-U.S. Treasury sector exposures. We continued to reduce the Fund’s already-low Treasury weighting (5% at year end, a decline of six percentage points) to add to the Fund’s credit holdings; we also maintained a shorter relative duration position, presently 70% of the Barclays U.S. Agg’s duration.
Most of the increase in the Fund’s credit weighting occurred in the third quarter, as high levels of new issuance in connection with M&A financing provided many interesting investment opportunities. Examples of new or growing positions in the Fund during 2015 included Allergan, Charter Communications, Hewlett Packard Enterprise, and Imperial Tobacco, each of which raised debt to finance transactions. M&A-related debt issuances often result in higher leverage ratios for the issuing entity, and may also be priced attractively (wider yield premiums) at new issue. Much of the recent increase in investment-grade corporate leverage has been concentrated in highly rated issuers willing to incur somewhat higher leverage to implement strategic transactions. While the depth and breadth of our research effort enables us to review nearly every large M&A-related investment-grade new issuance, we are selective in the Fund’s participation in these issues. When evaluating acquisition-related financing, our global industry analyst team develops a view of the strategic rationale for each M&A transaction and compiles a financial forecast assessing deleveraging potential under a range of scenarios. Meanwhile, our fixed income analyst team focuses on the balance sheet and liquidity implications, particularly in downside scenarios. When pricing appears attractive relative to these expectations and we see the potential for the issuer to delever over time, we often find it compelling to invest subsequent to a leveraging event.
In addition, we have recently found opportunities within market sectors experiencing heightened volatility. In 2015, these segments were primarily the commodities sectors and emerging markets, with hardest-hit issuers exposed to both. Our analysis has focused on issuers whose securities appear undervalued relative to credit fundamentals. Our investment team conducts in-depth assessments of the value of an issuer’s assets over a market cycle, as well as its ability to weather a prolonged period of commodity price weakness. This analysis has resulted in new or increased exposures to Cemex, Codelco, Kinder Morgan, and Teck Resources. We have also maintained the Fund’s positions in Petrobras, Rio Oil
PAGE 2 § DODGE & COX INCOME FUND
Finance Trust, and Pemex (all of which underperformed substantially in 2015), based in part on potential downside protection provided by strong government relationships and other sources of financial flexibility.
We continue to have a favorable view of subordinated securities issued by large U.S. and UK banks, where the Fund retains a modest overweight. 2015 presented opportunities to expand this theme to industrial issuers seeking to obtain financing without significant credit ratings degradation. Industrial hybrid securities are subordinated securities that are given partial equity treatment by the rating agencies. During the year we purchased hybrid securities issued by TransCanada, a leading midstream energy company whose stability is supported by the long-term contractual nature of its business, and BHP Billiton, the world’s largest mining company with a strong balance sheet and attractive cost positions in its operations.
We remain constructive on the Fund’s credit holdings, which generally are diversified across market sectors, trade at attractive prices, and have issuers with financial flexibility to weather the current challenged environment. While we recognize that recent increases in corporate leverage and shareholder remuneration could result in weaker credit profiles, we believe that the U.S. economy remains healthy, default rates remain low and fairly concentrated in lower-rated, commodity-related issuers, and valuations provide sufficient compensation for the current risks.
Turning to the Fund’s Agency MBS, currently a 33% weighting, we shifted both the weighting (between 33% and 36%) and the mix of underlying holdings throughout the year in response to changing valuations. For example, we trimmed the Fund’s CMO floaters, whose valuations became fuller, in favor of MBS with more attractive long-term total return potential (e.g., pre-reset hybrid ARM MBS, 15- and 30-year premium MBS). We also sold a portion of shorter-duration MBS and AAA-rated ABS to purchase relatively more attractive corporate bonds. We continue to view the Fund’s MBS favorably in terms of their ability to generate regular income, provide an important source of liquidity, and add an element of defensiveness in a volatile market environment for credit markets. Indeed, they were important contributors to the Fund’s 2015 return.
With respect to interest rate risk, we believe it is prudent to mitigate the effect of price declines associated with potentially rising interest rates through a shorter relative Fund duration. We see a clear disconnect between the slow pace of rate increases implied by current U.S. Treasury valuations and the faster pace expected by Fed policymakers, particularly in the context of a modestly expanding economy (more than 2% growth is expected over the next several years) and an inflation rate likely to rise as energy and import prices stabilize. It is our view that interest rates will rise more quickly than the levels implied by the market’s very modest expectations.
IN CLOSING
The Fund’s recent relative performance has been disappointing. The headwind of a weak credit sector since mid-2014 has been the primary factor behind this underperformance. While we are not
pleased with these returns, we remain confident in our investment strategy and process. We have navigated challenging environments in the past, and have used these environments to find attractive long-term investment opportunities at compelling valuations. Furthermore, we believe that the current environment suits us well, given our long-term orientation and focus on finding undervalued securities through a robust research process. We remain optimistic about the Fund’s long-term relative return prospects. However, given starting yields, we believe near-term absolute returns will be modest at best.
Thank you for your continued confidence in our firm. As always, we welcome your comments and questions.
For the Board of Trustees,
| | |
| |
|
Charles F. Pohl, Chairman | | Dana M. Emery, President |
January 29, 2016
| (a) | | Yield premiums are one way to measure a security’s valuation. Narrowing yield premiums result in a higher valuation. Widening yield premiums result in a lower valuation. |
| (b) | | Sector returns as calculated and reported by Barclays. |
| (c) | | Duration is a measure of a bond’s (or a bond portfolio’s) price sensitivity to changes in interest rates. |
| (d) | | The U.S. Government does not guarantee the Fund’s shares, yield, or net asset value. The agency guarantee (by, for example, Ginnie Mae, Fannie Mae, or Freddie Mac) does not eliminate market risk. |
| (e) | | Credit securities refers to corporate bonds and government-related securities, as classified by Barclays. |
| (f) | | Unless otherwise specified, all weightings and characteristics are as of December 31, 2015. |
DODGE & COX INCOME FUND §PAGE 3
ANNUAL PERFORMANCE REVIEW
The Fund underperformed the Barclays U.S. Agg by 1.2 percentage points in 2015.
Key Detractors from Relative Results
| | § | | Certain emerging market-related credit holdings underperformed for the year, including Pemex, Petrobras, and Rio Oil Finance Trust. | |
| | § | | The Fund’s overweight to the Industrial sub-sector (23% versus 14% for the Barclays U.S. Agg) and underweight to U.S. Treasuries (11% versus 36% for the Barclays U.S. Agg) detracted from relative returns. | |
| | § | | Corporate security selection was slightly negative; numerous industrial issuers performed poorly, including Cemex, Cox Communications, Kinder Morgan, Macy’s, and Teck Resources. | |
Key Contributors to Relative Results
| | § | | The Fund’s shorter relative duration (approximately 70% of the Barclays U.S. Agg’s duration) added to relative returns. | |
| | § | | The Fund’s Agency MBS holdings outperformed the MBS in the Barclays U.S. Agg after adjusting for duration differences. | |
| | § | | The Fund’s nominal yield advantage benefited returns. | |
| | | | Unless otherwise noted, figures cited in this section denote Fund positioning at the beginning of the period. | |
KEY CHARACTERISTICS OF DODGE & COX
Independent Organization
Dodge & Cox is one of the largest privately owned investment managers in the world. We remain committed to independence, with a goal of providing the highest quality investment management service to our existing clients.
Over 85 Years of Investment Experience
Dodge & Cox was founded in 1930. We have a stable and well-qualified team of investment professionals, most of whom have spent their entire careers at Dodge & Cox.
Experienced Investment Team
The Fixed Income Investment Policy Committee, which is the decision-making body for the Income Fund, is an eight-member committee with an average tenure at Dodge & Cox of 20 years.
One Business with a Single Research Office
Dodge & Cox manages equity (domestic, international, and global), fixed income (domestic and global), and balanced investments, operating from one office in San Francisco.
Consistent Investment Approach
Our team decision-making process involves thorough, bottom-up fundamental analysis of each investment.
Long-Term Focus and Low Expenses
We invest with a three- to five-year investment horizon, which has historically resulted in low turnover relative to our peers. We manage Funds that maintain low expense ratios.
Risks: The Fund invests in individual bonds whose yields and market values fluctuate, so that an investment may be worth more or less than its original cost. Debt securities are subject to interest rate risk, credit risk, and prepayment and call risk, all of which could have adverse effects on the value of the Fund. A low interest rate environment creates an elevated risk of future negative returns. Financial intermediaries may restrict their market making activities for certain debt securities, which may reduce the liquidity and increase the volatility of such securities. Please read the prospectus and summary prospectus for specific details regarding the Fund’s risk profile.
PAGE 4 § DODGE & COX INCOME FUND
GROWTH OF $10,000 OVER 10 YEARS
FOR AN INVESTMENT MADE ON DECEMBER 31, 2005
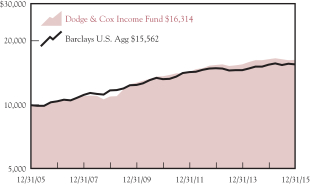
AVERAGE ANNUAL TOTAL RETURN
FOR PERIODS ENDED DECEMBER 31, 2015
| | | | | | | | | | | | | | | | |
| | | 1 Year | | | 5 Years | | | 10 Years | | | 20 Years | |
| | | | | | | | | | | | | | | | |
Dodge & Cox Income Fund | | | –0.59 | % | | | 3.60 | % | | | 5.02 | % | | | 5.68 | % |
Barclays U.S. Aggregate Bond Index (Barclays U.S. Agg) | | | 0.57 | | | | 3.26 | | | | 4.52 | | | | 5.34 | |
Returns represent past performance and do not guarantee future results. Investment return and share price will fluctuate with market conditions, and investors may have a gain or loss when shares are sold. Fund performance changes over time and currently may be significantly lower than stated. Performance is updated and published monthly. Visit the Fund’s website at dodgeandcox.com or call 800-621-3979 for current performance figures.
The Fund’s total returns include the reinvestment of dividend and capital gain distributions, but have not been adjusted for any income taxes payable by shareholders on these distributions or on Fund share redemptions. Index returns include interest income but, unlike Fund returns, do not reflect fees or expenses. The Barclays U.S. Aggregate Bond Index (Barclays U.S. Agg) is a widely recognized, unmanaged index of U.S. dollar-denominated, investment-grade, taxable debt securities.
Barclays® is a trademark of Barclays Bank PLC.
FUND EXPENSE EXAMPLE
As a Fund shareholder, you incur ongoing Fund costs, including management fees and other Fund expenses. All mutual funds have ongoing costs, sometimes referred to as operating expenses. The following example shows ongoing costs of investing in the Fund and can help you understand these costs and compare them with those of other mutual funds. The example assumes a $1,000 investment held for the six months indicated.
ACTUAL EXPENSES
The first line of the table below provides information about actual account values and expenses based on the Fund’s actual returns. You may use the information in this line, together with your account balance, to estimate the expenses that you paid over the period. Simply divide your account value by $1,000 (for example, an $8,600 account value divided by $1,000 = 8.6), then multiply the result by the number in the first line under the heading “Expenses Paid During Period” to estimate the expenses you paid on your account during this period.
HYPOTHETICAL EXAMPLE FOR COMPARISON WITH OTHER MUTUAL FUNDS
Information on the second line of the table can help you compare ongoing costs of investing in the Fund with those of other mutual funds. This information may not be used to estimate the actual ending account balance or expenses you paid during the period. The hypothetical “Ending Account Value” is based on the actual expense ratio of the Fund and an assumed 5% annual rate of return before expenses (not the Fund’s actual return). The amount under the heading “Expenses Paid During Period” shows the hypothetical expenses your account would have incurred under this scenario. You can compare this figure with the 5% hypothetical examples that appear in shareholder reports of other mutual funds.
| | | | | | | | | | | | |
Six Months Ended December 31, 2015 | | Beginning Account Value
7/1/2015 | | | Ending Account Value
12/31/2015 | | | Expenses Paid
During Period* | |
Based on Actual Fund Return | | $ | 1,000.00 | | | $ | 993.20 | | | $ | 2.14 | |
Based on Hypothetical 5% Yearly Return | | | 1,000.00 | | | | 1,023.06 | | | | 2.17 | |
| * | | Expenses are equal to the Fund’s annualized expense ratio of 0.43%, multiplied by the average account value over the period, multiplied by 184/365 (to reflect the one-half year period). |
The expenses shown in the table highlight ongoing costs only and do not reflect any transactional fees or account maintenance fees. Though other mutual funds may charge such fees, please note that the Fund does not charge transaction fees (e.g., redemption fees, sales loads) or universal account maintenance fees (e.g., small account fees).
DODGE & COX INCOME FUND §PAGE 5
| | | | |
| FUND INFORMATION (unaudited) | | | December 31, 2015 | |
| | | | |
| GENERAL INFORMATION | | | |
Net Asset Value Per Share | | | $13.29 | |
Total Net Assets (billions) | | | $43.1 | |
30-Day SEC Yield(a) | | | 3.47% | |
2014 Expense Ratio (per 5/1/15 Prospectus) | | | 0.44% | |
2015 Expense Ratio | | | 0.43% | |
Portfolio Turnover Rate | | | 24% | |
Number of Credit Issuers | | | 67 | |
Fund Inception | | | 1989 | |
No sales charges or distribution fees | | | | |
Investment Manager: Dodge & Cox, San Francisco. Managed by the Fixed Income Investment Policy Committee, whose eight members’ average tenure at Dodge & Cox is 20 years.
| | | | | | | | |
| PORTFOLIO CHARACTERISTICS | | Fund | | | Barclays
U.S. Agg | |
Effective Duration (years) | | | 4.0 | | | | 5.7 | |
| | | | |
| FIVE LARGEST CREDIT ISSUERS (%)(b) | | Fund | |
State of California GO | | | 2.2 | |
Bank of America Corp. | | | 2.0 | |
Verizon Communications, Inc. | | | 2.0 | |
Kinder Morgan, Inc. | | | 1.9 | |
Cox Enterprises, Inc. | | | 1.8 | |
| | | | | | | | |
| CREDIT QUALITY (%)(c) | | Fund | | | Barclays
U.S. Agg | |
U.S. Treasury/Agency/GSE(d) | | | 38.0 | | | | 68.0 | |
Aaa | | | 4.0 | | | | 4.8 | |
Aa | | | 3.1 | | | | 3.5 | |
A | | | 5.1 | | | | 10.5 | |
Baa | | | 35.9 | | | | 13.2 | |
Ba | | | 8.9 | | | | 0.0 | |
B | | | 2.1 | | | | 0.0 | |
Caa | | | 0.0 | (g) | | | 0.0 | |
Cash Equivalents | | | 2.9 | | | | 0.0 | |
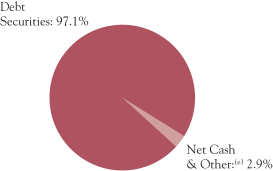
| | | | | | | | |
| SECTOR DIVERSIFICATION (%) | | Fund | | | Barclays
U.S. Agg | |
U.S. Treasury(d) | | | 5.0 | | | | 36.4 | |
Government-Related | | | 7.4 | | | | 8.2 | |
Mortgage-Related(f) | | | 32.7 | | | | 28.6 | |
Corporate | | | 46.3 | | | | 24.3 | |
Asset-Backed/Commercial Mortgage-Backed | | | 5.7 | | | | 2.5 | |
Cash Equivalents | | | 2.9 | | | | 0.0 | |
| | | | | | | | |
| MATURITY DIVERSIFICATION (%)(d) | | Fund | | | Barclays
U.S. Agg | |
0-1 Years to Maturity | | | 4.5 | | | | 0.0 | |
1-5 | | | 45.9 | | | | 42.7 | |
5-10 | | | 28.9 | | | | 42.3 | |
10-15 | | | 2.6 | | | | 2.2 | |
15-20 | | | 4.5 | | | | 1.6 | |
20-25 | | | 8.8 | | | | 3.7 | |
25 and Over | | | 4.8 | | | | 7.5 | |
| (a) | SEC Yield is an annualization of the Fund’s total net investment income per share for the 30-day period ended on the last day of the month. |
| (b) | The Fund’s portfolio holdings are subject to change without notice. The mention of specific securities is not a recommendation to buy, sell, or hold any particular security and is not indicative of Dodge & Cox’s current or future trading activity. |
| (c) | The credit quality distributions shown for the Fund and the Index are based on the middle of Moody’s, S&P’s, and Fitch ratings, which is the methodology used by Barclays in constructing its indices. If a security is rated by only two agencies, the lower of the two ratings is used. Please note the Fund applies the highest of Moody’s, S&P’s, and Fitch ratings to determine compliance with the quality requirements stated in its prospectus. On that basis, the Fund held 6.4% in securities rated below investment grade. The credit quality of the investments in the portfolio does not apply to the stability or safety of the Fund or its shares. |
| (d) | Data as presented excludes the Fund’s position in Treasury futures contracts. |
| (e) | Net Cash & Other includes short-term investments (e.g., money market funds and repurchase agreements) and other assets less liabilities (e.g., cash, receivables, payables, and unrealized appreciation/depreciation on certain derivatives). |
| (f) | The Fund holds 0.4% in Agency multifamily mortgage securities; the Index classifies these securities under CMBS – Agency. |
PAGE 6 § DODGE & COX INCOME FUND
| | | | |
| PORTFOLIO OF INVESTMENTS | | | December 31, 2015 | |
| | | | | | | | |
| DEBT SECURITIES: 97.1% | | | | | | |
| | |
| | | PAR VALUE | | | VALUE | |
| U.S. TREASURY: 5.0% | | | | | | | | |
U.S. Treasury Note/Bond | | | | | | | | |
1.50%, 8/31/18 | | $ | 250,000,000 | | | $ | 251,701,500 | |
0.875%, 10/15/18 | | | 300,000,000 | | | | 296,724,300 | |
1.50%, 2/28/19 | | | 496,995,000 | | | | 498,648,999 | |
1.625%, 7/31/19 | | | 600,000,000 | | | | 602,200,800 | |
1.625%, 12/31/19 | | | 500,000,000 | | | | 500,125,500 | |
| | | | | | | | |
| | | | 2,149,401,099 | |
| GOVERNMENT-RELATED: 7.4% | | | | | |
FEDERAL AGENCY: 0.3% | | | | | | | | |
Small Business Admin. — 504 Program | | | | | | | | |
Series 1997-20E 1, 7.30%, 5/1/17 | | | 24,882 | | | | 25,648 | |
Series 1997-20H 1, 6.80%, 8/1/17 | | | 7,796 | | | | 7,948 | |
Series 1997-20J 1, 6.55%, 10/1/17 | | | 111,816 | | | | 114,405 | |
Series 1997-20L 1, 6.55%, 12/1/17 | | | 5,005 | | | | 5,124 | |
Series 1998-20B 1, 6.15%, 2/1/18 | | | 13,525 | | | | 14,154 | |
Series 1998-20C 1, 6.35%, 3/1/18 | | | 435,206 | | | | 457,822 | |
Series 1998-20H 1, 6.15%, 8/1/18 | | | 233,918 | | | | 246,212 | |
Series 1998-20L 1, 5.80%, 12/1/18 | | | 132,203 | | | | 138,410 | |
Series 1999-20C 1, 6.30%, 3/1/19 | | | 129,925 | | | | 134,730 | |
Series 1999-20E 1, 6.30%, 5/1/19 | | | 3,584 | | | | 3,716 | |
Series 1999-20G 1, 7.00%, 7/1/19 | | | 243,730 | | | | 253,446 | |
Series 1999-20I 1, 7.30%, 9/1/19 | | | 119,298 | | | | 124,182 | |
Series 2000-20C 1, 7.625%, 3/1/20 | | | 7,298 | | | | 7,742 | |
Series 2000-20G 1, 7.39%, 7/1/20 | | | 4,441 | | | | 4,699 | |
Series 2001-20G 1, 6.625%, 7/1/21 | | | 969,601 | | | | 1,053,103 | |
Series 2001-20L 1, 5.78%, 12/1/21 | | | 2,904,898 | | | | 3,095,072 | |
Series 2002-20A 1, 6.14%, 1/1/22 | | | 22,348 | | | | 24,155 | |
Series 2002-20L 1, 5.10%, 12/1/22 | | | 862,659 | | | | 920,246 | |
Series 2003-20G 1, 4.35%, 7/1/23 | | | 56,562 | | | | 59,378 | |
Series 2004-20L 1, 4.87%, 12/1/24 | | | 1,296,779 | | | | 1,382,839 | |
Series 2005-20B 1, 4.625%, 2/1/25 | | | 2,367,752 | | | | 2,506,263 | |
Series 2005-20D 1, 5.11%, 4/1/25 | | | 107,053 | | | | 115,828 | |
Series 2005-20E 1, 4.84%, 5/1/25 | | | 3,977,227 | | | | 4,232,604 | |
Series 2005-20G 1, 4.75%, 7/1/25 | | | 4,005,706 | | | | 4,250,920 | |
Series 2005-20H 1, 5.11%, 8/1/25 | | | 52,810 | | | | 56,941 | |
Series 2005-20I 1, 4.76%, 9/1/25 | | | 4,980,293 | | | | 5,292,317 | |
Series 2006-20A 1, 5.21%, 1/1/26 | | | 4,938,826 | | | | 5,324,703 | |
Series 2006-20B 1, 5.35%, 2/1/26 | | | 1,525,995 | | | | 1,657,611 | |
Series 2006-20C 1, 5.57%, 3/1/26 | | | 7,182,729 | | | | 7,854,678 | |
Series 2006-20G 1, 6.07%, 7/1/26 | | | 13,100,376 | | | | 14,647,576 | |
Series 2006-20H 1, 5.70%, 8/1/26 | | | 114,131 | | | | 126,308 | |
Series 2006-20I 1, 5.54%, 9/1/26 | | | 240,274 | | | | 262,899 | |
Series 2006-20J 1, 5.37%, 10/1/26 | | | 4,518,289 | | | | 4,923,048 | |
Series 2006-20L 1, 5.12%, 12/1/26 | | | 3,545,363 | | | | 3,843,033 | |
Series 2007-20A 1, 5.32%, 1/1/27 | | | 8,657,970 | | | | 9,545,779 | |
Series 2007-20C 1, 5.23%, 3/1/27 | | | 13,297,620 | | | | 14,590,409 | |
Series 2007-20D 1, 5.32%, 4/1/27 | | | 13,335,560 | | | | 14,689,595 | |
Series 2007-20G 1, 5.82%, 7/1/27 | | | 9,282,355 | | | | 10,459,094 | |
| | | | | | | | |
| | | | 112,452,637 | |
FOREIGN AGENCY: 2.3% | | | | | | | | |
Corp. Nacional del Cobre de Chile(c) (Chile)
4.50%, 9/16/25(b) | | | 122,575,000 | | | | 115,425,936 | |
Petroleo Brasileiro SA(c) (Brazil) | | | | | | | | |
5.75%, 1/20/20 | | | 43,955,000 | | | | 34,504,675 | |
5.375%, 1/27/21 | | | 187,220,000 | | | | 139,478,900 | |
4.375%, 5/20/23 | | | 38,625,000 | | | | 25,492,500 | |
6.25%, 3/17/24 | | | 80,805,000 | | | | 57,977,587 | |
Petroleos Mexicanos(c) (Mexico) | | | | | | | | |
4.875%, 1/18/24 | | | 123,065,000 | | | | 114,758,112 | |
4.25%, 1/15/25(b) | | | 97,765,000 | | | | 85,544,375 | |
4.50%, 1/23/26(b) | | | 15,065,000 | | | | 13,234,603 | |
6.625%, 6/15/35 | | | 102,290,000 | | | | 91,421,687 | |
5.50%, 6/27/44 | | | 5,900,000 | | | | 4,438,806 | |
5.50%, 6/27/44(b) | | | 36,075,000 | | | | 27,140,666 | |
6.375%, 1/23/45 | | | 149,875,000 | | | | 127,358,979 | |
5.625%, 1/23/46(b) | | | 190,720,000 | | | | 145,938,944 | |
| | | | | | | | |
| | | | 982,715,770 | |
| | | | | | | | |
| | |
| | | PAR VALUE | | | VALUE | |
LOCAL AUTHORITY: 4.7% | | | | | | | | |
L.A. Unified School District GO | | | | | | | | |
5.75%, 7/1/34 | | $ | 6,075,000 | | | $ | 7,313,146 | |
6.758%, 7/1/34 | | | 185,585,000 | | | | 244,530,508 | |
New Jersey Turnpike Authority RB | | | | | | | | |
7.414%, 1/1/40 | | | 41,065,000 | | | | 58,322,566 | |
7.102%, 1/1/41 | | | 148,277,000 | | | | 203,800,805 | |
New Valley Generation
4.929%, 1/15/21 | | | 340,287 | | | | 368,052 | |
State of California GO | | | | | | | | |
7.50%, 4/1/34 | | | 203,021,000 | | | | 283,289,413 | |
7.55%, 4/1/39 | | | 200,880,000 | | | | 291,780,209 | |
7.30%, 10/1/39 | | | 116,735,000 | | | | 163,381,138 | |
7.625%, 3/1/40 | | | 103,410,000 | | | | 150,592,881 | |
7.60%, 11/1/40 | | | 56,435,000 | | | | 83,763,649 | |
State of Illinois GO | | | | | | | | |
4.961%, 3/1/16 | | | 40,560,000 | | | | 40,811,066 | |
5.365%, 3/1/17 | | | 196,360,000 | | | | 203,650,847 | |
5.665%, 3/1/18 | | | 173,675,000 | | | | 183,895,774 | |
5.10%, 6/1/33 | | | 124,455,000 | | | | 117,690,871 | |
| | | | | | | | |
| | | | 2,033,190,925 | |
SOVEREIGN: 0.1% | | | | | | | | |
Spain Government International (c) (Spain)
4.00%, 3/6/18(b) | | | 55,790,000 | | | | 58,193,545 | |
| | | | | | | | |
| | | | 3,186,552,877 | |
| MORTGAGE-RELATED: 32.7% | |
FEDERAL AGENCY CMO & REMIC: 3.2% | |
Dept. of Veterans Affairs | | | | | | | | |
Series 1995-2D 4A, 9.293%, 5/15/25 | | | 145,506 | | | | 178,423 | |
Series 1997-2 Z, 7.50%, 6/15/27 | | | 9,751,483 | | | | 11,003,619 | |
Series 1998-2 2A, 8.693%, 8/15/27 | | | 38,255 | | | | 44,805 | |
Series 1998-1 1A, 8.209%, 3/15/28 | | | 219,820 | | | | 254,336 | |
Fannie Mae | | | | | | | | |
Trust 1998-58 PX, 6.50%, 9/25/28 | | | 427,092 | | | | 470,195 | |
Trust 1998-58 PC, 6.50%, 10/25/28 | | | 2,310,178 | | | | 2,574,165 | |
Trust 2001-69 PQ, 6.00%, 12/25/31 | | | 2,667,209 | | | | 3,002,085 | |
Trust 2002-33 A1, 7.00%, 6/25/32 | | | 2,513,867 | | | | 2,816,246 | |
Trust 2002-69 Z, 5.50%, 10/25/32 | | | 315,970 | | | | 352,984 | |
Trust 2008-24 GD, 6.50%, 3/25/37 | | | 2,424,010 | | | | 2,684,804 | |
Trust 2007-47 PE, 5.00%, 5/25/37 | | | 6,239,945 | | | | 6,692,835 | |
Trust 2009-30 AG, 6.50%, 5/25/39 | | | 14,068,493 | | | | 15,237,184 | |
Trust 2009-53 QM, 5.50%, 5/25/39 | | | 3,437,366 | | | | 3,685,011 | |
Trust 2009-40 TB, 6.00%, 6/25/39 | | | 6,494,274 | | | | 7,204,096 | |
Trust 2001-T3 A1, 7.50%, 11/25/40 | | | 134,874 | | | | 157,013 | |
Trust 2010-123 WT, 7.00%, 11/25/40 | | | 52,894,063 | | | | 61,029,609 | |
Trust 2001-T7 A1, 7.50%, 2/25/41 | | | 88,383 | | | | 103,282 | |
Trust 2001-T5 A2, 6.989%, 6/19/41 | | | 51,853 | | | | 58,242 | |
Trust 2001-T5 A3, 7.50%, 6/19/41 | | | 260,737 | | | | 310,032 | |
Trust 2001-T4 A1, 7.50%, 7/25/41 | | | 2,401,671 | | | | 2,839,952 | |
Trust 2011-58 AT, 4.00%, 7/25/41 | | | 12,743,491 | | | | 13,223,814 | |
Trust 2001-T10 A1, 7.00%, 12/25/41 | | | 2,710,771 | | | | 3,179,728 | |
Trust 2013-106 MA, 4.00%, 2/25/42 | | | 25,970,249 | | | | 27,496,113 | |
Trust 2002-90 A1, 6.50%, 6/25/42 | | | 5,514,942 | | | | 6,244,734 | |
Trust 2002-W6 2A1, 6.321%, 6/25/42 | | | 3,148,434 | | | | 3,665,612 | |
Trust 2002-W8 A2, 7.00%, 6/25/42 | | | 1,841,433 | | | | 2,098,061 | |
Trust 2002-T16 A3, 7.50%, 7/25/42 | | | 3,993,802 | | | | 4,623,202 | |
Trust 2003-W2 1A2, 7.00%, 7/25/42 | | | 8,407,371 | | | | 9,762,673 | |
Trust 2003-W4 3A, 6.561%, 10/25/42 | | | 2,514,950 | | | | 2,839,493 | |
Trust 2012-121 NB, 7.00%, 11/25/42 | | | 1,687,780 | | | | 1,946,294 | |
Trust 2003-7 A1, 6.50%, 12/25/42 | | | 4,454,329 | | | | 5,119,161 | |
Trust 2003-W1 2A, 6.392%, 12/25/42 | | | 3,240,697 | | | | 3,729,835 | |
Trust 2012-133 HF, 0.772%, 12/25/42 | | | 51,002,673 | | | | 51,201,890 | |
Trust 2012-134 FD, 0.772%, 12/25/42 | | | 1,374,965 | | | | 1,379,725 | |
Trust 2012-134 FT, 0.772%, 12/25/42 | | | 72,211,974 | | | | 72,106,321 | |
Trust 2013-98 FA, 0.972%, 9/25/43 | | | 48,863,321 | | | | 49,434,113 | |
Trust 2013-101 CF, 1.022%, 10/25/43 | | | 24,492,837 | | | | 24,719,741 | |
| | |
| See accompanying Notes to Financial Statements | | DODGE & COX INCOME FUND §PAGE 7 |
| | | | |
| PORTFOLIO OF INVESTMENTS | | | December 31, 2015 | |
| | | | | | | | |
| DEBT SECURITIES (continued) | | | | | | |
| | |
| | | PAR VALUE | | | VALUE | |
Trust 2013-101 FE, 1.022%, 10/25/43 | | $ | 39,072,948 | | | $ | 39,463,822 | |
Trust 2004-T1 1A2, 6.50%, 1/25/44 | | | 2,811,476 | | | | 3,138,873 | |
Trust 2004-W2 2A2, 7.00%, 2/25/44 | | | 147,903 | | | | 167,997 | |
Trust 2004-W2 5A, 7.50%, 3/25/44 | | | 6,824,597 | | | | 7,781,906 | |
Trust 2004-W8 3A, 7.50%, 6/25/44 | | | 5,139,443 | | | | 5,979,654 | |
Trust 2004-W14 1AF, 0.822%, 7/25/44 | | | 1,939,751 | | | | 1,912,776 | |
Trust 2004-W15 1A2, 6.50%, 8/25/44 | | | 1,115,003 | | | | 1,231,412 | |
Trust 2005-W1 1A3, 7.00%, 10/25/44 | | | 7,357,811 | | | | 8,387,652 | |
Trust 2001-79 BA, 7.00%, 3/25/45 | | | 873,791 | | | | 993,601 | |
Trust 2006-W1 1A1, 6.50%, 12/25/45 | | | 554,568 | | | | 623,322 | |
Trust 2006-W1 1A2, 7.00%, 12/25/45 | | | 4,066,186 | | | | 4,692,731 | |
Trust 2006-W1 1A3, 7.50%, 12/25/45 | | | 71,084 | | | | 82,100 | |
Trust 2006-W1 1A4, 8.00%, 12/25/45 | | | 4,652,779 | | | | 5,531,068 | |
Trust 2007-W10 1A, 6.315%, 8/25/47 | | | 18,269,753 | | | | 20,456,277 | |
Trust 2007-W10 2A, 6.324%, 8/25/47 | | | 5,244,232 | | | | 5,860,933 | |
Freddie Mac | | | | | | | | |
Series 2456 CJ, 6.50%, 6/15/32 | | | 234,421 | | | | 264,277 | |
Series 3312 AB, 6.50%, 6/15/32 | | | 4,450,335 | | | | 4,990,524 | |
Series T-41 2A, 5.812%, 7/25/32 | | | 311,554 | | | | 356,568 | |
Series 2587 ZU, 5.50%, 3/15/33 | | | 7,177,250 | | | | 8,051,584 | |
Series 2610 UA, 4.00%, 5/15/33 | | | 2,603,484 | | | | 2,704,708 | |
Series T-48 1A, 5.464%, 7/25/33 | | | 3,219,620 | | | | 3,718,306 | |
Series 2708 ZD, 5.50%, 11/15/33 | | | 27,253,897 | | | | 30,214,335 | |
Series 3204 ZM, 5.00%, 8/15/34 | | | 9,717,783 | | | | 10,873,964 | |
Series 3330 GZ, 5.50%, 6/15/37 | | | 6,364,269 | | | | 6,877,120 | |
Series 4091 JF, 0.831%, 6/15/41 | | | 34,928,663 | | | | 35,113,949 | |
Series 4120 YF, 0.681%, 10/15/42 | | | 77,374,187 | | | | 77,742,944 | |
Series 309 F4, 0.861%, 8/15/43 | | | 87,134,952 | | | | 86,077,522 | |
Series 311 F1, 0.881%, 8/15/43 | | | 113,397,893 | | | | 112,025,953 | |
Series T-51 1A, 6.50%, 9/25/43 | | | 72,786 | | | | 84,802 | |
Series 4281 BC, 4.786%, 12/15/43 | | | 209,428,788 | | | | 225,958,898 | |
Series 4283 DW, 4.831%, 12/15/43 | | | 126,715,000 | | | | 137,843,656 | |
Series 4283 EW, 4.683%, 12/15/43 | | | 77,420,658 | | | | 83,955,984 | |
Series 4310 FA, 0.881%, 2/15/44 | | | 3,047,562 | | | | 3,047,548 | |
Series 4319 MA, 5.026%, 3/15/44 | | | 38,337,000 | | | | 42,060,665 | |
| | | | | | | | |
| | | | 1,381,736,859 | |
FEDERAL AGENCY MORTGAGE PASS-THROUGH: 29.5% | |
Fannie Mae, 10 Year
6.00%, 11/1/16 | | | 246,089 | | | | 248,714 | |
Fannie Mae, 15 Year | | | | | | | | |
3.50%, 8/1/26-12/1/29 | | | 800,843,886 | | | | 839,998,715 | |
4.00%, 9/1/25-5/1/29 | | | 210,720,621 | | | | 223,409,135 | |
4.50%, 3/1/29 | | | 47,030,431 | | | | 50,546,304 | |
5.00%, 9/1/25 | | | 75,564,467 | | | | 81,350,479 | |
5.50%, 1/1/18-7/1/25 | | | 205,240,634 | | | | 222,454,729 | |
6.00%, 7/1/16-3/1/23 | | | 71,990,929 | | | | 77,317,094 | |
6.50%, 5/1/16-12/1/19 | | | 5,198,921 | | | | 5,320,478 | |
7.00%, 11/1/17 | | | 6,149 | | | | 6,253 | |
7.50%, 8/1/17 | | | 70,340 | | | | 71,379 | |
Fannie Mae, 20 Year | | | | | | | | |
4.00%, 9/1/30-7/1/35 | | | 2,587,757,122 | | | | 2,767,465,569 | |
4.50%, 3/1/29-1/1/34 | | | 736,111,213 | | | | 798,572,337 | |
Fannie Mae, 30 Year | | | | | | | | |
4.50%, 6/1/36-2/1/45 | | | 913,899,731 | | | | 991,081,657 | |
5.00%, 7/1/37 | | | 16,645,776 | | | | 18,388,688 | |
5.50%, 2/1/33-11/1/39 | | | 274,213,435 | | | | 308,216,177 | |
6.00%, 11/1/28-2/1/39 | | | 179,729,016 | | | | 204,911,049 | |
6.50%, 12/1/32-8/1/39 | | | 77,343,880 | | | | 89,196,415 | |
7.00%, 4/1/32-2/1/39 | | | 111,585,383 | | | | 129,145,893 | |
Fannie Mae, 40 Year
4.50%, 1/1/52 | | | 14,324,834 | | | | 15,340,512 | |
Fannie Mae, Hybrid ARM | | | | | | | | |
1.881%, 8/1/34 | | | 2,306,487 | | | | 2,402,074 | |
1.884%, 6/1/43 | | | 6,412,433 | | | | 6,554,808 | |
1.956%, 9/1/43 | | | 14,541,908 | | | | 14,906,264 | |
1.991%, 1/1/35 | | | 3,526,501 | | | | 3,687,578 | |
| | | | | | | | |
| | |
| | | PAR VALUE | | | VALUE | |
2.008%, 4/1/35 | | $ | 4,272,020 | | | $ | 4,496,576 | |
2.07%, 11/1/35 | | | 2,670,407 | | | | 2,790,372 | |
2.128%, 4/1/44 | | | 84,904,636 | | | | 87,949,868 | |
2.169%, 7/1/35 | | | 1,672,315 | | | | 1,767,239 | |
2.17%, 8/1/35 | | | 2,592,642 | | | | 2,735,746 | |
2.191%, 10/1/34 | | | 2,669,567 | | | | 2,799,698 | |
2.194%, 7/1/35 | | | 1,978,426 | | | | 2,088,827 | |
2.214%, 8/1/35 | | | 8,755,321 | | | | 9,224,085 | |
2.237%, 9/1/34 | | | 3,606,884 | | | | 3,805,095 | |
2.281%, 12/1/42 | | | 26,082,611 | | | | 26,250,828 | |
2.289%, 5/1/43 | | | 5,512,318 | | | | 5,546,856 | |
2.302%, 7/1/35 | | | 2,490,331 | | | | 2,639,170 | |
2.311%, 10/1/43 | | | 66,096,177 | | | | 67,347,462 | |
2.321%, 2/1/44 | | | 4,992,102 | | | | 5,114,862 | |
2.35%, 1/1/37 | | | 4,386,771 | | | | 4,611,034 | |
2.371%, 9/1/42 | | | 15,680,251 | | | | 16,034,249 | |
2.393%, 8/1/34 | | | 738,464 | | | | 783,963 | |
2.397%, 10/1/38 | | | 9,822,166 | | | | 10,397,982 | |
2.398%, 10/1/33 | | | 3,149,535 | | | | 3,339,332 | |
2.399%, 12/1/36 | | | 3,797,562 | | | | 4,005,727 | |
2.412%, 7/1/34 | | | 3,376,707 | | | | 3,563,399 | |
2.415%, 2/1/43 | | | 22,285,757 | | | | 22,811,114 | |
2.416%, 10/1/35 | | | 3,747,603 | | | | 3,964,897 | |
2.433%, 6/1/35 | | | 1,339,022 | | | | 1,412,630 | |
2.451%, 10/1/38 | | | 2,463,990 | | | | 2,618,071 | |
2.47%, 1/1/36 | | | 5,886,195 | | | | 6,226,428 | |
2.471%, 1/1/36 | | | 4,541,752 | | | | 4,806,457 | |
2.474%, 5/1/44 | | | 24,095,420 | | | | 24,666,222 | |
2.475%, 10/1/38 | | | 5,587,495 | | | | 5,869,715 | |
2.476%, 11/1/36 | | | 2,954,946 | | | | 3,136,611 | |
2.479%, 12/1/35-5/1/38 | | | 220,890,585 | | | | 233,789,469 | |
2.489%, 10/1/44 | | | 11,373,974 | | | | 11,558,600 | |
2.50%, 7/1/35 | | | 2,193,708 | | | | 2,327,561 | |
2.505%, 10/1/35 | | | 2,631,963 | | | | 2,783,987 | |
2.506%, 11/1/42 | | | 15,135,933 | | | | 15,510,886 | |
2.517%, 9/1/35 | | | 3,402,851 | | | | 3,604,305 | |
2.558%, 1/1/36 | | | 22,455,501 | | | | 23,754,119 | |
2.561%, 8/1/35 | | | 5,070,129 | | | | 5,394,631 | |
2.571%, 4/1/45 | | | 10,852,275 | | | | 11,016,996 | |
2.601%, 4/1/42 | | | 19,446,107 | | | | 20,008,241 | |
2.625%, 9/1/38 | | | 1,105,905 | | | | 1,177,271 | |
2.66%, 2/1/43 | | | 9,315,226 | | | | 9,811,094 | |
2.674%, 8/1/45 | | | 22,412,131 | | | | 22,804,576 | |
2.675%, 10/1/44 | | | 23,757,282 | | | | 24,271,339 | |
2.698%, 11/1/43 | | | 23,901,698 | | | | 24,532,516 | |
2.702%, 4/1/44 | | | 27,654,815 | | | | 28,557,438 | |
2.717%, 12/1/44 | | | 11,695,367 | | | | 11,948,652 | |
2.719%, 2/1/45 | | | 33,558,952 | | | | 34,261,785 | |
2.72%, 12/1/44 | | | 7,692,711 | | | | 7,860,462 | |
2.721%, 10/1/44 | | | 17,293,969 | | | | 17,687,676 | |
2.731%, 9/1/44 | | | 17,817,126 | | | | 18,242,468 | |
2.739%, 2/1/37 | | | 10,913,461 | | | | 11,602,789 | |
2.74%, 8/1/45 | | | 21,609,630 | | | | 22,044,970 | |
2.743%, 11/1/44 | | | 9,363,226 | | | | 9,577,359 | |
2.75%, 12/1/44 | | | 8,005,738 | | | | 8,187,041 | |
2.759%, 9/1/44 | | | 19,069,689 | | | | 19,532,453 | |
2.764%, 10/1/44 | | | 17,720,770 | | | | 18,139,395 | |
2.769%, 11/1/44 | | | 15,911,672 | | | | 16,280,583 | |
2.783%, 12/1/44 | | | 56,871,308 | | | | 58,180,953 | |
2.787%, 2/1/44 | | | 10,278,368 | | | | 10,554,985 | |
2.80%, 8/1/44-10/1/44 | | | 76,544,703 | | | | 78,387,177 | |
2.801%, 1/1/35 | | | 1,372,432 | | | | 1,453,017 | |
2.803%, 12/1/44 | | | 26,888,409 | | | | 27,512,739 | |
2.814%, 10/1/44 | | | 33,261,468 | | | | 34,058,209 | |
2.835%, 8/1/44 | | | 48,711,517 | | | | 49,904,297 | |
2.848%, 10/1/44 | | | 20,726,300 | | | | 21,226,890 | |
| | |
| PAGE 8 § DODGE & COX INCOME FUND | | See accompanying Notes to Financial Statements |
| | | | |
| PORTFOLIO OF INVESTMENTS | | | December 31, 2015 | |
| | | | | | | | |
| DEBT SECURITIES (continued) | | | | | | |
| | |
| | | PAR VALUE | | | VALUE | |
2.85%, 10/1/44 | | $ | 22,200,611 | | | $ | 22,728,488 | |
2.86%, 11/1/44 | | | 32,169,041 | | | | 32,958,245 | |
2.864%, 7/1/44 | | | 29,631,331 | | | | 30,396,645 | |
2.867%, 11/1/44 | | | 29,915,171 | | | | 30,651,847 | |
2.88%, 9/1/44 | | | 60,821,053 | | | | 62,416,330 | |
2.889%, 9/1/44-10/1/44 | | | 26,569,323 | | | | 27,251,937 | |
2.894%, 10/1/44 | | | 10,435,897 | | | | 10,700,705 | |
2.896%, 7/1/44 | | | 20,446,306 | | | | 21,004,335 | |
2.915%, 8/1/44 | | | 11,332,393 | | | | 11,634,824 | |
2.918%, 2/1/44 | | | 16,269,225 | | | | 16,760,471 | |
2.928%, 4/1/44 | | | 11,052,054 | | | | 11,373,872 | |
2.93%, 10/1/44 | | | 37,875,379 | | | | 38,881,783 | |
2.932%, 1/1/45 | | | 24,416,718 | | | | 25,059,180 | |
2.933%, 7/1/44 | | | 15,059,049 | | | | 15,484,248 | |
2.934%, 9/1/43 | | | 12,457,920 | | | | 12,841,625 | |
2.935%, 11/1/44 | | | 29,559,493 | | | | 30,343,174 | |
2.938%, 11/1/43 | | | 21,763,709 | | | | 22,312,424 | |
2.944%, 4/1/44 | | | 10,868,773 | | | | 11,187,250 | |
2.954%, 11/1/44 | | | 28,329,937 | | | | 29,105,386 | |
2.965%, 7/1/44 | | | 11,203,665 | | | | 11,526,484 | |
2.976%, 10/1/44 | | | 23,055,337 | | | | 23,705,230 | |
3.002%, 9/1/44 | | | 35,269,218 | | | | 36,313,735 | |
3.023%, 8/1/44 | | | 15,385,878 | | | | 15,850,254 | |
3.05%, 5/1/44 | | | 46,658,354 | | | | 48,167,907 | |
3.203%, 4/1/44 | | | 35,247,177 | | | | 36,368,197 | |
3.444%, 7/1/41 | | | 69,632,696 | | | | 73,237,947 | |
4.127%, 12/1/39 | | | 4,141,439 | | | | 4,373,579 | |
4.831%, 4/1/38 | | | 741,995 | | | | 788,343 | |
5.031%, 5/1/38 | | | 2,545,726 | | | | 2,696,969 | |
5.145%, 8/1/37 | | | 719,354 | | | | 739,053 | |
5.272%, 6/1/39 | | | 1,347,451 | | | | 1,440,177 | |
5.593%, 11/1/37 | | | 1,500,371 | | | | 1,592,281 | |
5.596%, 4/1/37 | | | 743,019 | | | | 795,432 | |
5.621%, 7/1/36 | | | 69,417 | | | | 69,003 | |
5.754%, 8/1/37 | | | 3,252,836 | | | | 3,457,562 | |
5.862%, 12/1/36 | | | 1,571,302 | | | | 1,665,268 | |
Fannie Mae, Multifamily DUS | | | | | | | | |
Trust 2014-M13 ASQ2, 1.637%, 11/25/17 | | | 57,955,932 | | | | 58,136,511 | |
Pool AL6445, 2.405%, 1/1/22 | | | 24,893,787 | | | | 25,412,080 | |
Pool AL6455, 2.552%, 11/1/21 | | | 29,305,788 | | | | 30,160,742 | |
Pool AL6028, 2.934%, 7/1/21 | | | 5,004,967 | | | | 5,144,361 | |
Pool 745629, 5.389%, 1/1/18 | | | 109,689 | | | | 113,041 | |
Pool 888559, 5.487%, 6/1/17 | | | 9,976,584 | | | | 10,404,728 | |
Pool 888015, 5.496%, 11/1/16 | | | 20,439,338 | | | | 20,426,623 | |
Pool 735745, 5.60%, 1/1/17 | | | 542 | | | | 542 | |
Pool 745936, 6.061%, 8/1/16 | | | 602,706 | | | | 612,444 | |
Freddie Mac, Hybrid ARM | | | | | | | | |
1.921%, 1/1/36 | | | 3,477,396 | | | | 3,660,015 | |
2.101%, 8/1/36 | | | 4,006,797 | | | | 4,206,786 | |
2.155%, 1/1/35 | | | 1,762,455 | | | | 1,863,418 | |
2.189%, 3/1/37 | | | 5,134,789 | | | | 5,444,385 | |
2.208%, 2/1/38 | | | 11,584,017 | | | | 12,135,901 | |
2.216%, 4/1/37 | | | 1,782,770 | | | | 1,883,189 | |
2.31%, 1/1/37 | | | 3,755,662 | | | | 3,990,037 | |
2.328%, 5/1/37 | | | 3,716,851 | | | | 3,941,112 | |
2.37%, 7/1/37 | | | 10,672,846 | | | | 11,363,720 | |
2.375%, 4/1/35 | | | 1,353,397 | | | | 1,440,314 | |
2.386%, 10/1/35 | | | 4,355,497 | | | | 4,568,773 | |
2.391%, 2/1/34 | | | 7,216,321 | | | | 7,687,023 | |
2.394%, 4/1/38 | | | 10,044,623 | | | | 10,669,831 | |
2.399%, 4/1/37 | | | 2,679,394 | | | | 2,813,996 | |
2.402%, 6/1/38 | | | 6,090,733 | | | | 6,422,494 | |
2.407%, 1/1/36 | | | 3,876,895 | | | | 4,103,560 | |
2.445%, 7/1/43 | | | 9,419,624 | | | | 9,827,308 | |
2.447%, 10/1/38 | | | 1,240,045 | | | | 1,309,898 | |
2.451%, 1/1/36 | | | 9,584,063 | | | | 10,160,381 | |
| | | | | | | | |
| | |
| | | PAR VALUE | | | VALUE | |
2.452%, 3/1/35 | | $ | 1,783,179 | | | $ | 1,888,066 | |
2.455%, 10/1/38 | | | 3,565,171 | | | | 3,773,546 | |
2.487%, 8/1/35 | | | 2,219,435 | | | | 2,340,180 | |
2.489%, 2/1/35 | | | 1,297,592 | | | | 1,375,844 | |
2.494%, 4/1/38 | | | 12,001,401 | | | | 12,763,007 | |
2.529%, 9/1/33 | | | 8,619,235 | | | | 9,168,092 | |
2.546%, 8/1/34 | | | 1,423,906 | | | | 1,514,105 | |
2.552%, 4/1/36 | | | 5,693,303 | | | | 6,035,235 | |
2.582%, 9/1/35 | | | 3,273,550 | | | | 3,457,446 | |
2.617%, 11/1/34 | | | 1,859,597 | | | | 1,959,243 | |
2.62%, 8/1/35 | | | 3,378,580 | | | | 3,597,616 | |
2.643%, 8/1/45 | | | 19,128,762 | | | | 19,404,719 | |
2.731%, 1/1/45 | | | 23,828,838 | | | | 24,302,367 | |
2.738%, 9/1/44 | | | 17,092,607 | | | | 17,458,070 | |
2.741%, 6/1/45 | | | 9,466,024 | | | | 9,625,425 | |
2.752%, 11/1/44 | | | 30,955,044 | | | | 31,615,866 | |
2.771%, 10/1/43 | | | 4,512,532 | | | | 4,637,348 | |
2.798%, 12/1/44 | | | 8,241,469 | | | | 8,415,907 | |
2.818%, 9/1/44 | | | 21,311,390 | | | | 21,789,758 | |
2.832%, 10/1/44 | | | 51,301,145 | | | | 52,360,519 | |
2.835%, 10/1/44 | | | 11,310,617 | | | | 11,565,818 | |
2.84%, 11/1/44 | | | 37,962,261 | | | | 38,816,573 | |
2.843%, 1/1/45 | | | 21,196,127 | | | | 21,661,143 | |
2.856%, 8/1/45 | | | 16,963,029 | | | | 17,311,259 | |
2.873%, 12/1/44 | | | 22,632,553 | | | | 23,154,767 | |
2.891%, 6/1/44 | | | 13,313,243 | | | | 13,650,015 | |
2.897%, 12/1/44 | | | 38,464,632 | | | | 39,378,527 | |
2.903%, 11/1/44 | | | 22,177,441 | | | | 22,711,460 | |
2.904%, 2/1/44 | | | 18,700,993 | | | | 19,227,996 | |
2.911%, 8/1/44 | | | 16,064,737 | | | | 16,468,759 | |
2.92%, 12/1/44 | | | 33,353,250 | | | | 34,176,111 | |
2.927%, 11/1/44 | | | 11,915,819 | | | | 12,209,997 | |
2.928%, 1/1/45-2/1/45 | | | 49,079,334 | | | | 50,277,051 | |
2.932%, 1/1/45 | | | 29,982,107 | | | | 30,721,418 | |
2.939%, 1/1/44 | | | 10,593,572 | | | | 10,908,039 | |
2.943%, 11/1/44 | | | 18,621,858 | | | | 19,098,428 | |
2.947%, 11/1/44 | | | 50,853,178 | | | | 52,162,911 | |
2.953%, 11/1/44 | | | 14,899,807 | | | | 15,290,455 | |
2.959%, 12/1/44 | | | 18,850,353 | | | | 19,339,341 | |
2.966%, 9/1/44-11/1/44 | | | 48,601,169 | | | | 49,900,149 | |
2.991%, 11/1/44 | | | 24,302,013 | | | | 24,958,418 | |
3.015%, 7/1/44 | | | 11,243,962 | | | | 11,562,718 | |
3.02%, 5/1/44-10/1/44 | | | 213,994,107 | | | | 220,371,790 | |
3.022%, 7/1/44 | | | 13,668,619 | | | | 14,065,442 | |
3.025%, 10/1/44 | | | 24,638,087 | | | | 25,337,589 | |
3.043%, 8/1/44 | | | 17,862,494 | | | | 18,380,513 | |
3.058%, 4/1/44 | | | 14,158,052 | | | | 14,581,352 | |
3.10%, 6/1/44 | | | 40,452,822 | | | | 41,711,360 | |
3.105%, 8/1/44 | | | 19,500,908 | | | | 20,096,219 | |
3.129%, 1/1/44 | | | 9,749,833 | | | | 10,059,602 | |
3.137%, 4/1/44 | | | 6,852,932 | | | | 7,069,394 | |
3.581%, 6/1/41 | | | 10,530,420 | | | | 11,013,393 | |
3.694%, 9/1/41 | | | 13,495,562 | | | | 14,153,911 | |
4.797%, 6/1/38 | | | 1,452,792 | | | | 1,532,857 | |
5.195%, 5/1/38 | | | 4,027,208 | | | | 4,271,864 | |
5.498%, 11/1/39 | | | 4,753,471 | | | | 5,023,687 | |
5.784%, 1/1/38 | | | 1,693,594 | | | | 1,795,732 | |
6.178%, 12/1/36 | | | 2,279,561 | | | | 2,409,223 | |
6.182%, 10/1/37 | | | 643,723 | | | | 685,119 | |
Freddie Mac Gold, 10 Year
6.00%, 9/1/16 | | | 79,918 | | | | 80,519 | |
Freddie Mac Gold, 15 Year | | | | | | | | |
4.00%, 6/1/26-6/1/27 | | | 376,943,736 | | | | 398,252,479 | |
4.50%, 3/1/25-6/1/26 | | | 24,828,127 | | | | 26,588,195 | |
5.50%, 10/1/20-12/1/24 | | | 12,608,880 | | | | 13,434,951 | |
6.00%, 8/1/16-11/1/23 | | | 24,205,400 | | | | 26,093,264 | |
6.50%, 5/1/16-9/1/18 | | | 1,461,315 | | | | 1,491,791 | |
| | |
| See accompanying Notes to Financial Statements | | DODGE & COX INCOME FUND §PAGE 9 |
| | | | |
| PORTFOLIO OF INVESTMENTS | | | December 31, 2015 | |
| | | | | | | | |
| DEBT SECURITIES (continued) | | | | | | |
| | |
| | | PAR VALUE | | | VALUE | |
Freddie Mac Gold, 20 Year | | | | | | | | |
4.00%, 9/1/31-6/1/35 | | $ | 351,048,364 | | | $ | 375,362,667 | |
4.50%, 5/1/30-1/1/34 | | | 180,316,302 | | | | 195,751,967 | |
6.00%, 7/1/25-12/1/27 | | | 34,264,242 | | | | 38,463,505 | |
6.50%, 7/1/21-10/1/26 | | | 4,398,131 | | | | 5,008,613 | |
Freddie Mac Gold, 30 Year | | | | | | | | |
4.50%, 3/1/39-7/1/45 | | | 1,083,467,253 | | | | 1,170,822,891 | |
5.50%, 3/1/34-12/1/38 | | | 96,598,961 | | | | 107,402,603 | |
6.00%, 2/1/33-2/1/39 | | | 39,549,995 | | | | 44,971,623 | |
6.50%, 12/1/32-10/1/38 | | | 22,498,505 | | | | 25,653,708 | |
7.00%, 4/1/31-11/1/38 | | | 6,578,891 | | | | 7,653,130 | |
7.90%, 2/17/21 | | | 366,298 | | | | 391,837 | |
Ginnie Mae, 30 Year | | | | | | | | |
7.00%, 5/15/28 | | | 433,409 | | | | 495,778 | |
7.50%, 9/15/17-5/15/25 | | | 1,491,941 | | | | 1,689,298 | |
7.80%, 6/15/20-1/15/21 | | | 334,342 | | | | 356,428 | |
7.85%, 1/15/21-10/15/21 | | | 6,443 | | | | 6,485 | |
8.00%, 9/15/20 | | | 6,185 | | | | 6,711 | |
| | | | | | | | |
| | | | 12,739,298,350 | |
PRIVATE LABEL CMO & REMIC: 0.0%(f) | |
GSMPS Mortgage Loan Trust
Series 2004-4 1A4, 8.50%, 6/25/34 30 Year(b) | | | 5,112,029 | | | | 5,510,549 | |
| | | | | | | | |
| | | | 14,126,545,758 | |
| ASSET-BACKED: 5.7% | | | | | | | | |
AUTO LOAN: 0.7% | | | | | | | | |
Ford Credit Auto Owner Trust | | | | | | | | |
Series 2012-B A4, 1.00%, 9/15/17 | | | 3,893,649 | | | | 3,893,953 | |
Series 2014-C A3, 1.06%, 5/15/19 | | | 9,025,000 | | | | 9,003,360 | |
Series 2015-B A3, 1.16%, 11/15/19 | | | 57,115,000 | | | | 56,692,646 | |
Series 2015-1 A, 2.12%, 7/15/26(b) | | | 200,480,000 | | | | 197,990,098 | |
Toyota Auto Receivables Owner Trust | | | | | | | | |
Series 2014-B A3, 0.76%, 3/15/18 | | | 13,555,000 | | | | 13,520,759 | |
Series 2015-A A3, 1.12%, 2/15/19 | | | 8,325,000 | | | | 8,302,381 | |
Series 2014-C A4, 1.44%, 4/15/20 | | | 20,975,000 | | | | 20,940,085 | |
| | | | | | | | |
| | | | 310,343,282 | |
CREDIT CARD: 2.6% | | | | | | | | |
American Express Master Trust | | | | | | | | |
Series 2014-2 A, 1.26%, 1/15/20 | | | 10,900,000 | | | | 10,877,420 | |
Series 2014-3 A, 1.49%, 4/15/20 | | | 381,035,481 | | | | 381,146,057 | |
Chase Issuance Trust | | | | | | | | |
Series 2006-A2 A2, 5.16%, 4/16/18 | | | 17,465,000 | | | | 17,551,382 | |
Series 2013-A8 A8, 1.01%, 10/15/18 | | | 11,740,000 | | | | 11,729,138 | |
Series 2014-A1 A1, 1.15%, 1/15/19 | | | 152,146,000 | | | | 152,023,675 | |
Series 2014-A6 A6, 1.26%, 7/15/19 | | | 24,285,000 | | | | 24,233,030 | |
Series 2014-A7 A7, 1.38%, 11/15/19 | | | 250,740,000 | | | | 250,027,297 | |
Series 2015-A2 A2, 1.59%, 2/18/20 | | | 260,397,000 | | | | 260,391,219 | |
| | | | | | | | |
| | | | 1,107,979,218 | |
OTHER: 1.7% | | | | | | | | |
Rio Oil Finance Trust(c) (Brazil) | | | | | | | | |
9.25%, 7/6/24(b) | | | 592,816,000 | | | | 438,683,840 | |
9.75%, 1/6/27(b) | | | 382,550,000 | | | | 281,174,250 | |
| | | | | | | | |
| | | | 719,858,090 | |
STUDENT LOAN: 0.7% | | | | | | | | |
Navient Student Loan Trust (Private Loans)
Series 2014-AA A2A, 2.74%, 2/15/29(b) | | | 35,880,000 | | | | 35,217,698 | |
SLM Student Loan Trust (Private Loans) | | | | | | | | |
Series 2013-A A2A, 1.77%, 5/17/27(b) | | | 58,445,000 | | | | 57,168,766 | |
Series 2012-B A2, 3.48%, 10/15/30(b) | | | 68,051,448 | | | | 68,985,950 | |
Series 2013-C A2A, 2.94%, 10/15/31(b) | | | 41,885,000 | | | | 42,171,506 | |
Series 2012-E A2A, 2.09%, 6/15/45(b) | | | 14,555,000 | | | | 14,434,832 | |
Series 2012-C A2, 3.31%, 10/15/46(b) | | | 94,748,000 | | | | 95,940,044 | |
| | | | | | | | |
| | | | 313,918,796 | |
| | | | | | | | |
| | | | 2,452,099,386 | |
| | | | | | | | |
| | |
| | | PAR VALUE | | | VALUE | |
| CORPORATE: 46.3% | | | | | | | | |
FINANCIALS: 15.5% | | | | | | | | |
Anthem, Inc. | | | | | | | | |
7.00%, 2/15/19 | | $ | 83,470,000 | | | $ | 93,795,406 | |
3.70%, 8/15/21 | | | 48,839,000 | | | | 49,943,689 | |
Bank of America Corp. | | | | | | | | |
7.625%, 6/1/19 | | | 188,582,000 | | | | 218,222,942 | |
5.625%, 7/1/20 | | | 73,416,000 | | | | 81,578,024 | |
4.20%, 8/26/24 | | | 163,140,000 | | | | 163,376,879 | |
4.25%, 10/22/26 | | | 127,024,000 | | | | 125,745,630 | |
6.625%, 5/23/36(a) | | | 241,528,000 | | | | 275,087,591 | |
Barclays PLC(c) (United Kingdom)
4.375%, 9/11/24 | | | 275,404,000 | | | | 269,295,815 | |
BNP Paribas SA(c) (France) | | | | | | | | |
4.25%, 10/15/24 | | | 379,446,000 | | | | 376,095,871 | |
4.375%, 9/28/25(b) | | | 65,275,000 | | | | 63,935,753 | |
Boston Properties, Inc. | | | | | | | | |
5.875%, 10/15/19 | | | 48,079,000 | | | | 53,374,036 | |
5.625%, 11/15/20 | | | 79,385,000 | | | | 88,390,117 | |
4.125%, 5/15/21 | | | 52,852,000 | | | | 55,383,717 | |
3.85%, 2/1/23 | | | 99,296,000 | | | | 101,373,769 | |
3.125%, 9/1/23 | | | 44,040,000 | | | | 42,899,584 | |
3.80%, 2/1/24 | | | 88,654,000 | | | | 90,186,739 | |
Capital One Financial Corp. | | | | | | | | |
4.75%, 7/15/21 | | | 182,195,000 | | | | 197,441,989 | |
3.50%, 6/15/23 | | | 193,115,000 | | | | 192,043,984 | |
3.75%, 4/24/24 | | | 36,940,000 | | | | 37,198,543 | |
3.20%, 2/5/25 | | | 67,240,000 | | | | 65,034,259 | |
4.20%, 10/29/25 | | | 64,960,000 | | | | 64,171,710 | |
Cigna Corp. | | | | | | | | |
4.00%, 2/15/22 | | | 62,964,000 | | | | 65,095,017 | |
7.65%, 3/1/23 | | | 6,317,000 | | | | 7,662,268 | |
7.875%, 5/15/27 | | | 33,255,000 | | | | 43,727,266 | |
8.30%, 1/15/33 | | | 8,195,000 | | | | 10,764,010 | |
6.15%, 11/15/36 | | | 88,097,000 | | | | 100,330,942 | |
5.875%, 3/15/41 | | | 18,489,000 | | | | 21,266,196 | |
5.375%, 2/15/42 | | | 54,405,000 | | | | 59,595,999 | |
Citigroup, Inc. | | | | | | | | |
2.062%, 5/15/18 | | | 120,345,000 | | | | 122,382,321 | |
3.50%, 5/15/23 | | | 105,730,000 | | | | 103,963,569 | |
6.692%, 10/30/40(a) | | | 381,543,025 | | | | 399,704,473 | |
Equity Residential | | | | | | | | |
4.75%, 7/15/20 | | | 5,200,000 | | | | 5,619,240 | |
4.625%, 12/15/21 | | | 102,744,000 | | | | 111,557,380 | |
3.00%, 4/15/23 | | | 47,300,000 | | | | 46,464,682 | |
3.375%, 6/1/25 | | | 77,890,000 | | | | 77,090,615 | |
General Electric Co.
2.342%, 11/15/20(b) | | | 228,648,000 | | | | 226,972,696 | |
Health Net, Inc.
6.375%, 6/1/17 | | | 120,854,000 | | | | 125,688,160 | |
HSBC Holdings PLC(c) (United Kingdom) | | | | | | | | |
5.10%, 4/5/21 | | | 85,935,000 | | | | 95,542,447 | |
9.30%, 6/1/21 | | | 100,000 | | | | 127,338 | |
6.50%, 5/2/36 | | | 179,105,000 | | | | 213,642,892 | |
6.50%, 9/15/37 | | | 195,591,000 | | | | 234,671,842 | |
6.80%, 6/1/38 | | | 32,000,000 | | | | 39,829,920 | |
JPMorgan Chase & Co. | | | | | | | | |
3.375%, 5/1/23 | | | 92,238,000 | | | | 90,704,174 | |
4.125%, 12/15/26 | | | 106,000,000 | | | | 105,809,306 | |
8.75%, 9/1/30(a) | | | 48,438,000 | | | | 69,369,319 | |
Lloyds Banking Group PLC(c) (United Kingdom)
4.50%, 11/4/24 | | | 218,317,000 | | | | 221,645,898 | |
| | |
| PAGE 10 § DODGE & COX INCOME FUND | | See accompanying Notes to Financial Statements |
| | | | |
| PORTFOLIO OF INVESTMENTS | | | December 31, 2015 | |
| | | | | | | | |
| DEBT SECURITIES (continued) | | | | | | |
| | |
| | | PAR VALUE | | | VALUE | |
Navient Corp. | | | | | | | | |
6.00%, 1/25/17 | | $ | 166,603,000 | | | $ | 170,768,075 | |
4.625%, 9/25/17 | | | 111,437,000 | | | | 109,765,445 | |
8.45%, 6/15/18 | | | 192,028,000 | | | | 202,109,470 | |
Royal Bank of Scotland Group PLC(c) (United Kingdom) | | | | | | | | |
6.125%, 12/15/22 | | | 292,243,000 | | | | 318,167,584 | |
6.00%, 12/19/23 | | | 264,320,000 | | | | 284,674,226 | |
Unum Group | | | | | | | | |
7.19%, 2/1/28 | | | 11,295,000 | | | | 13,265,740 | |
7.25%, 3/15/28 | | | 25,060,000 | | | | 29,152,398 | |
6.75%, 12/15/28 | | | 8,107,000 | | | | 9,514,448 | |
Wells Fargo & Co.
4.30%, 7/22/27 | | | 247,864,000 | | | | 253,229,016 | |
| | | | | | | | |
| | | | 6,694,450,419 | |
INDUSTRIALS: 29.5% | | | | | | | | |
Allergan PLC(c) (Ireland) | | | | | | | | |
3.00%, 3/12/20 | | | 181,325,000 | | | | 181,180,484 | |
3.45%, 3/15/22 | | | 56,635,000 | | | | 56,725,446 | |
3.80%, 3/15/25 | | | 204,424,000 | | | | 203,398,814 | |
AT&T, Inc. | | | | | | | | |
3.40%, 5/15/25 | | | 124,574,000 | | | | 119,742,397 | |
8.25%, 11/15/31 | | | 190,653,000 | | | | 255,137,564 | |
6.55%, 2/15/39 | | | 59,430,000 | | | | 66,755,401 | |
5.35%, 9/1/40 | | | 59,744,000 | | | | 59,008,551 | |
4.75%, 5/15/46 | | | 77,670,000 | | | | 71,100,982 | |
Becton, Dickinson and Co. 3.734%, 12/15/24 | | | 46,675,000 | | | | 47,103,383 | |
BHP Billiton, Ltd.(c) (Australia)
6.75%, 10/19/75(a)(b) | | | 223,972,000 | | | | 216,132,980 | |
Boston Scientific Corp.
6.00%, 1/15/20 | | | 15,690,000 | | | | 17,421,784 | |
Burlington Northern Santa Fe LLC(e) | | | | | | | | |
4.70%, 10/1/19 | | | 75,445,000 | | | | 81,617,985 | |
7.57%, 1/2/21 | | | 10,496,389 | | | | 11,589,977 | |
8.251%, 1/15/21 | | | 4,300,228 | | | | 4,841,235 | |
4.10%, 6/1/21 | | | 5,820,000 | | | | 6,133,954 | |
3.05%, 9/1/22 | | | 39,535,000 | | | | 39,501,988 | |
5.943%, 1/15/23 | | | 57,522 | | | | 61,726 | |
3.85%, 9/1/23 | | | 89,340,000 | | | | 92,856,780 | |
5.72%, 1/15/24 | | | 15,809,857 | | | | 17,404,787 | |
3.75%, 4/1/24 | | | 29,682,000 | | | | 30,415,561 | |
5.342%, 4/1/24 | | | 5,223,959 | | | | 5,645,271 | |
5.629%, 4/1/24 | | | 21,148,315 | | | | 23,133,614 | |
5.996%, 4/1/24 | | | 40,392,566 | | | | 44,916,534 | |
3.442%, 6/16/28(b) | | | 89,043,354 | | | | 85,967,440 | |
Cemex SAB de CV(c) (Mexico) | | | | | | | | |
6.50%, 12/10/19(b) | | | 138,875,000 | | | | 134,014,375 | |
7.25%, 1/15/21(b) | | | 163,907,000 | | | | 157,760,487 | |
6.00%, 4/1/24(b) | | | 113,175,000 | | | | 97,047,562 | |
5.70%, 1/11/25(b) | | | 202,411,000 | | | | 169,266,199 | |
6.125%, 5/5/25(b) | | | 78,400,000 | | | | 67,032,000 | |
Charter Communications, Inc. | | | | | | | | |
4.908%, 7/23/25(b) | | | 122,505,000 | | | | 122,384,578 | |
6.484%, 10/23/45(b) | | | 92,015,000 | | | | 92,047,665 | |
Cox Enterprises, Inc. | | | | | | | | |
5.875%, 12/1/16(b) | | | 76,215,000 | | | | 78,796,859 | |
9.375%, 1/15/19(b) | | | 145,119,000 | | | | 168,177,103 | |
3.25%, 12/15/22(b) | | | 147,403,000 | | | | 133,988,295 | |
2.95%, 6/30/23(b) | | | 241,788,000 | | | | 213,011,359 | |
3.85%, 2/1/25(b) | | | 197,601,000 | | | | 181,177,393 | |
| | | | | | | | |
| | |
| | | PAR VALUE | | | VALUE | |
CRH PLC(c) (Ireland)
3.875%, 5/18/25(b) | | $ | 185,239,000 | | | $ | 184,066,252 | |
CSX Corp. | | | | | | | | |
9.75%, 6/15/20 | | | 10,067,000 | | | | 12,790,476 | |
6.251%, 1/15/23 | | | 15,173,398 | | | | 17,315,396 | |
Dillard’s, Inc. | | | | | | | | |
7.13%, 8/1/18 | | | 23,565,000 | | | | 25,935,097 | |
7.875%, 1/1/23 | | | 275,000 | | | | 324,070 | |
7.75%, 7/15/26 | | | 21,016,000 | | | | 24,307,463 | |
7.75%, 5/15/27 | | | 12,848,000 | | | | 14,951,757 | |
7.00%, 12/1/28 | | | 28,225,000 | | | | 31,283,913 | |
Dow Chemical Co. | | | | | | | | |
8.55%, 5/15/19 | | | 156,085,000 | | | | 184,019,532 | |
4.25%, 11/15/20 | | | 7,726,000 | | | | 8,090,853 | |
3.00%, 11/15/22 | | | 24,240,000 | | | | 23,221,605 | |
7.375%, 11/1/29 | | | 69,100,000 | | | | 85,386,317 | |
9.40%, 5/15/39 | | | 135,313,000 | | | | 194,447,217 | |
5.25%, 11/15/41 | | | 12,378,000 | | | | 12,064,948 | |
Eaton Corp. PLC(c) (Ireland)
2.75%, 11/2/22 | | | 61,835,000 | | | | 59,840,203 | |
FedEx Corp. | | | | | | | | |
8.00%, 1/15/19 | | | 18,050,000 | | | | 21,014,315 | |
7.65%, 7/15/24 | | | 1,990,174 | | | | 2,328,504 | |
Ford Motor Credit Co. LLC(e) | | | | | | | | |
8.125%, 1/15/20 | | | 16,910,000 | | | | 19,923,835 | |
5.75%, 2/1/21 | | | 215,710,000 | | | | 238,416,713 | |
5.875%, 8/2/21 | | | 153,240,000 | | | | 170,889,877 | |
3.219%, 1/9/22 | | | 39,700,000 | | | | 38,869,675 | |
4.25%, 9/20/22 | | | 44,075,000 | | | | 45,094,014 | |
4.375%, 8/6/23 | | | 27,875,000 | | | | 28,652,629 | |
General Electric Co. | | | | | | | | |
4.375%, 9/16/20 | | | 14,629,000 | | | | 15,887,665 | |
4.625%, 1/7/21 | | | 15,139,000 | | | | 16,628,890 | |
4.65%, 10/17/21 | | | 15,937,000 | | | | 17,622,402 | |
Hewlett Packard Enterprise Co.
3.60%, 10/15/20(b) | | | 354,040,000 | | | | 354,889,696 | |
Imperial Tobacco Group PLC(c)
(United Kingdom) | | | | | | | | |
3.75%, 7/21/22(b) | | | 124,595,000 | | | | 125,107,958 | |
4.25%, 7/21/25(b) | | | 385,702,000 | | | | 391,458,988 | |
Kinder Morgan, Inc. | | | | | | | | |
3.45%, 2/15/23 | | | 23,425,000 | | | | 19,460,764 | |
3.50%, 9/1/23 | | | 43,211,000 | | | | 35,847,241 | |
5.625%, 11/15/23(b) | | | 49,500,000 | | | | 45,278,739 | |
4.15%, 2/1/24 | | | 47,997,000 | | | | 41,435,762 | |
4.25%, 9/1/24 | | | 22,635,000 | | | | 19,268,927 | |
4.30%, 6/1/25 | | | 196,680,000 | | | | 170,021,403 | |
6.50%, 2/1/37 | | | 50,861,000 | | | | 43,686,242 | |
6.95%, 1/15/38 | | | 92,139,000 | | | | 81,909,913 | |
6.50%, 9/1/39 | | | 72,546,000 | | | | 59,824,551 | |
5.00%, 8/15/42 | | | 57,054,000 | | | | 42,097,579 | |
5.00%, 3/1/43 | | | 71,101,000 | | | | 52,669,061 | |
5.50%, 3/1/44 | | | 90,632,000 | | | | 70,688,247 | |
5.40%, 9/1/44 | | | 64,829,000 | | | | 48,991,664 | |
5.55%, 6/1/45 | | | 40,000,000 | | | | 31,236,480 | |
5.05%, 2/15/46 | | | 62,325,000 | | | | 46,218,475 | |
LafargeHolcim, Ltd.(c) (Switzerland)
6.50%, 7/15/16 | | | 75,696,000 | | | | 77,604,977 | |
| | |
| See accompanying Notes to Financial Statements | | DODGE & COX INCOME FUND §PAGE 11 |
| | | | |
| PORTFOLIO OF INVESTMENTS | | | December 31, 2015 | |
| | | | | | | | |
| DEBT SECURITIES (continued) | | | | | | |
| | |
| | | PAR VALUE | | | VALUE | |
Macy’s, Inc. | | | | | | | | |
6.65%, 7/15/24 | | $ | 52,526,000 | | | $ | 59,198,378 | |
7.00%, 2/15/28 | | | 27,985,000 | | | | 32,478,607 | |
6.70%, 9/15/28 | | | 34,115,000 | | | | 37,597,459 | |
6.90%, 4/1/29 | | | 67,888,000 | | | | 76,510,523 | |
6.90%, 1/15/32 | | | 60,095,000 | | | | 66,323,907 | |
6.70%, 7/15/34 | | | 130,660,000 | | | | 135,751,951 | |
4.50%, 12/15/34 | | | 154,923,000 | | | | 129,466,053 | |
6.375%, 3/15/37 | | | 101,593,000 | | | | 102,808,154 | |
Naspers, Ltd.(c) (South Africa) | | | | | | | | |
6.00%, 7/18/20(b) | | | 220,010,000 | | | | 234,075,239 | |
5.50%, 7/21/25(b) | | | 257,875,000 | | | | 248,084,002 | |
Nordstrom, Inc.
6.95%, 3/15/28 | | | 20,107,000 | | | | 24,591,504 | |
Norfolk Southern Corp. | | | | | | | | |
7.70%, 5/15/17 | | | 28,585,000 | | | | 30,895,240 | |
9.75%, 6/15/20 | | | 13,813,000 | | | | 17,630,319 | |
RELX PLC(c) (United Kingdom) | | | | | | | | |
8.625%, 1/15/19 | | | 28,613,000 | | | | 33,372,973 | |
3.125%, 10/15/22 | | | 144,337,000 | | | | 140,262,944 | |
Sprint Corp.
6.00%, 12/1/16 | | | 303,716,000 | | | | 302,197,420 | |
Teck Resources, Ltd.(c) (Canada) | | | | | | | | |
4.75%, 1/15/22 | | | 13,000,000 | | | | 6,305,000 | |
3.75%, 2/1/23 | | | 26,161,000 | | | | 12,099,463 | |
6.00%, 8/15/40 | | | 17,000,000 | | | | 7,140,000 | |
6.25%, 7/15/41 | | | 36,795,000 | | | | 16,189,800 | |
5.40%, 2/1/43 | | | 51,150,000 | | | | 21,099,375 | |
Telecom Italia SPA(c) (Italy) | | | | | | | | |
6.999%, 6/4/18 | | | 165,232,000 | | | | 178,450,560 | |
7.175%, 6/18/19 | | | 200,711,000 | | | | 221,287,892 | |
5.303%, 5/30/24(b) | | | 154,656,000 | | | | 152,722,800 | |
7.20%, 7/18/36 | | | 53,458,000 | | | | 53,992,580 | |
7.721%, 6/4/38 | | | 118,140,000 | | | | 123,160,950 | |
The Kraft Heinz Co.
3.95%, 7/15/25(b) | | | 36,303,000 | | | | 36,654,449 | |
Time Warner Cable, Inc. | | | | | | | | |
8.75%, 2/14/19 | | | 130,460,000 | | | | 151,378,870 | |
8.25%, 4/1/19 | | | 237,543,000 | | | | 272,993,442 | |
5.00%, 2/1/20 | | | 20,700,000 | | | | 21,911,488 | |
4.125%, 2/15/21 | | | 30,545,000 | | | | 31,188,705 | |
4.00%, 9/1/21 | | | 40,609,000 | | | | 41,003,313 | |
6.55%, 5/1/37 | | | 46,188,000 | | | | 46,716,391 | |
6.75%, 6/15/39 | | | 112,072,000 | | | | 112,470,528 | |
Time Warner, Inc. | | | | | | | | |
7.625%, 4/15/31 | | | 281,417,000 | | | | 348,204,852 | |
7.70%, 5/1/32 | | | 231,134,000 | | | | 288,546,299 | |
TransCanada Corp.(c) (Canada)
5.625%, 5/20/75(a) | | | 237,639,000 | | | | 219,717,217 | |
Twenty-First Century Fox, Inc. | | | | | | | | |
6.20%, 12/15/34 | | | 14,795,000 | | | | 16,790,121 | |
6.40%, 12/15/35 | | | 49,525,000 | | | | 57,042,845 | |
6.15%, 3/1/37 | | | 31,905,000 | | | | 35,549,476 | |
6.65%, 11/15/37 | | | 79,075,000 | | | | 91,889,974 | |
6.15%, 2/15/41 | | | 40,108,000 | | | | 45,090,296 | |
| | | | | | | | |
| | |
| | | PAR VALUE | | | VALUE | |
Union Pacific Corp. | | | | | | | | |
6.70%, 2/23/19 | | $ | 2,427,820 | | | $ | 2,587,911 | |
7.60%, 1/2/20 | | | 1,125,478 | | | | 1,279,734 | |
6.061%, 1/17/23 | | | 6,682,098 | | | | 7,322,390 | |
4.698%, 1/2/24 | | | 3,639,828 | | | | 3,890,066 | |
3.646%, 2/15/24 | | | 35,886,000 | | | | 37,476,037 | |
3.75%, 3/15/24 | | | 9,550,000 | | | | 10,019,879 | |
5.082%, 1/2/29 | | | 8,187,160 | | | | 8,890,290 | |
5.866%, 7/2/30 | | | 43,098,738 | | | | 49,195,541 | |
6.176%, 1/2/31 | | | 31,842,455 | | | | 36,207,069 | |
Verizon Communications, Inc. | | | | | | | | |
4.15%, 3/15/24 | | | 66,000,000 | | | | 67,867,866 | |
3.50%, 11/1/24 | | | 169,000,000 | | | | 167,003,603 | |
4.272%, 1/15/36 | | | 163,817,000 | | | | 147,862,207 | |
6.55%, 9/15/43 | | | 403,637,000 | | | | 479,188,563 | |
Vulcan Materials Co.
7.50%, 6/15/21 | | | 143,984,000 | | | | 167,741,360 | |
Xerox Corp. | | | | | | | | |
6.40%, 3/15/16 | | | 72,137,000 | | | | 72,802,031 | |
7.20%, 4/1/16 | | | 25,586,000 | | | | 25,916,827 | |
6.75%, 2/1/17 | | | 62,799,000 | | | | 65,807,637 | |
2.95%, 3/15/17 | | | 1,125,000 | | | | 1,133,397 | |
6.35%, 5/15/18 | | | 106,052,000 | | | | 113,391,965 | |
5.625%, 12/15/19 | | | 87,407,000 | | | | 92,985,140 | |
4.50%, 5/15/21 | | | 63,744,000 | | | | 64,366,014 | |
Zoetis, Inc. | | | | | | | | |
3.45%, 11/13/20 | | | 39,377,000 | | | | 39,424,213 | |
4.50%, 11/13/25 | | | 156,205,000 | | | | 158,403,117 | |
| | | | | | | | |
| | | | | | | 12,705,173,014 | |
UTILITIES: 1.3% | | | | | | | | |
Dominion Resources, Inc.
5.75%, 10/1/54(a) | | | 232,036,000 | | | | 227,348,872 | |
Enel SPA(c) (Italy) | | | | | | | | |
6.80%, 9/15/37(b) | | | 153,664,000 | | | | 187,631,120 | |
6.00%, 10/7/39(b) | | | 137,712,000 | | | | 153,989,834 | |
| | | | | | | | |
| | | | | | | 568,969,826 | |
| | | | | | | | |
| | | | | | | 19,968,593,259 | |
| | | | | | | | |
TOTAL DEBT SECURITIES
(Cost $41,826,048,489) | | | | | | | 41,883,192,379 | |
| | |
| PAGE 12 § DODGE & COX INCOME FUND | | See accompanying Notes to Financial Statements |
| | | | |
| PORTFOLIO OF INVESTMENTS | | | December 31, 2015 | |
| | | | | | | | |
| SHORT-TERM INVESTMENTS: 2.1% | |
| | |
| | | PAR VALUE | | | VALUE | |
COMMERCIAL PAPER: 0.7% | | | | | | | | |
Anthem, Inc.
1/20/16(b) | | $ | 100,000,000 | | | $ | 99,959,889 | |
UnitedHealth Group, Inc.
1/7/16(b) | | | 173,000,000 | | | | 172,980,970 | |
| | | | | | | | |
| | | | | | | 272,940,859 | |
MONEY MARKET FUND: 0.1% | | | | | | | | |
SSgA U.S. Treasury Money
Market Fund | | | 43,184,920 | | | | 43,184,920 | |
| |
REPURCHASE AGREEMENT: 1.3% | | | | | |
Fixed Income Clearing Corporation(d) 0.08%, dated 12/31/15, due 1/4/16, maturity value $574,252,104 | | | 574,247,000 | | | | 574,247,000 | |
| | | | | | | | |
TOTAL SHORT-TERM INVESTMENTS
(Cost $890,372,779) | | | $ | 890,372,779 | |
| | | | | | | | |
TOTAL INVESTMENTS
(Cost $42,716,421,268) | | | 99.2 | % | | $ | 42,773,565,158 | |
OTHER ASSETS LESS LIABILITIES | | | 0.8 | % | | | 351,687,601 | |
| | | | | | | | |
| NET ASSETS | | | 100.0 | % | | $ | 43,125,252,759 | |
| | | | | | | | |
| (b) | Security exempt from registration under Rule 144A of the Securities Act of 1933. The security may be resold in transactions exempt from registration, normally to qualified institutional buyers. As of December 31, 2015, all such securities in total represented $6,277,368,282 or 14.7% of net assets. These securities have been deemed liquid by Dodge & Cox, investment manager, pursuant to procedures approved by the Fund’s Board of Trustees. |
| (c) | Security denominated in U.S. dollars |
| (d) | Repurchase agreement is collateralized by U.S. Treasury Note 1.75%, 12/31/20. Total collateral value is $585,736,913. |
| (e) | Subsidiary (see below) |
Debt securities are grouped by parent company unless otherwise noted. Actual securities may be issued by the listed parent company or one of its subsidiaries. In determining a parent company’s country designation, the Fund generally references the country of incorporation.
ARM: Adjustable Rate Mortgage
CMO: Collateralized Mortgage Obligation
DUS: Delegated Underwriting and Servicing
GO: General Obligation
RB: Revenue Bond
REMIC: Real Estate Mortgage Investment Conduit
FUTURES CONTRACTS
| | | | | | | | | | | | | | | | |
| Description | | Number of
Contracts | | | Expiration
Date | | | Notional
Amount | | | Unrealized
Appreciation/
(Depreciation) | |
10 Year U.S. Treasury Note— Short Position | | | 18,678 | | | | Mar 2016 | | | $ | (2,351,676,938 | ) | | $ | 8,831,538 | |
Long-Term U.S. Treasury Bond— Short Position | | | 11,371 | | | | Mar 2016 | | | | (1,804,435,562 | ) | | | (5,762,192 | ) |
| | | | | | | | | | | | | | | | |
| | | | | | | | | | | | | | $ | 3,069,346 | |
| | | | | | | | | | | | | | | | |
| | |
| See accompanying Notes to Financial Statements | | DODGE & COX INCOME FUND §PAGE 13 |
| | | | |
STATEMENT OF ASSETS AND LIABILITIES | |
| |
| | | December 31, 2015 | |
ASSETS: | | | | |
Investments, at value (cost $42,716,421,268) | | $ | 42,773,565,158 | |
Cash held at broker | | | 74,679,210 | |
Receivable for investments sold | | | 23,335,462 | |
Receivable for Fund shares sold | | | 40,308,548 | |
Interest receivable | | | 386,215,271 | |
Prepaid expenses and other assets | | | 223,995 | |
| | | | |
| | | 43,298,327,644 | |
| | | | |
LIABILITIES: | | | | |
Payable to broker for variation margin | | | 16,915,938 | |
Payable for Fund shares redeemed | | | 139,049,185 | |
Management fees payable | | | 14,800,439 | |
Accrued expenses | | | 2,309,323 | |
| | | | |
| | | 173,074,885 | |
| | | | |
NET ASSETS | | $ | 43,125,252,759 | |
| | | | |
NET ASSETS CONSIST OF: | | | | |
Paid in capital | | $ | 43,145,771,932 | |
Undistributed net investment income | | | 12,530,465 | |
Undistributed net realized loss | | | (93,262,874 | ) |
Net unrealized appreciation | | | 60,213,236 | |
| | | | |
| | $ | 43,125,252,759 | |
| | | | |
Fund shares outstanding (par value $0.01 each,
unlimited shares authorized) | | | 3,244,929,885 | |
Net asset value per share | | $ | 13.29 | |
|
STATEMENT OF OPERATIONS | |
| |
| | | Year Ended
December 31, 2015 | |
INVESTMENT INCOME: | | | | |
Dividends | | $ | 28,970,448 | |
Interest | | | 1,452,159,615 | |
| | | | |
| | | 1,481,130,063 | |
| | | | |
EXPENSES: | | | | |
Management fees | | | 174,080,596 | |
Custody and fund accounting fees | | | 672,473 | |
Transfer agent fees | | | 8,733,946 | |
Professional services | | | 187,581 | |
Shareholder reports | | | 1,513,816 | |
Registration fees | | | 956,756 | |
Trustees’ fees | | | 237,500 | |
Miscellaneous | | | 548,505 | |
| | | | |
| | | 186,931,173 | |
| | | | |
NET INVESTMENT INCOME | | | 1,294,198,890 | |
| | | | |
|
REALIZED AND UNREALIZED GAIN (LOSS): | |
Net realized loss | | | | |
Investments | | | (5,284,623 | ) |
Treasury futures contracts | | | (84,502,080 | ) |
Net change in unrealized appreciation/depreciation | | | | |
Investments | | | (1,566,447,658 | ) |
Treasury futures contracts | | | 65,259,551 | |
| | | | |
Net realized and unrealized loss | | | (1,590,974,810 | ) |
| | | | |
NET DECREASE IN NET ASSETS
FROM OPERATIONS | | $ | (296,775,920 | ) |
| | | | |
| | | | | | | | |
STATEMENT OF CHANGES IN NET ASSETS | |
| | |
| | | Year Ended
December 31, 2015 | | | Year Ended
December 31, 2014 | |
OPERATIONS: | | | | | | | | |
Net investment income | | $ | 1,294,198,890 | | | $ | 841,617,395 | |
Net realized gain (loss) | | | (89,786,703 | ) | | | 184,870,735 | |
Net change in unrealized
appreciation/depreciation | | | (1,501,188,107 | ) | | | 408,715,923 | |
| | | | | | | | |
| | | (296,775,920 | ) | | | 1,435,204,053 | |
| | | | | | | | |
| | |
DISTRIBUTIONS TO SHAREHOLDERS FROM: | | | | | | | | |
Net investment income | | | (1,293,890,373 | ) | | | (836,624,131 | ) |
Net realized gain | | | (25,501,766 | ) | | | (232,101,623 | ) |
| | | | | | | | |
Total distributions | | | (1,319,392,139 | ) | | | (1,068,725,754 | ) |
| | | | | | | | |
| | |
FUND SHARE
TRANSACTIONS: | | | | | | | | |
Proceeds from sale of shares | | | 14,066,640,197 | | | | 18,587,943,566 | |
Reinvestment of distributions | | | 1,067,877,119 | | | | 840,852,670 | |
Cost of shares redeemed | | | (9,521,033,129 | ) | | | (5,321,422,005 | ) |
| | | | | | | | |
Net increase from Fund
share transactions | | | 5,613,484,187 | | | | 14,107,374,231 | |
| | | | | | | | |
Total increase in net assets | | | 3,997,316,128 | | | | 14,473,852,530 | |
| | |
NET ASSETS: | | | | | | | | |
Beginning of year | | | 39,127,936,631 | | | | 24,654,084,101 | |
| | | | | | | | |
End of year (including undistributed net investment income of $12,530,465 and $12,221,948, respectively) | | $ | 43,125,252,759 | | | $ | 39,127,936,631 | |
| | | | | | | | |
| | |
SHARE INFORMATION: | | | | | | | | |
Shares sold | | | 1,023,992,169 | | | | 1,341,256,318 | |
Distributions reinvested | | | 79,082,204 | | | | 61,052,395 | |
Shares redeemed | | | (698,078,052 | ) | | | (384,742,642 | ) |
| | | | | | | | |
Net increase in shares outstanding | | | 404,996,321 | | | | 1,017,566,071 | |
| | | | | | | | |
| | |
| PAGE 14 § DODGE & COX INCOME FUND | | See accompanying Notes to Financial Statements |
NOTES TO FINANCIAL STATEMENTS
NOTE 1—ORGANIZATION AND SIGNIFICANT ACCOUNTING POLICIES
Dodge & Cox Income Fund (the “Fund”) is one of the series constituting the Dodge & Cox Funds (the “Trust” or the “Funds”). The Trust is organized as a Delaware statutory trust and is registered under the Investment Company Act of 1940, as amended, as an open-end management investment company. The Fund commenced operations on January 3, 1989, and seeks high and stable current income consistent with long-term preservation of capital. Risk considerations and investment strategies of the Fund are discussed in the Fund’s Prospectus.
The financial statements have been prepared in conformity with accounting principles generally accepted in the United States of America, which require the use of estimates and assumptions by management. Actual results may differ from those estimates. Significant accounting policies are as follows:
Security valuation The Fund’s net assets are valued as of the close of trading on the New York Stock Exchange (NYSE), generally 4:00 p.m. Eastern Time, each day that the NYSE is open for business. If the NYSE is closed due to inclement weather, technology problems, or for any other reason on a day it would normally be open for business, or the NYSE has an unscheduled early closing on a day it has opened for business, the Fund reserves the right to calculate the Fund’s NAV as of the normally scheduled close of regular trading on the NYSE for that day, provided that Dodge & Cox believes that it can obtain reliable market quotes or valuations.
Debt securities and non-exchange traded derivatives are valued based on prices received from independent pricing services which utilize both dealer-supplied valuations and pricing models. Pricing models may consider quoted prices for similar securities, interest rates, prepayment speeds, and credit risk. Exchange-traded derivatives are valued at the settlement price determined by the relevant exchange. Security values are not discounted based on the size of the Fund’s position. Short-term securities less than 60 days to maturity may be valued at amortized cost if amortized cost approximates current value. Mutual funds are valued at their respective net asset values. All securities held by the Fund are denominated in U.S. dollars.
If market quotations are not readily available or if a security’s value is believed to have materially changed after the close of the security’s primary market but before the close of trading on the NYSE, the security is valued at fair value as determined in good faith by or under the direction of the Fund’s Board of Trustees. The Board of Trustees has appointed Dodge & Cox, the Fund’s investment manager, to make fair value determinations in accordance with the Dodge & Cox Funds Valuation Policies (“Valuation Policies”), subject to Board oversight. Dodge & Cox has established a Pricing Committee that is comprised of representatives from Treasury, Legal, Compliance, and Operations. The Pricing Committee is responsible for implementing the Valuation Policies, including determining the fair value of securities when market quotations or market-based valuations are not readily
available or are deemed unreliable. The Pricing Committee considers relevant indications of value that are reasonably available to it in determining the fair value assigned to a particular security, such as the value of similar financial instruments, trading volumes, contractual restrictions on disposition, related corporate actions, and changes in economic conditions. In doing so, the Pricing Committee employs various methods for calibrating fair valuation approaches, including a regular review of key inputs and assumptions, back-testing, and review of any related market activity.
Valuing securities through a fair value determination involves greater reliance on judgment than valuation of securities based on readily available market quotations. In some instances, lack of information and uncertainty as to the significance of information may lead to a conclusion that a prior valuation is the best indication of a security’s value. When fair value pricing is employed, the prices of securities used by the Fund to calculate its NAV may differ from quoted or published prices for the same securities.
Security transactions, investment income, expenses, and distributions Security transactions are recorded on the trade date. Realized gains and losses on securities sold are determined on the basis of identified cost.
Interest income is recorded on the accrual basis. Interest income includes coupon interest, amortization of premium and accretion of discount on debt securities, and gain/loss on paydowns. The ability of the issuers of the debt securities held by the Fund to meet their obligations may be affected by economic developments in a specific industry, state, or region. Debt obligations may be placed on non-accrual status and related interest income may be reduced by ceasing current accruals and writing off interest receivables when the collection of all or a portion of interest has become doubtful. A debt obligation is removed from non-accrual status when the issuer resumes interest payments or when collectibility of interest is reasonably assured. Dividend income is recorded on the ex-dividend date.
Expenses are recorded on the accrual basis. Some expenses of the Trust can be directly attributed to a specific series. Expenses which cannot be directly attributed are allocated among the Funds in the Trust based on relative net assets or other expense methodologies determined by the nature of the expense.
Distributions to shareholders are recorded on the ex-dividend date.
Repurchase agreements The Fund enters into repurchase agreements, secured by U.S. government or agency securities, which involve the purchase of securities from a counterparty with a simultaneous commitment to resell the securities at an agreed-upon date and price. It is the Fund’s policy that its custodian take possession of the underlying collateral securities, the fair value of which exceeds the principal amount of the repurchase transaction, including accrued interest, at all times. In the event of default by the counterparty, the Fund has the contractual right to liquidate the securities and to apply the proceeds in satisfaction of the obligation.
DODGE & COX INCOME FUND §PAGE 15
NOTES TO FINANCIAL STATEMENTS
Futures Contracts Futures contracts involve an obligation to purchase or sell (depending on whether the Fund has entered a long or short futures contract, respectively) an asset at a future date, at a price set at the time of the contract. Upon entering into a futures contract, the Fund is required to deposit an amount of cash or liquid assets (referred to as initial margin) in a segregated account with the clearing broker. Subsequent payments (referred to as variation margin) to and from the clearing broker are made on a daily basis based on changes in the market value of futures contracts. Futures contracts are traded publicly and their market value changes daily. Changes in the market value of open futures contracts are recorded as unrealized appreciation or depreciation in the Statement of Operations. Realized gains and losses on futures contracts are recorded in the Statement of Operations at the closing or expiration of the contracts. Cash deposited with a broker as initial margin is recorded on the Statement of Assets and Liabilities. A receivable and/or payable to brokers for daily variation margin is also recorded on the Statement of Assets and Liabilities.
Investments in futures contracts may include certain risks, which may be different from, and potentially greater than, those of the underlying securities. To the extent the Fund uses futures, it is exposed to additional volatility and potential losses resulting from leverage.
The Fund has maintained short Treasury futures contracts to assist with the management of the portfolio’s interest rate exposure. During the year ended December 31, 2015, these Treasury futures contracts had notional values ranging from 5% to 10% of net assets.
Indemnification Under the Trust’s organizational documents, its officers and trustees are indemnified against certain liabilities arising out of the performance of their duties to the Trust. In addition, in the normal course of business the Trust enters into contracts that provide general indemnities to other parties. The Trust’s maximum exposure under these arrangements is unknown as this would involve future claims that may be made against the Trust that have not yet occurred.
NOTE 2—VALUATION MEASUREMENTS
Various inputs are used in determining the value of the Fund’s investments. These inputs are summarized in the three broad levels listed below.
| § | | Level 1: Quoted prices in active markets for identical securities |
| § | | Level 2: Other significant observable inputs (including quoted prices for similar securities, market indices, interest rates, credit risk, etc.) |
| § | | Level 3: Significant unobservable inputs (including Fund management’s assumptions in determining the fair value of investments) |
The inputs or methodology used for valuing securities are not necessarily an indication of the risk associated with investing in those securities.
The following is a summary of the inputs used to value the Fund’s holdings at December 31, 2015:
| | | | | | | | |
| Classification(a) | | LEVEL 1 (Quoted Prices) | | | LEVEL 2 (Other Significant
Observable Inputs) | |
Securities | | | | | | | | |
Debt Securities | | | | | | | | |
U.S. Treasury | | $ | — | | | $ | 2,149,401,099 | |
Government-Related | | | — | | | | 3,186,552,877 | |
Mortgage-Related | | | — | | | | 14,126,545,758 | |
Asset-Backed | | | — | | | | 2,452,099,386 | |
Corporate | | | — | | | | 19,968,593,259 | |
Short-term Investments | | | | | | | | |
Commercial Paper | | | — | | | | 272,940,859 | |
Money Market Fund | | | 43,184,920 | | | | — | |
Repurchase Agreement | | | — | | | | 574,247,000 | |
| | | | | | | | |
Total Securities | | $ | 43,184,920 | | | $ | 42,730,380,238 | |
| | | | | | | | |
Other Financial Instruments(b) | | | | | |
Treasury Futures Contracts | | | | | | | | |
Appreciation | | $ | 8,831,538 | | | $ | — | |
Depreciation | | | (5,762,192 | ) | | | — | |
| | | | | | | | | |
| (a) | U.S. Treasury securities were transferred from Level 1 to Level 2 during the year. There were no Level 3 securities at December 31, 2015 and 2014 and there were no transfers to Level 3 during the year. |
| (b) | Represents unrealized appreciation/(depreciation). |
NOTE 3—RELATED PARTY TRANSACTIONS
Management fees Under a written agreement approved by a unanimous vote of the Board of Trustees, the Fund pays an annual management fee of 0.50% of the Fund’s average daily net assets up to $100 million and 0.40% of the Fund’s average daily net assets in excess of $100 million to Dodge & Cox, investment manager of the Fund. The agreement further provides that Dodge & Cox shall waive its fee to the extent that such fee plus all other ordinary operating expenses of the Fund exceed 1% of the average daily net assets for the year.
Fund officers and trustees All officers and two of the trustees of the Trust are officers or employees of Dodge & Cox. The Trust pays a fee only to those trustees who are not affiliated with Dodge & Cox.
Cross trades Cross trading is the buying or selling of portfolio securities between funds to which Dodge & Cox serves as investment manager. At its regularly scheduled quarterly meetings, the Board of Trustees reviews such transactions as of the most recent calendar quarter for compliance with the requirements and restrictions set forth by Rule 17a-7 under the Investment Company Act of 1940. During the year ending December 31, 2015, the Fund executed cross trades with the Dodge & Cox Balanced Fund pursuant to Rule 17a-7 under the Investment Company Act of 1940.
PAGE 16 § DODGE & COX INCOME FUND
NOTES TO FINANCIAL STATEMENTS
NOTE 4—INCOME TAX INFORMATION AND DISTRIBUTIONS TO SHAREHOLDERS
A provision for federal income taxes is not required since the Fund intends to continue to qualify as a regulated investment company under Subchapter M of the Internal Revenue Code and distribute all of its taxable income to shareholders. Distributions are determined in accordance with income tax regulations, and such amounts may differ from net investment income and realized gains for financial reporting purposes. Financial reporting records are adjusted for permanent book to tax differences at year end to reflect tax character.
Book to tax differences are primarily due to differing treatments of wash sales, net short-term realized gain (loss), and Treasury futures contracts. At December 31, 2015, the cost of investments for federal income tax purposes was $42,716,465,638.
Distributions during the years noted below were characterized as follows for federal income tax purposes:
| | | | | | | | |
| | | Year Ended December 31, 2015 | | | Year Ended December 31, 2014 | |
Ordinary income | | | $1,300,100,433 | | | | $864,273,705 | |
| | | ($0.405 per share) | | | | ($0.397 per share) | |
| | |
Long-term capital gain | | | $19,291,706 | | | | $204,452,049 | |
| | | ($0.006 per share) | | | | ($0.088 per share) | |
At December 31, 2015, the tax basis components of distributable earnings were as follows:
| | | | |
Unrealized appreciation | | $ | 962,670,848 | |
Unrealized depreciation | | | (905,571,328 | ) |
| | | | |
Net unrealized appreciation | | | 57,099,520 | |
Undistributed ordinary income | | | 12,919,601 | |
Undistributed long-term capital gain | | | 59,927,325 | |
Deferred loss(a) | | | (150,465,619 | ) |
| (a) | Represents net short-term realized loss incurred between November 1, 2015 and December 31, 2015. As permitted by tax regulations, the Fund has elected to treat this loss as arising in 2016. |
Fund management has reviewed the tax positions for open periods (three years and four years, respectively, from filing the Fund’s Federal and State tax returns) as applicable to the Fund, and has determined that no provision for income tax is required in the Fund’s financial statements.
NOTE 5—LOAN FACILITIES
Pursuant to an exemptive order issued by the Securities and Exchange Commission (SEC), the Fund may participate in an interfund lending facility (Facility). The Facility allows the Fund to borrow money from or loan money to the Funds. Loans under the Facility are made for temporary or emergency purposes, such as to fund shareholder redemption requests. Interest on borrowings is the average of the current repurchase agreement rate and the bank loan rate. There was no activity in the Facility during the year.
All Funds in the Trust participate in a $500 million committed credit facility (Line of Credit) with State Street Bank and Trust Company, to be utilized for temporary or emergency purposes to fund shareholder redemptions or for other short-term liquidity purposes. The maximum amount available to the Fund is $250 million. Each Fund pays an annual commitment fee on its pro-rata portion of the Line of Credit. For the year ended December 31, 2015, the Fund’s commitment fee amounted to $146,884 and is reflected as a Miscellaneous Expense in the Statement of Operations. Interest on borrowings is charged at the prevailing rate. There were no borrowings on the Line of Credit during the year.
NOTE 6—PURCHASES AND SALES OF INVESTMENTS
For the year ended December 31, 2015, purchases and sales of securities, other than short-term securities and U.S. government securities, aggregated $9,648,393,292 and $2,894,870,558, respectively. For the year ended December 31, 2015, purchases and sales of U.S. government securities aggregated $6,322,132,495 and $7,335,682,500, respectively.
NOTE 7—SUBSEQUENT EVENTS
Fund management has determined that no material events or transactions occurred subsequent to December 31, 2015, and through the date of the Fund’s financial statements issuance, which require additional disclosure in the Fund’s financial statements.
DODGE & COX INCOME FUND §PAGE 17
FINANCIAL HIGHLIGHTS
| | | | | | | | | | | | | | | | | | | | |
SELECTED DATA AND RATIOS (for a share outstanding throughout each year) | | Year Ended December 31, | |
| | | 2015 | | | 2014 | | | 2013 | | | 2012 | | | 2011 | |
| | | | |
Net asset value, beginning of year | | | $13.78 | | | | $13.53 | | | | $13.86 | | | | $13.30 | | | | $13.23 | |
Income from investment operations: | | | | | | | | | | | | | | | | | | | | |
Net investment income | | | 0.40 | | | | 0.39 | | | | 0.42 | | | | 0.48 | | | | 0.55 | |
Net realized and unrealized gain (loss) | | | (0.48 | ) | | | 0.35 | | | | (0.33 | ) | | | 0.56 | | | | 0.07 | |
| | | | |
Total from investment operations | | | (0.08 | ) | | | 0.74 | | | | 0.09 | | | | 1.04 | | | | 0.62 | |
| | | | |
Distributions to shareholders from: | | | | | | | | | | | | | | | | | | | | |
Net investment income | | | (0.40 | ) | | | (0.39 | ) | | | (0.42 | ) | | | (0.48 | ) | | | (0.55 | ) |
Net realized gain | | | (0.01 | ) | | | (0.10 | ) | | | — | | | | — | | | | — | |
| | | | |
Total distributions | | | (0.41 | ) | | | (0.49 | ) | | | (0.42 | ) | | | (0.48 | ) | | | (0.55 | ) |
| | | | |
Net asset value, end of year | | | $13.29 | | | | $13.78 | | | | $13.53 | | | | $13.86 | | | | $13.30 | |
| | | | |
Total return | | | (0.59 | )% | | | 5.48 | % | | | 0.64 | % | | | 7.94 | % | | | 4.76 | % |
Ratios/supplemental data: | | | | | | | | | | | | | | | | | | | | |
Net assets, end of year (millions) | | | $43,125 | | | | $39,128 | | | | $24,654 | | | | $26,539 | | | | $24,051 | |
Ratio of expenses to average net assets | | | 0.43 | % | | | 0.44 | % | | | 0.43 | % | | | 0.43 | % | | | 0.43 | % |
Ratio of net investment income to average net assets | | | 2.97 | % | | | 2.89 | % | | | 3.00 | % | | | 3.52 | % | | | 4.12 | % |
Portfolio turnover rate | | | 24 | % | | | 27 | % | | | 38 | % | | | 26 | % | | | 27 | % |
See accompanying Notes to Financial Statements
PAGE 18 § DODGE & COX INCOME FUND
REPORT OF INDEPENDENT REGISTERED PUBLIC ACCOUNTING FIRM
To the Trustees of Dodge & Cox Funds and Shareholders of Dodge & Cox Income Fund
In our opinion, the accompanying statement of assets and liabilities, including the portfolio of investments, and the related statements of operations and of changes in net assets and the financial highlights present fairly, in all material respects, the financial position of Dodge & Cox Income Fund (the “Fund”, one of the series constituting Dodge & Cox Funds) at December 31, 2015, the results of its operations for the year then ended, the changes in its net assets for each of the two years in the period then ended and the financial highlights for each of the five years in the period then ended, in conformity with accounting principles generally accepted in the United States of America. These financial statements and financial highlights (hereafter referred to as financial statements) are the responsibility of the Fund’s management. Our responsibility is to express an opinion on these financial statements based on our audits. We conducted our audits of these financial statements in accordance with the standards of the Public Company Accounting Oversight Board (United States). Those standards require that we plan and perform the audit to obtain reasonable assurance about whether the financial statements are free of material misstatement. An audit includes examining, on a test basis, evidence supporting the amounts and disclosures in the financial statements, assessing the accounting principles used and significant estimates made by management, and evaluating the overall financial statement presentation. We believe that our audits, which included confirmation of securities at December 31, 2015, by correspondence with the custodian and brokers, provide a reasonable basis for our opinion.
PricewaterhouseCoopers LLP
San Francisco, California
February 25, 2016
DODGE & COX INCOME FUND §PAGE 19
BOARD APPROVAL OF FUNDS’ INVESTMENT MANAGEMENT AGREEMENTS AND MANAGEMENT FEES
(unaudited)
The Board of Trustees is responsible for overseeing the performance of the Dodge & Cox Funds’ investment manager and determining whether to continue the Investment Management Agreements between the Funds and Dodge & Cox each year (the “Agreements”). At a meeting of the Board of Trustees of the Trust held on December 16, 2015, the Trustees, by a unanimous vote (including a separate vote of those Trustees who are not “interested persons” (as defined in the Investment Company Act of 1940) (the “Independent Trustees”)), approved the renewal of the Agreements for an additional one-year term through December 31, 2016 with respect to each Fund. During the course of the year, the Board received a wide variety of materials relating to the investment management and administrative services provided by Dodge & Cox and the performance of each of the Funds.
INFORMATION RECEIVED
In advance of the meeting, the Board, including each of the Independent Trustees, requested, received, and reviewed materials relating to the Agreements and the services provided by Dodge & Cox. The Independent Trustees retained Morningstar® to prepare an independent expense and performance summary for each Fund and comparable funds managed by other advisers identified by Morningstar. The Morningstar materials included information regarding advisory fee rates, expense ratios, and transfer agency, custodial, and distribution expenses, as well as appropriate performance comparisons to each Fund’s peer group and an index or combination of indices. The Morningstar materials also included a comparison of expenses of various share classes offered by comparable funds. The materials reviewed by the Board contained information concerning, among other things, Dodge & Cox’s profitability, financial results and condition, advisory fee revenue, and separate account and sub-adviser fund fee schedules. The Board additionally considered the Funds’ brokerage commissions, turnover rates, sales and redemption data and the significant investment that Dodge & Cox makes in research used in managing the Funds. The Board received and reviewed memoranda and related materials addressing, among other things, Dodge & Cox’s services to the Funds; how Dodge & Cox Funds’ fees compare to fees of peer group funds; the different fees, services, costs, and risks associated with other accounts managed by Dodge & Cox as compared to the Dodge & Cox Funds; and the ways in which the Funds realize economies of scale. Throughout the process of reviewing the services provided by Dodge & Cox and preparing for the meeting, the Independent Trustees found Dodge & Cox to be open, forthright, detailed, and very helpful in answering questions about all issues. The Board received copies of the Agreements and a memorandum from the independent legal counsel to the Independent Trustees discussing the factors generally regarded as appropriate to consider in evaluating advisory arrangements. The Trust’s Contract Review Committee, consisting solely of Independent Trustees, met with the independent legal
counsel on November 11, 2015, and again on December 16, 2015, to discuss whether to renew the Agreements. The Board, including the Independent Trustees, subsequently concluded that the existing Agreements are fair and reasonable and voted to approve the Agreements. In considering the Agreements, the Board, including the Independent Trustees, did not identify any single factor or particular information as all-important or controlling. In reaching the decision to approve the Agreements, the Board considered several factors, discussed below, to be key factors and reached the conclusions described below.
NATURE, QUALITY, AND EXTENT OF THE SERVICES
The Board considered that Dodge & Cox provides a wide range of services to the Funds in addition to portfolio management and that the quality of these services has been excellent in all respects. The extensive nature of services provided by Dodge & Cox has been documented in materials provided to the Board and in presentations made to the Board throughout the year. In particular, the Board considered the nature, quality, and extent of portfolio management, administrative, and shareholder services performed by Dodge & Cox. With regard to portfolio management services, the Board considered Dodge & Cox’s established long-term history of care and conscientiousness in the management of the Funds; its demonstrated consistency in investment approach and depth; the background and experience of the Dodge & Cox Investment Policy Committee, International Investment Policy Committee, Global Stock Investment Policy Committee, Fixed Income Investment Policy Committee, and Global Bond Investment Policy Committee, and research analysts responsible for managing the Funds; its methods for assessing the regulatory and investment climate in various jurisdictions; Dodge & Cox’s overall high level of attention to its core investment management function; and its commitment to the Funds and their shareholders. In the area of administrative and shareholder services, the Board considered the excellent quality of Dodge & Cox’s work in areas such as compliance, legal services, trading, proxy voting, technology, oversight of the Funds’ transfer agent and custodian, tax compliance, and shareholder communication through its website and other means. The Board also noted Dodge & Cox’s diligent disclosure policy, its favorable compliance record, and its reputation as a trusted, shareholder-friendly mutual fund family. In addition, the Board considered that Dodge & Cox manages approximately $185 billion in Fund assets with fewer professionals than most comparable funds, and that on average these professionals have more experience and longer tenure than investment professionals at comparable funds. The Board also noted that Dodge & Cox is an investment research-oriented firm with no other business endeavors to distract management’s attention from its research efforts, and that its investment professionals adhere to a consistent investment approach across the Funds. The Board further considered the favorable stewardship grades given by Morningstar to each of the Funds and the “Gold” analyst rating awarded by Morningstar to all of the Funds except the Global Bond Fund. The Board concluded that it was satisfied with the nature, extent, and quality of investment management and other services provided to the Funds by Dodge & Cox.
PAGE 20 § DODGE & COX INCOME FUND
INVESTMENT PERFORMANCE
The Board considered short-term and long-term investment performance for each Fund (including periods of outperformance or underperformance) as compared to both relevant indices and the performance of such Fund’s peer group. The Board noted that the Funds had weak absolute and relative performance in 2015, but remained solid performers over longer periods. The Board determined after extensive review and inquiry that Dodge & Cox’s historic, long-term, team-oriented, bottom-up investment approach remains consistent and that Dodge & Cox continues to be distinguished by its integrity, transparency, and independence. The Board considered that the performance of the Funds is the result of a team-oriented investment management process that emphasizes a long-term investment horizon, comprehensive independent research, price discipline, low cost and low portfolio turnover. The Board also considered that the investment performance delivered by Dodge & Cox to the Funds appeared to be consistent with the relevant performance delivered for other clients of Dodge & Cox. The Board concluded that Dodge & Cox has delivered favorable long-term performance for Fund investors consistent with the long-term investment strategies being pursued by the Funds.
COSTS AND ANCILLARY BENEFITS
Costs of Services to Funds: Fees and Expenses. The Board considered each Fund’s management fee rate and expense ratio relative to each Fund’s peer group and relative to management fees charged by Dodge & Cox to other clients. In particular, the Board considered that the Funds continue to be substantially below their peer group median in expense ratios and that many media and industry reports specifically comment on the low expense ratios of the Funds, which have been a defining characteristic of the Funds for many years. The Board also evaluated the operating structures of the Funds and Dodge & Cox, noting that the Funds do not charge front-end sales commissions or distribution fees, and Dodge & Cox bears, among other things, the significant cost of third party research, reimbursement for recordkeeping and administrative costs to third-party retirement plan administrators, and administrative and office overhead.
The Board noted that expenses are well below industry averages. When compared to peer group funds, the Funds are in the quartile with the lowest expense ratios. The Board also considered that the Funds receive numerous administrative, regulatory compliance, legal, technology and shareholder support services from Dodge & Cox without any additional administrative fee and the fact that the Funds have relatively low transaction costs and portfolio turnover rates. The Board noted the Funds’ unusual single-share-class structure and reviewed Morningstar data showing that the few peer group funds with lower expense ratios often have other share classes with significantly higher expense ratios. In this regard, the Board considered that many of the Funds’ shareholders would not be eligible to purchase comparably-priced shares of many peer group funds, which typically make their lower-priced share classes available only to institutional investors. The Board determined that the Funds provide access for small investors to high quality investment management at a relatively low cost.
The Board reviewed information regarding the fee rates Dodge & Cox charges to separate accounts and subadvised funds that have investment programs similar to those of the Funds, including instances where separate account and sub-advised fund fees are lower than Fund fees. The Board considered differences in the nature and scope of services Dodge & Cox provides to the Funds as compared to other client accounts, differences in regulatory, litigation, and other risks as between Dodge & Cox Funds and other types of clients. The Board also noted that different markets exist for mutual fund and institutional separate account management services. With respect to non-U.S. funds sponsored and managed by Dodge & Cox that are comparable to the Funds in many respects, the Board noted that the fee rates charged by Dodge & Cox are the same as or higher than the fee rates charged to the Funds. After consideration of these matters, the Board concluded that the overall costs incurred by the Funds for the services they receive (including the management fee paid to Dodge & Cox) are reasonable and that the fees are acceptable based upon the qualifications, experience, reputation, and performance of Dodge & Cox and the low overall expense ratios of the Funds.
Profitability and Costs of Services to Dodge & Cox; “Fall-out” Benefits. The Board reviewed reports of Dodge & Cox’s financial position, profitability, and estimated overall value, and considered Dodge & Cox’s overall profitability within its context as a private, employee-owned S-Corporation and relative to the favorable services provided. The Board noted in particular that Dodge & Cox’s profits are not generated by high fee rates, but reflect an extraordinarily streamlined, efficient, and focused business approach toward investment management. The Board recognized the importance of Dodge & Cox’s profitability—which is derived solely from management fees and does not include other business ventures—to maintain its independence, stability, company culture and ethics, and management continuity. The Board also considered that the compensation/profit structure at Dodge & Cox includes a return on shareholder employees’ investment in the firm, which is vital for remaining independent and facilitating retention of management and investment professionals. The Board considered independent research indicating that firms that grow organically, rather than through acquisition, tend to have better performance. Key to organic growth is the ability to retain talented and experienced analysts, portfolio managers and other professionals.
The Board also considered that in January 2015, Dodge & Cox closed the International Stock Fund to new investors to pro-actively manage the growth of the Fund. The Stock Fund and Balanced Fund were similarly closed to new investors during periods of significant growth in the past. While these actions are intended to benefit existing shareholders, the effect is to reduce potential revenues to Dodge & Cox from new shareholders. The Board also considered potential “fall-out” benefits (including the receipt of research from unaffiliated brokers and reputational benefits to non-U.S. funds sponsored and managed by Dodge & Cox) that Dodge & Cox might receive as a result of its association with the Funds and determined that they are acceptable. The Board also noted that Dodge & Cox continues to invest substantial
DODGE & COX INCOME FUND §PAGE 21
sums in its business in order to provide enhanced services, systems and research capabilities, all of which benefit the Funds. The Board concluded that Dodge & Cox’s profitability is the keystone of its independence, stability and long-term investment performance and that the profitability of Dodge & Cox’s relationship with the Funds (including fall-out benefits) is fair and reasonable.
ECONOMIES OF SCALE
The Board considered whether there have been economies of scale with respect to the management of each Fund, whether the Funds have appropriately benefited from any economies of scale, and whether the management fee rate is reasonable in relation to the Fund assets and any economies of scale that may exist. In the Board’s view, any consideration of economies of scale must take account of the Funds’ low fee structure and the considerable efficiencies of the Funds’ organization and fee structure that has been realized by shareholders from the time of each Fund’s inception (i.e., from the first dollar). An assessment of economies of scale must also take into account that Dodge & Cox invests significant time and resources in each new Fund for months (and sometimes years) prior to launch; in addition, expenses are capped, which means that Dodge & Cox earns no revenue and subsidizes the operations of a new Fund for a period of time until it reaches scale.
In addition, the Board noted that Dodge & Cox has shared economies of scale by adding or enhancing services to the Funds over time, and that the internal costs of providing investment management, up-to-date technology, administrative, legal, and compliance services to the Funds continue to increase. For example, Dodge & Cox has increased its global research staff and investment resources over the years to address the increased complexity of investing in multinational and non-U.S. companies. In addition, Dodge & Cox has made substantial expenditures in other staff, technology, cybersecurity, and infrastructure to enable it to integrate credit and equity analyses and to be able to implement its strategy in a more effective and secure manner. Over the last ten years, Dodge & Cox has increased its spending on third party research, data services, trading systems, technology, and recordkeeping service expenses at a rate that has significantly outpaced the Funds’ growth rate during the same period.
The Board considered that Dodge & Cox has a history of voluntarily limiting asset growth in several Funds that experienced significant inflows by closing them to new investors in order to protect the Funds’ ability to achieve good investment returns for shareholders. The Board also observed that, even without fee breakpoints, the Funds are competitively priced in a very competitive market and that having a low fee from inception is better for shareholders than starting with a higher fee and adding breakpoints. The Board concluded that the current Dodge & Cox fee structure is fair and reasonable and adequately shares economies of scale that may exist.
CONCLUSION
Based on their evaluation of all material factors and assisted by the advice of independent legal counsel to the Independent Trustees, the Board, including the Independent Trustees, concluded that the advisory fee structure was fair and reasonable, that each Fund was paying a competitive fee for the services provided, that the scope and quality of Dodge & Cox’s services has provided substantial value for Fund shareholders over the long term, and that approval of the Agreements was in the best interests of each Fund and its shareholders.
FUND HOLDINGS
The Fund provides a complete list of its holdings four times each fiscal year, as of the end of each quarter. The Fund files the lists with the Securities and Exchange Commission (SEC) on Form N-CSR (second and fourth quarters) and Form N-Q (first and third quarters). Shareholders may view the Fund’s Forms N-CSR and N-Q on the SEC’s website at sec.gov. Forms N-CSR and N-Q may also be reviewed and copied at the SEC’s Public Reference Room in Washington, DC. Information regarding the operations of the Public Reference Room may be obtained by calling 202-551-8090 (direct) or 800-732-0330 (general SEC number). A list of the Fund’s quarter-end holdings is also available at dodgeandcox.com on or about 15 days following each quarter end and remains available on the web site until the list is updated in the subsequent quarter.
PROXY VOTING
For a free copy of the Fund’s proxy voting policies and procedures, please call 800-621-3979, visit the Fund’s website at dodgeandcox.com, or visit the SEC’s website at sec.gov. Information regarding how the Fund voted proxies relating to portfolio securities during the most recent 12-month period ending June 30 is also available at dodgeandcox.com or at sec.gov.
HOUSEHOLD MAILINGS
The Fund routinely mails shareholder reports and summary prospectuses to shareholders and, on occasion, proxy statements. In order to reduce the volume of mail, when possible, only one copy of these documents will be sent to shareholders who are part of the same family and share the same residential address.
If you have a direct account with the Funds and you do not want the mailing of shareholder reports and summary prospectuses combined with other members in your household, contact the Funds at 800-621-3979. Your request will be implemented within 30 days.
PAGE 22 § DODGE & COX INCOME FUND
DODGE & COX FUNDS—EXECUTIVE OFFICER & TRUSTEE INFORMATION
| | | | | | |
Name (Age) and
Address* | | Position with Trust (Year of Election or
Appointment) | | Principal Occupation During Past 5 Years | | Other Directorships Held by Trustees |
| INTERESTED TRUSTEES AND EXECUTIVE OFFICERS |
| Charles F. Pohl (57) | | Chairman and Trustee (Officer since 2004) | | Chairman (since 2013), Co-President (2011-2013), Senior Vice President (until 2011), and Director of Dodge & Cox; Chief Investment Officer, Portfolio Manager, Investment Analyst, and member of Investment Policy Committee (IPC), Global Stock Investment Policy Committee (GSIPC), International Investment Policy Committee (IIPC), and Fixed Income Investment Policy Committee (FIIPC) | | — |
| Dana M. Emery (54) | | President and Trustee (Trustee since 1993) | | Chief Executive Officer (since 2013), President (since 2011), Executive Vice President (until 2011), and Director of Dodge & Cox; Director of Fixed Income, Portfolio Manager, and member of FIIPC and Global Bond Investment Policy Committee (GBIPC) | | — |
| John A. Gunn (72) | | Senior Vice President (Officer since 1998) | | Chairman Emeritus (2011-2013), Chairman (until 2011), Chief Executive Officer (until 2010), and Director (until 2013) of Dodge & Cox; Portfolio Manager and member of IPC, GSIPC (until 2014), and IIPC (until 2015) | | — |
| Diana S. Strandberg (56) | | Senior Vice President (Officer since 2006) | | Senior Vice President (since 2011), Vice President (until 2011), and Director (since 2011) of Dodge & Cox; Director of International Equity (since 2009), Portfolio Manager, Investment Analyst, and member of IPC, GSIPC, IIPC, and GBIPC | | — |
| David H. Longhurst (58) | | Treasurer (Officer since 2006) | | Vice President and Assistant Treasurer of Dodge & Cox | | — |
| Thomas M. Mistele (62) | | Secretary (Officer since 1998) | | Chief Operating Officer, Director, Secretary, Senior Counsel (since 2011), and General Counsel (until 2011) of Dodge & Cox | | — |
| Katherine M. Primas (41) | | Chief Compliance Officer (Officer since 2009) | | Vice President (since 2011) and Chief Compliance Officer of Dodge & Cox | | — |
| INDEPENDENT TRUSTEES |
| Thomas A. Larsen (66) | | Trustee (Since 2002) | | Senior Counsel of Arnold & Porter LLP (law firm) (since 2013); Partner of Arnold & Porter LLP (until 2012); Director of Howard, Rice, Nemerovski, Canady, Falk & Rabkin (1977-2011) | | — |
| Ann Mather (55) | | Trustee (Since 2011) | | CFO, Pixar Animation Studios (1999-2004) | | Director, Google, Inc. (internet information services) (since 2005); Director, Glu Mobile, Inc. (multimedia software) (since 2005); Director, Netflix, Inc. (internet television) (since 2010); Director, Arista Networks (cloud networking) (since 2013); Director, Shutterfly, Inc. (internet photography services/publishing) (since 2013) |
| Robert B. Morris III (63) | | Trustee (Since 2011) | | Advisory Director, The Presidio Group (since 2005) | | — |
| Gary Roughead (64) | | Trustee (Since 2013) | | Annenberg Distinguished Visiting Fellow, Hoover Institution (since 2012); Admiral, United States Navy (Ret.); U.S. Navy Chief of Naval Operations (2008-2011) | | Director, Northrop Grumman Corp. (global security) (since 2012) |
| Mark E. Smith (64) | | Trustee (Since 2014) | | Executive Vice President, Managing Director—Fixed Income at Loomis Sayles & Company, L.P. (2003-2011) | | — |
| John B. Taylor (69) | | Trustee (Since 2005) (and 1995-2001) | | Professor of Economics, Stanford University (since 1984); Senior Fellow, Hoover Institution (since 1996); Under Secretary for International Affairs, United States Treasury (2001-2005) | | — |
| * | | The address for each Officer and Trustee is 555 California Street, 40th Floor, San Francisco, California 94104. Each Officer and Trustee oversees all six series in the Dodge & Cox Funds complex and serves for an indefinite term. |
Additional information about the Trust’s Trustees and Officers is available in the Trust’s Statement of Additional Information (SAI). You can get a free copy of the SAI by visiting the Funds’ website at dodgeandcox.com or calling
800-621-3979.
DODGE & COX INCOME FUND §PAGE 23
dodgeandcox.com
For Fund literature, transactions, and account
information, please visit the Funds’ website.
or write or call:
DODGE & COX FUNDS
c/o Boston Financial Data Services
P.O. Box 8422
Boston, Massachusetts 02266-8422
(800) 621-3979
INVESTMENT MANAGER
Dodge & Cox
555 California Street, 40th Floor
San Francisco, California 94104
(415) 981-1710
This report is submitted for the general information of the shareholders of the Fund. The report is not authorized for distribution to prospective investors in the Fund unless it is accompanied by a current prospectus.
This report reflects our views, opinions, and portfolio holdings as of December 31, 2015, the end of the reporting period. Any such views are subject to change at any time based upon market or other conditions and Dodge & Cox disclaims any responsibility to update such views. These views may not be relied on as investment advice and, because investment decisions for a Dodge & Cox Fund are based on numerous factors, may not be relied on as an indication of trading intent on behalf of any Dodge & Cox Fund.
DODGE & COX FUNDS®
Annual Report
December 31, 2015
Global Bond Fund
ESTABLISHED 2014
TICKER: DODLX
12/15 GBF AR Printed on recycled paper
TO OUR SHAREHOLDERS
The Dodge & Cox Global Bond Fund had a total return of –6.2% for the year ending December 31, 2015, compared to –3.2% for the Barclays Global Aggregate Bond Index (Barclays Global Agg).
MARKET COMMENTARY
Market volatility increased throughout 2015, particularly in late summer following China’s decision to devalue the renminbi. Numerous concerns contributed to “risk-off” behavior, including China’s ongoing structural adjustments, further declines in commodity prices, financial and political turmoil in some emerging markets, and important policy moves by major central banks. The U.S. dollar continued to strengthen against almost all currencies, which was the main driver of the Barclays Global Agg’s negative return, as it overwhelmed the income earned during the year. Widening yield premiums(a) also drove price declines for credit securities(b).
Global economic and policy divergence continued during 2015. The U.S. economy saw another year of solid growth underpinned by dynamism in consumption, investment, housing, and the labor market, which offset weakness in the manufacturing sector. The U.S. Federal Reserve (Fed) increased the federal funds rate by 0.25 percentage points after seven years at the so-called zero lower bound, citing progress in the recovery and assessing that inflation should move towards the 2% target over the medium term. In contrast, the economic outlook in the Eurozone remained challenged by considerable slack and weak inflation. This led the European Central Bank to continue easing during the year, taking deposit rates further into negative territory, extending its asset purchase program until at least March 2017, and expanding the pool of purchasable securities. Facing similar challenges, the Bank of Japan introduced measures to augment its already large Quantitative and Qualitative Easing Program. Despite large intra-year swings, 10-year yields in the United States, Germany, and Japan ended the year nearly unchanged at 2.27%, 0.63%, and 0.27%, respectively. The euro and the Japanese yen depreciated by 10.2% and 0.4%, respectively, against the U.S. dollar.
Emerging markets faced significant headwinds during 2015. China’s growth deceleration below 7%, the slowest yearly pace in years, dampened the outlook of its main trading partners and put downward pressure on global commodity prices. In particular, oil prices declined to the lowest level since the financial crisis, affecting growth and fiscal dynamics of exporting countries. Idiosyncratic events also contributed to financial turmoil in some emerging markets, such as Brazil and South Africa. In turn, interest rates rose in several emerging markets and many currencies depreciated against the U.S. dollar—ranging from the Brazilian real’s 32.9% at the higher end, to the Indian rupee’s 4.7% at the lower end. As in 2014, Asian oil importers and countries with economic reform momentum fared better than commodity exporters or countries with political challenges.
Investment-grade corporate bonds performed relatively poorly as yield premiums widened, especially during the third quarter. Energy, basic materials and/or below-investment grade issuers fared
worst, while financials were among the strongest performers. Supply and demand dynamics were negative, as supply was high due to record levels of M&A financing and demand weakened given accelerating outflows from credit funds in the second half of the year.
INVESTMENT STRATEGY
2015 was a challenging year for the Fund as currency depreciation and widening credit yield premiums drove negative performance. Declining commodity prices and weakness in several emerging market economies and credits had a particularly large negative impact on the Fund.
The broad investment themes of the Fund remained largely intact over the course of the year, but positioning shifted, substantially in some areas, as our conviction around some existing themes grew. The Fund continues to have a defensive posture via interest rate risk (i.e., low duration(c)), a majority of holdings in credit securities, high exposure to the U.S. dollar, and a sizable (27%(d)) exposure to emerging market currencies and credits. As the valuation and economic landscape evolved over the year, we increased the Fund’s credit exposure, decreased foreign currency exposure, and reduced interest rate exposure.
Credit: Identifying Opportunities
The Fund’s large allocation to credit securities was a detractor from performance, as credit yield premiums rose to levels not seen since 2013. Within the Fund’s credit holdings, commodity-related issuers such as Kinder Morgan, Rio Oil Finance Trust, and Pemex,(e) had the weakest performance. Amid this changing valuation backdrop, we found a number of individual opportunities that resulted in an increase in the Fund’s corporate bond weighting, from 51% to 58%. We added to a diverse group of issuers by geography, sector, and credit rating category.
One source of credit additions to the Fund was M&A-related financing, which created an abundant source of supply for the markets to absorb. Many companies seek to delever subsequent to these transactions, aligning incentives with bondholders. Our global industry analyst team develops a view of the strategic rationale for each M&A transaction and compiles a financial forecast that enables us to assess issuers’ deleveraging capabilities across a range of outcomes, while our fixed income analyst team focuses on the balance sheet and liquidity implications, particularly in downside scenarios. Examples of recent M&A-related investments include Actavis (a pharmaceutical company buying Allergen), CRH (a building materials company buying assets from Lafarge and Holcim), and Imperial Tobacco (purchasing assets from Reynolds American).
We also conducted considerable research on the energy and metals & mining sectors, where valuations changed most significantly, seeking credits trading at attractive valuations with strong business franchises and the ability to withstand lower commodity prices for a sustained period. We made several additions to the portfolio including a position in Concho Resources, an independent exploration and production company
PAGE 2 § DODGE & COX GLOBAL BOND FUND
and one of the largest producers in the Permian Basin. Concho Resources has one of the lowest break-even oil prices in the industry, significant valuable oil reserves, and a strong management team with a conservative approach to leverage. Another addition to the portfolio was Chilean state-owned Codelco, the world’s largest copper producer, accounting for around 10% of global copper production. We believe the strong AA-rated Chilean sovereign would support Codelco if needed, and that the long-term supply and demand outlook for copper is favorable given limited supply and consumer-driven demand.
While credit spreads ended the year at levels reflecting a perceived rise in defaults or a potential recession, we do not believe that either scenario is likely. Leverage levels are reasonable, interest coverage is robust, and the U.S. economy is growing at a moderate pace. As such, we believe many bonds are trading at attractive levels. The wide dispersion of valuations in credit today is conducive to our rigorous research process and focus on security selection. We remain optimistic about the prospects for the Fund’s credit holdings.
Currency: Strong U.S. Dollar Continues
As in 2014, nearly every currency depreciated against the U.S. dollar in 2015. These declines hurt the Fund’s performance, especially the depreciation of several Latin American currencies that accelerated in the latter half of the year. However, relative to the Barclays Global Agg, on the whole, the Fund’s currency positioning was slightly additive to performance, largely because of the Fund’s significant underweight to the euro.
During the year, we significantly increased the Fund’s U.S. dollar weighting (from 61% to 78%) as the divergence in economic strength and monetary policy between the United States and much of the rest of the world was cemented. Early in the year, we reduced exposure to the euro and other euro-correlated currencies (e.g., Swedish krona and British pound). These trims were driven by low yield levels and the likelihood that the European Central Bank would take actions that could weaken the euro versus the dollar. Later in the year, in the midst of weakening Chinese growth and a change to the Chinese currency regime, we reduced the Fund’s exposure to Asian emerging market currencies, including the Malaysian ringgit, the Indonesian rupiah, and the South Korean won. Depreciation pressure for these currencies is likely to continue as they are exporters to China and/or competitors with China. One brighter spot in the region is India, as it has fewer linkages with China, positive reform momentum, accelerating growth, solid macro policies, and is a net beneficiary from lower oil prices. In accordance with this favorable view, we increased the Fund’s exposure to the Indian rupee during the year.
Approximately 13% of the Fund’s holdings are denominated in four Latin American currencies (Mexican peso, Brazilian real, Colombian peso, and Chilean peso), which have been battered by a number of forces including commodity price declines, weakening sentiment towards emerging markets, and idiosyncratic challenges in the case of Brazil. Our constructive outlook for these currencies is based on their mix of high yield levels, low valuations, the prospect for a stabilization or recovery of commodity prices, and, in the case of Mexico, the medium-run benefits of structural reforms.
Rates: What Happens After “Liftoff”?
Developed market rates ended relatively unchanged over the course of 2015, despite important central bank moves, incessant media commentary about U.S. long-term rates, and some intra-year volatility. The U.S. 10-year rate increased just 0.1 percentage points during the year, and Japanese and German 10-year yields moved even less.
Our views regarding interest rate risk have not changed materially. We are operating in an environment where the price impact of a rise in rates could easily overwhelm the low yield/income of most developed market government bonds. As such, the Fund’s duration is 3.1 years, less than half that of the Barclays Global Agg. We see a clear disconnect between the far slower pace of rate increases implied by current U.S. Treasury valuations and the Fed’s stated expectations and, particularly in the context of a modestly expanding economy (more than 2% growth is expected over the next several years) and an inflation rate likely to rise as energy and import prices increase.
IN CLOSING
The Fund’s recent performance has been disappointing, but we retain a view that the vast global bond universe provides ample opportunity for investors over the long term. We remain confident in our investment strategy and process, which is based on robust fundamental research and a focus on relative valuation, and believe the current environment is conducive to our disciplined credit and currency selection processes. Acknowledging that bond prices and currencies can be volatile in the short term, we remain focused on the long term.
Thank you for your continued confidence in our firm. As always, we welcome your comments and questions.
For the Board of Trustees,
| | |
| |
|
Charles F. Pohl, Chairman | | Dana M. Emery, President |
January 29, 2016
| (a) | | Yield premiums are one way to measure a security’s valuation. Narrowing yield premiums result in a higher valuation. Widening yield premiums result in a lower valuation. |
| (b) | | Credit securities refers to corporate bonds and government-related securities, as classified by Barclays. |
| (c) | | Duration is a measure of a bond’s (or a bond portfolio’s) price sensitivity to changes in interest rates. |
| (d) | | Unless otherwise specified, all weightings and characteristics are as of December 31, 2015. |
| (e) | | The use of specific examples does not imply that they are more attractive investments than the Fund’s other holdings. |
DODGE & COX GLOBAL BOND FUND §PAGE 3
ANNUAL PERFORMANCE REVIEW
The Fund underperformed the Barclays Global Agg by 3.0 percentage points in 2015.
Key Detractors from Relative Results
| | § | | The Fund’s exposure to Latin American currencies (13% versus 0.4% for the Barclays Global Agg), including the Brazilian real, Mexican peso, Colombian peso, and Chilean peso, detracted from relative returns as these currencies depreciated versus the U.S. dollar. | |
| | § | | The Fund’s commodity-related credit holdings underperformed, led by Kinder Morgan and Teck Resources in North America, as well as Pemex, Petrobras, and Rio Oil Finance Trust in Latin America. | |
| | § | | The Fund’s relatively high corporate exposure (51% versus 17% for the Barclays Global Agg) detracted from relative returns as corporate yield premiums rose. | |
Key Contributors to Relative Results
| | § | | The Fund’s underweight to the euro (6% versus 26% for the Barclays Global Agg) contributed significantly to relative returns as the euro depreciated 10.2% versus the U.S. dollar. | |
| | § | | The Fund’s nominal yield advantage was a positive factor. | |
| | | | Unless otherwise noted, figures cited in this section denote Fund positioning at the beginning of the period. | |
KEY CHARACTERISTICS OF DODGE & COX
Independent Organization
Dodge & Cox is one of the largest privately owned investment managers in the world. We remain committed to independence, with a goal of providing the highest quality investment management service to our existing clients.
Over 85 Years of Investment Experience
Dodge & Cox was founded in 1930. We have a stable and well-qualified team of investment professionals, most of whom have spent their entire careers at Dodge & Cox.
Experienced Investment Team
The Global Bond Investment Policy Committee, which is the decision-making body for the Global Bond Fund, is a six-member committee with an average tenure at Dodge & Cox of 20 years.
One Business with a Single Research Office
Dodge & Cox manages equity (domestic, international, and global), fixed income (domestic and global), and balanced investments, operating from one office in San Francisco.
Consistent Investment Approach
Our team decision-making process involves thorough, bottom-up fundamental analysis of each investment.
Long-Term Focus and Low Expenses
We invest with a three- to five-year investment horizon, which has historically resulted in low turnover relative to our peers. We manage Funds that maintain low expense ratios.
Risks: The yields and market values of the instruments in which the Fund invests may fluctuate. Accordingly, an investment may be worth more or less than its original cost. Debt securities are subject to interest rate risk, credit risk, and prepayment and call risk, all of which could have adverse effects on the value of the Fund. A low interest rate environment creates an elevated risk of future negative returns. Financial intermediaries may restrict their market making activities for certain debt securities, which may reduce the liquidity and increase the volatility of such securities. Investing in non-U.S. securities may entail risk due to foreign economic and political developments; this risk may be increased when investing in emerging markets. The Fund is also subject to currency risk. Please read the prospectus and summary prospectus for specific details regarding the Fund’s risk profile.
PAGE 4 § DODGE & COX GLOBAL BOND FUND
GROWTH OF $10,000 SINCE INCEPTION
FOR AN INVESTMENT MADE ON DECEMBER 5, 2012
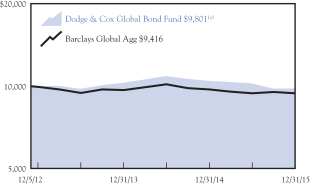
AVERAGE ANNUAL TOTAL RETURN
FOR PERIODS ENDED DECEMBER 31, 2015
| | | | | | | | | | | | |
| | | 1 Year | | | 3 Years | | | Since
Inception
(12/5/12) | |
| | | | | | | | | | | | |
Dodge & Cox Global Bond Fund(a) | | | –6.21 | % | | | –0.73 | % | | | –0.65 | % |
Barclays Global Aggregate Bond Index
(Barclays Global Agg) | | | –3.17 | | | | –1.74 | | | | –1.93 | |
| (a) | | Expense reimbursements have been in effect for the Fund since its inception. Without the expense reimbursements, returns for the Fund would have been lower. The Fund’s returns from May 1, 2014 to December 31, 2014 and from January 1, 2015 to December 31, 2015 are as presented in the Financial Highlights. |
Returns represent past performance and do not guarantee future results. Investment return and share price will fluctuate with market conditions, and investors may have a gain or loss when shares are sold. Fund performance changes over time and currently may be significantly lower than stated. Performance is updated and published monthly. Visit the Fund’s website at dodgeandcox.com or call 800-621-3979 for current performance figures.
A private fund managed and funded by Dodge & Cox (the “Private Fund”) was reorganized into the Fund and the Fund commenced operations on May 1, 2014. The Private Fund commenced operations on December 5, 2012 and had an investment objective, policies, and strategies that were, in all material respects, the same as those of the Fund, and was managed in a manner that, in all material respects, complied with the investment guidelines and restrictions of the Fund. However, the Private Fund was not registered as an investment company under the Investment Company Act of 1940 (the “1940 Act”), and therefore was not subject to certain investment limitations, diversification requirements, liquidity requirements, and other restrictions imposed by the 1940 Act and the Internal Revenue Code, which, if applicable, may have adversely affected its performance.
The Fund’s total returns include the reinvestment of dividend and capital gain distributions, but have not been adjusted for any income taxes payable by shareholders on these distributions or on Fund share redemptions. Index returns include interest income but, unlike Fund returns, do not reflect fees or expenses. The Barclays Global Aggregate Bond Index (Barclays Global Agg) is a widely recognized, unmanaged index of multi-currency investment-grade, debt securities.
Barclays® is a trademark of Barclays Bank PLC.
FUND EXPENSE EXAMPLE
As a Fund shareholder, you incur ongoing Fund costs, including management fees and other Fund expenses. All mutual funds have ongoing costs, sometimes referred to as operating expenses. The following example shows ongoing costs of investing in the Fund and can help you understand these costs and compare them with those of other mutual funds. The example assumes a $1,000 investment held for the six months indicated.
ACTUAL EXPENSES
The first line of the table below provides information about actual account values and expenses based on the Fund’s actual returns. You may use the information in this line, together with your account balance, to estimate the expenses that you paid over the period. Simply divide your account value by $1,000 (for example, an $8,600 account value divided by $1,000 = 8.6), then multiply the result by the number in the first line under the heading “Expenses Paid During Period” to estimate the expenses you paid on your account during this period.
HYPOTHETICAL EXAMPLE FOR COMPARISON WITH OTHER MUTUAL FUNDS
Information on the second line of the table can help you compare ongoing costs of investing in the Fund with those of other mutual funds. This information may not be used to estimate the actual ending account balance or expenses you paid during the period. The hypothetical “Ending Account Value” is based on the actual expense ratio of the Fund and an assumed 5% annual rate of return before expenses (not the Fund’s actual return). The amount under the heading “Expenses Paid During Period” shows the hypothetical expenses your account would have incurred under this scenario. You can compare this figure with the 5% hypothetical examples that appear in shareholder reports of other mutual funds.
| | | | | | | | | | | | |
Six Months Ended December 31, 2015 | | Beginning Account Value
7/1/2015 | | | Ending Account Value
12/31/2015 | | | Expenses Paid
During Period* | |
Based on Actual Fund Return | | $ | 1,000.00 | | | $ | 958.40 | | | $ | 2.96 | |
Based on Hypothetical 5% Yearly Return | | | 1,000.00 | | | | 1,022.18 | | | | 3.06 | |
| * | | Expenses are equal to the Fund’s annualized net expense ratio of 0.60%, multiplied by the average account value over the period, multiplied by 184/365 (to reflect the one-half year period). |
The expenses shown in the table highlight ongoing costs only and do not reflect any transactional fees or account maintenance fees. Though other mutual funds may charge such fees, please note that the Fund does not charge transaction fees (e.g., redemption fees, sales loads) or universal account maintenance fees (e.g., small account fees).
DODGE & COX GLOBAL BOND FUND §PAGE 5
| | | | |
| FUND INFORMATION (unaudited) | | | December 31, 2015 | |
| | | | |
| GENERAL INFORMATION | | | |
Net Asset Value Per Share | | | $9.67 | |
Total Net Assets (millions) | | | $67.7 | |
30-Day SEC Yield (using net expenses)(a)(b) | | | 4.52% | |
30-Day SEC Yield (using gross expenses)(a) | | | 3.71% | |
Net Expense Ratio(b) | | | 0.60% | |
2015 Gross Expense Ratio | | | 1.41% | |
Portfolio Turnover Rate | | | 55% | |
Number of Credit Issuers | | | 55 | |
Fund Inception | | | May 1, 2014 | |
No sales charges or distribution fees | | | | |
Investment Manager: Dodge & Cox, San Francisco. Managed by the Global Bond Investment Policy Committee, whose six members’ average tenure at Dodge & Cox is 20 years.
| | | | | | | | |
| PORTFOLIO CHARACTERISTICS | | Fund | | | Barclays
Global Agg | |
Effective Duration (years) | | | 3.1 | | | | 6.6 | |
Emerging Markets(c) | | | 27.3% | | | | 5.0% | |
| | | | |
| FIVE LARGEST CREDIT ISSUERS (%)(d) | | Fund | |
Cemex SAB de CV | | | 2.5 | |
Millicom International Cellular SA | | | 2.2 | |
Chicago Transit Authority RB | | | 2.2 | |
Naspers, Ltd. | | | 2.2 | |
Imperial Tobacco Group PLC | | | 2.0 | |
| | | | | | | | |
| CREDIT QUALITY (%)(e)(g) | | Fund | | | Barclays
Global Agg | |
Aaa | | | 12.4 | | | | 41.0 | |
Aa | | | 3.6 | | | | 16.8 | |
A | | | 16.0 | | | | 26.1 | |
Baa | | | 44.8 | | | | 16.1 | |
Ba | | | 16.9 | | | | 0.0 | |
B | | | 3.5 | | | | 0.0 | |
Cash Equivalents | | | 2.8 | | | | 0.0 | |
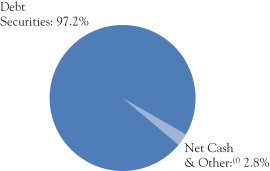
| | | | | | | | |
| SECTOR DIVERSIFICATION (%)(g) | | Fund | | | Barclays
Global Agg | |
Government | | | 17.5 | | | | 54.0 | |
Government-Related | | | 8.9 | | | | 12.4 | |
Securitized | | | 13.3 | | | | 15.7 | |
Corporate | | | 57.5 | | | | 17.9 | |
Cash Equivalents | | | 2.8 | | | | 0.0 | |
| | | | | | | | |
| REGION DIVERSIFICATION (%)(c)(g) | | Fund | | | Barclays
Global Agg | |
United States | | | 50.1 | | | | 38.9 | |
Latin America | | | 23.1 | | | | 1.1 | |
Europe (excluding United Kingdom) | | | 8.7 | | | | 25.9 | |
United Kingdom | | | 7.9 | | | | 6.2 | |
Africa/Middle East | | | 3.1 | | | | 0.8 | |
Canada | | | 2.7 | | | | 3.1 | |
Pacific (excluding Japan) | | | 1.6 | | | | 5.1 | |
Japan | | | 0.0 | | | | 16.5 | |
Other | | | 0.0 | | | | 2.4 | |
| (a) | SEC Yield is an annualization of the Fund’s total net investment income per share for the 30-day period ended on the last day of the month. |
| (b) | Dodge & Cox has contractually agreed to reimburse the Fund for all ordinary expenses to the extent necessary to maintain Total Annual Fund Operating expenses at 0.60% through April 30, 2016. The term of the agreement renews annually thereafter unless terminated with 30 days’ written notice by either party prior to the end of the term. |
| (c) | The Fund may classify an issuer in a different category than the Barclays Global Aggregate Bond Index. The Fund generally classifies a corporate issuer based on the country of incorporation of the parent company, but may designate a different country in certain circumstances. |
| (d) | The Fund’s portfolio holdings are subject to change without notice. The mention of specific securities is not a recommendation to buy, sell, or hold any particular security and is not indicative of Dodge & Cox’s current or future trading activity. |
| (e) | The credit quality distributions shown for the Fund and the Index are based on the middle of Moody’s, S&P’s, and Fitch ratings, which is the methodology used by Barclays in constructing its indices. If a security is rated by only two agencies, the lower of the two ratings is used. Please note the Fund applies the highest of Moody’s, S&P’s, and Fitch ratings to comply with the quality requirements stated in its prospectus. On that basis, the Fund held 13.1% in securities rated below investment grade. The credit quality of the investments in the portfolio does not apply to the stability or safety of the Fund or its shares. |
| (f) | Net Cash & Other includes short-term investments (e.g., money market funds and repurchase agreements) and other assets less liabilities (e.g., cash, receivables, payables, and unrealized appreciation/depreciation on certain derivatives). |
| (g) | Excludes the Fund’s derivative contracts. |
PAGE 6 § DODGE & COX GLOBAL BOND FUND
| | | | |
| PORTFOLIO OF INVESTMENTS | | | December 31, 2015 | |
| | | | | | | | | | |
| DEBT SECURITIES: 97.2% | | | | | | |
| | | |
| | | | | PAR VALUE | | | VALUE | |
| GOVERNMENT: 17.5% | | | | | | | | | | |
Brazil Government (Brazil) | | | | | | | | | | |
Series F, 10.00%, 1/1/21 | | BRL | | | 3,355,000 | | | $ | 675,044 | |
Series F, 10.00%, 1/1/25 | | BRL | | | 2,900,000 | | | | 524,272 | |
Chile Government GDN (Chile)
6.00%, 1/1/18(c) | | CLP | | | 905,000,000 | | | | 1,323,807 | |
Colombia Government (Colombia)
9.85%, 6/28/27 | | COP | | | 3,900,000,000 | | | | 1,402,378 | |
Mexico Government (Mexico) | | | | | | | | | | |
4.75%, 6/14/18 | | MXN | | | 23,200,000 | | | | 1,352,573 | |
2.00%, 6/9/22(a) | | MXN | | | 71,166,039 | | | | 3,859,355 | |
South Korea Government (South Korea)
3.00%, 12/10/16 | | KRW | | | 880,200,000 | | | | 760,138 | |
U.S. Treasury Note/Bond (United States)
0.875%, 11/30/17 | | USD | | | 1,950,000 | | | | 1,944,544 | |
| | | | | | | | | | |
| | | | | | | | | 11,842,111 | |
| GOVERNMENT-RELATED: 8.9% | | | | | |
Brazil Government International (Brazil)
4.25%, 1/7/25 | | USD | | | 850,000 | | | | 684,250 | |
Chicago Transit Authority RB (United States) | | | | | | | | | | |
6.20%, 12/1/40 | | USD | | | 50,000 | | | | 54,249 | |
6.899%, 12/1/40 | | USD | | | 1,250,000 | | | | 1,452,774 | |
Corp. Nacional del Cobre de Chile (Chile)
4.50%, 9/16/25(c) | | USD | | | 375,000 | | | | 353,129 | |
Peru Government International (Peru)
4.125%, 8/25/27 | | USD | | | 700,000 | | | | 686,000 | |
Petroleo Brasileiro SA (Brazil)
7.25%, 3/17/44 | | USD | | | 550,000 | | | | 371,250 | |
Petroleos Mexicanos (Mexico) | | | | | | | | | | |
2.75%, 4/21/27 | | EUR | | | 425,000 | | | | 339,212 | |
5.50%, 6/27/44(c) | | USD | | | 175,000 | | | | 131,660 | |
6.375%, 1/23/45 | | USD | | | 485,000 | | | | 412,137 | |
State of California GO (United States)
6.20%, 10/1/19 | | USD | | | 325,000 | | | | 372,730 | |
State of Illinois GO (United States) | | | | | | | | | | |
4.961%, 3/1/16 | | USD | | | 400,000 | | | | 402,476 | |
5.665%, 3/1/18 | | USD | | | 700,000 | | | | 741,195 | |
| | | | | | | | | | |
| | | | | | | | | 6,001,062 | |
| SECURITIZED: 13.3% | | | | | | | | | | |
Chase Issuance Trust (United States)
Series 2007-A3 A3, 5.23%, 4/15/19 | | USD | | | 419,000 | | | | 437,502 | |
Fannie Mae, 15 Year (United States)
5.00%, 7/1/25 | | USD | | | 35,130 | | | | 36,976 | |
Fannie Mae, 20 Year (United States) | | | | | | | | | | |
4.50%, 6/1/31 | | USD | | | 267,621 | | | | 291,359 | |
4.00%, 10/1/34 | | USD | | | 364,507 | | | | 389,934 | |
Fannie Mae, Hybrid ARM (United States) | | | | | | | | | | |
2.915%, 8/1/44 | | USD | | | 235,817 | | | | 242,110 | |
2.759%, 9/1/44 | | USD | | | 422,977 | | | | 433,242 | |
Ford Credit Auto Owner Trust (United States) | | | | | | | | | | |
Series 2012-B A4, 1.00%, 9/15/17 | | USD | | | 194,682 | | | | 194,698 | |
Series 2014-C A3, 1.06%, 5/15/19 | | USD | | | 880,000 | | | | 877,890 | |
| | | | | | | | | | |
| | | |
| | | | | PAR VALUE | | | VALUE | |
Freddie Mac (United States)
Series 4283 EW, 4.683%, 12/15/43 | | USD | | | 241,632 | | | $ | 262,029 | |
Freddie Mac, Hybrid ARM (United States) | | | | | | | | | | |
3.025%, 10/1/44 | | USD | | | 504,956 | | | | 519,292 | |
2.752%, 11/1/44 | | USD | | | 1,272,832 | | | | 1,300,004 | |
2.731%, 1/1/45 | | USD | | | 1,319,435 | | | | 1,345,654 | |
Freddie Mac Gold, 30 Year (United States)
6.00%, 2/1/35 | | USD | | | 121,622 | | | | 138,843 | |
Navient Student Loan Trust (Private Loans) (United States)
Series 2015-CA B, 3.25%, 5/15/40(c) | | USD | | | 1,350,000 | | | | 1,306,648 | |
Rio Oil Finance Trust (Brazil) | | | | | | | | | | |
9.25%, 7/6/24(c) | | USD | | | 1,200,000 | | | | 888,000 | |
9.75%, 1/6/27(c) | | USD | | | 475,000 | | | | 349,125 | |
| | | | | | | | | | |
| | | | 9,013,306 | |
| CORPORATE: 57.5% | | | | | | | | | | |
FINANCIALS: 16.4% | | | | | | | | | | |
Anthem, Inc. (United States) | | | | | | | | | | |
7.00%, 2/15/19 | | USD | | | 335,000 | | | | 376,440 | |
4.35%, 8/15/20 | | USD | | | 275,000 | | | | 291,287 | |
Bank of America Corp. (United States) | | | | | | | | | | |
4.25%, 10/22/26 | | USD | | | 300,000 | | | | 296,981 | |
6.625%, 5/23/36(b) | | USD | | | 325,000 | | | | 370,158 | |
Barclays PLC (United Kingdom)
4.375%, 9/11/24 | | USD | | | 600,000 | | | | 586,693 | |
BNP Paribas SA (France) | | | | | | | | | | |
5.75%, 1/24/22 | | GBP | | | 425,000 | | | | 700,655 | |
4.375%, 9/28/25(c) | | USD | | | 200,000 | | | | 195,897 | |
Boston Properties, Inc. (United States) | | | | | | | | | | |
5.625%, 11/15/20 | | USD | | | 275,000 | | | | 306,195 | |
4.125%, 5/15/21 | | USD | | | 325,000 | | | | 340,568 | |
Capital One Financial Corp. (United States)
3.75%, 4/24/24 | | USD | | | 750,000 | | | | 755,249 | |
Citigroup, Inc. (United States)
6.692%, 10/30/40(b) | | USD | | | 1,030,000 | | | | 1,079,028 | |
Equity Residential (United States)
4.75%, 7/15/20 | | USD | | | 575,000 | | | | 621,358 | |
Health Net, Inc. (United States)
6.375%, 6/1/17 | | USD | | | 550,000 | | | | 572,000 | |
HSBC Holdings PLC (United Kingdom) | | | | | | | | | | |
6.50%, 5/2/36 | | USD | | | 400,000 | | | | 477,134 | |
6.50%, 9/15/37 | | USD | | | 525,000 | | | | 629,900 | |
JPMorgan Chase & Co. (United States)
3.375%, 5/1/23 | | USD | | | 700,000 | | | | 688,360 | |
Lloyds Banking Group PLC (United Kingdom)
4.50%, 11/4/24 | | USD | | | 950,000 | | | | 964,486 | |
Navient Corp. (United States) | | | | | | | | | | |
6.00%, 1/25/17 | | USD | | | 670,000 | | | | 686,750 | |
4.625%, 9/25/17 | | USD | | | 243,000 | | | | 239,355 | |
8.45%, 6/15/18 | | USD | | | 125,000 | | | | 131,562 | |
Royal Bank of Scotland Group PLC (United Kingdom) | | | | | | | | | | |
6.125%, 12/15/22 | | USD | | | 325,000 | | | | 353,830 | |
6.00%, 12/19/23 | | USD | | | 400,000 | | | | 430,802 | |
| | | | | | | | | | |
| | | | 11,094,688 | |
| | |
| See accompanying Notes to Financial Statements | | DODGE & COX GLOBAL BOND FUND §PAGE 7 |
| | | | |
| PORTFOLIO OF INVESTMENTS | | | December 31, 2015 | |
| | | | | | | | | | | | |
| DEBT SECURITIES (continued) | | | | | | | |
| | | |
| | | | | | PAR VALUE | | | VALUE | |
INDUSTRIALS: 37.7% | | | | | | | | | | | | |
Allergan PLC (Ireland) | | | | | | | | | | | | |
3.00%, 3/12/20 | | | USD | | | | 275,000 | | | $ | 274,781 | |
3.80%, 3/15/25 | | | USD | | | | 225,000 | | | | 223,872 | |
AT&T, Inc. (United States) | | | | | | | | | | | | |
6.55%, 2/15/39 | | | USD | | | | 500,000 | | | | 561,631 | |
4.75%, 5/15/46 | | | USD | | | | 125,000 | | | | 114,428 | |
BHP Billiton, Ltd. (Australia)
6.75%, 10/19/75(b)(c) | | | USD | | | | 350,000 | | | | 337,750 | |
Canadian Pacific Railway, Ltd. (Canada)
6.25%, 6/1/18 | | | CAD | | | | 800,000 | | | | 634,097 | |
Cemex SAB de CV (Mexico)
7.25%, 1/15/21(c) | | | USD | | | | 1,750,000 | | | | 1,684,375 | |
Concho Resources, Inc. (United States)
6.50%, 1/15/22 | | | USD | | | | 1,100,000 | | | | 1,056,000 | |
Cox Enterprises, Inc. (United States) | | | | | | | | | | | | |
3.25%, 12/15/22(c) | | | USD | | | | 715,000 | | | | 649,930 | |
2.95%, 6/30/23(c) | | | USD | | | | 400,000 | | | | 352,394 | |
Ford Motor Credit Co. LLC(d) (United States) | | | | | | | | | | | | |
8.125%, 1/15/20 | | | USD | | | | 300,000 | | | | 353,468 | |
5.875%, 8/2/21 | | | USD | | | | 625,000 | | | | 696,986 | |
Grupo Televisa SAB (Mexico)
8.50%, 3/11/32 | | | USD | | | | 500,000 | | | | 603,071 | |
HCA Holdings, Inc. (United States)
4.75%, 5/1/23 | | | USD | | | | 675,000 | | | | 668,250 | |
Hewlett Packard Enterprise Co. (United States)
3.60%, 10/15/20(c) | | | USD | | | | 550,000 | | | | 551,320 | |
Imperial Tobacco Group PLC (United Kingdom) | | | | | | | | | | | | |
9.00%, 2/17/22 | | | GBP | | | | 305,000 | | | | 594,802 | |
4.25%, 7/21/25(c) | | | USD | | | | 750,000 | | | | 761,194 | |
Kinder Morgan, Inc. (United States) | | | | | | | | | | | | |
4.30%, 6/1/25 | | | USD | | | | 100,000 | | | | 86,446 | |
6.95%, 1/15/38 | | | USD | | | | 1,325,000 | | | | 1,177,901 | |
Macy’s, Inc. (United States) | | | | | | | | | | | | |
6.70%, 9/15/28 | | | USD | | | | 50,000 | | | | 55,104 | |
6.90%, 4/1/29 | | | USD | | | | 75,000 | | | | 84,526 | |
6.70%, 7/15/34 | | | USD | | | | 425,000 | | | | 441,563 | |
Millicom International Cellular SA (Luxembourg)
6.625%, 10/15/21(c) | | | USD | | | | 1,650,000 | | | | 1,524,187 | |
Molex Electronic Technologies LLC(d) (United States)
2.878%, 4/15/20(c) | | | USD | | | | 775,000 | | | | 755,113 | |
MTN Group, Ltd. (South Africa)
4.755%, 11/11/24(c) | | | USD | | | | 725,000 | | | | 630,750 | |
Naspers, Ltd. (South Africa) | | | | | | | | | | | | |
6.00%, 7/18/20(c) | | | USD | | | | 700,000 | | | | 744,751 | |
5.50%, 7/21/25(c) | | | USD | | | | 750,000 | | | | 721,524 | |
RELX PLC (United Kingdom) | | | | | | | | | | | | |
8.625%, 1/15/19 | | | USD | | | | 58,000 | | | | 67,649 | |
3.125%, 10/15/22 | | | USD | | | | 444,000 | | | | 431,468 | |
Sprint Corp. (United States)
6.00%, 12/1/16 | | | USD | | | | 675,000 | | | | 671,625 | |
Teck Resources, Ltd. (Canada)
6.00%, 8/15/40 | | | USD | | | | 400,000 | | | | 168,000 | |
| | | | | | | | | | | | |
| | | |
| | | | | | PAR VALUE | | | VALUE | |
Telecom Italia SPA (Italy) | | | | | | | | | | | | |
6.375%, 6/24/19 | | | GBP | | | | 450,000 | | | $ | 720,525 | |
7.721%, 6/4/38 | | | USD | | | | 575,000 | | | | 599,437 | |
Time Warner Cable, Inc. (United States) | | | | | | | | | | | | |
8.75%, 2/14/19 | | | USD | | | | 475,000 | | | | 551,165 | |
6.75%, 6/15/39 | | | USD | | | | 750,000 | | | | 752,667 | |
Time Warner, Inc. (United States) | | | | | | | | | | | | |
7.625%, 4/15/31 | | | USD | | | | 400,000 | | | | 494,931 | |
7.70%, 5/1/32 | | | USD | | | | 375,000 | | | | 468,148 | |
TransCanada Corp. (Canada)
5.625%, 5/20/75(b) | | | USD | | | | 1,125,000 | | | | 1,040,157 | |
Twenty-First Century Fox, Inc. (United States) | | | | | | | | | | | | |
6.15%, 3/1/37 | | | USD | | | | 275,000 | | | | 306,413 | |
6.65%, 11/15/37 | | | USD | | | | 625,000 | | | | 726,288 | |
Tyco International PLC (Ireland)
3.90%, 2/14/26 | | | USD | | | | 375,000 | | | | 376,063 | |
Verizon Communications, Inc. (United States) | | | | | | | | | | | | |
4.272%, 1/15/36 | | | USD | | | | 375,000 | | | | 338,477 | |
6.55%, 9/15/43 | | | USD | | | | 525,000 | | | | 623,268 | |
Vulcan Materials Co. (United States)
7.50%, 6/15/21 | | | USD | | | | 438,000 | | | | 510,270 | |
Zoetis, Inc. (United States) | | | | | | | | | | | | |
3.45%, 11/13/20 | | | USD | | | | 100,000 | | | | 100,120 | |
4.50%, 11/13/25 | | | USD | | | | 200,000 | | | | 202,814 | |
| | | | | | | | | | | | |
| | | | | | | | | | | 25,489,699 | |
UTILITIES: 3.4% | | | | | | | | | | | | |
Dominion Resources, Inc. (United States)
5.75%, 10/1/54(b) | | | USD | | | | 1,075,000 | | | | 1,053,285 | |
Enel SPA (Italy) | | | | | | | | | | | | |
6.80%, 9/15/37(c) | | | USD | | | | 650,000 | | | | 793,681 | |
6.00%, 10/7/39(c) | | | USD | | | | 425,000 | | | | 475,236 | |
| | | | | | | | | | | | |
| | | | | | | | | | | 2,322,202 | |
| | | | | | | | | | | | |
| | | | | | | | | | | 38,906,589 | |
| | | | | | | | | | | | |
TOTAL DEBT SECURITIES
(Cost $71,366,669) | | | | | | | | 65,763,068 | |
| | |
| PAGE 8 § DODGE & COX GLOBAL BOND FUND | | See accompanying Notes to Financial Statements |
| | | | |
| PORTFOLIO OF INVESTMENTS | | | December 31, 2015 | |
| | | | | | | | | | | | |
| SHORT-TERM INVESTMENTS: 1.4% | |
| | | |
| | | | | | PAR VALUE | | | VALUE | |
MONEY MARKET FUND: 0.1% | | | | | | | | | | | | |
SSgA U.S. Treasury Money Market Fund | | | USD | | | | 67,958 | | | $ | 67,958 | |
| | | |
REPURCHASE AGREEMENT: 1.3% | | | | | | | | | | | | |
Fixed Income Clearing Corporation(e) 0.08%, dated 12/31/15, due 1/4/16, maturity value $905,008 | | | USD | | | | 905,000 | | | | 905,000 | |
| | | | | | | | | | | | |
TOTAL SHORT-TERM INVESTMENTS
(Cost $972,958) | | | $ | 972,958 | |
| | | | | | | | | | | | |
TOTAL INVESTMENTS
(Cost $72,339,627) | | | | 98.6 | % | | $ | 66,736,026 | |
OTHER ASSETS LESS LIABILITIES | | | | 1.4 | % | | | 925,826 | |
| | | | | | | | | | | | |
| NET ASSETS | | | | 100.0 | % | | $ | 67,661,852 | |
| | | | | | | | | | | | |
| (c) | Security exempt from registration under Rule 144A of the Securities Act of 1933. The security may be resold in transactions exempt from registration, normally to qualified institutional buyers. As of December 31, 2015, all such securities in total represented $14,530,472 or 21.4% of total net assets. These securities have been deemed liquid by Dodge & Cox, investment manager, pursuant to procedures approved by the Fund’s Board of Trustees. |
| (d) | Subsidiary (see below) |
| (e) | Repurchase agreement is collateralized by U.S. Treasury Note 1.625%, 7/31/20. Total collateral value is $926,156. |
Debt securities are grouped by parent company unless otherwise noted. Actual securities may be issued by the listed parent company or one of its subsidiaries. In determining a parent company’s country designation, the Fund generally references the country of incorporation.
ARM: Adjustable Rate Mortgage
GO: General Obligation
GDN: Global Depositary Note
RB: Revenue Bond
BRL: Brazilian Real
CAD: Canadian Dollar
CLP: Chilean Peso
COP: Colombian Peso
EUR: Euro
GBP: British Pound
INR: Indian Rupee
KRW: South Korean Won
MXN: Mexican Peso
USD: United States Dollar
FUTURES CONTRACTS
| | | | | | | | | | | | | | | | |
| Description | | Number of
Contracts | | | Expiration
Date | | | Notional
Amount | | | Unrealized
Appreciation/
(Depreciation) | |
10 Year U.S.
Treasury Note
—Short Position | | | 66 | | | | Mar 2016 | | | $ | (8,309,813 | ) | | $ | 31,033 | |
Long-Term U.S. Treasury Bond—Short Position | | | 18 | | | | Mar 2016 | | | | (2,856,375 | ) | | | (8,905 | ) |
| | | | | | | | | | | | | | | | |
| | | | | | | | | | | | | | $ | 22,128 | |
| | | | | | | | | | | | | | | | |
CENTRALLY CLEARED INTEREST RATE SWAPS
| | | | | | | | | | | | | | | | |
| | | | | | Contract Amount | | | | |
Notional Amount | | Expiration
Date | | | Fixed
Rate | | | Floating Rate | | | Unrealized
Appreciation/
(Depreciation) | |
Pay Fixed/Receive Floating: | | | | | | | | | |
$825,000 | | | 5/6/24 | | | | 2.72 | % | | | USD LIBOR 3-Month | | | $ | (45,704 | ) |
825,000 | | | 8/22/24 | | | | 2.57 | % | | | USD LIBOR 3-Month | | | | (39,699 | ) |
1,750,000 | | | 7/29/45 | | | | 2.774 | % | | | USD LIBOR 3-Month | | | | (79,352 | ) |
| | | | | | | | | | | | | | | | |
| | | | | | | | | | | | | | $ | (164,755 | ) |
| | | | | | | | | | | | | | | | |
FORWARD CURRENCY CONTRACTS
| | | | | | | | | | | | | | | | |
| | | | | | Contract Amount | | | | |
| Counterparty | | Settlement
Date | | | Receive
U.S. Dollar | | | Deliver
Foreign
Currency | | | Unrealized
Appreciation/
(Depreciation) | |
Contracts to sell EUR: | | | | | | | | | |
Barclays | | | 3/2/16 | | | | 1,489,986 | | | | 1,400,000 | | | $ | (33,612 | ) |
| | | | |
| Counterparty | | Settlement
Date | | | Deliver U.S. Dollar | | | Receive
Foreign
Currency | | | Unrealized
Appreciation/
(Depreciation) | |
Contracts to buy EUR: | | | | | | | | | |
Barclays | | | 3/2/16 | | | | 1,146,251 | | | | 1,075,000 | | | | 23,654 | |
Contracts to buy INR: | | | | | | | | | |
Barclays | | | 2/17/16 | | | | 1,272,321 | | | | 85,500,000 | | | | 11,134 | |
Barclays | | | 2/17/16 | | | | 761,793 | | | | 52,000,000 | | | | 18,788 | |
| | | | | | | | | | | | | | | | |
| | | | | | | | | | | | | | $ | 19,964 | |
| | | | | | | | | | | | | | | | |
| | |
| See accompanying Notes to Financial Statements | | DODGE & COX GLOBAL BOND FUND §PAGE 9 |
| | | | |
STATEMENT OF ASSETS AND LIABILITIES | |
| | | December 31, 2015 | |
ASSETS: | | | | |
Investments, at value (cost $72,339,627) | | $ | 66,736,026 | |
Unrealized appreciation on forward currency contracts | | | 53,576 | |
Cash denominated in foreign currency (cost $167) | | | 164 | |
Cash held at broker | | | 359,674 | |
Receivable for investments sold | | | 39,172 | |
Receivable for Fund shares sold | | | 7,788 | |
Dividends and interest receivable | | | 971,912 | |
Prepaid expenses and other assets | | | 19,273 | |
| | | | |
| | | 68,187,585 | |
| | | | |
LIABILITIES: | | | | |
Unrealized depreciation on forward currency contracts | | | 33,612 | |
Payable to broker for variation margin | | | 80,439 | |
Payable for Fund shares redeemed | | | 342,887 | |
Expense reimbursement received in advance | | | 17,227 | |
Accrued expenses | | | 51,568 | |
| | | | |
| | | 525,733 | |
| | | | |
NET ASSETS | | $ | 67,661,852 | |
| | | | |
NET ASSETS CONSIST OF: | | | | |
Paid in capital | | $ | 74,419,062 | |
Accumulated net investment loss | | | (186,162 | ) |
Accumulated net realized loss | | | (827,352 | ) |
Net unrealized depreciation | | | (5,743,696 | ) |
| | | | |
| | $ | 67,661,852 | |
| | | | |
Fund shares outstanding (par value $0.01 each,
unlimited shares authorized) | | | 6,999,088 | |
Net asset value per share | | $ | 9.67 | |
|
STATEMENT OF OPERATIONS | |
| | | Year Ended December 31, 2015 | |
INVESTMENT INCOME: | | | | |
Dividends | | $ | 58,964 | |
Interest (net of foreign taxes of $5,879) | | | 2,759,838 | |
| | | | |
| | | 2,818,802 | |
| | | | |
EXPENSES: | | | | |
Management fees | | | 353,517 | |
Custody and fund accounting fees | | | 26,648 | |
Transfer agent fees | | | 21,750 | |
Professional services | | | 223,071 | |
Shareholder reports | | | 15,063 | |
Registration fees | | | 90,581 | |
Trustees’ fees | | | 237,500 | |
Miscellaneous | | | 27,068 | |
| | | | |
Total expenses | | | 995,198 | |
Expenses reimbursed by investment manager | | | (570,879 | ) |
| | | | |
Net expenses | | | 424,319 | |
| | | | |
NET INVESTMENT INCOME | | | 2,394,483 | |
| | | | |
| |
REALIZED AND UNREALIZED GAIN (LOSS): | | | | |
Net realized loss | | | | |
Investments | | | (3,334,009 | ) |
Treasury futures contracts | | | (119,291 | ) |
Interest rate swaps | | | (37,901 | ) |
Forward currency contracts | | | (11,908 | ) |
Foreign currency transactions | | | (51,881 | ) |
Net change in unrealized appreciation/depreciation | | | | |
Investments | | | (3,697,465 | ) |
Treasury futures contracts | | | 229,905 | |
Interest rate swaps | | | (97,410 | ) |
Forward currency contracts | | | 37,073 | |
Foreign currency translation | | | 6,831 | |
| | | | |
Net realized and unrealized loss | | | (7,076,056 | ) |
| | | | |
NET DECREASE IN NET ASSETS
FROM OPERATIONS | | $ | (4,681,573 | ) |
| | | | |
| | | | | | | | |
STATEMENT OF CHANGES IN NET ASSETS | |
| | | Year Ended
December 31, 2015 | | | Period Ended
December 31, 2014* | |
OPERATIONS: | | | | | | | | |
Net investment income | | $ | 2,394,483 | | | $ | 746,563 | |
Net realized loss | | | (3,554,990 | ) | | | (339,029 | ) |
Net change in unrealized
appreciation/depreciation | | | (3,521,066 | ) | | | (2,222,630 | ) |
| | | | | | | | |
| | | (4,681,573 | ) | | | (1,815,096 | ) |
| | | | | | | | |
| | |
DISTRIBUTIONS TO SHAREHOLDERS FROM: | | | | | | | | |
Net investment income | | | — | | | | (650,780 | ) |
Net realized gain | | | — | | | | — | |
| | | | | | | | |
Total distributions | | | — | | | | (650,780 | ) |
| | | | | | | | |
| | |
FUND SHARE
TRANSACTIONS: | | | | | | | | |
Proceeds from sale of shares | | | 26,112,074 | | | | 75,231,468 | |
Reinvestment of distributions | | | — | | | | 582,706 | |
Cost of shares redeemed | | | (18,458,010 | ) | | | (8,658,937 | ) |
| | | | | | | | |
Net increase from Fund share transactions | | | 7,654,064 | | | | 67,155,237 | |
| | | | | | | | |
Total increase in net assets | | | 2,972,491 | | | | 64,689,361 | |
| | |
NET ASSETS: | | | | | | | | |
Beginning of period | | | 64,689,361 | | | | — | |
| | | | | | | | |
End of period (including accumulated net investment loss of $(186,162) and $(66,238), respectively) | | $ | 67,661,852 | | | $ | 64,689,361 | |
| | | | | | | | |
| | |
SHARE INFORMATION: | | | | | | | | |
Shares sold | | | 2,575,716 | | | | 7,034,774 | |
Distributions reinvested | | | — | | | | 55,846 | |
Shares redeemed | | | (1,848,870 | ) | | | (818,378 | ) |
| | | | | | | | |
Net increase in shares outstanding | | | 726,846 | | | | 6,272,242 | |
| | | | | | | | |
| * | Period from May 1, 2014 (commencement of operations) to December 31, 2014 |
| | |
| PAGE 10 § DODGE & COX GLOBAL BOND FUND | | See accompanying Notes to Financial Statements |
NOTES TO FINANCIAL STATEMENTS
NOTE 1—ORGANIZATION AND SIGNIFICANT ACCOUNTING POLICIES
Dodge & Cox Global Bond Fund (the “Fund”) is one of the series constituting the Dodge & Cox Funds (the “Trust” or the “Funds”). The Trust is organized as a Delaware statutory trust and is registered under the Investment Company Act of 1940, as amended, as an open-end management investment company. The Fund1 seeks a high rate of total return consistent with long-term preservation of capital. Foreign investing, especially in developing countries, has special risks such as currency and market volatility and political and social instability. These and other risk considerations are discussed in the Fund’s Prospectus.
The financial statements have been prepared in conformity with accounting principles generally accepted in the United States of America, which require the use of estimates and assumptions by management. Actual results may differ from those estimates. Significant accounting policies are as follows:
Security valuation The Fund’s net assets are valued as of the close of trading on the New York Stock Exchange (NYSE), generally 4:00 p.m. Eastern Time, each day that the NYSE is open for business. If the NYSE is closed due to inclement weather, technology problems, or for any other reason on a day it would normally be open for business, or the NYSE has an unscheduled early closing on a day it has opened for business, the Fund reserves the right to calculate the Fund’s NAV as of the normally scheduled close of regular trading on the NYSE for that day, provided that Dodge & Cox believes that it can obtain reliable market quotes or valuations.
Debt securities and non-exchange traded derivatives are valued based on prices received from independent pricing services which utilize both dealer-supplied valuations and pricing models. Pricing models may consider quoted prices for similar securities, interest rates, prepayment speeds, and credit risk. Exchange-traded derivatives are valued at the settlement price determined by the relevant exchange. Interest rate swaps are valued daily based on prices received from independent pricing services, which represent the net present value of all future cash settlement amounts based on implied forward interest rates. Other financial instruments for which market quotes are readily available are valued at market value. Security values are not discounted based on the size of the Fund’s position. Short-term securities less than 60 days to maturity may be valued at amortized cost if amortized cost approximates current value. Mutual funds are valued at their respective net asset values.
| 1 | | The Fund’s predecessor, Dodge & Cox Global Bond Fund, L.L.C. (the “Private Fund”), was organized on August 31, 2012 and commenced operations on December 5, 2012 as a private investment fund that reorganized into, and had the same investment manager as, the Fund. The Fund commenced operations on May 1, 2014, upon the transfer of assets from the Private Fund. This transaction was accomplished through a transfer of Private Fund net assets valued at $10,725,688 in exchange for 1,000,000 shares of the Fund. Immediately after the transfer, the shares of the Fund were distributed to the sole owner of the Private Fund and the investment manager of the Fund, Dodge & Cox, which became the initial shareholder of the Fund. |
Investments initially valued in currencies other than the U.S. dollar are converted to the U.S. dollar using prevailing exchange rates. As a result, the Fund’s net assets may be affected by changes in the value of currencies in relation to the U.S. dollar.
If market quotations are not readily available or if a security’s value is believed to have materially changed after the close of the security’s primary market but before the close of trading on the NYSE, the security is valued at fair value as determined in good faith by or under the direction of the Fund’s Board of Trustees. The Board of Trustees has appointed Dodge & Cox, the Fund’s investment manager, to make fair value determinations in accordance with the Dodge & Cox Funds Valuation Policies (“Valuation Policies”), subject to Board oversight. Dodge & Cox has established a Pricing Committee that is comprised of representatives from Treasury, Legal, Compliance, and Operations. The Pricing Committee is responsible for implementing the Valuation Policies, including determining the fair value of securities when market quotations or market-based valuations are not readily available or are deemed unreliable. The Pricing Committee considers relevant indications of value that are reasonably available to it in determining the fair value assigned to a particular security, such as the value of similar financial instruments, trading volumes, contractual restrictions on disposition, related corporate actions, and changes in economic conditions. In doing so, the Pricing Committee employs various methods for calibrating fair valuation approaches, including a regular review of key inputs and assumptions, back-testing, and review of any related market activity.
Valuing securities through a fair value determination involves greater reliance on judgment than valuation of securities based on readily available market quotations. In some instances, lack of information and uncertainty as to the significance of information may lead to a conclusion that a prior valuation is the best indication of a security’s value. When fair value pricing is employed, the prices of securities used by the Fund to calculate its NAV may differ from quoted or published prices for the same securities.
Security transactions, investment income, expenses, and distributions Security transactions are recorded on the trade date. Realized gains and losses on securities sold are determined on the basis of identified cost.
Interest income is recorded on the accrual basis. Interest income includes coupon interest, amortization of premium and accretion of discount on debt securities, gain/loss on paydowns, and inflation adjustments to the principal amount of inflation-indexed securities. The ability of the issuers of the debt securities held by the Fund to meet their obligations may be affected by economic developments in a specific industry, state, region, or country. Debt obligations may be placed on non-accrual status and related interest income may be reduced by ceasing current accruals and writing off interest receivables when the collection of all or a portion of interest has become doubtful. A debt obligation is removed from non-accrual status when the issuer resumes interest payments or when collectability of interest is reasonably assured. Dividend income is recorded on the ex-dividend date.
DODGE & COX GLOBAL BOND FUND §PAGE 11
NOTES TO FINANCIAL STATEMENTS
Expenses are recorded on the accrual basis. Some expenses of the Trust can be directly attributed to a specific series. Expenses which cannot be directly attributed are allocated among the Funds in the Trust based on relative net assets or other expense methodologies determined by the nature of the expense.
Distributions to shareholders are recorded on the ex-dividend date.
Foreign taxes The Fund is subject to foreign taxes which may be imposed by certain countries in which the Fund invests. The Fund endeavors to record foreign taxes based on applicable foreign tax law. Withholding taxes are incurred on certain foreign receipts and are accrued at the time the associated interest income is recorded.
Capital gains taxes are incurred upon disposition of certain foreign securities. Capital gains taxes on appreciated securities are accrued as unrealized losses and are reflected as realized losses upon the sale of the related security. Currency taxes may be incurred when the Fund purchases certain foreign currencies related to securities transactions and are recorded as realized losses on foreign currency transactions.
Repurchase agreements The Fund enters into repurchase agreements, secured by U.S. government or agency securities, which involve the purchase of securities from a counterparty with a simultaneous commitment to resell the securities at an agreed-upon date and price. It is the Fund’s policy that its custodian take possession of the underlying collateral securities, the fair value of which exceeds the principal amount of the repurchase transaction, including accrued interest, at all times. In the event of default by the counterparty, the Fund has the contractual right to liquidate the securities and to apply the proceeds in satisfaction of the obligation.
Futures Contracts Futures contracts involve an obligation to purchase or sell (depending on whether the Fund has entered a long or short futures contract, respectively) an asset at a future date, at a price set at the time of the contract. Upon entering into a futures contract, the Fund is required to deposit an amount of cash or liquid assets (referred to as initial margin) in a segregated account with the clearing broker. Subsequent payments (referred to as variation margin) to and from the clearing broker are made on a daily basis based on changes in the market value of futures contracts. Futures contracts are traded publicly and their market value changes daily. Changes in the market value of open futures contracts are recorded as unrealized appreciation or depreciation in the Statement of Operations. Realized gains and losses on futures contracts are recorded in the Statement of Operations at the closing or expiration of the contracts. Cash deposited with a broker as initial margin is recorded on the Statement of Assets and Liabilities. A receivable and/or payable to brokers for daily variation margin is also recorded on the Statement of Assets and Liabilities.
Investments in futures contracts may include certain risks, which may be different from, and potentially greater than, those of the underlying securities. To the extent the Fund uses futures, it is exposed to additional volatility and potential losses resulting from leverage.
The Fund has maintained short Treasury futures contracts to assist with the management of the portfolio’s interest rate
exposure. During the year ended December 31, 2015, these Treasury futures contracts had notional values ranging from 8% to 17% of net assets.
Interest rate swaps Interest rate swaps are agreements that obligate two parties to exchange a series of cash flows at specified payment dates calculated by reference to specified interest rates, such as an exchange of floating rate payments for fixed rate payments. Upon entering into a centrally cleared interest rate swap, the Fund is required to post an amount of cash or liquid assets (referred to as initial margin) in a segregated account with the clearing broker. Subsequent payments (referred to as variation margin) to and from the clearing broker are made on a daily basis based on changes in the market value of each interest rate swap. Changes in the market value of open interest rate swaps are recorded as unrealized appreciation or depreciation in the Statement of Operations. Realized gains and losses on interest rate swaps are recorded in the Statement of Operations, both upon the exchange of cash flows on each specified payment date and upon the closing or expiration of the swap. Cash deposited with the clearing broker as initial margin is recorded on the Statement of Assets and Liabilities. A receivable and/or payable to brokers for daily variation margin is also recorded on the Statement of Assets and Liabilities.
Investments in interest rate swaps may include certain risks including unfavorable changes in interest rates, or a default or failure by the clearing broker or clearinghouse.
The Fund has maintained interest rate swaps in connection with the management of the portfolio’s interest rate exposure. During the year ended December 31, 2015, these interest rate swaps had U.S. dollar notional values ranging from 2% to 5% of net assets.
Forward currency contracts A forward currency contract represents an obligation to purchase or sell a specific foreign currency at a future date at a price set at the time of the contract. Losses from these transactions may arise from unfavorable changes in currency values or if the counterparties do not perform under a contract’s terms.
The values of the forward currency contracts are adjusted daily based on the prevailing forward exchange rates of the underlying currencies. Changes in the value of open contracts are recorded as unrealized appreciation or depreciation in the Statement of Operations. When the forward currency contract is closed, the Fund records a realized gain or loss in the Statement of Operations equal to the difference between the value at the time the contract was opened and the value at the time it was closed.
The Fund has maintained forward currency contracts to increase its portfolio exposure to the Indian rupee. During the year ended December 31, 2015, these Indian rupee forward currency contracts had U.S. dollar total values ranging from 1% to 3% of net assets.
The Fund entered into forward currency contracts to hedge foreign currency risks associated with portfolio investments denominated in the euro. During the year ended December 31,
PAGE 12 § DODGE & COX GLOBAL BOND FUND
NOTES TO FINANCIAL STATEMENTS
2015, these euro forward currency contracts had U.S. dollar total values ranging from 0% to 2% of net assets.
Foreign currency translation The books and records of the Fund are maintained in U.S. dollars. Foreign currency amounts are translated into U.S. dollars at the prevailing exchange rates of such currencies against the U.S. dollar. The market value of investment securities and other assets and liabilities are translated at the exchange rate as of the valuation date. Purchases and sales of investment securities, income, and expenses are translated at the exchange rate prevailing on the transaction date.
Reported realized and unrealized gain (loss) on investments includes foreign currency gain (loss) related to investment transactions.
Reported realized and unrealized gain (loss) on foreign currency transactions and translation include the following: holding/disposing of foreign currency, the difference between the trade and settlement dates on securities transactions, the difference between the accrual and payment dates on interest, and currency losses on the purchase of foreign currency in certain countries that impose taxes on such transactions.
Indemnification Under the Trust’s organizational documents, its officers and trustees are indemnified against certain liabilities arising out of the performance of their duties to the Trust. In addition, in the normal course of business the Trust enters into contracts that provide general indemnities to other parties. The Trust’s maximum exposure under these arrangements is unknown as this would involve future claims that may be made against the Trust that have not yet occurred.
NOTE 2—VALUATION MEASUREMENTS
Various inputs are used in determining the value of the Fund’s investments. These inputs are summarized in the three broad levels listed below.
| § | | Level 1: Quoted prices in active markets for identical securities |
| § | | Level 2: Other significant observable inputs (including quoted prices for similar securities, market indices, interest rates, credit risk, etc.) |
| § | | Level 3: Significant unobservable inputs (including Fund management’s assumptions in determining the fair value of investments) |
The inputs or methodology used for valuing securities are not necessarily an indication of the risk associated with investing in those securities.
The following is a summary of the inputs used to value the Fund’s holdings at December 31, 2015:
| | | | | | | | |
| Classification(a) | | LEVEL 1
(Quoted Prices) | | | LEVEL 2
(Other Significant
Observable Inputs) | |
Securities | | | | | | | | |
Debt Securities | | | | | | | | |
Government | | $ | — | | | $ | 11,842,111 | |
Government-Related | | | — | | | | 6,001,062 | |
Securitized | | | — | | | | 9,013,306 | |
Corporate | | | — | | | | 38,906,589 | |
Short-term Investments | | | | | | | | |
Money Market Fund | | | 67,958 | | | | — | |
Repurchase Agreement | | | — | | | | 905,000 | |
| | | | | | | | |
Total Securities | | $ | 67,958 | | | $ | 66,668,068 | |
| | | | | | | | |
Other Financial Instruments(b) | | | | | | | | |
Treasury Futures Contracts | | | | | | | | |
Appreciation | | $ | 31,033 | | | $ | — | |
Depreciation | | | (8,905 | ) | | | — | |
Interest Rate Swaps | | | | | | | | |
Depreciation | | | — | | | | (164,755 | ) |
Forward Currency Contracts | | | | | | | | |
Appreciation | | | — | | | | 53,576 | |
Depreciation | | | — | | | | (33,612 | ) |
| | | | | | | | | |
| (a) | U.S. Treasury securities were transferred from Level 1 to Level 2 during the year. There were no Level 3 securities at December 31, 2015 and 2014, and there were no transfers to Level 3 during the year. |
| (b) | Represents unrealized appreciation/(depreciation). |
NOTE 3—ADDITIONAL DERIVATIVES INFORMATION
The Fund has entered into over-the-counter derivatives, such as forward currency contracts (each, a “Derivative”). Each Derivative is subject to a negotiated master agreement (based on a form published by the International Swaps and Derivatives Association (“ISDA”)) governing all Derivatives between the Fund and the relevant dealer counterparty. The master agreements specify (i) events of default and other events permitting a party to terminate some or all of the Derivatives thereunder and (ii) the process by which those Derivatives will be valued for purposes of determining termination payments. If some or all of the Derivatives under a master agreement are terminated because of an event of default or similar event, the values of all terminated Derivatives must be netted to determine a single payment owed by one party to the other. Some master agreements contain collateral terms requiring the parties to post collateral in respect of some or all of the Derivatives thereunder based on the net market value of those Derivatives, subject to a minimum exposure threshold. To the extent amounts owed to the Fund by its counterparties are not collateralized, the Fund is at risk of those counterparties’ non-performance. The Fund attempts to mitigate counterparty credit risk by entering into Derivatives only with counterparties it believes to be of good credit quality and by monitoring the financial stability of those counterparties.
At December 31, 2015, all offsetting Derivative positions qualify for netting pursuant to master netting arrangements. For financial reporting purposes, the Fund does not offset financial
DODGE & COX GLOBAL BOND FUND §PAGE 13
NOTES TO FINANCIAL STATEMENTS
assets and liabilities that are subject to a master netting arrangement in the Statement of Assets and Liabilities. Gross assets and liabilities related to Derivatives are presented as “unrealized appreciation on forward currency contracts” and “unrealized depreciation on forward currency contracts,” respectively, in the Statement of Assets and Liabilities. Derivative information by counterparty is presented in the Portfolio of Investments. At December 31, 2015, no collateral is pledged or held by the Fund for Derivatives.
NOTE 4—RELATED PARTY TRANSACTIONS
Management fees Under a written agreement approved by a unanimous vote of the Board of Trustees, the Fund pays an annual management fee of 0.50% of the Fund’s average daily net assets to Dodge & Cox, investment manager of the Fund. Until April 30, 2016, Dodge & Cox has contractually agreed to reimburse the Fund for all ordinary expenses to the extent necessary to maintain the ratio of total operating expenses to average net assets at 0.60%. The agreement is renewable annually thereafter and is subject to termination upon 30 days’ written notice by either party. This expense reimbursement agreement has been in effect since the Fund’s inception.
Fund officers and trustees All officers and two of the trustees of the Trust are officers or employees of Dodge & Cox. The Trust pays a fee only to those trustees who are not affiliated with Dodge & Cox.
Share ownership At December 31, 2015, Dodge & Cox owned 14% of the Fund’s outstanding shares.
NOTE 5—INCOME TAX INFORMATION AND DISTRIBUTIONS TO SHAREHOLDERS
A provision for federal income taxes is not required since the Fund intends to continue to qualify as a regulated investment company under Subchapter M of the Internal Revenue Code and distribute all of its taxable income to shareholders. Distributions are determined in accordance with income tax regulations, and such amounts may differ from net investment income and realized gains for financial reporting purposes. Financial reporting records are adjusted for permanent book to tax differences at year end to reflect tax character.
Book to tax differences are primarily due to differing treatments of wash sales, net short-term realized gain (loss), foreign capital gain taxes, foreign currency realized gain (loss), Treasury futures contracts, and interest rate swaps. At December 31, 2015, the cost of investments for federal income tax purposes was $72,339,627.
Distributions during the periods noted below were characterized as follows for federal income tax purposes:
| | | | | | | | |
| | | Year Ended
December 31, 2015 | | | Eight Months Ended December 31, 2014 | |
Ordinary income | | | $— | | | | $650,780 | |
| | | | | | | ($0.144 per share) | |
Long-term capital gain | | | — | | | | — | |
At December 31, 2015, the tax basis components of distributable earnings were as follows:
| | | | |
Unrealized appreciation | | $ | 104,514 | |
Unrealized depreciation | | | (5,708,115 | ) |
| | | | |
Net unrealized depreciation | | | (5,603,601 | ) |
Undistributed ordinary income | | | — | |
Capital loss carryforward(a) | | | (775,303 | ) |
Deferred loss(b) | | | (196,120 | ) |
| (a) | Represents accumulated capital loss as of December 31, 2015, which may be carried forward to offset future capital gains. |
| | | | |
No expiration | | | | |
Short-term | | $ | 469,709 | |
Long-term | | | 305,594 | |
| | | | |
| | $ | 775,303 | |
| | | | |
| (b) | Represents net realized specified loss incurred between November 1, 2015 and December 31, 2015. As permitted by tax regulations, the Fund has elected to treat this loss as arising in 2016. |
Fund management has reviewed the tax positions for the open period applicable to the Fund, and has determined that no provision for income tax is required in the Fund’s financial statements.
NOTE 6—LOAN FACILITIES
Pursuant to an exemptive order issued by the Securities and Exchange Commission (SEC), the Fund may participate in an interfund lending facility (Facility). The Facility allows the Fund to borrow money from or loan money to the Funds. Loans under the Facility are made for temporary or emergency purposes, such as to fund shareholder redemption requests. Interest on borrowings is the average of the current repurchase agreement rate and the bank loan rate. There was no activity in the Facility during the year.
All Funds in the Trust participate in a $500 million committed credit facility (Line of Credit) with State Street Bank and Trust Company, to be utilized for temporary or emergency purposes to fund shareholder redemptions or for other short-term liquidity purposes. The maximum amount available to the Fund is $250 million. Each Fund pays an annual commitment fee on its pro-rata portion of the Line of Credit. For the year ended December 31, 2015, the Fund’s commitment fee amounted to $250 and is reflected as a Miscellaneous Expense in the Statement of Operations. Interest on borrowings is charged at the prevailing rate. There were no borrowings on the Line of Credit during the year.
NOTE 7—PURCHASES AND SALES OF INVESTMENTS
For the year ended December 31, 2015, purchases and sales of securities, other than short-term securities and U.S. government securities, aggregated $38,643,970 and $27,999,196, respectively. For the year ended December 31, 2015, purchases and sales of U.S. government securities aggregated $10,835,441 and $9,365,464, respectively.
NOTE 8—SUBSEQUENT EVENTS
Fund management has determined that no material events or transactions occurred subsequent to December 31, 2015, and through the date of the Fund’s financial statements issuance, which require additional disclosure in the Fund’s financial statements.
PAGE 14 § DODGE & COX GLOBAL BOND FUND
FINANCIAL HIGHLIGHTS
| | | | | | | | |
SELECTED DATA AND RATIOS (for a share outstanding throughout the period) | | Year Ended
December 31, 2015 | | | Period from May 1, 2014 (commencement of Fund operations) to December 31, 2014 | |
Net asset value, beginning of period | | | $10.31 | | | | $10.73 | |
Income from investment operations: | | | | | | | | |
Net investment income | | | 0.34 | | | | 0.16 | |
Net realized and unrealized loss | | | (0.98 | ) | | | (0.44 | ) |
| | | | | | | | |
Total from investment operations | | | (0.64 | ) | | | (0.28 | ) |
| | | | | | | | |
Distributions to shareholders from: | | | | | | | | |
Net investment income | | | — | | | | (0.14 | ) |
Net realized gain | | | — | | | | — | |
| | | | | | | | |
Total distributions | | | — | | | | (0.14 | ) |
| | | | | | | | |
Net asset value, end of period | | | $9.67 | | | | $10.31 | |
| | | | | | | | |
Total return | | | (6.21 | )% | | | (2.59 | )% |
Ratios/supplemental data: | | | | | | | | |
Net assets, end of period (millions) | | | $68 | | | | $65 | |
Ratio of expenses to average net assets | | | 0.60 | % | | | 0.60 | %(a) |
Ratio of expenses to average net assets, before reimbursement by investment manager | | | 1.41 | % | | | 2.18 | %(a) |
Ratio of net investment income to average net assets | | | 3.39 | % | | | 2.83 | %(a) |
Portfolio turnover rate | | | 55 | % | | | 36 | % |
See accompanying Notes to Financial Statements
REPORT OF INDEPENDENT REGISTERED PUBLIC ACCOUNTING FIRM
To the Trustees of Dodge & Cox Funds and Shareholders of Dodge & Cox Global Bond Fund
In our opinion, the accompanying statement of assets and liabilities, including the portfolio of investments, and the related statements of operations and of changes in net assets and the financial highlights present fairly, in all material respects, the financial position of Dodge & Cox Global Bond Fund (the “Fund”, one of the series constituting Dodge & Cox Funds) at December 31, 2015, the results of its operations, the changes in its net assets, and financial highlights for each of the periods presented in conformity with accounting principles generally accepted in the United States of America. These financial statements and financial highlights (hereafter referred to as financial statements) are the responsibility of the Fund’s management. Our responsibility is to express an opinion on these financial statements based on our audits. We conducted our audits of these financial statements in accordance with the standards of the Public Company Accounting Oversight Board (United States). Those standards require that we plan and perform the audit to obtain reasonable assurance about whether the financial statements are free of material misstatement. An audit includes examining, on a test basis, evidence supporting the amounts and disclosures in the financial statements, assessing the accounting principles used and significant estimates made by management, and evaluating the overall financial statement presentation. We believe that our audits which included confirmation of securities at December 31, 2015, by correspondence with the custodian and brokers, provide a reasonable basis for our opinion.
PricewaterhouseCoopers LLP
San Francisco, California
February 25, 2016
DODGE & COX GLOBAL BOND FUND §PAGE 15
BOARD APPROVAL OF FUNDS’ INVESTMENT MANAGEMENT AGREEMENTS AND MANAGEMENT FEES
(unaudited)
The Board of Trustees is responsible for overseeing the performance of the Dodge & Cox Funds’ investment manager and determining whether to continue the Investment Management Agreements between the Funds and Dodge & Cox each year (the “Agreements”). At a meeting of the Board of Trustees of the Trust held on December 16, 2015, the Trustees, by a unanimous vote (including a separate vote of those Trustees who are not “interested persons” (as defined in the Investment Company Act of 1940) (the “Independent Trustees”)), approved the renewal of the Agreements for an additional one-year term through December 31, 2016 with respect to each Fund. During the course of the year, the Board received a wide variety of materials relating to the investment management and administrative services provided by Dodge & Cox and the performance of each of the Funds.
INFORMATION RECEIVED
In advance of the meeting, the Board, including each of the Independent Trustees, requested, received, and reviewed materials relating to the Agreements and the services provided by Dodge & Cox. The Independent Trustees retained Morningstar® to prepare an independent expense and performance summary for each Fund and comparable funds managed by other advisers identified by Morningstar. The Morningstar materials included information regarding advisory fee rates, expense ratios, and transfer agency, custodial, and distribution expenses, as well as appropriate performance comparisons to each Fund’s peer group and an index or combination of indices. The Morningstar materials also included a comparison of expenses of various share classes offered by comparable funds. The materials reviewed by the Board contained information concerning, among other things, Dodge & Cox’s profitability, financial results and condition, advisory fee revenue, and separate account and sub-adviser fund fee schedules. The Board additionally considered the Funds’ brokerage commissions, turnover rates, sales and redemption data and the significant investment that Dodge & Cox makes in research used in managing the Funds. The Board received and reviewed memoranda and related materials addressing, among other things, Dodge & Cox’s services to the Funds; how Dodge & Cox Funds’ fees compare to fees of peer group funds; the different fees, services, costs, and risks associated with other accounts managed by Dodge & Cox as compared to the Dodge & Cox Funds; and the ways in which the Funds realize economies of scale. Throughout the process of reviewing the services provided by Dodge & Cox and preparing for the meeting, the Independent Trustees found Dodge & Cox to be open, forthright, detailed, and very helpful in answering questions about all issues. The Board received copies of the Agreements and a memorandum from the independent legal counsel to the Independent Trustees discussing the factors generally regarded as appropriate to consider in evaluating advisory arrangements. The Trust’s Contract Review Committee, consisting solely of Independent Trustees, met with the independent legal counsel on November 11, 2015, and again on December 16, 2015, to discuss
whether to renew the Agreements. The Board, including the Independent Trustees, subsequently concluded that the existing Agreements are fair and reasonable and voted to approve the Agreements. In considering the Agreements, the Board, including the Independent Trustees, did not identify any single factor or particular information as all-important or controlling. In reaching the decision to approve the Agreements, the Board considered several factors, discussed below, to be key factors and reached the conclusions described below.
NATURE, QUALITY, AND EXTENT OF THE SERVICES
The Board considered that Dodge & Cox provides a wide range of services to the Funds in addition to portfolio management and that the quality of these services has been excellent in all respects. The extensive nature of services provided by Dodge & Cox has been documented in materials provided to the Board and in presentations made to the Board throughout the year. In particular, the Board considered the nature, quality, and extent of portfolio management, administrative, and shareholder services performed by Dodge & Cox. With regard to portfolio management services, the Board considered Dodge & Cox’s established long-term history of care and conscientiousness in the management of the Funds; its demonstrated consistency in investment approach and depth; the background and experience of the Dodge & Cox Investment Policy Committee, International Investment Policy Committee, Global Stock Investment Policy Committee, Fixed Income Investment Policy Committee, and Global Bond Investment Policy Committee, and research analysts responsible for managing the Funds; its methods for assessing the regulatory and investment climate in various jurisdictions; Dodge & Cox’s overall high level of attention to its core investment management function; and its commitment to the Funds and their shareholders. In the area of administrative and shareholder services, the Board considered the excellent quality of Dodge & Cox’s work in areas such as compliance, legal services, trading, proxy voting, technology, oversight of the Funds’ transfer agent and custodian, tax compliance, and shareholder communication through its website and other means. The Board also noted Dodge & Cox’s diligent disclosure policy, its favorable compliance record, and its reputation as a trusted, shareholder-friendly mutual fund family. In addition, the Board considered that Dodge & Cox manages approximately $185 billion in Fund assets with fewer professionals than most comparable funds, and that on average these professionals have more experience and longer tenure than investment professionals at comparable funds. The Board also noted that Dodge & Cox is an investment research-oriented firm with no other business endeavors to distract management’s attention from its research efforts, and that its investment professionals adhere to a consistent investment approach across the Funds. The Board further considered the favorable stewardship grades given by Morningstar to each of the Funds and the “Gold” analyst rating awarded by Morningstar to all of the Funds except the Global Bond Fund. The Board concluded that it was satisfied with the nature, extent, and quality of investment management and other services provided to the Funds by Dodge & Cox.
PAGE 16 § DODGE & COX GLOBAL BOND FUND
INVESTMENT PERFORMANCE
The Board considered short-term and long-term investment performance for each Fund (including periods of outperformance or underperformance) as compared to both relevant indices and the performance of such Fund’s peer group. The Board noted that the Funds had weak absolute and relative performance in 2015, but remained solid performers over longer periods. The Board determined after extensive review and inquiry that Dodge & Cox’s historic, long-term, team-oriented, bottom-up investment approach remains consistent and that Dodge & Cox continues to be distinguished by its integrity, transparency, and independence. The Board considered that the performance of the Funds is the result of a team-oriented investment management process that emphasizes a long-term investment horizon, comprehensive independent research, price discipline, low cost and low portfolio turnover. The Board also considered that the investment performance delivered by Dodge & Cox to the Funds appeared to be consistent with the relevant performance delivered for other clients of Dodge & Cox. The Board concluded that Dodge & Cox has delivered favorable long-term performance for Fund investors consistent with the long-term investment strategies being pursued by the Funds.
COSTS AND ANCILLARY BENEFITS
Costs of Services to Funds: Fees and Expenses. The Board considered each Fund’s management fee rate and expense ratio relative to each Fund’s peer group and relative to management fees charged by Dodge & Cox to other clients. In particular, the Board considered that the Funds continue to be substantially below their peer group median in expense ratios and that many media and industry reports specifically comment on the low expense ratios of the Funds, which have been a defining characteristic of the Funds for many years. The Board also evaluated the operating structures of the Funds and Dodge & Cox, noting that the Funds do not charge front-end sales commissions or distribution fees, and Dodge & Cox bears, among other things, the significant cost of third party research, reimbursement for recordkeeping and administrative costs to third-party retirement plan administrators, and administrative and office overhead.
The Board noted that expenses are well below industry averages. When compared to peer group funds, the Funds are in the quartile with the lowest expense ratios. The Board also considered that the Funds receive numerous administrative, regulatory compliance, legal, technology and shareholder support services from Dodge & Cox without any additional administrative fee and the fact that the Funds have relatively low transaction costs and portfolio turnover rates. The Board noted the Funds’ unusual single-share-class structure and reviewed Morningstar data showing that the few peer group funds with lower expense ratios often have other share classes with significantly higher expense ratios. In this regard, the Board considered that many of the Funds’ shareholders would not be eligible to purchase comparably-priced shares of many peer group funds, which typically make their lower-priced share classes available only to institutional investors. The Board determined that the Funds provide access for small investors to high quality investment management at a relatively low cost.
The Board reviewed information regarding the fee rates Dodge & Cox charges to separate accounts and subadvised funds that have investment programs similar to those of the Funds, including instances where separate account and sub-advised fund fees are lower than Fund fees. The Board considered differences in the nature and scope of services Dodge & Cox provides to the Funds as compared to other client accounts, differences in regulatory, litigation, and other risks as between Dodge & Cox Funds and other types of clients. The Board also noted that different markets exist for mutual fund and institutional separate account management services. With respect to non-U.S. funds sponsored and managed by Dodge & Cox that are comparable to the Funds in many respects, the Board noted that the fee rates charged by Dodge & Cox are the same as or higher than the fee rates charged to the Funds. After consideration of these matters, the Board concluded that the overall costs incurred by the Funds for the services they receive (including the management fee paid to Dodge & Cox) are reasonable and that the fees are acceptable based upon the qualifications, experience, reputation, and performance of Dodge & Cox and the low overall expense ratios of the Funds.
Profitability and Costs of Services to Dodge & Cox; “Fall-out” Benefits. The Board reviewed reports of Dodge & Cox’s financial position, profitability, and estimated overall value, and considered Dodge & Cox’s overall profitability within its context as a private, employee-owned S-Corporation and relative to the favorable services provided. The Board noted in particular that Dodge & Cox’s profits are not generated by high fee rates, but reflect an extraordinarily streamlined, efficient, and focused business approach toward investment management. The Board recognized the importance of Dodge & Cox’s profitability—which is derived solely from management fees and does not include other business ventures—to maintain its independence, stability, company culture and ethics, and management continuity. The Board also considered that the compensation/profit structure at Dodge & Cox includes a return on shareholder employees’ investment in the firm, which is vital for remaining independent and facilitating retention of management and investment professionals. The Board considered independent research indicating that firms that grow organically, rather than through acquisition, tend to have better performance. Key to organic growth is the ability to retain talented and experienced analysts, portfolio managers and other professionals.
The Board also considered that in January 2015, Dodge & Cox closed the International Stock Fund to new investors to pro-actively manage the growth of the Fund. The Stock Fund and Balanced Fund were similarly closed to new investors during periods of significant growth in the past. While these actions are intended to benefit existing shareholders, the effect is to reduce potential revenues to Dodge & Cox from new shareholders. The Board also considered potential “fall-out” benefits (including the receipt of research from unaffiliated brokers and reputational benefits to non-U.S. funds sponsored and managed by Dodge & Cox) that Dodge & Cox might receive as a
DODGE & COX GLOBAL BOND FUND §PAGE 17
result of its association with the Funds and determined that they are acceptable. The Board also noted that Dodge & Cox continues to invest substantial sums in its business in order to provide enhanced services, systems and research capabilities, all of which benefit the Funds. The Board concluded that Dodge & Cox’s profitability is the keystone of its independence, stability and long-term investment performance and that the profitability of Dodge & Cox’s relationship with the Funds (including fall-out benefits) is fair and reasonable.
ECONOMIES OF SCALE
The Board considered whether there have been economies of scale with respect to the management of each Fund, whether the Funds have appropriately benefited from any economies of scale, and whether the management fee rate is reasonable in relation to the Fund assets and any economies of scale that may exist. In the Board’s view, any consideration of economies of scale must take account of the Funds’ low fee structure and the considerable efficiencies of the Funds’ organization and fee structure that has been realized by shareholders from the time of each Fund’s inception (i.e., from the first dollar). An assessment of economies of scale must also take into account that Dodge & Cox invests significant time and resources in each new Fund for months (and sometimes years) prior to launch; in addition, expenses are capped, which means that Dodge & Cox earns no revenue and subsidizes the operations of a new Fund for a period of time until it reaches scale.
In addition, the Board noted that Dodge & Cox has shared economies of scale by adding or enhancing services to the Funds over time, and that the internal costs of providing investment management, up-to-date technology, administrative, legal, and compliance services to the Funds continue to increase. For example, Dodge & Cox has increased its global research staff and investment resources over the years to address the increased complexity of investing in multinational and non-U.S. companies. In addition, Dodge & Cox has made substantial expenditures in other staff, technology, cybersecurity, and infrastructure to enable it to integrate credit and equity analyses and to be able to implement its strategy in a more effective and secure manner. Over the last ten years, Dodge & Cox has increased its spending on third party research, data services, trading systems, technology, and recordkeeping service expenses at a rate that has significantly outpaced the Funds’ growth rate during the same period.
The Board considered that Dodge & Cox has a history of voluntarily limiting asset growth in several Funds that experienced significant inflows by closing them to new investors in order to protect the Funds’ ability to achieve good investment returns for shareholders. The Board also observed that, even without fee breakpoints, the Funds are competitively priced in a very competitive market and that having a low fee from inception is better for shareholders than starting with a higher fee and adding breakpoints. The Board concluded that the current Dodge & Cox fee structure is fair and reasonable and adequately shares economies of scale that may exist.
CONCLUSION
Based on their evaluation of all material factors and assisted by the advice of independent legal counsel to the Independent Trustees, the Board, including the Independent Trustees, concluded that the advisory fee structure was fair and reasonable, that each Fund was paying a competitive fee for the services provided, that the scope and quality of Dodge & Cox’s services has provided substantial value for Fund shareholders over the long term, and that approval of the Agreements was in the best interests of each Fund and its shareholders.
FUND HOLDINGS
The Fund provides a complete list of its holdings four times each fiscal year, as of the end of each quarter. The Fund files the lists with the Securities and Exchange Commission (SEC) on Form N-CSR (second and fourth quarters) and Form N-Q (first and third quarters). Shareholders may view the Fund’s Forms N-CSR and N-Q on the SEC’s website at sec.gov. Forms N-CSR and N-Q may also be reviewed and copied at the SEC’s Public Reference Room in Washington, DC. Information regarding the operations of the Public Reference Room may be obtained by calling 202-942-8090 (direct) or 800-732-0330 (general SEC number). A list of the Fund’s quarter-end holdings is also available at dodgeandcox.com on or about 15 days following each quarter end and remains available on the web site until the list is updated in the subsequent quarter.
PROXY VOTING
For a free copy of the Fund’s proxy voting policies and procedures, please call 800-621-3979, visit the Fund’s website at www.dodgeandcox.com, or visit the SEC’s website at sec.gov. Information regarding how the Fund voted proxies relating to portfolio securities during the most recent 2-month period ending June 30 is also available at dodgeandcox.com or at sec.gov.
HOUSEHOLD MAILINGS
The Fund routinely mails shareholder reports and summary prospectuses to shareholders and, on occasion, proxy statements. In order to reduce the volume of mail, when possible, only one copy of these documents will be sent to shareholders who are part of the same family and share the same residential address.
If you have a direct account with the Funds and you do not want the mailing of shareholder reports and summary prospectuses combined with other members in your household, contact the Funds at 800-621-3979. Your request will be implemented within 30 days.
PAGE 18 § DODGE & COX GLOBAL BOND FUND
DODGE & COX FUNDS—EXECUTIVE OFFICER & TRUSTEE INFORMATION
| | | | | | |
Name (Age) and
Address* | | Position with Trust (Year of Election or
Appointment) | | Principal Occupation During Past 5 Years | | Other Directorships Held by Trustees |
| INTERESTED TRUSTEES AND EXECUTIVE OFFICERS |
| Charles F. Pohl (57) | | Chairman and Trustee (Officer since 2004) | | Chairman (since 2013), Co-President (2011-2013), Senior Vice President (until 2011), and Director of Dodge & Cox; Chief Investment Officer, Portfolio Manager, Investment Analyst, and member of Investment Policy Committee (IPC), Global Stock Investment Policy Committee (GSIPC), International Investment Policy Committee (IIPC), and Fixed Income Investment Policy Committee (FIIPC) | | — |
| Dana M. Emery (54) | | President and Trustee (Trustee since 1993) | | Chief Executive Officer (since 2013), President (since 2011), Executive Vice President (until 2011), and Director of Dodge & Cox; Director of Fixed Income, Portfolio Manager, and member of FIIPC and Global Bond Investment Policy Committee (GBIPC) | | — |
| John A. Gunn (72) | | Senior Vice President (Officer since 1998) | | Chairman Emeritus (2011-2013), Chairman (until 2011), Chief Executive Officer (until 2010), and Director (until 2013) of Dodge & Cox; Portfolio Manager and member of IPC, GSIPC (until 2014), and IIPC (until 2015) | | — |
| Diana S. Strandberg (56) | | Senior Vice President (Officer since 2006) | | Senior Vice President (since 2011), Vice President (until 2011), and Director (since 2011) of Dodge & Cox; Director of International Equity (since 2009), Portfolio Manager, Investment Analyst, and member of IPC, GSIPC, IIPC, and GBIPC | | — |
| David H. Longhurst (58) | | Treasurer (Officer since 2006) | | Vice President and Assistant Treasurer of Dodge & Cox | | — |
| Thomas M. Mistele (62) | | Secretary (Officer since 1998) | | Chief Operating Officer, Director, Secretary, Senior Counsel (since 2011), and General Counsel (until 2011) of Dodge & Cox | | — |
| Katherine M. Primas (41) | | Chief Compliance Officer (Officer since 2009) | | Vice President (since 2011) and Chief Compliance Officer of Dodge & Cox | | — |
| INDEPENDENT TRUSTEES |
| Thomas A. Larsen (66) | | Trustee (Since 2002) | | Senior Counsel of Arnold & Porter LLP (law firm) (since 2013); Partner of Arnold & Porter LLP (until 2012); Director of Howard, Rice, Nemerovski, Canady, Falk & Rabkin (1977-2011) | | — |
| Ann Mather (55) | | Trustee (Since 2011) | | CFO, Pixar Animation Studios (1999-2004) | | Director, Google, Inc. (internet information services) (since 2005); Director, Glu Mobile, Inc. (multimedia software) (since 2005); Director, Netflix, Inc. (internet television) (since 2010); Director, Arista Networks (cloud networking) (since 2013); Director, Shutterfly, Inc. (internet photography services/publishing) (since 2013) |
| Robert B. Morris III (63) | | Trustee (Since 2011) | | Advisory Director, The Presidio Group (since 2005) | | — |
| Gary Roughead (64) | | Trustee (Since 2013) | | Annenberg Distinguished Visiting Fellow, Hoover Institution (since 2012); Admiral, United States Navy (Ret.); U.S. Navy Chief of Naval Operations (2008-2011) | | Director, Northrop Grumman Corp. (global security) (since 2012) |
| Mark E. Smith (64) | | Trustee (Since 2014) | | Executive Vice President, Managing Director—Fixed Income at Loomis Sayles & Company, L.P. (2003-2011) | | — |
| John B. Taylor (69) | | Trustee (Since 2005) (and 1995-2001) | | Professor of Economics, Stanford University (since 1984); Senior Fellow, Hoover Institution (since 1996); Under Secretary for International Affairs, United States Treasury (2001-2005) | | — |
| * | | The address for each Officer and Trustee is 555 California Street, 40th Floor, San Francisco, California 94104. Each Officer and Trustee oversees all six series in the Dodge & Cox Funds complex and serves for an indefinite term. |
Additional information about the Trust’s Trustees and Officers is available in the Trust’s Statement of Additional Information (SAI). You can get a free copy of the SAI by visiting the Funds’ website at dodgeandcox.com or calling
800-621-3979.
DODGE & COX GLOBAL BOND FUND §PAGE 19
dodgeandcox.com
For Fund literature, transactions, and account
information, please visit the Funds’ website.
or write or call:
DODGE & COX FUNDS
c/o Boston Financial Data Services
P.O. Box 8422
Boston, Massachusetts 02266-8422
(800) 621-3979
INVESTMENT MANAGER
Dodge & Cox
555 California Street, 40th Floor
San Francisco, California 94104
(415) 981-1710
This report is submitted for the general information of the shareholders of the Fund. The report is not authorized for distribution to prospective investors in the Fund unless it is accompanied by a current prospectus.
This report reflects our views, opinions, and portfolio holdings as of December 31, 2015, the end of the reporting period. Any such views are subject to change at any time based upon market or other conditions and Dodge & Cox disclaims any responsibility to update such views. These views may not be relied on as investment advice and, because investment decisions for a Dodge & Cox Fund are based on numerous factors, may not be relied on as an indication of trading intent on behalf of any Dodge & Cox Fund.
A code of ethics, as defined in Item 2 of Form N-CSR, adopted by the registrant and applicable to the registrant’s principal executive officer and principal financial officer was in effect during the entire period covered by this report. A copy of the code of ethics as revised May 1, 2014 is filed as an exhibit to this Form N-CSR. No substantive amendments were approved or waivers were granted to this code of ethics during the period covered by this report.
| ITEM 3. | AUDIT COMMITTEE FINANCIAL EXPERT. |
The Board of Trustees of the registrant has determined that Ann Mather and Robert B. Morris III, members of the registrant’s Audit and Compliance Committee, are each an “audit committee financial expert” and are “independent”, as defined in Item 3 of Form N-CSR.
| ITEM 4. | PRINCIPAL ACCOUNTANT FEES AND SERVICES. |
(a) – (d) Aggregate fees billed to the registrant for the fiscal years ended December 31, 2015 and December 31, 2014 for professional services rendered by the registrant’s principal accountant were as follows:
| | | | | | | | |
| | | 2015 | | | 2014 | |
| (a) Audit Fees | | $ | 340,000 | | | $ | 317,000 | |
| (b) Audit-Related Fees | | | — | | | | — | |
| (c) Tax Fees | | | 350,200 | | | | 333,800 | |
| (d) All Other Fees | | | — | | | | — | |
Audit fees include amounts related to the audit of the registrant’s annual financial statements and services normally provided by the accountant in connection with statutory and regulatory filings. Tax fees include amounts related to tax advice and tax return preparation, compliance, and reviews.
(e) (1) The registrant’s Audit and Compliance Committee has adopted policies and procedures (“Policies”) which require the registrant’s Audit and Compliance Committee to pre-approve all audit and non-audit services provided by the principal accountant to the registrant. The policies also require the Audit and Compliance Committee to pre-approve any engagement of the principal accountant to provide non-audit services to the registrant’s investment adviser, if the services directly impact the registrant’s operations and financial reporting. The Policies do not apply in the case of audit services that the principal accountant provides to the registrant’s adviser. If a service (other than the engagement of the principal accountant to audit the registrant’s financial statements) is required to be pre-approved under the Policies between regularly scheduled Audit and Compliance Committee meetings, pre-approval may be authorized by a designated Audit and Compliance Committee member with ratification at the next scheduled Audit and Compliance Committee meeting.
(e) (2) No services included in (b) – (d) above were approved pursuant to paragraph (c)(7)(i)(C) of Rule 2-01 of Regulation S-X.
(f) Less than 50% of the hours expended on the principal accountant’s engagement to audit the registrant’s financial statements for the most recent fiscal year were attributed to work performed by persons other than the principal accountant’s full-time, permanent employees.
(g) For the fiscal years ended December 31, 2015 and December 31, 2014, the aggregate fees billed by the registrant’s principal accountant for non-audit services rendered to the registrant, for non-audit services rendered to the registrant’s investment adviser, and for non-audit services rendered to entities controlled by the adviser were $795,300 and $723,600, respectively.
(h) All non-audit services described under (g) above that were not pre-approved by the registrant’s Audit and Compliance Committee were considered by the registrant’s Audit and Compliance Committee and found to be compatible with maintaining the principal accountant’s independence.
| ITEM 5. | AUDIT COMMITTEE OF LISTED REGISTRANTS. |
Not applicable.
| ITEM 6. | SCHEDULE OF INVESTMENTS. |
Not applicable. The complete schedule of investments is included in Item 1 of this Form N-CSR.
| ITEM 7. | DISCLOSURE OF PROXY VOTING POLICIES AND PROCEDURES FOR CLOSED-END MANAGEMENT INVESTMENT COMPANIES. |
Not applicable.
| ITEM 8. | PORTFOLIO MANAGERS OF CLOSED-END MANAGEMENT INVESTMENT COMPANIES. |
Not applicable.
| ITEM 9. | PURCHASES OF EQUITY SECURITIES BY CLOSED-END MANAGEMENT INVESTMENT COMPANY AND AFFILIATED PURCHASERS. |
Not applicable.
| ITEM 10. | SUBMISSION OF MATTERS TO A VOTE OF SECURITY HOLDERS. |
The registrant has adopted the following procedures by which shareholders may recommend nominees to the registrant’s Board of Trustees.
1. The shareholder must submit any such recommendation in writing to the registrant to the attention of the Secretary at the address of the principal executive offices of the registrant. The shareholder’s recommendation is then considered by the registrant’s Nominating Committee.
2. The shareholder recommendation must include:
(i) A statement in writing setting forth (a) the name, date of birth, business address and residence address of the person recommended by the shareholder (the “candidate”); and (b) whether the recommending shareholder believes that the candidate is or will be an “interested person” of the registrant (as defined in the Investment Company Act of 1940) and, if not an “interested person,” information regarding the candidate that will be sufficient for the registrant to make such determination and, if applicable, similar information regarding whether the candidate would satisfy the standards for independence of a Board member under listing standards of the New York Stock Exchange or other applicable securities exchange.
(ii) The written and manually signed consent of the candidate to be named as a nominee and to serve as a Trustee if elected;
(iii) The recommending shareholder’s name as it appears on the registrant’s books and the number of all shares of the registrant owned beneficially and of record by the recommending shareholder (as evidenced to the Nominating Committee’s satisfaction by a recent brokerage or account statement); and
(iv) A description of all arrangements or understandings between the recommending shareholder and the candidate and any other person or persons (including their names) pursuant to which the recommendation is being made by the recommending shareholder.
In addition, the Nominating Committee may require the candidate to furnish such other information as it may reasonably require or deem necessary to determine the eligibility of such candidate to serve on the Board or to satisfy applicable law and information regarding the candidate that would be required to be disclosed if the candidate were a nominee in a proxy statement or other filing required to be made in connection with solicitation of proxies for election of Trustees.
| ITEM 11. | CONTROLS AND PROCEDURES. |
(a) An evaluation was performed within 90 days of the filing of this report, under the supervision and with the participation of the registrant’s management, including the principal executive officer and principal financial officer, of the effectiveness of the design and operation of the registrant’s disclosure controls and procedures. Based on that evaluation, the principal executive officer and principal financial officer concluded that the registrant’s disclosure controls and procedures were effective.
(b) The registrant’s principal executive officer and principal financial officer are aware of no changes in the registrant’s internal control over financial reporting that occurred during the second fiscal quarter of the period covered by this report that has materially affected, or is reasonably likely to materially affect, the registrant’s internal control over financial reporting.
(a) (1) The registrant’s code of ethics pursuant to Item 2 of Form N-CSR is attached. (EX.99A)
(a) (2) Certifications pursuant to Section 302 of the Sarbanes-Oxley Act of 2002 are attached. (EX.99B)
(a) (3) Not applicable.
(b) Certifications pursuant to Section 906 of the Sarbanes-Oxley Act of 2002 are attached. (EX.99C)
SIGNATURES
Pursuant to the requirements of the Securities Exchange Act of 1934 and the Investment Company Act of 1940, the registrant has duly caused this report to be signed on its behalf by the undersigned, thereunto duly authorized.
| | |
| Dodge & Cox Funds |
| |
| By | | /s/ Charles F. Pohl |
| | Charles F. Pohl |
| | Chairman – Principal Executive Officer |
| |
| Date | | February 26, 2016 |
Pursuant to the requirements of the Securities Exchange Act of 1934 and the Investment Company Act of 1940, this report has been signed below by the following persons on behalf of the registrant and in the capacities and on the dates indicated.
| | |
| Dodge & Cox Funds |
| |
| By | | /s/ Charles F. Pohl |
| | Charles F. Pohl |
| | Chairman – Principal Executive Officer |
| |
| By | | /s/ David H. Longhurst |
| | David H. Longhurst |
| | Treasurer – Principal Financial Officer |
| |
| Date | | February 26, 2016 |