UNITED STATES
SECURITIES AND EXCHANGE COMMISSION
Washington, D.C. 20549
FORMN-CSR
CERTIFIED SHAREHOLDER REPORT OF REGISTERED
MANAGEMENT INVESTMENT COMPANIES
Investment Company Act file number811-173
DODGE & COX FUNDS
(Exact name of registrant as specified in charter)
555 California Street, 40th Floor
San Francisco, CA 94104
(Address of principal executive offices) (Zip code)
Roberta R.W. Kameda, Esq.
555 California Street, 40th Floor
San Francisco, CA 94104
(Name and address of agent for service)
Registrant’s telephone number, including area code:415-981-1710
Date of fiscal year end: DECEMBER 31, 2018
Date of reporting period: DECEMBER 31, 2018
FormN-CSR is to be used by management investment companies to file reports with the Commission not later than 10 days after the transmission to stockholders of any report that is required to be transmitted to stockholders under Rule30e-1 under the Investment Company Act of 1940 (17 CFR270.30e-1). The Commission may use the information provided on FormN-CSR in its regulatory, disclosure review, inspection, and policymaking roles.
A registrant is required to disclose the information specified by FormN-CSR, and the Commission will make this information public. A registrant is not required to respond to the collection of information contained in FormN-CSR unless the Form displays a currently valid Office of Management and Budget (“OMB”) control number. Please direct comments concerning the accuracy of the information collection burden estimate and any suggestions for reducing the burden to Secretary, Securities and Exchange Commission, 450 Fifth Street, NW, Washington, DC 20549-0609. The OMB has reviewed this collection of information under the clearance requirements of 44 U.S.C. ss. 3507.
ITEM 1. REPORTS TO STOCKHOLDERS.
The following are the December 31, 2018 annual reports for the Dodge & Cox Funds, a Delaware statutory trust, consisting of six series: Dodge & Cox Stock Fund, Dodge & Cox Global Stock Fund, Dodge & Cox International Stock Fund, Dodge & Cox Balanced Fund, Dodge & Cox Income Fund, and Dodge & Cox Global Bond Fund. The reports of each series were transmitted to their respective shareholders on February 19, 2019.

DODGE & COX FUNDS®
Annual Report
December 31, 2018
Stock Fund
ESTABLISHED 1965
TICKER: DODGX
Important Notice:
Beginning on January 1, 2021, we intend to discontinue mailing paper copies of the Fund’s shareholder reports as permitted by new regulations adopted by the Securities and Exchange Commission, unless you specifically request paper copies from Dodge & Cox Funds or from your financial intermediary, such as a broker-dealer or bank. The reports will remain available to you on the Dodge & Cox Funds website (dodgeandcox.com), and you will be notified by mail each time a report is posted and provided with a link to access the report.
If you have already elected to receive shareholder reports electronically, you will not be affected by this change and do not need to take any action. If you have not done so already, you may elect to receive shareholder reports and other communications electronically by enrolling ine-delivery on the Funds website, or, if you are invested through a financial intermediary, by updating your mailing preferences through the intermediary.
If you wish to continue receiving paper copies of all future shareholder reports, please contact us at (800)621-3979. Reports will be provided to you free of charge. If you are invested through a financial intermediary, you may contact your financial intermediary to request to receive paper copies. Your election to receive reports in paper form will apply to all funds held with Dodge & Cox Funds or through your financial intermediary, as applicable.
12/18 SF AR  Printed on recycled paper
TO OUR SHAREHOLDERS
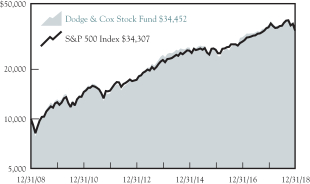
The Dodge & Cox Stock Fund had a total return of –7.1% for the year ended December 31, 2018, compared to a return of –4.4% for the S&P 500 Index.
MARKET COMMENTARY
In 2018, global equity markets were volatile and posted significant losses. Although returns were negative, the United States outperformed most other equity markets—the S&P 500 was down 4% compared to a decline of nearly 14% for the MSCI EAFE Index.(a) Over the course of the year, the S&P 500 experienced two divergent periods of performance.
During the first nine months of 2018, U.S. equities posted strong returns: the S&P 500 was up 11% and reached anall-time high in late September. U.S. growth stocks (the higher valuation portion of the equity market) outperformed value stocks (the lower valuation portion) by 13 percentage points, continuing a longer-term trend.(b) From 2014 through September 30, 2018, growth outperformed value by 39 percentage points,(c) fueled by growth-oriented companies in sectors and industries associated with technology—most notably the “FAANG” stocks (Facebook, Amazon, Apple, Netflix, Google). Over this period, the Fund performed strongly compared to the U.S. value investment universe; however, the Fund’s value-oriented approach hindered its relative returns versus the broad-based S&P 500.
Starting in October, volatility spiked as investors became worried about the pace of U.S. interest rate increases, a weakening global economy, and rising geopolitical concerns, including the escalating trade conflict between the United States and China. Brexit-related uncertainty and Italy’s political turmoil also weighed on multinational companies. There was a significant correction in the fourth quarter, especially among technology stocks. Companies in more value-oriented sectors, including Health Care and Utilities, outperformed. Overall, the S&P 500 declined 14% during the quarter.
INVESTMENT STRATEGY
Market volatility can create buying opportunities for patient, long-term, value-oriented investors like Dodge & Cox. Asbottom-up investors, we pay close attention to macro factors, but our research process places more emphasis on individual company fundamentals relative to valuation. We view this approach as a more reliable factor in determining long-term investment merit.
In 2018, we made gradual portfolio adjustments based on relative valuation changes. For example, as valuations increased, we trimmed selected Information Technology and Health Care holdings that had performed strongly. The Fund’s largest sale was Merck, a leading pharmaceutical company held in the Fund since 2009. While the company has a strong management team, we decided to sell Merck given its higher valuation and our concerns about Merck’s dependence on its blockbuster cancer drug Keytruda for future sales growth. In addition, we believe the company is entering a period of heavy, sustained investment as it manages through a product cycle, which could pressure profit margins.
Nevertheless, the Fund remained overweight the Health Care sector (22.8% compared to 15.5% for the S&P 500).(d) We are enthusiastic about the Fund’s Pharmaceuticals holdings because valuations are attractive and new drug approvals demonstrate improving research productivity. Moreover, the substantial cash flows at these companies are not sensitive to economic swings and their healthy dividends provide a solid, stable source of return. We believe Health Care is a more attractive, defensive alternative to Consumer Staples, where valuations are higher but growth prospects are lower.
Additionally, as a result of individual security selection, we increased the Fund’s Energy exposure from 7.8% to 8.5% during 2018—a significant add given the S&P 500 Energy sector was down 18%. We also increased the portfolio’s exposure to select Industrials companies as valuations declined. For example, we initiated a position in United Technologies(e) (highlighted below) and added to the Fund’s existing holdings in FedEx and Johnson Controls International.
Energy
During the fourth quarter, Brent crude oil prices dropped 35%, weighing heavily on the outlook for energy-related companies, and Energy was the worst-performing sector (down 24%) within the S&P 500. While the short-term direction of oil prices is difficult to forecast, we believe slower supply growth and increasing demand point to higher prices over our investment horizon. Weighing valuation against individual company fundamentals, we recently added to the Fund’s positions in Occidental Petroleum and Halliburton, among others.
Occidental Petroleum
A multinational oil and gas company, Occidental Petroleum’s stock price declined 24% in the fourth quarter along with the broader Energy sector, due to concerns about the macro environment and oil supply. While the company faces political risks in Oman and the United Arab Emirates, we believe investors overreacted in the short term, given Occidental’s solid long-term underlying business fundamentals. Occidental is considered a partner of choice for many companies and countries due to its technological capabilities, experience managing reservoirs, and global reach. The company has an attractive growth profile andlow-cost assets in the Permian Basin and the Middle East. Given low operating costs and modest maintenance capital expenditures, these businesses are profitable across a broad range of oil prices. Occidental’s proven management team has created a strong corporate culture with a focus on returns, steady growth, and consistent dividends. In addition, the company has a strong balance sheet, an attractive valuation at 14 times forward earnings, and a 5% dividend yield. On December 31, Occidental comprised 1.6% of the Fund.
Halliburton
Halliburton is the second-largest diversified oil services company after Schlumberger. Of the “big four” diversified oil services
PAGE 2§ DODGE & COX STOCK FUND
companies, Halliburton has the largest and strongest position in the North American market, primarily due to its leading pressure pumping (hydraulic fracturing) business. In 2018, investors became concerned that insufficient pipeline capacity to transport oil out of the Permian Basin may negatively impact North American pressure pumping activity. Infrastructure in the Permian has failed to keep pace with production growth, causing Permian-produced barrels to trade at a steep discount and exploration and production companies to scale back activity until new capacity comes online. As a result, oil services companies with large exposure to North America, like Halliburton, sold off in the first half of 2018. These concerns depressed Halliburton’s valuation and presented an attractive long-term buying opportunity, given the company’s strong franchise.
Although North American services activity has rebounded meaningfully since early 2016, our analysis suggests further investment will be needed for North America to maintain and grow oil production. With competitive advantages due to its scale and superior execution, we expect Halliburton to grow operating profits in North America over the next three to five years. Halliburton’s international business is much better positioned than in previous cycles. Over the past several years, the company invested in key product lines, expanded its international presence, and built deeper relationships with national oil companies. These investments are paying off—Halliburton has outpaced Schlumberger, the leading international service company, on international growth in most quarters since 2015. We believe Halliburton can continue gaining share as international markets recover. In addition, management has renewed its focus on returning capital to shareholders. Thus, we initiated a position in Halliburton during the third quarter and added further in December as oil prices fell. At year end, Halliburton accounted for 0.7% of the Fund’s net assets.
United Technologies
United Technologies is a multi-industry conglomerate comprised of world-class franchises in elevators/escalators (Otis), jet engines and aerospace supply (Pratt and Whitney), HVAC(f) (Carrier), fire/security, and refrigeration. United Technologies’ aerospace margins have been under pressure as Boeing and Airbus moved into the aftermarket, squeezing their supply base. Despite this risk, we believe the company is an attractive long-term investment opportunity at 14 times forward earnings. United Technologies has premier global franchises with attractive long-term growth potential and a high degree of visibility based on its substantial backlog (over seven years) of aerospace contracts. United Technologies recently acquired Rockwell Collins, making the combined company the largest global aerospace supplier. The launch of its new jet engine platform should drive earnings growth in the years ahead. Meanwhile, United Technologies has announced plans to split into three companies, which could create substantial shareholder value; we estimate each of its world-class franchises trades 15 to 20% below “pure-play” peers. United Technologies was a 1.4% position on December 31.
IN CLOSING
Despite the market turmoil, we remain optimistic about the long-term prospects for the Fund’s investments. The portfolio’s valuation is attractive and trades at a meaningful discount to the overall market: 12.1 times forward earnings compared to 15.4 times for the S&P 500. We also believe longer-term global economic growth will be better than many investors expect, and the Fund is well positioned to capitalize on this.
Our fundamental, active, value-oriented investment approach requires conviction and patience. Accordingly, maintaining a long-term investment horizon and staying the course are essential. We thank you for your continued confidence in Dodge & Cox. As always, we welcome your comments and questions.
For the Board of Trustees,
| | |
 | |  |
Charles F. Pohl, Chairman | | Dana M. Emery, President |
January 31, 2019
| (a) | | The MSCI EAFE (Europe, Australasia, Far East) Index is a broad-based, unmanaged equity market index aggregated from 21 developed market country indices, excluding the United States and Canada. |
| (b) | | The Russell 1000 Growth Index had a total return of 17.1% compared to 3.9% for the Russell 1000 Value Index from December 31, 2017 through September 30, 2018. |
| (c) | | The Russell 1000 Growth Index had a total return of 72.5% compared to 33.2% for the Russell 1000 Value Index from December 31, 2014 through September 30, 2018. |
| (d) | | Unless otherwise specified, all weightings and characteristics are as of December 31, 2018. |
| (e) | | The use of specific examples does not imply that they are more or less attractive investments than the portfolio’s other holdings. |
| (f) | | HVAC = heating, ventilation, and air conditioning. |
DODGE & COX STOCK FUND§PAGE 3
2018 PERFORMANCE REVIEW
The Fund underperformed the S&P 500 by 2.7 percentage points in 2018.
Key Detractors from Relative Results
| | § | | The Fund’s average overweight position (27% versus 14%) and weak returns from holdings in the Financials sector (down 17% compared to down 13% for the S&P 500 sector) hampered results. Goldman Sachs (down 34%), Capital One Financial (down 23%), and Wells Fargo (down 22%) were key detractors. | |
| | § | | The Energy sector was the worst-performing segment of the Fund (holdings down 27%) and the S&P 500 (down 18%). The Fund’s higher average weighting in the sector (8% versus 6%) also hurt results. Schlumberger (down 45%), Apache (down 36%), and Baker Hughes, a GE Company (down 30%) were notable. | |
| | § | | Within the reconstituted Consumer Discretionary sector (down 7% compared to up 2% for the S&P 500 sector), not owning Amazon (up 28%) was the main drag on relative performance. In contrast, small holdings Mattel (down 35%) and Harley-Davidson (down 31%) lagged. | |
| | § | | Other detractors included DISH Network (down 48%), Micro Focus International (down 46%), FedEx (down 35%), and Charter Communications (down 15%). | |
Key Contributors to Relative Results
| | § | | In Health Care, the Fund’s average overweight position (23% versus 15% for the S&P 500) and holdings (up 9% compared to up 6% for the S&P 500 sector) had a significant, positive impact. Eli Lilly (up 40%), Express Scripts (up 24% to date of acquisition by Cigna), AstraZeneca (up 14%), and GlaxoSmithKline (up 14%) performed well. | |
| | § | | The Fund’s significant underweight position (average less than 1% versus 7%) in the Consumer Staples sector, which lagged the overall Index (down 9% for the S&P 500 sector), helped results. | |
| | § | | Standout performers included Twenty-First Century Fox (up 41% owing to a bidding war for most of the company) and Dell Technologies (up 39%). | |
| | § | | Not owning certain large companies in the S&P 500, including General Electric (down 55%) and Facebook (down 26%), also contributed notably. | |
KEY CHARACTERISTICS OF DODGE & COX
Independent Organization
Dodge & Cox is one of the largest privately owned investment managers in the world. We remain committed to independence, with a goal of providing the highest quality investment management service to our existing clients.
Over 85 Years of Investment Experience
Dodge & Cox was founded in 1930. We have a stable and well-qualified team of investment professionals, most of whom have spent their entire careers at Dodge & Cox.
Experienced Investment Team
The U.S. Equity Investment Committee, which is the decision-making body for the Stock Fund, is a nine-member committee with an average tenure at Dodge & Cox of 24 years.
One Business with a Single Research Office
Dodge & Cox manages equity (domestic, international, and global), fixed income (domestic and global), and balanced investments, operating from one office in San Francisco.
Consistent Investment Approach
Our team decision-making process involves thorough, bottom-up fundamental analysis of each investment.
Long-Term Focus and Low Expenses
We invest with a three- to five-year investment horizon, which has historically resulted in low turnover relative to our peers. We manage Funds that maintain low expense ratios.
Risks: The Fund is subject to market risk, meaning holdings in the Fund may decline in value for extended periods due to the financial prospects of individual companies, or due to general market and economic conditions. Please read the prospectus and summary prospectus for specific details regarding the Fund’s risk profile.
PAGE 4§ DODGE & COX STOCK FUND
GROWTH OF $10,000 OVER 10 YEARS
FOR AN INVESTMENT MADE ON DECEMBER 31, 2008
AVERAGE ANNUAL TOTAL RETURN
FOR PERIODS ENDED DECEMBER 31, 2018
| | | | | | | | | | | | | | | | |
| | | 1 Year | | | 5 Years | | | 10 Years | | | 20 Years | |
Dodge & Cox Stock Fund | | | –7.08 | % | | | 7.05 | % | | | 13.17 | % | | | 8.87 | % |
S&P 500 Index | | | –4.38 | | | | 8.49 | | | | 13.12 | | | | 5.62 | |
Returns represent past performance and do not guarantee future results. Investment return and share price will fluctuate with market conditions, and investors may have a gain or loss when shares are sold. Fund performance changes over time and currently may be significantly lower than stated. Performance is updated and published monthly. Visit the Fund’s website at dodgeandcox.com or call800-621-3979 for current performance figures.
The Fund’s total returns include the reinvestment of dividend and capital gain distributions, but have not been adjusted for any income taxes payable by shareholders on these distributions or on Fund share redemptions. Index returns include dividends but, unlike Fund returns, do not reflect fees or expenses. The S&P 500 Index is a market capitalization-weighted index of 500 large-capitalization stocks commonly used to represent the U.S. equity market.
S&P 500® is a trademark of S&P Global Inc.
FUND EXPENSE EXAMPLE
As a Fund shareholder, you incur ongoing Fund costs, including management fees and other Fund expenses. All mutual funds have ongoing costs, sometimes referred to as operating expenses. The following example shows ongoing costs of investing in the Fund and can help you understand these costs and compare them with those of other mutual funds. The example assumes a $1,000 investment held for the six months indicated.
ACTUAL EXPENSES
The first line of the table below provides information about actual account values and expenses based on the Fund’s actual returns. You may use the information in this line, together with your account balance, to estimate the expenses that you paid over the period. Simply divide your account value by $1,000 (for example, an $8,600 account value divided by $1,000 = 8.6), then multiply the result by the number in the first line under the heading “Expenses Paid During Period” to estimate the expenses you paid on your account during this period.
HYPOTHETICAL EXAMPLE FOR COMPARISON WITH OTHER MUTUAL FUNDS
Information on the second line of the table can help you compare ongoing costs of investing in the Fund with those of other mutual funds. This information may not be used to estimate the actual ending account balance or expenses you paid during the period. The hypothetical “Ending Account Value” is based on the actual expense ratio of the Fund and an assumed 5% annual rate of return before expenses (not the Fund’s actual return). The amount under the heading “Expenses Paid During Period” shows the hypothetical expenses your account would have incurred under this scenario. You can compare this figure with the 5% hypothetical examples that appear in shareholder reports of other mutual funds.
| | | | | | | | | | | | |
Six Months Ended
December 31, 2018 | | Beginning Account Value
7/1/2018 | | | Ending Account Value
12/31/2018 | | | Expenses Paid
During Period* | |
Based on Actual Fund Return | | $ | 1,000.00 | | | $ | 920.60 | | | $ | 2.50 | |
Based on Hypothetical 5% Yearly Return | | | 1,000.00 | | | | 1,022.60 | | | | 2.64 | |
| * | | Expenses are equal to the Fund’s annualized expense ratio of 0.52%, multiplied by the average account value over the period, multiplied by 184/365 (to reflect the one-half year period). |
The expenses shown in the table highlight ongoing costs only and do not reflect any transactional fees or account maintenance fees. Though other mutual funds may charge such fees, please note that the Fund does not charge transaction fees (e.g., redemption fees, sales loads) or universal account maintenance fees (e.g., small account fees).
DODGE & COX STOCK FUND§PAGE 5
| | | | |
| FUND INFORMATION (unaudited) | | | December 31, 2018 | |
| | | | |
| GENERAL INFORMATION | | | |
Net Asset Value Per Share | | | $172.81 | |
Total Net Assets (billions) | | | $63.0 | |
Expense Ratio | | | 0.52% | |
Portfolio Turnover Rate | | | 20% | |
30-Day SEC Yield(a) | | | 1.76% | |
Active Share(b) | | | 79% | |
Number of Companies | | | 69 | |
Fund Inception | | | 1965 | |
No sales charges or distribution fees | | | | |
Investment Manager: Dodge & Cox, San Francisco. Managed by the U.S. Equity Investment Committee, whose nine members’ average tenure at Dodge & Cox is 24 years.
| | | | | | | | |
| PORTFOLIO CHARACTERISTICS | | Fund | | | S&P 500 | |
Median Market Capitalization (billions) | | | $36 | | | | $19 | |
Weighted Average Market Capitalization (billions) | | | $136 | | | | $201 | |
Price-to-Earnings Ratio(c) | | | 12.1x | | | | 15.4x | |
Foreign Securities not in the S&P 500(d) | | | 12.7% | | | | 0.0% | |
| | | | |
| TEN LARGEST HOLDINGS (%)(e) | | Fund | |
Comcast Corp. | | | 4.1 | |
Wells Fargo & Co. | | | 3.6 | |
Charter Communications, Inc. | | | 3.2 | |
Charles Schwab Corp. | | | 3.1 | |
Microsoft Corp. | | | 3.1 | |
Alphabet, Inc. | | | 3.1 | |
Sanofi(France) | | | 2.8 | |
Bank of America Corp. | | | 2.7 | |
Capital One Financial Corp. | | | 2.7 | |
Novartis AG(Switzerland) | | | 2.6 | |
| | | | | | | | |
SECTOR DIVERSIFICATION (%) | | Fund | | | S&P 500 | |
Financials | | | 24.9 | | | | 13.3 | |
Health Care | | | 22.8 | | | | 15.5 | |
Communication Services | | | 15.3 | | | | 10.1 | |
Information Technology | | | 13.1 | | | | 20.1 | |
Energy | | | 8.5 | | | | 5.3 | |
Industrials | | | 6.4 | | | | 9.2 | |
Consumer Discretionary | | | 3.6 | | | | 10.0 | |
Materials | | | 1.0 | | | | 2.7 | |
Consumer Staples | | | 0.5 | | | | 7.4 | |
Utilities | | | 0.0 | | | | 3.4 | |
Real Estate | | | 0.0 | | | | 3.0 | |
| (a) | SEC Yield is an annualization of the Fund’s net investment income for the trailing30-day period. Dividends paid by the Fund may be higher or lower than implied by the SEC Yield. |
| (b) | Active share is a measure of how much an investment portfolio differs from its benchmark index, based on a scale of 0% (complete overlap with the index) to 100% (no overlap). Overlap for each security in the Fund is the lower of either its percentage weight in the Fund or its percentage weight in the relevant index. The Fund’s total overlap with the S&P 500 is the sum of each security’s calculated overlap. |
| (c) | Price-to-earnings (P/E) ratios are calculated using12-month forward earnings estimates from third-party sources. |
| (d) | Foreign securities are U.S. dollar denominated. |
| (e) | The Fund’s portfolio holdings are subject to change without notice. The mention of specific securities is not a recommendation to buy, sell, or hold any particular security and is not indicative of Dodge & Cox’s current or future trading activity. |
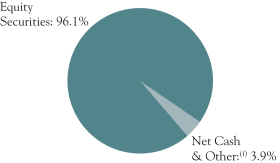
| (f) | Net Cash & Other includes cash, short-term investments, derivatives, receivables, and payables. |
PAGE 6§ DODGE & COX STOCK FUND
| | | | |
| PORTFOLIO OF INVESTMENTS | | | December 31, 2018 | |
| | | | | | | | |
| COMMON STOCKS: 96.1% | |
| | |
| | | SHARES | | | VALUE | |
| COMMUNICATION SERVICES: 15.3% | |
MEDIA & ENTERTAINMENT: 13.6% | |
Alphabet, Inc., Class A(a) | | | 82,500 | | | $ | 86,209,200 | |
Alphabet, Inc., Class C(a) | | | 1,793,153 | | | | 1,857,007,178 | |
Charter Communications, Inc., Class A(a) | | | 7,023,786 | | | | 2,001,568,296 | |
Comcast Corp., Class A | | | 76,555,794 | | | | 2,606,724,786 | |
DISH Network Corp., Class A(a) | | | 11,776,176 | | | | 294,051,115 | |
News Corp., Class A | | | 7,528,790 | | | | 85,451,767 | |
Twenty-First Century Fox, Inc., Class A | | | 25,409,326 | | | | 1,222,696,767 | |
Twenty-First Century Fox, Inc., Class B | | | 8,300,600 | | | | 396,602,668 | |
| | | | | | | | |
| | | | 8,550,311,777 | |
TELECOMMUNICATION SERVICES: 1.7% | |
AT&T, Inc. | | | 12,615,287 | | | | 360,040,291 | |
Sprint Corp.(a) | | | 58,634,327 | | | | 341,251,783 | |
Zayo Group Holdings, Inc.(a)(b) | | | 16,027,500 | | | | 366,068,100 | |
| | | | | | | | |
| | | | 1,067,360,174 | |
| | | | | | | | |
| | | | 9,617,671,951 | |
| CONSUMER DISCRETIONARY: 3.6% | |
AUTOMOBILES & COMPONENTS: 0.3% | |
Harley-Davidson, Inc. | | | 6,581,047 | | | | 224,545,324 | |
|
CONSUMER DURABLES & APPAREL: 0.3% | |
Mattel, Inc.(a)(b) | | | 20,504,501 | | | | 204,839,965 | |
|
RETAILING: 3.0% | |
Booking Holdings, Inc.(a) | | | 532,600 | | | | 917,360,892 | |
Qurate Retail, Inc., Series A(a) | | | 32,289,076 | | | | 630,282,764 | |
Target Corp. | | | 1,337,915 | | | | 88,422,802 | |
The Gap, Inc. | | | 8,991,303 | | | | 231,615,965 | |
| | | | | | | | |
| | | | 1,867,682,423 | |
| | | | | | | | |
| | | | 2,297,067,712 | |
| CONSUMER STAPLES: 0.5% | |
FOOD, BEVERAGE & TOBACCO: 0.5% | |
Molson Coors Brewing Company, Class B | | | 5,801,525 | | | | 325,813,644 | |
|
| ENERGY: 8.5% | |
Anadarko Petroleum Corp.(b) | | | 26,957,621 | | | | 1,181,822,105 | |
Apache Corp.(b) | | | 31,484,032 | | | | 826,455,840 | |
Baker Hughes, a GE Company | | | 36,084,952 | | | | 775,826,468 | |
Concho Resources, Inc.(a) | | | 2,450,500 | | | | 251,886,895 | |
Halliburton Co. | | | 17,500,000 | | | | 465,150,000 | |
National Oilwell Varco, Inc.(b) | | | 10,645,009 | | | | 273,576,731 | |
Occidental Petroleum Corp. | | | 16,914,726 | | | | 1,038,225,882 | |
Schlumberger, Ltd.
(Curacao/United States) | | | 14,955,645 | | | | 539,599,672 | |
Weatherford International PLC(a) (Ireland/United States) | | | 29,359,600 | | | | 16,412,016 | |
| | | | | | | | |
| | | | 5,368,955,609 | |
| FINANCIALS: 24.9% | |
BANKS: 9.6% | |
Bank of America Corp. | | | 69,596,700 | | | | 1,714,862,688 | |
BB&T Corp. | | | 11,015,944 | | | | 477,210,694 | |
JPMorgan Chase & Co. | | | 16,329,700 | | | | 1,594,105,314 | |
Wells Fargo & Co. | | | 49,727,141 | | | | 2,291,426,657 | |
| | | | | | | | |
| | | | 6,077,605,353 | |
DIVERSIFIED FINANCIALS: 12.4% | |
American Express Co. | | | 16,313,200 | | | | 1,554,974,224 | |
Bank of New York Mellon Corp. | | | 31,562,624 | | | | 1,485,652,712 | |
Capital One Financial Corp.(b) | | | 22,661,213 | | | | 1,712,961,090 | |
Charles Schwab Corp. | | | 47,605,000 | | | | 1,977,035,650 | |
Goldman Sachs Group, Inc. | | | 6,476,000 | | | | 1,081,815,800 | |
| | | | | | | | |
| | | | 7,812,439,476 | |
INSURANCE: 2.9% | |
AEGON NV (Netherlands) | | | 73,163,067 | | | | 340,208,262 | |
Brighthouse Financial, Inc.(a)(b) | | | 6,699,363 | | | | 204,196,584 | |
| | | | | | | | |
| | |
| | | SHARES | | | VALUE | |
MetLife, Inc. | | | 30,428,900 | | | $ | 1,249,410,634 | |
| | | | | | | | |
| | | | 1,793,815,480 | |
| | | | | | | | |
| | | | 15,683,860,309 | |
| HEALTH CARE: 22.8% | |
HEALTH CARE EQUIPMENT & SERVICES: 6.0% | |
Cigna Corp. | | | 8,097,805 | | | | 1,537,935,072 | |
CVS Health Corp. | | | 9,300,000 | | | | 609,336,000 | |
Danaher Corp. | | | 3,129,500 | | | | 322,714,040 | |
Medtronic PLC (Ireland/United States) | | | 3,517,100 | | | | 319,915,416 | |
UnitedHealth Group, Inc. | | | 3,860,160 | | | | 961,643,059 | |
| | | | | | | | |
| | | | 3,751,543,587 | |
PHARMACEUTICALS, BIOTECHNOLOGY & LIFE SCIENCES: 16.8% | |
Alnylam Pharmaceuticals, Inc.(a) | | | 2,813,861 | | | | 205,158,605 | |
AstraZeneca PLC ADR (United Kingdom) | | | 32,696,973 | | | | 1,241,831,035 | |
Bristol-Myers Squibb Co. | | | 25,848,739 | | | | 1,343,617,453 | |
Eli Lilly and Co. | | | 9,160,219 | | | | 1,060,020,543 | |
Gilead Sciences, Inc. | | | 10,945,612 | | | | 684,648,031 | |
GlaxoSmithKline PLC ADR (United Kingdom) | | | 32,000,000 | | | | 1,222,720,000 | |
Incyte Corp.(a) | | | 2,000,000 | | | | 127,180,000 | |
Novartis AG ADR (Switzerland) | | | 19,251,900 | | | | 1,652,005,539 | |
Roche Holding AG ADR (Switzerland) | | | 42,192,699 | | | | 1,311,349,085 | |
Sanofi ADR (France) | | | 40,419,428 | | | | 1,754,607,369 | |
| | | | | | | | |
| | | | 10,603,137,660 | |
| | | | | | | | |
| | | | 14,354,681,247 | |
| INDUSTRIALS: 6.4% | |
CAPITAL GOODS: 3.4% | |
Johnson Controls International PLC (Ireland/United States) | | | 42,454,251 | | | | 1,258,768,542 | |
United Technologies Corp. | | | 8,350,000 | | | | 889,108,000 | |
| | | | | | | | |
| | | | 2,147,876,542 | |
TRANSPORTATION: 3.0% | |
FedEx Corp. | | | 9,663,999 | | | | 1,559,092,959 | |
Union Pacific Corp. | | | 2,344,600 | | | | 324,094,058 | |
| | | | | | | | |
| | | | 1,883,187,017 | |
| | | | | | | | |
| | | | 4,031,063,559 | |
| INFORMATION TECHNOLOGY: 13.1% | |
SEMICONDUCTORS & SEMICONDUCTOR EQUIPMENT: 1.7% | |
Maxim Integrated Products, Inc. | | | 5,445,475 | | | | 276,902,404 | |
Microchip Technology, Inc. | | | 11,350,233 | | | | 816,308,757 | |
| | | | | | | | |
| | | | 1,093,211,161 | |
SOFTWARE & SERVICES: 4.3% | |
Dell Technologies, Inc., Class C(a) | | | 5,625,133 | | | | 274,900,250 | |
Micro Focus International PLC ADR(b)(United Kingdom) | | | 24,000,377 | | | | 413,046,488 | |
Microsoft Corp. | | | 19,280,600 | | | | 1,958,330,542 | |
Synopsys, Inc.(a) | | | 533,863 | | | | 44,972,619 | |
| | | | | | | | |
| | | | 2,691,249,899 | |
TECHNOLOGY, HARDWARE & EQUIPMENT: 7.1% | |
Cisco Systems, Inc. | | | 20,308,411 | | | | 879,963,449 | |
Hewlett Packard Enterprise Co.(b) | | | 84,295,793 | | | | 1,113,547,426 | |
HP Inc. | | | 50,846,578 | | | | 1,040,320,986 | |
Juniper Networks, Inc.(b) | | | 25,633,165 | | | | 689,788,470 | |
TE Connectivity, Ltd. (Switzerland) | | | 9,527,564 | | | | 720,569,665 | |
| | | | | | | | |
| | | | 4,444,189,996 | |
| | | | | | | | |
| | | | 8,228,651,056 | |
| MATERIALS: 1.0% | |
Ball Corporation | | | 1,468,578 | | | | 67,525,216 | |
Celanese Corp. | | | 6,266,298 | | | | 563,778,831 | |
| | | | | | | | |
| | | | 631,304,047 | |
| | | | | | | | |
TOTAL COMMON STOCKS
(Cost $46,623,019,047) | | | $ | 60,539,069,134 | |
| | |
| See accompanying Notes to Financial Statements | | DODGE & COX STOCK FUND§PAGE 7 |
| | | | |
| PORTFOLIO OF INVESTMENTS | | | December 31, 2018 | |
| | | | | | | | |
| SHORT-TERM INVESTMENTS: 3.7% | |
| | |
| | | PAR VALUE/ SHARES | | | VALUE | |
REPURCHASE AGREEMENT: 3.3% | |
Fixed Income Clearing Corporation(c)
1.60%, dated 12/31/18, due 1/2/19, maturity value $2,093,395,063 | | $ | 2,093,209,000 | | | $ | 2,093,209,000 | |
|
MONEY MARKET FUND: 0.4% | |
State Street Institutional U.S. Government Money Market Fund | | | 250,412,031 | | | | 250,412,031 | |
| | | | | | | | |
TOTAL SHORT-TERM INVESTMENTS
(Cost $2,343,621,031) | | | $ | 2,343,621,031 | |
| | | | | | | | |
TOTAL INVESTMENTS IN SECURITIES
(Cost $48,966,640,078) | | | 99.8 | % | | $ | 62,882,690,165 | |
OTHER ASSETS LESS LIABILITIES | | | 0.2 | % | | | 122,001,982 | |
| | | | | | | | |
| NET ASSETS | | | 100.0 | % | | $ | 63,004,692,147 | |
| | | | | | | | |
| (b) | See Note 9 regarding holdings of 5% voting securities |
| (c) | Repurchase agreement is collateralized by U.S. Treasury Inflation Indexed Note 0.125%, 4/15/20 and U.S. Treasury Notes1.375%-2.625%,4/30/20-8/15/20. Total collateral value is $2,135,088,878. |
In determining a company’s country designation, the Fund generally references the country of incorporation. In cases where the Fund considers the country of incorporation to be a “jurisdiction of convenience” chosen primarily for tax purposes or in other limited circumstances, the Fund uses the country designation of an appropriate broad-based market index. In those cases, two countries are listed - the country of incorporation and the country designated by an appropriate index, respectively.
ADR: American Depositary Receipt
FUTURES CONTRACTS
| | | | | | | | | | | | | | | | |
| Description | | Number of
Contracts | | | Expiration
Date | | | Notional
Amount | | | Value /
Unrealized
Appreciation
(Depreciation) | |
E-mini S&P 500 Index—Long Position | | | 18,732 | | | | 3/15/19 | | | $ | 2,346,370,320 | | | $ | 1,506,941 | |
| | |
| PAGE 8§ DODGE & COX STOCK FUND | | See accompanying Notes to Financial Statements |
| | | | |
STATEMENT OF ASSETS AND LIABILITIES | |
| |
| | | December 31, 2018 | |
ASSETS: | | | | |
Investments in securities, at value | | | | |
Unaffiliated issuers (cost $42,930,003,077) | | $ | 57,882,925,187 | |
Affiliated issuers (cost $6,036,637,001) | | | 4,999,764,978 | |
| | | | |
| | | 62,882,690,165 | |
Cash | | | 74,206 | |
Deposits with broker for futures contracts | | | 112,392,000 | |
Receivable for variation margin for futures contracts | | | 17,982,720 | |
Receivable for investments sold | | | 8,400,861 | |
Receivable for Fund shares sold | | | 97,603,948 | |
Dividends and interest receivable | | | 84,026,675 | |
Prepaid expenses and other assets | | | 696,135 | |
| | | | |
| | | 63,203,866,710 | |
| | | | |
LIABILITIES: | | | | |
Payable for investments purchased | | | 1,412,076 | |
Payable for Fund shares redeemed | | | 168,366,092 | |
Management fees payable | | | 27,919,273 | |
Accrued expenses | | | 1,477,122 | |
| | | | |
| | | 199,174,563 | |
| | | | |
NET ASSETS | | $ | 63,004,692,147 | |
| | | | |
NET ASSETS CONSIST OF: | | | | |
Paid in capital | | $ | 46,748,088,472 | |
Total distributable earnings | | | 16,256,603,675 | |
| | | | |
| | $ | 63,004,692,147 | |
| | | | |
Fund shares outstanding (par value $0.01 each, unlimited shares authorized) | | | 364,587,708 | |
Net asset value per share | | $ | 172.81 | |
| |
STATEMENT OF OPERATIONS | | | | |
| |
| | | Year Ended
December 31, 2018 | |
INVESTMENT INCOME: | | | | |
Dividends (net of foreign taxes of $25,995,122) | | | | |
Unaffiliated issuers | | $ | 1,197,694,770 | |
Affiliated issuers | | | 167,687,233 | |
Interest | | | 13,295,726 | |
| | | | |
| | | 1,378,677,729 | |
| | | | |
EXPENSES: | | | | |
Management fees | | | 357,797,197 | |
Custody and fund accounting fees | | | 872,436 | |
Transfer agent fees | | | 3,666,090 | |
Professional services | | | 225,658 | |
Shareholder reports | | | 1,478,710 | |
Registration fees | | | 382,627 | |
Trustees’ fees | | | 324,167 | |
ADR depositary service fees | | | 6,722,477 | |
Miscellaneous | | | 985,758 | |
| | | | |
| | | 372,455,120 | |
| | | | |
NET INVESTMENT INCOME | | | 1,006,222,609 | |
| | | | |
REALIZED AND UNREALIZED GAIN (LOSS): | | | | |
Net realized gain (loss) | | | | |
Investments in securities of unaffiliated issuers | | | 6,817,569,932 | |
Investments in securities of affiliated issuers | | | 4,300,134 | |
Futures contracts | | | (72,552,552 | ) |
Net change in unrealized appreciation/depreciation | | | | |
Investments in securities of unaffiliated issuers | | | (10,566,446,809 | ) |
Investments in securities of affiliated issuers | | | (1,991,979,743 | ) |
Futures contracts | | | (9,816,012 | ) |
| | | | |
Net realized and unrealized loss | | | (5,818,925,050 | ) |
| | | | |
NET CHANGE IN NET ASSETS FROM OPERATIONS | | $ | (4,812,702,441 | ) |
| | | | |
| | | | | | | | |
STATEMENT OF CHANGES IN NET ASSETS | |
| | |
| | | Year Ended
December 31, 2018 | | | Year Ended
December 31, 2017 | |
OPERATIONS: | | | | | | | | |
Net investment income | | $ | 1,006,222,609 | | | $ | 1,049,903,472 | |
Net realized gain (loss) | | | 6,749,317,514 | | | | 3,567,659,704 | |
Net change in unrealized appreciation/depreciation | | | (12,568,242,564 | ) | | | 6,614,504,649 | |
| | | | | | | | |
| | | (4,812,702,441 | ) | | | 11,232,067,825 | |
| | | | | | | | |
| | |
DISTRIBUTIONS TO SHAREHOLDERS: | | | | | | | | |
Total distributions | | | (5,765,113,809 | ) | | | (4,660,640,417 | )(a) |
| | |
FUND SHARE
TRANSACTIONS: | | | | | | | | |
Proceeds from sale of shares | | | 8,154,979,913 | | | | 8,669,060,752 | |
Reinvestment of distributions | | | 5,469,183,979 | | | | 4,418,678,881 | |
Cost of shares redeemed | | | (10,942,582,148 | ) | | | (10,358,716,247 | ) |
| | | | | | | | |
Net change from Fund share transactions | | | 2,681,581,744 | | | | 2,729,023,386 | |
| | | | | | | | |
Total change in net assets | | | (7,896,234,506 | ) | | | 9,300,450,794 | |
| | |
NET ASSETS: | | | | | | | | |
Beginning of year | | | 70,900,926,653 | | | | 61,600,475,859 | |
| | | | | | | | |
End of year | | $ | 63,004,692,147 | | | $ | 70,900,926,653 | (b) |
| | | | | | | | |
| | |
SHARE INFORMATION: | | | | | | | | |
Shares sold | | | 40,043,780 | | | | 44,674,938 | |
Distributions reinvested | | | 30,452,377 | | | | 22,297,192 | |
Shares redeemed | | | (54,124,818 | ) | | | (53,003,282 | ) |
| | | | | | | | |
Net change in shares outstanding | | | 16,371,339 | | | | 13,968,848 | |
| | | | | | | | |
| (a) | Prior year comparative amounts have been adjusted to reflect current presentation under new accounting standards. Prior year distributions consisted of $1,054,882,152 from net investment income and $3,605,758,265 from net realized gain. |
| (b) | Includes undistributed net investment income of $7,788,890. |
| | |
| See accompanying Notes to Financial Statements | | DODGE & COX STOCK FUND§PAGE 9 |
NOTES TO FINANCIAL STATEMENTS
NOTE 1—ORGANIZATION AND SIGNIFICANT ACCOUNTING POLICIES
Dodge & Cox Stock Fund (the “Fund”) is one of the series constituting the Dodge & Cox Funds (the “Trust” or the “Funds”). The Trust is organized as a Delaware statutory trust and is registered under the Investment Company Act of 1940, as amended, as anopen-end management investment company. The Fund commenced operations on January 4, 1965, and seeks long-term growth of principal and income. Risk considerations and investment strategies of the Fund are discussed in the Fund’s Prospectus.
The Fund is an investment company and follows the accounting and reporting guidance issued in Topic 946 by the Financial Accounting Standards Board. The financial statements have been prepared in conformity with accounting principles generally accepted in the United States of America, which require the use of estimates and assumptions by management. Actual results may differ from those estimates. Significant accounting policies are as follows:
Security valuation The Fund’s net assets are normally valued as of the scheduled close of trading on the New York Stock Exchange (NYSE), generally 4 p.m. Eastern Time, each day that the NYSE is open for business.
Portfolio holdings for which market quotes are readily available are valued at market value. Listed securities, for example, are generally valued using the official quoted close price or the last sale on the exchange that is determined to be the primary market for the security. Exchange-traded derivatives are generally valued at the settlement price determined by the relevant exchange. Short-term securities less than 60 days to maturity may be valued at amortized cost if amortized cost approximates current value. Mutual funds are valued at their respective net asset values. Security values are not discounted based on the size of the Fund’s position and may differ from the value a Fund receives upon sale of the securities. All securities held by the Fund are denominated in U.S. dollars.
If market quotations are not readily available or if normal valuation procedures produce valuations that are deemed unreliable or inappropriate under the circumstances existing at the time, the investment will be valued at fair value as determined in good faith by or under the direction of the Fund’s Board of Trustees. The Board of Trustees has appointed Dodge & Cox, the Fund’s investment manager, to make fair value determinations in accordance with the Dodge & Cox Funds Valuation Policies (“Valuation Policies”), subject to Board oversight. Dodge & Cox has established a Pricing Committee that is comprised of representatives from Treasury, Legal, Compliance, and Operations. The Pricing Committee is responsible for implementing the Valuation Policies, including determining the fair value of securities and other investments when necessary. The Pricing Committee considers relevant indications of value that are reasonably available to it in determining the fair value assigned to a particular security, such as the value of similar financial instruments, trading volumes, contractual restrictions on disposition, related corporate actions, and changes in economic conditions. In doing so, the Pricing Committee employs various
methods for calibrating fair valuation approaches, including a regular review of key inputs and assumptions, back-testing, and review of any related market activity.
Valuing securities through a fair value determination involves greater reliance on judgment than valuation of securities based on readily available market quotations. In some instances, lack of information and uncertainty as to the significance of information may lead to a conclusion that a prior valuation is the best indication of a security’s value. When fair value pricing is employed, the prices of securities used by the Fund to calculate its net asset value may differ from quoted or published prices for the same securities.
Security transactions, investment income, expenses, and distributions Security transactions are recorded on the trade date. Realized gains and losses on securities sold are determined on the basis of identified cost.
Dividend income and corporate action transactions are recorded on theex-dividend date, or when the Fund first learns of the dividend/corporate action if the ex-dividend date has passed.Non-cash dividends, if any, are recorded at the fair market value of the securities received. Dividends characterized as return of capital for U.S. tax purposes are recorded as a reduction of cost of investments and/or realized gain. Interest income is recorded on the accrual basis.
Expenses are recorded on the accrual basis. Some expenses of the Trust can be directly attributed to a specific series. Expenses which cannot be directly attributed are allocated among the Funds in the Trust using methodologies determined by the nature of the expense.
Distributions to shareholders are recorded on theex-dividend date.
Repurchase agreements Repurchase agreements are transactions under which a Fund purchases a security from a dealer counterparty and agrees to resell the security to that counterparty on a specified future date at the same price, plus a specified interest rate. The Fund’s repurchase agreements are secured by U.S. government or agency securities. It is the Fund’s policy that its custodian take possession of the underlying collateral securities, the fair value of which exceeds the principal amount of the repurchase transaction, including accrued interest, at all times. In the event of default by the counterparty, the Fund has the contractual right to liquidate the collateral securities and to apply the proceeds in satisfaction of the obligation.
Foreign taxes The Fund may be subject to foreign taxes which may be imposed by certain countries in which the Fund invests. The Fund endeavors to record foreign taxes based on applicable foreign tax law. Withholding taxes are incurred on certain foreign dividends and are accrued at the time the associated dividend is recorded. The Fund files withholding tax reclaims in certain jurisdictions to recover a portion of amounts previously withheld. The Fund records a reclaim receivable based on, among other things, a jurisdiction’s legal obligation to pay reclaims as well as payment history and market convention. In consideration of recent decisions rendered by
PAGE 10§ DODGE & COX STOCK FUND
NOTES TO FINANCIAL STATEMENTS
European courts, the Fund has filed for additional reclaims related to prior years. A corresponding receivable is established when both the amount is known and significant contingencies or uncertainties regarding collectability are removed. These amounts, if any, are reported in “dividends and interest receivable” in the Statement of Assets and Liabilities.
Futures contracts Futures contracts involve an obligation to purchase or sell (depending on whether the Fund has entered a long or short futures contract, respectively) an asset at a future date, at a price set at the time of the contract. Upon entering into a futures contract, the Fund is required to deposit an amount of cash or liquid assets (referred to as initial margin) in a segregated account with the clearing broker. Subsequent payments (referred to as variation margin) to and from the clearing broker are made on a daily basis based on changes in the market value of futures contracts. Futures contracts are traded publicly and their market value changes daily. Changes in the market value of open futures contracts are recorded as unrealized appreciation or depreciation in the Statement of Operations. Realized gains and losses on futures contracts are recorded in the Statement of Operations at the closing or expiration of the contracts. Cash deposited with a broker as initial margin is recorded in the Statement of Assets and Liabilities. A receivable and/or payable to brokers for daily variation margin is also recorded in the Statement of Assets and Liabilities.
Investments in futures contracts may include certain risks, which may be different from, and potentially greater than, those of the underlying securities. To the extent the Fund uses futures, it is exposed to additional volatility and potential losses resulting from leverage.
The Fund has maintained long S&P 500 futures contracts to provide equity exposure that approximates the Fund’s “net cash and other” position, which includes cash, short-term investments, receivables, and payables. During the year ended December 31, 2018, these S&P 500 futures contracts had notional values up to 4% of net assets.
Indemnification Under the Trust’s organizational documents, its officers and trustees are indemnified against certain liabilities arising out of the performance of their duties to the Trust. In addition, in the normal course of business the Trust enters into contracts that provide general indemnities to other parties. The Trust’s maximum exposure under these arrangements is unknown as this would involve future claims that may be made against the Trust that have not yet occurred.
NOTE 2—VALUATION MEASUREMENTS
Various inputs are used in determining the value of the Fund’s investments. These inputs are summarized in the three broad levels listed below.
| § | | Level 1: Quoted prices in active markets for identical securities |
| § | | Level 2: Other significant observable inputs (including quoted prices for similar securities, market indices, interest rates, credit risk, forward exchange rates, etc.) |
| § | | Level 3: Significant unobservable inputs (including Fund management’s assumptions in determining the fair value of investments) |
The inputs or methodology used for valuing securities are not necessarily an indication of the risk associated with investing in those securities.
The following is a summary of the inputs used to value the Fund’s holdings at December 31, 2018:
| | | | | | | | |
| Classification | | LEVEL 1
(Quoted Prices) | | | LEVEL 2
(Other Significant
Observable Inputs) | |
Securities | | | | | | | | |
Common Stocks(a) | | $ | 60,539,069,134 | | | $ | — | |
Short-term Investments | | | | | | | | |
Repurchase Agreement | | | — | | | | 2,093,209,000 | |
Money Market Fund | | | 250,412,031 | | | | — | |
| | | | | | | | |
Total | | $ | 60,789,481,165 | | | $ | 2,093,209,000 | |
| | | | | | | | |
| | |
Other Investments | | | | | | | | |
Futures Contracts | | | | | | | | |
Appreciation | | $ | 1,506,941 | | | $ | — | |
| | | | | | | | | |
| (a) | All common stocks held in the Fund are Level 1 securities. For a detailed break-out of common stocks by major industry classification, please refer to the Portfolio of Investments. |
NOTE 3—RELATED PARTY TRANSACTIONS
Management fees Under a written agreement approved by a unanimous vote of the Board of Trustees, the Fund pays a management fee monthly at an annual rate of 0.50% of the Fund’s average daily net assets to Dodge & Cox, investment manager of the Fund. The agreement further provides that Dodge & Cox shall waive its fee to the extent that such fee plus all other ordinary operating expenses of the Fund exceed 0.75% of the average daily net assets for the year.
Fund officers and trustees All officers and two of the trustees of the Trust are officers or employees of Dodge & Cox. The Trust pays a fee only to those trustees who are not affiliated with Dodge & Cox.
NOTE 4—INCOME TAX INFORMATION AND DISTRIBUTIONS TO SHAREHOLDERS
A provision for federal income taxes is not required since the Fund intends to continue to qualify as a regulated investment company under Subchapter M of the Internal Revenue Code and distribute all of its taxable income to shareholders. Distributions are determined in accordance with income tax regulations, and such amounts may differ from net investment income and realized gains for financial reporting purposes. The Fund may also designate a portion of the amount paid to redeeming shareholders as a distribution for tax purposes. Financial reporting records are adjusted for permanent book to tax differences at year end to reflect tax character. Book to tax differences are primarily due to differing treatments of wash sales, net short-term realized gain (loss), certain corporate action transactions, derivatives, and distributions.
DODGE & COX STOCK FUND§PAGE 11
NOTES TO FINANCIAL STATEMENTS
Distributions during the years noted below were characterized as follows for federal income tax purposes:
| | | | | | | | |
| | | Year Ended
December 31, 2018 | | | Year Ended
December 31, 2017 | |
Ordinary income | | $ | 1,021,848,439 | | | $ | 1,232,159,263 | |
| |
| ($2.947 per share
| )
| | | ($3.636 per share | ) |
Long-term capital gain | | $
| 4,743,265,370
|
| | $ | 3,428,481,154 | |
| |
| ($13.793 per share
| )
| | | ($10.173 per share | ) |
At December 31, 2018, the tax basis components of distributable earnings were as follows:
| | | | |
Undistributed ordinary income | | $ | 91,321,645 | |
Undistributed long-term capital gain | | | 2,175,559,439 | |
At December 31, 2018, unrealized appreciation and depreciation for investments and derivatives based on cost for federal income tax purposes were as follows:
| | | | |
Tax cost | | $ | 48,894,474,515 | |
| | | | |
Unrealized appreciation | | | 18,171,642,663 | |
Unrealized depreciation | | | (4,181,920,072 | ) |
| | | | |
Net unrealized appreciation | | | 13,989,722,591 | |
| | | | | |
Fund management has reviewed the tax positions for open periods (three years and four years, respectively, from filing the Fund’s Federal and State tax returns) as applicable to the Fund, and has determined that no provision for income tax is required in the Fund’s financial statements.
NOTE 5—LOAN FACILITIES
Pursuant to an exemptive order issued by the Securities and Exchange Commission (SEC), the Fund may participate in an interfund lending facility (Facility). The Facility allows the Fund to borrow money from or loan money to the Funds. Loans under the Facility are made for temporary or emergency purposes, such as to fund shareholder redemption requests. Interest on borrowings is the average of the current repurchase agreement rate and the bank loan rate. There was no activity in the Facility during the year.
All Funds in the Trust participate in a $500 million committed credit facility (Line of Credit) with State Street Bank and Trust Company, to be utilized for temporary or emergency purposes to fund shareholder redemptions or for other short-term liquidity purposes. The maximum amount available to the Fund is $250 million. Each Fund pays an annual commitment fee on itspro-rata portion of the Line of Credit. For the year ended December 31, 2018, the Fund’s commitment fee amounted to $426,145 and is reflected as a Miscellaneous Expense in the Statement of Operations. Interest on borrowings is charged at the prevailing rate. There were no borrowings on the Line of Credit during the year.
NOTE 6—PURCHASES AND SALES OF INVESTMENTS
For the year ended December 31, 2018, purchases and sales of securities, other than short-term securities, aggregated $13,763,687,829 and $17,402,330,258, respectively.
NOTE 7—NEW ACCOUNTING GUIDANCE
In August 2018, the Financial Accounting Standards Board issued Accounting Standards Update “Fair Value Measurement (Topic 820)” (ASU 2018-13) which modifies the disclosure requirements for fair value measurement by removing, modifying, or adding certain disclosures. The amendments are effective for annual periods beginning after December 15, 2019, and interim periods within those annual periods. The Fund is permitted to early adopt any removed or modified disclosures upon issuance of this update and delay adoption of the additional disclosures until their effective date. The Fund has early adopted the updated accounting standards on the Fund’s financial statements.
NOTE 8—SUBSEQUENT EVENTS
Fund management has determined that no material events or transactions occurred subsequent to December 31, 2018, and through the date of the Fund’s financial statements issuance, which require additional disclosure in the Fund’s financial statements.
PAGE 12§ DODGE & COX STOCK FUND
NOTES TO FINANCIAL STATEMENTS
NOTE 9—HOLDINGS OF 5% VOTING SECURITIES
Each of the companies listed below was considered to be an affiliate of the Fund because the Fund owned 5% or more of the company’s voting securities during all or part of the year ended December 31, 2018. Transactions during the year in these securities were as follows:
| | | | | | | | | | | | | | | | | | | | | | | | | | | | | | | | |
| | | Shares at
Beginning of Year | | | Additions | | | Reductions | | | Shares at
End of Year | | | Dividend Income(a) | | | Realized Gain (Loss) | | | Net Change in Unrealized Appreciation/
Depreciation | | | Value at
End of Year | |
COMMON STOCKS: 7.9% | | | | | | | | | |
COMMUNICATION SERVICES: 0.6% | | | | | | | | | |
Zayo Group Holdings, Inc.(b) | | | 14,027,500 | | | | 2,000,000 | | | | — | | | | 16,027,500 | | | $ | — | | | $ | — | | | $ | (216,664,513 | ) | | $ | 366,068,100 | |
| | |
CONSUMER DISCRETIONARY: 0.3% | | | | | | | | | |
Mattel, Inc.(b) | | | 16,700,000 | | | | 3,804,501 | | | | — | | | | 20,504,501 | | | | — | | | | — | | | | (101,314,820 | ) | | | 204,839,965 | |
| | |
ENERGY: 3.2% | | | | | | | | | |
Anadarko Petroleum Corp. | | | 27,357,621 | | | | — | | | | (400,000 | ) | | | 26,957,621 | | | | 28,505,502 | | | | 3,924,232 | | | | (263,811,523 | ) | | | 1,181,822,105 | |
Apache Corp. | | | 18,700,694 | | | | 12,783,338 | | | | — | | | | 31,484,032 | | | | 22,813,198 | | | | — | | | | (373,508,584 | ) | | | 826,455,840 | |
National Oilwell Varco, Inc. | | | 18,698,800 | | | | 1,300,000 | | | | (9,353,791 | ) | | | 10,645,009 | | | | 3,398,645 | | | | (190,658,754 | ) | | | 156,065,615 | | | | — | (c) |
| | | | | | | | | | | | | | | | | | | | | | | | | | | | | | | | |
| | | | | | | | | | | | | | | | | | | | | | | | | | | | | | | 2,008,277,945 | |
| | | | | | | | | | | | | | | | | | | | | | | | | | | | | | | | |
| | |
FINANCIALS: 0.3% | | | | | | | | | |
Brighthouse Financial, Inc.(b) | | | 2,099,363 | | | | 4,600,000 | | | | — | | | | 6,699,363 | | | | — | | | | — | | | | (114,097,793 | ) | | | 204,196,584 | |
Capital One Financial Corp. | | | 26,795,511 | | | | 150,000 | | | | (4,284,298 | ) | | | 22,661,213 | | | | 41,143,098 | | | | 99,042,053 | | | | (654,296,219 | ) | | | — | (c) |
| | | | | | | | | | | | | | | | | | | | | | | | | | | | | | | | |
| | | | | | | | | | | | | | | | | | | | | | | | | | | | | | | 204,196,584 | |
| | | | | | | | | | | | | | | | | | | | | | | | | | | | | | | | |
| | |
INFORMATION TECHNOLOGY: 3.5% | | | | | | | | | |
Hewlett Packard Enterprise Co. | | | 102,041,816 | | | | — | | | | (17,746,023 | ) | | | 84,295,793 | | | | 36,102,966 | | | | 91,992,603 | | | | (131,709,225 | ) | | | 1,113,547,426 | |
Juniper Networks, Inc. | | | 22,833,165 | | | | 2,800,000 | | | | — | | | | 25,633,165 | | | | 17,951,879 | | | | — | | | | (35,026,797 | ) | | | 689,788,470 | |
Micro Focus International PLC ADR | | | 14,012,968 | | | | 9,987,409 | | | | — | | | | 24,000,377 | | | | 17,771,945 | | | | — | | | | (257,615,884 | ) | | | 413,046,488 | |
| | | | | | | | | | | | | | | | | | | | | | | | | | | | | | | | |
| | | | | | | | | | | | | | | | | | | | | | | | | | | | | | | 2,216,382,384 | |
| | | | | | | | | | | | | | | | | | | | | | | | | | | | | | | | |
| | | | | | | | | | | | | | | | | | $ | 167,687,233 | | | $ | 4,300,134 | | | $ | (1,991,979,743 | ) | | $ | 4,999,764,978 | |
| | | | | | | | | | | | | | | | | | | | | | | | | | | | | | | | |
| | | | | | | | | | | | | | | | | | | | | | | | | | | | | | | | | |
| (a) | Net of foreign taxes, if any |
| (c) | Company was not an affiliate at year end |
FINANCIAL HIGHLIGHTS
| | | | | | | | | | | | | | | | | | | | |
SELECTED DATA AND RATIOS (for a share outstanding throughout each year) | | Year Ended December 31, | |
| | | 2018 | | | 2017 | | | 2016 | | | 2015 | | | 2014 | |
| | | | |
Net asset value, beginning of year | | | $203.61 | | | | $184.30 | | | | $162.77 | | | | $180.94 | | | | $168.87 | |
Income from investment operations: | | | | | | | | | | | | | | | | | | | | |
Net investment income | | | 2.90 | | | | 3.09 | | | | 3.05 | | | | 2.42 | | | | 2.83 | |
Net realized and unrealized gain (loss) | | | (16.96 | ) | | | 30.03 | | | | 30.56 | | | | (10.55 | ) | | | 14.60 | |
| | | | |
Total from investment operations | | | (14.06 | ) | | | 33.12 | | | | 33.61 | | | | (8.13 | ) | | | 17.43 | |
| | | | |
Distributions to shareholders from: | | | | | | | | | | | | | | | | | | | | |
Net investment income | | | (2.90 | ) | | | (3.11 | ) | | | (3.03 | ) | | | (2.46 | ) | | | (2.80 | ) |
Net realized gain | | | (13.84 | ) | | | (10.70 | ) | | | (9.05 | ) | | | (7.58 | ) | | | (2.56 | ) |
| | | | |
Total distributions | | | (16.74 | ) | | | (13.81 | ) | | | (12.08 | ) | | | (10.04 | ) | | | (5.36 | ) |
| | | | |
Net asset value, end of year | | | $172.81 | | | | $203.61 | | | | $184.30 | | | | $162.77 | | | | $180.94 | |
| | | | |
Total return | | | (7.08 | )% | | | 18.32 | % | | | 21.27 | % | | | (4.47 | )% | | | 10.43 | % |
Ratios/supplemental data: | | | | | | | | | | | | | | | | | | | | |
Net assets, end of year (millions) | | | $63,005 | | | | $70,901 | | | | $61,600 | | | | $54,845 | | | | $60,260 | |
Ratio of expenses to average net assets | | | 0.52 | % | | | 0.52 | % | | | 0.52 | % | | | 0.52 | % | | | 0.52 | % |
Ratio of net investment income to average net assets | | | 1.41 | % | | | 1.58 | % | | | 1.83 | % | | | 1.36 | % | | | 1.62 | % |
Portfolio turnover rate | | | 20 | % | | | 13 | % | | | 16 | % | | | 15 | % | | | 17 | % |
See accompanying Notes to Financial Statements
DODGE & COX STOCK FUND§PAGE 13
REPORT OF INDEPENDENT REGISTERED PUBLIC ACCOUNTING FIRM
To the Board of Trustees of the Dodge & Cox Funds and Shareholders of Dodge & Cox Stock Fund
Opinion on the Financial Statements
We have audited the accompanying statement of assets and liabilities, including the portfolio of investments, of Dodge & Cox Stock Fund (one of the funds constituting Dodge & Cox Funds, referred to hereafter as the “Fund”) as of December 31, 2018, the related statement of operations for the year ended December 31, 2018, the statement of changes in net assets for each of the two years in the period ended December 31, 2018, including the related notes, and the financial highlights for each of the five years in the period ended December 31, 2018 (collectively referred to as the “financial statements”). In our opinion, the financial statements present fairly, in all material respects, the financial position of the Fund as of December 31, 2018, the results of its operations for the year then ended, the changes in its net assets for each of the two years in the period ended December 31, 2018 and the financial highlights for each of the five years in the period ended December 31, 2018 in conformity with accounting principles generally accepted in the United States of America.
Basis for Opinion
These financial statements are the responsibility of the Fund’s management. Our responsibility is to express an opinion on the Fund’s financial statements based on our audits. We are a public accounting firm registered with the Public Company Accounting Oversight Board (United States) (PCAOB) and are required to be independent with respect to the Fund in accordance with the U.S. federal securities laws and the applicable rules and regulations of the Securities and Exchange Commission and the PCAOB.
We conducted our audits of these financial statements in accordance with the standards of the PCAOB. Those standards require that we plan and perform the audit to obtain reasonable assurance about whether the financial statements are free of material misstatement, whether due to error or fraud.
Our audits included performing procedures to assess the risks of material misstatement of the financial statements, whether due to error or fraud, and performing procedures that respond to those risks. Such procedures included examining, on a test basis, evidence regarding the amounts and disclosures in the financial statements. Our audits also included evaluating the accounting principles used and significant estimates made by management, as well as evaluating the overall presentation of the financial statements. Our procedures included confirmation of securities owned as of December 31, 2018 by correspondence with the custodian, transfer agent and brokers; when replies were not received from brokers, we performed other auditing procedures. We believe that our audits provide a reasonable basis for our opinion.
PricewaterhouseCoopers LLP
San Francisco, California
February 15, 2019
We have served as the auditor of one or more investment companies in the Dodge & Cox Funds since 1931.
PAGE 14§ DODGE & COX STOCK FUND
SPECIAL 2018 TAX INFORMATION
(unaudited)
The following information is provided pursuant to provisions of the Internal Revenue Code:
The Fund designates $4,949,127,203 as long-term capital gain distributions in 2018.
The Fund designates up to a maximum amount of $1,390,396,699 of its distributions paid to shareholders in 2018 as qualified dividends (treated for federal income tax purposes in the hands of shareholders as taxable at a maximum rate of 20%).
For shareholders that are corporations, the Fund designates 79% of its ordinary dividends paid to shareholders in 2018 as dividends from domestic corporations eligible for the corporate dividends received deduction, provided that the shareholder otherwise satisfies applicable requirements to claim that deduction.
BOARD APPROVAL OF FUNDS’ INVESTMENT
MANAGEMENT AGREEMENTS AND MANAGEMENT FEES
(unaudited)
The Board of Trustees is responsible for overseeing the performance of the Dodge & Cox Funds’ investment manager and determining whether to continue the Investment Management Agreements between the Funds and Dodge & Cox each year (the “Agreements”). At a meeting of the Board of Trustees of the Trust held on December 13, 2018, the Trustees, by a unanimous vote (including a separate vote of those Trustees who are not “interested persons” (as defined in the Investment Company Act of 1940) (the “Independent Trustees”)), approved the renewal of the Agreements for an additional one-year term through December 31, 2019 with respect to each Fund. During the course of the year, the Board received extensive information and materials relating to the investment management and administrative services provided by Dodge & Cox and the performance of each of the Funds.
INFORMATION RECEIVED
Over the past several years, the Board has requested, received, and discussed a number of special presentations on topics relevant to their annual consideration of the proposed renewal of the Funds’ Agreements. In addition to the foregoing and in advance of the meetings referred to below, the Board, including the Independent Trustees, requested, received, and reviewed materials relating to the Agreements and the services provided by Dodge & Cox. The Independent Trustees retained Broadridge to prepare an independent expense and performance summary for each Fund and comparable funds managed by other advisers identified by Broadridge. The Broadridge materials included information regarding advisory fee rates, expense ratios, and transfer agency, custodial, and distribution expenses, as well as performance comparisons to each Fund’s peer group and to a broad-based securities index or combination of indices. The Broadridge materials also included a comparison of expenses of various share classes offered by comparable funds. The materials reviewed by the Board contained information concerning, among other things, Dodge & Cox’s profitability, financial results and condition, advisory fee revenue, and separate account fee schedules. The Board additionally considered the Funds’ brokerage commissions,
turnover rates, sales and redemption data, and the significant investment that Dodge & Cox makes in research used in managing the Funds. The Board received and reviewed memoranda and related materials addressing, among other things, Dodge & Cox’s services to the Funds; how Dodge & Cox Funds’ fees compare to fees of peer group funds; the different fees, services, costs, and risks associated with other accounts managed by Dodge & Cox as compared to the Dodge & Cox Funds; and the ways in which the Funds realize economies of scale. Throughout the process of reviewing the services provided by Dodge & Cox and preparing for the meeting, the Independent Trustees found Dodge & Cox to be open, forthright, detailed, and very helpful in answering questions about all issues. The Board received copies of the Agreements and a memorandum from the independent legal counsel to the Independent Trustees discussing the factors generally regarded as appropriate to consider in evaluating advisory arrangements. The Trust’s Contract Review Committee, consisting solely of Independent Trustees, met with the independent legal counsel on November 8, 2018 and again on December 13, 2018 to discuss whether to renew the Agreements. The Board, including the Independent Trustees, subsequently concluded that the existing Agreements are fair and reasonable and voted to approve the Agreements. In considering the Agreements, the Board, including the Independent Trustees, did not identify any single factor or particular information as all-important or controlling. In reaching the decision to approve the Agreements, the Board considered several factors, discussed below, to be key factors and reached the conclusions described below.
NATURE, QUALITY, AND EXTENT OF THE SERVICES
The Board considered that Dodge & Cox provides a wide range of services to the Funds in addition to portfolio management, including regulatory compliance, trading desks, proxy voting, transfer agent and custodian oversight, administration, regulatory filings, tax compliance and filings, web site, and anti-money laundering. The extensive nature of services provided by Dodge & Cox has been documented in materials provided to the Board and in presentations made to the Board throughout the year. In particular, the Board considered the nature, quality, and extent of portfolio management, administrative, and shareholder services performed by Dodge & Cox. With regard to portfolio management services, the Board considered Dodge & Cox’s established long-term history of care and conscientiousness in the management of the Funds; its demonstrated consistency in investment approach and depth; the background and experience of the Dodge & Cox U.S. Equity Investment Committee, International Equity Investment Committee, Global Equity Investment Committee, U.S. Fixed Income Investment Committee, and Global Fixed Income Investment Committee, and research analysts responsible for managing the Funds; Dodge & Cox’s methods for assessing the regulatory and investment climate in various jurisdictions; its overall high level of attention to its core investment management function; and its commitment to the Funds and their shareholders. The Board noted Dodge & Cox’s long record of favorable press and industry coverage, as well as its positive compliance record, and its reputation as a trusted, shareholder-friendly mutual fund family.
DODGE & COX STOCK FUND§PAGE 15
In addition, the Board considered that Dodge & Cox manages approximately $215 billion in Fund assets with fewer professionals than most comparable funds, and that on average these professionals have more experience and longer tenure than investment professionals at comparable funds. The Board also noted that Dodge & Cox is an investment research-oriented firm with no other business endeavors to distract management’s attention from its research efforts or to present material conflicts of interest with the operations of the Funds, that its investment professionals adhere to a consistent investment approach across the Funds, and that due to its careful and deliberate strategy with respect to new products, Dodge & Cox has had remarkable stability in its mutual fund product offerings over the course of the past 88 years and has the fewest funds of any of the 25 largest mutual fund families by assets. The Board further considered the “Gold” analyst rating awarded by Morningstar to all of the Funds (other than the Global Bond Fund, which has a “Bronze” rating). The Board concluded that it was satisfied with the nature, extent, and quality of investment management and other services provided to the Funds by Dodge & Cox.
INVESTMENT PERFORMANCE
The Board completed an intensive review and assessment of each Fund’s recent and long-term investment performance (including periods of outperformance and underperformance), as compared to relevant indices and the performance of such Fund’s peer group and broader Morningstar category. In assessing the performance of the Funds, the Board considered the Funds’ investment returns over various periods and the volatility thereof and concluded that the levels experienced were consistent with Dodge & Cox’s long-term approach and active investment style. The Board also compared the short- and long-term investment performance of the equity funds to value-oriented indices, in recognition of the significant performance divergence between value and growth stocks over the past several years. It was noted that equity performance has been consistent with the value oriented investment strategy employed by Dodge & Cox. The Board further noted that the equity funds have outperformed over their medium to long-term investment horizons as compared to their corresponding value equity indices.
The Board determined after extensive review and inquiry that Dodge & Cox’s historic, long-term, team-oriented, bottom-up investment approach remains consistent and that Dodge & Cox continues to be distinguished by its integrity, transparency, and independence. The Board considered that the performance of the Funds is the result of a value-oriented investment management process that emphasizes a long-term investment horizon, comprehensive independent research, a team approach, price discipline, low cost, and low portfolio turnover. The Board also considered that the investment performance delivered by Dodge & Cox to the Funds appeared to be consistent with the relevant performance delivered for other clients of Dodge & Cox. The Board concluded that Dodge & Cox has delivered favorable long-term performance for Fund investors consistent with the long-term investment strategies being pursued by the Funds.
COSTS AND ANCILLARY BENEFITS
Costs of Services to Funds: Fees and Expenses The Board considered each Fund’s management fee rate and net expense ratio relative to (1) a broad category of other mutual funds with similar portfolio characteristics and share class and expense structures and (2) a much smaller group of peers selected by Broadridge based on investment style, share class characteristics, and asset levels. The Board also considered the management fees charged by Dodge & Cox to other clients. In particular, the Board considered that the Funds continue to be below their peer group median in net expense ratios and that many media and industry reports specifically comment on the low cost of the Funds, which have been a defining characteristic of the Funds for many years. The Board also evaluated the operating structures of the Funds and Dodge & Cox, noting that the Funds do not charge front-end sales commissions or distribution fees, and Dodge & Cox bears, among other things, the significant cost of third party research, reimbursement for shareholder recordkeeping and administrative costs to third-party retirement plan administrators, and administrative and office overhead.
The Board noted that the Broadridge report shows that the net expense ratio of every Dodge & Cox Fund is in the least expensive quartile compared to its broad Morningstar category. The Board noted the Funds’ unusual single-share-class structure and reviewed Broadridge data (including asset-weighted average expense ratios) showing that most of the peer group funds offer several different classes of shares, with different expense ratios, to different categories of investors, and that the Broadridge expense comparisons described above generally compare the net expense ratio of each Dodge & Cox Fund’s single share class to one of the least expensive share classes of the peer fund, even though those share classes are often not available to retail investors. The Board determined that the Funds provide access for small investors to high quality investment management at a relatively low cost. The Board also considered that the Funds are priced to scale, i.e., management fee rates begin at relatively low levels. Even without breakpoints, the Funds’ management fee rates are lower than those of many peer funds whose fee schedules include breakpoints. With respect to non-U.S. funds sponsored and managed by Dodge & Cox that are comparable to the Funds in many respects, the Board noted that the fee rates charged by Dodge & Cox are the same as or higher than the fee rates charged to the Funds.
The Board reviewed information regarding the fee rates Dodge & Cox charges to separate accounts that have investment programs similar to those of the Funds, including instances where separate account fees are lower than Fund fees. The Board considered the significant differences in the nature and scope of services Dodge & Cox provides to the Funds as compared to other client accounts, as well as material differences in regulatory, litigation, and other risks as between Dodge & Cox Funds and other types of clients. The Board noted that different markets exist for mutual fund and institutional separate account management services and that a comparison of Fund fee rates and separate account fee rates must consider the fact that separate account clients bear additional costs and responsibilities that are included
PAGE 16§ DODGE & COX STOCK FUND
in the cost of a Fund. The Board further noted that many sophisticated institutional investors in the Funds that are eligible to open separate accounts at Dodge & Cox have decided for various reasons to invest in the Funds. After consideration of these matters, the Board concluded that the overall costs incurred by the Funds for the services they receive (including the management fee paid to Dodge & Cox) are reasonable and that the fees are acceptable based upon the qualifications, experience, reputation, and performance of Dodge & Cox and the low overall expense ratios of the Funds.
Profitability and Costs of Services to Dodge & Cox; “Fall-out” Benefits The Board reviewed reports of Dodge & Cox’s financial position, profitability, and estimated overall value and considered Dodge & Cox’s overall profitability within its context as a private, employee-owned S-Corporation and relative to the favorable services provided. The Board noted in particular that Dodge & Cox’s profits are not generated by high fee rates, but reflect a very streamlined, efficient, and focused business approach toward investment management.
The Board recognized the importance of Dodge & Cox’s profitability—which is derived solely from management fees and does not include other business ventures—to maintain its independence, stability, company culture and ethics, and management continuity. The Board also considered that the compensation/profit structure at Dodge & Cox includes a return on shareholder employees’ investment in the firm, which is vital for remaining independent and facilitating retention of management and investment professionals. The Board also considered that in January 2015, Dodge & Cox closed the International Stock Fund to new investors to proactively manage the growth of the Fund. The Stock Fund and Balanced Fund were similarly closed to new investors during periods of significant growth in the past. While these actions are intended to benefit existing Fund shareholders, the effect is to reduce potential revenues to Dodge & Cox from new shareholders.
The Board also considered potential “fall-out” benefits (including the receipt of research from unaffiliated brokers and reputational benefits to non-U.S. funds sponsored and managed by Dodge & Cox) that Dodge & Cox might receive as a result of its association with the Funds and determined that they are acceptable. The Board also noted that Dodge & Cox continues to invest substantial sums in its business in order to provide enhanced services, systems, and research capabilities, all of which benefit the Funds. The Board concluded that Dodge & Cox’s profitability is the keystone of its independence, stability, and long-term investment performance and that the profitability of Dodge & Cox’s relationship with the Funds (including fall-out benefits) is fair and reasonable.
ECONOMIES OF SCALE
The Board considered whether there have been economies of scale with respect to the management of each Fund, whether the Funds have appropriately benefited from any economies of scale, and whether the management fee rate is reasonable in relation to the level of Fund assets and any economies of scale that may exist. In
the Board’s view, any consideration of economies of scale must take account of the Funds’ low fee and expense structure and the fact that the Dodge & Cox Funds build economies of scale into their fee structures by charging low fees from a fund’s inception and keeping overall expenses down as a Fund grows, as compared to other fund complexes that employ fee “breakpoints” only after a fund reaches a certain scale. An assessment of economies of scale must also take into account that Dodge & Cox invests significant time and resources in each new Fund for months (and sometimes years) prior to launch; in addition, in a Fund’s early periods of operations, expenses are capped, which means that Dodge & Cox subsidizes the operations of a new Fund for a period of time until it reaches scale. The Board also observed that, while total Fund assets have grown significantly over the long term, this growth has not been continuous or evenly distributed across all of the Funds (for example, the total assets of the Balanced Fund have actually declined over the past ten years). In addition, the Board noted that Dodge & Cox has shared the benefits of economies of scale with the Funds by adding and enhancing services to the Funds over time, and that Dodge & Cox’s internal costs of providing investment management, technology, administrative, legal, and compliance services to the Funds continue to increase. For example, Dodge & Cox has increased its global research staff and investment resources over the years to add important new capabilities for the benefit of Fund shareholders and to address the increased complexity of investing globally.
In addition, Dodge & Cox has made substantial expenditures in other staff, technology, and infrastructure to enable it to integrate credit and equity analyses and to implement its strategy in a more effective and secure manner. Over the last ten years, Dodge & Cox has increased its spending on research, investment management, client servicing, cybersecurity, technology, third party research, data services, and computer systems for trading, operations, compliance, accounting, and communications at a rate that has significantly outpaced the Funds’ growth rate during the same period. The Board also observed that, even without fee breakpoints, the Funds are competitively priced in a very competitive market and that having a low fee from inception is better for shareholders than starting with a higher fee and adding breakpoints. The Board also noted that there are certain diseconomies of scale associated with managing large funds, insofar as certain of the costs and risks associated with portfolio management increase disproportionately as assets grow. The Board concluded that the current Dodge & Cox fee structure is fair and reasonable and adequately shares economies of scale that may exist.
CONCLUSION
Based on their evaluation of all material factors and assisted by the advice of independent legal counsel to the Independent Trustees, the Board, including the Independent Trustees, concluded that the advisory fee structure was fair and reasonable, that each Fund was paying a competitive fee for the services provided, that Dodge & Cox’s services have provided value for Fund shareholders over the long term, and that approval of the Agreements was in the best interests of each Fund and its shareholders.
DODGE & COX STOCK FUND§PAGE 17
FUND HOLDINGS
The Fund provides a complete list of its holdings four times each fiscal year, as of the end of each quarter. The Fund files the lists with the Securities and Exchange Commission (SEC) onForm N-CSR (second and fourth quarters) and Form N-Q (first and third quarters). Shareholders may view the Fund’sForms N-CSR and N-Q on the SEC’s website at sec.gov. FormsN-CSR and N-Q may also be reviewed and copied at the SEC’s Public Reference Room in Washington, DC. Information regarding the operations of the Public Reference Room may be obtained by calling800-SEC-0330. A list of the Fund’s quarter-end holdings is also available at dodgeandcox.com on or about 15 days following each quarter end and remains available on the website until the list is updated in the subsequent quarter.
PROXY VOTING
For a free copy of the Fund’s proxy voting policies and procedures, please call 800-621-3979, visit the Fund’s website at dodgeandcox.com, or visit the SEC’s website at sec.gov. Information regarding how the Fund voted proxies relating to portfolio securities during the most recent 12-month period ending June 30 is also available at dodgeandcox.com or at sec.gov.
HOUSEHOLD MAILINGS
The Fund routinely mails shareholder reports and summary prospectuses to shareholders and, on occasion, proxy statements. In order to reduce the volume of mail, when possible, only one copy of these documents will be sent to shareholders who are part of the same family and share the same residential address.
If you have a direct account with the Funds and you do not want the mailing of shareholder reports and summary prospectuses combined with other members in your household, contact the Funds at 800-621-3979. Your request will be implemented within 30 days.
PAGE 18§ DODGE & COX STOCK FUND
DODGE & COX FUNDS—EXECUTIVE OFFICER & TRUSTEE INFORMATION
| | | | | | |
| | | | |
Name (Age) and
Address* | | Position with Trust (Year of Election or
Appointment)** | | Principal Occupation During Past Five Years** | | Other Directorships of Public Companies Held
by Trustees |
| |
| INTERESTED TRUSTEES AND EXECUTIVE OFFICERS |
| Charles F. Pohl (60) | | Chairman and Trustee (since 2014) | | Chairman and Director of Dodge & Cox; Chief Investment Officer and member of U.S. Equity Investment Committee (USEIC), Global Equity Investment Committee (GEIC), and International Equity Investment Committee (IEIC) | | — |
| Dana M. Emery (57) | | President (since 2014) and Trustee (since 1993) | | Chief Executive Officer, President, and Director of Dodge & Cox;Co-Director of Fixed Income and member of U.S. Fixed Income Investment Committee (USFIIC) and Global Fixed Income Investment Committee (GFIIC) | | — |
| Diana S. Strandberg (59) | | Senior Vice President (since 2006) | | Senior Vice President and Director of Dodge & Cox; Director of International Equity and member of USEIC, GEIC, IEIC, and GFIIC | | — |
Roberta R.W. Kameda (58) | | Chief Legal Officer (since 2019) and Secretary (since 2017) | | Vice President, General Counsel, and Secretary (since 2017) of Dodge & Cox | | — |
| David H. Longhurst (61) | | Treasurer (since 2006) | | Vice President and Assistant Treasurer of Dodge & Cox | | — |
| Katherine M. Primas (44) | | Chief Compliance Officer (since 2010) | | Vice President and Chief Compliance Officer of Dodge & Cox | | — |
| |
| INDEPENDENT TRUSTEES |
| Caroline M. Hoxby (52) | | Trustee (since 2017) | | Professor of Economics, Stanford University; Director of the Economics of Education Program, National Bureau of Economic Research; Senior Fellow, Hoover Institution and Stanford Institute for Economic Policy Research | | — |
| Thomas A. Larsen (69) | | Trustee (since 2002) | | Senior Counsel of Arnold & Porter (law firm) (2013-2018); Partner of Arnold & Porter (until 2012); Director of Howard, Rice, Nemerovski, Canady, Falk & Rabkin (1977-2011) | | — |
| Ann Mather (58) | | Trustee (since 2011) | | CFO, Pixar Animation Studios (1999-2004) | | Director, Alphabet Inc. (internet information services) (since 2005); Director, Glu Mobile, Inc. (multimedia software) (since 2004); Director, Netflix, Inc. (internet television) (since 2010); Director, Arista Networks (cloud networking) (since 2013); Director, Shutterfly, Inc. (internet photography services/publishing) (since 2013) |
| Robert B. Morris III (66) | | Trustee (since 2011) | | Advisory Director, The Presidio Group (2005-2016); Partner and Managing Director—Global Investment Research at Goldman Sachs (until 2001) | | — |
| Gary Roughead (67) | | Trustee (since 2013) | | Robert and Marion Oster Distinguished Military Fellow, Hoover Institution (since 2012); Admiral, United States Navy (Ret.); U.S. Navy Chief of Naval Operations (2008-2011) | | Director, Northrop Grumman Corp. (global security) (since 2012); Director, Maersk Line, Limited (shipping and transportation) (since 2016) |
| Mark E. Smith (67) | | Trustee (since 2014) | | Executive Vice President, Managing Director—Fixed Income at Loomis Sayles & Company, L.P. (2003-2011) | | — |
| John B. Taylor (72) | | Trustee (since 2005) (and 1995-2001) | | Professor of Economics, Stanford University (since 1984); Senior Fellow, Hoover Institution (since 1996); Under Secretary for International Affairs, United States Treasury (2001-2005) | | — |
| * | | The address for each Officer and Trustee is 555 California Street, 40th Floor, San Francisco, California 94104. Each Officer and Trustee oversees all six series in the Dodge & Cox Funds complex and serves for an indefinite term. |
| ** | | Information as of February 14, 2019. |
Additional information about the Trust’s Trustees and Officers is available in the Trust’s Statement of Additional Information (SAI). You can get a free copy of the SAI by visiting the Funds’ website at dodgeandcox.com or calling
800-621-3979.
DODGE & COX STOCK FUND§PAGE 19
dodgeandcox.com
For Fund literature, transactions, and account
information, please visit the Funds’ website.
or write or call:
DODGE & COX FUNDS
c/o DST Asset Manager Solutions, Inc.
P.O. Box 219502
Kansas City, Missouri 64121-9502
(800) 621-3979
INVESTMENT MANAGER
Dodge & Cox
555 California Street, 40th Floor
San Francisco, California 94104
(415) 981-1710
This report is submitted for the general information of the shareholders of the Fund. The report is not authorized for distribution to prospective investors in the Fund unless it is accompanied by a current prospectus.
This report reflects our views, opinions, and portfolio holdings as of December 31, 2018, the end of the reporting period. Any such views are subject to change at any time based upon market or other conditions and Dodge & Cox disclaims any responsibility to update such views. These views may not be relied on as investment advice and, because investment decisions for a Dodge & Cox Fund are based on numerous factors, may not be relied on as an indication of trading intent on behalf of any Dodge & Cox Fund.
DODGE & COX FUNDS®
Annual Report
December 31, 2018
Global Stock Fund
ESTABLISHED 2008
TICKER: DODWX
Important Notice:
Beginning on January 1, 2021, we intend to discontinue mailing paper copies of the Fund’s shareholder reports as permitted by new regulations adopted by the Securities and Exchange Commission, unless you specifically request paper copies from Dodge & Cox Funds or from your financial intermediary, such as a broker-dealer or bank. The reports will remain available to you on the Dodge & Cox Funds website (dodgeandcox.com), and you will be notified by mail each time a report is posted and provided with a link to access the report.
If you have already elected to receive shareholder reports electronically, you will not be affected by this change and do not need to take any action. If you have not done so already, you may elect to receive shareholder reports and other communications electronically by enrolling ine-delivery on the Funds website, or, if you are invested through a financial intermediary, by updating your mailing preferences through the intermediary.
If you wish to continue receiving paper copies of all future shareholder reports, please contact us at (800)621-3979. Reports will be provided to you free of charge. If you are invested through a financial intermediary, you may contact your financial intermediary to request to receive paper copies. Your election to receive reports in paper form will apply to all funds held with Dodge & Cox Funds or through your financial intermediary, as applicable.
12/18 GSF AR Printed on recycled paper
TO OUR SHAREHOLDERS
The Dodge & Cox Global Stock Fund had a total return of –12.7% for the year ended December 31, 2018, compared to a return of –8.7% for the MSCI World Index.
MACRO CONCERNS BUFFETED MARKETS IN 2018
In 2018, global markets were weighed down by concerns about trade wars, rising interest rates, slowing economic growth, and political uncertainty. Pessimism and market volatility mounted, especially during the fourth quarter. As a result, nearly every asset class—stocks, bonds, and commodities—posted negative returns for the year. Outside the United States, the MSCI EAFE Index(a)declined 14%, the MSCI Emerging Markets Index declined 15%, and most other markets suffered double-digit percentage losses in 2018.
In the United States, the S&P 500 Index experienced two divergent periods of performance. During the first nine months of 2018, U.S. equities posted strong returns: the S&P 500 was up 11% and reached an all-time high in late September. U.S. growth stocks (the higher valuation portion of the equity market) outperformed value stocks (the lower valuation portion) by 13 percentage points,(b) continuing a longer-term trend. From 2014 through September 30, 2018, growth outperformed value by 39 percentage points,(c) fueled by growth-oriented companies in sectors and industries associated with technology—most notably the “FAANG” stocks (Facebook, Amazon, Apple, Netflix, Google). Starting in October, there was a significant market correction, especially among technology stocks. Companies in more value-oriented sectors, including Health Care and Utilities, outperformed. Overall, the S&P 500 declined 14% during the quarter, ending the year down 4%.
WHAT’S PRICED INTO VALUATIONS?
The forward price-to-earnings ratio for the MSCI World was 13.5 times at year end,(d) 21% lower than it was at the start of 2018. Valuations are currently attractive; for example, the MSCI EAFE trades at 11.9 times forward earnings. Over the past 30 years, the MSCI EAFE has traded at lower valuations only 25% of the time, including during the global financial crisis (2007-08) and the European sovereign debt crisis (2009-12), both periods of severe economic stress. Put another way, this valuation starting point already incorporates significant pessimism about the future. When we look at fundamentals, however, many of the companies in the Fund are generating attractive levels of earnings and cash flows, returning capital to shareholders through dividends and buybacks, and strengthening their balance sheets. In other words, many companies are more resilient than they were in previous periods of economic stress.
No one ever knows exactly how the future is going to unfold. Although fear and uncertainty dominate the headlines, our decades of experience have taught us to focus on valuations of individual companies relative to their fundamentals, rather than try to predict near-term market movements. We believe this ultimately serves our investors better in the long run. It is important to look at what is already priced into company
valuations and revisit the underlying fundamentals and staying power behind each investment. As we have done in previous periods of volatility, we have added to areas where we see particularly attractive opportunities, such as in European and UK Financials, as well as in Energy.
European and UK Financials
In 2018, the Financials sector was the worst-performing sector of the MSCI World (down 17%) and a major detractor from the Fund’s performance. Financials comprised 31% of the Fund at year end, with 80% invested in companies in developed markets and 20% in emerging markets. The Fund’s emerging market bank holdings outperformed the overall market, with strong returns from Itau Unibanco (up 14%)(e) and ICICI Bank (up 5%). In contrast, the Fund’s 10 European and UK Financials holdings underperformed, down an average 31%.
Over the past few years, European and UK banks and insurance companies have faced many challenges, including slow growth, low interest rates, increasing capital requirements, and political uncertainty. When we discussed these holdings at the half-year mark, our enthusiasm was based on the combination of improving fundamentals and low valuations. Managements were cutting costs and restructuring businesses to increase returns. At that time, the Fund’s holdings traded at an average forward price-to-earnings ratio of nine times, low by historic standards. Since then, valuations have declined further, and several companies are now close to 10-year valuation lows—levels that were last seen during the European sovereign debt crisis.
We build the portfolio on a company-by-company basis, and we continue to revisit and retest each investment on its individual merits. Based on this work, we believe the Fund’s European Financials investments represent some of the best long-term opportunities available in the market today. As a result, we started a new position in Societe Generale (one of the largest banks in Europe) based on its stable and profitable core French and Czech retail banking businesses, upside optionality from future cost savings, and the resolution of its legacy legal issues. The company has a compelling valuation—0.4 times book value and six times forward earnings—with an attractive 8% dividend yield. We also recently added to several holdings, including BNP Paribas (a French-domiciled, pan-European retail and investment bank), UBS (the world’s largest private bank and wealth manager, based in Switzerland), and UniCredit (Italy’s largest bank).
UBS Group
At eight times forward earnings, UBS trades at its lowest valuation since the European debt crisis, while the company is in a much stronger financial position. It successfully restructured the investment banking division and boosted capital levels. All of its businesses generate a healthy return on equity, and the wealth management business appears well positioned to grow, especially in Asia. Looking forward, we believe the company will be able to return more capital to shareholders through dividends and buybacks. In addition, the CEO has been buying meaningful
PAGE 2§ DODGE & COX GLOBAL STOCK FUND
amounts of shares personally, further aligning management’s interests with those of shareholders. Based on these factors, we added to the Fund’s position, which stood at 2.1% at year end.
Energy
During the fourth quarter, Brent crude oil prices dropped 35%, weighing heavily on the outlook for energy-related companies, and Energy was the worst-performing sector (down 24%) within the S&P 500. While the short-term direction of oil prices is difficult to forecast, we believe slower supply growth and increasing demand point to higher prices over our investment horizon. Weighing valuation against individual company fundamentals, we added to Apache, Baker Hughes (a GE Company), and Occidental Petroleum, among other Energy holdings.
Occidental Petroleum
A multinational oil and gas company based in the United States, Occidental Petroleum’s stock price declined 24% in the fourth quarter along with the broader Energy sector, due to concerns about the macro environment and oil supply. While the company faces political risks in Oman and the United Arab Emirates, we believe investors overreacted in the short term, given Occidental’s solid long-term underlying business fundamentals. Occidental is considered a partner of choice for many companies and countries due to its technological capabilities, experience managing reservoirs, and global reach. The company has an attractive growth profile and low-cost assets in the Permian Basin and the Middle East. Given low operating costs and modest maintenance capital expenditures, these businesses are profitable across a broad range of oil prices. Occidental’s proven management team has created a strong corporate culture with a focus on returns, steady growth, and consistent dividends. In addition, the company has a strong balance sheet, an attractive valuation at 14 times forward earnings, and a 5% dividend yield. On December 31, Occidental was a 1.4% position in the Fund.
IN CLOSING
We are enthusiastic about the long-term outlook for the portfolio. Many of the companies in the Fund are trading at very low valuations. Relative to the range of potential outcomes, we believe that the overall risk/reward profile for these companies is quite attractive. Our investment approach requires persistence and patience as share prices and currencies can be volatile in the short term. Hence, we encourage shareholders to remain focused on the long term.
Thank you for your continued confidence in Dodge & Cox. As always, we welcome your comments and questions.
For the Board of Trustees,
| | |
| | |
Charles F. Pohl, Chairman | | Dana M. Emery, President |
January 31, 2019
| (a) | | The MSCI EAFE (Europe, Australasia, Far East) Index is a broad-based, unmanaged equity market index aggregated from 21 developed market country indices, excluding the United States and Canada. |
| (b) | | The Russell 1000 Growth Index had a total return of 17.1% compared to 3.9% for the Russell 1000 Value Index from December 31, 2017 through September 30, 2018. |
| (c) | | The Russell 1000 Growth Index had a total return of 72.5% compared to 33.2% for the Russell 1000 Value Index from December 31, 2014 through September 30, 2018. |
| (d) | | Unless otherwise specified, all weightings and characteristics are as of December 31, 2018. |
| (e) | | The use of specific examples does not imply that they are more or less attractive investments than the portfolio’s other holdings. |
DODGE & COX GLOBAL STOCK FUND§PAGE 3
2018 PERFORMANCE REVIEW
The Fund underperformed the MSCI World by 3.9 percentage points in 2018.
Key Detractors from Relative Results
| | § | | Weaker returns from holdings in the Financials sector (down 19% compared to down 17% for the MSCI World sector), combined with an average overweight position (28% versus 17%), hurt results. Societe Generale (down 40%) and UniCredit (down 39%) detracted from returns. | |
| | § | | In the Communication Services sector, the Fund’s holdings (down 16% compared to down 8% for the MSCI World sector) performed poorly, especially Liberty Global (down 39%). | |
| | § | | Additional detractors included Magnit (down 51%) and JD.com (down 49%). | |
Key Contributors to Relative Results
| | § | | Strong returns in the Health Care sector (up 6% compared to up 2% for the MSCI World sector), combined with a higher average weighting (20% versus 12%), had a positive impact. Eli Lilly (up 40%), Express Scripts (up 24% to date of acquisition by Cigna), and GlaxoSmithKline (up 12%) were strong performers. | |
| | § | | Relative returns in the Materials sector (down 15% compared to down 17% for the MSCI World sector) contributed to results. | |
| | § | | Additional contributors included Dell Technologies (up 39%), Itau Unibanco (up 14%), and ICICI Bank (up 5%). | |
KEY CHARACTERISTICS OF DODGE & COX
Independent Organization
Dodge & Cox is one of the largest privately owned investment managers in the world. We remain committed to independence, with a goal of providing the highest quality investment management service to our existing clients.
Over 85 Years of Investment Experience
Dodge & Cox was founded in 1930. We have a stable and well-qualified team of investment professionals, most of whom have spent their entire careers at Dodge & Cox.
Experienced Investment Team
The Global Equity Investment Committee, which is the decision-making body for the Global Stock Fund, is a seven-member committee with an average tenure at Dodge & Cox of 24 years.
One Business with a Single Research Office
Dodge & Cox manages equity (domestic, international, and global), fixed income (domestic and global), and balanced investments, operating from one office in San Francisco.
Consistent Investment Approach
Our team decision-making process involves thorough, bottom-up fundamental analysis of each investment.
Long-Term Focus and Low Expenses
We invest with a three- to five-year investment horizon, which has historically resulted in low turnover relative to our peers. We manage Funds that maintain low expense ratios.
Risks: The Fund is subject to market risk, meaning holdings in the Fund may decline in value for extended periods due to the financial prospects of individual companies, or due to general market and economic conditions. Investing in non-U.S. securities may entail risk due to foreign economic and political developments; this risk may be increased when investing in emerging markets. The Fund is also subject to currency risk. Please read the prospectus and summary prospectus for specific details regarding the Fund’s risk profile.
PAGE 4§ DODGE & COX GLOBAL STOCK FUND
GROWTH OF $10,000 OVER 10 YEARS
FOR AN INVESTMENT MADE ON DECEMBER 31, 2008
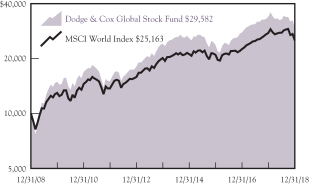
AVERAGE ANNUAL TOTAL RETURN
FOR PERIODS ENDED DECEMBER 31, 2018
| | | | | | | | | | | | | | | | |
| | | 1 Year | | | 3 Years | | | 5 Years | | | 10 Years | |
Dodge & Cox Global Stock Fund | | | –12.65 | % | | | 7.52 | % | | | 4.10 | % | | | 11.45 | % |
MSCI World Index | | | – 8.71 | | | | 6.30 | | | | 4.56 | | | | 9.67 | |
Returns represent past performance and do not guarantee future results. Investment return and share price will fluctuate with market conditions, and investors may have a gain or loss when shares are sold. Fund performance changes over time and currently may be significantly lower than stated. Performance is updated and published monthly. Visit the Fund’s website at dodgeandcox.com or call800-621-3979 for current performance figures.
The Fund’s total returns include the reinvestment of dividend and capital gain distributions, but have not been adjusted for any income taxes payable by shareholders on these distributions or on Fund share redemptions. Index returns include dividends but, unlike Fund returns, do not reflect fees or expenses. The MSCI World Index is a broad-based, unmanaged equity market index aggregated from 23 developed market country indices, including the United States. MSCI makes no express or implied warranties or representations and shall have no liability whatsoever with respect to any MSCI data contained herein. The MSCI data may not be further redistributed or used as a basis for other indices or any securities or financial products. This report is not approved, reviewed, or produced by MSCI.
MSCI World is a service mark of MSCI Barra.
FUND EXPENSE EXAMPLE
As a Fund shareholder, you incur ongoing Fund costs, including management fees and other Fund expenses. All mutual funds have ongoing costs, sometimes referred to as operating expenses. The following example shows ongoing costs of investing in the Fund and can help you understand these costs and compare them with those of other mutual funds. The example assumes a $1,000 investment held for the six months indicated.
ACTUAL EXPENSES
The first line of the table below provides information about actual account values and expenses based on the Fund’s actual returns. You may use the information in this line, together with your account balance, to estimate the expenses that you paid over the period. Simply divide your account value by $1,000 (for example, an $8,600 account value divided by $1,000 = 8.6), then multiply the result by the number in the first line under the heading “Expenses Paid During Period” to estimate the expenses you paid on your account during this period.
HYPOTHETICAL EXAMPLE FOR COMPARISON WITH OTHER MUTUAL FUNDS
Information on the second line of the table can help you compare ongoing costs of investing in the Fund with those of other mutual funds. This information may not be used to estimate the actual ending account balance or expenses you paid during the period. The hypothetical “Ending Account Value” is based on the actual expense ratio of the Fund and an assumed 5% annual rate of return before expenses (not the Fund’s actual return). The amount under the heading “Expenses Paid During Period” shows the hypothetical expenses your account would have incurred under this scenario. You can compare this figure with the 5% hypothetical examples that appear in shareholder reports of other mutual funds.
| | | | | | | | | | | | |
Six Months Ended December 31, 2018 | | Beginning Account Value
7/1/2018 | | | Ending Account Value
12/31/2018 | | | Expenses Paid During Period* | |
Based on Actual Fund Return | | $ | 1,000.00 | | | $ | 904.20 | | | $ | 2.98 | |
Based on Hypothetical 5% Yearly Return | | | 1,000.00 | | | | 1,022.08 | | | | 3.16 | |
| * | | Expenses are equal to the Fund’s annualized expense ratio of 0.62%, multiplied by the average account value over the period, multiplied by 184/365 (to reflect the one-half year period). |
The expenses shown in the table highlight ongoing costs only and do not reflect any transactional fees or account maintenance fees. Though other mutual funds may charge such fees, please note that the Fund does not charge transaction fees (e.g., redemption fees, sales loads) or universal account maintenance fees (e.g., small account fees).
DODGE & COX GLOBAL STOCK FUND§PAGE 5
| | | | |
| FUND INFORMATION (unaudited) | | | December 31, 2018 | |
| | | | |
| GENERAL INFORMATION | | | |
Net Asset Value Per Share | | | $11.03 | |
Total Net Assets (billions) | | | $8.6 | |
Expense Ratio | | | 0.62% | |
Portfolio Turnover Rate | | | 31% | |
30-Day SEC Yield(a) | | | 1.97% | |
Active Share(b) | | | 87% | |
Number of Companies | | | 87 | |
Fund Inception | | | 2008 | |
No sales charges or distribution fees | | | | |
Investment Manager: Dodge & Cox, San Francisco. Managed by the Global Equity Investment Committee, whose seven members’ average tenure at Dodge & Cox is 24 years.
| | | | | | | | |
| PORTFOLIO CHARACTERISTICS | | Fund | | | MSCI
World | |
Median Market Capitalization (billions) | | | $35 | | | | $11 | |
Weighted Average Market Capitalization (billions) | | | $97 | | | | $128 | |
Price-to-Earnings Ratio(c) | | | 11.0x | | | | 13.5x | |
Countries Represented | | | 20 | | | | 23 | |
Emerging Markets (Brazil, China, India, Mexico, Russia, South Africa, South Korea, Thailand) | | | 16.5% | | | | 0.0% | |
| | | | |
| TEN LARGEST HOLDINGS (%)(d) | | Fund | |
Comcast Corp. (United States) | | | 2.8 | |
Novartis AG(Switzerland) | | | 2.6 | |
Sanofi(France) | | | 2.5 | |
Alphabet, Inc.(United States) | | | 2.4 | |
Charter Communications, Inc.(United States) | | | 2.3 | |
ICICI Bank, Ltd.(India) | | | 2.3 | |
Roche Holding AG(Switzerland) | | | 2.2 | |
Itau Unibanco Holding SA(Brazil) | | | 2.2 | |
UBS Group AG(Switzerland) | | | 2.1 | |
GlaxoSmithKline PLC(United Kingdom) | | | 2.1 | |

| | | | | | | | |
| REGION DIVERSIFICATION (%)(f) | | Fund | | | MSCI
World | |
United States | | | 44.5 | | | | 61.7 | |
Europe (excluding United Kingdom) | | | 23.8 | | | | 15.9 | |
United Kingdom | | | 9.5 | | | | 5.9 | |
Pacific (excluding Japan) | | | 8.5 | | | | 4.4 | |
Latin America | | | 4.9 | | | | 0.0 | |
Africa | | | 2.9 | | | | 0.0 | |
Japan | | | 2.5 | | | | 8.6 | |
Canada | | | 1.1 | | | | 3.3 | |
Middle East | | | 0.0 | | | | 0.2 | |
| | | | | | | | |
| SECTOR DIVERSIFICATION (%) | | Fund | | | MSCI
World | |
Financials | | | 30.7 | | | | 16.2 | |
Health Care | | | 18.3 | | | | 13.4 | |
Communication Services | | | 17.3 | | | | 8.3 | |
Information Technology | | | 8.7 | | | | 14.9 | |
Energy | | | 6.7 | | | | 5.9 | |
Consumer Discretionary | | | 5.6 | | | | 10.4 | |
Industrials | | | 5.4 | | | | 10.9 | |
Materials | | | 3.8 | | | | 4.6 | |
Consumer Staples | | | 0.7 | | | | 8.7 | |
Real Estate | | | 0.5 | | | | 3.3 | |
Utilities | | | 0.0 | | | | 3.4 | |
| (a) | SEC Yield is an annualization of the Fund’s net investment income for the trailing30-day period. Dividends paid by the Fund may be higher or lower than implied by the SEC Yield. |
| (b) | Active share is a measure of how much an investment portfolio differs from its benchmark index, based on a scale of 0% (complete overlap with the index) to 100% (no overlap). Overlap for each security in the Fund is the lower of either its percentage weight in the Fund or its percentage weight in the relevant index. The Fund’s total overlap with the MSCI World is the sum of each security’s calculated overlap. |
| (c) | Price-to-earnings (P/E) ratios are calculated using12-month forward earnings estimates from third-party sources. |
| (d) | The Fund’s portfolio holdings are subject to change without notice. The mention of specific securities is not a recommendation to buy, sell, or hold any particular security and is not indicative of Dodge & Cox’s current or future trading activity. |
| (e) | Net Cash & Other includes cash, short-term investments, derivatives, receivables, and payables. |
| (f) | The Fund may classify a company in a different category than the MSCI World. The Fund generally classifies a company based on its country of incorporation, but may designate a different country in certain circumstances. |
PAGE 6§ DODGE & COX GLOBAL STOCK FUND
| | | | |
| CONSOLIDATED PORTFOLIO OF INVESTMENTS | | | December 31, 2018 | |
| | | | | | | | |
| COMMON STOCKS: 92.9% | | | | | | |
| | |
| | | SHARES | | | VALUE | |
| COMMUNICATION SERVICES: 16.7% | |
MEDIA & ENTERTAINMENT: 13.7% | |
Alphabet, Inc., Class C(a) (United States) | | | 201,999 | | | $ | 209,192,184 | |
Altice Europe NV, Series A(a)(Netherlands) | | | 7,733,145 | | | | 14,930,086 | |
Altice USA, Inc., Class A(a) (United States) | | | 3,219,308 | | | | 53,182,968 | |
Baidu, Inc. ADR(a) (Cayman Islands/China) | | | 628,000 | | | | 99,600,800 | |
Charter Communications, Inc., Class A(a) (United States) | | | 687,597 | | | | 195,944,517 | |
Comcast Corp., Class A (United States) | | | 6,996,600 | | | | 238,234,230 | |
DISH Network Corp., Class A(a) (United States) | | | 1,066,600 | | | | 26,633,002 | |
Grupo Televisa SAB ADR (Mexico) | | | 7,247,600 | | | | 91,174,808 | |
Liberty Global PLC, Series C(a) (United Kingdom) | | | 3,937,900 | | | | 81,278,256 | |
Liberty Latin America Ltd, Series A(a) (Bermuda/United Kingdom) | | | 142,748 | | | | 2,066,991 | |
Naspers, Ltd. (South Africa) | | | 641,000 | | | | 127,326,564 | |
Television Broadcasts, Ltd. (Hong Kong) | | | 2,509,500 | | | | 4,732,513 | |
Twenty-First Century Fox, Inc., Class A (United States) | | | 818,900 | | | | 39,405,468 | |
| | | | | | | | |
| | | | | | | 1,183,702,387 | |
TELECOMMUNICATION SERVICES: 3.0% | | | | | |
Millicom International Cellular SA SDR (Luxembourg) | | | 1,003,400 | | | | 63,671,436 | |
MTN Group, Ltd. (South Africa) | | | 10,548,600 | | | | 65,303,161 | |
Sprint Corp.(a) (United States) | | | 8,868,500 | | | | 51,614,670 | |
Zayo Group Holdings, Inc.(a) (United States) | | | 3,383,900 | | | | 77,288,276 | |
| | | | | | | | |
| | | | | | | 257,877,543 | |
| | | | | | | | |
| | | | | | | 1,441,579,930 | |
| CONSUMER DISCRETIONARY: 5.6% | | | | | |
AUTOMOBILES & COMPONENTS: 1.8% | | | | | |
Bayerische Motoren Werke AG (Germany) | | | 894,300 | | | | 72,426,750 | |
Honda Motor Co., Ltd. (Japan) | | | 3,289,100 | | | | 85,947,971 | |
| | | | | | | | |
| | | | | | | 158,374,721 | |
CONSUMER DURABLES & APPAREL: 0.3% | | | | | |
Mattel, Inc.(a) (United States) | | | 2,594,367 | | | | 25,917,726 | |
| | |
RETAILING: 3.5% | | | | | | | | |
Booking Holdings, Inc.(a) (United States) | | | 63,100 | | | | 108,684,702 | |
JD.com, Inc. ADR(a) (Cayman Islands/China) | | | 5,145,400 | | | | 107,693,222 | |
Qurate Retail, Inc., Series A(a) (United States) | | | 4,308,072 | | | | 84,093,565 | |
| | | | | | | | |
| | | | | | | 300,471,489 | |
| | | | | | | | |
| | | | | | | 484,763,936 | |
| CONSUMER STAPLES: 0.7% | | | | | | | | |
FOOD & STAPLES RETAILING: 0.7% | | | | | |
Magnit PJSC (Russia) | | | 1,171,100 | | | | 59,113,867 | |
| | |
| ENERGY: 5.9% | | | | | | | | |
Anadarko Petroleum Corp. (United States) | | | 2,538,600 | | | | 111,292,224 | |
Apache Corp. (United States) | | | 3,969,282 | | | | 104,193,652 | |
Baker Hughes, a GE Company (United States) | | | 1,177,527 | | | | 25,316,830 | |
National Oilwell Varco, Inc. (United States) | | | 162,035 | | | | 4,164,300 | |
Occidental Petroleum Corp. (United States) | | | 1,937,063 | | | | 118,896,927 | |
Schlumberger, Ltd. (Curacao/United States) | | | 1,233,600 | | | | 44,508,288 | |
Suncor Energy, Inc. (Canada) | | | 3,416,300 | | | | 95,553,911 | |
Weatherford International PLC(a) (Ireland/United States) | | | 4,434,175 | | | | 2,478,704 | |
| | | | | | | | |
| | | | | | | 506,404,836 | |
| FINANCIALS: 28.5% | |
BANKS: 17.4% | |
Axis Bank, Ltd.(a) (India) | | | 10,157,400 | | | | 90,363,456 | |
Banco Santander SA (Spain) | | | 29,197,898 | | | | 131,765,504 | |
| | | | | | | | |
| | |
| | | SHARES | | | VALUE | |
Bank of America Corp. (United States) | | | 4,797,300 | | | $ | 118,205,472 | |
Barclays PLC (United Kingdom) | | | 72,373,388 | | | | 138,828,202 | |
BNP Paribas SA (France) | | | 3,164,200 | | | | 142,509,845 | |
ICICI Bank, Ltd. (India) | | | 37,630,636 | | | | 194,803,618 | |
KasikornbankPCL-Foreign (Thailand) | | | 9,593,200 | | | | 54,436,149 | |
Mitsubishi UFJ Financial Group, Inc. (Japan) | | | 7,650,000 | | | | 37,723,222 | |
Societe Generale SA (France) | | | 4,174,400 | | | | 132,532,799 | |
Standard Chartered PLC (United Kingdom) | | | 18,665,381 | | | | 144,277,309 | |
UniCredit SPA (Italy) | | | 14,365,066 | | | | 162,956,237 | |
Wells Fargo & Co. (United States) | | | 3,302,773 | | | | 152,191,780 | |
| | | | | | | | |
| | | | 1,500,593,593 | |
DIVERSIFIED FINANCIALS: 9.5% | |
American Express Co. (United States) | | | 714,700 | | | | 68,125,204 | |
Bank of New York Mellon Corp. (United States) | | | 1,490,500 | | | | 70,157,835 | |
Capital One Financial Corp. (United States) | | | 1,949,200 | | | | 147,340,028 | |
Charles Schwab Corp. (United States) | | | 2,999,400 | | | | 124,565,082 | |
Credit Suisse Group AG (Switzerland) | | | 9,836,499 | | | | 108,399,620 | |
Goldman Sachs Group, Inc. (United States) | | | 678,900 | | | | 113,410,245 | |
UBS Group AG (Switzerland) | | | 14,570,700 | | | | 181,885,474 | |
| | | | | | | | |
| | | | 813,883,488 | |
INSURANCE: 1.6% | |
AEGON NV (Netherlands) | | | 11,219,967 | | | | 52,158,691 | |
Aviva PLC (United Kingdom) | | | 18,209,820 | | | | 86,850,764 | |
| | | | | | | | |
| | | | 139,009,455 | |
| | | | | | | | |
| | | | 2,453,486,536 | |
| HEALTH CARE: 18.3% | |
HEALTH CARE EQUIPMENT & SERVICES: 3.0% | |
Cigna Corp. (United States) | | | 454,038 | | | | 86,230,966 | |
CVS Health Corp. (United States) | | | 1,523,300 | | | | 99,806,616 | |
UnitedHealth Group, Inc. (United States) | | | 285,700 | | | | 71,173,584 | |
| | | | | | | | |
| | | | 257,211,166 | |
PHARMACEUTICALS, BIOTECHNOLOGY & LIFE SCIENCES: 15.3% | |
Alnylam Pharmaceuticals, Inc.(a) (United States) | | | 358,500 | | | | 26,138,235 | |
AstraZeneca PLC (United Kingdom) | | | 1,681,700 | | | | 125,766,701 | |
Bayer AG (Germany) | | | 1,433,620 | | | | 99,408,862 | |
Bristol-Myers Squibb Co. (United States) | | | 2,542,700 | | | | 132,169,546 | |
Eli Lilly and Co. (United States) | | | 724,448 | | | | 83,833,123 | |
GlaxoSmithKline PLC (United Kingdom) | | | 9,348,400 | | | | 177,429,369 | |
Incyte Corp.(a) (United States) | | | 693,300 | | | | 44,086,947 | |
Novartis AG (Switzerland) | | | 2,643,700 | | | | 226,428,620 | |
Roche Holding AG (Switzerland) | | | 768,300 | | | | 189,980,800 | |
Sanofi (France) | | | 2,468,762 | | | | 213,348,030 | |
| | | | | | | | |
| | | | 1,318,590,233 | |
| | | | | | | | |
| | | | 1,575,801,399 | |
| INDUSTRIALS: 5.4% | |
CAPITAL GOODS: 3.6% | |
Johnson Controls International PLC (Ireland/United States) | | | 5,578,840 | | | | 165,412,606 | |
Mitsubishi Electric Corp. (Japan) | | | 8,114,500 | | | | 88,958,504 | |
Schneider Electric SA (France) | | | 848,578 | | | | 57,751,678 | |
| | | | | | | | |
| | | | 312,122,788 | |
TRANSPORTATION: 1.8% | |
FedEx Corp. (United States) | | | 964,300 | | | | 155,570,519 | |
| | | | | | | | |
| | | | 467,693,307 | |
| INFORMATION TECHNOLOGY: 7.5% | |
SEMICONDUCTORS & SEMICONDUCTOR EQUIPMENT: 1.1% | |
Microchip Technology, Inc. (United States) | | | 1,364,800 | | | | 98,156,416 | |
|
SOFTWARE & SERVICES: 2.5% | |
Dell Technologies, Inc., Class C(a) (United States) | | | 797,343 | | | | 38,966,153 | |
| | |
| See accompanying Notes to Consolidated Financial Statements | | DODGE & COX GLOBAL STOCK FUND§PAGE 7 |
| | | | |
| CONSOLIDATED PORTFOLIO OF INVESTMENTS | | | December 31, 2018 | |
| | | | | | | | |
| INFORMATION TECHNOLOGY (continued) | |
| | | SHARES | | | VALUE | |
Micro Focus International PLC (United Kingdom) | | | 3,319,349 | | | $ | 58,015,528 | |
Microsoft Corp. (United States) | | | 1,119,800 | | | | 113,738,086 | |
| | | | | | | | |
| | | | 210,719,767 | |
TECHNOLOGY, HARDWARE & EQUIPMENT: 3.9% | |
Hewlett Packard Enterprise Co. (United States) | | | 6,716,024 | | | | 88,718,677 | |
HP Inc. (United States) | | | 1,995,200 | | | | 40,821,792 | |
Juniper Networks, Inc. (United States) | | | 3,167,168 | | | | 85,228,491 | |
Samsung Electronics Co., Ltd. (South Korea) | | | 1,146,200 | | | | 39,659,290 | |
TE Connectivity, Ltd. (Switzerland) | | | 1,070,015 | | | | 80,925,234 | |
| | | | | | | | |
| | | | 335,353,484 | |
| | | | | | | | |
| | | | 644,229,667 | |
| MATERIALS: 3.8% | |
Celanese Corp. (United States) | | | 826,200 | | | | 74,333,214 | |
Cemex SAB de CV ADR (Mexico) | | | 15,489,917 | | | | 74,661,400 | |
LafargeHolcim, Ltd. (Switzerland) | | | 1,455,120 | | | | 60,128,814 | |
Linde PLC (Ireland/United States) | | | 738,261 | | | | 117,226,215 | |
| | | | | | | | |
| | | | 326,349,643 | |
| REAL ESTATE: 0.5% | |
Hang Lung Group, Ltd. (Hong Kong) | | | 15,217,900 | | | | 38,662,614 | |
| | | | | | | | |
TOTAL COMMON STOCKS
(Cost $7,999,354,941) | | | $ | 7,998,085,735 | |
|
| PREFERRED STOCKS: 4.2% | |
| ENERGY: 0.8% | |
Petroleo Brasileiro SA (Brazil) | | | 11,985,206 | | | | 69,580,752 | |
|
| FINANCIALS: 2.2% | |
BANKS: 2.2% | |
Itau Unibanco Holding SA (Brazil) | | | 20,300,994 | | | | 186,833,158 | |
|
| INFORMATION TECHNOLOGY: 1.2% | |
TECHNOLOGY, HARDWARE & EQUIPMENT: 1.2% | |
Samsung Electronics Co., Ltd. (South Korea) | | | 3,695,700 | | | | 105,419,860 | |
| | | | | | | | |
TOTAL PREFERRED STOCKS
(Cost $187,385,925) | | | $ | 361,833,770 | |
|
| EQUITY-LINKED NOTE: 0.6% | |
| COMMUNICATION SERVICES: 0.6% | |
MEDIA & ENTERTAINMENT: 0.6% | |
Naspers, Ltd. excluding Tencent Holdings,
Ltd.(a)(c) (South Africa) | | | 191,000 | | | | 52,530,730 | |
| | | | | | | | |
TOTAL EQUITY-LINKED NOTE
(Cost $49,510,485) | | | $ | 52,530,730 | |
| | | | | | | | |
| SHORT-TERM INVESTMENTS: 2.2% | |
| | |
| | | PAR VALUE/ SHARES | | | VALUE | |
REPURCHASE AGREEMENT: 1.8% | |
Fixed Income Clearing Corporation(b)
1.60%, dated 12/31/18, due 1/2/19, maturity value $160,618,276 | | $ | 160,604,000 | | | $ | 160,604,000 | |
| |
MONEY MARKET FUND: 0.4% | | | | | |
State Street Institutional U.S. Government Money Market Fund | | | 34,309,242 | | | | 34,309,242 | |
| | | | | | | | |
TOTAL SHORT-TERM INVESTMENTS
(Cost $194,913,242) | | | $ | 194,913,242 | |
| | | | | | | | |
TOTAL INVESTMENTS IN SECURITIES(Cost $8,431,164,593) | | | 99.9 | % | | $ | 8,607,363,477 | |
OTHER ASSETS LESS LIABILITIES | | | 0.1 | % | | | 6,831,965 | |
| | | | | | | | |
| NET ASSETS | | | 100.0 | % | | $ | 8,614,195,442 | |
| | | | | | | | |
| (b) | Repurchase agreement is collateralized by U.S. Treasury Notes1.375%-2.625%,8/15/20-8/31/20. Total collateral value is $163,819,319. |
| (c) | Equity-linked note issued by JPMorgan Chase Bank, N.A. The note is designed to provide exposure to Naspers, Ltd. excluding the effect of Naspers, Ltd.’s investment in Tencent Holdings, Ltd. The note is exempt from registration under Rule 144A of the Securities Act of 1933. The note may be resold in transactions exempt from registration, normally to qualified institutional buyers. |
In determining a company’s country designation, the Fund generally references the country of incorporation. In cases where the Fund considers the country of incorporation to be a “jurisdiction of convenience” chosen primarily for tax purposes or in other limited circumstances, the Fund uses the country designation of an appropriate broad-based market index. In those cases, two countries are listed - the country of incorporation and the country designated by an appropriate index, respectively.
ADR: American Depositary Receipt
SDR: Swedish Depository Receipt
| | |
| PAGE 8§ DODGE & COX GLOBAL STOCK FUND | | See accompanying Notes to Consolidated Financial Statements |
| | | | |
| CONSOLIDATED PORTFOLIO OF INVESTMENTS | | | December 31, 2018 | |
FUTURES CONTRACTS
| | | | | | | | | | | | | | | | |
| Description | | Number of
Contracts | | | Expiration
Date | | | Notional
Amount | | | Value /
Unrealized
Appreciation
(Depreciation) | |
E-mini S&P 500 Index—Long Position | | | 1,335 | | | | 3/15/19 | | | $ | 167,222,100 | | | $ | 1,697,012 | |
CURRENCY FORWARD CONTRACTS | |
| | | | | | Contract Amount | | | | |
| Counterparty | | Settle Date | | | Receive
U.S. Dollar | | | Deliver
Foreign
Currency | | | Unrealized
Appreciation
(Depreciation) | |
Contracts to sell CHF: | |
Barclays | | | 1/30/19 | | | | 43,056,069 | | | | 42,500,000 | | | $ | (288,445 | ) |
Morgan Stanley | | | 1/30/19 | | | | 43,042,115 | | | | 42,500,000 | | | | (302,398 | ) |
UBS | | | 2/6/19 | | | | 23,906,648 | | | | 23,800,000 | | | | (382,147 | ) |
Goldman Sachs | | | 2/27/19 | | | | 20,218,767 | | | | 20,000,000 | | | | (232,370 | ) |
HSBC | | | 2/27/19 | | | | 20,533,046 | | | | 20,200,000 | | | | (122,603 | ) |
Contracts to sell CNH: | |
Credit Suisse | | | 1/9/19 | | | | 7,298,389 | | | | 48,278,840 | | | | 268,898 | |
HSBC | | | 1/9/19 | | | | 5,460,337 | | | | 36,209,130 | | | | 188,219 | |
HSBC | | | 1/9/19 | | | | 1,820,579 | | | | 12,069,710 | | | | 63,206 | |
HSBC | | | 1/9/19 | | | | 1,820,112 | | | | 12,069,710 | | | | 62,740 | |
HSBC | | | 1/9/19 | | | | 5,461,737 | | | | 36,209,130 | | | | 189,619 | |
JPMorgan | | | 1/16/19 | | | | 22,554,310 | | | | 147,128,533 | | | | 1,132,771 | |
JPMorgan | | | 1/16/19 | | | | 35,845,717 | | | | 233,832,367 | | | | 1,800,320 | |
Citibank | | | 1/30/19 | | | | 7,918,195 | | | | 51,135,704 | | | | 473,604 | |
Citibank | | | 1/30/19 | | | | 7,803,155 | | | | 50,372,484 | | | | 469,677 | |
Citibank | | | 1/30/19 | | | | 439,944 | | | | 2,840,015 | | | | 26,481 | |
Citibank | | | 1/30/19 | | | | 446,430 | | | | 2,883,046 | | | | 26,702 | |
HSBC | | | 1/30/19 | | | | 7,881,608 | | | | 50,881,297 | | | | 474,055 | |
HSBC | | | 1/30/19 | | | | 444,367 | | | | 2,868,702 | | | | 26,727 | |
UBS | | | 1/30/19 | | | | 7,916,357 | | | | 51,135,705 | | | | 471,765 | |
UBS | | | 1/30/19 | | | | 446,327 | | | | 2,883,047 | | | | 26,598 | |
Citibank | | | 2/13/19 | | | | 5,050,348 | | | | 32,500,000 | | | | 319,109 | |
Credit Suisse | | | 2/13/19 | | | | 5,047,760 | | | | 32,500,000 | | | | 316,520 | |
Citibank | | | 6/12/19 | | | | 10,779,347 | | | | 70,000,000 | | | | 590,540 | |
Barclays | | | 7/24/19 | | | | 14,015,826 | | | | 96,000,000 | | | | 43,155 | |
JPMorgan | | | 7/31/19 | | | | 9,949,363 | | | | 68,332,224 | | | | 3,760 | |
Citibank | | | 8/7/19 | | | | 11,988,187 | | | | 82,856,354 | | | | (71,298 | ) |
Citibank | | | 8/7/19 | | | | 11,053,953 | | | | 76,404,924 | | | | (66,546 | ) |
Citibank | | | 8/7/19 | | | | 12,047,102 | | | | 82,856,354 | | | | (12,383 | ) |
HSBC | | | 8/7/19 | | | | 10,946,297 | | | | 75,264,552 | | | | (8,224 | ) |
HSBC | | | 8/7/19 | | | | 11,875,064 | | | | 81,619,692 | | | | (4,428 | ) |
HSBC | | | 8/7/19 | | | | 11,096,980 | | | | 76,404,924 | | | | (23,520 | ) |
Barclays | | | 8/28/19 | | | | 6,702,608 | | | | 46,000,000 | | | | 7,573 | |
Citibank | | | 8/28/19 | | | | 21,723,766 | | | | 149,075,000 | | | | 26,756 | |
Goldman Sachs | | | 8/28/19 | | | | 21,713,641 | | | | 149,075,000 | | | | 16,631 | |
JPMorgan | | | 8/28/19 | | | | 21,391,114 | | | | 146,850,000 | | | | 17,941 | |
JPMorgan | | | 10/23/19 | | | | 22,835,938 | | | | 160,000,000 | | | | (449,906 | ) |
Citibank | | | 12/4/19 | | | | 28,026,826 | | | | 196,000,000 | | | | (496,947 | ) |
| | | | | | | | | | | | | | | | |
| | | | | | Contract Amount | | | | |
| Counterparty | | Settle Date | | | Deliver
U.S. Dollar | | | Receive
Foreign
Currency | | | Unrealized
Appreciation
(Depreciation) | |
Contracts to buy CHF: | |
Barclays | | | 2/27/19 | | | | 3,342,379 | | | | 3,300,000 | | | $ | 32,059 | |
Contracts to buy CNH: | |
Credit Suisse | | | 1/9/19 | | | | 1,401,274 | | | | 9,680,000 | | | | 8,152 | |
| | | | | | | | | | | | | | | | |
Unrealized gain on currency forward contracts | | | | 7,083,578 | |
Unrealized loss on currency forward contracts | | | | (2,461,215 | ) |
| | | | | | | | | | | | | | | | |
Net unrealized gain on currency forward contracts | | | $ | 4,622,363 | |
| | | | | | | | | | | | | | | | |
The listed counterparty may be the parent company or one of its subsidiaries.
CHF: Swiss Franc
CNH: Chinese Yuan Renminbi
| | |
| See accompanying Notes to Consolidated Financial Statements | | DODGE & COX GLOBAL STOCK FUND§PAGE 9 |
| | | | |
CONSOLIDATED STATEMENT OF ASSETS AND LIABILITIES | |
| |
| | | December 31, 2018 | |
ASSETS: | | | | |
Investments in securities, at value (cost $8,431,164,593) | | $ | 8,607,363,477 | |
Unrealized appreciation on currency forward contracts | | | 7,083,578 | |
Cash | | | 100 | |
Cash denominated in foreign currency (cost $58,370,931) | | | 58,539,893 | |
Deposits with broker for futures contracts | | | 8,010,000 | |
Receivable for variation margin for futures contracts | | | 1,281,599 | |
Receivable for investments sold | | | 7,232,457 | |
Receivable for Fund shares sold | | | 7,886,160 | |
Dividends and interest receivable | | | 18,497,443 | |
Prepaid expenses and other assets | | | 64,930 | |
| | | | |
| | | 8,715,959,637 | |
| | | | |
LIABILITIES: | | | | |
Unrealized depreciation on currency forward contracts | | | 2,461,215 | |
Cash received as collateral for currency forward contracts | | | 6,410,000 | |
Payable for investments purchased | | | 74,218,122 | |
Payable for Fund shares redeemed | | | 8,400,221 | |
Deferred foreign capital gains tax | | | 5,437,215 | |
Management fees payable | | | 4,512,421 | |
Accrued expenses | | | 325,001 | |
| | | | |
| | | 101,764,195 | |
| | | | |
NET ASSETS | | $ | 8,614,195,442 | |
| | | | |
NET ASSETS CONSIST OF: | | | | |
Paid in capital | | $ | 8,257,850,693 | |
Total distributable earnings | | | 356,344,749 | |
| | | | |
| | $ | 8,614,195,442 | |
| | | | |
Fund shares outstanding (par value $0.01 each, unlimited shares authorized) | | | 780,653,262 | |
Net asset value per share | | $ | 11.03 | |
|
CONSOLIDATED STATEMENT OF OPERATIONS | |
| |
| | | Year Ended
December 31, 2018 | |
INVESTMENT INCOME: | | | | |
Dividends (net of foreign taxes of $13,212,620) | | $ | 204,691,315 | |
Interest | | | 2,164,865 | |
| | | | |
| | | 206,856,180 | |
| | | | |
EXPENSES: | | | | |
Management fees | | | 57,951,050 | |
Custody and fund accounting fees | | | 740,313 | |
Transfer agent fees | | | 292,176 | |
Professional services | | | 211,786 | |
Shareholder reports | | | 59,144 | |
Registration fees | | | 242,718 | |
Trustees’ fees | | | 324,167 | |
ADR depositary service fees | | | 236,557 | |
Miscellaneous | | | 155,769 | |
| | | | |
| | | 60,213,680 | |
| | | | |
NET INVESTMENT INCOME | | | 146,642,500 | |
| | | | |
REALIZED AND UNREALIZED GAIN (LOSS): | |
Net realized gain (loss) | | | | |
Investments in securities (net of foreign capital gains taxes of $338,867) | | | 752,161,043 | |
Futures contracts | | | (7,549,893 | ) |
Currency forward contracts | | | (23,430,385 | ) |
Foreign currency transactions | | | (1,338,958 | ) |
Net change in unrealized appreciation/depreciation | | | | |
Investments in securities (net of increase in deferred foreign capital gains tax of $1,577,542) | | | (2,154,785,002 | ) |
Futures contracts | | | 716,083 | |
Currency forward contracts | | | 33,296,864 | |
Foreign currency translation | | | (398,452 | ) |
| | | | |
Net realized and unrealized loss | | | (1,401,328,700 | ) |
| | | | |
NET CHANGE IN NET ASSETS
FROM OPERATIONS | | $ | (1,254,686,200 | ) |
| | | | |
| | | | | | | | |
CONSOLIDATED STATEMENT OF CHANGES IN NET ASSETS | |
| | |
| | | Year Ended
December 31, 2018 | | | Year Ended
December 31, 2017 | |
OPERATIONS: | | | | | | | | |
Net investment income | | $ | 146,642,500 | | | $ | 86,363,057 | |
Net realized gain (loss) | | | 719,841,807 | | | | 377,089,181 | |
Net change in unrealized appreciation/depreciation | | | (2,121,170,507 | ) | | | 1,154,466,793 | |
| | | | | | | | |
| | | (1,254,686,200 | ) | | | 1,617,919,031 | |
| | | | | | | | |
| | |
DISTRIBUTIONS TO SHAREHOLDERS: | | | | | | | | |
Total distributions | | | (770,232,844 | ) | | | (397,832,847 | )(a) |
| | |
FUND SHARE TRANSACTIONS: | | | | | | | | |
Proceeds from sale of shares | | | 1,404,694,112 | | | | 2,601,130,740 | |
Reinvestment of distributions | | | 749,634,584 | | | | 387,957,885 | |
Cost of shares redeemed | | | (1,425,797,344 | ) | | | (1,399,820,312 | ) |
| | | | | | | | |
Net change from Fund share transactions | | | 728,531,352 | | | | 1,589,268,313 | |
| | | | | | | | |
Total change in net assets | | | (1,296,387,692 | ) | | | 2,809,354,497 | |
| | |
NET ASSETS: | | | | | | | | |
Beginning of year | | | 9,910,583,134 | | | | 7,101,228,637 | |
| | | | | | | | |
End of year | | $ | 8,614,195,442 | | | $ | 9,910,583,134 | (b) |
| | | | | | | | |
| | |
SHARE INFORMATION: | | | | | | | | |
Shares sold | | | 103,488,968 | | | | 195,795,071 | |
Distributions reinvested | | | 67,840,234 | | | | 28,276,808 | |
Shares redeemed | | | (105,831,354 | ) | | | (105,299,029 | ) |
| | | | | | | | |
Net change in shares outstanding | | | 65,497,848 | | | | 118,772,850 | |
| | | | | | | | |
| (a) | Prior year comparative amounts have been adjusted to reflect current presentation under new accounting standards. Prior year distributions consisted of $87,312,909 from net investment income and $310,519,938 from net realized gain. |
| (b) | Includes undistributed net investment income of $849,242. |
| | |
| PAGE 10§ DODGE & COX GLOBAL STOCK FUND | | See accompanying Notes to Consolidated Financial Statements |
NOTES TO CONSOLIDATED FINANCIAL STATEMENTS
NOTE 1—ORGANIZATION AND SIGNIFICANT ACCOUNTING POLICIES
Dodge & Cox Global Stock Fund (the “Fund”) is one of the series constituting the Dodge & Cox Funds (the “Trust” or the “Funds”). The Trust is organized as a Delaware statutory trust and is registered under the Investment Company Act of 1940, as amended, as anopen-end management investment company. The Fund commenced operations on May 1, 2008, and seeks long-term growth of principal and income. The Fund invests primarily in a diversified portfolio of U.S. and foreign equity securities. Foreign investing, especially in developing countries, has special risks such as currency and market volatility and political and social instability. These and other risk considerations are discussed in the Fund’s Prospectus.
The Fund is an investment company and follows the accounting and reporting guidance issued in Topic 946 by the Financial Accounting Standards Board. The financial statements have been prepared in conformity with accounting principles generally accepted in the United States of America, which require the use of estimates and assumptions by management. Actual results may differ from those estimates. Significant accounting policies are as follows:
Security valuation The Fund’s net assets are normally valued as of the scheduled close of trading on the New York Stock Exchange (NYSE), generally 4 p.m. Eastern Time, each day that the NYSE is open for business.
Portfolio holdings for which market quotes are readily available are valued at market value. Listed securities, for example, are generally valued using the official quoted close price or the last sale on the exchange that is determined to be the primary market for the security. Equity-linked notes are valued using prices received from independent pricing services which utilize market quotes from underlying reference instruments. Exchange-traded derivatives are valued at the settlement price determined by the relevant exchange.Short-term securities less than 60 days to maturity may be valued at amortized cost if amortized cost approximates current value. Security values are not discounted based on the size of the Fund’s position and may differ from the value a Fund receives upon sale of the securities. Mutual funds are valued at their respective net asset values.
Investments initially valued in currencies other than the U.S. dollar are converted to the U.S. dollar using prevailing exchange rates. Currency forward contracts are valued based on the prevailing forward exchange rates of the underlying currencies. As a result, the Fund’s net assets may be affected by changes in the value of currencies in relation to the U.S. dollar.
If market quotations are not readily available or if normal valuation procedures produce valuations that are deemed unreliable or inappropriate under the circumstances existing at the time, the investment will be valued at fair value as determined in good faith by or under the direction of the Fund’s Board of Trustees. The Board of Trustees has appointed Dodge & Cox, the Fund’s investment manager, to make fair value determinations in accordance with the Dodge & Cox Funds Valuation Policies (“Valuation Policies”), subject to Board oversight. Dodge & Cox has established a Pricing Committee that is comprised of representatives from Treasury, Legal, Compliance, and Operations. The Pricing Committee is responsible for implementing the
Valuation Policies, including determining the fair value of securities and other investments when necessary. The Pricing Committee considers relevant indications of value that are reasonably available to it in determining the fair value assigned to a particular security, such as the value of similar financial instruments, trading volumes, contractual restrictions on disposition, related corporate actions, and changes in economic conditions. In doing so, the Pricing Committee employs various methods for calibrating fair valuation approaches, including a regular review of key inputs and assumptions, back-testing, and review of any related market activity.
As trading in securities on most foreign exchanges is normally completed before the close of the NYSE, the value of non-U.S. securities can change by the time the Fund calculates its net asset value. To address these changes, the Fund may utilize adjustment factors provided by an independent pricing service to systematically value non-U.S. securities at fair value. These adjustment factors are based on statistical analyses of subsequent movements and changes in U.S. markets and financial instruments trading in U.S. markets that represent foreign securities or baskets of securities.
Valuing securities through a fair value determination involves greater reliance on judgment than valuation of securities based on readily available market quotations. In some instances, lack of information and uncertainty as to the significance of information may lead to a conclusion that a prior valuation is the best indication of a security’s value. When fair value pricing is employed, the prices of securities used by the Fund to calculate its net asset value may differ from quoted or published prices for the same securities.
Security transactions, investment income, expenses, and distributions Security transactions are recorded on the trade date. Realized gains and losses on securities sold are determined on the basis of identified cost.
Dividend income and corporate action transactions are recorded on theex-dividend date, or when the Fund first learns of the dividend/corporate action if the ex-dividend date has passed.Non-cash dividends, if any, are recorded at the fair market value of the securities received. Dividends characterized as return of capital for U.S. tax purposes are recorded as a reduction of cost of investments and/or realized gain. Interest income is recorded on the accrual basis.
Expenses are recorded on the accrual basis. Some expenses of the Trust can be directly attributed to a specific series. Expenses which cannot be directly attributed are allocated among the Funds in the Trust using methodologies determined by the nature of the expense.
Distributions to shareholders are recorded on theex-dividend date.
Foreign taxes The Fund is subject to foreign taxes which may be imposed by certain countries in which the Fund invests. The Fund endeavors to record foreign taxes based on applicable foreign tax law. Withholding taxes are incurred on certain foreign dividends and are accrued at the time the associated dividend is recorded. The Fund files withholding tax reclaims in certain jurisdictions to recover a portion of amounts previously withheld. The Fund records a reclaim receivable based on, among other things, a jurisdiction’s legal obligation to pay reclaims as well as
DODGE & COX GLOBAL STOCK FUND§PAGE 11
NOTES TO CONSOLIDATED FINANCIAL STATEMENTS
payment history and market convention. In consideration of recent decisions rendered by European courts, the Fund has filed for additional reclaims related to prior years. A corresponding receivable is established when both the amount is known and significant contingencies or uncertainties regarding collectability are removed. These amounts, if any, are reported in “dividends and interest receivable” in the Consolidated Statement of Assets and Liabilities.
Capital gains taxes are incurred upon disposition of certain foreign securities. Expected capital gains taxes on appreciated securities, if any, are accrued as unrealized losses and incurred capital gains taxes are reflected as realized losses upon the sale of the related security. Currency taxes may be incurred when the Fund purchases certain foreign currencies related to securities transactions and are recorded as realized losses on foreign currency transactions.
Equity-linked note An equity-linked note is a structured security linked to underlying reference equity securities. Changes in the market value of equity-linked notes are recorded as unrealized appreciation or depreciation and realized gains or losses are recorded upon the sale or maturity of the notes in the Consolidated Statement of Operations within investments in securities. The risks of investing in equity-linked notes include unfavorable price movements in the underlying securities and the credit risk of the issuing financial institution. Equity-linked notes may be more volatile and less liquid than other investments held by the Fund.
Repurchase agreements Repurchase agreements are transactions under which a Fund purchases a security from a dealer counterparty and agrees to resell the security to that counterparty on a specified future date at the same price, plus a specified interest rate. The Fund’s repurchase agreements are secured by U.S. government or agency securities. It is the Fund’s policy that its custodian take possession of the underlying collateral securities, the fair value of which exceeds the principal amount of the repurchase transaction, including accrued interest, at all times. In the event of default by the counterparty, the Fund has the contractual right to liquidate the collateral securities and to apply the proceeds in satisfaction of the obligation.
Foreign currency translation The books and records of the Fund are maintained in U.S. dollars. Foreign currency amounts are translated into U.S. dollars at the prevailing exchange rates of such currencies against the U.S. dollar. The market value of investment securities and other assets and liabilities are translated at the exchange rate as of the valuation date. Purchases and sales of investment securities, income, and expenses are translated at the exchange rate prevailing on the transaction date.
Reported realized and unrealized gain (loss) on investments include foreign currency gain (loss) related to investment transactions.
Reported realized and unrealized gain (loss) on foreign currency transactions and translation include the following: disposing/holding of foreign currency, the difference between the trade and settlement dates on securities transactions, the difference between the accrual and payment dates on dividends, and currency losses on the purchase of foreign currency in certain countries that impose taxes on such transactions.
ConsolidationThe Fund may invest in certain securities through its wholly owned subsidiary, Dodge & Cox Global Stock Fund Cayman, Ltd. (the “Subsidiary”). The Subsidiary is a
Cayman Islands exempted company and invests in certain securities consistent with the investment objective of the Fund. The Fund’s Consolidated Financial Statements, including the Consolidated Portfolio of Investments, consist of the holdings and accounts of the Fund and the Subsidiary. All intercompany transactions and balances have been eliminated. At December 31, 2018, the Subsidiary had net assets of $100, which represented less than 0.01% of the Fund’s consolidated net assets.
Indemnification Under the Trust’s organizational documents, its officers and trustees are indemnified against certain liabilities arising out of the performance of their duties to the Trust. In addition, in the normal course of business the Trust enters into contracts that provide general indemnities to other parties. The Trust’s maximum exposure under these arrangements is unknown as this would involve future claims that may be made against the Trust that have not yet occurred.
NOTE 2—VALUATION MEASUREMENTS
Various inputs are used in determining the value of the Fund’s investments. These inputs are summarized in the three broad levels listed below.
| § | | Level 1: Quoted prices in active markets for identical securities |
| § | | Level 2: Other significant observable inputs (including quoted prices for similar securities, market indices, interest rates, credit risk, forward exchange rates, etc.) |
| § | | Level 3: Significant unobservable inputs (including Fund management’s assumptions in determining the fair value of investments) |
The inputs or methodology used for valuing securities are not necessarily an indication of the risk associated with investing in those securities.
The following is a summary of the inputs used to value the Fund’s holdings at December 31, 2018:
| | | | | | | | |
| Classification | | LEVEL 1
(Quoted Prices) | | | LEVEL 2
(Other Significant
Observable Inputs) | |
Securities | | | | | | | | |
Common Stocks | | | | | | | | |
Communication Services | | $ | 1,165,616,171 | | | $ | 275,963,759 | |
Consumer Discretionary | | | 326,389,216 | | | | 158,374,720 | |
Consumer Staples | | | 59,113,867 | | | | — | |
Energy | | | 506,404,836 | | | | — | |
Financials | | | 793,995,646 | | | | 1,659,490,890 | |
Health Care | | | 543,439,017 | | | | 1,032,362,382 | |
Industrials | | | 320,983,125 | | | | 146,710,182 | |
Information Technology | | | 546,554,849 | | | | 97,674,818 | |
Materials | | | 148,994,614 | | | | 177,355,029 | |
Real Estate | | | — | | | | 38,662,614 | |
Preferred Stocks | | | | | | | | |
Energy | | | — | | | | 69,580,752 | |
Financials | | | — | | | | 186,833,158 | |
Information Technology | | | — | | | | 105,419,860 | |
Equity-Linked Note | | | | | | | | |
Communication Services | | | — | | | | 52,530,730 | |
Short-term Investments | | | | | | | | |
Repurchase Agreement | | | — | | | | 160,604,000 | |
Money Market Fund | | | 34,309,242 | | | | — | |
| | | | | | | | |
Total Securities | | $ | 4,445,800,583 | | | $ | 4,161,562,894 | |
| | | | | | | | |
PAGE 12§ DODGE & COX GLOBAL STOCK FUND
NOTES TO CONSOLIDATED FINANCIAL STATEMENTS
| | | | | | | | |
| Classification | | LEVEL 1
(Quoted Prices) | | | LEVEL 2
(Other Significant
Observable Inputs) | |
Other Investments | | | | | | | | |
Futures Contracts | | | | | | | | |
Appreciation | | $ | 1,697,012 | | | $ | — | |
Currency Forward Contracts | | | | | | | | |
Appreciation | | | — | | | | 7,083,578 | |
Depreciation | | | — | | | | (2,461,215 | ) |
| | | | | | | | | |
NOTE 3—DERIVATIVE INSTRUMENTS
The Fund entered into various transactions involving derivative instruments, including currency forward contracts and futures contracts, in connection with its investment strategy. The Fund may use derivatives to minimize the impact of losses to one or more of its investments (as a ‘‘hedging technique’’) or to implement its investment strategy.
The Fund entered intoover-the-counter derivatives (each, an ‘‘OTC Derivative’’), such as currency forward contracts. Each OTC Derivative is subject to a negotiated master agreement (based on a form published by the International Swaps and Derivatives Association (‘‘ISDA’’)) governing all OTC Derivatives between the Fund and the relevant dealer counterparty. The master agreements specify (i) events of default and other events permitting a party to terminate some or all of the OTC Derivatives thereunder and (ii) the process by which those OTC Derivatives will be valued for purposes of determining termination payments. If some or all of the OTC Derivatives under a master agreement are terminated because of an event of default or similar event, the values of all terminated OTC Derivatives must be netted to determine a single payment owed by one party to the other. To the extent amounts owed to the Fund by its counterparties are not collateralized, the Fund is at risk of those counterparties’ non-performance. The Fund attempts to mitigate counterparty credit risk by entering into OTC Derivatives only with counterparties it believes to be of good credit quality, by exchanging collateral and by monitoring the financial stability of those counterparties.
Futures contracts Futures contracts involve an obligation to purchase or sell (depending on whether the Fund has entered a long or short futures contract, respectively) an asset at a future date, at a price set at the time of the contract. Upon entering into a futures contract, the Fund is required to deposit an amount of cash or liquid assets (referred to as initial margin) in a segregated account with the clearing broker. Subsequent payments (referred to as variation margin) to and from the clearing broker are made on a daily basis based on changes in the market value of futures contracts. Futures contracts are traded publicly and their market value changes daily. Changes in the market value of open futures contracts are recorded as unrealized appreciation or depreciation in the Consolidated Statement of Operations. Realized gains and losses on futures contracts are recorded in the Consolidated Statement of Operations at the closing or expiration of the contracts. Cash deposited with a broker as initial margin is recorded in the Consolidated Statement of Assets and Liabilities. A receivable and/or payable to brokers for daily variation margin is also recorded in the Consolidated Statement of Assets and Liabilities.
Investments in futures contracts may include certain risks, which may be different from, and potentially greater than, those of the underlying securities. To the extent the Fund uses futures, it is exposed to additional volatility and potential losses resulting from leverage.
The Fund has maintained long S&P 500 futures contracts to provide equity exposure that approximates the Fund’s “net cash and other” position, which includes cash, short-term investments, receivables, and payables. During the year ended December 31, 2018, these S&P 500 futures contracts had notional values up to 5% of net assets.
Currency forward contractsA currency forward contract represents an obligation to purchase or sell a specific foreign currency at a future date at a price set at the time of the contract. The values of currency forward contracts are adjusted daily based on the prevailing forward exchange rates of the underlying currencies. Changes in the value of open contracts are recorded as unrealized appreciation or depreciation in the Consolidated Statement of Operations. When a currency forward contract is closed, the Fund records a realized gain or loss in the Consolidated Statement of Operations equal to the difference between the value at the time the contract was opened and the value at the time it was closed.
Losses from these transactions may arise from unfavorable changes in currency values or if a counterparty does not perform under a contract’s terms.
The Fund has maintained currency forward contracts to hedge direct and/or indirect foreign currency exposure to the Chinese yuan renminbi, euro, and Swiss franc. During the year ended December 31, 2018, these currency forward contracts had U.S. dollar total values ranging from 4% to 7% of net assets.
Additional derivative information For financial reporting purposes, the Fund does not offset OTC Derivative assets and liabilities that are subject to a master netting arrangement in the Consolidated Statement of Assets and Liabilities. OTC Derivatives are presented in the Consolidated Statement of Assets and Liabilities as unrealized appreciation/depreciation on currency forward contracts. Cash collateral pledged or received by the Fund for OTC Derivatives is reported gross in the Consolidated Statement of Assets and Liabilities as cash pledged/(received) as collateral for currency forward contracts. Derivative information by counterparty is presented in the Consolidated Portfolio of Investments.
The netting of assets and liabilities and the offsetting of collateral pledged or received are based on contractualnetting/set-off provisions in the ISDA master agreement. The following table presents the Fund’s net exposure for OTC Derivatives that are subject to enforceable master netting arrangements as of December 31, 2018. The net amount represents the receivable from (payable to) the counterparty in the event of a default.
DODGE & COX GLOBAL STOCK FUND§PAGE 13
NOTES TO CONSOLIDATED FINANCIAL STATEMENTS
| | | | | | | | | | | | | | | | |
| Counterparty | | Gross OTC Derivative
Assets | | | Gross OTC Derivative
Liabilities | | | Cash Collateral Pledged / (Received)(a) | | | Net Amount | |
Barclays | | $ | 82,787 | | | $ | (288,445 | ) | | $ | — | | | $ | (205,658 | ) |
Citibank | | | 1,932,869 | | | | (647,174 | ) | | | (1,285,695 | ) | | | — | |
Credit Suisse | | | 593,570 | | | | — | | | | (593,570 | ) | | | — | |
Goldman Sachs | | | 16,631 | | | | (232,370 | ) | | | — | | | | (215,739 | ) |
HSBC | | | 1,004,566 | | | | (158,775 | ) | | | (845,791 | ) | | | — | |
JPMorgan | | | 2,954,792 | | | | (449,906 | ) | | | (2,504,886 | ) | | | — | |
Morgan Stanley | | | — | | | | (302,398 | ) | | | — | | | | (302,398 | ) |
UBS | | | 498,363 | | | | (382,147 | ) | | | (116,216 | ) | | | — | |
| | | | | | | | | | | | | | | | |
Total | | $ | 7,083,578 | | | $ | (2,461,215 | ) | | $ | (5,346,158 | ) | | $ | (723,795 | ) |
| | | | | | | | | | | | | | | | |
| | | | | | | | | | | | | | | | | |
| (a) | Cash collateral pledged/(received) in excess of OTC Derivative assets/liabilities, if any, is not presented. Total cash collateral pledged/(received) is presented in the Consolidated Statement of Assets and Liabilities. |
NOTE 4—RELATED PARTY TRANSACTIONS
Management fees Under a written agreement approved by a unanimous vote of the Board of Trustees, the Fund pays a management fee monthly at an annual rate of 0.60% of the Fund’s average daily net assets to Dodge & Cox, investment manager of the Fund.
Fund officers and trustees All officers and two of the trustees of the Trust are officers or employees of Dodge & Cox. The Trust pays a fee only to those trustees who are not affiliated with Dodge & Cox.
NOTE 5—INCOME TAX INFORMATION AND DISTRIBUTIONS TO SHAREHOLDERS
A provision for federal income taxes is not required since the Fund intends to qualify as a regulated investment company under Subchapter M of the Internal Revenue Code and distribute all of its taxable income to shareholders. Distributions are determined in accordance with income tax regulations, and such amounts may differ from net investment income and realized gains for financial reporting purposes. The Fund may also designate a portion of the amount paid to redeeming shareholders as a distribution for tax purposes. Financial reporting records are adjusted for permanent book to tax differences at year end to reflect tax character. Book to tax differences are primarily due to differing treatments of wash sales, net short-term realized gain (loss), foreign currency realized gain (loss), foreign capital gains tax, certain corporate action transactions, derivatives, and distributions.
Distributions during the years noted below were characterized as follows for federal income tax purposes:
| | | | | | | | |
| | | Year Ended
December 31, 2018 | | | Year Ended December 31, 2017 | |
Ordinary income | | $ | 194,859,210 | | | $ | 133,923,724 | |
| | ($ | 0.273 per share | ) | | ($ | 0.204 per share | ) |
Long-term capital gain | | $ | 575,373,634 | | | $ | 263,909,123 | |
| | ($ | 0.806 per share | ) | | ($ | 0.402 per share | ) |
At December 31, 2018, the tax basis components of distributable earnings were as follows:
| | | | |
Undistributed ordinary income | | $ | 5,895,860 | |
Undistributed long-term capital gain | | | 221,964,846 | |
At December 31, 2018, unrealized appreciation and depreciation for investments and derivatives based on cost for federal income tax purposes were as follows:
| | | | |
Tax cost | | $ | 8,479,533,886 | |
Unrealized appreciation | | | 1,360,173,647 | |
Unrealized depreciation | | | (1,226,024,681 | ) |
| | | | |
Net unrealized appreciation | | | 134,148,966 | |
| | | | | |
Fund management has reviewed the tax positions for open periods (three years and four years, respectively, from filing the Fund’s Federal and State tax returns) as applicable to the Fund, and has determined that no provision for income tax is required in the Fund’s financial statements.
NOTE 6—LOAN FACILITIES
Pursuant to an exemptive order issued by the Securities and Exchange Commission (SEC), the Fund may participate in an interfund lending facility (Facility). The Facility allows the Fund to borrow money from or loan money to the Funds. Loans under the Facility are made for temporary or emergency purposes, such as to fund shareholder redemption requests. Interest on borrowings is the average of the current repurchase agreement rate and the bank loan rate. There was no activity in the Facility during the year.
All Funds in the Trust participate in a $500 million committed credit facility (Line of Credit) with State Street Bank and Trust Company, to be utilized for temporary or emergency purposes to fund shareholder redemptions or for other short-term liquidity purposes. The maximum amount available to the Fund is $250 million. Each Fund pays an annual commitment fee on itspro-rata portion of the Line of Credit. For the year ended December 31, 2018, the Fund’s commitment fee amounted to $55,888 and is reflected as a Miscellaneous Expense in the Consolidated Statement of Operations. Interest on borrowings is charged at the prevailing rate. There were no borrowings on the Line of Credit during the year.
NOTE 7—PURCHASES AND SALES OF INVESTMENTS
For the year ended December 31, 2018, purchases and sales of securities, other than short-term securities, aggregated $3,266,905,184 and $2,914,596,709, respectively.
NOTE 8—NEW ACCOUNTING GUIDANCE
In August 2018, the Financial Accounting Standards Board issued Accounting Standards Update “Fair Value Measurement (Topic 820)” (ASU 2018-13) which modifies the disclosure requirements for fair value measurement by removing, modifying, or adding certain disclosures. The amendments are effective for annual periods beginning after December 15, 2019, and interim periods
PAGE 14§ DODGE & COX GLOBAL STOCK FUND
NOTES TO CONSOLIDATED FINANCIAL STATEMENTS
within those annual periods. The Fund is permitted to early adopt any removed or modified disclosures upon issuance of this update and delay adoption of the additional disclosures until their effective date. The Fund has early adopted the updated accounting standards on the Fund’s financial statements.
NOTE 9—SUBSEQUENT EVENTS
Fund management has determined that no material events or transactions occurred subsequent to December 31, 2018, and through the date of the Fund’s financial statements issuance, which require additional disclosure in the Fund’s financial statements.
DODGE & COX GLOBAL STOCK FUND§PAGE 15
CONSOLIDATED FINANCIAL HIGHLIGHTS
| | | | | | | | | | | | | | | | | | | | |
SELECTED DATA AND RATIOS (for a share outstanding throughout each year) | | Year Ended December 31, | |
| | | 2018 | | | 2017 | | | 2016 | | | 2015 | | | 2014 | |
| | | | |
Net asset value, beginning of year | | | $13.86 | | | | $11.91 | | | | $10.46 | | | | $11.83 | | | | $11.48 | |
Income from investment operations: | | | | | | | | | | | | | | | | | | | | |
Net investment income | | | 0.21 | | | | 0.13 | | | | 0.14 | | | | 0.16 | | | | 0.16 | |
Net realized and unrealized gain (loss) | | | (1.96 | ) | | | 2.42 | | | | 1.65 | | | | (1.11 | ) | | | 0.64 | |
| | | | |
Total from investment operations | | | (1.75 | ) | | | 2.55 | | | | 1.79 | | | | (0.95 | ) | | | 0.80 | |
| | | | |
Distributions to shareholders from: | | | | | | | | | | | | | | | | | | | | |
Net investment income | | | (0.25 | ) | | | (0.13 | ) | | | (0.14 | ) | | | (0.19 | ) | | | (0.15 | ) |
Net realized gain | | | (0.83 | ) | | | (0.47 | ) | | | (0.20 | ) | | | (0.23 | ) | | | (0.30 | ) |
| | | | |
Total distributions | | | (1.08 | ) | | | (0.60 | ) | | | (0.34 | ) | | | (0.42 | ) | | | (0.45 | ) |
| | | | |
Net asset value, end of year | | | $11.03 | | | | $13.86 | | | | $11.91 | | | | $10.46 | | | | $11.83 | |
| | | | |
Total return | | | (12.65 | )% | | | 21.51 | % | | | 17.09 | % | | | (8.05 | )% | | | 6.95 | % |
Ratios/supplemental data: | | | | | | | | | | | | | | | | | | | | |
Net assets, end of year (millions) | | | $8,614 | | | | $9,911 | | | | $7,101 | | | | $5,708 | | | | $5,895 | |
Ratio of expenses to average net assets | | | 0.62 | % | | | 0.63 | % | | | 0.63 | % | | | 0.63 | % | | | 0.65 | % |
Ratio of net investment income to average net assets | | | 1.52 | % | | | 1.02 | % | | | 1.36 | % | | | 1.39 | % | | | 1.42 | % |
Portfolio turnover rate | | | 31 | % | | | 18 | % | | | 25 | % | | | 20 | % | | | 17 | % |
See accompanying Notes to Consolidated Financial Statements
PAGE 16§ DODGE & COX GLOBAL STOCK FUND
REPORT OF INDEPENDENT REGISTERED PUBLIC ACCOUNTING FIRM
To the Board of Trustees of the Dodge & Cox Funds and Shareholders of Dodge & Cox Global Stock Fund
Opinion on the Financial Statements
We have audited the accompanying consolidated statement of assets and liabilities, including the consolidated portfolio of investments, of Dodge & Cox Global Stock Fund and its subsidiary (one of the funds constituting Dodge & Cox Funds, referred to hereafter as the “Fund”) as of December 31, 2018, the related consolidated statement of operations for the year ended December 31, 2018, the consolidated statement of changes in net assets for each of the two years in the period ended December 31, 2018, including the related notes, and the financial highlights for each of the five years in the period ended December 31, 2018 (collectively referred to as the “consolidated financial statements”). In our opinion, the consolidated financial statements present fairly, in all material respects, the financial position of the Fund as of December 31, 2018, the results of its operations for the year then ended, the changes in its net assets for each of the two years in the period ended December 31, 2018 and the financial highlights for each of the five years in the period ended December 31, 2018 in conformity with accounting principles generally accepted in the United States of America.
Basis for Opinion
These consolidated financial statements are the responsibility of the Fund’s management. Our responsibility is to express an opinion on the Fund’s consolidated financial statements based on our audits. We are a public accounting firm registered with the Public Company Accounting Oversight Board (United States) (PCAOB) and are required to be independent with respect to the Fund in accordance with the U.S. federal securities laws and the applicable rules and regulations of the Securities and Exchange Commission and the PCAOB.
We conducted our audits of these consolidated financial statements in accordance with the standards of the PCAOB. Those standards require that we plan and perform the audit to obtain reasonable assurance about whether the consolidated financial statements are free of material misstatement, whether due to error or fraud.
Our audits included performing procedures to assess the risks of material misstatement of the consolidated financial statements, whether due to error or fraud, and performing procedures that respond to those risks. Such procedures included examining, on a test basis, evidence regarding the amounts and disclosures in the consolidated financial statements. Our audits also included evaluating the accounting principles used and significant estimates made by management, as well as evaluating the overall presentation of the consolidated financial statements. Our procedures included confirmation of securities owned as of December 31, 2018 by correspondence with the custodian, transfer agent and brokers; when replies were not received from brokers, we performed other auditing procedures. We believe that our audits provide a reasonable basis for our opinion.
PricewaterhouseCoopers LLP
San Francisco, California
February 15, 2019
We have served as the auditor of one or more investment companies in the Dodge & Cox Funds since 1931.
DODGE & COX GLOBAL STOCK FUND§PAGE 17
SPECIAL 2018 TAX INFORMATION
(unaudited)
The following information is provided pursuant to provisions of the Internal Revenue Code:
In 2018, the Fund elected to pass through to shareholders foreign source income of $199,409,341 and foreign taxes paid of $13,450,071.
The Fund designates $592,823,973 as long-term capital gain distributions in 2018.
The Fund designates up to a maximum amount of $240,420,251 of its distributions paid to shareholders in 2018 as qualified dividends (treated for federal income tax purposes in the hands of shareholders as taxable at a maximum rate of 20%).
For shareholders that are corporations, the Fund designates 25% of its ordinary dividends paid to shareholders in 2018 as dividends from domestic corporations eligible for the corporate dividends received deduction, provided that the shareholder otherwise satisfies applicable requirements to claim that deduction.
BOARD APPROVAL OF FUNDS’ INVESTMENT
MANAGEMENT AGREEMENTS AND MANAGEMENT FEES
(unaudited)
The Board of Trustees is responsible for overseeing the performance of the Dodge & Cox Funds’ investment manager and determining whether to continue the Investment Management Agreements between the Funds and Dodge & Cox each year (the “Agreements”). At a meeting of the Board of Trustees of the Trust held on December 13, 2018, the Trustees, by a unanimous vote (including a separate vote of those Trustees who are not “interested persons” (as defined in the Investment Company Act of 1940) (the “Independent Trustees”)), approved the renewal of the Agreements for an additional one-year term through December 31, 2019 with respect to each Fund. During the course of the year, the Board received extensive information and materials relating to the investment management and administrative services provided by Dodge & Cox and the performance of each of the Funds.
INFORMATION RECEIVED
Over the past several years, the Board has requested, received, and discussed a number of special presentations on topics relevant to their annual consideration of the proposed renewal of the Funds’ Agreements. In addition to the foregoing and in advance of the meetings referred to below, the Board, including the Independent Trustees, requested, received, and reviewed materials relating to the Agreements and the services provided by Dodge & Cox. The Independent Trustees retained Broadridge to prepare an independent expense and performance summary for each Fund and comparable funds managed by other advisers identified by Broadridge. The Broadridge materials included information regarding advisory fee rates, expense ratios, and transfer agency, custodial, and distribution expenses, as well as performance comparisons to each Fund’s peer group and to a broad-based securities index or combination of indices. The Broadridge materials also included a comparison of expenses of various share classes offered by comparable funds. The materials reviewed by the Board contained information concerning, among other things,
Dodge & Cox’s profitability, financial results and condition, advisory fee revenue, and separate account fee schedules. The Board additionally considered the Funds’ brokerage commissions, turnover rates, sales and redemption data, and the significant investment that Dodge & Cox makes in research used in managing the Funds. The Board received and reviewed memoranda and related materials addressing, among other things, Dodge & Cox’s services to the Funds; how Dodge & Cox Funds’ fees compare to fees of peer group funds; the different fees, services, costs, and risks associated with other accounts managed by Dodge & Cox as compared to the Dodge & Cox Funds; and the ways in which the Funds realize economies of scale. Throughout the process of reviewing the services provided by Dodge & Cox and preparing for the meeting, the Independent Trustees found Dodge & Cox to be open, forthright, detailed, and very helpful in answering questions about all issues. The Board received copies of the Agreements and a memorandum from the independent legal counsel to the Independent Trustees discussing the factors generally regarded as appropriate to consider in evaluating advisory arrangements. The Trust’s Contract Review Committee, consisting solely of Independent Trustees, met with the independent legal counsel on November 8, 2018 and again on December 13, 2018 to discuss whether to renew the Agreements. The Board, including the Independent Trustees, subsequently concluded that the existing Agreements are fair and reasonable and voted to approve the Agreements. In considering the Agreements, the Board, including the Independent Trustees, did not identify any single factor or particular information as all-important or controlling. In reaching the decision to approve the Agreements, the Board considered several factors, discussed below, to be key factors and reached the conclusions described below.
NATURE, QUALITY, AND EXTENT OF THE SERVICES
The Board considered that Dodge & Cox provides a wide range of services to the Funds in addition to portfolio management, including regulatory compliance, trading desks, proxy voting, transfer agent and custodian oversight, administration, regulatory filings, tax compliance and filings, web site, and anti-money laundering. The extensive nature of services provided by Dodge & Cox has been documented in materials provided to the Board and in presentations made to the Board throughout the year. In particular, the Board considered the nature, quality, and extent of portfolio management, administrative, and shareholder services performed by Dodge & Cox. With regard to portfolio management services, the Board considered Dodge & Cox’s established long-term history of care and conscientiousness in the management of the Funds; its demonstrated consistency in investment approach and depth; the background and experience of the Dodge & Cox U.S. Equity Investment Committee, International Equity Investment Committee, Global Equity Investment Committee, U.S. Fixed Income Investment Committee, and Global Fixed Income Investment Committee, and research analysts responsible for managing the Funds; Dodge & Cox’s methods for assessing the regulatory and investment climate in various jurisdictions; its overall high level of attention to its core investment management function; and its commitment to the Funds and their shareholders.
PAGE 18§ DODGE & COX GLOBAL STOCK FUND
The Board noted Dodge & Cox’s long record of favorable press and industry coverage, as well as its positive compliance record, and its reputation as a trusted, shareholder-friendly mutual fund family.
In addition, the Board considered that Dodge & Cox manages approximately $215 billion in Fund assets with fewer professionals than most comparable funds, and that on average these professionals have more experience and longer tenure than investment professionals at comparable funds. The Board also noted that Dodge & Cox is an investment research-oriented firm with no other business endeavors to distract management’s attention from its research efforts or to present material conflicts of interest with the operations of the Funds, that its investment professionals adhere to a consistent investment approach across the Funds, and that due to its careful and deliberate strategy with respect to new products, Dodge & Cox has had remarkable stability in its mutual fund product offerings over the course of the past 88 years and has the fewest funds of any of the 25 largest mutual fund families by assets. The Board further considered the “Gold” analyst rating awarded by Morningstar to all of the Funds (other than the Global Bond Fund, which has a “Bronze” rating). The Board concluded that it was satisfied with the nature, extent, and quality of investment management and other services provided to the Funds by Dodge & Cox.
INVESTMENT PERFORMANCE
The Board completed an intensive review and assessment of each Fund’s recent and long-term investment performance (including periods of outperformance and underperformance), as compared to relevant indices and the performance of such Fund’s peer group and broader Morningstar category. In assessing the performance of the Funds, the Board considered the Funds’ investment returns over various periods and the volatility thereof and concluded that the levels experienced were consistent with Dodge & Cox’s long-term approach and active investment style. The Board also compared the short- and long-term investment performance of the equity funds to value-oriented indices, in recognition of the significant performance divergence between value and growth stocks over the past several years. It was noted that equity performance has been consistent with the value oriented investment strategy employed by Dodge & Cox. The Board further noted that the equity funds have outperformed over their medium to long-term investment horizons as compared to their corresponding value equity indices.
The Board determined after extensive review and inquiry that Dodge & Cox’s historic, long-term, team-oriented, bottom-up investment approach remains consistent and that Dodge & Cox continues to be distinguished by its integrity, transparency, and independence. The Board considered that the performance of the Funds is the result of a value-oriented investment management process that emphasizes a long-term investment horizon, comprehensive independent research, a team approach, price discipline, low cost, and low portfolio turnover. The Board also considered that the investment performance delivered by Dodge & Cox to the Funds appeared to be consistent with the relevant performance delivered for other clients of Dodge & Cox.
The Board concluded that Dodge & Cox has delivered favorable long-term performance for Fund investors consistent with the long-term investment strategies being pursued by the Funds.
COSTS AND ANCILLARY BENEFITS
Costs of Services to Funds: Fees and Expenses The Board considered each Fund’s management fee rate and net expense ratio relative to (1) a broad category of other mutual funds with similar portfolio characteristics and share class and expense structures and (2) a much smaller group of peers selected by Broadridge based on investment style, share class characteristics, and asset levels. The Board also considered the management fees charged by Dodge & Cox to other clients. In particular, the Board considered that the Funds continue to be below their peer group median in net expense ratios and that many media and industry reports specifically comment on the low cost of the Funds, which have been a defining characteristic of the Funds for many years. The Board also evaluated the operating structures of the Funds and Dodge & Cox, noting that the Funds do not charge front-end sales commissions or distribution fees, and Dodge & Cox bears, among other things, the significant cost of third party research, reimbursement for shareholder recordkeeping and administrative costs to third-party retirement plan administrators, and administrative and office overhead.
The Board noted that the Broadridge report shows that the net expense ratio of every Dodge & Cox Fund is in the least expensive quartile compared to its broad Morningstar category. The Board noted the Funds’ unusual single-share-class structure and reviewed Broadridge data (including asset-weighted average expense ratios) showing that most of the peer group funds offer several different classes of shares, with different expense ratios, to different categories of investors, and that the Broadridge expense comparisons described above generally compare the net expense ratio of each Dodge & Cox Fund’s single share class to one of the least expensive share classes of the peer fund, even though those share classes are often not available to retail investors. The Board determined that the Funds provide access for small investors to high quality investment management at a relatively low cost. The Board also considered that the Funds are priced to scale, i.e., management fee rates begin at relatively low levels. Even without breakpoints, the Funds’ management fee rates are lower than those of many peer funds whose fee schedules include breakpoints. With respect to non-U.S. funds sponsored and managed by Dodge & Cox that are comparable to the Funds in many respects, the Board noted that the fee rates charged by Dodge & Cox are the same as or higher than the fee rates charged to the Funds.
The Board reviewed information regarding the fee rates Dodge & Cox charges to separate accounts that have investment programs similar to those of the Funds, including instances where separate account fees are lower than Fund fees. The Board considered the significant differences in the nature and scope of services Dodge & Cox provides to the Funds as compared to other client accounts, as well as material differences in regulatory, litigation, and other risks as between Dodge & Cox Funds and other types of clients. The Board noted that different markets exist for mutual fund and institutional separate account management
DODGE & COX GLOBAL STOCK FUND§PAGE 19
services and that a comparison of Fund fee rates and separate account fee rates must consider the fact that separate account clients bear additional costs and responsibilities that are included in the cost of a Fund. The Board further noted that many sophisticated institutional investors in the Funds that are eligible to open separate accounts at Dodge & Cox have decided for various reasons to invest in the Funds. After consideration of these matters, the Board concluded that the overall costs incurred by the Funds for the services they receive (including the management fee paid to Dodge & Cox) are reasonable and that the fees are acceptable based upon the qualifications, experience, reputation, and performance of Dodge & Cox and the low overall expense ratios of the Funds.
Profitability and Costs of Services to Dodge & Cox; “Fall-out” Benefits The Board reviewed reports of Dodge & Cox’s financial position, profitability, and estimated overall value and considered Dodge & Cox’s overall profitability within its context as a private, employee-owned S-Corporation and relative to the favorable services provided. The Board noted in particular that Dodge & Cox’s profits are not generated by high fee rates, but reflect a very streamlined, efficient, and focused business approach toward investment management.
The Board recognized the importance of Dodge & Cox’s profitability—which is derived solely from management fees and does not include other business ventures—to maintain its independence, stability, company culture and ethics, and management continuity. The Board also considered that the compensation/profit structure at Dodge & Cox includes a return on shareholder employees’ investment in the firm, which is vital for remaining independent and facilitating retention of management and investment professionals. The Board also considered that in January 2015, Dodge & Cox closed the International Stock Fund to new investors to proactively manage the growth of the Fund. The Stock Fund and Balanced Fund were similarly closed to new investors during periods of significant growth in the past. While these actions are intended to benefit existing Fund shareholders, the effect is to reduce potential revenues to Dodge & Cox from new shareholders.
The Board also considered potential “fall-out” benefits (including the receipt of research from unaffiliated brokers and reputational benefits to non-U.S. funds sponsored and managed by Dodge & Cox) that Dodge & Cox might receive as a result of its association with the Funds and determined that they are acceptable. The Board also noted that Dodge & Cox continues to invest substantial sums in its business in order to provide enhanced services, systems, and research capabilities, all of which benefit the Funds. The Board concluded that Dodge & Cox’s profitability is the keystone of its independence, stability, and long-term investment performance and that the profitability of Dodge & Cox’s relationship with the Funds (including fall-out benefits) is fair and reasonable.
ECONOMIES OF SCALE
The Board considered whether there have been economies of scale with respect to the management of each Fund, whether the Funds have appropriately benefited from any economies of scale, and whether the management fee rate is reasonable in relation to the level of Fund assets and any economies of scale that may exist. In the Board’s view, any consideration of economies of scale must take account of the Funds’ low fee and expense structure and the fact that the Dodge & Cox Funds build economies of scale into their fee structures by charging low fees from a fund’s inception and keeping overall expenses down as a Fund grows, as compared to other fund complexes that employ fee “breakpoints” only after a fund reaches a certain scale. An assessment of economies of scale must also take into account that Dodge & Cox invests significant time and resources in each new Fund for months (and sometimes years) prior to launch; in addition, in a Fund’s early periods of operations, expenses are capped, which means that Dodge & Cox subsidizes the operations of a new Fund for a period of time until it reaches scale. The Board also observed that, while total Fund assets have grown significantly over the long term, this growth has not been continuous or evenly distributed across all of the Funds (for example, the total assets of the Balanced Fund have actually declined over the past ten years). In addition, the Board noted that Dodge & Cox has shared the benefits of economies of scale with the Funds by adding and enhancing services to the Funds over time, and that Dodge & Cox’s internal costs of providing investment management, technology, administrative, legal, and compliance services to the Funds continue to increase. For example, Dodge & Cox has increased its global research staff and investment resources over the years to add important new capabilities for the benefit of Fund shareholders and to address the increased complexity of investing globally.
In addition, Dodge & Cox has made substantial expenditures in other staff, technology, and infrastructure to enable it to integrate credit and equity analyses and to implement its strategy in a more effective and secure manner. Over the last ten years, Dodge & Cox has increased its spending on research, investment management, client servicing, cybersecurity, technology, third party research, data services, and computer systems for trading, operations, compliance, accounting, and communications at a rate that has significantly outpaced the Funds’ growth rate during the same period. The Board also observed that, even without fee breakpoints, the Funds are competitively priced in a very competitive market and that having a low fee from inception is better for shareholders than starting with a higher fee and adding breakpoints. The Board also noted that there are certain diseconomies of scale associated with managing large funds, insofar as certain of the costs and risks associated with portfolio management increase disproportionately as assets grow. The Board concluded that the current Dodge & Cox fee structure is fair and reasonable and adequately shares economies of scale that may exist.
PAGE 20§ DODGE & COX GLOBAL STOCK FUND
CONCLUSION
Based on their evaluation of all material factors and assisted by the advice of independent legal counsel to the Independent Trustees, the Board, including the Independent Trustees, concluded that the advisory fee structure was fair and reasonable, that each Fund was paying a competitive fee for the services provided, that Dodge & Cox’s services have provided value for Fund shareholders over the long term, and that approval of the Agreements was in the best interests of each Fund and its shareholders.
DODGE & COX GLOBAL STOCK FUND§PAGE 21
FUND HOLDINGS
The Fund provides a complete list of its holdings four times each fiscal year, as of the end of each quarter. The Fund files the lists with the Securities and Exchange Commission (SEC) onForm N-CSR (second and fourth quarters) and Form N-Q (first and third quarters). Shareholders may view the Fund’sForms N-CSR andN-Q on the SEC’s website at sec.gov.Forms N-CSR and N-Q may also be reviewed and copied at the SEC’s Public Reference Room in Washington, DC. Information regarding the operations of the Public Reference Room may be obtained by calling800-SEC-0330. A list of the Fund’s quarter-end holdings is also available at dodgeandcox.com on or about 15 days following each quarter end and remains available on the website until the list is updated in the subsequent quarter.
PROXY VOTING
For a free copy of the Fund’s proxy voting policies and procedures, please call 800-621-3979, visit the Fund’s website at dodgeandcox.com, or visit the SEC’s website at sec.gov. Information regarding how the Fund voted proxies relating to portfolio securities during the most recent 12-month period ending June 30 is also available at dodgeandcox.com or at sec.gov.
HOUSEHOLD MAILINGS
The Fund routinely mails shareholder reports and summary prospectuses to shareholders and, on occasion, proxy statements. In order to reduce the volume of mail, when possible, only one copy of these documents will be sent to shareholders who are part of the same family and share the same residential address.
If you have a direct account with the Funds and you do not want the mailing of shareholder reports and summary prospectuses combined with other members in your household, contact the Funds at 800-621-3979. Your request will be implemented within 30 days.
PAGE 22§ DODGE & COX GLOBAL STOCK FUND
DODGE & COX FUNDS—EXECUTIVE OFFICER & TRUSTEE INFORMATION
| | | | | | |
| | | | |
Name (Age) and
Address* | | Position with Trust (Year of Election or
Appointment)** | | Principal Occupation During Past Five Years** | | Other Directorships of Public Companies Held
by Trustees |
| |
| INTERESTED TRUSTEES AND EXECUTIVE OFFICERS |
| Charles F. Pohl (60) | | Chairman and Trustee (since 2014) | | Chairman and Director of Dodge & Cox; Chief Investment Officer and member of U.S. Equity Investment Committee (USEIC), Global Equity Investment Committee (GEIC), and International Equity Investment Committee (IEIC) | | — |
| Dana M. Emery (57) | | President (since 2014) and Trustee (since 1993) | | Chief Executive Officer, President, and Director of Dodge & Cox;Co-Director of Fixed Income and member of U.S. Fixed Income Investment Committee (USFIIC) and Global Fixed Income Investment Committee (GFIIC) | | — |
| Diana S. Strandberg (59) | | Senior Vice President (since 2006) | | Senior Vice President and Director of Dodge & Cox; Director of International Equity and member of USEIC, GEIC, IEIC, and GFIIC | | — |
Roberta R.W. Kameda (58) | | Chief Legal Officer (since 2019) and Secretary (since 2017) | | Vice President, General Counsel, and Secretary (since 2017) of Dodge & Cox | | — |
| David H. Longhurst (61) | | Treasurer (since 2006) | | Vice President and Assistant Treasurer of Dodge & Cox | | — |
| Katherine M. Primas (44) | | Chief Compliance Officer (since 2010) | | Vice President and Chief Compliance Officer of Dodge & Cox | | — |
| |
| INDEPENDENT TRUSTEES |
| Caroline M. Hoxby (52) | | Trustee (since 2017) | | Professor of Economics, Stanford University; Director of the Economics of Education Program, National Bureau of Economic Research; Senior Fellow, Hoover Institution and Stanford Institute for Economic Policy Research | | — |
| Thomas A. Larsen (69) | | Trustee (since 2002) | | Senior Counsel of Arnold & Porter (law firm) (2013-2018); Partner of Arnold & Porter (until 2012); Director of Howard, Rice, Nemerovski, Canady, Falk & Rabkin (1977-2011) | | — |
| Ann Mather (58) | | Trustee (since 2011) | | CFO, Pixar Animation Studios (1999-2004) | | Director, Alphabet Inc. (internet information services) (since 2005); Director, Glu Mobile, Inc. (multimedia software) (since 2004); Director, Netflix, Inc. (internet television) (since 2010); Director, Arista Networks (cloud networking) (since 2013); Director, Shutterfly, Inc. (internet photography services/publishing) (since 2013) |
| Robert B. Morris III (66) | | Trustee (since 2011) | | Advisory Director, The Presidio Group (2005-2016); Partner and Managing Director—Global Investment Research at Goldman Sachs (until 2001) | | — |
| Gary Roughead (67) | | Trustee (since 2013) | | Robert and Marion Oster Distinguished Military Fellow, Hoover Institution (since 2012); Admiral, United States Navy (Ret.); U.S. Navy Chief of Naval Operations (2008-2011) | | Director, Northrop Grumman Corp. (global security) (since 2012); Director, Maersk Line, Limited (shipping and transportation) (since 2016) |
| Mark E. Smith (67) | | Trustee (since 2014) | | Executive Vice President, Managing Director—Fixed Income at Loomis Sayles & Company, L.P. (2003-2011) | | — |
| John B. Taylor (72) | | Trustee (since 2005) (and 1995-2001) | | Professor of Economics, Stanford University (since 1984); Senior Fellow, Hoover Institution (since 1996); Under Secretary for International Affairs, United States Treasury (2001-2005) | | — |
| * | | The address for each Officer and Trustee is 555 California Street, 40th Floor, San Francisco, California 94104. Each Officer and Trustee oversees all six series in the Dodge & Cox Funds complex and serves for an indefinite term. |
| ** | | Information as of February 14, 2019. |
Additional information about the Trust’s Trustees and Officers is available in the Trust’s Statement of Additional Information (SAI). You can get a free copy of the SAI by visiting the Funds’ website at dodgeandcox.com or calling
800-621-3979.
DODGE & COX GLOBAL STOCK FUND§PAGE 23
dodgeandcox.com
For Fund literature, transactions, and account information, please visit the Funds’ website.
or write or call:
DODGE & COX FUNDS
c/o DST Asset Manager Solutions, Inc.
P.O. Box 219502
Kansas City, Missouri 64121-9502
(800) 621-3979
INVESTMENT MANAGER
Dodge & Cox
555 California Street, 40th Floor
San Francisco, California 94104
(415) 981-1710
This report is submitted for the general information of the shareholders of the Fund. The report is not authorized for distribution to prospective investors in the Fund unless it is accompanied by a current prospectus.
This report reflects our views, opinions, and portfolio holdings as of December 31, 2018, the end of the reporting period. Any such views are subject to change at any time based upon market or other conditions and Dodge & Cox disclaims any responsibility to update such views. These views may not be relied on as investment advice and, because investment decisions for a Dodge & Cox Fund are based on numerous factors, may not be relied on as an indication of trading intent on behalf of any Dodge & Cox Fund.
DODGE & COX FUNDS®
Annual Report
December 31, 2018
International Stock Fund
ESTABLISHED 2001
TICKER: DODFX
(Closed to New Investors)
Important Notice:
Beginning on January 1, 2021, we intend to discontinue mailing paper copies of the Fund’s shareholder reports as permitted by new regulations adopted by the Securities and Exchange Commission, unless you specifically request paper copies from Dodge & Cox Funds or from your financial intermediary, such as a broker-dealer or bank. The reports will remain available to you on the Dodge & Cox Funds website (dodgeandcox.com), and you will be notified by mail each time a report is posted and provided with a link to access the report.
If you have already elected to receive shareholder reports electronically, you will not be affected by this change and do not need to take any action. If you have not done so already, you may elect to receive shareholder reports and other communications electronically by enrolling ine-delivery on the Funds website, or, if you are invested through a financial intermediary, by updating your mailing preferences through the intermediary.
If you wish to continue receiving paper copies of all future shareholder reports, please contact us at (800)621-3979. Reports will be provided to you free of charge. If you are invested through a financial intermediary, you may contact your financial intermediary to request to receive paper copies. Your election to receive reports in paper form will apply to all funds held with Dodge & Cox Funds or through your financial intermediary, as applicable.
12/18 ISF AR Printed on recycled paper
TO OUR SHAREHOLDERS
The Dodge & Cox International Stock Fund had a total return of –18.0% for the year ended December 31, 2018, compared to a return of –13.8% for the MSCI EAFE (Europe, Australasia, Far East) Index. As fellow shareholders, we are disappointed by the Fund’s recent results, though optimistic about the opportunities ahead.
MACRO CONCERNS BUFFETED INTERNATIONAL MARKETS IN 2018
Nearly every asset class—stocks, bonds, and commodities—posted negative returns for the year. International equities were no exception, with most markets suffering double-digit percentage losses. Markets were weighed down by concerns about slowing global economic growth/potential recession, trade wars, rising interest rates, and political uncertainty. Pessimism mounted during the fourth quarter, as market volatility rose and the MSCI EAFE declined by 13%. Less economically sensitive sectors, such as Utilities and Health Care, fared better than more economically sensitive areas, such as Financials and Consumer Discretionary.
WHAT’S PRICED INTO VALUATIONS?
No one ever knows exactly how the future is going to unfold. Although fear and uncertainty have dominated the headlines, our decades of experience have taught us to focus on valuations of individual companies relative to their fundamentals, rather than try to predict near-term market movements.
The MSCI EAFE’s forward price-to-earnings ratio stood at 11.9 times at year end,(a) or 20% lower than at the start of 2018. Over the past 30 years, the MSCI EAFE has traded at lower valuations only 25% of the time, including the global financial crisis (2007-08) and the European sovereign debt crisis (2009-12), both periods of severe economic stress. Put another way, this valuation starting point already incorporates significant pessimism about the future. When we look at fundamentals, however, many of the companies in the Fund are generating attractive levels of earnings and cash flows, returning capital to shareholders through dividends and buybacks, and strengthening their balance sheets. Should a downturn materialize—which is not a certain outcome by any measure—many companies are more resilient than they were in previous periods of economic stress.
The temptation during volatile periods is to step away from the market and wait to see how things turn out. However, this temptation often causes investors to miss significant opportunities. As we have done in previous periods of volatility, we have leaned into areas where we see opportunity. One such example is Itau Unibanco,(b) the leading independent bank in Brazil, which we addressed in our semi-annual letter. Its shares were down 32% in the second quarter (21% in local currency) due to a truck drivers’ strike that paralyzed Brazil and heightened concerns about economic growth. Moreover, the country was preparing for a contentious presidential election in October.
At the time, no one knew what would happen in Brazil. Despite the uncertainty, we thought Itau’s valuation was especially attractive. We have long admired management’s ability to consistently generate returns on equity exceeding 15% over decades and through volatile economic cycles. Those factors, combined with our long-term horizon, affirmed our decision to add to the Fund’s position in the second quarter. The stock subsequently rose 34% in
the second half of the year. To be sure, not everything works out that way, but this is an example of how focusing on what is priced in relative to long-term fundamentals helps set a course during uncertain times.
REVISITING HEALTHCARE AND FINANCIALS
In our semi-annual letter, we discussed the Health Care and Financials sectors, which are the Fund’s two largest overweight positions relative to the market. Below we provide an update on their performance and our longer-term outlook.
Health Care
Health Care was a relative bright spot as the Fund’s best-performing sector in 2018 (down 1%). Comprised primarily of European Pharmaceuticals, 18% of the Fund is invested in Health Care companies, compared to 11% of the MSCI EAFE.
When we last discussed these holdings, multiple factors drove our enthusiasm. Valuations were attractive and new drug approvals validated improving research productivity. Prodigious cash flow, largely insulated from economic swings, supported healthy dividends that provided a source of defensiveness. We thought Health Care was a better defensive alternative than Consumer Staples, where valuations were higher but growth prospects lower.
While we have trimmed several of the Fund’s holdings based on their relative outperformace, we remain optimistic about the Fund’s European Pharmaceuticals investments. The largest of these holdings is Sanofi, the world’s fifth-largest pharmaceutical company and a 3.7% position in the Fund at year end. The company’s portfolio is diversified with leading franchises in immunology, rare diseases, and vaccines. Its valuation is attractive at 13 times forward earnings, and we think the implied value of its research and development pipeline is the cheapest among large pharmaceutical companies. Sanofi has the potential to generate faster earnings growth in coming years, as the impact of patent expirations on some key drugs is being modulated with successful new drugs. In addition, management has ample room to cut costs and bring margins closer to the average of its peers.
Financials
In 2018, the Financials sector was the worst-performing sector of the MSCI EAFE (down 20%) and a major detractor from the Fund’s performance. Financials comprised 30% of the Fund at year end, with 22% invested in companies in developed markets and 8% in emerging markets. The Fund’s emerging market bank holdings outperformed the overall market, with strong returns from Itau Unibanco (up 14%) and ICICI Bank (up 5%). In contrast, the Fund’s 11 European and UK Financials holdings underperformed, down an average 31%.
Over the past few years, these European and UK banks and insurance companies have faced many challenges, including low growth and low interest rates, increasing capital requirements, and political uncertainty. When we discussed these holdings at the half-year mark, our enthusiasm was based on the combination of improving fundamentals and low valuations. Managements were cutting costs and restructuring businesses to increase returns. At that time, the Fund’s holdings traded at an average forward price-to-earnings ratio of nine times, low by historic standards. Since
PAGE 2§ DODGE & COX INTERNATIONAL STOCK FUND
then, valuations have declined further, and several companies are now close to 10-year valuation lows—levels that were last seen during the European sovereign debt crisis. Yet fundamentals continue to improve, as evidenced by rising earnings projections across our holdings through 2018.
We build the portfolio on a company-by-company basis, and we continue to revisit and retest each investment on its individual merits. Based on this work, we believe the Fund’s European Financials investments represent some of the best long-term opportunities available in the market today.
One example is UBS, the world’s largest private bank and wealth manager. At eight times forward earnings, the company’s stock trades at its lowest valuation since the European debt crisis, but UBS is in a much stronger financial position. It successfully overcame concerns about tax avoidance, restructured the investment banking division, and boosted capital levels to comply with more stringent regulatory requirements. All of its businesses generate a healthy return on equity, and the wealth management business appears well positioned to grow, especially in Asia. Looking forward, we believe the company will be able to return more capital to shareholders through dividends and buybacks. In addition, the CEO has been buying meaningful amounts of shares personally, further aligning management’s interests with those of shareholders. Based on these factors, we added to the Fund’s position, which stood at 2.8% at year end.
IN CLOSING
We are enthusiastic about the long-term outlook for the portfolio. Many of the companies in the Fund are trading at very low valuations. Relative to the range of potential outcomes, we believe that the overall risk/reward profile for these companies is quite compelling.
While 2018 proved to be a challenging year, our investment team has successfully navigated a number of difficult periods in the market together. Our investment approach requires persistence and patience as share prices and currencies can be volatile in the short term. We encourage shareholders to remain focused on the long term, and we thank you for your continued confidence in Dodge & Cox. As always, we welcome your comments and questions.
For the Board of Trustees,
| | |
| | |
Charles F. Pohl, Chairman | | Dana M. Emery, President |
January 31, 2019
| (a) | | Unless otherwise specified, all weightings and characteristics are as of December 31, 2018. |
| (b) | | The use of specific examples does not imply that they are more or less attractive investments than the portfolio’s other holdings. |
DODGE & COX INTERNATIONAL STOCK FUND§PAGE 3
2018 PERFORMANCE REVIEW
The Fund underperformed the MSCI EAFE by 4.2 percentage points in 2018.
Key Detractors from Relative Results
| | § | | In the Financials sector, the Fund’s average overweight position (30% versus 20% for the MSCI EAFE) significantly detracted from results. Banks in Europe and the United Kingdom hindered performance, including UniCredit (down 39%), Credit Suisse (down 38%), BNP Paribas (down 37%), Societe Generale (down 36%), UBS (down 30%), and Barclays (down 29%). | |
| | § | | Within the Communication Services sector, the Fund’s stock selection in the Media industry hurt results, especially Liberty Global (down 39%) and Grupo Televisa (down 32%). MTN Group (down 41%) and Baidu (down 32%) were additional detractors. | |
| | § | | The Fund’s significant underweight position in traditional defensive sectors (such as Consumer Staples, Real Estate, and Utilities) detracted from results. | |
| | § | | Additional detractors included Magnit (down 51%), JD.com (down 49%), Schlumberger (down 45%), Bayer (down 43%), Mitsubishi Electric (down 32%), and Samsung Electronics (down 25%). | |
Key Contributors to Relative Results
| | § | | The Fund’s emerging markets Financials holdings contributed to performance. Itau Unibanco (up 14%), ICICI Bank (up 5%), and Axis Bank (flat) performed well. | |
| | § | | In the Health Care sector, the Fund’s average overweight position (17% versus 10% for the MSCI EAFE) and holdings (down 1% versus down 4%) helped performance. AstraZeneca (up 12%), GlaxoSmithKline (up 12%), Novartis (up 3%), Sanofi (up 4%), and Roche (flat) performed well. | |
| | § | | In the Materials sector, Linde (up 5%) contributed to performance. | |
| | § | | Ericsson (up 35%) and Petrobras (up 25%) also outperformed. | |
KEY CHARACTERISTICS OF DODGE & COX
Independent Organization
Dodge & Cox is one of the largest privately owned investment managers in the world. We remain committed to independence, with a goal of providing the highest quality investment management service to our existing clients.
Over 85 Years of Investment Experience
Dodge & Cox was founded in 1930. We have a stable and well-qualified team of investment professionals, most of whom have spent their entire careers at Dodge & Cox.
Experienced Investment Team
The International Equity Investment Committee, which is the decision-making body for the International Stock Fund, is a nine-member committee with an average tenure at Dodge & Cox of 23 years.
One Business with a Single Research Office
Dodge & Cox manages equity (domestic, international, and global), fixed income (domestic and global), and balanced investments, operating from one office in San Francisco.
Consistent Investment Approach
Our team decision-making process involves thorough, bottom-up fundamental analysis of each investment.
Long-Term Focus and Low Expenses
We invest with a three- to five-year investment horizon, which has historically resulted in low turnover relative to our peers. We manage Funds that maintain low expense ratios.
Risks: The Fund is subject to market risk, meaning holdings in the Fund may decline in value for extended periods due to the financial prospects of individual companies, or due to general market and economic conditions. Investing in non-U.S. securities may entail risk due to foreign economic and political developments; this risk may be increased when investing in emerging markets. The Fund is also subject to currency risk. Please read the prospectus and summary prospectus for specific details regarding the Fund’s risk profile.
PAGE 4§ DODGE & COX INTERNATIONAL STOCK FUND
GROWTH OF $10,000 OVER 10 YEARS
FOR AN INVESTMENT MADE ON DECEMBER 31, 2008
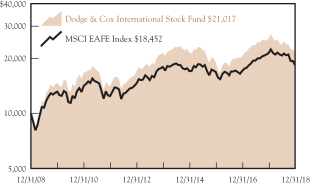
AVERAGE ANNUAL TOTAL RETURN
FOR PERIODS ENDED DECEMBER 31, 2018
| | | | | | | | | | | | | | | | |
| | | 1 Year | | | 3 Years | | | 5 Years | | | 10 Years | |
Dodge & Cox International
Stock Fund | | | –17.98 | % | | | 3.25 | % | | | –0.48 | % | | | 7.72 | % |
MSCI EAFE Index | | | –13.79 | | | | 2.87 | | | | 0.53 | | | | 6.32 | |
Returns represent past performance and do not guarantee future results. Investment return and share price will fluctuate with market conditions, and investors may have a gain or loss when shares are sold. Fund performance changes over time and currently may be significantly lower than stated. Performance is updated and published monthly. Visit the Fund’s website at dodgeandcox.com or call800-621-3979 for current performance figures.
The Fund’s total returns include the reinvestment of dividend and capital gain distributions, but have not been adjusted for any income taxes payable by shareholders on these distributions or on Fund share redemptions. Index returns include dividends but, unlike Fund returns, do not reflect fees or expenses. The MSCI EAFE (Europe, Australasia, Far East) Index is a broad-based, unmanaged equity market index aggregated from 21 developed market country indices, excluding the United States and Canada. MSCI makes no express or implied warranties or representations and shall have no liability whatsoever with respect to any MSCI data contained herein. The MSCI data may not be further redistributed or used as a basis for other indices or any securities or financial products. This report is not approved, reviewed, or produced by MSCI.
MSCI EAFE is a service mark of MSCI Barra.
FUND EXPENSE EXAMPLE
As a Fund shareholder, you incur ongoing Fund costs, including management fees and other Fund expenses. All mutual funds have ongoing costs, sometimes referred to as operating expenses. The following example shows ongoing costs of investing in the Fund and can help you understand these costs and compare them with those of other mutual funds. The example assumes a $1,000 investment held for the six months indicated.
ACTUAL EXPENSES
The first line of the table below provides information about actual account values and expenses based on the Fund’s actual returns. You may use the information in this line, together with your account balance, to estimate the expenses that you paid over the period. Simply divide your account value by $1,000 (for example, an $8,600 account value divided by $1,000 = 8.6), then multiply the result by the number in the first line under the heading “Expenses Paid During Period” to estimate the expenses you paid on your account during this period.
HYPOTHETICAL EXAMPLE FOR COMPARISON WITH OTHER MUTUAL FUNDS
Information on the second line of the table can help you compare ongoing costs of investing in the Fund with those of other mutual funds. This information may not be used to estimate the actual ending account balance or expenses you paid during the period. The hypothetical “Ending Account Value” is based on the actual expense ratio of the Fund and an assumed 5% annual rate of return before expenses (not the Fund’s actual return). The amount under the heading “Expenses Paid During Period” shows the hypothetical expenses your account would have incurred under this scenario. You can compare this figure with the 5% hypothetical examples that appear in shareholder reports of other mutual funds.
| | | | | | | | | | | | |
Six Months Ended
December 31, 2018 | | Beginning Account Value
7/1/2018 | | | Ending Account Value
12/31/2018 | | | Expenses Paid During Period* | |
Based on Actual Fund Return | | $ | 1,000.00 | | | $ | 883.30 | | | $ | 3.00 | |
Based on Hypothetical 5% Yearly Return | | | 1,000.00 | | | | 1,022.02 | | | | 3.22 | |
| * | | Expenses are equal to the Fund’s annualized expense ratio of 0.63%, multiplied by the average account value over the period, multiplied by 184/365 (to reflect theone-half year period). |
The expenses shown in the table highlight ongoing costs only and do not reflect any transactional fees or account maintenance fees. Though other mutual funds may charge such fees, please note that the Fund does not charge transaction fees (e.g., redemption fees, sales loads) or universal account maintenance fees (e.g., small account fees).
DODGE & COX INTERNATIONAL STOCK FUND§PAGE 5
| | | | |
| FUND INFORMATION (unaudited) | | | December 31, 2018 | |
| | | | |
| GENERAL INFORMATION | | | |
Net Asset Value Per Share | | | $36.91 | |
Total Net Assets (billions) | | | $48.1 | |
Expense Ratio | | | 0.63% | |
Portfolio Turnover Rate | | | 17% | |
30-Day SEC Yield(a) | | | 2.45% | |
Active Share(b) | | | 87% | |
Number of Companies | | | 69 | |
Fund Inception | | | 2001 | |
No sales charges or distribution fees | | | | |
Investment Manager: Dodge & Cox, San Francisco. Managed by the International Equity Investment Committee, whose nine members’ average tenure at Dodge & Cox is 23 years.
| | | | | | | | |
| PORTFOLIO CHARACTERISTICS | | Fund | | | MSCI
EAFE | |
Median Market Capitalization (billions) | | | $29 | | | | $9 | |
Weighted Average Market Capitalization (billions) | | | $69 | | | | $53 | |
Price-to-Earnings Ratio(c) | | | 10.3x | | | | 11.9x | |
Countries Represented | | | 24 | | | | 21 | |
Emerging Markets (Brazil, China, India, Mexico, Russia, South Africa, South Korea, Thailand, Turkey, United Arab Emirates) | | | 25.0% | | | | 0.0% | |
| | | | |
| TEN LARGEST HOLDINGS (%)(d) | | Fund | |
Sanofi(France) | | | 3.7 | |
Samsung Electronics Co., Ltd.(South Korea) | | | 3.6 | |
Novartis AG(Switzerland) | | | 3.5 | |
Roche Holding AG (Switzerland) | | | 3.2 | |
ICICI Bank, Ltd.(India) | | | 3.1 | |
Itau Unibanco Holding SA (Brazil) | | | 3.0 | |
Naspers, Ltd.(South Africa) | | | 2.9 | |
UBS Group AG(Switzerland) | | | 2.8 | |
AstraZeneca PLC(United Kingdom) | | | 2.4 | |
Bayer AG(Germany) | | | 2.4 | |
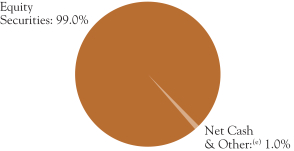
| | | | | | | | |
| REGION DIVERSIFICATION (%)(f) | | Fund | | | MSCI
EAFE | |
Europe (excluding United Kingdom) | | | 39.3 | | | | 45.5 | |
United Kingdom | | | 15.4 | | | | 16.9 | |
Pacific (excluding Japan) | | | 12.8 | | | | 12.4 | |
Japan | | | 8.7 | | | | 24.6 | |
United States | | | 8.3 | | | | 0.0 | |
Latin America | | | 7.3 | | | | 0.0 | |
Africa | | | 4.5 | | | | 0.0 | |
Canada | | | 2.4 | | | | 0.0 | |
Middle East | | | 0.3 | | | | 0.6 | |
| | | | | | | | |
| SECTOR DIVERSIFICATION (%) | | Fund | | | MSCI
EAFE | |
Financials | | | 29.8 | | | | 19.5 | |
Health Care | | | 17.5 | | | | 11.2 | |
Communication Services | | | 11.7 | | | | 5.5 | |
Information Technology | | | 9.6 | | | | 6.0 | |
Industrials | | | 7.9 | | | | 14.3 | |
Energy | | | 7.0 | | | | 5.9 | |
Consumer Discretionary | | | 6.6 | | | | 11.2 | |
Materials | | | 5.9 | | | | 7.4 | |
Utilities | | | 1.7 | | | | 3.7 | |
Consumer Staples | | | 0.7 | | | | 11.6 | |
Real Estate | | | 0.6 | | | | 3.7 | |
| (a) | SEC Yield is an annualization of the Fund’s net investment income for the trailing30-day period. Dividends paid by the Fund may be higher or lower than implied by the SEC Yield. |
| (b) | Active share is a measure of how much an investment portfolio differs from its benchmark index, based on a scale of 0% (complete overlap with the index) to 100% (no overlap). Overlap for each security in the Fund is the lower of either its percentage weight in the Fund or its percentage weight in the relevant index. The International Stock Fund’s total overlap with the MSCI EAFE is the sum of each security’s calculated overlap. |
| (c) | Price-to-earnings (P/E) ratios are calculated using12-month forward earnings estimates from third-party sources. |
| (d) | The Fund’s portfolio holdings are subject to change without notice. The mention of specific securities is not a recommendation to buy, sell, or hold any particular security and is not indicative of Dodge & Cox’s current or future trading activity. |
| (e) | Net Cash & Other includes cash, short-term investments, derivatives, receivables, and payables. |
| (f) | The Fund may classify a company in a different category than the MSCI EAFE. The Fund generally classifies a company based on its country of incorporation, but may designate a different country in certain circumstances. |
PAGE 6§ DODGE & COX INTERNATIONAL STOCK FUND
| | | | |
| CONSOLIDATED PORTFOLIO OF INVESTMENTS | | | December 31, 2018 | |
| | | | | | | | |
| COMMON STOCKS: 92.0% | |
| | |
| | | SHARES | | | VALUE | |
| COMMUNICATION SERVICES: 11.0% | |
MEDIA & ENTERTAINMENT: 8.7% | |
Altice Europe NV, Series A(a) (Netherlands) | | | 37,585,877 | | | $ | 72,565,606 | |
Altice USA, Inc., Class A(a) (United States) | | | 19,976,925 | | | | 330,018,801 | |
Baidu, Inc. ADR(a) (Cayman Islands/China) | | | 3,997,187 | | | | 633,953,858 | |
Grupo Televisa SAB ADR (Mexico) | | | 44,032,780 | | | | 553,932,372 | |
Liberty Global PLC, Series A(a)(b) (United Kingdom) | | | 18,753,503 | | | | 400,199,754 | |
Liberty Global PLC, Series C(a) (United Kingdom) | | | 34,615,554 | | | | 714,465,035 | |
Liberty Latin America Ltd, Series A(a)(b) (Bermuda/United Kingdom) | | | 419,068 | | | | 6,068,105 | |
Naspers, Ltd. (South Africa) | | | 7,133,795 | | | | 1,417,038,381 | |
Television Broadcasts, Ltd.(b) (Hong Kong) | | | 39,842,700 | | | | 75,136,916 | |
| | | | | | | | |
| | | | 4,203,378,828 | |
TELECOMMUNICATION SERVICES: 2.3% | |
America Movil SAB de CV, Series L (Mexico) | | | 411,702,800 | | | | 293,089,530 | |
Millicom International Cellular SA SDR(b) (Luxembourg) | | | 6,764,405 | | | | 429,239,963 | |
MTN Group, Ltd.(b) (South Africa) | | | 61,950,680 | | | | 383,517,742 | |
| | | | | | | | |
| | | | 1,105,847,235 | |
| | | | | | | | |
| | | | 5,309,226,063 | |
| CONSUMER DISCRETIONARY: 6.6% | |
AUTOMOBILES & COMPONENTS: 3.6% | |
Bayerische Motoren Werke AG (Germany) | | | 8,459,001 | | | | 685,069,834 | |
Honda Motor Co., Ltd. (Japan) | | | 28,773,055 | | | | 751,873,058 | |
Yamaha Motor Co., Ltd. (Japan) | | | 14,753,100 | | | | 287,130,422 | |
| | | | | | | | |
| | | | 1,724,073,314 | |
RETAILING: 3.0% | |
Alibaba Group Holding, Ltd. ADR(a) (Cayman Islands/China) | | | 2,431,400 | | | | 333,271,998 | |
Booking Holdings, Inc.(a) (United States) | | | 266,600 | | | | 459,197,172 | |
JD.com, Inc. ADR(a) (Cayman Islands/China) | | | 31,345,848 | | | | 656,068,599 | |
| | | | | | | | |
| | | | 1,448,537,769 | |
| | | | | | | | |
| | | | 3,172,611,083 | |
| CONSUMER STAPLES: 0.7% | |
FOOD & STAPLES RETAILING: 0.7% | |
Magnit PJSC(b) (Russia) | | | 6,445,340 | | | | 325,342,817 | |
|
| ENERGY: 5.4% | |
Equinor ASA (Norway) | | | 26,021,504 | | | | 554,939,783 | |
Schlumberger, Ltd. (Curacao/United States) | | | 16,617,224 | | | | 599,549,442 | |
Suncor Energy, Inc. (Canada) | | | 27,632,700 | | | | 772,886,619 | |
Total SA (France) | | | 12,681,549 | | | | 669,941,118 | |
Weatherford International PLC(a) (Ireland/United States) | | | 34,997,592 | | | | 19,563,654 | |
| | | | | | | | |
| | | | 2,616,880,616 | |
| FINANCIALS: 26.8% | |
BANKS: 19.8% | |
Axis Bank, Ltd.(a) (India) | | | 62,352,425 | | | | 554,706,970 | |
Banco Santander SA (Spain) | | | 221,454,320 | | | | 999,388,386 | |
Barclays PLC (United Kingdom) | | | 535,660,998 | | | | 1,027,516,539 | |
BNP Paribas SA (France) | | | 23,641,858 | | | | 1,064,786,523 | |
ICICI Bank, Ltd.(b) (India) | | | 291,281,487 | | | | 1,507,885,425 | |
KasikornbankPCL- Foreign(b) (Thailand) | | | 66,108,227 | | | | 375,127,936 | |
Lloyds Banking Group PLC (United Kingdom) | | | 1,017,285,600 | | | | 672,197,367 | |
Mitsubishi UFJ Financial Group, Inc. (Japan) | | | 123,883,400 | | | | 610,886,407 | |
| | | | | | | | |
| | |
| | | SHARES | | | VALUE | |
Societe Generale SA (France) | | | 27,510,442 | | | $ | 873,427,527 | |
Standard Chartered PLC (United Kingdom) | | | 113,089,413 | | | | 874,144,291 | |
UniCredit SPA (Italy) | | | 85,589,562 | | | | 970,921,607 | |
| | | | | | | | |
| | | | 9,530,988,978 | |
DIVERSIFIED FINANCIALS: 4.4% | |
Credit Suisse Group AG (Switzerland) | | | 66,001,808 | | | | 727,349,325 | |
Haci Omer Sabanci Holding AS (Turkey) | | | 47,323,154 | | | | 67,099,314 | |
UBS Group AG (Switzerland) | | | 106,645,927 | | | | 1,331,256,908 | |
| | | | | | | | |
| | | | 2,125,705,547 | |
INSURANCE: 2.6% | |
AEGON NV(b) (Netherlands) | | | 114,920,818 | | | | 534,236,815 | |
Aviva PLC (United Kingdom) | | | 142,336,627 | | | | 678,866,937 | |
| | | | | | | | |
| | | | 1,213,103,752 | |
| | | | | | | | |
| | | | 12,869,798,277 | |
| HEALTH CARE: 17.5% | |
PHARMACEUTICALS, BIOTECHNOLOGY & LIFE SCIENCES: 17.5% | |
AstraZeneca PLC (United Kingdom) | | | 15,463,200 | | | | 1,156,422,456 | |
Bayer AG (Germany) | | | 16,286,450 | | | | 1,129,321,198 | |
GlaxoSmithKline PLC (United Kingdom) | | | 59,301,200 | | | | 1,125,516,081 | |
Novartis AG (Switzerland) | | | 12,279,770 | | | | 1,051,742,398 | |
Novartis AG ADR (Switzerland) | | | 7,504,800 | | | | 643,986,888 | |
Roche Holding AG (Switzerland) | | | 6,160,100 | | | | 1,523,234,062 | |
Sanofi (France) | | | 20,664,022 | | | | 1,785,764,841 | |
| | | | | | | | |
| | | | 8,415,987,924 | |
| INDUSTRIALS: 7.9% | |
CAPITAL GOODS: 7.6% | |
Johnson Controls International PLC (Ireland/United States) | | | 34,576,401 | | | | 1,025,190,290 | |
Mitsubishi Electric Corp. (Japan) | | | 93,491,200 | | | | 1,024,935,278 | |
Nidec Corp. (Japan) | | | 3,640,400 | | | | 417,207,083 | |
Schneider Electric SA (France) | | | 12,114,246 | | | | 824,459,308 | |
Smiths Group PLC(b) (United Kingdom) | | | 21,485,581 | | | | 371,995,712 | |
| | | | | | | | |
| | | | 3,663,787,671 | |
TRANSPORTATION: 0.3% | |
DP World, Ltd. (United Arab Emirates) | | | 8,256,304 | | | | 141,166,698 | |
| | | | | | | | |
| | | | 3,804,954,369 | |
| INFORMATION TECHNOLOGY: 7.9% | |
SOFTWARE & SERVICES: 1.4% | |
Fujitsu, Ltd. (Japan) | | | 4,030,650 | | | | 252,684,657 | |
Micro Focus International PLC(b) (United Kingdom) | | | 22,922,596 | | | | 400,640,762 | |
| | | | | | | | |
| | | | 653,325,419 | |
TECHNOLOGY, HARDWARE & EQUIPMENT: 6.5% | |
Brother Industries, Ltd. (Japan) | | | 9,724,000 | | | | 142,731,650 | |
Hewlett Packard Enterprise Co. (United States) | | | 32,204,847 | | | | 425,426,029 | |
Kyocera Corp. (Japan) | | | 13,881,500 | | | | 690,314,383 | |
Samsung Electronics Co., Ltd. (South Korea) | | | 26,562,150 | | | | 919,068,235 | |
TE Connectivity, Ltd. (Switzerland) | | | 7,803,846 | | | | 590,204,873 | |
Telefonaktiebolaget LM Ericsson (Sweden) | | | 43,044,300 | | | | 379,392,609 | |
| | | | | | | | |
| | | | 3,147,137,779 | |
| | | | | | | | |
| | | | 3,800,463,198 | |
| MATERIALS: 5.9% | |
Akzo Nobel NV (Netherlands) | | | 4,989,099 | | | | 401,036,636 | |
Cemex SAB de CV ADR (Mexico) | | | 101,337,026 | | | | 488,444,465 | |
LafargeHolcim, Ltd. (Switzerland) | | | 11,233,983 | | | | 464,213,311 | |
Linde PLC (Ireland/United States) | | | 6,961,570 | | | | 1,105,406,493 | |
Nutrien, Ltd. (Canada) | | | 8,063,453 | | | | 378,982,291 | |
| | | | | | | | |
| | | | 2,838,083,196 | |
| REAL ESTATE: 0.6% | |
Hang Lung Group, Ltd.(b) (Hong Kong) | | | 110,219,400 | | | | 280,023,530 | |
| | |
| See accompanying Notes to Consolidated Financial Statements | | DODGE & COX INTERNATIONAL STOCK FUND§PAGE 7 |
| | | | |
| CONSOLIDATED PORTFOLIO OF INVESTMENTS | | | December 31, 2018 | |
| | | | | | | | |
| COMMON STOCKS (continued) | |
| | |
| | | SHARES | | | VALUE | |
|
| UTILITIES: 1.7% | |
Engie (France) | | | 56,998,700 | | | $ | 814,633,194 | |
| | | | | | | | |
TOTAL COMMON STOCKS
(Cost $49,376,807,355) | | | $ | 44,248,004,267 | |
|
| PREFERRED STOCKS: 6.3% | |
| ENERGY: 1.6% | |
Petroleo Brasileiro SA (Brazil) | | | 132,036,900 | | | | 766,547,253 | |
|
| FINANCIALS: 3.0% | |
BANKS: 3.0% | |
Itau Unibanco Holding SA (Brazil) | | | 155,177,152 | | | | 1,428,119,138 | |
|
| INFORMATION TECHNOLOGY: 1.7% | |
TECHNOLOGY, HARDWARE & EQUIPMENT: 1.7% | |
Samsung Electronics Co., Ltd. (South Korea) | | | 28,739,700 | | | | 819,800,078 | |
| | | | | | | | |
TOTAL PREFERRED STOCKS
(Cost $2,071,501,946) | | | $ | 3,014,466,469 | |
|
| EQUITY-LINKED NOTE: 0.7% | |
| COMMUNICATION SERVICES: 0.7% | |
MEDIA & ENTERTAINMENT: 0.7% | |
Naspers, Ltd. excluding Tencent Holdings, Ltd. 5/30/19(a)(d) (South Africa) | | | 1,300,000 | | | | 357,539,000 | |
| | | | | | | | |
TOTAL EQUITY-LINKED NOTE
(Cost $336,982,360) | | | $ | 357,539,000 | |
| | | | | | | | |
| SHORT-TERM INVESTMENTS: 0.5% | |
| | |
| | | PAR VALUE/ SHARES | | | VALUE | |
REPURCHASE AGREEMENT: 0.1% | |
Fixed Income Clearing Corporation(c)
1.60%, dated 12/31/18, due 1/2/19, maturity value $53,478,753 | | $ | 53,474,000 | | | $ | 53,474,000 | |
|
MONEY MARKET FUND: 0.4% | |
State Street Institutional U.S. Government Money Market Fund | | | 193,121,771 | | | | 193,121,771 | |
| | | | | | | | |
TOTAL SHORT-TERM INVESTMENTS
(Cost $246,595,771) | | | $ | 246,595,771 | |
| | | | | | | | |
TOTAL INVESTMENTS IN SECURITIES
(Cost $52,031,887,432) | | | 99.5 | % | | $ | 47,866,605,507 | |
OTHER ASSETS LESS LIABILITIES | | | 0.5 | % | | | 240,901,154 | |
| | | | | | | | |
| NET ASSETS | | | 100.0 | % | | $ | 48,107,506,661 | |
| | | | | | | | |
| (b) | See Note 10 regarding holdings of 5% voting securities |
| (c) | Repurchase agreement is collateralized by U.S. Treasury Note 2.625%, 8/15/20. Total collateral value is $54,545,266. |
| (d) | Equity-linked note issued by JPMorgan Chase Bank, N.A. The note is designed to provide exposure to Naspers, Ltd. excluding the effect of Naspers, Ltd.’s investment in Tencent Holdings, Ltd. The note is exempt from registration under Rule 144A of the Securities Act of 1933. The note may be resold in transactions exempt from registration, normally to qualified institutional buyers. |
In determining a company’s country designation, the Fund generally references the country of incorporation. In cases where the Fund considers the country of incorporation to be a “jurisdiction of convenience” chosen primarily for tax purposes or in other limited circumstances, the Fund uses the country designation of an appropriate broad-based market index. In those cases, two countries are listed - the country of incorporation and the country designated by an appropriate index, respectively.
ADR: American Depositary Receipt
SDR: Swedish Depository Receipt
| | |
| PAGE 8§ DODGE & COX INTERNATIONAL STOCK FUND | | See accompanying Notes to Consolidated Financial Statements |
| | | | |
| CONSOLIDATED PORTFOLIO OF INVESTMENTS | | | December 31, 2018 | |
FUTURES CONTRACTS
| | | | | | | | | | | | | | | | |
| Description | | Number of
Contracts | | | Expiration
Date | | | Notional
Amount | | | Value /
Unrealized
Appreciation
(Depreciation) | |
Euro Stoxx 50 Index—Long Position | | | 8,337 | | | | 3/15/19 | | | $ | 284,079,900 | | | $ | (6,004,788 | ) |
Yen Denominated Nikkei 225 Index—Long Position | | | 1,599 | | | | 3/7/19 | | | | 144,538,046 | | | | (10,054,811 | ) |
| | | | | | | | | | | | | | | | |
| | | | | | | | | | | | | | $ | (16,059,599 | ) |
| | | | | |
CURRENCY FORWARD CONTRACTS
| | | | | | | | | | | | | | | | |
| | | | Contract Amount | | | | |
| Counterparty | | Settle Date | | | Receive
U.S. Dollar | | | Deliver
Foreign
Currency | | | Unrealized
Appreciation
(Depreciation) | |
Contracts to sell CHF: | |
Barclays | | | 1/30/19 | | | | 350,780,328 | | | | 346,250,000 | | | $ | (2,349,975 | ) |
Morgan Stanley | | | 1/30/19 | | | | 350,666,646 | | | | 346,250,000 | | | | (2,463,656 | ) |
UBS | | | 2/6/19 | | | | 577,576,569 | | | | 575,000,000 | | | | (9,232,545 | ) |
Goldman Sachs | | | 2/27/19 | | | | 141,531,369 | | | | 140,000,000 | | | | (1,626,593 | ) |
HSBC | | | 2/27/19 | | | | 315,111,102 | | | | 310,000,000 | | | | (1,881,529 | ) |
Contracts to sell CNH: | |
Credit Suisse | | | 1/9/19 | | | | 139,332,844 | | | | 921,686,760 | | | | 5,133,512 | |
HSBC | | | 1/9/19 | | | | 23,171,000 | | | | 153,614,460 | | | | 804,445 | |
HSBC | | | 1/9/19 | | | | 69,495,179 | | | | 460,843,380 | | | | 2,395,513 | |
HSBC | | | 1/9/19 | | | | 69,512,999 | | | | 460,843,380 | | | | 2,413,334 | |
HSBC | | | 1/9/19 | | | | 23,165,060 | | | | 153,614,460 | | | | 798,504 | |
JPMorgan | | | 1/16/19 | | | | 281,062,458 | | | | 1,833,454,733 | | | | 14,116,118 | |
JPMorgan | | | 1/16/19 | | | | 188,813,770 | | | | 1,231,688,867 | | | | 9,483,008 | |
Citibank | | | 1/30/19 | | | | 27,943,631 | | | | 180,387,314 | | | | 1,681,946 | |
Citibank | | | 1/30/19 | | | | 170,432,841 | | | | 1,100,655,288 | | | | 10,193,952 | |
Citibank | | | 1/30/19 | | | | 167,956,687 | | | | 1,084,227,597 | | | | 10,109,423 | |
Citibank | | | 1/30/19 | | | | 28,355,599 | | | | 183,120,456 | | | | 1,696,009 | |
HSBC | | | 1/30/19 | | | | 169,645,335 | | | | 1,095,179,391 | | | | 10,203,655 | |
HSBC | | | 1/30/19 | | | | 28,224,578 | | | | 182,209,409 | | | | 1,697,623 | |
UBS | | | 1/30/19 | | | | 28,349,014 | | | | 183,120,457 | | | | 1,689,424 | |
UBS | | | 1/30/19 | | | | 170,393,264 | | | | 1,100,655,288 | | | | 10,154,375 | |
Citibank | | | 2/13/19 | | | | 163,165,092 | | | | 1,050,000,000 | | | | 10,309,675 | |
Credit Suisse | | | 2/13/19 | | | | 163,081,463 | | | | 1,050,000,000 | | | | 10,226,046 | |
JPMorgan | | | 7/31/19 | | | | 372,709,137 | | | | 2,559,766,351 | | | | 140,839 | |
Citibank | | | 8/7/19 | | | | 179,693,317 | | | | 1,241,950,358 | | | | (1,068,702 | ) |
Citibank | | | 8/7/19 | | | | 180,254,043 | | | | 1,241,950,357 | | | | (507,975 | ) |
HSBC | | | 8/7/19 | | | | 177,930,391 | | | | 1,223,413,785 | | | | (133,686 | ) |
Barclays | | | 8/28/19 | | | | 103,453,300 | | | | 710,000,000 | | | | 116,880 | |
Citibank | | | 8/28/19 | | | | 73,226,178 | | | | 502,500,000 | | | | 90,190 | |
Goldman Sachs | | | 8/28/19 | | | | 73,192,047 | | | | 502,500,000 | | | | 56,060 | |
JPMorgan | | | 8/28/19 | | | | 72,104,880 | | | | 495,000,000 | | | | 60,474 | |
Goldman Sachs | | | 9/25/19 | | | | 83,899,357 | | | | 583,713,000 | | | | (1,054,660 | ) |
Barclays | | | 12/4/19 | | | | 46,081,464 | | | | 321,750,000 | | | | (742,637 | ) |
Barclays | | | 12/4/19 | | | | 46,772,969 | | | | 326,625,000 | | | | (760,587 | ) |
JPMorgan | | | 12/4/19 | | | | 46,797,765 | | | | 326,625,000 | | | | (735,792 | ) |
UBS | | | 12/4/19 | | | | 46,441,841 | | | | 325,000,000 | | | | (855,231 | ) |
Citibank | | | 12/18/19 | | | | 117,305,527 | | | | 813,654,596 | | | | (1,103,261 | ) |
| | | | | | | | | | | | | | | | |
| | | | Contract Amount | | | | |
| Counterparty | | Settle Date | | | Deliver
U.S. Dollar | | | Receive
Foreign
Currency | | | Unrealized
Appreciation
(Depreciation) | |
Contracts to buy CHF: | |
Morgan Stanley | | | 1/30/19 | | | | 152,761,294 | | | | 151,113,000 | | | $ | 1,354,459 | |
Contracts to buy CNH: | |
Barclays | | | 1/9/19 | | | | 89,516,872 | | | | 614,801,880 | | | | (558 | ) |
Citibank | | | 1/9/19 | | | | 90,873,189 | | | | 624,117,060 | | | | (567 | ) |
Credit Suisse | | | 1/9/19 | | | | 90,800,474 | | | | 624,117,060 | | | | 72,147 | |
Goldman Sachs | | | 1/16/19 | | | | 78,849,469 | | | | 500,000,250 | | | | (6,050,705 | ) |
Goldman Sachs | | | 1/16/19 | | | | 78,802,246 | | | | 500,000,250 | | | | (6,003,483 | ) |
Goldman Sachs | | | 1/16/19 | | | | 78,876,716 | | | | 499,999,500 | | | | (6,078,062 | ) |
| | | | | | | | | | | | | | | | |
Unrealized gain on currency forward contracts | | | | 104,997,611 | |
Unrealized loss on currency forward contracts | | | | (42,650,204 | ) |
| | | | | | | | | | | | | | | | |
Net unrealized gain on currency forward contracts | | | $ | 62,347,407 | |
| | | | | |
The listed counterparty may be the parent company or one of its subsidiaries.
CHF: Swiss Franc
CNH: Chinese Yuan Renminbi
| | |
| See accompanying Notes to Consolidated Financial Statements | | DODGE & COX INTERNATIONAL STOCK FUND§PAGE 9 |
| | | | |
CONSOLIDATED STATEMENT OF ASSETS AND LIABILITIES | |
| |
| | | December 31, 2018 | |
ASSETS: | | | | |
Investments in securities, at value | | | | |
Unaffiliated issuers (cost $48,362,880,713) | | $ | 45,584,026,053 | |
Affiliated issuers (cost $3,669,006,719) | | | 2,282,579,454 | |
| | | | |
| | | 47,866,605,507 | |
Unrealized appreciation on currency forward contracts | | | 104,997,611 | |
Cash pledged as collateral for currency forward contracts | | | 23,520,000 | |
Cash | | | 100 | |
Cash denominated in foreign currency (cost $16,134,175) | | | 16,134,204 | |
Deposits with broker for futures contracts | | | 28,273,863 | |
Receivable for variation margin for futures contracts | | | 1,610,946 | |
Receivable for investments sold | | | 250,494,158 | |
Receivable for Fund shares sold | | | 62,262,107 | |
Dividends and interest receivable | | | 137,526,195 | |
Prepaid expenses and other assets | | | 233,127 | |
| | | | |
| | | 48,491,657,818 | |
| | | | |
LIABILITIES: | | | | |
Unrealized depreciation on currency forward contracts | | | 42,650,204 | |
Cash received as collateral for currency forward contracts | | | 96,140,000 | |
Payable for Fund shares redeemed | | | 197,132,944 | |
Deferred foreign capital gains tax | | | 20,053,023 | |
Management fees payable | | | 25,493,486 | |
Accrued expenses | | | 2,681,500 | |
| | | | |
| | | 384,151,157 | |
| | | | |
NET ASSETS | | $ | 48,107,506,661 | |
| | | | |
NET ASSETS CONSIST OF: | | | | |
Paid in capital | | $ | 54,258,694,214 | |
Total accumulated loss | | | (6,151,187,553 | ) |
| | | | |
| | $ | 48,107,506,661 | |
| | | | |
Fund shares outstanding (par value $0.01 each, unlimited shares authorized) | | | 1,303,277,574 | |
Net asset value per share | | $ | 36.91 | |
| |
CONSOLIDATED STATEMENT OF OPERATIONS | | | | |
| |
| | | Year Ended
December 31, 2018 | |
INVESTMENT INCOME: | | | | |
Dividends (net of foreign taxes of $164,336,469) | | | | |
Unaffiliated issuers | | $ | 1,495,479,535 | |
Affiliated issuers | | | 192,734,187 | |
Interest | | | 9,483,052 | |
| | | | |
| | | 1,697,696,774 | |
| | | | |
EXPENSES: | | | | |
Management fees | | | 364,370,853 | |
Custody and fund accounting fees | | | 7,646,055 | |
Transfer agent fees | | | 5,422,433 | |
Professional services | | | 297,654 | |
Shareholder reports | | | 1,580,950 | |
Registration fees | | | 268,131 | |
Trustees’ fees | | | 324,167 | |
ADR depositary service fees | | | 1,664,222 | |
Miscellaneous | | | 1,167,414 | |
| | | | |
| | | 382,741,879 | |
| | | | |
NET INVESTMENT INCOME | | | 1,314,954,895 | |
| | | | |
REALIZED AND UNREALIZED GAIN (LOSS): | | | | |
Net realized loss | |
Investments in securities of unaffiliated issuers | | | 1,482,772,588 | |
Investments in securities of affiliated issuers
(net of foreign taxes of $1,331,234) | | | (1,357,968,848 | ) |
Futures contracts | | | (85,152,438 | ) |
Currency forward contracts | | | (220,308,118 | ) |
Foreign currency transactions | | | (8,785,231 | ) |
Net change in unrealized appreciation/depreciation | |
Investments in securities of unaffiliated issuers | | | (12,121,274,124 | ) |
Investments in securities of affiliated issuers (net of decrease in deferred foreign capital gains tax of $12,825,586) | | | (606,278,493 | ) |
Futures contracts | | | (14,113,925 | ) |
Currency forward contracts | | | 365,626,648 | |
Foreign currency translation | | | (2,488,898 | ) |
| | | | |
Net realized and unrealized loss | | | (12,567,970,839 | ) |
| | | | |
NET CHANGE IN NET ASSETS
FROM OPERATIONS | | $ | (11,253,015,944 | ) |
| | | | |
| | | | | | | | |
CONSOLIDATED STATEMENT OF CHANGES IN NET ASSETS | |
| | |
| | | Year Ended
December 31, 2018 | | | Year Ended
December 31, 2017 | |
OPERATIONS: | | | | | |
Net investment income | | $ | 1,314,954,895 | | | $ | 968,379,628 | |
Net realized gain (loss) | | | (189,442,047 | ) | | | (371,445,449 | ) |
Net change in unrealized appreciation/depreciation | | | (12,378,528,792 | ) | | | 12,279,943,481 | |
| | | | | | | | |
| | | (11,253,015,944 | ) | | | 12,876,877,660 | |
| | | | | | | | |
| | |
DISTRIBUTIONS TO SHAREHOLDERS: | | | | | | | | |
Total distributions | | | (1,392,029,880 | ) | | | (1,246,064,935 | )(a) |
| | |
FUND SHARE TRANSACTIONS: | | | | | | | | |
Proceeds from sale of shares | | | 7,786,364,752 | | | | 8,048,181,192 | |
Reinvestment of distributions | | | 1,194,160,091 | | | | 1,054,276,376 | |
Cost of shares redeemed | | | (13,898,235,680 | ) | | | (9,249,656,015 | ) |
| | | | | | | | |
Net change from Fund share transactions | | | (4,917,710,837 | ) | | | (147,198,447 | ) |
| | | | | | | | |
Total change in net assets | | | (17,562,756,661 | ) | | | 11,483,614,278 | |
| | |
NET ASSETS: | | | | | | | | |
Beginning of year | | | 65,670,263,322 | | | | 54,186,649,044 | |
| | | | | | | | |
End of year | | $ | 48,107,506,661 | | | $ | 65,670,263,322 | (b) |
| | | | | | | | |
| | |
SHARE INFORMATION: | | | | | | | | |
Shares sold | | | 177,112,322 | | | | 184,640,901 | |
Distributions reinvested | | | 32,344,484 | | | | 23,034,217 | |
Shares redeemed | | | (323,973,781 | ) | | | (212,133,063 | ) |
| | | | | | | | |
Net change in shares outstanding | | | (114,516,975 | ) | | | (4,457,945 | ) |
| | | | | | | | |
| (a) | Prior year comparative amounts have been adjusted to reflect current presentation under new accounting standards. Prior year distributions consisted of $1,246,064,935 from net investment income. |
| (b) | Includes distributions in excess of net investment income of $291,728,937. |
| | |
| PAGE 10§ DODGE & COX INTERNATIONAL STOCK FUND | | See accompanying Notes to Consolidated Financial Statements |
NOTES TO CONSOLIDATED FINANCIAL STATEMENTS
NOTE 1—ORGANIZATION AND SIGNIFICANT ACCOUNTING POLICIES
Dodge & Cox International Stock Fund (the “Fund”) is one of the series constituting the Dodge & Cox Funds (the “Trust” or the “Funds”). The Trust is organized as a Delaware statutory trust and is registered under the Investment Company Act of 1940, as amended, as anopen-end management investment company. On January 16, 2015, the Fund closed to new investors. The Fund commenced operations on May 1, 2001, and seeks long-term growth of principal and income. The Fund invests primarily in a diversified portfolio of foreign equity securities. Foreign investing, especially in developing countries, has special risks such as currency and market volatility and political and social instability. These and other risk considerations are discussed in the Fund’s Prospectus.
The Fund is an investment company and follows the accounting and reporting guidance issued in Topic 946 by the Financial Accounting Standards Board. The financial statements have been prepared in conformity with accounting principles generally accepted in the United States of America, which require the use of estimates and assumptions by management. Actual results may differ from those estimates. Significant accounting policies are as follows:
Security valuation The Fund’s net assets are normally valued as of the scheduled close of trading on the New York Stock Exchange (NYSE), generally 4 p.m. Eastern Time, each day that the NYSE is open for business.
Portfolio holdings for which market quotes are readily available are valued at market value. Listed securities, for example, are generally valued using the official quoted close price or the last sale on the exchange that is determined to be the primary market for the security. Equity-linked notes are valued using prices received from independent pricing services which utilize market quotes from underlying reference instruments. Exchange-traded derivatives are valued at the settlement price determined by the relevant exchange.Short-term securities less than 60 days to maturity may be valued at amortized cost if amortized cost approximates current value. Security values are not discounted based on the size of the Fund’s position and may differ from the value a Fund receives upon sale of the securities. Mutual funds are valued at their respective net asset values.
Investments initially valued in currencies other than the U.S. dollar are converted to the U.S. dollar using prevailing exchange rates. Currency forward contracts are valued based on the prevailing forward exchange rates of the underlying currencies. As a result, the Fund’s net assets may be affected by changes in the value of currencies in relation to the U.S. dollar.
If market quotations are not readily available or if normal valuation procedures produce valuations that are deemed unreliable or inappropriate under the circumstances existing at the time, the investment will be valued at fair value as determined in good faith by or under the direction of the Fund’s Board of Trustees. The Board of Trustees has appointed Dodge & Cox, the Fund’s investment manager, to make fair value determinations in accordance with the Dodge & Cox Funds Valuation Policies (“Valuation Policies”), subject to Board oversight. Dodge & Cox has established a Pricing Committee that is comprised of representatives from Treasury, Legal, Compliance, and Operations. The Pricing Committee is responsible for implementing the Valuation Policies, including determining the
fair value of securities and other investments when necessary. The Pricing Committee considers relevant indications of value that are reasonably available to it in determining the fair value assigned to a particular security, such as the value of similar financial instruments, trading volumes, contractual restrictions on disposition, related corporate actions, and changes in economic conditions. In doing so, the Pricing Committee employs various methods for calibrating fair valuation approaches, including a regular review of key inputs and assumptions, back-testing, and review of any related market activity.
As trading in securities on most foreign exchanges is normally completed before the close of the NYSE, the value of non-U.S. securities can change by the time the Fund calculates its net asset value. To address these changes, the Fund may utilize adjustment factors provided by an independent pricing service to systematically value non-U.S. securities at fair value. These adjustment factors are based on statistical analyses of subsequent movements and changes in U.S. markets and financial instruments trading in U.S. markets that represent foreign securities or baskets of securities.
Valuing securities through a fair value determination involves greater reliance on judgment than valuation of securities based on readily available market quotations. In some instances, lack of information and uncertainty as to the significance of information may lead to a conclusion that a prior valuation is the best indication of a security’s value. When fair value pricing is employed, the prices of securities used by the Fund to calculate its net asset value may differ from quoted or published prices for the same securities.
Security transactions, investment income, expenses, and distributions Security transactions are recorded on the trade date. Realized gains and losses on securities sold are determined on the basis of identified cost.
Dividend income and corporate action transactions are recorded on theex-dividend date, or when the Fund first learns of the dividend/corporate action if the ex-dividend date has passed.Non-cash dividends, if any, are recorded at the fair market value of the securities received. Dividends characterized as return of capital for U.S. tax purposes are recorded as a reduction of cost of investments and/or realized gain. Interest income is recorded on the accrual basis.
Expenses are recorded on the accrual basis. Some expenses of the Trust can be directly attributed to a specific series. Expenses which cannot be directly attributed are allocated among the Funds in the Trust using methodologies determined by the nature of the expense.
Distributions to shareholders are recorded on theex-dividend date.
Foreign taxes The Fund is subject to foreign taxes which may be imposed by certain countries in which the Fund invests. The Fund endeavors to record foreign taxes based on applicable foreign tax law. Withholding taxes are incurred on certain foreign dividends and are accrued at the time the associated dividend is recorded. The Fund files withholding tax reclaims in certain jurisdictions to recover a portion of amounts previously withheld. The Fund records a reclaim receivable based on, among other things, a jurisdiction’s legal obligation to pay reclaims as well as payment history and market convention. In consideration of recent decisions rendered by European courts, the Fund has filed for additional reclaims related to prior years. A corresponding receivable is established when both the amount is known and significant contingencies or uncertainties regarding collectability
DODGE & COX INTERNATIONAL STOCK FUND§PAGE 11
NOTES TO CONSOLIDATED FINANCIAL STATEMENTS
are removed. These amounts, if any, are reported in “dividends and interest receivable” in the Consolidated Statement of Assets and Liabilities.
Capital gains taxes are incurred upon disposition of certain foreign securities. Expected capital gains taxes on appreciated securities, if any, are accrued as unrealized losses and incurred capital gains taxes are reflected as realized losses upon the sale of the related security. Currency taxes may be incurred when the Fund purchases certain foreign currencies related to securities transactions and are recorded as realized losses on foreign currency transactions.
Repurchase agreements Repurchase agreements are transactions under which a Fund purchases a security from a dealer counterparty and agrees to resell the security to that counterparty on a specified future date at the same price, plus a specified interest rate. The Fund’s repurchase agreements are secured by U.S. government or agency securities. It is the Fund’s policy that its custodian take possession of the underlying collateral securities, the fair value of which exceeds the principal amount of the repurchase transaction, including accrued interest, at all times. In the event of default by the counterparty, the Fund has the contractual right to liquidate the collateral securities and to apply the proceeds in satisfaction of the obligation.
Equity-linked note An equity-linked note is a structured security linked to underlying reference equity securities. Changes in the market value of equity-linked notes are recorded as unrealized appreciation or depreciation and realized gains or losses are recorded upon the sale or maturity of the notes in the Consolidated Statement of Operations within investments in securities. The risks of investing in equity-linked notes include unfavorable price movements in the underlying securities and the credit risk of the issuing financial institution. Equity-linked notes may be more volatile and less liquid than other investments held by the Fund.
Foreign currency translation The books and records of the Fund are maintained in U.S. dollars. Foreign currency amounts are translated into U.S. dollars at the prevailing exchange rates of such currencies against the U.S. dollar. The market value of investment securities and other assets and liabilities are translated at the exchange rate as of the valuation date. Purchases and sales of investment securities, income, and expenses are translated at the exchange rate prevailing on the transaction date.
Reported realized and unrealized gain (loss) on investments include foreign currency gain (loss) related to investment transactions.
Reported realized and unrealized gain (loss) on foreign currency transactions and translation include the following: disposing/holding of foreign currency, the difference between the trade and settlement dates on securities transactions, the difference between the accrual and payment dates on dividends, and currency losses on the purchase of foreign currency in certain countries that impose taxes on such transactions.
Consolidation The Fund may invest in certain securities through its wholly owned subsidiary, Dodge & Cox International Stock Fund Cayman, Ltd. (the “Subsidiary”). The Subsidiary is a Cayman Islands exempted company and invests in certain securities
consistent with the investment objective of the Fund. The Fund’s Consolidated Financial Statements, including the Consolidated Portfolio of Investments, consist of the holdings and accounts of the Fund and the Subsidiary. All intercompany transactions and balances have been eliminated. At December 31, 2018, the Subsidiary had net assets of $100, which represented less than 0.01% of the Fund’s consolidated net assets.
Indemnification Under the Trust’s organizational documents, its officers and trustees are indemnified against certain liabilities arising out of the performance of their duties to the Trust. In addition, in the normal course of business the Trust enters into contracts that provide general indemnities to other parties. The Trust’s maximum exposure under these arrangements is unknown as this would involve future claims that may be made against the Trust that have not yet occurred.
NOTE 2—VALUATION MEASUREMENTS
Various inputs are used in determining the value of the Fund’s investments. These inputs are summarized in the three broad levels listed below.
| § | | Level 1: Quoted prices in active markets for identical securities |
| § | | Level 2: Other significant observable inputs (including quoted prices for similar securities, market indices, interest rates, credit risk, forward exchange rates, etc.) |
| § | | Level 3: Significant unobservable inputs (including Fund management’s assumptions in determining the fair value of investments) |
The inputs or methodology used for valuing securities are not necessarily an indication of the risk associated with investing in those securities.
The following is a summary of the inputs used to value the Fund’s holdings at December 31, 2018:
| | | | | | | | |
| Classification | | LEVEL 1
(Quoted Prices) | | | LEVEL 2
(Other Significant
Observable Inputs) | |
Securities | | | | | | | | |
Common Stocks | | | | | | | | |
Communication Services | | $ | 2,931,727,455 | | | $ | 2,377,498,608 | |
Consumer Discretionary | | | 1,448,537,769 | | | | 1,724,073,314 | |
Consumer Staples | | | 325,342,817 | | | | — | |
Energy | | | 1,391,999,715 | | | | 1,224,880,901 | |
Financials | | | — | | | | 12,869,798,277 | |
Health Care | | | 643,986,888 | | | | 7,772,001,036 | |
Industrials | | | 1,025,190,290 | | | | 2,779,764,079 | |
Information Technology | | | 1,015,630,902 | | | | 2,784,832,296 | |
Materials | | | 867,426,756 | | | | 1,970,656,440 | |
Real Estate | | | — | | | | 280,023,530 | |
Utilities | | | — | | | | 814,633,194 | |
Preferred Stocks | | | | | | | | |
Energy | | | — | | | | 766,547,253 | |
Financials | | | — | | | | 1,428,119,138 | |
Information Technology | | | — | | | | 819,800,078 | |
Equity-Linked Note | | | | | | | | |
Communication Services | | | — | | | | 357,539,000 | |
Short-term Investments | | | | | | | | |
Repurchase Agreement | | | — | | | | 53,474,000 | |
Money Market Fund | | | 193,121,771 | | | | — | |
| | | | | | | | |
Total Securities | | $ | 9,842,964,363 | | | $ | 38,023,641,144 | |
| | | | | | | | |
PAGE 12§ DODGE & COX INTERNATIONAL STOCK FUND
NOTES TO CONSOLIDATED FINANCIAL STATEMENTS
| | | | | | | | |
| Classification | | LEVEL 1
(Quoted Prices) | | | LEVEL 2
(Other Significant
Observable Inputs) | |
| | |
Other Investments | | | | | | | | |
Futures Contracts | | | | | | | | |
Depreciation | | $ | (16,059,599) | | | $ | — | |
Currency Forward Contracts | | | | | | | | |
Appreciation | | | — | | | | 104,997,611 | |
Depreciation | | | — | | | | (42,650,204 | ) |
| | | | | | | | | |
NOTE 3—DERIVATIVE INSTRUMENTS
The Fund entered into various transactions involving derivative instruments, including currency forward contracts and futures contracts, in connection with its investment strategy. The Fund may use derivatives to minimize the impact of losses to one or more of its investments (as a “hedging technique”) or to implement its investment strategy.
The Fund entered intoover-the-counter derivatives (each, an “OTC Derivative”), such as currency forward contracts. Each OTC Derivative is subject to a negotiated master agreement (based on a form published by the International Swaps and Derivatives Association (“ISDA”)) governing all OTC Derivatives between the Fund and the relevant dealer counterparty. The master agreements specify (i) events of default and other events permitting a party to terminate some or all of the OTC Derivatives thereunder and (ii) the process by which those OTC Derivatives will be valued for purposes of determining termination payments. If some or all of the OTC Derivatives under a master agreement are terminated because of an event of default or similar event, the values of all terminated OTC Derivatives must be netted to determine a single payment owed by one party to the other. To the extent amounts owed to the Fund by its counterparties are not collateralized, the Fund is at risk of those counterparties’non-performance. The Fund attempts to mitigate counterparty credit risk by entering into OTC Derivatives only with counterparties it believes to be of good credit quality, by exchanging collateral, and by monitoring the financial stability of those counterparties.
Futures contracts Futures contracts involve an obligation to purchase or sell (depending on whether the Fund has entered a long or short futures contract, respectively) an asset at a future date, at a price set at the time of the contract. Upon entering into a futures contract, the Fund is required to deposit an amount of cash or liquid assets (referred to as initial margin) in a segregated account with the clearing broker. Subsequent payments (referred to as variation margin) to and from the clearing broker are made on a daily basis based on changes in the market value of futures contracts. Futures contracts are traded publicly and their market value changes daily. Changes in the market value of open futures contracts are recorded as unrealized appreciation or depreciation in the Consolidated Statement of Operations. Realized gains and losses on futures contracts are recorded in the Consolidated Statement of Operations at the closing or expiration of the contracts. Cash deposited with a broker as initial margin is
recorded in the Consolidated Statement of Assets and Liabilities. A receivable and/or payable to brokers for daily variation margin are also recorded in the Consolidated Statement of Assets and Liabilities.
Investments in futures contracts may include certain risks, which may be different from, and potentially greater than, those of the underlying securities. To the extent the Fund uses futures, it is exposed to additional volatility and potential losses resulting from leverage.
The Fund has maintained long Euro Stoxx 50 futures contracts and long Yen Denominated Nikkei futures contracts to provide equity exposure that approximates the Fund’s “net cash and other” position, which includes cash, short-term investments, receivables, and payables. During the year ended December 31, 2018, these futures contracts had notional values up to 3% of net assets.
Currency forward contractsA currency forward contract represents an obligation to purchase or sell a specific foreign currency at a future date at a price set at the time of the contract. The values of currency forward contracts are adjusted daily based on the prevailing forward exchange rates of the underlying currencies. Changes in the value of open contracts are recorded as unrealized appreciation or depreciation in the Consolidated Statement of Operations. When a currency forward contract is closed, the Fund records a realized gain or loss in the Consolidated Statement of Operations equal to the difference between the value at the time the contract was opened and the value at the time it was closed.
Losses from these transactions may arise from unfavorable changes in currency values or if a counterparty does not perform under a contract’s terms.
The Fund has maintained currency forward contracts to hedge direct and/or indirect foreign currency exposure to the Chinese yuan renminbi, euro, and Swiss franc. During the year ended December 31, 2018, these currency forward contracts had U.S. dollar total values ranging from 7% to 13% of net assets.
Additional derivative information For financial reporting purposes, the Fund does not offset OTC Derivative assets and liabilities that are subject to a master netting arrangement in the Consolidated Statement of Assets and Liabilities. OTC Derivatives are presented in the Consolidated Statement of Assets and Liabilities as unrealized appreciation/depreciation on currency forward contracts. Cash collateral pledged or received by the Fund for OTC Derivatives is reported gross in the Consolidated Statement of Assets and Liabilities as cash pledged/(received) as collateral for currency forward contracts. Derivative information by counterparty is presented in the Consolidated Portfolio of Investments.
The netting of assets and liabilities and the offsetting of collateral pledged or received are based on contractualnetting/set-off provisions in the ISDA master agreement. The following table presents the Fund’s net exposure for OTC Derivatives that are subject to enforceable master netting arrangements as of December 31, 2018. The net amount represents the receivable from (payable to) the counterparty in the event of a default.
DODGE & COX INTERNATIONAL STOCK FUND§PAGE 13
NOTES TO CONSOLIDATED FINANCIAL STATEMENTS
| | | | | | | | | | | | | | | | |
| Counterparty | | Gross OTC
Derivative Assets | | | Gross OTC
Derivative
Liabilities | | | Cash Collateral Pledged /
(Received)(a) | | | Net Amount | |
Barclays | | $ | 116,880 | | | $ | (3,853,757 | ) | | $ | 3,120,000 | | | $ | (616,877 | ) |
Citibank | | | 34,081,195 | | | | (2,680,505 | ) | | | (31,400,690 | ) | | | — | |
Credit Suisse | | | 15,431,705 | | | | — | | | | (15,431,705 | ) | | | — | |
Goldman Sachs | | | 56,060 | | | | (20,813,503 | ) | | | 20,400,000 | | | | (357,443 | ) |
HSBC | | | 18,313,074 | | | | (2,015,215 | ) | | | (16,297,859 | ) | | | — | |
JPMorgan | | | 23,800,439 | | | | (735,792 | ) | | | (23,064,647 | ) | | | — | |
Morgan Stanley | | | 1,354,459 | | | | (2,463,656 | ) | | | — | | | | (1,109,197 | ) |
UBS | | | 11,843,799 | | | | (10,087,776 | ) | | | (1,756,023 | ) | | | — | |
| | | | | | | | | | | | | | | | |
Total | | $ | 104,997,611 | | | $ | (42,650,204 | ) | | $ | (64,430,924 | ) | | $ | (2,083,517 | ) |
| | | | | | | | | | | | | | | | |
| | | | | | | | | | | | | | | | | |
| (a) | Cash collateral pledged/(received) in excess of OTC Derivative assets/liabilities, if any, is not presented. Total cash collateral pledged/(received) is presented in the Consolidated Statement of Assets and Liabilities. |
NOTE 4—RELATED PARTY TRANSACTIONS
Management fees Under a written agreement approved by a unanimous vote of the Board of Trustees, the Fund pays a management fee monthly at an annual rate of 0.60% of the Fund’s average daily net assets to Dodge & Cox, investment manager of the Fund.
Fund officers and trustees All officers and two of the trustees of the Trust are officers or employees of Dodge & Cox. The Trust pays a fee only to those trustees who are not affiliated with Dodge & Cox.
NOTE 5—INCOME TAX INFORMATION AND DISTRIBUTIONS TO SHAREHOLDERS
A provision for federal income taxes is not required since the Fund intends to continue to qualify as a regulated investment company under Subchapter M of the Internal Revenue Code and distribute all of its taxable income to shareholders. Distributions are determined in accordance with income tax regulations, and such amounts may differ from net investment income and realized gains for financial reporting purposes. The Fund may also designate a portion of the amount paid to redeeming shareholders as a distribution for tax purposes. Financial reporting records are adjusted for permanent book to tax differences at year end to reflect tax character. Book to tax differences are primarily due to differing treatments of wash sales, net short-term realized gain (loss), investments in passive foreign investment companies, foreign currency realized gain (loss), foreign capital gains tax, certain corporate action transactions, derivatives, and distributions.
Distributions during the years noted below were characterized as follows for federal income tax purposes.
| | | | | | | | |
| | | Year Ended December 31, 2018 | | | Year Ended
December 31, 2017 | |
Ordinary income | | $ | 1,392,029,880 | | | $ | 1,246,064,935 | |
| | ($ | 1.080 per share | ) | | ($ | 0.892 per share | ) |
Long-term capital gain | | | — | | | | — | |
At December 31, 2018, the tax basis components of distributable earnings were as follows:
| | | | |
Capital loss carryforward(a) | | $
| (1,436,591,790
| )
|
Deferred loss(b) | | | (391,633,447 | ) |
At December 31, 2018, unrealized appreciation and depreciation for investments and derivatives based on cost for federal income tax purposes were as follows:
| | | | |
Tax cost | | $ | 52,216,065,213 | |
| | | | |
Unrealized appreciation | | | 6,235,663,017 | |
Unrealized depreciation | | | (10,538,834,915 | ) |
| | | | |
Net unrealized depreciation | | | (4,303,171,898 | ) |
| | | | | |
| (a) | Represents accumulated short-term and long-term capital loss as of December 31, 2018, which may be carried forward to offset future capital gains. |
| (b) | Represents net realized specified loss and capital loss incurred between November 1, 2018 and December 31, 2018. As permitted by tax regulation, the Fund has elected to treat this loss as arising in 2019. |
Fund management has reviewed the tax positions for open periods (three years and four years, respectively, from filing the Fund’s Federal and State tax returns) as applicable to the Fund, and has determined that no provision for income tax is required in the Fund’s financial statements.
NOTE 6—LOAN FACILITIES
Pursuant to an exemptive order issued by the Securities and Exchange Commission (SEC), the Fund may participate in an interfund lending facility (Facility). The Facility allows the Fund to borrow money from or loan money to the Funds. Loans under the Facility are made for temporary or emergency purposes, such as to fund shareholder redemption requests. Interest on borrowings is the average of the current repurchase agreement rate and the bank loan rate. There was no activity in the Facility during the year.
All Funds in the Trust participate in a $500 million committed credit facility (Line of Credit) with State Street Bank and Trust Company, to be utilized for temporary or emergency purposes to fund shareholder redemptions or for other short-term liquidity purposes. The maximum amount available to the Fund is $250 million. Each Fund pays an annual commitment fee on itspro-rata portion of the Line of Credit. For the year ended December 31, 2018, the Fund’s commitment fee amounted to $352,211 and is reflected as a Miscellaneous Expense in the Consolidated Statement of Operations. Interest on borrowings is charged at the prevailing rate. There were no borrowings on the Line of Credit during the year.
NOTE 7—PURCHASES AND SALES OF INVESTMENTS
For the year ended December 31, 2018, purchases and sales of securities, other than short-term securities, aggregated $10,292,098,170 and $15,178,320,127 respectively.
PAGE 14§ DODGE & COX INTERNATIONAL STOCK FUND
NOTES TO CONSOLIDATED FINANCIAL STATEMENTS
NOTE 8—NEW ACCOUNTING GUIDANCE
In August 2018, the Financial Accounting Standards Board issued Accounting Standards Update “Fair Value Measurement (Topic 820)” (ASU 2018-13) which modifies the disclosure requirements for fair value measurement by removing, modifying, or adding certain disclosures. The amendments are effective for annual periods beginning after December 15, 2019, and interim periods within those annual periods. The Fund is permitted to early adopt any removed or modified disclosures upon issuance of this update and delay adoption of the additional disclosures until their
effective date. The Fund has early adopted the updated accounting standards on the Fund’s financial statements.
NOTE 9—SUBSEQUENT EVENTS
Fund management has determined that no material events or transactions occurred subsequent to December 31, 2018, and through the date of the Fund’s financial statements issuance, which require additional disclosure in the Fund’s financial statements.
NOTE 10—HOLDINGS OF 5% VOTING SECURITIES
Each of the companies listed below was considered to be an affiliate of the Fund because the Fund owned 5% or more of the company’s voting securities during all or part of the year ended December 31, 2018. Transactions during the year in these securities were as follows:
| | | | | | | | | | | | | | | | | | | | | | | | | | | | | | | | |
| | | Shares at
Beginning of Year | | | Additions | | | Reductions | | | Shares at End of Year | | | Dividend
Income(a) | | | Realized
Gain (Loss)(a) | | | Net Change in Unrealized Appreciation/
Depreciation(a) | | | Value at
End of Year | |
| COMMON STOCKS: 4.7% | | | | | | | | | | | | | | | | | | | | | | | | | | | | | |
| COMMUNICATION SERVICES: 1.8% | | | | | | | | | | | | | | | | | | | | | | | | | |
Liberty Global PLC, Series A(b) | | | 18,753,503 | | | | — | | | | — | | | | 18,753,503 | | | $ | — | | | $ | — | | | $ | (271,925,794 | ) | | $ | 400,199,754 | |
Liberty Latin America Ltd, Series A(b) | | | 3,917,037 | | | | — | | | | (3,497,969 | ) | | | 419,068 | | | | — | | | | (46,350,331 | ) | | | 37,471,292 | | | | — | (c) |
Millicom International Cellular SA SDR | | | 8,703,436 | | | | — | | | | (1,939,031 | ) | | | 6,764,405 | | | | 16,958,960 | | | | (60,469,528 | ) | | | 30,425,732 | | | | 429,239,963 | |
MTN Group, Ltd. | | | 102,215,380 | | | | — | | | | (40,264,700 | ) | | | 61,950,680 | | | | 43,463,793 | | | | (507,835,931 | ) | | | 16,757,385 | | | | — | (c) |
Television Broadcasts, Ltd. | | | 40,022,900 | | | | — | | | | (180,200 | ) | | | 39,842,700 | | | | 6,631,583 | | | | (840,127 | ) | | | (67,948,438 | ) | | | 75,136,916 | |
| | | | | | | | | | | | | | | | | | | | | | | | | | | | | | | | |
| | | | | | | | | | | | | | | | | | | | | | | | | | | | | | | 904,576,633 | |
| | | | | | | | | | | | | | | | | | | | | | | | | | | | | | | | |
| | | | | | | |
| CONSUMER STAPLES: 0.7% | | | | | | | | | | | | | | | | | | | | | | | | | | | | | |
Magnit PJSC | | | 5,432,785 | | | | 1,045,500 | | | | (32,945 | ) | | | 6,445,340 | | | | 23,268,255 | | | | (4,435,280 | ) | | | (337,884,449 | ) | | | 325,342,817 | |
| | | | | | | |
| ENERGY: 0.0% | | | | | | | | | | | | | | | | | | | | | | | | | | | | | |
Saipem SPA(b) | | | 56,980,627 | | | | — | | | | (56,980,627 | ) | | | — | | | | — | | | | (811,495,790 | ) | | | 775,603,389 | | | | — | |
| | | | | | | |
| FINANCIALS: 0.0% | | | | | | | | | | | | | | | | | | | | | | | | | | | | | |
AEGON NV | | | 134,755,530 | | | | 6,744,988 | | | | (26,579,700 | ) | | | 114,920,818 | | | | 42,041,791 | | | | (60,863,218 | ) | | | (143,790,135 | ) | | | — | (c) |
ICICI Bank, Ltd. | | | 384,183,576 | | | | 32,327,700 | | | | (125,229,789 | ) | | | 291,281,487 | | | | 8,695,524 | | | | 91,464,914 | | | | 13,578,449 | | | | — | (c) |
KasikornbankPCL- Foreign | | | 132,832,727 | | | | — | | | | (66,724,500 | ) | | | 66,108,227 | | | | 13,304,191 | | | | 45,018,718 | | | | (215,818,552 | ) | | | — | (c) |
| | | | | | | | | | | | | | | | | | | | | | | | | | | | | | | | |
| | | | | | | | | | | | | | | | | | | | | | | | | | | | | | | — | |
| | | | | | | | | | | | | | | | | | | | | | | | | | | | | | | | |
| | | | | | | |
| INDUSTRIALS: 0.8% | | | | | | | | | | | | | | | | | | | | | | | | | | | | | |
Smiths Group PLC | | | 17,295,000 | | | | 8,306,600 | | | | (4,116,019 | ) | | | 21,485,581 | | | | 8,781,051 | | | | 1,937,606 | | | | (38,197,198 | ) | | | 371,995,712 | |
| | | | | | | |
| INFORMATION TECHNOLOGY: 0.8% | | | | | | | | | | | | | | | | | | | | | | | | | | | | | |
Micro Focus International PLC(d) | | | 15,521,973 | | | | 7,529,520 | | | | (128,897 | ) | | | 22,922,596 | | | | 18,239,756 | | | | (1,562,688 | ) | | | (280,364,674 | ) | | | 400,640,762 | |
| | | | | | | |
| REAL ESTATE: 0.6% | | | | | | | | | | | | | | | | | | | | | | | | | | | | | |
Hang Lung Group, Ltd. | | | 111,345,400 | | | | — | | | | (1,126,000 | ) | | | 110,219,400 | | | | 11,349,283 | | | | (2,537,193 | ) | | | (124,185,500 | ) | | | 280,023,530 | |
| | | | | | | | | | | | | | | | | | | | | | | | | | | | | | | | |
| | | | | | | | | | | | | | | | | | $ | 192,734,187 | | | $ | (1,357,968,848 | ) | | $ | (606,278,493 | ) | | $ | 2,282,579,454 | |
| | | | | | | | | | | | | | | | | | | | | | | | | | | | | | | | |
| | | | | | | | | | | | | | | | | | | | | | | | | | | | | | | | | |
| (a) | Net of foreign taxes, if any |
| (c) | Company was not an affiliate at year end |
| (d) | Includes transactions in Micro Focus International PLC ADR which was converted to ordinary shares during the year |
DODGE & COX INTERNATIONAL STOCK FUND§PAGE 15
CONSOLIDATED FINANCIAL HIGHLIGHTS
| | | | | | | | | | | | | | | | | | | | |
SELECTED DATA AND RATIOS (for a share outstanding throughout each year) | | Year Ended December 31, | |
| | | 2018 | | | 2017 | | | 2016 | | | 2015 | | | 2014 | |
| | | | |
Net asset value, beginning of year | | | $46.32 | | | | $38.10 | | | | $36.48 | | | | $42.11 | | | | $43.04 | |
Income from investment operations: | | | | | | | | | | | | | | | | | | | | |
Net investment income | | | 1.01 | | | | 0.70 | | | | 0.82 | | | | 0.79 | | | | 0.98 | |
Net realized and unrealized gain (loss) | | | (9.34 | ) | | | 8.41 | | | | 2.19 | | | | (5.58 | ) | | | (0.94 | ) |
| | | | |
Total from investment operations | | | (8.33 | ) | | | 9.11 | | | | 3.01 | | | | (4.79 | ) | | | 0.04 | |
| | | | |
Distributions to shareholders from: | | | | | | | | | | | | | | | | | | | | |
Net investment income | | | (1.08 | ) | | | (0.89 | ) | | | (0.85 | ) | | | (0.84 | ) | | | (0.97 | ) |
Net realized gain | | | — | | | | — | | | | (0.54 | ) | | | — | | | | — | |
| | | | |
Total distributions | | | (1.08 | ) | | | (0.89 | ) | | | (1.39 | ) | | | (0.84 | ) | | | (0.97 | ) |
| | | | |
Net asset value, end of year | | | $36.91 | | | | $46.32 | | | | $38.10 | | | | $36.48 | | | | $42.11 | |
| | | | |
Total return | | | (17.98 | )% | | | 23.94 | % | | | 8.26 | % | | | (11.35 | )% | | | 0.07 | % |
Ratios/supplemental data: | | | | | | | | | | | | | | | | | | | | |
Net assets, end of year (millions) | | | $48,108 | | | | $65,670 | | | | $54,187 | | | | $57,029 | | | | $64,040 | |
Ratio of expenses to average net assets | | | 0.63 | % | | | 0.63 | % | | | 0.64 | % | | | 0.64 | % | | | 0.64 | % |
Ratio of net investment income to average net assets | | | 2.17 | % | | | 1.57 | % | | | 2.12 | % | | | 1.86 | % | | | 2.39 | % |
Portfolio turnover rate | | | 17 | % | | | 17 | % | | | 17 | % | | | 18 | % | | | 12 | % |
See accompanying Notes to Consolidated Financial Statements
PAGE 16§ DODGE & COX INTERNATIONAL STOCK FUND
REPORT OF INDEPENDENT REGISTERED PUBLIC ACCOUNTING FIRM
To the Board of Trustees of the Dodge & Cox Funds and Shareholders of Dodge & Cox International Stock Fund
Opinion on the Financial Statements
We have audited the accompanying consolidated statement of assets and liabilities, including the consolidated portfolio of investments, of Dodge & Cox International Stock Fund and its subsidiary (one of the funds constituting Dodge & Cox Funds, referred to hereafter as the “Fund”) as of December 31, 2018, the related consolidated statement of operations for the year ended December 31, 2018, the consolidated statement of changes in net assets for each of the two years in the period ended December 31, 2018, including the related notes, and the financial highlights for each of the five years in the period ended December 31, 2018 (collectively referred to as the “consolidated financial statements”). In our opinion, the consolidated financial statements present fairly, in all material respects, the financial position of the Fund as of December 31, 2018, the results of its operations for the year then ended, the changes in its net assets for each of the two years in the period ended December 31, 2018 and the financial highlights for each of the five years in the period ended December 31, 2018 in conformity with accounting principles generally accepted in the United States of America.
Basis for Opinion
These consolidated financial statements are the responsibility of the Fund’s management. Our responsibility is to express an opinion on the Fund’s consolidated financial statements based on our audits. We are a public accounting firm registered with the Public Company Accounting Oversight Board (United States) (PCAOB) and are required to be independent with respect to the Fund in accordance with the U.S. federal securities laws and the applicable rules and regulations of the Securities and Exchange Commission and the PCAOB.
We conducted our audits of these consolidated financial statements in accordance with the standards of the PCAOB. Those standards require that we plan and perform the audit to obtain reasonable assurance about whether the consolidated financial statements are free of material misstatement, whether due to error or fraud.
Our audits included performing procedures to assess the risks of material misstatement of the consolidated financial statements, whether due to error or fraud, and performing procedures that respond to those risks. Such procedures included examining, on a test basis, evidence regarding the amounts and disclosures in the consolidated financial statements. Our audits also included evaluating the accounting principles used and significant estimates made by management, as well as evaluating the overall presentation of the consolidated financial statements. Our procedures included confirmation of securities owned as of December 31, 2018 by correspondence with the custodian, transfer agent and brokers. We believe that our audits provide a reasonable basis for our opinion.
PricewaterhouseCoopers LLP
San Francisco, California
February 15, 2019
We have served as the auditor of one or more investment companies in the Dodge & Cox Funds since 1931.
DODGE & COX INTERNATIONAL STOCK FUND§PAGE 17
SPECIAL 2018 TAX INFORMATION
(unaudited)
The following information is provided pursuant to provisions of the Internal Revenue Code:
In 2018, the Fund elected to pass through to shareholders foreign source income of $2,122,893,859 and foreign taxes paid of $165,146,729.
The Fund designates up to a maximum of $1,952,851,642 of its distributions paid to shareholders in 2018 as qualified dividends (treated for federal income tax purposes in the hands of shareholders as taxable at a maximum rate of 20%).
For shareholders that are corporations, the Fund designates 1% of its ordinary dividends paid to shareholders in 2018 as dividends from domestic corporations eligible for the corporate dividends received deduction, provided that the shareholder otherwise satisfies applicable requirements to claim that deduction.
BOARD APPROVAL OF FUNDS’ INVESTMENT
MANAGEMENT AGREEMENTS AND MANAGEMENT FEES
(unaudited)
The Board of Trustees is responsible for overseeing the performance of the Dodge & Cox Funds’ investment manager and determining whether to continue the Investment Management Agreements between the Funds and Dodge & Cox each year (the “Agreements”). At a meeting of the Board of Trustees of the Trust held on December 13, 2018, the Trustees, by a unanimous vote (including a separate vote of those Trustees who are not “interested persons” (as defined in the Investment Company Act of 1940) (the “Independent Trustees”)), approved the renewal of the Agreements for an additional one-year term through December 31, 2019 with respect to each Fund. During the course of the year, the Board received extensive information and materials relating to the investment management and administrative services provided by Dodge & Cox and the performance of each of the Funds.
INFORMATION RECEIVED
Over the past several years, the Board has requested, received, and discussed a number of special presentations on topics relevant to their annual consideration of the proposed renewal of the Funds’ Agreements. In addition to the foregoing and in advance of the meetings referred to below, the Board, including the Independent Trustees, requested, received, and reviewed materials relating to the Agreements and the services provided by Dodge & Cox. The Independent Trustees retained Broadridge to prepare an independent expense and performance summary for each Fund and comparable funds managed by other advisers identified by Broadridge. The Broadridge materials included information regarding advisory fee rates, expense ratios, and transfer agency, custodial, and distribution expenses, as well as performance comparisons to each Fund’s peer group and to a broad-based securities index or combination of indices. The Broadridge materials also included a comparison of expenses of various share classes offered by comparable funds. The materials reviewed by the Board contained information concerning, among other things, Dodge & Cox’s profitability, financial results and condition,
advisory fee revenue, and separate account fee schedules. The Board additionally considered the Funds’ brokerage commissions, turnover rates, sales and redemption data, and the significant investment that Dodge & Cox makes in research used in managing the Funds. The Board received and reviewed memoranda and related materials addressing, among other things, Dodge & Cox’s services to the Funds; how Dodge & Cox Funds’ fees compare to fees of peer group funds; the different fees, services, costs, and risks associated with other accounts managed by Dodge & Cox as compared to the Dodge & Cox Funds; and the ways in which the Funds realize economies of scale. Throughout the process of reviewing the services provided by Dodge & Cox and preparing for the meeting, the Independent Trustees found Dodge & Cox to be open, forthright, detailed, and very helpful in answering questions about all issues. The Board received copies of the Agreements and a memorandum from the independent legal counsel to the Independent Trustees discussing the factors generally regarded as appropriate to consider in evaluating advisory arrangements. The Trust’s Contract Review Committee, consisting solely of Independent Trustees, met with the independent legal counsel on November 8, 2018 and again on December 13, 2018 to discuss whether to renew the Agreements. The Board, including the Independent Trustees, subsequently concluded that the existing Agreements are fair and reasonable and voted to approve the Agreements. In considering the Agreements, the Board, including the Independent Trustees, did not identify any single factor or particular information as all-important or controlling. In reaching the decision to approve the Agreements, the Board considered several factors, discussed below, to be key factors and reached the conclusions described below.
NATURE, QUALITY, AND EXTENT OF THE SERVICES
The Board considered that Dodge & Cox provides a wide range of services to the Funds in addition to portfolio management, including regulatory compliance, trading desks, proxy voting, transfer agent and custodian oversight, administration, regulatory filings, tax compliance and filings, web site, and anti-money laundering. The extensive nature of services provided by Dodge & Cox has been documented in materials provided to the Board and in presentations made to the Board throughout the year. In particular, the Board considered the nature, quality, and extent of portfolio management, administrative, and shareholder services performed by Dodge & Cox. With regard to portfolio management services, the Board considered Dodge & Cox’s established long-term history of care and conscientiousness in the management of the Funds; its demonstrated consistency in investment approach and depth; the background and experience of the Dodge & Cox U.S. Equity Investment Committee, International Equity Investment Committee, Global Equity Investment Committee, U.S. Fixed Income Investment Committee, and Global Fixed Income Investment Committee, and research analysts responsible for managing the Funds; Dodge & Cox’s methods for assessing the regulatory and investment climate in various jurisdictions; its overall high level of attention to its core investment management function; and its commitment to the Funds and their shareholders.
PAGE 18§ DODGE & COX INTERNATIONAL STOCK FUND
The Board noted Dodge & Cox’s long record of favorable press and industry coverage, as well as its positive compliance record, and its reputation as a trusted, shareholder-friendly mutual fund family.
In addition, the Board considered that Dodge & Cox manages approximately $215 billion in Fund assets with fewer professionals than most comparable funds, and that on average these professionals have more experience and longer tenure than investment professionals at comparable funds. The Board also noted that Dodge & Cox is an investment research-oriented firm with no other business endeavors to distract management’s attention from its research efforts or to present material conflicts of interest with the operations of the Funds, that its investment professionals adhere to a consistent investment approach across the Funds, and that due to its careful and deliberate strategy with respect to new products, Dodge & Cox has had remarkable stability in its mutual fund product offerings over the course of the past 88 years and has the fewest funds of any of the 25 largest mutual fund families by assets. The Board further considered the “Gold” analyst rating awarded by Morningstar to all of the Funds (other than the Global Bond Fund, which has a “Bronze” rating). The Board concluded that it was satisfied with the nature, extent, and quality of investment management and other services provided to the Funds by Dodge & Cox.
INVESTMENT PERFORMANCE
The Board completed an intensive review and assessment of each Fund’s recent and long-term investment performance (including periods of outperformance and underperformance), as compared to relevant indices and the performance of such Fund’s peer group and broader Morningstar category. In assessing the performance of the Funds, the Board considered the Funds’ investment returns over various periods and the volatility thereof and concluded that the levels experienced were consistent with Dodge & Cox’s long-term approach and active investment style. The Board also compared the short- and long-term investment performance of the equity funds to value-oriented indices, in recognition of the significant performance divergence between value and growth stocks over the past several years. It was noted that equity performance has been consistent with the value oriented investment strategy employed by Dodge & Cox. The Board further noted that the equity funds have outperformed over their medium to long-term investment horizons as compared to their corresponding value equity indices.
The Board determined after extensive review and inquiry that Dodge & Cox’s historic, long-term, team-oriented, bottom-up investment approach remains consistent and that Dodge & Cox continues to be distinguished by its integrity, transparency, and independence. The Board considered that the performance of the Funds is the result of a value-oriented investment management process that emphasizes a long-term investment horizon, comprehensive independent research, a team approach, price discipline, low cost, and low portfolio turnover. The Board also considered that the investment performance delivered by Dodge & Cox to the Funds appeared to be consistent with the relevant performance delivered for other clients of Dodge & Cox.
The Board concluded that Dodge & Cox has delivered favorable long-term performance for Fund investors consistent with the long-term investment strategies being pursued by the Funds.
COSTS AND ANCILLARY BENEFITS
Costs of Services to Funds: Fees and Expenses The Board considered each Fund’s management fee rate and net expense ratio relative to (1) a broad category of other mutual funds with similar portfolio characteristics and share class and expense structures and (2) a much smaller group of peers selected by Broadridge based on investment style, share class characteristics, and asset levels. The Board also considered the management fees charged by Dodge & Cox to other clients. In particular, the Board considered that the Funds continue to be below their peer group median in net expense ratios and that many media and industry reports specifically comment on the low cost of the Funds, which have been a defining characteristic of the Funds for many years. The Board also evaluated the operating structures of the Funds and Dodge & Cox, noting that the Funds do not charge front-end sales commissions or distribution fees, and Dodge & Cox bears, among other things, the significant cost of third party research, reimbursement for shareholder recordkeeping and administrative costs to third-party retirement plan administrators, and administrative and office overhead.
The Board noted that the Broadridge report shows that the net expense ratio of every Dodge & Cox Fund is in the least expensive quartile compared to its broad Morningstar category. The Board noted the Funds’ unusual single-share-class structure and reviewed Broadridge data (including asset-weighted average expense ratios) showing that most of the peer group funds offer several different classes of shares, with different expense ratios, to different categories of investors, and that the Broadridge expense comparisons described above generally compare the net expense ratio of each Dodge & Cox Fund’s single share class to one of the least expensive share classes of the peer fund, even though those share classes are often not available to retail investors. The Board determined that the Funds provide access for small investors to high quality investment management at a relatively low cost. The Board also considered that the Funds are priced to scale, i.e., management fee rates begin at relatively low levels. Even without breakpoints, the Funds’ management fee rates are lower than those of many peer funds whose fee schedules include breakpoints. With respect to non-U.S. funds sponsored and managed by Dodge & Cox that are comparable to the Funds in many respects, the Board noted that the fee rates charged by Dodge & Cox are the same as or higher than the fee rates charged to the Funds.
The Board reviewed information regarding the fee rates Dodge & Cox charges to separate accounts that have investment programs similar to those of the Funds, including instances where separate account fees are lower than Fund fees. The Board considered the significant differences in the nature and scope of services Dodge & Cox provides to the Funds as compared to other client accounts, as well as material differences in regulatory, litigation, and other risks as between Dodge & Cox Funds and other types of clients. The Board noted that different markets exist
DODGE & COX INTERNATIONAL STOCK FUND§PAGE 19
for mutual fund and institutional separate account management services and that a comparison of Fund fee rates and separate account fee rates must consider the fact that separate account clients bear additional costs and responsibilities that are included in the cost of a Fund. The Board further noted that many sophisticated institutional investors in the Funds that are eligible to open separate accounts at Dodge & Cox have decided for various reasons to invest in the Funds. After consideration of these matters, the Board concluded that the overall costs incurred by the Funds for the services they receive (including the management fee paid to Dodge & Cox) are reasonable and that the fees are acceptable based upon the qualifications, experience, reputation, and performance of Dodge & Cox and the low overall expense ratios of the Funds.
Profitability and Costs of Services to Dodge & Cox; “Fall-out” Benefits The Board reviewed reports of Dodge & Cox’s financial position, profitability, and estimated overall value and considered Dodge & Cox’s overall profitability within its context as a private, employee-owned S-Corporation and relative to the favorable services provided. The Board noted in particular that Dodge & Cox’s profits are not generated by high fee rates, but reflect a very streamlined, efficient, and focused business approach toward investment management.
The Board recognized the importance of Dodge & Cox’s profitability—which is derived solely from management fees and does not include other business ventures—to maintain its independence, stability, company culture and ethics, and management continuity. The Board also considered that the compensation/profit structure at Dodge & Cox includes a return on shareholder employees’ investment in the firm, which is vital for remaining independent and facilitating retention of management and investment professionals. The Board also considered that in January 2015, Dodge & Cox closed the International Stock Fund to new investors to proactively manage the growth of the Fund. The Stock Fund and Balanced Fund were similarly closed to new investors during periods of significant growth in the past. While these actions are intended to benefit existing Fund shareholders, the effect is to reduce potential revenues to Dodge & Cox from new shareholders.
The Board also considered potential “fall-out” benefits (including the receipt of research from unaffiliated brokers and reputational benefits to non-U.S. funds sponsored and managed by Dodge & Cox) that Dodge & Cox might receive as a result of its association with the Funds and determined that they are acceptable. The Board also noted that Dodge & Cox continues to invest substantial sums in its business in order to provide enhanced services, systems, and research capabilities, all of which benefit the Funds. The Board concluded that Dodge & Cox’s profitability is the keystone of its independence, stability, and long-term investment performance and that the profitability of Dodge & Cox’s relationship with the Funds (including fall-out benefits) is fair and reasonable.
ECONOMIES OF SCALE
The Board considered whether there have been economies of scale with respect to the management of each Fund, whether the Funds have appropriately benefited from any economies of scale, and whether the management fee rate is reasonable in relation to the level of Fund assets and any economies of scale that may exist. In the Board’s view, any consideration of economies of scale must take account of the Funds’ low fee and expense structure and the fact that the Dodge & Cox Funds build economies of scale into their fee structures by charging low fees from a fund’s inception and keeping overall expenses down as a Fund grows, as compared to other fund complexes that employ fee “breakpoints” only after a fund reaches a certain scale. An assessment of economies of scale must also take into account that Dodge & Cox invests significant time and resources in each new Fund for months (and sometimes years) prior to launch; in addition, in a Fund’s early periods of operations, expenses are capped, which means that Dodge & Cox subsidizes the operations of a new Fund for a period of time until it reaches scale. The Board also observed that, while total Fund assets have grown significantly over the long term, this growth has not been continuous or evenly distributed across all of the Funds (for example, the total assets of the Balanced Fund have actually declined over the past ten years). In addition, the Board noted that Dodge & Cox has shared the benefits of economies of scale with the Funds by adding and enhancing services to the Funds over time, and that Dodge & Cox’s internal costs of providing investment management, technology, administrative, legal, and compliance services to the Funds continue to increase. For example, Dodge & Cox has increased its global research staff and investment resources over the years to add important new capabilities for the benefit of Fund shareholders and to address the increased complexity of investing globally.
In addition, Dodge & Cox has made substantial expenditures in other staff, technology, and infrastructure to enable it to integrate credit and equity analyses and to implement its strategy in a more effective and secure manner. Over the last ten years, Dodge & Cox has increased its spending on research, investment management, client servicing, cybersecurity, technology, third party research, data services, and computer systems for trading, operations, compliance, accounting, and communications at a rate that has significantly outpaced the Funds’ growth rate during the same period. The Board also observed that, even without fee breakpoints, the Funds are competitively priced in a very competitive market and that having a low fee from inception is better for shareholders than starting with a higher fee and adding breakpoints. The Board also noted that there are certain diseconomies of scale associated with managing large funds, insofar as certain of the costs and risks associated with portfolio management increase disproportionately as assets grow. The Board concluded that the current Dodge & Cox fee structure is fair and reasonable and adequately shares economies of scale that may exist.
PAGE 20§ DODGE & COX INTERNATIONAL STOCK FUND
CONCLUSION
Based on their evaluation of all material factors and assisted by the advice of independent legal counsel to the Independent Trustees, the Board, including the Independent Trustees, concluded that the advisory fee structure was fair and reasonable, that each Fund was paying a competitive fee for the services provided, that Dodge & Cox’s services have provided value for Fund shareholders over the long term, and that approval of the Agreements was in the best interests of each Fund and its shareholders.
DODGE & COX INTERNATIONAL STOCK FUND§PAGE 21
FUND HOLDINGS
The Fund provides a complete list of its holdings four times each fiscal year, as of the end of each quarter. The Fund files the lists with the Securities and Exchange Commission (SEC) onForm N-CSR (second and fourth quarters) and Form N-Q (first and third quarters). Shareholders may view the Fund’sForms N-CSR and N-Q on the SEC’s website at sec.gov. FormsN-CSR and N-Q may also be reviewed and copied at the SEC’s Public Reference Room in Washington, DC. Information regarding the operations of the Public Reference Room may be obtained by calling800-SEC-0330. A list of the Fund’s quarter-end holdings is also available at dodgeandcox.com on or about 15 days following each quarter end and remains available on the website until the list is updated in the subsequent quarter.
PROXY VOTING
For a free copy of the Fund’s proxy voting policies and procedures, please call 800-621-3979, visit the Fund’s website at dodgeandcox.com, or visit the SEC’s website at sec.gov. Information regarding how the Fund voted proxies relating to portfolio securities during the most recent 12-month period ending June 30 is also available at dodgeandcox.com or at sec.gov.
HOUSEHOLD MAILINGS
The Fund routinely mails shareholder reports and summary prospectuses to shareholders and, on occasion, proxy statements. In order to reduce the volume of mail, when possible, only one copy of these documents will be sent to shareholders who are part of the same family and share the same residential address.
If you have a direct account with the Funds and you do not want the mailing of shareholder reports and summary prospectuses combined with other members in your household, contact the Funds at 800-621-3979. Your request will be implemented within 30 days.
PAGE 22§ DODGE & COX INTERNATIONAL STOCK FUND
DODGE & COX FUNDS—EXECUTIVE OFFICER & TRUSTEE INFORMATION
| | | | | | |
| | | | |
Name (Age) and
Address* | | Position with Trust (Year of Election or
Appointment)** | | Principal Occupation During Past Five Years** | | Other Directorships of Public Companies Held
by Trustees |
| |
| INTERESTED TRUSTEES AND EXECUTIVE OFFICERS |
| Charles F. Pohl (60) | | Chairman and Trustee (since 2014) | | Chairman and Director of Dodge & Cox; Chief Investment Officer and member of U.S. Equity Investment Committee (USEIC), Global Equity Investment Committee (GEIC), and International Equity Investment Committee (IEIC) | | — |
| Dana M. Emery (57) | | President (since 2014) and Trustee (since 1993) | | Chief Executive Officer, President, and Director of Dodge & Cox;Co-Director of Fixed Income and member of U.S. Fixed Income Investment Committee (USFIIC) and Global Fixed Income Investment Committee (GFIIC) | | — |
| Diana S. Strandberg (59) | | Senior Vice President (since 2006) | | Senior Vice President and Director of Dodge & Cox; Director of International Equity and member of USEIC, GEIC, IEIC, and GFIIC | | — |
Roberta R.W. Kameda (58) | | Chief Legal Officer (since 2019) and Secretary (since 2017) | | Vice President, General Counsel, and Secretary (since 2017) of Dodge & Cox | | — |
| David H. Longhurst (61) | | Treasurer (since 2006) | | Vice President and Assistant Treasurer of Dodge & Cox | | — |
| Katherine M. Primas (44) | | Chief Compliance Officer (since 2010) | | Vice President and Chief Compliance Officer of Dodge & Cox | | — |
| |
| INDEPENDENT TRUSTEES |
| Caroline M. Hoxby (52) | | Trustee (since 2017) | | Professor of Economics, Stanford University; Director of the Economics of Education Program, National Bureau of Economic Research; Senior Fellow, Hoover Institution and Stanford Institute for Economic Policy Research | | — |
| Thomas A. Larsen (69) | | Trustee (since 2002) | | Senior Counsel of Arnold & Porter (law firm) (2013-2018); Partner of Arnold & Porter (until 2012); Director of Howard, Rice, Nemerovski, Canady, Falk & Rabkin (1977-2011) | | — |
| Ann Mather (58) | | Trustee (since 2011) | | CFO, Pixar Animation Studios (1999-2004) | | Director, Alphabet Inc. (internet information services) (since 2005); Director, Glu Mobile, Inc. (multimedia software) (since 2004); Director, Netflix, Inc. (internet television) (since 2010); Director, Arista Networks (cloud networking) (since 2013); Director, Shutterfly, Inc. (internet photography services/publishing) (since 2013) |
| Robert B. Morris III (66) | | Trustee (since 2011) | | Advisory Director, The Presidio Group (2005-2016); Partner and Managing Director—Global Investment Research at Goldman Sachs (until 2001) | | — |
| Gary Roughead (67) | | Trustee (since 2013) | | Robert and Marion Oster Distinguished Military Fellow, Hoover Institution (since 2012); Admiral, United States Navy (Ret.); U.S. Navy Chief of Naval Operations (2008-2011) | | Director, Northrop Grumman Corp. (global security) (since 2012); Director, Maersk Line, Limited (shipping and transportation) (since 2016) |
| Mark E. Smith (67) | | Trustee (since 2014) | | Executive Vice President, Managing Director—Fixed Income at Loomis Sayles & Company, L.P. (2003-2011) | | — |
| John B. Taylor (72) | | Trustee (since 2005) (and 1995-2001) | | Professor of Economics, Stanford University (since 1984); Senior Fellow, Hoover Institution (since 1996); Under Secretary for International Affairs, United States Treasury (2001-2005) | | — |
| * | | The address for each Officer and Trustee is 555 California Street, 40th Floor, San Francisco, California 94104. Each Officer and Trustee oversees all six series in the Dodge & Cox Funds complex and serves for an indefinite term. |
| ** | | Information as of February 14, 2019. |
Additional information about the Trust’s Trustees and Officers is available in the Trust’s Statement of Additional Information (SAI). You can get a free copy of the SAI by visiting the Funds’ website at dodgeandcox.com or calling
800-621-3979.
DODGE & COX INTERNATIONAL STOCK FUND§PAGE 23
dodgeandcox.com
For Fund literature, transactions, and account information, please visit the Funds’ website.
or write or call:
DODGE & COX FUNDS
c/o DST Asset Manager Solutions, Inc.
P.O. Box 219502
Kansas City, Missouri 64121-9502
(800) 621-3979
INVESTMENT MANAGER
Dodge & Cox
555 California Street, 40th Floor
San Francisco, California 94104
(415) 981-1710
This report is submitted for the general information of the shareholders of the Fund. The report is not authorized for distribution to prospective investors in the Fund unless it is accompanied by a current prospectus.
This report reflects our views, opinions, and portfolio holdings as of December 31, 2018, the end of the reporting period. Any such views are subject to change at any time based upon market or other conditions and Dodge & Cox disclaims any responsibility to update such views. These views may not be relied on as investment advice and, because investment decisions for a Dodge & Cox Fund are based on numerous factors, may not be relied on as an indication of trading intent on behalf of any Dodge & Cox Fund.
DODGE & COX FUNDS®
Annual Report
December 31, 2018
Balanced Fund
ESTABLISHED 1931
TICKER: DODBX
Important Notice:
Beginning on January 1, 2021, we intend to discontinue mailing paper copies of the Fund’s shareholder reports as permitted by new regulations adopted by the Securities and Exchange Commission, unless you specifically request paper copies from Dodge & Cox Funds or from your financial intermediary, such as a broker-dealer or bank. The reports will remain available to you on the Dodge & Cox Funds website (dodgeandcox.com), and you will be notified by mail each time a report is posted and provided with a link to access the report.
If you have already elected to receive shareholder reports electronically, you will not be affected by this change and do not need to take any action. If you have not done so already, you may elect to receive shareholder reports and other communications electronically by enrolling in e-delivery on the Funds website, or, if you are invested through a financial intermediary, by updating your mailing preferences through the intermediary.
If you wish to continue receiving paper copies of all future shareholder reports, please contact us at (800) 621-3979. Reports will be provided to you free of charge. If you are invested through a financial intermediary, you may contact your financial intermediary to request to receive paper copies. Your election to receive reports in paper form will apply to all funds held with Dodge & Cox Funds or through your financial intermediary, as applicable.
12/18 BF AR Printed on recycled paper
TO OUR SHAREHOLDERS
The Dodge & Cox Balanced Fund had a total return of –4.6% for year ended December 31, 2018, compared to a return of –2.4% for the Combined Index (a 60/40 blend of stocks and fixed income securities).
MARKET COMMENTARY
The U.S. equity market posted a loss for 2018 as the fourth quarter sell-off overwhelmed strong performance earlier in the year. During the first nine months of the year, U.S. equities posted solid returns: the S&P 500 Index was up 11% and reached an all-time high in late September. U.S. growth stocks (the higher valuation portion of the equity market) had outperformed value stocks (the lower valuation portion) by 13 percentage points during this period and by 39 percentage points since 2014.(a)
Starting in October, volatility spiked as investors became worried about the pace of U.S. interest rate increases, a weakening global economy, and rising geopolitical concerns, including the escalating trade conflict between the United States and China. Brexit-related uncertainty and Italy’s political turmoil also weighed on multinational companies. There was a significant correction in the fourth quarter, especially among technology stocks. Companies in more value-oriented sectors, including Health Care and Utilities, outperformed.
In fixed income, the broad U.S. investment-grade fixed income market posted a flat return for 2018 despite rising Treasury yields and the underperformance of corporate bonds. A flight to quality took hold during the fourth quarter as investors grappled with the aforementioned geopolitical uncertainty, changing expectations regarding the path of future Federal Reserve (Fed) rate hikes, and ongoing tensions between the United States and other important global trading partners.
INVESTMENT STRATEGY
Market volatility can create buying opportunities for patient, long-term, value-oriented investors like Dodge & Cox. As bottom-up investors, we pay close attention to macro factors, but our research process places more emphasis on individual company fundamentals relative to valuation, which we view as a more reliable factor in determining long-term investment merit.
We set the Fund’s asset allocation based on our long-term outlook for the Fund’s equity and fixed income holdings, which currently favors equities. We did not make any meaningful changes to this allocation during 2018. At year end, the Fund’s 65.2%(b) equity weighting (including 4.8% in preferred stocks) reflected our more positive outlook for total return potential from equities than from fixed income.
Equity Strategy
In 2018, we made gradual portfolio adjustments based on relative valuation changes. As valuations increased, we trimmed selected Information Technology and Health Care holdings that had performed strongly. The portfolio’s largest sale was Merck, a leading pharmaceutical company held in the portfolio since 2009. While the company has a strong management team, we decided to
sell Merck given its higher valuation and our concerns about Merck’s dependence on its blockbuster cancer drug Keytruda for future sales growth. In addition, we believe the company is entering a period of heavy, sustained investment as it manages through a product cycle, which could pressure profit margins.
Nevertheless, the portfolio remained overweight the Health Care sector (22.1% compared to 15.5% for the S&P 500). We are enthusiastic about the portfolio’s Pharmaceuticals holdings, as valuations are attractive and new drug approvals demonstrate improving research productivity. Their substantial cash flow is not sensitive to economic swings and healthy dividends provide a solid, stable source of return. We also believe Health Care is a more attractive, defensive alternative to Consumer Staples, where valuations are higher but growth prospects are lower.
Additionally, as a result of individual security selection, we increased the portfolio’s Energy exposure from 7.6% to 8.0% during 2018—a significant add given the S&P 500 Energy sector was down 18%. We also increased the portfolio’s exposure to select Industrials companies as valuations declined. For example, we initiated a position in United Technologies(c) (highlighted below) and added to the portfolio’s existing holdings in FedEx and Johnson Controls International.
Energy
During the fourth quarter, Brent crude oil prices dropped 35%, weighing heavily on the outlook for energy-related companies, and Energy was the worst-performing sector (down 24%) within the S&P 500. While the short-term direction of oil prices is difficult to forecast, we believe slower supply growth and increasing demand point to higher prices in the next three to five years. Weighing valuation against individual company fundamentals, we recently added to the portfolio’s positions in Occidental Petroleum, among others.
A multinational oil and gas company, Occidental Petroleum’s stock price declined 24% in the fourth quarter along with the broader Energy sector, due to concerns about the macro environment and oil supply. While the company faces political risks in Oman and the United Arab Emirates, we believe investors overreacted in the short term, given Occidental’s solid long-term underlying business fundamentals. Occidental is considered a partner of choice for many companies and countries due to its technological capabilities, experience managing reservoirs, and global reach. The company has an attractive growth profile and low-cost assets in the Permian Basin and the Middle East. Given low operating costs and modest maintenance capital expenditures, these businesses are profitable across a broad range of oil prices. Occidental’s proven management team has created a strong corporate culture with a focus on returns, steady growth, and consistent dividends. In addition, the company has a strong balance sheet, an attractive valuation at 14 times forward earnings, and a 5% dividend yield. On December 31, Occidental was a 1.6% position in the equity portfolio.
PAGE 2§ DODGE & COX BALANCED FUND
United Technologies
United Technologies is a multi-industry conglomerate comprised of world-class franchises in elevators/escalators (Otis), jet engines and aerospace supply (Pratt and Whitney), HVAC(d) (Carrier), fire/security, and refrigeration. United Technologies’ aerospace margins have been under pressure as Boeing and Airbus moved into the aftermarket, squeezing their supply base. Despite this risk, we believe the company is an attractive long-term investment opportunity at 14 times forward earnings. United Technologies has premier global franchises with attractive long-term growth potential and a high degree of forward visibility based on its substantial backlog (over seven years) of aerospace contracts. United Technologies recently acquired Rockwell Collins, making the combined company the largest global aerospace supplier. The launch of its new jet engine platform should drive earnings growth in the years ahead. Meanwhile, United Technologies has announced plans to split into three companies, which could create substantial shareholder value; we estimate each of its world-class franchises trades 15 to 20% below “pure-play” peers. United Technologies accounted for 1.3% of the equity portfolio on December 31.
Fixed Income Strategy
In response to changing valuations over the course of the year, we selectively added exposure across all major “spread” sectors, as the significant widening in yield premiums(e) resulted in a more favorable risk/reward dynamic. Amid these changes, however, the fixed income portfolio’s investment strategy has remained broadly consistent.
Credit: Adding Opportunistically at Attractive Valuations
The portfolio’s credit(f) weighting increased over the year, reflecting interesting opportunities in two distinct areas: issuance resulting from strategic corporate activity (e.g., mergers, acquisitions, spin-offs) and tactical additions to existing credit issuers. As always, these decisions are made at the individual security and issuer levels based on our team’s assessment of valuation and fundamentals.
We continued to find attractive opportunities among issuers tapping the new issue market to finance strategic transactions. We selectively participated in this segment of the market by focusing on large, durable enterprises that have a strong rationale for combining businesses, a commitment from management to de-lever, a credible plan for doing so, and multiple degrees of freedom to cushion against a negative surprise. For example, we recently added to Bayer, Cigna, Comcast, and CVS.
We also added to certain portfolio holdings, such as Cemex, Enel, and Petrobras, where pricing looked more attractive amid the broad widening of credit yield premiums. Other tactical purchases over the year included additions to high-quality corporates in the intermediate part of the curve. For example, we added to three- to five-year maturity securities issued by Ford Motor Credit and HSBC.
Although the backdrop and outlook for corporate borrowers have weakened slightly, we believe corporate fundamentals remain reasonable given healthy growth and profit margins, high interest coverage, and a well-capitalized banking sector. Valuations appear
attractive against this fundamental backdrop for the kind of issuers we tend to favor. Our credit analysis emphasizes leading companies with durable cash flows and balance sheets that can weather a full economic cycle. Historically, credit yield premiums near current valuation levels have provided attractive investment entry points.
Securitized: Adding Liquidity and Incremental Yield
The portfolio’s holdings in the Securitized sector consist predominantly of Agency(g) MBS, with a smaller position in AAA-rated asset-backed securities (ABS). As a group, these securities add incremental yield over Treasuries in the intermediate portion of the yield curve and, given their high credit quality and strong liquidity, provide ballast for the overall fixed income portfolio. As with credit investments, we utilize in-house fundamental research on securities in this sector to identify attractive total return opportunities over a broad range of interest rate, spread, and prepayment scenarios.
Over the course of 2018, we added to several mortgage and asset-backed securities at compelling valuations. Within MBS, we added to the portfolio’s position in Ginnie Mae-guaranteed Home Equity Conversion Mortgages (also known as Reverse Mortgages), among other holdings. These floating rate securities offer attractive spreads and low prepayment risk. Within ABS, we added to specific AAA-rated, floating rate ABS backed by 97% federally guaranteed student loans.
Defensive Duration(h): Mitigating Interest Rate Risk
We continue to position the fixed income portfolio defensively with regard to interest rate risk. The portfolio’s relative interest rate positioning is underpinned by three key factors. First, while we recognize that there will be a downshift in the pace of Fed tightening and the likely federal funds terminal rate over this cycle (implied by the rapid decline in interest rates in the fourth quarter), there is still a significant gap between market expectations for future federal funds rate increases (implied by the forward curve) and the Fed’s stated expectations. We believe this gap will narrow as the market prices in a more aggressive Fed hiking path. Second, we believe the U.S. economy remains on solid footing. While the boost to economic growth from the aggressive tax bill and expansionary budget will taper off in 2019, growth should remain solid. Third, the significant tightening in measures of unemployment has raised the prospects for more rapid wage growth and somewhat higher inflation than recent indicators show. Keeping in mind the Fed’s dual mandate of full employment and stable inflation, these factors should keep the Fed nudging short-term rates higher over time and add upward pressure on longer-term rates. For these reasons, we continue to believe that a shorter relative duration is prudent.
IN CLOSING
Despite the market turmoil, we remain optimistic about the long-term prospects for the Fund’s investments. The equity portfolio’s valuation is attractive and trades at a meaningful discount to the overall market: 12.1 times forward earnings compared to 15.4 times for the S&P 500. We continue to position the fixed income portfolio defensively from a capital preservation standpoint, while
DODGE & COX BALANCED FUND§PAGE 3
seeking opportunities to add incremental yield through our bottom-up, research-driven investment approach. We also believe longer-term global economic growth will be better than many investors expect, and the Fund is well positioned to capitalize on this.
Our fundamental, active, value-oriented investment approach requires conviction and patience. Accordingly, maintaining a long-term investment horizon and staying the course are essential. We thank you for your continued confidence in Dodge & Cox. As always, we welcome your comments and questions.
For the Board of Trustees,
| | |
| |
|
Charles F. Pohl, Chairman | | Dana M. Emery, President |
January 31, 2019
| (a) | | The Russell 1000 Growth Index had a total return of 17.1% compared to 3.9% for the Russell 1000 Value Index from December 31, 2017 through September 30, 2018. The Russell 1000 Growth Index had a total return of 72.5% compared to 33.2% for the Russell 1000 Value Index from December 31, 2014 through September 30, 2018. |
| (b) | | Unless otherwise specified, all weightings and characteristics are as of December 31, 2018. |
| (c) | | The use of specific examples does not imply that they are more or less attractive investments than the portfolio’s other holdings. |
| (d) | | HVAC = heating, ventilation, and air conditioning. |
| (e) | | Yield premiums are one way to measure a security’s valuation. Narrowing yield premiums result in a higher valuation. Widening yield premiums result in a lower valuation. |
| (f) | | Credit securities refers to corporate bonds and government-related securities, as classified by Bloomberg. |
| (g) | | The U.S. Government does not guarantee the Fund’s shares, yield, or net asset value. The agency guarantee (by, for example, Ginnie Mae, Fannie Mae, or Freddie Mac) does not eliminate market risk. |
| (h) | | Duration is a measure of a bond’s (or a bond portfolio’s) price sensitivity to changes in interest rates. |
PAGE 4§ DODGE & COX BALANCED FUND
2018 PERFORMANCE REVIEW
The Fund underperformed the Combined Index by 2.3 percentage points in 2018. The Fund’s lower allocation to fixed income had a negative impact on relative results.
Equity Portfolio
| | § | | In Financials, the portfolio’s average overweight position (27% versus 14%) and weak returns (down 17% compared to down 13% for the S&P 500 sector) hampered results. Goldman Sachs (down 34%), Capital One Financial (down 23%), and Wells Fargo (down 22%) lagged. | |
| | § | | The Energy sector was the worst-performing segment of the portfolio (holdings down 28%) and the S&P 500 (down 18%). The portfolio’s higher average weighting in the sector (8% versus 6%) also hurt results. Schlumberger (down 45%), Apache (down 36%), and Baker Hughes, a GE Company (down 30%) were particularly weak. | |
| | § | | In Health Care, the portfolio’s overweight position and holdings (up 9% compared to up 6% for the S&P 500 sector) had a significant, positive impact. Eli Lilly (up 40%), Express Scripts (up 24% to date of acquisition by Cigna), AstraZeneca (up 14%), and GlaxoSmithKline (up 14%) performed well. | |
| | § | | Twenty-First Century Fox (up 41%) and Dell Technologies (up 39%) also contributed. | |
Fixed Income Portfolio
| | § | | The portfolio’s overweight to corporate bonds and underweight to U.S. Treasuries detracted from relative returns given the significant underperformance of credit. | |
| | § | | Security selection within credit was negative as several issuers underperformed, including Pemex, Telecom Italia, and TransCanada. | |
| | § | | The portfolio’s shorter relative duration (72% of the Bloomberg Barclays U.S. Agg’s duration) added significantly to relative returns. | |
KEY CHARACTERISTICS OF DODGE & COX
Independent Organization
Dodge & Cox is one of the largest privately owned investment managers in the world. We remain committed to independence, with a goal of providing the highest quality investment management service to our existing clients.
Over 85 Years of Investment Experience
Dodge & Cox was founded in 1930. We have a stable and well-qualified team of investment professionals, most of whom have spent their entire careers at Dodge & Cox.
Experienced Investment Team
The U.S. Equity Investment Committee, which is responsible for determining the asset allocation of the Balanced Fund and managing the equity portion of the Balanced Fund, is a nine-member committee with an average tenure at Dodge & Cox of 24 years. The U.S. Fixed Income Investment Committee, which is responsible for managing the debt portion of the Balanced Fund, is a ten-member committee with an average tenure of 21 years.
One Business with a Single Research Office
Dodge & Cox manages equity (domestic, international, and global), fixed income (domestic and global), and balanced investments, operating from one office in San Francisco.
Consistent Investment Approach
Our team decision-making process involves thorough, bottom-up fundamental analysis of each investment.
Long-Term Focus and Low Expenses
We invest with a three- to five-year investment horizon, which has historically resulted in low turnover relative to our peers. We manage Funds that maintain low expense ratios.
Risks: The Fund is subject to market risk, meaning holdings in the Fund may decline in value for extended periods due to the financial prospects of individual companies or due to general market and economic conditions. The Fund also invests in individual bonds whose yields and market values fluctuate, so that an investment may be worth more or less than its original cost. Debt securities are subject to interest rate risk, credit risk, and prepayment and call risk, all of which could have adverse effects on the value of the Fund. A low interest rate environment creates an elevated risk of future negative returns. Financial intermediaries may restrict their market making activities for certain debt securities, which may reduce the liquidity and increase the volatility of such securities. Please read the prospectus and summary prospectus for specific details regarding the Fund’s risk profile.
DODGE & COX BALANCED FUND§PAGE 5
GROWTH OF $10,000 OVER 10 YEARS
FOR AN INVESTMENT MADE ON DECEMBER 31, 2008
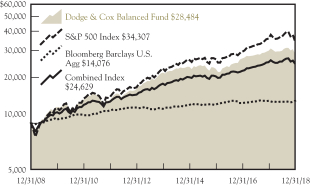
AVERAGE ANNUAL TOTAL RETURN
FOR PERIODS ENDED DECEMBER 31, 2018
| | | | | | | | | | | | | | | | |
| | | 1 Year | | | 5 Years | | | 10 Years | | | 20 Years | |
| | | | | | | | | | | | | | | | |
Dodge & Cox Balanced Fund | | | –4.61 | % | | | 5.77 | % | | | 11.04 | % | | | 7.86 | % |
S&P 500 Index | | | –4.38 | | | | 8.49 | | | | 13.12 | | | | 5.62 | |
Bloomberg Barclays U.S. Aggregate Bond Index (Bloomberg Barclays U.S. Agg) | | | 0.01 | | | | 2.52 | | | | 3.48 | | | | 4.55 | |
Combined Index(a) | | | –2.35 | | | | 6.25 | | | | 9.43 | | | | 5.49 | |
Returns represent past performance and do not guarantee future results. Investment return and share price will fluctuate with market conditions, and investors may have a gain or loss when shares are sold. Fund performance changes over time and currently may be significantly lower than stated. Performance is updated and published monthly. Visit the Fund’s website at dodgeandcox.com or call800-621-3979 for current performance figures.
The Fund’s total returns include the reinvestment of dividend and capital gain distributions, but have not been adjusted for any income taxes payable by shareholders on these distributions or on Fund share redemptions. Index returns include dividends and/or interest income but, unlike Fund returns, do not reflect fees or expenses.
Standard & Poor’s, Standard & Poor’s 500, and S&P 500® are trademarks of S&P Global Inc. Bloomberg is a registered trademark of Bloomberg Finance L.P. and its affiliates. Barclays® is a trademark of Barclays Bank PLC.
| (a) | The Combined Index reflects an unmanaged portfolio (rebalanced monthly) of 60% of the S&P 500 Index, which is a market capitalization-weighted index of 500 large-capitalization stocks commonly used to represent the U.S. equity market, and 40% of the Bloomberg Barclays U.S. Aggregate Bond Index (Bloomberg Barclays U.S. Agg), which is a widely recognized, unmanaged index of U.S. dollar-denominated, investment-grade, taxable fixed income securities. The Fund may, however, invest up to 75% of its total assets in equity securities. |
FUND EXPENSE EXAMPLE
As a Fund shareholder, you incur ongoing Fund costs, including management fees and other Fund expenses. All mutual funds have ongoing costs, sometimes referred to as operating expenses. The following example shows ongoing costs of investing in the Fund and can help you understand these costs and compare them with those of other mutual funds. The example assumes a $1,000 investment held for the six months indicated.
ACTUAL EXPENSES
The first line of the table below provides information about actual account values and expenses based on the Fund’s actual returns. You may use the information in this line, together with your account balance, to estimate the expenses that you paid over the period. Simply divide your account value by $1,000 (for example, an $8,600 account value divided by $1,000 = 8.6), then multiply the result by the number in the first line under the heading “Expenses Paid During Period” to estimate the expenses you paid on your account during this period.
HYPOTHETICAL EXAMPLE FOR COMPARISON WITH OTHER MUTUAL FUNDS
Information on the second line of the table can help you compare ongoing costs of investing in the Fund with those of other mutual funds. This information may not be used to estimate the actual ending account balance or expenses you paid during the period. The hypothetical “Ending Account Value” is based on the actual expense ratio of the Fund and an assumed 5% annual rate of return before expenses (not the Fund’s actual return). The amount under the heading “Expenses Paid During Period” shows the hypothetical expenses your account would have incurred under this scenario. You can compare this figure with the 5% hypothetical examples that appear in shareholder reports of other mutual funds.
| | | | | | | | | | | | |
Six Months Ended
December 31, 2018 | | Beginning Account Value
7/1/2018 | | | Ending Account Value
12/31/2018 | | | Expenses Paid
During Period* | |
Based on Actual Fund Return | | $ | 1,000.00 | | | $ | 953.80 | | | $ | 2.58 | |
Based on Hypothetical 5% Yearly Return | | | 1,000.00 | | | | 1,022.57 | | | | 2.67 | |
| * | | Expenses are equal to the Fund’s annualized expense ratio of 0.52%, multiplied by the average account value over the period, multiplied by 184/365 (to reflect theone-half year period). |
The expenses shown in the table highlight ongoing costs only and do not reflect any transactional fees or account maintenance fees. Though other mutual funds may charge such fees, please note that the Fund does not charge transaction fees (e.g., redemption fees, sales loads) or universal account maintenance fees (e.g., small account fees).
PAGE 6§ DODGE & COX BALANCED FUND
| | | | |
| FUND INFORMATION (unaudited) | | | December 31, 2018 | |
| | | | |
| GENERAL INFORMATION | | | |
Net Asset Value Per Share | | | $93.27 | |
Total Net Assets (billions) | | | $14.2 | |
Expense Ratio | | | 0.53% | |
Portfolio Turnover Rate | | | 24% | |
30-Day SEC Yield(a) | | | 2.55% | |
Fund Inception | | | 1931 | |
No sales charges or distribution fees | | | | |
Investment Manager:Dodge & Cox, San Francisco. Managed by the U.S. Equity Investment Committee, whose nine members’ average tenure at Dodge & Cox is 24 years, and by the U.S. Fixed Income Investment Committee, whose ten members’ average tenure is 21 years.
| | | | |
| EQUITY PORTFOLIO (65.2%) | | Fund | |
Number of Common Stocks | | | 69 | |
Number of Preferred Stocks | | | 5 | |
Median Market Capitalization (billions)(b) | | | $36 | |
Price-to-Earnings Ratio(b)(c) | | | 12.1x | |
Foreign Securities not in the S&P 500(d) | | | 8.0% | |
| | | | | | | | | | | | |
| FIVE LARGEST SECTORS (%) | | Common | | | Preferred | | | Fund | |
Financials | | | 15.7 | | | | 4.4 | | | | 20.1 | |
Health Care | | | 14.4 | | | | — | | | | 14.4 | |
Communication Services | | | 9.4 | | | | 0.4 | | | | 9.8 | |
Information Technology | | | 8.5 | | | | — | | | | 8.5 | |
Energy | | | 5.2 | | | | — | | | | 5.2 | |
| | | | | | | | | | | | |
| TEN LARGEST EQUITIES (%)(e) | | Common | | | Preferred | | | Fund | |
Wells Fargo & Co. | | | 2.3 | | | | 1.4 | | | | 3.7 | |
JPMorgan Chase & Co. | | | 1.6 | | | | 1.7 | | | | 3.3 | |
Comcast Corp. | | | 2.6 | | | | 0.4 | | | | 3.0 | |
Bank of America Corp. | | | 1.7 | | | | 0.5 | | | | 2.2 | |
Microsoft Corp. | | | 2.1 | | | | — | | | | 2.1 | |
Charter Communications, Inc. | | | 2.0 | | | | — | | | | 2.0 | |
Charles Schwab Corp. | | | 1.9 | | | | — | | | | 1.9 | |
Alphabet, Inc. | | | 1.9 | | | | — | | | | 1.9 | |
Capital One Financial Corp. | | | 1.8 | | | | — | | | | 1.8 | |
Novartis AG(Switzerland) | | | 1.7 | | | | — | | | | 1.7 | |
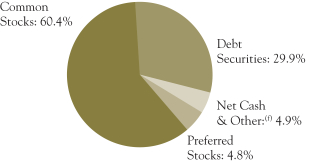
| | | | |
| FIXED INCOME PORTFOLIO (29.9%) | | Fund | |
Number of Credit Issuers | | | 51 | |
Effective Duration (years)(g) | | | 4.2 | |
| | | | |
| SECTOR DIVERSIFICATION (%) | | Fund | |
U.S. Treasury(h) | | | 2.9 | |
Government-Related(i) | | | 1.7 | |
Securitized | | | 13.3 | |
Corporate | | | 12.0 | |
| | | | |
| CREDIT QUALITY (%)(j) | | Fund | |
U.S. Treasury/Agency/GSE(h) | | | 13.7 | |
Aaa | | | 1.1 | |
Aa | | | 1.9 | |
A | | | 1.5 | |
Baa | | | 9.6 | |
Ba | | | 2.1 | |
B | | | 0.0 | |
Caa | | | 0.0 | |
| | | | |
| FIVE LARGEST CREDIT ISSUERS (%)(e) | | Fund | |
Charter Communications, Inc. | | | 0.8 | |
HSBC Holdings PLC | | | 0.5 | |
Petroleos Mexicanos | | | 0.5 | |
State of California GO | | | 0.5 | |
Verizon Communications, Inc. | | | 0.5 | |
| (a) | SEC Yield is an annualization of the Fund’s net investment income for the trailing30-day period. Dividends paid by the Fund may be higher or lower than implied by the SEC Yield. |
| (b) | Excludes the Fund’s preferred stock positions. |
| (c) | Price-to-earnings (P/E) ratio is calculated using12-month forward earnings estimates from third-party sources. |
| (d) | Foreign stocks are U.S. dollar denominated. |
| (e) | The Fund’s portfolio holdings are subject to change without notice. The mention of specific securities is not a recommendation to buy, sell, or hold any particular security and is not indicative of Dodge & Cox’s current or future trading activity. |
| (f) | Net Cash & Other includes cash, short-term investments, derivatives, receivables, and payables. |
| (g) | Interest rate derivatives reduce the duration of the fixed income portfolio by 0.2 years (i.e., total portfolio duration is 4.4 years without derivatives). |
| (h) | Data as presented excludes the Fund’s position in Treasury futures contracts. |
| (i) | The portfolio’s Government-Related holdings includetax-exempt municipal securities; the Index classifies these securities as Municipal Bonds. |
| (j) | The credit quality distribution shown for the Fund is based on the middle of Moody’s, S&P, and Fitch ratings, which is the methodology used by Bloomberg in constructing its indices. If a security is rated by only two agencies, the lower of the two ratings is used. Please note the Fund applies the highest of Moody’s, S&P, and Fitch ratings to determine compliance with the quality requirements stated in its prospectus. The credit quality of the investments in the portfolio does not apply to the stability or safety of the Fund or its shares. |
DODGE & COX BALANCED FUND§PAGE 7
| | | | |
| PORTFOLIO OF INVESTMENTS | | | December 31, 2018 | |
| | | | | | | | |
| COMMON STOCKS: 60.4% | |
| | |
| | | SHARES | | | VALUE | |
| COMMUNICATION SERVICES: 9.4% | |
MEDIA & ENTERTAINMENT: 8.4% | |
Alphabet, Inc., Class A(a) | | | 2,000 | | | $ | 2,089,920 | |
Alphabet, Inc., Class C(a) | | | 252,795 | | | | 261,797,030 | |
Charter Communications, Inc., Class A(a) | | | 999,207 | | | | 284,744,019 | |
Comcast Corp., Class A | | | 10,990,348 | | | | 374,221,349 | |
DISH Network Corp., Class A(a) | | | 1,675,032 | | | | 41,825,549 | |
News Corp., Class A | | | 1,057,504 | | | | 12,002,670 | |
Twenty-First Century Fox, Inc., Class A | | | 3,483,400 | | | | 167,621,208 | |
Twenty-First Century Fox, Inc., Class B | | | 852,000 | | | | 40,708,560 | |
| | | | | | | | |
| | | | 1,185,010,305 | |
TELECOMMUNICATION SERVICES: 1.0% | |
AT&T, Inc. | | | 1,566,716 | | | | 44,714,075 | |
Sprint Corp.(a) | | | 8,537,071 | | | | 49,685,753 | |
Zayo Group Holdings, Inc.(a) | | | 2,225,000 | | | | 50,819,000 | |
| | | | | | | | |
| | | | 145,218,828 | |
| | | | | | | | |
| | | | 1,330,229,133 | |
| CONSUMER DISCRETIONARY: 2.3% | |
AUTOMOBILES & COMPONENTS: 0.2% | |
Harley-Davidson, Inc. | | | 938,400 | | | | 32,018,208 | |
|
CONSUMER DURABLES & APPAREL: 0.2% | |
Mattel, Inc.(a) | | | 3,118,723 | | | | 31,156,043 | |
|
RETAILING: 1.9% | |
Booking Holdings, Inc.(a) | | | 76,300 | | | | 131,420,646 | |
Qurate Retail, Inc., Series A(a) | | | 4,285,850 | | | | 83,659,792 | |
Target Corp. | | | 166,681 | | | | 11,015,947 | |
The Gap, Inc. | | | 1,570,000 | | | | 40,443,200 | |
| | | | | | | | |
| | | | 266,539,585 | |
| | | | | | | | |
| | | | 329,713,836 | |
| | | | | | | | |
| CONSUMER STAPLES: 0.3% | |
FOOD, BEVERAGE & TOBACCO: 0.3% | |
Molson Coors Brewing Company, Class B | | | 847,896 | | | | 47,617,839 | |
|
| ENERGY: 5.2% | |
Anadarko Petroleum Corp. | | | 3,653,892 | | | | 160,186,625 | |
Apache Corp. | | | 4,460,439 | | | | 117,086,524 | |
Baker Hughes, a GE Company | | | 4,880,100 | | | | 104,922,150 | |
Concho Resources, Inc.(a) | | | 284,400 | | | | 29,233,476 | |
Halliburton Co. | | | 2,430,000 | | | | 64,589,400 | |
National Oilwell Varco, Inc. | | | 1,538,241 | | | | 39,532,794 | |
Occidental Petroleum Corp. | | | 2,346,814 | | | | 144,047,443 | |
Schlumberger, Ltd. (Curacao/United States) | | | 2,084,921 | | | | 75,223,950 | |
Weatherford International PLC(a)
(Ireland/United States) | | | 3,970,000 | | | | 2,219,230 | |
| | | | | | | | |
| | | | 737,041,592 | |
| FINANCIALS: 15.7% | |
BANKS: 6.0% | |
Bank of America Corp. | | | 9,810,300 | | | | 241,725,792 | |
BB&T Corp. | | | 1,250,584 | | | | 54,175,299 | |
JPMorgan Chase & Co. | | | 2,253,100 | | | | 219,947,622 | |
Wells Fargo & Co. | | | 7,220,106 | | | | 332,702,485 | |
| | | | | | | | |
| | | | 848,551,198 | |
DIVERSIFIED FINANCIALS: 7.8% | |
American Express Co. | | | 2,223,000 | | | | 211,896,360 | |
Bank of New York Mellon Corp. | | | 4,437,400 | | | | 208,868,418 | |
Capital One Financial Corp. | | | 3,361,248 | | | | 254,076,736 | |
Charles Schwab Corp. | | | 6,727,200 | | | | 279,380,616 | |
Goldman Sachs Group, Inc. | | | 920,000 | | | | 153,686,000 | |
| | | | | | | | |
| | | | 1,107,908,130 | |
INSURANCE: 1.9% | |
AEGON NV (Netherlands) | | | 12,230,828 | | | | 56,873,350 | |
Brighthouse Financial, Inc.(a) | | | 967,818 | | | | 29,499,093 | |
| | | | | | | | |
| | |
| | | SHARES | | | VALUE | |
MetLife, Inc. | | | 4,481,300 | | | $ | 184,002,178 | |
| | | | | | | | |
| | | | 270,374,621 | |
| | | | | | | | |
| | | | 2,226,833,949 | |
| HEALTH CARE: 14.4% | |
HEALTH CARE EQUIPMENT & SERVICES: 3.6% | |
Cigna Corp. | | | 1,124,620 | | | | 213,587,909 | |
CVS Health Corp. | | | 1,320,000 | | | | 86,486,400 | |
Danaher Corp. | | | 349,100 | | | | 35,999,192 | |
Medtronic PLC (Ireland/United States) | | | 514,200 | | | | 46,771,632 | |
UnitedHealth Group, Inc. | | | 495,072 | | | | 123,332,336 | |
| | | | | | | | |
| | | | 506,177,469 | |
PHARMACEUTICALS, BIOTECHNOLOGY & LIFE SCIENCES: 10.8% | |
Alnylam Pharmaceuticals, Inc.(a) | | | 386,000 | | | | 28,143,260 | |
AstraZeneca PLC ADR (United Kingdom) | | | 4,375,899 | | | | 166,196,644 | |
Bristol-Myers Squibb Co. | | | 3,784,800 | | | | 196,733,904 | |
Eli Lilly and Co. | | | 1,416,049 | | | | 163,865,190 | |
Gilead Sciences, Inc. | | | 1,555,680 | | | | 97,307,784 | |
GlaxoSmithKline PLC ADR (United Kingdom) | | | 4,515,000 | | | | 172,518,150 | |
Incyte Corp.(a) | | | 470,000 | | | | 29,887,300 | |
Novartis AG ADR (Switzerland) | | | 2,880,600 | | | | 247,184,286 | |
Roche Holding AG ADR (Switzerland) | | | 6,031,000 | | | | 187,443,480 | |
Sanofi ADR (France) | | | 5,685,265 | | | | 246,797,354 | |
| | | | | | | | |
| | | | 1,536,077,352 | |
| | | | | | | | |
| | | | 2,042,254,821 | |
| INDUSTRIALS: 4.0% | |
CAPITAL GOODS: 2.1% | |
Johnson Controls International PLC
(Ireland/United States) | | | 6,077,214 | | | | 180,189,395 | |
United Technologies Corp. | | | 1,160,000 | | | | 123,516,800 | |
| | | | | | | | |
| | | | 303,706,195 | |
TRANSPORTATION: 1.9% | |
FedEx Corp. | | | 1,371,354 | | | | 221,240,541 | |
Union Pacific Corp. | | | 295,400 | | | | 40,833,142 | |
| | | | | | | | |
| | | | 262,073,683 | |
| | | | | | | | |
| | | | 565,779,878 | |
| INFORMATION TECHNOLOGY: 8.5% | |
SEMICONDUCTORS & SEMICONDUCTOR EQUIPMENT: 1.2% | |
Maxim Integrated Products, Inc. | | | 770,191 | | | | 39,164,213 | |
Microchip Technology, Inc. | | | 1,760,900 | | | | 126,643,928 | |
| | | | | | | | |
| | | | 165,808,141 | |
SOFTWARE & SERVICES: 2.9% | |
Dell Technologies, Inc., Class C(a) | | | 802,168 | | | | 39,201,950 | |
Micro Focus International PLC ADR (United Kingdom) | | | 3,678,727 | | | | 63,310,892 | |
Microsoft Corp. | | | 2,921,400 | | | | 296,726,598 | |
Synopsys, Inc.(a) | | | 40,602 | | | | 3,420,312 | |
| | | | | | | | |
| | | | 402,659,752 | |
TECHNOLOGY, HARDWARE & EQUIPMENT: 4.4% | |
Cisco Systems, Inc. | | | 2,746,000 | | | | 118,984,180 | |
Hewlett Packard Enterprise Co. | | | 12,545,520 | | | | 165,726,319 | |
HP Inc. | | | 7,066,573 | | | | 144,582,084 | |
Juniper Networks, Inc. | | | 3,350,329 | | | | 90,157,353 | |
TE Connectivity, Ltd. (Switzerland) | | | 1,438,836 | | | | 108,819,167 | |
| | | | | | | | |
| | | | 628,269,103 | |
| | | | | | | | |
| | | | 1,196,736,996 | |
| MATERIALS: 0.6% | |
Ball Corporation | | | 172,986 | | | | 7,953,896 | |
Celanese Corp. | | | 817,532 | | | | 73,553,354 | |
| | | | | | | | |
| | | | | | | 81,507,250 | |
| | | | | | | | |
TOTAL COMMON STOCKS
(Cost $6,283,814,700) | | | $ | 8,557,715,294 | |
| | |
| PAGE 8§ DODGE & COX BALANCED FUND | | See accompanying Notes to Financial Statements |
| | | | |
| PORTFOLIO OF INVESTMENTS | | | December 31, 2018 | |
| | | | | | | | |
| PREFERRED STOCKS: 4.8% | |
| | |
| | | PAR VALUE | | | VALUE | |
| COMMUNICATION SERVICES: 0.4% | |
MEDIA & ENTERTAINMENT: 0.4% | |
NBCUniversal Enterprise, Inc. 5.25%(c) | | $ | 53,210,000 | | | $ | 53,875,125 | |
|
| FINANCIALS: 4.4% | |
BANKS: 4.4% | |
Bank of America Corp. 6.10%(g) | | | 16,008,000 | | | | 15,767,880 | |
Bank of America Corp. 6.25%(g) | | | 52,470,000 | | | | 51,840,360 | |
Citigroup, Inc. 5.95%(g) | | | 5,175,000 | | | | 4,722,705 | |
Citigroup, Inc. 5.95%(g) | | | 77,327,000 | | | | 69,980,935 | |
Citigroup, Inc. 6.25%(g) | | | 45,886,000 | | | | 43,945,022 | |
JPMorgan Chase & Co. 6.10%(g) | | | 246,575,000 | | | | 245,033,906 | |
Wells Fargo & Co. 5.875%(g) | | | 202,295,000 | | | | 199,958,493 | |
| | | | | | | | |
| | | | | | | 631,249,301 | |
| | | | | | | | |
TOTAL PREFERRED STOCKS
(Cost $700,532,952) | | | $ | 685,124,426 | |
|
| DEBT SECURITIES: 29.9% | |
| U.S. TREASURY: 2.9% | |
U.S. Treasury Note/Bond | |
1.125%, 7/31/21 | | | 9,770,000 | | | | 9,438,623 | |
1.75%, 11/30/21 | | | 101,300,000 | | | | 99,252,408 | |
2.875%, 9/30/23 | | | 100,000,000 | | | | 101,621,179 | |
2.875%, 10/31/23 | | | 100,000,000 | | | | 101,659,096 | |
2.875%, 11/30/23 | | | 91,885,000 | | | | 93,480,192 | |
| | | | | | | | |
| | | | | | | 405,451,498 | |
| GOVERNMENT-RELATED: 1.7% | |
FEDERAL AGENCY: 0.0% | |
Small Business Admin. — 504 Program | |
Series1999-20F 1, 6.80%, 6/1/19 | | | 26,059 | | | | 26,206 | |
Series2000-20D 1, 7.47%, 4/1/20 | | | 266,872 | | | | 270,524 | |
Series2000-20E 1, 8.03%, 5/1/20 | | | 54,053 | | | | 55,025 | |
Series2000-20G 1, 7.39%, 7/1/20 | | | 124,041 | | | | 125,719 | |
Series2000-20I 1, 7.21%, 9/1/20 | | | 46,880 | | | | 47,489 | |
Series2001-20E 1, 6.34%, 5/1/21 | | | 258,476 | | | | 263,664 | |
Series2001-20G 1, 6.625%, 7/1/21 | | | 263,355 | | | | 269,128 | |
Series2003-20J 1, 4.92%, 10/1/23 | | | 1,116,453 | | | | 1,154,972 | |
Series2007-20F 1, 5.71%, 6/1/27 | | | 1,438,634 | | | | 1,513,268 | |
| | | | | | | | |
| | | | | | | 3,725,995 | |
FOREIGN AGENCY: 0.7% | |
Petroleo Brasileiro SA (Brazil)
4.375%, 5/20/23 | | | 7,620,000 | | | | 7,268,490 | |
5.999%, 1/27/28 | | | 18,785,000 | | | | 17,686,265 | |
Petroleos Mexicanos (Mexico)
6.875%, 8/4/26 | | | 13,775,000 | | | | 13,389,300 | |
6.50%, 3/13/27 | | | 18,400,000 | | | | 17,296,000 | |
6.625%, 6/15/35 | | | 9,425,000 | | | | 8,228,025 | |
6.375%, 1/23/45 | | | 20,125,000 | | | | 16,200,625 | |
6.75%, 9/21/47 | | | 5,925,000 | | | | 4,899,323 | |
6.35%, 2/12/48 | | | 15,466,000 | | | | 12,318,978 | |
| | | | | | | | |
| | | | | | | 97,287,006 | |
LOCAL AUTHORITY: 1.0% | |
New Jersey Turnpike Authority RB
7.102%, 1/1/41 | | | 12,436,000 | | | | 16,988,447 | |
State of California GO
7.50%, 4/1/34 | | | 13,470,000 | | | | 18,355,973 | |
7.55%, 4/1/39 | | | 14,475,000 | | | | 20,736,161 | |
7.30%, 10/1/39 | | | 18,730,000 | | | | 25,711,046 | |
7.625%, 3/1/40 | | | 4,590,000 | | | | 6,535,196 | |
State of Illinois GO
5.877%, 3/1/19 | | | 10,225,000 | | | | 10,270,195 | |
5.00%, 11/1/20 | | | 8,000,000 | | | | 8,260,560 | |
5.00%, 11/1/21 | | | 10,500,000 | | | | 10,977,645 | |
5.10%, 6/1/33 | | | 22,615,000 | | | | 21,561,819 | |
| | | | | | | | |
| | | | | | | 139,397,042 | |
| | | | | | | | |
| | | | | | | 240,410,043 | |
| | | | | | | | |
| | |
| | | PAR VALUE | | | VALUE | |
| SECURITIZED: 13.3% | |
ASSET-BACKED: 2.5% | |
Auto Loan: 0.2% | |
Ford Credit Auto Owner Trust | |
Series 2015-REV1 A, 2.12%, 7/15/26(c) | | $ | 16,450,000 | | | $ | 16,281,971 | |
Series 2017-REV2 A, 2.36%, 3/15/29(c) | | | 6,721,000 | | | | 6,546,950 | |
| | | | | | | | |
| | | | | | | 22,828,921 | |
Credit Card: 0.3% | |
Bank of America Credit Card Trust
Series2018-A1 A1, 2.70%, 7/17/23 | | | 44,399,000 | | | | 44,236,695 | |
Other: 0.4% | |
Rio Oil Finance Trust (Brazil)
9.25%, 7/6/24(c) | | | 22,697,041 | | | | 24,200,720 | |
9.75%, 1/6/27(c) | | | 32,065,226 | | | | 35,071,341 | |
| | | | | | | | |
| | | | | | | 59,272,061 | |
Student Loan: 1.6% | |
Navient Student Loan Trust
USD LIBOR1-Month | | | | | | | | |
+0.80%, 3.306%, 7/26/66(c) | | | 9,239,626 | | | | 9,254,838 | |
+1.15%, 3.656%, 7/26/66(c) | | | 6,902,000 | | | | 6,979,425 | |
+0.75%, 3.256%, 3/25/67(c) | | | 86,422,000 | | | | 85,942,945 | |
SLM Student Loan Trust
USD LIBOR1-Month | | | | | | | | |
+0.75%, 3.256%, 1/25/45(c) | | | 43,805,592 | | | | 43,549,369 | |
USD LIBOR3-Month | | | | | | | | |
+0.17%, 2.66%, 1/25/41 | | | 15,288,203 | | | | 14,832,504 | |
+0.55%, 3.04%, 10/25/64(c) | | | 49,262,000 | | | | 49,384,017 | |
SLM Student Loan Trust (Private Loans)
Series2014-A A2A, 2.59%, 1/15/26(c) | | | 1,337,801 | | | | 1,335,453 | |
SMB Private Education Loan Trust (Private Loans)
Series2018-B A2A, 3.60%, 1/15/37(c) | | | 19,845,000 | | | | 20,095,392 | |
| | | | | | | | |
| | | | | | | 231,373,943 | |
| | | | | | | | |
| | | | | | | 357,711,620 | |
CMBS: 0.2% | |
Agency CMBS: 0.2% | |
Fannie Mae Multifamily DUS | |
Pool AL8144, 2.405%, 10/1/22 | | | 7,692,715 | | | | 7,636,101 | |
Pool AL9086, 2.306%, 7/1/23 | | | 1,587,917 | | | | 1,558,186 | |
Freddie Mac Multifamily Interest Only | |
Series K055 X1, 1.366%, 3/25/26(f) | | | 10,571,095 | | | | 867,082 | |
Series K056 X1, 1.266%, 5/25/26(f) | | | 4,631,864 | | | | 353,439 | |
Series K057 X1, 1.192%, 7/25/26(f) | | | 3,797,030 | | | | 279,422 | |
Series K064 X1, 0.608%, 3/25/27(f) | | | 9,538,316 | | | | 401,180 | |
Series K065 X1, 0.674%, 4/25/27(f) | | | 44,274,096 | | | | 2,082,614 | |
Series K066 X1, 0.753%, 6/25/27(f) | | | 37,814,529 | | | | 1,996,055 | |
Series K069 X1, 0.369%, 9/25/27(f) | | | 238,701,660 | | | | 6,790,179 | |
| | | | | | | | |
| | | | | | | 21,964,258 | |
| | | | | | | | |
| | | | | | | 21,964,258 | |
MORTGAGE-RELATED: 10.6% | |
Federal Agency CMO & REMIC: 2.1% | |
Dept. of Veterans Affairs | |
Series1995-1 1, 6.848%, 2/15/25(f) | | | 185,626 | | | | 196,116 | |
Series1995-2C 3A, 8.793%, 6/15/25 | | | 89,521 | | | | 100,237 | |
Series2002-1 2J, 6.50%, 8/15/31 | | | 6,402,061 | | | | 7,192,062 | |
Fannie Mae | |
Trust2002-33 A1, 7.00%, 6/25/32 | | | 1,395,779 | | | | 1,541,058 | |
Trust2009-66 ET, 6.00%, 5/25/39 | | | 982,232 | | | | 1,020,956 | |
Trust2009-30 AG, 6.50%, 5/25/39 | | | 1,461,144 | | | | 1,584,708 | |
Trust2001-T7 A1, 7.50%, 2/25/41 | | | 1,061,013 | | | | 1,207,566 | |
Trust2001-T5 A3, 7.50%, 6/19/41(f) | | | 466,032 | | | | 524,430 | |
Trust2001-T8 A1, 7.50%, 7/25/41 | | | 1,145,982 | | | | 1,299,458 | |
Trust2001-T4 A1, 7.50%, 7/25/41 | | | 1,134,531 | | | | 1,296,361 | |
Trust2001-W3 A, 7.00%, 9/25/41(f) | | | 713,496 | | | | 760,891 | |
| | |
| See accompanying Notes to Financial Statements | | DODGE & COX BALANCED FUND§PAGE 9 |
| | | | |
| PORTFOLIO OF INVESTMENTS | | | December 31, 2018 | |
| | | | | | | | |
DEBT SECURITIES (continued) | |
| | |
| | | PAR VALUE | | | VALUE | |
Trust2001-T10 A2, 7.50%, 12/25/41 | | $ | 819,348 | | | $ | 937,105 | |
Trust2013-106 MA, 4.00%, 2/25/42 | | | 7,351,688 | | | | 7,570,693 | |
Trust2002-W6 2A1, 7.00%, 6/25/42(f) | | | 1,150,561 | | | | 1,245,750 | |
Trust2002-W8 A2, 7.00%, 6/25/42 | | | 1,429,682 | | | | 1,627,789 | |
Trust2003-W2 1A1, 6.50%, 7/25/42 | | | 2,425,877 | | | | 2,680,457 | |
Trust2003-W2 1A2, 7.00%, 7/25/42 | | | 987,696 | | | | 1,117,738 | |
Trust2003-W4 4A, 7.50%, 10/25/42(f) | | | 1,173,603 | | | | 1,295,361 | |
Trust2012-121 NB, 7.00%, 11/25/42 | | | 1,657,639 | | | | 1,861,525 | |
Trust2004-T1 1A2, 6.50%, 1/25/44 | | | 1,480,662 | | | | 1,656,699 | |
Trust2004-W2 5A, 7.50%, 3/25/44 | | | 2,148,498 | | | | 2,383,905 | |
Trust2004-W8 3A, 7.50%, 6/25/44 | | | 369,649 | | | | 420,540 | |
Trust2005-W4 1A2, 6.50%, 8/25/45 | | | 3,499,269 | | | | 3,895,470 | |
Trust2009-11 MP, 7.00%, 3/25/49 | | | 3,192,669 | | | | 3,627,646 | |
USD LIBOR1-Month | | | | | | | | |
+0.55%, 3.056%, 9/25/43 | | | 6,925,480 | | | | 6,999,446 | |
Freddie Mac | |
Series 1078 GZ, 6.50%, 5/15/21 | | | 24,961 | | | | 25,222 | |
Series 16 PK, 7.00%, 8/25/23 | | | 1,056,844 | | | | 1,114,088 | |
SeriesT-48 1A4, 5.538%, 7/25/33 | | | 22,666,175 | | | | 24,316,841 | |
SeriesT-51 1A, 6.50%, 9/25/43(f) | | | 155,413 | | | | 175,990 | |
SeriesT-59 1A1, 6.50%, 10/25/43 | | | 8,052,396 | | | | 9,340,229 | |
Series 4281 BC, 4.50%, 12/15/43(f) | | | 42,797,198 | | | | 45,495,275 | |
USD LIBOR1-Month | | | | | | | | |
+0.61%, 3.065%, 9/15/43 | | | 15,530,539 | | | | 15,718,598 | |
Ginnie Mae | |
USD LIBOR1-Month | | | | | | | | |
+0.62%, 2.934%, 9/20/64 | | | 3,829,314 | | | | 3,848,866 | |
USD LIBOR12-Month | | | | | | | | |
+0.30%, 2.26%, 1/20/67 | | | 24,305,644 | | | | 24,456,327 | |
+0.23%, 3.07%, 10/20/67 | | | 22,353,891 | | | | 22,419,777 | |
+0.23%, 3.07%, 10/20/67 | | | 13,556,636 | | | | 13,594,687 | |
+0.06%, 2.35%, 12/20/67 | | | 35,299,524 | | | | 35,118,081 | |
+0.08%, 2.81%, 5/20/68 | | | 10,015,063 | | | | 9,961,856 | |
+0.25%, 3.05%, 6/20/68 | | | 30,917,783 | | | | 31,083,437 | |
| | | | | | | | |
| | | | | | | 290,713,241 | |
Federal Agency Mortgage Pass-Through: 8.5% | |
Fannie Mae, 15 Year
6.00%, 3/1/22 | | | 110,203 | | | | 112,221 | |
4.50%, 1/1/25-1/1/27 | | | 7,620,368 | | | | 7,842,883 | |
3.50%, 11/1/25-12/1/29 | | | 21,738,893 | | | | 22,018,071 | |
Fannie Mae, 20 Year
4.00%, 11/1/30-2/1/37 | | | 40,690,269 | | | | 42,107,384 | |
4.50%, 1/1/31-12/1/34 | | | 62,175,059 | | | | 65,027,356 | |
3.50%, 6/1/35-4/1/37 | | | 76,715,520 | | | | 77,473,465 | |
Fannie Mae, 30 Year
6.50%, 12/1/28-8/1/39 | | | 14,467,604 | | | | 16,282,209 | |
5.50%, 7/1/33-8/1/37 | | | 9,398,704 | | | | 10,124,269 | |
6.00%, 9/1/36-8/1/37 | | | 13,067,149 | | | | 14,257,817 | |
7.00%, 8/1/37 | | | 356,854 | | | | 394,619 | |
4.50%, 1/1/39-7/1/48 | | | 374,781,538 | | | | 389,681,444 | |
Fannie Mae, 40 Year
4.50%, 6/1/56 | | | 38,650,223 | | | | 40,167,444 | |
Fannie Mae, Hybrid ARM
1-Year U.S. Treasury CMT | | | | | | | | |
+2.05%, 4.305%, 9/1/34 | | | 709,629 | | | | 740,647 | |
USD LIBOR12-Month | | | | | | | | |
+1.35%, 4.257%, 12/1/34 | | | 1,054,343 | | | | 1,088,357 | |
+1.58%, 3.947%, 1/1/35 | | | 770,367 | | | | 801,967 | |
+1.51%, 4.293%, 8/1/35 | | | 678,554 | | | | 703,569 | |
+1.64%, 3.807%, 5/1/37 | | | 972,686 | | | | 1,015,968 | |
+1.85%, 4.188%, 7/1/39 | | | 1,504,774 | | | | 1,544,644 | |
+1.78%, 3.763%, 11/1/40 | | | 1,434,526 | | | | 1,455,554 | |
+1.78%, 3.63%, 12/1/40 | | | 3,529,724 | | | | 3,616,902 | |
+1.57%, 4.429%, 11/1/43 | | | 2,997,151 | | | | 3,091,383 | |
+1.55%, 2.684%, 4/1/44 | | | 8,837,865 | | | | 9,220,050 | |
+1.60%, 2.811%, 11/1/44 | | | 16,389,821 | | | | 16,495,850 | |
+1.60%, 2.801%, 12/1/44 | | | 11,588,889 | | | | 11,652,998 | |
+1.59%, 2.882%, 9/1/45 | | | 3,040,302 | | | | 3,055,268 | |
+1.59%, 2.843%, 12/1/45 | | | 15,843,763 | | | | 15,932,535 | |
+1.59%, 2.652%, 1/1/46 | | | 13,377,029 | | | | 13,400,225 | |
| | | | | | | | |
| | |
| | | PAR VALUE | | | VALUE | |
+1.61%, 2.958%, 4/1/46 | | $ | 8,005,930 | | | $ | 8,012,420 | |
+1.61%, 2.524%, 12/1/46 | | | 12,993,081 | | | | 12,768,666 | |
+1.61%, 3.177%, 6/1/47 | | | 11,785,287 | | | | 11,887,936 | |
+1.61%, 3.14%, 7/1/47 | | | 16,568,234 | | | | 16,695,171 | |
+1.60%, 2.716%, 8/1/47 | | | 20,166,910 | | | | 20,224,729 | |
USD LIBOR6-Month | | | | | | | | |
+1.54%, 4.168%, 1/1/35 | | | 1,175,960 | | | | 1,213,083 | |
Freddie Mac, Hybrid ARM1-Year U.S. Treasury CMT | | | | | | | | |
+2.25%, 4.687%, 10/1/35 | | | 1,665,363 | | | | 1,753,439 | |
USD LIBOR12-Month | | | | | | | | |
+1.96%, 4.514%, 5/1/34 | | | 1,549,764 | | | | 1,631,632 | |
+1.56%, 3.94%, 4/1/37 | | | 1,631,669 | | | | 1,697,159 | |
+1.79%, 4.543%, 9/1/37 | | | 1,104,955 | | | | 1,156,681 | |
+1.94%, 4.586%, 1/1/38 | | | 252,403 | | | | 264,106 | |
+2.06%, 4.03%, 2/1/38 | | | 2,499,631 | | | | 2,635,584 | |
+1.96%, 4.647%, 7/1/38 | | | 196,801 | | | | 204,176 | |
+1.73%, 4.226%, 10/1/38 | | | 937,133 | | | | 981,183 | |
+1.79%, 3.619%, 10/1/41 | | | 830,123 | | | | 851,860 | |
+1.79%, 2.787%, 8/1/42 | | | 5,449,034 | | | | 5,564,780 | |
+1.62%, 2.955%, 5/1/44 | | | 10,516,863 | | | | 10,602,136 | |
+1.61%, 3.054%, 5/1/44 | | | 1,435,160 | | | | 1,449,067 | |
+1.62%, 2.921%, 6/1/44 | | | 3,420,621 | | | | 3,446,858 | |
+1.62%, 3.172%, 6/1/44 | | | 3,297,796 | | | | 3,343,147 | |
+1.63%, 3.066%, 1/1/45 | | | 17,031,627 | | | | 17,178,916 | |
+1.62%, 2.736%, 10/1/45 | | | 8,604,258 | | | | 8,612,047 | |
+1.62%, 2.821%, 10/1/45 | | | 9,840,342 | | | | 9,876,927 | |
+1.63%, 3.245%, 7/1/47 | | | 9,591,408 | | | | 9,678,854 | |
Freddie Mac Gold, 15 Year
4.50%, 9/1/24-9/1/26 | | | 5,164,621 | | | | 5,324,276 | |
Freddie Mac Gold, 20 Year
6.50%, 10/1/26 | | | 2,637,441 | | | | 2,826,389 | |
4.50%, 4/1/31-6/1/31 | | | 8,117,086 | | | | 8,485,421 | |
Freddie Mac Gold, 30 Year
7.75%, 7/25/21 | | | 88,301 | | | | 89,155 | |
7.47%, 3/17/23 | | | 54,249 | | | | 56,287 | |
6.50%, 12/1/32-4/1/33 | | | 4,327,282 | | | | 4,819,136 | |
7.00%, 11/1/37-9/1/38 | | | 3,520,709 | | | | 3,986,849 | |
5.50%, 12/1/37 | | | 513,291 | | | | 554,567 | |
6.00%, 2/1/39 | | | 1,278,481 | | | | 1,396,111 | |
4.50%, 9/1/41-8/1/47 | | | 251,475,594 | | | | 261,325,259 | |
Ginnie Mae, 30 Year
7.97%, 4/15/20-1/15/21 | | | 65,594 | | | | 67,006 | |
7.50%, 11/15/24-10/15/25 | | | 448,620 | | | | 483,589 | |
| | | | | | | | |
| | | | | | | 1,210,449,701 | |
| | | | | | | | |
| | | | | | | 1,501,162,942 | |
| | | | | | | | |
| | | | | | | 1,880,838,820 | |
| CORPORATE: 12.0% | |
FINANCIALS: 4.3% | |
Bank of America Corp.
3.004%, 12/20/23(g) | | | 44,918,000 | | | | 43,608,931 | |
4.20%, 8/26/24 | | | 5,825,000 | | | | 5,776,803 | |
4.45%, 3/3/26 | | | 3,970,000 | | | | 3,927,998 | |
4.25%, 10/22/26 | | | 2,970,000 | | | | 2,890,099 | |
4.183%, 11/25/27 | | | 7,925,000 | | | | 7,621,602 | |
Barclays PLC (United Kingdom)
4.375%, 9/11/24 | | | 18,275,000 | | | | 17,251,343 | |
4.836%, 5/9/28 | | | 4,525,000 | | | | 4,149,658 | |
BNP Paribas SA (France)
4.25%, 10/15/24 | | | 31,175,000 | | | | 30,818,933 | |
4.375%, 9/28/25(c) | | | 20,120,000 | | | | 19,558,872 | |
4.375%, 5/12/26(c) | | | 8,000,000 | | | | 7,702,328 | |
4.625%, 3/13/27(c) | | | 4,275,000 | | | | 4,151,751 | |
Boston Properties, Inc.
3.85%, 2/1/23 | | | 7,800,000 | | | | 7,813,475 | |
3.125%, 9/1/23 | | | 17,550,000 | | | | 16,953,963 | |
3.80%, 2/1/24 | | | 5,000,000 | | | | 4,981,320 | |
| | |
| PAGE 10§ DODGE & COX BALANCED FUND | | See accompanying Notes to Financial Statements |
| | | | |
| PORTFOLIO OF INVESTMENTS | | | December 31, 2018 | |
| | | | | | | | |
DEBT SECURITIES (continued) | |
| | |
| | | PAR VALUE | | | VALUE | |
3.65%, 2/1/26 | | $ | 4,450,000 | | | $ | 4,308,750 | |
Capital One Financial Corp.
3.50%, 6/15/23 | | | 21,006,000 | | | | 20,628,152 | |
4.20%, 10/29/25 | | | 10,175,000 | | | | 9,831,777 | |
Cigna Corp.
3.75%, 7/15/23(c) | | | 16,900,000 | | | | 16,842,677 | |
4.125%, 11/15/25(c) | | | 4,100,000 | | | | 4,096,127 | |
7.875%, 5/15/27 | | | 17,587,000 | | | | 21,679,920 | |
Citigroup, Inc.
4.00%, 8/5/24 | | | 5,925,000 | | | | 5,853,198 | |
USD LIBOR3-Month | | | | | | | | |
+6.37%, 8.89%, 10/30/40(b) | | | 37,080,925 | | | | 39,142,624 | |
Equity Residential
3.00%, 4/15/23 | | | 14,775,000 | | | | 14,531,915 | |
2.85%, 11/1/26 | | | 6,000,000 | | | | 5,642,527 | |
HSBC Holdings PLC (United Kingdom)
3.95%, 5/18/24(g) | | | 19,200,000 | | | | 19,095,178 | |
4.30%, 3/8/26 | | | 11,462,000 | | | | 11,311,718 | |
6.50%, 5/2/36 | | | 27,355,000 | | | | 31,155,321 | |
6.50%, 9/15/37 | | | 12,665,000 | | | | 14,368,383 | |
JPMorgan Chase & Co.
4.125%, 12/15/26 | | | 3,000,000 | | | | 2,939,344 | |
8.75%, 9/1/30(b) | | | 23,042,000 | | | | 30,167,768 | |
Lloyds Banking Group PLC (United Kingdom)
4.05%, 8/16/23 | | | 10,325,000 | | | | 10,199,679 | |
4.50%, 11/4/24 | | | 19,575,000 | | | | 18,900,682 | |
4.65%, 3/24/26 | | | 11,100,000 | | | | 10,441,007 | |
Royal Bank of Scotland Group PLC (United Kingdom)
6.125%, 12/15/22 | | | 43,156,000 | | | | 43,734,580 | |
6.00%, 12/19/23 | | | 11,825,000 | | | | 11,967,355 | |
Unum Group
7.19%, 2/1/28 | | | 8,305,000 | | | | 9,629,367 | |
7.25%, 3/15/28 | | | 2,030,000 | | | | 2,382,268 | |
6.75%, 12/15/28 | | | 11,368,000 | | | | 13,120,294 | |
Wells Fargo & Co.
2.15%, 12/6/19 | | | 19,500,000 | | | | 19,323,469 | |
4.10%, 6/3/26 | | | 3,376,000 | | | | 3,298,398 | |
4.30%, 7/22/27 | | | 21,995,000 | | | | 21,647,693 | |
USD LIBOR3-Month | | | | | | | | |
+0.65%, 3.389%, 12/6/19 | | | 11,575,000 | | | | 11,603,206 | |
| | | | | | | | |
| | | | | | | 605,050,453 | |
INDUSTRIALS: 7.2% | |
AT&T, Inc.
5.35%, 9/1/40 | | | 27,575,000 | | | | 26,852,364 | |
4.75%, 5/15/46 | | | 7,000,000 | | | | 6,230,149 | |
5.65%, 2/15/47 | | | 5,175,000 | | | | 5,174,353 | |
4.50%, 3/9/48 | | | 24,560,000 | | | | 21,175,066 | |
Bayer AG (Germany)
3.875%, 12/15/23(c) | | | 16,175,000 | | | | 15,880,488 | |
4.25%, 12/15/25(c) | | | 6,600,000 | | | | 6,426,508 | |
4.375%, 12/15/28(c) | | | 21,300,000 | | | | 20,348,846 | |
Bayerische Motoren Werke AG (Germany)
3.40%, 8/13/21(c) | | | 6,200,000 | | | | 6,173,784 | |
BHP Billiton, Ltd. (Australia)
6.75%, 10/19/75(b)(c)(g) | | | 7,525,000 | | | | 7,826,000 | |
Burlington Northern Santa Fe LLC(e)
5.72%, 1/15/24 | | | 3,121,072 | | | | 3,305,262 | |
5.342%, 4/1/24 | | | 6,171,490 | | | | 6,405,220 | |
5.629%, 4/1/24 | | | 9,787,715 | | | | 10,314,954 | |
Cemex SAB de CV (Mexico)
6.00%, 4/1/24(c) | | | 10,575,000 | | | | 10,511,550 | |
5.70%, 1/11/25(c) | | | 22,475,000 | | | | 21,548,131 | |
6.125%, 5/5/25(c) | | | 12,870,000 | | | | 12,552,240 | |
Charter Communications, Inc.
8.75%, 2/14/19 | | | 7,840,000 | | | | 7,883,773 | |
8.25%, 4/1/19 | | | 21,815,000 | | | | 22,059,858 | |
4.125%, 2/15/21 | | | 2,260,000 | | | | 2,269,981 | |
| | | | | | | | |
| | |
| | | PAR VALUE | | | VALUE | |
4.908%, 7/23/25 | | $ | 11,600,000 | | | $ | 11,529,317 | |
4.20%, 3/15/28 | | | 5,000,000 | | | | 4,684,886 | |
6.55%, 5/1/37 | | | 11,000,000 | | | | 11,299,330 | |
6.75%, 6/15/39 | | | 6,160,000 | | | | 6,265,478 | |
6.484%, 10/23/45 | | | 32,977,000 | | | | 34,035,344 | |
5.375%, 5/1/47 | | | 4,100,000 | | | | 3,719,826 | |
5.75%, 4/1/48 | | | 5,805,000 | | | | 5,442,459 | |
Comcast Corp.
3.95%, 10/15/25 | | | 5,325,000 | | | | 5,390,475 | |
4.70%, 10/15/48 | | | 3,625,000 | | | | 3,688,376 | |
3.999%, 11/1/49 | | | 3,772,000 | | | | 3,384,983 | |
Cox Enterprises, Inc.
3.25%, 12/15/22(c) | | | 6,240,000 | | | | 6,095,595 | |
2.95%, 6/30/23(c) | | | 37,166,000 | | | | 35,760,127 | |
3.85%, 2/1/25(c) | | | 24,125,000 | | | | 23,777,397 | |
CRH PLC (Ireland)
3.875%, 5/18/25(c) | | | 17,100,000 | | | | 16,442,083 | |
CVS Health Corp.
3.70%, 3/9/23 | | | 22,253,000 | | | | 22,013,515 | |
4.10%, 3/25/25 | | | 6,025,000 | | | | 5,972,123 | |
4.30%, 3/25/28 | | | 9,425,000 | | | | 9,228,843 | |
4.78%, 3/25/38 | | | 5,125,000 | | | | 4,916,417 | |
Dell Technologies, Inc.
5.45%, 6/15/23(c) | | | 14,966,000 | | | | 15,229,137 | |
Dillard’s, Inc.
7.875%, 1/1/23 | | | 8,660,000 | | | | 9,542,185 | |
7.75%, 7/15/26 | | | 50,000 | | | | 53,723 | |
7.75%, 5/15/27 | | | 540,000 | | | | 581,732 | |
7.00%, 12/1/28 | | | 15,135,000 | | | | 15,586,407 | |
DowDuPont, Inc.
7.375%, 11/1/29 | | | 17,000,000 | | | | 20,738,274 | |
9.40%, 5/15/39 | | | 5,677,000 | | | | 8,219,134 | |
Elanco Animal Health, Inc.
3.912%, 8/27/21(c) | | | 2,500,000 | | | | 2,515,450 | |
4.272%, 8/28/23(c) | | | 2,500,000 | | | | 2,497,728 | |
4.90%, 8/28/28(c) | | | 3,500,000 | | | | 3,563,604 | |
Ford Motor Credit Co. LLC(e)
2.681%, 1/9/20 | | | 13,000,000 | | | | 12,783,267 | |
5.75%, 2/1/21 | | | 12,700,000 | | | | 12,952,277 | |
5.875%, 8/2/21 | | | 12,945,000 | | | | 13,275,462 | |
3.813%, 10/12/21 | | | 14,270,000 | | | | 13,858,342 | |
4.25%, 9/20/22 | | | 4,243,000 | | | | 4,067,334 | |
4.375%, 8/6/23 | | | 8,695,000 | | | | 8,235,746 | |
Imperial Brands PLC (United Kingdom)
3.75%, 7/21/22(c) | | | 10,475,000 | | | | 10,390,137 | |
4.25%, 7/21/25(c) | | | 44,175,000 | | | | 43,469,012 | |
Kinder Morgan, Inc.
4.30%, 6/1/25 | | | 11,050,000 | | | | 10,995,098 | |
5.50%, 3/1/44 | | | 25,893,000 | | | | 25,063,758 | |
5.40%, 9/1/44 | | | 20,119,000 | | | | 19,254,110 | |
Macy’s, Inc.
6.70%, 7/15/34 | | | 5,890,000 | | | | 5,909,379 | |
Naspers, Ltd. (South Africa)
6.00%, 7/18/20(c) | | | 16,900,000 | | | | 17,348,864 | |
5.50%, 7/21/25(c) | | | 20,075,000 | | | | 20,209,703 | |
4.85%, 7/6/27(c) | | | 14,200,000 | | | | 13,600,135 | |
RELX PLC (United Kingdom)
3.125%, 10/15/22 | | | 17,458,000 | | | | 17,140,655 | |
Telecom Italia SPA (Italy)
7.175%, 6/18/19 | | | 27,527,000 | | | | 27,718,037 | |
5.303%, 5/30/24(c) | | | 17,858,000 | | | | 16,965,100 | |
7.20%, 7/18/36 | | | 11,596,000 | | | | 11,074,180 | |
7.721%, 6/4/38 | | | 7,062,000 | | | | 7,013,484 | |
TransCanada Corp. (Canada)
5.625%, 5/20/75(b)(g) | | | 20,570,000 | | | | 18,538,712 | |
5.875%, 8/15/76(b)(g) | | | 4,500,000 | | | | 4,232,700 | |
5.30%, 3/15/77(b)(g) | | | 20,885,000 | | | | 18,026,366 | |
| | |
| See accompanying Notes to Financial Statements | | DODGE & COX BALANCED FUND§PAGE 11 |
| | | | |
| PORTFOLIO OF INVESTMENTS | | | December 31, 2018 | |
| | | | | | | | |
DEBT SECURITIES (continued) | |
| | |
| | | PAR VALUE | | | VALUE | |
Twenty-First Century Fox, Inc. | |
6.15%, 3/1/37 | | $ | 15,000,000 | | | $ | 18,417,816 | |
6.65%, 11/15/37 | | | 4,638,000 | | | | 6,113,356 | |
Ultrapar Participacoes SA (Brazil)
5.25%, 10/6/26(c) | | | 12,050,000 | | | | 11,703,683 | |
Union Pacific Corp.
6.176%, 1/2/31 | | | 7,507,212 | | | | 8,220,397 | |
United Technologies Corp.
3.35%, 8/16/21 | | | 3,650,000 | | | | 3,639,973 | |
3.65%, 8/16/23 | | | 13,000,000 | | | | 12,948,242 | |
Verizon Communications, Inc.
4.272%, 1/15/36 | | | 11,847,000 | | | | 11,099,144 | |
4.522%, 9/15/48 | | | 7,000,000 | | | | 6,567,001 | |
5.012%, 4/15/49 | | | 49,149,000 | | | | 49,039,292 | |
Xerox Corp.
4.50%, 5/15/21 | | | 21,561,000 | | | | 21,031,438 | |
Zoetis, Inc.
3.25%, 2/1/23 | | | 2,150,000 | | | | 2,114,641 | |
4.50%, 11/13/25 | | | 17,545,000 | | | | 18,015,168 | |
| | | | | | | | |
| | | | | | | 1,026,144,484 | |
UTILITIES: 0.5% | |
Dominion Energy, Inc.
2.579%, 7/1/20 | | | 4,600,000 | | | | 4,527,302 | |
4.104%, 4/1/21 | | | 5,650,000 | | | | 5,693,704 | |
5.75%, 10/1/54(b)(g) | | | 22,950,000 | | | | 22,921,713 | |
Enel SPA (Italy)
4.25%, 9/14/23(c) | | | 4,075,000 | | | | 3,984,227 | |
4.625%, 9/14/25(c) | | | 10,500,000 | | | | 10,078,993 | |
6.80%, 9/15/37(c) | | | 13,700,000 | | | | 14,718,190 | |
6.00%, 10/7/39(c) | | | 13,352,000 | | | | 13,250,019 | |
| | | | | | | | |
| | | | | | | 75,174,148 | |
| | | | | | | | |
| | | | | | | 1,706,369,085 | |
| | | | | | | | |
TOTAL DEBT SECURITIES
(Cost $4,223,018,923) | | | $ | 4,233,069,446 | |
|
| SHORT-TERM INVESTMENTS: 4.6% | |
| | |
| | | PAR VALUE/ SHARES | | | VALUE | |
REPURCHASE AGREEMENT: 4.2% | |
Fixed Income Clearing Corporation(d)
1.60%, dated 12/31/18, due 1/2/19, maturity value $599,147,253 | | $ | 599,094,000 | | | $ | 599,094,000 | |
MONEY MARKET FUND: 0.4% | |
State Street Institutional U.S. Government Money Market Fund | | | 56,452,166 | | | | 56,452,166 | |
| | | | | | | | |
TOTAL SHORT-TERM INVESTMENTS
(Cost $655,546,166) | | | $ | 655,546,166 | |
| | | | | | | | |
TOTAL INVESTMENTS IN SECURITIES(Cost $11,862,912,741) | | | 99.7 | % | | $ | 14,131,455,332 | |
OTHER ASSETS LESS LIABILITIES | | | 0.3 | % | | | 49,573,999 | |
| | | | | | | | |
| NET ASSETS | | | 100.0 | % | | $ | 14,181,029,331 | |
| | | | | | | | |
| (b) | Hybrid security has characteristics of both a debt and equity security. |
| (c) | Security exempt from registration under Rule 144A of the Securities Act of 1933. The security may be resold in transactions exempt from registration, normally to qualified institutional buyers. |
| (d) | Repurchase agreement is collateralized by U.S. Treasury Notes1.375%-2.625%,8/15/20-11/15/20. Total collateral value is $611,078,260. |
| (e) | Subsidiary (see below) |
| (f) | Variable rate security: interest rate is determined by the interest rates of underlying pool of assets that collateralize the security. The interest rate of the security may change due to a change in the interest rates or the composition of underlying pool of assets. The interest rate shown is the rate as of period end. |
| (g) | Variable rate security:fixed-to-float security pays an initial fixed interest rate and will pay a floating interest rate established at a predetermined time in the future. The interest rate shown is the rate as of period end. |
In determining a company’s country designation, the Fund generally references the country of incorporation. In cases where the Fund considers the country of incorporation to be a “jurisdiction of convenience” chosen primarily for tax purposes or in other limited circumstances, the Fund uses the country designation of an appropriate broad-based market index. In those cases, two countries are listed—the country of incorporation and the country designated by an appropriate index, respectively.
Debt securities are grouped by parent company unless otherwise noted. Actual securities may be issued by the listed parent company or one of its subsidiaries.
Debt securities with floating interest rates are linked to the referenced benchmark; the interest rate shown is the rate as of period end.
ADR: American Depositary Receipt
ARM: Adjustable Rate Mortgage
CMBS: Commercial Mortgage-Backed Security
CMO: Collateralized Mortgage Obligation
CMT: Constant Maturity Treasury
DUS: Delegated Underwriting and Servicing
GO: General Obligation
RB: Revenue Bond
REMIC: Real Estate Mortgage Investment Conduit
FUTURES CONTRACTS
| | | | | | | | | | | | | | | | |
| Description | | Number of
Contracts | | | Expiration
Date | | | Notional
Amount | | | Value /
Unrealized
Appreciation
(Depreciation) | |
10 Year U.S. Treasury Note—Short Position | | | 539 | | | | 3/20/19 | | | $ | (65,766,422 | ) | | $ | (1,588,047 | ) |
| | | | |
Ultra Long-Term U.S. Treasury Bond—Short Position | | | 232 | | | | 3/20/19 | | | | (37,272,250 | ) | | | (1,976,588 | ) |
| | | | | | | | | | | | | | | | |
| | | | | | | | | | | | | | $ | (3,564,635 | ) |
| | | | | | | | | | | | | | | | |
| | |
| PAGE 12§ DODGE & COX BALANCED FUND | | See accompanying Notes to Financial Statements |
| | | | |
STATEMENT OF ASSETS AND LIABILITIES | |
| |
| | | December 31, 2018 | |
ASSETS: | |
Investments in securities, at value (cost $11,862,912,741) | | $ | 14,131,455,332 | |
Cash | | | 48,606,663 | |
Deposits with broker for futures contracts | | | 1,412,750 | |
Receivable for investments sold | | | 2,179,789 | |
Receivable for Fund shares sold | | | 23,608,485 | |
Dividends and interest receivable | | | 52,374,341 | |
Prepaid expenses and other assets | | | 184,204 | |
| | | | |
| | | 14,259,821,564 | |
| | | | |
LIABILITIES: | |
Payable for variation margin for futures contracts | | | 348,257 | |
Payable for investments purchased | | | 48,583,024 | |
Payable for Fund shares redeemed | | | 22,899,904 | |
Management fees payable | | | 6,173,454 | |
Accrued expenses | | | 787,594 | |
| | | | |
| | | 78,792,233 | |
| | | | |
NET ASSETS | | $ | 14,181,029,331 | |
| | | | |
NET ASSETS CONSIST OF: | |
Paid in capital | | $ | 11,556,264,515 | |
Total distributable earnings | | | 2,624,764,816 | |
| | | | |
| | $ | 14,181,029,331 | |
| | | | |
Fund shares outstanding (par value $0.01 each, unlimited shares authorized) | | | 152,041,910 | |
Net asset value per share | | $ | 93.27 | |
| |
STATEMENT OF OPERATIONS | | | | |
| |
| | | Year Ended
December 31, 2018 | |
INVESTMENT INCOME: | |
Dividends (net of foreign taxes of $4,031,561) | | $ | 208,771,696 | |
Interest | | | 200,404,293 | |
| | | | |
| | | 409,175,989 | |
| | | | |
EXPENSES: | |
Management fees | | | 78,985,615 | |
Custody and fund accounting fees | | | 248,923 | |
Transfer agent fees | | | 1,655,386 | |
Professional services | | | 151,525 | |
Shareholder reports | | | 426,420 | |
Registration fees | | | 165,274 | |
Trustees’ fees | | | 324,167 | |
ADR depositary service fees | | | 1,040,400 | |
Miscellaneous | | | 243,558 | |
| | | | |
| | | 83,241,268 | |
| | | | |
NET INVESTMENT INCOME | | | 325,934,721 | |
| | | | |
REALIZED AND UNREALIZED GAIN (LOSS): | |
Net realized gain | |
Investments in securities | | | 1,289,910,206 | |
Futures contracts | | | 10,583,744 | |
Net change in unrealized appreciation/depreciation | |
Investments in securities | | | (2,306,746,694 | ) |
Futures contracts | | | (3,871,299 | ) |
| | | | |
Net realized and unrealized loss | | | (1,010,124,043 | ) |
| | | | |
NET CHANGE IN NET ASSETS
FROM OPERATIONS | | $ | (684,189,322 | ) |
| | | | |
| | | | | | | | |
STATEMENT OF CHANGES IN NET ASSETS | |
| | |
| | | Year Ended
December 31, 2018 | | | Year Ended
December 31, 2017 | |
OPERATIONS: | | | | | | | | |
Net investment income | | $ | 325,934,721 | | | $ | 337,024,067 | |
Net realized gain (loss) | | | 1,300,493,950 | | | | 858,113,109 | |
Net change in unrealized appreciation/depreciation | | | (2,310,617,993 | ) | | | 694,677,141 | |
| | | | | | | | |
| | | (684,189,322 | ) | | | 1,889,814,317 | |
| | | | | | | | |
| | |
DISTRIBUTIONS TO SHAREHOLDERS: | | | | | | | | |
Total distributions | | | (1,299,992,127 | ) | | | (1,332,935,056 | )(a) |
| | |
FUND SHARE
TRANSACTIONS: | | | | | | | | |
Proceeds from sale of shares | | | 1,255,189,936 | | | | 1,562,877,163 | |
Reinvestment of distributions | | | 1,229,242,880 | | | | 1,265,331,879 | |
Cost of shares redeemed | | | (2,706,186,811 | ) | | | (2,379,686,448 | ) |
| | | | | | | | |
Net change from Fund share transactions | | | (221,753,995 | ) | | | 448,522,594 | |
| | | | | | | | |
Total change in net assets | | | (2,205,935,444 | ) | | | 1,005,401,855 | |
| | |
NET ASSETS: | | | | | | | | |
Beginning of year | | | 16,386,964,775 | | | | 15,381,562,920 | |
| | | | | | | | |
End of year | | $ | 14,181,029,331 | | | $ | 16,386,964,775 | (b) |
| | | | | | | | |
| | |
SHARE INFORMATION: | | | | | | | | |
Shares sold | | | 11,905,136 | | | | 14,655,810 | |
Distributions reinvested | | | 12,704,514 | | | | 11,918,105 | |
Shares redeemed | | | (25,719,422 | ) | | | (22,251,076 | ) |
| | | | | | | | |
Net change in shares outstanding | | | (1,109,772 | ) | | | 4,322,839 | |
| | | | | | | | |
| (a) | Prior year comparative amounts have been adjusted to reflect current presentation under new accounting standards. Prior year distributions consisted of $338,037,335 from net investment income and $994,897,721 from net realized gain. |
| (b) | Includes undistributed net investment income of $2,270,590. |
| | |
| See accompanying Notes to Financial Statements | | DODGE & COX BALANCED FUND§PAGE 13 |
NOTES TO FINANCIAL STATEMENTS
NOTE 1—ORGANIZATION AND SIGNIFICANT ACCOUNTING POLICIES
Dodge & Cox Balanced Fund (the “Fund”) is one of the series constituting the Dodge & Cox Funds (the “Trust” or the “Funds”). The Trust is organized as a Delaware statutory trust and is registered under the Investment Company Act of 1940, as amended, as anopen-end management investment company. The Fund commenced operations on June 26, 1931, and seeks regular income, conservation of principal, and an opportunity for long-term growth of principal and income. Risk considerations and investment strategies of the Fund are discussed in the Fund’s Prospectus.
The Fund is an investment company and follows the accounting and reporting guidance issued in Topic 946 by the Financial Accounting Standards Board. The financial statements have been prepared in conformity with accounting principles generally accepted in the United States of America, which require the use of estimates and assumptions by management. Actual results may differ from those estimates. Significant accounting policies are as follows:
Security valuation The Fund’s net assets are normally valued as of the scheduled close of trading on the New York Stock Exchange (NYSE), generally 4 p.m. Eastern Time, each day that the NYSE is open for business. Portfolio securities and other financial instruments for which market quotes are readily available are valued at market value. Listed securities, for example, are generally valued using the official quoted close price or the last sale on the exchange that is determined to be the primary market for the security.
Debt securities, certain preferred stocks, and derivatives traded over the counter are valued using prices received from independent pricing services which utilize dealer quotes, recent transaction data, pricing models, and other inputs to arrive at market-based valuations. Pricing models may consider quoted prices for similar securities, interest rates, cash flows (including prepayment speeds), and credit risk. Exchange-traded derivatives are valued at the settlement price determined by the relevant exchange. Short-term securities less than 60 days to maturity may be valued at amortized cost if amortized cost approximates current value. Mutual funds are valued at their respective net asset values. Security values are not discounted based on the size of the Fund’s position and may differ from the value a Fund receives upon sale of the securities. All securities held by the Fund are denominated in U.S. dollars.
If market quotations are not readily available or if normal valuation procedures produce valuations that are deemed unreliable or inappropriate under the circumstances existing at the time, the investment will be valued at fair value as determined in good faith by or under the direction of the Fund’s Board of Trustees. The Board of Trustees has appointed Dodge & Cox, the Fund’s investment manager, to make fair value determinations in accordance with the Dodge & Cox Funds Valuation Policies (“Valuation Policies”), subject to Board oversight. Dodge & Cox has established a Pricing Committee that is comprised of representatives from Treasury, Legal, Compliance, and Operations. The Pricing Committee is responsible
for implementing the Valuation Policies, including determining the fair value of securities and other investments when necessary. The Pricing Committee considers relevant indications of value that are reasonably available to it in determining the fair value assigned to a particular security, such as the value of similar financial instruments, trading volumes, contractual restrictions on disposition, related corporate actions, and changes in economic conditions. In doing so, the Pricing Committee employs various methods for calibrating fair valuation approaches, including a regular review of key inputs and assumptions, back-testing, and review of any related market activity.
Valuing securities through a fair value determination involves greater reliance on judgment than valuation of securities based on readily available market quotations. In some instances, lack of information and uncertainty as to the significance of information may lead to a conclusion that a prior valuation is the best indication of a security’s value. When fair value pricing is employed, the prices of securities used by the Fund to calculate its net asset value may differ from quoted or published prices for the same securities.
Security transactions, investment income, expenses, and distributions Security transactions are recorded on the trade date. Realized gains and losses on securities sold are determined on the basis of identified cost.
Dividend income and corporate action transactions are recorded on theex-dividend date, or when the Fund first learns of the dividend/corporate action if the ex-dividend date has passed.Non-cash dividends, if any, are recorded at the fair market value of the securities received. Dividends characterized as return of capital for U.S. tax purposes are recorded as a reduction of cost of investments and/or realized gain.
Interest income is recorded on the accrual basis. Interest income includes coupon interest, amortization of premium and accretion of discount on debt securities, and gain/loss on paydowns. The ability of the issuers of the debt securities held by the Fund to meet their obligations may be affected by economic developments in a specific industry, state, or region. Debt obligations may be placed onnon-accrual status and related interest income may be reduced by ceasing current accruals and writing off interest receivables when the collection of all or a portion of interest has become doubtful. A debt obligation is removed fromnon-accrual status when the issuer resumes interest payments or when collectibility of interest is reasonably assured.
Expenses are recorded on the accrual basis. Some expenses of the Trust can be directly attributed to a specific series. Expenses which cannot be directly attributed are allocated among the Funds in the Trust using methodologies determined by the nature of the expense.
Distributions to shareholders are recorded on theex-dividend date.
Foreign taxes The Fund may be subject to foreign taxes which may be imposed by certain countries in which the Fund invests. The Fund endeavors to record foreign taxes based on applicable foreign tax law. Withholding taxes are incurred on certain foreign dividends and are accrued at the time the associated dividend is recorded. The Fund files withholding tax
PAGE 14§ DODGE & COX BALANCED FUND
NOTES TO FINANCIAL STATEMENTS
reclaims in certain jurisdictions to recover a portion of amounts previously withheld. The Fund records a reclaim receivable based on, among other things, a jurisdiction’s legal obligation to pay reclaims as well as payment history and market convention. In consideration of recent decisions rendered by European courts, the Fund has filed for additional reclaims related to prior years. A corresponding receivable is established when both the amount is known and significant contingencies or uncertainties regarding collectability are removed. These amounts, if any, are reported in “dividends and interest receivable” in the Statement of Assets and Liabilities.
Repurchase agreements Repurchase agreements are transactions under which a Fund purchases a security from a dealer counterparty and agrees to resell the security to that counterparty on a specified future date at the same price, plus a specified interest rate. The Fund’s repurchase agreements are secured by U.S. government or agency securities. It is the Fund’s policy that its custodian take possession of the underlying collateral securities, the fair value of which exceeds the principal amount of the repurchase transaction, including accrued interest, at all times. In the event of default by the counterparty, the Fund has the contractual right to liquidate the collateral securities and to apply the proceeds in satisfaction of the obligation.
Indemnification Under the Trust’s organizational documents, its officers and trustees are indemnified against certain liabilities arising out of the performance of their duties to the Trust. In addition, in the normal course of business the Trust enters into contracts that provide general indemnities to other parties. The Trust’s maximum exposure under these arrangements is unknown as this would involve future claims that may be made against the Trust that have not yet occurred.
NOTE 2—VALUATION MEASUREMENTS
Various inputs are used in determining the value of the Fund’s investments. These inputs are summarized in the three broad levels listed below.
| § | | Level 1: Quoted prices in active markets for identical securities |
| § | | Level 2: Other significant observable inputs (including quoted prices for similar securities, market indices, interest rates, credit risk, forward exchange rates, etc.) |
| § | | Level 3: Significant unobservable inputs (including Fund management’s assumptions in determining the fair value of investments) |
The inputs or methodology used for valuing securities are not necessarily an indication of the risk associated with investing in those securities.
The following is a summary of the inputs used to value the Fund’s holdings at December 31, 2018:
| | | | | | | | |
| Classification | | LEVEL 1 (Quoted Prices) | | | LEVEL 2
(Other Significant
Observable Inputs) | |
Securities | | | | | | | | |
Common Stocks(a) | | $ | 8,557,715,294 | | | $ | — | |
Preferred Stocks | | | — | | | | 685,124,426 | |
Debt Securities | | | | | | | | |
U.S. Treasury | | | — | | | | 405,451,498 | |
Government-Related | | | — | | | | 240,410,043 | |
Securitized | | | — | | | | 1,880,838,820 | |
Corporate | | | — | | | | 1,706,369,085 | |
Short-term Investments | | | | | | | | |
Repurchase Agreement | | | — | | | | 599,094,000 | |
Money Market Fund | | | 56,452,166 | | | | — | |
| | | | | | | | |
Total Securities | | $ | 8,614,167,460 | | | $ | 5,517,287,872 | |
| | | | | | | | |
| | |
Other Investments | | | | | | | | |
Futures Contracts | | | | | | | | |
Depreciation | | $ | (3,564,635 | ) | | $ | — | |
| | | | | | | | | |
| (a) | All common stocks held in the Fund are Level 1 securities. For a detailed break-out of common stocks by major industry classification, please refer to the Portfolio of Investments. |
NOTE 3—DERIVATIVE INSTRUMENTS
The Fund entered into various transactions involving derivative instruments, including Treasury futures contracts and purchased equity index put options, in connection with its investment strategy. The Fund may use derivatives to minimize the impact of losses to one or more of its investments (as a “hedging technique”) or to implement its investment strategy.
The Fund entered intoover-the-counter derivatives (each, an “OTC Derivative”), such as put options. Each OTC Derivative is subject to a negotiated master agreement (based on a form published by the International Swaps and Derivatives Association (“ISDA”)) governing all OTC Derivatives between the Fund and the relevant dealer counterparty. The master agreements specify (i) events of default and other events permitting a party to terminate some or all of the OTC Derivatives thereunder and (ii) the process by which those OTC Derivatives will be valued for purposes of determining termination payments. If some or all of the OTC Derivatives under a master agreement are terminated because of an event of default or similar event, the values of all terminated OTC Derivatives must be netted to determine a single payment owed by one party to the other. To the extent amounts owed to the Fund by its counterparties are not collateralized, the Fund is at risk of those counterparties’non-performance. The Fund attempts to mitigate counterparty credit risk by entering into OTC Derivatives only with counterparties it believes to be of good credit quality, by exchanging collateral, and by monitoring the financial stability of those counterparties.
Futures contracts Futures contracts involve an obligation to purchase or sell (depending on whether the Fund has entered a long or short futures contract, respectively) an asset at a future date, at a price set at the time of the contract. Upon entering into a futures contract, the Fund is required to deposit an amount of
DODGE & COX BALANCED FUND§PAGE 15
NOTES TO FINANCIAL STATEMENTS
cash or liquid assets (referred to as initial margin) in a segregated account with the clearing broker. Subsequent payments (referred to as variation margin) to and from the clearing broker are made on a daily basis based on changes in the market value of futures contracts. Futures contracts are traded publicly and their market value changes daily. Changes in the market value of open futures contracts are recorded as unrealized appreciation or depreciation in the Statement of Operations. Realized gains and losses on futures contracts are recorded in the Statement of Operations at the closing or expiration of the contracts. Cash deposited with a broker as initial margin is recorded in the Statement of Assets and Liabilities. A receivable and/or payable to brokers for daily variation margin is also recorded in the Statement of Assets and Liabilities.
Investments in futures contracts may include certain risks, which may be different from, and potentially greater than, those of the underlying securities. To the extent the Fund uses futures, it is exposed to additional volatility and potential losses resulting from leverage.
The Fund has maintained short Treasury futures contracts to assist with the management of the portfolio’s interest rate exposure. During the year ended December 31, 2018, these Treasury futures contracts had notional values up to 2% of net assets.
Equity index put options An equity index put option gives its holder the right (but not the obligation) to sell the future value of an equity stock index, such as the S&P 500 index, at a predetermined strike price. A put option has value at its expiration if the index price is lower than the strike price. The buyer of an equity index put option pays a premium amount to purchase the contract, but has no payment obligations thereafter. Cash collateral received from the counterparty is recorded in the Statement of Assets and Liabilities. Changes in the value of open equity index put options are recorded as unrealized appreciation or depreciation and realized gains or losses are recorded at the closing or expiration of the options in the Statement of Operations within investments in securities. For the year ended December 31, 2018, the change in unrealized appreciation/depreciation and realized gain (loss) was $87,855,366 and ($80,427,894), respectively.
The Fund purchasedover-the-counter equity index put options to hedge against a general downturn in the equity markets. During the year ended December 31, 2018, these equity index put options had values up to 1% of net assets. The Fund did not hold any equity index put options as of year end.
Additional derivative information For financial reporting purposes, the Fund does not offset OTC Derivative assets and liabilities that are subject to a master netting arrangement in the Statement of Assets and Liabilities. OTC Derivatives, if any, are presented in the Statement of Assets and Liabilities as investments. Collateral, if any, held by the Fund for OTC Derivatives are reported gross and presented as “Cash received as collateral for options purchased” in the Statement of Assets and Liabilities.
The netting of assets and liabilities and the offsetting of collateral pledged or received are based on contractualnetting/set-off provisions in the ISDA master agreement. The Fund did not hold any derivative or collateral subject to a master netting arrangement at year end.
NOTE 4—RELATED PARTY TRANSACTIONS
Management fees Under a written agreement approved by a unanimous vote of the Board of Trustees, the Fund pays a management fee monthly at an annual rate of 0.50% of the Fund’s average daily net assets to Dodge & Cox, investment manager of the Fund.
Fund officers and trustees All officers and two of the trustees of the Trust are officers or employees of Dodge & Cox. The Trust pays a fee only to those trustees who are not affiliated with Dodge & Cox.
NOTE 5—INCOME TAX INFORMATION AND DISTRIBUTIONS TO SHAREHOLDERS
A provision for federal income taxes is not required since the Fund intends to continue to qualify as a regulated investment company under Subchapter M of the Internal Revenue Code and distribute all of its taxable income to shareholders. Distributions are determined in accordance with income tax regulations, and such amounts may differ from net investment income and realized gains for financial reporting purposes. The Fund may also designate a portion of the amount paid to redeeming shareholders as a distribution for tax purposes. Financial reporting records are adjusted for permanent book to tax differences at year end to reflect tax character. Book to tax differences are primarily due to differing treatments of wash sales, net short-term realized gain (loss), certain corporate action transactions, derivatives, and distributions.
Distributions during the years noted below were characterized as follows for federal income tax purposes:
| | | | | | | | |
| | | Year Ended
December 31, 2018 | | | Year Ended
December 31, 2017 | |
Ordinary income | | $ | 297,446,889 | | | $ | 381,953,061 | |
| | ($ | 2.010 per share | ) | | ($ | 2.589 per share | ) |
Long-term capital gain | | $ | 1,002,545,238 | | | $ | 950,981,995 | |
| | ($ | 6.916 per share | ) | | ($ | 6.491 per share | ) |
At December 31, 2018, the tax basis components of distributable earnings were as follows:
| | | | |
Undistributed long-term capital gain | | $ | 345,167,737 | |
PAGE 16§ DODGE & COX BALANCED FUND
NOTES TO FINANCIAL STATEMENTS
At December 31, 2018, unrealized appreciation and depreciation for investments and derivatives based on cost for federal income tax purposes were as follows:
| | | | |
Tax cost | | $ | 11,848,293,618 | |
| | | | |
Unrealized appreciation | | | 2,941,160,324 | |
Unrealized depreciation | | | (661,563,245 | ) |
| | | | |
Net unrealized appreciation | | | 2,279,597,079 | |
| | | | | |
Fund management has reviewed the tax positions for open periods (three years and four years, respectively, from filing the Fund’s Federal and State tax returns) as applicable to the Fund, and has determined that no provision for income tax is required in the Fund’s financial statements.
NOTE 6—LOAN FACILITIES
Pursuant to an exemptive order issued by the Securities and Exchange Commission (SEC), the Fund may participate in an interfund lending facility (Facility). The Facility allows the Fund to borrow money from or loan money to the Funds. Loans under the Facility are made for temporary or emergency purposes, such as to fund shareholder redemption requests. Interest on borrowings is the average of the current repurchase agreement rate and the bank loan rate. There was no activity in the Facility during the year.
All Funds in the Trust participate in a $500 million committed credit facility (Line of Credit) with State Street Bank and Trust Company, to be utilized for temporary or emergency purposes to fund shareholder redemptions or for other short-term liquidity purposes. The maximum amount available to the Fund is $250 million. Each Fund pays an annual commitment fee on itspro-rata portion of the Line of Credit. For the year ended December 31, 2018, the Fund’s commitment fee amounted to $91,786 and is reflected as a Miscellaneous Expense in the Statement of Operations. Interest on borrowings is charged at the prevailing rate. There were no borrowings on the Line of Credit during the year.
NOTE 7—PURCHASES AND SALES OF INVESTMENTS
For the year ended December 31, 2018, purchases and sales of securities, other than short-term securities and U.S. government securities, aggregated $2,647,919,529 and $3,871,428,961, respectively. For the year ended December 31, 2018, purchases and sales of U.S. government securities aggregated $1,030,521,241 and $1,315,394,315, respectively.
NOTE 8—NEW ACCOUNTING GUIDANCE
In March 2017, the Financial Accounting Standards Board issued an update to amend the amortization period for certain purchased callable debt securities held at a premium. The amendments shorten the amortization period for premiums to the earliest call date, but do not require an accounting change for securities held at a discount. The amendments are effective for financial statements for fiscal years beginning after December 15, 2018, and interim periods within those fiscal years. Management is evaluating the impact, if any, of this guidance on the Fund’s financial statements and disclosures.
In August 2018, the Financial Accounting Standards Board issued Accounting Standards Update “Fair Value Measurement (Topic 820)” (ASU 2018-13) which modifies the disclosure requirements for fair value measurement by removing, modifying, or adding certain disclosures. The amendments are effective for annual periods beginning after December 15, 2019, and interim periods within those annual periods. The Fund is permitted to early adopt any removed or modified disclosures upon issuance of this update and delay adoption of the additional disclosures until their effective date. The Fund has early adopted the updated accounting standards on the Fund’s financial statements.
NOTE 9—SUBSEQUENT EVENTS
Fund management has determined that no material events or transactions occurred subsequent to December 31, 2018, and through the date of the Fund’s financial statements issuance, which require additional disclosure in the Fund’s financial statements.
DODGE & COX BALANCED FUND§PAGE 17
FINANCIAL HIGHLIGHTS
| | | | | | | | | | | | | | | | | | | | |
SELECTED DATA AND RATIOS (for a share outstanding throughout each year) | | Year Ended December 31, | |
| | | 2018 | | | 2017 | | | 2016 | | | 2015 | | | 2014 | |
| | | | |
Net asset value, beginning of year | | | $107.00 | | | | $103.35 | | | | $94.42 | | | | $102.48 | | | | $98.30 | |
Income from investment operations: | | | | | | | | | | | | | | | | | | | | |
Net investment income | | | 2.20 | | | | 2.28 | | | | 2.34 | | | | 2.06 | | | | 2.03 | |
Net realized and unrealized gain (loss) | | | (7.00 | ) | | | 10.45 | | | | 12.89 | | | | (4.99 | ) | | | 6.59 | |
| | | | |
Total from investment operations | | | (4.80 | ) | | | 12.73 | | | | 15.23 | | | | (2.93 | ) | | | 8.62 | |
| | | | |
Distributions to shareholders from: | | | | | | | | | | | | | | | | | | | | |
Net investment income | | | (2.01 | ) | | | (2.29 | ) | | | (2.34 | ) | | | (2.06 | ) | | | (2.03 | ) |
Net realized gain | | | (6.92 | ) | | | (6.79 | ) | | | (3.96 | ) | | | (3.07 | ) | | | (2.41 | ) |
| | | | |
Total distributions | | | (8.93 | ) | | | (9.08 | ) | | | (6.30 | ) | | | (5.13 | ) | | | (4.44 | ) |
| | | | |
Net asset value, end of year | | | $93.27 | | | | $107.00 | | | | $103.35 | | | | $94.42 | | | | $102.48 | |
| | | | |
Total return | | | (4.61 | )% | | | 12.59 | % | | | 16.55 | % | | | (2.88 | )% | | | 8.85 | % |
Ratios/supplemental data: | | | | | | | | | | | | | | | | | | | | |
Net assets, end of year (millions) | | | $14,181 | | | | $16,387 | | | | $15,382 | | | | $14,269 | | | | $15,465 | |
Ratio of expenses to average net assets | | | 0.53 | % | | | 0.53 | % | | | 0.53 | % | | | 0.53 | % | | | 0.53 | % |
Ratio of net investment income to average net assets | | | 2.06 | % | | | 2.12 | % | | | 2.41 | % | | | 2.03 | % | | | 2.00 | % |
Portfolio turnover rate | | | 24 | % | | | 19 | % | | | 24 | % | | | 20 | % | | | 23 | % |
See accompanying Notes to Financial Statements
REPORT OF INDEPENDENT REGISTERED PUBLIC ACCOUNTING FIRM
To the Board of Trustees of the Dodge & Cox Funds and Shareholders of Dodge & Cox Balanced Fund
Opinion on the Financial Statements
We have audited the accompanying statement of assets and liabilities, including the portfolio of investments, of Dodge & Cox Balanced Fund (one of the funds constituting Dodge & Cox Funds, referred to hereafter as the “Fund”) as of December 31, 2018, the related statement of operations for the year ended December 31, 2018, the statement of changes in net assets for each of the two years in the period ended December 31, 2018, including the related notes, and the financial highlights for each of the five years in the period ended December 31, 2018 (collectively referred to as the “financial statements”). In our opinion, the financial statements present fairly, in all material respects, the financial position of the Fund as of December 31, 2018, the results of its operations for the year then ended, the changes in its net assets for each of the two years in the period ended December 31, 2018 and the financial highlights for each of the five years in the period ended December 31, 2018 in conformity with accounting principles generally accepted in the United States of America.
Basis for Opinion
These financial statements are the responsibility of the Fund’s management. Our responsibility is to express an opinion on the Fund’s financial statements based on our audits. We are a public accounting firm registered with the Public Company Accounting Oversight Board (United States) (PCAOB) and are required to be independent with respect to the Fund in accordance with the U.S. federal securities laws and the applicable rules and regulations of the Securities and Exchange Commission and the PCAOB.
We conducted our audits of these financial statements in accordance with the standards of the PCAOB. Those standards require that we plan and perform the audit to obtain reasonable assurance about whether the financial statements are free of material misstatement, whether due to error or fraud.
Our audits included performing procedures to assess the risks of material misstatement of the financial statements, whether due to error or fraud, and performing procedures that respond to those risks. Such procedures included examining, on a test basis, evidence regarding the amounts and disclosures in the financial statements. Our audits also included evaluating the accounting principles used and significant estimates made by management, as well as evaluating the overall presentation of the financial statements. Our procedures included confirmation of securities owned as of December 31, 2018 by correspondence with the custodian, transfer agent and brokers; when replies were not received from brokers, we performed other auditing procedures. We believe that our audits provide a reasonable basis for our opinion.
PricewaterhouseCoopers LLP
San Francisco, California
February 15, 2019
We have served as the auditor of one or more investment companies in the Dodge & Cox Funds since 1931.
PAGE 18§ DODGE & COX BALANCED FUND
SPECIAL 2018 TAX INFORMATION
(unaudited)
The following information is provided pursuant to provisions of the Internal Revenue Code:
The Fund designates $1,029,156,170 as long-term capital gain distributions in 2018.
The Fund designates $212,662,872 of its distributions paid to shareholders in 2018 as qualified dividends (treated for federal income tax purposes in the hands of shareholders as taxable at a maximum rate of 20%).
For shareholders that are corporations, the Fund designates 45% of its ordinary dividends paid to shareholders in 2018 as dividends from domestic corporations eligible for the corporate dividends received deduction, provided that the shareholder otherwise satisfies applicable requirements to claim that deduction.
BOARD APPROVAL OF FUNDS’ INVESTMENT
MANAGEMENT AGREEMENTS AND MANAGEMENT FEES
(unaudited)
The Board of Trustees is responsible for overseeing the performance of the Dodge & Cox Funds’ investment manager and determining whether to continue the Investment Management Agreements between the Funds and Dodge & Cox each year (the “Agreements”). At a meeting of the Board of Trustees of the Trust held on December 13, 2018, the Trustees, by a unanimous vote (including a separate vote of those Trustees who are not “interested persons” (as defined in the Investment Company Act of 1940) (the “Independent Trustees”)), approved the renewal of the Agreements for an additional one-year term through December 31, 2019 with respect to each Fund. During the course of the year, the Board received extensive information and materials relating to the investment management and administrative services provided by Dodge & Cox and the performance of each of the Funds.
INFORMATION RECEIVED
Over the past several years, the Board has requested, received, and discussed a number of special presentations on topics relevant to their annual consideration of the proposed renewal of the Funds’ Agreements. In addition to the foregoing and in advance of the meetings referred to below, the Board, including the Independent Trustees, requested, received, and reviewed materials relating to the Agreements and the services provided by Dodge & Cox. The Independent Trustees retained Broadridge to prepare an independent expense and performance summary for each Fund and comparable funds managed by other advisers identified by Broadridge. The Broadridge materials included information regarding advisory fee rates, expense ratios, and transfer agency, custodial, and distribution expenses, as well as performance comparisons to each Fund’s peer group and to a broad-based securities index or combination of indices. The Broadridge materials also included a comparison of expenses of various share classes offered by comparable funds. The materials reviewed by the Board contained information concerning, among other things, Dodge & Cox’s profitability, financial results and condition, advisory fee revenue, and separate account fee schedules. The Board additionally considered the Funds’ brokerage commissions,
turnover rates, sales and redemption data, and the significant investment that Dodge & Cox makes in research used in managing the Funds. The Board received and reviewed memoranda and related materials addressing, among other things, Dodge & Cox’s services to the Funds; how Dodge & Cox Funds’ fees compare to fees of peer group funds; the different fees, services, costs, and risks associated with other accounts managed by Dodge & Cox as compared to the Dodge & Cox Funds; and the ways in which the Funds realize economies of scale. Throughout the process of reviewing the services provided by Dodge & Cox and preparing for the meeting, the Independent Trustees found Dodge & Cox to be open, forthright, detailed, and very helpful in answering questions about all issues. The Board received copies of the Agreements and a memorandum from the independent legal counsel to the Independent Trustees discussing the factors generally regarded as appropriate to consider in evaluating advisory arrangements. The Trust’s Contract Review Committee, consisting solely of Independent Trustees, met with the independent legal counsel on November 8, 2018 and again on December 13, 2018 to discuss whether to renew the Agreements. The Board, including the Independent Trustees, subsequently concluded that the existing Agreements are fair and reasonable and voted to approve the Agreements. In considering the Agreements, the Board, including the Independent Trustees, did not identify any single factor or particular information as all-important or controlling. In reaching the decision to approve the Agreements, the Board considered several factors, discussed below, to be key factors and reached the conclusions described below.
NATURE, QUALITY, AND EXTENT OF THE SERVICES
The Board considered that Dodge & Cox provides a wide range of services to the Funds in addition to portfolio management, including regulatory compliance, trading desks, proxy voting, transfer agent and custodian oversight, administration, regulatory filings, tax compliance and filings, web site, and anti-money laundering. The extensive nature of services provided by Dodge & Cox has been documented in materials provided to the Board and in presentations made to the Board throughout the year. In particular, the Board considered the nature, quality, and extent of portfolio management, administrative, and shareholder services performed by Dodge & Cox. With regard to portfolio management services, the Board considered Dodge & Cox’s established long-term history of care and conscientiousness in the management of the Funds; its demonstrated consistency in investment approach and depth; the background and experience of the Dodge & Cox U.S. Equity Investment Committee, International Equity Investment Committee, Global Equity Investment Committee, U.S. Fixed Income Investment Committee, and Global Fixed Income Investment Committee, and research analysts responsible for managing the Funds; Dodge & Cox’s methods for assessing the regulatory and investment climate in various jurisdictions; its overall high level of attention to its core investment management function; and its commitment to the Funds and their shareholders. The Board noted Dodge & Cox’s long record of favorable press and industry coverage, as well as its positive compliance record, and its reputation as a trusted, shareholder-friendly mutual fund family.
DODGE & COX BALANCED FUND§PAGE 19
In addition, the Board considered that Dodge & Cox manages approximately $215 billion in Fund assets with fewer professionals than most comparable funds, and that on average these professionals have more experience and longer tenure than investment professionals at comparable funds. The Board also noted that Dodge & Cox is an investment research-oriented firm with no other business endeavors to distract management’s attention from its research efforts or to present material conflicts of interest with the operations of the Funds, that its investment professionals adhere to a consistent investment approach across the Funds, and that due to its careful and deliberate strategy with respect to new products, Dodge & Cox has had remarkable stability in its mutual fund product offerings over the course of the past 88 years and has the fewest funds of any of the 25 largest mutual fund families by assets. The Board further considered the “Gold” analyst rating awarded by Morningstar to all of the Funds (other than the Global Bond Fund, which has a “Bronze” rating). The Board concluded that it was satisfied with the nature, extent, and quality of investment management and other services provided to the Funds by Dodge & Cox.
INVESTMENT PERFORMANCE
The Board completed an intensive review and assessment of each Fund’s recent and long-term investment performance (including periods of outperformance and underperformance), as compared to relevant indices and the performance of such Fund’s peer group and broader Morningstar category. In assessing the performance of the Funds, the Board considered the Funds’ investment returns over various periods and the volatility thereof and concluded that the levels experienced were consistent with Dodge & Cox’s long-term approach and active investment style. The Board also compared the short- and long-term investment performance of the equity funds to value-oriented indices, in recognition of the significant performance divergence between value and growth stocks over the past several years. It was noted that equity performance has been consistent with the value oriented investment strategy employed by Dodge & Cox. The Board further noted that the equity funds have outperformed over their medium to long-term investment horizons as compared to their corresponding value equity indices.
The Board determined after extensive review and inquiry that Dodge & Cox’s historic, long-term, team-oriented, bottom-up investment approach remains consistent and that Dodge & Cox continues to be distinguished by its integrity, transparency, and independence. The Board considered that the performance of the Funds is the result of a value-oriented investment management process that emphasizes a long-term investment horizon, comprehensive independent research, a team approach, price discipline, low cost, and low portfolio turnover. The Board also considered that the investment performance delivered by Dodge & Cox to the Funds appeared to be consistent with the relevant performance delivered for other clients of Dodge & Cox. The Board concluded that Dodge & Cox has delivered favorable long-term performance for Fund investors consistent with the long-term investment strategies being pursued by the Funds.
COSTS AND ANCILLARY BENEFITS
Costs of Services to Funds: Fees and Expenses The Board considered each Fund’s management fee rate and net expense ratio relative to (1) a broad category of other mutual funds with similar portfolio characteristics and share class and expense structures and (2) a much smaller group of peers selected by Broadridge based on investment style, share class characteristics, and asset levels. The Board also considered the management fees charged by Dodge & Cox to other clients. In particular, the Board considered that the Funds continue to be below their peer group median in net expense ratios and that many media and industry reports specifically comment on the low cost of the Funds, which have been a defining characteristic of the Funds for many years. The Board also evaluated the operating structures of the Funds and Dodge & Cox, noting that the Funds do not charge front-end sales commissions or distribution fees, and Dodge & Cox bears, among other things, the significant cost of third party research, reimbursement for shareholder recordkeeping and administrative costs to third-party retirement plan administrators, and administrative and office overhead.
The Board noted that the Broadridge report shows that the net expense ratio of every Dodge & Cox Fund is in the least expensive quartile compared to its broad Morningstar category. The Board noted the Funds’ unusual single-share-class structure and reviewed Broadridge data (including asset-weighted average expense ratios) showing that most of the peer group funds offer several different classes of shares, with different expense ratios, to different categories of investors, and that the Broadridge expense comparisons described above generally compare the net expense ratio of each Dodge & Cox Fund’s single share class to one of the least expensive share classes of the peer fund, even though those share classes are often not available to retail investors. The Board determined that the Funds provide access for small investors to high quality investment management at a relatively low cost. The Board also considered that the Funds are priced to scale, i.e., management fee rates begin at relatively low levels. Even without breakpoints, the Funds’ management fee rates are lower than those of many peer funds whose fee schedules include breakpoints. With respect to non-U.S. funds sponsored and managed by Dodge & Cox that are comparable to the Funds in many respects, the Board noted that the fee rates charged by Dodge & Cox are the same as or higher than the fee rates charged to the Funds.
The Board reviewed information regarding the fee rates Dodge & Cox charges to separate accounts that have investment programs similar to those of the Funds, including instances where separate account fees are lower than Fund fees. The Board considered the significant differences in the nature and scope of services Dodge & Cox provides to the Funds as compared to other client accounts, as well as material differences in regulatory, litigation, and other risks as between Dodge & Cox Funds and other types of clients. The Board noted that different markets exist for mutual fund and institutional separate account management services and that a comparison of Fund fee rates and separate account fee rates must consider the fact that separate account clients bear additional costs and responsibilities that are included
PAGE 20§ DODGE & COX BALANCED FUND
in the cost of a Fund. The Board further noted that many sophisticated institutional investors in the Funds that are eligible to open separate accounts at Dodge & Cox have decided for various reasons to invest in the Funds. After consideration of these matters, the Board concluded that the overall costs incurred by the Funds for the services they receive (including the management fee paid to Dodge & Cox) are reasonable and that the fees are acceptable based upon the qualifications, experience, reputation, and performance of Dodge & Cox and the low overall expense ratios of the Funds.
Profitability and Costs of Services to Dodge & Cox; “Fall-out” Benefits The Board reviewed reports of Dodge & Cox’s financial position, profitability, and estimated overall value and considered Dodge & Cox’s overall profitability within its context as a private, employee-owned S-Corporation and relative to the favorable services provided. The Board noted in particular that Dodge & Cox’s profits are not generated by high fee rates, but reflect a very streamlined, efficient, and focused business approach toward investment management.
The Board recognized the importance of Dodge & Cox’s profitability—which is derived solely from management fees and does not include other business ventures—to maintain its independence, stability, company culture and ethics, and management continuity. The Board also considered that the compensation/profit structure at Dodge & Cox includes a return on shareholder employees’ investment in the firm, which is vital for remaining independent and facilitating retention of management and investment professionals. The Board also considered that in January 2015, Dodge & Cox closed the International Stock Fund to new investors to proactively manage the growth of the Fund. The Stock Fund and Balanced Fund were similarly closed to new investors during periods of significant growth in the past. While these actions are intended to benefit existing Fund shareholders, the effect is to reduce potential revenues to Dodge & Cox from new shareholders.
The Board also considered potential “fall-out” benefits (including the receipt of research from unaffiliated brokers and reputational benefits to non-U.S. funds sponsored and managed by Dodge & Cox) that Dodge & Cox might receive as a result of its association with the Funds and determined that they are acceptable. The Board also noted that Dodge & Cox continues to invest substantial sums in its business in order to provide enhanced services, systems, and research capabilities, all of which benefit the Funds. The Board concluded that Dodge & Cox’s profitability is the keystone of its independence, stability, and long-term investment performance and that the profitability of Dodge & Cox’s relationship with the Funds (including fall-out benefits) is fair and reasonable.
ECONOMIES OF SCALE
The Board considered whether there have been economies of scale with respect to the management of each Fund, whether the Funds have appropriately benefited from any economies of scale, and whether the management fee rate is reasonable in relation to the level of Fund assets and any economies of scale that may exist. In the Board’s view, any consideration of economies of scale must
take account of the Funds’ low fee and expense structure and the fact that the Dodge & Cox Funds build economies of scale into their fee structures by charging low fees from a fund’s inception and keeping overall expenses down as a Fund grows, as compared to other fund complexes that employ fee “breakpoints” only after a fund reaches a certain scale. An assessment of economies of scale must also take into account that Dodge & Cox invests significant time and resources in each new Fund for months (and sometimes years) prior to launch; in addition, in a Fund’s early periods of operations, expenses are capped, which means that Dodge & Cox subsidizes the operations of a new Fund for a period of time until it reaches scale. The Board also observed that, while total Fund assets have grown significantly over the long term, this growth has not been continuous or evenly distributed across all of the Funds (for example, the total assets of the Balanced Fund have actually declined over the past ten years). In addition, the Board noted that Dodge & Cox has shared the benefits of economies of scale with the Funds by adding and enhancing services to the Funds over time, and that Dodge & Cox’s internal costs of providing investment management, technology, administrative, legal, and compliance services to the Funds continue to increase. For example, Dodge & Cox has increased its global research staff and investment resources over the years to add important new capabilities for the benefit of Fund shareholders and to address the increased complexity of investing globally.
In addition, Dodge & Cox has made substantial expenditures in other staff, technology, and infrastructure to enable it to integrate credit and equity analyses and to implement its strategy in a more effective and secure manner. Over the last ten years, Dodge & Cox has increased its spending on research, investment management, client servicing, cybersecurity, technology, third party research, data services, and computer systems for trading, operations, compliance, accounting, and communications at a rate that has significantly outpaced the Funds’ growth rate during the same period. The Board also observed that, even without fee breakpoints, the Funds are competitively priced in a very competitive market and that having a low fee from inception is better for shareholders than starting with a higher fee and adding breakpoints. The Board also noted that there are certain diseconomies of scale associated with managing large funds, insofar as certain of the costs and risks associated with portfolio management increase disproportionately as assets grow. The Board concluded that the current Dodge & Cox fee structure is fair and reasonable and adequately shares economies of scale that may exist.
CONCLUSION
Based on their evaluation of all material factors and assisted by the advice of independent legal counsel to the Independent Trustees, the Board, including the Independent Trustees, concluded that the advisory fee structure was fair and reasonable, that each Fund was paying a competitive fee for the services provided, that Dodge & Cox’s services have provided value for Fund shareholders over the long term, and that approval of the Agreements was in the best interests of each Fund and its shareholders.
DODGE & COX BALANCED FUND§PAGE 21
FUND HOLDINGS
The Fund provides a complete list of its holdings four times each fiscal year, as of the end of each quarter. The Fund files the lists with the SEC on Form N-CSR (second and fourth quarters) and Form N-Q (first and third quarters). Shareholders may view the Fund’sForms N-CSR and N-Q on the SEC’s website at sec.gov. Forms N-CSR and N-Q may also be reviewed and copied at the SEC’s Public Reference Room in Washington, DC. Information regarding the operations of the Public Reference Room may be obtained by calling800-SEC-0330. A list of the Fund’s quarter-end holdings is also available at dodgeandcox.com on or about 15 days following each quarter end and remains available on the website until the list is updated in the subsequent quarter.
PROXY VOTING
For a free copy of the Fund’s proxy voting policies and procedures, please call800-621-3979, visit the Fund’s website at dodgeandcox.com, or visit the SEC’s website at sec.gov. Information regarding how the Fund voted proxies relating to portfolio securities during the most recent 12-month period ending June 30 is also available at dodgeandcox.com or at sec.gov.
HOUSEHOLD MAILINGS
The Fund routinely mails shareholder reports and summary prospectuses to shareholders and, on occasion, proxy statements. In order to reduce the volume of mail, when possible, only one copy of these documents will be sent to shareholders who are part of the same family and share the same residential address.
If you have a direct account with the Funds and you do not want the mailing of shareholder reports and summary prospectuses combined with other members in your household, contact the Funds at800-621-3979. Your request will be implemented within 30 days.
PAGE 22§ DODGE & COX BALANCED FUND
DODGE & COX FUNDS—EXECUTIVE OFFICER & TRUSTEE INFORMATION
| | | | | | |
| | | | |
Name (Age) and
Address* | | Position with Trust (Year of Election or
Appointment)** | | Principal Occupation During Past Five Years** | | Other Directorships of Public Companies Held
by Trustees |
| |
| INTERESTED TRUSTEES AND EXECUTIVE OFFICERS |
| Charles F. Pohl (60) | | Chairman and Trustee (since 2014) | | Chairman and Director of Dodge & Cox; Chief Investment Officer and member of U.S. Equity Investment Committee (USEIC), Global Equity Investment Committee (GEIC), and International Equity Investment Committee (IEIC) | | — |
| Dana M. Emery (57) | | President (since 2014) and Trustee (since 1993) | | Chief Executive Officer, President, and Director of Dodge & Cox;Co-Director of Fixed Income and member of U.S. Fixed Income Investment Committee (USFIIC) and Global Fixed Income Investment Committee (GFIIC) | | — |
| Diana S. Strandberg (59) | | Senior Vice President (since 2006) | | Senior Vice President and Director of Dodge & Cox; Director of International Equity and member of USEIC, GEIC, IEIC, and GFIIC | | — |
Roberta R.W. Kameda (58) | | Chief Legal Officer (since 2019) and Secretary (since 2017) | | Vice President, General Counsel, and Secretary (since 2017) of Dodge & Cox | | — |
| David H. Longhurst (61) | | Treasurer (since 2006) | | Vice President and Assistant Treasurer of Dodge & Cox | | — |
| Katherine M. Primas (44) | | Chief Compliance Officer (since 2010) | | Vice President and Chief Compliance Officer of Dodge & Cox | | — |
| |
| INDEPENDENT TRUSTEES |
| Caroline M. Hoxby (52) | | Trustee (since 2017) | | Professor of Economics, Stanford University; Director of the Economics of Education Program, National Bureau of Economic Research; Senior Fellow, Hoover Institution and Stanford Institute for Economic Policy Research | | — |
| Thomas A. Larsen (69) | | Trustee (since 2002) | | Senior Counsel of Arnold & Porter (law firm) (2013-2018); Partner of Arnold & Porter (until 2012); Director of Howard, Rice, Nemerovski, Canady, Falk & Rabkin (1977-2011) | | — |
| Ann Mather (58) | | Trustee (since 2011) | | CFO, Pixar Animation Studios (1999-2004) | | Director, Alphabet Inc. (internet information services) (since 2005); Director, Glu Mobile, Inc. (multimedia software) (since 2004); Director, Netflix, Inc. (internet television) (since 2010); Director, Arista Networks (cloud networking) (since 2013); Director, Shutterfly, Inc. (internet photography services/publishing) (since 2013) |
| Robert B. Morris III (66) | | Trustee (since 2011) | | Advisory Director, The Presidio Group (2005-2016); Partner and Managing Director—Global Investment Research at Goldman Sachs (until 2001) | | — |
| Gary Roughead (67) | | Trustee (since 2013) | | Robert and Marion Oster Distinguished Military Fellow, Hoover Institution (since 2012); Admiral, United States Navy (Ret.); U.S. Navy Chief of Naval Operations (2008-2011) | | Director, Northrop Grumman Corp. (global security) (since 2012); Director, Maersk Line, Limited (shipping and transportation) (since 2016) |
| Mark E. Smith (67) | | Trustee (since 2014) | | Executive Vice President, Managing Director—Fixed Income at Loomis Sayles & Company, L.P. (2003-2011) | | — |
| John B. Taylor (72) | | Trustee (since 2005) (and 1995-2001) | | Professor of Economics, Stanford University (since 1984); Senior Fellow, Hoover Institution (since 1996); Under Secretary for International Affairs, United States Treasury (2001-2005) | | — |
| * | | The address for each Officer and Trustee is 555 California Street, 40th Floor, San Francisco, California 94104. Each Officer and Trustee oversees all six series in the Dodge & Cox Funds complex and serves for an indefinite term. |
| ** | | Information as of February 14, 2019. |
Additional information about the Trust’s Trustees and Officers is available in the Trust’s Statement of Additional Information (SAI). You can get a free copy of the SAI by visiting the Funds’ website at dodgeandcox.com or calling
800-621-3979.
DODGE & COX BALANCED FUND§PAGE 23
dodgeandcox.com
For Fund literature, transactions, and account information, please visit the Funds’ website.
or write or call:
DODGE & COX FUNDS
c/o DST Asset Manager Solutions, Inc.
P.O. Box 219502
Kansas City, Missouri 64121-9502
(800) 621-3979
INVESTMENT MANAGER
Dodge & Cox
555 California Street, 40th Floor
San Francisco, California 94104
(415) 981-1710
This report is submitted for the general information of the shareholders of the Fund. The report is not authorized for distribution to prospective investors in the Fund unless it is accompanied by a current prospectus.
This report reflects our views, opinions, and portfolio holdings as of December 31, 2018, the end of the reporting period. Any such views are subject to change at any time based upon market or other conditions and Dodge & Cox disclaims any responsibility to update such views. These views may not be relied on as investment advice and, because investment decisions for a Dodge & Cox Fund are based on numerous factors, may not be relied on as an indication of trading intent on behalf of any Dodge & Cox Fund.
DODGE & COX FUNDS®
Annual Report
December 31, 2018
Income Fund
ESTABLISHED 1989
TICKER: DODIX
Important Notice:
Beginning on January 1, 2021, we intend to discontinue mailing paper copies of the Fund’s shareholder reports as permitted by new regulations adopted by the Securities and Exchange Commission, unless you specifically request paper copies from Dodge & Cox Funds or from your financial intermediary, such as a broker-dealer or bank. The reports will remain available to you on the Dodge & Cox Funds website (dodgeandcox.com), and you will be notified by mail each time a report is posted and provided with a link to access the report.
If you have already elected to receive shareholder reports electronically, you will not be affected by this change and do not need to take any action. If you have not done so already, you may elect to receive shareholder reports and other communications electronically by enrolling in e-delivery on the Funds website, or, if you are invested through a financial intermediary, by updating your mailing preferences through the intermediary.
If you wish to continue receiving paper copies of all future shareholder reports, please contact us at (800) 621-3979. Reports will be provided to you free of charge. If you are invested through a financial intermediary, you may contact your financial intermediary to request to receive paper copies. Your election to receive reports in paper form will apply to all funds held with Dodge & Cox Funds or through your financial intermediary, as applicable.
12/18 IF AR Printed on recycled paper
TO OUR SHAREHOLDERS
The Dodge & Cox Income Fund had a total return of –0.3% for the year ended December 31, 2018, compared to a return of 0.0% for the Bloomberg Barclays U.S. Aggregate Bond Index (Bloomberg Barclays U.S. Agg).
MARKET COMMENTARY
The broad U.S. investment-grade fixed income market posted a flat return for 2018 despite pressure from rising Treasury yields and the poor performance of corporate bonds. U.S. economic fundamentals remained generally strong; however, a flight to quality took hold during the fourth quarter as investors grappled with geopolitical uncertainty, changing expectations regarding future Federal Reserve (Fed) policy, and ongoing tensions between the United States and its important global trading partners.
The U.S. economy powered through 2018, leading the Fed to raise its benchmark interest rate four times. GDP grew around 3%, core inflation neared the Fed’s 2% target, and unemployment ended the year at 3.9%. Nevertheless, trade tensions between the United States and China clouded the economic outlook as protectionist rhetoric escalated into rounds of increased tariffs between the two countries. Fears of a prospective slowdown were amplified by turbulence in emerging markets and slowing growth in the eurozone and China. Finally, toward the end of the year, equity markets declined significantly, fueling recession risk concerns and dampening investor expectations of further monetary tightening.
The investment-grade Corporate sector returned –2.5%(a) for the year, underperforming comparable-duration(b) Treasuries by 3.2 percentage points. Amid a challenging market environment, the spread on investment-grade credit ended 2018 at its widest level in more than two years. Meanwhile, Agency(c) MBS returned 1.0% and underperformed comparable-duration Treasuries by 0.6 percentage points.
INVESTMENT STRATEGY
Bond investors still face a number of uncertainties, both domestic (e.g., political gridlock, Fed policy, underlying economic momentum) and international (e.g., Brexit, global growth, trade policy). These and other factors added to market volatility and led to a “risk-off” environment, particularly in the final months of 2018, which weighed on the Fund’s one-year relative return. While it was a disappointing end to 2018, we maintain conviction in our long-term, value-driven investment strategy. We seek to construct a portfolio that, in our view, is likely to perform well across a variety of market environments over our extended investment horizon. For the thoughtful and patient investor, we believe the recent volatility, and the uncertainty it reflects, can create an attractive entry point for successful investments.
In response to changing valuations over the course of the year, we selectively added exposure across all major “spread” sectors, as the significant widening in yield premiums(d) resulted in a more favorable risk/reward dynamic. Amid these changes, however, the portfolio’s investment strategy has remained broadly consistent. The Fund holds sizable positions in corporate bonds (40%) and
Agency MBS (38%) and smaller positions in asset-backed securities (9%), government-related securities (6%), U.S. Treasuries (6%), and net cash (1%).(e) We have maintained the Fund’s defensive duration positioning given our longer-term expectations for interest rates to rise more than market valuations imply.
Credit: Adding Opportunistically at Attractive Valuations
The Fund’s credit(f) weighting increased six percentage points on a net basis over the year, reflecting interesting opportunities in two distinct areas: issuance resulting from strategic corporate activity (e.g., mergers, acquisitions, spin-offs) and tactical additions to certain existing issuers. As always, these decisions are made at the individual security and issuer levels based on our team’s assessment of valuation and fundamentals.
We continued to find attractive opportunities among issuers tapping the new issue market in order to finance strategic transactions. We selectively participated in this segment of the market by focusing on large, durable enterprises that have a strong rationale for combining businesses, a commitment from management to de-lever, a credible plan for doing so, and multiple degrees of freedom to cushion against a negative surprise. For example, we recently added to Comcast,(g) which issued $27 billion of debt in October to fund its acquisition of British broadcaster Sky. While Comcast’s debt load has increased, management reiterated its plan to deleverage over the next 18-24 months in order to maintain its single-A ratings. Given the company’s size, strength, and cash flow, we believe investors are being appropriately compensated for the risks. Other recent additions to the Fund that fall into this category include Bayer, Cigna, and CVS.
Based on our extensive in-house credit research, we also added to certain Fund holdings where pricing looked more attractive amid the broad sell-off in credit. This move provided us with a more interesting opportunity set, allowing us to add to several issuers we know well—including Cemex, Enel, Petrobras, and Royal Bank of Scotland—at more attractive valuations. Other tactical purchases over the year included additions to corporates in the intermediate part of the curve. For example, we added to three- to five-year maturity securities issued by Ford Motor Credit, HSBC, and Wells Fargo.
The financial press has written extensively about the length of the current credit cycle, specifically how much longer it has to run. This is a topic we follow closely and incorporate into our investment committee discussions. While we readily acknowledge the backdrop and outlook for corporate borrowers have weakened slightly, we believe corporate fundamentals remain reasonable given healthy growth and profit margins, high interest coverage, and a well-capitalized banking sector. Against this fundamental backdrop, valuations appear attractive for the kind of issuers we tend to favor. Our credit analysis emphasizes leading companies with durable cash flows and balance sheets that can weather a full economic cycle. Historically, credit yield premiums near current valuation levels have provided attractive investment entry points.
PAGE 2§ DODGE & COX INCOME FUND
Securitized: Adding Liquidity and Incremental Yield
The Fund’s holdings in the Securitized sector consist predominantly of Agency MBS, with a smaller weighting in AAA-rated asset-backed securities (ABS). As a group, these securities add incremental yield and return opportunity over U.S. Treasuries in the intermediate portion of the yield curve and, given their high credit quality and strong liquidity, provide ballast for the overall Fund. As with credit investments, we utilize in-house fundamental research on securities in this sector to identify attractive total return opportunities over a broad range of interest rate, valuation, and prepayment scenarios.
We added to several mortgage and asset-backed security types in 2018, which increased the Fund’s Securitized weighting by 10 percentage points (from 36% to 46%). Within MBS, we added to the Fund’s position in Ginnie Mae-guaranteed Home Equity Conversion Mortgages (also known as Reverse Mortgages). These floating rate securities offer attractive spreads and low prepayment risk. We also added to certain lower coupon/longer duration 30-year securities and reduced the Fund’s holdings of 15-year MBS in response to changes in relative valuations. We continue to favor 30-year 4% and 4.5% MBS; their highly liquid and heterogeneous nature allows for deep security selection across various characteristics. Within ABS, we added to specific AAA-rated, floating rate ABS backed by 97% federally guaranteed student loans. These short-duration securities trade at attractive levels relative to ABS and MBS alternatives, and their floating rate coupon (based on LIBOR) adds a defensive duration element to the portfolio.
The MBS market continues to garner attention given the Fed’s ongoing balance sheet reduction process. In the wake of the 2007-2008 financial crisis, the Fed purchased Treasuries and Agency MBS on a large scale in an effort to support the housing market and stabilize financial conditions (known as “quantitative easing”). The Fed maintained its balance sheet of Treasuries and Agency MBS after its quantitative easing program ended in 2014 by reinvesting proceeds from bond maturities and prepayments into similar securities. With the U.S. economy on a strong track in late 2017, the Fed began to reduce its balance sheet by not reinvesting proceeds, effectively letting securities “run off” at a rate that will slowly increase to a prescribed rate. While this change presents investors with a new mortgage bond environment, we have not seen any material impact to MBS valuations due in part to the transparent and gradual nature of the reductions. We will continue to evaluate opportunities and risks in the MBS market as the Fed’s policy normalization evolves.
Defensive Duration: Mitigating the Risk of Rising Rates
We continue to position the Fund defensively with regard to interest rate risk. At year end, the Fund’s duration was 4.3 years (equal to 74% of the Bloomberg Barclays U.S. Agg’s duration). The absolute level of yields is an important factor in our deliberations regarding the optimal duration exposure for the portfolio, but we also consider the shape of the yield curve, inflation expectations, valuations, and broader economic conditions, among other factors.
The Fund’s relative interest rate positioning is underpinned by three key factors. First, while we recognize that there will be a downshift in the pace of Fed tightening and the likely federal funds terminal rate over this cycle (implied by the rapid decline in interest rates in the fourth quarter), there is still a significant gap between market expectations for future federal funds rate increases (implied by the forward curve) and the Fed’s stated expectations. We believe this gap will narrow as the market prices in a more aggressive Fed hiking path. Second, we believe the U.S. economy remains on solid footing. While the boost to economic growth from the aggressive tax bill and expansionary budget will taper off in 2019, growth should remain solid. Third, the significant tightening in measures of unemployment has raised the prospects for more rapid wage growth and somewhat higher inflation than recent indicators show. Keeping in mind the Fed’s dual mandate of full employment and stable inflation, these factors should keep the Fed nudging short-term rates higher over time and add upward pressure on longer-term rates. For these reasons, we continue to believe that a shorter relative duration is prudent.
IN CLOSING
Despite a difficult end to the year, we remain confident in our investment strategy and process. We have navigated challenging environments in the past, and have used these periods to uncover attractive long-term investment opportunities at compelling valuations. Furthermore, we believe that the current environment suits our investment strategy well, given our long-term orientation and focus on finding undervalued securities through a robust research process.
Thank you for your continued confidence in Dodge & Cox. As always, we welcome your comments and questions.
For the Board of Trustees,
| | |
| | |
Charles F. Pohl, Chairman | | Dana M. Emery, President |
January 31, 2019
| (a) | | Sector returns as calculated and reported by Bloomberg. |
| (b) | | Duration is a measure of a bond’s (or a bond portfolio’s) price sensitivity to changes in interest rates. |
| (c) | | The U.S. Government does not guarantee the Fund’s shares, yield, or net asset value. The agency guarantee (by, for example, Ginnie Mae, Fannie Mae, or Freddie Mac) does not eliminate market risk. |
| (d) | | Yield premiums are one way to measure a security’s valuation. Narrowing yield premiums result in a higher valuation. Widening yield premiums result in a lower valuation. |
| (e) | | Unless otherwise specified, all weightings and characteristics are as of December 31, 2018. |
| (f) | | Credit securities refers to corporate bonds and government-related securities, as classified by Bloomberg. |
| (g) | | The use of specific examples does not imply that they are more or less attractive investments than the Fund’s other holdings. |
DODGE & COX INCOME FUND§PAGE 3
2018 PERFORMANCE REVIEW
The Fund underperformed the Bloomberg Barclays U.S. Agg by 0.3 percentage points in 2018.
Key Detractors from Relative Results
| | § | | The Fund’s overweight to corporate bonds and underweight to U.S. Treasuries detracted from relative returns given the significant underperformance of credit. | |
| | § | | Security selection within credit was negative as several issuers underperformed, including Pemex, Telecom Italia, and TransCanada. | |
Key Contributors to Relative Results
| | § | | The Fund’s shorter relative duration (71% of the Bloomberg Barclays U.S. Agg’s duration) added significantly to relative returns. | |
| | § | | Certain credit issuers outperformed, including Bank of America capital securities, Rio Oil Finance Trust, and Verizon. | |
| | § | | The Fund’s nominal yield advantage added to relative returns. | |
KEY CHARACTERISTICS OF DODGE & COX
Independent Organization
Dodge & Cox is one of the largest privately owned investment managers in the world. We remain committed to independence, with a goal of providing the highest quality investment management service to our existing clients.
Over 85 Years of Investment Experience
Dodge & Cox was founded in 1930. We have a stable and well-qualified team of investment professionals, most of whom have spent their entire careers at Dodge & Cox.
Experienced Investment Team
The U.S. Fixed Income Investment Committee, which is the decision-making body for the Income Fund, is a ten-member committee with an average tenure at Dodge & Cox of 21 years.
One Business with a Single Research Office
Dodge & Cox manages equity (domestic, international, and global), fixed income (domestic and global), and balanced investments, operating from one office in San Francisco.
Consistent Investment Approach
Our team decision-making process involves thorough, bottom-up fundamental analysis of each investment.
Long-Term Focus and Low Expenses
We invest with a three- to five-year investment horizon, which has historically resulted in low turnover relative to our peers. We manage Funds that maintain low expense ratios.
Risks: The Fund invests in individual bonds whose yields and market values fluctuate, so that an investment may be worth more or less than its original cost. Debt securities are subject to interest rate risk, credit risk, and prepayment and call risk, all of which could have adverse effects on the value of the Fund. A low interest rate environment creates an elevated risk of future negative returns. Financial intermediaries may restrict their market making activities for certain debt securities, which may reduce the liquidity and increase the volatility of such securities. Please read the prospectus and summary prospectus for specific details regarding the Fund’s risk profile.
PAGE 4§ DODGE & COX INCOME FUND
GROWTH OF $10,000 OVER 10 YEARS
FOR AN INVESTMENT MADE ON DECEMBER 31, 2008
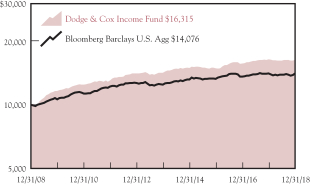
AVERAGE ANNUAL TOTAL RETURN
FOR PERIODS ENDED DECEMBER 31, 2018
| | | | | | | | | | | | | | | | |
| | | 1 Year | | | 5 Years | | | 10 Years | | | 20 Years | |
Dodge & Cox Income Fund | | | –0.31 | % | | | 2.87 | % | | | 5.01 | % | | | 5.08 | % |
Bloomberg Barclays U.S. Aggregate Bond Index (Bloomberg Barclays U.S. Agg) | | | 0.01 | | | | 2.52 | | | | 3.48 | | | | 4.55 | |
Returns represent past performance and do not guarantee future results. Investment return and share price will fluctuate with market conditions, and investors may have a gain or loss when shares are sold. Fund performance changes over time and currently may be significantly lower than stated. Performance is updated and published monthly. Visit the Fund’s website at dodgeandcox.com or call800-621-3979 for current performance figures.
The Fund’s total returns include the reinvestment of dividend and capital gain distributions, but have not been adjusted for any income taxes payable by shareholders on these distributions or on Fund share redemptions. Index returns include interest income but, unlike Fund returns, do not reflect fees or expenses. The Bloomberg Barclays U.S. Aggregate Bond Index (Bloomberg Barclays U.S. Agg) is a widely recognized, unmanaged index of U.S. dollar-denominated, investment-grade, taxable debt securities.
Bloomberg is a registered trademark of Bloomberg Finance L.P. and its affiliates. Barclays® is a trademark of Barclays Bank PLC.
FUND EXPENSE EXAMPLE
As a Fund shareholder, you incur ongoing Fund costs, including management fees and other Fund expenses. All mutual funds have ongoing costs, sometimes referred to as operating expenses. The following example shows ongoing costs of investing in the Fund and can help you understand these costs and compare them with those of other mutual funds. The example assumes a $1,000 investment held for the six months indicated.
ACTUAL EXPENSES
The first line of the table below provides information about actual account values and expenses based on the Fund’s actual returns. You may use the information in this line, together with your account balance, to estimate the expenses that you paid over the period. Simply divide your account value by $1,000 (for example, an $8,600 account value divided by $1,000 = 8.6), then multiply the result by the number in the first line under the heading “Expenses Paid During Period” to estimate the expenses you paid on your account during this period.
HYPOTHETICAL EXAMPLE FOR COMPARISON WITH OTHER MUTUAL FUNDS
Information on the second line of the table can help you compare ongoing costs of investing in the Fund with those of other mutual funds. This information may not be used to estimate the actual ending account balance or expenses you paid during the period. The hypothetical “Ending Account Value” is based on the actual expense ratio of the Fund and an assumed 5% annual rate of return before expenses (not the Fund’s actual return). The amount under the heading “Expenses Paid During Period” shows the hypothetical expenses your account would have incurred under this scenario. You can compare this figure with the 5% hypothetical examples that appear in shareholder reports of other mutual funds.
| | | | | | | | | | | | |
Six Months Ended December 31, 2018 | | Beginning Account Value
7/1/2018 | | | Ending Account Value
12/31/2018 | | | Expenses Paid
During Period* | |
Based on Actual Fund Return | | $ | 1,000.00 | | | $ | 1,009.30 | | | $ | 2.13 | |
Based on Hypothetical 5% Yearly Return | | | 1,000.00 | | | | 1,023.08 | | | | 2.15 | |
| * | | Expenses are equal to the Fund’s annualized expense ratio of 0.42%, multiplied by the average account value over the period, multiplied by 184/365 (to reflect theone-half year period). |
The expenses shown in the table highlight ongoing costs only and do not reflect any transactional fees or account maintenance fees. Though other mutual funds may charge such fees, please note that the Fund does not charge transaction fees (e.g., redemption fees, sales loads) or universal account maintenance fees (e.g., small account fees).
DODGE & COX INCOME FUND§PAGE 5
| | | | |
| FUND INFORMATION (unaudited) | | | December 31, 2018 | |
| | | | |
| GENERAL INFORMATION | | | |
Net Asset Value Per Share | | | $13.26 | |
Total Net Assets (billions) | | | $54.3 | |
Expense Ratio | | | 0.42% | |
Portfolio Turnover Rate | | | 37% | |
30-Day SEC Yield(a) | | | 3.72% | |
Number of Credit Issuers | | | 54 | |
Fund Inception | | | 1989 | |
No sales charges or distribution fees | | | | |
Investment Manager: Dodge & Cox, San Francisco. Managed by the U.S. Fixed Income Investment Committee, whose ten members’ average tenure at Dodge & Cox is 21 years.
| | | | | | | | |
| PORTFOLIO CHARACTERISTICS | | Fund | | | BBG Barclays
U.S. Agg | |
Effective Duration (years)(b) | | | 4.3 | | | | 5.9 | |
| | | | |
| FIVE LARGEST CREDIT ISSUERS (%)(c) | | Fund | |
Charter Communications, Inc. | | | 2.7 | |
Wells Fargo & Co. | | | 2.0 | |
HSBC Holdings PLC | | | 1.8 | |
Petroleos Mexicanos | | | 1.8 | |
State of California GO | | | 1.7 | |
| | | | | | | | |
| CREDIT QUALITY (%)(d) | | Fund | | | BBG Barclays
U.S. Agg | |
U.S. Treasury/Agency/GSE(e) | | | 43.6 | | | | 69.3 | |
Aaa | | | 4.5 | | | | 4.0 | |
Aa | | | 6.7 | | | | 3.1 | |
A | | | 6.0 | | | | 10.0 | |
Baa | | | 31.9 | | | | 13.6 | |
Ba | | | 6.5 | | | | 0.0 | |
B | | | 0.0 | | | | 0.0 | |
Caa | | | 0.0 | | | | 0.0 | |
Net Cash & Other(g) | | | 0.8 | | | | 0.0 | |
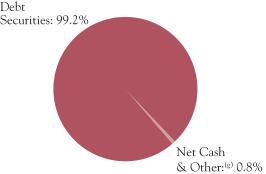
| | | | | | | | |
| SECTOR DIVERSIFICATION (%) | | Fund | | | BBG Barclays
U.S. Agg | |
U.S. Treasury(e) | | | 5.9 | | | | 38.9 | |
Government-Related(f) | | | 6.4 | | | | 6.1 | |
Securitized | | | 46.4 | | | | 30.7 | |
Corporate | | | 40.5 | | | | 24.3 | |
Net Cash & Other(g) | | | 0.8 | | | | 0.0 | |
| | | | | | | | |
| MATURITY DIVERSIFICATION (%)(e) | | Fund | | | BBG Barclays
U.S. Agg | |
0-1 Years to Maturity | | | 3.2 | | | | 0.0 | |
1-5 | | | 30.8 | | | | 40.5 | |
5-10 | | | 49.7 | | | | 43.8 | |
10-15 | | | 1.8 | | | | 1.2 | |
15-20 | | | 5.2 | | | | 2.3 | |
20-25 | | | 2.8 | | | | 4.4 | |
25 and Over | | | 6.5 | | | | 7.8 | |
| (a) | SEC Yield is an annualization of the Fund’s net investment income for the trailing30-day period. Dividends paid by the Fund may be higher or lower than implied by the SEC Yield. |
| (b) | Interest rate derivatives reduce total Fund duration by 0.2 years (i.e., total Fund duration is 4.5 years without derivatives). |
| (c) | The Fund’s portfolio holdings are subject to change without notice. The mention of specific securities is not a recommendation to buy, sell, or hold any particular security and is not indicative of Dodge & Cox’s current or future trading activity. |
| (d) | The credit quality distributions shown for the Fund and the Index are based on the middle of Moody’s, S&P, and Fitch ratings, which is the methodology used by Bloomberg in constructing its indices. If a security is rated by only two agencies, the lower of the two ratings is used. Please note the Fund applies the highest of Moody’s, S&P, and Fitch ratings to determine compliance with the quality requirements stated in its prospectus. On that basis, the Fund held 3.7% in securities rated below investment grade. The credit quality of the investments in the portfolio does not apply to the stability or safety of the Fund or its shares. |
| (e) | Data as presented excludes the Fund’s position in Treasury futures contracts. |
| (f) | The portfolio’s Government-Related holdings includetax-exempt municipal securities; the Index classifies these securities as Municipal Bonds. |
| (g) | Net Cash & Other includes cash, short-term investments, derivatives, receivables, and payables. |
PAGE 6§ DODGE & COX INCOME FUND
| | | | |
| PORTFOLIO OF INVESTMENTS | | | December 31, 2018 | |
| | | | | | | | |
| DEBT SECURITIES: 99.2% | |
| | |
| | | PAR VALUE | | | VALUE | |
| U.S. TREASURY: 5.9% | |
U.S. Treasury Note/Bond | | | | | | | | |
2.375%, 4/15/21 | | $ | 195,185,000 | | | $ | 194,662,107 | |
2.625%, 5/15/21 | | | 297,955,000 | | | | 298,859,374 | |
1.375%, 5/31/21 | | | 450,000,000 | | | | 438,362,482 | |
2.625%, 7/15/21 | | | 375,000,000 | | | | 376,280,543 | |
1.125%, 7/31/21 | | | 250,000,000 | | | | 241,520,558 | |
2.00%, 12/31/21 | | | 165,000,000 | | | | 162,738,028 | |
1.875%, 7/31/22 | | | 200,000,000 | | | | 195,852,888 | |
2.75%, 4/30/23 | | | 142,955,000 | | | | 144,425,501 | |
2.75%, 8/31/25 | | | 565,540,000 | | | | 571,266,251 | |
3.00%, 10/31/25 | | | 561,940,000 | | | | 576,737,150 | |
| | | | | | | | |
| | | | | | | 3,200,704,882 | |
| GOVERNMENT-RELATED: 6.4% | |
FEDERAL AGENCY: 0.1% | |
Small Business Admin. — 504 Program | |
Series1999-20C 1, 6.30%, 3/1/19 | | | 9,887 | | | | 9,903 | |
Series1999-20E 1, 6.30%, 5/1/19 | | | 276 | | | | 277 | |
Series1999-20G 1, 7.00%, 7/1/19 | | | 37,557 | | | | 37,731 | |
Series1999-20I 1, 7.30%, 9/1/19 | | | 19,166 | | | | 19,314 | |
Series2000-20C 1, 7.625%, 3/1/20 | | | 1,402 | | | | 1,422 | |
Series2000-20G 1, 7.39%, 7/1/20 | | | 1,316 | | | | 1,334 | |
Series2001-20G 1, 6.625%, 7/1/21 | | | 317,563 | | | | 324,525 | |
Series2001-20L 1, 5.78%, 12/1/21 | | | 759,842 | | | | 775,761 | |
Series2002-20A 1, 6.14%, 1/1/22 | | | 6,608 | | | | 6,788 | |
Series2002-20L 1, 5.10%, 12/1/22 | | | 233,881 | | | | 239,593 | |
Series2003-20G 1, 4.35%, 7/1/23 | | | 19,956 | | | | 20,406 | |
Series2004-20L 1, 4.87%, 12/1/24 | | | 501,796 | | | | 518,514 | |
Series2005-20B 1, 4.625%, 2/1/25 | | | 1,033,267 | | | | 1,061,546 | |
Series2005-20D 1, 5.11%, 4/1/25 | | | 34,848 | | | | 36,036 | |
Series2005-20E 1, 4.84%, 5/1/25 | | | 1,441,374 | | | | 1,486,128 | |
Series2005-20G 1, 4.75%, 7/1/25 | | | 1,710,889 | | | | 1,761,372 | |
Series2005-20H 1, 5.11%, 8/1/25 | | | 18,980 | | | | 19,621 | |
Series2005-20I 1, 4.76%, 9/1/25 | | | 2,054,240 | | | | 2,117,613 | |
Series2006-20A 1, 5.21%, 1/1/26 | | | 1,867,315 | | | | 1,934,120 | |
Series2006-20B 1, 5.35%, 2/1/26 | | | 580,495 | | | | 603,762 | |
Series2006-20C 1, 5.57%, 3/1/26 | | | 2,623,025 | | | | 2,745,748 | |
Series2006-20G 1, 6.07%, 7/1/26 | | | 4,618,519 | | | | 4,859,532 | |
Series2006-20H 1, 5.70%, 8/1/26 | | | 36,918 | | | | 38,658 | |
Series2006-20I 1, 5.54%, 9/1/26 | | | 67,797 | | | | 71,013 | |
Series2006-20J 1, 5.37%, 10/1/26 | | | 1,707,160 | | | | 1,780,251 | |
Series2006-20L 1, 5.12%, 12/1/26 | | | 1,634,763 | | | | 1,698,193 | |
Series2007-20A 1, 5.32%, 1/1/27 | | | 3,201,732 | | | | 3,324,586 | |
Series2007-20C 1, 5.23%, 3/1/27 | | | 5,071,998 | | | | 5,243,268 | |
Series2007-20D 1, 5.32%, 4/1/27 | | | 5,127,347 | | | | 5,324,720 | |
Series2007-20G 1, 5.82%, 7/1/27 | | | 3,493,235 | | | | 3,671,101 | |
| | | | | | | | |
| | | | | | | 39,732,836 | |
FOREIGN AGENCY: 2.4% | |
Petroleo Brasileiro SA (Brazil) | |
5.999%, 1/27/28 | | | 329,050,000 | | | | 309,803,866 | |
7.25%, 3/17/44 | | | 9,130,000 | | | | 8,997,706 | |
Petroleos Mexicanos (Mexico) | | | | | | | | |
4.875%, 1/18/24 | | | 123,065,000 | | | | 114,696,580 | |
6.875%, 8/4/26 | | | 120,490,000 | | | | 117,116,280 | |
6.50%, 3/13/27 | | | 227,365,000 | | | | 213,723,100 | |
6.625%, 6/15/35 | | | 112,290,000 | | | | 98,029,170 | |
6.375%, 1/23/45 | | | 166,156,000 | | | | 133,755,580 | |
6.75%, 9/21/47 | | | 191,366,000 | | | | 158,238,632 | |
6.35%, 2/12/48 | | | 192,270,000 | | | | 153,146,900 | |
| | | | | | | | |
| | | | | | | 1,307,507,814 | |
LOCAL AUTHORITY: 3.9% | |
L.A. Unified School District GO | |
5.75%, 7/1/34 | | | 6,075,000 | | | | 7,188,608 | |
6.758%, 7/1/34 | | | 185,585,000 | | | | 238,831,192 | |
New Jersey Turnpike Authority RB | | | | | | | | |
7.414%, 1/1/40 | | | 41,065,000 | | | | 57,860,585 | |
| | | | | | | | |
| | |
| | | PAR VALUE | | | VALUE | |
7.102%, 1/1/41 | | $ | 148,277,000 | | | $ | 202,556,761 | |
New Valley Generation
4.929%, 1/15/21 | | | 197,230 | | | | 202,026 | |
State of California GO | | | | | | | | |
7.50%, 4/1/34 | | | 194,406,000 | | | | 264,922,888 | |
7.55%, 4/1/39 | | | 146,605,000 | | | | 210,018,993 | |
7.30%, 10/1/39 | | | 208,455,000 | | | | 286,150,348 | |
7.625%, 3/1/40 | | | 119,575,000 | | | | 170,249,689 | |
State of Illinois GO | | | | | | | | |
5.877%, 3/1/19 | | | 120,575,000 | | | | 121,107,942 | |
5.00%, 11/1/20 | | | 145,585,000 | | | | 150,326,704 | |
5.00%, 11/1/21 | | | 117,990,000 | | | | 123,357,365 | |
5.10%, 6/1/33 | | | 306,400,000 | | | | 292,130,952 | |
| | | | | | | | |
| | | | | | | 2,124,904,053 | |
| | | | | | | | |
| | | | | | | 3,472,144,703 | |
| SECURITIZED: 46.4% | |
ASSET-BACKED: 8.8% | |
Auto Loan: 0.5% | |
Ford Credit Auto Owner Trust | |
Series 2015-REV1 A, 2.12%, 7/15/26(b) | | | 207,826,000 | | | | 205,703,161 | |
Series 2017-REV1 A, 2.62%, 8/15/28(b) | | | 26,054,000 | | | | 25,670,360 | |
Series 2017-REV2 A, 2.36%, 3/15/29(b) | | | 54,874,000 | | | | 53,452,956 | |
| | | | | | | | |
| | | | | | | 284,826,477 | |
Credit Card: 1.1% | |
American Express Master Trust | |
Series2017-3 A, 1.77%, 4/15/20 | | | 185,705,000 | | | | 183,051,610 | |
Series2017-6 A, 2.04%, 5/15/23 | | | 59,190,000 | | | | 58,278,101 | |
Series2018-6 A, 3.06%, 2/15/24 | | | 44,828,000 | | | | 44,980,913 | |
Bank of America Credit Card Trust
Series2018-A1 A1, 2.70%, 7/17/23 | | | 224,513,000 | | | | 223,692,270 | |
Citibank Credit Card Issuance Trust
Series2018-A1 A1, 2.49%, 1/20/23 | | | 59,944,000 | | | | 59,457,627 | |
| | | | | | | | |
| | | | | | | 569,460,521 | |
Other: 1.4% | |
Rio Oil Finance Trust (Brazil) | |
9.25%, 7/6/24(b) | | | 412,059,253 | | | | 439,358,179 | |
9.75%, 1/6/27(b) | | | 238,769,958 | | | | 261,154,641 | |
8.20%, 4/6/28(b) | | | 66,400,000 | | | | 69,554,000 | |
| | | | | | | | |
| | | | | | | 770,066,820 | |
Student Loan: 5.8% | |
Navient Student Loan Trust
USD LIBOR1-Month | |
+1.25%, 3.756%, 6/25/65(b) | | | 233,854,692 | | | | 235,598,126 | |
+1.15%, 3.656%, 3/25/66(b) | | | 100,610,085 | | | | 100,955,077 | |
+1.30%, 3.806%, 3/25/66(b) | | | 123,350,000 | | | | 125,998,115 | |
+0.80%, 3.306%, 7/26/66(b) | | | 358,793,179 | | | | 359,383,896 | |
+1.05%, 3.556%, 7/26/66(b) | | | 323,668,000 | | | | 326,944,588 | |
+1.15%, 3.656%, 7/26/66(b) | | | 219,752,000 | | | | 222,217,112 | |
+1.00%, 3.506%, 9/27/66(b) | | | 114,564,000 | | | | 116,126,504 | |
+1.05%, 3.556%, 12/27/66(b) | | | 139,176,576 | | | | 139,176,368 | |
+0.72%, 3.226%, 3/25/67(b) | | | 97,760,000 | | | | 97,217,412 | |
+0.80%, 3.306%, 3/25/67(b) | | | 183,798,000 | | | | 181,518,298 | |
+0.68%, 3.186%, 6/27/67(b) | | | 225,000,000 | | | | 223,159,972 | |
+0.70%, 3.206%, 2/25/70(b) | | | 281,255,799 | | | | 280,533,731 | |
Navient Student Loan Trust (Private Loans) | |
Series2014-AA A2A, 2.74%, 2/15/29(b) | | | 20,368,355 | | | | 20,143,415 | |
Series2017-A A2A, 2.88%, 12/16/58(b) | | | 31,000,000 | | | | 30,319,838 | |
SLM Student Loan Trust
USD LIBOR1-Month | | | | | | | | |
+1.20%, 3.706%, 10/25/34 | | | 27,721,000 | | | | 28,239,876 | |
USD LIBOR3-Month | | | | | | | | |
+0.63%, 3.12%, 1/25/40(b) | | | 142,597,151 | | | | 142,930,016 | |
+0.17%, 2.66%, 7/25/40 | | | 13,626,000 | | | | 12,915,119 | |
+0.75%, 3.24%, 10/25/40 | | | 80,889,000 | | | | 80,226,924 | |
+0.60%, 3.09%, 1/25/41 | | | 125,311,000 | | | | 124,423,836 | |
| | |
| See accompanying Notes to Financial Statements | | DODGE & COX INCOME FUND§PAGE 7 |
| | | | |
| PORTFOLIO OF INVESTMENTS | | | December 31, 2018 | |
| | | | | | | | |
| DEBT SECURITIES (continued) | |
| | |
| | | PAR VALUE | | | VALUE | |
+0.55%, 3.04%, 10/25/64(b) | | $ | 32,458,000 | | | $ | 32,538,395 | |
+0.55%, 3.04%, 10/25/64(b) | | | 72,950,000 | | | | 73,195,382 | |
SLM Student Loan Trust (Private Loans) | |
Series2013-A A2A, 1.77%, 5/17/27(b) | | | 7,641,160 | | | | 7,628,377 | |
Series2013-C A2A, 2.94%, 10/15/31(b) | | | 10,643,640 | | | | 10,640,030 | |
SMB Private Education Loan Trust (Private Loans) | |
Series2017-A A2A, 2.88%, 9/15/34(b) | | | 26,811,000 | | | | 26,223,083 | |
Series2017-B A2A, 2.82%, 10/15/35(b) | | | 26,946,000 | | | | 26,345,258 | |
Series2018-A A2A, 3.50%, 2/15/36(b) | | | 50,000,000 | | | | 50,063,375 | |
Series2018-B A2A, 3.60%, 1/15/37(b) | | | 68,386,000 | | | | 69,248,854 | |
| | | | | | | | |
| | | | | | | 3,143,910,977 | |
| | | | | | | | |
| | | | | | | 4,768,264,795 | |
CMBS: 0.3% | |
Agency CMBS: 0.3% | |
Fannie Mae Multifamily DUS | |
Pool AL6028, 2.70%, 7/1/21 | | | 2,229,981 | | | | 2,226,466 | |
Pool AL6455, 2.765%, 11/1/21 | | | 9,180,299 | | | | 9,160,767 | |
Pool AL6445, 2.50%, 1/1/22 | | | 5,886,349 | | | | 5,819,355 | |
Freddie Mac Multifamily Interest Only | |
Series K055 X1, 1.366%, 3/25/26(d) | | | 119,211,445 | | | | 9,778,188 | |
Series K056 X1, 1.266%, 5/25/26(d) | | | 41,317,964 | | | | 3,152,808 | |
Series K057 X1, 1.192%, 7/25/26(d) | | | 209,252,244 | | | | 15,398,789 | |
Series K062 X1, 0.308%, 12/25/26(d) | | | 324,482,727 | | | | 7,181,679 | |
Series K064 X1, 0.608%, 3/25/27(d) | | | 413,921,303 | | | | 17,409,447 | |
Series K065 X1, 0.674%, 4/25/27(d) | | | 479,578,244 | | | | 22,558,929 | |
Series K066 X1, 0.753%, 6/25/27(d) | | | 381,780,578 | | | | 20,152,440 | |
Series K067 X1, 0.579%, 7/25/27(d) | | | 480,665,484 | | | | 20,202,611 | |
Series K069 X1, 0.369%, 9/25/27(d) | | | 101,109,943 | | | | 2,876,204 | |
Series K071 X1, 0.292%, 11/25/27(d) | | | 259,268,368 | | | | 5,864,754 | |
Series K070 X1, 0.327%, 11/25/27(d) | | | 121,944,721 | | | | 3,194,598 | |
Series K154 X1, 0.312%, 11/25/32(d) | | | 295,165,700 | | | | 9,335,294 | |
| | | | | | | | |
| | | | | | | 154,312,329 | |
| | | | | | | | |
| | | | | | | 154,312,329 | |
MORTGAGE-RELATED: 37.3% | |
Federal Agency CMO & REMIC: 5.7% | |
Dept. of Veterans Affairs | |
Series1995-2D 4A, 9.293%, 5/15/25 | | | 75,104 | | | | 84,386 | |
Series1997-2 Z, 7.50%, 6/15/27 | | | 5,798,568 | | | | 6,374,617 | |
Series1998-2 2A, 8.675%, 8/15/27(d) | | | 15,003 | | | | 16,678 | |
Series1998-1 1A, 8.293%, 3/15/28(d) | | | 111,352 | | | | 121,062 | |
Fannie Mae | |
Trust1998-58 PX, 6.50%, 9/25/28 | | | 208,366 | | | | 226,226 | |
Trust1998-58 PC, 6.50%, 10/25/28 | | | 1,151,882 | | | | 1,253,690 | |
Trust2001-69 PQ, 6.00%, 12/25/31 | | | 1,434,911 | | | | 1,581,572 | |
Trust2002-33 A1, 7.00%, 6/25/32 | | | 1,671,459 | | | | 1,845,432 | |
Trust2002-69 Z, 5.50%, 10/25/32 | | | 185,961 | | | | 198,180 | |
Trust2008-24 GD, 6.50%, 3/25/37 | | | 682,580 | | | | 738,665 | |
Trust2007-47 PE, 5.00%, 5/25/37 | | | 2,547,524 | | | | 2,692,903 | |
Trust2009-53 QM, 5.50%, 5/25/39 | | | 657,076 | | | | 676,604 | |
Trust2009-30 AG, 6.50%, 5/25/39 | | | 6,224,370 | | | | 6,750,746 | |
Trust2009-40 TB, 6.00%, 6/25/39 | | | 2,612,799 | | | | 2,800,657 | |
Trust2010-123 WT, 7.00%, 11/25/40 | | | 26,966,044 | | | | 30,541,612 | |
Trust2001-T3 A1, 7.50%, 11/25/40 | | | 93,486 | | | | 104,741 | |
Trust2001-T7 A1, 7.50%, 2/25/41 | | | 54,566 | | | | 62,103 | |
Trust2001-T5 A2, 7.00%, 6/19/41(d) | | | 36,155 | | | | 39,916 | |
Trust2001-T5 A3, 7.50%, 6/19/41(d) | | | 178,103 | | | | 200,421 | |
Trust2011-58 AT, 4.00%, 7/25/41 | | | 7,191,361 | | | | 7,455,281 | |
Trust2001-T4 A1, 7.50%, 7/25/41 | | | 1,591,014 | | | | 1,817,956 | |
Trust2001-T10 A1, 7.00%, 12/25/41 | | | 1,798,006 | | | | 2,053,147 | |
Trust2013-106 MA, 4.00%, 2/25/42 | | | 16,511,286 | | | | 17,003,153 | |
Trust2002-90 A1, 6.50%, 6/25/42 | | | 3,743,250 | | | | 4,031,304 | |
Trust2002-W6 2A1, 7.00%, 6/25/42(d) | | | 2,107,690 | | | | 2,282,065 | |
Trust2002-W8 A2, 7.00%, 6/25/42 | | | 1,178,436 | | | | 1,341,729 | |
Trust2003-W2 1A2, 7.00%, 7/25/42 | | | 6,191,311 | | | | 7,006,471 | |
Trust2002-T16 A3, 7.50%, 7/25/42 | | | 2,830,879 | | | | 3,265,763 | |
| | | | | | | | |
| | |
| | | PAR VALUE | | | VALUE | |
Trust2003-W4 3A, 7.00%, 10/25/42(d) | | $ | 1,834,310 | | | $ | 1,994,840 | |
Trust2012-121 NB, 7.00%, 11/25/42 | | | 884,167 | | | | 992,917 | |
Trust2003-W1 2A, 5.891%, 12/25/42(d) | | | 2,252,567 | | | | 2,414,231 | |
Trust2003-7 A1, 6.50%, 12/25/42 | | | 3,062,430 | | | | 3,384,102 | |
Trust2004-T1 1A2, 6.50%, 1/25/44 | | | 1,882,357 | | | | 2,106,153 | |
Trust2004-W2 2A2, 7.00%, 2/25/44 | | | 79,832 | | | | 89,374 | |
Trust2004-W2 5A, 7.50%, 3/25/44 | | | 3,390,813 | | | | 3,762,338 | |
Trust2004-W8 3A, 7.50%, 6/25/44 | | | 2,626,725 | | | | 2,988,357 | |
Trust2004-W15 1A2, 6.50%, 8/25/44 | | | 636,973 | | | | 708,503 | |
Trust2005-W1 1A3, 7.00%, 10/25/44 | | | 5,123,129 | | | | 5,807,488 | |
Trust2001-79 BA, 7.00%, 3/25/45 | | | 562,975 | | | | 634,841 | |
Trust2006-W1 1A1, 6.50%, 12/25/45 | | | 308,706 | | | | 345,599 | |
Trust2006-W1 1A2, 7.00%, 12/25/45 | | | 2,271,197 | | | | 2,569,159 | |
Trust2006-W1 1A3, 7.50%, 12/25/45 | | | 39,078 | | | | 44,499 | |
Trust2006-W1 1A4, 8.00%, 12/25/45 | | | 2,634,003 | | | | 3,026,871 | |
Trust2007-W10 1A, 6.26%, 8/25/47(d) | | | 7,958,889 | | | | 8,593,628 | |
Trust2007-W10 2A, 6.345%, 8/25/47(d) | | | 2,453,194 | | | | 2,641,739 | |
USD LIBOR1-Month | | | | | | | | |
+0.55%, 3.056%, 9/25/43 | | | 31,645,145 | | | | 31,983,122 | |
+0.40%, 2.906%, 7/25/44 | | | 1,319,931 | | | | 1,305,912 | |
Freddie Mac | |
Series 3312 AB, 6.50%, 6/15/32 | | | 2,294,813 | | | | 2,547,867 | |
Series 2456 CJ, 6.50%, 6/15/32 | | | 153,306 | | | | 171,151 | |
SeriesT-41 2A, 5.438%, 7/25/32(d) | | | 212,381 | | | | 226,100 | |
Series 2587 ZU, 5.50%, 3/15/33 | | | 3,236,391 | | | | 3,460,474 | |
Series 2610 UA, 4.00%, 5/15/33 | | | 1,429,328 | | | | 1,459,235 | |
SeriesT-48 1A, 4.969%, 7/25/33(d) | | | 2,307,627 | | | | 2,414,132 | |
Series 2708 ZD, 5.50%, 11/15/33 | | | 13,248,377 | | | | 14,598,811 | |
Series 3204 ZM, 5.00%, 8/15/34 | | | 5,970,876 | | | | 6,395,754 | |
Series 3330 GZ, 5.50%, 6/15/37 | | | 874,474 | | | | 938,649 | |
Series 3427 Z, 5.00%, 3/15/38 | | | 2,600,170 | | | | 2,770,530 | |
SeriesT-51 1A, 6.50%, 9/25/43(d) | | | 52,840 | | | | 59,837 | |
Series 4283 DW, 4.50%, 12/15/43(d) | | | 70,582,749 | | | | 74,565,677 | |
Series 4283 EW, 4.50%, 12/15/43(d) | | | 41,485,606 | | | | 43,588,072 | |
Series 4281 BC, 4.50%, 12/15/43(d) | | | 116,764,717 | | | | 124,125,950 | |
Series 4319 MA, 4.50%, 3/15/44(d) | | | 23,174,828 | | | | 24,648,868 | |
USD LIBOR1-Month | | | | | | | | |
+0.53%, 2.985%, 8/15/43 | | | 57,840,096 | | | | 58,490,651 | |
Ginnie Mae
USD LIBOR1-Month | |
+0.65%, 2.964%, 10/20/64 | | | 7,744,057 | | | | 7,791,862 | |
+0.63%, 2.944%, 4/20/65 | | | 11,316,050 | | | | 11,376,453 | |
+0.60%, 2.914%, 7/20/65 | | | 8,176,106 | | | | 8,210,820 | |
+0.60%, 2.914%, 8/20/65 | | | 7,417,456 | | | | 7,449,479 | |
+0.62%, 2.934%, 9/20/65 | | | 1,686,941 | | | | 1,695,676 | |
+0.75%, 3.064%, 11/20/65 | | | 30,194,473 | | | | 30,492,293 | |
+0.90%, 3.214%, 3/20/66 | | | 19,617,197 | | | | 19,940,828 | |
+0.90%, 3.214%, 4/20/66 | | | 20,563,814 | | | | 20,902,894 | |
+0.78%, 3.094%, 9/20/66 | | | 11,588,596 | | | | 11,723,451 | |
+0.75%, 3.064%, 10/20/66 | | | 53,526,392 | | | | 54,116,633 | |
+0.80%, 3.114%, 11/20/66 | | | 23,577,173 | | | | 23,890,766 | |
+0.81%, 3.124%, 12/20/66 | | | 13,029,487 | | | | 13,212,861 | |
+0.57%, 2.884%, 9/20/67 | | | 31,190,774 | | | | 31,429,418 | |
USD LIBOR12-Month | | | | | | | | |
+0.30%, 3.128%, 9/20/66 | | | 19,399,046 | | | | 19,504,055 | |
+0.28%, 3.376%, 12/20/66 | | | 37,388,472 | | | | 37,634,612 | |
+0.30%, 2.26%, 1/20/67 | | | 95,403,995 | | | | 96,012,291 | |
+0.30%, 2.26%, 1/20/67 | | | 103,739,671 | | | | 104,382,805 | |
+0.31%, 2.27%, 1/20/67 | | | 39,611,969 | | | | 39,877,226 | |
+0.25%, 2.513%, 2/20/67 | | | 20,371,351 | | | | 20,438,055 | |
+0.20%, 2.463%, 3/20/67 | | | 3,312,368 | | | | 3,315,485 | |
+0.30%, 2.797%, 4/20/67 | | | 24,205,472 | | | | 24,339,658 | |
+0.20%, 2.863%, 5/20/67 | | | 47,962,856 | | | | 48,024,100 | |
+0.30%, 2.963%, 5/20/67 | | | 20,985,847 | | | | 21,102,644 | |
+0.20%, 2.977%, 6/20/67 | | | 104,287,136 | | | | 104,551,275 | |
+0.30%, 3.077%, 6/20/67 | | | 24,441,596 | | | | 24,586,065 | |
+0.20%, 2.972%, 8/20/67 | | | 22,972,789 | | | | 22,999,327 | |
| | |
| PAGE 8§ DODGE & COX INCOME FUND | | See accompanying Notes to Financial Statements |
| | | | |
| PORTFOLIO OF INVESTMENTS | | | December 31, 2018 | |
| | | | | | | | |
| DEBT SECURITIES (continued) | |
| | |
| | | PAR VALUE | | | VALUE | |
+0.25%, 3.078%, 9/20/67 | | $ | 23,892,127 | | | $ | 23,975,026 | |
+0.27%, 3.098%, 9/20/67 | | | 72,671,193 | | | | 73,017,769 | |
+0.22%, 3.06%, 10/20/67 | | | 36,439,192 | | | | 36,515,011 | |
+0.23%, 3.07%, 10/20/67 | | | 161,106,611 | | | | 161,581,456 | |
+0.23%, 3.07%, 10/20/67 | | | 75,947,872 | | | | 76,161,042 | |
+0.25%, 3.09%, 10/20/67 | | | 49,492,343 | | | | 49,683,853 | |
+0.20%, 3.125%, 11/20/67 | | | 17,922,073 | | | | 17,956,411 | |
+0.22%, 3.145%, 11/20/67 | | | 24,769,167 | | | | 24,770,681 | |
+0.22%, 3.145%, 11/20/67 | | | 133,079,131 | | | | 133,488,056 | |
+0.06%, 2.35%, 12/20/67 | | | 58,327,895 | | | | 58,028,083 | |
+0.18%, 3.276%, 12/20/67 | | | 35,111,747 | | | | 35,206,362 | |
+0.15%, 2.25%, 1/20/68 | | | 16,425,906 | | | | 16,423,704 | |
+0.06%, 2.35%, 1/20/68 | | | 103,916,688 | | | | 103,380,343 | |
+0.08%, 2.37%, 1/20/68 | | | 48,255,060 | | | | 48,070,045 | |
+0.10%, 2.33%, 2/20/68 | | | 49,594,901 | | | | 49,390,659 | |
+0.10%, 2.37%, 2/20/68 | | | 100,323,805 | | | | 99,046,452 | |
+0.07%, 2.40%, 2/20/68 | | | 49,466,439 | | | | 49,209,846 | |
+0.15%, 2.45%, 2/20/68 | | | 33,858,398 | | | | 33,836,715 | |
+0.05%, 2.54%, 2/20/68 | | | 3,710,898 | | | | 3,661,199 | |
+0.04%, 2.56%, 2/20/68 | | | 54,468,756 | | | | 54,133,251 | |
+0.05%, 2.83%, 2/20/68 | | | 26,255,605 | | | | 26,116,351 | |
+0.06%, 2.58%, 3/20/68 | | | 14,994,020 | | | | 14,900,434 | |
+0.04%, 2.60%, 3/20/68 | | | 89,873,733 | | | | 89,333,789 | |
+0.04%, 2.60%, 3/20/68 | | | 37,965,981 | | | | 37,321,501 | |
+0.05%, 2.71%, 3/20/68 | | | 46,593,888 | | | | 45,875,531 | |
+0.03%, 2.73%, 3/20/68 | | | 18,127,861 | | | | 17,929,406 | |
+0.02%, 2.72%, 4/20/68 | | | 26,800,684 | | | | 26,436,548 | |
+0.05%, 2.75%, 4/20/68 | | | 49,205,448 | | | | 48,637,927 | |
+0.05%, 2.75%, 4/20/68 | | | 42,992,834 | | | | 42,498,425 | |
+0.04%, 2.80%, 5/20/68 | | | 49,730,348 | | | | 49,359,121 | |
+0.15%, 2.86%, 6/20/68 | | | 46,858,658 | | | | 46,811,307 | |
+0.25%, 3.00%, 7/20/68 | | | 41,179,058 | | | | 41,402,706 | |
+0.12%, 2.95%, 8/20/68 | | | 35,700,304 | | | | 35,735,315 | |
+0.10%, 3.02%, 10/20/68 | | | 65,022,853 | | | | 64,810,644 | |
+0.22%, 3.22%, 11/20/68 | | | 35,464,282 | | | | 35,603,653 | |
| | | | | | | | |
| | | | | | | 3,117,732,165 | |
Federal Agency Mortgage Pass-Through: 31.5% | |
Fannie Mae, 15 Year | |
6.00%, 1/1/19-3/1/23 | | | 15,921,890 | | | | 16,341,832 | |
5.50%, 12/1/19-7/1/25 | | | 65,710,267 | | | | 67,921,728 | |
6.50%, 12/1/19 | | | 139 | | | | 139 | |
4.00%, 9/1/25 | | | 742,483 | | | | 744,448 | |
5.00%, 9/1/25 | | | 27,290,522 | | | | 27,896,190 | |
3.50%, 10/1/25-2/1/31 | | | 720,335,804 | | | | 730,035,955 | |
4.50%, 3/1/29 | | | 18,453,281 | | | | 18,994,448 | |
Fannie Mae, 20 Year | | | | | | | | |
4.50%, 3/1/29-1/1/34 | | | 360,938,118 | | | | 376,792,948 | |
4.00%, 9/1/30-3/1/37 | | | 1,695,014,375 | | | | 1,755,412,117 | |
3.50%, 11/1/35-4/1/37 | | | 165,226,456 | | | | 167,185,493 | |
3.50%, 3/1/37 | | | 241,932,581 | | | | 244,418,308 | |
Fannie Mae, 30 Year | | | | | | | | |
6.00%, 11/1/28-2/1/39 | | | 92,164,745 | | | | 100,531,108 | |
7.00%, 4/1/32-2/1/39 | | | 8,171,115 | | | | 9,309,942 | |
6.50%, 12/1/32-8/1/39 | | | 37,301,181 | | | | 42,355,065 | |
5.50%, 2/1/33-11/1/39 | | | 137,948,827 | | | | 148,145,084 | |
4.50%, 11/1/35-6/1/48 | | | 2,446,899,130 | | | | 2,548,952,546 | |
4.50%, 6/1/47 | | | 245,251,460 | | | | 254,284,017 | |
4.50%, 5/1/48 | | | 330,454,146 | | | | 342,493,249 | |
4.50%, 6/1/48 | | | 362,044,436 | | | | 375,233,856 | |
4.50%, 6/1/48 | | | 654,356,156 | | | | 678,195,325 | |
4.50%, 7/1/48 | | �� | 371,216,314 | | | | 384,740,675 | |
4.50%, 7/1/48 | | | 303,983,357 | | | | 315,057,672 | |
4.50%, 8/1/48 | | | 294,023,501 | | | | 304,823,596 | |
5.00%, 7/1/37-7/1/40 | | | 21,411,360 | | | | 22,842,333 | |
4.00%, 10/1/40-5/1/48 | | | 788,601,854 | | | | 806,099,328 | |
4.00%, 2/1/47 | | | 229,616,966 | | | | 234,430,277 | |
3.00%, 3/1/47-7/1/47 | | | 58,628,953 | | | | 57,244,118 | |
3.00%, 5/1/48 | | | 383,279,373 | | | | 374,185,169 | |
Fannie Mae, 40 Year
4.50%, 1/1/52-6/1/56 | | | 153,975,484 | | | | 159,927,863 | |
Fannie Mae, Hybrid ARM
1-Year U.S. Treasury CMT | | | | | | | | |
+2.14%, 4.317%, 10/1/33 | | | 1,186,463 | | | | 1,244,089 | |
| | | | | | | | |
| | |
| | | PAR VALUE | | | VALUE | |
+2.14%, 4.334%, 8/1/34 | | $ | 323,170 | | | $ | 338,747 | |
+1.96%, 4.303%, 9/1/34 | | | 1,408,768 | | | | 1,466,536 | |
+2.29%, 4.289%, 1/1/36 | | | 10,184,917 | | | | 10,732,184 | |
+2.12%, 4.246%, 7/1/36 | | | 62,319 | | | | 65,427 | |
+2.14%, 4.196%, 12/1/36 | | | 1,551,734 | | | | 1,631,384 | |
USD LIBOR12-Month | | | | | | | | |
+1.67%, 4.066%, 7/1/34 | | | 1,513,398 | | | | 1,580,390 | |
+1.36%, 4.233%, 10/1/34 | | | 732,927 | | | | 756,559 | |
+1.94%, 4.782%, 1/1/35 | | | 767,470 | | | | 810,590 | |
+1.37%, 3.509%, 4/1/35 | | | 1,833,171 | | | | 1,898,464 | |
+1.75%, 4.251%, 6/1/35 | | | 529,348 | | | | 555,302 | |
+1.41%, 4.16%, 7/1/35 | | | 705,604 | | | | 731,926 | |
+1.45%, 4.164%, 7/1/35 | | | 346,380 | | | | 358,960 | |
+1.52%, 4.186%, 7/1/35 | | | 1,094,035 | | | | 1,138,836 | |
+1.75%, 4.453%, 7/1/35 | | | 1,082,366 | | | | 1,135,751 | |
+1.33%, 4.084%, 8/1/35 | | | 855,394 | | | | 880,624 | |
+1.41%, 4.156%, 8/1/35 | | | 2,841,307 | | | | 2,966,918 | |
+1.75%, 4.557%, 8/1/35 | | | 1,910,464 | | | | 2,001,345 | |
+1.77%, 4.517%, 9/1/35 | | | 1,274,284 | | | | 1,331,871 | |
+1.57%, 4.381%, 10/1/35 | | | 1,758,867 | | | | 1,823,480 | |
+1.75%, 4.498%, 10/1/35 | | | 1,210,766 | | | | 1,265,436 | |
+1.62%, 4.543%, 12/1/35 | | | 393,419 | | | | 407,944 | |
+1.69%, 4.356%, 1/1/36 | | | 2,932,423 | | | | 3,066,744 | |
+1.62%, 4.513%, 1/1/36 | | | 1,890,561 | | | | 1,973,183 | |
+1.75%, 4.467%, 11/1/36 | | | 1,049,954 | | | | 1,098,522 | |
+1.74%, 4.618%, 12/1/36 | | | 780,935 | | | | 817,535 | |
+1.52%, 4.222%, 1/1/37 | | | 1,739,095 | | | | 1,813,398 | |
+2.01%, 4.489%, 2/1/37 | | | 3,023,802 | | | | 3,194,903 | |
+1.93%, 4.303%, 4/1/37 | | | 345,796 | | | | 366,447 | |
+1.19%, 4.065%, 8/1/37 | | | 108,685 | | | | 108,469 | |
+1.83%, 4.559%, 8/1/37 | | | 1,518,450 | | | | 1,599,031 | |
+1.48%, 4.074%, 11/1/37 | | | 466,599 | | | | 483,335 | |
+2.02%, 4.39%, 4/1/38 | | | 150,769 | | | | 154,901 | |
+1.73%, 4.347%, 5/1/38 | | | 95,646,166 | | | | 100,158,077 | |
+1.93%, 4.40%, 5/1/38 | | | 1,534,275 | | | | 1,618,680 | |
+1.88%, 4.631%, 9/1/38 | | | 386,110 | | | | 404,142 | |
+1.70%, 4.107%, 10/1/38 | | | 836,295 | | | | 871,601 | |
+1.61%, 4.384%, 10/1/38 | | | 4,513,046 | | | | 4,702,295 | |
+1.70%, 4.472%, 10/1/38 | | | 2,052,848 | | | | 2,145,082 | |
+1.72%, 4.324%, 6/1/39 | | | 432,648 | | | | 453,119 | |
+1.76%, 4.16%, 12/1/39 | | | 1,792,594 | | | | 1,846,227 | |
+1.71%, 2.616%, 4/1/42 | | | 7,673,398 | | | | 7,968,797 | |
+1.67%, 2.324%, 9/1/42 | | | 7,032,542 | | | | 7,200,799 | |
+1.68%, 2.469%, 11/1/42 | | | 6,838,203 | | | | 7,045,223 | |
+1.57%, 2.277%, 12/1/42 | | | 13,467,414 | | | | 13,354,360 | |
+1.58%, 2.351%, 2/1/43 | | | 13,511,080 | | | | 13,860,178 | |
+1.80%, 4.531%, 2/1/43 | | | 1,927,270 | | | | 2,002,740 | |
+1.56%, 2.299%, 5/1/43 | | | 2,910,141 | | | | 2,880,962 | |
+1.47%, 3.856%, 6/1/43 | | | 1,447,212 | | | | 1,488,142 | |
+1.56%, 2.996%, 9/1/43 | | | 3,948,628 | | | | 3,988,459 | |
+1.56%, 3.262%, 9/1/43 | | | 2,503,127 | | | | 2,529,031 | |
+1.45%, 4.126%, 9/1/43 | | | 3,214,119 | | | | 3,297,901 | |
+1.61%, 2.299%, 10/1/43 | | | 32,328,786 | | | | 32,450,259 | |
+1.55%, 2.662%, 11/1/43 | | | 10,370,215 | | | | 10,440,522 | |
+1.60%, 2.866%, 11/1/43 | | | 13,244,272 | | | | 13,285,208 | |
+1.56%, 3.066%, 12/1/43 | | | 5,292,840 | | | | 5,376,859 | |
+1.55%, 2.478%, 2/1/44 | | | 1,684,600 | | | | 1,733,936 | |
+1.59%, 2.696%, 2/1/44 | | | 5,082,100 | | | | 5,137,082 | |
+1.58%, 2.969%, 2/1/44 | | | 6,788,663 | | | | 6,892,489 | |
+1.56%, 2.669%, 4/1/44 | | | 9,898,875 | | | | 10,092,967 | |
+1.59%, 2.926%, 4/1/44 | | | 5,359,225 | | | | 5,413,075 | |
+1.59%, 3.001%, 4/1/44 | | | 4,131,789 | | | | 4,179,597 | |
+1.58%, 3.185%, 4/1/44 | | | 17,476,823 | | | | 17,649,933 | |
+1.67%, 4.258%, 4/1/44 | | | 19,661,755 | | | | 20,378,760 | |
+1.57%, 2.484%, 5/1/44 | | | 9,551,254 | | | | 9,935,709 | |
+1.57%, 3.046%, 5/1/44 | | | 19,738,576 | | | | 20,061,070 | |
+1.58%, 2.828%, 7/1/44 | | | 9,686,935 | | | | 9,776,721 | |
+1.59%, 2.857%, 7/1/44 | | | 12,637,504 | | | | 12,753,577 | |
+1.57%, 2.939%, 7/1/44 | | | 4,973,897 | | | | 5,019,832 | |
+1.56%, 2.95%, 7/1/44 | | | 7,242,708 | | | | 7,310,920 | |
| | |
| See accompanying Notes to Financial Statements | | DODGE & COX INCOME FUND§PAGE 9 |
| | | | |
| PORTFOLIO OF INVESTMENTS | | | December 31, 2018 | |
| | | | | | | | |
| DEBT SECURITIES (continued) | |
| | |
| | | PAR VALUE | | | VALUE | |
+1.59%, 2.962%, 7/1/44 | | $ | 4,465,758 | | | $ | 4,502,640 | |
+1.58%, 3.084%, 7/1/44 | | | 11,448,030 | | | | 11,581,025 | |
+1.57%, 2.79%, 8/1/44 | | | 18,305,500 | | | | 18,441,991 | |
+1.58%, 2.802%, 8/1/44 | | | 8,332,437 | | | | 8,391,498 | |
+1.58%, 2.897%, 8/1/44 | | | 5,834,222 | | | | 5,886,241 | |
+1.57%, 3.01%, 8/1/44 | | | 6,766,167 | | | | 6,831,612 | |
+1.58%, 2.682%, 9/1/44 | | | 7,731,108 | | | | 7,769,906 | |
+1.58%, 2.757%, 9/1/44 | | | 9,283,386 | | | | 9,346,155 | |
+1.65%, 2.826%, 9/1/44 | | | 31,385,379 | | | | 31,668,777 | |
+1.58%, 2.858%, 9/1/44 | | | 4,735,969 | | | | 4,775,239 | |
+1.64%, 2.943%, 9/1/44 | | | 15,330,014 | | | | 15,466,509 | |
+1.59%, 3.021%, 9/1/44 | | | 6,212,515 | | | | 6,267,860 | |
+1.57%, 2.472%, 10/1/44 | | | 7,232,064 | | | | 7,236,719 | |
+1.60%, 2.593%, 10/1/44 | | | 6,251,955 | | | | 6,266,459 | |
+1.57%, 2.634%, 10/1/44 | | | 12,781,723 | | | | 12,829,922 | |
+1.57%, 2.719%, 10/1/44 | | | 7,782,069 | | | | 7,820,842 | |
+1.58%, 2.752%, 10/1/44 | | | 30,406,758 | | | | 30,591,545 | |
+1.58%, 2.795%, 10/1/44 | | | 14,696,340 | | | | 14,794,642 | |
+1.60%, 2.84%, 10/1/44 | | | 13,381,667 | | | | 13,486,441 | |
+1.56%, 2.845%, 10/1/44 | | | 6,788,709 | | | | 6,839,461 | |
+1.60%, 2.873%, 10/1/44 | | | 9,356,397 | | | | 9,433,218 | |
+1.60%, 2.926%, 10/1/44 | | | 15,994,311 | | | | 16,130,954 | |
+1.56%, 2.939%, 10/1/44 | | | 7,475,710 | | | | 7,539,574 | |
+1.58%, 2.949%, 10/1/44 | | | 4,140,889 | | | | 4,175,045 | |
+1.58%, 2.734%, 11/1/44 | | | 6,104,496 | | | | 6,131,792 | |
+1.60%, 2.794%, 11/1/44 | | | 12,387,479 | | | | 12,458,934 | |
+1.60%, 2.818%, 11/1/44 | | | 6,978,015 | | | | 7,020,805 | |
+1.58%, 2.832%, 11/1/44 | | | 15,047,099 | | | | 15,152,601 | |
+1.56%, 2.915%, 11/1/44 | | | 14,671,519 | | | | 14,785,565 | |
+1.57%, 2.937%, 11/1/44 | | | 13,414,709 | | | | 13,523,018 | |
+1.59%, 2.68%, 12/1/44 | | | 4,049,953 | | | | 4,057,666 | |
+1.58%, 2.717%, 12/1/44 | | | 3,803,274 | | | | 3,817,634 | |
+1.57%, 2.739%, 12/1/44 | | | 28,200,903 | | | | 28,308,286 | |
+1.58%, 2.774%, 12/1/44 | | | 4,533,635 | | | | 4,553,343 | |
+1.60%, 2.828%, 12/1/44 | | | 10,574,668 | | | | 10,633,549 | |
+1.59%, 2.993%, 12/1/44 | | | 6,749,890 | | | | 6,806,878 | |
+1.57%, 2.912%, 1/1/45 | | | 10,307,918 | | | | 10,374,900 | |
+1.58%, 2.755%, 2/1/45 | | | 15,422,456 | | | | 15,473,738 | |
+1.57%, 3.011%, 3/1/45 | | | 135,249,885 | | | | 136,552,706 | |
+1.59%, 3.077%, 3/1/45 | | | 3,477,433 | | | | 3,508,112 | |
+1.61%, 2.581%, 4/1/45 | | | 5,725,989 | | | | 5,726,054 | |
+1.58%, 2.841%, 4/1/45 | | | 31,238,722 | | | | 31,536,807 | |
+1.60%, 2.64%, 8/1/45 | | | 11,220,430 | | | | 11,245,129 | |
+1.58%, 2.66%, 8/1/45 | | | 10,323,913 | | | | 10,340,002 | |
+1.58%, 2.809%, 10/1/45 | | | 23,380,559 | | | | 23,498,349 | |
+1.60%, 2.617%, 11/1/45 | | | 19,464,590 | | | | 19,496,466 | |
+1.61%, 2.837%, 3/1/46 | | | 3,939,149 | | | | 3,956,489 | |
+1.60%, 2.417%, 4/1/46 | | | 33,679,226 | | | | 33,794,420 | |
+1.59%, 2.685%, 4/1/46 | | | 6,644,115 | | | | 6,646,846 | |
+1.61%, 2.727%, 4/1/46 | | | 5,744,326 | | | | 5,751,672 | |
+1.58%, 2.802%, 4/1/46 | | | 16,266,562 | | | | 16,323,624 | |
+1.61%, 2.932%, 4/1/46 | | | 4,422,701 | | | | 4,440,148 | |
+1.58%, 2.483%, 5/1/46 | | | 8,232,082 | | | | 8,284,542 | |
+1.59%, 2.718%, 6/1/46 | | | 9,594,118 | | | | 9,614,383 | |
+1.60%, 2.739%, 6/1/46 | | | 3,050,648 | | | | 3,060,638 | |
+1.59%, 2.675%, 7/1/46 | | | 3,048,257 | | | | 3,050,987 | |
+1.62%, 2.301%, 12/1/46 | | | 7,022,117 | | | | 6,938,803 | |
+1.61%, 3.106%, 6/1/47 | | | 25,779,174 | | | | 25,952,565 | |
+1.61%, 3.177%, 6/1/47 | | | 27,776,491 | | | | 28,018,422 | |
+1.61%, 3.14%, 7/1/47 | | | 8,937,315 | | | | 9,005,901 | |
+1.59%, 3.159%, 7/1/47 | | | 21,062,325 | | | | 21,238,162 | |
+1.60%, 2.716%, 8/1/47 | | | 26,850,893 | | | | 26,927,876 | |
+1.61%, 3.008%, 8/1/47 | | | 8,074,202 | | | | 8,106,227 | |
+1.61%, 3.025%, 8/1/47 | | | 8,586,025 | | | | 8,624,453 | |
+1.59%, 3.169%, 8/1/47 | | | 10,519,741 | | | | 10,606,457 | |
+1.57%, 2.952%, 10/1/47 | | | 6,693,910 | | | | 6,719,858 | |
+1.61%, 3.09%, 10/1/47 | | | 10,815,480 | | | | 10,882,227 | |
| | | | | | | | |
| | |
| | | PAR VALUE | | | VALUE | |
+1.61%, 2.896%, 11/1/47 | | $ | 7,777,350 | | | $ | 7,783,152 | |
+1.59%, 2.985%, 11/1/47 | | | 17,848,210 | | | | 17,922,567 | |
+1.61%, 3.123%, 1/1/48 | | | 4,218,042 | | | | 4,245,466 | |
+1.61%, 3.161%, 1/1/48 | | | 9,633,611 | | | | 9,705,932 | |
+1.61%, 3.10%, 3/1/48 | | | 11,005,983 | | | | 11,078,023 | |
+1.60%, 3.175%, 4/1/48 | | | 13,455,530 | | | | 13,575,624 | |
+1.61%, 3.169%, 5/1/48 | | | 99,440,737 | | | | 100,182,381 | |
USD LIBOR6-Month | | | | | | | | |
+1.42%, 4.092%, 8/1/34 | | | 1,572,974 | | | | 1,616,075 | |
+1.50%, 4.035%, 1/1/35 | | | 904,878 | | | | 931,923 | |
+1.57%, 4.07%, 11/1/35 | | | 1,229,164 | | | | 1,269,494 | |
Freddie Mac, Hybrid ARM
1-Year U.S. Treasury CMT | | | | | | | | |
+2.25%, 3.777%, 2/1/34 | | | 3,269,030 | | | | 3,452,264 | |
+2.25%, 4.738%, 11/1/34 | | | 1,002,108 | | | | 1,053,803 | |
+2.25%, 3.961%, 2/1/35 | | | 708,713 | | | | 748,667 | |
+2.13%, 4.00%, 4/1/35 | | | 364,112 | | | | 376,570 | |
+1.67%, 3.642%, 1/1/36 | | | 2,079,981 | | | | 2,147,141 | |
+2.25%, 4.018%, 1/1/36 | | | 3,386,261 | | | | 3,565,738 | |
USD LIBOR12-Month | | | | | | | | |
+1.78%, 4.529%, 9/1/33 | | | 4,004,376 | | | | 4,185,861 | |
+1.80%, 4.54%, 8/1/34 | | | 626,158 | | | | 655,226 | |
+1.63%, 3.459%, 1/1/35 | | | 313,426 | | | | 325,929 | |
+1.80%, 4.003%, 3/1/35 | | | 856,298 | | | | 897,827 | |
+1.71%, 4.361%, 8/1/35 | | | 956,634 | | | | 999,886 | |
+1.87%, 4.62%, 8/1/35 | | | 1,816,324 | | | | 1,910,214 | |
+1.83%, 4.574%, 9/1/35 | | | 1,235,103 | | | | 1,278,014 | |
+1.63%, 4.361%, 10/1/35 | | | 1,517,423 | | | | 1,581,435 | |
+1.61%, 4.264%, 1/1/36 | | | 1,039,519 | | | | 1,079,505 | |
+1.88%, 4.229%, 4/1/36 | | | 2,084,877 | | | | 2,193,103 | |
+1.78%, 4.649%, 12/1/36 | | | 1,419,449 | | | | 1,488,566 | |
+1.77%, 3.554%, 1/1/37 | | | 1,525,153 | | | | 1,593,709 | |
+1.57%, 3.487%, 3/1/37 | | | 1,717,789 | | | | 1,788,348 | |
+1.56%, 3.94%, 4/1/37 | | | 1,020,829 | | | | 1,061,802 | |
+1.68%, 4.029%, 4/1/37 | | | 1,058,509 | | | | 1,104,154 | |
+1.63%, 4.105%, 5/1/37 | | | 1,267,080 | | | | 1,317,534 | |
+1.63%, 4.339%, 7/1/37 | | | 3,620,931 | | | | 3,758,010 | |
+2.09%, 4.835%, 10/1/37 | | | 110,923 | | | | 116,686 | |
+2.05%, 3.845%, 1/1/38 | | | 403,246 | | | | 424,353 | |
+1.69%, 3.944%, 2/1/38 | | | 3,278,959 | | | | 3,411,662 | |
+1.86%, 4.063%, 4/1/38 | | | 4,447,228 | | | | 4,660,116 | |
+1.76%, 4.08%, 4/1/38 | | | 3,123,659 | | | | 3,251,225 | |
+1.90%, 4.271%, 5/1/38 | | | 673,917 | | | | 708,592 | |
+1.67%, 4.051%, 6/1/38 | | | 2,451,564 | | | | 2,558,124 | |
+1.63%, 4.25%, 6/1/38 | | | 334,220 | | | | 339,453 | |
+1.73%, 4.226%, 10/1/38 | | | 461,564 | | | | 483,260 | |
+1.73%, 4.263%, 10/1/38 | | | 2,292,103 | | | | 2,400,692 | |
+1.80%, 4.365%, 11/1/39 | | | 1,135,889 | | | | 1,186,206 | |
+1.86%, 4.534%, 7/1/43 | | | 1,734,610 | | | | 1,810,776 | |
+1.70%, 4.00%, 8/1/43 | | | 21,041,308 | | | | 21,797,891 | |
+1.64%, 2.767%, 10/1/43 | | | 1,991,336 | | | | 1,981,923 | |
+1.58%, 2.876%, 1/1/44 | | | 3,528,727 | | | | 3,571,397 | |
+1.61%, 3.121%, 1/1/44 | | | 3,104,219 | | | | 3,152,872 | |
+1.62%, 2.87%, 2/1/44 | | | 9,595,853 | | | | 9,709,104 | |
+1.64%, 3.098%, 4/1/44 | | | 3,032,159 | | | | 3,073,154 | |
+1.63%, 3.121%, 4/1/44 | | | 5,566,329 | | | | 5,637,761 | |
+1.63%, 2.995%, 5/1/44 | | | 83,292,364 | | | | 84,327,832 | |
+1.62%, 2.828%, 6/1/44 | | | 5,062,277 | | | | 5,102,599 | |
+1.62%, 3.095%, 6/1/44 | | | 16,936,260 | | | | 17,160,137 | |
+1.63%, 3.057%, 7/1/44 | | | 4,134,920 | | | | 4,174,748 | |
+1.62%, 3.058%, 7/1/44 | | | 5,117,814 | | | | 5,166,951 | |
+1.61%, 2.85%, 8/1/44 | | | 7,440,252 | | | | 7,491,703 | |
+1.62%, 3.026%, 8/1/44 | | | 7,418,123 | | | | 7,483,678 | |
+1.63%, 3.045%, 8/1/44 | | | 9,290,487 | | | | 9,379,540 | |
+1.62%, 2.71%, 9/1/44 | | | 8,993,876 | | | | 9,016,776 | |
+1.62%, 2.759%, 9/1/44 | | | 10,818,722 | | | | 10,861,751 | |
+1.62%, 2.83%, 9/1/44 | | | 6,975,558 | | | | 7,020,717 | |
| | |
| PAGE 10§ DODGE & COX INCOME FUND | | See accompanying Notes to Financial Statements |
| | | | |
| PORTFOLIO OF INVESTMENTS | | | December 31, 2018 | |
| | | | | | | | |
| DEBT SECURITIES (continued) | |
| | |
| | | PAR VALUE | | | VALUE | |
+1.62%, 2.802%, 10/1/44 | | $ | 4,925,784 | | | $ | 4,948,970 | |
+1.62%, 2.831%, 10/1/44 | | | 13,086,987 | | | | 13,149,554 | |
+1.61%, 2.894%, 10/1/44 | | | 11,541,659 | | | | 11,612,396 | |
+1.63%, 2.933%, 10/1/44 | | | 11,102,688 | | | | 11,172,025 | |
+1.63%, 3.015%, 10/1/44 | | | 11,964,234 | | | | 12,061,480 | |
+1.60%, 2.697%, 11/1/44 | | | 15,795,464 | | | | 15,828,469 | |
+1.63%, 2.752%, 11/1/44 | | | 6,531,965 | | | | 6,549,313 | |
+1.63%, 2.779%, 11/1/44 | | | 11,629,247 | | | | 11,674,532 | |
+1.61%, 2.886%, 11/1/44 | | | 7,542,045 | | | | 7,577,839 | |
+1.61%, 2.909%, 11/1/44 | | | 21,877,082 | | | | 22,015,553 | |
+1.61%, 2.91%, 11/1/44 | | | 6,577,634 | | | | 6,625,396 | |
+1.62%, 2.916%, 11/1/44 | | | 11,779,458 | | | | 11,844,818 | |
+1.62%, 2.937%, 11/1/44 | | | 10,450,665 | | | | 10,513,680 | |
+1.63%, 2.942%, 11/1/44 | | | 9,123,559 | | | | 9,177,637 | |
+1.63%, 2.953%, 11/1/44 | | | 16,588,447 | | | | 16,703,667 | |
+1.60%, 2.996%, 11/1/44 | | | 5,044,870 | | | | 5,080,983 | |
+1.63%, 2.80%, 12/1/44 | | | 3,466,742 | | | | 3,475,760 | |
+1.63%, 2.84%, 12/1/44 | | | 17,526,218 | | | | 17,591,379 | |
+1.62%, 2.899%, 12/1/44 | | | 11,475,536 | | | | 11,533,328 | |
+1.63%, 2.903%, 12/1/44 | | | 14,998,395 | | | | 15,081,604 | |
+1.62%, 2.916%, 12/1/44 | | | 7,465,374 | | | | 7,504,607 | |
+1.62%, 2.673%, 1/1/45 | | | 11,843,305 | | | | 11,851,632 | |
+1.63%, 2.832%, 1/1/45 | | | 9,380,908 | | | | 9,419,437 | |
+1.62%, 2.855%, 1/1/45 | | | 8,973,072 | | | | 9,010,743 | |
+1.62%, 2.905%, 1/1/45 | | | 16,107,021 | | | | 16,189,955 | |
+1.63%, 3.066%, 1/1/45 | | | 22,559,403 | | | | 22,754,497 | |
+1.62%, 2.901%, 2/1/45 | | | 12,515,987 | | | | 12,577,992 | |
+1.62%, 2.623%, 4/1/45 | | | 6,379,217 | | | | 6,375,201 | |
+1.63%, 2.60%, 5/1/45 | | | 42,142,798 | | | | 42,096,998 | |
+1.63%, 2.768%, 6/1/45 | | | 5,544,111 | | | | 5,564,713 | |
+1.63%, 2.616%, 8/1/45 | | | 11,183,911 | | | | 11,186,046 | |
+1.64%, 2.738%, 8/1/45 | | | 34,448,815 | | | | 34,553,953 | |
+1.60%, 2.783%, 8/1/45 | | | 8,357,484 | | | | 8,390,395 | |
+1.63%, 2.813%, 9/1/45 | | | 9,581,942 | | | | 9,615,528 | |
+1.63%, 2.727%, 5/1/46 | | | 217,862,948 | | | | 218,478,559 | |
+1.62%, 2.734%, 5/1/46 | | | 17,220,564 | | | | 17,224,793 | |
+1.62%, 2.627%, 7/1/46 | | | 22,969,658 | | | | 22,925,263 | |
+1.63%, 2.542%, 9/1/46 | | | 40,267,882 | | | | 39,974,109 | |
+1.63%, 3.168%, 6/1/47 | | | 12,268,882 | | | | 12,353,726 | |
+1.63%, 3.202%, 8/1/47 | | | 7,877,624 | | | | 7,933,081 | |
+1.64%, 3.099%, 10/1/47 | | | 8,471,555 | | | | 8,509,615 | |
+1.64%, 3.13%, 11/1/47 | | | 3,908,670 | | | | 3,929,517 | |
USD LIBOR6-Month | | | | | | | | |
+1.60%, 4.124%, 8/1/36 | | | 1,840,019 | | | | 1,900,810 | |
Freddie Mac Gold, 15 Year | | | | | | | | |
6.00%, 2/1/19-11/1/23 | | | 6,556,992 | | | | 6,761,676 | |
5.50%, 10/1/20-12/1/24 | | | 2,199,700 | | | | 2,231,692 | |
4.50%, 3/1/25-6/1/26 | | | 9,695,142 | | | | 9,996,548 | |
Freddie Mac Gold, 20 Year | | | | | | | | |
6.50%, 10/1/26 | | | 1,940,136 | | | | 2,079,129 | |
4.50%, 5/1/30-1/1/34 | | | 91,256,167 | | | | 95,393,067 | |
4.00%, 9/1/31-10/1/35 | | | 423,901,006 | | | | 439,308,593 | |
3.50%, 7/1/35-1/1/36 | | | 165,861,806 | | | | 168,004,793 | |
Freddie Mac Gold, 30 Year | | | | | | | | |
7.90%, 2/17/21 | | | 48,040 | | | | 47,999 | |
7.00%, 4/1/31-11/1/38 | | | 2,836,042 | | | | 3,161,757 | |
6.50%, 12/1/32-10/1/38 | | | 9,061,602 | | | | 10,069,520 | |
6.00%, 12/1/33-2/1/39 | | | 16,208,471 | | | | 17,613,789 | |
5.50%, 3/1/34-12/1/38 | | | 46,960,126 | | | | 50,745,698 | |
4.50%, 3/1/39-6/1/48 | | | 1,925,524,824 | | | | 1,999,882,013 | |
4.50%, 6/1/47 | | | 313,526,889 | | | | 324,901,181 | |
4.00%, 11/1/45 | | | 275,509,744 | | | | 281,293,939 | |
4.00%, 11/1/45-8/1/48 | | | 589,619,604 | | | | 602,092,327 | |
Ginnie Mae, 20 Year
4.00%, 1/20/35 | | | 7,964,682 | | | | 8,142,462 | |
Ginnie Mae, 30 Year | | | | | | | | |
7.80%, 6/15/20-1/15/21 | | | 56,340 | | | | 56,604 | |
8.00%, 9/15/20 | | | 561 | | | | 561 | |
7.85%, 1/15/21 | | | 2,365 | | | | 2,368 | |
| | | | | | | | |
| | |
| | | PAR VALUE | | | VALUE | |
7.50%, 12/15/23-5/15/25 | | $ | 659,136 | | | $ | 708,855 | |
7.00%, 5/15/28 | | | 226,698 | | | | 245,668 | |
| | | | | | | | |
| | | | | | | 17,142,735,114 | |
Private Label CMO & REMIC: 0.1% | |
GSMPS Mortgage Loan Trust
Series2004-4 1A4, 8.50%, 6/25/34(b) | | | 3,136,245 | | | | 3,432,685 | |
Seasoned Credit Risk Transfer Trust
Series2017-4 M45T, 4.50%, 6/25/57 | | | 29,725,915 | | | | 30,546,350 | |
| | | | | | | | |
| | | | | | | 33,979,035 | |
| | | | | | | | |
| | | | | | | 20,294,446,314 | |
| | | | | | | | |
| | | | | | | 25,217,023,438 | |
| CORPORATE: 40.5% | |
FINANCIALS: 14.7% | |
Bank of America Corp. | |
3.004%, 12/20/23(e) | | | 422,916,000 | | | | 410,590,731 | |
4.20%, 8/26/24 | | | 163,140,000 | | | | 161,790,165 | |
4.25%, 10/22/26 | | | 185,082,000 | | | | 180,102,817 | |
Barclays PLC (United Kingdom) | | | | | | | | |
4.375%, 9/11/24 | | | 239,204,000 | | | | 225,805,218 | |
4.836%, 5/9/28 | | | 77,975,000 | | | | 71,507,088 | |
BNP Paribas SA (France) | | | | | | | | |
4.25%, 10/15/24 | | | 381,716,000 | | | | 377,356,204 | |
4.375%, 9/28/25(b) | | | 170,531,000 | | | | 165,775,049 | |
4.375%, 5/12/26(b) | | | 118,904,000 | | | | 114,479,699 | |
4.625%, 3/13/27(b) | | | 237,000,000 | | | | 230,167,254 | |
Boston Properties, Inc. | | | | | | | | |
5.625%, 11/15/20 | | | 79,385,000 | | | | 82,277,402 | |
4.125%, 5/15/21 | | | 52,852,000 | | | | 53,566,346 | |
3.85%, 2/1/23 | | | 76,031,000 | | | | 76,162,347 | |
3.125%, 9/1/23 | | | 19,500,000 | | | | 18,837,737 | |
3.80%, 2/1/24 | | | 64,024,000 | | | | 63,784,801 | |
3.20%, 1/15/25 | | | 47,075,000 | | | | 44,969,741 | |
3.65%, 2/1/26 | | | 19,580,000 | | | | 18,958,500 | |
4.50%, 12/1/28 | | | 101,325,000 | | | | 103,662,753 | |
Capital One Financial Corp. | |
3.50%, 6/15/23 | | | 155,385,000 | | | | 152,589,997 | |
3.75%, 4/24/24 | | | 36,940,000 | | | | 36,025,311 | |
3.20%, 2/5/25 | | | 52,515,000 | | | | 49,045,952 | |
4.20%, 10/29/25 | | | 121,149,000 | | | | 117,062,408 | |
Cigna Corp. | | | | | | | | |
4.00%, 2/15/22 | | | 62,964,000 | | | | 63,605,888 | |
7.65%, 3/1/23 | | | 7,217,000 | | | | 8,301,329 | |
3.75%, 7/15/23(b) | | | 244,625,000 | | | | 243,795,256 | |
4.125%, 11/15/25(b) | | | 47,550,000 | | | | 47,505,087 | |
7.875%, 5/15/27 | | | 26,720,000 | | | | 32,938,390 | |
4.375%, 10/15/28(b) | | | 128,625,000 | | | | 129,421,196 | |
Citigroup, Inc. | | | | | | | | |
3.50%, 5/15/23 | | | 72,730,000 | | | | 71,397,989 | |
4.00%, 8/5/24 | | | 31,300,000 | | | | 30,920,693 | |
USD LIBOR3-Month | | | | | | | | |
+6.37%, 8.89%, 10/30/40(a) | | | 427,488,075 | | | | 451,256,412 | |
Equity Residential | | | | | | | | |
4.75%, 7/15/20 | | | 5,200,000 | | | | 5,299,345 | |
4.625%, 12/15/21 | | | 108,687,000 | | | | 112,444,539 | |
3.00%, 4/15/23 | | | 47,300,000 | | | | 46,521,798 | |
3.375%, 6/1/25 | | | 77,890,000 | | | | 76,567,075 | |
HSBC Holdings PLC (United Kingdom) | | | | | | | | |
5.10%, 4/5/21 | | | 85,935,000 | | | | 88,863,116 | |
9.30%, 6/1/21 | | | 100,000 | | | | 112,858 | |
2.65%, 1/5/22 | | | 32,865,000 | | | | 31,881,900 | |
3.262%, 3/13/23(e) | | | 13,570,000 | | | | 13,279,784 | |
3.60%, 5/25/23 | | | 63,550,000 | | | | 63,183,306 | |
3.95%, 5/18/24(e) | | | 133,680,000 | | | | 132,950,177 | |
4.30%, 3/8/26 | | | 116,100,000 | | | | 114,577,771 | |
6.50%, 5/2/36 | | | 218,122,000 | | | | 248,424,817 | |
| | |
| See accompanying Notes to Financial Statements | | DODGE & COX INCOME FUND§PAGE 11 |
| | | | |
| PORTFOLIO OF INVESTMENTS | | | December 31, 2018 | |
| | | | | | | | |
| DEBT SECURITIES (continued) | |
| | |
| | | PAR VALUE | | | VALUE | |
6.50%, 9/15/37 | | $ | 230,191,000 | | | $ | 261,150,608 | |
6.80%, 6/1/38 | | | 29,650,000 | | | | 35,050,445 | |
JPMorgan Chase & Co. | | | | | | | | |
3.375%, 5/1/23 | | | 92,238,000 | | | | 90,215,495 | |
4.125%, 12/15/26 | | | 119,864,000 | | | | 117,440,513 | |
4.25%, 10/1/27 | | | 125,244,000 | | | | 123,361,020 | |
8.75%, 9/1/30(a) | | | 62,983,000 | | | | 82,460,573 | |
Lloyds Banking Group PLC (United Kingdom) | | | | | | | | |
4.05%, 8/16/23 | | | 146,125,000 | | | | 144,351,384 | |
4.50%, 11/4/24 | | | 218,317,000 | | | | 210,796,433 | |
4.582%, 12/10/25 | | | 116,731,000 | | | | 110,559,981 | |
4.65%, 3/24/26 | | | 118,232,000 | | | | 111,212,719 | |
Royal Bank of Scotland Group PLC (United Kingdom) | | | | | | | | |
6.125%, 12/15/22 | | | 340,311,000 | | | | 344,873,447 | |
6.10%, 6/10/23 | | | 19,737,000 | | | | 20,047,538 | |
6.00%, 12/19/23 | | | 350,211,000 | | | | 354,427,005 | |
5.125%, 5/28/24 | | | 28,169,000 | | | | 27,309,802 | |
Unum Group | | | | | | | | |
7.19%, 2/1/28 | | | 11,295,000 | | | | 13,096,170 | |
7.25%, 3/15/28 | | | 25,060,000 | | | | 29,408,690 | |
6.75%, 12/15/28 | | | 8,107,000 | | | | 9,356,635 | |
Wells Fargo & Co. | | | | | | | | |
2.15%, 12/6/19 | | | 280,875,000 | | | | 278,332,278 | |
3.55%, 8/14/23 | | | 244,815,000 | | | | 243,915,741 | |
4.10%, 6/3/26 | | | 130,170,000 | | | | 127,177,849 | |
4.30%, 7/22/27 | | | 323,175,000 | | | | 318,071,986 | |
USD LIBOR3-Month | | | | | | | | |
+0.65%, 3.389%, 12/6/19 | | | 135,850,000 | | | | 136,181,042 | |
| | | | | | | | |
| | | | | | | 7,956,563,600 | |
INDUSTRIALS: 24.0% | |
AT&T, Inc. | |
8.75%, 11/15/31 | | | 100,978,000 | | | | 133,820,448 | |
5.35%, 9/1/40 | | | 59,744,000 | | | | 58,178,337 | |
4.75%, 5/15/46 | | | 112,670,000 | | | | 100,278,700 | |
5.65%, 2/15/47 | | | 130,385,000 | | | | 130,368,689 | |
5.45%, 3/1/47 | | | 144,180,000 | | | | 140,996,791 | |
4.50%, 3/9/48 | | | 250,175,000 | | | | 215,695,116 | |
Bayer AG (Germany) | | | | | | | | |
3.875%, 12/15/23(b) | | | 301,635,000 | | | | 296,142,878 | |
4.25%, 12/15/25(b) | | | 133,965,000 | | | | 130,443,508 | |
4.375%, 12/15/28(b) | | | 137,260,000 | | | | 131,130,637 | |
Bayerische Motoren Werke AG (Germany)
3.40%, 8/13/21(b) | | | 92,505,000 | | | | 92,113,854 | |
BHP Billiton, Ltd. (Australia)
6.75%, 10/19/75(a)(b)(e) | | | 111,122,000 | | | | 115,566,880 | |
Burlington Northern Santa Fe LLC(c) | | | | | | | | |
4.70%, 10/1/19 | | | 33,445,000 | | | | 33,853,029 | |
8.251%, 1/15/21 | | | 1,790,823 | | | | 1,846,510 | |
3.05%, 9/1/22 | | | 39,535,000 | | | | 39,243,777 | |
5.943%, 1/15/23 | | | 19,844 | | | | 20,295 | |
3.85%, 9/1/23 | | | 79,525,000 | | | | 81,663,987 | |
5.72%, 1/15/24 | | | 11,584,549 | | | | 12,268,214 | |
5.342%, 4/1/24 | | | 3,426,902 | | | | 3,556,687 | |
5.629%, 4/1/24 | | | 14,531,493 | | | | 15,314,268 | |
5.996%, 4/1/24 | | | 30,424,042 | | | | 32,831,079 | |
3.442%, 6/16/28(b) | | | 78,803,138 | | | | 77,063,204 | |
Cemex SAB de CV (Mexico) | | | | | | | | |
6.00%, 4/1/24(b) | | | 113,175,000 | | | | 112,495,950 | |
5.70%, 1/11/25(b) | | | 225,456,000 | | | | 216,158,195 | |
6.125%, 5/5/25(b) | | | 109,090,000 | | | | 106,396,568 | |
7.75%, 4/16/26(b) | | | 138,048,000 | | | | 145,124,340 | |
Charter Communications, Inc. | | | | | | | | |
8.75%, 2/14/19 | | | 130,460,000 | | | | 131,188,399 | |
| | | | | | | | |
| | |
| | | PAR VALUE | | | VALUE | |
8.25%, 4/1/19 | | $ | 237,543,000 | | | $ | 240,209,252 | |
5.00%, 2/1/20 | | | 20,700,000 | | | | 20,987,922 | |
4.125%, 2/15/21 | | | 33,095,000 | | | | 33,241,157 | |
4.00%, 9/1/21 | | | 40,609,000 | | | | 40,360,528 | |
4.908%, 7/23/25 | | | 122,505,000 | | | | 121,758,528 | |
4.20%, 3/15/28 | | | 68,500,000 | | | | 64,182,933 | |
6.55%, 5/1/37 | | | 46,188,000 | | | | 47,444,861 | |
6.75%, 6/15/39 | | | 112,072,000 | | | | 113,991,013 | |
6.484%, 10/23/45 | | | 450,292,000 | | | | 464,743,406 | |
5.375%, 5/1/47 | | | 57,310,000 | | | | 51,995,908 | |
5.75%, 4/1/48 | | | 122,940,000 | | | | 115,262,000 | |
Comcast Corp. | | | | | | | | |
3.95%, 10/15/25 | | | 95,605,000 | | | | 96,780,537 | |
3.969%, 11/1/47 | | | 54,240,000 | | | | 48,552,796 | |
4.70%, 10/15/48 | | | 46,050,000 | | | | 46,855,099 | |
Cox Enterprises, Inc. | | | | | | | | |
3.25%, 12/15/22(b) | | | 94,333,000 | | | | 92,149,961 | |
2.95%, 6/30/23(b) | | | 251,295,000 | | | | 241,789,302 | |
3.85%, 2/1/25(b) | | | 263,159,000 | | | | 259,367,292 | |
3.35%, 9/15/26(b) | | | 139,412,000 | | | | 128,688,698 | |
3.50%, 8/15/27(b) | | | 144,842,000 | | | | 133,614,329 | |
CRH PLC (Ireland)
3.875%, 5/18/25(b) | | | 196,754,000 | | | | 189,183,949 | |
CSX Corp. | | | | | | | | |
9.75%, 6/15/20 | | | 10,067,000 | | | | 11,012,663 | |
6.251%, 1/15/23 | | | 11,859,995 | | | | 12,756,018 | |
CVS Health Corp. | | | | | | | | |
3.70%, 3/9/23 | | | 327,847,000 | | | | 324,318,730 | |
4.10%, 3/25/25 | | | 42,500,000 | | | | 42,127,011 | |
4.30%, 3/25/28 | | | 116,634,000 | | | | 114,206,564 | |
4.78%, 3/25/38 | | | 75,850,000 | | | | 72,762,976 | |
Dell Technologies, Inc.
5.45%, 6/15/23(b) | | | 198,108,000 | | | | 201,591,202 | |
Dillard’s, Inc. | | | | | | | | |
7.875%, 1/1/23 | | | 275,000 | | | | 303,014 | |
7.75%, 7/15/26 | | | 21,016,000 | | | | 22,580,785 | |
7.75%, 5/15/27 | | | 12,848,000 | | | | 13,840,918 | |
7.00%, 12/1/28 | | | 28,225,000 | | | | 29,066,820 | |
DowDuPont, Inc. | | | | | | | | |
4.55%, 11/30/25(b) | | | 20,200,000 | | | | 20,559,135 | |
4.80%, 11/30/28(b) | | | 24,050,000 | | | | 24,484,756 | |
7.375%, 11/1/29 | | | 69,100,000 | | | | 84,294,984 | |
9.40%, 5/15/39 | | | 153,811,000 | | | | 222,686,840 | |
5.25%, 11/15/41 | | | 39,918,000 | | | | 39,878,079 | |
5.55%, 11/30/48(b) | | | 19,204,000 | | | | 19,414,011 | |
Elanco Animal Health, Inc. | | | | | | | | |
3.912%, 8/27/21(b) | | | 32,870,000 | | | | 33,073,143 | |
4.272%, 8/28/23(b) | | | 32,775,000 | | | | 32,745,214 | |
4.90%, 8/28/28(b) | | | 46,519,000 | | | | 47,364,363 | |
Ford Motor Credit Co. LLC(c) | | | | | | | | |
2.681%, 1/9/20 | | | 110,925,000 | | | | 109,075,683 | |
8.125%, 1/15/20 | | | 7,091,000 | | | | 7,360,923 | |
5.75%, 2/1/21 | | | 192,923,000 | | | | 196,755,294 | |
5.875%, 8/2/21 | | | 169,660,000 | | | | 173,991,113 | |
3.813%, 10/12/21 | | | 194,775,000 | | | | 189,156,168 | |
3.219%, 1/9/22 | | | 30,125,000 | | | | 28,288,176 | |
4.25%, 9/20/22 | | | 3,142,000 | | | | 3,011,917 | |
4.14%, 2/15/23 | | | 112,081,000 | | | | 106,528,177 | |
4.375%, 8/6/23 | | | 34,264,000 | | | | 32,454,238 | |
Imperial Brands PLC (United Kingdom) | | | | | | | | |
3.75%, 7/21/22(b) | | | 124,595,000 | | | | 123,585,601 | |
4.25%, 7/21/25(b) | | | 593,845,000 | | | | 584,354,401 | |
Kinder Morgan, Inc. | | | | | | | | |
4.30%, 6/1/25 | | | 139,770,000 | | | | 139,075,550 | |
6.50%, 2/1/37 | | | 50,861,000 | | | | 54,850,987 | |
6.95%, 1/15/38 | | | 92,139,000 | | | | 102,866,820 | |
| | |
| PAGE 12§ DODGE & COX INCOME FUND | | See accompanying Notes to Financial Statements |
| | | | |
| PORTFOLIO OF INVESTMENTS | | | December 31, 2018 | |
| | | | | | | | |
| DEBT SECURITIES (continued) | |
| | |
| | | PAR VALUE | | | VALUE | |
6.50%, 9/1/39 | | $ | 72,546,000 | | | $ | 77,438,950 | |
5.00%, 8/15/42 | | | 78,782,000 | | | | 72,171,413 | |
5.00%, 3/1/43 | | | 86,308,000 | | | | 78,402,828 | |
5.50%, 3/1/44 | | | 96,910,000 | | | | 93,806,387 | |
5.40%, 9/1/44 | | | 69,297,000 | | | | 66,318,010 | |
Macy’s, Inc. | | | | | | | | |
6.90%, 4/1/29 | | | 30,383,000 | | | | 32,728,288 | |
6.70%, 7/15/34 | | | 77,960,000 | | | | 78,216,506 | |
4.50%, 12/15/34 | | | 95,617,000 | | | | 76,577,421 | |
6.375%, 3/15/37 | | | 21,354,000 | | | | 20,594,388 | |
Naspers, Ltd. (South Africa) | | | | | | | | |
6.00%, 7/18/20(b) | | | 220,010,000 | | | | 225,853,466 | |
5.50%, 7/21/25(b) | | | 347,931,000 | | | | 350,265,617 | |
4.85%, 7/6/27(b) | | | 140,217,000 | | | | 134,293,673 | |
Nordstrom, Inc.
6.95%, 3/15/28 | | | 20,107,000 | | | | 22,250,318 | |
RELX PLC (United Kingdom) | | | | | | | | |
8.625%, 1/15/19 | | | 28,613,000 | | | | 28,662,383 | |
3.125%, 10/15/22 | | | 146,687,000 | | | | 144,020,578 | |
3.50%, 3/16/23 | | | 64,115,000 | | | | 63,603,019 | |
Telecom Italia SPA (Italy) | | | | | | | | |
7.175%, 6/18/19 | | | 200,711,000 | | | | 202,103,934 | |
5.303%, 5/30/24(b) | | | 241,056,000 | | | | 229,003,200 | |
7.20%, 7/18/36 | | | 53,458,000 | | | | 51,052,390 | |
7.721%, 6/4/38 | | | 150,684,000 | | | | 149,648,801 | |
TransCanada Corp. (Canada) | | | | | | | | |
5.625%, 5/20/75(a)(e) | | | 237,639,000 | | | | 214,172,149 | |
5.875%, 8/15/76(a)(e) | | | 84,536,000 | | | | 79,514,562 | |
5.30%, 3/15/77(a)(e) | | | 282,129,000 | | | | 243,512,593 | |
Twenty-First Century Fox, Inc. | | | | | | | | |
6.20%, 12/15/34 | | | 14,795,000 | | | | 18,005,032 | |
6.40%, 12/15/35 | | | 49,525,000 | | | | 61,845,574 | |
6.15%, 3/1/37 | | | 31,905,000 | | | | 39,174,694 | |
6.65%, 11/15/37 | | | 79,075,000 | | | | 104,228,890 | |
6.15%, 2/15/41 | | | 49,083,000 | | | | 61,023,569 | |
Ultrapar Participacoes SA (Brazil)
5.25%, 10/6/26(b) | | | 151,950,000 | | | | 147,582,957 | |
Union Pacific Corp. | |
7.60%, 1/2/20 | | | 242,539 | | | | 251,934 | |
6.061%, 1/17/23 | | | 2,359,419 | | | | 2,572,646 | |
4.698%, 1/2/24 | | | 2,066,012 | | | | 2,132,102 | |
5.082%, 1/2/29 | | | 5,363,020 | | | | 5,709,101 | |
5.866%, 7/2/30 | | | 31,722,309 | | | | 34,456,527 | |
6.176%, 1/2/31 | | | 30,856,882 | | | | 33,788,286 | |
United Technologies Corp. | |
3.35%, 8/16/21 | | | 53,035,000 | | | | 52,889,305 | |
3.65%, 8/16/23 | | | 180,430,000 | | | | 179,711,638 | |
Verizon Communications, Inc. | | | | | | | | |
4.272%, 1/15/36 | | | 166,472,000 | | | | 155,963,259 | |
4.522%, 9/15/48 | | | 213,601,000 | | | | 200,388,274 | |
5.012%, 4/15/49 | | | 480,632,000 | | | | 479,559,152 | |
Xerox Corp. | | | | | | | | |
5.625%, 12/15/19 | | | 87,407,000 | | | | 88,058,958 | |
2.75%, 9/1/20 | | | 22,690,000 | | | | 21,781,421 | |
4.50%, 5/15/21 | | | 97,025,000 | | | | 94,641,959 | |
4.07%, 3/17/22 | | | 2,349,000 | | | | 2,155,547 | |
Zoetis, Inc. | | | | | | | | |
3.45%, 11/13/20 | | | 39,377,000 | | | | 39,478,243 | |
4.50%, 11/13/25 | | | 166,139,000 | | | | 170,591,163 | |
| | | | | | | | |
| | | | | | | 13,055,543,190 | |
UTILITIES: 1.8% | |
Dominion Energy, Inc. | |
2.962%, 7/1/19 | | | 10,000,000 | | | | 9,964,548 | |
2.579%, 7/1/20 | | | 32,099,000 | | | | 31,591,707 | |
4.104%, 4/1/21 | | | 97,451,000 | | | | 98,204,805 | |
5.75%, 10/1/54(a)(e) | | | 232,036,000 | | | | 231,750,006 | |
| | | | | | | | |
| | |
| | | PAR VALUE | | | VALUE | |
Enel SPA (Italy) | | | | | | | | |
4.25%, 9/14/23(b) | | $ | 60,000,000 | | | $ | 58,663,462 | |
4.625%, 9/14/25(b) | | | 175,588,000 | | | | 168,547,646 | |
3.625%, 5/25/27(b) | | | 38,125,000 | | | | 33,650,339 | |
6.80%, 9/15/37(b) | | | 174,509,000 | | | | 187,478,580 | |
6.00%, 10/7/39(b) | | | 157,024,000 | | | | 155,824,670 | |
| | | | | | | | |
| | | | | | | 975,675,763 | |
| | | | | | | | |
| | | | | | | 21,987,782,553 | |
| | | | | | | | |
TOTAL DEBT SECURITIES
(Cost $54,391,065,172) | | | $ | 53,877,655,576 | |
| | |
| See accompanying Notes to Financial Statements | | DODGE & COX INCOME FUND§PAGE 13 |
| | | | |
| PORTFOLIO OF INVESTMENTS | | | December 31, 2018 | |
| | | | | | | | |
| SHORT-TERM INVESTMENTS: 0.2% | |
| | |
| | | PAR VALUE/ SHARES | | | VALUE | |
MONEY MARKET FUND: 0.2% | |
State Street Institutional U.S. Government Money Market Fund | | $ | 120,228,458 | | | $ | 120,228,458 | |
| | | | | | | | |
TOTAL SHORT-TERM INVESTMENTS
(Cost $120,228,458) | | | $ | 120,228,458 | |
| | | | | | | | |
TOTAL INVESTMENTS IN SECURITIES
(Cost $54,511,293,630) | | | 99.4 | % | | $ | 53,997,884,034 | |
OTHER ASSETS LESS LIABILITIES | | | 0.6 | % | | | 315,736,748 | |
| | | | | | | | |
| NET ASSETS | | | 100.0 | % | | $ | 54,313,620,782 | |
| | | | | | | | |
| (a) | Hybrid security: characteristics of both a debt and equity security. |
| (b) | Security exempt from registration under Rule 144A of the Securities Act of 1933. The security may be resold in transactions exempt from registration, normally to qualified institutional buyers. |
| (c) | Subsidiary (see below) |
| (d) | Variable rate security: interest rate is determined by the interest rates of underlying pool of assets that collateralize the security. The interest rate of the security may change due to a change in the interest rates or the composition of underlying pool of assets. The interest rate shown is the rate as of period end. |
| (e) | Variable rate security:fixed-to-float security pays an initial fixed interest rate and will pay a floating interest rate established at a predetermined time in the future. The interest rate shown is the rate as of period end. |
Debt securities are grouped by parent company unless otherwise noted. Actual securities may be issued by the listed parent company or one of its subsidiaries. In determining a parent company’s country designation, the Fund generally references the country of incorporation.
Debt securities with floating interest rates are linked to the referenced benchmark; the interest rate shown is the rate as of period end.
ARM: Adjustable Rate Mortgage
CMBS: Commercial Mortgage-Backed Security
CMO: Collateralized Mortgage Obligation
CMT: Constant Maturity Treasury
DUS: Delegated Underwriting and Servicing
GO: General Obligation
RB: Revenue Bond
REMIC: Real Estate Mortgage Investment Conduit
FUTURES CONTRACTS
| | | | | | | | | | | | | | | | |
| Description | | Number of
Contracts | | | Expiration
Date | | | Notional
Amount | | | Value /
Unrealized
Appreciation
(Depreciation) | |
Ultra Long-Term U.S. Treasury Bond—Short Position | | | 3,190 | | | | 3/20/19 | | | $ | (512,493,438 | ) | | $ | (27,176,840 | ) |
| | |
| PAGE 14§ DODGE & COX INCOME FUND | | See accompanying Notes to Financial Statements |
| | | | |
STATEMENT OF ASSETS AND LIABILITIES | |
| |
| | | December 31, 2018 | |
ASSETS: | | | | |
Investments in securities, at value (cost $54,511,293,630) | | $ | 53,997,884,034 | |
Cash | | | 68,963 | |
Deposits with broker for futures contracts | | | 11,643,811 | |
Receivable for investments sold | | | 18,701,788 | |
Receivable for Fund shares sold | | | 103,733,865 | |
Interest receivable | | | 427,040,311 | |
Prepaid expenses and other assets | | | 194,608 | |
| | | | |
| | | 54,559,267,380 | |
| | | | |
LIABILITIES: | | | | |
Payable for variation margin for futures contracts | | | 1,894,059 | |
Payable for Fund shares redeemed | | | 222,241,493 | |
Management fees payable | | | 18,744,774 | |
Accrued expenses | | | 2,766,272 | |
| | | | |
| | | 245,646,598 | |
| | | | |
NET ASSETS | | $ | 54,313,620,782 | |
| | | | |
NET ASSETS CONSIST OF: | | | | |
Paid in capital | | $ | 54,886,594,607 | |
Total accumulated loss | | | (572,973,825 | ) |
| | | | |
| | $ | 54,313,620,782 | |
| | | | |
Fund shares outstanding (par value $0.01 each, unlimited shares authorized) | | | 4,096,589,846 | |
Net asset value per share | | $ | 13.26 | |
|
STATEMENT OF OPERATIONS | |
| |
| | | Year Ended
December 31, 2018 | |
INVESTMENT INCOME: | | | | |
Dividends | | $ | 34,768,787 | |
Interest | | | 1,890,216,378 | |
| | | | |
| | | 1,924,985,165 | |
| | | | |
EXPENSES: | | | | |
Management fees | | | 223,673,151 | |
Custody and fund accounting fees | | | 826,426 | |
Transfer agent fees | | | 8,040,473 | |
Professional services | | | 220,308 | |
Shareholder reports | | | 1,937,027 | |
Registration fees | | | 1,017,598 | |
Trustees’ fees | | | 324,167 | |
Miscellaneous | | | 792,106 | |
| | | | |
| | | 236,831,256 | |
| | | | |
NET INVESTMENT INCOME | | | 1,688,153,909 | |
| | | | |
REALIZED AND UNREALIZED GAIN (LOSS): | | | | |
Net realized gain | | | | |
Investments in securities | | | 19,700,155 | |
Futures contracts | | | 48,186,074 | |
Net change in unrealized appreciation/depreciation | | | | |
Investments in securities | | | (1,914,555,278 | ) |
Futures contracts | | | (28,416,917 | ) |
| | | | |
Net realized and unrealized loss | | | (1,875,085,966 | ) |
| | | | |
NET CHANGE IN NET ASSETS
FROM OPERATIONS | | $ | (186,932,057 | ) |
| | | | |
| | | | | | | | |
STATEMENT OF CHANGES IN NET ASSETS | |
| | |
| | | Year Ended
December 31, 2018 | | | Year Ended
December 31, 2017 | |
OPERATIONS: | | | | | | | | |
Net investment income | | $ | 1,688,153,909 | | | $ | 1,407,714,701 | |
Net realized gain (loss) | | | 67,886,229 | | | | 238,365,078 | |
Net change in unrealized appreciation/depreciation | | | (1,942,972,195 | ) | | | 498,474,373 | |
| | | | | | | | |
| | | (186,932,057 | ) | | | 2,144,554,152 | |
| | | | | | | | |
| | |
DISTRIBUTIONS TO SHAREHOLDERS: | | | | | | | | |
Total distributions | | | (1,887,086,223 | ) | | | (1,545,668,043 | )(a) |
| | |
FUND SHARE
TRANSACTIONS: | | | | | | | | |
Proceeds from sale of shares | | | 14,058,784,954 | | | | 14,912,910,845 | |
Reinvestment of distributions | | | 1,568,832,950 | | | | 1,266,629,663 | |
Cost of shares redeemed | | | (13,526,739,100 | ) | | | (9,124,121,824 | ) |
| | | | | | | | |
Net change from Fund share transactions | | | 2,100,878,804 | | | | 7,055,418,684 | |
| | | | | | | | |
Total change in net assets | | | 26,860,524 | | | | 7,654,304,793 | |
| | |
NET ASSETS: | | | | | | | | |
Beginning of year | | | 54,286,760,258 | | | | 46,632,455,465 | |
| | | | | | | | |
End of year | | $ | 54,313,620,782 | | | $ | 54,286,760,258 | (b) |
| | | | | | | | |
| | |
SHARE INFORMATION: | | | | | | | | |
Shares sold | | | 1,043,147,794 | | | | 1,083,349,260 | |
Distributions reinvested | | | 117,588,178 | | | | 92,213,550 | |
Shares redeemed | | | (1,008,309,102 | ) | | | (663,262,463 | ) |
| | | | | | | | |
Net change in shares outstanding | | | 152,426,870 | | | | 512,300,347 | |
| | | | | | | | |
| (a) | Prior year comparative amounts have been adjusted to reflect current presentation under new accounting standards. Prior year distributions consisted of $1,404,908,219 from net investment income and $140,759,824 from net realized gain. |
| (b) | Includes undistributed net investment income of $18,087,643. |
| | |
| See accompanying Notes to Financial Statements | | DODGE & COX INCOME FUND§PAGE 15 |
NOTES TO FINANCIAL STATEMENTS
NOTE 1—ORGANIZATION AND SIGNIFICANT ACCOUNTING POLICIES
Dodge & Cox Income Fund (the “Fund”) is one of the series constituting the Dodge & Cox Funds (the “Trust” or the “Funds”). The Trust is organized as a Delaware statutory trust and is registered under the Investment Company Act of 1940, as amended, as anopen-end management investment company. The Fund commenced operations on January 3, 1989, and seeks high and stable current income consistent with long-term preservation of capital. Risk considerations and investment strategies of the Fund are discussed in the Fund’s Prospectus.
The Fund is an investment company and follows the accounting and reporting guidance issued in Topic 946 by the Financial Accounting Standards Board. The financial statements have been prepared in conformity with accounting principles generally accepted in the United States of America, which require the use of estimates and assumptions by management. Actual results may differ from those estimates. Significant accounting policies are as follows:
Security valuation The Fund’s net assets are normally valued as of the scheduled close of trading on the New York Stock Exchange (NYSE), generally 4 p.m. Eastern Time, each day that the NYSE is open for business.
Debt securities and derivatives traded over the counter are valued using prices received from independent pricing services which utilize dealer quotes, recent transaction data, pricing models, and other inputs to arrive at market-based valuations. Pricing models may consider quoted prices for similar securities, interest rates, cash flows (including prepayment speeds), and credit risk. Exchange-traded derivatives are valued at the settlement price determined by the relevant exchange. Short-term securities less than 60 days to maturity may be valued at amortized cost if amortized cost approximates current value. Mutual funds are valued at their respective net asset values. Security values are not discounted based on the size of the Fund’s position and may differ from the value a Fund receives upon sale of the securities. All securities held by the Fund are denominated in U.S. dollars.
If market quotations are not readily available or if normal valuation procedures produce valuations that are deemed unreliable or inappropriate under the circumstances existing at the time, the investment will be valued at fair value as determined in good faith by or under the direction of the Fund’s Board of Trustees. The Board of Trustees has appointed Dodge & Cox, the Fund’s investment manager, to make fair value determinations in accordance with the Dodge & Cox Funds Valuation Policies (“Valuation Policies”), subject to Board oversight. Dodge & Cox has established a Pricing Committee that is comprised of representatives from Treasury, Legal, Compliance, and Operations. The Pricing Committee is responsible for implementing the Valuation Policies, including determining the fair value of securities and other investments when necessary. The Pricing Committee considers relevant indications of value that are reasonably available to it in determining the fair value assigned to a particular security, such as the value of similar financial instruments, trading volumes, contractual restrictions on disposition, related corporate actions, and changes in economic
conditions. In doing so, the Pricing Committee employs various methods for calibrating fair valuation approaches, including a regular review of key inputs and assumptions, back-testing, and review of any related market activity.
Valuing securities through a fair value determination involves greater reliance on judgment than valuation of securities based on readily available market quotations. In some instances, lack of information and uncertainty as to the significance of information may lead to a conclusion that a prior valuation is the best indication of a security’s value. When fair value pricing is employed, the prices of securities used by the Fund to calculate its net asset value may differ from quoted or published prices for the same securities.
Security transactions, investment income, expenses, and distributions Security transactions are recorded on the trade date. Realized gains and losses on securities sold are determined on the basis of identified cost.
Interest income is recorded on the accrual basis. Interest income includes coupon interest, amortization of premium and accretion of discount on debt securities, and gain/loss on paydowns. The ability of the issuers of the debt securities held by the Fund to meet their obligations may be affected by economic developments in a specific industry, state, or region. Debt obligations may be placed onnon-accrual status and related interest income may be reduced by ceasing current accruals and writing off interest receivables when the collection of all or a portion of interest has become doubtful. A debt obligation is removed fromnon-accrual status when the issuer resumes interest payments or when collectibility of interest is reasonably assured. Dividend income is recorded on the ex-dividend date.
Expenses are recorded on the accrual basis. Some expenses of the Trust can be directly attributed to a specific series. Expenses which cannot be directly attributed are allocated among the Funds in the Trust using methodologies determined by the nature of the expense.
Distributions to shareholders are recorded on theex-dividend date.
Repurchase agreements Repurchase agreements are transactions under which a Fund purchases a security from a dealer counterparty and agrees to resell the security to that counterparty on a specified future date at the same price, plus a specified interest rate. The Fund’s repurchase agreements are secured by U.S. government or agency securities. It is the Fund’s policy that its custodian take possession of the underlying collateral securities, the fair value of which exceeds the principal amount of the repurchase transaction, including accrued interest, at all times. In the event of default by the counterparty, the Fund has the contractual right to liquidate the securities and to apply the proceeds in satisfaction of the obligation.
Futures contracts Futures contracts involve an obligation to purchase or sell (depending on whether the Fund has entered a long or short futures contract, respectively) an asset at a future date, at a price set at the time of the contract. Upon entering into a futures contract, the Fund is required to deposit an amount of cash or liquid assets (referred to as initial margin) in a segregated account with the clearing broker. Subsequent payments (referred
PAGE 16§ DODGE & COX INCOME FUND
NOTES TO FINANCIAL STATEMENTS
to as variation margin) to and from the clearing broker are made on a daily basis based on changes in the market value of futures contracts. Futures contracts are traded publicly and their market value changes daily. Changes in the market value of open futures contracts are recorded as unrealized appreciation or depreciation in the Statement of Operations. Realized gains and losses on futures contracts are recorded in the Statement of Operations at the closing or expiration of the contracts. Cash deposited with a broker as initial margin is recorded in the Statement of Assets and Liabilities. A receivable and/or payable to brokers for daily variation margin is also recorded in the Statement of Assets and Liabilities.
Investments in futures contracts may include certain risks, which may be different from, and potentially greater than, those of the underlying securities. To the extent the Fund uses futures, it is exposed to additional volatility and potential losses resulting from leverage.
The Fund has maintained short Treasury futures contracts to assist with the management of the portfolio’s interest rate exposure. During the year ended December 31, 2018, these Treasury futures contracts had notional values up to 2% of net assets.
Indemnification Under the Trust’s organizational documents, its officers and trustees are indemnified against certain liabilities arising out of the performance of their duties to the Trust. In addition, in the normal course of business the Trust enters into contracts that provide general indemnities to other parties. The Trust’s maximum exposure under these arrangements is unknown as this would involve future claims that may be made against the Trust that have not yet occurred.
NOTE 2—VALUATION MEASUREMENTS
Various inputs are used in determining the value of the Fund’s investments. These inputs are summarized in the three broad levels listed below.
| § | | Level 1: Quoted prices in active markets for identical securities |
| § | | Level 2: Other significant observable inputs (including quoted prices for similar securities, market indices, interest rates, credit risk, forward exchange rates, etc.) |
| § | | Level 3: Significant unobservable inputs (including Fund management’s assumptions in determining the fair value of investments) |
The inputs or methodology used for valuing securities are not necessarily an indication of the risk associated with investing in those securities.
The following is a summary of the inputs used to value the Fund’s holdings at December 31, 2018:
| | | | | | | | |
| Classification | | LEVEL 1 (Quoted Prices) | | | LEVEL 2 (Other Significant
Observable Inputs) | |
Securities | | | | | | | | |
Debt Securities | | | | | | | | |
U.S. Treasury | | $ | — | | | $ | 3,200,704,882 | |
Government-Related | | | — | | | | 3,472,144,703 | |
Securitized | | | — | | | | 25,217,023,438 | |
Corporate | | | — | | | | 21,987,782,553 | |
Short-term Investments | | | | | | | | |
Money Market Fund | | | 120,228,458 | | | | — | |
| | | | | | | | |
Total Securities | | $ | 120,228,458 | | | $ | 53,877,655,576 | |
| | | | | | | | |
| | |
Other Investments | | | | | | | | |
Futures Contracts | | | | | | | | |
Depreciation | | $ | (27,176,840 | ) | | $ | — | |
| | | | | | | | | |
NOTE 3—RELATED PARTY TRANSACTIONS
Management fees Under a written agreement approved by a unanimous vote of the Board of Trustees, the Fund pays a management fee monthly at an annual rate of 0.50% of the Fund’s average daily net assets up to $100 million and 0.40% of the Fund’s average daily net assets in excess of $100 million to Dodge & Cox, investment manager of the Fund. The agreement further provides that Dodge & Cox shall waive its fee to the extent that such fee plus all other ordinary operating expenses of the Fund exceed 1% of the average daily net assets for the year.
Fund officers and trustees All officers and two of the trustees of the Trust are officers or employees of Dodge & Cox. The Trust pays a fee only to those trustees who are not affiliated with Dodge & Cox.
NOTE 4—INCOME TAX INFORMATION AND DISTRIBUTIONS TO SHAREHOLDERS
A provision for federal income taxes is not required since the Fund intends to continue to qualify as a regulated investment company under Subchapter M of the Internal Revenue Code and distribute all of its taxable income to shareholders. Distributions are determined in accordance with income tax regulations, and such amounts may differ from net investment income and realized gains for financial reporting purposes. The Fund may also designate a portion of the amount paid to redeeming shareholders as a distribution for tax purposes. Financial reporting records are adjusted for permanent book to tax differences at year end to reflect tax character. Book to tax differences are primarily due to differing treatments of wash sales, net short-term realized gain (loss), derivatives, and distributions.
DODGE & COX INCOME FUND§PAGE 17
NOTES TO FINANCIAL STATEMENTS
Distributions during the years noted below were characterized as follows for federal income tax purposes:
| | | | | | | | |
| | | Year Ended
December 31, 2018 | | | Year Ended December 31, 2017 | |
Ordinary income | | $ | 1,653,646,376 | | | $ | 1,404,908,219 | |
| | ($ | 0.398 per share | ) | | ($ | 0.380 per share | ) |
Long-term capital gain | | $ | 233,439,847 | | | $ | 140,759,824 | |
| | ($ | 0.057 per share | ) | | ($ | 0.037 per share | ) |
At December 31, 2018, the tax basis components of distributable earnings were as follows:
| | | | |
Undistributed ordinary income | | $ | 11,346,654 | |
Deferred loss(a) | | | (70,637,963 | ) |
At December 31, 2018, unrealized appreciation and depreciation for investments and derivatives based on cost for federal income tax purposes were as follows:
| | | | |
Tax cost | | $ | 54,484,389,710 | |
| | | | |
Unrealized appreciation | | | 584,595,626 | |
Unrealized depreciation | | | (1,098,278,142 | ) |
| | | | |
Net unrealized depreciation | | | (513,682,516 | ) |
| | | | | |
| (a) | Represents net realized capital loss incurred between November 1, 2018 and December 31, 2018. As permitted by tax regulation, the Fund has elected to treat this loss as arising in 2019. |
Fund management has reviewed the tax positions for open periods (three years and four years, respectively, from filing the Fund’s Federal and State tax returns) as applicable to the Fund, and has determined that no provision for income tax is required in the Fund’s financial statements.
NOTE 5—LOAN FACILITIES
Pursuant to an exemptive order issued by the Securities and Exchange Commission (SEC), the Fund may participate in an interfund lending facility (Facility). The Facility allows the Fund to borrow money from or loan money to the Funds. Loans under the Facility are made for temporary or emergency purposes, such as to fund shareholder redemption requests. Interest on borrowings is the average of the current repurchase agreement rate and the bank loan rate. There was no activity in the Facility during the year.
All Funds in the Trust participate in a $500 million committed credit facility (Line of Credit) with State Street Bank and Trust Company, to be utilized for temporary or emergency purposes to fund shareholder redemptions or for other short-term liquidity purposes. The maximum amount available to the Fund is
$250 million. Each Fund pays an annual commitment fee on itspro-rata portion of the Line of Credit. For the year ended December 31, 2018, the Fund’s commitment fee amounted to $334,220 and is reflected as a Miscellaneous Expense in the Statement of Operations. Interest on borrowings is charged at the prevailing rate. There were no borrowings on the Line of Credit during the year.
NOTE 6—PURCHASES AND SALES OF INVESTMENTS
For the year ended December 31, 2018, purchases and sales of securities, other than short-term securities and U.S. government securities, aggregated $10,353,455,159 and $2,460,094,642 respectively. For the year ended December 31, 2018, purchases and sales of U.S. government securities aggregated $13,396,413,626 and $17,838,188,094 respectively.
NOTE 7—NEW ACCOUNTING GUIDANCE
In March 2017, the Financial Accounting Standards Board issued an update to amend the amortization period for certain purchased callable debt securities held at a premium. The amendments shorten the amortization period for premiums to the earliest call date, but do not require an accounting change for securities held at a discount. The amendments are effective for financial statements for fiscal years beginning after December 15, 2018, and interim periods within those fiscal years. Management is evaluating the impact, if any, of this guidance on the Fund’s financial statements and disclosures.
In August 2018, the Financial Accounting Standards Board issued Accounting Standards Update “Fair Value Measurement (Topic 820)” (ASU 2018-13) which modifies the disclosure requirements for fair value measurement by removing, modifying, or adding certain disclosures. The amendments are effective for annual periods beginning after December 15, 2019, and interim periods within those annual periods. The Fund is permitted to early adopt any removed or modified disclosures upon issuance of this update and delay adoption of the additional disclosures until their effective date. The Fund has early adopted the updated accounting standards on the Fund’s financial statements.
NOTE 8—SUBSEQUENT EVENTS
Fund management has determined that no material events or transactions occurred subsequent to December 31, 2018, and through the date of the Fund’s financial statements issuance, which require additional disclosure in the Fund’s financial statements.
PAGE 18§ DODGE & COX INCOME FUND
FINANCIAL HIGHLIGHTS
| | | | | | | | | | | | | | | | | | | | |
SELECTED DATA AND RATIOS (for a share outstanding throughout each year) | | Year Ended December 31, | |
| | | 2018 | | | 2017 | | | 2016 | | | 2015 | | | 2014 | |
| | | | |
Net asset value, beginning of year | | | $13.76 | | | | $13.59 | | | | $13.29 | | | | $13.78 | | | | $13.53 | |
Income from investment operations: | | | | | | | | | | | | | | | | | | | | |
Net investment income | | | 0.41 | | | | 0.38 | | | | 0.42 | | | | 0.40 | | | | 0.39 | |
Net realized and unrealized gain (loss) | | | (0.45 | ) | | | 0.21 | | | | 0.32 | | | | (0.48 | ) | | | 0.35 | |
| | | | |
Total from investment operations | | | (0.04 | ) | | | 0.59 | | | | 0.74 | | | | (0.08 | ) | | | 0.74 | |
| | | | |
Distributions to shareholders from: | | | | | | | | | | | | | | | | | | | | |
Net investment income | | | (0.40 | ) | | | (0.38 | ) | | | (0.42 | ) | | | (0.40 | ) | | | (0.39 | ) |
Net realized gain | | | (0.06 | ) | | | (0.04 | ) | | | (0.02 | ) | | | (0.01 | ) | | | (0.10 | ) |
| | | | |
Total distributions | | | (0.46 | ) | | | (0.42 | ) | | | (0.44 | ) | | | (0.41 | ) | | | (0.49 | ) |
| | | | |
Net asset value, end of year | | | $13.26 | | | | $13.76 | | | | $13.59 | | | | $13.29 | | | | $13.78 | |
| | | | |
Total return | | | (0.31 | )% | | | 4.36 | % | | | 5.62 | % | | | (0.59 | )% | | | 5.48 | % |
Ratios/supplemental data: | | | | | | | | | | | | | | | | | | | | |
Net assets, end of year (millions) | | | $54,314 | | | | $54,287 | | | | $46,632 | | | | $43,125 | | | | $39,128 | |
Ratio of expenses to average net assets | | | 0.42 | % | | | 0.43 | % | | | 0.43 | % | | | 0.43 | % | | | 0.44 | % |
Ratio of net investment income to average net assets | | | 3.02 | % | | | 2.80 | % | | | 3.11 | % | | | 2.97 | % | | | 2.89 | % |
Portfolio turnover rate | | | 37 | % | | | 19 | % | | | 27 | % | | | 24 | % | | | 27 | % |
See accompanying Notes to Financial Statements
DODGE & COX INCOME FUND§PAGE 19
REPORT OF INDEPENDENT REGISTERED PUBLIC ACCOUNTING FIRM
To the Board of Trustees of the Dodge & Cox Funds and Shareholders of Dodge & Cox Income Fund
Opinion on the Financial Statements
We have audited the accompanying statement of assets and liabilities, including the portfolio of investments, of Dodge & Cox Income Fund (one of the funds constituting Dodge & Cox Funds, referred to hereafter as the “Fund”) as of December 31, 2018, the related statement of operations for the year ended December 31, 2018, the statement of changes in net assets for each of the two years in the period ended December 31, 2018, including the related notes, and the financial highlights for each of the five years in the period ended December 31, 2018 (collectively referred to as the “financial statements”). In our opinion, the financial statements present fairly, in all material respects, the financial position of the Fund as of December 31, 2018, the results of its operations for the year then ended, the changes in its net assets for each of the two years in the period ended December 31, 2018 and the financial highlights for each of the five years in the period ended December 31, 2018 in conformity with accounting principles generally accepted in the United States of America.
Basis for Opinion
These financial statements are the responsibility of the Fund’s management. Our responsibility is to express an opinion on the Fund’s financial statements based on our audits. We are a public accounting firm registered with the Public Company Accounting Oversight Board (United States) (PCAOB) and are required to be independent with respect to the Fund in accordance with the U.S. federal securities laws and the applicable rules and regulations of the Securities and Exchange Commission and the PCAOB.
We conducted our audits of these financial statements in accordance with the standards of the PCAOB. Those standards require that we plan and perform the audit to obtain reasonable assurance about whether the financial statements are free of material misstatement, whether due to error or fraud.
Our audits included performing procedures to assess the risks of material misstatement of the financial statements, whether due to error or fraud, and performing procedures that respond to those risks. Such procedures included examining, on a test basis, evidence regarding the amounts and disclosures in the financial statements. Our audits also included evaluating the accounting principles used and significant estimates made by management, as well as evaluating the overall presentation of the financial statements. Our procedures included confirmation of securities owned as of December 31, 2018 by correspondence with the custodian, transfer agent and brokers. We believe that our audits provide a reasonable basis for our opinion.
PricewaterhouseCoopers LLP
San Francisco, California
February 15, 2019
We have served as the auditor of one or more investment companies in the Dodge & Cox Funds since 1931.
PAGE 20§ DODGE & COX INCOME FUND
SPECIAL 2018 TAX INFORMATION
(unaudited)
The following information is provided pursuant to provisions of the Internal Revenue Code:
The Fund designates $233,439,847 as long-term capital gain distributions in 2018.
BOARD APPROVAL OF FUNDS’ INVESTMENT
MANAGEMENT AGREEMENTS AND MANAGEMENT FEES
(unaudited)
The Board of Trustees is responsible for overseeing the performance of the Dodge & Cox Funds’ investment manager and determining whether to continue the Investment Management Agreements between the Funds and Dodge & Cox each year (the “Agreements”). At a meeting of the Board of Trustees of the Trust held on December 13, 2018, the Trustees, by a unanimous vote (including a separate vote of those Trustees who are not “interested persons” (as defined in the Investment Company Act of 1940) (the “Independent Trustees”)), approved the renewal of the Agreements for an additional one-year term through December 31, 2019 with respect to each Fund. During the course of the year, the Board received extensive information and materials relating to the investment management and administrative services provided by Dodge & Cox and the performance of each of the Funds.
INFORMATION RECEIVED
Over the past several years, the Board has requested, received, and discussed a number of special presentations on topics relevant to their annual consideration of the proposed renewal of the Funds’ Agreements. In addition to the foregoing and in advance of the meetings referred to below, the Board, including the Independent Trustees, requested, received, and reviewed materials relating to the Agreements and the services provided by Dodge & Cox. The Independent Trustees retained Broadridge to prepare an independent expense and performance summary for each Fund and comparable funds managed by other advisers identified by Broadridge. The Broadridge materials included information regarding advisory fee rates, expense ratios, and transfer agency, custodial, and distribution expenses, as well as performance comparisons to each Fund’s peer group and to a broad-based securities index or combination of indices. The Broadridge materials also included a comparison of expenses of various share classes offered by comparable funds. The materials reviewed by the Board contained information concerning, among other things, Dodge & Cox’s profitability, financial results and condition, advisory fee revenue, and separate account fee schedules. The Board additionally considered the Funds’ brokerage commissions, turnover rates, sales and redemption data, and the significant investment that Dodge & Cox makes in research used in managing the Funds. The Board received and reviewed memoranda and related materials addressing, among other things, Dodge & Cox’s services to the Funds; how Dodge & Cox Funds’ fees compare to fees of peer group funds; the different fees, services, costs, and risks associated with other accounts managed by Dodge & Cox as compared to the Dodge & Cox Funds; and the ways in which the
Funds realize economies of scale. Throughout the process of reviewing the services provided by Dodge & Cox and preparing for the meeting, the Independent Trustees found Dodge & Cox to be open, forthright, detailed, and very helpful in answering questions about all issues. The Board received copies of the Agreements and a memorandum from the independent legal counsel to the Independent Trustees discussing the factors generally regarded as appropriate to consider in evaluating advisory arrangements. The Trust’s Contract Review Committee, consisting solely of Independent Trustees, met with the independent legal counsel on November 8, 2018 and again on December 13, 2018 to discuss whether to renew the Agreements. The Board, including the Independent Trustees, subsequently concluded that the existing Agreements are fair and reasonable and voted to approve the Agreements. In considering the Agreements, the Board, including the Independent Trustees, did not identify any single factor or particular information as all-important or controlling. In reaching the decision to approve the Agreements, the Board considered several factors, discussed below, to be key factors and reached the conclusions described below.
NATURE, QUALITY, AND EXTENT OF THE SERVICES
The Board considered that Dodge & Cox provides a wide range of services to the Funds in addition to portfolio management, including regulatory compliance, trading desks, proxy voting, transfer agent and custodian oversight, administration, regulatory filings, tax compliance and filings, web site, and anti-money laundering. The extensive nature of services provided by Dodge & Cox has been documented in materials provided to the Board and in presentations made to the Board throughout the year. In particular, the Board considered the nature, quality, and extent of portfolio management, administrative, and shareholder services performed by Dodge & Cox. With regard to portfolio management services, the Board considered Dodge & Cox’s established long-term history of care and conscientiousness in the management of the Funds; its demonstrated consistency in investment approach and depth; the background and experience of the Dodge & Cox U.S. Equity Investment Committee, International Equity Investment Committee, Global Equity Investment Committee, U.S. Fixed Income Investment Committee, and Global Fixed Income Investment Committee, and research analysts responsible for managing the Funds; Dodge & Cox’s methods for assessing the regulatory and investment climate in various jurisdictions; its overall high level of attention to its core investment management function; and its commitment to the Funds and their shareholders. The Board noted Dodge & Cox’s long record of favorable press and industry coverage, as well as its positive compliance record, and its reputation as a trusted, shareholder-friendly mutual fund family.
In addition, the Board considered that Dodge & Cox manages approximately $215 billion in Fund assets with fewer professionals than most comparable funds, and that on average these professionals have more experience and longer tenure than investment professionals at comparable funds. The Board also noted that Dodge & Cox is an investment research-oriented firm with no other business endeavors to distract management’s
DODGE & COX INCOME FUND§PAGE 21
attention from its research efforts or to present material conflicts of interest with the operations of the Funds, that its investment professionals adhere to a consistent investment approach across the Funds, and that due to its careful and deliberate strategy with respect to new products, Dodge & Cox has had remarkable stability in its mutual fund product offerings over the course of the past 88 years and has the fewest funds of any of the 25 largest mutual fund families by assets. The Board further considered the “Gold” analyst rating awarded by Morningstar to all of the Funds (other than the Global Bond Fund, which has a “Bronze” rating). The Board concluded that it was satisfied with the nature, extent, and quality of investment management and other services provided to the Funds by Dodge & Cox.
INVESTMENT PERFORMANCE
The Board completed an intensive review and assessment of each Fund’s recent and long-term investment performance (including periods of outperformance and underperformance), as compared to relevant indices and the performance of such Fund’s peer group and broader Morningstar category. In assessing the performance of the Funds, the Board considered the Funds’ investment returns over various periods and the volatility thereof and concluded that the levels experienced were consistent with Dodge & Cox’s long-term approach and active investment style. The Board also compared the short- and long-term investment performance of the equity funds to value-oriented indices, in recognition of the significant performance divergence between value and growth stocks over the past several years. It was noted that equity performance has been consistent with the value oriented investment strategy employed by Dodge & Cox. The Board further noted that the equity funds have outperformed over their medium to long-term investment horizons as compared to their corresponding value equity indices.
The Board determined after extensive review and inquiry that Dodge & Cox’s historic, long-term, team-oriented, bottom-up investment approach remains consistent and that Dodge & Cox continues to be distinguished by its integrity, transparency, and independence. The Board considered that the performance of the Funds is the result of a value-oriented investment management process that emphasizes a long-term investment horizon, comprehensive independent research, a team approach, price discipline, low cost, and low portfolio turnover. The Board also considered that the investment performance delivered by Dodge & Cox to the Funds appeared to be consistent with the relevant performance delivered for other clients of Dodge & Cox. The Board concluded that Dodge & Cox has delivered favorable long-term performance for Fund investors consistent with the long-term investment strategies being pursued by the Funds.
COSTS AND ANCILLARY BENEFITS
Costs of Services to Funds: Fees and Expenses The Board considered each Fund’s management fee rate and net expense ratio relative to (1) a broad category of other mutual funds with similar portfolio characteristics and share class and expense structures and (2) a much smaller group of peers selected by Broadridge based on
investment style, share class characteristics, and asset levels. The Board also considered the management fees charged by Dodge & Cox to other clients. In particular, the Board considered that the Funds continue to be below their peer group median in net expense ratios and that many media and industry reports specifically comment on the low cost of the Funds, which have been a defining characteristic of the Funds for many years. The Board also evaluated the operating structures of the Funds and Dodge & Cox, noting that the Funds do not charge front-end sales commissions or distribution fees, and Dodge & Cox bears, among other things, the significant cost of third party research, reimbursement for shareholder recordkeeping and administrative costs to third-party retirement plan administrators, and administrative and office overhead.
The Board noted that the Broadridge report shows that the net expense ratio of every Dodge & Cox Fund is in the least expensive quartile compared to its broad Morningstar category. The Board noted the Funds’ unusual single-share-class structure and reviewed Broadridge data (including asset-weighted average expense ratios) showing that most of the peer group funds offer several different classes of shares, with different expense ratios, to different categories of investors, and that the Broadridge expense comparisons described above generally compare the net expense ratio of each Dodge & Cox Fund’s single share class to one of the least expensive share classes of the peer fund, even though those share classes are often not available to retail investors. The Board determined that the Funds provide access for small investors to high quality investment management at a relatively low cost. The Board also considered that the Funds are priced to scale, i.e., management fee rates begin at relatively low levels. Even without breakpoints, the Funds’ management fee rates are lower than those of many peer funds whose fee schedules include breakpoints. With respect to non-U.S. funds sponsored and managed by Dodge & Cox that are comparable to the Funds in many respects, the Board noted that the fee rates charged by Dodge & Cox are the same as or higher than the fee rates charged to the Funds.
The Board reviewed information regarding the fee rates Dodge & Cox charges to separate accounts that have investment programs similar to those of the Funds, including instances where separate account fees are lower than Fund fees. The Board considered the significant differences in the nature and scope of services Dodge & Cox provides to the Funds as compared to other client accounts, as well as material differences in regulatory, litigation, and other risks as between Dodge & Cox Funds and other types of clients. The Board noted that different markets exist for mutual fund and institutional separate account management services and that a comparison of Fund fee rates and separate account fee rates must consider the fact that separate account clients bear additional costs and responsibilities that are included in the cost of a Fund. The Board further noted that many sophisticated institutional investors in the Funds that are eligible to open separate accounts at Dodge & Cox have decided for various reasons to invest in the Funds. After consideration of these matters, the Board concluded that the overall costs incurred by the Funds for the services they receive (including the management fee paid to Dodge & Cox) are reasonable and that the fees are
PAGE 22§ DODGE & COX INCOME FUND
acceptable based upon the qualifications, experience, reputation, and performance of Dodge & Cox and the low overall expense ratios of the Funds.
Profitability and Costs of Services to Dodge & Cox; “Fall-out” Benefits The Board reviewed reports of Dodge & Cox’s financial position, profitability, and estimated overall value and considered Dodge & Cox’s overall profitability within its context as a private, employee-owned S-Corporation and relative to the favorable services provided. The Board noted in particular that Dodge & Cox’s profits are not generated by high fee rates, but reflect a very streamlined, efficient, and focused business approach toward investment management.
The Board recognized the importance of Dodge & Cox’s profitability—which is derived solely from management fees and does not include other business ventures—to maintain its independence, stability, company culture and ethics, and management continuity. The Board also considered that the compensation/profit structure at Dodge & Cox includes a return on shareholder employees’ investment in the firm, which is vital for remaining independent and facilitating retention of management and investment professionals. The Board also considered that in January 2015, Dodge & Cox closed the International Stock Fund to new investors to proactively manage the growth of the Fund. The Stock Fund and Balanced Fund were similarly closed to new investors during periods of significant growth in the past. While these actions are intended to benefit existing Fund shareholders, the effect is to reduce potential revenues to Dodge & Cox from new shareholders.
The Board also considered potential “fall-out” benefits (including the receipt of research from unaffiliated brokers and reputational benefits to non-U.S. funds sponsored and managed by Dodge & Cox) that Dodge & Cox might receive as a result of its association with the Funds and determined that they are acceptable. The Board also noted that Dodge & Cox continues to invest substantial sums in its business in order to provide enhanced services, systems, and research capabilities, all of which benefit the Funds. The Board concluded that Dodge & Cox’s profitability is the keystone of its independence, stability, and long-term investment performance and that the profitability of Dodge & Cox’s relationship with the Funds (including fall-out benefits) is fair and reasonable.
ECONOMIES OF SCALE
The Board considered whether there have been economies of scale with respect to the management of each Fund, whether the Funds have appropriately benefited from any economies of scale, and whether the management fee rate is reasonable in relation to the level of Fund assets and any economies of scale that may exist. In the Board’s view, any consideration of economies of scale must take account of the Funds’ low fee and expense structure and the fact that the Dodge & Cox Funds build economies of scale into their fee structures by charging low fees from a fund’s inception and keeping overall expenses down as a Fund grows, as compared to other fund complexes that employ fee “breakpoints” only after a fund reaches a certain scale. An assessment of economies of scale must also take into account that Dodge & Cox invests significant
time and resources in each new Fund for months (and sometimes years) prior to launch; in addition, in a Fund’s early periods of operations, expenses are capped, which means that Dodge & Cox subsidizes the operations of a new Fund for a period of time until it reaches scale. The Board also observed that, while total Fund assets have grown significantly over the long term, this growth has not been continuous or evenly distributed across all of the Funds (for example, the total assets of the Balanced Fund have actually declined over the past ten years). In addition, the Board noted that Dodge & Cox has shared the benefits of economies of scale with the Funds by adding and enhancing services to the Funds over time, and that Dodge & Cox’s internal costs of providing investment management, technology, administrative, legal, and compliance services to the Funds continue to increase. For example, Dodge & Cox has increased its global research staff and investment resources over the years to add important new capabilities for the benefit of Fund shareholders and to address the increased complexity of investing globally.
In addition, Dodge & Cox has made substantial expenditures in other staff, technology, and infrastructure to enable it to integrate credit and equity analyses and to implement its strategy in a more effective and secure manner. Over the last ten years, Dodge & Cox has increased its spending on research, investment management, client servicing, cybersecurity, technology, third party research, data services, and computer systems for trading, operations, compliance, accounting, and communications at a rate that has significantly outpaced the Funds’ growth rate during the same period. The Board also observed that, even without fee breakpoints, the Funds are competitively priced in a very competitive market and that having a low fee from inception is better for shareholders than starting with a higher fee and adding breakpoints. The Board also noted that there are certain diseconomies of scale associated with managing large funds, insofar as certain of the costs and risks associated with portfolio management increase disproportionately as assets grow. The Board concluded that the current Dodge & Cox fee structure is fair and reasonable and adequately shares economies of scale that may exist.
CONCLUSION
Based on their evaluation of all material factors and assisted by the advice of independent legal counsel to the Independent Trustees, the Board, including the Independent Trustees, concluded that the advisory fee structure was fair and reasonable, that each Fund was paying a competitive fee for the services provided, that Dodge & Cox’s services have provided value for Fund shareholders over the long term, and that approval of the Agreements was in the best interests of each Fund and its shareholders.
DODGE & COX INCOME FUND§PAGE 23
FUND HOLDINGS
The Fund provides a complete list of its holdings four times each fiscal year, as of the end of each quarter. The Fund files the lists with the Securities and Exchange Commission (SEC) on FormN-CSR (second and fourth quarters) and Form N-Q (first and third quarters). Shareholders may view the Fund’s Forms N-CSR and N-Q on the SEC’s website at sec.gov. Forms N-CSR and N-Q may also be reviewed and copied at the SEC’s Public Reference Room in Washington, DC. Information regarding the operations of the Public Reference Room may be obtained by calling800-SEC-0330. A list of the Fund’s quarter-end holdings is also available at dodgeandcox.com on or about 15 days following each quarter end and remains available on the web site until the list is updated in the subsequent quarter.
PROXY VOTING
For a free copy of the Fund’s proxy voting policies and procedures, please call 800-621-3979, visit the Fund’s website at dodgeandcox.com, or visit the SEC’s website at sec.gov. Information regarding how the Fund voted proxies relating to portfolio securities during the most recent 12-month period ending June 30 is also available at dodgeandcox.com or at sec.gov.
HOUSEHOLD MAILINGS
The Fund routinely mails shareholder reports and summary prospectuses to shareholders and, on occasion, proxy statements. In order to reduce the volume of mail, when possible, only one copy of these documents will be sent to shareholders who are part of the same family and share the same residential address.
If you have a direct account with the Funds and you do not want the mailing of shareholder reports and summary prospectuses combined with other members in your household, contact the Funds at800-621-3979. Your request will be implemented within 30 days.
PAGE 24§ DODGE & COX INCOME FUND
[THIS PAGE INTENTIONALLY LEFT BLANK]
DODGE & COX INCOME FUND§PAGE 25
[THIS PAGE INTENTIONALLY LEFT BLANK]
PAGE 26§ DODGE & COX INCOME FUND
DODGE & COX FUNDS—EXECUTIVE OFFICER & TRUSTEE INFORMATION
| | | | | | |
| | | | |
Name (Age) and
Address* | | Position with Trust (Year of Election or
Appointment)** | | Principal Occupation During Past Five Years** | | Other Directorships of Public Companies Held
by Trustees |
| |
| INTERESTED TRUSTEES AND EXECUTIVE OFFICERS |
| Charles F. Pohl (60) | | Chairman and Trustee (since 2014) | | Chairman and Director of Dodge & Cox; Chief Investment Officer and member of U.S. Equity Investment Committee (USEIC), Global Equity Investment Committee (GEIC), and International Equity Investment Committee (IEIC) | | — |
| Dana M. Emery (57) | | President (since 2014) and Trustee (since 1993) | | Chief Executive Officer, President, and Director of Dodge & Cox;Co-Director of Fixed Income and member of U.S. Fixed Income Investment Committee (USFIIC) and Global Fixed Income Investment Committee (GFIIC) | | — |
| Diana S. Strandberg (59) | | Senior Vice President (since 2006) | | Senior Vice President and Director of Dodge & Cox; Director of International Equity and member of USEIC, GEIC, IEIC, and GFIIC | | — |
Roberta R.W. Kameda (58) | | Chief Legal Officer (since 2019) and Secretary (since 2017) | | Vice President, General Counsel, and Secretary (since 2017) of Dodge & Cox | | — |
| David H. Longhurst (61) | | Treasurer (since 2006) | | Vice President and Assistant Treasurer of Dodge & Cox | | — |
| Katherine M. Primas (44) | | Chief Compliance Officer (since 2010) | | Vice President and Chief Compliance Officer of Dodge & Cox | | — |
| |
| INDEPENDENT TRUSTEES |
| Caroline M. Hoxby (52) | | Trustee (since 2017) | | Professor of Economics, Stanford University; Director of the Economics of Education Program, National Bureau of Economic Research; Senior Fellow, Hoover Institution and Stanford Institute for Economic Policy Research | | — |
| Thomas A. Larsen (69) | | Trustee (since 2002) | | Senior Counsel of Arnold & Porter (law firm) (2013-2018); Partner of Arnold & Porter (until 2012); Director of Howard, Rice, Nemerovski, Canady, Falk & Rabkin (1977-2011) | | — |
| Ann Mather (58) | | Trustee (since 2011) | | CFO, Pixar Animation Studios (1999-2004) | | Director, Alphabet Inc. (internet information services) (since 2005); Director, Glu Mobile, Inc. (multimedia software) (since 2004); Director, Netflix, Inc. (internet television) (since 2010); Director, Arista Networks (cloud networking) (since 2013); Director, Shutterfly, Inc. (internet photography services/publishing) (since 2013) |
| Robert B. Morris III (66) | | Trustee (since 2011) | | Advisory Director, The Presidio Group (2005-2016); Partner and Managing Director—Global Investment Research at Goldman Sachs (until 2001) | | — |
| Gary Roughead (67) | | Trustee (since 2013) | | Robert and Marion Oster Distinguished Military Fellow, Hoover Institution (since 2012); Admiral, United States Navy (Ret.); U.S. Navy Chief of Naval Operations (2008-2011) | | Director, Northrop Grumman Corp. (global security) (since 2012); Director, Maersk Line, Limited (shipping and transportation) (since 2016) |
| Mark E. Smith (67) | | Trustee (since 2014) | | Executive Vice President, Managing Director—Fixed Income at Loomis Sayles & Company, L.P. (2003-2011) | | — |
| John B. Taylor (72) | | Trustee (since 2005) (and 1995-2001) | | Professor of Economics, Stanford University (since 1984); Senior Fellow, Hoover Institution (since 1996); Under Secretary for International Affairs, United States Treasury (2001-2005) | | — |
| * | | The address for each Officer and Trustee is 555 California Street, 40th Floor, San Francisco, California 94104. Each Officer and Trustee oversees all six series in the Dodge & Cox Funds complex and serves for an indefinite term. |
| ** | | Information as of February 14, 2019. |
Additional information about the Trust’s Trustees and Officers is available in the Trust’s Statement of Additional Information (SAI). You can get a free copy of the SAI by visiting the Funds’ website at dodgeandcox.com or calling
800-621-3979.
DODGE & COX INCOME FUND§PAGE 27
dodgeandcox.com
For Fund literature, transactions, and account
information, please visit the Funds’ website.
or write or call:
DODGE & COX FUNDS
c/o DST Asset Manager Solutions, Inc.
P.O. Box 219502
Kansas City, Missouri 64121-9502
(800) 621-3979
INVESTMENT MANAGER
Dodge & Cox
555 California Street, 40th Floor
San Francisco, California 94104
(415) 981-1710
This report is submitted for the general information of the shareholders of the Fund. The report is not authorized for distribution to prospective investors in the Fund unless it is accompanied by a current prospectus.
This report reflects our views, opinions, and portfolio holdings as of December 31, 2018, the end of the reporting period. Any such views are subject to change at any time based upon market or other conditions and Dodge & Cox disclaims any responsibility to update such views. These views may not be relied on as investment advice and, because investment decisions for a Dodge & Cox Fund are based on numerous factors, may not be relied on as an indication of trading intent on behalf of any Dodge & Cox Fund.
DODGE & COX FUNDS®
Annual Report
December 31, 2018
Global Bond Fund
ESTABLISHED 2014
TICKER: DODLX
Important Notice:
Beginning on January 1, 2021, we intend to discontinue mailing paper copies of the Fund’s shareholder reports as permitted by new regulations adopted by the Securities and Exchange Commission, unless you specifically request paper copies from Dodge & Cox Funds or from your financial intermediary, such as a broker-dealer or bank. The reports will remain available to you on the Dodge & Cox Funds website (dodgeandcox.com), and you will be notified by mail each time a report is posted and provided with a link to access the report.
If you have already elected to receive shareholder reports electronically, you will not be affected by this change and do not need to take any action. If you have not done so already, you may elect to receive shareholder reports and other communications electronically by enrolling in e-delivery on the Funds website, or, if you are invested through a financial intermediary, by updating your mailing preferences through the intermediary.
If you wish to continue receiving paper copies of all future shareholder reports, please contact us at (800) 621-3979. Reports will be provided to you free of charge. If you are invested through a financial intermediary, you may contact your financial intermediary to request to receive paper copies. Your election to receive reports in paper form will apply to all funds held with Dodge & Cox Funds or through your financial intermediary, as applicable.
12/18 GBF AR Printed on recycled paper
TO OUR SHAREHOLDERS
The Dodge & Cox Global Bond Fund had a total return of –1.5% for the year ended December 31, 2018, compared to a return of –1.2% for the Bloomberg Barclays Global Aggregate Bond Index (Bloomberg Barclays Global Agg).
MARKET COMMENTARY
While 2018 began with a surge of optimism around strong, “synchronized” global growth, the year proved to be a challenging one for economic momentum and risk assets, including corporate bonds and many emerging market currencies. Economic divergence was instead the theme of the year. Fiscal stimulus boosted the U.S. economy, while a deceleration in other major economies was exacerbated by trade and political tensions. The Bloomberg Barclays Global Agg returned –1.2% in 2018, driven mostly by widening credit spreads and the depreciation of the euro.
The United States reported strong economic data throughout 2018, leading the Federal Reserve (Fed) to hike its benchmark interest rate four times. Annual GDP growth paced around 3%, core inflation neared the Fed’s 2% target, and unemployment ended at 3.9%. Despite these strong numbers, trade tensions between the United States and China clouded the economic outlook, as protectionist rhetoric escalated into rounds of increased tariffs between the two countries. Fears of an eventual economic slowdown were amplified by turbulence in emerging markets and decelerating growth in the eurozone and China. Finally, toward the end of the year, equity markets declined significantly, fueling recession risk concerns and dampening investor expectations of further monetary tightening.
Consistent with the sell-off in risk assets, corporate bonds performed poorly. Global investment-grade corporate yield premiums(a) finished the year at 155 basis points,(b) the highest level since mid-2016. Financials outperformed Industrials and lower-rated companies underperformed higher-rated companies.
Amid this volatility, the U.S. dollar strengthened significantly against most currencies. The euro depreciated 4.5%, weighed down both by slowing economic momentum and rising political risks, including Italy’s contentious budget process and ongoing Brexit uncertainties. Returns of emerging market currencies varied. The Argentine peso and Turkish lira fell dramatically, while the Mexican peso finished the year essentially unchanged. A large decline in oil prices (–25% for the year) put downward pressure on the currencies of oil-exporting countries.
INVESTMENT STRATEGY
Financial markets ended 2018 on a decidedly negative note for most major asset classes. Fixed income generally fared relatively well, but the Fund’s significant holdings in corporate and emerging market bonds underperformed U.S. Treasuries and drove the Fund’s modestly negative return. While we are disappointed by these results, we maintain conviction in our long-term, value-driven investment strategy, and, in fact, we see many compelling opportunities in the current investment environment. When negative sentiment shrouds the market, valuations tend to fall
across the board without distinguishing among the relative strength of individual companies or countries. These periods create excellent opportunities for our active investment strategy, which emphasizes individual issuer and security selection and leverages our experienced research and investment team.
Of the three primary investment levers that we employ in the Fund—credit, currency, and rates—we were most active in credit, taking advantage of declining valuations (i.e., increasing yield premiums) to add significantly to our holdings. As of year end, the Fund had 59%(c) of its net assets invested in credit(d) securities across 55 issuers, up from 47% at the beginning of the year. While we made a number of incremental adjustments to the Fund’s currency and interest rate positioning, the U.S. dollar weighting (82%) and overall duration(e) (3.7 years) did not change materially over the year.
Credit: Lower Valuations Create Interesting Opportunities
Our global bond investment strategy focuses on credit more than many of our peers’ strategies, as we see plentiful opportunity in this large and growing part of the global bond market. Valuation discipline, a key tenet of our investment strategy, drove most of our portfolio changes in 2018. After reaching post-crisis highs in early February, credit valuations began to cheapen in March, and the trend accelerated in the fourth quarter. We opportunistically increased the Fund’s aggregate credit exposure by 12 percentage points over the year, including an almost seven percentage point increase in the fourth quarter.
Throughout the year, we participated in several attractively priced primary debt offerings from companies that were financing strategic activities (e.g., mergers, acquisitions, spin-offs). The key characteristics of many of these investments included strong cash generation capabilities, high liquidity, business diversity and scale, and credible plans for debt reduction in the coming years. We also added to our subordinated bond holdings, especially industrial hybrid securities from several companies with strong credit profiles. For example, we recently established a position in a BHP Billiton(f) hybrid security with an option-adjusted spread of more than 300 basis points, which looked attractive relative to BHP’s senior debt levels and other market alternatives. BHP is a large and geographically diversified mining company with top-tier assets, strong cash flow generation capabilities, and low leverage.
The financial press has written extensively about the current long-lasting credit and economic cycle, emphasizing the growth in corporate leverage and triple-B debt. We closely follow these topics and incorporate them into our Investment Committee discussions. While the outlook for corporate borrowers has weakened somewhat, we believe corporate fundamentals remain reasonable amid healthy growth, profit margins, and interest coverage. Our credit analysis emphasizes leading companies with durable cash flows and balance sheets that can weather a full economic cycle. Furthermore, credit yield premiums near current valuation levels have provided attractive investment entry points.
PAGE 2§ DODGE & COX GLOBAL BOND FUND
Currency: The U.S. Dollar Does It Again
The broad trade-weighted dollar rose 8% in 2018, bolstered by the United States’ relatively strong growth and the Fed’s interest rate hikes. Against this difficult backdrop, the Fund’s aggregate currency exposures produced a flat return, as the yields on several of the Fund’s holdings helped offset declining spot rates almost across the board. The Fund’s 7% position in Mexican peso-denominated government bond holdings performed well, despite weak emerging market sentiment and challenging political developments in Mexico over the course of the year.
We have been finding relatively more attractive risk-adjusted return opportunities in the U.S. dollar-denominated market, leading to a high U.S.-dollar exposure (82%) in the Fund. This weighting also reflects our caution about adding relatively volatile currency exposure to the Fund. However, we believe the U.S. dollar is moderately overvalued and nearing its cyclical peak, so we anticipate more non-U.S. currency opportunities to surface.
During the year, emerging market currencies with large external financing needs—most notably the Argentine peso and Turkish lira—generally depreciated. The Fund has small exposures to both of these currencies, which reached their lowest levels in the third quarter before rallying by year end. Our approach in volatile situations like this is to maintain our long-term investment view and retest our investment theses in light of changes to both fundamental factors and valuations. Overall, we believe that the low currency valuations and high yields of these investments warrant continued small exposures. Among other encouraging factors, the International Monetary Fund’s agreement with Argentina in September has provided significant support and Turkey’s economy is undergoing a much-needed rebalancing.
Emerging market pessimism also drove valuations lower in Indonesia. But after reviewing fundamentals, we increased the Fund’s exposure to the Indonesian rupiah. We believed that the market had overreacted to sentiment and external conditions, and underappreciated Indonesia’s economic strengths. During the year, the Indonesian central bank proactively hiked interest rates and the government announced measures to improve public finances and ease pressure on the current account deficit.
Rates: Looking Outside the United States
Courtesy of the Fed, U.S. short-term interest rates have risen substantially in recent years. For example, the 2-year U.S. Treasury rate has more than doubled in the last two years (from 1.2% to 2.5%). The rise in rates has increased the return potential for fixed income securities. However, we believe that U.S. interest rates are likely to continue to rise modestly, and this may create headwinds for returns. Consequently, we have positioned the Fund with a relatively low U.S.-dollar duration of 3.2 years.
Outside the United States, we have eschewed exposure to low-yielding markets like Germany and Japan, but we continue to find opportunities in emerging market sovereigns. In August, we established a small position in (currency-hedged) Brazilian real-denominated five-year government bonds, and we recently increased our interest rate exposure in both Mexico and Indonesia via purchases of longer-duration government bonds.
IN CLOSING
As we look at global bond investment opportunities across credit, currencies, and interest rates, we have a positive outlook over the long term. Valuations for these segments of the market appear relatively attractive, and we are particularly optimistic about the Fund’s thoroughly researched holdings.
Thank you for your continued confidence in Dodge & Cox. As always, we welcome your comments and questions.
For the Board of Trustees,
| | |
| | |
Charles F. Pohl, Chairman | | Dana M. Emery, President |
January 31, 2019
| (a) | | Yield premiums are one way to measure a security’s valuation. Narrowing yield premiums result in a higher valuation. Widening yield premiums result in a lower valuation. |
| (b) | | One basis point is equal to 1/100th of 1%. |
| (c) | | Unless otherwise specified, all weightings and characteristics are as of December 31, 2018. |
| (d) | | Credit securities refers to corporate bonds and government-related securities, as classified by Bloomberg. |
| (e) | | Duration is a measure of a bond’s (or a bond portfolio’s) price sensitivity to changes in interest rates. |
| (f) | | The use of specific examples does not imply that they are more or less attractive investments than the Fund’s other holdings. |
DODGE & COX GLOBAL BOND FUND§PAGE 3
2018 PERFORMANCE REVIEW
The Fund returned -1.5% in 2018.
Key Detractors
| | § | | The Fund’s large allocation to corporate bonds (38%) detracted from performance as credit yield premiums rose considerably. Underperformers include Telecom Italia and TransCanada. | |
| | § | | The Fund’s exposure to several depreciating emerging market currencies detracted from returns, including the Argentine peso (0.7%), Colombian peso (2.9%), and Indian rupee (2.5%). | |
| | § | | Government-related credits in the Fund (9%) generally underperformed, in particular the Province of Buenos Aires and Pemex. | |
Key Contributors
| | § | | The Fund benefited from its exposure to interest rates in the United States, Colombia, and India. | |
| | § | | The Fund’s large exposure to the Mexican peso (5.9%) contributed positively to returns. | |
| | § | | Certain credit holdings performed well, including Rio Oil Finance Trust and Citigroup capital securities. | |
KEY CHARACTERISTICS OF DODGE & COX
Independent Organization
Dodge & Cox is one of the largest privately owned investment managers in the world. We remain committed to independence, with a goal of providing the highest quality investment management service to our existing clients.
Over 85 Years of Investment Experience
Dodge & Cox was founded in 1930. We have a stable and well-qualified team of investment professionals, most of whom have spent their entire careers at Dodge & Cox.
Experienced Investment Team
The Global Fixed Income Investment Committee, which is the decision-making body for the Global Bond Fund, is a six-member committee with an average tenure at Dodge & Cox of 20 years.
One Business with a Single Research Office
Dodge & Cox manages equity (domestic, international, and global), fixed income (domestic and global), and balanced investments, operating from one office in San Francisco.
Consistent Investment Approach
Our team decision-making process involves thorough, bottom-up fundamental analysis of each investment.
Long-Term Focus and Low Expenses
We invest with a three- to five-year investment horizon, which has historically resulted in low turnover relative to our peers. We manage Funds that maintain low expense ratios.
Risks: The yields and market values of the instruments in which the Fund invests may fluctuate. Accordingly, an investment may be worth more or less than its original cost. Debt securities are subject to interest rate risk, credit risk, and prepayment and call risk, all of which could have adverse effects on the value of the Fund. A low interest rate environment creates an elevated risk of future negative returns. Financial intermediaries may restrict their market making activities for certain debt securities, which may reduce the liquidity and increase the volatility of such securities. Investing in non-U.S. securities may entail risk due to foreign economic and political developments; this risk may be increased when investing in emerging markets. The Fund is also subject to currency risk. Please read the prospectus and summary prospectus for specific details regarding the Fund’s risk profile.
PAGE 4§ DODGE & COX GLOBAL BOND FUND
GROWTH OF $10,000 SINCE INCEPTION
FOR AN INVESTMENT MADE ON DECEMBER 5, 2012
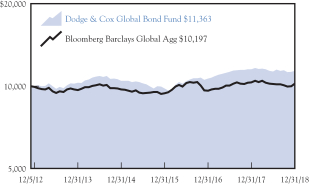
AVERAGE ANNUAL TOTAL RETURN
FOR PERIODS ENDED DECEMBER 31, 2018
| | | | | | | | | | | | | | | | |
| | | 1 Year | | | 3 Years | | | 5 Years | | | Since
Inception
(12/5/12) | |
| | | | | | | | | | | | | | | | |
Dodge & Cox Global Bond Fund(a) | | | –1.45 | % | | | 5.06 | % | | | 2.03 | % | | | 2.13 | % |
Bloomberg Barclays Global Aggregate Bond Index (Bloomberg Barclays Global Agg) | | | –1.20 | | | | 2.70 | | | | 1.08 | | | | 0.33 | |
| (a) | | Expense reimbursements have been in effect for the Fund since its inception. Without the expense reimbursements, returns for the Fund would have been lower. The Fund’s returns since May 1, 2014 are as presented in the Financial Highlights. |
Returns represent past performance and do not guarantee future results. Investment return and share price will fluctuate with market conditions, and investors may have a gain or loss when shares are sold. Fund performance changes over time and currently may be significantly lower than stated. Performance is updated and published monthly. Visit the Fund’s website at dodgeandcox.com or call800-621-3979 for current performance figures.
A private fund managed and funded by Dodge & Cox (the “Private Fund”) was reorganized into the Fund and the Fund commenced operations on May 1, 2014. The Private Fund commenced operations on December 5, 2012 and had an investment objective, policies, and strategies that were, in all material respects, the same as those of the Fund, and was managed in a manner that, in all material respects, complied with the investment guidelines and restrictions of the Fund. However, the Private Fund was not registered as an investment company under the Investment Company Act of 1940 (the “1940 Act”), and therefore was not subject to certain investment limitations, diversification requirements, liquidity requirements, and other restrictions imposed by the 1940 Act and the Internal Revenue Code, which, if applicable, may have adversely affected its performance.
The Fund’s total returns include the reinvestment of dividend and capital gain distributions, but have not been adjusted for any income taxes payable by shareholders on these distributions or on Fund share redemptions. Index returns include interest income but, unlike Fund returns, do not reflect fees or expenses. The Bloomberg Barclays Global Aggregate Bond Index (Bloomberg Barclays Global Agg) is a widely recognized, unmanaged index of multi-currency investment-grade, debt securities.
Bloomberg is a registered trademark of Bloomberg Finance L.P. and its affiliates. Barclays® is a trademark of Barclays Bank PLC.
FUND EXPENSE EXAMPLE
As a Fund shareholder, you incur ongoing Fund costs, including management fees and other Fund expenses. All mutual funds have ongoing costs, sometimes referred to as operating expenses. The following example shows ongoing costs of investing in the Fund and can help you understand these costs and compare them with those of other mutual funds. The example assumes a $1,000 investment held for the six months indicated.
ACTUAL EXPENSES
The first line of the table below provides information about actual account values and expenses based on the Fund’s actual returns. You may use the information in this line, together with your account balance, to estimate the expenses that you paid over the period. Simply divide your account value by $1,000 (for example, an $8,600 account value divided by $1,000 = 8.6), then multiply the result by the number in the first line under the heading “Expenses Paid During Period” to estimate the expenses you paid on your account during this period.
HYPOTHETICAL EXAMPLE FOR COMPARISON WITH OTHER MUTUAL FUNDS
Information on the second line of the table can help you compare ongoing costs of investing in the Fund with those of other mutual funds. This information may not be used to estimate the actual ending account balance or expenses you paid during the period. The hypothetical “Ending Account Value” is based on the actual expense ratio of the Fund and an assumed 5% annual rate of return before expenses (not the Fund’s actual return). The amount under the heading “Expenses Paid During Period” shows the hypothetical expenses your account would have incurred under this scenario. You can compare this figure with the 5% hypothetical examples that appear in shareholder reports of other mutual funds.
| | | | | | | | | | | | |
Six Months Ended December 31, 2018 | | Beginning Account Value
7/1/2018 | | | Ending Account Value
12/31/2018 | | | Expenses Paid
During Period* | |
Based on Actual Fund Return | | $ | 1,000.00 | | | $
| 1,005.00
|
| | $
| 2.27
|
|
Based on Hypothetical 5% Yearly Return | | | 1,000.00 | | |
| 1,022.94
|
| |
| 2.29
|
|
| * | | Expenses are equal to the Fund’s annualized net expense ratio of 0.45%, multiplied by the average account value over the period, multiplied by 184/365 (to reflect the one-half year period). |
The expenses shown in the table highlight ongoing costs only and do not reflect any transactional fees or account maintenance fees. Though other mutual funds may charge such fees, please note that the Fund does not charge transaction fees (e.g., redemption fees, sales loads) or universal account maintenance fees (e.g., small account fees).
DODGE & COX GLOBAL BOND FUND§PAGE 5
| | | | |
| FUND INFORMATION (unaudited) | | | December 31, 2018 | |
| | | | |
| GENERAL INFORMATION | | | |
Net Asset Value Per Share | | | $10.23 | |
Total Net Assets (millions) | | | $226.1 | |
Net Expense Ratio(a) | | | 0.45% | |
Gross Expense Ratio | | | 0.92% | |
Portfolio Turnover Rate | | | 55% | |
30-Day SEC Yield (using net expenses)(a)(b) | | | 5.32% | |
30-Day SEC Yield (using gross expenses) | | | 4.85% | |
Number of Credit Issuers | | | 55 | |
Fund Inception | | | May 1, 2014 | |
No sales charges or distribution fees | | | | |
Investment Manager:Dodge & Cox, San Francisco. Managed by the Global Fixed Income Investment Committee, whose six members’ average tenure at Dodge & Cox is 20 years.
| | | | | | | | |
| PORTFOLIO CHARACTERISTICS | | Fund | | | BBG Barclays
Global Agg | |
Effective Duration (years)(c) | | | 3.7 | | | | 7.0 | |
Emerging Markets(d) | | | 30.6% | | | | 5.3% | |
Non-USD Currency Exposure(e) | | | 18.0% | | | | 54.7% | |
| | | | |
| FIVE LARGEST CREDIT ISSUERS (%)(f) | | Fund | |
Charter Communications, Inc. | | | 2.0 | |
AT&T, Inc. | | | 2.0 | |
Cemex SAB de CV | | | 2.0 | |
Kinder Morgan, Inc. | | | 1.9 | |
TransCanada Corp. | | | 1.9 | |
| | | | | | | | |
| CREDIT QUALITY (%)(g)(h) | | Fund | | | BBG Barclays
Global Agg | |
Aaa | | | 12.3 | | | | 40.3 | |
Aa | | | 2.3 | | | | 15.9 | |
A | | | 14.2 | | | | 28.4 | |
Baa | | | 51.1 | | | | 15.4 | |
Ba | | | 15.2 | | | | 0.0 | |
B | | | 2.3 | | | | 0.0 | |
Caa | | | 0.0 | | | | 0.0 | |
Net Cash & Other(i) | | | 2.6 | | | | 0.0 | |
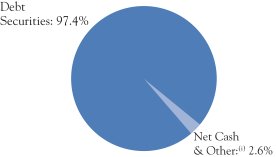
| | | | | | | | |
| SECTOR DIVERSIFICATION (%)(h) | | Fund | | | BBG Barclays
Global Agg | |
Government | | | 20.0 | | | | 54.3 | |
Government-Related | | | 5.5 | | | | 11.7 | |
Securitized | | | 18.6 | | | | 15.4 | |
Corporate | | | 53.3 | | | | 18.6 | |
Net Cash & Other(i) | | | 2.6 | | | | 0.0 | |
| | | | | | | | |
| REGION DIVERSIFICATION (%)(d)(h) | | Fund | | | BBG Barclays
Global Agg | |
United States | | | 45.6 | | | | 39.5 | |
Latin America | | | 19.3 | | | | 1.0 | |
Europe (excluding United Kingdom) | | | 12.6 | | | | 25.5 | |
Pacific (excluding Japan) | | | 8.6 | | | | 5.6 | |
United Kingdom | | | 7.2 | | | | 5.2 | |
Africa | | | 2.2 | | | | 0.0 | (j) |
Canada | | | 1.9 | | | | 3.2 | |
Japan | | | 0.0 | | | | 17.2 | |
Middle East | | | 0.0 | | | | 0.6 | |
Other | | | 0.0 | | | | 2.2 | |
| (a) | Dodge & Cox has contractually agreed to reimburse the Fund for all ordinary expenses to the extent necessary to maintain total annual fund operating expenses at 0.45% through April 30, 2019. The term of the agreement renews annually thereafter unless terminated with 30 days’ written notice by either party prior to the end of the term. |
| (b) | SEC Yield is an annualization of the Fund’s net investment income for the trailing30-day period. Dividends paid by the Fund may be higher or lower than implied by the SEC Yield. |
| (c) | Interest rate derivatives reduce total Fund duration by 2.2 years (i.e., total Fund duration is 5.9 years without derivatives). |
| (d) | The Fund may classify an issuer in a different category than the Bloomberg Barclays Global Aggregate Bond Index. The Fund generally classifies a corporate issuer based on the country of incorporation of the parent company, but may designate a different country in certain circumstances. |
| (e) | Non-USD currency exposure for the Fund reflects the value of the portfolio’snon-U.S. dollar denominated investments, as well as the impact of currency derivatives. |
| (f) | The Fund’s portfolio holdings are subject to change without notice. The mention of specific securities is not a recommendation to buy, sell, or hold any particular security and is not indicative of Dodge & Cox’s current or future trading activity. |
| (g) | The credit quality distributions shown for the Fund and the Index are based on the middle of Moody’s, S&P, and Fitch ratings, which is the methodology used by Bloomberg in constructing its indices. If a security is rated by only two agencies, the lower of the two ratings is used. Please note the Fund applies the highest of Moody’s, S&P, and Fitch ratings to comply with the quality requirements stated in its prospectus. On that basis, the Fund held 11.0% in securities rated below investment grade. The credit quality of the investments in the portfolio does not apply to the stability or safety of the Fund or its shares. |
| (h) | Region, sector, and quality weights exclude the effect of the Fund’s derivative contracts. |
| (i) | Net Cash & Other includes cash, short-term investments, derivatives, receivables, and payables. |
PAGE 6§ DODGE & COX GLOBAL BOND FUND
| | | | |
| CONSOLIDATED PORTFOLIO OF INVESTMENTS | | | December 31, 2018 | |
| | | | | | | | | | | | |
| DEBT SECURITIES: 97.4% | |
| | | |
| | | | | | PAR VALUE | | | VALUE | |
| GOVERNMENT: 20.0% | |
Argentina Government (Argentina)
4.50%, 6/21/19(h) | | | USD | | | | 2,150,000 | | | $ | 2,138,712 | |
Brazil Government (Brazil)
10.00%, 1/1/23 | | | BRL | | | | 4,000,000 | | | | 1,081,601 | |
Colombia Government (Colombia) | |
7.75%, 4/14/21 | | | COP | | | | 10,510,000,000 | | | | 3,367,407 | |
3.00%, 3/25/33(a) | | | COP | | | | 7,037,976,600 | | | | 2,028,567 | |
India Government (India)
8.24%, 2/15/27 | | | INR | | | | 569,480,000 | | | | 8,574,893 | |
Indonesia Government (Indonesia)
8.25%, 5/15/36 | | | IDR | | | | 110,400,000,000 | | | | 7,581,363 | |
Italy Government (Italy)
4.50%, 3/1/24 | | | EUR | | | | 980,000 | | | | 1,263,013 | |
Mexico Government (Mexico) | |
2.00%, 6/9/22(a) | | | MXN | | | | 102,490,346 | | | | 4,835,862 | |
5.75%, 3/5/26 | | | MXN | | | | 59,100,000 | | | | 2,540,352 | |
8.00%, 11/7/47 | | | MXN | | | | 159,800,000 | | | | 7,344,047 | |
Poland Government (Poland)
2.50%, 1/25/23 | | | PLN | | | | 8,550,000 | | | | 2,326,822 | |
Turkey Government (Turkey)
10.50%, 8/11/27 | | | TRY | | | | 5,785,000 | | | | 817,060 | |
U.S. Treasury Note/Bond (United States)
2.75%, 11/30/20 | | | USD | | | | 1,250,000 | | | | 1,255,428 | |
| | | | | | | | | | | | |
| | | | | | | | | | | 45,155,127 | |
| GOVERNMENT-RELATED: 5.5% | |
Chicago Transit Authority RB (United States)
6.899%, 12/1/40 | | | USD | | | | 775,000 | | | | 990,055 | |
Indonesia Government International (Indonesia)
3.75%, 6/14/28(c) | | | EUR | | | | 850,000 | | | | 1,057,334 | |
Peru Government International (Peru)
3.75%, 3/1/30 | | | EUR | | | | 800,000 | | | | 1,077,005 | |
Petroleo Brasileiro SA (Brazil)
7.25%, 3/17/44 | | | USD | | | | 1,000,000 | | | | 985,510 | |
Petroleos Mexicanos (Mexico) | |
4.75%, 2/26/29 | | | EUR | | | | 900,000 | | | | 943,693 | |
6.75%, 9/21/47 | | | USD | | | | 2,736,000 | | | | 2,262,371 | |
6.35%, 2/12/48 | | | USD | | | | 51,000 | | | | 40,623 | |
Province of Buenos Aires Argentina (Argentina) | | | | | | | | | | | | |
5.375%, 1/20/23(c) | | | EUR | | | | 2,600,000 | | | | 2,321,715 | |
BADLARPP
+3.83%, 49.217%, 5/31/22 | | | ARS | | | | 34,600,000 | | | | 843,190 | |
State of Illinois GO (United States) | |
5.877%, 3/1/19 | | | USD | | | | 700,000 | | | | 703,094 | |
5.10%, 6/1/33 | | | USD | | | | 1,250,000 | | | | 1,191,787 | |
| | | | | | | | | | | | |
| | | | | | | | | | | 12,416,377 | |
| SECURITIZED: 18.6% | |
ASSET-BACKED: 7.6% | |
Other: 1.5% | |
Rio Oil Finance Trust (Brazil) | |
9.25%, 7/6/24(c) | | | USD | | | | 2,207,921 | | | | 2,354,196 | |
9.75%, 1/6/27(c) | | | USD | | | | 541,579 | | | | 592,353 | |
8.20%, 4/6/28(c) | | | USD | | | | 400,000 | | | | 419,000 | |
| | | | | | | | | | | | |
| | | | | | | | | | | 3,365,549 | |
Student Loan: 6.1% | |
Navient Student Loan Trust
(United States)
Series2017-4A A3,
3.506%, 9/27/66(c) | | | USD | | | | 3,863,000 | | | | 3,915,686 | |
| | | | | | | | | | | | |
| | | |
| | | | | | PAR VALUE | | | VALUE | |
Navient Student Loan Trust (Private Loans) (United States) | | | | | | | | | | | | |
Series2015-CA B, 3.25%, 5/15/40(c) | | | USD | | | | 1,350,000 | | | $ | 1,348,469 | |
Series2017-A B, 3.91%, 12/16/58(c) | | | USD | | | | 1,050,000 | | | | 1,039,165 | |
SLM Student Loan Trust (United States) | | | | | | | | | | | | |
USD LIBOR1-Month | | | | | | | | | |
+0.95%, 3.456%, 9/25/28 | | | USD | | | | 2,174,056 | | | | 2,177,516 | |
USD LIBOR3-Month | | | | | | | | | |
+0.11%, 2.898%, 12/15/32(c) | | | USD | | | | 2,775,483 | | | | 2,654,924 | |
SMB Private Education Loan Trust (Private Loans) (United States) | | | | | | | | | | | | |
Series2017-B A2A, 2.82%, 10/15/35(c) | | | USD | | | | 1,697,000 | | | | 1,659,167 | |
Series2018-C B, 4.00%, 11/17/42(c) | | | USD | | | | 1,000,000 | | | | 992,047 | |
| | | | | | | | | | | | |
| | | | | | | | | | | 13,786,974 | |
| | | | | | | | | | | | |
| | | | | | | | | | | 17,152,523 | |
CMBS: 0.8% | |
Agency CMBS: 0.8% | |
Freddie Mac Military Housing Trust Multifamily (United States)
4.492%, 11/25/55(c)(f) | | | USD | | | | 1,638,557 | | | | 1,755,677 | |
| | | | | | | | | | | | |
| | | | | | | | | | | | |
| | | | | | | | | | | | |
MORTGAGE-RELATED: 10.2% | |
Federal Agency CMO & REMIC: 2.2% | |
Fannie Mae (United States)
Trust2004-W9 1A3, 6.05%, 2/25/44 | | | USD | | | | 494,099 | | | | 558,762 | |
Freddie Mac (United States) | | | | | | | | | | | | |
Series 4283 EW, 4.50%, 12/15/43(f) | | | USD | | | | 121,884 | | | | 128,061 | |
Series 4319 MA, 4.50%, 3/15/44(f) | | | USD | | | | 444,310 | | | | 472,570 | |
Ginnie Mae (United States) | | | | | | | | | | | | |
Series2010-169 JZ, 4.00%, 12/20/40 | | | USD | | | | 618,126 | | | | 628,765 | |
USD LIBOR12-Month | | | | | | | | | |
+0.22%, 3.06%, 10/20/67 | | | USD | | | | 646,863 | | | | 648,209 | |
+0.15%, 2.29%, 12/20/67 | | | USD | | | | 1,450,397 | | | | 1,450,253 | |
+0.04%, 2.56%, 2/20/68 | | | USD | | | | 1,112,932 | | | | 1,106,077 | |
| | | | | | | | | | | | |
| | | | | | | | | | | 4,992,697 | |
Federal Agency Mortgage Pass-Through: 8.0% | |
Fannie Mae, 15 Year
(United States)
5.00%, 7/1/25 | | | USD | | | | 16,674 | | | | 17,125 | |
Fannie Mae, 30 Year (United States) | |
4.50%, 4/1/39-7/1/48 | | | USD | | | | 9,406,295 | | | | 9,789,007 | |
Fannie Mae, Hybrid ARM (United States) | | | | | | | | | | | | |
USD LIBOR12-Month | | | | | | | | | |
+1.58%, 2.897%, 8/1/44 | | | USD | | | | 121,405 | | | | 122,487 | |
+1.58%, 2.757%, 9/1/44 | | | USD | | | | 205,911 | | | | 207,303 | |
Freddie Mac, Hybrid ARM (United States) | | | | | | | | | | | | |
USD LIBOR12-Month | | | | | | | | | |
+1.63%, 3.015%, 10/1/44 | | | USD | | | | 245,206 | | | | 247,199 | |
+1.60%, 2.697%, 11/1/44 | | | USD | | | | 649,489 | | | | 650,847 | |
+1.62%, 2.673%, 1/1/45 | | | USD | | | | 655,780 | | | | 656,241 | |
Freddie Mac Gold, 30 Year (United States) | | | | | | | | | | | | |
6.00%, 2/1/35 | | | USD | | | | 64,257 | | | | 69,519 | |
4.50%, 8/1/44-8/1/47 | | | USD | | | | 6,140,071 | | | | 6,363,099 | |
| | | | | | | | | | | | |
| | | | | | | | | | | 18,122,827 | |
| | | | | | | | | | | | |
| | | | | | | | | | | 23,115,524 | |
| | | | | | | | | | | | |
| | | | | | | | | | | 42,023,724 | |
| CORPORATE: 53.3% | |
FINANCIALS: 14.2% | |
Bank of America Corp. (United States) | | | | | | | | | | | | |
4.25%, 10/22/26 | | | USD | | | | 1,725,000 | | | | 1,678,593 | |
4.183%, 11/25/27 | | | USD | | | | 1,400,000 | | | | 1,346,403 | |
| | |
| See accompanying Notes to Consolidated Financial Statements | | DODGE & COX GLOBAL BOND FUND§PAGE 7 |
| | | | |
| CONSOLIDATED PORTFOLIO OF INVESTMENTS | | | December 31, 2018 | |
| | | | | | | | | | | | |
| DEBT SECURITIES (continued) | |
| | | |
| | | | | | PAR VALUE | | | VALUE | |
Barclays PLC (United Kingdom)
4.836%, 5/9/28 | | | USD | | | | 2,650,000 | | | $ | 2,430,186 | |
BNP Paribas SA (France) | | | | | | | | | | | | |
4.375%, 9/28/25(c) | | | USD | | | | 2,400,000 | | | | 2,333,066 | |
4.625%, 3/13/27(c) | | | USD | | | | 1,850,000 | | | | 1,796,664 | |
Capital One Financial Corp. (United States)
3.75%, 4/24/24 | | | USD | | | | 625,000 | | | | 609,524 | |
Chubb, Ltd. (Switzerland)
2.50%, 3/15/38 | | | EUR | | | | 3,075,000 | | | | 3,470,544 | |
Cigna Corp. (United States) | | | | | | | | | | | | |
3.75%, 7/15/23(c) | | | USD | | | | 850,000 | | | | 847,117 | |
4.125%, 11/15/25(c) | | | USD | | | | 575,000 | | | | 574,457 | |
4.375%, 10/15/28(c) | | | USD | | | | 400,000 | | | | 402,476 | |
Citigroup, Inc. (United States) | | | | | | | | | | | | |
USD LIBOR3-Month | | | | | | | | | |
+6.37%, 8.89%, 10/30/40(b) | | | USD | | | | 2,075,000 | | | | 2,190,370 | |
HSBC Holdings PLC (United Kingdom) | | | | | | | | | | | | |
6.50%, 9/15/37 | | | USD | | | | 775,000 | | | | 879,234 | |
6.00%, 3/29/40 | | | GBP | | | | 1,675,000 | | | | 2,553,109 | |
JPMorgan Chase & Co. (United States)
4.25%, 10/1/27 | | | USD | | | | 2,350,000 | | | | 2,314,669 | |
Lloyds Banking Group PLC (United Kingdom) | | | | | | | | | | | | |
4.50%, 11/4/24 | | | USD | | | | 1,125,000 | | | | 1,086,246 | |
4.582%, 12/10/25 | | | USD | | | | 2,625,000 | | | | 2,486,229 | |
Royal Bank of Scotland Group PLC (United Kingdom)
6.00%, 12/19/23 | | | USD | | | | 2,925,000 | | | | 2,960,212 | |
Wells Fargo & Co. (United States)
4.30%, 7/22/27 | | | USD | | | | 2,250,000 | | | | 2,214,472 | |
| | | | | | | | | | | | |
| | | | | | | | | | | 32,173,571 | |
INDUSTRIALS: 34.3% | |
AT&T, Inc. (United States)
3.15%, 9/4/36 | | | EUR | | | | 4,100,000 | | | | 4,481,072 | |
Bayer AG (Germany)
3.75%, 7/1/74(b)(g) | | | EUR | | | | 3,500,000 | | | | 3,885,409 | |
Becton, Dickinson and Co. (United States)
2.894%, 6/6/22 | | | USD | | | | 1,700,000 | | | | 1,646,404 | |
BHP Billiton, Ltd. (Australia)
6.75%, 10/19/75(b)(c)(g) | | | USD | | | | 2,100,000 | | | | 2,184,000 | |
Cemex SAB de CV (Mexico)
7.75%, 4/16/26(c) | | | USD | | | | 4,200,000 | | | | 4,415,292 | |
Charter Communications, Inc. (United States) | | | | | | | | | | | | |
7.30%, 7/1/38 | | | USD | | | | 425,000 | | | | 461,160 | |
6.75%, 6/15/39 | | | USD | | | | 1,300,000 | | | | 1,322,260 | |
6.484%, 10/23/45 | | | USD | | | | 1,450,000 | | | | 1,496,535 | |
5.75%, 4/1/48 | | | USD | | | | 1,375,000 | | | | 1,289,127 | |
Comcast Corp. (United States)
3.969%, 11/1/47 | | | USD | | | | 550,000 | | | | 492,331 | |
Concho Resources, Inc. (United States) | | | | | | | | | | | | |
4.875%, 10/1/47 | | | USD | | | | 500,000 | | | | 476,086 | |
4.85%, 8/15/48 | | | USD | | | | 250,000 | | | | 239,532 | |
Cox Enterprises, Inc. (United States) | | | | | | | | | | | | |
4.80%, 2/1/35(c) | | | USD | | | | 350,000 | | | | 319,408 | |
8.375%, 3/1/39(c) | | | USD | | | | 1,575,000 | | | | 1,964,842 | |
CVS Health Corp. (United States) | | | | | | | | | | | | |
3.70%, 3/9/23 | | | USD | | | | 575,000 | | | | 568,812 | |
4.10%, 3/25/25 | | | USD | | | | 175,000 | | | | 173,464 | |
4.30%, 3/25/28 | | | USD | | | | 650,000 | | | | 636,472 | |
4.78%, 3/25/38 | | | USD | | | | 425,000 | | | | 407,703 | |
| | | | | | | | | | | | |
| | | |
| | | | | | PAR VALUE | | | VALUE | |
Dell Technologies, Inc. (United States)
5.45%, 6/15/23(c) | | | USD | | | | 775,000 | | | $ | 788,626 | |
DowDuPont, Inc. (United States)
5.55%, 11/30/48(c) | | | USD | | | | 1,075,000 | | | | 1,086,756 | |
Elanco Animal Health, Inc. (United States)
4.90%, 8/28/28(c) | | | USD | | | | 1,025,000 | | | | 1,043,627 | |
Ford Motor Credit Co. LLC (United States)(d) | | | | | | | | | | | | |
5.875%, 8/2/21 | | | USD | | | | 1,800,000 | | | | 1,845,951 | |
4.14%, 2/15/23 | | | USD | | | | 1,425,000 | | | | 1,354,401 | |
Grupo Televisa SAB (Mexico) | | | | | | | | | | | | |
8.50%, 3/11/32 | | | USD | | | | 1,264,000 | | | | 1,579,343 | |
6.125%, 1/31/46 | | | USD | | | | 475,000 | | | | 487,870 | |
HCA Holdings, Inc. (United States)
4.75%, 5/1/23 | | | USD | | | | 2,800,000 | | | | 2,758,000 | |
Imperial Brands PLC (United Kingdom) | | | | | | | | | | | | |
4.25%, 7/21/25(c) | | | USD | | | | 1,300,000 | | | | 1,279,224 | |
3.375%, 2/26/26 | | | EUR | | | | 1,375,000 | | | | 1,668,172 | |
Kinder Morgan, Inc. (United States)
6.95%, 1/15/38 | | | USD | | | | 3,850,000 | | | | 4,298,259 | |
LafargeHolcim, Ltd. (Switzerland) | | | | | | | | | | | | |
7.125%, 7/15/36 | | | USD | | | | 1,150,000 | | | | 1,357,365 | |
4.75%, 9/22/46(c) | | | USD | | | | 950,000 | | | | 826,092 | |
Macy’s, Inc. (United States) | |
6.70%, 9/15/28 | | | USD | | | | 50,000 | | | | 52,674 | |
6.90%, 4/1/29 | | | USD | | | | 75,000 | | | | 80,789 | |
6.70%, 7/15/34 | | | USD | | | | 425,000 | | | | 426,398 | |
Millicom International Cellular SA (Luxembourg)
5.125%, 1/15/28(c) | | | USD | | | | 2,525,000 | | | | 2,247,250 | |
Molex Electronic Technologies LLC(d) (United States)
2.878%, 4/15/20(c) | | | USD | | | | 731,000 | | | | 723,845 | |
MTN Group, Ltd. (South Africa)
4.755%, 11/11/24(c) | | | USD | | | | 1,125,000 | | | | 1,020,274 | |
Naspers, Ltd. (South Africa) | |
5.50%, 7/21/25(c) | | | USD | | | | 2,150,000 | | | | 2,164,426 | |
4.85%, 7/6/27(c) | | | USD | | | | 1,850,000 | | | | 1,771,849 | |
QVC, Inc.(d) (United States)
4.45%, 2/15/25 | | | USD | | | | 2,400,000 | | | | 2,212,653 | |
RELX PLC (United Kingdom) | | | | | | | | | | | | |
8.625%, 1/15/19 | | | USD | | | | 58,000 | | | | 58,100 | |
3.125%, 10/15/22 | | | USD | | | | 574,000 | | | | 563,566 | |
3.50%, 3/16/23 | | | USD | | | | 325,000 | | | | 322,405 | |
Telecom Italia SPA (Italy) | | | | | | | | | | | | |
7.175%, 6/18/19 | | | USD | | | | 200,000 | | | | 201,388 | |
6.375%, 6/24/19 | | | GBP | | | | 800,000 | | | | 1,036,682 | |
7.20%, 7/18/36 | | | USD | | | | 1,000,000 | | | | 955,000 | |
7.721%, 6/4/38 | | | USD | | | | 2,000,000 | | | | 1,986,260 | |
TransCanada Corp. (Canada) | | | | | | | | | | | | |
5.625%, 5/20/75(b)(g) | | | USD | | | | 1,800,000 | | | | 1,622,250 | |
5.30%, 3/15/77(b)(g) | | | USD | | | | 3,025,000 | | | | 2,610,953 | |
Twenty-First Century Fox, Inc. (United States) | | | | | | | | | | | | |
6.65%, 11/15/37 | | | USD | | | | 1,100,000 | | | | 1,449,912 | |
6.15%, 2/15/41 | | | USD | | | | 550,000 | | | | 683,800 | |
Ultrapar Participacoes SA (Brazil)
5.25%, 10/6/26(c) | | | USD | | | | 2,200,000 | | | | 2,136,772 | |
United Technologies Corp. (United States) | | | | | | | | | | | | |
3.35%, 8/16/21 | | | USD | | | | 175,000 | | | | 174,519 | |
3.65%, 8/16/23 | | | USD | | | | 625,000 | | | | 622,512 | |
Verizon Communications, Inc. (United States)
5.012%, 4/15/49 | | | USD | | | | 2,225,000 | | | | 2,220,033 | |
Xerox Corp. (United States)
4.50%, 5/15/21 | | | USD | | | | 3,500,000 | | | | 3,414,036 | |
| | | | | | | | | | | | |
| | | | | | | | | | | 77,591,941 | |
| | |
| PAGE 8§ DODGE & COX GLOBAL BOND FUND | | See accompanying Notes to Consolidated Financial Statements |
| | | | |
| CONSOLIDATED PORTFOLIO OF INVESTMENTS | | | December 31, 2018 | |
| | | | | | | | | | | | |
| DEBT SECURITIES (continued) | |
| | | |
| | | | | | PAR VALUE | | | VALUE | |
UTILITIES: 4.8% | |
Dominion Energy, Inc. (United States)
5.75%, 10/1/54(b)(g) | | | USD | | | | 3,025,000 | | | $ | 3,021,271 | |
Enel SPA (Italy)
3.375%, 11/24/81(b)(g) | | | EUR | | | | 3,750,000 | | | | 3,920,612 | |
The Southern Co. (United States)
5.50%, 3/15/57(b)(g) | | | USD | | | | 4,000,000 | | | | 3,841,710 | |
| | | | | | | | | | | | |
| | | | | | | | | | | 10,783,593 | |
| | | | | | | | | | | | |
| | | | | | | | | | | 120,549,105 | |
| | | | | | | | | | | | |
TOTAL DEBT SECURITIES
(Cost $227,221,197) | | | $ | 220,144,333 | |
|
| SHORT-TERM INVESTMENTS: 1.5% | |
| | |
| | | | PAR VALUE/ SHARES | | | VALUE | |
REPURCHASE AGREEMENT: 1.1% | |
Fixed Income Clearing Corporation(e)
1.60%, dated 12/31/18, due 1/2/19, maturity value $2,612,232 | | | USD | | | | 2,612,000 | | | | 2,612,000 | |
|
MONEY MARKET FUND: 0.4% | |
State Street Institutional U.S. Government Money Market Fund | | | USD | | | | 901,616 | | | | 901,616 | |
| | | | | | | | | | | | |
TOTAL SHORT-TERM INVESTMENTS
(Cost $3,513,616) | | | $ | 3,513,616 | |
| | | | | | | | | | | | |
TOTAL INVESTMENTS IN SECURITIES
(Cost $230,734,813) | | | | 98.9 | % | | $ | 223,657,949 | |
OTHER ASSETS LESS LIABILITIES | | | | 1.1 | % | | | 2,445,168 | |
| | | | | | | | | | | | |
| NET ASSETS | | | | 100.0 | % | | $ | 226,103,117 | |
| | | | | | | | | | | | |
| (b) | Hybrid security has characteristics of both a debt and equity security. |
| (c) | Security exempt from registration under Rule 144A of the Securities Act of 1933. The security may be resold in transactions exempt from registration, normally to qualified institutional buyers. |
| (d) | Subsidiary (see below) |
| (e) | Repurchase agreement is collateralized by U.S. Treasury Note 2.625%, 11/15/20. Total collateral value is $2,666,770. |
| (f) | Variable rate security: interest rate is determined by the interest rates of underlying pool of assets that collateralize the security. The interest rate of the security may change due to a change in the interest rates or the composition of underlying pool of assets. The interest rate shown is the rate as of period end. |
| (g) | Variable rate security:fixed-to-float security pays an initial fixed interest rate and will pay a floating interest rate established at a predetermined time in the future. The interest rate shown is the rate as of period end. |
| (h) | Dual currency bond. Issued in USD but pays in ARS at maturity. |
Debt securities are grouped by parent company unless otherwise noted. Actual securities may be issued by the listed parent company or one of its subsidiaries. In determining a parent company’s country designation, the Fund generally references the country of incorporation.
Debt securities with floating interest rates are linked to the referenced benchmark; the interest rate shown is the rate as of period end.
ARM: Adjustable Rate Mortgage
CMBS: Commercial Mortgage-Backed Security
CMO: Collateralized Mortgage Obligation
DUS: Delegated Underwriting and Servicing
GO: General Obligation
RB: Revenue Bond
REMIC: Real Estate Mortgage Investment Conduit
ARS: Argentine Peso
COP: Colombian Peso
EUR: Euro
GBP: British Pound
IDR: Indonesian Rupiah
INR: Indian Rupee
MXN: Mexican Peso
PLN: Polish Zloty
TRY: Turkish Lira
USD: United States Dollar
FUTURES CONTRACTS
| | | | | | | | | | | | | | | | |
| Description | | Number of
Contracts | | | Expiration
Date | | | Notional
Amount | | | Value /
Unrealized
Appreciation
(Depreciation) | |
Euro-Bobl Future—Short Position | | | 9 | | | | 3/7/19 | | | $ | (1,366,513 | ) | | $ | (426 | ) |
Euro-Bund Future—Short Position | | | 77 | | | | 3/7/19 | | | | (14,427,944 | ) | | | (50,729 | ) |
Euro-Buxl Future—Short Position | | | 14 | | | | 3/7/19 | | | | (2,897,234 | ) | | | (13,863 | ) |
Long-Term U.S. Treasury Bond—Short Position | | | 74 | | | | 3/20/19 | | | | (10,804,000 | ) | | | (496,375 | ) |
UK-Gilt Future—Short Position | | | 26 | | | | 3/27/19 | | | | (4,081,804 | ) | | | (7,687 | ) |
Ultra Long-Term U.S. Treasury Bond—Short Position | | | 34 | | | | 3/20/19 | | | | (5,462,312 | ) | | | (289,688 | ) |
| | | | | | | | | | | | | | | | |
| | | | | | | | | | | | | | $ | (858,768 | ) |
| | | | | | | | | | | | | | | | |
CENTRALLY CLEARED INTEREST RATE SWAPS
| | | | | | | | | | | | | | | | | | | | |
| | | | | | Contract Amount | | | | |
Notional
Amount | | Expiration
Date | | | Fixed
Rate | | | Value | | | Upfront
Payments (Receipts) | | | Unrealized
Appreciation/
(Depreciation) | |
Pay Fixed (Semi-Annually)/Receive USD LIBOR3-Month (Quarterly) | |
$1,450,000 | | | 3/20/49 | | | | 3.00 | % | | $ | (38,983 | ) | | $ | 8,680 | | | $ | (47,573 | ) |
CURRENCY FORWARD CONTRACTS
| | | | | | | | | | | | | | | | |
| | | | | | Contract Amount | | | | |
| Counterparty | | Settle Date | | | Receive
U.S. Dollar | | | Deliver
Foreign
Currency | | | Unrealized
Appreciation
(Depreciation) | |
Contracts to sell BRL: | |
Goldman Sachs | | | 8/13/19 | | | | 1,020,656 | | | | 4,039,756 | | | $ | (3,411 | ) |
Contracts to sell EUR: | |
Barclays | | | 1/9/19 | | | | 1,303,867 | | | | 1,100,000 | | | | 42,921 | |
Barclays | | | 2/13/19 | | | | 1,728,891 | | | | 1,500,000 | | | | 4,382 | |
Barclays | | | 1/30/19 | | | | 1,162,355 | | | | 1,010,000 | | | | 2,543 | |
Barclays | | | 4/24/19 | | | | 775,476 | | | | 675,000 | | | | (5,281 | ) |
Barclays | | | 4/24/19 | | | | 2,405,800 | | | | 2,100,000 | | | | (23,222 | ) |
Barclays | | | 4/24/19 | | | | 918,874 | | | | 800,000 | | | | (6,468 | ) |
Barclays | | | 4/24/19 | | | | 606,351 | | | | 525,000 | | | | (905 | ) |
Citibank | | | 2/13/19 | | | | 5,951,083 | | | | 5,150,000 | | | | 30,267 | |
Citibank | | | 2/13/19 | | | | 499,358 | | | | 425,000 | | | | 10,747 | |
Citibank | | | 2/13/19 | | | | 1,282,885 | | | | 1,100,000 | | | | 18,245 | |
Citibank | | | 4/24/19 | | | | 3,963,380 | | | | 3,400,000 | | | | 30,678 | |
Citibank | | | 4/24/19 | | | | 2,814,295 | | | | 2,450,000 | | | | (19,563 | ) |
Goldman Sachs | | | 2/13/19 | | | | 519,395 | | | | 450,000 | | | | 2,042 | |
Contracts to sell GBP: | |
Barclays | | | 3/13/19 | | | | 952,448 | | | | 725,000 | | | | 25,241 | |
Barclays | | | 4/24/19 | | | | 641,154 | | | | 500,000 | | | | 413 | |
Citibank | | | 4/24/19 | | | | 130,952 | | | | 100,000 | | | | 2,804 | |
Goldman Sachs | | | 4/24/19 | | | | 1,801,856 | | | | 1,400,000 | | | | 7,783 | |
| | | | | | | | | | | | | | | | |
Unrealized gain on currency forward contracts | | | | 178,066 | |
Unrealized loss on currency forward contracts | | | | (58,850 | ) |
| | | | | | | | | | | | | | | | |
Net unrealized gain on currency forward contracts | | | $ | 119,216 | |
| | | | | | | | | | | | | | | | |
The listed counterparty may be the parent company or one of its subsidiaries.
| | |
| See accompanying Notes to Consolidated Financial Statements | | DODGE & COX GLOBAL BOND FUND§PAGE 9 |
| | | | |
CONSOLIDATED
STATEMENT OF ASSETS AND LIABILITIES | |
| |
| | | December 31, 2018 | |
ASSETS: | | | | |
Investments in securities, at value (cost $230,734,813) | | $ | 223,657,949 | |
Unrealized appreciation on currency forward contracts | | | 178,066 | |
Cash | | | 100 | |
Cash denominated in foreign currency (cost $4,052) | | | 4,053 | |
Deposits with broker for futures contracts | | | 676,709 | |
Deposits with broker for swaps | | | 124,095 | |
Receivable for investments sold | | | 66,370 | |
Receivable for Fund shares sold | | | 847,878 | |
Dividends and interest receivable | | | 3,144,013 | |
Expense reimbursement receivable | | | 24,949 | |
Prepaid expenses and other assets | | | 14,069 | |
| | | | |
| | | 228,738,251 | |
| | | | |
LIABILITIES: | | | | |
Unrealized depreciation on currency forward contracts | | | 58,850 | |
Payable for variation margin for futures contracts | | | 49,383 | |
Payable for variation margin for swaps | | | 7,148 | |
Payable for investments purchased | | | 1,696,522 | |
Payable for Fund shares redeemed | | | 509,216 | |
Deferred foreign capital gains tax | | | 53,766 | |
Management fees payable | | | 94,692 | |
Accrued expenses | | | 165,557 | |
| | | | |
| | | 2,635,134 | |
| | | | |
NET ASSETS | | $ | 226,103,117 | |
| | | | |
NET ASSETS CONSIST OF: | | | | |
Paid in capital | | $ | 236,855,722 | |
Total accumulated loss | | | (10,752,605 | ) |
| | | | |
| | $ | 226,103,117 | |
| | | | |
Fund shares outstanding (par value $0.01 each, unlimited shares authorized) | | | 22,106,167 | |
Net asset value per share | | $ | 10.23 | |
| |
CONSOLIDATED STATEMENT OF OPERATIONS | | | | |
| |
| | | Year Ended
December 31, 2018 | |
INVESTMENT INCOME: | |
Dividends | | $ | 147,296 | |
Interest (net of foreign taxes of $76,844) | | | 8,994,224 | |
| | | | |
| | | 9,141,520 | |
| | | | |
EXPENSES: | |
Management fees | | | 991,535 | |
Custody and fund accounting fees | | | 37,261 | |
Transfer agent fees | | | 32,689 | |
Professional services | | | 276,097 | |
Shareholder reports | | | 29,294 | |
Registration fees | | | 100,972 | |
Trustees’ fees | | | 324,167 | |
Miscellaneous | | | 32,001 | |
| | | | |
Total expenses | | | 1,824,016 | |
| | | | |
Expenses reimbursed by investment manager | | | (931,608 | ) |
| | | | |
Net expenses | | | 892,408 | |
| | | | |
NET INVESTMENT INCOME | | | 8,249,112 | |
| | | | |
REALIZED AND UNREALIZED GAIN (LOSS): | |
Net realized gain (loss) | | | | |
Investments in securities | | | (686,931 | ) |
Futures contracts | | | 577,473 | |
Swaps | | | 536,002 | |
Currency forward contracts | | | 227,183 | |
Foreign currency transactions | | | (76,968 | ) |
Net change in unrealized appreciation/depreciation | | | | |
Investments in securities (net of increase in deferred foreign capital gains tax of $52,433) | | | (11,130,044 | ) |
Futures contracts | | | (981,586 | ) |
Swaps | | | 43,122 | |
Currency forward contracts | | | 192,875 | |
Foreign currency translation | | | (9,859 | ) |
| | | | |
Net realized and unrealized loss | | | (11,308,733 | ) |
| | | | |
NET CHANGE IN NET ASSETS
FROM OPERATIONS | | $ | (3,059,621 | ) |
| | | | |
| | | | | | | | |
CONSOLIDATED STATEMENT OF CHANGES IN NET ASSETS | |
| | |
| | | Year Ended December 31, 2018 | | | Year Ended
December 31, 2017 | |
OPERATIONS: | | | | | | | | |
Net investment income | | $ | 8,249,112 | | | $ | 4,556,109 | |
Net realized gain (loss) | | | 576,759 | | | | 690,867 | |
Net change in unrealized appreciation/depreciation | | | (11,885,492 | ) | | | 4,620,643 | |
| | | | | | | | |
| | | (3,059,621 | ) | | | 9,867,619 | |
| | | | | | | | |
| | |
DISTRIBUTIONS TO
SHAREHOLDERS: | | | | | | | | |
Total distributions | | | (10,969,606 | ) | | | (3,557,479 | )(a) |
| | |
FUND SHARE
TRANSACTIONS: | | | | | | | | |
Proceeds from sale of shares | | | 123,099,819 | | | | 49,240,188 | |
Reinvestment of distributions | | | 10,700,054 | | | | 3,475,556 | |
Cost of shares redeemed | | | (49,996,330 | ) | | | (12,459,063 | ) |
| | | | | | | | |
Net change from Fund share transactions | | | 83,803,543 | | | | 40,256,681 | |
| | | | | | | | |
Total change in net assets | | | 69,774,316 | | | | 46,566,821 | |
| | |
NET ASSETS: | | | | | | | | |
Beginning of year | | | 156,328,801 | | | | 109,761,980 | |
| | | | | | | | |
End of year | | $ | 226,103,117 | | | $ | 156,328,801 | (b) |
| | | | | | | | |
| | |
SHARE INFORMATION: | | | | | | | | |
Shares sold | | | 11,449,398 | | | | 4,519,727 | |
Distributions reinvested | | | 1,037,870 | | | | 317,453 | |
Shares redeemed | | | (4,697,860 | ) | | | (1,146,936 | ) |
| | | | | | | | |
Net change in shares outstanding | | | 7,789,408 | | | | 3,690,244 | |
| | | | | | | | |
| (a) | Prior year comparative amounts have been adjusted to reflect current presentation under new accounting standards. Prior year distributions consisted of $3,391,849 from net investment income and $165,630 from net realized gain. |
| (b) | Includes distributions in excess of net investment income of $240,339. |
| | |
| PAGE 10§ DODGE & COX GLOBAL BOND FUND | | See accompanying Notes to Consolidated Financial Statements |
NOTES TO CONSOLIDATED FINANCIAL STATEMENTS
NOTE 1—ORGANIZATION AND SIGNIFICANT ACCOUNTING POLICIES
Dodge & Cox Global Bond Fund (the “Fund”) is one of the series constituting the Dodge & Cox Funds (the “Trust” or the “Funds”). The Trust is organized as a Delaware statutory trust and is registered under the Investment Company Act of 1940, as amended, as anopen-end management investment company. The Fund1 seeks a high rate of total return consistent with long-term preservation of capital. Foreign investing, especially in developing countries, has special risks such as currency and market volatility and political and social instability. These and other risk considerations are discussed in the Fund’s Prospectus.
The Fund is an investment company and follows the accounting and reporting guidance issued in Topic 946 by the Financial Accounting Standards Board. The financial statements have been prepared in conformity with accounting principles generally accepted in the United States of America, which require the use of estimates and assumptions by management. Actual results may differ from those estimates. Significant accounting policies are as follows:
Security valuation The Fund’s net assets are normally valued as of the scheduled close of trading on the New York Stock Exchange (NYSE), generally 4 p.m. Eastern Time, each day that the NYSE is open for business.
Debt securities and derivatives traded over the counter are valued using prices received from independent pricing services which utilize dealer quotes, recent transaction data, pricing models, and other inputs to arrive at market-based valuations. Pricing models may consider quoted prices for similar securities, interest rates, cash flows (including prepayment speeds), and credit risk. Exchange-traded derivatives are valued at the settlement price determined by the relevant exchange. Other financial instruments for which market quotes are readily available are valued at market value. Short-term securities less than 60 days to maturity may be valued at amortized cost if amortized cost approximates current value. Mutual funds are valued at their respective net asset values. Security values are not discounted based on the size of the Fund’s position and may differ from the value a Fund receives upon sale of the securities.
Investments initially valued in currencies other than the U.S. dollar are converted to the U.S. dollar using prevailing exchange rates. Currency forward contracts are valued based on the prevailing forward exchange rates of the underlying currencies. As a result, the Fund’s net assets may be affected by changes in the value of currencies in relation to the U.S. dollar.
If market quotations are not readily available or if normal valuation procedures produce valuations that are deemed unreliable or inappropriate under the circumstances existing at the time, the investment will be valued at fair value as determined in good faith by
| 1 | | The Fund’s predecessor, Dodge & Cox Global Bond Fund, L.L.C. (the “Private Fund”), was organized on August 31, 2012 and commenced operations on December 5, 2012 as a private investment fund that reorganized into, and had the same investment manager as, the Fund. The Fund commenced operations on May 1, 2014, upon the transfer of assets from the Private Fund. This transaction was accomplished through a transfer of Private Fund net assets valued at $10,725,688 in exchange for 1,000,000 shares of the Fund. Immediately after the transfer, the shares of the Fund were distributed to the sole owner of the Private Fund and the investment manager of the Fund, Dodge & Cox, which became the initial shareholder of the Fund. |
or under the direction of the Fund’s Board of Trustees. The Board of Trustees has appointed Dodge & Cox, the Fund’s investment manager, to make fair value determinations in accordance with the Dodge & Cox Funds Valuation Policies (“Valuation Policies”), subject to Board oversight. Dodge & Cox has established a Pricing Committee that is comprised of representatives from Treasury, Legal, Compliance, and Operations. The Pricing Committee is responsible for implementing the Valuation Policies, including determining the fair value of securities and other investments when necessary. The Pricing Committee considers relevant indications of value that are reasonably available to it in determining the fair value assigned to a particular security, such as the value of similar financial instruments, trading volumes, contractual restrictions on disposition, related corporate actions, and changes in economic conditions. In doing so, the Pricing Committee employs various methods for calibrating fair valuation approaches, including a regular review of key inputs and assumptions, back-testing, and review of any related market activity.
Valuing securities through a fair value determination involves greater reliance on judgment than valuation of securities based on readily available market quotations. In some instances, lack of information and uncertainty as to the significance of information may lead to a conclusion that a prior valuation is the best indication of a security’s value. When fair value pricing is employed, the prices of securities used by the Fund to calculate its net asset value may differ from quoted or published prices for the same securities.
Security transactions, investment income, expenses, and distributions Security transactions are recorded on the trade date. Realized gains and losses on securities sold are determined on the basis of identified cost.
Interest income is recorded on the accrual basis. Interest income includes coupon interest, amortization of premium and accretion of discount on debt securities, gain/loss on paydowns, and inflation adjustments to the principal amount of inflation-indexed securities. The ability of the issuers of the debt securities held by the Fund to meet their obligations may be affected by economic developments in a specific industry, state, region, or country. Debt obligations may be placed on non-accrual status and related interest income may be reduced by ceasing current accruals and writing off interest receivables when the collection of all or a portion of interest has become doubtful. A debt obligation is removed from non-accrual status when the issuer resumes interest payments or when collectability of interest is reasonably assured. Dividend income is recorded on the ex-dividend date.
Expenses are recorded on the accrual basis. Some expenses of the Trust can be directly attributed to a specific series. Expenses which cannot be directly attributed are allocated among the Funds in the Trust using methodologies determined by the nature of the expense.
Distributions to shareholders are recorded on theex-dividend date.
Foreign taxes The Fund is subject to foreign taxes which may be imposed by certain countries in which the Fund invests. The Fund endeavors to record foreign taxes based on applicable foreign tax law. Withholding taxes are incurred on certain foreign receipts and are accrued at the time the associated interest income is recorded.
DODGE & COX GLOBAL BOND FUND§PAGE 11
NOTES TO CONSOLIDATED FINANCIAL STATEMENTS
Capital gains taxes are incurred upon disposition of certain foreign securities. Expected capital gains taxes on appreciated securities, if any, are accrued as unrealized losses and incurred capital gains taxes are reflected as realized losses upon the sale of the related security. Currency taxes may be incurred when the Fund purchases certain foreign currencies related to securities transactions and are recorded as realized losses on foreign currency transactions.
Repurchase agreements Repurchase agreements are transactions under which a Fund purchases a security from a dealer counterparty and agrees to resell the security to that counterparty on a specified future date at the same price, plus a specified interest rate. The Fund’s repurchase agreements are secured by U.S. government or agency securities. It is the Fund’s policy that its custodian take possession of the underlying collateral securities, the fair value of which exceeds the principal amount of the repurchase transaction, including accrued interest, at all times. In the event of default by the counterparty, the Fund has the contractual right to liquidate the securities and to apply the proceeds in satisfaction of the obligation.
Foreign currency translation The books and records of the Fund are maintained in U.S. dollars. Foreign currency amounts are translated into U.S. dollars at the prevailing exchange rates of such currencies against the U.S. dollar. The market value of investment securities and other assets and liabilities are translated at the exchange rate as of the valuation date. Purchases and sales of investment securities, income, and expenses are translated at the exchange rate prevailing on the transaction date.
Reported realized and unrealized gain (loss) on investments includes foreign currency gain (loss) related to investment transactions.
Reported realized and unrealized gain (loss) on foreign currency transactions and translation include the following: holding/disposing of foreign currency, the difference between the trade and settlement dates on securities transactions, the difference between the accrual and payment dates on interest, and currency losses on the purchase of foreign currency in certain countries that impose taxes on such transactions.
Consolidation The Fund may invest in certain securities through its wholly owned subsidiary, Dodge & Cox Global Bond Fund Cayman, Ltd. (the “Subsidiary”). The Subsidiary is a Cayman Islands exempted company and invests in certain securities consistent with the investment objective of the Fund. The Fund’s Consolidated Financial Statements, including the Consolidated Portfolio of Investments, consist of the holdings and accounts of the Fund and the Subsidiary. All intercompany transactions and balances have been eliminated. At December 31, 2018, the Subsidiary had net assets of $100, which represented less than 0.01% of the Fund’s consolidated net assets.
Indemnification Under the Trust’s organizational documents, its officers and trustees are indemnified against certain liabilities arising out of the performance of their duties to the Trust. In addition, in the normal course of business the Trust enters into contracts that provide general indemnities to other parties. The Trust’s maximum exposure under these arrangements is unknown as this would involve future claims that may be made against the Trust that have not yet occurred.
NOTE 2—VALUATION MEASUREMENTS
Various inputs are used in determining the value of the Fund’s investments. These inputs are summarized in the three broad levels listed below.
| § | | Level 1: Quoted prices in active markets for identical securities |
| § | | Level 2: Other significant observable inputs (including quoted prices for similar securities, market indices, interest rates, credit risk, forward exchange rates, etc.) |
| § | | Level 3: Significant unobservable inputs (including Fund management’s assumptions in determining the fair value of investments) |
The inputs or methodology used for valuing securities are not necessarily an indication of the risk associated with investing in those securities.
The following is a summary of the inputs used to value the Fund’s holdings at December 31, 2018:
| | | | | | | | |
| Classification | | LEVEL 1 (Quoted Prices) | | | LEVEL 2
(Other Significant
Observable Inputs) | |
Securities | | | | | | | | |
Debt Securities | | | | | | | | |
Government | | $ | — | | | $ | 45,155,127 | |
Government-Related | | | — | | | | 12,416,377 | |
Securitized | | | — | | | | 42,023,724 | |
Corporate | | | — | | | | 120,549,105 | |
Short-term Investments | | | | | | | | |
Repurchase Agreement | | | — | | | | 2,612,000 | |
Money Market Fund | | | 901,616 | | | | — | |
| | | | | | | | |
Total Securities | | $ | 901,616 | | | $ | 222,756,333 | |
| | | | | | | | |
| | |
Other Investments | | | | | | | | |
Futures Contracts | | | | | | | | |
Depreciation | | $ | (858,768 | ) | | $ | — | |
Swaps | | | | | | | | |
Depreciation | | | — | | | | (47,573 | ) |
Currency Forward Contracts | | | | | | | | |
Appreciation | | | — | | | | 178,066 | |
Depreciation | | | — | | | | (58,850 | ) |
| | | | | | | | | |
NOTE 3—DERIVATIVE INSTRUMENTS
The Fund entered into various currency or interest rate-related transactions involving derivative instruments, including currency forward contracts, futures contracts, and swaps, in connection with its investment strategy. The Fund may use derivatives to minimize the impact of losses to one or more of its investments (as a “hedging technique”) or to implement its investment strategy.
The Fund entered intoover-the-counter derivatives (each, an “OTC Derivative”), such as currency forward contracts. Each OTC Derivative is subject to a negotiated master agreement (based on a form published by the International Swaps and Derivatives Association (“ISDA”)) governing all OTC Derivatives between the Fund and the relevant dealer counterparty. The master agreements specify (i) events of default and other events permitting a party to terminate some or all of the OTC Derivatives thereunder and (ii) the process by which those OTC Derivatives will be valued for purposes of determining termination payments. If some or all of the OTC Derivatives under a master agreement
PAGE 12§ DODGE & COX GLOBAL BOND FUND
NOTES TO CONSOLIDATED FINANCIAL STATEMENTS
are terminated because of an event of default or similar event, the values of all terminated OTC Derivatives must be netted to determine a single payment owed by one party to the other. To the extent amounts owed to the Fund by its counterparties are not collateralized, the Fund is at risk of those counterparties’ non-performance. The Fund attempts to mitigate counterparty credit risk by entering into OTC Derivatives only with counterparties it believes to be of good credit quality, by exchanging collateral, and by monitoring the financial stability of those counterparties.
Futures contracts Futures contracts involve an obligation to purchase or sell (depending on whether the Fund has entered a long or short futures contract, respectively) an asset at a future date, at a price set at the time of the contract. Upon entering into a futures contract, the Fund is required to deposit an amount of cash or liquid assets (referred to as initial margin) in a segregated account with the clearing broker. Subsequent payments (referred to as variation margin) to and from the clearing broker are made on a daily basis based on changes in the market value of futures contracts. Futures contracts are traded publicly and their market value changes daily. Changes in the market value of open futures contracts are recorded as unrealized appreciation or depreciation in the Consolidated Statement of Operations. Realized gains and losses on futures contracts are recorded in the Consolidated Statement of Operations at the closing or expiration of the contracts. Cash deposited with a broker as initial margin is recorded in the Consolidated Statement of Assets and Liabilities. A receivable and/or payable to brokers for daily variation margin is also recorded in the Consolidated Statement of Assets and Liabilities.
Investments in futures contracts may include certain risks, which may be different from, and potentially greater than, those of the underlying securities. To the extent the Fund uses futures, it is exposed to additional volatility and potential losses resulting from leverage.
The Fund has maintained short Treasury futures contracts, short Euro Government Bond futures contracts, and short UK Gilt futures contracts to assist with the management of the portfolio’s interest rate exposure. During the year ended December 31, 2018, these futures contracts had total notional values ranging from 12% to 18% of net assets.
Interest rate swaps Interest rate swaps are agreements that obligate two parties to exchange a series of cash flows at specified payment dates calculated by reference to specified interest rates, such as an exchange of floating rate payments for fixed rate payments. Upon entering into a centrally cleared interest rate swap, the Fund is required to post an amount of cash or liquid assets (referred to as initial margin) in a segregated account with the clearing broker. Subsequent payments (referred to as variation margin) to and from the clearing broker are made on a daily basis based on changes in the market value of each interest rate swap. Changes in the market value of open interest rate swaps are recorded as unrealized appreciation or depreciation in the Consolidated Statement of Operations. Realized gains and losses on interest rate swaps are recorded in the Consolidated Statement of Operations, both upon the exchange of cash flows on each specified payment date and upon the closing or expiration of the swap. Cash deposited with the clearing broker as initial margin is recorded in the Consolidated Statement of Assets and Liabilities. A receivable and/or payable to brokers for daily variation margin is also recorded in the Consolidated Statement of Assets and Liabilities.
Investments in interest rate swaps may include certain risks including unfavorable changes in interest rates, or a default or failure by the clearing broker or clearinghouse.
The Fund has maintained interest rate swaps in connection with the management of the portfolio’s interest rate exposure. During the year ended December 31, 2018, these interest rate swaps had U.S. dollar notional values up to 6% of net assets.
Currency forward contracts A currency forward contract represents an obligation to purchase or sell a specific foreign currency at a future date at a price set at the time of the contract. The values of currency forward contracts are adjusted daily based on the prevailing forward exchange rates of the underlying currencies. Changes in the value of open contracts are recorded as unrealized appreciation or depreciation in the Consolidated Statement of Operations. When a currency forward contract is closed, the Fund records a realized gain or loss in the Consolidated Statement of Operations equal to the difference between the value at the time the contract was opened and the value at the time it was closed.
Losses from these transactions may arise from unfavorable changes in currency values or if a counterparty does not perform under a contract’s terms.
The Fund has maintained currency forward contracts to hedge direct and/or indirect foreign currency exposure to the Brazilian real, British pound, euro, Thai bhat, and Japanese yen. During the year ended December 31, 2018, these currency forward contracts had U.S. dollar total values ranging from 6% to 13% of net assets.
Additional derivative information For financial reporting purposes, the Fund does not offset OTC Derivative assets and liabilities that are subject to a master netting arrangement in the Consolidated Statement of Assets and Liabilities. OTC Derivatives are presented in the Consolidated Statement of Assets and Liabilities as unrealized appreciation/(depreciation) on currency forward contracts. Cash collateral pledged or received by the Fund for OTC Derivatives, if any, is reported gross in the Consolidated Statement of Assets and Liabilities as cash pledged/(received) as collateral for currency forward contracts. Derivative information by counterparty is presented in the Consolidated Portfolio of Investments.
The netting of assets and liabilities and the offsetting of collateral pledged or received are based on contractual netting/set-off provisions in the ISDA master agreement. The following table presents the Fund’s net exposure for OTC Derivatives that are subject to enforceable master netting arrangements as of December 31, 2018. The net amount represents the receivable from (payable to) the counterparty in the event of a default.
| | | | | | | | | | | | | | | | |
| Counterparty | | Gross
OTC Derivative Assets | | | Gross
OTC Derivative Liabilities | | | Cash Collateral Pledged / (Received) | | | Net Amount | |
Barclays | | $ | 75,500 | | | $ | (35,876 | ) | | $ | — | | | $ | 39,624 | |
Citibank | | | 92,741 | | | | (19,563 | ) | | | — | | | | 73,178 | |
Goldman Sachs | | | 9,825 | | | | (3,411 | ) | | | — | | | | 6,414 | |
| | | | | | | | | | | | | | | | |
Total | | $ | 178,066 | | | $ | (58,850 | ) | | $ | — | | | $ | 119,216 | |
| | | | | | | | | | | | | | | | |
| | | | | | | | | | | | | | | | | |
DODGE & COX GLOBAL BOND FUND§PAGE 13
NOTES TO CONSOLIDATED FINANCIAL STATEMENTS
NOTE 4—RELATED PARTY TRANSACTIONS
Management fees Under a written agreement approved by a unanimous vote of the Board of Trustees, the Fund pays a management fee monthly at an annual rate of 0.50% of the Fund’s average daily net assets to Dodge & Cox, investment manager of the Fund. Dodge & Cox has contractually agreed to reimburse the Fund for all ordinary expenses to the extent necessary to maintain the ratio of total operating expenses to average net assets (“net expense ratio”) at 0.45% through April 30, 2019. The term of the agreement is renewable annually thereafter unless terminated with 30 days’ written notice by either party prior to the end of the term.
Fund officers and trustees All officers and two of the trustees of the Trust are officers or employees of Dodge & Cox. The Trust pays a fee only to those trustees who are not affiliated with Dodge & Cox.
Share ownership At December 31, 2018, Dodge & Cox owned 7% of the Fund’s outstanding shares.
NOTE 5—INCOME TAX INFORMATION AND DISTRIBUTIONS TO SHAREHOLDERS
A provision for federal income taxes is not required since the Fund intends to continue to qualify as a regulated investment company under Subchapter M of the Internal Revenue Code and distribute all of its taxable income to shareholders. Distributions are determined in accordance with income tax regulations, and such amounts may differ from net investment income and realized gains for financial reporting purposes. The Fund may also designate a portion of the amount paid to redeeming shareholders as a distribution for tax purposes. Financial reporting records are adjusted for permanent book to tax differences at year end to reflect tax character. Book to tax differences are primarily due to differing treatments of wash sales, net short-term realized gain (loss), foreign currency realized gain (loss), straddles, derivatives, and distributions.
Distributions during the years noted below were characterized as follows for federal income tax purposes:
| | | | | | | | |
| | | Year Ended
December 31, 2018 | | | Year Ended
December 31, 2017 | |
Ordinary income | | $ | 9,758,236 | | | $ | 3,557,479 | |
| | ($ | 0.471 per share | ) | | ($ | 0.268 per share | ) |
Long-term capital gain | | $ | 1,211,370 | | | | — | |
| | ($ | 0.060 per share | ) | | | | |
At December 31, 2018, the tax basis components of distributable earnings were as follows:
| | | | |
Deferred loss(a) | | $ | (3,174,536 | ) |
At December 31, 2018, unrealized appreciation and depreciation for investments and derivatives based on cost for federal income tax purposes were as follows:
| | | | |
Tax cost | | $ | 230,383,311 | |
| | | | |
Unrealized appreciation | | | 2,005,845 | |
Unrealized depreciation | | | (9,518,332 | ) |
| | | | |
Net unrealized depreciation | | | (7,512,487 | ) |
| | | | | |
| (a) | Represents net realized specified loss and capital loss incurred between November 1, 2018 and December 31, 2018. As permitted by tax regulation, the Fund has elected to treat this loss as arising in 2019. |
Fund management has reviewed the tax positions for the open period (three years and four years, respectively, from filing the Fund’s federal and State tax returns) applicable to the Fund, and has determined that no provision for income tax is required in the Fund’s financial statements.
NOTE 6—LOAN FACILITIES
Pursuant to an exemptive order issued by the Securities and Exchange Commission (SEC), the Fund may participate in an interfund lending facility (Facility). The Facility allows the Fund to borrow money from or loan money to the Funds. Loans under the Facility are made for temporary or emergency purposes, such as to fund shareholder redemption requests. Interest on borrowings is the average of the current repurchase agreement rate and the bank loan rate. There was no activity in the Facility during the year.
All Funds in the Trust participate in a $500 million committed credit facility (Line of Credit) with State Street Bank and Trust Company, to be utilized for temporary or emergency purposes to fund shareholder redemptions or for other short-term liquidity purposes. The maximum amount available to the Fund is $250 million. Each Fund pays an annual commitment fee on itspro-rata portion of the Line of Credit. For the year ended December 31, 2018, the Fund’s commitment fee amounted to $1,221 and is reflected as a Miscellaneous Expense in the Consolidated Statement of Operations. Interest on borrowings is charged at the prevailing rate. There were no borrowings on the Line of Credit during the year.
NOTE 7—PURCHASES AND SALES OF INVESTMENTS
For the year ended December 31, 2018, purchases and sales of securities, other than short-term securities and U.S. government securities, aggregated $140,961,825 and $43,213,928, respectively. For the year ended December 31, 2018, purchases and sales of U.S. government securities aggregated $53,684,254 and $58,107,856, respectively.
NOTE 8—NEW ACCOUNTING GUIDANCE
In March 2017, the Financial Accounting Standards Board issued an update to amend the amortization period for certain purchased callable debt securities held at a premium. The amendments shorten the amortization period for premiums to the earliest call date, but do not require an accounting change for securities held at a discount. The amendments are effective for financial statements for fiscal years beginning after December 15, 2018, and interim periods within those fiscal years. Management is evaluating the impact, if any, of this guidance on the Fund’s financial statements and disclosures.
In August 2018, the Financial Accounting Standards Board issued Accounting Standards Update “Fair Value Measurement (Topic 820)” (ASU 2018-13) which modifies the disclosure requirements for fair value measurement by removing, modifying, or adding certain disclosures. The amendments are effective for annual periods beginning after December 15, 2019, and interim periods within those annual periods. The Fund is permitted to early adopt any removed or modified disclosures upon issuance of this update and delay adoption of the additional disclosures until their effective date. The Fund has early adopted the updated accounting standards on the Fund’s financial statements.
PAGE 14§ DODGE & COX GLOBAL BOND FUND
NOTES TO CONSOLIDATED FINANCIAL STATEMENTS
NOTE 9—SUBSEQUENT EVENTS
Fund management has determined that no material events or transactions occurred subsequent to December 31, 2018, and through the date of the Fund’s financial statements issuance, which require additional disclosure in the Fund’s financial statements.
DODGE & COX GLOBAL BOND FUND§PAGE 15
CONSOLIDATED FINANCIAL HIGHLIGHTS
| | | | | | | | | | | | | | | | | | | | |
SELECTED DATA AND RATIOS (for a share outstanding throughout each period) | | Year Ended December 31, | | | Period from
May 1, 2014
(commencement of
Fund operations) to December 31, 2014 | |
| | 2018 | | | 2017 | | | 2016 | | | 2015 | |
Net asset value, beginning of period | | | $10.92 | | | | $10.33 | | | | $9.67 | | | | $10.31 | | | | $10.73 | |
Income from investment operations: | | | | | | | | | | | | | | | | | | | | |
Net investment income | | | 0.40 | | | | 0.37 | | | | 0.30 | | | | 0.34 | | | | 0.16 | |
Net realized and unrealized gain (loss) | | | (0.56 | ) | | | 0.49 | | | | 0.54 | | | | (0.98 | ) | | | (0.44 | ) |
| | | | |
Total from investment operations | | | (0.16 | ) | | | 0.86 | | | | 0.84 | | | | (0.64 | ) | | | (0.28 | ) |
| | | | |
Distributions to shareholders from: | | | | | | | | | | | | | | | | | | | | |
Net investment income | | | (0.43 | ) | | | (0.26 | ) | | | (0.18 | ) | | | — | | | | (0.14 | ) |
Net realized gain | | | (0.10 | ) | | | (0.01 | ) | | | — | | | | — | | | | — | |
| | | | |
Total distributions | | | (0.53 | ) | | | (0.27 | ) | | | (0.18 | ) | | | — | | | | (0.14 | ) |
| | | | |
Net asset value, end of period | | | $10.23 | | | | $10.92 | | | | $10.33 | | | | $9.67 | | | | $10.31 | |
| | | | |
Total return | | | (1.45 | )% | | | 8.31 | % | | | 8.64 | % | | | (6.21 | )% | | | (2.59 | )% |
Ratios/supplemental data: | | | | | | | | | | | | | | | | | | | | |
Net assets, end of period (millions) | | | $226 | | | | $156 | | | | $110 | | | | $68 | | | | $65 | |
Ratio of expenses to average net assets | | | 0.45 | % | | | 0.49 | % | | | 0.60 | % | | | 0.60 | % | | | 0.60 | %(a) |
Ratio of expenses to average net assets, before reimbursement by investment manager | | | 0.92 | % | | | 1.06 | % | | | 1.33 | % | | | 1.41 | % | | | 2.18 | %(a) |
Ratio of net investment income to average net assets | | | 4.15 | % | | | 3.51 | % | | | 3.77 | % | | | 3.39 | % | | | 2.83 | %(a) |
Portfolio turnover rate | | | 55 | % | | | 46 | % | | | 73 | % | | | 55 | % | | | 36 | % |
See accompanying Notes to Consolidated Financial Statements
PAGE 16§ DODGE & COX GLOBAL BOND FUND
REPORT OF INDEPENDENT REGISTERED PUBLIC ACCOUNTING FIRM
To the Board of Trustees of the Dodge & Cox Funds and Shareholders of Dodge & Cox Global Bond Fund
Opinion on the Financial Statements
We have audited the accompanying consolidated statement of assets and liabilities, including the consolidated portfolio of investments, of Dodge & Cox Global Bond Fund and its subsidiary (one of the funds constituting Dodge & Cox Funds, referred to hereafter as the “Fund”) as of December 31, 2018, the related consolidated statement of operations for the year ended December 31, 2018, the consolidated statement of changes in net assets for each of the two years in the period ended December 31, 2018, including the related notes, and the financial highlights for each of the periods indicated therein (collectively referred to as the “consolidated financial statements”). In our opinion, the consolidated financial statements present fairly, in all material respects, the financial position of the Fund as of December 31, 2018, the results of its operations for the year then ended, the changes in its net assets for each of the two years in the period ended December 31, 2018 and the financial highlights for each of the periods indicated therein in conformity with accounting principles generally accepted in the United States of America.
Basis for Opinion
These consolidated financial statements are the responsibility of the Fund’s management. Our responsibility is to express an opinion on the Fund’s consolidated financial statements based on our audits. We are a public accounting firm registered with the Public Company Accounting Oversight Board (United States) (PCAOB) and are required to be independent with respect to the Fund in accordance with the U.S. federal securities laws and the applicable rules and regulations of the Securities and Exchange Commission and the PCAOB.
We conducted our audits of these consolidated financial statements in accordance with the standards of the PCAOB. Those standards require that we plan and perform the audit to obtain reasonable assurance about whether the consolidated financial statements are free of material misstatement, whether due to error or fraud.
Our audits included performing procedures to assess the risks of material misstatement of the consolidated financial statements, whether due to error or fraud, and performing procedures that respond to those risks. Such procedures included examining, on a test basis, evidence regarding the amounts and disclosures in the consolidated financial statements. Our audits also included evaluating the accounting principles used and significant estimates made by management, as well as evaluating the overall presentation of the consolidated financial statements. Our procedures included confirmation of securities owned as of December 31, 2018 by correspondence with the custodian, transfer agent and brokers; when replies were not received from brokers, we performed other auditing procedures. We believe that our audits provide a reasonable basis for our opinion.
PricewaterhouseCoopers LLP
San Francisco, California
February 15, 2019
We have served as the auditor of one or more investment companies in the Dodge & Cox Funds since 1931.
DODGE & COX GLOBAL BOND FUND§PAGE 17
SPECIAL 2018 TAX INFORMATION
(unaudited)
The following information is provided pursuant to provisions of the Internal Revenue Code:
The Fund designates $1,211,370 as long-term capital gain distributions in 2018.
BOARD APPROVAL OF FUNDS’ INVESTMENT
MANAGEMENT AGREEMENTS AND MANAGEMENT FEES
(unaudited)
The Board of Trustees is responsible for overseeing the performance of the Dodge & Cox Funds’ investment manager and determining whether to continue the Investment Management Agreements between the Funds and Dodge & Cox each year (the “Agreements”). At a meeting of the Board of Trustees of the Trust held on December 13, 2018, the Trustees, by a unanimous vote (including a separate vote of those Trustees who are not “interested persons” (as defined in the Investment Company Act of 1940) (the “Independent Trustees”)), approved the renewal of the Agreements for an additional one-year term through December 31, 2019 with respect to each Fund. During the course of the year, the Board received extensive information and materials relating to the investment management and administrative services provided by Dodge & Cox and the performance of each of the Funds.
INFORMATION RECEIVED
Over the past several years, the Board has requested, received, and discussed a number of special presentations on topics relevant to their annual consideration of the proposed renewal of the Funds’ Agreements. In addition to the foregoing and in advance of the meetings referred to below, the Board, including the Independent Trustees, requested, received, and reviewed materials relating to the Agreements and the services provided by Dodge & Cox. The Independent Trustees retained Broadridge to prepare an independent expense and performance summary for each Fund and comparable funds managed by other advisers identified by Broadridge. The Broadridge materials included information regarding advisory fee rates, expense ratios, and transfer agency, custodial, and distribution expenses, as well as performance comparisons to each Fund’s peer group and to a broad-based securities index or combination of indices. The Broadridge materials also included a comparison of expenses of various share classes offered by comparable funds. The materials reviewed by the Board contained information concerning, among other things, Dodge & Cox’s profitability, financial results and condition, advisory fee revenue, and separate account fee schedules. The Board additionally considered the Funds’ brokerage commissions, turnover rates, sales and redemption data, and the significant investment that Dodge & Cox makes in research used in managing the Funds. The Board received and reviewed memoranda and related materials addressing, among other things, Dodge & Cox’s services to the Funds; how Dodge & Cox Funds’ fees compare to fees of peer group funds; the different fees, services, costs, and risks associated with other accounts managed by Dodge & Cox as
compared to the Dodge & Cox Funds; and the ways in which the Funds realize economies of scale. Throughout the process of reviewing the services provided by Dodge & Cox and preparing for the meeting, the Independent Trustees found Dodge & Cox to be open, forthright, detailed, and very helpful in answering questions about all issues. The Board received copies of the Agreements and a memorandum from the independent legal counsel to the Independent Trustees discussing the factors generally regarded as appropriate to consider in evaluating advisory arrangements. The Trust’s Contract Review Committee, consisting solely of Independent Trustees, met with the independent legal counsel on November 8, 2018 and again on December 13, 2018 to discuss whether to renew the Agreements. The Board, including the Independent Trustees, subsequently concluded that the existing Agreements are fair and reasonable and voted to approve the Agreements. In considering the Agreements, the Board, including the Independent Trustees, did not identify any single factor or particular information as all-important or controlling. In reaching the decision to approve the Agreements, the Board considered several factors, discussed below, to be key factors and reached the conclusions described below.
NATURE, QUALITY, AND EXTENT OF THE SERVICES
The Board considered that Dodge & Cox provides a wide range of services to the Funds in addition to portfolio management, including regulatory compliance, trading desks, proxy voting, transfer agent and custodian oversight, administration, regulatory filings, tax compliance and filings, web site, and anti-money laundering. The extensive nature of services provided by Dodge & Cox has been documented in materials provided to the Board and in presentations made to the Board throughout the year. In particular, the Board considered the nature, quality, and extent of portfolio management, administrative, and shareholder services performed by Dodge & Cox. With regard to portfolio management services, the Board considered Dodge & Cox’s established long-term history of care and conscientiousness in the management of the Funds; its demonstrated consistency in investment approach and depth; the background and experience of the Dodge & Cox U.S. Equity Investment Committee, International Equity Investment Committee, Global Equity Investment Committee, U.S. Fixed Income Investment Committee, and Global Fixed Income Investment Committee, and research analysts responsible for managing the Funds; Dodge & Cox’s methods for assessing the regulatory and investment climate in various jurisdictions; its overall high level of attention to its core investment management function; and its commitment to the Funds and their shareholders. The Board noted Dodge & Cox’s long record of favorable press and industry coverage, as well as its positive compliance record, and its reputation as a trusted, shareholder-friendly mutual fund family.
In addition, the Board considered that Dodge & Cox manages approximately $215 billion in Fund assets with fewer professionals than most comparable funds, and that on average these professionals have more experience and longer tenure than investment professionals at comparable funds. The Board also noted that Dodge & Cox is an investment research-oriented firm
PAGE 18§ DODGE & COX GLOBAL BOND FUND
with no other business endeavors to distract management’s attention from its research efforts or to present material conflicts of interest with the operations of the Funds, that its investment professionals adhere to a consistent investment approach across the Funds, and that due to its careful and deliberate strategy with respect to new products, Dodge & Cox has had remarkable stability in its mutual fund product offerings over the course of the past 88 years and has the fewest funds of any of the 25 largest mutual fund families by assets. The Board further considered the “Gold” analyst rating awarded by Morningstar to all of the Funds (other than the Global Bond Fund, which has a “Bronze” rating). The Board concluded that it was satisfied with the nature, extent, and quality of investment management and other services provided to the Funds by Dodge & Cox.
INVESTMENT PERFORMANCE
The Board completed an intensive review and assessment of each Fund’s recent and long-term investment performance (including periods of outperformance and underperformance), as compared to relevant indices and the performance of such Fund’s peer group and broader Morningstar category. In assessing the performance of the Funds, the Board considered the Funds’ investment returns over various periods and the volatility thereof and concluded that the levels experienced were consistent with Dodge & Cox’s long-term approach and active investment style. The Board also compared the short- and long-term investment performance of the equity funds to value-oriented indices, in recognition of the significant performance divergence between value and growth stocks over the past several years. It was noted that equity performance has been consistent with the value oriented investment strategy employed by Dodge & Cox. The Board further noted that the equity funds have outperformed over their medium to long-term investment horizons as compared to their corresponding value equity indices.
The Board determined after extensive review and inquiry that Dodge & Cox’s historic, long-term, team-oriented, bottom-up investment approach remains consistent and that Dodge & Cox continues to be distinguished by its integrity, transparency, and independence. The Board considered that the performance of the Funds is the result of a value-oriented investment management process that emphasizes a long-term investment horizon, comprehensive independent research, a team approach, price discipline, low cost, and low portfolio turnover. The Board also considered that the investment performance delivered by Dodge & Cox to the Funds appeared to be consistent with the relevant performance delivered for other clients of Dodge & Cox. The Board concluded that Dodge & Cox has delivered favorable long-term performance for Fund investors consistent with the long-term investment strategies being pursued by the Funds.
COSTS AND ANCILLARY BENEFITS
Costs of Services to Funds: Fees and Expenses The Board considered each Fund’s management fee rate and net expense ratio relative to (1) a broad category of other mutual funds with similar portfolio characteristics and share class and expense structures and
(2) a much smaller group of peers selected by Broadridge based on investment style, share class characteristics, and asset levels. The Board also considered the management fees charged by Dodge & Cox to other clients. In particular, the Board considered that the Funds continue to be below their peer group median in net expense ratios and that many media and industry reports specifically comment on the low cost of the Funds, which have been a defining characteristic of the Funds for many years. The Board also evaluated the operating structures of the Funds and Dodge & Cox, noting that the Funds do not charge front-end sales commissions or distribution fees, and Dodge & Cox bears, among other things, the significant cost of third party research, reimbursement for shareholder recordkeeping and administrative costs to third-party retirement plan administrators, and administrative and office overhead.
The Board noted that the Broadridge report shows that the net expense ratio of every Dodge & Cox Fund is in the least expensive quartile compared to its broad Morningstar category. The Board noted the Funds’ unusual single-share-class structure and reviewed Broadridge data (including asset-weighted average expense ratios) showing that most of the peer group funds offer several different classes of shares, with different expense ratios, to different categories of investors, and that the Broadridge expense comparisons described above generally compare the net expense ratio of each Dodge & Cox Fund’s single share class to one of the least expensive share classes of the peer fund, even though those share classes are often not available to retail investors. The Board determined that the Funds provide access for small investors to high quality investment management at a relatively low cost. The Board also considered that the Funds are priced to scale, i.e., management fee rates begin at relatively low levels. Even without breakpoints, the Funds’ management fee rates are lower than those of many peer funds whose fee schedules include breakpoints. With respect to non-U.S. funds sponsored and managed by Dodge & Cox that are comparable to the Funds in many respects, the Board noted that the fee rates charged by Dodge & Cox are the same as or higher than the fee rates charged to the Funds.
The Board reviewed information regarding the fee rates Dodge & Cox charges to separate accounts that have investment programs similar to those of the Funds, including instances where separate account fees are lower than Fund fees. The Board considered the significant differences in the nature and scope of services Dodge & Cox provides to the Funds as compared to other client accounts, as well as material differences in regulatory, litigation, and other risks as between Dodge & Cox Funds and other types of clients. The Board noted that different markets exist for mutual fund and institutional separate account management services and that a comparison of Fund fee rates and separate account fee rates must consider the fact that separate account clients bear additional costs and responsibilities that are included in the cost of a Fund. The Board further noted that many sophisticated institutional investors in the Funds that are eligible to open separate accounts at Dodge & Cox have decided for various reasons to invest in the Funds. After consideration of these matters, the Board concluded that the overall costs incurred by the Funds for the services they receive (including the management fee paid to Dodge & Cox) are reasonable and that the fees are acceptable based upon the qualifications, experience,
DODGE & COX GLOBAL BOND FUND§PAGE 19
reputation, and performance of Dodge & Cox and the low overall expense ratios of the Funds.
Profitability and Costs of Services to Dodge & Cox; “Fall-out” Benefits The Board reviewed reports of Dodge & Cox’s financial position, profitability, and estimated overall value and considered Dodge & Cox’s overall profitability within its context as a private, employee-owned S-Corporation and relative to the favorable services provided. The Board noted in particular that Dodge & Cox’s profits are not generated by high fee rates, but reflect a very streamlined, efficient, and focused business approach toward investment management.
The Board recognized the importance of Dodge & Cox’s profitability—which is derived solely from management fees and does not include other business ventures—to maintain its independence, stability, company culture and ethics, and management continuity. The Board also considered that the compensation/profit structure at Dodge & Cox includes a return on shareholder employees’ investment in the firm, which is vital for remaining independent and facilitating retention of management and investment professionals. The Board also considered that in January 2015, Dodge & Cox closed the International Stock Fund to new investors to proactively manage the growth of the Fund. The Stock Fund and Balanced Fund were similarly closed to new investors during periods of significant growth in the past. While these actions are intended to benefit existing Fund shareholders, the effect is to reduce potential revenues to Dodge & Cox from new shareholders.
The Board also considered potential “fall-out” benefits (including the receipt of research from unaffiliated brokers and reputational benefits to non-U.S. funds sponsored and managed by Dodge & Cox) that Dodge & Cox might receive as a result of its association with the Funds and determined that they are acceptable. The Board also noted that Dodge & Cox continues to invest substantial sums in its business in order to provide enhanced services, systems, and research capabilities, all of which benefit the Funds. The Board concluded that Dodge & Cox’s profitability is the keystone of its independence, stability, and long-term investment performance and that the profitability of Dodge & Cox’s relationship with the Funds (including fall-out benefits) is fair and reasonable.
ECONOMIES OF SCALE
The Board considered whether there have been economies of scale with respect to the management of each Fund, whether the Funds have appropriately benefited from any economies of scale, and whether the management fee rate is reasonable in relation to the level of Fund assets and any economies of scale that may exist. In the Board’s view, any consideration of economies of scale must take account of the Funds’ low fee and expense structure and the fact that the Dodge & Cox Funds build economies of scale into their fee structures by charging low fees from a fund’s inception and keeping overall expenses down as a Fund grows, as compared to other fund complexes that employ fee “breakpoints” only after a fund reaches a certain scale. An assessment of economies of scale must also take into account that Dodge & Cox invests significant
time and resources in each new Fund for months (and sometimes years) prior to launch; in addition, in a Fund’s early periods of operations, expenses are capped, which means that Dodge & Cox subsidizes the operations of a new Fund for a period of time until it reaches scale. The Board also observed that, while total Fund assets have grown significantly over the long term, this growth has not been continuous or evenly distributed across all of the Funds (for example, the total assets of the Balanced Fund have actually declined over the past ten years). In addition, the Board noted that Dodge & Cox has shared the benefits of economies of scale with the Funds by adding and enhancing services to the Funds over time, and that Dodge & Cox’s internal costs of providing investment management, technology, administrative, legal, and compliance services to the Funds continue to increase. For example, Dodge & Cox has increased its global research staff and investment resources over the years to add important new capabilities for the benefit of Fund shareholders and to address the increased complexity of investing globally.
In addition, Dodge & Cox has made substantial expenditures in other staff, technology, and infrastructure to enable it to integrate credit and equity analyses and to implement its strategy in a more effective and secure manner. Over the last ten years, Dodge & Cox has increased its spending on research, investment management, client servicing, cybersecurity, technology, third party research, data services, and computer systems for trading, operations, compliance, accounting, and communications at a rate that has significantly outpaced the Funds’ growth rate during the same period. The Board also observed that, even without fee breakpoints, the Funds are competitively priced in a very competitive market and that having a low fee from inception is better for shareholders than starting with a higher fee and adding breakpoints. The Board also noted that there are certain diseconomies of scale associated with managing large funds, insofar as certain of the costs and risks associated with portfolio management increase disproportionately as assets grow. The Board concluded that the current Dodge & Cox fee structure is fair and reasonable and adequately shares economies of scale that may exist.
CONCLUSION
Based on their evaluation of all material factors and assisted by the advice of independent legal counsel to the Independent Trustees, the Board, including the Independent Trustees, concluded that the advisory fee structure was fair and reasonable, that each Fund was paying a competitive fee for the services provided, that Dodge & Cox’s services have provided value for Fund shareholders over the long term, and that approval of the Agreements was in the best interests of each Fund and its shareholders.
PAGE 20§ DODGE & COX GLOBAL BOND FUND
FUND HOLDINGS
The Fund provides a complete list of its holdings four times each fiscal year, as of the end of each quarter. The Fund files the lists with the Securities and Exchange Commission (SEC) onForm N-CSR (second and fourth quarters) and Form N-Q (first and third quarters). Shareholders may view the Fund’s FormsN-CSR and N-Q on the SEC’s website at sec.gov. Forms N-CSR and N-Q may also be reviewed and copied at the SEC’s Public Reference Room in Washington, DC. Information regarding the operations of the Public Reference Room may be obtained by calling800-SEC-0330. A list of the Fund’s quarter-end holdings is also available at dodgeandcox.com on or about 15 days following each quarter end and remains available on the web site until the list is updated in the subsequent quarter.
PROXY VOTING
For a free copy of the Fund’s proxy voting policies and procedures, please call 800-621-3979, visit the Fund’s website at www.dodgeandcox.com, or visit the SEC’s website at sec.gov. Information regarding how the Fund voted proxies relating to portfolio securities during the most recent 12-month period ending June 30 is also available at dodgeandcox.com or at sec.gov.
HOUSEHOLD MAILINGS
The Fund routinely mails shareholder reports and summary prospectuses to shareholders and, on occasion, proxy statements. In order to reduce the volume of mail, when possible, only one copy of these documents will be sent to shareholders who are part of the same family and share the same residential address.
If you have a direct account with the Funds and you do not want the mailing of shareholder reports and summary prospectuses combined with other members in your household, contact the Funds at 800-621-3979. Your request will be implemented within 30 days.
DODGE & COX GLOBAL BOND FUND§PAGE 21
[THIS PAGE INTENTIONALLY LEFT BLANK]
PAGE 22§ DODGE & COX GLOBAL BOND FUND
DODGE & COX FUNDS—EXECUTIVE OFFICER & TRUSTEE INFORMATION
| | | | | | |
| | | | |
Name (Age) and
Address* | | Position with Trust (Year of Election or
Appointment)** | | Principal Occupation During Past Five Years** | | Other Directorships of Public Companies Held
by Trustees |
| |
| INTERESTED TRUSTEES AND EXECUTIVE OFFICERS |
| Charles F. Pohl (60) | | Chairman and Trustee (since 2014) | | Chairman and Director of Dodge & Cox; Chief Investment Officer and member of U.S. Equity Investment Committee (USEIC), Global Equity Investment Committee (GEIC), and International Equity Investment Committee (IEIC) | | — |
| Dana M. Emery (57) | | President (since 2014) and Trustee (since 1993) | | Chief Executive Officer, President, and Director of Dodge & Cox;Co-Director of Fixed Income and member of U.S. Fixed Income Investment Committee (USFIIC) and Global Fixed Income Investment Committee (GFIIC) | | — |
| Diana S. Strandberg (59) | | Senior Vice President (since 2006) | | Senior Vice President and Director of Dodge & Cox; Director of International Equity and member of USEIC, GEIC, IEIC, and GFIIC | | — |
Roberta R.W. Kameda (58) | | Chief Legal Officer (since 2019) and Secretary (since 2017) | | Vice President, General Counsel, and Secretary (since 2017) of Dodge & Cox | | — |
| David H. Longhurst (61) | | Treasurer (since 2006) | | Vice President and Assistant Treasurer of Dodge & Cox | | — |
| Katherine M. Primas (44) | | Chief Compliance Officer (since 2010) | | Vice President and Chief Compliance Officer of Dodge & Cox | | — |
| |
| INDEPENDENT TRUSTEES |
| Caroline M. Hoxby (52) | | Trustee (since 2017) | | Professor of Economics, Stanford University; Director of the Economics of Education Program, National Bureau of Economic Research; Senior Fellow, Hoover Institution and Stanford Institute for Economic Policy Research | | — |
| Thomas A. Larsen (69) | | Trustee (since 2002) | | Senior Counsel of Arnold & Porter (law firm) (2013-2018); Partner of Arnold & Porter (until 2012); Director of Howard, Rice, Nemerovski, Canady, Falk & Rabkin (1977-2011) | | — |
| Ann Mather (58) | | Trustee (since 2011) | | CFO, Pixar Animation Studios (1999-2004) | | Director, Alphabet Inc. (internet information services) (since 2005); Director, Glu Mobile, Inc. (multimedia software) (since 2004); Director, Netflix, Inc. (internet television) (since 2010); Director, Arista Networks (cloud networking) (since 2013); Director, Shutterfly, Inc. (internet photography services/publishing) (since 2013) |
| Robert B. Morris III (66) | | Trustee (since 2011) | | Advisory Director, The Presidio Group (2005-2016); Partner and Managing Director—Global Investment Research at Goldman Sachs (until 2001) | | — |
| Gary Roughead (67) | | Trustee (since 2013) | | Robert and Marion Oster Distinguished Military Fellow, Hoover Institution (since 2012); Admiral, United States Navy (Ret.); U.S. Navy Chief of Naval Operations (2008-2011) | | Director, Northrop Grumman Corp. (global security) (since 2012); Director, Maersk Line, Limited (shipping and transportation) (since 2016) |
| Mark E. Smith (67) | | Trustee (since 2014) | | Executive Vice President, Managing Director—Fixed Income at Loomis Sayles & Company, L.P. (2003-2011) | | — |
| John B. Taylor (72) | | Trustee (since 2005) (and 1995-2001) | | Professor of Economics, Stanford University (since 1984); Senior Fellow, Hoover Institution (since 1996); Under Secretary for International Affairs, United States Treasury (2001-2005) | | — |
| * | | The address for each Officer and Trustee is 555 California Street, 40th Floor, San Francisco, California 94104. Each Officer and Trustee oversees all six series in the Dodge & Cox Funds complex and serves for an indefinite term. |
| ** | | Information as of February 14, 2019. |
Additional information about the Trust’s Trustees and Officers is available in the Trust’s Statement of Additional Information (SAI). You can get a free copy of the SAI by visiting the Funds’ website at dodgeandcox.com or calling
800-621-3979.
DODGE & COX GLOBAL BOND FUND§PAGE 23
dodgeandcox.com
For Fund literature, transactions, and account
information, please visit the Funds’ website.
or write or call:
DODGE & COX FUNDS
c/o DST Asset Manager Solutions, Inc.
P.O. Box 219502
Kansas City, Missouri 64121-9502
(800) 621-3979
INVESTMENT MANAGER
Dodge & Cox
555 California Street, 40th Floor
San Francisco, California 94104
(415) 981-1710
This report is submitted for the general information of the shareholders of the Fund. The report is not authorized for distribution to prospective investors in the Fund unless it is accompanied by a current prospectus.
This report reflects our views, opinions, and portfolio holdings as of December 31, 2018, the end of the reporting period. Any such views are subject to change at any time based upon market or other conditions and Dodge & Cox disclaims any responsibility to update such views. These views may not be relied on as investment advice and, because investment decisions for a Dodge & Cox Fund are based on numerous factors, may not be relied on as an indication of trading intent on behalf of any Dodge & Cox Fund.
ITEM 2. CODE OF ETHICS.
A code of ethics, as defined in Item 2 of FormN-CSR, adopted by the registrant and applicable to the registrant’s principal executive officer and principal financial officer was in effect during the entire period covered by this report. A copy of the code of ethics as revised May 1, 2014 is filed as an exhibit to this FormN-CSR. No substantive amendments were approved or waivers were granted to this code of ethics during the period covered by this report.
ITEM 3. AUDIT COMMITTEE FINANCIAL EXPERT.
The Board of Trustees of the registrant has determined that Ann Mather, Robert B. Morris III and Mark E. Smith, members of the registrant’s Audit and Compliance Committee, are each an “audit committee financial expert” and are “independent”, as defined in Item 3 of FormN-CSR.
ITEM 4. PRINCIPAL ACCOUNTANT FEES AND SERVICES.
(a)– (d) Aggregate fees billed to the registrant for the fiscal years ended December 31, 2018 and December 31, 2017 for professional services rendered by the registrant’s principal accountant were as follows:
| | | | | | | | |
| | | 2018 | | | 2017 | |
(a) Audit Fees | | $ | 369,500 | | | $ | 353,000 | |
(b) Audit-Related Fees | | | — | | | | — | |
(c) Tax Fees | | | 232,500 | | | | 237,600 | |
(d) All Other Fees | | | — | | | | — | |
Audit fees include amounts related to the audit of the registrant’s annual financial statements and services normally provided by the accountant in connection with statutory and regulatory filings. Tax fees include amounts related to tax advice and tax return preparation, compliance, and reviews.
(e) (1) The registrant’s Audit and Compliance Committee has adopted policies and procedures (“Policies”) which require the registrant’s Audit and Compliance Committee topre-approve all audit andnon-audit services provided by the principal accountant to the registrant. The policies also require the Audit and Compliance Committee topre-approve any engagement of the principal accountant to providenon-audit services to the registrant’s investment adviser, if the services directly impact the registrant’s operations and financial reporting. The Policies do not apply in the case of audit services that the principal accountant provides to the registrant’s adviser. If a service (other than the engagement of the principal accountant to audit the registrant’s financial statements) is required to bepre-approved under the Policies between regularly scheduled Audit and Compliance Committee meetings,pre-approval may be authorized by a designated Audit and Compliance Committee member with ratification at the next scheduled Audit and Compliance Committee meeting.
(e) (2) No services included in (b) - (d) above were approved pursuant to paragraph (c)(7)(i)(C) of Rule2-01 of RegulationS-X.
(f) Less than 50% of the hours expended on the principal accountant’s engagement to audit the registrant’s financial statements for the most recent fiscal year were attributed to work performed by persons other than the principal accountant’s full-time, permanent employees.
(g) For the fiscal years ended December 31, 2018 and December 31, 2017, the aggregate fees billed by the registrant’s principal accountant fornon-audit services rendered to the registrant, fornon-audit services rendered to the registrant’s investment adviser, and fornon-audit services rendered to entities controlled by the adviser were $675,635 and $700,700, respectively.
(h) Allnon-audit services described under (g) above that were notpre-approved by the registrant’s Audit and Compliance Committee were considered by the registrant’s Audit and Compliance Committee and found to be compatible with maintaining the principal accountant’s independence.
ITEM 5. AUDIT COMMITTEE OF LISTED REGISTRANTS.
Not applicable.
ITEM 6. SCHEDULE OF INVESTMENTS.
Not applicable. The complete schedule of investments is included in Item 1 of this FormN-CSR.
ITEM 7. DISCLOSURE OF PROXY VOTING POLICIES AND PROCEDURES FORCLOSED-END MANAGEMENT INVESTMENT COMPANIES.
Not applicable.
ITEM 8. PORTFOLIO MANAGERS OFCLOSED-END MANAGEMENT INVESTMENT COMPANIES.
Not applicable.
ITEM 9. PURCHASES OF EQUITY SECURITIES BYCLOSED-END MANAGEMENT INVESTMENT COMPANY AND AFFILIATED PURCHASERS.
Not applicable.
ITEM 10. SUBMISSION OF MATTERS TO A VOTE OF SECURITY HOLDERS.
The registrant has adopted the following procedures by which shareholders may recommend nominees to the registrant’s Board of Trustees.
1. The shareholder must submit any such recommendation in writing to the registrant to the attention of the Secretary at the address of the principal executive offices of the registrant. The shareholder’s recommendation is then considered by the registrant’s Nominating Committee.
2. The shareholder recommendation must include:
(i) A statement in writing setting forth (a) the name, date of birth, business address and residence address of the person recommended by the shareholder (the “candidate”); and (b) whether the recommending shareholder believes that the candidate is or will be an “interested person” of the registrant (as defined in the Investment Company Act of 1940) and, if not an “interested person,” information regarding the candidate that will be sufficient for the registrant to make such determination and, if applicable, similar information regarding whether the candidate would satisfy the standards for independence of a Board member under listing standards of the New York Stock Exchange or other applicable securities exchange.
(ii) The written and manually signed consent of the candidate to be named as a nominee and to serve as a Trustee if elected;
(iii) The recommending shareholder’s name as it appears on the registrant’s books and the number of all shares of the registrant owned beneficially and of record by the recommending shareholder (as evidenced to the Nominating Committee’s satisfaction by a recent brokerage or account statement); and
(iv) A description of all arrangements or understandings between the recommending shareholder and the candidate and any other person or persons (including their names) pursuant to which the recommendation is being made by the recommending shareholder.
In addition, the Nominating Committee may require the candidate to furnish such other information as it may reasonably require or deem necessary to determine the eligibility of such candidate to serve on the Board or to satisfy applicable law and information regarding the candidate that would be required to be disclosed if the candidate were a nominee in a proxy statement or other filing required to be made in connection with solicitation of proxies for election of Trustees.
ITEM 11. CONTROLS AND PROCEDURES.
(a) An evaluation was performed within 90 days of the filing of this report, under the supervision and with the participation of the registrant’s management, including the principal executive officer and principal financial officer, of the effectiveness of the design and operation of the registrant’s disclosure controls and procedures. Based on that evaluation, the principal executive officer and principal financial officer concluded that the registrant’s disclosure controls and procedures were effective.
(b) The registrant’s principal executive officer and principal financial officer are aware of no changes in the registrant’s internal control over financial reporting that occurred during the second fiscal quarter of the period covered by this report that has materially affected, or is reasonably likely to materially affect, the registrant’s internal control over financial reporting.
ITEM 12. EXHIBITS.
(a) (1) The registrant’s code of ethics pursuant to Item 2 of FormN-CSR is attached. (EX.99A)
(a) (2) Certifications pursuant to Section 302 of the Sarbanes-Oxley Act of 2002 are attached. (EX.99B)
(a) (3) Not applicable.
(b) Certifications pursuant to Section 906 of the Sarbanes-Oxley Act of 2002 are attached. (EX.99C)
SIGNATURES
Pursuant to the requirements of the Securities Exchange Act of 1934 and the Investment Company Act of 1940, the registrant has duly caused this report to be signed on its behalf by the undersigned, thereunto duly authorized.
| | |
| Dodge & Cox Funds |
| |
| By | | /s/ Charles F. Pohl |
| | Charles F. Pohl |
| | Chairman – Principal Executive Officer |
| |
| Date | | February 27, 2019 |
Pursuant to the requirements of the Securities Exchange Act of 1934 and the Investment Company Act of 1940, this report has been signed below by the following persons on behalf of the registrant and in the capacities and on the dates indicated.
| | |
| Dodge & Cox Funds |
| |
| By | | /s/ Charles F. Pohl |
| | Charles F. Pohl |
| | Chairman – Principal Executive Officer |
| |
| By | | /s/ David H. Longhurst |
| | David H. Longhurst |
| | Treasurer – Principal Financial Officer |
| |
| Date | | February 27, 2019 |