UNITED STATES
SECURITIES AND EXCHANGE COMMISSION
Washington, D.C. 20549
FORM N-CSR
CERTIFIED SHAREHOLDER REPORT OF REGISTERED
MANAGEMENT INVESTMENT COMPANIES
Investment Company Act file number 811-173
DODGE & COX FUNDS
(Exact name of registrant as specified in charter)
555 California Street, 40th Floor
San Francisco, CA 94104
(Address of principal executive offices) (Zip code)
Thomas M. Mistele, Esq.
555 California Street, 40th Floor
San Francisco, CA 94104
(Name and address of agent for service)
Registrant’s telephone number, including area code: 415-981-1710
Date of fiscal year end: DECEMBER 31, 2016
Date of reporting period: DECEMBER 31, 2016
Form N-CSR is to be used by management investment companies to file reports with the Commission not later than 10 days after the transmission to stockholders of any report that is required to be transmitted to stockholders under Rule 30e-1 under the Investment Company Act of 1940 (17 CFR 270.30e-1). The Commission may use the information provided on Form N-CSR in its regulatory, disclosure review, inspection, and policymaking roles.
A registrant is required to disclose the information specified by Form N-CSR, and the Commission will make this information public. A registrant is not required to respond to the collection of information contained in Form N-CSR unless the Form displays a currently valid Office of Management and Budget (“OMB”) control number. Please direct comments concerning the accuracy of the information collection burden estimate and any suggestions for reducing the burden to Secretary, Securities and Exchange Commission, 450 Fifth Street, NW, Washington, DC 20549-0609. The OMB has reviewed this collection of information under the clearance requirements of 44 U.S.C. ss. 3507.
ITEM 1. REPORTS TO STOCKHOLDERS.
The following are the December 31, 2016 annual reports for the Dodge & Cox Funds, a Delaware statutory trust, consisting of six series: Dodge & Cox Stock Fund, Dodge & Cox Global Stock Fund, Dodge & Cox International Stock Fund, Dodge & Cox Balanced Fund, Dodge & Cox Income Fund, and Dodge & Cox Global Bond Fund. The reports of each series were transmitted to their respective shareholders on February 15, 2017.

DODGE & COX FUNDS®
Annual Report
December 31, 2016
Stock Fund
ESTABLISHED 1965
TICKER: DODGX
12/16 SF AR  Printed on recycled paper
TO OUR SHAREHOLDERS
The Dodge & Cox Stock Fund had a total return of 21.3% for the year ended December 31, 2016, compared to a return of 12.0% for the S&P 500 Index.
AN EXTRAORDINARY YEAR
The Fund’s strong absolute and relative performance in 2016 was achieved with largely the same portfolio that produced weak results in 2015. Many of the biggest contributors in 2016 were the largest detractors in 2015. The past year’s performance also improved the Fund’s longer-term relative results. The Fund’s annualized total return for the past five years was 17.0% versus 14.7% for the S&P 500.
We would like to express sincere appreciation to our fellow shareholders for your patience and confidence in Dodge & Cox. These results serve as a reminder that a single quarter or year is too short an interval over which to judge the success of our strategy. Our bottom-up, value-oriented, active investment approach requires independent thinking to build the level of conviction essential to invest in companies that are out of favor. Stock prices can move dramatically in response to the headlines of the day, but it often takes time for a company’s results to improve and for positive change to be recognized by other investors. Accordingly, maintaining a long-term investment horizon and staying the course when markets move against us are essential for our investment team, as well as for our fellow shareholders. We would be the first to acknowledge this is not easy to do, but our persistence to stick with our convictions in the face of market volatility was rewarded during this past year.
For the past 20 years, the Fund’s average annualized total return was 10.0% versus 7.7% for the S&P 500. This period encompassed large swings in Fund performance, market prices, and equity valuations, including the technology stock bubble and crash as well as the 2008-09 global financial crisis and subsequent recovery. More recently, investor concerns have been around global economic growth, lower commodity prices, and the U.S. presidential election. Uncertainty is a constant, but it can create compelling opportunities for patient, long-term, value-oriented, active investors. Our recent insight paper, “Understanding the Case for Active Management,” is summarized at the end of this letter and is available in its entirety on our website.
MARKET COMMENTARY
In 2016, global equity markets were volatile amid macroeconomic and geopolitical concerns. The U.S. equity market was one of the stronger developed markets and appreciated significantly: the S&P 500 reached an all-time high in mid-December and was up 12% for the year.
During 2015, value stocks underperformed growth stocks in the United States by one of the widest margins since the global financial crisis. This trend reversed in 2016, as U.S. value stocks outperformed growth stocks by ten percentage points,(a) benefiting many of the Fund’s value-oriented holdings. Recently, the more economically sensitive sectors of the market that are likely to benefit from an improving economy and higher interest rates (e.g.,
Energy, Financials) have accounted for a larger portion of the value category than stocks in the more defensive, stable sectors (e.g., Consumer Staples, Real Estate, Telecommunication Services, Utilities).
Equity returns for these two broad groups—more economically sensitive and more defensive sectors—have been highly correlated with interest rate movements in recent years. As interest rates declined to historically low levels and investors searched for yield in the equity market, defensive stocks with “bond-like” characteristics outperformed more cyclical stocks. In the first half of 2016, the best-performing sectors of the S&P 500 were Telecommunication Services and Utilities, while Financials and Information Technology were the worst performers. Conversely, as U.S. Treasury yields rose during the second half of 2016, especially after the U.S. presidential election, economically sensitive holdings outperformed considerably: Financials and Information Technology were the strongest sectors of the market, while Real Estate and Utilities were the weakest.
INVESTMENT STRATEGY
The Fund’s performance in 2016 mirrored this shift described above between the cyclical and defensive sectors: first half 2016 performance for the Fund was up 1% (versus up 4% for the S&P 500) and second half performance was up 20% (versus up 8%). As a result of individual security selection, the portfolio is tilted toward more economically sensitive companies: Financials comprised 29% of the portfolio, Information Technology accounted for 18%, and Energy was 9%.(b) We believe the Fund is well positioned based on our opinion that longer-term global economic growth will be better than many expect and interest rates will continue to rise. There is also a significant valuation gap between the Fund’s holdings and sectors where the Fund has little or no exposure.
Our strong price discipline is an essential characteristic of our investment strategy. We constantly weigh valuation against fundamentals and seek to invest in companies where the initial valuation reflects concerns about future earnings and cash flow prospects, while our analysis reveals the possibility of more positive developments. As long-term investors, our challenge is to assess short-term concerns while investing with an eye toward future prospects. When we see long-term value, we often add to positions as valuations decline and other investors become more pessimistic. Two examples include recent activity in the Financials and Health Care sectors, which are discussed below.
Financials
Amid heightened market volatility, we revisited and retested our thinking on many of the Fund’s holdings during 2015 and the first half of 2016. As valuations became more attractive, we concluded market conditions had created long-term investment opportunities in selected economically sensitive companies, especially in Financials. Despite low interest rates and global economic challenges, we saw opportunities because many of the portfolio’s Financials holdings traded at relatively inexpensive valuations (at
PAGE 2 § DODGE & COX STOCK FUND
levels not seen since the 2008 global financial crisis) although they had benefited from loan growth and improved credit quality since the crisis. We added to various companies, including American Express, Bank of America, Goldman Sachs, and MetLife.(c)
During the second half of 2016, Financials was the best-performing sector of the S&P 500 (up 22%), in large part due to rising interest rates. We trimmed several of the Fund’s holdings in response to higher share prices, but maintain a significant overweight position in the sector (29% versus 15% for the S&P 500). Profits are improving and strong capital positions allow the banks to return significant capital to shareholders via share buybacks and dividends, making them a compelling alternative to other dividend-paying stocks, in our view. As rates increase, profitability within the sector should improve further. The sector also stands to benefit from potential easing of financial regulation by the Trump administration (e.g., The Dodd-Frank Wall Street Reform and Consumer Protection Act could be repealed or modified).
While we trimmed Financials on a net basis during the fourth quarter, we opportunistically added to Wells Fargo (up only 5% for 2016), which detracted from relative performance and was weak among bank stocks due to regulatory infractions and fines. We were disappointed to learn about the bank’s sales practices that resulted in improper account openings, but are convinced Wells Fargo is actively addressing the issues. After a comprehensive review, we believe Wells Fargo’s superior franchise, deep management team, track record of generating higher returns than other banks, and attractive valuation at 1.6 times book value make it an attractive long-term investment opportunity. On December 31, Wells Fargo was a 3.9% position in the Fund.
Health Care
Health Care was the worst performing sector (down 2%) of the S&P 500 in 2016 amid legal, regulatory, and pricing concerns, especially in the Pharmaceuticals industry. Pharmacy benefit managers have exerted increased pricing pressure on drug manufacturers, aided by industry consolidation and higher market shares. This trend could impact long-term profitability for pharmaceutical companies. Additional risks include biosimilar and generic competition, as well as reduced drug reimbursement from government buyers and private payors.
Conversely, research and development (R&D) productivity has increased for many of the Fund’s pharmaceutical holdings. Overall industry R&D pipelines have become larger, and new drug approvals are on the upswing. These companies stand to benefit from long-term growth in emerging markets; consumers and governments have demonstrated a tendency to spend more on health care as consumer purchasing power increases. Furthermore, the Fund’s pharmaceutical holdings have reasonable valuations, strong balance sheets, high free cash flow, and cost-cutting opportunities that help mitigate risk.
After evaluating the risks versus the opportunities, the Fund remains overweight Pharmaceuticals (11% compared to 5% for the S&P 500). We added tactically to several holdings (e.g., AstraZeneca, Sanofi) as valuations became more attractive during the second half of 2016. In addition, we recently initiated new positions in Alnylam Pharmaceuticals and Bristol-Myers Squibb.
Bristol-Myers Squibb
Once a diversified pharmaceutical company facing significant patent expirations (a “cliff”), Bristol-Myers has transitioned into a focused biopharmaceutical company that is positioned to grow. Many of its competitors responded to their patent cliffs by expanding into other non-drug areas; Bristol-Myers shed its interests in those assets unrelated to the drug business (e.g., medical supply, nutritionals), focused on specialty drugs, and concentrated on only those therapeutic areas that it believed could be profitable over the long term. Its medicines help millions of people fight against such diseases as cancer, cardiovascular disease, hepatitis, HIV/AIDS, and rheumatoid arthritis.
In 2016, one of Bristol-Myers’ lead immuno-oncology trials (CheckMate-026) failed and its stock price declined significantly. We think this is a short-term setback, and believe the company’s immuno-oncology business is particularly attractive with its strong pipeline of other drugs, significant growth potential, and reasonable valuation at 20 times forward earnings. After weighing the risks versus the long-term opportunities, we initiated a position in Bristol-Myers, which accounted for 1.3% of the Fund on December 31.
IN CLOSING
While U.S. equity valuations have increased, we remain optimistic about the long-term outlook for the portfolio, which trades at a discount: 14.7 times forward earnings compared to 18.8 times for the S&P 500. The valuation disparities that characterize the current environment offer significant opportunities for active management. We believe that being patient, persistent, and having a long-term investment horizon are essential for investment success. While we do not know what the future holds, we will continue to apply the bottom-up, value-oriented investment approach that has served the Fund well for decades.
We want to express gratitude to the Fund’s shareholders for taking the long view and having confidence in Dodge & Cox. Our strategy requires patience and persistence, and we appreciate yours.
As always, we welcome your comments and questions.
For the Board of Trustees,
| | |
 | |  |
Charles F. Pohl, Chairman | | Dana M. Emery, President |
January 31, 2017
| (a) | | The Russell 1000 Value Index outperformed the Russell 1000 Growth Index by 10.3 percentage points during 2016. Generally, stocks that have lower valuations are “value” stocks, while those with higher valuations are “growth” stocks. |
| (b) | | Unless otherwise specified, all weightings and characteristics are as of December 31, 2016. |
| (c) | | The use of specific examples does not imply that they are more attractive investments than the Fund’s other holdings. |
DODGE & COX STOCK FUND §PAGE 3
UNDERSTANDING THE CASE FOR ACTIVE MANAGEMENT
One of the fiercest investment debates concerns active versus passive approaches to investing: Should investors actively choose individual investments in the hopes of beating the market, or choose a fund that tracks an index and matches the return of the market, never doing better, but never doing worse?
The most frequently cited evidence against active management is that the majority of active managers fail to beat their benchmark each year. But measuring on a 12-month basis doesn’t necessarily capture the results of an active management strategy because it often takes more than a year for a strategy to come to fruition. When measurement intervals are lengthened, the results of the active versus passive comparison are significantly different—a higher percentage of active managers outperform their benchmarks. To be sure, outperformance over the long run is nowhere near a sure thing, but the data suggests active management is an eminently viable choice.
One of the attributes of successful active managers is having a high “active share,” meaning their portfolio is significantly different from an index. Another attribute is having low fees and low portfolio turnover, which reduce the drag on performance exerted by expenses. Successful active managers also tend to provide higher risk-adjusted returns, because unlike index funds, they aren’t obliged to invest in higher risk companies. Studies also show that active managers do better when they are tightly focused on specific strategies and markets and when they have a significant financial stake in their funds.
Research indicates that the average U.S. mutual fund investor earns two percentage points less per year than the average fund because many investors move in and out of funds too quickly. But if investors have the discipline to stick with good active managers through inevitable periods of underperformance, they can have meaningful prospects of outperforming the market over time.
A summary from Dodge & Cox’s insight paper titled, “Understanding the Case for Active Management.”
ANNUAL PERFORMANCE REVIEW
The Fund outperformed the S&P 500 by 9.3 percentage points in 2016.
Key Contributors to Relative Results
| | § | | Returns from holdings in the Consumer Discretionary sector (up 26% compared to up 6% for the S&P 500 sector) helped results. Time Warner Inc. (up 52%), which agreed to be acquired by AT&T, was particularly strong. Time Warner Cable (up 13% to date of merger) and Charter Communications (up 24% from date of merger) merged during the year and performed well. | |
| | § | | The Fund’s holdings in the Information Technology sector (up 25% compared to up 14% for the S&P 500 sector) aided performance. Hewlett Packard Enterprise (up 54%) and HP Inc. (up 30%) were key contributors. | |
| | § | | The Fund’s significant overweight position (27% versus 13%) in the Financials sector (up 22%, in line with the S&P 500 sector) added to relative results. Notable contributors included Goldman Sachs (up 35%) and Bank of America (up 33%). | |
| | § | | Following a weak 2015, Sprint (up 133%) was a standout performer. | |
Key Detractors from Relative Results
| | § | | The Health Care sector (down 2% for the S&P 500) faced headwinds during the year and lagged the overall market. Selected Fund holdings were weak, including Express Scripts (down 21%), Roche (down 15%), and Novartis (down 13%). | |
| | § | | Wells Fargo (up only 5%), a large position in the Fund, detracted from performance and was weak among bank stocks due to regulatory infractions and fines. | |
KEY CHARACTERISTICS OF DODGE & COX
Independent Organization
Dodge & Cox is one of the largest privately owned investment managers in the world. We remain committed to independence, with a goal of providing the highest quality investment management service to our existing clients.
Over 85 Years of Investment Experience
Dodge & Cox was founded in 1930. We have a stable and well-qualified team of investment professionals, most of whom have spent their entire careers at Dodge & Cox.
Experienced Investment Team
The Investment Policy Committee, which is the decision-making body for the Stock Fund, is an eight-member committee with an average tenure at Dodge & Cox of 23 years.
One Business with a Single Research Office
Dodge & Cox manages equity (domestic, international, and global), fixed income (domestic and global), and balanced investments, operating from one office in San Francisco.
Consistent Investment Approach
Our team decision-making process involves thorough, bottom-up fundamental analysis of each investment.
Long-Term Focus and Low Expenses
We invest with a three- to five-year investment horizon, which has historically resulted in low turnover relative to our peers. We manage Funds that maintain low expense ratios.
Risks: The Fund is subject to market risk, meaning holdings in the Fund may decline in value for extended periods due to the financial prospects of individual companies, or due to general market and economic conditions. Please read the prospectus and summary prospectus for specific details regarding the Fund’s risk profile.
PAGE 4 § DODGE & COX STOCK FUND
GROWTH OF $10,000 OVER 10 YEARS
FOR AN INVESTMENT MADE ON DECEMBER 31, 2006
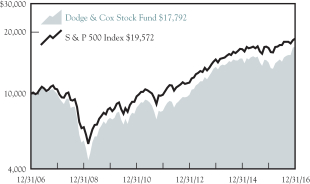
AVERAGE ANNUAL TOTAL RETURN
FOR PERIODS ENDED DECEMBER 31, 2016
| | | | | | | | | | | | | | | | |
| | | 1 Year | | | 5 Years | | | 10 Years | | | 20 Years | |
Dodge & Cox Stock Fund | | | 21.27 | % | | | 17.00 | % | | | 5.93 | % | | | 10.00 | % |
S&P 500 Index | | | 11.96 | | | | 14.66 | | | | 6.95 | | | | 7.68 | |
Returns represent past performance and do not guarantee future results. Investment return and share price will fluctuate with market conditions, and investors may have a gain or loss when shares are sold. Fund performance changes over time and currently may be significantly lower than stated. Performance is updated and published monthly. Visit the Fund’s website at dodgeandcox.com or call 800-621-3979 for current performance figures.
The Fund’s total returns include the reinvestment of dividend and capital gain distributions, but have not been adjusted for any income taxes payable by shareholders on these distributions or on Fund share redemptions. Index returns include dividends but, unlike Fund returns, do not reflect fees or expenses. The S&P 500 Index is a market capitalization-weighted index of 500 large-capitalization stocks commonly used to represent the U.S. equity market.
S&P 500® is a trademark of S&P Global Inc.
FUND EXPENSE EXAMPLE
As a Fund shareholder, you incur ongoing Fund costs, including management fees and other Fund expenses. All mutual funds have ongoing costs, sometimes referred to as operating expenses. The following example shows ongoing costs of investing in the Fund and can help you understand these costs and compare them with those of other mutual funds. The example assumes a $1,000 investment held for the six months indicated.
ACTUAL EXPENSES
The first line of the table below provides information about actual account values and expenses based on the Fund’s actual returns. You may use the information in this line, together with your account balance, to estimate the expenses that you paid over the period. Simply divide your account value by $1,000 (for example, an $8,600 account value divided by $1,000 = 8.6), then multiply the result by the number in the first line under the heading “Expenses Paid During Period” to estimate the expenses you paid on your account during this period.
HYPOTHETICAL EXAMPLE FOR COMPARISON WITH OTHER MUTUAL FUNDS
Information on the second line of the table can help you compare ongoing costs of investing in the Fund with those of other mutual funds. This information may not be used to estimate the actual ending account balance or expenses you paid during the period. The hypothetical “Ending Account Value” is based on the actual expense ratio of the Fund and an assumed 5% annual rate of return before expenses (not the Fund’s actual return). The amount under the heading “Expenses Paid During Period” shows the hypothetical expenses your account would have incurred under this scenario. You can compare this figure with the 5% hypothetical examples that appear in shareholder reports of other mutual funds.
| | | | | | | | | | | | |
Six Months Ended
December 31, 2016 | | Beginning Account Value
7/1/2016 | | | Ending Account Value
12/31/2016 | | | Expenses Paid
During Period* | |
Based on Actual Fund Return | | $ | 1,000.00 | | | $ | 1,204.20 | | | $ | 2.85 | |
Based on Hypothetical 5% Yearly Return | | | 1,000.00 | | | | 1,022.55 | | | | 2.61 | |
| * | | Expenses are equal to the Fund’s annualized expense ratio of 0.51%, multiplied by the average account value over the period, multiplied by 184/366 (to reflect the one-half year period). |
The expenses shown in the table highlight ongoing costs only and do not reflect any transactional fees or account maintenance fees. Though other mutual funds may charge such fees, please note that the Fund does not charge transaction fees (e.g., redemption fees, sales loads) or universal account maintenance fees (e.g., small account fees).
DODGE & COX STOCK FUND §PAGE 5
| | | | |
| FUND INFORMATION (unaudited) | | | December 31, 2016 | |
| | | | |
| GENERAL INFORMATION | | | |
Net Asset Value Per Share | | | $184.30 | |
Total Net Assets (billions) | | | $61.6 | |
Expense Ratio | | | 0.52% | |
Portfolio Turnover Rate | | | 16% | |
30-Day SEC Yield(a) | | | 1.18% | |
Number of Companies | | | 64 | |
Fund Inception | | | 1965 | |
No sales charges or distribution fees | | | | |
Investment Manager: Dodge & Cox, San Francisco. Managed by the Investment Policy Committee, whose eight members’ average tenure at Dodge & Cox is 23 years.
| | | | | | | | |
| PORTFOLIO CHARACTERISTICS | | Fund | | | S&P 500 | |
Median Market Capitalization (billions) | | | $40 | | | | $19 | |
Weighted Average Market Capitalization (billions) | | | $113 | | | | $151 | |
Price-to-Earnings Ratio(b) | | | 14.7x | | | | 18.8x | |
Foreign Securities not in the S&P 500(c) | | | 9.1% | | | | 0.0% | |
| | | | |
| TEN LARGEST HOLDINGS (%)(d) | | Fund | |
Bank of America Corp. | | | 4.0 | |
Wells Fargo & Co. | | | 3.9 | |
Capital One Financial Corp. | | | 3.8 | |
Charles Schwab Corp. | | | 3.8 | |
Hewlett Packard Enterprise Co. | | | 3.5 | |
Goldman Sachs Group, Inc. | | | 3.3 | |
Time Warner, Inc. | | | 3.1 | |
Sanofi (France) | | | 2.9 | |
Charter Communications, Inc. | | | 2.9 | |
Microsoft Corp. | | | 2.5 | |
| | | | | | | | |
| SECTOR DIVERSIFICATION(%) | | Fund | | | S&P 500 | |
Financials | | | 29.4 | | | | 14.8 | |
Information Technology | | | 17.9 | | | | 20.8 | |
Health Care | | | 16.9 | | | | 13.6 | |
Consumer Discretionary | | | 15.1 | | | | 12.0 | |
Energy | | | 9.2 | | | | 7.6 | |
Industrials | | | 4.2 | | | | 10.3 | |
Telecommunication Services | | | 1.9 | | | | 2.7 | |
Consumer Staples | | | 1.5 | | | | 9.4 | |
Materials | | | 1.0 | | | | 2.8 | |
Utilities | | | 0.0 | | | | 3.1 | |
Real Estate | | | 0.0 | | | | 2.9 | |
| (a) | SEC Yield is an annualization of the Fund’s net investment income for the trailing 30-day period. Dividends paid by the Fund may be higher or lower than implied by the SEC Yield. |
| (b) | Price-to-earnings (P/E) ratios are calculated using 12-month forward earnings estimates from third-party sources. |
| (c) | Foreign securities are U.S. dollar denominated. |
| (d) | The Fund’s portfolio holdings are subject to change without notice. The mention of specific securities is not a recommendation to buy, sell, or hold any particular security and is not indicative of Dodge & Cox’s current or future trading activity. |
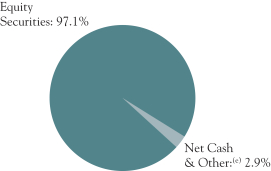
| (e) | Net Cash & Other includes cash, short-term investments, receivables, and payables. |
PAGE 6 § DODGE & COX STOCK FUND
| | | | |
| PORTFOLIO OF INVESTMENTS | | | December 31, 2016 | |
| | | | | | | | |
| COMMON STOCKS: 97.1% | |
| | |
| | | SHARES | | | VALUE | |
| CONSUMER DISCRETIONARY: 15.1% | |
AUTOMOBILES & COMPONENTS: 0.6% | |
Adient PLC(a) (Ireland) | | | 1,142,935 | | | $ | 66,975,991 | |
Harley-Davidson, Inc. | | | 5,610,647 | | | | 327,325,146 | |
| | | | | | | | |
| | | | 394,301,137 | |
CONSUMER DURABLES & APPAREL: 0.5% | |
Coach, Inc. | | | 8,813,900 | | | | 308,662,778 | |
| | |
MEDIA: 11.8% | | | | | | | | |
Charter Communications, Inc., Class A(a) | | | 6,094,486 | | | | 1,754,724,409 | |
Comcast Corp., Class A | | | 22,498,797 | | | | 1,553,541,933 | |
DISH Network Corp., Class A(a) | | | 9,727,476 | | | | 563,512,684 | |
News Corp., Class A | | | 4,462,806 | | | | 51,143,757 | |
Time Warner, Inc. | | | 19,778,332 | | | | 1,909,202,388 | |
Twenty-First Century Fox, Inc., Class A | | | 41,334,626 | | | | 1,159,022,913 | |
Twenty-First Century Fox, Inc., Class B | | | 9,350,000 | | | | 254,787,500 | |
| | | | | | | | |
| | | | 7,245,935,584 | |
RETAILING: 2.2% | |
Liberty Interactive Corp. QVC Group, Series A(a) | | | 12,017,275 | | | | 240,105,155 | |
Target Corp. | | | 6,161,054 | | | | 445,012,930 | |
The Priceline Group, Inc.(a) | | | 458,400 | | | | 672,041,904 | |
| | | | | | | | |
| | | | 1,357,159,989 | |
| | | | | | | | |
| | | | | | | 9,306,059,488 | |
| CONSUMER STAPLES: 1.5% | |
FOOD & STAPLES RETAILING: 1.5% | |
Wal-Mart Stores, Inc. | | | 12,988,050 | | | | 897,734,016 | |
| | |
| ENERGY: 9.2% | | | | | | | | |
Anadarko Petroleum Corp. | | | 13,395,521 | | | | 934,069,679 | |
Apache Corp. | | | 17,095,994 | | | | 1,085,082,739 | |
Baker Hughes, Inc. | | | 15,637,578 | | | | 1,015,973,443 | |
Concho Resources, Inc.(a) | | | 3,615,000 | | | | 479,349,000 | |
National Oilwell Varco, Inc. | | | 18,698,000 | | | | 700,053,120 | |
Schlumberger, Ltd. (Curacao/United States) | | | 15,499,245 | | | | 1,301,161,618 | |
Weatherford International PLC(a) (Ireland) | | | 28,007,400 | | | | 139,756,926 | |
| | | | | | | | |
| | | | 5,655,446,525 | |
| FINANCIALS: 29.4% | |
BANKS: 11.2% | |
Bank of America Corp. | | | 111,294,300 | | | | 2,459,604,030 | |
BB&T Corp. | | | 13,015,144 | | | | 611,972,071 | |
JPMorgan Chase & Co. | | | 16,797,800 | | | | 1,449,482,162 | |
Wells Fargo & Co. | | | 43,253,341 | | | | 2,383,691,622 | |
| | | | | | | | |
| | | | 6,904,749,885 | |
DIVERSIFIED FINANCIALS: 15.3% | |
American Express Co. | | | 17,197,300 | | | | 1,273,975,984 | |
Bank of New York Mellon Corp. | | | 29,763,060 | | | | 1,410,173,783 | |
Capital One Financial Corp.(b) | | | 27,167,711 | | | | 2,370,111,108 | |
Charles Schwab Corp. | | | 58,867,600 | | | | 2,323,504,172 | |
Goldman Sachs Group, Inc. | | | 8,518,700 | | | | 2,039,802,715 | |
| | | | | | | | |
| | | | 9,417,567,762 | |
INSURANCE: 2.9% | |
AEGON NV (Netherlands) | | | 71,579,823 | | | | 395,836,421 | |
MetLife, Inc. | | | 26,432,700 | | | | 1,424,458,203 | |
| | | | | | | | |
| | | | | | | 1,820,294,624 | |
| | | | | | | | |
| | | | 18,142,612,271 | |
| HEALTH CARE: 16.9% | |
HEALTH CARE EQUIPMENT & SERVICES: 6.3% | |
Anthem, Inc. | | | 1,527,685 | | | | 219,635,272 | |
Cigna Corp. | | | 8,608,217 | | | | 1,148,250,066 | |
| | | | | | | | |
| | |
| | | SHARES | | | VALUE | |
Danaher Corp. | | | 3,237,600 | | | $ | 252,014,784 | |
Express Scripts Holding Co.(a) | | | 12,534,871 | | | | 862,273,776 | |
Medtronic PLC (Ireland) | | | 6,719,600 | | | | 478,637,108 | |
UnitedHealth Group, Inc. | | | 5,830,760 | | | | 933,154,830 | |
| | | | | | | | |
| | | | 3,893,965,836 | |
|
PHARMACEUTICALS, BIOTECHNOLOGY & LIFE SCIENCES: 10.6% | |
Alnylam Pharmaceuticals, Inc.(a)(b) | | | 5,430,735 | | | | 203,326,718 | |
AstraZeneca PLC ADR (United Kingdom) | | | 32,659,383 | | | | 892,254,344 | |
Bristol-Myers Squibb Co. | | | 14,113,900 | | | | 824,816,316 | |
Merck & Co., Inc. | | | 7,767,900 | | | | 457,296,273 | |
Novartis AG ADR (Switzerland) | | | 20,392,957 | | | | 1,485,422,988 | |
Roche Holding AG ADR (Switzerland) | | | 31,020,799 | | | | 885,023,396 | |
Sanofi ADR (France) | | | 44,130,728 | | | | 1,784,646,640 | |
| | | | | | | | |
| | | | | | | 6,532,786,675 | |
| | | | | | | | |
| | | | 10,426,752,511 | |
| INDUSTRIALS: 4.2% | |
CAPITAL GOODS: 0.8% | |
Johnson Controls International PLC (Ireland) | | | 11,329,351 | | | | 466,655,968 | |
| | |
TRANSPORTATION: 3.4% | | | | | | | | |
FedEx Corp. | | | 6,847,099 | | | | 1,274,929,834 | |
Union Pacific Corp. | | | 8,070,000 | | | | 836,697,600 | |
| | | | | | | | |
| | | | 2,111,627,434 | |
| | | | | | | | |
| | | | 2,578,283,402 | |
| INFORMATION TECHNOLOGY: 17.9% | |
SEMICONDUCTORS & SEMICONDUCTOR EQUIPMENT: 0.8% | |
Maxim Integrated Products, Inc. | | | 12,095,740 | | | | 466,532,692 | |
| | |
SOFTWARE & SERVICES: 7.2% | | | | | | | | |
Alphabet, Inc., Class A(a) | | | 203,100 | | | | 160,946,595 | |
Alphabet, Inc., Class C(a) | | | 1,765,253 | | | | 1,362,457,570 | |
Dell Technologies, Inc., Class V(a) | | | 6,851,210 | | | | 376,611,014 | |
Microsoft Corp. | | | 25,147,300 | | | | 1,562,653,222 | |
Symantec Corp.(b) | | | 3,340,476 | | | | 79,803,972 | |
Synopsys, Inc.(a)(b) | | | 7,265,469 | | | | 427,645,505 | |
VMware, Inc.(a) | | | 5,955,511 | | | | 468,877,381 | |
| | | | | | | | |
| | | | 4,438,995,259 | |
TECHNOLOGY, HARDWARE & EQUIPMENT: 9.9% | |
Cisco Systems, Inc. | | | 38,202,711 | | | | 1,154,485,927 | |
Corning, Inc. | | | 18,842,000 | | | | 457,295,340 | |
Hewlett Packard Enterprise Co.(b) | | | 93,402,495 | | | | 2,161,333,734 | |
HP Inc. | | | 71,435,195 | | | | 1,060,098,294 | |
Juniper Networks, Inc. | | | 3,169,247 | | | | 89,562,920 | |
NetApp, Inc.(b) | | | 14,368,331 | | | | 506,771,034 | |
TE Connectivity, Ltd. (Switzerland) | | | 9,976,475 | | | | 691,170,188 | |
| | | | | | | | |
| | | | 6,120,717,437 | |
| | | | | | | | |
| | | | 11,026,245,388 | |
| MATERIALS: 1.0% | | | | | | | | |
Celanese Corp., Series A(b) | | | 7,779,698 | | | | 612,573,421 | |
|
| TELECOMMUNICATION SERVICES: 1.9% | |
Sprint Corp.(a) | | | 106,416,127 | | | | 896,023,789 | |
Zayo Group Holdings, Inc.(a) | | | 8,550,000 | | | | 280,953,000 | |
| | | | | | | | |
| | | | 1,176,976,789 | |
| | | | | | | | |
TOTAL COMMON STOCKS
(Cost $39,936,648,414) | | | $ | 59,822,683,811 | |
| | |
| See accompanying Notes to Financial Statements | | DODGE & COX STOCK FUND §PAGE 7 |
| | | | |
| PORTFOLIO OF INVESTMENTS | | | December 31, 2016 | |
| | | | | | | | |
| SHORT-TERM INVESTMENTS: 3.0% | |
| | |
| | | PAR VALUE | | | VALUE | |
MONEY MARKET FUND: 0.1% | | | | | |
State Street Institutional Treasury Plus Money Market Fund | | $ | 62,055,950 | | | $ | 62,055,950 | |
| |
REPURCHASE AGREEMENT: 2.9% | | | | | |
Fixed Income Clearing Corporation(c) 0.10%, dated 12/30/16, due 1/3/17, maturity value $1,754,866,498 | | | 1,754,843,000 | | | | 1,754,843,000 | |
| | | | | | | | |
TOTAL SHORT-TERM INVESTMENTS
(Cost $1,816,898,950) | | | $ | 1,816,898,950 | |
| | | | | | | | |
TOTAL INVESTMENTS
(Cost $41,753,547,364) | | | 100.1 | % | | $ | 61,639,582,761 | |
OTHER ASSETS LESS LIABILITIES | | | (0.1 | %) | | | (39,106,902 | ) |
| | | | | | | | |
| NET ASSETS | | | 100.0 | % | | $ | 61,600,475,859 | |
| | | | | | | | |
| (b) | See Note 9 regarding holdings of 5% voting securities |
| (c) | Repurchase agreement is collateralized by Fannie Mae 5.375%, 6/12/17, Federal Farm Credit Bank 1.125%, 9/22/17, Freddie Mac 0.75%-1.00%, 7/14/17-11/28/17, U.S. Treasury Inflation Indexed Note 0.125%-2.625%, 4/15/17-7/15/17, and U.S. Treasury Notes 0.625%-1.875%, 5/15/17-12/31/17. Total collateral value is $1,789,951,128. |
In determining a company’s country designation, the Fund generally references the country of incorporation. In cases where the Fund considers the country of incorporation to be a “jurisdiction of convenience” chosen primarily for tax purposes or in other limited circumstances, the Fund uses the country designation of an appropriate broad-based market index. In those cases, two countries are listed—the country of incorporation and the country designated by an appropriate index, respectively.
ADR: American Depositary Receipt
FUTURES CONTRACTS
| | | | | | | | | | | | | | | | |
| Description | | Number of
Contracts | | | Expiration
Date | | | Notional
Amount | | | Unrealized
Appreciation/
(Depreciation) | |
E-mini S&P 500 Index—Long Position | | | 15,431 | | | | Mar 2017 | | | $ | 1,725,340,110 | | | $ | (14,740,454 | ) |
| | |
| PAGE 8 § DODGE & COX STOCK FUND | | See accompanying Notes to Financial Statements |
| | | | |
STATEMENT OF ASSETS AND LIABILITIES | |
| |
| | | December 31, 2016 | |
ASSETS: | | | | |
Investments, at value | | | | |
Unaffiliated issuers (cost $38,193,911,466) | | $ | 55,785,466,746 | |
Affiliated issuers (cost $3,559,635,898) | | | 5,854,116,015 | |
| | | | |
| | | 61,639,582,761 | |
Cash held at broker | | | 73,297,257 | |
Receivable for investments sold | | | 93,302,447 | |
Receivable for Fund shares sold | | | 38,128,416 | |
Dividends and interest receivable | | | 61,732,289 | |
Prepaid expenses and other assets | | | 314,115 | |
| | | | |
| | | 61,906,357,285 | |
| | | | |
LIABILITIES: | | | | |
Payable for investments purchased | | | 9,628,958 | |
Payable to broker for variation margin | | | 5,595,262 | |
Payable for Fund shares redeemed | | | 262,792,748 | |
Management fees payable | | | 26,417,770 | |
Accrued expenses | | | 1,446,688 | |
| | | | |
| | | 305,881,426 | |
| | | | |
NET ASSETS | | $ | 61,600,475,859 | |
| | | | |
NET ASSETS CONSIST OF: | | | | |
Paid in capital | | $ | 40,826,136,110 | |
Undistributed net investment income | | | 7,382,075 | |
Undistributed net realized gain | | | 895,662,731 | |
Net unrealized appreciation | | | 19,871,294,943 | |
| | | | |
| | $ | 61,600,475,859 | |
| | | | |
Fund shares outstanding (par value $0.01 each,
unlimited shares authorized) | | | 334,247,521 | |
Net asset value per share | | $ | 184.30 | |
|
STATEMENT OF OPERATIONS | |
| |
| | | Year Ended
December 31, 2016 | |
INVESTMENT INCOME: | | | | |
Dividends (net of foreign taxes of $10,923,953) | | | | |
Unaffiliated issuers | | $ | 1,003,676,462 | |
Affiliated issuers | | | 293,655,555 | |
Interest | | | 778,193 | |
| | | | |
| | | 1,298,110,210 | |
| | | | |
EXPENSES: | | | | |
Management fees | | | 275,674,035 | |
Custody and fund accounting fees | | | 689,957 | |
Transfer agent fees | | | 3,594,887 | |
Professional services | | | 140,704 | |
Shareholder reports | | | 1,100,507 | |
Registration fees | | | 264,299 | |
Trustees’ fees | | | 247,500 | |
ADR depositary services fees | | | 3,658,073 | |
Miscellaneous | | | 765,153 | |
| | | | |
| | | 286,135,115 | |
| | | | |
NET INVESTMENT INCOME | | | 1,011,975,095 | |
| | | | |
REALIZED AND UNREALIZED GAIN (LOSS): | | | | |
Net realized gain (loss) | | | | |
Investments in unaffiliated issuers | | | 2,639,028,649 | |
Investments in affiliated issuers | | | 313,249,118 | |
Futures contracts | | | 14,986,913 | |
Foreign currency transactions | | | (127,784 | ) |
Net change in unrealized appreciation/depreciation | | | | |
Investments | | | 7,043,077,537 | |
Futures contracts | | | (16,453,661 | ) |
| | | | |
Net realized and unrealized gain | | | 9,993,760,772 | |
| | | | |
NET CHANGE IN NET ASSETS
FROM OPERATIONS | | $ | 11,005,735,867 | |
| | | | |
| | | | | | | | |
STATEMENT OF CHANGES IN NET ASSETS | | | | | |
| | |
| | | Year Ended
December 31, 2016 | | | Year Ended
December 31, 2015 | |
OPERATIONS: | | | | | | | | |
Net investment income | | $ | 1,011,975,095 | | | $ | 801,418,840 | |
Net realized gain | | | 2,967,136,896 | | | | 2,982,618,142 | |
Net change in unrealized appreciation/depreciation | | | 7,026,623,876 | | | | (6,397,067,953 | ) |
| | | | | | | | |
| | | 11,005,735,867 | | | | (2,613,030,971 | ) |
| | | | | | | | |
| | |
DISTRIBUTIONS TO SHAREHOLDERS FROM: | | | | | | | | |
Net investment income | | | (1,006,582,969 | ) | | | (813,298,971 | ) |
Net realized gain | | | (2,967,981,956 | ) | | | (2,475,923,268 | ) |
| | | | | | | | |
Total distributions | | | (3,974,564,925 | ) | | | (3,289,222,239 | ) |
| | | | | | | | |
| | |
FUND SHARE TRANSACTIONS: | | | | | | | | |
Proceeds from sale of shares | | | 7,078,053,220 | | | | 7,399,154,348 | |
Reinvestment of distributions | | | 3,757,250,793 | | | | 3,094,798,205 | |
Cost of shares redeemed | | | (11,111,123,603 | ) | | | (10,006,695,861 | ) |
| | | | | | | | |
Net change from Fund share transactions | | | (275,819,590 | ) | | | 487,256,692 | |
| | | | | | | | |
Total change in net assets | | | 6,755,351,352 | | | | (5,414,996,518 | ) |
| | |
NET ASSETS: | | | | | | | | |
Beginning of year | | | 54,845,124,507 | | | | 60,260,121,025 | |
| | | | | | | | |
End of year (including undistributed net investment income of $7,382,075 and $7,503,253, respectively) | | $ | 61,600,475,859 | | | $ | 54,845,124,507 | |
| | | | | | | | |
| | |
SHARE INFORMATION: | | | | | | | | |
Shares sold | | | 42,458,419 | | | | 41,883,366 | |
Distributions reinvested | | | 21,705,948 | | | | 18,759,974 | |
Shares redeemed | | | (66,866,904 | ) | | | (56,738,159 | ) |
| | | | | | | | |
Net change in shares outstanding | | | (2,702,537 | ) | | | 3,905,181 | |
| | | | | | | | |
| | |
| See accompanying Notes to Financial Statements | | DODGE & COX STOCK FUND §PAGE 9 |
NOTES TO FINANCIAL STATEMENTS
NOTE 1—ORGANIZATION AND SIGNIFICANT ACCOUNTING POLICIES
Dodge & Cox Stock Fund (the “Fund”) is one of the series constituting the Dodge & Cox Funds (the “Trust” or the “Funds”). The Trust is organized as a Delaware statutory trust and is registered under the Investment Company Act of 1940, as amended, as an open-end management investment company. The Fund commenced operations on January 4, 1965, and seeks long-term growth of principal and income. Risk considerations and investment strategies of the Fund are discussed in the Fund’s Prospectus.
The financial statements have been prepared in conformity with accounting principles generally accepted in the United States of America, which require the use of estimates and assumptions by management. Actual results may differ from those estimates. Significant accounting policies are as follows:
Security valuation The Fund’s net assets are typically valued as of the normally scheduled close of trading on the New York Stock Exchange (NYSE), generally 4:00 p.m. Eastern Time, each day that the NYSE is open for business.
Portfolio securities and other financial instruments for which market quotes are readily available are valued at market value. Listed securities are generally valued using the official quoted close price or the last sale on the exchange that is determined to be the primary market for the security. Exchange-traded derivatives are valued at the settlement price determined by the relevant exchange. Security values are not discounted based on the size of the Fund’s position. Short-term securities less than 60 days to maturity may be valued at amortized cost if amortized cost approximates current value. Mutual funds are valued at their respective net asset values. All securities held by the Fund are denominated in U.S. dollars.
If market quotations are not readily available or if a security’s value is believed to have materially changed after the close of the security’s primary market but before the close of trading on the NYSE, the security is valued at fair value as determined in good faith by or under the direction of the Fund’s Board of Trustees. The Board of Trustees has appointed Dodge & Cox, the Fund’s investment manager, to make fair value determinations in accordance with the Dodge & Cox Funds Valuation Policies (“Valuation Policies”), subject to Board oversight. Dodge & Cox has established a Pricing Committee that is comprised of representatives from Treasury, Legal, Compliance, and Operations. The Pricing Committee is responsible for implementing the Valuation Policies, including determining the fair value of securities when market quotations or market-based valuations are not readily available or are deemed unreliable. The Pricing Committee considers relevant indications of value that are reasonably available to it in determining the fair value assigned to a particular security, such as the value of similar financial instruments, trading volumes, contractual restrictions on disposition, related corporate actions, and changes in economic conditions. In doing so, the Pricing Committee employs various
methods for calibrating fair valuation approaches, including a regular review of key inputs and assumptions, back-testing, and review of any related market activity.
Valuing securities through a fair value determination involves greater reliance on judgment than valuation of securities based on readily available market quotations. In some instances, lack of information and uncertainty as to the significance of information may lead to a conclusion that a prior valuation is the best indication of a security’s value. When fair value pricing is employed, the prices of securities used by the Fund to calculate its NAV may differ from quoted or published prices for the same securities.
Security transactions, investment income, expenses, and distributions Security transactions are recorded on the trade date. Realized gains and losses on securities sold are determined on the basis of identified cost.
Dividend income and corporate action transactions are recorded on the ex-dividend date, or when the Fund first learns of the dividend/corporate action if the ex-dividend date has passed. Withholding taxes on foreign dividends have been provided for in accordance with the Fund’s understanding of the applicable country’s tax rules and rates. Non-cash dividends included in dividend income, if any, are recorded at the fair market value of the securities received. Dividends characterized as return of capital for U.S. tax purposes are recorded as a reduction of cost of investments and/or realized gain. Interest income is recorded on the accrual basis.
Expenses are recorded on the accrual basis. Some expenses of the Trust can be directly attributed to a specific series. Expenses which cannot be directly attributed are allocated among the Funds in the Trust using methodologies determined by the nature of the expense.
Distributions to shareholders are recorded on the ex-dividend date.
Repurchase agreements The Fund enters into repurchase agreements, secured by U.S. government or agency securities, which involve the purchase of securities from a counterparty with a simultaneous commitment to resell the securities at an agreed-upon date and price. It is the Fund’s policy that its custodian take possession of the underlying collateral securities, the fair value of which exceeds the principal amount of the repurchase transaction, including accrued interest, at all times. In the event of default by the counterparty, the Fund has the contractual right to liquidate the collateral securities and to apply the proceeds in satisfaction of the obligation.
Foreign taxes The Fund may be subject to foreign taxes which may be imposed by certain countries in which the Fund invests. The Fund endeavors to record foreign taxes based on applicable foreign tax law. Withholding taxes are incurred on certain foreign dividends and are accrued at the time the associated dividend is recorded. The Fund files withholding tax reclaims in certain jurisdictions to recover a portion of amounts previously withheld. The Fund records a reclaim receivable based
PAGE 10 § DODGE & COX STOCK FUND
NOTES TO FINANCIAL STATEMENTS
on, among other things, a jurisdiction’s legal obligation to pay reclaims as well as payment history and market convention. In consideration of recent decisions rendered by European courts, the Fund has filed for additional reclaims related to prior years. A corresponding receivable is established when both the amount is known and significant contingencies or uncertainties regarding collectability are removed. These amounts, if any, are reported in “dividends and interest receivable” on the Statement of Assets and Liabilities.
Futures Contracts Futures contracts involve an obligation to purchase or sell (depending on whether the Fund has entered a long or short futures contract, respectively) an asset at a future date, at a price set at the time of the contract. Upon entering into a futures contract, the Fund is required to deposit an amount of cash or liquid assets (referred to as initial margin) in a segregated account with the clearing broker. Subsequent payments (referred to as variation margin) to and from the clearing broker are made on a daily basis based on changes in the market value of futures contracts. Futures contracts are traded publicly and their market value changes daily. Changes in the market value of open futures contracts are recorded as unrealized appreciation or depreciation in the Statement of Operations. Realized gains and losses on futures contracts are recorded in the Statement of Operations at the closing or expiration of the contracts. Cash deposited with a broker as initial margin is recorded on the Statement of Assets and Liabilities. A receivable and/or payable to brokers for daily variation margin is also recorded on the Statement of Assets and Liabilities.
Investments in futures contracts may include certain risks, which may be different from, and potentially greater than, those of the underlying securities. To the extent the Fund uses futures, it is exposed to additional volatility and potential losses resulting from leverage.
The Fund has maintained long S&P 500 futures contracts to provide equity exposure that approximates the Fund’s “net cash and other” position, which includes cash, short-term investments, receivables, and payables. During the year ended December 31, 2016, these S&P 500 futures contracts had notional values ranging from 1% to 3% of net assets.
Indemnification Under the Trust’s organizational documents, its officers and trustees are indemnified against certain liabilities arising out of the performance of their duties to the Trust. In addition, in the normal course of business the Trust enters into contracts that provide general indemnities to other parties. The Trust’s maximum exposure under these arrangements is unknown as this would involve future claims that may be made against the Trust that have not yet occurred.
NOTE 2—VALUATION MEASUREMENTS
Various inputs are used in determining the value of the Fund’s investments. These inputs are summarized in the three broad levels listed below.
| § | | Level 1: Quoted prices in active markets for identical securities |
| § | | Level 2: Other significant observable inputs (including quoted prices for similar securities, market indices, interest rates, credit risk, forward exchange rates, etc.) |
| § | | Level 3: Significant unobservable inputs (including Fund management’s assumptions in determining the fair value of investments) |
The inputs or methodology used for valuing securities are not necessarily an indication of the risk associated with investing in those securities.
The following is a summary of the inputs used to value the Fund’s holdings at December 31, 2016:
| | | | | | | | |
| Classification(a) | | LEVEL 1
(Quoted Prices) | | | LEVEL 2
(Other Significant
Observable Inputs) | |
Securities | | | | | | | | |
Common Stocks(b) | | $ | 59,822,683,811 | | | $ | — | |
Short-term Investments | | | | | | | | |
Money Market Fund | | | 62,055,950 | | | | — | |
Repurchase Agreement | | | — | | | | 1,754,843,000 | |
| | | | | | | | |
Total Securities | | $ | 59,884,739,761 | | | $ | 1,754,843,000 | |
| | | | | | | | |
Other Financial Instruments | | | | | | | | |
Futures Contracts | | | | | | | | |
Depreciation | | $ | (14,740,454 | ) | | $ | — | |
| | | | | | | | | |
| (a) | There were no transfers between Level 1 and Level 2 during the year ended December 31, 2016. There were no Level 3 securities at December 31, 2016 and 2015, and there were no transfers to Level 3 during the year. |
| (b) | All common stocks held in the Fund are Level 1 securities. For a detailed break-out of common stocks by major industry classification, please refer to the Portfolio of Investments. |
NOTE 3—RELATED PARTY TRANSACTIONS
Management fees Under a written agreement approved by a unanimous vote of the Board of Trustees, the Fund pays an annual management fee of 0.50% of the Fund’s average daily net assets to Dodge & Cox, investment manager of the Fund. The agreement further provides that Dodge & Cox shall waive its fee to the extent that such fee plus all other ordinary operating expenses of the Fund exceed 0.75% of the average daily net assets for the year.
Fund officers and trustees All officers and two of the trustees of the Trust are officers or employees of Dodge & Cox. The Trust pays a fee only to those trustees who are not affiliated with Dodge & Cox.
NOTE 4—INCOME TAX INFORMATION AND DISTRIBUTIONS TO SHAREHOLDERS
A provision for federal income taxes is not required since the Fund intends to continue to qualify as a regulated investment company under Subchapter M of the Internal Revenue Code and distribute all of its taxable income to shareholders. Distributions are determined in accordance with income tax regulations, and such amounts may differ from net investment income and realized gains for financial reporting purposes. Financial reporting records are adjusted for permanent book to tax differences at year end to reflect tax character.
DODGE & COX STOCK FUND §PAGE 11
NOTES TO FINANCIAL STATEMENTS
Book to tax differences are primarily due to differing treatments of wash sales, net short-term realized gain (loss), certain dividends, and futures contracts. At December 31, 2016, the cost of investments for federal income tax purposes was $41,799,114,906.
Distributions during the years noted below were characterized as follows for federal income tax purposes:
| | | | | | | | |
| | | Year Ended December 31, 2016 | | | Year Ended
December 31, 2015 | |
Ordinary income | | | $1,056,249,886 | | | | $813,298,971 | |
| | | ($3.183 per share) | | | | ($2.460 per share) | |
| | |
Long-term capital gain | | | $2,918,315,039 | | | | $2,475,923,268 | |
| | | ($8.899 per share) | | | | ($7.577 per share) | |
At December 31, 2016, the tax basis components of distributable earnings were as follows:
| | | | |
Unrealized appreciation | | $ | 21,008,106,160 | |
Unrealized depreciation | | | (1,167,638,305 | ) |
| | | | |
Net unrealized appreciation | | | 19,840,467,855 | |
Undistributed ordinary income | | | 54,938,850 | |
Undistributed long-term capital gain | | | 878,933,044 | |
Fund management has reviewed the tax positions for open periods (three years and four years, respectively, from filing the Fund’s Federal and State tax returns) as applicable to the Fund, and has determined that no provision for income tax is required in the Fund’s financial statements.
NOTE 5—LOAN FACILITIES
Pursuant to an exemptive order issued by the Securities and Exchange Commission (SEC), the Fund may participate in an interfund lending facility (Facility). The Facility allows the Fund to borrow money from or loan money to the Funds. Loans under the Facility are made for temporary or emergency purposes, such as to fund shareholder redemption requests. Interest on borrowings is the average of the current repurchase agreement rate and the bank loan rate. There was no activity in the Facility during the year.
All Funds in the Trust participate in a $500 million committed credit facility (Line of Credit) with State Street Bank and Trust Company, to be utilized for temporary or emergency purposes to fund shareholder redemptions or for other short-term liquidity purposes. The maximum amount available to the Fund is $250 million. Each Fund pays an annual commitment fee on its pro-rata portion of the Line of Credit. For the year ended December 31, 2016, the Fund’s commitment fee amounted to $281,548 and is reflected as a Miscellaneous Expense in the Statement of Operations. Interest on borrowings is charged at the prevailing rate. There were no borrowings on the Line of Credit during the year.
NOTE 6—PURCHASES AND SALES OF INVESTMENTS
For the year ended December 31, 2016, purchases and sales of securities, other than short-term securities, aggregated $8,789,787,134 and $12,613,765,083, respectively.
NOTE 7—NEW ACCOUNTING GUIDANCE
In October 2016, the SEC issued a new rule, Investment Company Reporting Modernization, which, among other provisions, amends Regulation S-X to require standardized, enhanced disclosures, particularly related to derivatives, in investment company financial statements. Compliance with the guidance is required for financial statements filed with the SEC on or after August 1, 2017. Management is currently assessing the impact of this rule to the Fund’s financial statements and other filings and does not expect any impact to the Fund’s net assets or results of operations.
NOTE 8—SUBSEQUENT EVENTS
Fund management has determined that no material events or transactions occurred subsequent to December 31, 2016, and through the date of the Fund’s financial statements issuance, which require additional disclosure in the Fund’s financial statements.
PAGE 12 § DODGE & COX STOCK FUND
NOTES TO FINANCIAL STATEMENTS
NOTE 9—HOLDINGS OF 5% VOTING SECURITIES
Each of the companies listed below was considered to be an affiliate of the Fund because the Fund owned 5% or more of the company’s voting securities during all or part of the year ended December 31, 2016. Purchase and sale transactions and dividend income earned during the year on these securities were as follows:
| | | | | | | | | | | | | | | | | | | | | | | | |
| | | Shares at
Beginning of Year | | | Additions | | | Reductions | | | Shares at
End of Year | | | Dividend
Income (a) | | | Value at
End of Year | |
ADT Corp. | | | 11,138,437 | | | | — | | | | (11,138,437 | ) | | | — | | | $ | 2,450,456 | | | $ | — | |
Alnylam Pharmaceuticals, Inc. | | | — | | | | 5,430,735 | | | | — | | | | 5,430,735 | | | | — | (b) | | | 203,326,718 | |
Capital One Financial Corp. | | | 29,786,611 | | | | — | | | | (2,618,900 | ) | | | 27,167,711 | | | | 47,658,578 | | | | 2,370,111,108 | |
Celanese Corp., Series A | | | 7,219,998 | | | | 1,029,700 | | | | (470,000 | ) | | | 7,779,698 | | | | 10,190,289 | | | | 612,573,421 | |
Hewlett Packard Enterprise Co. | | | 90,984,995 | | | | 5,017,500 | | | | (2,600,000 | ) | | | 93,402,495 | | | | 21,776,824 | | | | 2,161,333,734 | |
NetApp, Inc. | | | 21,532,731 | | | | 900,000 | | | | (8,064,400 | ) | | | 14,368,331 | | | | 16,053,775 | | | | 506,771,034 | |
Symantec Corp. | | | 54,111,000 | | | | — | | | | (50,770,524 | ) | | | 3,340,476 | | | | 195,525,633 | | | | — | (c) |
Synopsys, Inc. | | | 9,193,469 | | | | — | | | | (1,928,000 | ) | | | 7,265,469 | | | | — | (b) | | | — | (c) |
| | | | | | | | | | | | | | | | | | | | | | | | |
| | | | | | | | | | | | | | | | | | $ | 293,655,555 | | | $ | 5,854,116,015 | |
| | | | | | | | | | | | | | | | | | | | | | | | |
| | | | | | | | | | | | | | | | | | | | | | | | | |
| (a) | Net of foreign taxes, if any |
| (c) | Company was not an affiliate at year end |
FINANCIAL HIGHLIGHTS
| | | | | | | | | | | | | | | | | | | | |
SELECTED DATA AND RATIOS (for a share outstanding throughout each year) | | Year Ended December 31, | |
| | | 2016 | | | 2015 | | | 2014 | | | 2013 | | | 2012 | |
| | | | |
Net asset value, beginning of year | | | $162.77 | | | | $180.94 | | | | $168.87 | | | | $121.90 | | | | $101.64 | |
Income from investment operations: | | | | | | | | | | | | | | | | | | | | |
Net investment income | | | 3.05 | | | | 2.42 | | | | 2.83 | | | | 2.11 | | | | 1.98 | |
Net realized and unrealized gain (loss) | | | 30.56 | | | | (10.55 | ) | | | 14.60 | | | | 46.97 | | | | 20.26 | |
| | | | |
Total from investment operations | | | 33.61 | | | | (8.13 | ) | | | 17.43 | | | | 49.08 | | | | 22.24 | |
| | | | |
Distributions to shareholders from: | | | | | | | | | | | | | | | | | | | | |
Net investment income | | | (3.03 | ) | | | (2.46 | ) | | | (2.80 | ) | | | (2.11 | ) | | | (1.98 | ) |
Net realized gain | | | (9.05 | ) | | | (7.58 | ) | | | (2.56 | ) | | | — | | | | — | |
| | | | |
Total distributions | | | (12.08 | ) | | | (10.04 | ) | | | (5.36 | ) | | | (2.11 | ) | | | (1.98 | ) |
| | | | |
Net asset value, end of year | | | $184.30 | | | | $162.77 | | | | $180.94 | | | | $168.87 | | | | $121.90 | |
| | | | |
Total return | | | 21.27 | % | | | (4.47 | )% | | | 10.43 | % | | | 40.55 | % | | | 22.01 | % |
Ratios/supplemental data: | | | | | | | | | | | | | | | | | | | | |
Net assets, end of year (millions) | | | $61,600 | | | | $54,845 | | | | $60,260 | | | | $54,848 | | | | $39,841 | |
Ratio of expenses to average net assets | | | 0.52 | % | | | 0.52 | % | | | 0.52 | % | | | 0.52 | % | | | 0.52 | % |
Ratio of net investment income to average net assets | | | 1.83 | % | | | 1.36 | % | | | 1.62 | % | | | 1.45 | % | | | 1.72 | % |
Portfolio turnover rate | | | 16 | % | | | 15 | % | | | 17 | % | | | 15 | % | | | 11 | % |
See accompanying Notes to Financial Statements
DODGE & COX STOCK FUND §PAGE 13
REPORT OF INDEPENDENT REGISTERED PUBLIC ACCOUNTING FIRM
To the Trustees of Dodge & Cox Funds and Shareholders of Dodge & Cox Stock Fund
In our opinion, the accompanying statement of assets and liabilities, including the portfolio of investments, and the related statements of operations and of changes in net assets and the financial highlights present fairly, in all material respects, the financial position of Dodge & Cox Stock Fund (one of the series constituting Dodge & Cox Funds, hereafter referred to as the “Fund”) as of December 31, 2016, the results of its operations for the year then ended, the changes in its net assets for each of the two years in the period then ended and the financial highlights for each of the five years in the period then ended, in conformity with accounting principles generally accepted in the United States of America. These financial statements and financial highlights (hereafter referred to as “financial statements”) are the responsibility of the Fund’s management. Our responsibility is to express an opinion on these financial statements based on our audits. We conducted our audits of these financial statements in accordance with the standards of the Public Company Accounting Oversight Board (United States). Those standards require that we plan and perform the audit to obtain reasonable assurance about whether the financial statements are free of material misstatement. An audit includes examining, on a test basis, evidence supporting the amounts and disclosures in the financial statements, assessing the accounting principles used and significant estimates made by management, and evaluating the overall financial statement presentation. We believe that our audits, which included confirmation of securities as of December 31, 2016 by correspondence with the custodian and brokers, provide a reasonable basis for our opinion.
PricewaterhouseCoopers LLP
San Francisco, California
February 15, 2017
PAGE 14 § DODGE & COX STOCK FUND
SPECIAL 2016 TAX INFORMATION
(unaudited)
The following information is provided pursuant to provisions of the Internal Revenue Code:
The Fund designates up to a maximum amount of $1,307,555,855 of its distributions paid to shareholders in 2016 as qualified dividends (treated for federal income tax purposes in the hands of shareholders as taxable at a maximum rate of 20%).
For shareholders that are corporations, the Fund designates 91% of its ordinary dividends paid to shareholders in 2016 as dividends from domestic corporations eligible for the corporate dividends received deduction, provided that the shareholder otherwise satisfies applicable requirements to claim that deduction.
BOARD APPROVAL OF FUNDS’ INVESTMENT MANAGEMENT AGREEMENTS AND MANAGEMENT FEES
(unaudited)
The Board of Trustees is responsible for overseeing the performance of the Dodge & Cox Funds’ investment manager and determining whether to continue the Investment Management Agreements between the Funds and Dodge & Cox each year (the “Agreements”). At a meeting of the Board of Trustees of the Trust held on December 14, 2016, the Trustees, by a unanimous vote (including a separate vote of those Trustees who are not “interested persons” (as defined in the Investment Company Act of 1940) (the “Independent Trustees”)), approved the renewal of the Agreements for an additional one-year term through December 31, 2017 with respect to each Fund. During the course of the year, the Board received extensive information and materials relating to the investment management and administrative services provided by Dodge & Cox and the performance of each of the Funds.
INFORMATION RECEIVED
In 2016, the Board requested and received a series of special presentations relating to the proposed renewal of the Funds’ Agreements. These presentations, which took place over the course of the year, covered, among other things, (i) a report about asset management industry trends and the competitive landscape for Dodge & Cox and the Funds; (ii) an extensive presentation regarding economies of scale, which included materials describing key enhancements over the past 15 years in the scope of services that Dodge & Cox furnishes to the Funds; (iii) a detailed presentation by Morningstar® representatives regarding the format, methodology, and content of Morningstar’s 15(c) report; (iv) materials describing peer fund management fees (including funds with breakpoints) and expense ratios and Dodge & Cox’s separate account advisory fee schedules as compared to those of peer firms; and (v) reports by outside counsel regarding mutual fund litigation trends and developments.
In addition to the foregoing and in advance of the meeting, the Board, including each of the Independent Trustees, requested, received, and reviewed materials relating to the Agreements and the services provided by Dodge & Cox. The Independent Trustees retained Morningstar to prepare an independent expense and
performance summary for each Fund and comparable funds managed by other advisers identified by Morningstar. The Morningstar materials included information regarding advisory fee rates, expense ratios, and transfer agency, custodial, and distribution expenses, as well as appropriate performance comparisons to each Fund’s peer group and an index or combination of indices. The Morningstar materials also included a comparison of expenses of various share classes offered by comparable funds. The materials reviewed by the Board contained information concerning, among other things, Dodge & Cox’s profitability, financial results and condition, advisory fee revenue and separate account fee schedules. The Board additionally considered the Funds’ brokerage commissions, turnover rates, sales and redemption data, and the significant investment that Dodge & Cox makes in research used in managing the Funds. The Board received and reviewed memoranda and related materials addressing, among other things, Dodge & Cox’s services to the Funds; how Dodge & Cox Funds’ fees compare to fees of peer group funds; the different fees, services, costs, and risks associated with other accounts managed by Dodge & Cox as compared to the Dodge & Cox Funds; and the ways in which the Funds realize economies of scale. Throughout the process of reviewing the services provided by Dodge & Cox and preparing for the meeting, the Independent Trustees found Dodge & Cox to be open, forthright, detailed, and very helpful in answering questions about all issues. The Board received copies of the Agreements and a memorandum from the independent legal counsel to the Independent Trustees discussing the factors generally regarded as appropriate to consider in evaluating advisory arrangements. The Trust’s Contract Review Committee, consisting solely of Independent Trustees, met with the independent legal counsel on November 3, 2016 and again on December 14, 2016 to discuss whether to renew the Agreements. The Board, including the Independent Trustees, subsequently concluded that the existing Agreements are fair and reasonable and voted to approve the Agreements. In considering the Agreements, the Board, including the Independent Trustees, did not identify any single factor or particular information as all-important or controlling. In reaching the decision to approve the Agreements, the Board considered several factors, discussed below, to be key factors and reached the conclusions described below.
NATURE, QUALITY, AND EXTENT OF THE SERVICES
The Board considered that Dodge & Cox provides a wide range of services to the Funds in addition to portfolio management and that the quality of these services has been excellent in all respects. The extensive nature of services provided by Dodge & Cox has been documented in materials provided to the Board and in presentations made to the Board throughout the year. In particular, the Board considered the nature, quality, and extent of portfolio management, administrative, and shareholder services performed by Dodge & Cox. With regard to portfolio management services, the Board considered Dodge & Cox’s established long-term history of care and conscientiousness in the management of the Funds; its demonstrated consistency in investment approach and depth; the
DODGE & COX STOCK FUND §PAGE 15
background and experience of the Dodge & Cox Investment Policy Committee, International Investment Policy Committee, Global Stock Investment Policy Committee, Fixed Income Investment Policy Committee, and Global Bond Investment Policy Committee, and research analysts responsible for managing the Funds; Dodge & Cox’s methods for assessing the regulatory and investment climate in various jurisdictions; its overall high level of attention to its core investment management function; and its commitment to the Funds and their shareholders. The Board also considered analysis provided by Morningstar regarding the degree of active management in the Dodge & Cox equity funds and concluded that Dodge & Cox is an active, high conviction manager of equity portfolios, not a “closet index” manager.
In the area of administrative and shareholder services, the Board considered the excellent quality of Dodge & Cox’s work in areas such as compliance, legal services, trading, proxy voting, technology, oversight of the Funds’ transfer agent and custodian, tax compliance, and shareholder communication through its website and other means. The Board also noted Dodge & Cox’s diligent disclosure policy, its favorable compliance record, and its reputation as a trusted, shareholder-friendly mutual fund family.
In addition, the Board considered that Dodge & Cox manages approximately $180 billion in Fund assets with fewer professionals than most comparable funds, and that on average these professionals have more experience and longer tenure than investment professionals at comparable funds. The Board also noted that Dodge & Cox is an investment research-oriented firm with no other business endeavors to distract management’s attention from its research efforts or to present material conflicts of interest with the operations of the Funds, that its investment professionals adhere to a consistent investment approach across the Funds, and that due to its careful and deliberate strategy with respect to new products, Dodge & Cox has had remarkable stability in its mutual fund product offerings over the course of the past 86 years and has the fewest funds of any of the 25 largest mutual fund families by assets. The Board further considered the favorable stewardship grades given by Morningstar to each of the Funds and the “Gold” analyst rating awarded by Morningstar to all of the Funds except the Global Bond Fund. The Board concluded that it was satisfied with the nature, extent, and quality of investment management and other services provided to the Funds by Dodge & Cox.
INVESTMENT PERFORMANCE
The Board considered short-term and long-term investment performance for each Fund (including periods of outperformance or underperformance) as compared to both relevant indices and the performance of such Fund’s peer group. The Board noted that, as of November 30, 2016, the Funds had strong absolute and relative year-to-date performance, and were also generally solid performers over longer periods. The Board determined after extensive review and inquiry that Dodge & Cox’s historic, long-term, team-oriented, bottom-up investment approach remains consistent and that Dodge & Cox continues to be distinguished by its integrity, transparency, and independence. The Board
considered that the performance of the Funds is the result of value-oriented investment management process that emphasizes a long-term investment horizon, comprehensive independent research, team approach, price discipline, low cost, and low portfolio turnover. The Board also considered that the investment performance delivered by Dodge & Cox to the Funds appeared to be consistent with the relevant performance delivered for other clients of Dodge & Cox. The Board concluded that Dodge & Cox has delivered favorable long-term performance for Fund investors consistent with the long-term investment strategies being pursued by the Funds.
COSTS AND ANCILLARY BENEFITS
Costs of Services to Funds: Fees and Expenses. The Board considered each Fund’s management fee rate and expense ratio relative to each Fund’s peer group and relative to management fees charged by Dodge & Cox to other clients. In particular, the Board considered that the Funds continue to be substantially below their peer group median in expense ratios and that many media and industry reports specifically comment on the low expense ratios of the Funds, which have been a defining characteristic of the Funds for many years. The Board also evaluated the operating structures of the Funds and Dodge & Cox, noting that the Funds do not charge front-end sales commissions or distribution fees, and Dodge & Cox bears, among other things, the significant cost of third party research, reimbursement for shareholder recordkeeping and administrative costs to third-party retirement plan administrators, and administrative and office overhead. The Board noted that expenses are well below industry averages.
When compared to peer group funds, the Funds are in the quartile with the lowest expense ratios. The Board also considered that the Funds receive numerous administrative, regulatory compliance, legal, technology, and shareholder support services from Dodge & Cox without any additional administrative fee and the fact that the Funds have relatively low transaction costs and portfolio turnover rates. The Board noted the Funds’ unusual single-share-class structure and reviewed Morningstar data (including asset-weighted average expense ratios) showing that the few peer group funds with lower expense ratios often have other share classes with significantly higher expense ratios. In this regard, the Board considered that many of the Funds’ shareholders would not be eligible to purchase comparably priced shares of many peer group funds, which typically make their lower-priced share classes available only to institutional investors. The Board determined that the Funds provide access for small investors to high quality investment management at a relatively low cost. The Board also considered that the Funds’ are priced to scale, i.e., management fee rates begin at relatively low levels with the result that, even without breakpoints, the Funds’ management fee rates are lower than those of many peer funds whose fee schedules include breakpoints. With respect to non-U.S. funds sponsored and managed by Dodge & Cox that are comparable to the Funds in many respects, the Board noted that the fee rates charged by Dodge & Cox are the same as or higher than the fee rates charged to the Funds.
PAGE 16 § DODGE & COX STOCK FUND
The Board reviewed information regarding the fee rates Dodge & Cox charges to separate accounts that have investment programs similar to those of the Funds, including instances where separate account fees are lower than Fund fees. The Board considered the significant differences in the nature and scope of services Dodge & Cox provides to the Funds as compared to other client accounts, as well as material differences in regulatory, litigation, and other risks as between Dodge & Cox Funds and other types of clients. The Board noted that different markets exist for mutual fund and institutional separate account management services and that a comparison of Fund fee rates and separate account fee rates must consider the fact that separate account clients bear additional costs and responsibilities that are included in the cost of a Fund. The Board further noted that many sophisticated institutional investors in the Funds that are eligible to open separate accounts at Dodge & Cox have decided for various reasons to invest in the Funds. After consideration of these matters, the Board concluded that the overall costs incurred by the Funds for the services they receive (including the management fee paid to Dodge & Cox) are reasonable and that the fees are acceptable based upon the qualifications, experience, reputation, and performance of Dodge & Cox and the low overall expense ratios of the Funds.
Profitability and Costs of Services to Dodge & Cox; “Fall-out” Benefits. The Board reviewed reports of Dodge & Cox’s financial position, profitability, and estimated overall value and considered Dodge & Cox’s overall profitability within its context as a private, employee-owned S-Corporation and relative to the favorable services provided. The Board noted in particular that Dodge & Cox’s profits are not generated by high fee rates, but reflect an extraordinarily streamlined, efficient, and focused business approach toward investment management.
The Board recognized the importance of Dodge & Cox’s profitability—which is derived solely from management fees and does not include other business ventures—to maintain its independence, stability, company culture and ethics, and management continuity. The Board also considered that the compensation/profit structure at Dodge & Cox includes a return on shareholder employees’ investment in the firm, which is vital for remaining independent and facilitating retention of management and investment professionals. The Board considered independent research indicating that firms that grow organically, rather than through acquisition, tend to have better performance. Key to organic growth is the ability to retain talented and experienced analysts, portfolio managers, and other professionals. The Board also considered that in January 2015, Dodge & Cox closed the International Stock Fund to new investors to proactively manage the growth of the Fund. The Stock Fund and Balanced Fund were similarly closed to new investors during periods of significant growth in the past. While these actions are intended to benefit existing Fund shareholders, the effect is to reduce potential revenues to Dodge & Cox from new shareholders.
The Board also considered potential “fall-out” benefits (including the receipt of research from unaffiliated brokers and reputational benefits to non-U.S. funds sponsored and managed by
Dodge & Cox) that Dodge & Cox might receive as a result of its association with the Funds and determined that they are acceptable. The Board also noted that Dodge & Cox continues to invest substantial sums in its business in order to provide enhanced services, systems, and research capabilities, all of which benefit the Funds. The Board concluded that Dodge & Cox’s profitability is the keystone of its independence, stability, and long-term investment performance and that the profitability of Dodge & Cox’s relationship with the Funds (including fall-out benefits) is fair and reasonable.
ECONOMIES OF SCALE
The Board considered whether there have been economies of scale with respect to the management of each Fund, whether the Funds have appropriately benefited from any economies of scale, and whether the management fee rate is reasonable in relation to the level of Fund assets and any economies of scale that may exist. In the Board’s view, any consideration of economies of scale must take account of the Funds’ low fee structure and the considerable efficiencies of the Funds’ organization and fee structure that has been realized by shareholders from the time of each Fund’s inception (i.e., from the first dollar). An assessment of economies of scale must also take into account that Dodge & Cox invests significant time and resources in each new Fund for months (and sometimes years) prior to launch; in addition, expenses are capped, which means that Dodge & Cox subsidizes the operations of a new Fund for a period of time until it reaches scale. The Board observed that, while total Fund assets have grown significantly over the long term, this growth has not been continuous or evenly distributed across all of the Funds, as assets of certain Funds have actually declined over the past ten years.
In addition, the Board noted that Dodge & Cox has shared economies of scale by adding and enhancing services to the Funds over time, and that the internal costs of providing investment management, technology, administrative, legal, and compliance services to the Funds continue to increase. For example, Dodge & Cox has increased its global research staff and investment resources over the years to add important new capabilities for the benefit of Fund shareholders and to address the increased complexity of investing in multinational and non-U.S. companies. In addition, Dodge & Cox has made substantial expenditures in other staff, technology, cybersecurity, and infrastructure to enable it to integrate credit and equity analyses and to be able to implement its strategy in a more effective and secure manner. Over the last ten years, Dodge & Cox has increased its spending on research, investment management, client servicing, and technology including payments for third party research, data services, and computer systems for trading, operations, compliance, accounting, and communications at a rate that has significantly outpaced the Funds’ growth rate during the same period. The Board considered that Dodge & Cox has a history of voluntarily limiting asset growth in several Funds that experienced significant inflows by closing them to new investors in order to protect the Funds’ ability to achieve good investment returns for shareholders. The Board also observed that, even
DODGE & COX STOCK FUND §PAGE 17
without fee breakpoints, the Funds are competitively priced in a very competitive market and that having a low fee from inception is better for shareholders than starting with a higher fee and adding breakpoints. The Board also noted that there may be certain diseconomies of scale associated with managing large funds, insofar as certain of the costs and risks associated with portfolio management increase as assets grow. The Board concluded that the current Dodge & Cox fee structure is fair and reasonable and adequately shares economies of scale that may exist.
CONCLUSION
Based on their evaluation of all material factors and assisted by the advice of independent legal counsel to the Independent Trustees, the Board, including the Independent Trustees, concluded that the advisory fee structure was fair and reasonable, that each Fund was paying a competitive fee for the services provided, that the scope and quality of Dodge & Cox’s services has provided substantial value for Fund shareholders over the long term, and that approval of the Agreements was in the best interests of each Fund and its shareholders.
FUND HOLDINGS
The Fund provides a complete list of its holdings four times each fiscal year, as of the end of each quarter. The Fund files the lists with the Securities and Exchange Commission (SEC) on Form N-CSR (second and fourth quarters) and Form N-Q (first and third quarters). Shareholders may view the Fund’s Forms N-CSR and N-Q on the SEC’s website at sec.gov. Forms N-CSR and N-Q may also be reviewed and copied at the SEC’s Public Reference Room in Washington, DC. Information regarding the operations of the Public Reference Room may be obtained by calling 202-551-8090 (direct) or 800-732-0330 (general SEC number). A list of the Fund’s quarter-end holdings is also available at dodgeandcox.com on or about 15 days following each quarter end and remains available on the website until the list is updated in the subsequent quarter.
PROXY VOTING
For a free copy of the Fund’s proxy voting policies and procedures, please call 800-621-3979, visit the Fund’s website at dodgeandcox.com, or visit the SEC’s website at sec.gov. Information regarding how the Fund voted proxies relating to portfolio securities during the most recent 12-month period ending June 30 is also available at dodgeandcox.com or at sec.gov.
HOUSEHOLD MAILINGS
The Fund routinely mails shareholder reports and summary prospectuses to shareholders and, on occasion, proxy statements. In order to reduce the volume of mail, when possible, only one copy of these documents will be sent to shareholders who are part of the same family and share the same residential address.
If you have a direct account with the Funds and you do not want the mailing of shareholder reports and summary prospectuses combined with other members in your household, contact the Funds at 800-621-3979. Your request will be implemented within 30 days.
PAGE 18 § DODGE & COX STOCK FUND
DODGE & COX FUNDS—EXECUTIVE OFFICER & TRUSTEE INFORMATION
| | | | | | |
Name (Age) and
Address* | | Position with Trust (Year of Election or
Appointment) | | Principal Occupation During Past 5 Years | | Other Directorships Held by Trustees |
| INTERESTED TRUSTEES AND EXECUTIVE OFFICERS |
| Charles F. Pohl (58) | | Chairman and Trustee (Since 2004) | | Chairman (since 2013), Co-President (2011-2013), Senior Vice President (until 2011), and Director of Dodge & Cox; Chief Investment Officer, Portfolio Manager, Investment Analyst, and member of Investment Policy Committee (IPC), Global Stock Investment Policy Committee (GSIPC), International Investment Policy Committee (IIPC), and Fixed Income Investment Policy Committee (FIIPC) | | — |
| Dana M. Emery (55) | | President and Trustee (Trustee since 1993) (President since 2014) | | Chief Executive Officer (since 2013), President (since 2011), Executive Vice President (until 2011), and Director of Dodge & Cox; Director of Fixed Income, Portfolio Manager, and member of FIIPC and Global Bond Investment Policy Committee (GBIPC) | | — |
| Diana S. Strandberg (57) | | Senior Vice President (Since 2006) | | Senior Vice President (since 2011), Vice President (until 2011), and Director (since 2011) of Dodge & Cox; Director of International Equity, Portfolio Manager, Investment Analyst, and member of IPC, GSIPC, IIPC, and GBIPC | | — |
| David H. Longhurst (59) | | Treasurer (Since 2006) | | Vice President and Assistant Treasurer of Dodge & Cox | | — |
| Thomas M. Mistele (63) | | Secretary (Since 1998) | | Chief Operating Officer (until Jan. 2017), Director, Secretary, Senior Counsel (since 2011), and General Counsel (until 2011) of Dodge & Cox | | — |
| Katherine M. Primas (42) | | Chief Compliance Officer (Since 2010) | | Vice President (since 2011) and Chief Compliance Officer of Dodge & Cox | | — |
| INDEPENDENT TRUSTEES |
| Thomas A. Larsen (67) | | Trustee (Since 2002) | | Senior Counsel of Arnold & Porter Kaye Scholer LLP (law firm) (since 2013); Partner of Arnold & Porter LLP (until 2012); Director of Howard, Rice, Nemerovski, Canady, Falk & Rabkin (1977-2011) | | — |
| Ann Mather (56) | | Trustee (Since 2011) | | CFO, Pixar Animation Studios (1999-2004) | | Director, Google, Inc. (internet information services) (since 2005); Director, Glu Mobile, Inc. (multimedia software) (since 2004); Director, Netflix, Inc. (internet television) (since 2010); Director, Arista Networks (cloud networking) (since 2013); Director, Shutterfly, Inc. (internet photography services/publishing) (since 2013) |
| Robert B. Morris III (64) | | Trustee (Since 2011) | | Advisory Director, The Presidio Group (2005-2016); Partner and Managing Director—Global Investment Research at Goldman Sachs (until 2001) | | — |
| Gary Roughead (65) | | Trustee (Since 2013) | | Robert and Marion Oster Distinguished Military Fellow, Hoover Institution (since 2012); Admiral, United States Navy (Ret.); U.S. Navy Chief of Naval Operations (2008-2011) | | Director, Northrop Grumman Corp. (global security) (since 2012); Director, Maersk Line, Limited (shipping and transportation) (since 2016) |
| Mark E. Smith (65) | | Trustee (Since 2014) | | Executive Vice President, Managing Director—Fixed Income at Loomis Sayles & Company, L.P. (2003-2011) | | — |
| John B. Taylor (70) | | Trustee (Since 2005) (and 1995-2001) | | Professor of Economics, Stanford University (since 1984); Senior Fellow, Hoover Institution (since 1996); Under Secretary for International Affairs, United States Treasury (2001-2005) | | — |
| * | | The address for each Officer and Trustee is 555 California Street, 40th Floor, San Francisco, California 94104. Each Officer and Trustee oversees all six series in the Dodge & Cox Funds complex and serves for an indefinite term. |
Additional information about the Trust’s Trustees and Officers is available in the Trust’s Statement of Additional Information (SAI). You can get a free copy of the SAI by visiting the Funds’ website at dodgeandcox.com or calling
800-621-3979.
DODGE & COX STOCK FUND §PAGE 19
dodgeandcox.com
For Fund literature, transactions, and account
information, please visit the Funds’ website.
or write or call:
DODGE & COX FUNDS
c/o Boston Financial Data Services
P.O. Box 8422
Boston, Massachusetts 02266-8422
(800) 621-3979
INVESTMENT MANAGER
Dodge & Cox
555 California Street, 40th Floor
San Francisco, California 94104
(415) 981-1710
This report is submitted for the general information of the shareholders of the Fund. The report is not authorized for distribution to prospective investors in the Fund unless it is accompanied by a current prospectus.
This report reflects our views, opinions, and portfolio holdings as of December 31, 2016, the end of the reporting period. Any such views are subject to change at any time based upon market or other conditions and Dodge & Cox disclaims any responsibility to update such views. These views may not be relied on as investment advice and, because investment decisions for a Dodge & Cox Fund are based on numerous factors, may not be relied on as an indication of trading intent on behalf of any Dodge & Cox Fund.
DODGE & COX FUNDS®
Annual Report
December 31, 2016
Global Stock Fund
ESTABLISHED 2008
TICKER: DODWX
12/16 GSF AR Printed on recycled paper
TO OUR SHAREHOLDERS
The Dodge & Cox Global Stock Fund had a total return of 17.1% for the year ended December 31, 2016, compared to a return of 7.5% for the MSCI World Index.
AN EXTRAORDINARY YEAR
The Fund’s strong absolute and relative performance in 2016 was achieved with largely the same portfolio that produced weak results in 2015. In fact, many of the biggest contributors in 2016 were some of the largest detractors in 2015. The past year’s strong performance also improved the Fund’s longer-term relative results. The Fund’s annualized total return for the past five years was 13.2% versus 10.4% for the MSCI World.
We would like to express sincere appreciation to our fellow shareholders for your patience and confidence in Dodge & Cox. These results serve as a reminder that a single quarter or year is too short an interval over which to judge the success of our strategy. Our bottom-up, value-oriented, active investment approach requires independent thinking to build the level of conviction essential to invest in companies that are out of favor. Stock prices can move dramatically in response to the headlines of the day, but it often takes time for a company’s results to improve and for positive change to be recognized by other investors. Accordingly, maintaining a long-term investment horizon and staying the course when markets move against us are essential for our investment team, as well as for our fellow shareholders. We would be the first to acknowledge this is not easy to do, but our persistence to stick with our convictions in the face of market volatility was rewarded during this past year.
Since its inception on May 1, 2008, the Fund has had an average annualized total return of 4.8% versus 3.9% for the MSCI World. This period encompassed large swings in Fund performance, market prices, and equity valuations, including the 2008-09 global financial crisis and subsequent recovery. More recently, investor concerns have been around global economic growth, lower commodity prices, Brexit, and the U.S. presidential election. Uncertainty is a constant, but it can create compelling opportunities for patient, long-term, value-oriented, active investors. Our recent insight paper, “Understanding the Case for Active Management,” is summarized at the end of the letter and is available in its entirety on our website.
MARKET COMMENTARY
The Fund benefited from two broad market factors. First, in 2015, value stocks underperformed growth stocks globally; in the United States, this underperformance was by one of the widest margins since the global financial crisis. The trend reversed across global equities in 2016 as value stocks outperformed growth stocks by ten percentage points,(a) benefiting the Fund’s value-oriented portfolio. Recently, the more economically sensitive, cyclical sectors of the market (e.g., Energy, Financials) have accounted for a larger portion of the value category than stocks in the more defensive, stable sectors (e.g., Consumer Staples, Telecommunication Services, Utilities). Each group’s equity returns have been highly correlated with interest rate movements in recent years. As
interest rates declined to historically low levels and investors searched for yield in the equity market, defensive stocks with “bond-like” characteristics outperformed the more cyclical stocks. Conversely, as U.S. Treasury yields rose during the second half of 2016, especially after the U.S. election, economically sensitive holdings outperformed considerably. The Fund’s performance in 2016 mirrored this shift: flat in the first half and up 18% in the second half.
Second, as emerging markets lagged developed markets on a multi-year basis through 2015, valuations had become increasingly attractive and the Fund found more investment opportunities. After a dramatic 15% drop in 2015, the MSCI Emerging Markets Index was up 11% in 2016, significantly outpacing the 1% return for developed markets stocks. Many of the Fund’s largest emerging market detractors in 2015 turned out to be the biggest contributors in 2016. For example, Petrobras and Itau Unibanco in Brazil were down 55% and 41%, respectively, in 2015, but were up 159% and 81% in 2016. We added to both holdings as their valuations declined in 2015, which later benefited the Fund.
While valuations have increased, especially in the United States, the portfolio trades at a discount to the overall global equity market (14.5 times forward earnings compared to 16.3 times for the MSCI World).
INVESTMENT STRATEGY
In our experience, the best investment opportunities can frequently be found in areas of greatest skepticism and uncertainty. We search in these areas, which are often characterized by discounted valuations, and attempt to discern which companies have the competitive position and management talent to grow earnings and cash flow over the next three to five years. As long-term investors, our challenge is to assess short-term concerns while investing with an eye toward future prospects. Just as important, we attempt to avoid those companies whose valuations reflect optimism that current conditions will remain intact or significantly improve and thus do not sufficiently compensate us for potential disappointment. When we see long-term value, we often add to positions as valuations decline and other investors become more pessimistic. Two examples include recent activity in the Financials and Health Care sectors, which are discussed below.
Financials
Amid heightened market volatility, we revisited and retested our thinking on many of the Fund’s holdings during 2015 and the first half of 2016. As valuations became more attractive, we concluded market conditions had created long-term investment opportunities in selected economically sensitive companies, especially in Financials. During the global equity market swoon in early 2016 and after steep share price declines following the Brexit vote, we added to several of the Fund’s existing financial services holdings (e.g., Barclays, Goldman Sachs) and initiated new positions (e.g., American Express, Banco Santander, BNP Paribas).(b) Despite low interest rates and global economic challenges, we saw opportunities because many of the portfolio’s holdings traded at
PAGE 2 § DODGE & COX GLOBAL STOCK FUND
relatively inexpensive valuations (at levels not seen since the 2008 global financial crisis) although they had benefited from loan growth and improved credit quality since the crisis.
For the second half of 2016, Financials was the best-performing sector of the MSCI World (up 24%), in large part due to rising U.S. interest rates. While we trimmed selected holdings in response to higher share prices, we maintained a significant overweight position in the sector (27% versus 18% for the MSCI World).(c) Regarding U.S. Financials (13% of the Fund), profits are improving and strong capital positions allow the banks to return significant capital to shareholders via share buybacks and dividends, making them a compelling alternative to other dividend-paying stocks, in our view. As rates increase, profitability within the sector should improve further. The sector also stands to benefit from potential easing of financial regulation by the Trump administration (e.g., The Dodd-Frank Wall Street Reform and Consumer Protection Act could be repealed or modified).
For the Fund’s European and UK Financials (10% of the Fund), valuations remain extremely compelling: these holdings trade at an average level of 0.7 times book value, reflecting continued doubt in the market that these companies will earn sufficient returns on equity. Faced with sluggish global growth and adverse regulatory changes, management teams at many institutions have responded by aggressively cutting operating expenses and eliminating underperforming businesses. As a result, many of these banks are better positioned to expand profitability in an improving environment.
While we trimmed Financials on a net basis during the fourth quarter, we opportunistically added to Wells Fargo (up only 5% for 2016), which detracted from relative performance and was weak among bank stocks due to regulatory infractions and fines. We were disappointed to learn about the bank’s sales practices that resulted in improper account openings, but are convinced Wells Fargo is actively addressing the issues. After a comprehensive review, we believe Wells Fargo’s superior franchise, deep management team, track record of generating higher returns than other banks, and attractive valuation at 1.6 times book value make it an attractive long-term investment opportunity. On December 31, Wells Fargo was a 1.8% position in the Fund.
Health Care
Health Care was the worst-performing sector (down 7%) of the MSCI World in 2016. Share prices for pharmaceutical companies were hurt by concerns about lower drug pricing in the United States, as pharmacy benefit managers have consolidated their market shares and exerted more pricing power. Since profits generated in the United States represent a substantial share of total profits for the global industry, many believe the outlook for long-term profitability is in question. While we acknowledge this risk, we believe the Fund’s pharmaceutical holdings are compelling at recent, lower valuations of 14.7 times forward earnings, which do not appropriately reflect the long-term potential for growth in cash flow and earnings. For example, several companies in the Fund’s portfolio have navigated through the most challenging wave of patent expirations, and their intensive research and development efforts are bearing fruit with meaningful new drug
launches. We added tactically to several holdings (e.g., AstraZeneca, Sanofi) as valuations became more attractive during the second half of 2016.
AstraZeneca, which is based in the United Kingdom, is a global pharmaceutical company with strengths in treatment for cancer and respiratory, cardiovascular, and infectious diseases. The share price has been under pressure due to recent and upcoming patent expirations for major drugs. Despite this headwind, the long-term growth outlook is favorable because of the company’s robust new drug pipeline, particularly in oncology. AstraZeneca has an attractive position in the revolutionary field of cancer immunotherapy, which harnesses the disease-fighting capabilities of the body’s immune system to reduce and potentially eliminate cancer tumors. With a 4.6% dividend yield, the current valuation is reasonable and does not appear to reflect the potential success of the immunotherapy drug pipeline.
IN CLOSING
Long-term, value-oriented investing is a humbling but hopefully rewarding endeavor. It requires forming independent opinions that may be very different from the consensus view and maintaining mental and emotional discipline in the face of inevitable market fluctuations. It is possible that we will buy shares of a company too early and that business conditions may not improve as we expect. Those challenges are well worth the potential for superior, long-term investment returns.
2016 was a vivid example of these perils and rewards. The significant market swings in the first half of the year highlighted the difficulty in predicting what the markets will do. Fortunately, our discipline paid off as the Fund’s strategy did well in the second half of the year. We do not know what the future holds, but we will continue to apply the bottom-up, value-oriented investment approach that has served us well for decades.
We want to express gratitude to the Fund’s shareholders for taking the long view and having confidence in Dodge & Cox. Our strategy requires patience and persistence, and we thank you for yours.
As always, we welcome your comments and questions.
For the Board of Trustees,
| | |
| | |
Charles F. Pohl, Chairman | | Dana M. Emery, President |
January 31, 2017
| (a) | | The MSCI World Value Index outperformed the MSCI World Growth Index by 10.0 percentage points during 2016. Generally, stocks that have lower valuations are “value” stocks, while those with higher valuations are “growth” stocks. |
| (b) | | The use of specific examples does not imply that they are more attractive investments than the Fund’s other holdings. |
| (c) | | Unless otherwise specified, all weightings and characteristics are as of December 31, 2016. |
DODGE & COX GLOBAL STOCK FUND §PAGE 3
UNDERSTANDING THE CASE FOR ACTIVE MANAGEMENT
One of the fiercest investment debates concerns active versus passive approaches to investing: Should investors actively choose individual investments in the hopes of beating the market, or choose a fund that tracks an index and matches the return of the market, never doing better, but never doing worse?
The most frequently cited evidence against active management is that the majority of active managers fail to beat their benchmark each year. But measuring on a 12-month basis doesn’t necessarily capture the results of an active management strategy because it often takes more than a year for a strategy to come to fruition. When measurement intervals are lengthened, the results of the active versus passive comparison are significantly different—a higher percentage of active managers outperform their benchmarks. To be sure, outperformance over the long run is nowhere near a sure thing, but the data suggests active management is an eminently viable choice.
One of the attributes of successful active managers is having a high “active share,” meaning their portfolio is significantly different from an index. Another attribute is having low fees and low portfolio turnover, which reduce the drag on performance exerted by expenses. Successful active managers also tend to provide higher risk-adjusted returns, because unlike index funds, they aren’t obliged to invest in higher risk companies. Studies also show that active managers do better when they are tightly focused on specific strategies and markets and when they have a significant financial stake in their funds.
Research indicates that the average U.S. mutual fund investor earns two percentage points less per year than the average fund because many investors move in and out of funds too quickly. But if investors have the discipline to stick with good active managers through inevitable periods of underperformance, they can have meaningful prospects of outperforming the market over time.
A summary from Dodge & Cox’s insight paper titled, “Understanding the Case for Active Management.”
PAGE 4 § DODGE & COX GLOBAL STOCK FUND
ANNUAL PERFORMANCE REVIEW
The Fund outperformed the MSCI World by 9.6 percentage points in 2016.
Key Contributors to Relative Results
| | § | | Strong returns from the Fund’s holdings in emerging markets (up 23%), specifically in Brazil, contributed to performance. Petrobras (up 159%) and Itau Unibanco (up 81%) were particularly strong. | |
| | § | | Relative returns in the Financials sector (up 16% compared to up 10% for the MSCI World sector), combined with a higher average weighting (26% versus 17%), had a positive impact. Goldman Sachs (up 35%) and Bank of America (up 33%) performed well. | |
| | § | | Strong returns from the Fund’s holdings in the Information Technology sector (up 22% compared to up 11% for the MSCI World sector) bolstered results. Hewlett Packard Enterprise (up 54%) and Samsung Electronics (up 29%) were notable contributors. | |
| | § | | Additional contributors included Teck Resources (up 201% to date of sale), Sprint (up 133%), and Time Warner, Inc. (up 52%). | |
Key Detractors from Relative Results
| | § | | The Fund’s average overweight position in the Health Care sector (15% versus 13% for the MSCI World sector) hindered results because this was the weakest sector of the market (down 7%). Express Scripts (down 21%), Roche (down 15%), and Novartis (down 14%) performed poorly. | |
| | § | | Additional detractors included Saipem (down 43%) and Credit Suisse (down 30%). | |
KEY CHARACTERISTICS OF DODGE & COX
Independent Organization
Dodge & Cox is one of the largest privately owned investment managers in the world. We remain committed to independence, with a goal of providing the highest quality investment management service to our existing clients.
Over 85 Years of Investment Experience
Dodge & Cox was founded in 1930. We have a stable and well-qualified team of investment professionals, most of whom have spent their entire careers at Dodge & Cox.
Experienced Investment Team
The Global Stock Investment Policy Committee, which is the decision-making body for the Global Stock Fund, is an eight-member committee with an average tenure at Dodge & Cox of 21 years.
One Business with a Single Research Office
Dodge & Cox manages equity (domestic, international, and global), fixed income (domestic and global), and balanced investments, operating from one office in San Francisco.
Consistent Investment Approach
Our team decision-making process involves thorough, bottom-up fundamental analysis of each investment.
Long-Term Focus and Low Expenses
We invest with a three- to five-year investment horizon, which has historically resulted in low turnover relative to our peers. We manage Funds that maintain low expense ratios.
Risks: The Fund is subject to market risk, meaning holdings in the Fund may decline in value for extended periods due to the financial prospects of individual companies, or due to general market and economic conditions. Investing in non-U.S. securities may entail risk due to foreign economic and political developments; this risk may be increased when investing in emerging markets. The Fund is also subject to currency risk. Please read the prospectus and summary prospectus for specific details regarding the Fund’s risk profile.
DODGE & COX GLOBAL STOCK FUND §PAGE 5
GROWTH OF $10,000 SINCE INCEPTION
FOR AN INVESTMENT MADE ON MAY 1, 2008
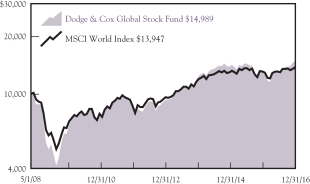
AVERAGE ANNUAL TOTAL RETURN
FOR PERIODS ENDED DECEMBER 31, 2016
| | | | | | | | | | | | | | | | |
| | | 1 Year | | | 3 Years | | | 5 Years | | | Since
Inception
(5/1/08) | |
Dodge & Cox Global Stock Fund | | | 17.09 | % | | | 4.82 | % | | | 13.18 | % | | | 4.78 | % |
MSCI World Index | | | 7.51 | | | | 3.80 | | | | 10.41 | | | | 3.91 | |
Returns represent past performance and do not guarantee future results. Investment return and share price will fluctuate with market conditions, and investors may have a gain or loss when shares are sold. Fund performance changes over time and currently may be significantly lower than stated. Performance is updated and published monthly. Visit the Fund’s website at dodgeandcox.com or call 800-621-3979 for current performance figures.
The Fund’s total returns include the reinvestment of dividend and capital gain distributions, but have not been adjusted for any income taxes payable by shareholders on these distributions or on Fund share redemptions. Index returns include dividends but, unlike Fund returns, do not reflect fees or expenses. The MSCI World Index is a broad-based, unmanaged equity market index aggregated from 23 developed market country indices, including the United States. MSCI makes no express or implied warranties or representations and shall have no liability whatsoever with respect to any MSCI data contained herein. The MSCI data may not be further redistributed or used as a basis for other indices or any securities or financial products. This report is not approved, reviewed, or produced by MSCI.
MSCI World is a service mark of MSCI Barra.
FUND EXPENSE EXAMPLE
As a Fund shareholder, you incur ongoing Fund costs, including management fees and other Fund expenses. All mutual funds have ongoing costs, sometimes referred to as operating expenses. The following example shows ongoing costs of investing in the Fund and can help you understand these costs and compare them with those of other mutual funds. The example assumes a $1,000 investment held for the six months indicated.
ACTUAL EXPENSES
The first line of the table below provides information about actual account values and expenses based on the Fund’s actual returns. You may use the information in this line, together with your account balance, to estimate the expenses that you paid over the period. Simply divide your account value by $1,000 (for example, an $8,600 account value divided by $1,000 = 8.6), then multiply the result by the number in the first line under the heading “Expenses Paid During Period” to estimate the expenses you paid on your account during this period.
HYPOTHETICAL EXAMPLE FOR COMPARISON WITH OTHER MUTUAL FUNDS
Information on the second line of the table can help you compare ongoing costs of investing in the Fund with those of other mutual funds. This information may not be used to estimate the actual ending account balance or expenses you paid during the period. The hypothetical “Ending Account Value” is based on the actual expense ratio of the Fund and an assumed 5% annual rate of return before expenses (not the Fund’s actual return). The amount under the heading “Expenses Paid During Period” shows the hypothetical expenses your account would have incurred under this scenario. You can compare this figure with the 5% hypothetical examples that appear in shareholder reports of other mutual funds.
| | | | | | | | | | | | |
Six Months Ended December 31, 2016 | | Beginning Account Value
7/1/2016 | | | Ending Account Value
12/31/2016 | | | Expenses Paid During Period* | |
Based on Actual Fund Return | | $ | 1,000.00 | | | $ | 1,176.60 | | | $ | 3.41 | |
Based on Hypothetical 5% Yearly Return | | | 1,000.00 | | | | 1,022.00 | | | | 3.17 | |
| * | | Expenses are equal to the Fund’s annualized expense ratio of 0.62%, multiplied by the average account value over the period, multiplied by 184/366 (to reflect the one-half year period). |
The expenses shown in the table highlight ongoing costs only and do not reflect any transactional fees or account maintenance fees. Though other mutual funds may charge such fees, please note that the Fund does not charge transaction fees (e.g., redemption fees, sales loads) or universal account maintenance fees (e.g., small account fees).
PAGE 6 § DODGE & COX GLOBAL STOCK FUND
| | | | |
| FUND INFORMATION (unaudited) | | | December 31, 2016 | |
| | | | |
| GENERAL INFORMATION | | | |
Net Asset Value Per Share | | | $11.91 | |
Total Net Assets (billions) | | | $7.1 | |
Expense Ratio | | | 0.63% | |
Portfolio Turnover Rate | | | 25% | |
30-Day SEC Yield(a) | | | 1.14% | |
Number of Companies | | | 84 | |
Fund Inception | | | 2008 | |
| No sales charges or distribution fees | | | | |
Investment Manager: Dodge & Cox, San Francisco. Managed by the Global Stock Investment Policy Committee, whose eight members’ average tenure at Dodge & Cox is 21 years.
| | | | | | | | |
| PORTFOLIO CHARACTERISTICS | | Fund | | | MSCI
World | |
Median Market Capitalization (billions) | | | $39 | | | | $11 | |
Weighted Average Market Capitalization (billions) | | | $89 | | | | $99 | |
Price-to-Earnings Ratio(b) | | | 14.5x | | | | 16.3x | |
Countries Represented | | | 20 | | | | 23 | |
Emerging Markets (Brazil, China, India, Mexico, South Africa, South Korea, Thailand, Turkey) | | | 15.7% | | | | 0.0% | |
| | | | |
| TEN LARGEST HOLDINGS (%)(c) | | Fund | |
Sanofi (France) | | | 2.8 | |
Barclays PLC (United Kingdom) | | | 2.7 | |
Hewlett Packard Enterprise Co. (United States) | | | 2.6 | |
Alphabet, Inc. (United States) | | | 2.5 | |
Bank of America Corp. (United States) | | | 2.5 | |
Goldman Sachs Group, Inc. (United States) | | | 2.5 | |
Naspers, Ltd. (South Africa) | | | 2.4 | |
Novartis AG (Switzerland) | | | 2.3 | |
Samsung Electronics Co., Ltd. (South Korea) | | | 2.2 | |
Charles Schwab Corp. (United States) | | | 2.1 | |
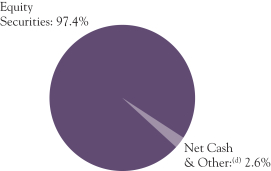
| | | | | | | | |
| REGION DIVERSIFICATION(%)(e) | | Fund | | | MSCI
World | |
United States | | | 49.5 | | | | 60.1 | |
Europe (excluding United Kingdom) | | | 20.5 | | | | 16.2 | |
Pacific (excluding Japan) | | | 9.2 | | | | 4.4 | |
United Kingdom | | | 8.9 | | | | 6.7 | |
Latin America | | | 4.0 | | | | 0.0 | |
Africa/Middle East | | | 3.7 | | | | 0.3 | |
Japan | | | 1.6 | | | | 8.7 | |
Canada | | | 0.0 | | | | 3.6 | |
| | | | | | | | |
| SECTOR DIVERSIFICATION(%) | | Fund | | | MSCI
World | |
Financials | | | 27.3 | | | | 18.0 | |
Consumer Discretionary | | | 19.3 | | | | 12.3 | |
Health Care | | | 15.5 | | | | 12.0 | |
Information Technology | | | 14.6 | | | | 14.6 | |
Energy | | | 7.4 | | | | 7.3 | |
Industrials | | | 4.4 | | | | 11.2 | |
Telecommunication Services | | | 3.7 | | | | 3.4 | |
Materials | | | 2.8 | | | | 5.0 | |
Real Estate | | | 1.3 | | | | 3.2 | |
Consumer Staples | | | 1.1 | | | | 9.8 | |
Utilities | | | 0.0 | | | | 3.2 | |
| (a) | SEC Yield is an annualization of the Fund’s net investment income for the trailing 30-day period. Dividends paid by the Fund may be higher or lower than implied by the SEC Yield. |
| (b) | Price-to-earnings (P/E) ratios are calculated using 12-month forward earnings estimates from third-party sources. |
| (c) | The Fund’s portfolio holdings are subject to change without notice. The mention of specific securities is not a recommendation to buy, sell, or hold any particular security and is not indicative of Dodge & Cox’s current or future trading activity. |
| (d) | Net Cash & Other includes cash, short-term investments, receivables, and payables. |
| (e) | The Fund may classify a company in a different category than the MSCI World. The Fund generally classifies a company based on its country of incorporation, but may designate a different country in certain circumstances. |
DODGE & COX GLOBAL STOCK FUND §PAGE 7
| | | | |
| CONSOLIDATED PORTFOLIO OF INVESTMENTS | | | December 31, 2016 | |
| | | | | | | | |
| COMMON STOCKS: 93.2% | |
| | |
| | | SHARES | | | VALUE | |
| CONSUMER DISCRETIONARY: 19.3% | |
AUTOMOBILES & COMPONENTS: 2.9% | |
Adient PLC(a) (Ireland) | | | 122,154 | | | $ | 7,158,224 | |
Bayerische Motoren Werke AG (Germany) | | | 620,200 | | | | 58,064,883 | |
Honda Motor Co., Ltd. (Japan) | | | 2,722,500 | | | | 79,260,568 | |
Mahindra & Mahindra, Ltd. (India) | | | 1,851,005 | | | | 32,024,071 | |
Yamaha Motor Co., Ltd. (Japan) | | | 1,448,400 | | | | 31,778,430 | |
| | | | | | | | |
| | | | | | | 208,286,176 | |
CONSUMER DURABLES & APPAREL: 0.4% | |
Coach, Inc. (United States) | | | 779,700 | | | | 27,305,094 | |
MEDIA: 12.5% | |
Altice NV, Series A(a) (Netherlands) | | | 3,459,444 | | | | 68,428,146 | |
Charter Communications, Inc., Class A(a) (United States) | | | 486,297 | | | | 140,014,632 | |
Comcast Corp., Class A (United States) | | | 1,080,400 | | | | 74,601,620 | |
DISH Network Corp., Class A(a) (United States) | | | 1,073,300 | | | | 62,176,269 | |
Grupo Televisa SAB ADR (Mexico) | | | 3,701,700 | | | | 77,328,513 | |
Liberty Global PLC LiLAC, Series A(a) (United Kingdom) | | | 767,200 | | | | 16,847,712 | |
Liberty Global PLC LiLAC, Series C(a) (United Kingdom) | | | 788,562 | | | | 16,693,857 | |
Liberty Global PLC, Series C(a) (United Kingdom) | | | 3,045,600 | | | | 90,454,320 | |
Naspers, Ltd. (South Africa) | | | 1,188,600 | | | | 173,185,217 | |
Television Broadcasts, Ltd. (Hong Kong) | | | 2,509,500 | | | | 8,251,497 | |
Time Warner, Inc. (United States) | | | 874,166 | | | | 84,383,244 | |
Twenty-First Century Fox, Inc., Class A (United States) | | | 2,600,400 | | | | 72,915,216 | |
| | | | | | | | |
| | | | | | | 885,280,243 | |
RETAILING: 3.5% | |
JD.com, Inc. ADR(a) (Cayman Islands/China) | | | 4,326,800 | | | | 110,073,792 | |
Target Corp. (United States) | | | 615,600 | | | | 44,464,788 | |
The Priceline Group, Inc.(a) (United States) | | | 65,700 | | | | 96,320,142 | |
| | | | | | | | |
| | | | | | | 250,858,722 | |
| | | | | | | | |
| | | | | | | 1,371,730,235 | |
| CONSUMER STAPLES: 1.1% | |
FOOD & STAPLES RETAILING: 0.8% | |
Wal-Mart Stores, Inc. (United States) | | | 826,600 | | | | 57,134,592 | |
FOOD, BEVERAGE & TOBACCO: 0.3% | |
Anadolu Efes Biracilik ve Malt Sanayii AS (Turkey) | | | 4,140,285 | | | | 20,689,644 | |
| | | | | | | | |
| | | | | | | 77,824,236 | |
| ENERGY: 6.4% | |
Anadarko Petroleum Corp. (United States) | | | 1,713,100 | | | | 119,454,463 | |
Apache Corp. (United States) | | | 1,271,732 | | | | 80,716,830 | |
Baker Hughes, Inc. (United States) | | | 722,505 | | | | 46,941,150 | |
National Oilwell Varco, Inc. (United States) | | | 1,573,700 | | | | 58,919,328 | |
Saipem SPA(a) (Italy) | | | 58,742,301 | | | | 32,868,142 | |
Schlumberger, Ltd. (Curacao/United States) | | | 1,089,600 | | | | 91,471,920 | |
Weatherford International PLC(a) (Ireland) | | | 4,409,375 | | | | 22,002,781 | |
| | | | | | | | |
| | | | | | | 452,374,614 | |
| FINANCIALS: 25.4% | |
BANKS: 13.3% | |
Banco Santander SA (Spain) | | | 6,907,028 | | | | 36,056,298 | |
Bank of America Corp. (United States) | | | 7,968,100 | | | | 176,095,010 | |
| | | | | | | | |
| | |
| | | SHARES | | | VALUE | |
Barclays PLC (United Kingdom) | | | 70,304,300 | | | $ | 193,123,792 | |
BNP Paribas SA (France) | | | 1,316,900 | | | | 83,888,369 | |
ICICI Bank, Ltd. (India) | | | 35,108,015 | | | | 131,510,118 | |
Kasikornbank PCL- Foreign (Thailand) | | | 6,693,800 | | | | 33,067,554 | |
Standard Chartered PLC(a) (United Kingdom) | | | 15,456,877 | | | | 126,597,599 | |
UniCredit SPA (Italy) | | | 12,289,260 | | | | 35,328,995 | |
Wells Fargo & Co. (United States) | | | 2,371,873 | | | | 130,713,921 | |
| | | | | | | | |
| | | | | | | 946,381,656 | |
DIVERSIFIED FINANCIALS: 9.9% | |
American Express Co. (United States) | | | 1,307,400 | | | | 96,852,192 | |
Bank of New York Mellon Corp. (United States) | | | 1,351,700 | | | | 64,043,546 | |
Capital One Financial Corp. (United States) | | | 1,517,100 | | | | 132,351,804 | |
Charles Schwab Corp. (United States) | | | 3,732,200 | | | | 147,309,934 | |
Credit Suisse Group AG (Switzerland) | | | 5,880,533 | | | | 83,968,236 | |
Goldman Sachs Group, Inc. (United States) | | | 727,000 | | | | 174,080,150 | |
| | | | | | | | |
| | | | | | | 698,605,862 | |
INSURANCE: 2.2% | |
AEGON NV (Netherlands) | | | 11,489,708 | | | | 63,182,684 | |
Aviva PLC (United Kingdom) | | | 15,812,720 | | | | 94,356,177 | |
| | | | | | | | |
| | | | | | | 157,538,861 | |
| | | | | | | | |
| | | | | | | 1,802,526,379 | |
| HEALTH CARE: 15.5% | |
HEALTH CARE EQUIPMENT & SERVICES: 4.8% | |
Anthem, Inc. (United States) | | | 291,288 | | | | 41,878,476 | |
Cigna Corp. (United States) | | | 829,800 | | | | 110,687,022 | |
Express Scripts Holding Co.(a) (United States) | | | 1,031,600 | | | | 70,963,764 | |
UnitedHealth Group, Inc. (United States) | | | 717,600 | | | | 114,844,704 | |
| | | | | | | | |
| | | | | | | 338,373,966 | |
PHARMACEUTICALS, BIOTECHNOLOGY & LIFE SCIENCES: 10.7% | |
Alnylam Pharmaceuticals, Inc.(a) (United States) | | | 672,200 | | | | 25,167,168 | |
AstraZeneca PLC (United Kingdom) | | | 1,752,040 | | | | 95,018,884 | |
Bayer AG (Germany) | | | 687,020 | | | | 71,674,025 | |
Bristol-Myers Squibb Co. (United States) | | | 1,165,700 | | | | 68,123,508 | |
Merck & Co., Inc. (United States) | | | 507,900 | | | | 29,900,073 | |
Novartis AG (Switzerland) | | | 1,669,300 | | | | 121,422,628 | |
Novartis AG ADR (Switzerland) | | | 571,000 | | | | 41,591,640 | |
Roche Holding AG (Switzerland) | | | 485,400 | | | | 110,599,946 | |
Sanofi (France) | | | 2,453,662 | | | | 198,442,078 | |
| | | | | | | | |
| | | | | | | 761,939,950 | |
| | | | | | | | |
| | | | | | | 1,100,313,916 | |
| INDUSTRIALS: 4.4% | |
CAPITAL GOODS: 2.3% | |
Johnson Controls International PLC (Ireland) | | | 1,221,540 | | | | 50,315,232 | |
Schneider Electric SA (France) | | | 1,656,078 | | | | 115,076,977 | |
| | | | | | | | |
| | | | | | | 165,392,209 | |
TRANSPORTATION: 2.1% | |
FedEx Corp. (United States) | | | 382,400 | | | $ | 71,202,880 | |
Union Pacific Corp. (United States) | | | 720,100 | | | | 74,659,968 | |
| | | | | | | | |
| | | | | | | 145,862,848 | |
| | | | | | | | |
| | | | | | | 311,255,057 | |
| | |
| PAGE 8 § DODGE & COX GLOBAL STOCK FUND | | See accompanying Notes to Consolidated Financial Statements |
| | | | |
| CONSOLIDATED PORTFOLIO OF INVESTMENTS | | | December 31, 2016 | |
| | | | | | | | |
| COMMON STOCKS (continued) | |
| | |
| | | SHARES | | | VALUE | |
| INFORMATION TECHNOLOGY: 13.3% | |
SOFTWARE & SERVICES: 6.3% | |
Alphabet, Inc., Class C(a) (United States) | | | 229,099 | | | $ | 176,823,190 | |
Baidu, Inc. ADR(a) (Cayman Islands/China) | | | 521,200 | | | | 85,690,492 | |
Dell Technologies, Inc., Class V(a) (United States) | | | 1,306,216 | | | | 71,802,694 | |
Microsoft Corp. (United States) | | | 1,438,200 | | | | 89,369,748 | |
VMware, Inc.(a) (United States) | | | 336,293 | | | | 26,476,348 | |
| | | | | | | | |
| | | | | | | 450,162,472 | |
TECHNOLOGY, HARDWARE & EQUIPMENT: 7.0% | |
Cisco Systems, Inc. (United States) | | | 3,379,600 | | | | 102,131,512 | |
Hewlett Packard Enterprise Co. (United States) | | | 7,997,700 | | | | 185,066,778 | |
HP Inc. (United States) | | | 4,418,100 | | | | 65,564,604 | |
Juniper Networks, Inc. (United States) | | | 713,268 | | | | 20,156,954 | |
Samsung Electronics Co., Ltd. (South Korea) | | | 44,417 | | | | 65,628,691 | |
TE Connectivity, Ltd. (Switzerland) | | | 810,115 | | | | 56,124,767 | |
| | | | | | | | |
| | | | | | | 494,673,306 | |
| | | | | | | | |
| | | | | | | 944,835,778 | |
| MATERIALS: 2.8% | |
Celanese Corp., Series A (United States) | | | 821,200 | | | | 64,661,288 | |
LafargeHolcim, Ltd. (Switzerland) | | | 1,199,020 | | | | 62,985,220 | |
Linde AG (Germany) | | | 419,710 | | | | 68,821,592 | |
| | | | | | | | |
| | | | | | | 196,468,100 | |
| REAL ESTATE: 1.3% | |
Hang Lung Properties, Ltd. (Hong Kong) | | | 14,826,000 | | | | 31,043,185 | |
Hang Lung Group, Ltd. (Hong Kong) | | | 18,662,100 | | | | 64,875,173 | |
| | | | | | | | |
| | | | | | | 95,918,358 | |
| TELECOMMUNICATION SERVICES: 3.7% | |
Millicom International Cellular SA SDR (Luxembourg) | | | 1,127,200 | | | | 48,146,155 | |
MTN Group, Ltd. (South Africa) | | | 9,594,400 | | | | 87,636,181 | |
Sprint Corp.(a) (United States) | | | 11,201,000 | | | | 94,312,420 | |
Zayo Group Holdings, Inc.(a) (United States) | | | 1,024,300 | | | | 33,658,498 | |
| | | | | | | | |
| | | | | | | 263,753,254 | |
TOTAL COMMON STOCKS (Cost $5,603,397,312) | | | | | | $ | 6,616,999,927 | |
|
| PREFERRED STOCKS: 4.2% | |
| ENERGY: 1.0% | |
Petroleo Brasileiro SA ADR(a) (Brazil) | | | 8,127,903 | | | | 71,606,826 | |
| FINANCIALS: 1.9% | |
BANKS: 1.9% | |
Itau Unibanco Holding SA (Brazil) | | | 12,858,629 | | | | 132,589,935 | |
| INFORMATION TECHNOLOGY: 1.3% | |
TECHNOLOGY, HARDWARE & EQUIPMENT: 1.3% | |
Samsung Electronics Co., Ltd. (South Korea) | | | 80,014 | | | | 94,088,463 | |
| | | | | | | | |
TOTAL PREFERRED STOCKS (Cost $192,045,307) | | | | | | $ | 298,285,224 | |
| | | | | | | | |
| SHORT-TERM INVESTMENTS: 2.1% | |
| | |
| | | PAR VALUE | | | VALUE | |
MONEY MARKET FUND: 0.1% | |
State Street Institutional Treasury Plus Money Market Fund | | $ | 7,126,571 | | | $ | 7,126,571 | |
|
REPURCHASE AGREEMENT: 0.1% | |
Fixed Income Clearing Corporation(b) 0.10%, dated 12/30/16, due 1/3/17, maturity value $6,787,075 | | | 6,787,000 | | | | 6,787,000 | |
|
TREASURY BILL: 1.9% | |
Canadian Treasury Bill (Canada) 2/9/17 | | CAD | 185,000,000 | | | | 137,723,830 | |
| | | | | | | | |
TOTAL SHORT-TERM INVESTMENTS (Cost $151,806,105) | | | $ | 151,637,401 | |
| | | | | | | | |
TOTAL INVESTMENTS (Cost $5,947,248,724) | | | 99.5 | % | | $ | 7,066,922,552 | |
OTHER ASSETS LESS LIABILITIES | | | 0.5 | % | | | 34,306,085 | |
| | | | | | | | |
| NET ASSETS | | | 100.0 | % | | $ | 7,101,228,637 | |
| | | | | | | | |
| (b) | Repurchase agreement is collateralized by U.S. Treasury Inflation Indexed Note 0.125%, 4/15/19 and U.S. Treasury Notes 3.125%, 5/15/19. Total collateral value is $6,926,059. |
In determining a company’s country designation, the Fund generally references the country of incorporation. In cases where the Fund considers the country of incorporation to be a “jurisdiction of convenience” chosen primarily for tax purposes or in other limited circumstances, the Fund uses the country designation of an appropriate broad-based market index. In those cases, two countries are listed—the country of incorporation and the country designated by an appropriate index, respectively.
ADR: American Depositary Receipt
SDR: Swedish Depository Receipt
CAD: Canadian Dollar
FUTURES CONTRACTS
| | | | | | | | | | | | | | | | |
| Description | | Number of
Contracts | | | Expiration
Date | | | Notional
Amount | | | Unrealized
Appreciation/
(Depreciation) | |
E-mini S&P 500 Index—Long Position | | | 1,140 | | | | Mar 2017 | | | $ | 127,463,400 | | | $ | (1,005,516 | ) |
| | |
| See accompanying Notes to Consolidated Financial Statements | | DODGE & COX GLOBAL STOCK FUND §PAGE 9 |
| | | | |
| CONSOLIDATED PORTFOLIO OF INVESTMENTS | | | December 31, 2016 | |
FORWARD CURRENCY CONTRACTS
| | | | | | | | | | | | | | | | |
| | | | | | Contract Amount | | | | |
| Counterparty | | Settle Date | | | Receive U.S.
Dollar | | | Deliver
Foreign
Currency | | | Unrealized
Appreciation/
(Depreciation) | |
Contracts to sell CHF: | |
Goldman Sachs | | | 1/11/17 | | | | 30,341,340 | | | | 30,000,000 | | | $ | 868,028 | |
UBS | | | 1/11/17 | | | | 30,332,444 | | | | 30,000,000 | | | | 859,132 | |
Goldman Sachs | | | 1/18/17 | | | | 15,250,334 | | | | 15,000,000 | | | | 506,190 | |
Contracts to sell CNH: | |
Citibank | | | 1/25/17 | | | | 20,345,864 | | | | 134,600,100 | | | | 1,189,588 | |
JPMorgan | | | 1/25/17 | | | | 10,720,689 | | | | 70,998,300 | | | | 616,216 | |
JPMorgan | | | 1/25/17 | | | | 10,721,083 | | | | 70,998,300 | | | | 616,611 | |
Citibank | | | 2/15/17 | | | | 10,716,725 | | | | 70,998,300 | | | | 669,761 | |
JPMorgan | | | 2/15/17 | | | | 4,281,891 | | | | 28,399,300 | | | | 263,109 | |
JPMorgan | | | 2/15/17 | | | | 10,724,009 | | | | 70,998,300 | | | | 677,046 | |
JPMorgan | | | 2/15/17 | | | | 10,700,573 | | | | 70,998,300 | | | | 653,610 | |
UBS | | | 2/22/17 | | | | 40,505,172 | | | | 273,328,900 | | | | 1,886,538 | |
Citibank | | | 3/1/17 | | | | 18,197,829 | | | | 120,697,100 | | | | 1,171,001 | |
Citibank | | | 3/1/17 | | | | 18,200,573 | | | | 120,697,100 | | | | 1,173,745 | |
Credit Suisse | | | 3/8/17 | | | | 11,709,600 | | | | 79,330,200 | | | | 534,243 | |
UBS | | | 3/8/17 | | | | 29,281,795 | | | | 198,325,600 | | | | 1,343,388 | |
Citibank | | | 3/15/17 | | | | 7,742,944 | | | | 51,391,000 | | | | 511,167 | |
Citibank | | | 3/15/17 | | | | 13,888,767 | | | | 92,297,800 | | | | 900,557 | |
JPMorgan | | | 3/15/17 | | | | 7,722,310 | | | | 51,280,900 | | | | 506,026 | |
JPMorgan | | | 3/15/17 | | | | 7,744,907 | | | | 51,391,100 | | | | 513,116 | |
Bank of America | | | 3/22/17 | | | | 8,001,894 | | | | 54,088,800 | | | | 398,616 | |
UBS | | | 3/22/17 | | | | 28,569,426 | | | | 193,243,600 | | | | 1,405,120 | |
Citibank | | | 3/29/17 | | | | 7,197,617 | | | | 47,720,200 | | | | 496,737 | |
Citibank | | | 3/29/17 | | | | 14,391,212 | | | | 95,440,500 | | | | 989,438 | |
Citibank | | | 3/29/17 | | | | 11,049,940 | | | | 73,415,800 | | | | 740,879 | |
HSBC | | | 3/29/17 | | | | 8,251,895 | | | | 54,635,800 | | | | 579,926 | |
JPMorgan | | | 3/29/17 | | | | 14,375,734 | | | | 95,440,500 | | | | 973,961 | |
JPMorgan | | | 3/29/17 | | | | 4,416,923 | | | | 29,284,200 | | | | 304,830 | |
Credit Suisse | | | 4/26/17 | | | | 40,049,516 | | | | 275,000,000 | | | | 1,575,753 | |
Bank of America | | | 6/14/17 | | | | 45,169,031 | | | | 320,000,000 | | | | 673,098 | |
Contracts to sell EUR: | |
Credit Suisse | | | 2/15/17 | | | | 25,054,200 | | | | 23,250,000 | | | | 529,543 | |
JPMorgan | | | 2/15/17 | | | | 13,763,944 | | | | 12,750,000 | | | | 314,938 | |
Bank of America | | | 2/22/17 | | | | 8,521,720 | | | | 8,000,000 | | | | 80,429 | |
Barclays | | | 3/1/17 | | | | 20,507,365 | | | | 19,000,000 | | | | 452,882 | |
HSBC | | | 3/8/17 | | | | 11,863,401 | | | | 11,000,000 | | | | 248,848 | |
| | | | |
| Counterparty | | Settle Date | | | Deliver U.S.
Dollar | | | Receive
Foreign
Currency | | | Unrealized
Appreciation/
(Depreciation) | |
Contracts to buy EUR: | |
JPMorgan | | | 2/15/17 | | | | 13,405,286 | | | | 12,750,000 | | | | 43,719 | |
| | | | | | | | | | | | | | | | |
| | | | | | | | | | | | | | $ | 25,267,789 | |
| | | | | | | | | | | | | | | | |
| | |
| PAGE 10 § DODGE & COX GLOBAL STOCK FUND | | See accompanying Notes to Consolidated Financial Statements |
| | |
CONSOLIDATED STATEMENT OF ASSETS AND LIABILITIES |
| |
| | | December 31, 2016 |
| | | | |
ASSETS: | | | | |
Investments, at value (cost $5,947,248,724) | | $ | 7,066,922,552 | |
Unrealized appreciation on forward currency contracts | | | 25,267,789 | |
Cash | | | 100 | |
Cash denominated in foreign currency (cost $597,861) | | | 596,151 | |
Cash held at broker | | | 5,415,002 | |
Receivable for investments sold | | | 2,351,221 | |
Receivable for Fund shares sold | | | 3,596,615 | |
Dividends and interest receivable | | | 11,847,236 | |
Prepaid expenses and other assets | | | 50,342 | |
| | | | |
| | | 7,116,047,008 | |
| | | | |
LIABILITIES: | | | | |
Payable for investments purchased | | | 2,344,427 | |
Payable to broker for variation margin | | | 507,300 | |
Payable for Fund shares redeemed | | | 7,948,302 | |
Management fees payable | | | 3,620,492 | |
Accrued expenses | | | 397,850 | |
| | | | |
| | | 14,818,371 | |
| | | | |
NET ASSETS | | $ | 7,101,228,637 | |
| | | | |
NET ASSETS CONSIST OF: | | | | |
Paid in capital | | $ | 5,900,388,930 | |
Undistributed net investment income | | | 1,478,327 | |
Undistributed net realized gain | | | 55,804,331 | |
Net unrealized appreciation | | | 1,143,557,049 | |
| | | | |
| | $ | 7,101,228,637 | |
| | | | |
Fund shares outstanding (par value $0.01 each,
unlimited shares authorized) | | | 596,382,564 | |
Net asset value per share | | $ | 11.91 | |
|
CONSOLIDATED STATEMENT OF OPERATIONS | |
| |
| | | Year Ended
December 31, 2016 | |
INVESTMENT INCOME: | | | | |
Dividends (net of foreign taxes of $5,196,074) | | $ | 120,738,177 | |
Interest | | | 166,843 | |
| | | | |
| | | 120,905,020 | |
| | | | |
EXPENSES: | | | | |
Management fees | | | 36,428,607 | |
Custody and fund accounting fees | | | 516,265 | |
Transfer agent fees | | | 388,314 | |
Professional services | | | 61,555 | |
Shareholder reports | | | 41,807 | |
Registration fees | | | 68,071 | |
Trustees’ fees | | | 247,500 | |
ADR depositary service fees | | | 371,729 | |
Miscellaneous | | | 111,105 | |
| | | | |
| | | 38,234,953 | |
| | | | |
NET INVESTMENT INCOME | | | 82,670,067 | |
| | | | |
REALIZED AND UNREALIZED GAIN (LOSS): | | | | |
Net realized gain | | | | |
Investments | | | 94,943,681 | |
Futures contracts | | | 17,595,743 | |
Forward currency contracts | | | 7,468,455 | |
Foreign currency transactions | | | 312,198 | |
Net change in unrealized appreciation/depreciation | | | | |
Investments | | | 806,811,865 | |
Futures contracts | | | (1,005,516 | ) |
Forward currency contracts | | | 24,446,887 | |
Foreign currency translation | | | 347,185 | |
| | | | |
Net realized and unrealized gain | | | 950,920,498 | |
| | | | |
NET CHANGE IN NET ASSETS
FROM OPERATIONS | | $ | 1,033,590,565 | |
| | | | |
| | | | | | | | |
CONSOLIDATED STATEMENT OF CHANGES IN NET ASSETS | |
| | |
| | | Year Ended
December 31, 2016 | | | Year Ended
December 31, 2015 | |
OPERATIONS: | | | | | | | | |
Net investment income | | $ | 82,670,067 | | | $ | 86,138,246 | |
Net realized gain | | | 120,320,077 | | | | 153,809,472 | |
Net change in unrealized appreciation/depreciation | | | 830,600,421 | | | | (764,683,319 | ) |
| | | | | | | | |
| | | 1,033,590,565 | | | | (524,735,601 | ) |
| | | | | | | | |
| | |
DISTRIBUTIONS TO SHAREHOLDERS FROM: | | | | | | | | |
Net investment income | | | (81,276,853 | ) | | | (98,070,160 | ) |
Net realized gain | | | (116,688,671 | ) | | | (119,687,722 | ) |
| | | | | | | | |
Total distributions | | | (197,965,524 | ) | | | (217,757,882 | ) |
| | | | | | | | |
| | |
FUND SHARE TRANSACTIONS: | | | | | | | | |
Proceeds from sale of shares | | | 1,117,120,169 | | | | 1,649,174,317 | |
Reinvestment of distributions | | | 192,513,037 | | | | 211,165,760 | |
Cost of shares redeemed | | | (751,808,292 | ) | | | (1,305,398,436 | ) |
| | | | | | | | |
Net change from Fund share transactions | | | 557,824,914 | | | | 554,941,641 | |
| | | | | | | | |
Total change in net assets | | | 1,393,449,955 | | | | (187,551,842 | ) |
| | |
NET ASSETS: | | | | | | | | |
Beginning of year | | | 5,707,778,682 | | | | 5,895,330,524 | |
| | | | | | | | |
End of year (including undistributed net investment income of $1,478,327 and $337,857, respectively) | | $ | 7,101,228,637 | | | $ | 5,707,778,682 | |
| | | | | | | | |
| | |
SHARE INFORMATION: | | | | | | | | |
Shares sold | | | 103,526,092 | | | | 141,279,760 | |
Distributions reinvested | | | 16,029,395 | | | | 20,441,990 | |
Shares redeemed | | | (69,004,235 | ) | | | (114,061,371 | ) |
| | | | | | | | |
Net change in shares outstanding | | | 50,551,252 | | | | 47,660,379 | |
| | | | | | | | |
| | |
| See accompanying Notes to Consolidated Financial Statements | | DODGE & COX GLOBAL STOCK FUND §PAGE 11 |
NOTES TO CONSOLIDATED FINANCIAL STATEMENTS
NOTE 1—ORGANIZATION AND SIGNIFICANT ACCOUNTING POLICIES
Dodge & Cox Global Stock Fund (the “Fund”) is one of the series constituting the Dodge & Cox Funds (the “Trust” or the “Funds”). The Trust is organized as a Delaware statutory trust and is registered under the Investment Company Act of 1940, as amended, as an open-end management investment company. The Fund commenced operations on May 1, 2008, and seeks long-term growth of principal and income. The Fund invests primarily in a diversified portfolio of U.S. and foreign equity securities. Foreign investing, especially in developing countries, has special risks such as currency and market volatility and political and social instability. These and other risk considerations are discussed in the Fund’s Prospectus.
The financial statements have been prepared in conformity with accounting principles generally accepted in the United States of America, which require the use of estimates and assumptions by management. Actual results may differ from those estimates. Significant accounting policies are as follows:
Security valuation The Fund’s net assets are typically valued as of the normally scheduled close of trading on the New York Stock Exchange (NYSE), generally 4:00 p.m. Eastern Time, each day that the NYSE is open for business.
Portfolio securities and other financial instruments for which market quotes are readily available are valued at market value. Listed securities are generally valued using the official quoted close price or the last sale on the exchange that is determined to be the primary market for the security. Security values are not discounted based on the size of the Fund’s position. Short-term securities less than 60 days to maturity may be valued at amortized cost if amortized cost approximates current value. Mutual funds are valued at their respective net asset values.
Investments initially valued in currencies other than the U.S. dollar are converted to the U.S. dollar using prevailing exchange rates. Forward currency contracts are valued based on the prevailing forward exchange rates of the underlying currencies. As a result, the Fund’s net assets may be affected by changes in the value of currencies in relation to the U.S. dollar.
If market quotations are not readily available or if a security’s value is believed to have materially changed after the close of the security’s primary market but before the close of trading on the NYSE, the security is valued at fair value as determined in good faith by or under the direction of the Fund’s Board of Trustees. The Board of Trustees has appointed Dodge & Cox, the Fund’s investment manager, to make fair value determinations in accordance with the Dodge & Cox Funds Valuation Policies (“Valuation Policies”), subject to Board oversight. Dodge & Cox has established a Pricing Committee that is comprised of representatives from Treasury, Legal, Compliance, and Operations. The Pricing Committee is responsible for implementing the Valuation Policies, including determining the fair value of securities when market quotations or market-based valuations are not readily available or are deemed unreliable. The Pricing
Committee considers relevant indications of value that are reasonably available to it in determining the fair value assigned to a particular security, such as the value of similar financial instruments, trading volumes, contractual restrictions on disposition, related corporate actions, and changes in economic conditions. In doing so, the Pricing Committee employs various methods for calibrating fair valuation approaches, including a regular review of key inputs and assumptions, back-testing, and review of any related market activity.
As trading in securities on most foreign exchanges is normally completed before the close of the NYSE, the value of non-U.S. securities can change by the time the Fund calculates its NAV. To address these changes, the Fund may utilize adjustment factors provided by an independent pricing service to systematically value non-U.S. securities at fair value. These adjustment factors are based on statistical analyses of subsequent movements and changes in U.S. markets and financial instruments trading in U.S. markets that represent foreign securities or baskets of securities.
Valuing securities through a fair value determination involves greater reliance on judgment than valuation of securities based on readily available market quotations. In some instances, lack of information and uncertainty as to the significance of information may lead to a conclusion that a prior valuation is the best indication of a security’s value. When fair value pricing is employed, the prices of securities used by the Fund to calculate its NAV may differ from quoted or published prices for the same securities.
Security transactions, investment income, expenses, and distributions Security transactions are recorded on the trade date. Realized gains and losses on securities sold are determined on the basis of identified cost.
Dividend income and corporate action transactions are recorded on the ex-dividend date, or when the Fund first learns of the dividend/corporate action if the ex-dividend date has passed. Non-cash dividends included in dividend income, if any, are recorded at the fair market value of the securities received. Dividends characterized as return of capital for U.S. tax purposes are recorded as a reduction of cost of investments and/or realized gain. Interest income is recorded on the accrual basis.
Expenses are recorded on the accrual basis. Some expenses of the Trust can be directly attributed to a specific series. Expenses which cannot be directly attributed are allocated among the Funds in the Trust using methodologies determined by the nature of the expense.
Distributions to shareholders are recorded on the ex-dividend date.
Foreign taxes The Fund is subject to foreign taxes which may be imposed by certain countries in which the Fund invests. The Fund endeavors to record foreign taxes based on applicable foreign tax law. Withholding taxes are incurred on certain foreign dividends and are accrued at the time the associated dividend is recorded. The Fund files withholding tax reclaims in certain jurisdictions to recover a portion of amounts previously withheld. The Fund records a reclaim receivable based on, among other things, a jurisdiction’s legal obligation to pay reclaims as well as
PAGE 12 § DODGE & COX GLOBAL STOCK FUND
NOTES TO CONSOLIDATED FINANCIAL STATEMENTS
payment history and market convention. In consideration of recent decisions rendered by European courts, the Fund has filed for additional reclaims related to prior years. A corresponding receivable is established when both the amount is known and significant contingencies or uncertainties regarding collectability are removed. These amounts, if any, are reported in “dividends and interest receivable” on the Consolidated Statement of Assets and Liabilities.
Capital gains taxes are incurred upon disposition of certain foreign securities. Expected capital gains taxes on appreciated securities are accrued as unrealized losses and incurred capital gains taxes are reflected as realized losses upon the sale of the related security. Currency taxes may be incurred when the Fund purchases certain foreign currencies related to securities transactions and are recorded as realized losses on foreign currency transactions.
Repurchase agreements The Fund enters into repurchase agreements, secured by U.S. government or agency securities, which involve the purchase of securities from a counterparty with a simultaneous commitment to resell the securities at an agreed-upon date and price. It is the Fund’s policy that its custodian take possession of the underlying collateral securities, the fair value of which exceeds the principal amount of the repurchase transaction, including accrued interest, at all times. In the event of default by the counterparty, the Fund has the contractual right to liquidate the collateral securities and to apply the proceeds in satisfaction of the obligation.
Futures Contracts Futures contracts involve an obligation to purchase or sell (depending on whether the Fund has entered a long or short futures contract, respectively) an asset at a future date, at a price set at the time of the contract. Upon entering into a futures contract, the Fund is required to deposit an amount of cash or liquid assets (referred to as initial margin) in a segregated account with the clearing broker. Subsequent payments (referred to as variation margin) to and from the clearing broker are made on a daily basis based on changes in the market value of futures contracts. Futures contracts are traded publicly and their market value changes daily. Changes in the market value of open futures contracts are recorded as unrealized appreciation or depreciation in the Statement of Operations. Realized gains and losses on futures contracts are recorded in the Statement of Operations at the closing or expiration of the contracts. Cash deposited with a broker as initial margin is recorded on the Statement of Assets and Liabilities. A receivable and/or payable to brokers for daily variation margin is also recorded on the Statement of Assets and Liabilities.
Investments in futures contracts may include certain risks, which may be different from, and potentially greater than, those of the underlying securities. To the extent the Fund uses futures, it is exposed to additional volatility and potential losses resulting from leverage.
The Fund entered into long S&P 500 futures contracts to provide equity exposure that approximates the Fund’s “net cash and other” position, which includes cash, short-term investments, receivables, and payables. During the year ended December 31, 2016, these S&P 500 futures contracts had notional values ranging from 1% to 3% of net assets.
Forward currency contracts A forward currency contract represents an obligation to purchase or sell a specific foreign currency at a future date at a price set at the time of the contract. The values of the forward currency contracts are adjusted daily based on the prevailing forward exchange rates of the underlying currencies. Changes in the value of open contracts are recorded as unrealized appreciation or depreciation in the Consolidated Statement of Operations. When the forward currency contract is closed, the Fund records a realized gain or loss in the Consolidated Statement of Operations equal to the difference between the value at the time the contract was opened and the value at the time it was closed. Losses from these transactions may arise from unfavorable changes in currency values or if the counterparties do not perform under a contract’s terms.
The Fund has maintained forward currency contracts to hedge direct and/or indirect foreign currency exposure to the Chinese yuan renminbi, euro, and Swiss franc. During the year ended December 31, 2016, these forward currency contracts had U.S. dollar total values ranging from 3% to 9% of net assets.
Foreign currency translation The books and records of the Fund are maintained in U.S. dollars. Foreign currency amounts are translated into U.S. dollars at the prevailing exchange rates of such currencies against the U.S. dollar. The market value of investment securities and other assets and liabilities are translated at the exchange rate as of the valuation date. Purchases and sales of investment securities, income, and expenses are translated at the exchange rate prevailing on the transaction date.
Reported realized and unrealized gain (loss) on investments include foreign currency gain (loss) related to investment transactions.
Reported realized and unrealized gain (loss) on foreign currency transactions and translation include the following: disposing/holding of foreign currency, the difference between the trade and settlement dates on securities transactions, the difference between the accrual and payment dates on dividends, and currency losses on the purchase of foreign currency in certain countries that impose taxes on such transactions.
Consolidation The Fund may invest in certain securities through its wholly owned subsidiary, Dodge & Cox Global Stock Fund Cayman, Ltd. (the “Subsidiary”). The Subsidiary is a Cayman Islands exempted company and invests in certain securities consistent with the investment objective of the Fund. The Fund’s Consolidated Financial Statements, including the Consolidated Portfolio of Investments, consist of the holdings and accounts of the Fund and the Subsidiary. All intercompany transactions and balances have been eliminated. At December 31, 2016, the Subsidiary had net assets of $100, which represented less than 0.01% of the Fund’s consolidated net assets.
Indemnification Under the Trust’s organizational documents, its officers and trustees are indemnified against certain liabilities arising out of the performance of their duties to the Trust. In addition, in the normal course of business the Trust enters into contracts that provide general indemnities to other
DODGE & COX GLOBAL STOCK FUND §PAGE 13
NOTES TO CONSOLIDATED FINANCIAL STATEMENTS
parties. The Trust’s maximum exposure under these arrangements is unknown as this would involve future claims that may be made against the Trust that have not yet occurred.
NOTE 2—VALUATION MEASUREMENTS
Various inputs are used in determining the value of the Fund’s investments and other financial instruments. These inputs are summarized in the three broad levels listed below.
| § | | Level 1: Quoted prices in active markets for identical securities |
| § | | Level 2: Other significant observable inputs (including quoted prices for similar securities, market indices, interest rates, credit risk, forward exchange rates, etc.) |
| § | | Level 3: Significant unobservable inputs (including Fund management’s assumptions in determining the fair value of investments) |
The inputs or methodology used for valuing securities are not necessarily an indication of the risk associated with investing in those securities.
The following is a summary of the inputs used to value the Fund’s holdings at December 31, 2016:
| | | | | | | | |
| Classification(a) | | LEVEL 1
(Quoted Prices) | | | LEVEL 2
(Other Significant
Observable Inputs) | |
Securities | | | | | | | | |
Common Stocks | | | | | | | | |
Consumer Discretionary | | $ | 920,737,424 | | | $ | 450,992,811 | |
Consumer Staples | | | 57,134,592 | | | | 20,689,644 | |
Energy | | | 419,506,472 | | | | 32,868,142 | |
Financials | | | 921,446,557 | | | | 881,079,822 | |
Health Care | | | 503,156,355 | | | | 597,157,561 | |
Industrials | | | 196,178,080 | | | | 115,076,977 | |
Information Technology | | | 879,207,087 | | | | 65,628,691 | |
Materials | | | 64,661,288 | | | | 131,806,812 | |
Real Estate | | | — | | | | 95,918,358 | |
Telecommunication Services | | | 127,970,918 | | | | 135,782,336 | |
Preferred Stocks | | | | | | | | |
Energy | | | 71,606,826 | | | | — | |
Financials | | | — | | | | 132,589,935 | |
Information Technology | | | — | | | | 94,088,463 | |
Short-term Investments | | | | | | | | |
Money Market Fund | | | 7,126,571 | | | | — | |
Repurchase Agreement | | | — | | | | 6,787,000 | |
Treasury Bill | | | — | | | | 137,723,830 | |
| | | | | | | | |
Total Securities | | $ | 4,168,732,170 | | | $ | 2,898,190,382 | |
| | | | | | | | |
Other Financial Instruments | | | | | | | | |
Futures Contracts | | | | | | | | |
Depreciation | | $ | (1,005,516 | ) | | $ | — | |
Forward Currency Contracts | | | | | | | | |
Appreciation | | $ | — | | | $ | 25,267,789 | |
| | | | | | | | | |
| (a) | Transfers during the year between Level 1 and Level 2 relate to the use of systematic fair valuation (see Note 1). On days when systematic fair valuation is used, securities whose primary market closes before the NYSE are classified as Level 2. There were no Level 3 securities at December 31, 2016 and 2015, and there were no transfers to Level 3 during the year. |
NOTE 3—ADDITIONAL DERIVATIVES INFORMATION
The Fund has entered into over-the-counter derivatives, such as forward currency contracts (each, a “Derivative”). Each Derivative is subject to a negotiated master agreement (based on a form published by the International Swaps and Derivatives Association (“ISDA”)) governing all Derivatives between the Fund and the relevant dealer counterparty. The master agreements specify (i) events of default and other events permitting a party to terminate some or all of the Derivatives thereunder and (ii) the process by which those Derivatives will be valued for purposes of determining termination payments. If some or all of the Derivatives under a master agreement are terminated because of an event of default or similar event, the values of all terminated Derivatives must be netted to determine a single payment owed by one party to the other. Some master agreements contain collateral terms requiring the parties to post collateral in respect of some or all of the Derivatives thereunder based on the net market value of those Derivatives, subject to a minimum exposure threshold. To the extent amounts owed to the Fund by its counterparties are not collateralized, the Fund is at risk of those counterparties’ non-performance. The Fund attempts to mitigate counterparty credit risk by entering into Derivatives only with counterparties it believes to be of good credit quality and by monitoring the financial stability of those counterparties.
At December 31, 2016, all Derivative positions qualify for netting pursuant to master netting arrangements. For financial reporting purposes, the Fund does not offset financial assets and liabilities that are subject to a master netting arrangement in the Consolidated Statement of Assets and Liabilities. Gross assets and liabilities related to Derivatives are presented as “unrealized appreciation on forward currency contracts” and “unrealized depreciation on forward currency contracts,” respectively, in the Consolidated Statement of Assets and Liabilities. Derivative information by counterparty is presented in the Consolidated Portfolio of Investments. At December 31, 2016, no collateral is pledged or held by the Fund for Derivatives.
NOTE 4—RELATED PARTY TRANSACTIONS
Management fees Under a written agreement approved by a unanimous vote of the Board of Trustees, the Fund pays an annual management fee of 0.60% of the Fund’s average daily net assets to Dodge & Cox, investment manager of the Fund.
Fund officers and trustees All officers and two of the trustees of the Trust are officers or employees of Dodge & Cox. The Trust pays a fee only to those trustees who are not affiliated with Dodge & Cox.
NOTE 5—INCOME TAX INFORMATION AND DISTRIBUTIONS TO SHAREHOLDERS
A provision for federal income taxes is not required since the Fund intends to qualify as a regulated investment company under Subchapter M of the Internal Revenue Code and distribute all of its taxable income to shareholders. Distributions are determined in accordance with income tax regulations, and such amounts may
PAGE 14 § DODGE & COX GLOBAL STOCK FUND
NOTES TO CONSOLIDATED FINANCIAL STATEMENTS
differ from net investment income and realized gains for financial reporting purposes. Financial reporting records are adjusted for permanent book to tax differences at year end to reflect tax character.
Book to tax differences are primarily due to differing treatments of wash sales, net short-term realized gain (loss), futures contracts, investments in passive foreign investment companies, foreign capital gain taxes, and foreign currency realized gain (loss). At December 31, 2016, the cost of investments for federal income tax purposes was $5,963,345,468.
Distributions during the years noted below were characterized as follows for federal income tax purposes:
| | | | | | | | |
| | | Year Ended December 31, 2016 | | | Year Ended December 31, 2015 | |
Ordinary income | | | $113,206,589 | | | | $112,306,144 | |
| | | ($0.195 per share) | | | | ($0.213 per share) | |
| | |
Long-term capital gain | | | $84,758,935 | | | | $105,451,738 | |
| | | ($0.146 per share) | | | | ($0.200 per share) | |
At December 31, 2016, the tax basis components of distributable earnings were as follows:
| | | | |
Unrealized appreciation | | | $1,534,430,850 | |
Unrealized depreciation | | | (430,853,766 | ) |
| | | | |
Net unrealized appreciation | | | 1,103,577,084 | |
Undistributed ordinary income | | | 17,790,961 | |
Undistributed long-term capital gain | | | 79,850,715 | |
Fund management has reviewed the tax positions for open periods (three years and four years, respectively, from filing the Fund’s Federal and State tax returns) as applicable to the Fund, and has determined that no provision for income tax is required in the Fund’s financial statements.
NOTE 6—LOAN FACILITIES
Pursuant to an exemptive order issued by the Securities and Exchange Commission (SEC), the Fund may participate in an interfund lending facility (Facility). The Facility allows the Fund to borrow money from or loan money to the Funds. Loans under
the Facility are made for temporary or emergency purposes, such as to fund shareholder redemption requests. Interest on borrowings is the average of the current repurchase agreement rate and the bank loan rate. There was no activity in the Facility during the year.
All Funds in the Trust participate in a $500 million committed credit facility (Line of Credit) with State Street Bank and Trust Company, to be utilized for temporary or emergency purposes to fund shareholder redemptions or for other short-term liquidity purposes. The maximum amount available to the Fund is $250 million. Each Fund pays an annual commitment fee on its pro-rata portion of the Line of Credit. For the year ended December 31, 2016, the Fund’s commitment fee amounted to $31,228 and is reflected as a Miscellaneous Expense in the Consolidated Statement of Operations. Interest on borrowings is charged at the prevailing rate. There were no borrowings on the Line of Credit during the year.
NOTE 7—PURCHASES AND SALES OF INVESTMENTS
For the year ended December 31, 2016, purchases and sales of securities, other than short-term securities, aggregated $1,945,089,872 and $1,508,125,089, respectively.
NOTE 8—NEW ACCOUNTING GUIDANCE
In October 2016, the SEC issued a new rule, Investment Company Reporting Modernization, which, among other provisions, amends Regulation S-X to require standardized, enhanced disclosures, particularly related to derivatives, in investment company financial statements. Compliance with the guidance is required for financial statements filed with the SEC on or after August 1, 2017. Management is currently assessing the impact of this rule to the Fund’s financial statements and other filings and does not expect any impact to the Fund’s net assets or results of operations.
NOTE 9—SUBSEQUENT EVENTS
Fund management has determined that no material events or transactions occurred subsequent to December 31, 2016, and through the date of the Fund’s financial statements issuance, which require additional disclosure in the Fund’s financial statements.
DODGE & COX GLOBAL STOCK FUND §PAGE 15
CONSOLIDATED FINANCIAL HIGHLIGHTS
| | | | | | | | | | | | | | | | | | | | |
SELECTED DATA AND RATIOS (for a share outstanding throughout each year) | | Year Ended December 31, | |
| | | 2016 | | | 2015 | | | 2014 | | | 2013 | | | 2012 | |
| | | | |
Net asset value, beginning of year | | | $10.46 | | | | $11.83 | | | | $11.48 | | | | $8.99 | | | | $7.68 | |
Income from investment operations: | | | | | | | | | | | | | | | | | | | | |
Net investment income | | | 0.14 | | | | 0.16 | | | | 0.16 | | | | 0.16 | | | | 0.15 | |
Net realized and unrealized gain (loss) | | | 1.65 | | | | (1.11 | ) | | | 0.64 | | | | 2.81 | | | | 1.48 | |
| | | | |
Total from investment operations | | | 1.79 | | | | (0.95 | ) | | | 0.80 | | | | 2.97 | | | | 1.63 | |
| | | | |
Distributions to shareholders from: | | | | | | | | | | | | | | | | | | | | |
Net investment income | | | (0.14 | ) | | | (0.19 | ) | | | (0.15 | ) | | | (0.16 | ) | | | (0.15 | ) |
Net realized gain | | | (0.20 | ) | | | (0.23 | ) | | | (0.30 | ) | | | (0.32 | ) | | | (0.17 | ) |
| | | | |
Total distributions | | | (0.34 | ) | | | (0.42 | ) | | | (0.45 | ) | | | (0.48 | ) | | | (0.32 | ) |
| | | | |
Net asset value, end of year | | | $11.91 | | | | $10.46 | | | | $11.83 | | | | $11.48 | | | | $8.99 | |
| | | | |
Total return | | | 17.09 | % | | | (8.05 | )% | | | 6.95 | % | | | 33.17 | % | | | 21.11 | % |
Ratios/supplemental data: | | | | | | | | | | | | | | | | | | | | |
Net assets, end of year (millions) | | | $7,101 | | | | $5,708 | | | | $5,895 | | | | $3,924 | | | | $2,695 | |
Ratio of expenses to average net assets | | | 0.63 | % | | | 0.63 | % | | | 0.65 | % | | | 0.65 | % | | | 0.65 | % |
Ratio of net investment income to average net assets | | | 1.36 | % | | | 1.39 | % | | | 1.42 | % | | | 1.58 | % | | | 1.93 | % |
Portfolio turnover rate | | | 25 | % | | | 20 | % | | | 17 | % | | | 24 | % | | | 12 | % |
See accompanying Notes to Consolidated Financial Statements
PAGE 16 § DODGE & COX GLOBAL STOCK FUND
REPORT OF INDEPENDENT REGISTERED PUBLIC ACCOUNTING FIRM
To the Trustees of Dodge & Cox Funds and Shareholders of Dodge & Cox Global Stock Fund
In our opinion, the accompanying consolidated statement of assets and liabilities, including the consolidated portfolio of investments, and the related consolidated statements of operations and of changes in net assets and the consolidated financial highlights present fairly, in all material respects, the financial position of Dodge & Cox Global Stock Fund and its subsidiary (one of the series constituting Dodge & Cox Funds, hereafter referred to as the “Fund”) as of December 31, 2016, the results of their operations for the year then ended, the changes in their net assets for each of the two years in the period then ended and the financial highlights for each of the five years in the period then ended, in conformity with accounting principles generally accepted in the United States of America. These consolidated financial statements and consolidated financial highlights (hereafter referred to as “financial statements”) are the responsibility of the Fund’s management. Our responsibility is to express an opinion on these financial statements based on our audits. We conducted our audits of these financial statements in accordance with the standards of the Public Company Accounting Oversight Board (United States). Those standards require that we plan and perform the audit to obtain reasonable assurance about whether the financial statements are free of material misstatement. An audit includes examining, on a test basis, evidence supporting the amounts and disclosures in the financial statements, assessing the accounting principles used and significant estimates made by management, and evaluating the overall financial statement presentation. We believe that our audits, which included confirmation of securities as of December 31, 2016 by correspondence with the custodian and brokers, provide a reasonable basis for our opinion.
PricewaterhouseCoopers LLP
San Francisco, California
February 15, 2017
DODGE & COX GLOBAL STOCK FUND §PAGE 17
SPECIAL 2016 TAX INFORMATION
(unaudited)
The following information is provided pursuant to provisions of the Internal Revenue Code:
In 2016, the Fund elected to pass through to shareholders foreign source income of $80,586,011 and foreign taxes paid of $4,996,137.
The Fund designates $115,993,717 of its distributions paid to shareholders in 2016 as qualified dividends (treated for federal income tax purposes in the hands of shareholders as taxable at a maximum rate of 20%).
For shareholders that are corporations, the Fund designates 34% of its ordinary dividends paid to shareholders in 2016 as dividends from domestic corporations eligible for the corporate dividends received deduction, provided that the shareholder otherwise satisfies applicable requirements to claim that deduction.
BOARD APPROVAL OF FUNDS’ INVESTMENT MANAGEMENT AGREEMENTS AND MANAGEMENT FEES
(unaudited)
The Board of Trustees is responsible for overseeing the performance of the Dodge & Cox Funds’ investment manager and determining whether to continue the Investment Management Agreements between the Funds and Dodge & Cox each year (the “Agreements”). At a meeting of the Board of Trustees of the Trust held on December 14, 2016, the Trustees, by a unanimous vote (including a separate vote of those Trustees who are not “interested persons” (as defined in the Investment Company Act of 1940) (the “Independent Trustees”)), approved the renewal of the Agreements for an additional one-year term through December 31, 2017 with respect to each Fund. During the course of the year, the Board received extensive information and materials relating to the investment management and administrative services provided by Dodge & Cox and the performance of each of the Funds.
INFORMATION RECEIVED
In 2016, the Board requested and received a series of special presentations relating to the proposed renewal of the Funds’ Agreements. These presentations, which took place over the course of the year, covered, among other things, (i) a report about asset management industry trends and the competitive landscape for Dodge & Cox and the Funds; (ii) an extensive presentation regarding economies of scale, which included materials describing key enhancements over the past 15 years in the scope of services that Dodge & Cox furnishes to the Funds; (iii) a detailed presentation by Morningstar® representatives regarding the format, methodology, and content of Morningstar’s 15(c) report; (iv) materials describing peer fund management fees (including funds with breakpoints) and expense ratios and Dodge & Cox’s separate account advisory fee schedules as compared to those of peer firms; and (v) reports by outside counsel regarding mutual fund litigation trends and developments.
In addition to the foregoing and in advance of the meeting, the Board, including each of the Independent Trustees, requested,
received, and reviewed materials relating to the Agreements and the services provided by Dodge & Cox. The Independent Trustees retained Morningstar to prepare an independent expense and performance summary for each Fund and comparable funds managed by other advisers identified by Morningstar. The Morningstar materials included information regarding advisory fee rates, expense ratios, and transfer agency, custodial, and distribution expenses, as well as appropriate performance comparisons to each Fund’s peer group and an index or combination of indices. The Morningstar materials also included a comparison of expenses of various share classes offered by comparable funds. The materials reviewed by the Board contained information concerning, among other things, Dodge & Cox’s profitability, financial results and condition, advisory fee revenue and separate account fee schedules. The Board additionally considered the Funds’ brokerage commissions, turnover rates, sales and redemption data, and the significant investment that Dodge & Cox makes in research used in managing the Funds. The Board received and reviewed memoranda and related materials addressing, among other things, Dodge & Cox’s services to the Funds; how Dodge & Cox Funds’ fees compare to fees of peer group funds; the different fees, services, costs, and risks associated with other accounts managed by Dodge & Cox as compared to the Dodge & Cox Funds; and the ways in which the Funds realize economies of scale. Throughout the process of reviewing the services provided by Dodge & Cox and preparing for the meeting, the Independent Trustees found Dodge & Cox to be open, forthright, detailed, and very helpful in answering questions about all issues. The Board received copies of the Agreements and a memorandum from the independent legal counsel to the Independent Trustees discussing the factors generally regarded as appropriate to consider in evaluating advisory arrangements. The Trust’s Contract Review Committee, consisting solely of Independent Trustees, met with the independent legal counsel on November 3, 2016 and again on December 14, 2016 to discuss whether to renew the Agreements. The Board, including the Independent Trustees, subsequently concluded that the existing Agreements are fair and reasonable and voted to approve the Agreements. In considering the Agreements, the Board, including the Independent Trustees, did not identify any single factor or particular information as all-important or controlling. In reaching the decision to approve the Agreements, the Board considered several factors, discussed below, to be key factors and reached the conclusions described below.
NATURE, QUALITY, AND EXTENT OF THE SERVICES
The Board considered that Dodge & Cox provides a wide range of services to the Funds in addition to portfolio management and that the quality of these services has been excellent in all respects. The extensive nature of services provided by Dodge & Cox has been documented in materials provided to the Board and in presentations made to the Board throughout the year. In particular, the Board considered the nature, quality, and extent of portfolio management, administrative, and shareholder services performed by Dodge & Cox. With regard to portfolio management
PAGE 18 § DODGE & COX GLOBAL STOCK FUND
services, the Board considered Dodge & Cox’s established long-term history of care and conscientiousness in the management of the Funds; its demonstrated consistency in investment approach and depth; the background and experience of the Dodge & Cox Investment Policy Committee, International Investment Policy Committee, Global Stock Investment Policy Committee, Fixed Income Investment Policy Committee, and Global Bond Investment Policy Committee, and research analysts responsible for managing the Funds; Dodge & Cox’s methods for assessing the regulatory and investment climate in various jurisdictions; its overall high level of attention to its core investment management function; and its commitment to the Funds and their shareholders. The Board also considered analysis provided by Morningstar regarding the degree of active management in the Dodge & Cox equity funds and concluded that Dodge & Cox is an active, high conviction manager of equity portfolios, not a “closet index” manager.
In the area of administrative and shareholder services, the Board considered the excellent quality of Dodge & Cox’s work in areas such as compliance, legal services, trading, proxy voting, technology, oversight of the Funds’ transfer agent and custodian, tax compliance, and shareholder communication through its website and other means. The Board also noted Dodge & Cox’s diligent disclosure policy, its favorable compliance record, and its reputation as a trusted, shareholder-friendly mutual fund family.
In addition, the Board considered that Dodge & Cox manages approximately $180 billion in Fund assets with fewer professionals than most comparable funds, and that on average these professionals have more experience and longer tenure than investment professionals at comparable funds. The Board also noted that Dodge & Cox is an investment research-oriented firm with no other business endeavors to distract management’s attention from its research efforts or to present material conflicts of interest with the operations of the Funds, that its investment professionals adhere to a consistent investment approach across the Funds, and that due to its careful and deliberate strategy with respect to new products, Dodge & Cox has had remarkable stability in its mutual fund product offerings over the course of the past 86 years and has the fewest funds of any of the 25 largest mutual fund families by assets. The Board further considered the favorable stewardship grades given by Morningstar to each of the Funds and the “Gold” analyst rating awarded by Morningstar to all of the Funds except the Global Bond Fund. The Board concluded that it was satisfied with the nature, extent, and quality of investment management and other services provided to the Funds by Dodge & Cox.
INVESTMENT PERFORMANCE
The Board considered short-term and long-term investment performance for each Fund (including periods of outperformance or underperformance) as compared to both relevant indices and the performance of such Fund’s peer group. The Board noted that, as of November 30, 2016, the Funds had strong absolute and relative year-to-date performance, and were also generally solid performers over longer periods. The Board determined after
extensive review and inquiry that Dodge & Cox’s historic, long-term, team-oriented, bottom-up investment approach remains consistent and that Dodge & Cox continues to be distinguished by its integrity, transparency, and independence. The Board considered that the performance of the Funds is the result of value-oriented investment management process that emphasizes a long-term investment horizon, comprehensive independent research, team approach, price discipline, low cost, and low portfolio turnover. The Board also considered that the investment performance delivered by Dodge & Cox to the Funds appeared to be consistent with the relevant performance delivered for other clients of Dodge & Cox. The Board concluded that Dodge & Cox has delivered favorable long-term performance for Fund investors consistent with the long-term investment strategies being pursued by the Funds.
COSTS AND ANCILLARY BENEFITS
Costs of Services to Funds: Fees and Expenses. The Board considered each Fund’s management fee rate and expense ratio relative to each Fund’s peer group and relative to management fees charged by Dodge & Cox to other clients. In particular, the Board considered that the Funds continue to be substantially below their peer group median in expense ratios and that many media and industry reports specifically comment on the low expense ratios of the Funds, which have been a defining characteristic of the Funds for many years. The Board also evaluated the operating structures of the Funds and Dodge & Cox, noting that the Funds do not charge front-end sales commissions or distribution fees, and Dodge & Cox bears, among other things, the significant cost of third party research, reimbursement for shareholder recordkeeping and administrative costs to third-party retirement plan administrators, and administrative and office overhead. The Board noted that expenses are well below industry averages.
When compared to peer group funds, the Funds are in the quartile with the lowest expense ratios. The Board also considered that the Funds receive numerous administrative, regulatory compliance, legal, technology, and shareholder support services from Dodge & Cox without any additional administrative fee and the fact that the Funds have relatively low transaction costs and portfolio turnover rates. The Board noted the Funds’ unusual single-share-class structure and reviewed Morningstar data (including asset-weighted average expense ratios) showing that the few peer group funds with lower expense ratios often have other share classes with significantly higher expense ratios. In this regard, the Board considered that many of the Funds’ shareholders would not be eligible to purchase comparably priced shares of many peer group funds, which typically make their lower-priced share classes available only to institutional investors. The Board determined that the Funds provide access for small investors to high quality investment management at a relatively low cost. The Board also considered that the Funds’ are priced to scale, i.e., management fee rates begin at relatively low levels with the result that, even without breakpoints, the Funds’ management fee rates are lower than those of many peer funds whose fee schedules include breakpoints. With respect to non-U.S. funds sponsored
DODGE & COX GLOBAL STOCK FUND §PAGE 19
and managed by Dodge & Cox that are comparable to the Funds in many respects, the Board noted that the fee rates charged by Dodge & Cox are the same as or higher than the fee rates charged to the Funds.
The Board reviewed information regarding the fee rates Dodge & Cox charges to separate accounts that have investment programs similar to those of the Funds, including instances where separate account fees are lower than Fund fees. The Board considered the significant differences in the nature and scope of services Dodge & Cox provides to the Funds as compared to other client accounts, as well as material differences in regulatory, litigation, and other risks as between Dodge & Cox Funds and other types of clients. The Board noted that different markets exist for mutual fund and institutional separate account management services and that a comparison of Fund fee rates and separate account fee rates must consider the fact that separate account clients bear additional costs and responsibilities that are included in the cost of a Fund. The Board further noted that many sophisticated institutional investors in the Funds that are eligible to open separate accounts at Dodge & Cox have decided for various reasons to invest in the Funds. After consideration of these matters, the Board concluded that the overall costs incurred by the Funds for the services they receive (including the management fee paid to Dodge & Cox) are reasonable and that the fees are acceptable based upon the qualifications, experience, reputation, and performance of Dodge & Cox and the low overall expense ratios of the Funds.
Profitability and Costs of Services to Dodge & Cox; “Fall-out” Benefits. The Board reviewed reports of Dodge & Cox’s financial position, profitability, and estimated overall value and considered Dodge & Cox’s overall profitability within its context as a private, employee-owned S-Corporation and relative to the favorable services provided. The Board noted in particular that Dodge & Cox’s profits are not generated by high fee rates, but reflect an extraordinarily streamlined, efficient, and focused business approach toward investment management.
The Board recognized the importance of Dodge & Cox’s profitability—which is derived solely from management fees and does not include other business ventures—to maintain its independence, stability, company culture and ethics, and management continuity. The Board also considered that the compensation/profit structure at Dodge & Cox includes a return on shareholder employees’ investment in the firm, which is vital for remaining independent and facilitating retention of management and investment professionals. The Board considered independent research indicating that firms that grow organically, rather than through acquisition, tend to have better performance. Key to organic growth is the ability to retain talented and experienced analysts, portfolio managers, and other professionals. The Board also considered that in January 2015, Dodge & Cox closed the International Stock Fund to new investors to proactively manage the growth of the Fund. The Stock Fund and Balanced Fund were similarly closed to new investors during periods of significant growth in the past. While these actions are intended to benefit existing Fund shareholders, the effect is to reduce potential revenues to Dodge & Cox from new shareholders.
The Board also considered potential “fall-out” benefits (including the receipt of research from unaffiliated brokers and reputational benefits to non-U.S. funds sponsored and managed by Dodge & Cox) that Dodge & Cox might receive as a result of its association with the Funds and determined that they are acceptable. The Board also noted that Dodge & Cox continues to invest substantial sums in its business in order to provide enhanced services, systems, and research capabilities, all of which benefit the Funds. The Board concluded that Dodge & Cox’s profitability is the keystone of its independence, stability, and long-term investment performance and that the profitability of Dodge & Cox’s relationship with the Funds (including fall-out benefits) is fair and reasonable.
ECONOMIES OF SCALE
The Board considered whether there have been economies of scale with respect to the management of each Fund, whether the Funds have appropriately benefited from any economies of scale, and whether the management fee rate is reasonable in relation to the level of Fund assets and any economies of scale that may exist. In the Board’s view, any consideration of economies of scale must take account of the Funds’ low fee structure and the considerable efficiencies of the Funds’ organization and fee structure that has been realized by shareholders from the time of each Fund’s inception (i.e., from the first dollar). An assessment of economies of scale must also take into account that Dodge & Cox invests significant time and resources in each new Fund for months (and sometimes years) prior to launch; in addition, expenses are capped, which means that Dodge & Cox subsidizes the operations of a new Fund for a period of time until it reaches scale. The Board observed that, while total Fund assets have grown significantly over the long term, this growth has not been continuous or evenly distributed across all of the Funds, as assets of certain Funds have actually declined over the past ten years.
In addition, the Board noted that Dodge & Cox has shared economies of scale by adding and enhancing services to the Funds over time, and that the internal costs of providing investment management, technology, administrative, legal, and compliance services to the Funds continue to increase. For example, Dodge & Cox has increased its global research staff and investment resources over the years to add important new capabilities for the benefit of Fund shareholders and to address the increased complexity of investing in multinational and non-U.S. companies. In addition, Dodge & Cox has made substantial expenditures in other staff, technology, cybersecurity, and infrastructure to enable it to integrate credit and equity analyses and to be able to implement its strategy in a more effective and secure manner. Over the last ten years, Dodge & Cox has increased its spending on research, investment management, client servicing, and technology including payments for third party research, data services, and computer systems for trading, operations, compliance, accounting, and communications at a rate that has significantly outpaced the Funds’ growth rate during the same period. The Board considered that Dodge & Cox has a history of voluntarily limiting asset growth in several Funds that
PAGE 20 § DODGE & COX GLOBAL STOCK FUND
experienced significant inflows by closing them to new investors in order to protect the Funds’ ability to achieve good investment returns for shareholders. The Board also observed that, even without fee breakpoints, the Funds are competitively priced in a very competitive market and that having a low fee from inception is better for shareholders than starting with a higher fee and adding breakpoints. The Board also noted that there may be certain diseconomies of scale associated with managing large funds, insofar as certain of the costs and risks associated with portfolio management increase as assets grow. The Board concluded that the current Dodge & Cox fee structure is fair and reasonable and adequately shares economies of scale that may exist.
CONCLUSION
Based on their evaluation of all material factors and assisted by the advice of independent legal counsel to the Independent Trustees, the Board, including the Independent Trustees, concluded that the advisory fee structure was fair and reasonable, that each Fund was paying a competitive fee for the services provided, that the scope and quality of Dodge & Cox’s services has provided substantial value for Fund shareholders over the long term, and that approval of the Agreements was in the best interests of each Fund and its shareholders.
DODGE & COX GLOBAL STOCK FUND §PAGE 21
FUND HOLDINGS
The Fund provides a complete list of its holdings four times each fiscal year, as of the end of each quarter. The Fund files the lists with the Securities and Exchange Commission (SEC) on Form N-CSR (second and fourth quarters) and Form N-Q (first and third quarters). Shareholders may view the Fund’s Forms N-CSR and N-Q on the SEC’s website at sec.gov. Forms N-CSR and N-Q may also be reviewed and copied at the SEC’s Public Reference Room in Washington, DC. Information regarding the operations of the Public Reference Room may be obtained by calling 202-942-8090 (direct) or 800-732-0330 (general SEC number). A list of the Fund’s quarter-end holdings is also available at dodgeandcox.com on or about 15 days following each quarter end and remains available on the website until the list is updated in the subsequent quarter.
PROXY VOTING
For a free copy of the Fund’s proxy voting policies and procedures, please call 800-621-3979, visit the Fund’s website at dodgeandcox.com, or visit the SEC’s website at sec.gov. Information regarding how the Fund voted proxies relating to portfolio securities during the most recent 12-month period ending June 30 is also available at dodgeandcox.com or at sec.gov.
HOUSEHOLD MAILINGS
The Fund routinely mails shareholder reports and summary prospectuses to shareholders and, on occasion, proxy statements. In order to reduce the volume of mail, when possible, only one copy of these documents will be sent to shareholders who are part of the same family and share the same residential address.
If you have a direct account with the Funds and you do not want the mailing of shareholder reports and summary prospectuses combined with other members in your household, contact the Funds at 800-621-3979. Your request will be implemented within 30 days.
PAGE 22 § DODGE & COX GLOBAL STOCK FUND
DODGE & COX FUNDS—EXECUTIVE OFFICER & TRUSTEE INFORMATION
| | | | | | |
Name (Age) and
Address* | | Position with Trust (Year of Election or
Appointment) | | Principal Occupation During Past 5 Years | | Other Directorships Held by Trustees |
| INTERESTED TRUSTEES AND EXECUTIVE OFFICERS |
| Charles F. Pohl (58) | | Chairman and Trustee (Since 2004) | | Chairman (since 2013), Co-President (2011-2013), Senior Vice President (until 2011), and Director of Dodge & Cox; Chief Investment Officer, Portfolio Manager, Investment Analyst, and member of Investment Policy Committee (IPC), Global Stock Investment Policy Committee (GSIPC), International Investment Policy Committee (IIPC), and Fixed Income Investment Policy Committee (FIIPC) | | — |
| Dana M. Emery (55) | | President and Trustee (Trustee since 1993) (President since 2014) | | Chief Executive Officer (since 2013), President (since 2011), Executive Vice President (until 2011), and Director of Dodge & Cox; Director of Fixed Income, Portfolio Manager, and member of FIIPC and Global Bond Investment Policy Committee (GBIPC) | | — |
| Diana S. Strandberg (57) | | Senior Vice President (Since 2006) | | Senior Vice President (since 2011), Vice President (until 2011), and Director (since 2011) of Dodge & Cox; Director of International Equity, Portfolio Manager, Investment Analyst, and member of IPC, GSIPC, IIPC, and GBIPC | | — |
| David H. Longhurst (59) | | Treasurer (Since 2006) | | Vice President and Assistant Treasurer of Dodge & Cox | | — |
| Thomas M. Mistele (63) | | Secretary (Since 1998) | | Chief Operating Officer (until Jan. 2017), Director, Secretary, Senior Counsel (since 2011), and General Counsel (until 2011) of Dodge & Cox | | — |
| Katherine M. Primas (42) | | Chief Compliance Officer (Since 2010) | | Vice President (since 2011) and Chief Compliance Officer of Dodge & Cox | | — |
| INDEPENDENT TRUSTEES |
| Thomas A. Larsen (67) | | Trustee (Since 2002) | | Senior Counsel of Arnold & Porter Kaye Scholer LLP (law firm) (since 2013); Partner of Arnold & Porter LLP (until 2012); Director of Howard, Rice, Nemerovski, Canady, Falk & Rabkin (1977-2011) | | — |
| Ann Mather (56) | | Trustee (Since 2011) | | CFO, Pixar Animation Studios (1999-2004) | | Director, Google, Inc. (internet information services) (since 2005); Director, Glu Mobile, Inc. (multimedia software) (since 2004); Director, Netflix, Inc. (internet television) (since 2010); Director, Arista Networks (cloud networking) (since 2013); Director, Shutterfly, Inc. (internet photography services/publishing) (since 2013) |
| Robert B. Morris III (64) | | Trustee (Since 2011) | | Advisory Director, The Presidio Group (2005-2016); Partner and Managing Director—Global Investment Research at Goldman Sachs (until 2001) | | — |
| Gary Roughead (65) | | Trustee (Since 2013) | | Robert and Marion Oster Distinguished Military Fellow, Hoover Institution (since 2012); Admiral, United States Navy (Ret.); U.S. Navy Chief of Naval Operations (2008-2011) | | Director, Northrop Grumman Corp. (global security) (since 2012); Director, Maersk Line, Limited (shipping and transportation) (since 2016) |
| Mark E. Smith (65) | | Trustee (Since 2014) | | Executive Vice President, Managing Director—Fixed Income at Loomis Sayles & Company, L.P. (2003-2011) | | — |
| John B. Taylor (70) | | Trustee (Since 2005) (and 1995-2001) | | Professor of Economics, Stanford University (since 1984); Senior Fellow, Hoover Institution (since 1996); Under Secretary for International Affairs, United States Treasury (2001-2005) | | — |
| * | | The address for each Officer and Trustee is 555 California Street, 40th Floor, San Francisco, California 94104. Each Officer and Trustee oversees all six series in the Dodge & Cox Funds complex and serves for an indefinite term. |
Additional information about the Trust’s Trustees and Officers is available in the Trust’s Statement of Additional Information (SAI). You can get a free copy of the SAI by visiting the Funds’ website at dodgeandcox.com or calling
800-621-3979.
DODGE & COX GLOBAL STOCK FUND §PAGE 23
dodgeandcox.com
For Fund literature, transactions, and account information, please visit the Funds’ website.
or write or call:
DODGE & COX FUNDS
c/o Boston Financial Data Services
P.O. Box 8422
Boston, Massachusetts 02266-8422
(800) 621-3979
INVESTMENT MANAGER
Dodge & Cox
555 California Street, 40th Floor
San Francisco, California 94104
(415) 981-1710
This report is submitted for the general information of the shareholders of the Fund. The report is not authorized for distribution to prospective investors in the Fund unless it is accompanied by a current prospectus.
This report reflects our views, opinions, and portfolio holdings as of December 31, 2016, the end of the reporting period. Any such views are subject to change at any time based upon market or other conditions and Dodge & Cox disclaims any responsibility to update such views. These views may not be relied on as investment advice and, because investment decisions for a Dodge & Cox Fund are based on numerous factors, may not be relied on as an indication of trading intent on behalf of any Dodge & Cox Fund.
DODGE & COX FUNDS®
Annual Report
December 31, 2016
International Stock Fund
ESTABLISHED 2001
TICKER: DODFX
(Closed to New Investors)
12/16 ISF AR Printed on recycled paper
TO OUR SHAREHOLDERS
The Dodge & Cox International Stock Fund had a total return of 8.3% for the year ended December 31, 2016, compared to a return of 1.0% for the MSCI EAFE (Europe, Australasia, Far East) Index.
AN EXTRAORDINARY YEAR
The Fund’s strong absolute and relative performance in 2016 was achieved with largely the same portfolio that produced weak results in 2015. In fact, many of the biggest contributors in 2016 were some of the largest detractors in 2015. The past year’s strong performance also improved the Fund’s longer-term relative results. The Fund’s annualized total return for the past five years was 8.0% versus 6.5% for the MSCI EAFE.
We would like to express sincere appreciation to our fellow shareholders for your patience and confidence in Dodge & Cox. These results serve as a reminder that a single quarter or year is too short an interval over which to judge the success of our strategy. Our bottom-up, value-oriented, active investment approach requires independent thinking to build the level of conviction essential to invest in companies that are out of favor. Stock prices can move dramatically in response to the headlines of the day, but it often takes time for a company’s results to improve and for positive change to be recognized by other investors. Accordingly, maintaining a long-term investment horizon and staying the course when markets move against us are essential for our investment team, as well as for our fellow shareholders. We would be the first to acknowledge this is not easy to do, but our persistence to stick with our convictions in the face of market volatility was rewarded during this past year.
Since its inception on May 1, 2001, the Fund has had an average annualized total return of 7.1% versus 4.0% for the MSCI EAFE. This period encompassed large swings in Fund performance, market prices, and equity valuations, including the 2008-09 global financial crisis and subsequent recovery. More recently, investor concerns have been around global economic growth, lower commodity prices, Brexit, and the U.S. presidential election. Uncertainty is a constant, but it can create compelling opportunities for patient, long-term, value-oriented, active investors. Our recent insight paper, “Understanding the Case for Active Management,” is summarized at the end of the letter and is available in its entirety on our website.
MARKET COMMENTARY
The major driver of the Fund’s relative results was the significant outperformance of the “value” portion of the market compared to the “growth” segment. Value stocks are those that have lower valuations than growth stocks. Recently, the more economically sensitive, cyclical sectors of the market (e.g., Energy, Financials) have accounted for a larger portion of the value category than stocks in the more defensive, stable sectors (e.g., Consumer Staples, Telecommunication Services, Utilities).
In our 2015 annual letter, we discussed the widening valuation gap between these two segments of the market and noted that we were finding increasingly attractive opportunities in the value segment. That gap widened further in the first half of 2016,
marking eight consecutive quarters of value underperforming growth. As prices declined in the value areas of the market, we added to several holdings, including those in Energy, Materials, and European and UK Financials. While we did not know when the market might move in the Fund’s favor, our in-depth research, valuation discipline, and three- to five-year investment horizon were critical pillars in building and maintaining our investment conviction. Value stocks staged a significant rally in the second half of 2016, driving much of the Fund’s outperformance for the year.
Similarly, as emerging markets lagged developed markets on a multi-year basis through 2015, valuations became increasingly attractive, and the Fund found more investment opportunities. After a dramatic 15% drop in 2015, the MSCI Emerging Markets Index was up 11% in 2016, significantly outpacing the 1% return for developed markets stocks. Many of the Fund’s largest emerging market detractors in 2015 turned out to be the biggest contributors in 2016. For example, Petrobras(a) and Itau Unibanco in Brazil were down 55% and 41%, respectively, in 2015, but were up 159% and 81% in 2016. We added to both holdings as their valuations declined in 2015, which later benefited the Fund.
Overall, international equity valuations remain reasonable: the MSCI EAFE trades at 14.8 times forward earnings (compared to a 20-year average of 15.7 times).(b) And while valuations for the cheaper parts of the market rose in relation to more expensive market segments, the valuation spread remains compelling.
INVESTMENT STRATEGY
In our experience, the best investment opportunities can frequently be found in areas of greatest skepticism and uncertainty. We search in these areas, which are often characterized by discounted valuations, and attempt to discern which companies have the competitive position and management talent to grow earnings and cash flow over the next three to five years. Just as important, we attempt to avoid those companies whose valuations reflect optimism that current conditions will remain intact or significantly improve and thus do not sufficiently compensate us for potential disappointment. Two areas where we currently see attractive investment opportunities amidst investor skepticism are Health Care (13% of the Fund) and European and UK Financials (20% of the Fund).
Health Care
Health Care was the worst performing sector (down 12%) of the MSCI EAFE in 2016. Share prices for pharmaceutical companies were hurt by concerns about lower drug pricing in the United States, as pharmacy benefit managers have consolidated their market shares and exerted more pricing power. Since profits generated in the United States represent a substantial share of total profits for the global industry, many believe the outlook for long-term profitability is in question. While we acknowledge this risk, we believe the Fund’s pharmaceutical holdings are compelling at recent, lower valuations of 14.2 times forward earnings, which do not appropriately reflect the long-term potential for growth in cash flow and earnings. For example, several companies in the Fund’s portfolio have navigated
PAGE 2 § DODGE & COX INTERNATIONAL STOCK FUND
through the most challenging wave of patent expirations, and their intensive research and development efforts are bearing fruit with meaningful new drug launches. We added to several of the Fund’s holdings in the latter half of 2016, including AstraZeneca, which is the newest addition to the Fund’s Health Care holdings.
AstraZeneca, which is based in the United Kingdom, is a global pharmaceutical company with strengths in treatment for cancer and respiratory, cardiovascular, and infectious diseases. The share price has been under pressure due to recent and upcoming patent expirations for major drugs. Despite this headwind, the long-term growth outlook is favorable because of the company’s robust new drug pipeline, particularly in oncology. AstraZeneca has an attractive position in the revolutionary field of cancer immunotherapy, which harnesses the disease-fighting capabilities of the body’s immune system to reduce and potentially eliminate cancer tumors. With a 4.6% dividend yield, the current valuation is reasonable and does not appear to reflect the potential success of the immunotherapy drug pipeline.
European and UK Financials
In our 2016 semi-annual letter, we wrote about adding to several of the Fund’s holdings in European and UK Financials during the global equity market swoon in early 2016 and after steep share price declines following the Brexit vote. European and UK Financials outperformed significantly in the second half of the year (up 33% compared to 24% for the MSCI EAFE) and represented 20% of the Fund at year end. We continue to think this industry presents some of the most attractive opportunities in the market.
Valuations remain extremely compelling: the Fund’s holdings trade at an average level of 0.7 times book value, reflecting continued doubt in the market that these companies will earn sufficient returns on equity. Over the past five years, the banking industry has been challenged by low interest rates, sluggish global growth, high legal costs, and adverse regulatory changes. Management teams at many institutions have responded by aggressively cutting operating expenses and eliminating underperforming businesses. As a result, many banks are better positioned to expand profitability in an improving environment. For example, in 2012, Switzerland-based UBS Group was early to restructure its investment banking segment and focus on its wealth management business, where it is a global leader. The bank has successfully reduced its cost base, despite facing large litigation costs and new regulatory compliance expenses. Due to its large customer deposit balances, UBS should also be one of the greatest beneficiaries from higher global interest rates as net interest income expands.
IN CLOSING
Long-term, value-oriented investing is a humbling but hopefully rewarding endeavor. It requires forming independent opinions that may be very different from the consensus view and maintaining mental and emotional discipline in the face of inevitable market fluctuations. It is possible that we will buy shares of a company too early and that business conditions may not improve as we expect. Those challenges are well worth the potential for superior, long-term investment returns.
2016 was a vivid example of these perils and rewards. The significant market swings in the first half of the year highlighted the difficulty in predicting what the markets will do. Fortunately, our discipline paid off as the Fund’s strategy did well in the second half of the year. We do not know what the future holds, but we will continue to apply the bottom-up, value-oriented investment approach that has served us well for decades.
We want to express gratitude to the Fund’s shareholders for taking the long view and having confidence in Dodge & Cox. Our strategy requires patience and persistence, and we thank you for yours.
As always, we welcome your comments and questions.
For the Board of Trustees,
| | |
| | |
Charles F. Pohl, Chairman | | Dana M. Emery, President |
January 31, 2017
| (a) | | The use of specific examples does not imply that they are more attractive investments than the Fund’s other holdings. |
| (b) | | Unless otherwise specified, all weightings and characteristics are as of December 31, 2016. |
DODGE & COX INTERNATIONAL STOCK FUND §PAGE 3
UNDERSTANDING THE CASE FOR ACTIVE MANAGEMENT
One of the fiercest investment debates concerns active versus passive approaches to investing: Should investors actively choose individual investments in the hopes of beating the market, or choose a fund that tracks an index and matches the return of the market, never doing better, but never doing worse?
The most frequently cited evidence against active management is that the majority of active managers fail to beat their benchmark each year. But measuring on a 12-month basis doesn’t necessarily capture the results of an active management strategy because it often takes more than a year for a strategy to come to fruition. When measurement intervals are lengthened, the results of the active versus passive comparison are significantly different—a higher percentage of active managers outperform their benchmarks. To be sure, outperformance over the long run is nowhere near a sure thing, but the data suggests active management is an eminently viable choice.
One of the attributes of successful active managers is having a high “active share,” meaning their portfolio is significantly different from an index. Another attribute is having low fees and low portfolio turnover, which reduce the drag on performance exerted by expenses. Successful active managers also tend to provide higher risk-adjusted returns, because unlike index funds, they aren’t obliged to invest in higher risk companies. Studies also show that active managers do better when they are tightly focused on specific strategies and markets and when they have a significant financial stake in their funds.
Research indicates that the average U.S. mutual fund investor earns two percentage points less per year than the average fund because many investors move in and out of funds too quickly. But if investors have the discipline to stick with good active managers through inevitable periods of underperformance, they can have meaningful prospects of outperforming the market over time.
A summary from Dodge & Cox’s insight paper titled, “Understanding the Case for Active Management.”
ANNUAL PERFORMANCE REVIEW
The Fund outperformed the MSCI EAFE by 7.3 percentage points in 2016.
Key Contributors to Relative Results
| | § | | Strong returns from the Fund’s holdings in emerging markets (up 21%), especially in the Financials sector (up 32%), contributed significantly to performance. Petrobras (up 159%), Itau Unibanco (up 81%), and Samsung Electronics (up 41%) were notable contributors. | |
| | § | | The Fund’s average overweight position (15% versus 5%) and holdings in the Information Technology sector (up 21% compared to up 4% for the MSCI EAFE sector) enhanced results. Hewlett Packard Enterprise (up 53%) and Nintendo (up 52%) performed well. | |
| | § | | The Fund’s holdings in the Industrials sector (up 29% compared to up 7% for the MSCI EAFE sector) aided performance. Johnson Controls (up 40%), Mitsubishi Electric (up 34%), and Schneider Electric (up 25%) were particularly strong. | |
| | § | | Teck Resources (up 201% to date of sale), Schlumberger (up 24%), and Naspers (up 8%) were among the additional contributors. | |
Key Detractors from Relative Results
| | § | | The Fund’s holdings in European and UK Financials hindered performance, especially UniCredit (down 47%), Credit Suisse Group (down 30%), Lloyds Banking Group (down 25%), and Barclays (down 12%). | |
| | § | | Investments in the Consumer Discretionary sector (down 5% compared to down 2% for the MSCI EAFE sector) hurt results. Grupo Televisa (down 23%), Liberty Global (down 17%), Bayerische Motoren Werke (down 9%), and Honda Motor (down 8%) were particularly weak. | |
| | § | | Additional detractors included Saipem (down 43%), LM Ericsson (down 38%), and Novartis (down 13%). | |
KEY CHARACTERISTICS OF DODGE & COX
Independent Organization
Dodge & Cox is one of the largest privately owned investment managers in the world. We remain committed to independence, with a goal of providing the highest quality investment management service to our existing clients.
Over 85 Years of Investment Experience
Dodge & Cox was founded in 1930. We have a stable and well-qualified team of investment professionals, most of whom have spent their entire careers at Dodge & Cox.
Experienced Investment Team
The International Investment Policy Committee, which is the decision-making body for the International Stock Fund, is an eight-member committee with an average tenure at Dodge & Cox of 22 years.
One Business with a Single Research Office
Dodge & Cox manages equity (domestic, international, and global), fixed income (domestic and global), and balanced investments, operating from one office in San Francisco.
Consistent Investment Approach
Our team decision-making process involves thorough, bottom-up fundamental analysis of each investment.
Long-Term Focus and Low Expenses
We invest with a three- to five-year investment horizon, which has historically resulted in low turnover relative to our peers. We manage Funds that maintain low expense ratios.
Risks: The Fund is subject to market risk, meaning holdings in the Fund may decline in value for extended periods due to the financial prospects of individual companies, or due to general market and economic conditions. Investing in non-U.S. securities may entail risk due to foreign economic and political developments; this risk may be increased when investing in emerging markets. The Fund is also subject to currency risk. Please read the prospectus and summary prospectus for specific details regarding the Fund’s risk profile.
PAGE 4 § DODGE & COX INTERNATIONAL STOCK FUND
GROWTH OF $10,000 OVER 10 YEARS
FOR AN INVESTMENT MADE ON DECEMBER 31, 2006
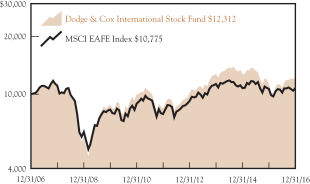
AVERAGE ANNUAL TOTAL RETURN
FOR PERIODS ENDED DECEMBER 31, 2016
| | | | | | | | | | | | | | | | |
| | | 1 Year | | | 3 Years | | | 5 Years | | | 10 Years | |
Dodge & Cox International
Stock Fund | | | 8.26 | % | | | –1.34 | % | | | 7.98 | % | | | 2.11 | % |
MSCI EAFE Index | | | 1.00 | | | | –1.60 | | | | 6.53 | | | | 0.75 | |
Returns represent past performance and do not guarantee future results. Investment return and share price will fluctuate with market conditions, and investors may have a gain or loss when shares are sold. Fund performance changes over time and currently may be significantly lower than stated. Performance is updated and published monthly. Visit the Fund’s website at dodgeandcox.com or call 800-621-3979 for current performance figures.
The Fund’s total returns include the reinvestment of dividend and capital gain distributions, but have not been adjusted for any income taxes payable by shareholders on these distributions or on Fund share redemptions. Index returns include dividends but, unlike Fund returns, do not reflect fees or expenses. The MSCI EAFE (Europe, Australasia, Far East) Index is a broad-based, unmanaged equity market index aggregated from 21 developed market country indices, excluding the United States and Canada. MSCI makes no express or implied warranties or representations and shall have no liability whatsoever with respect to any MSCI data contained herein. The MSCI data may not be further redistributed or used as a basis for other indices or any securities or financial products. This report is not approved, reviewed, or produced by MSCI.
MSCI EAFE is a service mark of MSCI Barra.
FUND EXPENSE EXAMPLE
As a Fund shareholder, you incur ongoing Fund costs, including management fees and other Fund expenses. All mutual funds have ongoing costs, sometimes referred to as operating expenses. The following example shows ongoing costs of investing in the Fund and can help you understand these costs and compare them with those of other mutual funds. The example assumes a $1,000 investment held for the six months indicated.
ACTUAL EXPENSES
The first line of the table below provides information about actual account values and expenses based on the Fund’s actual returns. You may use the information in this line, together with your account balance, to estimate the expenses that you paid over the period. Simply divide your account value by $1,000 (for example, an $8,600 account value divided by $1,000 = 8.6), then multiply the result by the number in the first line under the heading “Expenses Paid During Period” to estimate the expenses you paid on your account during this period.
HYPOTHETICAL EXAMPLE FOR COMPARISON WITH OTHER MUTUAL FUNDS
Information on the second line of the table can help you compare ongoing costs of investing in the Fund with those of other mutual funds. This information may not be used to estimate the actual ending account balance or expenses you paid during the period. The hypothetical “Ending Account Value” is based on the actual expense ratio of the Fund and an assumed 5% annual rate of return before expenses (not the Fund’s actual return). The amount under the heading “Expenses Paid During Period” shows the hypothetical expenses your account would have incurred under this scenario. You can compare this figure with the 5% hypothetical examples that appear in shareholder reports of other mutual funds.
| | | | | | | | | | | | |
Six Months Ended December 31, 2016 | | Beginning Account Value
7/1/2016 | | | Ending Account Value
12/31/2016 | | | Expenses Paid During Period* | |
Based on Actual Fund Return | | $ | 1,000.00 | | | $ | 1,138.50 | | | $ | 3.46 | |
Based on Hypothetical 5% Yearly Return | | | 1,000.00 | | | | 1,021.90 | | | | 3.28 | |
| * | Expenses are equal to the Fund’s annualized expense ratio of 0.64%, multiplied by the average account value over the period, multiplied by 184/366 (to reflect the one-half year period). |
The expenses shown in the table highlight ongoing costs only and do not reflect any transactional fees or account maintenance fees. Though other mutual funds may charge such fees, please note that the Fund does not charge transaction fees (e.g., redemption fees, sales loads) or universal account maintenance fees (e.g., small account fees).
DODGE & COX INTERNATIONAL STOCK FUND §PAGE 5
| | | | |
| FUND INFORMATION (unaudited) | | | December 31, 2016 | |
| | | | |
| GENERAL INFORMATION | | | |
Net Asset Value Per Share | | | $38.10 | |
Total Net Assets (billions) | | | $54.2 | |
Expense Ratio | | | 0.64% | |
Portfolio Turnover Rate | | | 17% | |
30-Day SEC Yield(a) | | | 1.73% | |
Number of Companies | | | 72 | |
Fund Inception | | | 2001 | |
No sales charges or distribution fees | | | | |
Investment Manager: Dodge & Cox, San Francisco. Managed by the International Investment Policy Committee, whose eight members’ average tenure at Dodge & Cox is 22 years.
| | | | | | | | |
| PORTFOLIO CHARACTERISTICS | | Fund | | | MSCI
EAFE | |
Median Market Capitalization (billions) | | | $27 | | | | $9 | |
Weighted Average Market Capitalization (billions) | | | $59 | | | | $51 | |
Price-to-Earnings Ratio(b) | | | 14.1x | | | | 14.8x | |
Countries Represented | | | 25 | | | | 21 | |
Emerging Markets (Brazil, China, India, Mexico, Russia, South Africa, South Korea, Thailand, Turkey, United Arab Emirates) | | | 24.9% | | | | 0.0% | |
| | | | |
| TEN LARGEST HOLDINGS (%)(c) | | Fund | |
Samsung Electronics Co., Ltd. (South Korea) | | | 4.5 | |
Sanofi (France) | | | 3.7 | |
Naspers, Ltd. (South Africa) | | | 3.4 | |
Schlumberger, Ltd. (United States) | | | 3.2 | |
Novartis AG (Switzerland) | | | 3.2 | |
Barclays PLC (United Kingdom) | | | 2.9 | |
BNP Paribas SA (France) | | | 2.9 | |
Schneider Electric SA (France) | | | 2.6 | |
ICICI Bank, Ltd. (India) | | | 2.5 | |
Itau Unibanco Holding SA (Brazil) | | | 2.5 | |
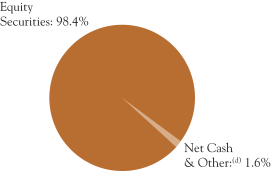
| | | | | | | | |
| REGION DIVERSIFICATION (%)(e) | | Fund | | | MSCI
EAFE | |
Europe (excluding United Kingdom) | | | 39.7 | | | | 44.8 | |
Pacific (excluding Japan) | | | 13.5 | | | | 12.1 | |
United Kingdom | | | 13.2 | | | | 18.3 | |
Japan | | | 11.9 | | | | 24.1 | |
Latin America | | | 6.8 | | | | 0.0 | |
United States | | | 6.0 | | | | 0.0 | |
Africa/Middle East | | | 5.2 | | | | 0.7 | |
Canada | | | 2.1 | | | | 0.0 | |
| | | | | | | | |
| SECTOR DIVERSIFICATION (%) | | Fund | | | MSCI
EAFE | |
Financials | | | 27.1 | | | | 21.2 | |
Consumer Discretionary | | | 17.3 | | | | 12.5 | |
Information Technology | | | 14.3 | | | | 5.5 | |
Health Care | | | 12.5 | | | | 10.6 | |
Industrials | | | 8.4 | | | | 14.0 | |
Energy | | | 7.8 | | | | 5.5 | |
Materials | | | 5.4 | | | | 7.9 | |
Telecommunication Services | | | 3.3 | | | | 4.5 | |
Real Estate | | | 1.3 | | | | 3.7 | |
Consumer Staples | | | 0.7 | | | | 11.2 | |
Utilities | | | 0.3 | | | | 3.4 | |
| (a) | SEC Yield is an annualization of the Fund’s net investment income for the trailing 30-day period. Dividends paid by the Fund may be higher or lower than implied by the SEC Yield. |
| (b) | Price-to-earnings (P/E) ratios are calculated using 12-month forward earnings estimates from third-party sources. |
| (c) | The Fund’s portfolio holdings are subject to change without notice. The mention of specific securities is not a recommendation to buy, sell, or hold any particular security and is not indicative of Dodge & Cox’s current or future trading activity. |
| (d) | Net Cash & Other includes cash, short-term investments, receivables, and payables. |
| (e) | The Fund may classify a company in a different category than the MSCI EAFE. The Fund generally classifies a company based on its country of incorporation, but may designate a different country in certain circumstances. |
PAGE 6 § DODGE & COX INTERNATIONAL STOCK FUND
| | | | |
| CONSOLIDATED PORTFOLIO OF INVESTMENTS | | | December 31, 2016 | |
| | | | | | | | |
| COMMON STOCKS: 92.9% | | | | | | |
| | |
| | | SHARES | | | VALUE | |
| CONSUMER DISCRETIONARY: 17.3% | |
AUTOMOBILES & COMPONENTS: 5.7% | |
Adient PLC(a) (Ireland) | | | 1,260,640 | | | $ | 73,873,504 | |
Bayerische Motoren Werke AG (Germany) | | | 9,617,500 | | | | 900,417,619 | |
Honda Motor Co., Ltd. (Japan) | | | 36,132,600 | | | | 1,051,934,029 | |
Honda Motor Co., Ltd. ADR (Japan) | | | 5,741,155 | | | | 167,584,314 | |
Mahindra & Mahindra, Ltd. (India) | | | 7,171,971 | | | | 124,081,625 | |
NGK Spark Plug Co., Ltd. (Japan) | | | 6,134,400 | | | | 135,793,426 | |
Yamaha Motor Co., Ltd.(b) (Japan) | | | 30,076,100 | | | | 659,880,719 | |
| | | | | | | | |
| | | | 3,113,565,236 | |
CONSUMER DURABLES & APPAREL: 1.4% | |
Panasonic Corp. (Japan) | | | 72,908,634 | | | | 739,949,893 | |
| | |
MEDIA: 8.5% | | | | | | | | |
Altice NV, Series A(a) (Netherlands) | | | 29,799,674 | | | | 589,440,509 | |
Grupo Televisa SAB ADR (Mexico) | | | 31,166,592 | | | | 651,070,107 | |
Liberty Global PLC LiLAC, Series A(a)(b) (United Kingdom) | | | 3,896,557 | | | | 85,568,392 | |
Liberty Global PLC LiLAC, Series C(a) (United Kingdom) | | | 5,436,380 | | | | 115,088,165 | |
Liberty Global PLC, Series A(a) (United Kingdom) | | | 15,970,087 | | | | 488,524,961 | |
Liberty Global PLC, Series C(a) (United Kingdom) | | | 24,370,147 | | | | 723,793,366 | |
Naspers, Ltd. (South Africa) | | | 12,619,695 | | | | 1,838,755,356 | |
Television Broadcasts, Ltd.(b) (Hong Kong) | | | 40,022,900 | | | | 131,599,460 | |
| | | | | | | | |
| | | | 4,623,840,316 | |
RETAILING: 1.7% | |
JD.com, Inc. ADR(a) (Cayman Islands/China) | | | 35,101,036 | | | | 892,970,356 | |
| | | | | | | | |
| | | | 9,370,325,801 | |
| CONSUMER STAPLES: 0.7% | | | | | | | | |
FOOD & STAPLES RETAILING: 0.5% | |
Magnit PJSC (Russia) | | | 1,394,237 | | | | 249,210,228 | |
| | |
FOOD, BEVERAGE & TOBACCO: 0.2% | | | | | | | | |
Anadolu Efes Biracilik ve Malt Sanayii AS(b) (Turkey) | | | 27,839,432 | | | | 139,117,941 | |
| | | | | | | | |
| | | | 388,328,169 | |
| ENERGY: 6.0% | | | | | | | | |
Royal Dutch Shell PLC ADR (United Kingdom) | | | 5,823,182 | | | | 316,664,637 | |
Saipem SPA(a)(b) (Italy) | | | 569,806,272 | | | | 318,824,311 | |
Schlumberger, Ltd. (Curacao/United States) | | | 20,381,524 | | | | 1,711,028,940 | |
Statoil ASA (Norway) | | | 2,797,950 | | | | 50,982,328 | |
Suncor Energy, Inc. (Canada) | | | 20,618,200 | | | | 674,008,958 | |
Weatherford International PLC(a) (Ireland) | | | 34,997,592 | | | | 174,637,984 | |
| | | | | | | | |
| | | | 3,246,147,158 | |
| FINANCIALS: 24.7% | | | | | | | | |
BANKS: 18.6% | |
Banco Santander SA (Spain) | | | 163,711,886 | | | | 854,614,258 | |
Barclays PLC (United Kingdom) | | | 570,954,998 | | | | 1,568,396,158 | |
BNP Paribas SA (France) | | | 24,491,558 | | | | 1,560,146,453 | |
ICICI Bank, Ltd.(b) (India) | | | 364,368,485 | | | | 1,364,877,579 | |
Kasikornbank PCL- Foreign(b) (Thailand) | | | 119,975,027 | | | | 592,679,890 | |
Lloyds Banking Group PLC (United Kingdom) | | | 961,015,500 | | | | 739,050,735 | |
Mitsubishi UFJ Financial Group, Inc. (Japan) | | | 85,086,600 | | | | 523,109,534 | |
Societe Generale SA (France) | | | 21,175,842 | | | | 1,039,535,983 | |
Standard Chartered PLC(a) (United Kingdom) | | | 154,538,813 | | | | 1,265,730,633 | |
UniCredit SPA (Italy) | | | 195,982,531 | | | | 563,407,872 | |
| | | | | | | | |
| | | | 10,071,549,095 | |
| | | | | | | | |
| | |
| | | SHARES | | | VALUE | |
DIVERSIFIED FINANCIALS: 3.4% | |
Credit Suisse Group AG (Switzerland) | | | 73,715,631 | | | $ | 1,052,586,820 | |
Haci Omer Sabanci Holding AS (Turkey) | | | 47,323,154 | | | | 122,827,891 | |
UBS Group AG (Switzerland) | | | 42,611,727 | | | | 667,083,719 | |
| | | | | | | | |
| | | | 1,842,498,430 | |
INSURANCE: 2.7% | |
AEGON NV(b) (Netherlands) | | | 134,654,439 | | | | 740,473,900 | |
Aviva PLC (United Kingdom) | | | 118,509,527 | | | | 707,158,912 | |
| | | | | | | | |
| | | | 1,447,632,812 | |
| | | | | | | | |
| | | | 13,361,680,337 | |
| HEALTH CARE: 12.5% | | | | | | | | |
PHARMACEUTICALS, BIOTECHNOLOGY & LIFE SCIENCES: 12.5% | |
AstraZeneca PLC (United Kingdom) | | | 15,087,450 | | | | 818,241,971 | |
Bayer AG (Germany) | | | 10,360,950 | | | | 1,080,916,116 | |
Novartis AG (Switzerland) | | | 10,088,570 | | | | 733,828,959 | |
Novartis AG ADR (Switzerland) | | | 13,228,500 | | | | 963,563,940 | |
Roche Holding AG (Switzerland) | | | 5,194,100 | | | | 1,183,492,334 | |
Sanofi (France) | | | 24,698,322 | | | | 1,997,498,575 | |
| | | | | | | | |
| | | | 6,777,541,895 | |
| INDUSTRIALS: 8.4% | | | | | | | | |
CAPITAL GOODS: 8.1% | |
Johnson Controls International PLC (Ireland) | | | 11,724,201 | | | | 482,919,839 | |
Koninklijke Philips NV (Netherlands) | | | 17,564,296 | | | | 535,377,495 | |
Mitsubishi Electric Corp. (Japan) | | | 83,418,800 | | | | 1,159,655,152 | |
Nidec Corp. (Japan) | | | 5,374,300 | | | | 462,190,057 | |
Schneider Electric SA (France) | | | 20,122,946 | | | | 1,398,296,330 | |
Smiths Group PLC(b) (United Kingdom) | | | 19,705,000 | | | | 342,300,274 | |
| | | | | | | | |
| | | | 4,380,739,147 | |
TRANSPORTATION: 0.3% | |
DP World, Ltd. (United Arab Emirates) | | | 8,256,304 | | | | 144,567,883 | |
| | | | | | | | |
| | | | 4,525,307,030 | |
| INFORMATION TECHNOLOGY: 13.0% | |
SOFTWARE & SERVICES: 2.5% | |
Baidu, Inc. ADR(a) (Cayman Islands/China) | | | 4,920,687 | | | | 809,010,150 | |
Nintendo Co., Ltd. (Japan) | | | 2,536,400 | | | | 530,223,070 | |
| | | | | | | | |
| | | | 1,339,233,220 | |
TECHNOLOGY, HARDWARE & EQUIPMENT: 10.5% | |
Brother Industries, Ltd.(b) (Japan) | | | 12,954,700 | | | | 232,963,534 | |
Hewlett Packard Enterprise Co. (United States) | | | 53,475,384 | | | | 1,237,420,386 | |
HP Inc. (United States) | | | 20,181,302 | | | | 299,490,522 | |
Kyocera Corp.(b) (Japan) | | | 16,344,500 | | | | 810,671,649 | |
Samsung Electronics Co., Ltd. (South Korea) | | | 1,173,492 | | | | 1,733,902,424 | |
TE Connectivity, Ltd. (Switzerland) | | | 10,380,862 | | | | 719,186,119 | |
Telefonaktiebolaget LM Ericsson (Sweden) | | | 115,264,300 | | | | 671,943,514 | |
| | | | | | | | |
| | | | 5,705,578,148 | |
| | | | | | | | |
| | | | 7,044,811,368 | |
| MATERIALS: 5.4% | | | | | | | | |
Agrium, Inc. (Canada) | | | 4,382,126 | | | | 440,622,769 | |
Akzo Nobel NV (Netherlands) | | | 6,883,317 | | | | 429,873,143 | |
Cemex SAB de CV ADR (Mexico) | | | 47,594,584 | | | | 382,184,510 | |
LafargeHolcim, Ltd. (Switzerland) | | | 17,269,883 | | | | 907,197,028 | |
Linde AG (Germany) | | | 4,533,205 | | | | 743,328,451 | |
| | | | | | | | |
| | | | 2,903,205,901 | |
| REAL ESTATE: 1.3% | | | | | | | | |
Hang Lung Properties, Ltd. (Hong Kong) | | | 144,880,200 | | | | 303,355,112 | |
Hang Lung Group, Ltd.(b) (Hong Kong) | | | 121,585,500 | | | | 422,668,421 | |
| | | | | | | | |
| | | | 726,023,533 | |
| | |
| See accompanying Notes to Consolidated Financial Statements | | DODGE & COX INTERNATIONAL STOCK FUND §PAGE 7 |
| | | | |
| CONSOLIDATED PORTFOLIO OF INVESTMENTS | | | December 31, 2016 | |
| | | | | | | | |
| COMMON STOCKS (continued) | |
| | |
| | | SHARES | | | VALUE | |
| TELECOMMUNICATION SERVICES: 3.3% | |
America Movil SAB de CV, Series L (Mexico) | | | 548,620,600 | | | $ | 344,580,840 | |
Bharti Airtel, Ltd. (India) | | | 49,441,504 | | | | 222,399,453 | |
Millicom International Cellular SA SDR(b) (Luxembourg) | | | 9,603,136 | | | | 410,179,271 | |
MTN Group, Ltd. (South Africa) | | | 88,829,080 | | | | 811,373,435 | |
| | | | | | | | |
| | | | 1,788,532,999 | |
| UTILITIES: 0.3% | | | | | | | | |
Engie (France) | | | 13,736,547 | | | | 174,999,308 | |
| | | | | | | | |
TOTAL COMMON STOCKS
(Cost $54,560,651,593) | | | $ | 50,306,903,499 | |
| |
| PREFERRED STOCKS: 5.5% | | | | |
| ENERGY: 1.8% | | | | | | | | |
Petroleo Brasileiro SA ADR(a) (Brazil) | | | 111,517,000 | | | | 982,464,770 | |
| | |
| FINANCIALS: 2.4% | | | | | | | | |
BANKS: 2.4% | | | | | | | | |
Itau Unibanco Holding SA (Brazil) | | | 128,669,101 | | | | 1,326,753,248 | |
|
| INFORMATION TECHNOLOGY: 1.3% | |
TECHNOLOGY, HARDWARE & EQUIPMENT: 1.3% | |
Samsung Electronics Co., Ltd. (South Korea) | | | 586,116 | | | | 689,213,810 | |
| | | | | | | | |
| |
TOTAL PREFERRED STOCKS
(Cost $3,102,940,330) | | | $ | 2,998,431,828 | |
|
| SHORT-TERM INVESTMENTS: 1.1% | |
| | |
| | | PAR VALUE | | | VALUE | |
MONEY MARKET FUND: 0.1% | | | | | | | | |
State Street Institutional Treasury Plus Money Market Fund | | $ | 54,471,261 | | | $ | 54,471,261 | |
| | |
REPURCHASE AGREEMENT: 1.0% | | | | | | | | |
Fixed Income Clearing Corporation(c) 0.10%, dated 12/30/16, due 1/3/17, maturity value $540,803,009 | | | 540,797,000 | | | | 540,797,000 | |
| | | | | | | | |
TOTAL SHORT-TERM INVESTMENTS
(Cost $595,268,261) | | | $ | 595,268,261 | |
| | | | | | | | |
TOTAL INVESTMENTS
(Cost $58,258,860,184) | | | 99.5 | % | | $ | 53,900,603,588 | |
OTHER ASSETS LESS LIABILITIES | | | 0.5 | % | | | 286,045,456 | |
| | | | | | | | |
| NET ASSETS | | | 100.0 | % | | $ | 54,186,649,044 | |
| | | | | | | | |
| (b) | See Note 10 regarding holdings of 5% voting securities |
| (c) | Repurchase agreement is collateralized by U.S. Treasury Inflation Indexed Note 0.125%, 4/15/18 and U.S. Treasury Notes 0.625%-0.875%, 5/15/17-4/30/18. Total collateral value is $551,622,946. |
In determining a company’s country designation, the Fund generally references the country of incorporation. In cases where the Fund considers the country of incorporation to be a “jurisdiction of convenience” chosen primarily for tax purposes or in other limited circumstances, the Fund uses the country designation of an appropriate broad-based market index. In those cases, two countries are listed—the country of incorporation and the country designated by an appropriate index, respectively.
ADR: American Depositary Receipt
SDR: Swedish Depository Receipt
FORWARD CURRENCY CONTRACTS
| | | | | | | | | | | | | | | | |
| | | | Contract Amount | | | | |
| Counterparty | | Settle
Date | | | Receive
U.S. Dollar | | | Deliver
Foreign
Currency | | | Unrealized
Appreciation/
(Depreciation) | |
Contracts to sell CHF: | |
Citibank | | | 1/11/17 | | | | 101,112 | | | | 100,000 | | | $ | 2,868 | |
Goldman Sachs | | | 1/11/17 | | | | 449,962,073 | | | | 444,900,000 | | | | 12,872,858 | |
UBS | | | 1/11/17 | | | | 470,152,876 | | | | 465,000,000 | | | | 13,316,541 | |
Goldman Sachs | | | 1/18/17 | | | | 305,006,685 | | | | 300,000,000 | | | | 10,123,810 | |
Bank of America | | | 3/8/17 | | | | 139,510,319 | | | | 140,000,000 | | | | 1,486,393 | |
Contracts to sell CNH: | |
Citibank | | | 1/25/17 | | | | 190,832,729 | | | | 1,262,473,000 | | | | 11,157,667 | |
JPMorgan | | | 1/25/17 | | | | 136,445,100 | | | | 903,614,500 | | | | 7,842,753 | |
JPMorgan | | | 1/25/17 | | | | 140,116,967 | | | | 927,897,500 | | | | 8,058,665 | |
Citibank | | | 2/15/17 | | | | 136,394,641 | | | | 903,614,500 | | | | 8,524,234 | |
JPMorgan | | | 2/15/17 | | | | 54,496,820 | | | | 361,445,800 | | | | 3,348,657 | |
JPMorgan | | | 2/15/17 | | | | 136,487,350 | | | | 903,614,500 | | | | 8,616,943 | |
JPMorgan | | | 2/15/17 | | | | 136,189,058 | | | | 903,614,400 | | | | 8,318,665 | |
UBS | | | 2/22/17 | | | | 505,782,721 | | | | 3,413,021,800 | | | | 23,556,948 | |
Citibank | | | 3/1/17 | | | | 231,608,684 | | | | 1,536,144,600 | | | | 14,903,649 | |
Citibank | | | 3/1/17 | | | | 231,643,610 | | | | 1,536,144,600 | | | | 14,938,575 | |
Credit Suisse | | | 3/8/17 | | | | 146,120,063 | | | | 989,934,200 | | | | 6,666,635 | |
UBS | | | 3/8/17 | | | | 365,638,166 | | | | 2,476,467,300 | | | | 16,774,723 | |
Citibank | | | 3/15/17 | | | | 95,010,622 | | | | 630,598,800 | | | | 6,272,328 | |
Citibank | | | 3/15/17 | | | | 176,766,052 | | | | 1,174,698,800 | | | | 11,461,634 | |
JPMorgan | | | 3/15/17 | | | | 95,034,504 | | | | 630,598,600 | | | | 6,296,238 | |
JPMorgan | | | 3/15/17 | | | | 94,757,370 | | | | 629,247,400 | | | | 6,209,245 | |
Bank of America | | | 3/22/17 | | | | 96,721,370 | | | | 653,788,100 | | | | 4,818,194 | |
UBS | | | 3/22/17 | | | | 451,437,966 | | | | 3,053,526,400 | | | | 22,202,907 | |
Citibank | | | 3/29/17 | | | | 176,588,755 | | | | 1,171,111,900 | | | | 12,140,993 | |
Citibank | | | 3/29/17 | | | | 88,319,155 | | | �� | 585,556,000 | | | | 6,095,268 | |
Citibank | | | 3/29/17 | | | | 135,589,299 | | | | 900,855,300 | | | | 9,091,021 | |
HSBC | | | 3/29/17 | | | | 105,024,045 | | | | 695,364,200 | | | | 7,380,868 | |
JPMorgan | | | 3/29/17 | | | | 88,319,140 | | | | 585,555,900 | | | | 6,095,266 | |
JPMorgan | | | 3/29/17 | | | | 176,398,840 | | | | 1,171,111,900 | | | | 11,951,078 | |
Contracts to sell EUR: | |
Barclays | | | 2/15/17 | | | | 80,941,350 | | | | 75,000,000 | | | | 1,829,552 | |
Credit Suisse | | | 2/15/17 | | | | 107,760,000 | | | | 100,000,000 | | | | 2,277,603 | |
JPMorgan | | | 2/15/17 | | | | 485,786,250 | | | | 450,000,000 | | | | 11,115,465 | |
Bank of America | | | 2/22/17 | | | | 239,673,375 | | | | 225,000,000 | | | | 2,262,055 | |
Barclays | | | 3/1/17 | | | | 647,601,000 | | | | 600,000,000 | | | | 14,301,546 | |
HSBC | | | 3/8/17 | | | | 323,547,300 | | | | 300,000,000 | | | | 6,786,756 | |
| | | | |
| Counterparty | | Settle
Date | | | Deliver
U.S. Dollar | | | Receive
Foreign
Currency | | | Unrealized
Appreciation/
(Depreciation) | |
Contracts to buy EUR: | |
JPMorgan | | | 2/15/17 | | | | 315,418,500 | | | | 300,000,000 | | | | 1,028,690 | |
| | | | | | | | | | | | | | | | |
| | | $ | 320,127,291 | |
| | | | | | | | | | | | | | | | |
| | |
| PAGE 8 § DODGE & COX INTERNATIONAL STOCK FUND | | See accompanying Notes to Consolidated Financial Statements |
| | |
CONSOLIDATED STATEMENT OF ASSETS AND LIABILITIES |
| |
| | | December 31, 2016 |
| | | | |
ASSETS: | | | | |
Investments, at value | | | | |
Unaffiliated issuers (cost $51,871,143,673) | | $ | 49,173,851,645 | |
Affiliated issuers (cost $6,387,716,511) | | | 4,726,751,943 | |
| | | | |
| | | 53,900,603,588 | |
Unrealized appreciation on forward currency contracts | | | 320,127,291 | |
Cash | | | 100 | |
Cash denominated in foreign currency (cost $2,354) | | | 2,319 | |
Receivable for investments sold | | | 66,924,644 | |
Receivable for Fund shares sold | | | 27,145,348 | |
Dividends and interest receivable | | | 137,106,127 | |
Prepaid expenses and other assets | | | 309,920 | |
| | | | |
| | | 54,452,219,337 | |
| | | | |
LIABILITIES: | | | | |
Payable for investments purchased | | | 19,062,828 | |
Payable for Fund shares redeemed | | | 214,861,863 | |
Management fees payable | | | 27,829,577 | |
Accrued expenses | | | 3,816,025 | |
| | | | |
| | | 265,570,293 | |
| | | | |
NET ASSETS | | $ | 54,186,649,044 | |
| | | | |
NET ASSETS CONSIST OF: | | | | |
Paid in capital | | $ | 59,317,173,912 | |
Distributions in excess of net investment income | | | (33,914,059 | ) |
Accumulated net realized loss | | | (1,056,411,585 | ) |
Net unrealized depreciation | | | (4,040,199,224 | ) |
| | | | |
| | $ | 54,186,649,044 | |
| | | | |
Fund shares outstanding (par value $0.01 each,
unlimited shares authorized) | | | 1,422,252,494 | |
Net asset value per share | | $ | 38.10 | |
|
CONSOLIDATED STATEMENT OF OPERATIONS | |
| |
| | | Year Ended
December 31, 2016 | |
INVESTMENT INCOME: | | | | |
Dividends (net of foreign taxes of $75,399,204) | | | | |
Unaffiliated issuers | | $ | 1,300,439,932 | |
Affiliated issuers | | | 178,803,730 | |
Interest | | | 1,349,650 | |
| | | | |
| | | 1,480,593,312 | |
| | | | |
EXPENSES: | | | | |
Management fees | | | 321,193,321 | |
Custody and fund accounting fees | | | 7,286,718 | |
Transfer agent fees | | | 8,950,307 | |
Professional services | | | 224,422 | |
Shareholder reports | | | 1,874,778 | |
Registration fees | | | 105,589 | |
Trustees’ fees | | | 247,500 | |
ADR depositary services fees | | | 4,531,051 | |
Miscellaneous | | | 739,877 | |
| | | | |
| | | 345,153,563 | |
| | | | |
NET INVESTMENT INCOME | | | 1,135,439,749 | |
| | | | |
REALIZED AND UNREALIZED GAIN (LOSS): | |
Net realized gain (loss) | | | | |
Investments in unaffiliated issuers | | | 1,665,789,240 | |
Investments in affiliated issuers | | | (218,391,873 | ) |
Forward currency contracts | | | 97,626,902 | |
Foreign currency transactions | | | (9,335,541 | ) |
Net change in unrealized appreciation/depreciation | | | | |
Investments | | | 1,209,855,425 | |
Forward currency contracts | | | 324,654,727 | |
Foreign currency translation | | | 1,286,694 | |
| | | | |
Net realized and unrealized gain | | | 3,071,485,574 | |
| | | | |
NET CHANGE IN NET ASSETS
FROM OPERATIONS | | $ | 4,206,925,323 | |
| | | | |
| | | | |
CONSOLIDATED STATEMENT OF CHANGES IN NET ASSETS |
| | | | | | | | |
| | |
| | | Year Ended
December 31, 2016 | | | Year Ended
December 31, 2015 | |
OPERATIONS: | | | | | | | | |
Net investment income | | $ | 1,135,439,749 | | | $ | 1,230,290,110 | |
Net realized gain | | | 1,535,688,728 | | | | 1,569,060,418 | |
Net change in unrealized appreciation/depreciation | | | 1,535,796,846 | | | | (10,451,943,877 | ) |
| | | | | | | | |
| | | 4,206,925,323 | | | | (7,652,593,349 | ) |
| | | | | | | | |
| | |
DISTRIBUTIONS TO SHAREHOLDERS FROM: | | | | | | | | |
Net investment income | | | (1,185,247,471 | ) | | | (1,304,169,120 | ) |
Net realized gain | | | (757,672,431 | ) | | | — | |
| | | | | | | | |
Total distributions | | | (1,942,919,902 | ) | | | (1,304,169,120 | ) |
| | | | | | | | |
| | |
FUND SHARE TRANSACTIONS: | | | | | | | | |
Proceeds from sale of shares | | | 6,854,611,384 | | | | 12,406,796,087 | |
Reinvestment of distributions | | | 1,655,896,889 | | | | 1,091,460,147 | |
Cost of shares redeemed | | | (13,616,468,513 | ) | | | (11,552,646,146 | ) |
| | | | | | | | |
Net change from Fund share transactions | | | (5,105,960,240 | ) | | | 1,945,610,088 | |
| | | | | | | | |
Total change in net assets | | | (2,841,954,819 | ) | | | (7,011,152,381 | ) |
| | |
NET ASSETS: | | | | | | | | |
Beginning of year | | | 57,028,603,863 | | | | 64,039,756,244 | |
| | | | | | | | |
End of year (including distributions in excess of net investment income of $(33,914,059) and $(5,017,088), respectively) | | $ | 54,186,649,044 | | | $ | 57,028,603,863 | |
| | | | | | | | |
| | |
SHARE INFORMATION: | | | | | | | | |
Shares sold | | | 194,723,459 | | | | 295,300,198 | |
Distributions reinvested | | | 43,438,957 | | | | 30,234,353 | |
Shares redeemed | | | (379,146,976 | ) | | | (283,036,306 | ) |
| | | | | | | | |
Net change in shares outstanding | | | (140,984,560 | ) | | | 42,498,245 | |
| | | | | | | | |
| | |
| See accompanying Notes to Consolidated Financial Statements | | DODGE & COX INTERNATIONAL STOCK FUND §PAGE 9 |
NOTES TO CONSOLIDATED FINANCIAL STATEMENTS
NOTE 1—ORGANIZATION AND SIGNIFICANT ACCOUNTING POLICIES
Dodge & Cox International Stock Fund (the “Fund”) is one of the series constituting the Dodge & Cox Funds (the “Trust” or the “Funds”). The Trust is organized as a Delaware statutory trust and is registered under the Investment Company Act of 1940, as amended, as an open-end management investment company. On January 16th, 2015, the Fund closed to new investors. The Fund commenced operations on May 1, 2001, and seeks long-term growth of principal and income. The Fund invests primarily in a diversified portfolio of foreign equity securities. Foreign investing, especially in developing countries, has special risks such as currency and market volatility and political and social instability. These and other risk considerations are discussed in the Fund’s Prospectus.
The financial statements have been prepared in conformity with accounting principles generally accepted in the United States of America, which require the use of estimates and assumptions by management. Actual results may differ from those estimates. Significant accounting policies are as follows:
Security valuation The Fund’s net assets are typically valued as of the normally scheduled close of trading on the New York Stock Exchange (NYSE), generally 4:00 p.m. Eastern Time, each day that the NYSE is open for business.
Portfolio securities and other financial instruments for which market quotes are readily available are valued at market value. Listed securities are generally valued using the official quoted close price or the last sale on the exchange that is determined to be the primary market for the security. Security values are not discounted based on the size of the Fund’s position. Short-term securities less than 60 days to maturity may be valued at amortized cost if amortized cost approximates current value. Mutual funds are valued at their respective net asset values.
Investments initially valued in currencies other than the U.S. dollar are converted to the U.S. dollar using prevailing exchange rates. Forward currency contracts are valued based on the prevailing forward exchange rates of the underlying currencies. As a result, the Fund’s net assets may be affected by changes in the value of currencies in relation to the U.S. dollar.
If market quotations are not readily available or if a security’s value is believed to have materially changed after the close of the security’s primary market but before the close of trading on the NYSE, the security is valued at fair value as determined in good faith by or under the direction of the Fund’s Board of Trustees. The Board of Trustees has appointed Dodge & Cox, the Fund’s investment manager, to make fair value determinations in accordance with the Dodge & Cox Funds Valuation Policies (“Valuation Policies”), subject to Board oversight. Dodge & Cox has established a Pricing Committee that is comprised of representatives from Treasury, Legal, Compliance, and Operations. The Pricing Committee is responsible for implementing the Valuation Policies, including determining the fair value of securities when market quotations or market-based valuations are not readily available or are deemed unreliable. The Pricing
Committee considers relevant indications of value that are reasonably available to it in determining the fair value assigned to a particular security, such as the value of similar financial instruments, trading volumes, contractual restrictions on disposition, related corporate actions, and changes in economic conditions. In doing so, the Pricing Committee employs various methods for calibrating fair valuation approaches, including a regular review of key inputs and assumptions, back-testing, and review of any related market activity.
As trading in securities on most foreign exchanges is normally completed before the close of the NYSE, the value of non-U.S. securities can change by the time the Fund calculates its NAV. To address these changes, the Fund may utilize adjustment factors provided by an independent pricing service to systematically value non-U.S. securities at fair value. These adjustment factors are based on statistical analyses of subsequent movements and changes in U.S. markets and financial instruments trading in U.S. markets that represent foreign securities or baskets of securities.
Valuing securities through a fair value determination involves greater reliance on judgment than valuation of securities based on readily available market quotations. In some instances, lack of information and uncertainty as to the significance of information may lead to a conclusion that a prior valuation is the best indication of a security’s value. When fair value pricing is employed, the prices of securities used by the Fund to calculate its NAV may differ from quoted or published prices for the same securities.
Security transactions, investment income, expenses, and distributions Security transactions are recorded on the trade date. Realized gains and losses on securities sold are determined on the basis of identified cost.
Dividend income and corporate action transactions are recorded on the ex-dividend date, or when the Fund first learns of the dividend/corporate action if the ex-dividend date has passed. Non-cash dividends included in dividend income, if any, are recorded at the fair market value of the securities received. Dividends characterized as return of capital for U.S. tax purposes are recorded as a reduction of cost of investments and/or realized gain. Interest income is recorded on the accrual basis.
Expenses are recorded on the accrual basis. Some expenses of the Trust can be directly attributed to a specific series. Expenses which cannot be directly attributed are allocated among the Funds in the Trust methodologies determined by the nature of the expense.
Distributions to shareholders are recorded on the ex-dividend date.
Foreign taxes The Fund is subject to foreign taxes which may be imposed by certain countries in which the Fund invests. The Fund endeavors to record foreign taxes based on applicable foreign tax law. Withholding taxes are incurred on certain foreign dividends and are accrued at the time the associated dividend is recorded. The Fund files withholding tax reclaims in certain jurisdictions to recover a portion of amounts previously withheld.
PAGE 10 § DODGE & COX INTERNATIONAL STOCK FUND
NOTES TO CONSOLIDATED FINANCIAL STATEMENTS
The Fund records a reclaim receivable based on, among other things, a jurisdiction’s legal obligation to pay reclaims as well as payment history and market convention. In consideration of recent decisions rendered by European courts, the Fund has filed for additional reclaims related to prior years. A corresponding receivable is established when both the amount is known and significant contingencies or uncertainties regarding collectability are removed. These amounts, if any, are reported in “dividends and interest receivable” on the Consolidated Statement of Assets and Liabilities.
Capital gains taxes are incurred upon disposition of certain foreign securities. Expected capital gains taxes on appreciated securities are accrued as unrealized losses and incurred capital gains taxes are reflected as realized losses upon the sale of the related security. Currency taxes may be incurred when the Fund purchases certain foreign currencies related to securities transactions and are recorded as realized losses on foreign currency transactions.
Repurchase agreements The Fund enters into repurchase agreements, secured by U.S. government or agency securities, which involve the purchase of securities from a counterparty with a simultaneous commitment to resell the securities at an agreed-upon date and price. It is the Fund’s policy that its custodian take possession of the underlying collateral securities, the fair value of which exceeds the principal amount of the repurchase transaction, including accrued interest, at all times. In the event of default by the counterparty, the Fund has the contractual right to liquidate the collateral securities and to apply the proceeds in satisfaction of the obligation.
Forward currency contracts A forward currency contract represents an obligation to purchase or sell a specific foreign currency at a future date at a price set at the time of the contract. The values of the forward currency contracts are adjusted daily based on the prevailing forward exchange rates of the underlying currencies. Changes in the value of open contracts are recorded as unrealized appreciation or depreciation in the Consolidated Statement of Operations. When the forward currency contract is closed, the Fund records a realized gain or loss in the Consolidated Statement of Operations equal to the difference between the value at the time the contract was opened and the value at the time it was closed. Losses from these transactions may arise from unfavorable changes in currency values or if the counterparties do not perform under a contract’s terms.
The Fund has maintained forward currency contracts to hedge direct and/or indirect foreign currency exposure to the Chinese yuan renminbi, euro, and Swiss franc. During the year ended December 31, 2016, these forward currency contracts had U.S. dollar total values ranging from 7% to 16% of net assets.
Foreign currency translation The books and records of the Fund are maintained in U.S. dollars. Foreign currency amounts are translated into U.S. dollars at the prevailing exchange rates of such currencies against the U.S. dollar. The market value of investment securities and other assets and liabilities are translated
at the exchange rate as of the valuation date. Purchases and sales of investment securities, income, and expenses are translated at the exchange rate prevailing on the transaction date.
Reported realized and unrealized gain (loss) on investments include foreign currency gain (loss) related to investment transactions.
Reported realized and unrealized gain (loss) on foreign currency transactions and translation include the following: disposing/holding of foreign currency, the difference between the trade and settlement dates on securities transactions, the difference between the accrual and payment dates on dividends, and currency losses on the purchase of foreign currency in certain countries that impose taxes on such transactions.
Consolidation The Fund may invest in certain securities through its wholly owned subsidiary, Dodge & Cox International Stock Fund Cayman, Ltd. (the “Subsidiary”). The Subsidiary is a Cayman Islands exempted company and invests in certain securities consistent with the investment objective of the Fund. The Fund’s Consolidated Financial Statements, including the Consolidated Portfolio of Investments, consist of the holdings and accounts of the Fund and the Subsidiary. All intercompany transactions and balances have been eliminated. At December 31, 2016, the Subsidiary had net assets of $100, which represented less than 0.01% of the Fund’s consolidated net assets.
Indemnification Under the Trust’s organizational documents, its officers and trustees are indemnified against certain liabilities arising out of the performance of their duties to the Trust. In addition, in the normal course of business the Trust enters into contracts that provide general indemnities to other parties. The Trust’s maximum exposure under these arrangements is unknown as this would involve future claims that may be made against the Trust that have not yet occurred.
NOTE 2—VALUATION MEASUREMENTS
Various inputs are used in determining the value of the Fund’s investments and other financial instruments. These inputs are summarized in the three broad levels listed below.
| § | | Level 1: Quoted prices in active markets for identical securities |
| § | | Level 2: Other significant observable inputs (including quoted prices for similar securities, market indices, interest rates, credit risk, forward exchange rates, etc.) |
| § | | Level 3: Significant unobservable inputs (including Fund management’s assumptions in determining the fair value of investments) |
The inputs or methodology used for valuing securities are not necessarily an indication of the risk associated with investing in those securities.
DODGE & COX INTERNATIONAL STOCK FUND §PAGE 11
NOTES TO CONSOLIDATED FINANCIAL STATEMENTS
The following is a summary of the inputs used to value the Fund’s holdings at December 31, 2016:
| | | | | | | | |
| Classification(a) | | LEVEL 1
(Quoted Prices) | | | LEVEL 2
(Other Significant
Observable Inputs) | |
Securities | | | | | | | | |
Common Stocks | | | | | | | | |
Consumer Discretionary | | $ | 3,198,473,165 | | | $ | 6,171,852,636 | |
Consumer Staples | | | — | | | | 388,328,169 | |
Energy | | | 2,876,340,519 | | | | 369,806,639 | |
Financials | | | — | | | | 13,361,680,337 | |
Health Care | | | 963,563,940 | | | | 5,813,977,955 | |
Industrials | | | 482,919,839 | | | | 4,042,387,191 | |
Information Technology | | | 3,065,107,176 | | | | 3,979,704,192 | |
Materials | | | 822,807,279 | | | | 2,080,398,622 | |
Real Estate | | | — | | | | 726,023,533 | |
Telecommunication Services | | | 344,580,840 | | | | 1,443,952,159 | |
Utilities | | | — | | | | 174,999,308 | |
Preferred Stocks | | | | | | | | |
Energy | | | 982,464,770 | | | | — | |
Financials | | | — | | | | 1,326,753,248 | |
Information Technology | | | — | | | | 689,213,810 | |
Short-term Investments | | | | | | | | |
Money Market Fund | | | 54,471,261 | | | | — | |
Repurchase Agreement | | | — | | | | 540,797,000 | |
| | | | | | | | |
Total Securities | | $ | 12,790,728,789 | | | $ | 41,109,874,799 | |
| | | | | | | | |
Other Financial Instruments | | | | | | | | |
Forward Currency Contracts | | | | | | | | |
Appreciation | | $ | — | | | $ | 320,127,291 | |
| | | | | | | | | |
| (a) | Transfers during the year between Level 1 and Level 2 relate to the use of systematic fair valuation or when significant observable inputs are used to fair value a specific security. On days when systematic fair valuation is used, securities whose primary market closes before the NYSE are classified as Level 2. There were no Level 3 securities at December 31, 2016 and 2015, and there were no transfers to Level 3 during the year. |
NOTE 3—ADDITIONAL DERIVATIVES INFORMATION
The Fund has entered into over-the-counter derivatives, such as forward currency contracts (each, a “Derivative”). Each Derivative is subject to a negotiated master agreement (based on a form published by the International Swaps and Derivatives Association (“ISDA”)) governing all Derivatives between the Fund and the relevant dealer counterparty. The master agreements specify (i) events of default and other events permitting a party to terminate some or all of the Derivatives thereunder and (ii) the process by which those Derivatives will be valued for purposes of determining termination payments. If some or all of the Derivatives under a master agreement are terminated because of an event of default or similar event, the values of all terminated Derivatives must be netted to determine a single payment owed by one party to the other. Some master agreements contain collateral terms requiring the parties to post collateral in respect of some or all of the Derivatives thereunder based on the net market value of those Derivatives, subject to a minimum exposure threshold. To the extent amounts owed to the Fund by its counterparties are not collateralized, the Fund is at risk of those counterparties’
non-performance. The Fund attempts to mitigate counterparty credit risk by entering into Derivatives only with counterparties it believes to be of good credit quality and by monitoring the financial stability of those counterparties.
At December 31, 2016, all Derivative positions qualify for netting pursuant to master netting arrangements. For financial reporting purposes, the Fund does not offset financial assets and liabilities that are subject to a master netting arrangement in the Consolidated Statement of Assets and Liabilities. Gross assets and liabilities related to Derivatives are presented as “unrealized appreciation on forward currency contracts” and “unrealized depreciation on forward currency contracts,” respectively, in the Consolidated Statement of Assets and Liabilities. Derivative information by counterparty is presented in the Consolidated Portfolio of Investments. At December 31, 2016, no collateral is pledged or held by the Fund for Derivatives.
NOTE 4—RELATED PARTY TRANSACTIONS
Management fees Under a written agreement approved by a unanimous vote of the Board of Trustees, the Fund pays an annual management fee of 0.60% of the Fund’s average daily net assets to Dodge & Cox, investment manager of the Fund.
Fund officers and trustees All officers and two of the trustees of the Trust are officers or employees of Dodge & Cox. The Trust pays a fee only to those trustees who are not affiliated with Dodge & Cox.
NOTE 5—INCOME TAX INFORMATION AND DISTRIBUTIONS TO SHAREHOLDERS
A provision for federal income taxes is not required since the Fund intends to continue to qualify as a regulated investment company under Subchapter M of the Internal Revenue Code and distribute all of its taxable income to shareholders. Distributions are determined in accordance with income tax regulations, and such amounts may differ from net investment income and realized gains for financial reporting purposes. Financial reporting records are adjusted for permanent book to tax differences at year end to reflect tax character.
Book to tax differences are primarily due to differing treatments of wash sales, net short-term realized gain (loss), investments in passive foreign investment companies, and foreign currency realized gain (loss). At December 31, 2016, the cost of investments for federal income tax purposes was $58,390,050,262.
Distributions during the years noted below were characterized as follows for federal income tax purposes.
| | | | | | | | |
| | | Year Ended
December 31, 2016 | | | Year Ended
December 31, 2015 | |
Ordinary income | | | $1,186,114,668 | | | | $1,304,169,120 | |
| | | ($0.852 per share) | | | | ($0.840 per share) | |
| | |
Long-term capital gain | | | $756,805,234 | | | | — | |
| | | ($0.543 per share) | | | | | |
PAGE 12 § DODGE & COX INTERNATIONAL STOCK FUND
NOTES TO CONSOLIDATED FINANCIAL STATEMENTS
At December 31, 2016, the tax basis components of distributable earnings were as follows:
| | | | |
Unrealized appreciation | | $ | 6,013,218,033 | |
Unrealized depreciation | | | (10,502,664,707 | ) |
| | | | |
Net unrealized depreciation | | | (4,489,446,674 | ) |
Undistributed ordinary income | | | 17,708,067 | |
Deferred loss(a) | | | (656,716,341 | ) |
| (a) | Represents capital loss incurred between November 1, 2016 and December 31, 2016. As permitted by tax regulation, the Fund has elected to treat this loss as arising in 2017. |
During 2016, the Fund fully utilized its capital loss carryforward of $1,783,220,989.
Fund management has reviewed the tax positions for open periods (three years and four years, respectively, from filing the Fund’s Federal and State tax returns) as applicable to the Fund, and has determined that no provision for income tax is required in the Fund’s financial statements.
NOTE 6—LOAN FACILITIES
Pursuant to an exemptive order issued by the Securities and Exchange Commission (SEC), the Fund may participate in an interfund lending facility (Facility). The Facility allows the Fund to borrow money from or loan money to the Funds. Loans under the Facility are made for temporary or emergency purposes, such as to fund shareholder redemption requests. Interest on borrowings is the average of the current repurchase agreement rate and the bank loan rate. There was no activity in the Facility during the year.
All Funds in the Trust participate in a $500 million committed credit facility (Line of Credit) with State Street Bank and Trust
Company, to be utilized for temporary or emergency purposes to fund shareholder redemptions or for other short-term liquidity purposes. The maximum amount available to the Fund is $250 million. Each Fund pays an annual commitment fee on its pro-rata portion of the Line of Credit. For the year ended December 31, 2016, the Fund’s commitment fee amounted to $268,225 and is reflected as a Miscellaneous Expense in the Consolidated Statement of Operations. Interest on borrowings is charged at the prevailing rate. There were no borrowings on the Line of Credit during the year.
NOTE 7—PURCHASES AND SALES OF INVESTMENTS
For the year ended December 31, 2016, purchases and sales of securities, other than short-term securities, aggregated $8,953,587,425 and $14,861,037,812, respectively.
NOTE 8—NEW ACCOUNTING GUIDANCE
In October 2016, the SEC issued a new rule, Investment Company Reporting Modernization, which, among other provisions, amends Regulation S-X to require standardized, enhanced disclosures, particularly related to derivatives, in investment company financial statements. Compliance with the guidance is required for financial statements filed with the SEC on or after August 1, 2017. Management is currently assessing the impact of this rule to the Fund’s financial statements and other filings and does not expect any impact to the Fund’s net assets or results of operations.
NOTE 9—SUBSEQUENT EVENTS
Fund management has determined that no material events or transactions occurred subsequent to December 31, 2016, and through the date of the Fund’s financial statements issuance, which require additional disclosure in the Fund’s financial statements.
NOTE 10—HOLDINGS OF 5% VOTING SECURITIES
Each of the companies listed below was considered to be an affiliate of the Fund because the Fund owned 5% or more of the company’s voting securities during all or part of the year ended December 31, 2016. Purchase and sale transactions and dividend income earned during the year on these securities were as follows:
| | | | | | | | | | | | | | | | | | | | | | | | |
| | | Shares at
Beginning of Year | | | Additions | | | Reductions | | | Shares at
End of Year | | | Dividend
Income (a) | | | Value at
End of Year | |
AEGON NV (Netherlands) | | | 130,337,763 | | | | 9,154,676 | | | | (4,838,000 | ) | | | 134,654,439 | | | $ | 38,711,931 | | | $ | 740,473,900 | |
Anadolu Efes Biracilik ve Malt Sanayii AS (Turkey) | | | 32,425,176 | | | | — | | | | (4,585,744 | ) | | | 27,839,432 | | | | 2,220,759 | | | | — | (c) |
BR Malls Participacoes SA (Brazil) | | | 54,870,300 | | | | 4,798,200 | | | | (59,668,500 | ) | | | — | | | | — | (b) | | | — | |
Brother Industries, Ltd. (Japan) | | | 12,212,000 | | | | 7,678,900 | | | | (6,936,200 | ) | | | 12,954,700 | | | | 5,245,979 | | | | — | (c) |
Hang Lung Group, Ltd. (Hong Kong) | | | 110,524,300 | | | | 11,061,200 | | | | — | | | | 121,585,500 | | | | 12,311,050 | | | | 422,668,421 | |
ICICI Bank, Ltd. (India) | | | 260,427,185 | | | | 111,484,800 | | | | (7,543,500 | ) | | | 364,368,485 | | | | 27,641,173 | | | | 1,364,877,579 | |
Kasikornbank PCL- Foreign (Thailand) | | | 139,883,027 | | | | — | | | | (19,908,000 | ) | | | 119,975,027 | | | | 13,847,299 | | | | 592,679,890 | |
Kyocera Corp. (Japan) | | | 19,122,400 | | | | 1,467,100 | | | | (4,245,000 | ) | | | 16,344,500 | | | | 14,393,167 | | | | — | (c) |
Liberty Global PLC LiLAC, Series A (United Kingdom) | | | 580,950 | | | | 3,315,607 | | | | — | | | | 3,896,557 | | | | — | (b) | | | 85,568,392 | |
Millicom International Cellular SA SDR (Luxembourg) | | | 10,088,392 | | | | 503,806 | | | | (989,062 | ) | | | 9,603,136 | | | | 20,805,537 | | | | 410,179,271 | |
Saipem SPA (Italy) | | | 46,865,200 | | | | 561,251,064 | | | | (38,309,992 | ) | | | 569,806,272 | | | | — | (b) | | | 318,824,311 | |
Smiths Group PLC (United Kingdom) | | | 33,926,200 | | | | — | | | | (14,221,200 | ) | | | 19,705,000 | | | | 14,951,174 | | | | — | (c) |
Television Broadcasts, Ltd. (Hong Kong) | | | 40,022,900 | �� | | | — | | | | — | | | | 40,022,900 | | | | 13,402,543 | | | | 131,599,460 | |
Yamaha Motor Co., Ltd. (Japan) | | | 31,550,100 | | | | — | | | | (1,474,000 | ) | | | 30,076,100 | | | | 15,273,118 | | | | 659,880,719 | |
| | | | | | | | | | | | | | | | | | | | | | | | |
| | | | | | | | | | | | | | | | | | $ | 178,803,730 | | | $ | 4,726,751,943 | |
| | | | | | | | | | | | | | | | | | | | | | | | |
| | | | | | | | | | | | | | | | | | | | | | | | | |
| (a) | Net of foreign taxes, if any |
| (c) | Company was not an affiliate at year end |
DODGE & COX INTERNATIONAL STOCK FUND §PAGE 13
CONSOLIDATED FINANCIAL HIGHLIGHTS
| | | | | | | | | | | | | | | | | | | | |
SELECTED DATA AND RATIOS (for a share outstanding throughout each year) | | Year Ended December 31, | |
| | | 2016 | | | 2015 | | | 2014 | | | 2013 | | | 2012 | |
| | | | |
Net asset value, beginning of year | | | $36.48 | | | | $42.11 | | | | $43.04 | | | | $34.64 | | | | $29.24 | |
Income from investment operations: | | | | | | | | | | | | | | | | | | | | |
Net investment income | | | 0.82 | | | | 0.79 | | | | 0.98 | | | | 0.70 | | | | 0.76 | |
Net realized and unrealized gain (loss) | | | 2.19 | | | | (5.58 | ) | | | (0.94 | ) | | | 8.40 | | | | 5.39 | |
| | | | |
Total from investment operations | | | 3.01 | | | | (4.79 | ) | | | 0.04 | | | | 9.10 | | | | 6.15 | |
| | | | |
Distributions to shareholders from: | | | | | | | | | | | | | | | | | | | | |
Net investment income | | | (0.85 | ) | | | (0.84 | ) | | | (0.97 | ) | | | (0.70 | ) | | | (0.75 | ) |
Net realized gain | | | (0.54 | ) | | | — | | | | — | | | | — | | | | — | |
| | | | |
Total distributions | | | (1.39 | ) | | | (0.84 | ) | | | (0.97 | ) | | | (0.70 | ) | | | (0.75 | ) |
| | | | |
Net asset value, end of year | | | $38.10 | | | | $36.48 | | | | $42.11 | | | | $43.04 | | | | $34.64 | |
| | | | |
Total return | | | 8.26 | % | | | (11.35 | )% | | | 0.07 | % | | | 26.31 | % | | | 21.03 | % |
Ratios/supplemental data: | | | | | | | | | | | | | | | | | | | | |
Net assets, end of year (millions) | | | $54,187 | | | | $57,029 | | | | $64,040 | | | | $53,616 | | | | $40,556 | |
Ratio of expenses to average net assets | | | 0.64 | % | | | 0.64 | % | | | 0.64 | % | | | 0.64 | % | | | 0.64 | % |
Ratio of net investment income to average net assets | | | 2.12 | % | | | 1.86 | % | | | 2.39 | % | | | 1.85 | % | | | 2.31 | % |
Portfolio turnover rate | | | 17 | % | | | 18 | % | | | 12 | % | | | 13 | % | | | 10 | % |
See accompanying Notes to Consolidated Financial Statements
REPORT OF INDEPENDENT REGISTERED PUBLIC ACCOUNTING FIRM
To the Trustees of Dodge & Cox Funds and Shareholders of Dodge & Cox International Stock Fund
In our opinion, the accompanying consolidated statement of assets and liabilities, including the consolidated portfolio of investments, and the related consolidated statements of operations and of changes in net assets and the consolidated financial highlights present fairly, in all material respects, the financial position of Dodge & Cox International Stock Fund and its subsidiary (one of the series constituting Dodge & Cox Funds, hereafter referred to as the “Fund”) as of December 31, 2016, the results of their operations for the year then ended, the changes in their net assets for each of the two years in the period then ended and the financial highlights for each of the five years in the period then ended, in conformity with accounting principles generally accepted in the United States of America. These consolidated financial statements and consolidated financial highlights (hereafter referred to as “financial statements”) are the responsibility of the Fund’s management. Our responsibility is to express an opinion on these financial statements based on our audits. We conducted our audits of these financial statements in accordance with the standards of the Public Company Accounting Oversight Board (United States). Those standards require that we plan and perform the audit to obtain reasonable assurance about whether the financial statements are free of material misstatement. An audit includes examining, on a test basis, evidence supporting the amounts and disclosures in the financial statements, assessing the accounting principles used and significant estimates made by management, and evaluating the overall financial statement presentation. We believe that our audits, which included confirmation of securities as of December 31, 2016 by correspondence with the custodian and brokers, provide a reasonable basis for our opinion.
PricewaterhouseCoopers LLP
San Francisco, California
February 15, 2017
PAGE 14 § DODGE & COX INTERNATIONAL STOCK FUND
SPECIAL 2016 TAX INFORMATION
(unaudited)
The following information is provided pursuant to provisions of the Internal Revenue Code:
In 2016, the Fund elected to pass through to shareholders foreign source income of $1,538,341,585 and foreign taxes paid of $65,966,143.
The Fund designates up to a maximum of $1,446,760,241 of its distributions paid to shareholders in 2016 as qualified dividends (treated for federal income tax purposes in the hands of shareholders as taxable at a maximum rate of 20%).
For shareholders that are corporations, the Fund designates 3% of its ordinary dividends paid to shareholders in 2016 as dividends from domestic corporations eligible for the corporate dividends received deduction, provided that the shareholder otherwise satisfies applicable requirements to claim that deduction.
BOARD APPROVAL OF FUNDS’ INVESTMENT MANAGEMENT AGREEMENTS AND MANAGEMENT FEES
(unaudited)
The Board of Trustees is responsible for overseeing the performance of the Dodge & Cox Funds’ investment manager and determining whether to continue the Investment Management Agreements between the Funds and Dodge & Cox each year (the “Agreements”). At a meeting of the Board of Trustees of the Trust held on December 14, 2016, the Trustees, by a unanimous vote (including a separate vote of those Trustees who are not “interested persons” (as defined in the Investment Company Act of 1940) (the “Independent Trustees”)), approved the renewal of the Agreements for an additional one-year term through December 31, 2017 with respect to each Fund. During the course of the year, the Board received extensive information and materials relating to the investment management and administrative services provided by Dodge & Cox and the performance of each of the Funds.
INFORMATION RECEIVED
In 2016, the Board requested and received a series of special presentations relating to the proposed renewal of the Funds’ Agreements. These presentations, which took place over the course of the year, covered, among other things, (i) a report about asset management industry trends and the competitive landscape for Dodge & Cox and the Funds; (ii) an extensive presentation regarding economies of scale, which included materials describing key enhancements over the past 15 years in the scope of services that Dodge & Cox furnishes to the Funds; (iii) a detailed presentation by Morningstar® representatives regarding the format, methodology, and content of Morningstar’s 15(c) report; (iv) materials describing peer fund management fees (including funds with breakpoints) and expense ratios and Dodge & Cox’s separate account advisory fee schedules as compared to those of peer firms; and (v) reports by outside counsel regarding mutual fund litigation trends and developments.
In addition to the foregoing and in advance of the meeting, the Board, including each of the Independent Trustees, requested,
received, and reviewed materials relating to the Agreements and the services provided by Dodge & Cox. The Independent Trustees retained Morningstar to prepare an independent expense and performance summary for each Fund and comparable funds managed by other advisers identified by Morningstar. The Morningstar materials included information regarding advisory fee rates, expense ratios, and transfer agency, custodial, and distribution expenses, as well as appropriate performance comparisons to each Fund’s peer group and an index or combination of indices. The Morningstar materials also included a comparison of expenses of various share classes offered by comparable funds. The materials reviewed by the Board contained information concerning, among other things, Dodge & Cox’s profitability, financial results and condition, advisory fee revenue and separate account fee schedules. The Board additionally considered the Funds’ brokerage commissions, turnover rates, sales and redemption data, and the significant investment that Dodge & Cox makes in research used in managing the Funds. The Board received and reviewed memoranda and related materials addressing, among other things, Dodge & Cox’s services to the Funds; how Dodge & Cox Funds’ fees compare to fees of peer group funds; the different fees, services, costs, and risks associated with other accounts managed by Dodge & Cox as compared to the Dodge & Cox Funds; and the ways in which the Funds realize economies of scale. Throughout the process of reviewing the services provided by Dodge & Cox and preparing for the meeting, the Independent Trustees found Dodge & Cox to be open, forthright, detailed, and very helpful in answering questions about all issues. The Board received copies of the Agreements and a memorandum from the independent legal counsel to the Independent Trustees discussing the factors generally regarded as appropriate to consider in evaluating advisory arrangements. The Trust’s Contract Review Committee, consisting solely of Independent Trustees, met with the independent legal counsel on November 3, 2016 and again on December 14, 2016 to discuss whether to renew the Agreements. The Board, including the Independent Trustees, subsequently concluded that the existing Agreements are fair and reasonable and voted to approve the Agreements. In considering the Agreements, the Board, including the Independent Trustees, did not identify any single factor or particular information as all-important or controlling. In reaching the decision to approve the Agreements, the Board considered several factors, discussed below, to be key factors and reached the conclusions described below.
NATURE, QUALITY, AND EXTENT OF THE SERVICES
The Board considered that Dodge & Cox provides a wide range of services to the Funds in addition to portfolio management and that the quality of these services has been excellent in all respects. The extensive nature of services provided by Dodge & Cox has been documented in materials provided to the Board and in presentations made to the Board throughout the year. In particular, the Board considered the nature, quality, and extent of portfolio management, administrative, and shareholder services performed by Dodge & Cox. With regard to portfolio management services, the
DODGE & COX INTERNATIONAL STOCK FUND §PAGE 15
Board considered Dodge & Cox’s established long-term history of care and conscientiousness in the management of the Funds; its demonstrated consistency in investment approach and depth; the background and experience of the Dodge & Cox Investment Policy Committee, International Investment Policy Committee, Global Stock Investment Policy Committee, Fixed Income Investment Policy Committee, and Global Bond Investment Policy Committee, and research analysts responsible for managing the Funds; Dodge & Cox’s methods for assessing the regulatory and investment climate in various jurisdictions; its overall high level of attention to its core investment management function; and its commitment to the Funds and their shareholders. The Board also considered analysis provided by Morningstar regarding the degree of active management in the Dodge & Cox equity funds and concluded that Dodge & Cox is an active, high conviction manager of equity portfolios, not a “closet index” manager.
In the area of administrative and shareholder services, the Board considered the excellent quality of Dodge & Cox’s work in areas such as compliance, legal services, trading, proxy voting, technology, oversight of the Funds’ transfer agent and custodian, tax compliance, and shareholder communication through its website and other means. The Board also noted Dodge & Cox’s diligent disclosure policy, its favorable compliance record, and its reputation as a trusted, shareholder-friendly mutual fund family.
In addition, the Board considered that Dodge & Cox manages approximately $180 billion in Fund assets with fewer professionals than most comparable funds, and that on average these professionals have more experience and longer tenure than investment professionals at comparable funds. The Board also noted that Dodge & Cox is an investment research-oriented firm with no other business endeavors to distract management’s attention from its research efforts or to present material conflicts of interest with the operations of the Funds, that its investment professionals adhere to a consistent investment approach across the Funds, and that due to its careful and deliberate strategy with respect to new products, Dodge & Cox has had remarkable stability in its mutual fund product offerings over the course of the past 86 years and has the fewest funds of any of the 25 largest mutual fund families by assets. The Board further considered the favorable stewardship grades given by Morningstar to each of the Funds and the “Gold” analyst rating awarded by Morningstar to all of the Funds except the Global Bond Fund. The Board concluded that it was satisfied with the nature, extent, and quality of investment management and other services provided to the Funds by Dodge & Cox.
INVESTMENT PERFORMANCE
The Board considered short-term and long-term investment performance for each Fund (including periods of outperformance or underperformance) as compared to both relevant indices and the performance of such Fund’s peer group. The Board noted that, as of November 30, 2016, the Funds had strong absolute and relative year-to-date performance, and were also generally solid performers over longer periods. The Board determined after extensive review and inquiry that Dodge & Cox’s historic,
long-term, team-oriented, bottom-up investment approach remains consistent and that Dodge & Cox continues to be distinguished by its integrity, transparency, and independence. The Board considered that the performance of the Funds is the result of value-oriented investment management process that emphasizes a long-term investment horizon, comprehensive independent research, team approach, price discipline, low cost, and low portfolio turnover. The Board also considered that the investment performance delivered by Dodge & Cox to the Funds appeared to be consistent with the relevant performance delivered for other clients of Dodge & Cox. The Board concluded that Dodge & Cox has delivered favorable long-term performance for Fund investors consistent with the long-term investment strategies being pursued by the Funds.
COSTS AND ANCILLARY BENEFITS
Costs of Services to Funds: Fees and Expenses. The Board considered each Fund’s management fee rate and expense ratio relative to each Fund’s peer group and relative to management fees charged by Dodge & Cox to other clients. In particular, the Board considered that the Funds continue to be substantially below their peer group median in expense ratios and that many media and industry reports specifically comment on the low expense ratios of the Funds, which have been a defining characteristic of the Funds for many years. The Board also evaluated the operating structures of the Funds and Dodge & Cox, noting that the Funds do not charge front-end sales commissions or distribution fees, and Dodge & Cox bears, among other things, the significant cost of third party research, reimbursement for shareholder recordkeeping and administrative costs to third-party retirement plan administrators, and administrative and office overhead. The Board noted that expenses are well below industry averages.
When compared to peer group funds, the Funds are in the quartile with the lowest expense ratios. The Board also considered that the Funds receive numerous administrative, regulatory compliance, legal, technology, and shareholder support services from Dodge & Cox without any additional administrative fee and the fact that the Funds have relatively low transaction costs and portfolio turnover rates. The Board noted the Funds’ unusual single-share-class structure and reviewed Morningstar data (including asset-weighted average expense ratios) showing that the few peer group funds with lower expense ratios often have other share classes with significantly higher expense ratios. In this regard, the Board considered that many of the Funds’ shareholders would not be eligible to purchase comparably priced shares of many peer group funds, which typically make their lower-priced share classes available only to institutional investors. The Board determined that the Funds provide access for small investors to high quality investment management at a relatively low cost. The Board also considered that the Funds’ are priced to scale, i.e., management fee rates begin at relatively low levels with the result that, even without breakpoints, the Funds’ management fee rates are lower than those of many peer funds whose fee schedules include breakpoints. With respect to non-U.S. funds sponsored and managed by Dodge & Cox that are comparable to the Funds
PAGE 16 § DODGE & COX INTERNATIONAL STOCK FUND
in many respects, the Board noted that the fee rates charged by Dodge & Cox are the same as or higher than the fee rates charged to the Funds.
The Board reviewed information regarding the fee rates Dodge & Cox charges to separate accounts that have investment programs similar to those of the Funds, including instances where separate account fees are lower than Fund fees. The Board considered the significant differences in the nature and scope of services Dodge & Cox provides to the Funds as compared to other client accounts, as well as material differences in regulatory, litigation, and other risks as between Dodge & Cox Funds and other types of clients. The Board noted that different markets exist for mutual fund and institutional separate account management services and that a comparison of Fund fee rates and separate account fee rates must consider the fact that separate account clients bear additional costs and responsibilities that are included in the cost of a Fund. The Board further noted that many sophisticated institutional investors in the Funds that are eligible to open separate accounts at Dodge & Cox have decided for various reasons to invest in the Funds. After consideration of these matters, the Board concluded that the overall costs incurred by the Funds for the services they receive (including the management fee paid to Dodge & Cox) are reasonable and that the fees are acceptable based upon the qualifications, experience, reputation, and performance of Dodge & Cox and the low overall expense ratios of the Funds.
Profitability and Costs of Services to Dodge & Cox; “Fall-out” Benefits. The Board reviewed reports of Dodge & Cox’s financial position, profitability, and estimated overall value and considered Dodge & Cox’s overall profitability within its context as a private, employee-owned S-Corporation and relative to the favorable services provided. The Board noted in particular that Dodge & Cox’s profits are not generated by high fee rates, but reflect an extraordinarily streamlined, efficient, and focused business approach toward investment management.
The Board recognized the importance of Dodge & Cox’s profitability—which is derived solely from management fees and does not include other business ventures—to maintain its independence, stability, company culture and ethics, and management continuity. The Board also considered that the compensation/profit structure at Dodge & Cox includes a return on shareholder employees’ investment in the firm, which is vital for remaining independent and facilitating retention of management and investment professionals. The Board considered independent research indicating that firms that grow organically, rather than through acquisition, tend to have better performance. Key to organic growth is the ability to retain talented and experienced analysts, portfolio managers, and other professionals. The Board also considered that in January 2015, Dodge & Cox closed the International Stock Fund to new investors to proactively manage the growth of the Fund. The Stock Fund and Balanced Fund were similarly closed to new investors during periods of significant growth in the past. While these actions are intended to benefit existing Fund shareholders, the effect is to reduce potential revenues to Dodge & Cox from new shareholders.
The Board also considered potential “fall-out” benefits (including the receipt of research from unaffiliated brokers and reputational benefits to non-U.S. funds sponsored and managed by Dodge & Cox) that Dodge & Cox might receive as a result of its association with the Funds and determined that they are acceptable. The Board also noted that Dodge & Cox continues to invest substantial sums in its business in order to provide enhanced services, systems, and research capabilities, all of which benefit the Funds. The Board concluded that Dodge & Cox’s profitability is the keystone of its independence, stability, and long-term investment performance and that the profitability of Dodge & Cox’s relationship with the Funds (including fall-out benefits) is fair and reasonable.
ECONOMIES OF SCALE
The Board considered whether there have been economies of scale with respect to the management of each Fund, whether the Funds have appropriately benefited from any economies of scale, and whether the management fee rate is reasonable in relation to the level of Fund assets and any economies of scale that may exist. In the Board’s view, any consideration of economies of scale must take account of the Funds’ low fee structure and the considerable efficiencies of the Funds’ organization and fee structure that has been realized by shareholders from the time of each Fund’s inception (i.e., from the first dollar). An assessment of economies of scale must also take into account that Dodge & Cox invests significant time and resources in each new Fund for months (and sometimes years) prior to launch; in addition, expenses are capped, which means that Dodge & Cox subsidizes the operations of a new Fund for a period of time until it reaches scale. The Board observed that, while total Fund assets have grown significantly over the long term, this growth has not been continuous or evenly distributed across all of the Funds, as assets of certain Funds have actually declined over the past ten years.
In addition, the Board noted that Dodge & Cox has shared economies of scale by adding and enhancing services to the Funds over time, and that the internal costs of providing investment management, technology, administrative, legal, and compliance services to the Funds continue to increase. For example, Dodge & Cox has increased its global research staff and investment resources over the years to add important new capabilities for the benefit of Fund shareholders and to address the increased complexity of investing in multinational and non-U.S. companies. In addition, Dodge & Cox has made substantial expenditures in other staff, technology, cybersecurity, and infrastructure to enable it to integrate credit and equity analyses and to be able to implement its strategy in a more effective and secure manner. Over the last ten years, Dodge & Cox has increased its spending on research, investment management, client servicing, and technology including payments for third party research, data services, and computer systems for trading, operations, compliance, accounting, and communications at a rate that has significantly outpaced the Funds’ growth rate during the same period. The Board considered that Dodge & Cox has a history of voluntarily limiting asset growth in several Funds that
DODGE & COX INTERNATIONAL STOCK FUND §PAGE 17
experienced significant inflows by closing them to new investors in order to protect the Funds’ ability to achieve good investment returns for shareholders. The Board also observed that, even without fee breakpoints, the Funds are competitively priced in a very competitive market and that having a low fee from inception is better for shareholders than starting with a higher fee and adding breakpoints. The Board also noted that there may be certain diseconomies of scale associated with managing large funds, insofar as certain of the costs and risks associated with portfolio management increase as assets grow. The Board concluded that the current Dodge & Cox fee structure is fair and reasonable and adequately shares economies of scale that may exist.
CONCLUSION
Based on their evaluation of all material factors and assisted by the advice of independent legal counsel to the Independent Trustees, the Board, including the Independent Trustees, concluded that the advisory fee structure was fair and reasonable, that each Fund was paying a competitive fee for the services provided, that the scope and quality of Dodge & Cox’s services has provided substantial value for Fund shareholders over the long term, and that approval of the Agreements was in the best interests of each Fund and its shareholders.
FUND HOLDINGS
The Fund provides a complete list of its holdings four times each fiscal year, as of the end of each quarter. The Fund files the lists with the Securities and Exchange Commission (SEC) on Form N-CSR (second and fourth quarters) and Form N-Q (first and third quarters). Shareholders may view the Fund’s Forms N-CSR and N-Q on the SEC’s website at sec.gov. Forms N-CSR and N-Q may also be reviewed and copied at the SEC’s Public Reference Room in Washington, DC. Information regarding the operations of the Public Reference Room may be obtained by calling 202-551-8090 (direct) or 800-732-0330 (general SEC number). A list of the Fund’s quarter-end holdings is also available at dodgeandcox.com on or about 15 days following each quarter end and remains available on the website until the list is updated in the subsequent quarter.
PROXY VOTING
For a free copy of the Fund’s proxy voting policies and procedures, please call 800-621-3979, visit the Fund’s website at dodgeandcox.com, or visit the SEC’s website at sec.gov. Information regarding how the Fund voted proxies relating to portfolio securities during the most recent 12-month period ending June 30 is also available at dodgeandcox.com or at sec.gov.
HOUSEHOLD MAILINGS
The Fund routinely mails shareholder reports and summary prospectuses to shareholders and, on occasion, proxy statements. In order to reduce the volume of mail, when possible, only one copy of these documents will be sent to shareholders who are part of the same family and share the same residential address.
If you have a direct account with the Funds and you do not want the mailing of shareholder reports and summary prospectuses combined with other members in your household, contact the Funds at 800-621-3979. Your request will be implemented within 30 days.
PAGE 18 § DODGE & COX INTERNATIONAL STOCK FUND
DODGE & COX FUNDS—EXECUTIVE OFFICER & TRUSTEE INFORMATION
| | | | | | |
Name (Age) and
Address* | | Position with Trust (Year of Election or
Appointment) | | Principal Occupation During Past 5 Years | | Other Directorships Held by Trustees |
| INTERESTED TRUSTEES AND EXECUTIVE OFFICERS |
| Charles F. Pohl (58) | | Chairman and Trustee (Since 2004) | | Chairman (since 2013), Co-President (2011-2013), Senior Vice President (until 2011), and Director of Dodge & Cox; Chief Investment Officer, Portfolio Manager, Investment Analyst, and member of Investment Policy Committee (IPC), Global Stock Investment Policy Committee (GSIPC), International Investment Policy Committee (IIPC), and Fixed Income Investment Policy Committee (FIIPC) | | — |
| Dana M. Emery (55) | | President and Trustee (Trustee since 1993) (President since 2014) | | Chief Executive Officer (since 2013), President (since 2011), Executive Vice President (until 2011), and Director of Dodge & Cox; Director of Fixed Income, Portfolio Manager, and member of FIIPC and Global Bond Investment Policy Committee (GBIPC) | | — |
| Diana S. Strandberg (57) | | Senior Vice President (Since 2006) | | Senior Vice President (since 2011), Vice President (until 2011), and Director (since 2011) of Dodge & Cox; Director of International Equity, Portfolio Manager, Investment Analyst, and member of IPC, GSIPC, IIPC, and GBIPC | | — |
| David H. Longhurst (59) | | Treasurer (Since 2006) | | Vice President and Assistant Treasurer of Dodge & Cox | | — |
| Thomas M. Mistele (63) | | Secretary (Since 1998) | | Chief Operating Officer (until Jan. 2017), Director, Secretary, Senior Counsel (since 2011), and General Counsel (until 2011) of Dodge & Cox | | — |
| Katherine M. Primas (42) | | Chief Compliance Officer (Since 2010) | | Vice President (since 2011) and Chief Compliance Officer of Dodge & Cox | | — |
| INDEPENDENT TRUSTEES |
| Thomas A. Larsen (67) | | Trustee (Since 2002) | | Senior Counsel of Arnold & Porter Kaye Scholer LLP (law firm) (since 2013); Partner of Arnold & Porter LLP (until 2012); Director of Howard, Rice, Nemerovski, Canady, Falk & Rabkin (1977-2011) | | — |
| Ann Mather (56) | | Trustee (Since 2011) | | CFO, Pixar Animation Studios (1999-2004) | | Director, Google, Inc. (internet information services) (since 2005); Director, Glu Mobile, Inc. (multimedia software) (since 2004); Director, Netflix, Inc. (internet television) (since 2010); Director, Arista Networks (cloud networking) (since 2013); Director, Shutterfly, Inc. (internet photography services/publishing) (since 2013) |
| Robert B. Morris III (64) | | Trustee (Since 2011) | | Advisory Director, The Presidio Group (2005-2016); Partner and Managing Director—Global Investment Research at Goldman Sachs (until 2001) | | — |
| Gary Roughead (65) | | Trustee (Since 2013) | | Robert and Marion Oster Distinguished Military Fellow, Hoover Institution (since 2012); Admiral, United States Navy (Ret.); U.S. Navy Chief of Naval Operations (2008-2011) | | Director, Northrop Grumman Corp. (global security) (since 2012); Director, Maersk Line, Limited (shipping and transportation) (since 2016) |
| Mark E. Smith (65) | | Trustee (Since 2014) | | Executive Vice President, Managing Director—Fixed Income at Loomis Sayles & Company, L.P. (2003-2011) | | — |
| John B. Taylor (70) | | Trustee (Since 2005) (and 1995-2001) | | Professor of Economics, Stanford University (since 1984); Senior Fellow, Hoover Institution (since 1996); Under Secretary for International Affairs, United States Treasury (2001-2005) | | — |
| * | | The address for each Officer and Trustee is 555 California Street, 40th Floor, San Francisco, California 94104. Each Officer and Trustee oversees all six series in the Dodge & Cox Funds complex and serves for an indefinite term. |
Additional information about the Trust’s Trustees and Officers is available in the Trust’s Statement of Additional Information (SAI). You can get a free copy of the SAI by visiting the Funds’ website at dodgeandcox.com or calling
800-621-3979.
DODGE & COX INTERNATIONAL STOCK FUND §PAGE 19
dodgeandcox.com
For Fund literature, transactions, and account information, please visit the Funds’ website.
or write or call:
DODGE & COX FUNDS
c/o Boston Financial Data Services
P.O. Box 8422
Boston, Massachusetts 02266-8422
(800) 621-3979
INVESTMENT MANAGER
Dodge & Cox
555 California Street, 40th Floor
San Francisco, California 94104
(415) 981-1710
This report is submitted for the general information of the shareholders of the Fund. The report is not authorized for distribution to prospective investors in the Fund unless it is accompanied by a current prospectus.
This report reflects our views, opinions, and portfolio holdings as of December 31, 2016, the end of the reporting period. Any such views are subject to change at any time based upon market or other conditions and Dodge & Cox disclaims any responsibility to update such views. These views may not be relied on as investment advice and, because investment decisions for a Dodge & Cox Fund are based on numerous factors, may not be relied on as an indication of trading intent on behalf of any Dodge & Cox Fund.
DODGE & COX FUNDS®
Annual Report
December 31, 2016
Balanced Fund
ESTABLISHED 1931
TICKER: DODBX
12/16 BF AR Printed on recycled paper
TO OUR SHAREHOLDERS
The Dodge & Cox Balanced Fund had a total return of 16.6% for the year ended December 31, 2016, compared to a return of 8.4% for the Combined Index (a 60/40 blend of stocks and fixed income securities).
AN EXTRAORDINARY YEAR
The Fund’s strong absolute and relative performance in 2016 was achieved with largely the same portfolio that produced weak results in 2015. Many of the biggest contributors in 2016 were the largest detractors in 2015. The past year’s performance improved the Fund’s longer-term relative results. The Fund’s annualized total return for the past five years was 13.4% versus 9.7% for the Combined Index.
We would like to express sincere appreciation to our fellow shareholders for your patience and confidence in Dodge & Cox. These results serve as a reminder that a single quarter or year is too short an interval over which to judge the success of our strategy. Our bottom-up, value-oriented, active investment approach requires independent thinking to build the level of conviction essential to invest in companies that are out of favor. Security prices can move dramatically in response to the headlines of the day, but it often takes time for a company’s results to improve and for positive change to be recognized by other investors. Accordingly, maintaining a long-term investment horizon and staying the course when markets move against us are essential for our investment team, as well as for our fellow shareholders, but our persistence to stick with our convictions in the face of market volatility was rewarded during this past year.
For the past 20 years, the Fund’s average annualized total return was 8.86% versus 7.05% for the Combined Index. This period encompassed large swings in Fund performance, market prices, and valuations, including the technology stock bubble and crash as well as the 2008-09 global financial crisis and subsequent recovery. More recently, investor concerns have been around global economic growth, lower commodity prices, and the U.S. presidential election. Uncertainty is a constant, but it can create compelling opportunities for patient, long-term, value-oriented, active investors. Our recent insight paper, “Understanding the Case for Active Management,” is summarized at the end of the letter and is available in its entirety on our website.
MARKET COMMENTARY
Global equity markets were volatile amid macroeconomic and geopolitical concerns in 2016. The U.S. equity market was one of the stronger developed markets and appreciated significantly: the S&P 500 reached an all-time high in mid-December and was up 12% for the year. U.S. value stocks outperformed growth stocks by ten percentage points,(a) benefiting many of the value-oriented holdings in the equity portfolio of the Fund. Recently, the more economically sensitive sectors of the market that are likely to benefit from an improving economy and higher interest rates (e.g., Energy, Financials) have accounted for a larger portion of the value category than stocks in the more defensive sectors with higher dividend yields (e.g., Consumer Staples, Real Estate, Telecommunication Services, Utilities).
In the fixed income markets, longer-term interest rates fell by 70-80 basis points(b) during the first half of the year, influenced by concerns about economic weakness in the Eurozone, slower growth in China, a continued decline in commodity prices, and questions about the durability of the U.S. economy. Over the second half of the year, longer-term Treasury rates rose by 80-100 basis points due to the results of the U.S. presidential election and better U.S. economic data, resulting in a modest 1.0% U.S. Treasury sector(c) return for all of 2016. Investment-grade corporate bonds returned 6.1% for the year, outperforming comparable-duration(d) Treasuries by a remarkable 4.9 percentage points and registering the best relative return since 2012. Agency(e) mortgage-backed securities (MBS) returned 1.7% for the year, performing roughly in line with comparable-duration Treasuries amid higher interest rates and slower expected prepayment speeds.
INVESTMENT STRATEGY
We set the Fund’s asset allocation based on our long-term outlook for the Fund’s equity and fixed income holdings. At year end, the Fund’s 72.7% equity weighting (including 4.9% in preferred stocks) reflected our more positive outlook for total return potential from equities than from fixed income. We believe the equity and fixed income portfolios are well positioned based on our view that longer-term global economic growth will be better than many expect, and we remain optimistic about the long-term outlook for the Fund.
Equity Strategy
Equity returns for the more economically sensitive and more defensive sectors have been highly correlated with interest rate movements in recent years. As interest rates declined to historically low levels and investors searched for yield in the equity market, defensive stocks with “bond-like” characteristics outperformed more cyclical stocks. In the first half of 2016, the best-performing sectors of the S&P 500 were Telecommunication Services and Utilities, while Financials and Information Technology were the worst performers. Conversely, as U.S. Treasury yields rose during the second half of 2016, especially after the U.S. presidential election, economically sensitive holdings outperformed considerably. Financials and Information Technology were the strongest sectors of the market, while Real Estate and Utilities were the weakest.
Due to individual security selection, the equity portfolio was tilted toward more economically sensitive companies: Financials comprised 31% of the portfolio, Information Technology accounted for 18%, and Energy was 9%.(f) There was also a significant valuation gap between the holdings in the equity portfolio and sectors where the portfolio had little or no exposure.
Our strong price discipline is an essential characteristic of our investment strategy. We constantly weigh valuation against fundamentals and seek to invest in companies where the initial valuation reflects concerns about future earnings and cash flow prospects, while our analysis reveals the possibility of more positive developments. As long-term investors, our challenge is to assess
PAGE 2 § DODGE & COX BALANCED FUND
short-term concerns while investing with an eye toward future prospects. When we see long-term value, we often add to positions as valuations decline and other investors become more pessimistic. Two examples include recent activity in Financials and Health Care, which are discussed below.
Financials
Amid heightened market volatility, we revisited and retested our thinking on many of the portfolio’s holdings during 2015 and the first half of 2016. As valuations became more attractive, we concluded market conditions had created long-term investment opportunities in selected economically sensitive companies, especially in Financials. Despite low interest rates and global economic challenges, we saw opportunities because many of the portfolio’s Financials holdings traded at relatively inexpensive valuations (at levels not seen since the 2008 global financial crisis) although they benefited from loan growth and improved credit quality since the crisis. We added to various companies, including American Express, Bank of America, Goldman Sachs, and MetLife.(g)
During the second half of 2016, Financials was the best-performing sector of the S&P 500 (up 29%), in large part due to rising interest rates. We trimmed several of the portfolio’s holdings in response to higher share prices, but maintain a significant overweight position in the sector (31% of the equity portfolio versus 15% for the S&P 500). Profits are improving and strong capital positions allow the banks to return significant capital to shareholders via share buybacks and dividends, making them a compelling alternative to other dividend-paying stocks, in our view. As rates increase, profitability within the Financials sector should improve further. The sector also stands to benefit from potential easing of financial regulation by the Trump administration (e.g., The Dodd-Frank Wall Street Reform and Consumer Protection Act could be repealed or modified).
Health Care
Health Care was the worst performing sector (down 2%) of the S&P 500 in 2016 amid legal, regulatory, and pricing concerns, especially in the Pharmaceuticals industry. Pharmacy benefit managers have exerted increased pricing pressure on drug manufacturers, aided by industry consolidation and higher market shares. This trend could impact long-term profitability for pharmaceutical companies. Additional risks include biosimilar and generic competition, as well as reduced drug reimbursement from government buyers and private payors.
Conversely, research and development productivity has increased for many of the pharmaceutical holdings in the equity portfolio. These companies stand to benefit from long-term growth in emerging markets as consumers and governments have demonstrated a tendency to spend more on health care with increased consumer purchasing power. Furthermore, the portfolio’s Pharmaceutical holdings have reasonable valuations, strong balance sheets, high free cash flow, and cost-cutting opportunities that help mitigate risk.
After evaluating the risks versus the opportunities, the portfolio remained overweight Pharmaceuticals (11% of the equity
portfolio compared to 5% for the S&P 500) and we added tactically to several holdings (e.g., AstraZeneca, Sanofi) as valuations became more attractive during the second half of 2016.
Fixed Income Strategy
In response to changing valuation dynamics over the course of 2016, we made a number of adjustments to the fixed income portfolio. Most notably, we selectively reduced exposure to corporate and other credit(h) holdings as the tremendous credit sector rally of 2016 has resulted in a somewhat less-favorable risk/reward dynamic today.
Yield premiums(i) increased substantially in the beginning of the year and peaked in February. We took advantage of this sudden widening, increasing the portfolio’s credit weighting to 60% by the end of February. The credit sector then staged a significant recovery in a short period of time (corporate yield premiums narrowed from 215 basis points in mid-February to 123 basis points at year end). As this recovery continued, we reduced the portfolio’s credit weighting. As of December 31, the portfolio held 48% in credit securities.
Our additions to the credit portfolio in 2016 occurred in three main areas. One was certain A- and BBB-rated issuers raising debt to finance strategic M&A transactions. The second was issuers in sectors experiencing heightened volatility where credit fundamentals were being undervalued (e.g., midstream and state-owned energy issuers, as well as commodity issuers able to withstand a substantial downturn). And the third was subordinated debt of large banks.
Even at today’s more compressed spread levels, we believe credit offers attractive value on a long-term basis. Corporate fundamentals remain strong, and we expect that the default likelihood for investment-grade corporate issuers is quite low, in line with historical experience. With respect to the corporate sector outlook under the new Trump administration, potential policies involving corporate tax reform, infrastructure spending, and regulation rollbacks are likely to be beneficial. However, other areas such as trade and foreign policy may have more mixed results, particularly related to certain industries.
We made no major shifts to the portfolio’s holdings within the Securitized sector. The portfolio’s MBS weighting ranged between 29% and 34% during the year, and we made small adjustments to the underlying target mix of holdings as valuations changed (e.g., trimming 15-20 year MBS in favor of 30-year MBS, emphasizing attractively-priced hybrid ARMs). The portfolio’s MBS performed well in 2016 relative to shorter-duration Treasuries (our yardstick for relative value/returns).
The duration of the fixed income portfolio was lower than the duration of the Bloomberg Barclays U.S. Aggregate Bond Index at the beginning of 2016 because we felt that interest rates were likely to rise. Starting in the third quarter, and accelerating in the fourth quarter following Mr. Trump’s victory, rates moved considerably higher. While this move narrowed the gap between our expectations of fair value for rates and the market’s, we still believe that rates are likely to rise more than implied by current market valuations. The economic policies likely to be pursued by the Trump administration and the Republican-controlled
DODGE & COX BALANCED FUND §PAGE 3
Congress offer the prospect of accelerated growth and the potential for higher inflation, combined with the likelihood that the Fed will raise interest rates more quickly than forecasted.
IN CLOSING
While U.S. equity valuations have increased, we remain optimistic about the long-term outlook for the equity portfolio of the Fund, which trades at 14.7 times forward earnings compared to 18.8 times for the S&P 500. The equity valuation disparities that characterize the current environment offer significant opportunities for active management. Absolute return prospects for the fixed income portfolio appear challenged in the near term, but we believe these assets serve a vital defensive role in the Fund’s balanced composition, offering income generation, downside protection, and low correlation to riskier asset classes.
We believe that being patient, persistent, and having a long-term investment horizon are essential for investment success. While we do not know what the future holds, we will continue to apply the bottom-up, value-oriented investment approach that has served the Fund well for decades.
Thank you for your continued confidence in our firm. As always, we welcome your comments and questions.
For the Board of Trustees,
| | |
| |
|
Charles F. Pohl, Chairman | | Dana M. Emery, President |
January 31, 2017
| (a) | | The Russell 1000 Value Index outperformed the Russell 1000 Growth Index by 10.3 percentage points during 2016. Generally, stocks that have lower valuations are “value” stocks, while those with higher valuations are “growth” stocks. |
| (b) | | One basis point is equal to 1/100th of 1%. |
| (c) | | Sector returns as calculated and reported by Bloomberg. |
| (d) | | Duration is a measure of a bond’s (or bond portfolio’s) price sensitivity to changes in interest rates. |
| (e) | | The U.S. Government does not guarantee the Fund’s shares, yield, or net asset value. The agency guarantee (by, for example, Ginnie Mae, Fannie Mae, or Freddie Mac) does not eliminate market risk. |
| (f) | | Unless otherwise specified, all weightings and characteristics are as of December 31, 2016. |
| (g) | | The use of specific examples does not imply that they are more attractive investments than the Fund’s other holdings. |
| (h) | | Credit securities refers to corporate bonds and government-related securities, as classified by Bloomberg. |
| (i) | | Yield premiums are one way to measure a security’s valuation. Narrowing yield premiums results in a higher valuation. Widening yield premiums results in a lower valuation. |
UNDERSTANDING THE CASE FOR ACTIVE MANAGEMENT
One of the fiercest investment debates concerns active versus passive approaches to investing: Should investors actively choose individual investments in the hopes of beating the market, or choose a fund that tracks an index and matches the return of the market, never doing better, but never doing worse?
The most frequently cited evidence against active management is that the majority of active managers fail to beat their benchmark each year. But measuring on a 12-month basis doesn’t necessarily capture the results of an active management strategy because it often takes more than a year for a strategy to come to fruition. When measurement intervals are lengthened, the results of the active versus passive comparison are significantly different—a higher percentage of active managers outperform their benchmarks. To be sure, outperformance over the long run is nowhere near a sure thing, but the data suggests active management is an eminently viable choice.
One of the attributes of successful active managers is having a high “active share,” meaning their portfolio is significantly different from an index. Another attribute is having low fees and low portfolio turnover, which reduce the drag on performance exerted by expenses. Successful active managers also tend to provide higher risk-adjusted returns, because unlike index funds, they aren’t obliged to invest in higher risk companies. Studies also show that active managers do better when they are tightly focused on specific strategies and markets and when they have a significant financial stake in their funds.
Research indicates that the average U.S. mutual fund investor earns two percentage points less per year than the average fund because many investors move in and out of funds too quickly. But if investors have the discipline to stick with good active managers through inevitable periods of underperformance, they can have meaningful prospects of outperforming the market over time.
A summary from Dodge & Cox’s insight paper titled, “Understanding the Case for Active Management.”
PAGE 4 § DODGE & COX BALANCED FUND
ANNUAL PERFORMANCE REVIEW
The Fund outperformed the Combined Index by 8.2 percentage points in 2016. The Fund’s higher allocation to equities had a positive impact on relative results.
Equity Portfolio
| | § | | Returns from holdings in the Consumer Discretionary sector (up 26% compared to up 6% for the S&P 500 sector) helped results. Time Warner, Inc. (up 52%), which agreed to be acquired by AT&T, was particularly strong. Time Warner Cable (up 13% to date of merger) and Charter Communications (up 24% from date of merger) merged during the year and performed well. | |
| | § | | The portfolio’s holdings in the Information Technology sector (up 25% compared to up 14% for the S&P 500 sector) aided performance. | |
| | § | | The portfolio’s significant overweight position (27% versus 13%) in the Financials sector (up 22% in line with the S&P 500 sector) contributed. | |
| | § | | The Health Care sector (down 2% for the S&P 500) faced headwinds during the year and lagged the overall market. Selected portfolio holdings were weak, including Express Scripts (down 21%), Roche (down 15%), and Novartis (down 13%). | |
Fixed Income Portfolio
| | § | | Credit security selection was strongly positive as several commodity-related holdings performed well, including Kinder Morgan, Pemex, Petrobras, Rio Oil Finance Trust, and Teck Resources. | |
| | § | | The portfolio’s overweight to the Industrial sub-sector and underweight to U.S. Treasuries added to relative returns. | |
| | § | | The portfolio’s shorter relative duration (71% of the Bloomberg Barclays U.S. Agg’s duration) added to relative returns. | |
| | § | | The portfolio’s lower exposure to long-term (10+ years) bonds, which outperformed short and intermediate maturities, detracted modestly from relative returns. | |
| | | | Unless otherwise noted, figures cited in this section denote portfolio positioning at the beginning of the period. | |
KEY CHARACTERISTICS OF DODGE & COX
Independent Organization
Dodge & Cox is one of the largest privately owned investment managers in the world. We remain committed to independence, with a goal of providing the highest quality investment management service to our existing clients.
Over 85 Years of Investment Experience
Dodge & Cox was founded in 1930. We have a stable and well-qualified team of investment professionals, most of whom have spent their entire careers at Dodge & Cox.
Experienced Investment Team
The Investment Policy Committee, which is responsible for determining the asset allocation of the Balanced Fund and managing the equity portion of the Balanced Fund, is an eight-member committee with an average tenure at Dodge & Cox of 23 years. The Fixed Income Investment Policy Committee, which is responsible for managing the debt portion of the Balanced Fund, is an eight-member committee with an average tenure of 21 years.
One Business with a Single Research Office
Dodge & Cox manages equity (domestic, international, and global), fixed income (domestic and global), and balanced investments, operating from one office in San Francisco.
Consistent Investment Approach
Our team decision-making process involves thorough, bottom-up fundamental analysis of each investment.
Long-Term Focus and Low Expenses
We invest with a three- to five-year investment horizon, which has historically resulted in low turnover relative to our peers. We manage Funds that maintain low expense ratios.
Risks: The Fund is subject to market risk, meaning holdings in the Fund may decline in value for extended periods due to the financial prospects of individual companies or due to general market and economic conditions. The Fund also invests in individual bonds whose yields and market values fluctuate, so that an investment may be worth more or less than its original cost. Debt securities are subject to interest rate risk, credit risk, and prepayment and call risk, all of which could have adverse effects on the value of the Fund. A low interest rate environment creates an elevated risk of future negative returns. Financial intermediaries may restrict their market making activities for certain debt securities, which may reduce the liquidity and increase the volatility of such securities. Please read the prospectus and summary prospectus for specific details regarding the Fund’s risk profile.
DODGE & COX BALANCED FUND §PAGE 5
GROWTH OF $10,000 OVER 10 YEARS
FOR AN INVESTMENT MADE ON DECEMBER 31, 2006
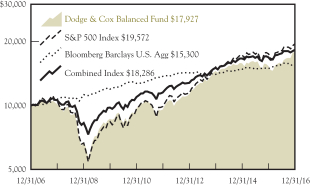
AVERAGE ANNUAL TOTAL RETURN
FOR PERIODS ENDED DECEMBER 31, 2016
| | | | | | | | | | | | | | | | |
| | | 1 Year | | | 5 Years | | | 10 Years | | | 20 Years | |
| | | | | | | | | | | | | | | | |
Dodge & Cox Balanced Fund | | | 16.55 | % | | | 13.36 | % | | | 6.01 | % | | | 8.86 | % |
S&P 500 Index | | | 11.96 | | | | 14.66 | | | | 6.95 | | | | 7.68 | |
Bloomberg Barclays U.S. Aggregate Bond Index (Bloomberg Barclays U.S. Agg) | | | 2.65 | | | | 2.23 | | | | 4.34 | | |
| 5.29
|
|
Combined Index(a) | | | 8.35 | | | | 9.70 | | | | 6.22 | | | | 7.05 | |
Returns represent past performance and do not guarantee future results. Investment return and share price will fluctuate with market conditions, and investors may have a gain or loss when shares are sold. Fund performance changes over time and currently may be significantly lower than stated. Performance is updated and published monthly. Visit the Fund’s website at dodgeandcox.com or call 800-621-3979 for current performance figures.
The Fund’s total returns include the reinvestment of dividend and capital gain distributions, but have not been adjusted for any income taxes payable by shareholders on these distributions or on Fund share redemptions. Index returns include dividends and/or interest income but, unlike Fund returns, do not reflect fees or expenses.
Standard & Poor’s, Standard & Poor’s 500, and S&P 500® are trademarks of S&P Global Inc. Bloomberg is a registered trademark of Bloomberg Finance L.P. and its affiliates. Barclays® is a trademark of Barclays Bank PLC.
| (a) | The Combined Index reflects an unmanaged portfolio (rebalanced monthly) of 60% of the S&P 500 Index, which is a market capitalization-weighted index of 500 large-capitalization stocks commonly used to represent the U.S. equity market, and 40% of the Bloomberg Barclays U.S. Aggregate Bond Index (Bloomberg Barclays U.S. Agg), which is a widely recognized, unmanaged index of U.S. dollar-denominated, investment-grade, taxable fixed income securities. The Fund may, however, invest up to 75% of its total assets in equity securities. |
FUND EXPENSE EXAMPLE
As a Fund shareholder, you incur ongoing Fund costs, including management fees and other Fund expenses. All mutual funds have ongoing costs, sometimes referred to as operating expenses. The following example shows ongoing costs of investing in the Fund and can help you understand these costs and compare them with those of other mutual funds. The example assumes a $1,000 investment held for the six months indicated.
ACTUAL EXPENSES
The first line of the table below provides information about actual account values and expenses based on the Fund’s actual returns. You may use the information in this line, together with your account balance, to estimate the expenses that you paid over the period. Simply divide your account value by $1,000 (for example, an $8,600 account value divided by $1,000 = 8.6), then multiply the result by the number in the first line under the heading “Expenses Paid During Period” to estimate the expenses you paid on your account during this period.
HYPOTHETICAL EXAMPLE FOR COMPARISON WITH OTHER MUTUAL FUNDS
Information on the second line of the table can help you compare ongoing costs of investing in the Fund with those of other mutual funds. This information may not be used to estimate the actual ending account balance or expenses you paid during the period. The hypothetical “Ending Account Value” is based on the actual expense ratio of the Fund and an assumed 5% annual rate of return before expenses (not the Fund’s actual return). The amount under the heading “Expenses Paid During Period” shows the hypothetical expenses your account would have incurred under this scenario. You can compare this figure with the 5% hypothetical examples that appear in shareholder reports of other mutual funds.
| | | | | | | | | | | | |
Six Months Ended
December 31, 2016 | | Beginning Account Value
7/1/2016 | | | Ending Account Value
12/31/2016 | | | Expenses Paid
During Period* | |
Based on Actual Fund Return | | $ | 1,000.00 | | | $ | 1,139.00 | | | $ | 2.80 | |
Based on Hypothetical 5% Yearly Return | | | 1,000.00 | | | | 1,022.52 | | | | 2.65 | |
| * | | Expenses are equal to the Fund’s annualized expense ratio of 0.52%, multiplied by the average account value over the period, multiplied by 184/366 (to reflect the one-half year period). |
The expenses shown in the table highlight ongoing costs only and do not reflect any transactional fees or account maintenance fees. Though other mutual funds may charge such fees, please note that the Fund does not charge transaction fees (e.g., redemption fees, sales loads) or universal account maintenance fees (e.g., small account fees).
PAGE 6 § DODGE & COX BALANCED FUND
| | | | |
| FUND INFORMATION (unaudited) | | | December 31, 2016 | |
| | | | |
| GENERAL INFORMATION | | | |
Net Asset Value Per Share | | | $103.35 | |
Total Net Assets (billions) | | | $15.4 | |
Expense Ratio | | | 0.53% | |
Portfolio Turnover Rate | | | 24% | |
30-Day SEC Yield(a) | | | 1.79% | |
Fund Inception | | | 1931 | |
No sales charges or distribution fees | | | | |
Investment Manager: Dodge & Cox, San Francisco. Managed by the Investment Policy Committee, whose eight members’ average tenure at Dodge & Cox is 23 years, and by the Fixed Income Investment Policy Committee, whose eight members’ average tenure is 21 years.
| | | | |
| EQUITY PORTFOLIO (72.7%) | | Fund | |
Number of Common Stocks | | | 64 | |
Number of Preferred Stocks | | | 5 | |
Median Market Capitalization (billions)(b) | | | $40 | |
Price-to-Earnings Ratio(b)(c) | | | 14.7x | |
Foreign Securities not in the S&P 500(d) | | | 6.5% | |
| | | | | | | | | | | | |
| FIVE LARGEST SECTORS (%) | | Common | | | Preferred | | | Total | |
Financials | | | 20.7 | | | | 4.5 | | | | 25.2 | |
Information Technology | | | 12.4 | | | | — | | | | 12.4 | |
Health Care | | | 11.8 | | | | — | | | | 11.8 | |
Consumer Discretionary | | | 10.6 | | | | 0.4 | | | | 11.0 | |
Energy | | | 6.4 | | | | — | | | | 6.4 | |
| | | | | | | | | | | | |
| TEN LARGEST EQUITIES (%)(e) | | Common | | | Preferred | | | Total | |
Wells Fargo & Co. | | | 2.7 | | | | 1.6 | | | | 4.3 | |
JPMorgan Chase & Co. | | | 1.7 | | | | 1.7 | | | | 3.4 | |
Bank of America Corp. | | | 2.8 | | | | 0.4 | | | | 3.2 | |
Capital One Financial Corp. | | | 2.7 | | | | — | | | | 2.7 | |
Charles Schwab Corp. | | | 2.7 | | | | — | | | | 2.7 | |
Hewlett Packard Enterprise Co. | | | 2.4 | | | | — | | | | 2.4 | |
Goldman Sachs Group, Inc. | | | 2.4 | | | | — | | | | 2.4 | |
Time Warner, Inc. | | | 2.2 | | | | — | | | | 2.2 | |
Sanofi (France) | | | 2.1 | | | | — | | | | 2.1 | |
Charter Communications, Inc. | | | 2.0 | | | | — | | | | 2.0 | |
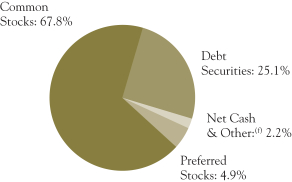
| | | | |
| FIXED INCOME PORTFOLIO (25.1%) | | Fund | |
Number of Credit Issuers | | | 48 | |
Effective Duration (years) | | | 4.1 | |
| | | | |
| SECTOR DIVERSIFICATION (%) | | | |
U.S. Treasury(g) | | | 4.9 | |
Government-Related | | | 1.5 | |
Mortgage-Related(h) | | | 7.9 | |
Corporate | | | 10.0 | |
Asset-Backed | | | 0.8 | |
| | | | |
| CREDIT QUALITY (%)(i) | | | |
U.S. Treasury/Agency/GSE(g) | | | 12.8 | |
Aaa | | | 0.3 | |
Aa | | | 0.9 | |
A | | | 0.7 | |
Baa | | | 8.0 | |
Ba | | | 1.5 | |
B | | | 0.4 | |
Caa | | | 0.5 | |
| | | | |
| FIVE LARGEST CREDIT ISSUERS (%)(e) | | | |
Charter Communications, Inc. | | | 0.5 | |
Verizon Communications, Inc. | | | 0.5 | |
State of California GO | | | 0.4 | |
Petroleos Mexicanos | | | 0.4 | |
Rio Oil Finance Trust | | | 0.4 | |
| (a) | SEC Yield is an annualization of the Fund’s net investment income for the trailing 30-day period. Dividends paid by the Fund may be higher or lower than implied by the SEC Yield. |
| (b) | Excludes the Fund’s preferred stock positions. |
| (c) | Price-to-earnings (P/E) ratio is calculated using 12-month forward earnings estimates from third-party sources. |
| (d) | Foreign stocks are U.S. dollar denominated. |
| (e) | The Fund’s portfolio holdings are subject to change without notice. The mention of specific securities is not a recommendation to buy, sell, or hold any particular security and is not indicative of Dodge & Cox’s current or future trading activity. |
| (f) | Net Cash & Other includes cash, short-term investments, receivables, and payables. |
| (g) | Data as presented excludes the Fund’s position in Treasury futures contracts. |
| (h) | The fixed income portfolio holds 0.4% in Agency multifamily mortgage securities; the Index classifies these securities under CMBS — Agency. |
| (i) | The credit quality distribution shown for the Fund is based on the middle of Moody’s, S&P’s, and Fitch ratings, which is the methodology used by Bloomberg in constructing its indices. If a security is rated by only two agencies, the lower of the two ratings is used. Please note the Fund applies the highest of Moody’s, S&P’s, and Fitch ratings to determine compliance with the quality requirements stated in its prospectus. The credit quality of the investments in the portfolio does not apply to the stability or safety of the Fund or its shares. |
DODGE & COX BALANCED FUND §PAGE 7
| | | | |
| PORTFOLIO OF INVESTMENTS | | | December 31, 2016 | |
| | | | | | | | |
| COMMON STOCKS: 67.8% | | | | | | |
| | |
| | | SHARES | | | VALUE | |
| CONSUMER DISCRETIONARY: 10.6% | |
AUTOMOBILES & COMPONENTS: 0.4% | |
Adient PLC(a) (Ireland) | | | 206,321 | | | $ | 12,090,410 | |
Harley-Davidson, Inc. | | | 953,400 | | | | 55,621,356 | |
| | | | | | | | |
| | | | | | | 67,711,766 | |
CONSUMER DURABLES & APPAREL: 0.4% | |
Coach, Inc. | | | 1,540,036 | | | | 53,932,061 | |
|
MEDIA: 8.3% | |
Charter Communications, Inc., Class A(a) | | | 1,076,807 | | | | 310,034,271 | |
Comcast Corp., Class A | | | 3,955,774 | | | | 273,146,195 | |
DISH Network Corp., Class A(a) | | | 1,700,032 | | | | 98,482,854 | |
News Corp., Class A | | | 903,050 | | | | 10,348,953 | |
Time Warner, Inc. | | | 3,441,366 | | | | 332,195,060 | |
Twenty-First Century Fox, Inc., Class A | | | 7,282,200 | | | | 204,192,888 | |
Twenty-First Century Fox, Inc., Class B | | | 1,600,000 | | | | 43,600,000 | |
| | | | | | | | |
| | | | | | | 1,272,000,221 | |
RETAILING: 1.5% | |
Liberty Interactive Corp. QVC Group, Series A(a) | | | 2,184,650 | | | | 43,649,307 | |
Target Corp. | | | 993,400 | | | | 71,753,282 | |
The Priceline Group, Inc.(a) | | | 78,700 | | | | 115,378,922 | |
| | | | | | | | |
| | | | | | | 230,781,511 | |
| | | | | | | | |
| | | | | | | 1,624,425,559 | |
| CONSUMER STAPLES: 1.0% | |
FOOD & STAPLES RETAILING: 1.0% | |
Wal-Mart Stores, Inc. | | | 2,302,400 | | | | 159,141,888 | |
|
| ENERGY: 6.4% | |
Anadarko Petroleum Corp. | | | 2,311,892 | | | | 161,208,229 | |
Apache Corp. | | | 3,005,139 | | | | 190,736,172 | |
Baker Hughes, Inc. | | | 2,671,779 | | | | 173,585,482 | |
Concho Resources, Inc.(a) | | | 614,900 | | | | 81,535,740 | |
National Oilwell Varco, Inc. | | | 3,199,000 | | | | 119,770,560 | |
Schlumberger, Ltd. (Curacao/United States) | | | 2,671,221 | | | | 224,249,003 | |
Weatherford International PLC(a) (Ireland) | | | 4,970,000 | | | | 24,800,300 | |
| | | | | | | | |
| | | | | | | 975,885,486 | |
| FINANCIALS: 20.7% | |
BANKS: 7.9% | |
Bank of America Corp. | | | 19,614,200 | | | | 433,473,820 | |
BB&T Corp. | | | 2,219,584 | | | | 104,364,840 | |
JPMorgan Chase & Co. | | | 3,002,100 | | | | 259,051,209 | |
Wells Fargo & Co. | | | 7,493,606 | | | | 412,972,626 | |
| | | | | | | | |
| | | | | | | 1,209,862,495 | |
DIVERSIFIED FINANCIALS: 10.8% | |
American Express Co. | | | 2,934,000 | | | | 217,350,720 | |
Bank of New York Mellon Corp. | | | 5,244,046 | | | | 248,462,900 | |
Capital One Financial Corp. | | | 4,820,059 | | | | 420,501,947 | |
Charles Schwab Corp. | | | 10,451,000 | | | | 412,500,970 | |
Goldman Sachs Group, Inc. | | | 1,506,500 | | | | 360,731,425 | |
| | | | | | | | |
| | | | | | | 1,659,547,962 | |
INSURANCE: 2.0% | |
AEGON NV (Netherlands) | | | 12,485,220 | | | | 69,043,267 | |
MetLife, Inc. | | | 4,582,000 | | | | 246,923,980 | |
| | | | | | | | |
| | | | | | | 315,967,247 | |
| | | | | | | | |
| | | | | | | 3,185,377,704 | |
| HEALTH CARE: 11.8% | |
HEALTH CARE EQUIPMENT & SERVICES: 4.3% | |
Anthem, Inc. | | | 264,226 | | | | 37,987,772 | |
Cigna Corp. | | | 1,485,559 | | | | 198,158,715 | |
Danaher Corp. | | | 501,100 | | | | 39,005,624 | |
Express Scripts Holding Co.(a) | | | 2,085,668 | | | | 143,473,102 | |
| | | | | | | | |
| | | | | | | |
| | |
| | | SHARES | | | VALUE | |
Medtronic PLC (Ireland) | | | 1,160,200 | | | $ | 82,641,046 | |
UnitedHealth Group, Inc. | | | 1,000,272 | | | | 160,083,531 | |
| | | | | | | | |
| | | | | | | 661,349,790 | |
PHARMACEUTICALS, BIOTECHNOLOGY & LIFE SCIENCES: 7.5% | |
Alnylam Pharmaceuticals, Inc.(a) | | | 1,090,000 | | | | 40,809,600 | |
AstraZeneca PLC ADR (United Kingdom) | | | 5,769,399 | | | | 157,619,981 | |
Bristol-Myers Squibb Co. | | | 2,566,017 | | | | 149,958,033 | |
Merck & Co., Inc. | | | 1,153,775 | | | | 67,922,734 | |
Novartis AG ADR (Switzerland) | | | 3,682,800 | | | | 268,255,152 | |
Roche Holding AG ADR (Switzerland) | | | 5,586,600 | | | | 159,385,698 | |
Sanofi ADR (France) | | | 7,795,165 | | | | 315,236,473 | |
| | | | | | | | |
| | | | | | | 1,159,187,671 | |
| | | | | | | | |
| | | | | | | 1,820,537,461 | |
| INDUSTRIALS: 3.0% | |
CAPITAL GOODS: 0.6% | |
Johnson Controls International PLC (Ireland) | | | 2,008,214 | | | | 82,718,334 | |
|
TRANSPORTATION: 2.4% | |
FedEx Corp. | | | 1,185,254 | | | | 220,694,295 | |
Union Pacific Corp. | | | 1,450,000 | | | | 150,336,000 | |
| | | | | | | | |
| | | | | | | 371,030,295 | |
| | | | | | | | |
| | | | | | | 453,748,629 | |
| INFORMATION TECHNOLOGY: 12.4% | |
SEMICONDUCTORS & SEMICONDUCTOR EQUIPMENT: 0.5% | |
Maxim Integrated Products, Inc. | | | 1,945,091 | | | | 75,022,160 | |
|
SOFTWARE & SERVICES: 5.0% | |
Alphabet, Inc., Class A(a) | | | 25,700 | | | | 20,365,965 | |
Alphabet, Inc., Class C(a) | | | 311,895 | | | | 240,726,799 | |
Dell Technologies, Inc., Class V(a) | | | 1,300,063 | | | | 71,464,463 | |
Microsoft Corp. | | | 4,428,700 | | | | 275,199,418 | |
Symantec Corp. | | | 553,941 | | | | 13,233,650 | |
Synopsys, Inc.(a) | | | 1,244,700 | | | | 73,263,042 | |
VMware, Inc.(a) | | | 1,014,400 | | | | 79,863,712 | |
| | | | | | | | |
| | | | | | | 774,117,049 | |
TECHNOLOGY, HARDWARE & EQUIPMENT: 6.9% | |
Cisco Systems, Inc. | | | 6,616,100 | | | | 199,938,542 | |
Corning, Inc. | | | 2,953,000 | | | | 71,669,310 | |
Hewlett Packard Enterprise Co. | | | 16,244,712 | | | | 375,902,636 | |
HP Inc. | | | 12,631,112 | | | | 187,445,702 | |
Juniper Networks, Inc. | | | 612,829 | | | | 17,318,547 | |
NetApp, Inc. | | | 2,523,891 | | | | 89,017,636 | |
TE Connectivity, Ltd. (Switzerland) | | | 1,726,036 | | | | 119,579,774 | |
| | | | | | | | |
| | | | | | | 1,060,872,147 | |
| | | | | | | | |
| | | | | | | 1,910,011,356 | |
| MATERIALS: 0.6% | |
Celanese Corp., Series A | | | 1,221,032 | | | | 96,144,060 | |
|
| TELECOMMUNICATION SERVICES: 1.3% | |
Sprint Corp.(a) | | | 17,992,971 | | | | 151,500,816 | |
Zayo Group Holdings, Inc.(a) | | | 1,485,000 | | | | 48,797,100 | |
| | | | | | | | |
| | | | | | | 200,297,916 | |
| | | | | | | | |
TOTAL COMMON STOCKS
(Cost $6,698,294,455) | | | | | | $ | 10,425,570,059 | |
| | |
| PREFERRED STOCKS: 4.9% | | | | | | |
| | |
| | | PAR VALUE | | | VALUE | |
| CONSUMER DISCRETIONARY: 0.4% | |
MEDIA: 0.4% | |
NBCUniversal Enterprise, Inc. 5.25%(c) | | $ | 53,210,000 | | | $ | 55,870,500 | |
| | |
| PAGE 8 § DODGE & COX BALANCED FUND | | See accompanying Notes to Financial Statements |
| | | | |
| PORTFOLIO OF INVESTMENTS | | | December 31, 2016 | |
| | | | | | | | |
| PREFERRED STOCKS (continued) | | | | | | |
| | |
| | | PAR VALUE | | | VALUE | |
| FINANCIALS: 4.5% | |
BANKS: 4.5% | |
Bank of America Corp. 6.10% | | $ | 16,008,000 | | | $ | 16,096,044 | |
Bank of America Corp. 6.25% | | | 52,470,000 | | | | 52,470,000 | |
Citigroup, Inc. 5.95% | | | | | | | | |
7/29/49 | | | 5,175,000 | | | | 5,246,156 | |
12/31/49 | | | 77,327,000 | | | | 76,375,878 | |
Citigroup, Inc. 6.25% | | | 50,886,000 | | | | 52,361,694 | |
JPMorgan Chase & Co. 6.10% | | | 254,565,000 | | | | 257,587,959 | |
Wells Fargo & Co. 5.875% | | | 227,645,000 | | | | 239,004,486 | |
| | | | | | | | |
| | | | | | | 699,142,217 | |
| | | | | | | | |
TOTAL PREFERRED STOCKS
(Cost $739,134,956) | | | | | | $ | 755,012,717 | |
|
| DEBT SECURITIES: 25.1% | |
| U.S. TREASURY: 4.9% | |
U.S. Treasury Note/Bond | | | | | | | | |
1.00%, 11/30/18 | | | 130,000,000 | | | | 129,556,830 | |
1.00%, 3/15/19 | | | 3,185,000 | | | | 3,167,199 | |
0.875%, 4/15/19 | | | 70,000,000 | | | | 69,350,190 | |
0.875%, 5/15/19 | | | 37,500,000 | | | | 37,129,012 | |
1.625%, 7/31/19 | | | 102,715,000 | | | | 103,393,227 | |
1.625%, 11/30/20 | | | 6,585,000 | | | | 6,553,287 | |
1.75%, 12/31/20 | | | 96,775,000 | | | | 96,665,354 | |
1.125%, 2/28/21 | | | 127,255,000 | | | | 123,713,239 | |
1.125%, 7/31/21 | | | 56,610,000 | | | | 54,669,692 | |
1.75%, 11/30/21 | | | 130,000,000 | | | | 128,900,980 | |
| | | | | | | | |
| | | | | | | 753,099,010 | |
| GOVERNMENT-RELATED: 1.5% | |
FEDERAL AGENCY: 0.1% | |
Small Business Admin. — 504 Program | | | | | | | | |
Series 1997-20F 1, 7.20%, 6/1/17 | | | 40,970 | | | | 41,494 | |
Series 1997-20I 1, 6.90%, 9/1/17 | | | 96,681 | | | | 98,602 | |
Series 1998-20D 1, 6.15%, 4/1/18 | | | 151,723 | | | | 154,394 | |
Series 1998-20I 1, 6.00%, 9/1/18 | | | 142,959 | | | | 145,317 | |
Series 1999-20F 1, 6.80%, 6/1/19 | | | 160,922 | | | | 166,727 | |
Series 2000-20D 1, 7.47%, 4/1/20 | | | 744,390 | | | | 776,569 | |
Series 2000-20E 1, 8.03%, 5/1/20 | | | 133,279 | | | | 139,424 | |
Series 2000-20G 1, 7.39%, 7/1/20 | | | 288,092 | | | | 299,745 | |
Series 2000-20I 1, 7.21%, 9/1/20 | | | 182,378 | | | | 189,649 | |
Series 2001-20E 1, 6.34%, 5/1/21 | | | 565,454 | | | | 600,030 | |
Series 2001-20G 1, 6.625%, 7/1/21 | | | 586,329 | | | | 623,597 | |
Series 2003-20J 1, 4.92%, 10/1/23 | | | 2,212,961 | | | | 2,354,542 | |
Series 2007-20F 1, 5.71%, 6/1/27 | | | 2,798,941 | | | | 3,076,914 | |
| | | | | | | | |
| | | | | | | 8,667,004 | |
FOREIGN AGENCY: 0.5% | |
Petroleo Brasileiro SA (Brazil) | | | | | | | | |
4.375%, 5/20/23 | | | 20,950,000 | | | | 18,304,015 | |
Petroleos Mexicanos (Mexico) | | | | | | | | |
4.25%, 1/15/25 | | | 22,685,000 | | | | 20,856,589 | |
6.50%, 3/13/27(c) | | | 5,725,000 | | | | 5,905,338 | |
6.625%, 6/15/35 | | | 9,425,000 | | | | 9,283,625 | |
6.375%, 1/23/45 | | | 20,125,000 | | | | 18,313,750 | |
5.625%, 1/23/46 | | | 16,675,000 | | | | 13,840,250 | |
| | | | | | | | |
| | | | | | | 86,503,567 | |
LOCAL AUTHORITY: 0.9% | |
New Jersey Turnpike Authority RB | | | | | | | | |
7.102%, 1/1/41 | | | 12,436,000 | | | | 17,399,829 | |
State of California GO | | | | | | | | |
7.50%, 4/1/34 | | | 13,470,000 | | | | 19,039,845 | |
7.55%, 4/1/39 | | | 15,025,000 | | | | 22,231,741 | |
7.30%, 10/1/39 | | | 13,730,000 | | | | 19,431,794 | |
7.625%, 3/1/40 | | | 5,540,000 | | | | 8,196,541 | |
| | | | | | | | |
| | | | | | | |
| | |
| | | PAR VALUE | | | VALUE | |
State of Illinois GO | | | | | | | | |
5.665%, 3/1/18 | | $ | 26,160,000 | | | $ | 27,068,799 | |
5.877%, 3/1/19 | | | 3,025,000 | | | | 3,206,833 | |
5.10%, 6/1/33 | | | 22,615,000 | | | | 19,987,589 | |
| | | | | | | | |
| | | | | | | 136,562,971 | |
| | | | | | | | |
| | | | | | | 231,733,542 | |
| MORTGAGE-RELATED: 7.9% | |
FEDERAL AGENCY CMO & REMIC: 1.4% | |
Dept. of Veterans Affairs | | | | | | | | |
Series 1995-1 1, 7.242%, 2/15/25 | | | 322,026 | | | | 357,659 | |
Series 1995-2C 3A, 8.793%, 6/15/25 | | | 146,770 | | | | 174,840 | |
Series 2002-1 2J, 6.50%, 8/15/31 | | | 9,020,926 | | | | 10,190,210 | |
Fannie Mae | | | | | | | | |
Trust 2002-33 A1, 7.00%, 6/25/32 | | | 1,871,369 | | | | 2,076,949 | |
Trust 2009-66 ET, 6.00%, 5/25/39 | | | 3,175,407 | | | | 3,420,188 | |
Trust 2009-30 AG, 6.50%, 5/25/39 | | | 2,571,092 | | | | 2,795,209 | |
Trust 2001-T7 A1, 7.50%, 2/25/41 | | | 1,455,995 | | | | 1,734,523 | |
Trust 2001-T5 A3, 7.50%, 6/19/41 | | | 610,949 | | | �� | 725,945 | |
Trust 2001-T4 A1, 7.50%, 7/25/41 | | | 1,484,443 | | | | 1,716,150 | |
Trust 2001-T8 A1, 7.50%, 7/25/41 | | | 1,495,644 | | | | 1,718,778 | |
Trust 2001-W3 A, 6.515%, 9/25/41 | | | 974,404 | | | | 1,066,063 | |
Trust 2001-T10 A2, 7.50%, 12/25/41 | | | 1,283,813 | | | | 1,494,678 | |
Trust 2013-106 MA, 4.00%, 2/25/42 | | | 9,744,841 | | | | 10,233,991 | |
Trust 2002-W6 2A1, 6.135%, 6/25/42 | | | 1,518,534 | | | | 1,728,472 | |
Trust 2002-W8 A2, 7.00%, 6/25/42 | | | 1,983,792 | | | | 2,244,491 | |
Trust 2003-W2 1A1, 6.50%, 7/25/42 | | | 3,229,290 | | | | 3,629,307 | |
Trust 2003-W2 1A2, 7.00%, 7/25/42 | | | 1,205,690 | | | | 1,387,285 | |
Trust 2003-W4 4A, 6.79%, 10/25/42 | | | 1,554,760 | | | | 1,814,825 | |
Trust 2012-121 NB, 7.00%, 11/25/42 | | | 2,532,346 | | | | 2,900,130 | |
Trust 2013-98 FA, 1.306%, 9/25/43 | | | 9,459,976 | | | | 9,573,585 | |
Trust 2004-T1 1A2, 6.50%, 1/25/44 | | | 1,906,009 | | | | 2,201,996 | |
Trust 2004-W2 5A, 7.50%, 3/25/44 | | | 3,482,657 | | | | 3,942,227 | |
Trust 2004-W8 3A, 7.50%, 6/25/44 | | | 559,964 | | | | 654,026 | |
Trust 2005-W4 1A2, 6.50%, 8/25/45 | | | 5,383,244 | | | | 6,249,138 | |
Trust 2009-11 MP, 7.00%, 3/25/49 | | | 5,162,512 | | | | 6,062,068 | |
Freddie Mac | | | | | | | | |
Series 1078 GZ, 6.50%, 5/15/21 | | | 94,185 | | | | 96,970 | |
Series 16 PK, 7.00%, 8/25/23 | | | 1,886,707 | | | | 2,074,839 | |
Series T-48 1A4, 5.538%, 7/25/33 | | | 28,194,584 | | | | 30,773,041 | |
Series 314 F2, 1.314%, 9/15/43 | | | 19,923,750 | | | | 20,000,613 | |
Series T-51 1A, 6.50%, 9/25/43 | | | 186,158 | | | | 213,538 | |
Series T-59 1A1, 6.50%, 10/25/43 | | | 10,167,354 | | | | 11,905,814 | |
Series 4281 BC, 4.50%, 12/15/43 | | | 62,140,458 | | | | 66,643,013 | |
| | | | | | | | |
| | | | | | | 211,800,561 | |
FEDERAL AGENCY MORTGAGE PASS-THROUGH: 6.5% | |
Fannie Mae, 15 Year | | | | | | | | |
3.50%, 12/1/29 | | | 9,229,428 | | | | 9,624,996 | |
4.50%, 1/1/25-1/1/27 | | | 14,243,910 | | | | 15,062,553 | |
6.00%, 7/1/17-3/1/22 | | | 709,524 | | | | 731,245 | |
6.50%, 6/1/17-11/1/18 | | | 256,474 | | | | 258,041 | |
7.00%, 11/1/18 | | | 21,034 | | | | 21,210 | |
7.50%, 8/1/17 | | | 8,808 | | | | 8,826 | |
Fannie Mae, 20 Year | | | | | | | | |
3.50%, 6/1/35 | | | 21,791,145 | | | | 22,425,539 | |
4.00%, 11/1/30-1/1/36 | | | 49,148,756 | | | | 52,184,299 | |
4.50%, 1/1/31-5/1/32 | | | 47,823,715 | | | | 51,454,000 | |
Fannie Mae, 30 Year | | | | | | | | |
4.00%, 7/1/46 | | | 31,352,075 | | | | 32,488,011 | |
4.50%, 1/1/39-4/1/46 | | | 185,245,532 | | | | 199,524,007 | |
5.50%, 7/1/33-8/1/37 | | | 14,582,199 | | | | 16,351,074 | |
6.00%, 9/1/36-8/1/37 | | | 19,501,761 | | | | 22,365,829 | |
6.50%, 12/1/28-8/1/39 | | | 22,116,160 | | | | 25,319,166 | |
7.00%, 4/1/37-8/1/37 | | | 6,906,633 | | | | 7,941,827 | |
| | |
| See accompanying Notes to Financial Statements | | DODGE & COX BALANCED FUND §PAGE 9 |
| | | | |
| PORTFOLIO OF INVESTMENTS | | | December 31, 2016 | |
| | | | | | | | |
| DEBT SECURITIES (continued) | |
| | |
| | | PAR VALUE | | | VALUE | |
Fannie Mae, Hybrid ARM | | | | | | | | |
2.536%, 11/1/43 | | $ | 6,798,875 | | | $ | 7,011,472 | |
2.591%, 9/1/34 | | | 1,302,232 | | | | 1,370,850 | |
2.645%, 1/1/46 | | | 20,178,974 | | | | 20,517,731 | |
2.69%, 4/1/44 | | | 15,865,171 | | | | 16,368,001 | |
2.705%, 1/1/35 | | | 2,383,171 | | | | 2,488,762 | |
2.773%, 1/1/35 | | | 1,379,512 | | | | 1,448,176 | |
2.815%, 9/1/36 | | | 150,240 | | | | 154,700 | |
2.817%, 12/1/44 | | | 16,640,686 | | | | 17,047,618 | |
2.821%, 11/1/44 | | | 25,204,324 | | | | 25,826,820 | |
2.833%, 12/1/45 | | | 23,966,301 | | | | 24,453,826 | |
2.87%, 8/1/35 | | | 1,513,415 | | | | 1,592,663 | |
2.888%, 12/1/34 | | | 1,775,438 | | | | 1,843,300 | |
2.949%, 9/1/45 | | | 4,848,273 | | | | 4,954,302 | |
3.292%, 12/1/41 | | | 31,698,711 | | | | 32,930,749 | |
3.322%, 6/1/41 | | | 13,193,511 | | | | 13,834,124 | |
3.568%, 12/1/40 | | | 5,510,204 | | | | 5,721,895 | |
3.761%, 11/1/40 | | | 2,738,238 | | | | 2,842,767 | |
4.271%, 7/1/39 | | | 2,261,319 | | | | 2,387,243 | |
5.454%, 5/1/37 | | | 1,276,287 | | | | 1,332,103 | |
Fannie Mae, Multifamily DUS | | | | | | | | |
Trust 2014-M9 ASQ2, 1.462%, 4/25/17 | | | 1,442,947 | | | | 1,442,498 | |
Pool AL9086, 2.227%, 7/1/23 | | | 4,778,916 | | | | 4,818,484 | |
Pool AL8144, 2.404%, 10/1/22 | | | 7,988,282 | | | | 8,127,298 | |
Freddie Mac, Hybrid ARM | | | | | | | | |
2.58%, 8/1/42 | | | 9,994,552 | | | | 10,281,723 | |
2.70%, 4/1/37 | | | 2,469,825 | | | | 2,615,614 | |
2.752%, 10/1/35 | | | 2,581,266 | | | | 2,740,917 | |
2.759%, 10/1/45 | | | 12,587,398 | | | | 12,821,081 | |
2.818%, 10/1/45 | | | 13,986,819 | | | | 14,257,037 | |
2.932%, 10/1/38 | | | 1,721,677 | | | | 1,822,141 | |
2.945%, 6/1/44 | | | 4,828,629 | | | | 4,953,760 | |
2.958%, 5/1/44 | | | 2,032,089 | | | | 2,085,558 | |
2.961%, 5/1/44 | | | 16,108,186 | | | | 16,544,188 | |
3.035%, 9/1/37 | | | 1,383,035 | | | | 1,473,016 | |
3.078%, 1/1/45 | | | 32,457,211 | | | | 33,333,359 | |
3.102%, 2/1/38 | | | 6,019,836 | | | | 6,415,017 | |
3.131%, 6/1/44 | | | 6,411,858 | | | | 6,599,573 | |
3.171%, 5/1/34 | | | 2,476,411 | | | | 2,619,557 | |
3.63%, 10/1/41 | | | 1,576,365 | | | | 1,622,182 | |
5.078%, 7/1/38 | | | 351,083 | | | | 372,948 | |
6.181%, 1/1/38 | | | 524,197 | | | | 559,303 | |
Freddie Mac Gold, 15 Year | | | | | | | | |
4.00%, 3/1/25-11/1/26 | | | 36,455,920 | | | | 38,341,216 | |
4.50%, 9/1/24-9/1/26 | | | 9,715,896 | | | | 10,279,913 | |
6.00%, 2/1/18 | | | 54,651 | | | | 54,973 | |
6.50%, 3/1/17-9/1/18 | | | 141,512 | | | | 142,401 | |
Freddie Mac Gold, 20 Year | | | | | | | | |
4.50%, 4/1/31-6/1/31 | | | 11,508,910 | | | | 12,388,357 | |
6.50%, 10/1/26 | | | 4,219,825 | | | | 4,699,181 | |
Freddie Mac Gold, 30 Year | | | | | | | | |
4.50%, 9/1/41-12/1/45 | | | 127,540,358 | | | | 137,106,954 | |
5.50%, 12/1/37 | | | 796,366 | | | | 897,449 | |
6.00%, 2/1/39 | | | 2,076,709 | | | | 2,363,747 | |
6.50%, 12/1/32-4/1/33 | | | 6,362,777 | | | | 7,312,564 | |
7.00%, 11/1/37-9/1/38 | | | 5,374,022 | | | | 6,100,697 | |
7.47%, 3/17/23 | | | 99,470 | | | | 107,856 | |
7.75%, 7/25/21 | | | 256,254 | | | | 272,034 | |
Ginnie Mae, 30 Year | | | | | | | | |
7.50%, 11/15/24-10/15/25 | | | 742,646 | | | | 838,175 | |
7.97%, 4/15/20-1/15/21 | | | 257,550 | | | | 277,329 | |
| | | | | | | | |
| | | | | | | 996,575,825 | |
| | | | | | | | |
| | | | | | | 1,208,376,386 | |
| | | | | | | | |
| | |
| | | PAR VALUE | | | VALUE | |
| ASSET-BACKED: 0.8% | |
AUTO LOAN: 0.1% | | | | | | | | |
Ford Credit Auto Owner Trust | | | | | | | | |
Series 2015-1 A, 2.12%, 7/15/26(c) | | $ | 16,450,000 | | | $ | 16,472,530 | |
| | |
OTHER: 0.5% | | | | | | | | |
Rio Oil Finance Trust (Brazil) | | | | | | | | |
9.25%, 7/6/24(c) | | | 32,060,250 | | | | 30,136,635 | |
9.75%, 1/6/27(c) | | | 40,290,540 | | | | 37,067,296 | |
| | | | | | | | |
| | | | | | | 67,203,931 | |
STUDENT LOAN: 0.2% | |
SLM Student Loan Trust (Private Loans) | | | | | | | | |
Series 2014-A A2A, 2.59%, 1/15/26(c) | | | 5,250,000 | | | | 5,261,946 | |
Series 2012-B A2, 3.48%, 10/15/30(c) | | | 5,637,636 | | | | 5,712,127 | |
Series 2012-E A2A, 2.09%, 6/15/45(c) | | | 13,775,000 | | | | 13,779,035 | |
Series 2012-C A2, 3.31%, 10/15/46(c) | | | 8,270,592 | | | | 8,381,654 | |
| | | | | | | | |
| | | | | | | 33,134,762 | |
| | | | | | | | |
| | | | | | | 116,811,223 | |
| CORPORATE: 10.0% | |
FINANCIALS: 3.4% | |
Bank of America Corp. | | | | | | | | |
4.20%, 8/26/24 | | | 5,825,000 | | | | 5,926,914 | |
6.625%, 5/23/36(b) | | | 37,275,000 | | | | 41,181,569 | |
Barclays PLC (United Kingdom) | | | | | | | | |
4.375%, 9/11/24 | | | 23,275,000 | | | | 23,058,845 | |
BNP Paribas SA (France) | | | | | | | | |
4.25%, 10/15/24 | | | 31,175,000 | | | | 31,214,530 | |
4.375%, 9/28/25(c) | | | 10,100,000 | | | | 10,028,765 | |
Boston Properties, Inc. | | | | | | | | |
3.85%, 2/1/23 | | | 7,800,000 | | | | 7,995,686 | |
3.125%, 9/1/23 | | | 17,550,000 | | | | 17,190,295 | |
Capital One Financial Corp. | | | | | | | | |
3.50%, 6/15/23 | | | 30,256,000 | | | | 30,338,720 | |
4.20%, 10/29/25 | | | 6,175,000 | | | | 6,187,307 | |
Cigna Corp. | | | | | | | | |
7.875%, 5/15/27 | | | 21,888,000 | | | | 28,772,805 | |
8.30%, 1/15/33 | | | 8,845,000 | | | | 11,683,661 | |
Citigroup, Inc. | | | | | | | | |
6.692%, 10/30/40(b) | | | 35,830,925 | | | | 37,120,695 | |
Equity Residential | | | | | | | | |
3.00%, 4/15/23 | | | 14,775,000 | | | | 14,556,360 | |
HSBC Holdings PLC (United Kingdom) | | | | | | | | |
4.30%, 3/8/26 | | | 4,600,000 | | | | 4,763,006 | |
6.50%, 5/2/36 | | | 23,190,000 | | | | 28,556,282 | |
6.50%, 9/15/37 | | | 15,315,000 | | | | 18,956,907 | |
JPMorgan Chase & Co. | | | | | | | | |
8.75%, 9/1/30(b) | | | 23,042,000 | | | | 32,378,181 | |
Lloyds Banking Group PLC (United Kingdom) | | | | | | | | |
4.50%, 11/4/24 | | | 19,575,000 | | | | 19,847,210 | |
4.65%, 3/24/26 | | | 7,100,000 | | | | 7,181,756 | |
Navient Corp. | | | | | | | | |
4.625%, 9/25/17 | | | 9,550,000 | | | | 9,705,187 | |
8.45%, 6/15/18 | | | 15,755,000 | | | | 16,976,012 | |
Royal Bank of Scotland Group PLC (United Kingdom) | | | | | | | | |
6.125%, 12/15/22 | | | 44,666,000 | | | | 47,444,225 | |
Unum Group | | | | | | | | |
7.19%, 2/1/28 | | | 8,305,000 | | | | 9,530,071 | |
7.25%, 3/15/28 | | | 2,030,000 | | | | 2,398,173 | |
6.75%, 12/15/28 | | | 11,368,000 | | | | 12,810,372 | |
Wells Fargo & Co. | | | | | | | | |
2.15%, 12/6/19 | | | 22,800,000 | | | | 22,783,516 | |
1.601%, 12/6/19 | | | 11,575,000 | | | | 11,603,081 | |
4.30%, 7/22/27 | | | 21,995,000 | | | | 22,588,579 | |
| | | | | | | | |
| | | | | | | 532,778,710 | |
| | |
| PAGE 10 § DODGE & COX BALANCED FUND | | See accompanying Notes to Financial Statements |
| | | | |
| PORTFOLIO OF INVESTMENTS | | | December 31, 2016 | |
| | | | | | | | |
| DEBT SECURITIES (continued) | |
| | |
| | | PAR VALUE | | | VALUE | |
INDUSTRIALS: 6.2% | | | | | | | | |
AT&T, Inc. | | | | | | | | |
5.35%, 9/1/40 | | $ | 27,575,000 | | | $ | 28,272,124 | |
4.75%, 5/15/46 | | | 7,000,000 | | | | 6,619,298 | |
5.65%, 2/15/47 | | | 5,175,000 | | | | 5,539,967 | |
4.50%, 3/9/48 | | | 10,160,000 | | | | 9,159,758 | |
BHP Billiton, Ltd. (Australia) | | | | | | | | |
6.75%, 10/19/75(b)(c) | | | 19,800,000 | | | | 22,225,500 | |
Burlington Northern Santa Fe LLC(e) | | | | | | | | |
5.72%, 1/15/24 | | | 4,004,335 | | | | 4,445,064 | |
5.342%, 4/1/24 | | | 8,422,517 | | | | 9,162,688 | |
5.629%, 4/1/24 | | | 12,970,786 | | | | 14,338,192 | |
Cemex SAB de CV (Mexico) | | | | | | | | |
6.50%, 12/10/19(c) | | | 6,175,000 | | | | 6,530,063 | |
6.00%, 4/1/24(c) | | | 10,575,000 | | | | 10,865,813 | |
5.70%, 1/11/25(c) | | | 22,475,000 | | | | 22,643,562 | |
6.125%, 5/5/25(c) | | | 8,100,000 | | | | 8,282,250 | |
Charter Communications, Inc. | | | | | | | | |
8.75%, 2/14/19 | | | 7,840,000 | | | | 8,832,160 | |
8.25%, 4/1/19 | | | 21,815,000 | | | | 24,504,462 | |
4.908%, 7/23/25 | | | 11,600,000 | | | | 12,210,380 | |
6.55%, 5/1/37 | | | 11,000,000 | | | | 12,434,444 | |
6.75%, 6/15/39 | | | 2,110,000 | | | | 2,449,307 | |
6.484%, 10/23/45 | | | 8,150,000 | | | | 9,405,793 | |
Cox Enterprises, Inc. | | | | | | | | |
3.25%, 12/15/22(c) | | | 6,240,000 | | | | 6,071,333 | |
2.95%, 6/30/23(c) | | | 37,166,000 | | | | 34,937,266 | |
3.85%, 2/1/25(c) | | | 13,125,000 | | | | 12,856,213 | |
CRH PLC (Ireland) | | | | | | | | |
3.875%, 5/18/25(c) | | | 17,100,000 | | | | 17,389,845 | |
Dell Technologies, Inc. | | | | | | | | |
4.42%, 6/15/21(c) | | | 25,415,000 | | | | 26,275,831 | |
5.45%, 6/15/23(c) | | | 11,500,000 | | | | 12,186,044 | |
Dillard’s, Inc. | | | | | | | | |
7.875%, 1/1/23 | | | 8,660,000 | | | | 10,283,750 | |
7.75%, 7/15/26 | | | 50,000 | | | | 57,250 | |
7.75%, 5/15/27 | | | 540,000 | | | | 633,150 | |
7.00%, 12/1/28 | | | 15,135,000 | | | | 16,951,200 | |
Dow Chemical Co. | | | | | | | | |
7.375%, 11/1/29 | | | 17,000,000 | | | | 22,301,586 | |
9.40%, 5/15/39 | | | 9,677,000 | | | | 14,992,189 | |
Ford Motor Credit Co. LLC(e) | | | | | | | | |
5.75%, 2/1/21 | | | 12,700,000 | | | | 13,915,707 | |
5.875%, 8/2/21 | | | 3,850,000 | | | | 4,248,144 | |
4.25%, 9/20/22 | | | 9,593,000 | | | | 9,872,876 | |
4.375%, 8/6/23 | | | 7,900,000 | | | | 8,144,315 | |
Imperial Brands PLC (United Kingdom) | | | | | | | | |
3.75%, 7/21/22(c) | | | 10,475,000 | | | | 10,742,175 | |
4.25%, 7/21/25(c) | | | 31,825,000 | | | | 32,808,806 | |
Kinder Morgan, Inc. | | | | | | | | |
4.30%, 6/1/25 | | | 26,515,000 | | | | 27,264,818 | |
5.50%, 3/1/44 | | | 23,730,000 | | | | 24,150,970 | |
5.40%, 9/1/44 | | | 15,414,000 | | | | 15,336,606 | |
Macy’s, Inc. | | | | | | | | |
6.90%, 1/15/32 | | | 47,069,000 | | | | 52,290,694 | |
6.70%, 7/15/34 | | | 2,890,000 | | | | 3,145,375 | |
Naspers, Ltd. (South Africa) | | | | | | | | |
6.00%, 7/18/20(c) | | | 16,900,000 | | | | 18,283,265 | |
5.50%, 7/21/25(c) | | | 17,575,000 | | | | 17,702,594 | |
RELX PLC (United Kingdom) | | | | | | | | |
3.125%, 10/15/22 | | | 17,458,000 | | | | 17,281,377 | |
Telecom Italia SPA (Italy) | | | | | | | | |
7.175%, 6/18/19 | | | 27,527,000 | | | | 30,486,153 | |
5.303%, 5/30/24(c) | | | 16,025,000 | | | | 15,624,375 | |
7.20%, 7/18/36 | | | 11,596,000 | | | | 11,430,641 | |
7.721%, 6/4/38 | | | 7,062,000 | | | | 7,291,515 | |
| | | | | | | | |
| | |
| | |
| | | PAR VALUE | | | VALUE | |
Time Warner, Inc. | | | | | | | | |
7.625%, 4/15/31 | | $ | 15,500,000 | | | $ | 20,984,427 | |
7.70%, 5/1/32 | | | 11,554,000 | | | | 15,639,275 | |
TransCanada Corp. (Canada) | | | | | | | | |
5.625%, 5/20/75(b) | | | 20,570,000 | | | | 20,775,700 | |
5.875%, 8/15/76(b) | | | 4,500,000 | | | | 4,680,000 | |
Twenty-First Century Fox, Inc. | | | | | | | | |
6.15%, 3/1/37 | | | 15,000,000 | | | | 17,527,440 | |
6.65%, 11/15/37 | | | 1,638,000 | | | | 2,012,598 | |
Ultrapar Participacoes SA (Brazil) | | | | | | | | |
5.25%, 10/6/26(c) | | | 15,050,000 | | | | 14,747,495 | |
Union Pacific Corp. | | | | | | | | |
6.176%, 1/2/31 | | | 8,730,526 | | | | 10,223,420 | |
Verizon Communications, Inc. | | | | | | | | |
4.272%, 1/15/36 | | | 11,847,000 | | | | 11,321,112 | |
6.55%, 9/15/43 | | | 46,476,000 | | | | 57,946,742 | |
Vulcan Materials Co. | | | | | | | | |
7.50%, 6/15/21 | | | 20,340,000 | | | | 23,950,350 | |
Xerox Corp. | | | | | | | | |
6.35%, 5/15/18 | | | 16,835,000 | | | | 17,746,178 | |
4.50%, 5/15/21 | | | 13,311,000 | | | | 13,828,013 | |
Zoetis, Inc. | | | | | | | | |
4.50%, 11/13/25 | | | 7,985,000 | | | | 8,454,239 | |
| | | | | | | | |
| | | | | | | 952,713,877 | |
UTILITIES: 0.4% | | | | | | | | |
Dominion Resources, Inc. | | | | | | | | |
4.104%, 4/1/21 | | | 5,300,000 | | | | 5,516,256 | |
5.75%, 10/1/54(b) | | | 22,950,000 | | | | 23,523,750 | |
Enel SPA (Italy) | | | | | | | | |
6.80%, 9/15/37(c) | | | 13,700,000 | | | | 16,605,427 | |
6.00%, 10/7/39(c) | | | 12,015,000 | | | | 13,401,411 | |
| | | | | | | | |
| | | | | | | 59,046,844 | |
| | | | | | | | |
| | | | | | | 1,544,539,431 | |
| | | | | | | | |
TOTAL DEBT SECURITIES
(Cost $3,718,258,456) | | | | | | $ | 3,854,559,592 | |
|
| SHORT-TERM INVESTMENTS: 2.7% | |
MONEY MARKET FUND: 0.1% | | | | | | | | |
State Street Institutional Treasury Plus Money Market Fund | | $ | 15,548,033 | | | $ | 15,548,033 | |
| | |
REPURCHASE AGREEMENT: 2.6% | | | | | | | | |
Fixed Income Clearing Corporation(d)
0.10%, dated 12/30/16, due 1/3/17,
maturity value $401,109,457 | | | 401,105,000 | | | | 401,105,000 | |
| | | | | | | | |
TOTAL SHORT-TERM INVESTMENTS
(Cost $416,653,033) | | | $ | 416,653,033 | |
| | | | | | | | |
TOTAL INVESTMENTS
(Cost $11,572,340,900) | | | 100.5 | % | | $ | 15,451,795,401 | |
OTHER ASSETS LESS LIABILITIES | | | (0.5 | %) | | | (70,232,481 | ) |
| | | | | | | | |
NET ASSETS | | | 100.0 | % | | $ | 15,381,562,920 | |
| | | | | | | | |
| (c) | Security exempt from registration under Rule 144A of the Securities Act of 1933. The security may be resold in transactions exempt from registration, normally to qualified institutional buyers. As of December 31, 2016, all such securities in total represented $508,795,094 or 3.3% of net assets. These securities have been deemed liquid by Dodge & Cox, investment manager, pursuant to procedures approved by the Fund’s Board of Trustees. |
| (d) | Repurchase agreement is collateralized by U.S. Treasury Inflation Indexed Note 0.125%, 4/15/19. Total collateral value is $409,132,056. |
| (e) | Subsidiary (see below) |
| | |
| See accompanying Notes to Financial Statements | | DODGE & COX BALANCED FUND §PAGE 11 |
| | | | |
| PORTFOLIO OF INVESTMENTS | | | December 31, 2016 | |
In determining a company’s country designation, the Fund generally references the country of incorporation. In cases where the Fund considers the country of incorporation to be a “jurisdiction of convenience” chosen primarily for tax purposes or in other limited circumstances, the Fund uses the country designation of an appropriate broad-based market index. In those cases, two countries are listed — the country of incorporation and the country designated by an appropriate index, respectively.
Debt securities are grouped by parent company unless otherwise noted. Actual securities may be issued by the listed parent company or one of its subsidiaries.
ADR: American Depositary Receipt
ARM: Adjustable Rate Mortgage
CMO: Collateralized Mortgage Obligation
DUS: Delegated Underwriting and Servicing
GO: General Obligation
RB: Revenue Bond
REMIC: Real Estate Mortgage Investment Conduit
FUTURES CONTRACTS
| | | | | | | | | | | | | | | | |
| Description | | Number of
Contracts | | | Expiration
Date | | | Notional
Amount | | | Unrealized
Appreciation/
(Depreciation) | |
10 Year U.S. Treasury Note—Short Position | | | 1,587 | | | | Mar 2017 | | | $ | (197,234,344 | ) | | $ | 913,562 | |
Long Term U.S. Treasury Bond—Short Position | | | 901 | | | | Mar 2017 | | | | (144,385,250 | ) | | | 550,745 | |
| | | | | | | | | | | | | | | | |
| | | | | | | | | | | | | | $ | 1,464,307 | |
| | | | | | | | | | | | | | | | |
| | |
| PAGE 12 § DODGE & COX BALANCED FUND | | See accompanying Notes to Financial Statements |
| | | | |
STATEMENT OF ASSETS AND LIABILITIES | |
| |
| | | December 31, 2016 | |
ASSETS: | | | | |
Investments, at value (cost $11,572,340,900) | | $ | 15,451,795,401 | |
Cash held at broker | | | 7,346,742 | |
Receivable for investments sold | | | 31,772,446 | |
Receivable for Fund shares sold | | | 10,714,067 | |
Dividends and interest receivable | | | 49,156,774 | |
Prepaid expenses and other assets | | | 95,176 | |
| | | | |
| | | 15,550,880,606 | |
| | | | |
LIABILITIES: | | | | |
Payable for investments purchased | | | 14,549,943 | |
Payable to broker for variation margin | | | 1,418,375 | |
Payable for Fund shares redeemed | | | 145,916,768 | |
Management fees payable | | | 6,588,108 | |
Accrued expenses | | | 844,492 | |
| | | | |
| | | 169,317,686 | |
| | | | |
NET ASSETS | | $ | 15,381,562,920 | |
| | | | |
NET ASSETS CONSIST OF: | | | | |
Paid in capital | | $ | 11,272,126,557 | |
Undistributed net investment income | | | 2,394,380 | |
Undistributed net realized gain | | | 226,123,175 | |
Net unrealized appreciation | | | 3,880,918,808 | |
| | | | |
| | $ | 15,381,562,920 | |
| | | | |
Fund shares outstanding (par value $0.01 each, unlimited shares authorized) | | | 148,828,843 | |
Net asset value per share | | $ | 103.35 | |
|
STATEMENT OF OPERATIONS | |
| |
| | | Year Ended
December 31, 2016 | |
INVESTMENT INCOME: | | | | |
Dividends (net of foreign taxes of $1,763,684) | | $ | 232,924,499 | |
Interest | | | 184,307,960 | |
| | | | |
| | | 417,232,459 | |
| | | | |
EXPENSES: | | | | |
Management fees | | | 71,022,127 | |
Custody and fund accounting fees | | | 186,555 | |
Transfer agent fees | | | 1,785,535 | |
Professional services | | | 166,274 | |
Shareholder reports | | | 299,276 | |
Registration fees | | | 80,999 | |
Trustees’ fees | | | 247,500 | |
ADR depositary services fees | | | 635,860 | |
Miscellaneous | | | 175,348 | |
| | | | |
| | | 74,599,474 | |
| | | | |
NET INVESTMENT INCOME | | | 342,632,985 | |
| | | | |
REALIZED AND UNREALIZED GAIN (LOSS): | | | | |
Net realized gain (loss) | | | | |
Investments | | | 660,171,952 | |
Futures contracts | | | (7,748,221 | ) |
Foreign currency transactions | | | (24,108 | ) |
Net change in unrealized appreciation/depreciation | | | | |
Investments | | | 1,208,146,381 | |
Futures contracts | | | 1,208,418 | |
| | | | |
Net realized and unrealized gain | | | 1,861,754,422 | |
| | | | |
NET CHANGE IN NET ASSETS FROM OPERATIONS | | $ | 2,204,387,407 | |
| | | | |
| | | | | | | | |
STATEMENT OF CHANGES IN NET ASSETS | |
| | |
| | | Year Ended
December 31, 2016 | | | Year Ended
December 31, 2015 | |
| | |
OPERATIONS: | | | | | | | | |
Net investment income | | $ | 342,632,985 | | | $ | 307,788,487 | |
Net realized gain | | | 652,399,623 | | | | 492,597,968 | |
Net change in unrealized appreciation/depreciation | | | 1,209,354,799 | | | | (1,229,772,659 | ) |
| | | | | | | | |
| | | 2,204,387,407 | | | | (429,386,204 | ) |
| | | | | | | | |
| | |
DISTRIBUTIONS TO SHAREHOLDERS FROM: | | | | | | | | |
Net investment income | | | (342,522,606 | ) | | | (308,037,610 | ) |
Net realized gain | | | (577,591,290 | ) | | | (455,897,559 | ) |
| | | | | | | | |
Total distributions | | | (920,113,896 | ) | | | (763,935,169 | ) |
| | | | | | | | |
| | |
FUND SHARE TRANSACTIONS: | | | | | | | | |
Proceeds from sale of shares | | | 1,311,438,514 | | | | 1,416,791,531 | |
Reinvestment of distributions | | | 873,912,502 | | | | 725,183,002 | |
Cost of shares redeemed | | | (2,357,390,650 | ) | | | (2,144,401,683 | ) |
| | | | | | | | |
Net change from Fund share transactions | | | (172,039,634 | ) | | | (2,427,150 | ) |
| | | | | | | | |
Total change in net assets | | | 1,112,233,877 | | | | (1,195,748,523 | ) |
| | |
NET ASSETS: | | | | | | | | |
Beginning of year | | | 14,269,329,043 | | | | 15,465,077,566 | |
| | | | | | | | |
End of year (including undistributed net investment income of $2,394,380 and $3,251,258, respectively) | | $ | 15,381,562,920 | | | $ | 14,269,329,043 | |
| | | | | | | | |
| | |
SHARE INFORMATION: | | | | | | | | |
Shares sold | | | 13,426,666 | | | | 14,047,663 | |
Distributions reinvested | | | 8,834,100 | | | | 7,539,830 | |
Shares redeemed | | | (24,554,403 | ) | | | (21,376,698 | ) |
| | | | | | | | |
Net change in shares outstanding | | | (2,293,637 | ) | | | 210,795 | |
| | | | | | | | |
| | |
| See accompanying Notes to Financial Statements | | DODGE & COX BALANCED FUND §PAGE 13 |
NOTES TO FINANCIAL STATEMENTS
NOTE 1—ORGANIZATION AND SIGNIFICANT ACCOUNTING POLICIES
Dodge & Cox Balanced Fund (the “Fund”) is one of the series constituting the Dodge & Cox Funds (the “Trust” or the “Funds”). The Trust is organized as a Delaware statutory trust and is registered under the Investment Company Act of 1940, as amended, as an open-end management investment company. The Fund commenced operations on June 26, 1931, and seeks regular income, conservation of principal, and an opportunity for long-term growth of principal and income. Risk considerations and investment strategies of the Fund are discussed in the Fund’s Prospectus.
The financial statements have been prepared in conformity with accounting principles generally accepted in the United States of America, which require the use of estimates and assumptions by management. Actual results may differ from those estimates. Significant accounting policies are as follows:
Security valuation The Fund’s net assets are typically valued as of the normally scheduled close of trading on the New York Stock Exchange (NYSE), generally 4:00 p.m. Eastern Time, each day that the NYSE is open for business. Portfolio securities and other financial instruments for which market quotes are readily available are valued at market value. Listed securities are generally valued using the official quoted close price or the last sale on the exchange that is determined to be the primary market for the security.
Debt securities (including certain preferred stocks) and non-exchange traded derivatives are valued based on prices received from independent pricing services which utilize both dealer-supplied valuations and pricing models. Pricing models may consider quoted prices for similar securities, interest rates, cash flows (including prepayment speeds), and credit risk. Exchange-traded derivatives are valued at the settlement price determined by the relevant exchange. Security values are not discounted based on the size of the Fund’s position. Short-term securities less than 60 days to maturity may be valued at amortized cost if amortized cost approximates current value. Mutual funds are valued at their respective net asset values. All securities held by the Fund are denominated in U.S. dollars.
If market quotations are not readily available or if a security’s value is believed to have materially changed after the close of the security’s primary market but before the close of trading on the NYSE, the security is valued at fair value as determined in good faith by or under the direction of the Fund’s Board of Trustees. The Board of Trustees has appointed Dodge & Cox, the Fund’s investment manager, to make fair value determinations in accordance with the Dodge & Cox Funds Valuation Policies (“Valuation Policies”), subject to Board oversight. Dodge & Cox has established a Pricing Committee that is comprised of representatives from Treasury, Legal, Compliance, and Operations. The Pricing Committee is responsible for implementing the Valuation Policies, including determining the fair value of securities when market quotations or market-based valuations are not readily available or are deemed unreliable. The Pricing
Committee considers relevant indications of value that are reasonably available to it in determining the fair value assigned to a particular security, such as the value of similar financial instruments, trading volumes, contractual restrictions on disposition, related corporate actions, and changes in economic conditions. In doing so, the Pricing Committee employs various methods for calibrating fair valuation approaches, including a regular review of key inputs and assumptions, back-testing, and review of any related market activity.
Valuing securities through a fair value determination involves greater reliance on judgment than valuation of securities based on readily available market quotations. In some instances, lack of information and uncertainty as to the significance of information may lead to a conclusion that a prior valuation is the best indication of a security’s value. When fair value pricing is employed, the prices of securities used by the Fund to calculate its NAV may differ from quoted or published prices for the same securities.
Security transactions, investment income, expenses, and distributions Security transactions are recorded on the trade date. Realized gains and losses on securities sold are determined on the basis of identified cost.
Dividend income and corporate action transactions are recorded on the ex-dividend date, or when the Fund first learns of the dividend/corporate action if the ex-dividend date has passed. Withholding taxes on foreign dividends have been provided for in accordance with the Fund’s understanding of the applicable country’s tax rules and rates. Non-cash dividends included in dividend income, if any, are recorded at the fair market value of the securities received. Dividends characterized as return of capital for U.S. tax purposes are recorded as a reduction of cost of investments and/or realized gain.
Interest income is recorded on the accrual basis. Interest income includes coupon interest, amortization of premium and accretion of discount on debt securities, and gain/loss on paydowns. The ability of the issuers of the debt securities held by the Fund to meet their obligations may be affected by economic developments in a specific industry, state, or region. Debt obligations may be placed on non-accrual status and related interest income may be reduced by ceasing current accruals and writing off interest receivables when the collection of all or a portion of interest has become doubtful. A debt obligation is removed from non-accrual status when the issuer resumes interest payments or when collectibility of interest is reasonably assured.
Expenses are recorded on the accrual basis. Some expenses of the Trust can be directly attributed to a specific series. Expenses which cannot be directly attributed are allocated among the Funds in the Trust using methodologies determined by the nature of the expense.
Distributions to shareholders are recorded on the ex-dividend date.
Foreign taxes The Fund may be subject to foreign taxes which may be imposed by certain countries in which the Fund invests. The Fund endeavors to record foreign taxes based on applicable foreign tax law. Withholding taxes are incurred on
PAGE 14 § DODGE & COX BALANCED FUND
NOTES TO FINANCIAL STATEMENTS
certain foreign dividends and are accrued at the time the associated dividend is recorded. The Fund files withholding tax reclaims in certain jurisdictions to recover a portion of amounts previously withheld. The Fund records a reclaim receivable based on, among other things, a jurisdiction’s legal obligation to pay reclaims as well as payment history and market convention. In consideration of recent decisions rendered by European courts, the Fund has filed for additional reclaims related to prior years. A corresponding receivable is established when both the amount is known and significant contingencies or uncertainties regarding collectability are removed. These amounts, if any, are reported in “dividends and interest receivable” on the Statement of Assets and Liabilities.
Repurchase agreements The Fund enters into repurchase agreements, secured by U.S. government or agency securities, which involve the purchase of securities from a counterparty with a simultaneous commitment to resell the securities at an agreed-upon date and price. It is the Fund’s policy that its custodian take possession of the underlying collateral securities, the fair value of which exceeds the principal amount of the repurchase transaction, including accrued interest, at all times. In the event of default by the counterparty, the Fund has the contractual right to liquidate the collateral securities and to apply the proceeds in satisfaction of the obligation.
Futures Contracts Futures contracts involve an obligation to purchase or sell (depending on whether the Fund has entered a long or short futures contract, respectively) an asset at a future date, at a price set at the time of the contract. Upon entering into a futures contract, the Fund is required to deposit an amount of cash or liquid assets (referred to as initial margin) in a segregated account with the clearing broker. Subsequent payments (referred to as variation margin) to and from the clearing broker are made on a daily basis based on changes in the market value of futures contracts. Futures contracts are traded publicly and their market value changes daily. Changes in the market value of open futures contracts are recorded as unrealized appreciation or depreciation in the Statement of Operations. Realized gains and losses on futures contracts are recorded in the Statement of Operations at the closing or expiration of the contracts. Cash deposited with a broker as initial margin is recorded on the Statement of Assets and Liabilities. A receivable and/or payable to brokers for daily variation margin is also recorded on the Statement of Assets and Liabilities.
Investments in futures contracts may include certain risks, which may be different from, and potentially greater than, those of the underlying securities. To the extent the Fund uses futures, it is exposed to additional volatility and potential losses resulting from leverage.
The Fund has maintained short Treasury futures contracts to assist with the management of the portfolio’s interest rate exposure. During the year ended December 31, 2016, these Treasury futures contracts had notional values ranging from 2% to 3% of net assets.
Indemnification Under the Trust’s organizational documents, its officers and trustees are indemnified against certain liabilities
arising out of the performance of their duties to the Trust. In addition, in the normal course of business the Trust enters into contracts that provide general indemnities to other parties. The Trust’s maximum exposure under these arrangements is unknown as this would involve future claims that may be made against the Trust that have not yet occurred.
NOTE 2—VALUATION MEASUREMENTS
Various inputs are used in determining the value of the Fund’s investments. These inputs are summarized in the three broad levels listed below.
| § | | Level 1: Quoted prices in active markets for identical securities |
| § | | Level 2: Other significant observable inputs (including quoted prices for similar securities, market indices, interest rates, credit risk, forward exchange rates, etc.) |
| § | | Level 3: Significant unobservable inputs (including Fund management’s assumptions in determining the fair value of investments) |
The inputs or methodology used for valuing securities are not necessarily an indication of the risk associated with investing in those securities.
The following is a summary of the inputs used to value the Fund’s holdings at December 31, 2016:
| | | | | | | | |
| Classification(a) | | LEVEL 1
(Quoted Prices) | | | LEVEL 2
(Other Significant
Observable Inputs) | |
Securities | | | | | | | | |
Common Stocks(b) | | $ | 10,425,570,059 | | | $ | — | |
Preferred Stocks | | | — | | | | 755,012,717 | |
Debt Securities | | | | | | | | |
U.S. Treasury | | | — | | | | 753,099,010 | |
Government-Related | | | — | | | | 231,733,542 | |
Mortgage-Related | | | — | | | | 1,208,376,386 | |
Asset-Backed | | | — | | | | 116,811,223 | |
Corporate | | | — | | | | 1,544,539,431 | |
Short-term Investments | | | | | | | | |
Money Market Fund | | | 15,548,033 | | | | — | |
Repurchase Agreement | | | — | | | | 401,105,000 | |
| | | | | | | | |
Total Securities | | $ | 10,441,118,092 | | | $ | 5,010,677,309 | |
| | | | | | | | |
Other Financial Instruments | | | | | | | | |
Futures Contracts | | | | | | | | |
Appreciation | | $ | 1,464,307 | | | $ | — | |
| | | | | | | | | |
| (a) | There were no transfers between Level 1 and Level 2 during the year ended December 31, 2016. There were no Level 3 securities at December 31, 2016 and 2015, and there were no transfers to Level 3 during the year. |
| (b) | All common stocks held in the Fund are Level 1 securities. For a detailed break-out of common stocks by major industry classification, please refer to the Portfolio of Investments. |
NOTE 3—RELATED PARTY TRANSACTIONS
Management fees Under a written agreement approved by a unanimous vote of the Board of Trustees, the Fund pays an annual management fee of 0.50% of the Fund’s average daily net assets to Dodge & Cox, investment manager of the Fund.
DODGE & COX BALANCED FUND §PAGE 15
NOTES TO FINANCIAL STATEMENTS
Fund officers and trustees All officers and two of the trustees of the Trust are officers or employees of Dodge & Cox. The Trust pays a fee only to those trustees who are not affiliated with Dodge & Cox.
NOTE 4—INCOME TAX INFORMATION AND DISTRIBUTIONS TO SHAREHOLDERS
A provision for federal income taxes is not required since the Fund intends to continue to qualify as a regulated investment company under Subchapter M of the Internal Revenue Code and distribute all of its taxable income to shareholders. Distributions are determined in accordance with income tax regulations, and such amounts may differ from net investment income and realized gains for financial reporting purposes. Financial reporting records are adjusted for permanent book to tax differences at year end to reflect tax character.
Book to tax differences are primarily due to differing treatments of wash sales, net short-term realized gain (loss), certain dividends, and futures contracts. At December 31, 2016, the cost of investments for federal income tax purposes was $11,579,988,833.
Distributions during the years noted below were characterized as follows for federal income tax purposes:
| | | | | | | | |
| | | Year Ended
December 31, 2016 | | | Year Ended
December 31, 2015 | |
Ordinary income | | | $353,285,575 | | | | $311,803,137 | |
| | | ($2.414 per share) | | | | ($2.085 per share) | |
| | |
Long-term capital gain | | | $566,828,321 | | | | $452,132,032 | |
| | | ($3.884 per share) | | | | ($3.049 per share) | |
At December 31, 2016, the tax basis components of distributable earnings were as follows:
| | | | |
Unrealized appreciation | | $ | 4,114,510,429 | |
Unrealized depreciation | | | (242,703,861 | ) |
| | | | |
Net unrealized appreciation | | | 3,871,806,568 | |
Undistributed ordinary income | | | 26,782,229 | |
Undistributed long-term capital gain | | | 210,847,566 | |
Fund management has reviewed the tax positions for open periods (three years and four years, respectively, from filing the Fund’s Federal and State tax returns) as applicable to the Fund, and has determined that no provision for income tax is required in the Fund’s financial statements.
NOTE 5—LOAN FACILITIES
Pursuant to an exemptive order issued by the Securities and Exchange Commission (SEC), the Fund may participate in an interfund lending facility (Facility). The Facility allows the Fund to borrow money from or loan money to the Funds. Loans under the Facility are made for temporary or emergency purposes, such as to fund shareholder redemption requests. Interest on borrowings is the average of the current repurchase agreement rate and the bank loan rate. There was no activity in the Facility during the year.
All Funds in the Trust participate in a $500 million committed credit facility (Line of Credit) with State Street Bank and Trust Company, to be utilized for temporary or emergency purposes to fund shareholder redemptions or for other short-term liquidity purposes. The maximum amount available to the Fund is $250 million. Each Fund pays an annual commitment fee on its pro-rata portion of the Line of Credit. For the year ended December 31, 2016, the Fund’s commitment fee amounted to $72,178 and is reflected as a Miscellaneous Expense in the Statement of Operations. Interest on borrowings is charged at the prevailing rate. There were no borrowings on the Line of Credit during the year.
NOTE 6—PURCHASES AND SALES OF INVESTMENTS
For the year ended December 31, 2016, purchases and sales of securities, other than short-term securities and U.S. government securities, aggregated $1,975,101,139 and $3,159,212,870, respectively. For the year ended December 31, 2016, purchases and sales of U.S. government securities aggregated $1,345,426,661 and $1,018,972,782, respectively.
NOTE 7—NEW ACCOUNTING GUIDANCE
In October 2016, the SEC issued a new rule, Investment Company Reporting Modernization, which, among other provisions, amends Regulation S-X to require standardized, enhanced disclosures, particularly related to derivatives, in investment company financial statements. Compliance with the guidance is required for financial statements filed with the SEC on or after August 1, 2017. Management is currently assessing the impact of this rule to the Fund’s financial statements and other filings and does not expect any impact to the Fund’s net assets or results of operations.
NOTE 8—SUBSEQUENT EVENTS
Fund management has determined that no material events or transactions occurred subsequent to December 31, 2016, and through the date of the Fund’s financial statements issuance, which require additional disclosure in the Fund’s financial statements.
PAGE 16 § DODGE & COX BALANCED FUND
FINANCIAL HIGHLIGHTS
| | | | | | | | | | | | | | | | | | | | |
SELECTED DATA AND RATIOS (for a share outstanding throughout each year) | | Year Ended December 31, | |
| | | 2016 | | | 2015 | | | 2014 | | | 2013 | | | 2012 | |
| | | | |
Net asset value, beginning of year | | | $94.42 | | | | $102.48 | | | | $98.30 | | | | $78.06 | | | | $67.45 | |
Income from investment operations: | | | | | | | | | | | | | | | | | | | | |
Net investment income | | | 2.34 | | | | 2.06 | | | | 2.03 | | | | 1.66 | | | | 1.65 | |
Net realized and unrealized gain (loss) | | | 12.89 | | | | (4.99 | ) | | | 6.59 | | | | 20.30 | | | | 10.62 | |
| | | | |
Total from investment operations | | | 15.23 | | | | (2.93 | ) | | | 8.62 | | | | 21.96 | | | | 12.27 | |
| | | | |
Distributions to shareholders from: | | | | | | | | | | | | | | | | | | | | |
Net investment income | | | (2.34 | ) | | | (2.06 | ) | | | (2.03 | ) | | | (1.65 | ) | | | (1.66 | ) |
Net realized gain | | | (3.96 | ) | | | (3.07 | ) | | | (2.41 | ) | | | (0.07 | ) | | | — | |
| | | | |
Total distributions | | | (6.30 | ) | | | (5.13 | ) | | | (4.44 | ) | | | (1.72 | ) | | | (1.66 | ) |
| | | | |
Net asset value, end of year | | | $103.35 | | | | $94.42 | | | | $102.48 | | | | $98.30 | | | | $78.06 | |
| | | | |
Total return | | | 16.55 | % | | | (2.88 | )% | | | 8.85 | % | | | 28.37 | % | | | 18.32 | % |
Ratios/supplemental data: | | | | | | | | | | | | | | | | | | | | |
Net assets, end of year (millions) | | | $15,382 | | | | $14,269 | | | | $15,465 | | | | $14,404 | | | | $12,217 | |
Ratio of expenses to average net assets | | | 0.53 | % | | | 0.53 | % | | | 0.53 | % | | | 0.53 | % | | | 0.53 | % |
Ratio of net investment income to average net assets | | | 2.41 | % | | | 2.03 | % | | | 2.00 | % | | | 1.85 | % | | | 2.21 | % |
Portfolio turnover rate | | | 24 | % | | | 20 | % | | | 23 | % | | | 25 | % | | | 16 | % |
See accompanying Notes to Financial Statements
DODGE & COX BALANCED FUND §PAGE 17
REPORT OF INDEPENDENT REGISTERED PUBLIC ACCOUNTING FIRM
To the Trustees of Dodge & Cox Funds and Shareholders of Dodge & Cox Balanced Fund
In our opinion, the accompanying statement of assets and liabilities, including the portfolio of investments, and the related statements of operations and of changes in net assets and the financial highlights present fairly, in all material respects, the financial position of Dodge & Cox Balanced Fund (one of the series constituting Dodge & Cox Funds, hereafter referred to as the “Fund”) as of December 31, 2016, the results of its operations for the year then ended, the changes in its net assets for each of the two years in the period then ended and the financial highlights for each of the five years in the period then ended, in conformity with accounting principles generally accepted in the United States of America. These financial statements and financial highlights (hereafter referred to as “financial statements”) are the responsibility of the Fund’s management. Our responsibility is to express an opinion on these financial statements based on our audits. We conducted our audits of these financial statements in accordance with the standards of the Public Company Accounting Oversight Board (United States). Those standards require that we plan and perform the audit to obtain reasonable assurance about whether the financial statements are free of material misstatement. An audit includes examining, on a test basis, evidence supporting the amounts and disclosures in the financial statements, assessing the accounting principles used and significant estimates made by management, and evaluating the overall financial statement presentation. We believe that our audits, which included confirmation of securities as of December 31, 2016 by correspondence with the custodian and brokers, provide a reasonable basis for our opinion.
PricewaterhouseCoopers LLP
San Francisco, California
February 15, 2017
PAGE 18 § DODGE & COX BALANCED FUND
SPECIAL 2016 TAX INFORMATION
(unaudited)
The following information is provided pursuant to provisions of the Internal Revenue Code:
The Fund designates $231,762,799 of its distributions paid to shareholders in 2016 as qualified dividends (treated for federal income tax purposes in the hands of shareholders as taxable at a maximum rate of 20%).
For shareholders that are corporations, the Fund designates 47% of its ordinary dividends paid to shareholders in 2016 as dividends from domestic corporations eligible for the corporate dividends received deduction, provided that the shareholder otherwise satisfies applicable requirements to claim that deduction.
BOARD APPROVAL OF FUNDS’ INVESTMENT MANAGEMENT AGREEMENTS AND MANAGEMENT FEES
(unaudited)
The Board of Trustees is responsible for overseeing the performance of the Dodge & Cox Funds’ investment manager and determining whether to continue the Investment Management Agreements between the Funds and Dodge & Cox each year (the “Agreements”). At a meeting of the Board of Trustees of the Trust held on December 14, 2016, the Trustees, by a unanimous vote (including a separate vote of those Trustees who are not “interested persons” (as defined in the Investment Company Act of 1940) (the “Independent Trustees”)), approved the renewal of the Agreements for an additional one-year term through December 31, 2017 with respect to each Fund. During the course of the year, the Board received extensive information and materials relating to the investment management and administrative services provided by Dodge & Cox and the performance of each of the Funds.
INFORMATION RECEIVED
In 2016, the Board requested and received a series of special presentations relating to the proposed renewal of the Funds’ Agreements. These presentations, which took place over the course of the year, covered, among other things, (i) a report about asset management industry trends and the competitive landscape for Dodge & Cox and the Funds; (ii) an extensive presentation regarding economies of scale, which included materials describing key enhancements over the past 15 years in the scope of services that Dodge & Cox furnishes to the Funds; (iii) a detailed presentation by Morningstar® representatives regarding the format, methodology, and content of Morningstar’s 15(c) report; (iv) materials describing peer fund management fees (including funds with breakpoints) and expense ratios and Dodge & Cox’s separate account advisory fee schedules as compared to those of peer firms; and (v) reports by outside counsel regarding mutual fund litigation trends and developments.
In addition to the foregoing and in advance of the meeting, the Board, including each of the Independent Trustees, requested, received, and reviewed materials relating to the Agreements and the services provided by Dodge & Cox. The Independent Trustees retained Morningstar to prepare an independent expense and
performance summary for each Fund and comparable funds managed by other advisers identified by Morningstar. The Morningstar materials included information regarding advisory fee rates, expense ratios, and transfer agency, custodial, and distribution expenses, as well as appropriate performance comparisons to each Fund’s peer group and an index or combination of indices. The Morningstar materials also included a comparison of expenses of various share classes offered by comparable funds. The materials reviewed by the Board contained information concerning, among other things, Dodge & Cox’s profitability, financial results and condition, advisory fee revenue and separate account fee schedules. The Board additionally considered the Funds’ brokerage commissions, turnover rates, sales and redemption data, and the significant investment that Dodge & Cox makes in research used in managing the Funds. The Board received and reviewed memoranda and related materials addressing, among other things, Dodge & Cox’s services to the Funds; how Dodge & Cox Funds’ fees compare to fees of peer group funds; the different fees, services, costs, and risks associated with other accounts managed by Dodge & Cox as compared to the Dodge & Cox Funds; and the ways in which the Funds realize economies of scale. Throughout the process of reviewing the services provided by Dodge & Cox and preparing for the meeting, the Independent Trustees found Dodge & Cox to be open, forthright, detailed, and very helpful in answering questions about all issues. The Board received copies of the Agreements and a memorandum from the independent legal counsel to the Independent Trustees discussing the factors generally regarded as appropriate to consider in evaluating advisory arrangements. The Trust’s Contract Review Committee, consisting solely of Independent Trustees, met with the independent legal counsel on November 3, 2016 and again on December 14, 2016 to discuss whether to renew the Agreements. The Board, including the Independent Trustees, subsequently concluded that the existing Agreements are fair and reasonable and voted to approve the Agreements. In considering the Agreements, the Board, including the Independent Trustees, did not identify any single factor or particular information as all-important or controlling. In reaching the decision to approve the Agreements, the Board considered several factors, discussed below, to be key factors and reached the conclusions described below.
NATURE, QUALITY, AND EXTENT OF THE SERVICES
The Board considered that Dodge & Cox provides a wide range of services to the Funds in addition to portfolio management and that the quality of these services has been excellent in all respects. The extensive nature of services provided by Dodge & Cox has been documented in materials provided to the Board and in presentations made to the Board throughout the year. In particular, the Board considered the nature, quality, and extent of portfolio management, administrative, and shareholder services performed by Dodge & Cox. With regard to portfolio management services, the Board considered Dodge & Cox’s established long-term history of care and conscientiousness in the management of the Funds; its demonstrated consistency in investment approach and depth; the
DODGE & COX BALANCED FUND §PAGE 19
background and experience of the Dodge & Cox Investment Policy Committee, International Investment Policy Committee, Global Stock Investment Policy Committee, Fixed Income Investment Policy Committee, and Global Bond Investment Policy Committee, and research analysts responsible for managing the Funds; Dodge & Cox’s methods for assessing the regulatory and investment climate in various jurisdictions; its overall high level of attention to its core investment management function; and its commitment to the Funds and their shareholders. The Board also considered analysis provided by Morningstar regarding the degree of active management in the Dodge & Cox equity funds and concluded that Dodge & Cox is an active, high conviction manager of equity portfolios, not a “closet index” manager.
In the area of administrative and shareholder services, the Board considered the excellent quality of Dodge & Cox’s work in areas such as compliance, legal services, trading, proxy voting, technology, oversight of the Funds’ transfer agent and custodian, tax compliance, and shareholder communication through its website and other means. The Board also noted Dodge & Cox’s diligent disclosure policy, its favorable compliance record, and its reputation as a trusted, shareholder-friendly mutual fund family.
In addition, the Board considered that Dodge & Cox manages approximately $180 billion in Fund assets with fewer professionals than most comparable funds, and that on average these professionals have more experience and longer tenure than investment professionals at comparable funds. The Board also noted that Dodge & Cox is an investment research-oriented firm with no other business endeavors to distract management’s attention from its research efforts or to present material conflicts of interest with the operations of the Funds, that its investment professionals adhere to a consistent investment approach across the Funds, and that due to its careful and deliberate strategy with respect to new products, Dodge & Cox has had remarkable stability in its mutual fund product offerings over the course of the past 86 years and has the fewest funds of any of the 25 largest mutual fund families by assets. The Board further considered the favorable stewardship grades given by Morningstar to each of the Funds and the “Gold” analyst rating awarded by Morningstar to all of the Funds except the Global Bond Fund. The Board concluded that it was satisfied with the nature, extent, and quality of investment management and other services provided to the Funds by Dodge & Cox.
INVESTMENT PERFORMANCE
The Board considered short-term and long-term investment performance for each Fund (including periods of outperformance or underperformance) as compared to both relevant indices and the performance of such Fund’s peer group. The Board noted that, as of November 30, 2016, the Funds had strong absolute and relative year-to-date performance, and were also generally solid performers over longer periods. The Board determined after extensive review and inquiry that Dodge & Cox’s historic, long-term, team-oriented, bottom-up investment approach remains consistent and that Dodge & Cox continues to be distinguished by its integrity, transparency, and independence. The Board
considered that the performance of the Funds is the result of value-oriented investment management process that emphasizes a long-term investment horizon, comprehensive independent research, team approach, price discipline, low cost, and low portfolio turnover. The Board also considered that the investment performance delivered by Dodge & Cox to the Funds appeared to be consistent with the relevant performance delivered for other clients of Dodge & Cox. The Board concluded that Dodge & Cox has delivered favorable long-term performance for Fund investors consistent with the long-term investment strategies being pursued by the Funds.
COSTS AND ANCILLARY BENEFITS
Costs of Services to Funds: Fees and Expenses. The Board considered each Fund’s management fee rate and expense ratio relative to each Fund’s peer group and relative to management fees charged by Dodge & Cox to other clients. In particular, the Board considered that the Funds continue to be substantially below their peer group median in expense ratios and that many media and industry reports specifically comment on the low expense ratios of the Funds, which have been a defining characteristic of the Funds for many years. The Board also evaluated the operating structures of the Funds and Dodge & Cox, noting that the Funds do not charge front-end sales commissions or distribution fees, and Dodge & Cox bears, among other things, the significant cost of third party research, reimbursement for shareholder recordkeeping and administrative costs to third-party retirement plan administrators, and administrative and office overhead. The Board noted that expenses are well below industry averages.
When compared to peer group funds, the Funds are in the quartile with the lowest expense ratios. The Board also considered that the Funds receive numerous administrative, regulatory compliance, legal, technology, and shareholder support services from Dodge & Cox without any additional administrative fee and the fact that the Funds have relatively low transaction costs and portfolio turnover rates. The Board noted the Funds’ unusual single-share-class structure and reviewed Morningstar data (including asset-weighted average expense ratios) showing that the few peer group funds with lower expense ratios often have other share classes with significantly higher expense ratios. In this regard, the Board considered that many of the Funds’ shareholders would not be eligible to purchase comparably priced shares of many peer group funds, which typically make their lower-priced share classes available only to institutional investors. The Board determined that the Funds provide access for small investors to high quality investment management at a relatively low cost. The Board also considered that the Funds’ are priced to scale, i.e., management fee rates begin at relatively low levels with the result that, even without breakpoints, the Funds’ management fee rates are lower than those of many peer funds whose fee schedules include breakpoints. With respect to non-U.S. funds sponsored and managed by Dodge & Cox that are comparable to the Funds in many respects, the Board noted that the fee rates charged by Dodge & Cox are the same as or higher than the fee rates charged to the Funds.
PAGE 20 § DODGE & COX BALANCED FUND
The Board reviewed information regarding the fee rates Dodge & Cox charges to separate accounts that have investment programs similar to those of the Funds, including instances where separate account fees are lower than Fund fees. The Board considered the significant differences in the nature and scope of services Dodge & Cox provides to the Funds as compared to other client accounts, as well as material differences in regulatory, litigation, and other risks as between Dodge & Cox Funds and other types of clients. The Board noted that different markets exist for mutual fund and institutional separate account management services and that a comparison of Fund fee rates and separate account fee rates must consider the fact that separate account clients bear additional costs and responsibilities that are included in the cost of a Fund. The Board further noted that many sophisticated institutional investors in the Funds that are eligible to open separate accounts at Dodge & Cox have decided for various reasons to invest in the Funds. After consideration of these matters, the Board concluded that the overall costs incurred by the Funds for the services they receive (including the management fee paid to Dodge & Cox) are reasonable and that the fees are acceptable based upon the qualifications, experience, reputation, and performance of Dodge & Cox and the low overall expense ratios of the Funds.
Profitability and Costs of Services to Dodge & Cox; “Fall-out” Benefits. The Board reviewed reports of Dodge & Cox’s financial position, profitability, and estimated overall value and considered Dodge & Cox’s overall profitability within its context as a private, employee-owned S-Corporation and relative to the favorable services provided. The Board noted in particular that Dodge & Cox’s profits are not generated by high fee rates, but reflect an extraordinarily streamlined, efficient, and focused business approach toward investment management.
The Board recognized the importance of Dodge & Cox’s profitability—which is derived solely from management fees and does not include other business ventures—to maintain its independence, stability, company culture and ethics, and management continuity. The Board also considered that the compensation/profit structure at Dodge & Cox includes a return on shareholder employees’ investment in the firm, which is vital for remaining independent and facilitating retention of management and investment professionals. The Board considered independent research indicating that firms that grow organically, rather than through acquisition, tend to have better performance. Key to organic growth is the ability to retain talented and experienced analysts, portfolio managers, and other professionals. The Board also considered that in January 2015, Dodge & Cox closed the International Stock Fund to new investors to proactively manage the growth of the Fund. The Stock Fund and Balanced Fund were similarly closed to new investors during periods of significant growth in the past. While these actions are intended to benefit existing Fund shareholders, the effect is to reduce potential revenues to Dodge & Cox from new shareholders.
The Board also considered potential “fall-out” benefits (including the receipt of research from unaffiliated brokers and reputational benefits to non-U.S. funds sponsored and managed by Dodge & Cox) that Dodge & Cox might receive as a result of its
association with the Funds and determined that they are acceptable. The Board also noted that Dodge & Cox continues to invest substantial sums in its business in order to provide enhanced services, systems, and research capabilities, all of which benefit the Funds. The Board concluded that Dodge & Cox’s profitability is the keystone of its independence, stability, and long-term investment performance and that the profitability of Dodge & Cox’s relationship with the Funds (including fall-out benefits) is fair and reasonable.
ECONOMIES OF SCALE
The Board considered whether there have been economies of scale with respect to the management of each Fund, whether the Funds have appropriately benefited from any economies of scale, and whether the management fee rate is reasonable in relation to the level of Fund assets and any economies of scale that may exist. In the Board’s view, any consideration of economies of scale must take account of the Funds’ low fee structure and the considerable efficiencies of the Funds’ organization and fee structure that has been realized by shareholders from the time of each Fund’s inception (i.e., from the first dollar). An assessment of economies of scale must also take into account that Dodge & Cox invests significant time and resources in each new Fund for months (and sometimes years) prior to launch; in addition, expenses are capped, which means that Dodge & Cox subsidizes the operations of a new Fund for a period of time until it reaches scale. The Board observed that, while total Fund assets have grown significantly over the long term, this growth has not been continuous or evenly distributed across all of the Funds, as assets of certain Funds have actually declined over the past ten years.
In addition, the Board noted that Dodge & Cox has shared economies of scale by adding and enhancing services to the Funds over time, and that the internal costs of providing investment management, technology, administrative, legal, and compliance services to the Funds continue to increase. For example, Dodge & Cox has increased its global research staff and investment resources over the years to add important new capabilities for the benefit of Fund shareholders and to address the increased complexity of investing in multinational and non-U.S. companies. In addition, Dodge & Cox has made substantial expenditures in other staff, technology, cybersecurity, and infrastructure to enable it to integrate credit and equity analyses and to be able to implement its strategy in a more effective and secure manner. Over the last ten years, Dodge & Cox has increased its spending on research, investment management, client servicing, and technology including payments for third party research, data services, and computer systems for trading, operations, compliance, accounting, and communications at a rate that has significantly outpaced the Funds’ growth rate during the same period. The Board considered that Dodge & Cox has a history of voluntarily limiting asset growth in several Funds that experienced significant inflows by closing them to new investors in order to protect the Funds’ ability to achieve good investment returns for shareholders. The Board also observed that, even without fee breakpoints, the Funds are competitively priced in a
DODGE & COX BALANCED FUND §PAGE 21
very competitive market and that having a low fee from inception is better for shareholders than starting with a higher fee and adding breakpoints. The Board also noted that there may be certain diseconomies of scale associated with managing large funds, insofar as certain of the costs and risks associated with portfolio management increase as assets grow. The Board concluded that the current Dodge & Cox fee structure is fair and reasonable and adequately shares economies of scale that may exist.
CONCLUSION
Based on their evaluation of all material factors and assisted by the advice of independent legal counsel to the Independent Trustees, the Board, including the Independent Trustees, concluded that the advisory fee structure was fair and reasonable, that each Fund was paying a competitive fee for the services provided, that the scope and quality of Dodge & Cox’s services has provided substantial value for Fund shareholders over the long term, and that approval of the Agreements was in the best interests of each Fund and its shareholders.
FUND HOLDINGS
The Fund provides a complete list of its holdings four times each fiscal year, as of the end of each quarter. The Fund files the lists with the SEC on Form N-CSR (second and fourth quarters) and Form N-Q (first and third quarters). Shareholders may view the Fund’s Forms N-CSR and N-Q on the SEC’s website at sec.gov.
Forms N-CSR and N-Q may also be reviewed and copied at the SEC’s Public Reference Room in Washington, DC. Information regarding the operations of the Public Reference Room may be obtained by calling 202-551-8090 (direct) or 800-732-0330 (general SEC number). A list of the Fund’s quarter-end holdings is also available at dodgeandcox.com on or about 15 days following each quarter end and remains available on the website until the list is updated in the subsequent quarter.
PROXY VOTING
For a free copy of the Fund’s proxy voting policies and procedures, please call 800-621-3979, visit the Fund’s website at dodgeandcox.com, or visit the SEC’s website at sec.gov. Information regarding how the Fund voted proxies relating to portfolio securities during the most recent 12-month period ending June 30 is also available at dodgeandcox.com or at sec.gov.
HOUSEHOLD MAILINGS
The Fund routinely mails shareholder reports and summary prospectuses to shareholders and, on occasion, proxy statements. In order to reduce the volume of mail, when possible, only one copy of these documents will be sent to shareholders who are part of the same family and share the same residential address.
If you have a direct account with the Funds and you do not want the mailing of shareholder reports and summary prospectuses combined with other members in your household, contact the Funds at 800-621-3979. Your request will be implemented within 30 days.
PAGE 22 § DODGE & COX BALANCED FUND
DODGE & COX FUNDS—EXECUTIVE OFFICER & TRUSTEE INFORMATION
| | | | | | |
Name (Age) and
Address* | | Position with Trust (Year of Election or
Appointment) | | Principal Occupation During Past 5 Years | | Other Directorships Held by Trustees |
| INTERESTED TRUSTEES AND EXECUTIVE OFFICERS |
| Charles F. Pohl (58) | | Chairman and Trustee (Since 2004) | | Chairman (since 2013), Co-President (2011-2013), Senior Vice President (until 2011), and Director of Dodge & Cox; Chief Investment Officer, Portfolio Manager, Investment Analyst, and member of Investment Policy Committee (IPC), Global Stock Investment Policy Committee (GSIPC), International Investment Policy Committee (IIPC), and Fixed Income Investment Policy Committee (FIIPC) | | — |
| Dana M. Emery (55) | | President and Trustee (Trustee since 1993) (President since 2014) | | Chief Executive Officer (since 2013), President (since 2011), Executive Vice President (until 2011), and Director of Dodge & Cox; Director of Fixed Income, Portfolio Manager, and member of FIIPC and Global Bond Investment Policy Committee (GBIPC) | | — |
| Diana S. Strandberg (57) | | Senior Vice President (Since 2006) | | Senior Vice President (since 2011), Vice President (until 2011), and Director (since 2011) of Dodge & Cox; Director of International Equity, Portfolio Manager, Investment Analyst, and member of IPC, GSIPC, IIPC, and GBIPC | | — |
| David H. Longhurst (59) | | Treasurer (Since 2006) | | Vice President and Assistant Treasurer of Dodge & Cox | | — |
| Thomas M. Mistele (63) | | Secretary (Since 1998) | | Chief Operating Officer (until Jan. 2017), Director, Secretary, Senior Counsel (since 2011), and General Counsel (until 2011) of Dodge & Cox | | — |
| Katherine M. Primas (42) | | Chief Compliance Officer (Since 2010) | | Vice President (since 2011) and Chief Compliance Officer of Dodge & Cox | | — |
| INDEPENDENT TRUSTEES |
| Thomas A. Larsen (67) | | Trustee (Since 2002) | | Senior Counsel of Arnold & Porter Kaye Scholer LLP (law firm) (since 2013); Partner of Arnold & Porter LLP (until 2012); Director of Howard, Rice, Nemerovski, Canady, Falk & Rabkin (1977-2011) | | — |
| Ann Mather (56) | | Trustee (Since 2011) | | CFO, Pixar Animation Studios (1999-2004) | | Director, Google, Inc. (internet information services) (since 2005); Director, Glu Mobile, Inc. (multimedia software) (since 2004); Director, Netflix, Inc. (internet television) (since 2010); Director, Arista Networks (cloud networking) (since 2013); Director, Shutterfly, Inc. (internet photography services/publishing) (since 2013) |
| Robert B. Morris III (64) | | Trustee (Since 2011) | | Advisory Director, The Presidio Group (2005-2016); Partner and Managing Director—Global Investment Research at Goldman Sachs (until 2001) | | — |
| Gary Roughead (65) | | Trustee (Since 2013) | | Robert and Marion Oster Distinguished Military Fellow, Hoover Institution (since 2012); Admiral, United States Navy (Ret.); U.S. Navy Chief of Naval Operations (2008-2011) | | Director, Northrop Grumman Corp. (global security) (since 2012); Director, Maersk Line, Limited (shipping and transportation) (since 2016) |
| Mark E. Smith (65) | | Trustee (Since 2014) | | Executive Vice President, Managing Director—Fixed Income at Loomis Sayles & Company, L.P. (2003-2011) | | — |
| John B. Taylor (70) | | Trustee (Since 2005) (and 1995-2001) | | Professor of Economics, Stanford University (since 1984); Senior Fellow, Hoover Institution (since 1996); Under Secretary for International Affairs, United States Treasury (2001-2005) | | — |
| * | | The address for each Officer and Trustee is 555 California Street, 40th Floor, San Francisco, California 94104. Each Officer and Trustee oversees all six series in the Dodge & Cox Funds complex and serves for an indefinite term. |
Additional information about the Trust’s Trustees and Officers is available in the Trust’s Statement of Additional Information (SAI). You can get a free copy of the SAI by visiting the Funds’ website at dodgeandcox.com or calling
800-621-3979.
DODGE & COX BALANCED FUND §PAGE 23
dodgeandcox.com
For Fund literature, transactions, and account information, please visit the Funds’ website.
or write or call:
DODGE & COX FUNDS
c/o Boston Financial Data Services
P.O. Box 8422
Boston, Massachusetts 02266-8422
(800) 621-3979
INVESTMENT MANAGER
Dodge & Cox
555 California Street, 40th Floor
San Francisco, California 94104
(415) 981-1710
This report is submitted for the general information of the shareholders of the Fund. The report is not authorized for distribution to prospective investors in the Fund unless it is accompanied by a current prospectus.
This report reflects our views, opinions, and portfolio holdings as of December 31, 2016, the end of the reporting period. Any such views are subject to change at any time based upon market or other conditions and Dodge & Cox disclaims any responsibility to update such views. These views may not be relied on as investment advice and, because investment decisions for a Dodge & Cox Fund are based on numerous factors, may not be relied on as an indication of trading intent on behalf of any Dodge & Cox Fund.
DODGE & COX FUNDS®
Annual Report
December 31, 2016
Income Fund
ESTABLISHED 1989
TICKER: DODIX
12/16 IF AR Printed on recycled paper
TO OUR SHAREHOLDERS
The Dodge & Cox Income Fund had a total return of 5.6% for the year ended December 31, 2016, compared to a return of 2.6% for the Bloomberg Barclays U.S. Aggregate Bond Index (Bloomberg Barclays U.S. Agg).
MARKET COMMENTARY
2016 marked a year of surprises for global financial markets, with accompanying large valuation swings. In the first half of the year, longer-term interest rates fell by 70-80 basis points,(a) influenced by concerns about economic weakness in the Eurozone, slower growth in China, a continued decline in commodity prices, and questions about the durability of the U.S. economy. Mid-year, the unexpected Brexit vote introduced a new wave of uncertainty about the future economic and political landscape of the United Kingdom and the European Union. U.S. Treasury rates declined throughout this timeframe, leading to strong first half performance.
However, the downward trend in interest rates reversed early in the third quarter in light of better U.S. economic data (e.g., a strong labor market, healthy consumer spending measures, rising inflation) and guidance from Federal Reserve (Fed) policymakers that they may raise short-term interest rates sooner than expected. The surprise of the year came on November 8 with Donald Trump’s victory in the U.S. presidential election. U.S. interest rates surged amid shifting expectations regarding policies and regulation under the new Trump administration. President Trump and the Republican-controlled Congress are expected to increase fiscal spending while reducing and simplifying taxes, which could boost economic growth and potentially trigger higher inflation. As widely expected, the Fed increased short-term rates by 25 basis points in December, its first rate increase in 2016 and only its second since the financial crisis. Over the second half of the year, longer-term Treasury rates rose by 80-100 basis points, wiping out most of the first half’s gains and resulting in a modest 1.0% full-year return for the U.S. Treasury sector.
Investment-grade corporate bonds returned 6.1% for the year, outperforming comparable-duration(b) Treasuries by a remarkable 4.9 percentage points and registering the best relative return since 2012. Commodity- and energy-related issuers staged an impressive comeback after poor 2015 performance. Attractive relative yields and a solid fundamental credit backdrop provided a tailwind for the sector, which continued post-election given the likelihood of favorable Trump policies for corporations. Agency(c) mortgage-backed securities (MBS) returned 1.7% for the year, performing roughly in line with comparable-duration Treasuries amid higher interest rates and slower expected prepayment speeds.
INVESTMENT STRATEGY
We are pleased with the Fund’s strong performance in 2016 and with its longer-term results as well. Many of the biggest contributors to the Fund’s 2016 results were the primary detractors one year earlier. In our experience, the keys to successfully navigating periods of volatility come down to having a long-term investment lens through which to view risk and reward,
conviction in our in-house research effort (providing confidence to stay the course in out-of-favor investments or sectors), and a team-based approach (ensuring that each portfolio holding is viewed with appropriate amounts of skepticism, optimism, and humility). These characteristics provide the foundation for us to make informed investment decisions as we seek to build a portfolio with the potential to deliver strong returns over an investment cycle.
In response to changing valuation dynamics over the course of 2016, we made a number of adjustments to Fund positioning. Most notably, we have been selectively reducing exposure to corporate and other credit(d) holdings as the tremendous credit sector rally of 2016 has resulted in a somewhat less-favorable risk/reward dynamic today.
Credit: Tactically Reducing Exposure but Remaining Vigilant Toward New Opportunities
As of December 31, the Fund held 49%(e) in credit securities, the same weighting as in mid-2015. The intervening 18 months were quite volatile for credit valuations. As valuations sank in the second half of 2015 and into February of 2016, we responded opportunistically, increasing the Fund’s credit weighting to 57% by March 2016. We found interesting opportunities in three main areas. One was certain investment grade companies raising debt to finance strategic M&A transactions. The second was issuers in sectors experiencing heightened volatility where credit fundamentals were being undervalued (e.g., midstream and state-owned energy issuers, as well as commodity producers able to withstand a substantial downturn). And the third was subordinated debt of large banks. The Credit sector then recovered quickly, as yield premiums narrowed from 215 basis points in February to 123 basis points at year end. As this recovery took place, we began reducing the Fund’s credit weighting, ending 2016 at 49%.
Two companies whose bonds we purchased in the first category were Anheuser-Busch InBev (InBev) and Dell Inc.(f) In both cases, the companies used proceeds to fund large strategic acquisitions, and their pro-forma debt burdens increased. Despite the increased leverage, several key credit positives informed our view of their relative attractiveness. These included highly respected management teams, a strong strategic rationale for the transactions, attractive spread compensation, and most importantly for bondholders, a demonstrated history of deleveraging after completion of previous levered acquisitions. Both positions were additive to Fund returns for 2016 with the meaningful spread compression that took place.
As yield premiums(g) declined in the latter half of 2016, we selectively reduced the Fund’s credit weighting at these higher valuations, trimming or selling Fund holdings that had outperformed our expectations and had no obvious catalyst for further improvement. For example, we trimmed Allergan in the first quarter given strong price performance, balanced against uncertainty about the closing of the company’s proposed merger with Pfizer. We also sold InBev in the third quarter following strong
PAGE 2 § DODGE & COX INCOME FUND
performance, and saw the maturity/redemption of several longstanding holdings, including Sprint and Centene (HealthNet). All told, we trimmed, sold, or matured over 20 credits throughout the year.
That said, we continued to find idiosyncratic opportunities in the more compressed spread environment later in the year. An example of this is Ultrapar Participacoes, a Brazilian fuel distributor whose bonds we purchased at the end of the third quarter. Ultrapar’s market-leading position, high quality assets, strong management team, and conservatively capitalized balance sheet were attractive to us in the context of the nearly 400 basis-point spread offered on its newly-issued 10-year USD bonds. Our firm’s substantial knowledge of this company, the result of its having previously been a position in the Dodge & Cox International Stock Fund for nearly a decade, facilitated our ability to comprehensively research its creditworthiness in a constrained period of time.
Even at today’s more compressed spread levels, we believe credit offers attractive value on a long-term basis. We recognize that certain activities of corporate issuers might be considered “late-cycle” behavior, including elevated M&A activity and increasing emphasis on shareholder returns, which has triggered a gradual increase in corporate leverage. However, we do not see significant cause for concern: interest coverage is robust, debt maturities are manageable overall, and banks are well capitalized and liquid. We remain vigilant in our research efforts of signs of potential fundamental credit degradation among the Fund’s holdings, and will continue, as always, to consider each holding in the context of fundamentals and relative valuation to ensure that its presence and size in the Fund’s portfolio is justified.
With respect to our corporate sector outlook under the new Trump administration, potential policies involving corporate tax reform, infrastructure spending, and regulation rollbacks are likely to be business friendly. However, other areas such as trade and foreign policy may have more mixed results, particularly related to certain industries. Our rigorous research process, canvassing the universe of alternatives for strong credits that we deem to be “survivors” over a wide range of outcomes, helps to mitigate the risks associated with credit investing.
The Fund’s MBS: A Source of Consistency, Liquidity, and Incremental Yield
We made no major shifts to the Fund’s holdings within the Securitized sector. The Fund’s MBS weighting ranged between 32% and 34% during the year, and we made small adjustments to the underlying target mix of holdings as valuations changed (e.g., trimming 15-20 year MBS in favor of 30-year MBS, emphasizing attractively-priced hybrid ARMs). The Fund’s MBS performed well in 2016 relative to shorter-duration Treasuries (our yardstick for relative value/returns). They also continued to fulfill their important role in anchoring portfolio liquidity and quality. Given the low absolute level of mortgage rates, prepayments remain quite subdued compared to historical precedents. In fact, the prepayment landscape in general is much less responsive than in years past. Numerous factors have influenced this new prepayment dynamic,
including tighter lending standards, significantly higher costs of refinancing, reduced demand for mortgage servicing rights by banks (which reduces competition), and substantial changes to the regulatory landscape. These factors result in a supportive environment for assuming well-considered prepayment risk, which we do through our research and security selection. We also held roughly 3% in AAA-rated ABS at the beginning of 2016 (composed of prime credit card and auto ABS, as well as private student loan ABS), which we reduced to 1% in the first quarter in favor of MBS for relative value reasons.
Duration Positioning: Remaining Defensive
At the outset of 2016, we had positioned the Fund’s duration quite defensively given the disconnect between our rate expectations (in light of economic growth, inflation, and the pace of Fed interest rate hikes) and those implied by then-current rates. Starting in the third quarter, and accelerating in the fourth quarter following Mr. Trump’s victory, rates moved considerably higher. This move narrowed the gap between our expectations of fair value for rates and the market’s. With generally higher rates, a reduced gap between our outlook and market expectations, and the higher cost of being short (with a steeper yield curve), we lengthened Fund duration by 2/10ths of a year post-election by reducing the Fund’s Treasury futures short position.
We continue to believe that rates are likely to rise more than market expectations. The economic policies likely to be pursued by the Trump administration and the Republican-controlled Congress offer the prospect of accelerated growth and the potential for higher inflation, combined with the likelihood that the Fed will raise interest rates more quickly than forecasted.
IN CLOSING
While we are very pleased with the Fund’s 2016 results, we encourage shareholders to temper near-term total return expectations for bonds. The fourth quarter of 2016, in which the broad bond market was down 3%, illustrates the potential for low, and even negative, returns from bonds over shorter time periods in this low-yield environment. In addition, 2016’s unique environment produced strong returns from credit securities despite low available starting yields, which is unlikely to be repeated in the near future. The general level of credit spreads is 40% lower than in February 2016 and close to long-term averages.
Notwithstanding somewhat challenged absolute return prospects in the near term, bonds serve a vital defensive role in a diversified portfolio by offering liquidity, income generation, downside protection, and low correlation to riskier asset classes. We continue to position the Fund defensively from a capital preservation standpoint, while continuing to seek opportunities to build portfolio yield through our bottom-up, research-driven investment approach.
DODGE & COX INCOME FUND §PAGE 3
We thank you for your confidence in Dodge & Cox. As always, we welcome your questions and comments.
For the Board of Trustees,
| | |
| |
|
Charles F. Pohl, Chairman | | Dana M. Emery, President |
January 31, 2017
| (a) | | One basis point is equal to 1/100th of 1%. |
| (b) | | Duration is a measure of a bond’s (or a bond portfolio’s) price sensitivity to changes in interest rates. |
| (c) | | The U.S. Government does not guarantee the Fund’s shares, yield, or net asset value. The agency guarantee (by, for example, Ginnie Mae, Fannie Mae, or Freddie Mac) does not eliminate market risk. |
| (d) | | Credit securities refers to corporate bonds and government-related securities, as classified by Bloomberg. |
| (e) | | Unless otherwise specified, all weightings and characteristics are as of December 31, 2016. |
| (f) | | The use of specific examples does not imply that they are more attractive investments than the Fund’s other holdings. |
| (g) | | Yield premiums are one way to measure a security’s valuation. Narrowing yield premiums results in a higher valuation. Widening yield premiums results in a lower valuation. |
ANNUAL PERFORMANCE REVIEW
The Fund outperformed the Bloomberg Barclays U.S. Agg by 3.0 percentage points in 2016.
Key Contributors to Relative Results
| | § | | Credit security selection was strongly positive as several commodity-related holdings performed well, including Kinder Morgan, Pemex, Petrobras, Rio Oil Finance Trust, and Teck Resources. Other notable outperformers included Cemex, Navient, and Time Warner, Inc. | |
| | § | | The Fund’s overweight to the Industrial sub-sector and underweight to U.S. Treasuries added to relative returns. | |
| | § | | The Fund’s shorter relative duration (70% of the Bloomberg Barclays U.S. Agg’s duration) added to relative returns. | |
| | § | | The Fund’s nominal yield advantage benefited returns. | |
Key Detractors from Relative Results
| | § | | The Fund’s lower exposure to long-term (10+ years) bonds, which outperformed short and intermediate maturities, detracted modestly from relative returns. | |
| | | | Unless otherwise noted, figures cited in this section denote Fund positioning at the beginning of the period. | |
KEY CHARACTERISTICS OF DODGE & COX
Independent Organization
Dodge & Cox is one of the largest privately owned investment managers in the world. We remain committed to independence, with a goal of providing the highest quality investment management service to our existing clients.
Over 85 Years of Investment Experience
Dodge & Cox was founded in 1930. We have a stable and well-qualified team of investment professionals, most of whom have spent their entire careers at Dodge & Cox.
Experienced Investment Team
The Fixed Income Investment Policy Committee, which is the decision-making body for the Income Fund, is an eight-member committee with an average tenure at Dodge & Cox of 21 years.
One Business with a Single Research Office
Dodge & Cox manages equity (domestic, international, and global), fixed income (domestic and global), and balanced investments, operating from one office in San Francisco.
Consistent Investment Approach
Our team decision-making process involves thorough, bottom-up fundamental analysis of each investment.
Long-Term Focus and Low Expenses
We invest with a three- to five-year investment horizon, which has historically resulted in low turnover relative to our peers. We manage Funds that maintain low expense ratios.
Risks: The Fund invests in individual bonds whose yields and market values fluctuate, so that an investment may be worth more or less than its original cost. Debt securities are subject to interest rate risk, credit risk, and prepayment and call risk, all of which could have adverse effects on the value of the Fund. A low interest rate environment creates an elevated risk of future negative returns. Financial intermediaries may restrict their market making activities for certain debt securities, which may reduce the liquidity and increase the volatility of such securities. Please read the prospectus and summary prospectus for specific details regarding the Fund’s risk profile.
PAGE 4 § DODGE & COX INCOME FUND
GROWTH OF $10,000 OVER 10 YEARS
FOR AN INVESTMENT MADE ON DECEMBER 31, 2006
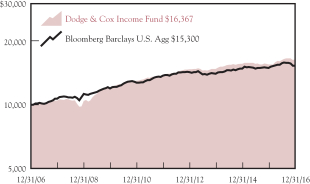
AVERAGE ANNUAL TOTAL RETURN
FOR PERIODS ENDED DECEMBER 31, 2016
| | | | | | | | | | | | | | | | |
| | | 1 Year | | | 5 Years | | | 10 Years | | | 20 Years | |
| | | | | | | | | | | | | | | | |
Dodge & Cox Income Fund | | | 5.62 | % | | | 3.77 | % | | | 5.05 | % | | | 5.78 | % |
Bloomberg Barclays U.S. Aggregate Bond Index (Bloomberg Barclays U.S. Agg) | | | 2.65 | | | | 2.23 | | | | 4.34 | | | | 5.29 | |
Returns represent past performance and do not guarantee future results. Investment return and share price will fluctuate with market conditions, and investors may have a gain or loss when shares are sold. Fund performance changes over time and currently may be significantly lower than stated. Performance is updated and published monthly. Visit the Fund’s website at dodgeandcox.com or call 800-621-3979 for current performance figures.
The Fund’s total returns include the reinvestment of dividend and capital gain distributions, but have not been adjusted for any income taxes payable by shareholders on these distributions or on Fund share redemptions. Index returns include interest income but, unlike Fund returns, do not reflect fees or expenses. The Bloomberg Barclays U.S. Aggregate Bond Index (Bloomberg Barclays U.S. Agg) is a widely recognized, unmanaged index of U.S. dollar-denominated, investment-grade, taxable debt securities.
Bloomberg is a registered trademark of Bloomberg Finance L.P. and its affiliates. Barclays® is a trademark of Barclays Bank PLC.
FUND EXPENSE EXAMPLE
As a Fund shareholder, you incur ongoing Fund costs, including management fees and other Fund expenses. All mutual funds have ongoing costs, sometimes referred to as operating expenses. The following example shows ongoing costs of investing in the Fund and can help you understand these costs and compare them with those of other mutual funds. The example assumes a $1,000 investment held for the six months indicated.
ACTUAL EXPENSES
The first line of the table below provides information about actual account values and expenses based on the Fund’s actual returns. You may use the information in this line, together with your account balance, to estimate the expenses that you paid over the period. Simply divide your account value by $1,000 (for example, an $8,600 account value divided by $1,000 = 8.6), then multiply the result by the number in the first line under the heading “Expenses Paid During Period” to estimate the expenses you paid on your account during this period.
HYPOTHETICAL EXAMPLE FOR COMPARISON WITH OTHER MUTUAL FUNDS
Information on the second line of the table can help you compare ongoing costs of investing in the Fund with those of other mutual funds. This information may not be used to estimate the actual ending account balance or expenses you paid during the period. The hypothetical “Ending Account Value” is based on the actual expense ratio of the Fund and an assumed 5% annual rate of return before expenses (not the Fund’s actual return). The amount under the heading “Expenses Paid During Period” shows the hypothetical expenses your account would have incurred under this scenario. You can compare this figure with the 5% hypothetical examples that appear in shareholder reports of other mutual funds.
| | | | | | | | | | | | |
Six Months Ended December 31, 2016 | | Beginning Account Value
7/1/2016 | | | Ending Account Value
12/31/2016 | | | Expenses Paid
During Period* | |
Based on Actual Fund Return | | $ | 1,000.00 | | | $ | 1,005.20 | | | $ | 2.14 | |
Based on Hypothetical 5% Yearly Return | | | 1,000.00 | | | | 1,023.00 | | | | 2.16 | |
| * | | Expenses are equal to the Fund’s annualized expense ratio of 0.42%, multiplied by the average account value over the period, multiplied by 184/366 (to reflect the one-half year period). |
The expenses shown in the table highlight ongoing costs only and do not reflect any transactional fees or account maintenance fees. Though other mutual funds may charge such fees, please note that the Fund does not charge transaction fees (e.g., redemption fees, sales loads) or universal account maintenance fees (e.g., small account fees).
DODGE & COX INCOME FUND §PAGE 5
| | | | |
| FUND INFORMATION (unaudited) | | | December 31, 2016 | |
| | | | |
| GENERAL INFORMATION | | | |
Net Asset Value Per Share | | | $13.59 | |
Total Net Assets (billions) | | | $46.6 | |
Expense Ratio | | | 0.43% | |
Portfolio Turnover Rate | | | 27% | |
30-Day SEC Yield(a) | | | 2.79% | |
Number of Credit Issuers | | | 56 | |
Fund Inception | | | 1989 | |
No sales charges or distribution fees | | | | |
Investment Manager: Dodge & Cox, San Francisco. Managed by the Fixed Income Investment Policy Committee, whose eight members’ average tenure at Dodge & Cox is 21 years.
| | | | | | | | |
| PORTFOLIO CHARACTERISTICS | | Fund | | | BBG Barclays
U.S. Agg | |
Effective Duration (years) | | | 4.2 | | | | 5.9 | |
| | | | |
| FIVE LARGEST CREDIT ISSUERS (%)(b) | | Fund | |
Charter Communications, Inc. | | | 2.0 | |
Verizon Communications, Inc. | | | 1.9 | |
Petroleos Mexicanos | | | 1.9 | |
State of California GO | | | 1.8 | |
Rio Oil Finance Trust | | | 1.8 | |
| | | | | | | | |
| CREDIT QUALITY (%)(c) | | Fund | | | BBG Barclays
U.S. Agg | |
U.S. Treasury/Agency/GSE(d) | | | 46.7 | | | | 67.3 | |
Aaa | | | 1.4 | | | | 4.2 | |
Aa | | | 3.9 | | | | 4.0 | |
A | | | 3.4 | | | | 10.9 | |
Baa | | | 32.4 | | | | 13.6 | |
Ba | | | 5.5 | | | | 0.0 | |
B | | | 1.9 | | | | 0.0 | |
Caa | | | 1.8 | | | | 0.0 | |
Net Cash & Other(e) | | | 3.0 | | | | 0.0 | |
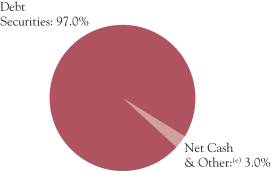
| | | | | | | | |
| SECTOR DIVERSIFICATION (%) | | Fund | | | BBG Barclays
U.S. Agg | |
U.S. Treasury(d) | | | 14.4 | | | | 36.2 | |
Government-Related | | | 6.9 | | | | 7.7 | |
Mortgage-Related(f) | | | 32.1 | | | | 28.1 | |
Corporate | | | 40.3 | | | | 25.8 | |
Asset-Backed/Commercial Mortgage-Backed | | | 3.3 | | | | 2.2 | |
Net Cash & Other(e) | | | 3.0 | | | | 0.0 | |
| | | | | | | | |
| MATURITY DIVERSIFICATION (%)(d) | | Fund | | | BBG Barclays
U.S. Agg | |
0-1 Years to Maturity | | | 4.0 | | | | 0.0 | |
1-5 | | | 47.0 | | | | 40.8 | |
5-10 | | | 29.1 | | | | 43.9 | |
10-15 | | | 2.8 | | | | 1.6 | |
15-20 | | | 4.7 | | | | 1.9 | |
20-25 | | | 6.6 | | | | 3.9 | |
25 and Over | | | 5.8 | | | | 7.9 | |
| (a) | SEC Yield is an annualization of the Fund’s net investment income for the trailing 30-day period. Dividends paid by the Fund may be higher or lower than implied by the SEC Yield. |
| (b) | The Fund’s portfolio holdings are subject to change without notice. The mention of specific securities is not a recommendation to buy, sell, or hold any particular security and is not indicative of Dodge & Cox’s current or future trading activity. |
| (c) | The credit quality distributions shown for the Fund and the Index are based on the middle of Moody’s, S&P’s, and Fitch ratings, which is the methodology used by Bloomberg in constructing its indices. If a security is rated by only two agencies, the lower of the two ratings is used. Please note the Fund applies the highest of Moody’s, S&P’s, and Fitch ratings to determine compliance with the quality requirements stated in its prospectus. On that basis, the Fund held 4.8% in securities rated below investment grade. The credit quality of the investments in the portfolio does not apply to the stability or safety of the Fund or its shares. |
| (d) | Data as presented excludes the Fund’s position in Treasury futures contracts. |
| (e) | Net Cash & Other includes cash, short-term investments, receivables, and payables. |
| (f) | The Fund holds 0.2% in Agency multifamily mortgage securities; the Index classifies these securities under CMBS – Agency. |
PAGE 6 § DODGE & COX INCOME FUND
| | | | |
| PORTFOLIO OF INVESTMENTS | | | December 31, 2016 | |
| | | | | | | | |
| DEBT SECURITIES: 97.0% | | | | | | |
| | |
| | | PAR VALUE | | | VALUE | |
| U.S. TREASURY: 14.4% | | | | | | | | |
U.S. Treasury Note/Bond | | | | | | | | |
1.00%, 12/31/17 | | $ | 175,000,000 | | | $ | 175,127,575 | |
0.875%, 1/15/18 | | | 600,000,000 | | | | 599,684,400 | |
0.75%, 2/28/18 | | | 500,000,000 | | | | 498,789,000 | |
0.625%, 6/30/18 | | | 250,000,000 | | | | 248,397,000 | |
0.75%, 7/31/18 | | | 500,000,000 | | | | 497,255,000 | |
1.50%, 8/31/18 | | | 250,000,000 | | | | 251,526,250 | |
0.75%, 8/31/18 | | | 350,000,000 | | | | 347,785,900 | |
0.875%, 10/15/18 | | | 300,000,000 | | | | 298,493,100 | |
1.50%, 2/28/19 | | | 496,995,000 | | | | 499,579,871 | |
0.875%, 4/15/19 | | | 350,000,000 | | | | 346,750,950 | |
1.625%, 7/31/19 | | | 600,000,000 | | | | 603,961,800 | |
0.75%, 8/15/19 | | | 350,000,000 | | | | 344,474,550 | |
0.875%, 9/15/19 | | | 600,000,000 | | | | 591,894,000 | |
1.625%, 12/31/19 | | | 500,000,000 | | | | 502,196,000 | |
1.50%, 5/31/20 | | | 250,000,000 | | | | 249,077,750 | |
1.375%, 5/31/21 | | | 450,000,000 | | | | 440,651,700 | |
1.125%, 7/31/21 | | | 250,000,000 | | | | 241,431,250 | |
| | | | | | | | |
| | | | | | | 6,737,076,096 | |
| GOVERNMENT-RELATED: 6.9% | | | | | |
FEDERAL AGENCY: 0.2% | | | | | | | | |
Small Business Admin. — 504 Program | | | | | |
Series 1997-20E 1, 7.30%, 5/1/17 | | | 8,414 | | | | 8,515 | |
Series 1997-20H 1, 6.80%, 8/1/17 | | | 3,652 | | | | 3,710 | |
Series 1997-20J 1, 6.55%, 10/1/17 | | | 52,272 | | | | 53,124 | |
Series 1997-20L 1, 6.55%, 12/1/17 | | | 2,264 | | | | 2,304 | |
Series 1998-20B 1, 6.15%, 2/1/18 | | | 5,607 | | | | 5,703 | |
Series 1998-20C 1, 6.35%, 3/1/18 | | | 209,976 | | | | 213,671 | |
Series 1998-20H 1, 6.15%, 8/1/18 | | | 125,953 | | | | 128,156 | |
Series 1998-20L 1, 5.80%, 12/1/18 | | | 72,304 | | | | 73,393 | |
Series 1999-20C 1, 6.30%, 3/1/19 | | | 77,938 | | | | 79,861 | |
Series 1999-20E 1, 6.30%, 5/1/19 | | | 2,150 | | | | 2,205 | |
Series 1999-20G 1, 7.00%, 7/1/19 | | | 152,207 | | | | 156,639 | |
Series 1999-20I 1, 7.30%, 9/1/19 | | | 80,023 | | | | 83,900 | |
Series 2000-20C 1, 7.625%, 3/1/20 | | | 4,290 | | | | 4,479 | |
Series 2000-20G 1, 7.39%, 7/1/20 | | | 3,056 | | | | 3,180 | |
Series 2001-20G 1, 6.625%, 7/1/21 | | | 707,017 | | | | 751,956 | |
Series 2001-20L 1, 5.78%, 12/1/21 | | | 1,762,613 | | | | 1,860,439 | |
Series 2002-20A 1, 6.14%, 1/1/22 | | | 15,595 | | | | 16,578 | |
Series 2002-20L 1, 5.10%, 12/1/22 | | | 554,624 | | | | 586,680 | |
Series 2003-20G 1, 4.35%, 7/1/23 | | | 41,977 | | | | 43,692 | |
Series 2004-20L 1, 4.87%, 12/1/24 | | | 882,061 | | | | 930,991 | |
Series 2005-20B 1, 4.625%, 2/1/25 | | | 1,811,648 | | | | 1,908,992 | |
Series 2005-20D 1, 5.11%, 4/1/25 | | | 70,731 | | | | 75,683 | |
Series 2005-20E 1, 4.84%, 5/1/25 | | | 2,814,307 | | | | 2,978,167 | |
Series 2005-20G 1, 4.75%, 7/1/25 | | | 2,921,338 | | | | 3,090,555 | |
Series 2005-20H 1, 5.11%, 8/1/25 | | | 35,074 | | | | 37,414 | |
Series 2005-20I 1, 4.76%, 9/1/25 | | | 3,344,153 | | | | 3,542,756 | |
Series 2006-20A 1, 5.21%, 1/1/26 | | | 3,502,462 | | | | 3,731,407 | |
Series 2006-20B 1, 5.35%, 2/1/26 | | | 979,463 | | | | 1,050,925 | |
Series 2006-20C 1, 5.57%, 3/1/26 | | | 4,814,055 | | | | 5,198,497 | |
Series 2006-20G 1, 6.07%, 7/1/26 | | | 9,110,159 | | | | 10,051,468 | |
Series 2006-20H 1, 5.70%, 8/1/26 | | | 76,474 | | | | 83,608 | |
Series 2006-20I 1, 5.54%, 9/1/26 | | | 145,332 | | | | 157,278 | |
Series 2006-20J 1, 5.37%, 10/1/26 | | | 3,106,782 | | | | 3,350,330 | |
Series 2006-20L 1, 5.12%, 12/1/26 | | | 2,636,153 | | | | 2,813,812 | |
Series 2007-20A 1, 5.32%, 1/1/27 | | | 6,664,082 | | | | 7,134,626 | |
Series 2007-20C 1, 5.23%, 3/1/27 | | | 10,429,464 | | | | 11,284,956 | |
Series 2007-20D 1, 5.32%, 4/1/27 | | | 9,840,520 | | | | 10,606,111 | |
Series 2007-20G 1, 5.82%, 7/1/27 | | | 7,617,322 | | | | 8,393,434 | |
| | | | | | | | |
| | | | | | | 80,499,195 | |
FOREIGN AGENCY: 2.3% | | | | | | | | |
Petroleo Brasileiro SA (Brazil) | | | | | | | | |
5.75%, 1/20/20 | | | 43,955,000 | | | | 44,504,437 | |
5.375%, 1/27/21 | | | 118,335,000 | | | | 115,731,630 | |
| | | | | | | | |
| | |
| | | PAR VALUE | | | VALUE | |
4.375%, 5/20/23 | | $ | 38,625,000 | | | $ | 33,746,662 | |
6.25%, 3/17/24 | | | 31,505,000 | | | | 30,219,596 | |
Petroleos Mexicanos (Mexico) | | | | | | | | |
4.875%, 1/18/24 | | | 123,065,000 | | | | 119,325,055 | |
4.25%, 1/15/25 | | | 97,765,000 | | | | 89,885,141 | |
4.50%, 1/23/26 | | | 15,065,000 | | | | 13,724,215 | |
6.875%, 8/4/26(b) | | | 63,400,000 | | | | 66,887,000 | |
6.50%, 3/13/27(b) | | | 104,765,000 | | | | 108,065,097 | |
6.625%, 6/15/35 | | | 112,290,000 | | | | 110,605,650 | |
5.50%, 6/27/44 | | | 16,603,000 | | | | 13,817,017 | |
6.375%, 1/23/45 | | | 166,156,000 | | | | 151,201,960 | |
5.625%, 1/23/46 | | | 190,720,000 | | | | 158,297,600 | |
6.75%, 9/21/47(b) | | | 33,161,000 | | | | 31,330,513 | |
| | | | | | | | |
| | | | | | | 1,087,341,573 | |
LOCAL AUTHORITY: 4.3% | | | | | | | | |
L.A. Unified School District GO | | | | | | | | |
5.75%, 7/1/34 | | | 6,075,000 | | | | 7,502,746 | |
6.758%, 7/1/34 | | | 185,585,000 | | | | 249,055,070 | |
New Jersey Turnpike Authority RB | | | | | | | | |
7.414%, 1/1/40 | | | 41,065,000 | | | | 59,305,662 | |
7.102%, 1/1/41 | | | 148,277,000 | | | | 207,461,765 | |
New Valley Generation
4.929%, 1/15/21 | | | 294,665 | | | | 315,420 | |
State of California GO | | | | | | | | |
7.50%, 4/1/34 | | | 194,406,000 | | | | 274,792,881 | |
7.55%, 4/1/39 | | | 164,895,000 | | | | 243,986,887 | |
7.30%, 10/1/39 | | | 116,735,000 | | | | 165,212,711 | |
7.625%, 3/1/40 | | | 103,410,000 | | | | 152,997,163 | |
7.60%, 11/1/40 | | | 16,760,000 | | | | 25,245,253 | |
State of Illinois GO | | | | | | | | |
5.365%, 3/1/17 | | | 211,845,000 | | | | 213,105,478 | |
5.665%, 3/1/18 | | | 179,570,000 | | | | 185,808,262 | |
5.877%, 3/1/19 | | | 20,350,000 | | | | 21,573,238 | |
5.10%, 6/1/33 | | | 211,850,000 | | | | 187,237,267 | |
| | | | | | | | |
| | | | | | | 1,993,599,803 | |
SOVEREIGN: 0.1% | | | | | | | | |
Spain Government International (Spain)
4.00%, 3/6/18(b) | | | 55,790,000 | | | | 56,926,554 | |
| | | | | | | | |
| | | | | | | 3,218,367,125 | |
| MORTGAGE-RELATED: 32.1% | |
FEDERAL AGENCY CMO & REMIC: 2.5% | |
Dept. of Veterans Affairs | | | | | | | | |
Series 1995-2D 4A, 9.293%, 5/15/25 | | | 126,238 | | | | 150,574 | |
Series 1997-2 Z, 7.50%, 6/15/27 | | | 8,475,792 | | | | 9,466,864 | |
Series 1998-2 2A, 8.654%, 8/15/27 | | | 33,246 | | | | 38,502 | |
Series 1998-1 1A, 8.194%, 3/15/28 | | | 195,161 | | | | 223,160 | |
Fannie Mae | | | | | | | | |
Trust 1998-58 PX, 6.50%, 9/25/28 | | | 346,093 | | | | 391,169 | |
Trust 1998-58 PC, 6.50%, 10/25/28 | | | 1,767,969 | | | | 1,951,312 | |
Trust 2001-69 PQ, 6.00%, 12/25/31 | | | 2,190,745 | | | | 2,437,787 | |
Trust 2002-33 A1, 7.00%, 6/25/32 | | | 2,240,982 | | | | 2,487,167 | |
Trust 2002-69 Z, 5.50%, 10/25/32 | | | 266,284 | | | | 297,468 | |
Trust 2008-24 GD, 6.50%, 3/25/37 | | | 1,680,148 | | | | 1,859,560 | |
Trust 2007-47 PE, 5.00%, 5/25/37 | | | 4,423,106 | | | | 4,742,366 | |
Trust 2009-30 AG, 6.50%, 5/25/39 | | | 10,952,672 | | | | 11,907,396 | |
Trust 2009-53 QM, 5.50%, 5/25/39 | | | 2,313,046 | | | | 2,477,568 | |
Trust 2009-40 TB, 6.00%, 6/25/39 | | | 4,714,850 | | | | 5,228,016 | |
Trust 2001-T3 A1, 7.50%, 11/25/40 | | | 121,422 | | | | 142,869 | |
Trust 2010-123 WT, 7.00%, 11/25/40 | | | 41,671,436 | | | | 48,301,128 | |
Trust 2001-T7 A1, 7.50%, 2/25/41 | | | 74,880 | | | | 89,204 | |
Trust 2001-T5 A2, 6.985%, 6/19/41 | | | 46,566 | | | | 52,097 | |
Trust 2001-T5 A3, 7.50%, 6/19/41 | | | 233,485 | | | | 277,433 | |
Trust 2001-T4 A1, 7.50%, 7/25/41 | | | 2,081,714 | | | | 2,406,648 | |
Trust 2011-58 AT, 4.00%, 7/25/41 | | | 10,432,802 | | | | 11,092,657 | |
Trust 2001-T10 A1, 7.00%, 12/25/41 | | | 2,427,744 | | | | 2,760,063 | |
| | |
| See accompanying Notes to Financial Statements | | DODGE & COX INCOME FUND §PAGE 7 |
| | | | |
| PORTFOLIO OF INVESTMENTS | | | December 31, 2016 | |
| | | | | | | | |
| DEBT SECURITIES (continued) | | | | | | |
| | |
| | | PAR VALUE | | | VALUE | |
Trust 2013-106 MA, 4.00%, 2/25/42 | | $ | 21,886,111 | | | $ | 22,984,702 | |
Trust 2002-90 A1, 6.50%, 6/25/42 | | | 4,816,048 | | | | 5,608,458 | |
Trust 2002-W6 2A1, 6.135%, 6/25/42 | | | 2,781,772 | | | | 3,166,354 | |
Trust 2002-W8 A2, 7.00%, 6/25/42 | | | 1,635,170 | | | | 1,850,055 | |
Trust 2002-T16 A3, 7.50%, 7/25/42 | | | 3,609,828 | | | | 4,154,083 | |
Trust 2003-W2 1A2, 7.00%, 7/25/42 | | | 7,557,793 | | | | 8,696,107 | |
Trust 2003-W4 3A, 6.241%, 10/25/42 | | | 2,254,898 | | | | 2,524,960 | |
Trust 2012-121 NB, 7.00%, 11/25/42 | | | 1,350,726 | | | | 1,546,898 | |
Trust 2003-7 A1, 6.50%, 12/25/42 | | | 3,941,788 | | | | 4,500,092 | |
Trust 2003-W1 2A, 6.211%, 12/25/42 | | | 2,905,965 | | | | 3,251,005 | |
Trust 2012-133 HF, 1.106%, 12/25/42 | | | 44,573,417 | | | | 44,193,023 | |
Trust 2012-134 FD, 1.106%, 12/25/42 | | | 1,208,371 | | | | 1,196,136 | |
Trust 2012-134 FT, 1.106%, 12/25/42 | | | 61,193,534 | | | | 60,561,172 | |
Trust 2013-98 FA, 1.306%, 9/25/43 | | | 43,226,218 | | | | 43,745,343 | |
Trust 2013-101 CF, 1.356%, 10/25/43 | | | 22,465,805 | | | | 22,665,862 | |
Trust 2013-101 FE, 1.356%, 10/25/43 | | | 35,712,253 | | | | 36,056,555 | |
Trust 2004-T1 1A2, 6.50%, 1/25/44 | | | 2,423,099 | | | | 2,799,386 | |
Trust 2004-W2 2A2, 7.00%, 2/25/44 | | | 120,546 | | | | 139,135 | |
Trust 2004-W2 5A, 7.50%, 3/25/44 | | | 5,496,416 | | | | 6,221,720 | |
Trust 2004-W8 3A, 7.50%, 6/25/44 | | | 3,979,104 | | | | 4,647,505 | |
Trust 2004-W14 1AF, 1.156%, 7/25/44 | | | 1,671,154 | | | | 1,609,691 | |
Trust 2004-W15 1A2, 6.50%, 8/25/44 | | | 896,902 | | | | 1,026,015 | |
Trust 2005-W1 1A3, 7.00%, 10/25/44 | | | 6,783,981 | | | | 7,934,646 | |
Trust 2001-79 BA, 7.00%, 3/25/45 | | | 750,004 | | | | 872,624 | |
Trust 2006-W1 1A1, 6.50%, 12/25/45 | | | 460,221 | | | | 515,022 | |
Trust 2006-W1 1A2, 7.00%, 12/25/45 | | | 3,226,606 | | | | 3,703,710 | |
Trust 2006-W1 1A3, 7.50%, 12/25/45 | | | 56,689 | | | | 65,046 | |
Trust 2006-W1 1A4, 8.00%, 12/25/45 | | | 3,913,933 | | | | 4,631,432 | |
Trust 2007-W10 1A, 6.30%, 8/25/47 | | | 14,008,293 | | | | 15,549,489 | |
Trust 2007-W10 2A, 6.349%, 8/25/47 | | | 4,131,876 | | | | 4,578,772 | |
Freddie Mac | | | | | | | | |
Series 2456 CJ, 6.50%, 6/15/32 | | | 201,470 | | | | 228,416 | |
Series 3312 AB, 6.50%, 6/15/32 | | | 3,592,056 | | | | 4,001,979 | |
Series T-41 2A, 5.611%, 7/25/32 | | | 269,747 | | | | 294,328 | |
Series 2587 ZU, 5.50%, 3/15/33 | | | 5,328,077 | | | | 5,921,812 | |
Series 2610 UA, 4.00%, 5/15/33 | | | 2,007,340 | | | | 2,103,995 | |
Series T-48 1A, 5.347%, 7/25/33 | | | 2,870,471 | | | | 3,288,189 | |
Series 2708 ZD, 5.50%, 11/15/33 | | | 20,932,175 | | | | 23,458,278 | |
Series 3204 ZM, 5.00%, 8/15/34 | | | 9,650,710 | | | | 10,475,846 | |
Series 3330 GZ, 5.50%, 6/15/37 | | | 3,716,402 | | | | 4,041,477 | |
Series 3427 Z, 5.00%, 3/15/38 | | | 3,955,469 | | | | 4,303,748 | |
Series 4091 JF, 1.204%, 6/15/41 | | | 27,274,979 | | | | 27,346,464 | |
Series 4120 YF, 1.054%, 10/15/42 | | | 67,827,842 | | | | 67,279,209 | |
Series 309 F4, 1.234%, 8/15/43 | | | 78,706,174 | | | | 78,067,947 | |
Series 311 F1, 1.254%, 8/15/43 | | | 95,012,758 | | | | 94,936,239 | |
Series T-51 1A, 6.50%, 9/25/43 | | | 63,294 | | | | 72,603 | |
Series 4281 BC, 4.50%, 12/15/43 | | | 169,539,440 | | | | 181,823,877 | |
Series 4283 DW, 4.50%, 12/15/43 | | | 104,534,016 | | | | 112,168,501 | |
Series 4283 EW, 4.50%, 12/15/43 | | | 62,716,860 | | | | 67,062,411 | |
Series 4310 FA, 1.254%, 2/15/44 | | | 2,714,051 | | | | 2,715,980 | |
Series 4319 MA, 4.50%, 3/15/44 | | | 33,527,044 | | | | 36,081,470 | |
| | | | | | | | |
| | | | | | | 1,155,448,775 | |
FEDERAL AGENCY MORTGAGE PASS-THROUGH: 29.6% | |
Fannie Mae, 15 Year | | | | | | | | |
3.50%, 10/1/25-2/1/31 | | | 1,179,691,718 | | | | 1,230,185,531 | |
4.00%, 9/1/25-5/1/29 | | | 159,460,590 | | | | 168,262,578 | |
4.50%, 3/1/29 | | | 34,615,064 | | | | 36,578,244 | |
5.00%, 9/1/25 | | | 54,913,507 | | | | 58,620,920 | |
5.50%, 1/1/18-7/1/25 | | | 146,457,906 | | | | 156,740,088 | |
6.00%, 1/1/17-3/1/23 | | | 43,568,300 | | | | 46,508,776 | |
6.50%, 2/1/17-12/1/19 | | | 793,832 | | | | 799,252 | |
7.00%, 11/1/17 | | | 461 | | | | 463 | |
7.50%, 8/1/17 | | | 3,935 | | | | 3,943 | |
Fannie Mae, 20 Year | | | | | | | | |
4.00%, 9/1/30-6/1/36 | | | 2,296,366,958 | | | | 2,436,573,560 | |
4.50%, 3/1/29-1/1/34 | | | 560,659,562 | | | | 603,179,870 | |
| | | | | | | | |
| | |
| | | PAR VALUE | | | VALUE | |
Fannie Mae, 30 Year | | | | | | | | |
4.00%, 8/1/43-6/1/46 | | $ | 67,003,325 | | | $ | 69,410,835 | |
4.50%, 11/1/35-11/1/46 | | | 1,873,627,324 | | | | 2,019,450,314 | |
5.00%, 7/1/37 | | | 12,848,207 | | | | 14,092,564 | |
5.50%, 2/1/33-11/1/39 | | | 213,605,778 | | | | 239,380,940 | |
6.00%, 11/1/28-2/1/39 | | | 142,018,334 | | | | 162,995,288 | |
6.50%, 12/1/32-8/1/39 | | | 59,712,225 | | | | 68,009,696 | |
7.00%, 4/1/32-2/1/39 | | | 86,541,522 | | | | 99,471,765 | |
Fannie Mae, 40 Year
4.50%, 1/1/52 | | | 11,920,238 | | | | 12,716,564 | |
Fannie Mae, Hybrid ARM | | | | | | | | |
1.935%, 6/1/43 | | | 5,145,202 | | | | 5,279,739 | |
1.948%, 9/1/43 | | | 12,460,052 | | | | 12,785,461 | |
2.21%, 4/1/44 | | | 60,005,310 | | | | 62,272,533 | |
2.282%, 5/1/43 | | | 4,677,055 | | | | 4,709,086 | |
2.283%, 12/1/42 | | | 20,071,661 | | | | 20,230,555 | |
2.311%, 10/1/43 | | | 51,048,692 | | | | 51,934,383 | |
2.313%, 12/1/46 | | | 10,078,403 | | | | 10,101,732 | |
2.373%, 9/1/42 | | | 13,313,727 | | | | 13,626,806 | |
2.386%, 2/1/44 | | | 3,093,890 | | | | 3,179,281 | |
2.397%, 2/1/43 | | | 19,420,721 | | | | 19,891,597 | |
2.452%, 4/1/46 | | | 50,495,289 | | | | 51,373,214 | |
2.464%, 5/1/44 | | | 19,119,327 | | | | 19,683,869 | |
2.483%, 10/1/44 | | | 8,790,920 | | | | 8,920,160 | |
2.507%, 4/1/35 | | | 3,768,810 | | | | 3,943,113 | |
2.513%, 5/1/46 | | | 13,369,356 | | | | 13,606,509 | |
2.514%, 9/1/34 | | | 2,441,999 | | | | 2,558,863 | |
2.516%, 11/1/42 | | | 11,688,618 | | | | 11,958,002 | |
2.573%, 4/1/45 | | | 7,929,777 | | | | 8,069,074 | |
2.58%, 11/1/35 | | | 2,284,840 | | | | 2,386,418 | |
2.591%, 4/1/42 | | | 15,679,216 | | | | 16,148,852 | |
2.605%, 8/1/34 | | | 2,021,897 | | | | 2,099,912 | |
2.621%, 8/1/35-7/1/36 | | | 2,089,250 | | | | 2,219,428 | |
2.642%, 11/1/45 | | | 26,178,321 | | | | 26,641,266 | |
2.654%, 8/1/34 | | | 615,344 | | | | 651,987 | |
2.657%, 7/1/35 | | | 960,462 | | | | 1,013,963 | |
2.658%, 11/1/43 | | | 16,987,318 | | | | 17,386,233 | |
2.659%, 8/1/45 | | | 17,414,307 | | | | 17,729,164 | |
2.669%, 10/1/44 | | | 19,624,549 | | | | 20,036,541 | |
2.671%, 7/1/35 | | | 1,421,051 | | | | 1,497,464 | |
2.674%, 9/1/44 | | | 11,549,994 | | | | 11,797,421 | |
2.676%, 4/1/44 | | | 22,029,092 | | | | 22,738,705 | |
2.679%, 8/1/35 | | | 6,611,385 | | | | 6,936,455 | |
2.684%, 1/1/35 | | | 2,346,873 | | | | 2,458,590 | |
2.688%, 12/1/36 | | | 3,044,818 | | | | 3,200,686 | |
2.694%, 4/1/46 | | | 8,381,077 | | | | 8,529,019 | |
2.697%, 10/1/44 | | | 13,083,544 | | | | 13,384,741 | |
2.701%, 12/1/44 | | | 7,737,149 | | | | 7,908,181 | |
2.704%, 10/1/33 | | | 2,478,203 | | | | 2,623,048 | |
2.713%, 6/1/46 | | | 11,732,657 | | | | 11,919,013 | |
2.721%, 7/1/46 | | | 4,181,785 | | | | 4,253,281 | |
2.728%, 8/1/45 | | | 16,399,840 | | | | 16,730,017 | |
2.736%, 12/1/44-2/1/45 | | | 29,154,921 | | | | 29,781,344 | |
2.74%, 11/1/44 | | | 7,949,845 | | | | 8,125,359 | |
2.75%, 4/1/46 | | | 9,162,115 | | | | 9,327,196 | |
2.756%, 12/1/44 | | | 6,908,663 | | | | 7,059,411 | |
2.763%, 9/1/44-10/1/44 | | | 58,527,373 | | | | 59,901,119 | |
2.766%, 12/1/44 | | | 42,044,502 | | | | 42,974,283 | |
2.767%, 6/1/46 | | | 4,145,850 | | | | 4,223,663 | |
2.773%, 2/1/44 | | | 8,223,557 | | | | 8,426,913 | |
2.778%, 7/1/35 | | | 2,084,019 | | | | 2,184,274 | |
2.785%, 10/1/44 | | | 12,868,968 | | | | 13,163,988 | |
2.79%, 10/1/44-11/1/44 | | | 36,414,097 | | | | 37,285,841 | |
2.793%, 10/1/34 | | | 1,786,962 | | | | 1,886,240 | |
2.812%, 8/1/44 | | | 30,066,762 | | | | 30,792,843 | |
2.813%, 8/1/44 | | | 14,118,720 | | | | 14,456,154 | |
| | |
| PAGE 8 § DODGE & COX INCOME FUND | | See accompanying Notes to Financial Statements |
| | | | |
| PORTFOLIO OF INVESTMENTS | | | December 31, 2016 | |
| | | | | | | | |
| DEBT SECURITIES (continued) | | | | | | |
| | |
| | | PAR VALUE | | | VALUE | |
2.814%, 12/1/44 | | $ | 16,409,031 | | | $ | 16,799,632 | |
2.817%, 4/1/46 | | | 21,545,335 | | | | 21,958,324 | |
2.833%, 10/1/45 | | | 35,746,305 | | | | 36,473,657 | |
2.84%, 11/1/44 | | | 21,931,512 | | | | 22,473,327 | |
2.842%, 11/1/44 | | | 23,698,512 | | | | 24,256,017 | |
2.844%, 4/1/45 | | | 50,535,730 | | | | 51,824,267 | |
2.852%, 9/1/44 | | | 6,961,961 | | | | 7,127,800 | |
2.853%, 10/1/44 | | | 18,199,119 | | | | 18,663,611 | |
2.859%, 9/1/44 | | | 45,030,653 | | | | 46,197,501 | |
2.871%, 7/1/44 | | | 15,626,425 | | | | 16,038,129 | |
2.872%, 7/1/44 | | | 21,715,489 | | | | 22,305,605 | |
2.873%, 10/1/44 | | | 23,456,486 | | | | 24,051,056 | |
2.884%, 2/1/43-10/1/44 | | | 16,779,416 | | | | 17,331,292 | |
2.885%, 1/1/37 | | | 3,979,130 | | | | 4,186,410 | |
2.887%, 7/1/34 | | | 2,690,456 | | | | 2,843,204 | |
2.904%, 11/1/43 | | | 16,907,844 | | | | 17,312,101 | |
2.907%, 8/1/44-4/1/46 | | | 17,646,498 | | | | 18,064,768 | |
2.916%, 1/1/36-11/1/44 | | | 38,195,262 | | | | 39,613,016 | |
2.919%, 10/1/44 | | | 27,813,667 | | | | 28,594,386 | |
2.92%, 10/1/38 | | | 8,271,350 | | | | 8,764,736 | |
2.922%, 1/1/45 | | | 18,070,433 | | | | 18,489,655 | |
2.927%, 11/1/44 | | | 19,969,633 | | | | 20,477,595 | |
2.936%, 7/1/44 | | | 11,906,905 | | | | 12,241,810 | |
2.937%, 2/1/44 | | | 12,556,028 | | | | 12,928,522 | |
2.943%, 10/1/35 | | | 3,076,005 | | | | 3,233,468 | |
2.946%, 6/1/35 | | | 932,661 | | | | 983,406 | |
2.948%, 3/1/46 | | | 8,290,921 | | | | 8,467,015 | |
2.949%, 7/1/44 | | | 8,122,918 | | | | 8,353,085 | |
2.954%, 4/1/44 | | | 8,309,896 | | | | 8,556,822 | |
2.959%, 9/1/43 | | | 7,563,958 | | | | 7,766,051 | |
2.962%, 9/1/44 | | | 25,631,763 | | | | 26,367,565 | |
2.966%, 4/1/44 | | | 7,910,410 | | | | 8,135,465 | |
2.968%, 10/1/44 | | | 13,744,881 | | | | 14,107,725 | |
2.969%, 10/1/38 | | | 1,942,101 | | | | 2,063,712 | |
2.995%, 5/1/38 | | | 174,595,224 | | | | 185,029,967 | |
2.999%, 7/1/44 | | | 9,342,038 | | | | 9,613,329 | |
3.00%, 7/1/35 | | | 1,863,122 | | | | 1,966,844 | |
3.01%, 8/1/35 | | | 3,686,962 | | | | 3,893,335 | |
3.011%, 3/1/45 | | | 225,722,139 | | | | 232,324,530 | |
3.014%, 10/1/38 | | | 5,063,131 | | | | 5,343,142 | |
3.017%, 9/1/35-10/1/35 | | | 5,192,777 | | | | 5,483,269 | |
3.018%, 9/1/44 | | | 10,726,861 | | | | 11,023,268 | |
3.021%, 8/1/44 | | | 11,151,364 | | | | 11,477,230 | |
3.032%, 1/1/36 | | | 4,809,451 | | | | 5,089,583 | |
3.045%, 12/1/44 | | | 12,797,221 | | | | 13,123,008 | |
3.048%, 11/1/36 | | | 2,094,815 | | | | 2,234,221 | |
3.067%, 5/1/44 | | | 36,696,441 | | | | 37,804,809 | |
3.085%, 3/1/45 | | | 6,949,015 | | | | 7,130,261 | |
3.105%, 7/1/44 | | | 17,724,782 | | | | 18,264,399 | |
3.113%, 1/1/36 | | | 3,079,768 | | | | 3,252,517 | |
3.121%, 12/1/35 | | | 1,251,982 | | | | 1,316,859 | |
3.122%, 9/1/38-12/1/43 | | | 8,795,596 | | | | 9,086,017 | |
3.14%, 8/1/37 | | | 2,203,599 | | | | 2,326,201 | |
3.198%, 4/1/44 | | | 26,229,459 | | | | 27,008,406 | |
3.205%, 12/1/36 | | | 1,234,931 | | | | 1,275,053 | |
3.231%, 2/1/37 | | | 9,115,161 | | | | 9,667,136 | |
3.378%, 7/1/41 | | | 47,159,068 | | | | 49,501,170 | |
3.457%, 1/1/35 | | | 1,148,193 | | | | 1,209,293 | |
4.159%, 12/1/39 | | | 3,558,998 | | | | 3,711,371 | |
4.846%, 6/1/39 | | | 780,450 | | | | 822,013 | |
4.991%, 4/1/38 | | | 451,564 | | | | 473,349 | |
5.033%, 5/1/38 | | | 2,362,439 | | | | 2,503,924 | |
5.111%, 8/1/37 | | | 378,509 | | | | 378,066 | |
5.496%, 4/1/37 | | | 443,931 | | | | 475,491 | |
5.56%, 11/1/37 | | | 1,209,016 | | | | 1,274,960 | |
| | | | | | | | |
| | |
| | | PAR VALUE | | | VALUE | |
Fannie Mae, Multifamily DUS | | | | | | | | |
Trust 2014-M13 ASQ2,
1.637%, 11/25/17 | | $ | 39,857,437 | | | $ | 39,903,513 | |
Pool AL6445, 2.58%, 1/1/22 | | | 8,641,596 | | | | 8,768,379 | |
Pool AL6455, 2.765%, 11/1/21 | | | 9,584,801 | | | | 9,818,708 | |
Pool AL6028, 2.963%, 7/1/21 | | | 4,026,649 | | | | 4,111,323 | |
Pool 745629, 5.14%, 1/1/18 | | | 40,140 | | | | 41,146 | |
Pool 888559, 5.505%, 6/1/17 | | | 8,166,729 | | | | 8,248,415 | |
Freddie Mac, Hybrid ARM | | | | | | | | |
1.874%, 8/1/43 | | | 80,788,262 | | | | 83,798,759 | |
2.142%, 1/1/36 | | | 3,012,560 | | | | 3,136,661 | |
2.50%, 1/1/35 | | | 949,566 | | | | 993,207 | |
2.547%, 3/1/37 | | | 4,312,153 | | | | 4,582,883 | |
2.559%, 9/1/46 | | | 59,554,675 | | | | 60,180,986 | |
2.614%, 5/1/45 | | | 61,462,484 | | | | 62,444,572 | |
2.625%, 4/1/35 | | | 1,028,742 | | | | 1,098,946 | |
2.637%, 8/1/45 | | | 15,012,480 | | | | 15,271,064 | |
2.656%, 7/1/46 | | | 32,252,220 | | | | 32,711,285 | |
2.662%, 1/1/36 | | | 7,495,557 | | | | 7,921,248 | |
2.676%, 1/1/37 | | | 3,127,814 | | | | 3,339,000 | |
2.70%, 4/1/37 | | | 1,545,209 | | | | 1,636,420 | |
2.705%, 2/1/38 | | | 9,847,137 | | | | 10,330,581 | |
2.711%, 1/1/45 | | | 20,014,447 | | | | 20,434,613 | |
2.725%, 4/1/45 | | | 12,221,644 | | | | 12,455,594 | |
2.728%, 2/1/34 | | | 5,372,408 | | | | 5,674,496 | |
2.732%, 8/1/45 | | | 51,355,504 | | | | 52,308,212 | |
2.737%, 11/1/44-6/1/45 | | | 31,377,120 | | | | 32,071,009 | |
2.739%, 9/1/44 | | | 14,106,430 | | | | 14,431,561 | |
2.747%, 5/1/46 | | | 323,711,033 | | | | 329,688,982 | |
2.756%, 10/1/43 | | | 3,454,141 | | | | 3,535,229 | |
2.757%, 5/1/46 | | | 22,546,282 | | | | 22,960,804 | |
2.78%, 8/1/36 | | | 3,015,041 | | | | 3,171,223 | |
2.801%, 9/1/44 | | | 17,768,236 | | | | 18,177,454 | |
2.804%, 12/1/44 | | | 6,588,948 | | | | 6,720,432 | |
2.807%, 10/1/44-8/1/45 | | | 21,027,315 | | | | 21,460,329 | |
2.812%, 10/1/44 | | | 21,530,836 | | | | 22,015,149 | |
2.814%, 9/1/45 | | | 13,892,931 | | | | 14,160,512 | |
2.82%, 11/1/44 | | | 18,369,311 | | | | 18,765,950 | |
2.823%, 5/1/37 | | | 3,231,701 | | | | 3,398,953 | |
2.833%, 1/1/45 | | | 14,297,213 | | | | 14,610,478 | |
2.84%, 10/1/44 | | | 18,560,903 | | | | 18,904,688 | |
2.854%, 11/1/44 | | | 11,681,065 | | | | 11,960,247 | |
2.86%, 12/1/44 | | | 28,097,057 | | | | 28,675,631 | |
2.865%, 4/1/37 | | | 2,360,422 | | | | 2,482,733 | |
2.866%, 11/1/34 | | | 1,564,220 | | | | 1,655,870 | |
2.869%, 7/1/37 | | | 8,212,330 | | | | 8,698,233 | |
2.878%, 8/1/44 | | | 12,426,091 | | | | 12,719,438 | |
2.881%, 4/1/38 | | | 7,881,589 | | | | 8,352,441 | |
2.882%, 6/1/44-12/1/44 | | | 29,490,237 | | | | 30,209,512 | |
2.883%, 7/1/43 | | | 4,863,662 | | | | 5,043,652 | |
2.884%, 1/1/45 | | | 11,893,606 | | | | 12,140,459 | |
2.891%, 3/1/35 | | | 1,479,655 | | | | 1,561,621 | |
2.902%, 2/1/44 | | | 14,222,679 | | | | 14,615,159 | |
2.909%, 12/1/44 | | | 25,763,829 | | | | 26,387,033 | |
2.913%, 10/1/35-9/1/44 | | | 15,692,864 | | | | 16,142,480 | |
2.916%, 11/1/44 | | | 11,891,209 | | | | 12,147,781 | |
2.917%, 1/1/45 | | | 22,182,934 | | | | 22,663,798 | |
2.92%, 6/1/38 | | | 4,564,907 | | | | 4,809,504 | |
2.921%, 12/1/44 | | | 12,974,960 | | | | 13,255,381 | |
2.929%, 11/1/44 | | | 18,865,691 | | | | 19,320,835 | |
2.932%, 10/1/38 | | | 847,974 | | | | 897,456 | |
2.933%, 2/1/45 | | | 22,988,269 | | | | 23,488,828 | |
2.94%, 11/1/44 | | | 8,457,447 | | | | 8,673,328 | |
2.943%, 11/1/44 | | | 10,842,500 | | | | 11,121,649 | |
2.946%, 11/1/44 | | | 34,747,979 | | | | 35,539,064 | |
2.95%, 1/1/36 | | | 2,498,525 | | | | 2,635,213 | |
| | |
| See accompanying Notes to Financial Statements | | DODGE & COX INCOME FUND §PAGE 9 |
| | | | |
| PORTFOLIO OF INVESTMENTS | | | December 31, 2016 | |
| | | | | | | | |
| DEBT SECURITIES (continued) | | | | | | |
| | |
| | | PAR VALUE | | | VALUE | |
2.952%, 4/1/38 | | $ | 10,562,238 | | | $ | 11,196,819 | |
2.954%, 10/1/38 | | | 2,890,073 | | | | 3,067,628 | |
2.955%, 11/1/44 | | | 14,307,117 | | | | 14,645,108 | |
2.961%, 11/1/44 | | | 18,055,156 | | | | 18,482,925 | |
2.962%, 11/1/44 | | | 23,842,543 | | | | 24,476,838 | |
2.966%, 2/1/35 | | | 995,000 | | | | 1,049,681 | |
2.98%, 1/1/44 | | | 6,201,339 | | | | 6,367,110 | |
2.982%, 8/1/35 | | | 1,691,810 | | | | 1,783,326 | |
3.009%, 7/1/44 | | | 9,846,469 | | | | 10,127,305 | |
3.01%, 10/1/44 | | | 19,939,334 | | | | 20,476,441 | |
3.015%, 5/1/44 | | | 132,790,422 | | | | 136,533,482 | |
3.016%, 10/1/44 | | | 18,017,480 | | | | 18,521,366 | |
3.022%, 4/1/36 | | | 4,195,923 | | | | 4,438,076 | |
3.029%, 9/1/33 | | | 7,004,597 | | | | 7,471,422 | |
3.046%, 8/1/34-8/1/44 | | | 14,194,122 | | | | 14,623,044 | |
3.052%, 7/1/44 | | | 7,945,290 | | | | 8,167,816 | |
3.078%, 9/1/35-1/1/45 | | | 45,278,899 | | | | 46,571,246 | |
3.084%, 4/1/44 | | | 9,224,733 | | | | 9,483,582 | |
3.092%, 8/1/44 | | | 14,272,733 | | | | 14,690,420 | |
3.12%, 8/1/35-6/1/44 | | | 32,830,075 | | | | 33,878,734 | |
3.129%, 4/1/44 | | | 4,889,466 | | | | 5,031,241 | |
3.144%, 1/1/44 | | | 6,053,462 | | | | 6,227,093 | |
3.382%, 12/1/36 | | | 1,594,946 | | | | 1,661,933 | |
3.60%, 9/1/41 | | | 8,611,288 | | | | 8,943,543 | |
3.615%, 6/1/41 | | | 7,359,000 | | | | 7,612,812 | |
4.74%, 6/1/38 | | | 732,334 | | | | 760,601 | |
5.206%, 5/1/38 | | | 2,574,277 | | | | 2,725,985 | |
5.235%, 11/1/39 | | | 3,038,157 | | | | 3,156,249 | |
5.788%, 1/1/38 | | | 1,104,695 | | | | 1,161,057 | |
6.239%, 10/1/37 | | | 310,051 | | | | 333,441 | |
Freddie Mac Gold, 15 Year | | | | | | | | |
3.50%, 12/1/30 | | | 72,574,134 | | | | 75,692,554 | |
4.00%, 6/1/26-6/1/27 | | | 282,427,292 | | | | 297,225,526 | |
4.50%, 3/1/25-6/1/26 | | | 18,510,647 | | | | 19,577,275 | |
5.50%, 10/1/20-12/1/24 | | | 8,221,566 | | | | 8,644,290 | |
6.00%, 5/1/17-11/1/23 | | | 15,958,801 | | | | 17,149,914 | |
6.50%, 2/1/17-9/1/18 | | | 192,484 | | | | 193,448 | |
Freddie Mac Gold, 20 Year | | | | | | | | |
4.00%, 9/1/31-10/1/35 | | | 607,534,465 | | | | 645,659,500 | |
4.50%, 5/1/30-1/1/34 | | | 141,738,386 | | | | 152,610,872 | |
6.00%, 12/1/27 | | | 24,683,987 | | | | 27,883,237 | |
6.50%, 10/1/26 | | | 3,104,158 | | | | 3,456,779 | |
Freddie Mac Gold, 30 Year | | | | | | | | |
4.00%, 5/1/46 | | | 8,267,818 | | | | 8,580,499 | |
4.50%, 3/1/39-2/1/46 | | | 1,038,264,846 | | | | 1,115,858,173 | |
5.50%, 3/1/34-12/1/38 | | | 73,705,158 | | | | 82,695,117 | |
6.00%, 2/1/33-2/1/39 | | | 29,646,041 | | | | 33,657,050 | |
6.50%, 12/1/32-10/1/38 | | | 16,172,379 | | | | 18,248,758 | |
7.00%, 4/1/31-11/1/38 | | | 4,944,402 | | | | 5,686,025 | |
7.90%, 2/17/21 | | | 236,447 | | | | 247,699 | |
Ginnie Mae, 20 Year
4.00%, 1/20/35 | | | 13,313,162 | | | | 14,138,235 | |
Ginnie Mae, 30 Year | | | | | | | | |
7.00%, 5/15/28 | | | 356,599 | | | | 407,024 | |
7.50%, 9/15/17-5/15/25 | | | 1,159,653 | | | | 1,306,841 | |
7.80%, 6/15/20-1/15/21 | | | 220,038 | | | | 230,873 | |
7.85%, 1/15/21 | | | 4,387 | | | | 4,404 | |
8.00%, 9/15/20 | | | 4,074 | | | | 4,312 | |
| | | | | | | | |
| | | | | | | 13,799,422,776 | |
PRIVATE LABEL CMO & REMIC: 0.0%(e) | | | | | |
GSMPS Mortgage Loan Trust
Series 2004-4 1A4, 8.50%, 6/25/34(b) | | | 4,248,949 | | | | 4,614,232 | |
| | | | | | | | |
| | | | | | | 14,959,485,783 | |
| | | | | | | | |
| | |
| | | PAR VALUE | | | VALUE | |
| ASSET-BACKED: 3.3% | | | | | | | | |
AUTO LOAN: 0.4% | | | | | | | | |
Ford Credit Auto Owner Trust
Series 2015-1 A, 2.12%, 7/15/26(b) | | $ | 200,480,000 | | | $ | 200,754,577 | |
CREDIT CARD: 0.4% | | | | | | | | |
Chase Issuance Trust
Series 2015-A2 A2, 1.59%, 2/18/20 | | | 185,397,000 | | | | 185,909,975 | |
OTHER: 1.9% | | | | | | | | |
Rio Oil Finance Trust (Brazil) | | | | | | | | |
9.25%, 7/6/24(b) | | | 564,605,798 | | | | 530,729,450 | |
9.75%, 1/6/27(b) | | | 359,071,542 | | | | 330,345,819 | |
| | | | | | | | |
| | | | | | | 861,075,269 | |
STUDENT LOAN: 0.6% | | | | | | | | |
Navient Student Loan Trust (Private Loans)
Series 2014-AA A2A,
2.74%, 2/15/29(b) | | | 34,855,518 | | | | 34,843,932 | |
SLM Student Loan Trust (Private Loans) | | | | | | | | |
Series 2013-A A2A, 1.77%, 5/17/27(b) | | | 58,445,000 | | | | 58,246,334 | |
Series 2012-B A2, 3.48%, 10/15/30(b) | | | 40,996,771 | | | | 41,538,470 | |
Series 2013-C A2A, 2.94%, 10/15/31(b) | | | 41,885,000 | | | | 42,366,690 | |
Series 2012-E A2A, 2.09%, 6/15/45(b) | | | 14,555,000 | | | | 14,559,263 | |
Series 2012-C A2, 3.31%, 10/15/46(b) | | | 77,586,340 | | | | 78,628,216 | |
| | | | | | | | |
| | | | | | | 270,182,905 | |
| | | | | | | | |
| | | | | | | 1,517,922,726 | |
| CORPORATE: 40.3% | | | | | | | | |
FINANCIALS: 14.1% | | | | | | | | |
Bank of America Corp. | | | | | | | | |
7.625%, 6/1/19 | | | 188,582,000 | | | | 211,828,315 | |
5.625%, 7/1/20 | | | 73,416,000 | | | | 80,669,721 | |
4.20%, 8/26/24 | | | 163,140,000 | | | | 165,994,297 | |
4.25%, 10/22/26 | | | 127,024,000 | | | | 128,374,900 | |
6.625%, 5/23/36(a) | | | 244,578,000 | | | | 270,210,753 | |
Barclays PLC (United Kingdom)
4.375%, 9/11/24 | | | 275,404,000 | | | | 272,846,323 | |
BNP Paribas SA (France) | | | | | | | | |
4.25%, 10/15/24 | | | 379,446,000 | | | | 379,927,138 | |
4.375%, 9/28/25(b) | | | 132,065,000 | | | | 131,133,546 | |
4.375%, 5/12/26(b) | | | 27,567,000 | | | | 27,170,035 | |
Boston Properties, Inc. | | | | | | | | |
5.875%, 10/15/19 | | | 48,079,000 | | | | 52,405,677 | |
5.625%, 11/15/20 | | | 79,385,000 | | | | 87,492,590 | |
4.125%, 5/15/21 | | | 52,852,000 | | | | 55,792,791 | |
3.85%, 2/1/23 | | | 76,031,000 | | | | 77,938,466 | |
3.125%, 9/1/23 | | | 19,500,000 | | | | 19,100,328 | |
3.80%, 2/1/24 | | | 64,024,000 | | | | 64,862,714 | |
Capital One Financial Corp. | | | | | | | | |
4.75%, 7/15/21 | | | 75,418,000 | | | | 81,498,878 | |
3.50%, 6/15/23 | | | 193,115,000 | | | | 193,642,976 | |
3.75%, 4/24/24 | | | 36,940,000 | | | | 37,377,998 | |
3.20%, 2/5/25 | | | 67,240,000 | | | | 65,087,580 | |
4.20%, 10/29/25 | | | 117,079,000 | | | | 117,312,338 | |
Cigna Corp. | | | | | | | | |
4.00%, 2/15/22 | | | 62,964,000 | | | | 65,717,919 | |
7.65%, 3/1/23 | | | 7,217,000 | | | | 8,743,908 | |
7.875%, 5/15/27 | | | 33,255,000 | | | | 43,715,261 | |
8.30%, 1/15/33 | | | 8,195,000 | | | | 10,825,054 | |
6.15%, 11/15/36 | | | 88,097,000 | | | | 102,000,380 | |
5.875%, 3/15/41 | | | 18,939,000 | | | | 21,733,468 | |
5.375%, 2/15/42 | | | 56,018,000 | | | | 62,295,265 | |
Citigroup, Inc. | | | | | | | | |
2.606%, 5/15/18 | | | 79,070,000 | | | | 80,322,864 | |
3.50%, 5/15/23 | | | 105,730,000 | | | | 105,279,907 | |
6.692%, 10/30/40(a) | | | 381,543,025 | | | | 395,277,048 | |
| | |
| PAGE 10 § DODGE & COX INCOME FUND | | See accompanying Notes to Financial Statements |
| | | | |
| PORTFOLIO OF INVESTMENTS | | | December 31, 2016 | |
| | | | | | | | |
| DEBT SECURITIES (continued) | | | | | | |
| | |
| | | PAR VALUE | | | VALUE | |
Equity Residential | | | | | | | | |
4.75%, 7/15/20 | | $ | 5,200,000 | | | $ | 5,591,357 | |
4.625%, 12/15/21 | | | 61,355,000 | | | | 66,583,735 | |
3.00%, 4/15/23 | | | 47,300,000 | | | | 46,600,055 | |
3.375%, 6/1/25 | | | 77,890,000 | | | | 77,229,026 | |
HSBC Holdings PLC (United Kingdom) | | | | | | | | |
5.10%, 4/5/21 | | | 85,935,000 | | | | 92,794,246 | |
9.30%, 6/1/21 | | | 100,000 | | | | 124,032 | |
4.30%, 3/8/26 | | | 116,100,000 | | | | 120,214,120 | |
6.50%, 5/2/36 | | | 179,105,000 | | | | 220,550,793 | |
6.50%, 9/15/37 | | | 195,591,000 | | | | 242,102,540 | |
6.80%, 6/1/38 | | | 32,000,000 | | | | 40,461,632 | |
JPMorgan Chase & Co. | | | | | | | | |
3.375%, 5/1/23 | | | 92,238,000 | | | | 91,812,967 | |
4.125%, 12/15/26 | | | 106,000,000 | | | | 108,029,158 | |
8.75%, 9/1/30(a) | | | 48,438,000 | | | | 68,064,157 | |
Lloyds Banking Group PLC (United Kingdom) | | | | | | | | |
4.50%, 11/4/24 | | | 218,317,000 | | | | 221,352,916 | |
4.582%, 12/10/25 | | | 24,585,000 | | | | 24,671,072 | |
4.65%, 3/24/26 | | | 99,850,000 | | | | 100,999,773 | |
Navient Corp. | | | | | | | | |
4.625%, 9/25/17 | | | 111,437,000 | | | | 113,247,851 | |
8.45%, 6/15/18 | | | 192,028,000 | | | | 206,910,170 | |
Royal Bank of Scotland Group PLC (United Kingdom) | | | | | | | | |
6.125%, 12/15/22 | | | 292,243,000 | | | | 310,420,515 | |
6.00%, 12/19/23 | | | 264,320,000 | | | | 274,266,362 | |
Unum Group | | | | | | | | |
7.19%, 2/1/28 | | | 11,295,000 | | | | 12,961,125 | |
7.25%, 3/15/28 | | | 25,060,000 | | | | 29,605,032 | |
6.75%, 12/15/28 | | | 8,107,000 | | | | 9,135,616 | |
Wells Fargo & Co. | | | | | | | | |
2.15%, 12/6/19 | | | 280,875,000 | | | | 280,671,927 | |
1.601%, 12/6/19 | | | 135,850,000 | | | | 136,179,572 | |
4.30%, 7/22/27 | | | 247,864,000 | | | | 254,553,106 | |
| | | | | | | | |
| | | | | | | 6,571,711,293 | |
INDUSTRIALS: 24.8% | | | | | | | | |
AT&T, Inc. | | | | | | | | |
8.25%, 11/15/31 | | | 100,978,000 | | | | 140,127,675 | |
5.35%, 9/1/40 | | | 59,744,000 | | | | 61,254,388 | |
4.75%, 5/15/46 | | | 77,670,000 | | | | 73,445,839 | |
5.65%, 2/15/47 | | | 120,390,000 | | | | 128,880,505 | |
4.50%, 3/9/48 | | | 217,175,000 | | | | 195,794,338 | |
BHP Billiton, Ltd. (Australia)
6.75%, 10/19/75(a)(b) | | | 231,972,000 | | | | 260,388,570 | |
Burlington Northern Santa Fe LLC(d) | | | | | | | | |
4.70%, 10/1/19 | | | 33,445,000 | | | | 35,934,077 | |
8.251%, 1/15/21 | | | 3,529,670 | | | | 3,888,984 | |
3.05%, 9/1/22 | | | 39,535,000 | | | | 40,330,879 | |
5.943%, 1/15/23 | | | 45,954 | | | | 48,609 | |
3.85%, 9/1/23 | | | 79,525,000 | | | | 84,126,317 | |
5.72%, 1/15/24 | | | 14,862,976 | | | | 16,498,840 | |
5.342%, 4/1/24 | | | 4,676,851 | | | | 5,087,853 | |
5.629%, 4/1/24 | | | 19,257,292 | | | | 21,287,434 | |
5.996%, 4/1/24 | | | 36,959,759 | | | | 42,318,924 | |
3.442%, 6/16/28(b) | | | 85,629,949 | | | | 85,261,911 | |
Cemex SAB de CV (Mexico) | | | | | | | | |
6.50%, 12/10/19(b) | | | 53,075,000 | | | | 56,126,813 | |
7.25%, 1/15/21(b) | | | 163,907,000 | | | | 174,560,955 | |
6.00%, 4/1/24(b) | | | 113,175,000 | | | | 116,287,313 | |
5.70%, 1/11/25(b) | | | 202,411,000 | | | | 203,929,083 | |
6.125%, 5/5/25(b) | | | 95,400,000 | | | | 97,546,500 | |
Charter Communications, Inc. | | | | | | | | |
8.75%, 2/14/19 | | | 130,460,000 | | | | 146,969,843 | |
8.25%, 4/1/19 | | | 237,543,000 | | | | 266,828,489 | |
| | | | | | | | |
| | |
| | | PAR VALUE | | | VALUE | |
5.00%, 2/1/20 | | $ | 20,700,000 | | | $ | 21,956,117 | |
4.125%, 2/15/21 | | | 30,545,000 | | | | 31,554,665 | |
4.00%, 9/1/21 | | | 40,609,000 | | | | 41,666,864 | |
4.908%, 7/23/25 | | | 122,505,000 | | | | 128,951,091 | |
6.55%, 5/1/37 | | | 46,188,000 | | | | 52,211,100 | |
6.75%, 6/15/39 | | | 112,072,000 | | | | 130,094,186 | |
6.484%, 10/23/45 | | | 92,015,000 | | | | 106,193,131 | |
Cox Enterprises, Inc. | | | | | | | | |
9.375%, 1/15/19(b) | | | 143,919,000 | | | | 162,533,915 | |
3.25%, 12/15/22(b) | | | 110,233,000 | | | | 107,253,402 | |
2.95%, 6/30/23(b) | | | 229,213,000 | | | | 215,467,784 | |
3.85%, 2/1/25(b) | | | 204,226,000 | | | | 200,043,656 | |
CRH PLC (Ireland)
3.875%, 5/18/25(b) | | | 185,239,000 | | | | 188,378,801 | |
CSX Corp. | | | | | | | | |
9.75%, 6/15/20 | | | 10,067,000 | | | | 12,385,662 | |
6.251%, 1/15/23 | | | 14,091,383 | | | | 16,240,319 | |
Dell Technologies, Inc. | | | | | | | | |
4.42%, 6/15/21(b) | | | 255,000,000 | | | | 263,637,105 | |
5.45%, 6/15/23(b) | | | 149,150,000 | | | | 158,047,692 | |
Dillard’s, Inc. | | | | | | | | |
7.13%, 8/1/18 | | | 23,565,000 | | | | 25,242,121 | |
7.875%, 1/1/23 | | | 275,000 | | | | 326,563 | |
7.75%, 7/15/26 | | | 21,016,000 | | | | 24,063,320 | |
7.75%, 5/15/27 | | | 12,848,000 | | | | 15,064,280 | |
7.00%, 12/1/28 | | | 28,225,000 | | | | 31,612,000 | |
Dow Chemical Co. | | | | | | | | |
7.375%, 11/1/29 | | | 69,100,000 | | | | 90,649,388 | |
9.40%, 5/15/39 | | | 144,913,000 | | | | 224,507,914 | |
5.25%, 11/15/41 | | | 12,378,000 | | | | 13,350,094 | |
Eaton Corp. PLC (Ireland)
2.75%, 11/2/22 | | | 33,370,000 | | | | 33,013,008 | |
FedEx Corp.
8.00%, 1/15/19 | | | 16,875,000 | | | | 18,881,792 | |
Ford Motor Credit Co. LLC(d) | | | | | | | | |
5.75%, 2/1/21 | | | 192,923,000 | | | | 211,390,554 | |
5.875%, 8/2/21 | | | 146,065,000 | | | | 161,170,166 | |
3.219%, 1/9/22 | | | 39,700,000 | | | | 39,216,732 | |
4.25%, 9/20/22 | | | 31,925,000 | | | | 32,856,412 | |
Hewlett Packard Enterprise Co.
3.60%, 10/15/20 | | | 52,382,000 | | | | 53,249,708 | |
Imperial Brands PLC (United Kingdom) | | | | | | | | |
3.75%, 7/21/22(b) | | | 124,595,000 | | | | 127,772,920 | |
4.25%, 7/21/25(b) | | | 385,702,000 | | | | 397,625,206 | |
Kinder Morgan, Inc. | | | | | | | | |
3.45%, 2/15/23 | | | 23,425,000 | | | | 23,213,449 | �� |
3.50%, 9/1/23 | | | 43,211,000 | | | | 42,573,249 | |
5.625%, 11/15/23(b) | | | 49,500,000 | | | | 54,276,651 | |
4.15%, 2/1/24 | | | 47,997,000 | | | | 48,789,334 | |
4.25%, 9/1/24 | | | 22,635,000 | | | | 23,136,139 | |
4.30%, 6/1/25 | | | 146,770,000 | | | | 150,920,509 | |
6.50%, 2/1/37 | | | 50,861,000 | | | | 55,655,666 | |
6.95%, 1/15/38 | | | 92,139,000 | | | | 106,723,129 | |
6.50%, 9/1/39 | | | 72,546,000 | | | | 79,530,439 | |
5.00%, 8/15/42 | | | 57,054,000 | | | | 54,432,369 | |
5.00%, 3/1/43 | | | 71,101,000 | | | | 68,438,907 | |
5.50%, 3/1/44 | | | 80,632,000 | | | | 82,062,412 | |
5.40%, 9/1/44 | | | 39,504,000 | | | | 39,305,650 | |
Macy’s, Inc. | | | | | | | | |
6.65%, 7/15/24 | | | 52,526,000 | | | | 60,118,948 | |
7.00%, 2/15/28 | | | 26,185,000 | | | | 29,881,746 | |
6.70%, 9/15/28 | | | 34,115,000 | | | | 36,962,101 | |
6.90%, 4/1/29 | | | 67,888,000 | | | | 76,761,980 | |
6.90%, 1/15/32 | | | 60,095,000 | | | | 66,761,759 | |
6.70%, 7/15/34 | | | 138,885,000 | | | | 151,157,573 | |
4.50%, 12/15/34 | | | 154,923,000 | | | | 138,288,763 | |
6.375%, 3/15/37 | | | 110,793,000 | | | | 116,888,498 | |
| | |
| See accompanying Notes to Financial Statements | | DODGE & COX INCOME FUND §PAGE 11 |
| | | | |
| PORTFOLIO OF INVESTMENTS | | | December 31, 2016 | |
| | | | | | | | |
| DEBT SECURITIES (continued) | | | | | | |
| | |
| | | PAR VALUE | | | VALUE | |
Naspers, Ltd. (South Africa) | | | | | | | | |
6.00%, 7/18/20(b) | | $ | 220,010,000 | | | $ | 238,017,818 | |
5.50%, 7/21/25(b) | | | 257,875,000 | | | | 259,747,172 | |
Nordstrom, Inc.
6.95%, 3/15/28 | | | 20,107,000 | | | | 24,297,540 | |
Norfolk Southern Corp.
7.70%, 5/15/17 | | | 28,585,000 | | | | 29,237,767 | |
RELX PLC (United Kingdom) | | | | | | | | |
8.625%, 1/15/19 | | | 28,613,000 | | | | 32,144,044 | |
3.125%, 10/15/22 | | | 144,337,000 | | | | 142,876,743 | |
Telecom Italia SPA (Italy) | | | | | | | | |
6.999%, 6/4/18 | | | 165,232,000 | | | | 175,145,920 | |
7.175%, 6/18/19 | | | 200,711,000 | | | | 222,287,433 | |
5.303%, 5/30/24(b) | | | 225,832,000 | | | | 220,186,200 | |
7.20%, 7/18/36 | | | 53,458,000 | | | | 52,695,689 | |
7.721%, 6/4/38 | | | 129,877,000 | | | | 134,098,003 | |
Time Warner, Inc. | | | | | | | | |
7.625%, 4/15/31 | | | 109,850,000 | | | | 148,718,665 | |
7.70%, 5/1/32 | | | 231,134,000 | | | | 312,858,591 | |
TransCanada Corp. (Canada) | | | | | | | | |
5.625%, 5/20/75(a) | | | 237,639,000 | | | | 240,015,390 | |
5.875%, 8/15/76(a) | | | 68,120,000 | | | | 70,844,800 | |
Twenty-First Century Fox, Inc. | | | | | | | | |
6.20%, 12/15/34 | | | 14,795,000 | | | | 17,356,370 | |
6.40%, 12/15/35 | | | 49,525,000 | | | | 59,079,462 | |
6.15%, 3/1/37 | | | 31,905,000 | | | | 37,280,865 | |
6.65%, 11/15/37 | | | 79,075,000 | | | | 97,158,820 | |
6.15%, 2/15/41 | | | 40,108,000 | | | | 47,359,326 | |
Ultrapar Participacoes SA (Brazil)
5.25%, 10/6/26(b) | | | 185,300,000 | | | | 181,575,470 | |
Union Pacific Corp. | | | | | | | | |
7.60%, 1/2/20 | | | 438,962 | | | | 499,425 | |
6.061%, 1/17/23 | | | 5,290,654 | | | | 5,714,261 | |
4.698%, 1/2/24 | | | 3,283,860 | | | | 3,480,891 | |
5.082%, 1/2/29 | | | 7,702,654 | | | | 8,405,868 | |
5.866%, 7/2/30 | | | 40,869,324 | | | | 45,772,580 | |
6.176%, 1/2/31 | | | 35,885,069 | | | | 42,021,308 | |
Verizon Communications, Inc. | | | | | | | | |
4.272%, 1/15/36 | | | 166,472,000 | | | | 159,082,308 | |
6.55%, 9/15/43 | | | 459,606,000 | | | | 573,041,357 | |
4.522%, 9/15/48 | | | 167,250,000 | | | | 160,051,226 | |
Vulcan Materials Co.
7.50%, 6/15/21 | | | 143,984,000 | | | | 169,541,160 | |
Xerox Corp. | | | | | | | | |
6.75%, 2/1/17 | | | 62,799,000 | | | | 63,025,516 | |
2.95%, 3/15/17 | | | 1,125,000 | | | | 1,128,374 | |
6.35%, 5/15/18 | | | 106,052,000 | | | | 111,791,958 | |
5.625%, 12/15/19 | | | 87,407,000 | | | | 93,949,064 | |
2.75%, 9/1/20 | | | 27,389,000 | | | | 26,995,420 | |
4.50%, 5/15/21 | | | 63,744,000 | | | | 66,219,881 | |
Zoetis, Inc. | | | | | | | | |
3.45%, 11/13/20 | | | 39,377,000 | | | | 40,384,539 | |
4.50%, 11/13/25 | | | 166,139,000 | | | | 175,902,158 | |
| | | | | | | | |
| | | | | | | 11,589,400,460 | |
UTILITIES: 1.4% | | | | | | | | |
Dominion Resources, Inc. | | | | | | | | |
2.962%, 7/1/19 | | | 10,000,000 | | | | 10,119,760 | |
4.104%, 4/1/21
| | | 60,555,000 | | | | 63,025,825 | |
5.75%, 10/1/54(a) | | | 232,036,000 | | | | 237,836,900 | |
Enel SPA (Italy) | | | | | | | | |
6.80%, 9/15/37(b) | | | 153,664,000 | | | | 186,252,293 | |
6.00%, 10/7/39(b) | | | 137,712,000 | | | | 153,602,588 | |
| | | | | | | | |
| | | | | | | 650,837,366 | |
| | | | | | | | |
| | | | | | | 18,811,949,119 | |
| | | | | | | | |
TOTAL DEBT SECURITIES
(Cost $44,354,484,755) | | | | | | $ | 45,244,800,849 | |
| | | | | | | | |
| SHORT-TERM INVESTMENTS: 3.5% | |
| | |
| | | PAR VALUE | | | VALUE | |
COMMERCIAL PAPER: 0.8% | | | | | | | | |
Comcast Corp.
1/5/17(b) | | $ | 197,343,000 | | | $ | 197,323,209 | |
Dominion Resources, Inc.
1/5/17(b) | | | 153,000,000 | | | | 152,985,040 | |
| | | | | | | | |
| | | | | | | 350,308,249 | |
| |
MONEY MARKET FUND: 0.1% | | | | | |
State Street Institutional Treasury Plus Money Market Fund | | | 46,573,829 | | | | 46,573,829 | |
| |
REPURCHASE AGREEMENT: 2.6% | | | | | |
Fixed Income Clearing Corporation(c) 0.10%, dated 12/30/16, due 1/3/17, maturity value $1,230,546,673 | | | 1,230,533,000 | | | | 1,230,533,000 | |
| | | | | | | | |
TOTAL SHORT-TERM INVESTMENTS
(Cost $1,627,415,078) | | | $ | 1,627,415,078 | |
| | | | | | | | |
TOTAL INVESTMENTS
(Cost $45,981,899,833) | | | 100.5 | % | | $ | 46,872,215,927 | |
OTHER ASSETS LESS LIABILITIES | | | (0.5 | %) | | | (239,760,462 | ) |
| | | | | | | | |
| NET ASSETS | | | 100.0 | % | | $ | 46,632,455,465 | |
| | | | | | | | |
| (b) | Security exempt from registration under Rule 144A of the Securities Act of 1933. The security may be resold in transactions exempt from registration, normally to qualified institutional buyers. As of December 31, 2016, all such securities in total represented $6,216,967,795 or 13.3% of net assets. These securities have been deemed liquid by Dodge & Cox, investment manager, pursuant to procedures approved by the Fund’s Board of Trustees. |
| (c) | Repurchase agreement is collateralized by Fannie Mae 1.875%, 9/18/18, Federal Home Loan Bank 1.25%, 6/8/18, Freddie Mac 1.625%, 12/27/18, U.S. Treasury Inflation Indexed Notes 0.125%, 4/15/18-4/15/19, and U.S. Treasury Notes 0.625%-3.875%, 2/28/18-11/30/18. Total collateral value is $1,255,152,834. |
| (d) | Subsidiary (see below) |
Debt securities are grouped by parent company unless otherwise noted. Actual securities may be issued by the listed parent company or one of its subsidiaries. In determining a parent company’s country designation, the Fund generally references the country of incorporation.
ARM: Adjustable Rate Mortgage
CMO: Collateralized Mortgage Obligation
DUS: Delegated Underwriting and Servicing
GO: General Obligation
RB: Revenue Bond
REMIC: Real Estate Mortgage Investment Conduit
FUTURES CONTRACTS
| | | | | | | | | | | | | | | | |
| Description | | Number of
Contracts | | | Expiration
Date | | | Notional
Amount | | | Unrealized
Appreciation/
(Depreciation) | |
10 Year U.S. Treasury Note—Short Position | | | 15,990 | | | | Mar 2017 | | | $ | (1,987,257,188 | ) | | $ | 9,006,328 | |
Long Term U.S. Treasury Bond—Short Position | | | 4,373 | | | | Mar 2017 | | | | (700,773,250 | ) | | | 4,588,964 | |
| | | | | | | | | | | | | | | | |
| | | | | | | | | | | | | | $ | 13,595,292 | |
| | | | | | | | | | | | | | | | |
| | |
| PAGE 12 § DODGE & COX INCOME FUND | | See accompanying Notes to Financial Statements |
| | | | |
STATEMENT OF ASSETS AND LIABILITIES | |
| |
| | | December 31, 2016 | |
ASSETS: | | | | |
Investments, at value (cost $45,981,899,833) | | $ | 46,872,215,927 | |
Cash held at broker | | | 47,674,612 | |
Receivable for investments sold | | | 40,724,511 | |
Receivable for Fund shares sold | | | 65,893,425 | |
Interest receivable | | | 362,306,270 | |
Prepaid expenses and other assets | | | 267,861 | |
| | | | |
| | | 47,389,082,606 | |
| | | | |
LIABILITIES: | | | | |
Payable for investments purchased | | | 633,704,221 | |
Payable to broker for variation margin | | | 9,732,906 | |
Payable for Fund shares redeemed | | | 94,839,590 | |
Management fees payable | | | 15,690,038 | |
Accrued expenses | | | 2,660,386 | |
| | | | |
| | | 756,627,141 | |
| | | | |
NET ASSETS | | $ | 46,632,455,465 | |
| | | | |
NET ASSETS CONSIST OF: | | | | |
Paid in capital | | $ | 45,689,048,595 | |
Undistributed net investment income | | | 15,281,161 | |
Undistributed net realized gain | | | 24,214,323 | |
Net unrealized appreciation | | | 903,911,386 | |
| | | | |
| | $ | 46,632,455,465 | |
| | | | |
Fund shares outstanding (par value $0.01 each,
unlimited shares authorized) | | | 3,431,862,629 | |
Net asset value per share | | $ | 13.59 | |
| |
STATEMENT OF OPERATIONS | | | | |
| |
| | | Year Ended
December 31, 2016 | |
INVESTMENT INCOME: | | | | |
Dividends | | $ | 27,047,814 | |
Interest | | | 1,579,933,773 | |
| | | | |
| | | 1,606,981,587 | |
| | | | |
EXPENSES: | | | | |
Management fees | | | 181,911,150 | |
Custody and fund accounting fees | | | 697,284 | |
Transfer agent fees | | | 8,534,759 | |
Professional services | | | 58,187 | |
Shareholder reports | | | 1,794,255 | |
Registration fees | | | 459,259 | |
Trustees’ fees | | | 247,500 | |
Miscellaneous | | | 765,078 | |
| | | | |
| | | 194,467,472 | |
| | | | |
NET INVESTMENT INCOME | | | 1,412,514,115 | |
| | | | |
REALIZED AND UNREALIZED GAIN (LOSS): | | | | |
Net realized gain (loss) | | | | |
Investments | | | 302,192,200 | |
Futures contracts | | | (122,313,926 | ) |
Net change in unrealized appreciation/depreciation | | | | |
Investments | | | 833,172,204 | |
Futures contracts | | | 10,525,946 | |
| | | | |
Net realized and unrealized gain | | | 1,023,576,424 | |
| | | | |
NET CHANGE IN NET ASSETS
FROM OPERATIONS | | $ | 2,436,090,539 | |
| | | | |
| | | | | | | | |
STATEMENT OF CHANGES IN NET ASSETS | |
| | |
| | | Year Ended
December 31, 2016 | | | Year Ended
December 31, 2015 | |
OPERATIONS: | | | | | | | | |
Net investment income | | $ | 1,412,514,115 | | | $ | 1,294,198,890 | |
Net realized gain (loss) | | | 179,878,274 | | | | (89,786,703 | ) |
Net change in unrealized appreciation/depreciation | | | 843,698,150 | | | | (1,501,188,107 | ) |
| | | | | | | | |
| | | 2,436,090,539 | | | | (296,775,920 | ) |
| | | | | | | | |
| | |
DISTRIBUTIONS TO SHAREHOLDERS FROM: | | | | | | | | |
Net investment income | | | (1,410,152,555 | ) | | | (1,293,890,373 | ) |
Net realized gain | | | (62,011,941 | ) | | | (25,501,766 | ) |
| | | | | | | | |
Total distributions | | | (1,472,164,496 | ) | | | (1,319,392,139 | ) |
| | | | | | | | |
| | |
FUND SHARE TRANSACTIONS: | | | | | | | | |
Proceeds from sale of shares | | | 11,299,892,007 | | | | 14,066,640,197 | |
Reinvestment of distributions | | | 1,208,984,389 | | | | 1,067,877,119 | |
Cost of shares redeemed | | | (9,965,599,733 | ) | | | (9,521,033,129 | ) |
| | | | | | | | |
Net change from Fund share transactions | | | 2,543,276,663 | | | | 5,613,484,187 | |
| | | | | | | | |
Total change in net assets | | | 3,507,202,706 | | | | 3,997,316,128 | |
| | |
NET ASSETS: | | | | | | | | |
Beginning of year | | | 43,125,252,759 | | | | 39,127,936,631 | |
| | | | | | | | |
End of year (including undistributed net investment income of $15,281,161 and $12,530,465, respectively) | | $ | 46,632,455,465 | | | $ | 43,125,252,759 | |
| | | | | | | | |
| | |
SHARE INFORMATION: | | | | | | | | |
Shares sold | | | 830,115,244 | | | | 1,023,992,169 | |
Distributions reinvested | | | 88,916,899 | | | | 79,082,204 | |
Shares redeemed | | | (732,099,399 | ) | | | (698,078,052 | ) |
| | | | | | | | |
Net change in shares outstanding | | | 186,932,744 | | | | 404,996,321 | |
| | | | | | | | |
| | |
| See accompanying Notes to Financial Statements | | DODGE & COX INCOME FUND §PAGE 13 |
NOTES TO FINANCIAL STATEMENTS
NOTE 1—ORGANIZATION AND SIGNIFICANT ACCOUNTING POLICIES
Dodge & Cox Income Fund (the “Fund”) is one of the series constituting the Dodge & Cox Funds (the “Trust” or the “Funds”). The Trust is organized as a Delaware statutory trust and is registered under the Investment Company Act of 1940, as amended, as an open-end management investment company. The Fund commenced operations on January 3, 1989, and seeks high and stable current income consistent with long-term preservation of capital. Risk considerations and investment strategies of the Fund are discussed in the Fund’s Prospectus.
The financial statements have been prepared in conformity with accounting principles generally accepted in the United States of America, which require the use of estimates and assumptions by management. Actual results may differ from those estimates. Significant accounting policies are as follows:
Security valuation The Fund’s net assets are typically valued as of the normally scheduled close of trading on the New York Stock Exchange (NYSE), generally 4:00 p.m. Eastern Time, each day that the NYSE is open for business.
Debt securities and non-exchange traded derivatives are valued based on prices received from independent pricing services which utilize both dealer-supplied valuations and pricing models. Pricing models may consider quoted prices for similar securities, interest rates, cash flows (including prepayment speeds), and credit risk. Exchange-traded derivatives are valued at the settlement price determined by the relevant exchange. Security values are not discounted based on the size of the Fund’s position. Short-term securities less than 60 days to maturity may be valued at amortized cost if amortized cost approximates current value. Mutual funds are valued at their respective net asset values. All securities held by the Fund are denominated in U.S. dollars.
If market quotations are not readily available or if a security’s value is believed to have materially changed after the close of the security’s primary market but before the close of trading on the NYSE, the security is valued at fair value as determined in good faith by or under the direction of the Fund’s Board of Trustees. The Board of Trustees has appointed Dodge & Cox, the Fund’s investment manager, to make fair value determinations in accordance with the Dodge & Cox Funds Valuation Policies (“Valuation Policies”), subject to Board oversight. Dodge & Cox has established a Pricing Committee that is comprised of representatives from Treasury, Legal, Compliance, and Operations. The Pricing Committee is responsible for implementing the Valuation Policies, including determining the fair value of securities when market quotations or market-based valuations are not readily available or are deemed unreliable. The Pricing Committee considers relevant indications of value that are reasonably available to it in determining the fair value assigned to a particular security, such as the value of similar financial instruments, trading volumes, contractual restrictions on disposition, related corporate actions, and changes in economic conditions. In doing so, the Pricing Committee employs various methods for calibrating fair valuation
approaches, including a regular review of key inputs and assumptions, back-testing, and review of any related market activity.
Valuing securities through a fair value determination involves greater reliance on judgment than valuation of securities based on readily available market quotations. In some instances, lack of information and uncertainty as to the significance of information may lead to a conclusion that a prior valuation is the best indication of a security’s value. When fair value pricing is employed, the prices of securities used by the Fund to calculate its NAV may differ from quoted or published prices for the same securities.
Security transactions, investment income, expenses, and distributions Security transactions are recorded on the trade date. Realized gains and losses on securities sold are determined on the basis of identified cost.
Interest income is recorded on the accrual basis. Interest income includes coupon interest, amortization of premium and accretion of discount on debt securities, and gain/loss on paydowns. The ability of the issuers of the debt securities held by the Fund to meet their obligations may be affected by economic developments in a specific industry, state, or region. Debt obligations may be placed on non-accrual status and related interest income may be reduced by ceasing current accruals and writing off interest receivables when the collection of all or a portion of interest has become doubtful. A debt obligation is removed from non-accrual status when the issuer resumes interest payments or when collectibility of interest is reasonably assured. Dividend income is recorded on the ex-dividend date.
Expenses are recorded on the accrual basis. Some expenses of the Trust can be directly attributed to a specific series. Expenses which cannot be directly attributed are allocated among the Funds in the Trust using methodologies determined by the nature of the expense.
Distributions to shareholders are recorded on the ex-dividend date.
Repurchase agreements The Fund enters into repurchase agreements, secured by U.S. government or agency securities, which involve the purchase of securities from a counterparty with a simultaneous commitment to resell the securities at an agreed-upon date and price. It is the Fund’s policy that its custodian take possession of the underlying collateral securities, the fair value of which exceeds the principal amount of the repurchase transaction, including accrued interest, at all times. In the event of default by the counterparty, the Fund has the contractual right to liquidate the securities and to apply the proceeds in satisfaction of the obligation.
Futures Contracts Futures contracts involve an obligation to purchase or sell (depending on whether the Fund has entered a long or short futures contract, respectively) an asset at a future date, at a price set at the time of the contract. Upon entering into a futures contract, the Fund is required to deposit an amount of cash or liquid assets (referred to as initial margin) in a segregated account with the clearing broker. Subsequent payments (referred to as variation margin) to and from the clearing broker are made
PAGE 14 § DODGE & COX INCOME FUND
NOTES TO FINANCIAL STATEMENTS
on a daily basis based on changes in the market value of futures contracts. Futures contracts are traded publicly and their market value changes daily. Changes in the market value of open futures contracts are recorded as unrealized appreciation or depreciation in the Statement of Operations. Realized gains and losses on futures contracts are recorded in the Statement of Operations at the closing or expiration of the contracts. Cash deposited with a broker as initial margin is recorded on the Statement of Assets and Liabilities. A receivable and/or payable to brokers for daily variation margin is also recorded on the Statement of Assets and Liabilities.
Investments in futures contracts may include certain risks, which may be different from, and potentially greater than, those of the underlying securities. To the extent the Fund uses futures, it is exposed to additional volatility and potential losses resulting from leverage.
The Fund has maintained short Treasury futures contracts to assist with the management of the portfolio’s interest rate exposure. During the year ended December 31, 2016, these Treasury futures contracts had notional values ranging from 5% to 10% of net assets.
Indemnification Under the Trust’s organizational documents, its officers and trustees are indemnified against certain liabilities arising out of the performance of their duties to the Trust. In addition, in the normal course of business the Trust enters into contracts that provide general indemnities to other parties. The Trust’s maximum exposure under these arrangements is unknown as this would involve future claims that may be made against the Trust that have not yet occurred.
NOTE 2—VALUATION MEASUREMENTS
Various inputs are used in determining the value of the Fund’s investments. These inputs are summarized in the three broad levels listed below.
| § | | Level 1: Quoted prices in active markets for identical securities |
| § | | Level 2: Other significant observable inputs (including quoted prices for similar securities, market indices, interest rates, credit risk, forward exchange rates, etc.) |
| § | | Level 3: Significant unobservable inputs (including Fund management’s assumptions in determining the fair value of investments) |
The inputs or methodology used for valuing securities are not necessarily an indication of the risk associated with investing in those securities.
The following is a summary of the inputs used to value the Fund’s holdings at December 31, 2016:
| | | | | | | | |
| Classification(a) | | LEVEL 1
(Quoted Prices) | | | LEVEL 2
(Other Significant
Observable Inputs) | |
Securities | | | | | | | | |
Debt Securities | | | | | | | | |
U.S. Treasury | | $ | — | | | $ | 6,737,076,096 | |
Government-Related | | | — | | | | 3,218,367,125 | |
Mortgage-Related | | | — | | | | 14,959,485,783 | |
Asset-Backed | | | — | | | | 1,517,922,726 | |
Corporate | | | — | | | | 18,811,949,119 | |
Short-term Investments | | | | | | | | |
Commercial Paper | | | — | | | | 350,308,249 | |
Money Market Fund | | | 46,573,829 | | | | — | |
Repurchase Agreement | | | — | | | | 1,230,533,000 | |
| | | | | | | | |
Total Securities | | $ | 46,573,829 | | | $ | 46,825,642,098 | |
| | | | | | | | |
| | | | | |
Other Financial Instruments | | | | | | | | |
Futures Contracts | | | | | | | | |
Appreciation | | $ | 13,595,292 | | | $ | — | |
| | | | | | | | | |
| (a) | There were no transfers between Level 1 and Level 2 during the year ended December 31, 2016. There were no Level 3 securities at December 31, 2016 and 2015 and there were no transfers to Level 3 during the year. |
NOTE 3—RELATED PARTY TRANSACTIONS
Management fees Under a written agreement approved by a unanimous vote of the Board of Trustees, the Fund pays an annual management fee of 0.50% of the Fund’s average daily net assets up to $100 million and 0.40% of the Fund’s average daily net assets in excess of $100 million to Dodge & Cox, investment manager of the Fund. The agreement further provides that Dodge & Cox shall waive its fee to the extent that such fee plus all other ordinary operating expenses of the Fund exceed 1% of the average daily net assets for the year.
Fund officers and trustees All officers and two of the trustees of the Trust are officers or employees of Dodge & Cox. The Trust pays a fee only to those trustees who are not affiliated with Dodge & Cox.
NOTE 4—INCOME TAX INFORMATION AND DISTRIBUTIONS TO SHAREHOLDERS
A provision for federal income taxes is not required since the Fund intends to continue to qualify as a regulated investment company under Subchapter M of the Internal Revenue Code and distribute all of its taxable income to shareholders. Distributions are determined in accordance with income tax regulations, and such amounts may differ from net investment income and realized gains for financial reporting purposes. Financial reporting records are adjusted for permanent book to tax differences at year end to reflect tax character.
Book to tax differences are primarily due to differing treatments of wash sales, net short-term realized gain (loss), and futures contracts. At December 31, 2016, the cost of investments for federal income tax purposes was $45,981,925,031.
DODGE & COX INCOME FUND §PAGE 15
NOTES TO FINANCIAL STATEMENTS
Distributions during the years noted below were characterized as follows for federal income tax purposes:
| | | | | | | | |
| | | Year Ended December 31, 2016 | | | Year Ended December 31, 2015 | |
Ordinary income | | | $1,410,152,555 | | | | $1,300,100,143 | |
| | | ($0.422 per share) | | | | ($0.405 per share) | |
| | |
Long-term capital gain | | | $62,011,941 | | | | $19,291,706 | |
| | | ($0.019 per share) | | | | ($0.006 per share) | |
At December 31, 2016, the tax basis components of distributable earnings were as follows:
| | | | |
Unrealized appreciation | | $ | 1,266,212,322 | |
Unrealized depreciation | | | (375,921,426 | ) |
| | | | |
Net unrealized appreciation | | | 890,290,896 | |
Undistributed ordinary income | | | 15,281,161 | |
Undistributed long-term capital gain | | | 37,834,813 | |
Fund management has reviewed the tax positions for open periods (three years and four years, respectively, from filing the Fund’s Federal and State tax returns) as applicable to the Fund, and has determined that no provision for income tax is required in the Fund’s financial statements.
NOTE 5—LOAN FACILITIES
Pursuant to an exemptive order issued by the Securities and Exchange Commission (SEC), the Fund may participate in an interfund lending facility (Facility). The Facility allows the Fund to borrow money from or loan money to the Funds. Loans under the Facility are made for temporary or emergency purposes, such as to fund shareholder redemption requests. Interest on borrowings is the average of the current repurchase agreement rate and the bank loan rate. There was no activity in the Facility during the year.
All Funds in the Trust participate in a $500 million committed credit facility (Line of Credit) with State Street Bank and Trust Company, to be utilized for temporary or emergency purposes to fund shareholder redemptions or for other short-term liquidity purposes. The maximum amount available to the Fund is $250 million. Each Fund pays an annual commitment fee on its pro-rata portion of the Line of Credit. For the year ended December 31, 2016, the Fund’s commitment fee amounted to $233,291 and is reflected as a Miscellaneous Expense in the Statement of Operations. Interest on borrowings is charged at the prevailing rate. There were no borrowings on the Line of Credit during the year.
NOTE 6—PURCHASES AND SALES OF INVESTMENTS
For the year ended December 31, 2016, purchases and sales of securities, other than short-term securities and U.S. government securities, aggregated $2,731,572,045 and $5,949,779,088, respectively. For the year ended December 31, 2016, purchases and sales of U.S. government securities aggregated $11,956,854,817 and $6,189,629,755, respectively.
NOTE 7—NEW ACCOUNTING GUIDANCE
In October 2016, the SEC issued a new rule, Investment Company Reporting Modernization, which, among other provisions, amends Regulation S-X to require standardized, enhanced disclosures, particularly related to derivatives, in investment company financial statements. Compliance with the guidance is required for financial statements filed with the SEC on or after August 1, 2017. Management is currently assessing the impact of this rule to the Fund’s financial statements and other filings and does not expect any impact to the Fund’s net assets or results of operations.
NOTE 8—SUBSEQUENT EVENTS
Fund management has determined that no material events or transactions occurred subsequent to December 31, 2016, and through the date of the Fund’s financial statements issuance, which require additional disclosure in the Fund’s financial statements.
PAGE 16 § DODGE & COX INCOME FUND
FINANCIAL HIGHLIGHTS
| | | | | | | | | | | | | | | | | | | | |
SELECTED DATA AND RATIOS (for a share outstanding throughout each year) | | Year Ended December 31, | |
| | | 2016 | | | 2015 | | | 2014 | | | 2013 | | | 2012 | |
| | | | |
Net asset value, beginning of year | | | $13.29 | | | | $13.78 | | | | $13.53 | | | | $13.86 | | | | $13.30 | |
Income from investment operations: | | | | | | | | | | | | | | | | | | | | |
Net investment income | | | 0.42 | | | | 0.40 | | | | 0.39 | | | | 0.42 | | | | 0.48 | |
Net realized and unrealized gain (loss) | | | 0.32 | | | | (0.48 | ) | | | 0.35 | | | | (0.33 | ) | | | 0.56 | |
| | | | |
Total from investment operations | | | 0.74 | | | | (0.08 | ) | | | 0.74 | | | | 0.09 | | | | 1.04 | |
| | | | |
Distributions to shareholders from: | | | | | | | | | | | | | | | | | | | | |
Net investment income | | | (0.42 | ) | | | (0.40 | ) | | | (0.39 | ) | | | (0.42 | ) | | | (0.48 | ) |
Net realized gain | | | (0.02 | ) | | | (0.01 | ) | | | (0.10 | ) | | | — | | | | — | |
| | | | |
Total distributions | | | (0.44 | ) | | | (0.41 | ) | | | (0.49 | ) | | | (0.42 | ) | | | (0.48 | ) |
| | | | |
Net asset value, end of year | | | $13.59 | | | | $13.29 | | | | $13.78 | | | | $13.53 | | | | $13.86 | |
| | | | |
Total return | | | 5.62 | % | | | (0.59 | )% | | | 5.48 | % | | | 0.64 | % | | | 7.94 | % |
Ratios/supplemental data: | | | | | | | | | | | | | | | | | | | | |
Net assets, end of year (millions) | | | $46,632 | | | | $43,125 | | | | $39,128 | | | | $24,654 | | | | $26,539 | |
Ratio of expenses to average net assets | | | 0.43 | % | | | 0.43 | % | | | 0.44 | % | | | 0.43 | % | | | 0.43 | % |
Ratio of net investment income to average net assets | | | 3.11 | % | | | 2.97 | % | | | 2.89 | % | | | 3.00 | % | | | 3.52 | % |
Portfolio turnover rate | | | 27 | % | | | 24 | % | | | 27 | % | | | 38 | % | | | 26 | % |
See accompanying Notes to Financial Statements
DODGE & COX INCOME FUND §PAGE 17
REPORT OF INDEPENDENT REGISTERED PUBLIC ACCOUNTING FIRM
To the Trustees of Dodge & Cox Funds and Shareholders of Dodge & Cox Income Fund
In our opinion, the accompanying statement of assets and liabilities, including the portfolio of investments, and the related statements of operations and of changes in net assets and the financial highlights present fairly, in all material respects, the financial position of Dodge & Cox Income Fund (one of the series constituting Dodge & Cox Funds, hereafter referred to as the “Fund”) as of December 31, 2016, the results of its operations for the year then ended, the changes in its net assets for each of the two years in the period then ended and the financial highlights for each of the five years in the period then ended, in conformity with accounting principles generally accepted in the United States of America. These financial statements and financial highlights (hereafter referred to as “financial statements”) are the responsibility of the Fund’s management. Our responsibility is to express an opinion on these financial statements based on our audits. We conducted our audits of these financial statements in accordance with the standards of the Public Company Accounting Oversight Board (United States). Those standards require that we plan and perform the audit to obtain reasonable assurance about whether the financial statements are free of material misstatement. An audit includes examining, on a test basis, evidence supporting the amounts and disclosures in the financial statements, assessing the accounting principles used and significant estimates made by management, and evaluating the overall financial statement presentation. We believe that our audits, which included confirmation of securities as of December 31, 2016 by correspondence with the custodian and brokers, provide a reasonable basis for our opinion.
PricewaterhouseCoopers LLP
San Francisco, California
February 15, 2017
PAGE 18 § DODGE & COX INCOME FUND
BOARD APPROVAL OF FUNDS’ INVESTMENT MANAGEMENT AGREEMENTS AND MANAGEMENT FEES
(unaudited)
The Board of Trustees is responsible for overseeing the performance of the Dodge & Cox Funds’ investment manager and determining whether to continue the Investment Management Agreements between the Funds and Dodge & Cox each year (the “Agreements”). At a meeting of the Board of Trustees of the Trust held on December 14, 2016, the Trustees, by a unanimous vote (including a separate vote of those Trustees who are not “interested persons” (as defined in the Investment Company Act of 1940) (the “Independent Trustees”)), approved the renewal of the Agreements for an additional one-year term through December 31, 2017 with respect to each Fund. During the course of the year, the Board received extensive information and materials relating to the investment management and administrative services provided by Dodge & Cox and the performance of each of the Funds.
INFORMATION RECEIVED
In 2016, the Board requested and received a series of special presentations relating to the proposed renewal of the Funds’ Agreements. These presentations, which took place over the course of the year, covered, among other things, (i) a report about asset management industry trends and the competitive landscape for Dodge & Cox and the Funds; (ii) an extensive presentation regarding economies of scale, which included materials describing key enhancements over the past 15 years in the scope of services that Dodge & Cox furnishes to the Funds; (iii) a detailed presentation by Morningstar® representatives regarding the format, methodology, and content of Morningstar’s 15(c) report; (iv) materials describing peer fund management fees (including funds with breakpoints) and expense ratios and Dodge & Cox’s separate account advisory fee schedules as compared to those of peer firms; and (v) reports by outside counsel regarding mutual fund litigation trends and developments.
In addition to the foregoing and in advance of the meeting, the Board, including each of the Independent Trustees, requested, received, and reviewed materials relating to the Agreements and the services provided by Dodge & Cox. The Independent Trustees retained Morningstar to prepare an independent expense and performance summary for each Fund and comparable funds managed by other advisers identified by Morningstar. The Morningstar materials included information regarding advisory fee rates, expense ratios, and transfer agency, custodial, and distribution expenses, as well as appropriate performance comparisons to each Fund’s peer group and an index or combination of indices. The Morningstar materials also included a comparison of expenses of various share classes offered by comparable funds. The materials reviewed by the Board contained information concerning, among other things, Dodge & Cox’s profitability, financial results and condition, advisory fee revenue and separate account fee schedules. The Board additionally considered the Funds’ brokerage commissions, turnover rates, sales
and redemption data, and the significant investment that Dodge & Cox makes in research used in managing the Funds. The Board received and reviewed memoranda and related materials addressing, among other things, Dodge & Cox’s services to the Funds; how Dodge & Cox Funds’ fees compare to fees of peer group funds; the different fees, services, costs, and risks associated with other accounts managed by Dodge & Cox as compared to the Dodge & Cox Funds; and the ways in which the Funds realize economies of scale. Throughout the process of reviewing the services provided by Dodge & Cox and preparing for the meeting, the Independent Trustees found Dodge & Cox to be open, forthright, detailed, and very helpful in answering questions about all issues. The Board received copies of the Agreements and a memorandum from the independent legal counsel to the Independent Trustees discussing the factors generally regarded as appropriate to consider in evaluating advisory arrangements. The Trust’s Contract Review Committee, consisting solely of Independent Trustees, met with the independent legal counsel on November 3, 2016 and again on December 14, 2016 to discuss whether to renew the Agreements. The Board, including the Independent Trustees, subsequently concluded that the existing Agreements are fair and reasonable and voted to approve the Agreements. In considering the Agreements, the Board, including the Independent Trustees, did not identify any single factor or particular information as all-important or controlling. In reaching the decision to approve the Agreements, the Board considered several factors, discussed below, to be key factors and reached the conclusions described below.
NATURE, QUALITY, AND EXTENT OF THE SERVICES
The Board considered that Dodge & Cox provides a wide range of services to the Funds in addition to portfolio management and that the quality of these services has been excellent in all respects. The extensive nature of services provided by Dodge & Cox has been documented in materials provided to the Board and in presentations made to the Board throughout the year. In particular, the Board considered the nature, quality, and extent of portfolio management, administrative, and shareholder services performed by Dodge & Cox. With regard to portfolio management services, the Board considered Dodge & Cox’s established long-term history of care and conscientiousness in the management of the Funds; its demonstrated consistency in investment approach and depth; the background and experience of the Dodge & Cox Investment Policy Committee, International Investment Policy Committee, Global Stock Investment Policy Committee, Fixed Income Investment Policy Committee, and Global Bond Investment Policy Committee, and research analysts responsible for managing the Funds; Dodge & Cox’s methods for assessing the regulatory and investment climate in various jurisdictions; its overall high level of attention to its core investment management function; and its commitment to the Funds and their shareholders. The Board also considered analysis provided by Morningstar regarding the degree of active management in the Dodge & Cox equity funds and concluded that Dodge & Cox is an active, high conviction manager of equity portfolios, not a “closet index” manager.
DODGE & COX INCOME FUND §PAGE 19
In the area of administrative and shareholder services, the Board considered the excellent quality of Dodge & Cox’s work in areas such as compliance, legal services, trading, proxy voting, technology, oversight of the Funds’ transfer agent and custodian, tax compliance, and shareholder communication through its website and other means. The Board also noted Dodge & Cox’s diligent disclosure policy, its favorable compliance record, and its reputation as a trusted, shareholder-friendly mutual fund family.
In addition, the Board considered that Dodge & Cox manages approximately $180 billion in Fund assets with fewer professionals than most comparable funds, and that on average these professionals have more experience and longer tenure than investment professionals at comparable funds. The Board also noted that Dodge & Cox is an investment research-oriented firm with no other business endeavors to distract management’s attention from its research efforts or to present material conflicts of interest with the operations of the Funds, that its investment professionals adhere to a consistent investment approach across the Funds, and that due to its careful and deliberate strategy with respect to new products, Dodge & Cox has had remarkable stability in its mutual fund product offerings over the course of the past 86 years and has the fewest funds of any of the 25 largest mutual fund families by assets. The Board further considered the favorable stewardship grades given by Morningstar to each of the Funds and the “Gold” analyst rating awarded by Morningstar to all of the Funds except the Global Bond Fund. The Board concluded that it was satisfied with the nature, extent, and quality of investment management and other services provided to the Funds by Dodge & Cox.
INVESTMENT PERFORMANCE
The Board considered short-term and long-term investment performance for each Fund (including periods of outperformance or underperformance) as compared to both relevant indices and the performance of such Fund’s peer group. The Board noted that, as of November 30, 2016, the Funds had strong absolute and relative year-to-date performance, and were also generally solid performers over longer periods. The Board determined after extensive review and inquiry that Dodge & Cox’s historic, long-term, team-oriented, bottom-up investment approach remains consistent and that Dodge & Cox continues to be distinguished by its integrity, transparency, and independence. The Board considered that the performance of the Funds is the result of value-oriented investment management process that emphasizes a long-term investment horizon, comprehensive independent research, team approach, price discipline, low cost, and low portfolio turnover. The Board also considered that the investment performance delivered by Dodge & Cox to the Funds appeared to be consistent with the relevant performance delivered for other clients of Dodge & Cox. The Board concluded that Dodge & Cox has delivered favorable long-term performance for Fund investors consistent with the long-term investment strategies being pursued by the Funds.
COSTS AND ANCILLARY BENEFITS
Costs of Services to Funds: Fees and Expenses. The Board considered each Fund’s management fee rate and expense ratio relative to each Fund’s peer group and relative to management fees charged by Dodge & Cox to other clients. In particular, the Board considered that the Funds continue to be substantially below their peer group median in expense ratios and that many media and industry reports specifically comment on the low expense ratios of the Funds, which have been a defining characteristic of the Funds for many years. The Board also evaluated the operating structures of the Funds and Dodge & Cox, noting that the Funds do not charge front-end sales commissions or distribution fees, and Dodge & Cox bears, among other things, the significant cost of third party research, reimbursement for shareholder recordkeeping and administrative costs to third-party retirement plan administrators, and administrative and office overhead. The Board noted that expenses are well below industry averages.
When compared to peer group funds, the Funds are in the quartile with the lowest expense ratios. The Board also considered that the Funds receive numerous administrative, regulatory compliance, legal, technology, and shareholder support services from Dodge & Cox without any additional administrative fee and the fact that the Funds have relatively low transaction costs and portfolio turnover rates. The Board noted the Funds’ unusual single-share-class structure and reviewed Morningstar data (including asset-weighted average expense ratios) showing that the few peer group funds with lower expense ratios often have other share classes with significantly higher expense ratios. In this regard, the Board considered that many of the Funds’ shareholders would not be eligible to purchase comparably priced shares of many peer group funds, which typically make their lower-priced share classes available only to institutional investors. The Board determined that the Funds provide access for small investors to high quality investment management at a relatively low cost. The Board also considered that the Funds’ are priced to scale, i.e., management fee rates begin at relatively low levels with the result that, even without breakpoints, the Funds’ management fee rates are lower than those of many peer funds whose fee schedules include breakpoints. With respect to non-U.S. funds sponsored and managed by Dodge & Cox that are comparable to the Funds in many respects, the Board noted that the fee rates charged by Dodge & Cox are the same as or higher than the fee rates charged to the Funds.
The Board reviewed information regarding the fee rates Dodge & Cox charges to separate accounts that have investment programs similar to those of the Funds, including instances where separate account fees are lower than Fund fees. The Board considered the significant differences in the nature and scope of services Dodge & Cox provides to the Funds as compared to other client accounts, as well as material differences in regulatory, litigation, and other risks as between Dodge & Cox Funds and other types of clients. The Board noted that different markets exist for mutual fund and institutional separate account management services and that a comparison of Fund fee rates and separate account fee rates must consider the fact that separate account
PAGE 20 § DODGE & COX INCOME FUND
clients bear additional costs and responsibilities that are included in the cost of a Fund. The Board further noted that many sophisticated institutional investors in the Funds that are eligible to open separate accounts at Dodge & Cox have decided for various reasons to invest in the Funds. After consideration of these matters, the Board concluded that the overall costs incurred by the Funds for the services they receive (including the management fee paid to Dodge & Cox) are reasonable and that the fees are acceptable based upon the qualifications, experience, reputation, and performance of Dodge & Cox and the low overall expense ratios of the Funds.
Profitability and Costs of Services to Dodge & Cox; “Fall-out” Benefits. The Board reviewed reports of Dodge & Cox’s financial position, profitability, and estimated overall value and considered Dodge & Cox’s overall profitability within its context as a private, employee-owned S-Corporation and relative to the favorable services provided. The Board noted in particular that Dodge & Cox’s profits are not generated by high fee rates, but reflect an extraordinarily streamlined, efficient, and focused business approach toward investment management.
The Board recognized the importance of Dodge & Cox’s profitability—which is derived solely from management fees and does not include other business ventures—to maintain its independence, stability, company culture and ethics, and management continuity. The Board also considered that the compensation/profit structure at Dodge & Cox includes a return on shareholder employees’ investment in the firm, which is vital for remaining independent and facilitating retention of management and investment professionals. The Board considered independent research indicating that firms that grow organically, rather than through acquisition, tend to have better performance. Key to organic growth is the ability to retain talented and experienced analysts, portfolio managers, and other professionals. The Board also considered that in January 2015, Dodge & Cox closed the International Stock Fund to new investors to proactively manage the growth of the Fund. The Stock Fund and Balanced Fund were similarly closed to new investors during periods of significant growth in the past. While these actions are intended to benefit existing Fund shareholders, the effect is to reduce potential revenues to Dodge & Cox from new shareholders.
The Board also considered potential “fall-out” benefits (including the receipt of research from unaffiliated brokers and reputational benefits to non-U.S. funds sponsored and managed by Dodge & Cox) that Dodge & Cox might receive as a result of its association with the Funds and determined that they are acceptable. The Board also noted that Dodge & Cox continues to invest substantial sums in its business in order to provide enhanced services, systems, and research capabilities, all of which benefit the Funds. The Board concluded that Dodge & Cox’s profitability is the keystone of its independence, stability, and long-term investment performance and that the profitability of Dodge & Cox’s relationship with the Funds (including fall-out benefits) is fair and reasonable.
ECONOMIES OF SCALE
The Board considered whether there have been economies of scale with respect to the management of each Fund, whether the Funds have appropriately benefited from any economies of scale, and whether the management fee rate is reasonable in relation to the level of Fund assets and any economies of scale that may exist. In the Board’s view, any consideration of economies of scale must take account of the Funds’ low fee structure and the considerable efficiencies of the Funds’ organization and fee structure that has been realized by shareholders from the time of each Fund’s inception (i.e., from the first dollar). An assessment of economies of scale must also take into account that Dodge & Cox invests significant time and resources in each new Fund for months (and sometimes years) prior to launch; in addition, expenses are capped, which means that Dodge & Cox subsidizes the operations of a new Fund for a period of time until it reaches scale. The Board observed that, while total Fund assets have grown significantly over the long term, this growth has not been continuous or evenly distributed across all of the Funds, as assets of certain Funds have actually declined over the past ten years.
In addition, the Board noted that Dodge & Cox has shared economies of scale by adding and enhancing services to the Funds over time, and that the internal costs of providing investment management, technology, administrative, legal, and compliance services to the Funds continue to increase. For example, Dodge & Cox has increased its global research staff and investment resources over the years to add important new capabilities for the benefit of Fund shareholders and to address the increased complexity of investing in multinational and non-U.S. companies. In addition, Dodge & Cox has made substantial expenditures in other staff, technology, cybersecurity, and infrastructure to enable it to integrate credit and equity analyses and to be able to implement its strategy in a more effective and secure manner. Over the last ten years, Dodge & Cox has increased its spending on research, investment management, client servicing, and technology including payments for third party research, data services, and computer systems for trading, operations, compliance, accounting, and communications at a rate that has significantly outpaced the Funds’ growth rate during the same period. The Board considered that Dodge & Cox has a history of voluntarily limiting asset growth in several Funds that experienced significant inflows by closing them to new investors in order to protect the Funds’ ability to achieve good investment returns for shareholders. The Board also observed that, even without fee breakpoints, the Funds are competitively priced in a very competitive market and that having a low fee from inception is better for shareholders than starting with a higher fee and adding breakpoints. The Board also noted that there may be certain diseconomies of scale associated with managing large funds, insofar as certain of the costs and risks associated with portfolio management increase as assets grow. The Board concluded that the current Dodge & Cox fee structure is fair and reasonable and adequately shares economies of scale that may exist.
DODGE & COX INCOME FUND §PAGE 21
CONCLUSION
Based on their evaluation of all material factors and assisted by the advice of independent legal counsel to the Independent Trustees, the Board, including the Independent Trustees, concluded that the advisory fee structure was fair and reasonable, that each Fund was paying a competitive fee for the services provided, that the scope and quality of Dodge & Cox’s services has provided substantial value for Fund shareholders over the long term, and that approval of the Agreements was in the best interests of each Fund and its shareholders.
FUND HOLDINGS
The Fund provides a complete list of its holdings four times each fiscal year, as of the end of each quarter. The Fund files the lists with the Securities and Exchange Commission (SEC) on Form N-CSR (second and fourth quarters) and Form N-Q (first and third quarters). Shareholders may view the Fund’s Forms N-CSR and N-Q on the SEC’s website at sec.gov. Forms N-CSR and N-Q may also be reviewed and copied at the SEC’s Public Reference Room in Washington, DC. Information regarding the operations of the Public Reference Room may be obtained by calling 202-551-8090 (direct) or 800-732-0330 (general SEC number). A list of the Fund’s quarter-end holdings is also available at dodgeandcox.com on or about 15 days following each quarter end and remains available on the web site until the list is updated in the subsequent quarter.
PROXY VOTING
For a free copy of the Fund’s proxy voting policies and procedures, please call 800-621-3979, visit the Fund’s website at dodgeandcox.com, or visit the SEC’s website at sec.gov. Information regarding how the Fund voted proxies relating to portfolio securities during the most recent 12-month period ending June 30 is also available at dodgeandcox.com or at sec.gov.
HOUSEHOLD MAILINGS
The Fund routinely mails shareholder reports and summary prospectuses to shareholders and, on occasion, proxy statements. In order to reduce the volume of mail, when possible, only one copy of these documents will be sent to shareholders who are part of the same family and share the same residential address.
If you have a direct account with the Funds and you do not want the mailing of shareholder reports and summary prospectuses combined with other members in your household, contact the Funds at 800-621-3979. Your request will be implemented within 30 days.
PAGE 22 § DODGE & COX INCOME FUND
DODGE & COX FUNDS—EXECUTIVE OFFICER & TRUSTEE INFORMATION
| | | | | | |
Name (Age) and
Address* | | Position with Trust (Year of Election or
Appointment) | | Principal Occupation During Past 5 Years | | Other Directorships Held by Trustees |
| INTERESTED TRUSTEES AND EXECUTIVE OFFICERS |
| Charles F. Pohl (58) | | Chairman and Trustee (Since 2004) | | Chairman (since 2013), Co-President (2011-2013), Senior Vice President (until 2011), and Director of Dodge & Cox; Chief Investment Officer, Portfolio Manager, Investment Analyst, and member of Investment Policy Committee (IPC), Global Stock Investment Policy Committee (GSIPC), International Investment Policy Committee (IIPC), and Fixed Income Investment Policy Committee (FIIPC) | | — |
| Dana M. Emery (55) | | President and Trustee (Trustee since 1993) (President since 2014) | | Chief Executive Officer (since 2013), President (since 2011), Executive Vice President (until 2011), and Director of Dodge & Cox; Director of Fixed Income, Portfolio Manager, and member of FIIPC and Global Bond Investment Policy Committee (GBIPC) | | — |
| Diana S. Strandberg (57) | | Senior Vice President (Since 2006) | | Senior Vice President (since 2011), Vice President (until 2011), and Director (since 2011) of Dodge & Cox; Director of International Equity, Portfolio Manager, Investment Analyst, and member of IPC, GSIPC, IIPC, and GBIPC | | — |
| David H. Longhurst (59) | | Treasurer (Since 2006) | | Vice President and Assistant Treasurer of Dodge & Cox | | — |
| Thomas M. Mistele (63) | | Secretary (Since 1998) | | Chief Operating Officer (until Jan. 2017), Director, Secretary, Senior Counsel (since 2011), and General Counsel (until 2011) of Dodge & Cox | | — |
| Katherine M. Primas (42) | | Chief Compliance Officer (Since 2010) | | Vice President (since 2011) and Chief Compliance Officer of Dodge & Cox | | — |
| INDEPENDENT TRUSTEES |
| Thomas A. Larsen (67) | | Trustee (Since 2002) | | Senior Counsel of Arnold & Porter Kaye Scholer LLP (law firm) (since 2013); Partner of Arnold & Porter LLP (until 2012); Director of Howard, Rice, Nemerovski, Canady, Falk & Rabkin (1977-2011) | | — |
| Ann Mather (56) | | Trustee (Since 2011) | | CFO, Pixar Animation Studios (1999-2004) | | Director, Google, Inc. (internet information services) (since 2005); Director, Glu Mobile, Inc. (multimedia software) (since 2004); Director, Netflix, Inc. (internet television) (since 2010); Director, Arista Networks (cloud networking) (since 2013); Director, Shutterfly, Inc. (internet photography services/publishing) (since 2013) |
| Robert B. Morris III (64) | | Trustee (Since 2011) | | Advisory Director, The Presidio Group (2005-2016); Partner and Managing Director—Global Investment Research at Goldman Sachs (until 2001) | | — |
| Gary Roughead (65) | | Trustee (Since 2013) | | Robert and Marion Oster Distinguished Military Fellow, Hoover Institution (since 2012); Admiral, United States Navy (Ret.); U.S. Navy Chief of Naval Operations (2008-2011) | | Director, Northrop Grumman Corp. (global security) (since 2012); Director, Maersk Line, Limited (shipping and transportation) (since 2016) |
| Mark E. Smith (65) | | Trustee (Since 2014) | | Executive Vice President, Managing Director—Fixed Income at Loomis Sayles & Company, L.P. (2003-2011) | | — |
| John B. Taylor (70) | | Trustee (Since 2005) (and 1995-2001) | | Professor of Economics, Stanford University (since 1984); Senior Fellow, Hoover Institution (since 1996); Under Secretary for International Affairs, United States Treasury (2001-2005) | | — |
| * | | The address for each Officer and Trustee is 555 California Street, 40th Floor, San Francisco, California 94104. Each Officer and Trustee oversees all six series in the Dodge & Cox Funds complex and serves for an indefinite term. |
Additional information about the Trust’s Trustees and Officers is available in the Trust’s Statement of Additional Information (SAI). You can get a free copy of the SAI by visiting the Funds’ website at dodgeandcox.com or calling
800-621-3979.
DODGE & COX INCOME FUND §PAGE 23
dodgeandcox.com
For Fund literature, transactions, and account
information, please visit the Funds’ website.
or write or call:
DODGE & COX FUNDS
c/o Boston Financial Data Services
P.O. Box 8422
Boston, Massachusetts 02266-8422
(800) 621-3979
INVESTMENT MANAGER
Dodge & Cox
555 California Street, 40th Floor
San Francisco, California 94104
(415) 981-1710
This report is submitted for the general information of the shareholders of the Fund. The report is not authorized for distribution to prospective investors in the Fund unless it is accompanied by a current prospectus.
This report reflects our views, opinions, and portfolio holdings as of December 31, 2016, the end of the reporting period. Any such views are subject to change at any time based upon market or other conditions and Dodge & Cox disclaims any responsibility to update such views. These views may not be relied on as investment advice and, because investment decisions for a Dodge & Cox Fund are based on numerous factors, may not be relied on as an indication of trading intent on behalf of any Dodge & Cox Fund.
DODGE & COX FUNDS®
Annual Report
December 31, 2016
Global Bond Fund
ESTABLISHED 2014
TICKER: DODLX
12/16 GBF AR Printed on recycled paper
TO OUR SHAREHOLDERS
The Dodge & Cox Global Bond Fund had a total return of 8.6% for the year ended December 31, 2016, compared to a return of 2.1% for the Bloomberg Barclays Global Aggregate Bond Index (Bloomberg Barclays Global Agg).
MARKET COMMENTARY
During 2016, economic and political shocks rattled global financial markets and included the devaluation of the Chinese renminbi, the UK vote to leave the European Union (Brexit), and Donald Trump’s victory in the U.S. presidential election, as well as political upheaval in several emerging market countries. The U.S. dollar and interest rates generally followed a v-shaped pattern over the course of the year, declining early on and reversing course midway through the year. The upward movement accelerated in the fourth quarter, fueled by expectations that Mr. Trump and the Republican-controlled Congress could boost growth (and inflation) via stimulative fiscal policies and scaled-back business regulation. These moves drove significant volatility in Bloomberg Barclays Global Agg returns, which were modestly positive for the year but returned 5.9% in the first quarter and declined 7.1% in the fourth quarter. Year-over-year, the U.S. dollar appreciated 5% on a broad trade-weighted basis and longer-term U.S. interest rates rose modestly.
Corporate bonds had a banner year, returning over 6%, but also experiencing high interim volatility. Fear centered around China and commodity prices drove especially weak performance in the first two months of the year. However, credit spreads subsequently reversed not only 2016’s widening but all of 2015’s as well. Commodity-related issuers and lower-rated bonds fared particularly well, with the Bloomberg Barclays Global High Yield Index returning 14%, exceeding the S&P 500 return of 12%.
After a weak first quarter, the U.S. economy strengthened throughout the year, with encouraging signs from consumers, labor and housing markets, along with an improved manufacturing sector. These positive developments and a higher inflation outlook led the Federal Reserve (Fed) to raise interest rates for only the second time since the financial crisis. Meanwhile, the Bank of Japan, European Central Bank, and Bank of England continued stimulative policies and expanded asset purchase programs. The exceptionally low (or negative) levels of interest rates in these markets (e.g., 10-year rates in Germany and Japan of 0.21% and 0.05%, respectively) contributed to an ongoing search for yield in global markets.
Emerging market currency performance was highly differentiated in 2016 (e.g., the Brazilian real appreciated 22% while the Turkish lira fell 17%). Generally speaking, commodity-exporters fared best while currencies in countries with geopolitical risks and/or those most vulnerable to changes in trade policies with the United States suffered. Political and economic risks for many emerging market countries are elevated, but in several cases, currencies are undervalued and interest rates are high, providing scope for country selection to provide value over a long-term investment horizon.
INVESTMENT STRATEGY
The Fund’s 2016 performance was strong on an absolute and relative basis, led by significant gains in credit securities,(a)
reflecting Dodge & Cox’s expertise in this area. Whereas many global bond funds focus on government securities and are guided by a top-down investment style, our process is driven from the bottom up as we scour the global bond universe and apply our intensive research process to identify a select group of attractive securities. We construct our portfolio based on this bottom-up approach, carefully balancing the attendant risks and opportunities. We believe this philosophy and process will serve us well going forward, as it did in 2016.
Performance during 2016 also highlights our staying power through difficult market environments. In February, when panic gripped the markets, many of the Fund’s commodity-related and/or emerging market holdings (e.g., Rio Oil, Petrobras, Teck Resources, Kinder Morgan(b)) fell in value. Our extensive experience and research process provided us with the conviction to hold these securities, despite short-term volatility and underperformance. In fact, these holdings ended 2016 as the Fund’s strongest performers.
The surge in credit valuations that drove performance means that these valuations are now less compelling than they were at the beginning of 2016. In this environment we have reduced the Fund’s credit weighting but remain constructive on the outlook for credit. We have also moderately increased the duration(c) of the portfolio and increased our U.S. dollar weighting. These changes are discussed below.
Credit: Is the Party Over?
2016 was an exceptional year for credit markets and the Fund benefited handsomely from both its high weighting in credit as well as strong security selection within the credit universe. As discussed earlier, many of the strongest performers in 2016 were the weakest performers in 2015, particularly emerging market and/or commodity-related holdings. As the year progressed and valuations rose, we reduced exposure to selected credits that performed well, exhibiting valuation discipline as we capitalized on improvements in commodity prices and investor sentiment. As a result, the Fund’s corporate weighting fell by 8% during 2016, but remains a large component of the Fund (49%(d)). As we exit a year with such strong performance for corporate bonds, does it make sense to continue to hold such a high (albeit reduced) weighting? To answer this question, we focus on valuation and long-term fundamentals, and we believe the answer is yes.
First, it’s important to emphasize that the Fund’s credit weighting is the result of our bottom-up approach to portfolio construction rather than a top-down view of the market. It is undeniable that broad credit market valuations are less compelling today than they were in recent years. The Bloomberg Barclays Global Credit Index’s option-adjusted spread of 125 is below its 5- and 10-year medians, but well above its post-crisis low in mid-2014. We are in the later stages of a long-tenured economic expansion which could peak over our time horizon, but we see no clear catalyst for broad-based deterioration. Corporate leverage has risen in recent years, but not to alarming levels, while interest coverage remains robust, commodity prices have stabilized, and banks are well
PAGE 2 § DODGE & COX GLOBAL BOND FUND
capitalized. The Fed’s gradual hiking cycle, the business-friendly bias of the new Republican administration, and the continued accommodative stances of central banks outside the United States should support credit valuations. Thus, on balance, we retain a positive outlook for credit and particularly for the Fund’s credit holdings which are selected on an individual basis because of their fundamental and relative attractiveness. However, as always, we remain vigilant regarding potential shifts in sentiment or cracks in the foundation of our underlying fundamental views, and remain highly selective in adding credit exposure.
Despite a net reduction in credit during 2016, we continued to find new attractive investment opportunities. One of the Fund’s newer holdings is Ultrapar Participaceoes, a leading distributor of fuel for cars and trucks, as well as residential cooking. Ultrapar was a relatively unknown issuer for the U.S. bond market but was previously a long-held equity investment at Dodge & Cox and thus a company that our investment team knows well. As a result, we were able to capitalize on the company’s new bond issue in September. Our investment thesis centers on Ultrapar’s franchise strength, strong free cash flow generation, conservative leverage philosophy, and high-quality management team. The security was attractively priced, reflecting the headline risks of being in a challenged country (Brazil) and industry (Energy), but we believe the fundamental strength of the business largely mitigates these risks. Even as Brazil’s economy contracted in 2015 and 2016 and energy prices swooned, Ultrapar’s profits grew.
Currency: Finding Diamonds in the Rough
The Fund’s U.S. dollar weighting of 86% reflects our team’s assessment that the return prospects for many non-U.S. developed market currencies are meager, especially on a risk-adjusted basis. In 2016, the broad trade-weighted dollar rose for the fifth consecutive year, creating a challenging environment for investing in non-U.S. currencies. But the rally in 2016 was both smaller in magnitude and less broad-based than that of 2015, with high dispersion in currency returns providing ample opportunity for country and currency selection in 2016. The Fund’s holdings in the Colombian peso and the Chilean peso did well, while the Mexican peso exposure was a significant detractor from Fund returns. Mexico faces a number of headwinds, including uncertainty over U.S. relations and trade policies, fiscal and current account deficits, and dwindling oil production. However, we believe the outlook is promising given that macroeconomic policymaking remains sound, the benefits from structural reforms should materialize over time, and the currency looks significantly undervalued, reflecting excessive pessimism.
Our research team conducts rigorous country analysis, considering qualitative factors and utilizing a variety of quantitative tools to assess valuation and identify key drivers of individual currencies. The Fund’s newest currency exposure is the Peruvian Sol. Peru has a relatively high growth rate (around 4%), stable and relatively low inflation levels, and strong and credible policymakers. The currency appears moderately undervalued and the central bank intervenes to mitigate its volatility, improving the risk/reward proposition.
Rates: Caution Still Warranted
We continue to be concerned about the absolute level of interest rates, which offer only scant compensation available to offset even small increases from today’s very low starting yields. Despite a notable rise in global interest rates after the U.S. election in November, yields in Europe and Japan fell over the year and U.S. rates rose only modestly. The Fund’s overall duration of 3.7 years reflects our caution with regards to interest rate risk. However, we believe interest rate levels are more appealing in selected markets. For example, during the fourth quarter, we increased the Fund’s duration in Peru, Colombia, and Mexico, via the purchase of 10- to 12-year maturity bonds with yields between 6% and 8%. We believe these yields provide attractive compensation relative to inflation, currency, and other country risks.
In the United States, we expect the Fed to raise rates gradually but slightly faster than what is currently priced in by the markets. This belief is underpinned by the strength of the U.S. economy and rising inflation expectations. While uncertainty exists, the potential for increased fiscal stimulus under the new administration could push yields even higher over a long-run horizon.
IN CLOSING
The uncertainty and shocks that characterized 2016 seem more likely than not to continue in 2017, given a range of upcoming elections across the globe and the big unknowns regarding President Trump’s policies. But uncertainty is a challenge, not a roadblock to successful investing. And for patient investors like us, uncertainty can present attractive risk/reward opportunities. We believe our experienced investment team and our bottom-up, value-oriented, active investment approach will serve the Fund well through this environment and beyond.
Thank you for your continued confidence in our firm. As always, we welcome your comments and questions.
For the Board of Trustees,
| | |
| |
|
Charles F. Pohl, Chairman | | Dana M. Emery, President |
January 31, 2017
| (a) | | Credit securities refers to corporate bonds and government-related securities, as classified by Bloomberg. |
| (b) | | The use of specific examples does not imply that they are more attractive investments than the Fund’s other holdings. |
| (c) | | Duration is a measure of a bond’s (or a bond portfolio’s) price sensitivity to changes in interest rates. |
| (d) | | Unless otherwise specified, all weightings and characteristics are as of December 31, 2016. |
DODGE & COX GLOBAL BOND FUND §PAGE 3
ANNUAL PERFORMANCE REVIEW
The Fund outperformed the Bloomberg Barclays Global Agg by 6.6 percentage points in 2016.
Key Contributors to Relative Results
| | § | | Security selection contributed significantly to outperformance, led by Brazil holdings (including Rio Oil Finance Trust and Petrobras) and other energy-related securities (including Kinder Morgan and Teck Resources). | |
| | § | | The Fund’s relatively low exposure to the euro and the pound (combined 3% versus 30% in the Bloomberg Barclays Global Agg), which depreciated 3% and 16% versus the U.S. dollar, respectively, boosted relative performance. | |
| | § | | The Fund’s government bond holdings in Brazil, Colombia, and Chile (combined 6% versus 0.01% in the Bloomberg Barclays Global Agg) added to relative returns. | |
| | § | | The Fund’s higher allocation to corporate bonds (58% versus 18% in the Bloomberg Barclays Global Agg) added to relative returns as credit yield premiums tightened. | |
Key Detractors from Relative Results
| | § | | The Fund’s minimal exposure to declining long-term government bond yields in Europe and Japan detracted from relative returns. | |
| | § | | The Fund’s overweight to the Mexican peso (8% versus 0.4% in the Bloomberg Barclays Global Agg) detracted from returns as the currency depreciated 17% versus the U.S. dollar. | |
| | | | Unless otherwise noted, figures cited in this section denote Fund positioning at the beginning of the period. | |
KEY CHARACTERISTICS OF DODGE & COX
Independent Organization
Dodge & Cox is one of the largest privately owned investment managers in the world. We remain committed to independence, with a goal of providing the highest quality investment management service to our existing clients.
Over 85 Years of Investment Experience
Dodge & Cox was founded in 1930. We have a stable and well-qualified team of investment professionals, most of whom have spent their entire careers at Dodge & Cox.
Experienced Investment Team
The Global Bond Investment Policy Committee, which is the decision-making body for the Global Bond Fund, is a six-member committee with an average tenure at Dodge & Cox of 21 years.
One Business with a Single Research Office
Dodge & Cox manages equity (domestic, international, and global), fixed income (domestic and global), and balanced investments, operating from one office in San Francisco.
Consistent Investment Approach
Our team decision-making process involves thorough, bottom-up fundamental analysis of each investment.
Long-Term Focus and Low Expenses
We invest with a three- to five-year investment horizon, which has historically resulted in low turnover relative to our peers. We manage Funds that maintain low expense ratios.
Risks: The yields and market values of the instruments in which the Fund invests may fluctuate. Accordingly, an investment may be worth more or less than its original cost. Debt securities are subject to interest rate risk, credit risk, and prepayment and call risk, all of which could have adverse effects on the value of the Fund. A low interest rate environment creates an elevated risk of future negative returns. Financial intermediaries may restrict their market making activities for certain debt securities, which may reduce the liquidity and increase the volatility of such securities. Investing in non-U.S. securities may entail risk due to foreign economic and political developments; this risk may be increased when investing in emerging markets. The Fund is also subject to currency risk. Please read the prospectus and summary prospectus for specific details regarding the Fund’s risk profile.
PAGE 4 § DODGE & COX GLOBAL BOND FUND
GROWTH OF $10,000 SINCE INCEPTION
FOR AN INVESTMENT MADE ON DECEMBER 5, 2012
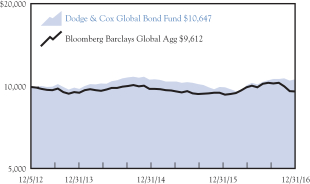
AVERAGE ANNUAL TOTAL RETURN
FOR PERIODS ENDED DECEMBER 31, 2016
| | | | | | | | | | | | |
| | | 1 Year | | | 3 Years | | | Since
Inception
(12/5/12) | |
| | | | | | | | | | | | |
Dodge & Cox Global Bond Fund(a) | | | 8.64 | % | | | 1.19 | % | | | 1.56 | % |
Bloomberg Barclays Global Aggregate Bond Index (Bloomberg Barclays Global Agg) | | | 2.09 | | | | –0.19 | | | | –0.96 | |
| (a) | | Expense reimbursements have been in effect for the Fund since its inception. Without the expense reimbursements, returns for the Fund would have been lower. The Fund’s returns since May 1, 2014 are as presented in the Financial Highlights. |
Returns represent past performance and do not guarantee future results. Investment return and share price will fluctuate with market conditions, and investors may have a gain or loss when shares are sold. Fund performance changes over time and currently may be significantly lower than stated. Performance is updated and published monthly. Visit the Fund’s website at dodgeandcox.com or call 800-621-3979 for current performance figures.
A private fund managed and funded by Dodge & Cox (the “Private Fund”) was reorganized into the Fund and the Fund commenced operations on May 1, 2014. The Private Fund commenced operations on December 5, 2012 and had an investment objective, policies, and strategies that were, in all material respects, the same as those of the Fund, and was managed in a manner that, in all material respects, complied with the investment guidelines and restrictions of the Fund. However, the Private Fund was not registered as an investment company under the Investment Company Act of 1940 (the “1940 Act”), and therefore was not subject to certain investment limitations, diversification requirements, liquidity requirements, and other restrictions imposed by the 1940 Act and the Internal Revenue Code, which, if applicable, may have adversely affected its performance.
The Fund’s total returns include the reinvestment of dividend and capital gain distributions, but have not been adjusted for any income taxes payable by shareholders on these distributions or on Fund share redemptions. Index returns include interest income but, unlike Fund returns, do not reflect fees or expenses. The Bloomberg Barclays Global Aggregate Bond Index (Bloomberg Barclays Global Agg) is a widely recognized, unmanaged index of multi-currency investment-grade, debt securities.
Bloomberg is a registered trademark of Bloomberg Finance L.P. and its affiliates. Barclays® is a trademark of Barclays Bank PLC.
FUND EXPENSE EXAMPLE
As a Fund shareholder, you incur ongoing Fund costs, including management fees and other Fund expenses. All mutual funds have ongoing costs, sometimes referred to as operating expenses. The following example shows ongoing costs of investing in the Fund and can help you understand these costs and compare them with those of other mutual funds. The example assumes a $1,000 investment held for the six months indicated.
ACTUAL EXPENSES
The first line of the table below provides information about actual account values and expenses based on the Fund’s actual returns. You may use the information in this line, together with your account balance, to estimate the expenses that you paid over the period. Simply divide your account value by $1,000 (for example, an $8,600 account value divided by $1,000 = 8.6), then multiply the result by the number in the first line under the heading “Expenses Paid During Period” to estimate the expenses you paid on your account during this period.
HYPOTHETICAL EXAMPLE FOR COMPARISON WITH OTHER MUTUAL FUNDS
Information on the second line of the table can help you compare ongoing costs of investing in the Fund with those of other mutual funds. This information may not be used to estimate the actual ending account balance or expenses you paid during the period. The hypothetical “Ending Account Value” is based on the actual expense ratio of the Fund and an assumed 5% annual rate of return before expenses (not the Fund’s actual return). The amount under the heading “Expenses Paid During Period” shows the hypothetical expenses your account would have incurred under this scenario. You can compare this figure with the 5% hypothetical examples that appear in shareholder reports of other mutual funds.
| | | | | | | | | | | | |
Six Months Ended December 31, 2016 | | Beginning Account Value
7/1/2016 | | | Ending Account Value
12/31/2016 | | | Expenses Paid
During Period* | |
Based on Actual Fund Return | | $ | 1,000.00 | | | $ | 1,021.90 | | | $ | 3.05 | |
Based on Hypothetical 5% Yearly Return | | | 1,000.00 | | | | 1,022.12 | | | | 3.05 | |
| * | | Expenses are equal to the Fund’s annualized net expense ratio of 0.60%, multiplied by the average account value over the period, multiplied by 184/366 (to reflect the one-half year period). |
The expenses shown in the table highlight ongoing costs only and do not reflect any transactional fees or account maintenance fees. Though other mutual funds may charge such fees, please note that the Fund does not charge transaction fees (e.g., redemption fees, sales loads) or universal account maintenance fees (e.g., small account fees).
DODGE & COX GLOBAL BOND FUND §PAGE 5
| | | | |
| FUND INFORMATION (unaudited) | | | December 31, 2016 | |
| | | | |
| GENERAL INFORMATION | | | |
Net Asset Value Per Share | | | $10.33 | |
Total Net Assets (millions) | | | $109.8 | |
Net Expense Ratio(a) | | | 0.60% | |
2016 Gross Expense Ratio | | | 1.33% | |
Portfolio Turnover Rate | | | 73% | |
30-Day SEC Yield (using net expenses)(a)(b) | | | 3.50% | |
30-Day SEC Yield (using gross expenses) | | | 2.77% | |
Number of Credit Issuers | | | 48 | |
Fund Inception | | | May 1, 2014 | |
| No sales charges or distribution fees | | | | |
Investment Manager: Dodge & Cox, San Francisco. Managed by the Global Bond Investment Policy Committee, whose six members’ average tenure at Dodge & Cox is 21 years.
| | | | | | | | |
| PORTFOLIO CHARACTERISTICS | | Fund | | | BBG Barclays
Global Agg | |
Effective Duration (years) | | | 3.7 | | | | 6.9 | |
Emerging Markets(c) | | | 25.7% | | | | 5.0% | |
| | | | |
| FIVE LARGEST CREDIT ISSUERS (%)(d) | | Fund | |
Kinder Morgan, Inc. | | | 2.0 | |
Cemex SAB de CV | | | 2.0 | |
Telecom Italia SPA | | | 1.9 | |
Chicago Transit Authority RB | | | 1.9 | |
Naspers, Ltd. | | | 1.9 | |
| | | | | | | | |
| CREDIT QUALITY (%)(e)(f) | | Fund | | | BBG Barclays
Global Agg | |
Aaa | | | 20.5 | | | | 40.3 | |
Aa | | | 1.0 | | | | 16.5 | |
A | | | 18.7 | | | | 26.9 | |
Baa | | | 41.5 | | | | 16.3 | |
Ba | | | 11.1 | | | | 0.0 | |
B | | | 2.5 | | | | 0.0 | |
Caa | | | 1.7 | | | | 0.0 | |
Net Cash & Other(g) | | | 3.0 | | | | 0.0 | |
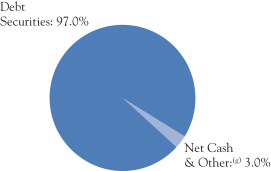
| | | | | | | | |
| SECTOR DIVERSIFICATION (%)(f) | | Fund | | | BBG Barclays
Global Agg | |
Government | | | 20.0 | | | | 54.0 | |
Government-Related | | | 8.5 | | | | 12.2 | |
Securitized | | | 19.9 | | | | 15.2 | |
Corporate | | | 48.6 | | | | 18.6 | |
Net Cash & Other(g) | | | 3.0 | | | | 0.0 | |
| | | | | | | | |
| REGION DIVERSIFICATION (%)(c)(f) | | Fund | | | BBG Barclays
Global Agg | |
United States | | | 51.3 | | | | 39.2 | |
Latin America | | | 20.9 | | | | 1.1 | |
Europe (excluding United Kingdom) | | | 7.3 | | | | 25.2 | |
United Kingdom | | | 6.7 | | | | 5.6 | |
Japan | | | 4.0 | | | | 17.4 | |
Africa/Middle East | | | 2.9 | | | | 0.9 | |
Pacific (excluding Japan) | | | 2.4 | | | | 5.1 | |
Canada | | | 1.5 | | | | 3.3 | |
Other | | | 0.0 | | | | 2.2 | |
| (a) | Dodge & Cox has contractually agreed to reimburse the Fund for all ordinary expenses to the extent necessary to maintain Total Annual Fund Operating expenses at 0.60% through April 30, 2017. The term of the agreement renews annually thereafter unless terminated with 30 days’ written notice by either party prior to the end of the term. |
| (b) | SEC Yield is an annualization of the Fund’s net investment income for the trailing 30-day period. Dividends paid by the Fund may be higher or lower than implied by the SEC Yield. |
| (c) | The Fund may classify an issuer in a different category than the Bloomberg Barclays Global Aggregate Bond Index. The Fund generally classifies a corporate issuer based on the country of incorporation of the parent company, but may designate a different country in certain circumstances. |
| (d) | The Fund’s portfolio holdings are subject to change without notice. The mention of specific securities is not a recommendation to buy, sell, or hold any particular security and is not indicative of Dodge & Cox’s current or future trading activity. |
| (e) | The credit quality distributions shown for the Fund and the Index are based on the middle of Moody’s, S&P’s, and Fitch ratings, which is the methodology used by Bloomberg in constructing its indices. If a security is rated by only two agencies, the lower of the two ratings is used. Please note the Fund applies the highest of Moody’s, S&P’s, and Fitch ratings to comply with the quality requirements stated in its prospectus. On that basis, the Fund held 7.9% in securities rated below investment grade. The credit quality of the investments in the portfolio does not apply to the stability or safety of the Fund or its shares. |
| (f) | Excludes the Fund’s derivative contracts. |
| (g) | Net Cash & Other includes cash, short-term investments, receivables, and payables. |
PAGE 6 § DODGE & COX GLOBAL BOND FUND
| | | | |
| PORTFOLIO OF INVESTMENTS | | | December 31, 2016 | |
| | | | | | | | | | | | |
| DEBT SECURITIES: 97.0% | |
| | | |
| | | | | | PAR VALUE | | | VALUE | |
| GOVERNMENT: 20.0% | |
Colombia Government (Colombia) | | | | | | | | | | | | |
9.85%, 6/28/27 | | | COP | | | | 7,025,000,000 | | | $ | 2,752,433 | |
Japan Treasury Discount Bill (Japan) | | | | | | | | | | | | |
2/27/17 | | | JPY | | | | 240,000,000 | | | | 2,054,340 | |
3/10/17 | | | JPY | | | | 150,000,000 | | | | 1,284,104 | |
3/21/17 | | | JPY | | | | 120,000,000 | | | | 1,027,382 | |
Mexico Government (Mexico) | | | | | | | | | | | | |
2.00%, 6/9/22(a) | | | MXN | | | | 73,577,864 | | | | 3,423,150 | |
5.75%, 3/5/26 | | | MXN | | | | 126,400,000 | | | | 5,410,280 | |
Peru Government GDN (Peru) | | | | | | | | | | | | |
6.35%, 8/12/28(c) | | | PEN | | | | 7,350,000 | | | | 2,156,426 | |
U.S. Treasury Note/Bond (United States) | | | | | | | | | | | | |
0.875%, 5/31/18 | | | USD | | | | 3,845,000 | | | | 3,837,068 | |
| | | | | | | | | | | | |
| | | | | | | | | | | 21,945,183 | |
| GOVERNMENT-RELATED: 8.5% | |
Chicago Transit Authority RB (United States) | | | | | | | | | | | | |
6.899%, 12/1/40 | | | USD | | | | 1,700,000 | | | | 2,132,363 | |
Indonesia Government International (Indonesia) | | | | | | | | | | | | |
3.75%, 6/14/28(c) | | | EUR | | | | 1,975,000 | | | | 2,113,666 | |
Peru Government International (Peru) | | | | | | | | | | | | |
3.75%, 3/1/30 | | | EUR | | | | 900,000 | | | | 1,066,841 | |
Petroleo Brasileiro SA (Brazil) | | | | | | | | | | | | |
7.25%, 3/17/44 | | | USD | | | | 650,000 | | | | 573,755 | |
Petroleos Mexicanos (Mexico) | | | | | | | | | | | | |
2.75%, 4/21/27 | | | EUR | | | | 633,000 | | | | 585,535 | |
5.50%, 6/27/44 | | | USD | | | | 56,000 | | | | 46,603 | |
6.375%, 1/23/45 | | | USD | | | | 535,000 | | | | 486,850 | |
6.75%, 9/21/47(c) | | | USD | | | | 711,000 | | | | 671,753 | |
State of Illinois GO (United States) | | | | | | | | | | | | |
5.665%, 3/1/18 | | | USD | | | | 800,000 | | | | 827,792 | |
5.877%, 3/1/19 | | | USD | | | | 250,000 | | | | 265,028 | |
5.10%, 6/1/33 | | | USD | | | | 600,000 | | | | 530,292 | |
| | | | | | | | | | | | |
| | | | | | | | | | | 9,300,478 | |
| SECURITIZED: 19.9% | |
American Express Master Trust (United States) | | | | | | | | | | | | |
Series 2014-3 A, 1.49%, 4/15/20 | | | USD | | | | 225,000 | | | | 225,503 | |
Chase Issuance Trust (United States) | | | | | | | | | | | | |
Series 2015-A2 A2, 1.59%, 2/18/20 | | | USD | | | | 1,015,000 | | | | 1,017,809 | |
Series 2016-A5 A5, 1.27%, 7/15/21 | | | USD | | | | 1,330,000 | | | | 1,311,734 | |
Fannie Mae, 15 Year (United States) | | | | | | | | | | | | |
5.00%, 7/1/25 | | | USD | | | | 26,347 | | | | 28,036 | |
Fannie Mae, 20 Year (United States) | | | | | | | | | | | | |
4.00%, 11/1/30 | | | USD | | | | 523,039 | | | | 553,568 | |
4.00%, 10/1/31 | | | USD | | | | 638,077 | | | | 676,504 | |
4.00%, 9/1/35 | | | USD | | | | 648,260 | | | | 687,618 | |
Fannie Mae, Hybrid ARM (United States) | | | | | | | | | | | | |
2.907%, 8/1/44 | | | USD | | | | 195,465 | | | | 200,733 | |
Fannie Mae, 30 Year (United States) | | | | | | | | | | | | |
4.50%, 8/1/44 | | | USD | | | | 3,707,954 | | | | 4,000,164 | |
Fannie Mae, Hybrid ARM (United States) | | | | | | | | | | | | |
2.763%, 9/1/44 | | | USD | | | | 315,817 | | | | 323,304 | |
Fannie Mae, 30 Year (United States) | | | | | | | | | | | | |
4.50%, 2/1/45 | | | USD | | | | 1,057,125 | | | | 1,143,768 | |
4.50%, 1/1/46 | | | USD | | | | 1,300,205 | | | | 1,399,525 | |
Ford Credit Auto Owner Trust (United States) | | | | | | | | | | | | |
Series 2015-B A3, 1.16%, 11/15/19 | | | USD | | | | 784,665 | | | | 783,924 | |
Series 2015-1 A, 2.12%, 7/15/26(c) | | | USD | | | | 550,000 | | | | 550,753 | |
| | | | | | | | | | | | |
| | | |
| | | | | | PAR VALUE | | | VALUE | |
Freddie Mac (United States) | | | | | | | | | | | | |
Series 4283 EW, 4.50%, 12/15/43 | | | USD | | | | 184,261 | | | $ | 197,028 | |
Series 4319 MA, 4.50%, 3/15/44 | | | USD | | | | 642,783 | | | | 691,757 | |
Freddie Mac, Hybrid ARM (United States) | | | | | | | | | | | | |
3.016%, 10/1/44 | | | USD | | | | 369,267 | | | | 379,594 | |
2.737%, 11/1/44 | | | USD | | | | 993,412 | | | | 1,016,368 | |
2.711%, 1/1/45 | | | USD | | | | 1,108,227 | | | | 1,131,492 | |
2.747%, 5/1/46 | | | USD | | | | 1,639,336 | | | | 1,669,610 | |
Freddie Mac Gold, 30 Year (United States) | | | | | | | | | | | | |
6.00%, 2/1/35 | | | USD | | | | 97,795 | | | | 110,907 | |
4.50%, 8/1/44 | | | USD | | | | 526,580 | | | | 565,569 | |
Navient Student Loan Trust (Private Loans) (United States) | | | | | | | | | | | | |
Series 2015-CA B, 3.25%, 5/15/40(c) | | | USD | | | | 1,350,000 | | | | 1,338,675 | |
Rio Oil Finance Trust (Brazil) | | | | | | | | | | | | |
9.25%, 7/6/24(c) | | | USD | | | | 1,557,081 | | | | 1,463,656 | |
9.75%, 1/6/27(c) | | | USD | | | | 445,848 | | | | 410,180 | |
| | | | | | | | | | | | |
| | | | | | | | | | | 21,877,779 | |
| CORPORATE: 48.6% | |
FINANCIALS: 12.3% | |
Bank of America Corp. (United States) | | | | | | | | | | | | |
4.25%, 10/22/26 | | | USD | | | | 700,000 | | | | 707,444 | |
6.625%, 5/23/36(b) | | | USD | | | | 325,000 | | | | 359,061 | |
Barclays PLC (United Kingdom) | | | | | | | | | | | | |
4.375%, 1/12/26 | | | USD | | | | 1,075,000 | | | | 1,088,784 | |
BNP Paribas SA (France) | | | | | | | | | | | | |
5.75%, 1/24/22 | | | GBP | | | | 500,000 | | | | 717,338 | |
4.375%, 9/28/25(c) | | | USD | | | | 400,000 | | | | 397,179 | |
Capital One Financial Corp. (United States) | | | | | | | | | | | | |
3.75%, 4/24/24 | | | USD | | | | 1,050,000 | | | | 1,062,450 | |
Citigroup, Inc. (United States) | | | | | | | | | | | | |
6.692%, 10/30/40(b) | | | USD | | | | 1,567,500 | | | | 1,623,924 | |
HSBC Holdings PLC (United Kingdom) | | | | | | | | | | | | |
5.75%, 12/20/27 | | | GBP | | | | 550,000 | | | | 779,409 | |
6.50%, 5/2/36 | | | USD | | | | 500,000 | | | | 615,702 | |
6.50%, 9/15/37 | | | USD | | | | 200,000 | | | | 247,560 | |
JPMorgan Chase & Co. (United States) | | | | | | | | | | | | |
3.375%, 5/1/23 | | | USD | | | | 1,050,000 | | | | 1,045,162 | |
Lloyds Banking Group PLC (United Kingdom) | | | | | | | | | | | | |
4.50%, 11/4/24 | | | USD | | | | 1,125,000 | | | | 1,140,644 | |
4.582%, 12/10/25 | | | USD | | | | 500,000 | | | | 501,750 | |
Navient Corp. (United States) | | | | | | | | | | | | |
4.625%, 9/25/17 | | | USD | | | | 268,000 | | | | 272,355 | |
8.45%, 6/15/18 | | | USD | | | | 500,000 | | | | 538,750 | |
Royal Bank of Scotland Group PLC (United Kingdom) | | | | | | | | | | | | |
6.125%, 12/15/22 | | | USD | | | | 325,000 | | | | 345,215 | |
6.00%, 12/19/23 | | | USD | | | | 950,000 | | | | 985,748 | |
Wells Fargo & Co. (United States) | | | | | | | | | | | | |
1.601%, 12/6/19 | | | USD | | | | 250,000 | | | | 250,607 | |
2.15%, 12/6/19 | | | USD | | | | 800,000 | | | | 799,422 | |
| | | | | | | | | | | | |
| | | | | | | | | | | 13,478,504 | |
INDUSTRIALS: 32.1% | |
AT&T, Inc. (United States) | | | | | | | | | | | | |
4.75%, 5/15/46 | | | USD | | | | 625,000 | | | | 591,009 | |
4.50%, 3/9/48 | | | USD | | | | 1,290,000 | | | | 1,163,001 | |
BHP Billiton, Ltd. (Australia) | | | | | | | | | | | | |
5.625%, 10/22/79(b) | | | EUR | | | | 425,000 | | | | 504,462 | |
| | |
| See accompanying Notes to Financial Statements | | DODGE & COX GLOBAL BOND FUND §PAGE 7 |
| | | | |
| PORTFOLIO OF INVESTMENTS | | | December 31, 2016 | |
| | | | | | | | | | | | |
| DEBT SECURITIES (continued) | |
| | | |
| | | | | | PAR VALUE | | | VALUE | |
Cemex SAB de CV (Mexico) | | | | | | | | | | | | |
7.25%, 1/15/21(c) | | | USD | | | | 1,000,000 | | | $ | 1,065,000 | |
7.75%, 4/16/26(c) | | | USD | | | | 1,000,000 | | | | 1,107,500 | |
Charter Communications, Inc. (United States) | | | | | | | | | | | | |
7.30%, 7/1/38 | | | USD | | | | 225,000 | | | | 276,375 | |
6.75%, 6/15/39 | | | USD | | | | 1,150,000 | | | | 1,334,930 | |
Concho Resources, Inc. (United States) | | | | | | | | | | | | |
6.50%, 1/15/22 | | | USD | | | | 1,050,000 | | | | 1,086,435 | |
Cox Enterprises, Inc. (United States) | | | | | | | | | | | | |
3.25%, 12/15/22(c) | | | USD | | | | 765,000 | | | | 744,322 | |
2.95%, 6/30/23(c) | | | USD | | | | 900,000 | | | | 846,030 | |
Dell Technologies, Inc. (United States) | | | | | | | | | | | | |
4.42%, 6/15/21(c) | | | USD | | | | 650,000 | | | | 672,016 | |
5.45%, 6/15/23(c) | | | USD | | | | 400,000 | | | | 423,862 | |
Ford Motor Credit Co. LLC(d) (United States) | | | | | | | | | | | | |
8.125%, 1/15/20 | | | USD | | | | 400,000 | | | | 461,003 | |
5.875%, 8/2/21 | | | USD | | | | 975,000 | | | | 1,075,829 | |
Grupo Televisa SAB (Mexico) | | | | | | | | | | | | |
8.50%, 3/11/32 | | | USD | | | | 875,000 | | | | 1,070,552 | |
HCA Holdings, Inc. (United States) | | | | | | | | | | | | |
4.75%, 5/1/23 | | | USD | | | | 1,625,000 | | | | 1,663,594 | |
Imperial Brands PLC (United Kingdom) | | | | | | | | | | | | |
4.25%, 7/21/25(c) | | | USD | | | | 1,000,000 | | | | 1,030,913 | |
Kinder Morgan, Inc. (United States) | | | | | | | | | | | | |
6.95%, 1/15/38 | | | USD | | | | 1,900,000 | | | | 2,200,739 | |
LafargeHolcim, Ltd. (Switzerland) | | | | | | | | | | | | |
7.125%, 7/15/36 | | | USD | | | | 1,000,000 | | | | 1,208,653 | |
4.75%, 9/22/46(c) | | | USD | | | | 425,000 | | | | 411,039 | |
Macy’s, Inc. (United States) | | | | | | | | | | | | |
6.70%, 9/15/28 | | | USD | | | | 50,000 | | | | 54,173 | |
6.90%, 4/1/29 | | | USD | | | | 75,000 | | | | 84,804 | |
6.70%, 7/15/34 | | | USD | | | | 425,000 | | | | 462,555 | |
6.375%, 3/15/37 | | | USD | | | | 450,000 | | | | 474,758 | |
Millicom International Cellular SA (Luxembourg) | | | | | | | | | | | | |
6.625%, 10/15/21(c) | | | USD | | | | 1,450,000 | | | | 1,527,865 | |
Molex Electronic Technologies LLC(d) (United States) | | | | | | | | | | | | |
2.878%, 4/15/20(c) | | | USD | | | | 731,000 | | | | 728,866 | |
MTN Group, Ltd. (South Africa) | | | | | | | | | | | | |
4.755%, 11/11/24(c) | | | USD | | | | 1,200,000 | | | | 1,099,440 | |
Naspers, Ltd. (South Africa) | | | | | | | | | | | | |
5.50%, 7/21/25(c) | | | USD | | | | 2,100,000 | | | | 2,115,246 | |
RELX PLC (United Kingdom) | | | | | | | | | | | | |
8.625%, 1/15/19 | | | USD | | | | 58,000 | | | | 65,157 | |
3.125%, 10/15/22 | | | USD | | | | 574,000 | | | | 568,193 | |
Telecom Italia SPA (Italy) | | | | | | | | | | | | |
6.375%, 6/24/19 | | | GBP | | | | 800,000 | | | | 1,078,082 | |
7.721%, 6/4/38 | | | USD | | | | 1,025,000 | | | | 1,058,312 | |
Time Warner, Inc. (United States) | | | | | | | | | | | | |
6.20%, 3/15/40 | | | USD | | | | 925,000 | | | | 1,066,041 | |
TransCanada Corp. (Canada) | | | | | | | | | | | | |
5.625%, 5/20/75(b) | | | USD | | | | 1,675,000 | | | | 1,691,750 | |
Twenty-First Century Fox, Inc. (United States) | | | | | | | | | | | | |
6.15%, 3/1/37 | | | USD | | | | 125,000 | | | | 146,062 | |
6.65%, 11/15/37 | | | USD | | | | 750,000 | | | | 921,519 | |
Ultrapar Participacoes SA (Brazil) | | | | | | | | | | | | |
5.25%, 10/6/26(c) | | | USD | | | | 600,000 | | | | 587,940 | |
Verizon Communications, Inc. (United States) | | | | | | | | | | | | |
6.40%, 2/15/38 | | | USD | | | | 600,000 | | | | 723,356 | |
| | | | | | | | | | | | |
| | | |
| | | | | | PAR VALUE | | | VALUE | |
6.55%, 9/15/43 | | | USD | | | | 275,000 | | | $ | 342,873 | |
Vulcan Materials Co. (United States) | | | | | | | | | | | | |
7.50%, 6/15/21 | | | USD | | | | 838,000 | | | | 986,745 | |
Zoetis, Inc. (United States) | | | | | | | | | | | | |
4.50%, 11/13/25 | | | USD | | | | 525,000 | | | | 555,852 | |
| | | | | | | | | | | | |
| | | | | | | | | | | 35,276,853 | |
UTILITIES: 4.2% | |
Dominion Resources, Inc. (United States) | | | | | | | | | | | | |
5.75%, 10/1/54(b) | | | USD | | | | 1,600,000 | | | | 1,640,000 | |
Enel SPA (Italy) | | | | | | | | | | | | |
6.80%, 9/15/37(c) | | | USD | | | | 650,000 | | | | 787,849 | |
6.00%, 10/7/39(c) | | | USD | | | | 705,000 | | | | 786,350 | |
The Southern Co. (United States) | | | | | | | | | | | | |
5.50%, 3/15/57(b) | | | USD | | | | 1,325,000 | | | | 1,338,331 | |
| | | | | | | | | | | | |
| | | | | | | | | | | 4,552,530 | |
| | | | | | | | | | | | |
| | | | | | | | | | | 53,307,887 | |
| | | | | | | | | | | | |
TOTAL DEBT SECURITIES
(Cost $107,444,634) | | | | | | | | | | $ | 106,431,327 | |
|
| SHORT-TERM INVESTMENTS: 1.7% | |
MONEY MARKET FUND: 0.1% | |
State Street Institutional Treasury Plus Money Market Fund | | | USD | | | | 109,433 | | | $ | 109,433 | |
|
REPURCHASE AGREEMENT: 1.6% | |
Fixed Income Clearing Corporation(e) | | | | | | | | | | | | |
0.10%, dated 12/30/16, due 1/3/17, maturity value $1,755,020 | | | USD | | | | 1,755,000 | | | | 1,755,000 | |
| | | | | | | | | | | | |
TOTAL SHORT-TERM INVESTMENTS
(Cost $1,864,433) | | | $ | 1,864,433 | |
| | | | | | | | | | | | |
TOTAL INVESTMENTS
(Cost $109,309,067) | | | | 98.7 | % | | $ | 108,295,760 | |
OTHER ASSETS LESS LIABILITIES | | | | | | | 1.3 | % | | | 1,466,220 | |
| | | | | | | | | | | | |
| NET ASSETS | | | | | | | 100.0 | % | | $ | 109,761,980 | |
| | | | | | | | | | | | |
| (c) | Security exempt from registration under Rule 144A of the Securities Act of 1933. The security may be resold in transactions exempt from registration, normally to qualified institutional buyers. As of December 31, 2016, all such securities in total represented $23,036,526 or 21.0% of total net assets. These securities have been deemed liquid by Dodge & Cox, investment manager, pursuant to procedures approved by the Fund’s Board of Trustees. |
| (d) | Subsidiary (see below) |
| (e) | Repurchase agreement is collateralized by U.S. Treasury Inflation Indexed Note 0.125%, 4/15/19. Total collateral value is $1,790,227. |
Debt securities are grouped by parent company unless otherwise noted. Actual securities may be issued by the listed parent company or one of its subsidiaries. In determining a parent company’s country designation, the Fund generally references the country of incorporation.
ARM: Adjustable Rate Mortgage
GO: General Obligation
RB: Revenue Bond
COP: Colombian Peso
EUR: Euro
GBP: British Pound
INR: Indian Rupee
JPY: Japanese Yen
MXN: Mexican Peso
PEN: Peruvian Sol
USD: United States Dollar
| | |
| PAGE 8 § DODGE & COX GLOBAL BOND FUND | | See accompanying Notes to Financial Statements |
| | | | |
| PORTFOLIO OF INVESTMENTS | | | December 31, 2016 | |
FUTURES CONTRACTS
| | | | | | | | | | | | | | | | |
| Description | | Number of
Contracts | | | Expiration
Date | | | Notional
Amount | | | Unrealized
Appreciation/
(Depreciation) | |
10 Year U.S. Treasury Note—Short Position | | | 106 | | | | Mar 2017 | | | $ | (13,173,812 | ) | | $ | 39,108 | |
Euro-Bund Future—Short Position | | | 14 | | | | Mar 2017 | | | | (2,419,096 | ) | | | (41,858 | ) |
Long Term U.S. Treasury Bond—Short Position | | | 19 | | | | Mar 2017 | | | | (3,044,750 | ) | | | 4,661 | |
| | | | | | | | | | | | | | | | |
| | | | | | | | | | | | | | $ | 1,911 | |
| | | | | | | | | | | | | | | | |
CENTRALLY CLEARED INTEREST RATE SWAPS
| | | | | | | | | | | | | | | | |
| | | | | | Contract Amount | | | | |
Notional
Amount | | Expiration
Date | | | Fixed
Rate | | | Floating Rate | | | Unrealized
Appreciation/
(Depreciation) | |
Pay Fixed/Receive Floating: | | | | | |
$ 825,000 | | | 5/6/24 | | | | 2.72 | % | | | USD LIBOR 3–Month | | | $ | (33,370 | ) |
825,000 | | | 8/22/24 | | | | 2.57 | % | | | USD LIBOR 3–Month | | | | (28,901 | ) |
1,750,000 | | | 7/29/45 | | | | 2.774 | % | | | USD LIBOR 3–Month | | | | (89,298 | ) |
400,000 | | | 3/15/47 | | | | 2.25 | % | | | USD LIBOR 3–Month | | | | (3,907 | ) |
| | | | | | | | | | | | | | | | |
| | | | | | | | | | | | | | $ | (155,476 | ) |
| | | | | | | | | | | | | | | | |
FORWARD CURRENCY CONTRACTS
| | | | | | | | | | | | | | | | |
| | | | | | Contract Amount | | | | |
| Counterparty | | Settle
Date | | | Receive
U.S. Dollar | | | Deliver
Foreign
Currency | | | Unrealized
Appreciation /
(Depreciation) | |
Contracts to sell EUR: | |
Bank of America | | | 2/22/17 | | | | 1,171,410 | | | | 1,100,000 | | | $ | 10,732 | |
Bank of America | | | 2/22/17 | | | | 502,350 | | | | 475,000 | | | | 1,148 | |
Bank of America | | | 2/22/17 | | | | 850,464 | | | | 800,000 | | | | 6,335 | |
Barclays | | | 1/18/17 | | | | 845,587 | | | | 765,000 | | | | 39,644 | |
Barclays | | | 2/22/17 | | | | 960,858 | | | | 900,000 | | | | 11,213 | |
Contracts to sell GBP: | |
Bank of America | | | 3/15/17 | | | | 693,230 | | | | 550,000 | | | | 14,238 | |
Bank of America | | | 3/15/17 | | | | 561,033 | | | | 450,000 | | | | 5,493 | |
Bank of America | | | 3/15/17 | | | | 93,987 | | | | 75,000 | | | | 1,397 | |
Barclays | | | 3/15/17 | | | | 1,340,705 | | | | 1,010,000 | | | | 93,827 | |
Contracts to sell INR: | |
Barclays | | | 1/18/17 | | | | 162,506 | | | | 11,000,000 | | | | 642 | |
Contracts to sell JPY: | |
Bank of America | | | 3/21/17 | | | | 1,045,697 | | | | 120,000,000 | | | | 15,076 | |
Bank of America | | | 2/27/17 | | | | 2,167,934 | | | | 240,000,000 | | | | 109,039 | |
Barclays | | | 3/10/17 | | | | 1,442,624 | | | | 150,000,000 | | | | 155,159 | |
| | | | |
| Counterparty | | Settle
Date | | | Deliver
U.S. Dollar | | | Receive
Foreign
Currency | | | Unrealized
Appreciation /
(Depreciation) | |
Contracts to buy INR: | |
Barclays | | | 1/18/17 | | | | 2,109,279 | | | | 146,500,000 | | | | 46,450 | |
Barclays | | | 3/1/17 | | | | 158,845 | | | | 11,000,000 | | | | 2,259 | |
| | | | | | | | | | | | | | | | |
| | | | | | | | | | | | | | $ | 512,652 | |
| | | | | | | | | | | | | | | | |
| | |
| See accompanying Notes to Financial Statements | | DODGE & COX GLOBAL BOND FUND §PAGE 9 |
| | |
STATEMENT OF ASSETS AND LIABILITIES |
| |
| | | December 31, 2016 |
| | | | |
ASSETS: | | | | |
Investments, at value (cost $109,309,067) | | $ | 108,295,760 | |
Unrealized appreciation on forward currency contracts | | | 512,652 | |
Cash denominated in foreign currency (cost $176) | | | 178 | |
Cash held at broker | | | 573,375 | |
Receivable for investments sold | | | 824,716 | |
Receivable for Fund shares sold | | | 188,707 | |
Dividends and interest receivable | | | 1,201,751 | |
Expense reimbursement receivable | | | 36,661 | |
Prepaid expenses and other assets | | | 18,821 | |
| | | | |
| | | 111,652,621 | |
| | | | |
LIABILITIES: | | | | |
Payable for investments purchased | | | 1,497,607 | |
Payable to broker for variation margin | | | 93,097 | |
Payable for Fund shares redeemed | | | 124,311 | |
Management fees payable | | | 41,941 | |
Accrued expenses | | | 133,685 | |
| | | | |
| | | 1,890,641 | |
| | | | |
NET ASSETS | | $ | 109,761,980 | |
| | | | |
NET ASSETS CONSIST OF: | | | | |
Paid in capital | | $ | 112,357,028 | |
Distributions in excess of net investment income | | | (1,355,951 | ) |
Accumulated net realized loss | | | (574,375 | ) |
Net unrealized depreciation | | | (664,722 | ) |
| | | | |
| | $ | 109,761,980 | |
| | | | |
Fund shares outstanding (par value $0.01 each,
unlimited shares authorized) | | | 10,626,515 | |
Net asset value per share | | $ | 10.33 | |
|
STATEMENT OF OPERATIONS | |
| |
| | | Year Ended December 31, 2016 | |
INVESTMENT INCOME: | | | | |
Dividends | | $ | 78,001 | |
Interest (net of foreign taxes of $2,829) | | | 3,292,659 | |
| | | | |
| | | 3,370,660 | |
| | | | |
EXPENSES: | | | | |
Management fees | | | 385,187 | |
Custody and fund accounting fees | | | 26,236 | |
Transfer agent fees | | | 30,380 | |
Professional services | | | 218,743 | |
Shareholder reports | | | 21,221 | |
Registration fees | | | 65,963 | |
Trustees’ fees | | | 247,500 | |
Miscellaneous | | | 28,061 | |
| | | | |
Total expenses | | | 1,023,291 | |
| | | | |
Expenses reimbursed by investment manager | | | (560,185 | ) |
| | | | |
Net expenses | | | 463,106 | |
| | | | |
NET INVESTMENT INCOME | | | 2,907,554 | |
| | | | |
REALIZED AND UNREALIZED GAIN (LOSS): | | | | |
Net realized gain (loss) | | | | |
Investments | | | (2,132,653 | ) |
Futures contracts | | | (100,087 | ) |
Interest rate swaps | | | (70,777 | ) |
Forward currency contracts | | | 294,044 | |
Foreign currency transactions | | | (23,213 | ) |
Net change in unrealized appreciation/depreciation | | | | |
Investments | | | 4,590,294 | |
Futures contracts | | | (20,217 | ) |
Interest rate swaps | | | 9,279 | |
Forward currency contracts | | | 492,688 | |
Foreign currency translation | | | 6,930 | |
| | | | |
Net realized and unrealized gain | | | 3,046,288 | |
| | | | |
NET CHANGE IN NET ASSETS FROM OPERATIONS | | $ | 5,953,842 | |
| | | | |
| | | | | | | | |
STATEMENT OF CHANGES IN NET ASSETS | |
| | |
| | | Year Ended
December 31, 2016 | | | Year Ended
December 31, 2015 | |
OPERATIONS: | | | | | | | | |
Net investment income | | $ | 2,907,554 | | | $ | 2,394,483 | |
Net realized loss | | | (2,032,686 | ) | | | (3,554,990 | ) |
Net change in unrealized appreciation/depreciation | | | 5,078,974 | | | | (3,521,066 | ) |
| | | | | | | | |
| | | 5,953,842 | | | | (4,681,573 | ) |
| | | | | | | | |
| | |
DISTRIBUTIONS TO SHAREHOLDERS FROM: | | | | | | | | |
Net investment income | | | (1,791,680 | ) | | | — | |
Net realized gain | | | — | | | | — | |
| | | | | | | | |
Total distributions | | | (1,791,680 | ) | | | — | |
| | | | | | | | |
| | |
FUND SHARE TRANSACTIONS: | | | | | | | | |
Proceeds from sale of shares | | | 64,939,219 | | | | 26,112,074 | |
Reinvestment of distributions | | | 1,748,223 | | | | — | |
Cost of shares redeemed | | | (28,749,476 | ) | | | (18,458,010 | ) |
| | | | | | | | |
Net change from Fund share transactions | | | 37,937,966 | | | | 7,654,064 | |
| | | | | | | | |
Total change in net assets | | | 42,100,128 | | | | 2,972,491 | |
| | |
NET ASSETS: | | | | | | | | |
Beginning of year | | | 67,661,852 | | | | 64,689,361 | |
| | | | | | | | |
End of year (including distributions in excess of net investment income of $(1,355,951) and accumulated net investment loss of $(186,162), respectively) | | $ | 109,761,980 | | | $ | 67,661,852 | |
| | | | | | | | |
| | |
SHARE INFORMATION: | | | | | | | | |
Shares sold | | | 6,359,396 | | | | 2,575,716 | |
Distributions reinvested | | | 169,730 | | | | — | |
Shares redeemed | | | (2,901,699 | ) | | | (1,848,870 | ) |
| | | | | | | | |
Net change in shares outstanding | | | 3,627,427 | | | | 726,846 | |
| | | | | | | | |
| | |
| PAGE 10 § DODGE & COX GLOBAL BOND FUND | | See accompanying Notes to Financial Statements |
NOTES TO FINANCIAL STATEMENTS
NOTE 1—ORGANIZATION AND SIGNIFICANT ACCOUNTING POLICIES
Dodge & Cox Global Bond Fund (the “Fund”) is one of the series constituting the Dodge & Cox Funds (the “Trust” or the “Funds”). The Trust is organized as a Delaware statutory trust and is registered under the Investment Company Act of 1940, as amended, as an open-end management investment company. The Fund1 seeks a high rate of total return consistent with long-term preservation of capital. Foreign investing, especially in developing countries, has special risks such as currency and market volatility and political and social instability. These and other risk considerations are discussed in the Fund’s Prospectus.
The financial statements have been prepared in conformity with accounting principles generally accepted in the United States of America, which require the use of estimates and assumptions by management. Actual results may differ from those estimates. Significant accounting policies are as follows:
Security valuation The Fund’s net assets are typically valued as of the normally scheduled close of trading on the New York Stock Exchange (NYSE), generally 4:00 p.m. Eastern Time, each day that the NYSE is open for business.
Debt securities and non-exchange traded derivatives are valued based on prices received from independent pricing services which utilize both dealer-supplied valuations and pricing models. Pricing models may consider quoted prices for similar securities, interest rates, cash flows (including prepayment speeds), and credit risk. Exchange-traded derivatives are valued at the settlement price determined by the relevant exchange. Other financial instruments for which market quotes are readily available are valued at market value. Security values are not discounted based on the size of the Fund’s position. Short-term securities less than 60 days to maturity may be valued at amortized cost if amortized cost approximates current value. Mutual funds are valued at their respective net asset values.
Investments initially valued in currencies other than the U.S. dollar are converted to the U.S. dollar using prevailing exchange rates. Forward currency contracts are valued based on the prevailing forward exchange rates of the underlying currencies. As a result, the Fund’s net assets may be affected by changes in the value of currencies in relation to the U.S. dollar.
If market quotations are not readily available or if a security’s value is believed to have materially changed after the close of the security’s primary market but before the close of trading on the NYSE, the security is valued at fair value as determined in good
| 1 | | The Fund’s predecessor, Dodge & Cox Global Bond Fund, L.L.C. (the “Private Fund”), was organized on August 31, 2012 and commenced operations on December 5, 2012 as a private investment fund that reorganized into, and had the same investment manager as, the Fund. The Fund commenced operations on May 1, 2014, upon the transfer of assets from the Private Fund. This transaction was accomplished through a transfer of Private Fund net assets valued at $10,725,688 in exchange for 1,000,000 shares of the Fund. Immediately after the transfer, the shares of the Fund were distributed to the sole owner of the Private Fund and the investment manager of the Fund, Dodge & Cox, which became the initial shareholder of the Fund. |
faith by or under the direction of the Fund’s Board of Trustees. The Board of Trustees has appointed Dodge & Cox, the Fund’s investment manager, to make fair value determinations in accordance with the Dodge & Cox Funds Valuation Policies (“Valuation Policies”), subject to Board oversight. Dodge & Cox has established a Pricing Committee that is comprised of representatives from Treasury, Legal, Compliance, and Operations. The Pricing Committee is responsible for implementing the Valuation Policies, including determining the fair value of securities when market quotations or market-based valuations are not readily available or are deemed unreliable. The Pricing Committee considers relevant indications of value that are reasonably available to it in determining the fair value assigned to a particular security, such as the value of similar financial instruments, trading volumes, contractual restrictions on disposition, related corporate actions, and changes in economic conditions. In doing so, the Pricing Committee employs various methods for calibrating fair valuation approaches, including a regular review of key inputs and assumptions, back-testing, and review of any related market activity.
Valuing securities through a fair value determination involves greater reliance on judgment than valuation of securities based on readily available market quotations. In some instances, lack of information and uncertainty as to the significance of information may lead to a conclusion that a prior valuation is the best indication of a security’s value. When fair value pricing is employed, the prices of securities used by the Fund to calculate its NAV may differ from quoted or published prices for the same securities.
Security transactions, investment income, expenses, and distributions Security transactions are recorded on the trade date. Realized gains and losses on securities sold are determined on the basis of identified cost.
Interest income is recorded on the accrual basis. Interest income includes coupon interest, amortization of premium and accretion of discount on debt securities, gain/loss on paydowns, and inflation adjustments to the principal amount of inflation-indexed securities. The ability of the issuers of the debt securities held by the Fund to meet their obligations may be affected by economic developments in a specific industry, state, region, or country. Debt obligations may be placed on non-accrual status and related interest income may be reduced by ceasing current accruals and writing off interest receivables when the collection of all or a portion of interest has become doubtful. A debt obligation is removed from non-accrual status when the issuer resumes interest payments or when collectability of interest is reasonably assured. Dividend income is recorded on the ex-dividend date.
Expenses are recorded on the accrual basis. Some expenses of the Trust can be directly attributed to a specific series. Expenses which cannot be directly attributed are allocated among the Funds in the Trust using methodologies determined by the nature of the expense.
DODGE & COX GLOBAL BOND FUND §PAGE 11
NOTES TO FINANCIAL STATEMENTS
Distributions to shareholders are recorded on the ex-dividend date.
Foreign taxes The Fund is subject to foreign taxes which may be imposed by certain countries in which the Fund invests. The Fund endeavors to record foreign taxes based on applicable foreign tax law. Withholding taxes are incurred on certain foreign receipts and are accrued at the time the associated interest income is recorded.
Capital gains taxes are incurred upon disposition of certain foreign securities. Expected capital gains taxes on appreciated securities are accrued as unrealized losses and incurred capital gains taxes are reflected as realized losses upon the sale of the related security. Currency taxes may be incurred when the Fund purchases certain foreign currencies related to securities transactions and are recorded as realized losses on foreign currency transactions.
Repurchase agreements The Fund enters into repurchase agreements, secured by U.S. government or agency securities, which involve the purchase of securities from a counterparty with a simultaneous commitment to resell the securities at an agreed-upon date and price. It is the Fund’s policy that its custodian take possession of the underlying collateral securities, the fair value of which exceeds the principal amount of the repurchase transaction, including accrued interest, at all times. In the event of default by the counterparty, the Fund has the contractual right to liquidate the securities and to apply the proceeds in satisfaction of the obligation.
Futures Contracts Futures contracts involve an obligation to purchase or sell (depending on whether the Fund has entered a long or short futures contract, respectively) an asset at a future date, at a price set at the time of the contract. Upon entering into a futures contract, the Fund is required to deposit an amount of cash or liquid assets (referred to as initial margin) in a segregated account with the clearing broker. Subsequent payments (referred to as variation margin) to and from the clearing broker are made on a daily basis based on changes in the market value of futures contracts. Futures contracts are traded publicly and their market value changes daily. Changes in the market value of open futures contracts are recorded as unrealized appreciation or depreciation in the Statement of Operations. Realized gains and losses on futures contracts are recorded in the Statement of Operations at the closing or expiration of the contracts. Cash deposited with a broker as initial margin is recorded on the Statement of Assets and Liabilities. A receivable and/or payable to brokers for daily variation margin is also recorded on the Statement of Assets and Liabilities.
Investments in futures contracts may include certain risks, which may be different from, and potentially greater than, those of the underlying securities. To the extent the Fund uses futures, it is exposed to additional volatility and potential losses resulting from leverage.
The Fund has maintained short Treasury futures contracts and short Euro-Bund futures contracts to assist with the management of the portfolio’s interest rate exposure. During the
year ended December 31, 2016, these futures contracts had total notional values ranging from 16% to 20% of net assets.
Interest rate swaps Interest rate swaps are agreements that obligate two parties to exchange a series of cash flows at specified payment dates calculated by reference to specified interest rates, such as an exchange of floating rate payments for fixed rate payments. Upon entering into a centrally cleared interest rate swap, the Fund is required to post an amount of cash or liquid assets (referred to as initial margin) in a segregated account with the clearing broker. Subsequent payments (referred to as variation margin) to and from the clearing broker are made on a daily basis based on changes in the market value of each interest rate swap. Changes in the market value of open interest rate swaps are recorded as unrealized appreciation or depreciation in the Statement of Operations. Realized gains and losses on interest rate swaps are recorded in the Statement of Operations, both upon the exchange of cash flows on each specified payment date and upon the closing or expiration of the swap. Cash deposited with the clearing broker as initial margin is recorded on the Statement of Assets and Liabilities. A receivable and/or payable to brokers for daily variation margin is also recorded on the Statement of Assets and Liabilities.
Investments in interest rate swaps may include certain risks including unfavorable changes in interest rates, or a default or failure by the clearing broker or clearinghouse.
The Fund has maintained interest rate swaps in connection with the management of the portfolio’s interest rate exposure. During the year ended December 31, 2016, these interest rate swaps had U.S. dollar notional values ranging from 3% to 5% of net assets.
Forward currency contracts A forward currency contract represents an obligation to purchase or sell a specific foreign currency at a future date at a price set at the time of the contract. The values of the forward currency contracts are adjusted daily based on the prevailing forward exchange rates of the underlying currencies. Changes in the value of open contracts are recorded as unrealized appreciation or depreciation in the Statement of Operations. When the forward currency contract is closed, the Fund records a realized gain or loss in the Statement of Operations equal to the difference between the value at the time the contract was opened and the value at the time it was closed. Losses from these transactions may arise from unfavorable changes in currency values or if the counterparties do not perform under a contract’s terms.
The Fund has maintained Indian rupee forward currency contracts as a substitute for a direct investment in India. During the year ended December 31, 2016, these Indian rupee forward currency contracts had U.S. dollar total values ranging from 1% to 4% of net assets.
The Fund has maintained forward currency contracts to hedge direct and/or indirect foreign currency exposure to the British pound, euro, and Japanese yen. During the year ended December 31, 2016, these forward currency contracts had U.S. dollar total values ranging from 1% to 11% of net assets.
PAGE 12 § DODGE & COX GLOBAL BOND FUND
NOTES TO FINANCIAL STATEMENTS
Foreign currency translation The books and records of the Fund are maintained in U.S. dollars. Foreign currency amounts are translated into U.S. dollars at the prevailing exchange rates of such currencies against the U.S. dollar. The market value of investment securities and other assets and liabilities are translated at the exchange rate as of the valuation date. Purchases and sales of investment securities, income, and expenses are translated at the exchange rate prevailing on the transaction date.
Reported realized and unrealized gain (loss) on investments includes foreign currency gain (loss) related to investment transactions.
Reported realized and unrealized gain (loss) on foreign currency transactions and translation include the following: holding/disposing of foreign currency, the difference between the trade and settlement dates on securities transactions, the difference between the accrual and payment dates on interest, and currency losses on the purchase of foreign currency in certain countries that impose taxes on such transactions.
Indemnification Under the Trust’s organizational documents, its officers and trustees are indemnified against certain liabilities arising out of the performance of their duties to the Trust. In addition, in the normal course of business the Trust enters into contracts that provide general indemnities to other parties. The Trust’s maximum exposure under these arrangements is unknown as this would involve future claims that may be made against the Trust that have not yet occurred.
NOTE 2—VALUATION MEASUREMENTS
Various inputs are used in determining the value of the Fund’s investments. These inputs are summarized in the three broad levels listed below.
| § | | Level 1: Quoted prices in active markets for identical securities |
| § | | Level 2: Other significant observable inputs (including quoted prices for similar securities, market indices, interest rates, credit risk, forward exchange rates, etc.) |
| § | | Level 3: Significant unobservable inputs (including Fund management’s assumptions in determining the fair value of investments) |
The inputs or methodology used for valuing securities are not necessarily an indication of the risk associated with investing in those securities.
The following is a summary of the inputs used to value the Fund’s holdings at December 31, 2016:
| | | | | | | | |
| Classification(a) | | LEVEL 1
(Quoted Prices) | | | LEVEL 2
(Other Significant
Observable Inputs) | |
Securities | | | | | | | | |
Debt Securities | | | | | | | | |
Government | | $ | — | | | $ | 21,945,183 | |
Government-Related | | | — | | | | 9,300,478 | |
Securitized | | | — | | | | 21,877,779 | |
Corporate | | | — | | | | 53,307,887 | |
Short-term Investments | | | | | | | | |
Money Market Fund | | | 109,433 | | | | — | |
Repurchase Agreement | | | — | | | | 1,755,000 | |
| | | | | | | | |
Total Securities | | $ | 109,433 | | | $ | 108,186,327 | |
| | | | | | | | |
Other Financial Instruments | | | | | | | | |
Futures Contracts | | | | | | | | |
Appreciation | | $ | 43,769 | | | $ | — | |
Depreciation | | | (41,858 | ) | | | — | |
Interest Rate Swaps | | | | | | | | |
Depreciation | | | — | | | | (155,476 | ) |
Forward Currency Contracts | | | | | | | | |
Appreciation | | | — | | | | 512,652 | |
| | | | | | | | | |
| (a) | There were no transfers between Level 1 and Level 2 during the year ended December 31, 2016. There were no Level 3 securities at December 31, 2016 and 2015, and there were no transfers to Level 3 during the year. |
NOTE 3—ADDITIONAL DERIVATIVES INFORMATION
The Fund has entered into over-the-counter derivatives, such as forward currency contracts (each, a “Derivative”). Each Derivative is subject to a negotiated master agreement (based on a form published by the International Swaps and Derivatives Association (“ISDA”)) governing all Derivatives between the Fund and the relevant dealer counterparty. The master agreements specify (i) events of default and other events permitting a party to terminate some or all of the Derivatives thereunder and (ii) the process by which those Derivatives will be valued for purposes of determining termination payments. If some or all of the Derivatives under a master agreement are terminated because of an event of default or similar event, the values of all terminated Derivatives must be netted to determine a single payment owed by one party to the other. Some master agreements contain collateral terms requiring the parties to post collateral in respect of some or all of the Derivatives thereunder based on the net market value of those Derivatives, subject to a minimum exposure threshold. To the extent amounts owed to the Fund by its counterparties are not collateralized, the Fund is at risk of those counterparties’ non-performance. The Fund attempts to mitigate counterparty credit risk by entering into Derivatives only with counterparties it believes to be of good credit quality and by monitoring the financial stability of those counterparties.
At December 31, 2016, all Derivative positions qualify for netting pursuant to master netting arrangements. For financial reporting purposes, the Fund does not offset financial assets and liabilities that are subject to a master netting arrangement in the
DODGE & COX GLOBAL BOND FUND §PAGE 13
NOTES TO FINANCIAL STATEMENTS
Statement of Assets and Liabilities. Gross assets and liabilities related to Derivatives are presented as “unrealized appreciation on forward currency contracts” and “unrealized depreciation on forward currency contracts,” respectively, in the Statement of Assets and Liabilities. Derivative information by counterparty is presented in the Portfolio of Investments. At December 31, 2016, no collateral is pledged or held by the Fund for Derivatives.
NOTE 4—RELATED PARTY TRANSACTIONS
Management fees Under a written agreement approved by a unanimous vote of the Board of Trustees, the Fund pays an annual management fee of 0.50% of the Fund’s average daily net assets to Dodge & Cox, investment manager of the Fund. Dodge & Cox has contractually agreed to reimburse the Fund for all ordinary expenses to the extent necessary to maintain the ratio of total operating expenses to average net assets at 0.60% through April 30, 2017. The agreement is renewable annually thereafter and is subject to termination upon 30 days’ written notice by either party. This expense reimbursement agreement has been in effect since the Fund’s inception.
Fund officers and trustees All officers and two of the trustees of the Trust are officers or employees of Dodge & Cox. The Trust pays a fee only to those trustees who are not affiliated with Dodge & Cox.
Share ownership At December 31, 2016, Dodge & Cox owned 13% of the Fund’s outstanding shares.
NOTE 5—INCOME TAX INFORMATION AND DISTRIBUTIONS TO SHAREHOLDERS
A provision for federal income taxes is not required since the Fund intends to continue to qualify as a regulated investment company under Subchapter M of the Internal Revenue Code and distribute all of its taxable income to shareholders. Distributions are determined in accordance with income tax regulations, and such amounts may differ from net investment income and realized gains for financial reporting purposes. Financial reporting records are adjusted for permanent book to tax differences at year end to reflect tax character.
Book to tax differences are primarily due to differing treatments of wash sales, net short-term realized gain (loss), foreign currency realized gain (loss), futures contracts, and interest rate swaps. At December 31, 2016, the cost of investments for federal income tax purposes was $109,859,803.
Distributions during the years noted below were characterized as follows for federal income tax purposes:
| | | | | | | | |
| | | Year Ended
December 31, 2016 | | | Year Ended December 31, 2015 | |
Ordinary income | | | $1,791,680 | | | | — | |
| | | ($0.175 per share) | | | | | |
Long-term capital gain | | | — | | | | — | |
At December 31, 2016, the tax basis components of distributable earnings were as follows:
| | | | |
Unrealized appreciation | | $ | 808,585 | |
Unrealized depreciation | | | (2,372,628 | ) |
| | | | |
Net unrealized depreciation | | | (1,564,043 | ) |
Undistributed ordinary income | | | — | |
Deferred loss(a) | | | (892,009 | ) |
| (a) | Represents net realized specified loss incurred between November 1, 2016 and December 31, 2016. As permitted by tax regulations, the Fund has elected to treat this loss as arising in 2017. |
During 2016, the Fund fully utilized its capital loss carryforward of $775,303.
Fund management has reviewed the tax positions for the open period applicable to the Fund, and has determined that no provision for income tax is required in the Fund’s financial statements.
NOTE 6—LOAN FACILITIES
Pursuant to an exemptive order issued by the Securities and Exchange Commission (SEC), the Fund may participate in an interfund lending facility (Facility). The Facility allows the Fund to borrow money from or loan money to the Funds. Loans under the Facility are made for temporary or emergency purposes, such as to fund shareholder redemption requests. Interest on borrowings is the average of the current repurchase agreement rate and the bank loan rate. There was no activity in the Facility during the year.
All Funds in the Trust participate in a $500 million committed credit facility (Line of Credit) with State Street Bank and Trust Company, to be utilized for temporary or emergency purposes to fund shareholder redemptions or for other short-term liquidity purposes. The maximum amount available to the Fund is $250 million. Each Fund pays an annual commitment fee on its pro-rata portion of the Line of Credit. For the year ended December 31, 2016, the Fund’s commitment fee amounted to $355 and is reflected as a Miscellaneous Expense in the Statement of Operations. Interest on borrowings is charged at the prevailing rate. There were no borrowings on the Line of Credit during the year.
NOTE 7—PURCHASES AND SALES OF INVESTMENTS
For the year ended December 31, 2016, purchases and sales of securities, other than short-term securities and U.S. government securities, aggregated $58,878,954 and $36,959,458, respectively. For the year ended December 31, 2016, purchases and sales of U.S. government securities aggregated $29,239,722 and $17,315,225, respectively.
NOTE 8—NEW ACCOUNTING GUIDANCE
In October 2016, the SEC issued a new rule, Investment Company Reporting Modernization, which, among other provisions, amends Regulation S-X to require standardized, enhanced disclosures, particularly related to derivatives, in investment company financial statements. Compliance with the guidance is required for financial statements filed with the SEC on or after August 1, 2017.
PAGE 14 § DODGE & COX GLOBAL BOND FUND
NOTES TO FINANCIAL STATEMENTS
Management is currently assessing the impact of this rule to the Fund’s financial statements and other filings and does not expect any impact to the Fund’s net assets or results of operations.
NOTE 9—SUBSEQUENT EVENTS
Fund management has determined that no material events or transactions occurred subsequent to December 31, 2016, and through the date of the Fund’s financial statements issuance, which require additional disclosure in the Fund’s financial statements.
DODGE & COX GLOBAL BOND FUND §PAGE 15
FINANCIAL HIGHLIGHTS
| | | | | | | | | | | | |
SELECTED DATA AND RATIOS (for a share outstanding throughout the period) | | Year Ended
December 31, 2016 | | | Year Ended
December 31, 2015 | | | Period from May 1, 2014
(commencement of Fund operations)
to December 31, 2014 | |
Net asset value, beginning of period | | | $9.67 | | | | $10.31 | | | | $10.73 | |
Income from investment operations: | | | | | | | | | | | | |
Net investment income | | | 0.30 | | | | 0.34 | | | | 0.16 | |
Net realized and unrealized gain (loss) | | | 0.54 | | | | (0.98 | ) | | | (0.44 | ) |
| | | | | | | | | | | | |
Total from investment operations | | | 0.84 | | | | (0.64 | ) | | | (0.28 | ) |
| | | | | | | | | | | | |
Distributions to shareholders from: | | | | | | | | | | | | |
Net investment income | | | (0.18 | ) | | | — | | | | (0.14 | ) |
Net realized gain | | | — | | | | — | | | | — | |
| | | | | | | | | | | | |
Total distributions | | | (0.18 | ) | | | — | | | | (0.14 | ) |
| | | | | | | | | | | | |
Net asset value, end of period | | | $10.33 | | | | $9.67 | | | | $10.31 | |
| | | | | | | | | | | | |
Total return | | | 8.64 | % | | | (6.21 | )% | | | (2.59 | )% |
Ratios/supplemental data: | | | | | | | | | | | | |
Net assets, end of period (millions) | | | $110 | | | | $68 | | | | $65 | |
Ratio of expenses to average net assets | | | 0.60 | % | | | 0.60 | % | | | 0.60 | %(a) |
Ratio of expenses to average net assets, before reimbursement by investment manager | | | 1.33 | % | | | 1.41 | % | | | 2.18 | %(a) |
Ratio of net investment income to average net assets | | | 3.77 | % | | | 3.39 | % | | | 2.83 | %(a) |
Portfolio turnover rate | | | 73 | % | | | 55 | % | | | 36 | % |
See accompanying Notes to Financial Statements
PAGE 16 § DODGE & COX GLOBAL BOND FUND
REPORT OF INDEPENDENT REGISTERED PUBLIC ACCOUNTING FIRM
To the Trustees of Dodge & Cox Funds and Shareholders of Dodge & Cox Global Bond Fund
In our opinion, the accompanying statement of assets and liabilities, including the portfolio of investments, and the related statements of operations and of changes in net assets and the financial highlights present fairly, in all material respects, the financial position of Dodge & Cox Global Bond Fund (one of the series constituting Dodge & Cox Funds, hereafter referred to as the “Fund”) as of December 31, 2016, the results of its operations for the year then ended, the changes in its net assets for each of the two years in the period then ended and the financial highlights for each of the periods indicated, in conformity with accounting principles generally accepted in the United States of America. These financial statements and financial highlights (hereafter referred to as “financial statements”) are the responsibility of the Fund’s management. Our responsibility is to express an opinion on these financial statements based on our audits. We conducted our audits of these financial statements in accordance with the standards of the Public Company Accounting Oversight Board (United States). Those standards require that we plan and perform the audit to obtain reasonable assurance about whether the financial statements are free of material misstatement. An audit includes examining, on a test basis, evidence supporting the amounts and disclosures in the financial statements, assessing the accounting principles used and significant estimates made by management, and evaluating the overall financial statement presentation. We believe that our audits, which included confirmation of securities as of December 31, 2016 by correspondence with the custodian and brokers, provide a reasonable basis for our opinion.
PricewaterhouseCoopers LLP
San Francisco, California
February 15, 2017
DODGE & COX GLOBAL BOND FUND §PAGE 17
BOARD APPROVAL OF FUNDS’ INVESTMENT MANAGEMENT AGREEMENTS AND MANAGEMENT FEES
(unaudited)
The Board of Trustees is responsible for overseeing the performance of the Dodge & Cox Funds’ investment manager and determining whether to continue the Investment Management Agreements between the Funds and Dodge & Cox each year (the “Agreements”). At a meeting of the Board of Trustees of the Trust held on December 14, 2016, the Trustees, by a unanimous vote (including a separate vote of those Trustees who are not “interested persons” (as defined in the Investment Company Act of 1940) (the “Independent Trustees”)), approved the renewal of the Agreements for an additional one-year term through December 31, 2017 with respect to each Fund. During the course of the year, the Board received extensive information and materials relating to the investment management and administrative services provided by Dodge & Cox and the performance of each of the Funds.
INFORMATION RECEIVED
In 2016, the Board requested and received a series of special presentations relating to the proposed renewal of the Funds’ Agreements. These presentations, which took place over the course of the year, covered, among other things, (i) a report about asset management industry trends and the competitive landscape for Dodge & Cox and the Funds; (ii) an extensive presentation regarding economies of scale, which included materials describing key enhancements over the past 15 years in the scope of services that Dodge & Cox furnishes to the Funds; (iii) a detailed presentation by Morningstar® representatives regarding the format, methodology, and content of Morningstar’s 15(c) report; (iv) materials describing peer fund management fees (including funds with breakpoints) and expense ratios and Dodge & Cox’s separate account advisory fee schedules as compared to those of peer firms; and (v) reports by outside counsel regarding mutual fund litigation trends and developments.
In addition to the foregoing and in advance of the meeting, the Board, including each of the Independent Trustees, requested, received, and reviewed materials relating to the Agreements and the services provided by Dodge & Cox. The Independent Trustees retained Morningstar to prepare an independent expense and performance summary for each Fund and comparable funds managed by other advisers identified by Morningstar. The Morningstar materials included information regarding advisory fee rates, expense ratios, and transfer agency, custodial, and distribution expenses, as well as appropriate performance comparisons to each Fund’s peer group and an index or combination of indices. The Morningstar materials also included a comparison of expenses of various share classes offered by comparable funds. The materials reviewed by the Board contained information concerning, among other things, Dodge & Cox’s profitability, financial results and condition, advisory fee revenue and separate account fee schedules. The Board additionally considered the Funds’ brokerage commissions, turnover rates, sales
and redemption data, and the significant investment that
Dodge & Cox makes in research used in managing the Funds. The Board received and reviewed memoranda and related materials addressing, among other things, Dodge & Cox’s services to the Funds; how Dodge & Cox Funds’ fees compare to fees of peer group funds; the different fees, services, costs, and risks associated with other accounts managed by Dodge & Cox as compared to the Dodge & Cox Funds; and the ways in which the Funds realize economies of scale. Throughout the process of reviewing the services provided by Dodge & Cox and preparing for the meeting, the Independent Trustees found Dodge & Cox to be open, forthright, detailed, and very helpful in answering questions about all issues. The Board received copies of the Agreements and a memorandum from the independent legal counsel to the Independent Trustees discussing the factors generally regarded as appropriate to consider in evaluating advisory arrangements. The Trust’s Contract Review Committee, consisting solely of Independent Trustees, met with the independent legal counsel on November 3, 2016 and again on December 14, 2016 to discuss whether to renew the Agreements. The Board, including the Independent Trustees, subsequently concluded that the existing Agreements are fair and reasonable and voted to approve the Agreements. In considering the Agreements, the Board, including the Independent Trustees, did not identify any single factor or particular information as all-important or controlling. In reaching the decision to approve the Agreements, the Board considered several factors, discussed below, to be key factors and reached the conclusions described below.
NATURE, QUALITY, AND EXTENT OF THE SERVICES
The Board considered that Dodge & Cox provides a wide range of services to the Funds in addition to portfolio management and that the quality of these services has been excellent in all respects. The extensive nature of services provided by Dodge & Cox has been documented in materials provided to the Board and in presentations made to the Board throughout the year. In particular, the Board considered the nature, quality, and extent of portfolio management, administrative, and shareholder services performed by Dodge & Cox. With regard to portfolio management services, the Board considered Dodge & Cox’s established long-term history of care and conscientiousness in the management of the Funds; its demonstrated consistency in investment approach and depth; the background and experience of the Dodge & Cox Investment Policy Committee, International Investment Policy Committee, Global Stock Investment Policy Committee, Fixed Income Investment Policy Committee, and Global Bond Investment Policy Committee, and research analysts responsible for managing the Funds; Dodge & Cox’s methods for assessing the regulatory and investment climate in various jurisdictions; its overall high level of attention to its core investment management function; and its commitment to the Funds and their shareholders. The Board also considered analysis provided by Morningstar regarding the degree of active management in the Dodge & Cox equity funds and concluded that Dodge & Cox is an active, high conviction manager of equity portfolios, not a “closet index” manager.
PAGE 18 § DODGE & COX GLOBAL BOND FUND
In the area of administrative and shareholder services, the Board considered the excellent quality of Dodge & Cox’s work in areas such as compliance, legal services, trading, proxy voting, technology, oversight of the Funds’ transfer agent and custodian, tax compliance, and shareholder communication through its website and other means. The Board also noted Dodge & Cox’s diligent disclosure policy, its favorable compliance record, and its reputation as a trusted, shareholder-friendly mutual fund family.
In addition, the Board considered that Dodge & Cox manages approximately $180 billion in Fund assets with fewer professionals than most comparable funds, and that on average these professionals have more experience and longer tenure than investment professionals at comparable funds. The Board also noted that Dodge & Cox is an investment research-oriented firm with no other business endeavors to distract management’s attention from its research efforts or to present material conflicts of interest with the operations of the Funds, that its investment professionals adhere to a consistent investment approach across the Funds, and that due to its careful and deliberate strategy with respect to new products, Dodge & Cox has had remarkable stability in its mutual fund product offerings over the course of the past 86 years and has the fewest funds of any of the 25 largest mutual fund families by assets. The Board further considered the favorable stewardship grades given by Morningstar to each of the Funds and the “Gold” analyst rating awarded by Morningstar to all of the Funds except the Global Bond Fund. The Board concluded that it was satisfied with the nature, extent, and quality of investment management and other services provided to the Funds by Dodge & Cox.
INVESTMENT PERFORMANCE
The Board considered short-term and long-term investment performance for each Fund (including periods of outperformance or underperformance) as compared to both relevant indices and the performance of such Fund’s peer group. The Board noted that, as of November 30, 2016, the Funds had strong absolute and relative year-to-date performance, and were also generally solid performers over longer periods. The Board determined after extensive review and inquiry that Dodge & Cox’s historic, long-term, team-oriented, bottom-up investment approach remains consistent and that Dodge & Cox continues to be distinguished by its integrity, transparency, and independence. The Board considered that the performance of the Funds is the result of value-oriented investment management process that emphasizes a long-term investment horizon, comprehensive independent research, team approach, price discipline, low cost, and low portfolio turnover. The Board also considered that the investment performance delivered by Dodge & Cox to the Funds appeared to be consistent with the relevant performance delivered for other clients of Dodge & Cox. The Board concluded that Dodge & Cox has delivered favorable long-term performance for Fund investors consistent with the long-term investment strategies being pursued by the Funds.
COSTS AND ANCILLARY BENEFITS
Costs of Services to Funds: Fees and Expenses. The Board considered each Fund’s management fee rate and expense ratio relative to each Fund’s peer group and relative to management fees charged by Dodge & Cox to other clients. In particular, the Board considered that the Funds continue to be substantially below their peer group median in expense ratios and that many media and industry reports specifically comment on the low expense ratios of the Funds, which have been a defining characteristic of the Funds for many years. The Board also evaluated the operating structures of the Funds and Dodge & Cox, noting that the Funds do not charge front-end sales commissions or distribution fees, and Dodge & Cox bears, among other things, the significant cost of third party research, reimbursement for shareholder recordkeeping and administrative costs to third-party retirement plan administrators, and administrative and office overhead. The Board noted that expenses are well below industry averages.
When compared to peer group funds, the Funds are in the quartile with the lowest expense ratios. The Board also considered that the Funds receive numerous administrative, regulatory compliance, legal, technology, and shareholder support services from Dodge & Cox without any additional administrative fee and the fact that the Funds have relatively low transaction costs and portfolio turnover rates. The Board noted the Funds’ unusual single-share-class structure and reviewed Morningstar data (including asset-weighted average expense ratios) showing that the few peer group funds with lower expense ratios often have other share classes with significantly higher expense ratios. In this regard, the Board considered that many of the Funds’ shareholders would not be eligible to purchase comparably priced shares of many peer group funds, which typically make their lower-priced share classes available only to institutional investors. The Board determined that the Funds provide access for small investors to high quality investment management at a relatively low cost. The Board also considered that the Funds’ are priced to scale, i.e., management fee rates begin at relatively low levels with the result that, even without breakpoints, the Funds’ management fee rates are lower than those of many peer funds whose fee schedules include breakpoints. With respect to non-U.S. funds sponsored and managed by Dodge & Cox that are comparable to the Funds in many respects, the Board noted that the fee rates charged by Dodge & Cox are the same as or higher than the fee rates charged to the Funds.
The Board reviewed information regarding the fee rates Dodge & Cox charges to separate accounts that have investment programs similar to those of the Funds, including instances where separate account fees are lower than Fund fees. The Board considered the significant differences in the nature and scope of services Dodge & Cox provides to the Funds as compared to other client accounts, as well as material differences in regulatory, litigation, and other risks as between Dodge & Cox Funds and other types of clients. The Board noted that different markets exist for mutual fund and institutional separate account management services and that a comparison of Fund fee rates and separate account fee rates must consider the fact that separate account
DODGE & COX GLOBAL BOND FUND §PAGE 19
clients bear additional costs and responsibilities that are included in the cost of a Fund. The Board further noted that many sophisticated institutional investors in the Funds that are eligible to open separate accounts at Dodge & Cox have decided for various reasons to invest in the Funds. After consideration of these matters, the Board concluded that the overall costs incurred by the Funds for the services they receive (including the management fee paid to Dodge & Cox) are reasonable and that the fees are acceptable based upon the qualifications, experience, reputation, and performance of Dodge & Cox and the low overall expense ratios of the Funds.
Profitability and Costs of Services to Dodge & Cox; “Fall-out” Benefits. The Board reviewed reports of Dodge & Cox’s financial position, profitability, and estimated overall value and considered Dodge & Cox’s overall profitability within its context as a private, employee-owned S-Corporation and relative to the favorable services provided. The Board noted in particular that Dodge & Cox’s profits are not generated by high fee rates, but reflect an extraordinarily streamlined, efficient, and focused business approach toward investment management.
The Board recognized the importance of Dodge & Cox’s profitability—which is derived solely from management fees and does not include other business ventures—to maintain its independence, stability, company culture and ethics, and management continuity. The Board also considered that the compensation/profit structure at Dodge & Cox includes a return on shareholder employees’ investment in the firm, which is vital for remaining independent and facilitating retention of management and investment professionals. The Board considered independent research indicating that firms that grow organically, rather than through acquisition, tend to have better performance. Key to organic growth is the ability to retain talented and experienced analysts, portfolio managers, and other professionals. The Board also considered that in January 2015, Dodge & Cox closed the International Stock Fund to new investors to proactively manage the growth of the Fund. The Stock Fund and Balanced Fund were similarly closed to new investors during periods of significant growth in the past. While these actions are intended to benefit existing Fund shareholders, the effect is to reduce potential revenues to Dodge & Cox from new shareholders.
The Board also considered potential “fall-out” benefits (including the receipt of research from unaffiliated brokers and reputational benefits to non-U.S. funds sponsored and managed by Dodge & Cox) that Dodge & Cox might receive as a result of its association with the Funds and determined that they are acceptable. The Board also noted that Dodge & Cox continues to invest substantial sums in its business in order to provide enhanced services, systems, and research capabilities, all of which benefit the Funds. The Board concluded that Dodge & Cox’s profitability is the keystone of its independence, stability, and long-term investment performance and that the profitability of Dodge & Cox’s relationship with the Funds (including fall-out benefits) is fair and reasonable.
ECONOMIES OF SCALE
The Board considered whether there have been economies of scale with respect to the management of each Fund, whether the Funds have appropriately benefited from any economies of scale, and whether the management fee rate is reasonable in relation to the level of Fund assets and any economies of scale that may exist. In the Board’s view, any consideration of economies of scale must take account of the Funds’ low fee structure and the considerable efficiencies of the Funds’ organization and fee structure that has been realized by shareholders from the time of each Fund’s inception (i.e., from the first dollar). An assessment of economies of scale must also take into account that Dodge & Cox invests significant time and resources in each new Fund for months (and sometimes years) prior to launch; in addition, expenses are capped, which means that Dodge & Cox subsidizes the operations of a new Fund for a period of time until it reaches scale. The Board observed that, while total Fund assets have grown significantly over the long term, this growth has not been continuous or evenly distributed across all of the Funds, as assets of certain Funds have actually declined over the past ten years.
In addition, the Board noted that Dodge & Cox has shared economies of scale by adding and enhancing services to the Funds over time, and that the internal costs of providing investment management, technology, administrative, legal, and compliance services to the Funds continue to increase. For example, Dodge & Cox has increased its global research staff and investment resources over the years to add important new capabilities for the benefit of Fund shareholders and to address the increased complexity of investing in multinational and non-U.S. companies. In addition, Dodge & Cox has made substantial expenditures in other staff, technology, cybersecurity, and infrastructure to enable it to integrate credit and equity analyses and to be able to implement its strategy in a more effective and secure manner. Over the last ten years, Dodge & Cox has increased its spending on research, investment management, client servicing, and technology including payments for third party research, data services, and computer systems for trading, operations, compliance, accounting, and communications at a rate that has significantly outpaced the Funds’ growth rate during the same period. The Board considered that Dodge & Cox has a history of voluntarily limiting asset growth in several Funds that experienced significant inflows by closing them to new investors in order to protect the Funds’ ability to achieve good investment returns for shareholders. The Board also observed that, even without fee breakpoints, the Funds are competitively priced in a very competitive market and that having a low fee from inception is better for shareholders than starting with a higher fee and adding breakpoints. The Board also noted that there may be certain diseconomies of scale associated with managing large funds, insofar as certain of the costs and risks associated with portfolio management increase as assets grow. The Board concluded that the current Dodge & Cox fee structure is fair and reasonable and adequately shares economies of scale that may exist.
PAGE 20 § DODGE & COX GLOBAL BOND FUND
CONCLUSION
Based on their evaluation of all material factors and assisted by the advice of independent legal counsel to the Independent Trustees, the Board, including the Independent Trustees, concluded that the advisory fee structure was fair and reasonable, that each Fund was paying a competitive fee for the services provided, that the scope and quality of Dodge & Cox’s services has provided substantial value for Fund shareholders over the long term, and that approval of the Agreements was in the best interests of each Fund and its shareholders.
FUND HOLDINGS
The Fund provides a complete list of its holdings four times each fiscal year, as of the end of each quarter. The Fund files the lists with the Securities and Exchange Commission (SEC) on Form N-CSR (second and fourth quarters) and Form N-Q (first and third quarters). Shareholders may view the Fund’s Forms N-CSR and N-Q on the SEC’s website at sec.gov. Forms N-CSR and N-Q may also be reviewed and copied at the SEC’s Public Reference Room in Washington, DC. Information regarding the operations of the Public Reference Room may be obtained by calling 202-942-8090 (direct) or 800-732-0330 (general SEC number). A list of the Fund’s quarter-end holdings is also available at
dodgeandcox.com on or about 15 days following each quarter end and remains available on the web site until the list is updated in the subsequent quarter.
PROXY VOTING
For a free copy of the Fund’s proxy voting policies and procedures, please call 800-621-3979, visit the Fund’s website at www.dodgeandcox.com, or visit the SEC’s website at sec.gov. Information regarding how the Fund voted proxies relating to portfolio securities during the most recent 12-month period ending June 30 is also available at dodgeandcox.com or at sec.gov.
HOUSEHOLD MAILINGS
The Fund routinely mails shareholder reports and summary prospectuses to shareholders and, on occasion, proxy statements. In order to reduce the volume of mail, when possible, only one copy of these documents will be sent to shareholders who are part of the same family and share the same residential address.
If you have a direct account with the Funds and you do not want the mailing of shareholder reports and summary prospectuses combined with other members in your household, contact the Funds at 800-621-3979. Your request will be implemented within 30 days.
DODGE & COX GLOBAL BOND FUND §PAGE 21
THIS PAGE INTENTIONALLY LEFT BLANK
PAGE 22 § DODGE & COX GLOBAL BOND FUND
DODGE & COX FUNDS—EXECUTIVE OFFICER & TRUSTEE INFORMATION
| | | | | | |
Name (Age) and
Address* | | Position with Trust (Year of Election or
Appointment) | | Principal Occupation During Past 5 Years | | Other Directorships Held by Trustees |
| INTERESTED TRUSTEES AND EXECUTIVE OFFICERS |
| Charles F. Pohl (58) | | Chairman and Trustee (Since 2004) | | Chairman (since 2013), Co-President (2011-2013), Senior Vice President (until 2011), and Director of Dodge & Cox; Chief Investment Officer, Portfolio Manager, Investment Analyst, and member of Investment Policy Committee (IPC), Global Stock Investment Policy Committee (GSIPC), International Investment Policy Committee (IIPC), and Fixed Income Investment Policy Committee (FIIPC) | | — |
| Dana M. Emery (55) | | President and Trustee (Trustee since 1993) (President since 2014) | | Chief Executive Officer (since 2013), President (since 2011), Executive Vice President (until 2011), and Director of Dodge & Cox; Director of Fixed Income, Portfolio Manager, and member of FIIPC and Global Bond Investment Policy Committee (GBIPC) | | — |
| Diana S. Strandberg (57) | | Senior Vice President (Since 2006) | | Senior Vice President (since 2011), Vice President (until 2011), and Director (since 2011) of Dodge & Cox; Director of International Equity, Portfolio Manager, Investment Analyst, and member of IPC, GSIPC, IIPC, and GBIPC | | — |
| David H. Longhurst (59) | | Treasurer (Since 2006) | | Vice President and Assistant Treasurer of Dodge & Cox | | — |
| Thomas M. Mistele (63) | | Secretary (Since 1998) | | Chief Operating Officer (until Jan. 2017), Director, Secretary, Senior Counsel (since 2011), and General Counsel (until 2011) of Dodge & Cox | | — |
| Katherine M. Primas (42) | | Chief Compliance Officer (Since 2010) | | Vice President (since 2011) and Chief Compliance Officer of Dodge & Cox | | — |
| INDEPENDENT TRUSTEES |
| Thomas A. Larsen (67) | | Trustee (Since 2002) | | Senior Counsel of Arnold & Porter Kaye Scholer LLP (law firm) (since 2013); Partner of Arnold & Porter LLP (until 2012); Director of Howard, Rice, Nemerovski, Canady, Falk & Rabkin (1977-2011) | | — |
| Ann Mather (56) | | Trustee (Since 2011) | | CFO, Pixar Animation Studios (1999-2004) | | Director, Google, Inc. (internet information services) (since 2005); Director, Glu Mobile, Inc. (multimedia software) (since 2004); Director, Netflix, Inc. (internet television) (since 2010); Director, Arista Networks (cloud networking) (since 2013); Director, Shutterfly, Inc. (internet photography services/publishing) (since 2013) |
| Robert B. Morris III (64) | | Trustee (Since 2011) | | Advisory Director, The Presidio Group (2005-2016); Partner and Managing Director—Global Investment Research at Goldman Sachs (until 2001) | | — |
| Gary Roughead (65) | | Trustee (Since 2013) | | Robert and Marion Oster Distinguished Military Fellow, Hoover Institution (since 2012); Admiral, United States Navy (Ret.); U.S. Navy Chief of Naval Operations (2008-2011) | | Director, Northrop Grumman Corp. (global security) (since 2012); Director, Maersk Line, Limited (shipping and transportation) (since 2016) |
| Mark E. Smith (65) | | Trustee (Since 2014) | | Executive Vice President, Managing Director—Fixed Income at Loomis Sayles & Company, L.P. (2003-2011) | | — |
| John B. Taylor (70) | | Trustee (Since 2005) (and 1995-2001) | | Professor of Economics, Stanford University (since 1984); Senior Fellow, Hoover Institution (since 1996); Under Secretary for International Affairs, United States Treasury (2001-2005) | | — |
| * | | The address for each Officer and Trustee is 555 California Street, 40th Floor, San Francisco, California 94104. Each Officer and Trustee oversees all six series in the Dodge & Cox Funds complex and serves for an indefinite term. |
Additional information about the Trust’s Trustees and Officers is available in the Trust’s Statement of Additional Information (SAI). You can get a free copy of the SAI by visiting the Funds’ website at dodgeandcox.com or calling
800-621-3979.
DODGE & COX GLOBAL BOND FUND §PAGE 23
dodgeandcox.com
For Fund literature, transactions, and account
information, please visit the Funds’ website.
or write or call:
DODGE & COX FUNDS
c/o Boston Financial Data Services
P.O. Box 8422
Boston, Massachusetts 02266-8422
(800) 621-3979
INVESTMENT MANAGER
Dodge & Cox
555 California Street, 40th Floor
San Francisco, California 94104
(415) 981-1710
This report is submitted for the general information of the shareholders of the Fund. The report is not authorized for distribution to prospective investors in the Fund unless it is accompanied by a current prospectus.
This report reflects our views, opinions, and portfolio holdings as of December 31, 2016, the end of the reporting period. Any such views are subject to change at any time based upon market or other conditions and Dodge & Cox disclaims any responsibility to update such views. These views may not be relied on as investment advice and, because investment decisions for a Dodge & Cox Fund are based on numerous factors, may not be relied on as an indication of trading intent on behalf of any Dodge & Cox Fund.
ITEM 2. CODE OF ETHICS.
A code of ethics, as defined in Item 2 of Form N-CSR, adopted by the registrant and applicable to the registrant’s principal executive officer and principal financial officer was in effect during the entire period covered by this report. A copy of the code of ethics as revised May 1, 2014 is filed as an exhibit to this Form N-CSR. No substantive amendments were approved or waivers were granted to this code of ethics during the period covered by this report.
ITEM 3. AUDIT COMMITTEE FINANCIAL EXPERT.
The Board of Trustees of the registrant has determined that Ann Mather and Robert B. Morris III, members of the registrant’s Audit and Compliance Committee, are each an “audit committee financial expert” and are “independent”, as defined in Item 3 of Form N-CSR.
ITEM 4. PRINCIPAL ACCOUNTANT FEES AND SERVICES.
(a) – (d) Aggregate fees billed to the registrant for the fiscal years ended December 31, 2016 and December 31, 2015 for professional services rendered by the registrant’s principal accountant were as follows:
| | | | | | | | |
| | | 2016 | | | 2015 | |
(a) Audit Fees | | $ | 353,000 | | | $ | 340,000 | |
(b) Audit-Related Fees | | | — | | | | — | |
(c) Tax Fees | | | 224,000 | | | | 350,200 | |
(d) All Other Fees | | | — | | | | — | |
Audit fees include amounts related to the audit of the registrant’s annual financial statements and services normally provided by the accountant in connection with statutory and regulatory filings. Tax fees include amounts related to tax advice and tax return preparation, compliance, and reviews.
(e) (1) The registrant’s Audit and Compliance Committee has adopted policies and procedures (“Policies”) which require the registrant’s Audit and Compliance Committee to pre-approve all audit and non-audit services provided by the principal accountant to the registrant. The policies also require the Audit and Compliance Committee to pre-approve any engagement of the principal accountant to provide non-audit services to the registrant’s investment adviser, if the services directly impact the registrant’s operations and financial reporting. The Policies do not apply in the case of audit services that the principal accountant provides to the registrant’s adviser. If a service (other than the engagement of the principal accountant to audit the registrant’s financial statements) is required to be pre-approved under the Policies between regularly scheduled Audit and Compliance Committee meetings, pre-approval may be authorized by a designated Audit and Compliance Committee member with ratification at the next scheduled Audit and Compliance Committee meeting.
(e) (2) No services included in (b) - (d) above were approved pursuant to paragraph (c)(7)(i)(C) of Rule 2-01 of Regulation S-X.
(f) Less than 50% of the hours expended on the principal accountant’s engagement to audit the registrant’s financial statements for the most recent fiscal year were attributed to work performed by persons other than the principal accountant’s full-time, permanent employees.
(g) For the fiscal years ended December 31, 2016 and December 31, 2015, the aggregate fees billed by the registrant’s principal accountant for non-audit services rendered to the registrant, for non-audit services rendered to the registrant’s investment adviser, and for non-audit services rendered to entities controlled by the adviser were $660,800 and $795,300, respectively.
(h) All non-audit services described under (g) above that were not pre-approved by the registrant’s Audit and Compliance Committee were considered by the registrant’s Audit and Compliance Committee and found to be compatible with maintaining the principal accountant’s independence.
ITEM 5. AUDIT COMMITTEE OF LISTED REGISTRANTS.
Not applicable.
ITEM 6. SCHEDULE OF INVESTMENTS.
Not applicable. The complete schedule of investments is included in Item 1 of this Form N-CSR.
ITEM 7. DISCLOSURE OF PROXY VOTING POLICIES AND PROCEDURES FOR CLOSED-END MANAGEMENT INVESTMENT COMPANIES.
Not applicable.
ITEM 8. PORTFOLIO MANAGERS OF CLOSED-END MANAGEMENT INVESTMENT COMPANIES.
Not applicable.
ITEM 9. PURCHASES OF EQUITY SECURITIES BY CLOSED-END MANAGEMENT INVESTMENT COMPANY AND AFFILIATED PURCHASERS.
Not applicable.
ITEM 10. SUBMISSION OF MATTERS TO A VOTE OF SECURITY HOLDERS.
The registrant has adopted the following procedures by which shareholders may recommend nominees to the registrant’s Board of Trustees.
1. The shareholder must submit any such recommendation in writing to the registrant to the attention of the Secretary at the address of the principal executive offices of the registrant. The shareholder’s recommendation is then considered by the registrant’s Nominating Committee.
2. The shareholder recommendation must include:
(i) A statement in writing setting forth (a) the name, date of birth, business address and residence address of the person recommended by the shareholder (the “candidate”); and (b) whether the recommending shareholder believes that the candidate is or will be an “interested person” of the registrant (as defined in the Investment Company Act of 1940) and, if not an “interested person,” information regarding the candidate that will be sufficient for the registrant to make such determination and, if applicable, similar information regarding whether the candidate would satisfy the standards for independence of a Board member under listing standards of the New York Stock Exchange or other applicable securities exchange.
(ii) The written and manually signed consent of the candidate to be named as a nominee and to serve as a Trustee if elected;
(iii) The recommending shareholder’s name as it appears on the registrant’s books and the number of all shares of the registrant owned beneficially and of record by the recommending shareholder (as evidenced to the Nominating Committee’s satisfaction by a recent brokerage or account statement); and
(iv) A description of all arrangements or understandings between the recommending shareholder and the candidate and any other person or persons (including their names) pursuant to which the recommendation is being made by the recommending shareholder.
In addition, the Nominating Committee may require the candidate to furnish such other information as it may reasonably require or deem necessary to determine the eligibility of such candidate to serve on the Board or to satisfy applicable law and information regarding the candidate that would be required to be disclosed if the candidate were a nominee in a proxy statement or other filing required to be made in connection with solicitation of proxies for election of Trustees.
ITEM 11. CONTROLS AND PROCEDURES.
(a) An evaluation was performed within 90 days of the filing of this report, under the supervision and with the participation of the registrant’s management, including the principal executive officer and principal financial officer, of the effectiveness of the design and operation of the registrant’s disclosure controls and procedures. Based on that evaluation, the principal executive officer and principal financial officer concluded that the registrant’s disclosure controls and procedures were effective.
(b) The registrant’s principal executive officer and principal financial officer are aware of no changes in the registrant’s internal control over financial reporting that occurred during the second fiscal quarter of the period covered by this report that has materially affected, or is reasonably likely to materially affect, the registrant’s internal control over financial reporting.
ITEM 12. EXHIBITS.
(a) (1) The registrant’s code of ethics pursuant to Item 2 of Form N-CSR is attached. (EX.99A)
(a) (2) Certifications pursuant to Section 302 of the Sarbanes-Oxley Act of 2002 are attached. (EX.99B)
(a) (3) Not applicable.
(b) Certifications pursuant to Section 906 of the Sarbanes-Oxley Act of 2002 are attached. (EX.99C)
SIGNATURES
Pursuant to the requirements of the Securities Exchange Act of 1934 and the Investment Company Act of 1940, the registrant has duly caused this report to be signed on its behalf by the undersigned, thereunto duly authorized.
Dodge & Cox Funds
| | |
| By | | /s/ Charles F. Pohl |
| | Charles F. Pohl |
| | Chairman - Principal Executive Officer |
| |
| Date | | February 17, 2017 |
Pursuant to the requirements of the Securities Exchange Act of 1934 and the Investment Company Act of 1940, this report has been signed below by the following persons on behalf of the registrant and in the capacities and on the dates indicated.
Dodge & Cox Funds
| | |
| By | | /s/ Charles F. Pohl |
| | Charles F. Pohl |
| | Chairman - Principal Executive Officer |
| |
| By | | /s/ David H. Longhurst |
| | David H. Longhurst |
| | Treasurer - Principal Financial Officer |
Date February 17, 2017