UNITED STATES
SECURITIES AND EXCHANGE COMMISSION
Washington, D.C. 20549
FORM N-CSR
CERTIFIED SHAREHOLDER REPORT OF REGISTERED
MANAGEMENT INVESTMENT COMPANIES
Investment Company Act file number 811-173
DODGE & COX FUNDS
(Exact name of registrant as specified in charter)
555 California Street, 40th Floor
San Francisco, CA 94104
(Address of principal executive offices) (Zip code)
Roberta R.W. Kameda, Esq.
555 California Street, 40th Floor
San Francisco, CA 94104
(Name and address of agent for service)
Registrant’s telephone number, including area code: 415-981-1710
Date of fiscal year end: DECEMBER 31, 2017
Date of reporting period: DECEMBER 31, 2017
Form N-CSR is to be used by management investment companies to file reports with the Commission not later than 10 days after the transmission to stockholders of any report that is required to be transmitted to stockholders under Rule 30e-1 under the Investment Company Act of 1940 (17 CFR 270.30e-1). The Commission may use the information provided on Form N-CSR in its regulatory, disclosure review, inspection, and policymaking roles.
A registrant is required to disclose the information specified by Form N-CSR, and the Commission will make this information public. A registrant is not required to respond to the collection of information contained in Form N-CSR unless the Form displays a currently valid Office of Management and Budget (“OMB”) control number. Please direct comments concerning the accuracy of the information collection burden estimate and any suggestions for reducing the burden to Secretary, Securities and Exchange Commission, 450 Fifth Street, NW, Washington, DC 20549-0609. The OMB has reviewed this collection of information under the clearance requirements of 44 U.S.C. ss. 3507.
ITEM 1. REPORTS TO STOCKHOLDERS.
The following are the December 31, 2017 annual reports for the Dodge & Cox Funds, a Delaware statutory trust, consisting of six series: Dodge & Cox Stock Fund, Dodge & Cox Global Stock Fund, Dodge & Cox International Stock Fund, Dodge & Cox Balanced Fund, Dodge & Cox Income Fund, and Dodge & Cox Global Bond Fund. The reports of each series were transmitted to their respective shareholders on February 16, 2018.

DODGE & COX FUNDS®
Annual Report
December 31, 2017
Stock Fund
ESTABLISHED 1965
TICKER: DODGX
12/17 SF AR  Printed on recycled paper
TO OUR SHAREHOLDERS
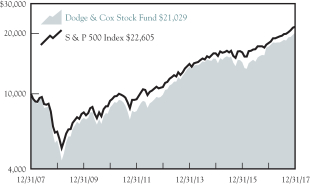
The Dodge & Cox Stock Fund had a total return of 18.3% for the year ended December 31, 2017, compared to a return of 21.8% for the S&P 500 Index.
MARKET COMMENTARY
U.S. equity markets continued to climb steadily during the fourth quarter, capping off a year of strong performance and low volatility. The S&P 500 reached an all-time high in mid-December and ended the year up nearly 22%. The period of sustained performance in U.S. equities since March 2009 is the second longest in U.S. history.
During 2017, U.S. growth stocks (the higher valuation portion of the equity market) outperformed value stocks (the lower valuation portion) by 17 percentage points overall.(a) Companies in sectors and industries associated with technology (e.g., Information Technology, Internet Retail, Media) led the market. The “FAANG” growth stocks—Facebook, Amazon, Apple, Netflix, and Google—were particularly strong, accounting for 20% of the S&P 500’s total return. Within the traditional value sectors, Energy was a laggard despite an 18% increase in oil prices during the year. Dodge & Cox’s approach is value oriented, and the Fund outperformed the U.S. value investment universe by five percentage points.(b) However, the outperformance of growth stocks had a negative impact on the Fund’s relative results versus the broad-based S&P 500.
Robust corporate earnings growth, sustained economic expansion, and rising interest rates were major factors influencing equity market returns. Anticipation of the new U.S. tax bill signed in December, which significantly reduces statutory corporate tax rates, also contributed. Economic data released during the fourth quarter was solid (e.g., the unemployment rate hit a 17-year low), suggesting the U.S. economy remains on a steady path.
INVESTMENT STRATEGY: FINDING OPPORTUNITIES IN HEALTH CARE AND ENERGY
At Dodge & Cox, our strong price discipline is an essential component of our investment strategy. Investment returns hinge on the purchase price: a good company is not always a good investment if the starting valuation is too high. We seek to invest in companies with valuations that do not fully reflect prospects for the company and where our analysis suggests the possibility of more positive developments. We constantly weigh valuation against company fundamentals and re-evaluate our thinking as prices change.
In response to diverging valuations, we made a number of gradual portfolio adjustments during 2017. We trimmed selected Information Technology, Media, and Financials holdings that had performed strongly. The Fund’s largest sale was DXC Technology, the company formed through the merger of Hewlett Packard Enterprise’s services division and Computer Sciences Corporation. As a result of the Fund’s investment in Hewlett Packard Enterprise, the Fund received DXC shares in April 2017, and the stock performed strongly. While the CEO has an impressive track record of shareholder value creation, management’s three-year plan embedded high expectations for margin expansion and earnings growth. We questioned whether these targets, even if achieved, would be sustainable over the long term. These concerns, combined with DXC’s higher valuation, led us to sell the
stock (up 36% over the holding period). We redeployed these proceeds, and others, into more attractively valued companies in the Health Care and Energy sectors, where our long-term outlook is more positive than that of many other investors.
Health Care
In the Pharmaceuticals industry, we believe valuations are compelling, reflecting regulatory and pricing concerns. As a result of industry consolidation and higher market shares, pharmacy benefit managers have been able to exert increased pricing pressure on drug manufacturers. This trend could impact long-term profitability for pharmaceutical companies. Despite these challenges, the FDA has recently increased the pace of new drug approvals. Most of the Fund’s pharmaceutical company holdings feature durable franchises with significant barriers to entry and growth potential from new discoveries and expansion into emerging markets.
Based on our evaluation of the risks and opportunities, the portfolio has significant exposure to the Pharmaceuticals and Biotechnology industries (15.0% compared to 7.4% for the S&P 500(c)). In 2017, we added tactically to several holdings (including Bristol Myers Squibb) as valuations became more attractive and initiated three new positions: Eli Lilly and GlaxoSmithKline, which are highlighted below, and Gilead Sciences (a biopharmaceutical company focused on treatments and research for HIV/AIDS and hepatitis).(d)
Eli Lilly
During the second quarter of 2017, we initiated a position in Eli Lilly, a leading drug company focused on branded pharmaceuticals and animal health products. As the only pharmaceutical company with a presence across all major drug classes in the diabetes field, it has an advantage in contracting and marketing products. Until recently, Eli Lilly was losing market share to Novo Nordisk and Sanofi in the key area of diabetes classes, given its smaller emerging markets footprint and lack of a basal insulin therapy. This trend reversed as Eli Lilly launched several new products during the last few years, and the company is now gaining share in most therapeutic areas within diabetes. Eli Lilly’s partnership with Boehringer Ingelheim, where costs and profits are shared 50/50, has been important in rejuvenating its diabetes portfolio.
After weathering two recent patent expirations, Eli Lilly is entering what could be an extended period of growth. The company’s four new drugs should each generate over $1 billion in annual sales. All of these recent product approvals have found commercial success and are driving future sales growth. If revenue grows as we expect, margins should improve significantly and boost earnings growth. The company has consistently had one of the better research and development (R&D) groups in the Pharmaceuticals industry due to its stable organization, thoughtful leadership, and high funding.
Most importantly, the company’s newly appointed CEO leads a competent management team that appears to be well aligned with the interests of long-term shareholders and capable of navigating competitive and regulatory risks. Eli Lilly was a 1.4% position in the portfolio on December 31.
GlaxoSmithKline
The Fund recently re-established a position in GlaxoSmithKline, after selling it in 2015. Based in the United Kingdom, the
PAGE 2 § DODGE & COX STOCK FUND
company has leading therapeutic franchises in respiratory care and HIV. In addition to its traditional pharmaceuticals business, the company is diversified through strong and growing businesses in vaccines and over-the-counter consumer health.
In 2015, we sold GlaxoSmithKline based on market headwinds and a higher valuation. The company’s pharmaceuticals business was suffering from pricing pressure on a key respiratory drug, Advair, and the pipeline of new drug launches was weak. The valuation, at 20 times forward earnings, was relatively expensive and did not sufficiently compensate for the risks. Some of those risks, including continued weakness in Advair sales, materialized, and the valuation declined after we sold the position.
In the second half of 2017, however, we built a position in GlaxoSmithKline again based on a more favorable fundamental long-term outlook and a lower valuation (12 times forward earnings). In the respiratory care division, declines in Advair sales should be offset by new drugs, aided by a new inhaler. The HIV segment is growing at healthy rates due to increased adoption of Dolutegravir, a drug that blocks an enzyme needed for HIV to replicate. Combined with continued growth in vaccines and consumer health, the company should achieve modest earnings growth. Meanwhile, the management team has also been revamped. The new CEO is focusing on renewing the pharmaceutical pipeline and has brought in a well-regarded head of R&D to lead that effort. Improvements in the drug pipeline will take time to manifest, but in the meantime, the company continues to generate stable cash flow and has an attractive 6% dividend yield. On December 31, GlaxoSmithKline was a 1.4% position in the Fund.
Energy
While Energy was the second-worst performing sector (down 1%) of the S&P 500 during 2017, we continue to believe Energy is an attractive area of the market. Global supply and demand fundamentals are supportive of higher oil prices. Demand growth in the developing world continues to be healthy, and the dearth of investment in new supply over the past few years should lead to a tighter balance. We conduct ongoing research to test our investment thesis and recently met with industry executives and experts in Houston and the Middle East. Our trips reaffirmed that development costs in U.S. shale oil are rising with more activity and that other global sources of new supply are likely needed to satisfy demand. Our research also reinforced the importance of investing in oil producers with assets on the low end of the cost curve and management teams that are investing counter-cyclically.
The Fund remains modestly overweight the Energy sector (7.8% compared to 6.1% for the S&P 500), primarily due to investments in the Energy Equipment & Services (Oil Services) industry and growing exposure to exploration and production (E&P) companies. Oil services companies are particularly appealing due to their strong franchises and ability to expand earnings as producers reinvest in projects to meet growing global demand. Given attractive valuations, we recently added to selected holdings, including Anadarko Petroleum (a leading global E&P company with strong operational capabilities) and Baker Hughes.
Baker Hughes, a GE Company
We have held Baker Hughes in the Fund since 1998, actively adding to and trimming from the position given relative valuation opportunities and changing fundamentals over the years. In July 2017, GE Oil & Gas completed its acquisition of Baker Hughes,
forming Baker Hughes GE (BHGE), now the second largest oilfield services company in the world after Schlumberger (also held in the Fund, 1.6% at year end). By combining oilfield services (Baker Hughes) and oilfield equipment (GE Oil & Gas) businesses, BHGE is the only company that serves the upstream, midstream, and downstream segments of the Oil, Gas, and Consumable Fuels industry.
Adjusting for the $17.50 per share cash dividend the Fund received in July, the stock was weak in 2017. While oil service activity levels have started to rebound in North America due to the resurgence of U.S. shale oil, hopes for an international recovery have been delayed. During the second half of 2017, we added to BHGE given its lower valuation, earnings growth potential, diversified business model, and financial strength. Management is targeting a $1.6 billion improvement in EBITDA, driven by 75% cost savings and 25% revenue synergies. BHGE has a long-term opportunity to increase its market share with its improved scale. BHGE’s leadership position in compressors and turbines generates long-term service contracts with attractive recurring revenue, which should reduce downside volatility. In addition, the company has a healthy balance sheet and recently announced a $3 billion share buyback. We believe BHGE provides attractive risk-reward diversification to the Fund’s Energy portfolio. The company was a 1.0% position on December 31.
IN CLOSING
U.S. equity valuations are now at the high end of the historical range. While we have a tempered return outlook for the overall U.S. market, we are optimistic about the long-term prospects for the Fund’s portfolio, which continues to trade at a significant discount to the market. On December 31, the Fund’s portfolio of 66 companies traded at 16 times forward estimated earnings, compared to 20 times for the S&P 500.
As an active, value-oriented manager, we believe the valuation disparities that characterize the current market offer significant opportunities. Our fundamental, bottom-up, price-disciplined investment approach requires conviction and patience. Accordingly, maintaining a long-term investment horizon and staying the course are essential. We thank our fellow shareholders for your continued confidence in Dodge & Cox. As always, we welcome your comments and questions.
For the Board of Trustees,
| | |
 | |  |
Charles F. Pohl, Chairman | | Dana M. Emery, President |
January 30, 2018
| (a) | The Russell 1000 Growth Index had a total return of 30.2% compared to 13.7% for the Russell 1000 Value Index during 2017. |
| (b) | The Dodge & Cox Stock Fund had a total return of 18.3% compared to 13.7% for the Russell 1000 Value Index during 2017. |
| (c) | Unless otherwise specified, all weightings and characteristics are as of December 31, 2017. |
| (d) | The use of specific examples does not imply that they are more or less attractive investments than the Fund’s other holdings. |
DODGE & COX STOCK FUND §PAGE 3
ANNUAL PERFORMANCE REVIEW
The Fund underperformed the S&P 500 by 3.5% percentage points in 2017.
Key Detractors from Relative Results
| | § | | Returns from holdings in the Energy sector (down 16% compared to down 1% for the S&P 500 sector), combined with a higher average weighting (8% versus 6%), detracted from results. Apache (down 32%), Baker Hughes (down 27%), and Anadarko Petroleum (down 23%) were weak. | |
| | § | | Relative results were hindered by the strong performance of several large internet and technology stocks not held by the Fund (e.g., Apple, Amazon, Facebook). The impact was significant in the Consumer Discretionary sector, where the Fund’s holdings lagged meaningfully (up 13% compared to up 23% for the S&P 500 sector). In Information Technology, the Fund’s underweight position and modest underperformance (up 36% compared to up 39% for the S&P 500 sector) hurt. | |
| | § | | Sprint (down 30%) also detracted. | |
Key Contributors to Relative Results
| | § | | The return for Wal-Mart (up 47%), the Fund’s only holding in Consumer Staples, considerably outpaced the S&P 500 sector (up 13%). | |
| | § | | The Fund’s lack of holdings in the Real Estate and Utilities sectors (up 11% and up 12%, respectively) aided relative results as these areas lagged the broader index. | |
| | § | | A number of individual holdings also contributed, including Alnylam Pharmaceuticals (up 239%), Cigna (up 52%), HP Inc. (up 46%), and several financial services companies, including American Express (up 36%), Bank of America (up 36%), and Charles Schwab (up 31%). | |
KEY CHARACTERISTICS OF DODGE & COX
Independent Organization
Dodge & Cox is one of the largest privately owned investment managers in the world. We remain committed to independence, with a goal of providing the highest quality investment management service to our existing clients.
Over 85 Years of Investment Experience
Dodge & Cox was founded in 1930. We have a stable and well-qualified team of investment professionals, most of whom have spent their entire careers at Dodge & Cox.
Experienced Investment Team
The U.S. Equity Investment Committee, which is the decision-making body for the Stock Fund, is an eight-member committee with an average tenure at Dodge & Cox of 24 years.
One Business with a Single Research Office
Dodge & Cox manages equity (domestic, international, and global), fixed income (domestic and global), and balanced investments, operating from one office in San Francisco.
Consistent Investment Approach
Our team decision-making process involves thorough, bottom-up fundamental analysis of each investment.
Long-Term Focus and Low Expenses
We invest with a three- to five-year investment horizon, which has historically resulted in low turnover relative to our peers. We manage Funds that maintain low expense ratios.
Risks: The Fund is subject to market risk, meaning holdings in the Fund may decline in value for extended periods due to the financial prospects of individual companies, or due to general market and economic conditions. Please read the prospectus and summary prospectus for specific details regarding the Fund’s risk profile.
PAGE 4 § DODGE & COX STOCK FUND
GROWTH OF $10,000 OVER 10 YEARS
FOR AN INVESTMENT MADE ON DECEMBER 31, 2007
AVERAGE ANNUAL TOTAL RETURN
FOR PERIODS ENDED DECEMBER 31, 2017
| | | | | | | | | | | | | | | | |
| | | 1 Year | | | 5 Years | | | 10 Years | | | 20 Years | |
Dodge & Cox Stock Fund | | | 18.32 | % | | | 16.30 | % | | | 7.71 | % | | | 9.55 | % |
S&P 500 Index | | | 21.83 | | | | 15.79 | | | | 8.50 | | | | 7.20 | |
Returns represent past performance and do not guarantee future results. Investment return and share price will fluctuate with market conditions, and investors may have a gain or loss when shares are sold. Fund performance changes over time and currently may be significantly lower than stated. Performance is updated and published monthly. Visit the Fund’s website at dodgeandcox.com or call 800-621-3979 for current performance figures.
The Fund’s total returns include the reinvestment of dividend and capital gain distributions, but have not been adjusted for any income taxes payable by shareholders on these distributions or on Fund share redemptions. Index returns include dividends but, unlike Fund returns, do not reflect fees or expenses. The S&P 500 Index is a market capitalization-weighted index of 500 large-capitalization stocks commonly used to represent the U.S. equity market.
S&P 500® is a trademark of S&P Global Inc.
FUND EXPENSE EXAMPLE
As a Fund shareholder, you incur ongoing Fund costs, including management fees and other Fund expenses. All mutual funds have ongoing costs, sometimes referred to as operating expenses. The following example shows ongoing costs of investing in the Fund and can help you understand these costs and compare them with those of other mutual funds. The example assumes a $1,000 investment held for the six months indicated.
ACTUAL EXPENSES
The first line of the table below provides information about actual account values and expenses based on the Fund’s actual returns. You may use the information in this line, together with your account balance, to estimate the expenses that you paid over the period. Simply divide your account value by $1,000 (for example, an $8,600 account value divided by $1,000 = 8.6), then multiply the result by the number in the first line under the heading “Expenses Paid During Period” to estimate the expenses you paid on your account during this period.
HYPOTHETICAL EXAMPLE FOR COMPARISON WITH OTHER MUTUAL FUNDS
Information on the second line of the table can help you compare ongoing costs of investing in the Fund with those of other mutual funds. This information may not be used to estimate the actual ending account balance or expenses you paid during the period. The hypothetical “Ending Account Value” is based on the actual expense ratio of the Fund and an assumed 5% annual rate of return before expenses (not the Fund’s actual return). The amount under the heading “Expenses Paid During Period” shows the hypothetical expenses your account would have incurred under this scenario. You can compare this figure with the 5% hypothetical examples that appear in shareholder reports of other mutual funds.
| | | | | | | | | | | | |
Six Months Ended
December 31, 2017 | | Beginning Account Value
7/1/2017 | | | Ending Account Value
12/31/2017 | | | Expenses Paid
During Period* | |
Based on Actual Fund Return | | $ | 1,000.00 | | | $ | 1,108.10 | | | $ | 2.74 | |
Based on Hypothetical 5% Yearly Return | | | 1,000.00 | | | | 1,022.61 | | | | 2.63 | |
| * | | Expenses are equal to the Fund’s annualized expense ratio of 0.52%, multiplied by the average account value over the period, multiplied by 184/365 (to reflect the one-half year period). |
The expenses shown in the table highlight ongoing costs only and do not reflect any transactional fees or account maintenance fees. Though other mutual funds may charge such fees, please note that the Fund does not charge transaction fees (e.g., redemption fees, sales loads) or universal account maintenance fees (e.g., small account fees).
DODGE & COX STOCK FUND §PAGE 5
| | | | |
| FUND INFORMATION (unaudited) | | | December 31, 2017 | |
| | | | |
| GENERAL INFORMATION | | | |
Net Asset Value Per Share | | | $203.61 | |
Total Net Assets (billions) | | | $70.9 | |
Expense Ratio | | | 0.52% | |
Portfolio Turnover Rate | | | 13% | |
30-Day SEC Yield(a) | | | 1.18% | |
Number of Companies | | | 66 | |
Fund Inception | | | 1965 | |
No sales charges or distribution fees | | | | |
Investment Manager: Dodge & Cox, San Francisco. Managed by the U.S. Equity Investment Committee, whose eight members’ average tenure at Dodge & Cox is 24 years.
| | | | | | | | |
| PORTFOLIO CHARACTERISTICS | | Fund | | | S&P 500 | |
Median Market Capitalization (billions) | | | $52 | | | | $22 | |
Weighted Average Market Capitalization (billions) | | | $140 | | | | $197 | |
Price-to-Earnings Ratio(b) | | | 16.1x | | | | 20.0x | |
Foreign Securities not in the S&P 500(c) | | | 11.2% | | | | 0.0% | |
| | | | |
| TEN LARGEST HOLDINGS (%)(d) | | Fund | |
Charles Schwab Corp. | | | 3.9 | |
Capital One Financial Corp. | | | 3.8 | |
Wells Fargo & Co. | | | 3.7 | |
Bank of America Corp. | | | 3.7 | |
Comcast Corp. | | | 3.2 | |
Alphabet, Inc. | | | 3.0 | |
Microsoft Corp. | | | 2.9 | |
Charter Communications, Inc. | | | 2.7 | |
Novartis AG (Switzerland) | | | 2.6 | |
Goldman Sachs Group, Inc. | | | 2.5 | |
| | | | | | | | |
| SECTOR DIVERSIFICATION (%) | | Fund | | | S&P 500 | |
Financials | | | 28.1 | | | | 14.8 | |
Health Care | | | 22.4 | | | | 13.8 | |
Information Technology | | | 17.6 | | | | 23.8 | |
Consumer Discretionary | | | 14.5 | | | | 12.2 | |
Energy | | | 7.8 | | | | 6.1 | |
Industrials | | | 5.1 | | | | 10.2 | |
Telecommunication Services | | | 1.6 | | | | 2.1 | |
Materials | | | 1.0 | | | | 3.0 | |
Consumer Staples | | | 0.5 | | | | 8.2 | |
Utilities | | | 0.0 | | | | 2.9 | |
Real Estate | | | 0.0 | | | | 2.9 | |
| (a) | SEC Yield is an annualization of the Fund’s net investment income for the trailing 30-day period. Dividends paid by the Fund may be higher or lower than implied by the SEC Yield. |
| (b) | Price-to-earnings (P/E) ratios are calculated using 12-month forward earnings estimates from third-party sources. |
| (c) | Foreign securities are U.S. dollar denominated. |
| (d) | The Fund’s portfolio holdings are subject to change without notice. The mention of specific securities is not a recommendation to buy, sell, or hold any particular security and is not indicative of Dodge & Cox’s current or future trading activity. |
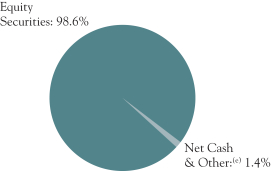
| (e) | Net Cash & Other includes cash, short-term investments, derivatives, receivables, and payables. |
PAGE 6 § DODGE & COX STOCK FUND
| | | | |
| PORTFOLIO OF INVESTMENTS | | | December 31, 2017 | |
| | | | | | | | |
| COMMON STOCKS: 98.6% | | | | | | |
| | |
| | | SHARES | | | VALUE | |
| CONSUMER DISCRETIONARY: 14.5% | | | | | |
AUTOMOBILES & COMPONENTS: 0.4% | | | | | |
Harley-Davidson, Inc. | | | 5,581,047 | | | $ | 283,963,671 | |
| |
CONSUMER DURABLES & APPAREL: 0.4% | | | | | |
Mattel, Inc. | | | 16,700,000 | | | | 256,846,000 | |
| | |
MEDIA: 10.9% | | | | | | | | |
Charter Communications, Inc., Class A(a) | | | 5,663,786 | | | | 1,902,805,544 | |
Comcast Corp., Class A | | | 56,755,794 | | | | 2,273,069,550 | |
DISH Network Corp., Class A(a) | | | 9,976,176 | | | | 476,362,404 | |
News Corp., Class A | | | 7,528,790 | | | | 122,041,686 | |
Time Warner, Inc. | | | 12,682,977 | | | | 1,160,111,906 | |
Twenty-First Century Fox, Inc., Class A | | | 42,310,126 | | | | 1,460,968,651 | |
Twenty-First Century Fox, Inc., Class B | | | 9,300,600 | | | | 317,336,472 | |
| | | | | | | | |
| | | | | | | 7,712,696,213 | |
RETAILING: 2.8% | | | | | | | | |
Liberty Interactive Corp. QVC Group, Series A(a) | | | 19,079,076 | | | | 465,911,036 | |
Target Corp. | | | 11,638,554 | | | | 759,415,649 | |
The Priceline Group, Inc.(a) | | | 453,000 | | | | 787,196,220 | |
| | | | | | | | |
| | | | | | | 2,012,522,905 | |
| | | | | | | | |
| | | | | | | 10,266,028,789 | |
| CONSUMER STAPLES: 0.5% | | | | | |
FOOD & STAPLES RETAILING: 0.5% | | | | | |
Wal-Mart Stores, Inc. | | | 3,553,616 | | | | 350,919,580 | |
| | |
| ENERGY: 7.8% | | | | | | | | |
Anadarko Petroleum Corp. | | | 27,357,621 | | | | 1,467,462,790 | |
Apache Corp. | | | 18,700,694 | | | | 789,543,301 | |
Baker Hughes, a GE Company | | | 21,431,013 | | | | 678,077,251 | |
Concho Resources, Inc.(a) | | | 3,680,500 | | | | 552,884,710 | |
National Oilwell Varco, Inc. | | | 18,698,800 | | | | 673,530,776 | |
Occidental Petroleum Corp. | | | 1,625,236 | | | | 119,714,884 | |
Schlumberger, Ltd.
(Curacao/United States) | | | 17,096,645 | | | | 1,152,142,907 | |
Weatherford International PLC(a) (Ireland) | | | 27,859,600 | | | | 116,174,532 | |
| | | | | | | | |
| | | | | | | 5,549,531,151 | |
| FINANCIALS: 28.1% | | | | | | | | |
BANKS: 10.8% | | | | | | | | |
Bank of America Corp. | | | 88,628,300 | | | | 2,616,307,416 | |
BB&T Corp. | | | 12,530,944 | | | | 623,038,536 | |
JPMorgan Chase & Co. | | | 16,609,700 | | | | 1,776,241,318 | |
Wells Fargo & Co. | | | 43,627,141 | | | | 2,646,858,644 | |
| | | | | | | | |
| | | | | | | 7,662,445,914 | |
DIVERSIFIED FINANCIALS: 14.6% | | | | | |
American Express Co. | | | 16,413,200 | | | | 1,629,994,892 | |
Bank of New York Mellon Corp. | | | 27,962,624 | | | | 1,506,066,929 | |
Capital One Financial Corp.(b) | | | 26,795,511 | | | | 2,668,296,985 | |
Charles Schwab Corp. | | | 53,843,000 | | | | 2,765,914,910 | |
Goldman Sachs Group, Inc. | | | 7,077,200 | | | | 1,802,987,472 | |
| | | | | | | | |
| | | | | | | 10,373,261,188 | |
INSURANCE: 2.7% | | | | | | | | |
AEGON NV (Netherlands) | | | 71,260,531 | | | | 448,941,345 | |
Brighthouse Financial, Inc.(a) | | | 2,099,363 | | | | 123,106,647 | |
MetLife, Inc. | | | 25,678,900 | | | | 1,298,325,184 | |
| | | | | | | | |
| | | | | | | 1,870,373,176 | |
| | | | | | | | |
| | | | | | | 19,906,080,278 | |
| | | | | | | | |
| | |
| | | SHARES | | | VALUE | |
| HEALTH CARE: 22.4% | | | | | | | | |
HEALTH CARE EQUIPMENT & SERVICES: 7.4% | | | | | |
Cigna Corp. | | | 6,351,117 | | | $ | 1,289,848,351 | |
Danaher Corp. | | | 3,419,500 | | | | 317,397,990 | |
Express Scripts Holding Co.(a) | | | 20,451,371 | | | | 1,526,490,331 | |
Medtronic PLC (Ireland) | | | 11,073,400 | | | | 894,177,050 | |
UnitedHealth Group, Inc. | | | 5,540,960 | | | | 1,221,560,042 | |
| | | | | | | | |
| | | | | | | 5,249,473,764 | |
PHARMACEUTICALS, BIOTECHNOLOGY & LIFE SCIENCES: 15.0% | |
Alnylam Pharmaceuticals, Inc.(a)(b) | | | 4,891,735 | | | | 621,494,932 | |
AstraZeneca PLC ADR (United Kingdom) | | | 37,271,973 | | | | 1,293,337,463 | |
Bristol-Myers Squibb Co. | | | 17,448,739 | | | | 1,069,258,726 | |
Eli Lilly and Co. | | | 12,061,000 | | | | 1,018,672,060 | |
Gilead Sciences, Inc. | | | 10,125,612 | | | | 725,398,844 | |
GlaxoSmithKline PLC ADR (United Kingdom) | | | 28,936,700 | | | | 1,026,384,749 | |
Merck & Co., Inc. | | | 8,026,900 | | | | 451,673,663 | |
Novartis AG ADR (Switzerland) | | | 21,730,200 | | | | 1,824,467,592 | |
Roche Holding AG ADR (Switzerland) | | | 27,827,699 | | | | 878,798,734 | |
Sanofi ADR (France) | | | 40,619,428 | | | | 1,746,635,404 | |
| | | | | | | | |
| | | | | | | 10,656,122,167 | |
| | | | | | | | |
| | | | | | | 15,905,595,931 | |
| INDUSTRIALS: 5.1% | | | | | | | | |
CAPITAL GOODS: 1.3% | | | | | | | | |
Johnson Controls International PLC (Ireland) | | | 24,914,817 | | | | 949,503,676 | |
| | |
TRANSPORTATION: 3.8% | | | | | | | | |
FedEx Corp. | | | 6,478,999 | | | | 1,616,769,410 | |
Union Pacific Corp. | | | 7,957,400 | | | | 1,067,087,340 | |
| | | | | | | | |
| | | | | | | 2,683,856,750 | |
| | | | | | | | |
| | | | | | | 3,633,360,426 | |
| INFORMATION TECHNOLOGY: 17.6% | | | | | |
SEMICONDUCTORS & SEMICONDUCTOR EQUIPMENT: 0.8% | |
Maxim Integrated Products, Inc. | | | 11,561,775 | | | | 604,449,597 | |
| | |
SOFTWARE & SERVICES: 7.9% | | | | | | | | |
Alphabet, Inc., Class A(a) | | | 117,500 | | | | 123,774,500 | |
Alphabet, Inc., Class C(a) | | | 1,900,153 | | | | 1,988,320,099 | |
Dell Technologies, Inc., Class V(a) | | | 8,122,510 | | | | 660,197,613 | |
Micro Focus International PLC ADR (United Kingdom) | | | 14,012,968 | | | | 470,695,595 | |
Microsoft Corp. | | | 23,841,000 | | | | 2,039,359,140 | |
Synopsys, Inc.(a) | | | 3,714,669 | | | | 316,638,386 | |
| | | | | | | | |
| | | | | | | 5,598,985,333 | |
TECHNOLOGY, HARDWARE & EQUIPMENT: 8.9% | |
Cisco Systems, Inc. | | | 37,072,711 | | | | 1,419,884,831 | |
Corning, Inc. | | | 9,779,800 | | | | 312,855,802 | |
Hewlett Packard Enterprise Co.(b) | | | 102,041,816 | | | | 1,465,320,478 | |
HP Inc. | | | 51,646,578 | | | | 1,085,094,604 | |
Juniper Networks, Inc.(b) | | | 22,833,165 | | | | 650,745,202 | |
NetApp, Inc.(b) | | | 7,420,231 | | | | 410,487,179 | |
TE Connectivity, Ltd. (Switzerland) | | | 9,863,775 | | | | 937,453,176 | |
| | | | | | | | |
| | | | | | | 6,281,841,272 | |
| | | | | | | | |
| | | | | | | 12,485,276,202 | |
| MATERIALS: 1.0% | | | | | | | | |
Celanese Corp., Series A(b) | | | 6,616,298 | | | | 708,473,190 | |
| | |
| See accompanying Notes to Financial Statements | | DODGE & COX STOCK FUND §PAGE 7 |
| | | | |
| PORTFOLIO OF INVESTMENTS | | | December 31, 2017 | |
| | | | | | | | |
| COMMON STOCKS (continued) | |
| | |
| | | SHARES | | | VALUE | |
|
| TELECOMMUNICATION SERVICES: 1.6% | |
Sprint Corp.(a) | | | 100,731,527 | | | $ | 593,308,694 | |
Zayo Group Holdings, Inc.(a)(b) | | | 14,027,500 | | | | 516,212,000 | |
| | | | | | | | |
| | | | | | | 1,109,520,694 | |
| | | | | | | | |
TOTAL COMMON STOCKS
(Cost $43,440,309,602) | | | $ | 69,914,786,241 | |
| |
| SHORT-TERM INVESTMENTS: 1.6% | | | | |
| | |
| | | SHARES/
PAR VALUE | | | VALUE | |
REPURCHASE AGREEMENT: 1.5% | |
Fixed Income Clearing Corporation(c)
0.80%, dated 12/29/17, due 1/2/18, maturity value $1,044,082,799 | | $ | 1,043,990,000 | | | $ | 1,043,990,000 | |
| | |
MONEY MARKET FUND: 0.1% | | | | | | | | |
State Street Institutional Treasury Plus Money Market Fund | | | 71,533,869 | | | | 71,533,869 | |
| | | | | | | | |
TOTAL SHORT-TERM INVESTMENTS
(Cost $1,115,523,869) | | | $ | 1,115,523,869 | |
| | | | | | | | |
TOTAL INVESTMENTS
(Cost $44,555,833,471) | | | 100.2 | % | | $ | 71,030,310,110 | |
OTHER ASSETS LESS LIABILITIES | | | (0.2 | %) | | | (129,383,457 | ) |
| | | | | | | | |
| NET ASSETS | | | 100.0 | % | | $ | 70,900,926,653 | |
| | | | | | | | |
| (b) | See Note 9 regarding holdings of 5% voting securities |
| (c) | Repurchase agreement is collateralized by U.S. Treasury Inflation Indexed 0.125%, 4/15/22. Total collateral value is $1,064,878,182. |
In determining a company’s country designation, the Fund generally references the country of incorporation. In cases where the Fund considers the country of incorporation to be a “jurisdiction of convenience” chosen primarily for tax purposes or in other limited circumstances, the Fund uses the country designation of an appropriate broad-based market index. In those cases, two countries are listed—the country of incorporation and the country designated by an appropriate index, respectively.
ADR: American Depositary Receipt
FUTURES CONTRACTS
| | | | | | | | | | | | | | | | |
| Description | | Number of
Contracts | | | Expiration
Date | | | Notional
Amount | | | Value /
Unrealized
Appreciation
(Depreciation) | |
E-mini S&P 500 Index—Long Position | | | 6,386 | | | | Mar 2018 | | | $ | 854,446,800 | | | $ | 11,322,953 | |
| | |
| PAGE 8 § DODGE & COX STOCK FUND | | See accompanying Notes to Financial Statements |
| | | | |
STATEMENT OF ASSETS AND LIABILITIES | |
| |
| | | December 31, 2017 | |
ASSETS: | | | | |
Investments in securities, at value | | | | |
Unaffiliated issuers (cost $41,384,767,733) | | $ | 65,729,735,445 | |
Affiliated issuers (cost $3,171,065,738) | | | 5,300,574,665 | |
| | | | |
| | | 71,030,310,110 | |
Deposits with broker for futures contracts | | | 28,737,020 | |
Receivable for variation margin for futures contracts | | | 3,234,491 | |
Receivable for investments sold | | | 56,087,071 | |
Receivable for Fund shares sold | | | 37,406,958 | |
Dividends and interest receivable | | | 75,643,652 | |
Prepaid expenses and other assets | | | 334,489 | |
| | | | |
| | | 71,231,753,791 | |
| | | | |
LIABILITIES: | | | | |
Payable for investments purchased | | | 25,578,217 | |
Payable for Fund shares redeemed | | | 273,598,644 | |
Management fees payable | | | 29,997,607 | |
Accrued expenses | | | 1,652,670 | |
| | | | |
| | | 330,827,138 | |
| | | | |
NET ASSETS | | $ | 70,900,926,653 | |
| | | | |
NET ASSETS CONSIST OF: | | | | |
Paid in capital | | $ | 43,739,617,866 | |
Undistributed net investment income | | | 7,788,890 | |
Undistributed net realized gain | | | 667,720,305 | |
Net unrealized appreciation | | | 26,485,799,592 | |
| | | | |
| | $ | 70,900,926,653 | |
| | | | |
Fund shares outstanding (par value $0.01 each, unlimited shares authorized) | | | 348,216,369 | |
Net asset value per share | | $ | 203.61 | |
|
STATEMENT OF OPERATIONS | |
| |
| | | Year Ended
December 31, 2017 | |
INVESTMENT INCOME: | | | | |
Dividends (net of foreign taxes of $25,462,776) | | | | |
Unaffiliated issuers | | $ | 1,292,737,298 | |
Affiliated issuers | | | 95,813,916 | |
Interest | | | 6,216,945 | |
| | | | |
| | | 1,394,768,159 | |
| | | | |
EXPENSES: | | | | |
Management fees | | | 331,821,270 | |
Custody and fund accounting fees | | | 806,022 | |
Transfer agent fees | | | 3,888,574 | |
Professional services | | | 166,041 | |
Shareholder reports | | | 1,265,608 | |
Registration fees | | | 347,496 | |
Trustees’ fees | | | 280,417 | |
ADR depositary services fees | | | 5,305,406 | |
Miscellaneous | | | 983,853 | |
| | | | |
| | | 344,864,687 | |
| | | | |
NET INVESTMENT INCOME | | | 1,049,903,472 | |
| | | | |
REALIZED AND UNREALIZED GAIN (LOSS): | | | | |
Net realized gain | | | | |
Investments in securities of unaffiliated issuers | | | 3,206,703,135 | |
Investments in securities of affiliated issuers | | | 159,000,889 | |
Futures contracts | | | 201,955,680 | |
Net change in unrealized appreciation/depreciation | | | | |
Investments in securities of unaffiliated issuers | | | 5,773,360,205 | |
Investments in securities of affiliated issuers | | | 815,081,037 | |
Futures contracts | | | 26,063,407 | |
| | | | |
Net realized and unrealized gain | | | 10,182,164,353 | |
| | | | |
NET CHANGE IN NET ASSETS
FROM OPERATIONS | | $ | 11,232,067,825 | |
| | | | |
| | | | | | | | |
STATEMENT OF CHANGES IN NET ASSETS | |
| | |
| | | Year Ended December 31, 2017 | | | Year Ended
December 31, 2016 | |
OPERATIONS: | | | | | | | | |
Net investment income | | $ | 1,049,903,472 | | | $ | 1,011,975,095 | |
Net realized gain | | | 3,567,659,704 | | |
| 2,967,136,896
|
|
Net change in unrealized appreciation/depreciation | | | 6,614,504,649 | | | | 7,026,623,876 | |
| | | | | | | | |
| | | 11,232,067,825 | | |
| 11,005,735,867
|
|
| | | | | | | | |
| | |
DISTRIBUTIONS TO SHAREHOLDERS FROM: | | | | | | | | |
Net investment income | | | (1,054,882,152 | ) | | | (1,006,582,969 | ) |
Net realized gain | | | (3,605,758,265 | ) | | | (2,967,981,956 | ) |
| | | | | | | | |
Total distributions | | | (4,660,640,417 | ) | | | (3,974,564,925 | ) |
| | | | | | | | |
| | |
FUND SHARE
TRANSACTIONS: | | | | | | | | |
Proceeds from sale of shares | | | 8,669,060,752 | | | | 7,078,053,220 | |
Reinvestment of distributions | | | 4,418,678,881 | | | | 3,757,250,793 | |
Cost of shares redeemed | | | (10,358,716,247 | ) | | | (11,111,123,603 | ) |
| | | | | | | | |
Net change from Fund share transactions | | | 2,729,023,386 | | | | (275,819,590 | ) |
| | | | | | | | |
Total change in net assets | | | 9,300,450,794 | | | | 6,755,351,352 | |
| | |
NET ASSETS: | | | | | | | | |
Beginning of year | | | 61,600,475,859 | | | | 54,845,124,507 | |
| | | | | | | | |
End of year (including undistributed net investment income of $7,788,890 and $7,382,075, respectively) | | $ | 70,900,926,653 | | | $ | 61,600,475,859 | |
| | | | | | | | |
| | |
SHARE INFORMATION: | | | | | | | | |
Shares sold | | | 44,674,938 | �� | | | 42,458,419 | |
Distributions reinvested | | | 22,297,192 | | | | 21,705,948 | |
Shares redeemed | | | (53,003,282 | ) | | | (66,866,904 | ) |
| | | | | | | | |
Net change in shares outstanding | | | 13,968,848 | | | | (2,702,537 | ) |
| | | | | | | | |
| | |
| See accompanying Notes to Financial Statements | | DODGE & COX STOCK FUND §PAGE 9 |
NOTES TO FINANCIAL STATEMENTS
NOTE 1—ORGANIZATION AND SIGNIFICANT ACCOUNTING POLICIES
Dodge & Cox Stock Fund (the “Fund”) is one of the series constituting the Dodge & Cox Funds (the “Trust” or the “Funds”). The Trust is organized as a Delaware statutory trust and is registered under the Investment Company Act of 1940, as amended, as an open-end management investment company. The Fund commenced operations on January 4, 1965, and seeks long-term growth of principal and income. Risk considerations and investment strategies of the Fund are discussed in the Fund’s Prospectus.
The financial statements have been prepared in conformity with accounting principles generally accepted in the United States of America, which require the use of estimates and assumptions by management. Actual results may differ from those estimates. Significant accounting policies are as follows:
Security valuation The Fund’s net assets are normally valued as of the scheduled close of trading on the New York Stock Exchange (NYSE), generally 4:00 p.m. Eastern Time, each day that the NYSE is open for business.
Portfolio holdings for which market quotes are readily available are valued at market value. Listed securities for example, are generally valued using the official quoted close price or the last sale on the exchange that is determined to be the primary market for the security. Exchange-traded derivatives are generally valued at the settlement price determined by the relevant exchange. Short-term securities less than 60 days to maturity may be valued at amortized cost if amortized cost approximates current value. Mutual funds are valued at their respective net asset values. Security values are not discounted based on the size of the Fund’s position and may differ from the value a Fund receives upon sale of the securities. All securities held by the Fund are denominated in U.S. dollars.
If market quotations are not readily available or if normal valuation procedures produce valuations that are deemed unreliable or inappropriate under the circumstances existing at the time, the investment will be valued at fair value as determined in good faith by or under the direction of the Fund’s Board of Trustees. The Board of Trustees has appointed Dodge & Cox, the Fund’s investment manager, to make fair value determinations in accordance with the Dodge & Cox Funds Valuation Policies (“Valuation Policies”), subject to Board oversight. Dodge & Cox has established a Pricing Committee that is comprised of representatives from Treasury, Legal, Compliance, and Operations. The Pricing Committee is responsible for implementing the Valuation Policies, including determining the fair value of securities and other investments when necessary. The Pricing Committee considers relevant indications of value that are reasonably available to it in determining the fair value assigned to a particular security, such as the value of similar financial instruments, trading volumes, contractual restrictions on disposition, related corporate actions, and changes in economic conditions. In doing so, the Pricing Committee employs various
methods for calibrating fair valuation approaches, including a regular review of key inputs and assumptions, back-testing, and review of any related market activity.
Valuing securities through a fair value determination involves greater reliance on judgment than valuation of securities based on readily available market quotations. In some instances, lack of information and uncertainty as to the significance of information may lead to a conclusion that a prior valuation is the best indication of a security’s value. When fair value pricing is employed, the prices of securities used by the Fund to calculate its net asset value may differ from quoted or published prices for the same securities.
Security transactions, investment income, expenses, and distributions Security transactions are recorded on the trade date. Realized gains and losses on securities sold are determined on the basis of identified cost.
Dividend income and corporate action transactions are recorded on the ex-dividend date, or when the Fund first learns of the dividend/corporate action if the ex-dividend date has passed. Non-cash dividends, if any, are recorded at the fair market value of the securities received. Dividends characterized as return of capital for U.S. tax purposes are recorded as a reduction of cost of investments and/or realized gain. Interest income is recorded on the accrual basis.
Expenses are recorded on the accrual basis. Some expenses of the Trust can be directly attributed to a specific series. Expenses which cannot be directly attributed are allocated among the Funds in the Trust using methodologies determined by the nature of the expense.
Distributions to shareholders are recorded on the ex-dividend date.
Repurchase agreements Repurchase agreements are transactions under which a Fund purchases a security from a dealer counterparty and agrees to resell the security to that counterparty on a specified future date at the same price, plus a specified interest rate. The Fund’s repurchase agreements are secured by U.S. government or agency securities. It is the Fund’s policy that its custodian take possession of the underlying collateral securities, the fair value of which exceeds the principal amount of the repurchase transaction, including accrued interest, at all times. In the event of default by the counterparty, the Fund has the contractual right to liquidate the collateral securities and to apply the proceeds in satisfaction of the obligation.
Foreign taxes The Fund may be subject to foreign taxes which may be imposed by certain countries in which the Fund invests. The Fund endeavors to record foreign taxes based on applicable foreign tax law. Withholding taxes are incurred on certain foreign dividends and are accrued at the time the associated dividend is recorded. The Fund files withholding tax reclaims in certain jurisdictions to recover a portion of amounts previously withheld. The Fund records a reclaim receivable based on, among other things, a jurisdiction’s legal obligation to pay reclaims as well as payment history and market convention. In consideration of recent decisions rendered by
PAGE 10 § DODGE & COX STOCK FUND
NOTES TO FINANCIAL STATEMENTS
European courts, the Fund has filed for additional reclaims related to prior years. A corresponding receivable is established when both the amount is known and significant contingencies or uncertainties regarding collectability are removed. These amounts, if any, are reported in “dividends and interest receivable” in the Statement of Assets and Liabilities.
Futures contracts Futures contracts involve an obligation to purchase or sell (depending on whether the Fund has entered a long or short futures contract, respectively) an asset at a future date, at a price set at the time of the contract. Upon entering into a futures contract, the Fund is required to deposit an amount of cash or liquid assets (referred to as initial margin) in a segregated account with the clearing broker. Subsequent payments (referred to as variation margin) to and from the clearing broker are made on a daily basis based on changes in the market value of futures contracts. Futures contracts are traded publicly and their market value changes daily. Changes in the market value of open futures contracts are recorded as unrealized appreciation or depreciation in the Statement of Operations. Realized gains and losses on futures contracts are recorded in the Statement of Operations at the closing or expiration of the contracts. Cash deposited with a broker as initial margin is recorded in the Statement of Assets and Liabilities. A receivable and/or payable to brokers for daily variation margin is also recorded in the Statement of Assets and Liabilities.
Investments in futures contracts may include certain risks, which may be different from, and potentially greater than, those of the underlying securities. To the extent the Fund uses futures, it is exposed to additional volatility and potential losses resulting from leverage.
The Fund has maintained long S&P 500 futures contracts to provide equity exposure that approximates the Fund’s “net cash and other” position, which includes cash, short-term investments, receivables, and payables. During the year ended December 31, 2017, these S&P 500 futures contracts had notional values ranging from 1% to 3% of net assets.
Indemnification Under the Trust’s organizational documents, its officers and trustees are indemnified against certain liabilities arising out of the performance of their duties to the Trust. In addition, in the normal course of business the Trust enters into contracts that provide general indemnities to other parties. The Trust’s maximum exposure under these arrangements is unknown as this would involve future claims that may be made against the Trust that have not yet occurred.
NOTE 2—VALUATION MEASUREMENTS
Various inputs are used in determining the value of the Fund’s investments. These inputs are summarized in the three broad levels listed below.
| § | | Level 1: Quoted prices in active markets for identical securities |
| § | | Level 2: Other significant observable inputs (including quoted prices for similar securities, market indices, interest rates, credit risk, forward exchange rates, etc.) |
| § | | Level 3: Significant unobservable inputs (including Fund management’s assumptions in determining the fair value of investments) |
The inputs or methodology used for valuing securities are not necessarily an indication of the risk associated with investing in those securities.
The following is a summary of the inputs used to value the Fund’s holdings at December 31, 2017:
| | | | | | | | |
| Classification(a) | | LEVEL 1
(Quoted Prices) | | | LEVEL 2
(Other Significant
Observable Inputs) | |
Securities | | | | | | | | |
Common Stocks(b) | | $ | 69,914,786,241 | | | $ | — | |
Short-term Investments | | | | | | | | |
Repurchase Agreement | | | — | | | | 1,043,990,000 | |
Money Market Fund | | | 71,533,869 | | | | — | |
| | | | | | | | |
Total Securities | | $ | 69,986,320,110 | | | $ | 1,043,990,000 | |
| | | | | | | | |
Other Investments | | | | | | | | |
Futures Contracts | | | | | | | | |
Appreciation | | $ | 11,322,953 | | | $ | — | |
| | | | | | | | | |
| (a) | There were no transfers between Level 1 and Level 2 during the year ended December 31, 2017. There were no Level 3 securities at December 31, 2017 and 2016, and there were no transfers to Level 3 during the year. |
| (b) | All common stocks held in the Fund are Level 1 securities. For a detailed break-out of common stocks by major industry classification, please refer to the Portfolio of Investments. |
NOTE 3—RELATED PARTY TRANSACTIONS
Management fees Under a written agreement approved by a unanimous vote of the Board of Trustees, the Fund pays a management fee monthly at an annual rate of 0.50% of the Fund’s average daily net assets to Dodge & Cox, investment manager of the Fund. The agreement further provides that Dodge & Cox shall waive its fee to the extent that such fee plus all other ordinary operating expenses of the Fund exceed 0.75% of the average daily net assets for the year.
Fund officers and trustees All officers and two of the trustees of the Trust are officers or employees of Dodge & Cox. The Trust pays a fee only to those trustees who are not affiliated with Dodge & Cox.
NOTE 4—INCOME TAX INFORMATION AND DISTRIBUTIONS TO SHAREHOLDERS
A provision for federal income taxes is not required since the Fund intends to continue to qualify as a regulated investment company under Subchapter M of the Internal Revenue Code and distribute all of its taxable income to shareholders. Distributions are determined in accordance with income tax regulations, and such amounts may differ from net investment income and realized gains for financial reporting purposes. Financial reporting records are adjusted for permanent book to tax differences at year end to reflect tax character.
Book to tax differences are primarily due to differing treatments of redemptions in-kind, wash sales, net short-term realized gain (loss), certain dividends, and derivatives. At December 31, 2017, the cost of
DODGE & COX STOCK FUND §PAGE 11
NOTES TO FINANCIAL STATEMENTS
investments in securities and derivatives for federal income tax purposes was $44,608,190,016.
Distributions during the years noted below were characterized as follows for federal income tax purposes:
| | | | | | | | |
| | | Year Ended December 31, 2017 | | | Year Ended
December 31, 2016 | |
Ordinary income | | $ | 1,232,159,263 | | | $ | 1,056,249,886 | |
| | | ($3.636 per share | ) | | ($ | 3.183 per share | ) |
Long-term capital gain | | $ | 3,428,481,154 | | | $ | 2,918,315,039 | |
| | | ($10.173 per share | ) | | ($ | 8.899 per share | ) |
At December 31, 2017, the tax basis components of distributable earnings were as follows:
| | | | |
Unrealized appreciation | | $ | 27,903,350,926 | |
Unrealized depreciation | | | (1,469,907,879 | ) |
| | | | |
Net unrealized appreciation | | | 26,433,443,047 | |
Undistributed ordinary income | | | 23,926,831 | |
Undistributed long-term capital gain | | | 703,938,909 | |
| | | | | |
Fund management has reviewed the tax positions for open periods (three years and four years, respectively, from filing the Fund’s Federal and State tax returns) as applicable to the Fund, and has determined that no provision for income tax is required in the Fund’s financial statements.
NOTE 5—REDEMPTIONS IN-KIND
During the year ended December 31, 2017, the Fund distributed securities and cash as payment for a redemption of Fund shares. For financial reporting purposes, the Fund realized a net gain of $184,889,371 attributable to the redemption in-kind: $163,481,605 from unaffiliated issuers and $21,407,766 from affiliated issuers. For tax purposes, no capital gain on the redemption in-kind was recognized.
NOTE 6—LOAN FACILITIES
Pursuant to an exemptive order issued by the Securities and Exchange Commission (SEC), the Fund may participate in an interfund lending facility (Facility). The Facility allows the Fund to borrow money from or loan money to the Funds. Loans under the Facility are made for temporary or emergency purposes, such as to fund shareholder redemption requests. Interest on borrowings is the average of the current repurchase agreement rate and the bank loan rate. There was no activity in the Facility during the year.
All Funds in the Trust participate in a $500 million committed credit facility (Line of Credit) with State Street Bank and Trust Company, to be utilized for temporary or emergency purposes to fund shareholder redemptions or for other short-term liquidity purposes. The maximum amount available to the Fund is $250 million. Each Fund pays an annual commitment fee on its pro-rata portion of the Line of Credit. For the year ended December 31, 2017, the Fund’s commitment fee amounted to
$421,447 and is reflected as a Miscellaneous Expense in the Statement of Operations. Interest on borrowings is charged at the prevailing rate. There were no borrowings on the Line of Credit during the year.
NOTE 7—PURCHASES AND SALES OF INVESTMENTS
For the year ended December 31, 2017, purchases and sales of securities, other than short-term securities, aggregated $9,140,669,841 and $8,602,292,192, respectively.
NOTE 8—SUBSEQUENT EVENTS
Fund management has determined that no material events or transactions occurred subsequent to December 31, 2017, and through the date of the Fund’s financial statements issuance, which require additional disclosure in the Fund’s financial statements.
PAGE 12 § DODGE & COX STOCK FUND
NOTES TO FINANCIAL STATEMENTS
NOTE 9—HOLDINGS OF 5% VOTING SECURITIES
Each of the companies listed below was considered to be an affiliate of the Fund because the Fund owned 5% or more of the company’s voting securities during all or part of the year ended December 31, 2017. Transactions during the year in these securities were as follows:
| | | | | | | | | | | | | | | | | | | | | | | | | | | | | | | | |
| | | Shares at
Beginning of Year | | | Additions | | | Reductions | | | Shares at
End of Year | | | Dividend Income(a) | | | Realized Gain (Loss) | | | Net Change
in Unrealized Appreciation/
Depreciation | | | Value at
End of Year | |
COMMON STOCKS: 7.5% | | | | | | | | | |
FINANCIALS: 3.8% | | | | | | | | | |
Capital One Financial Corp. | | | 27,167,711 | | | | — | | | | (372,200 | ) | | | 26,795,511 | | | $ | 43,255,458 | | | $ | 12,166,560 | | | $ | 318,643,321 | | | $ | 2,668,296,985 | |
| | |
HEALTH CARE: 0.0% | | | | | | | | | |
Alnylam Pharmaceuticals, Inc.(b) | | | 5,430,735 | | | | 70,000 | | | | (609,000 | ) | | | 4,891,735 | | | | — | | | | 38,416,787 | | | | 453,484,420 | | | | — | (c) |
| | |
INFORMATION TECHNOLOGY: 3.0% | | | | | | | | | |
Hewlett Packard Enterprise Co. | | | 93,402,495 | | | | 9,680,821 | | | | (1,041,500 | ) | | | 102,041,816 | | | | 27,209,629 | | | | 4,976,923 | | | | (337,740,886 | ) | | | 1,465,320,478 | |
Juniper Networks, Inc. | | | 3,169,247 | | | | 19,927,918 | | | | (264,000 | ) | | | 22,833,165 | | | | 5,211,988 | | | | 316,441 | | | | 31,399,386 | | | | 650,745,202 | |
NetApp, Inc. | | | 14,368,331 | | | | — | | | | (6,948,100 | ) | | | 7,420,231 | | | | 7,421,128 | | | | 52,082,940 | | | | 142,494,144 | | | | — | (c) |
| | | | | | | | | | | | | | | | | | | | | | | | | | | | | | | | |
| | | | | | | | | | | | | | | | | | | | | | | | | | | | | | | 2,116,065,680 | |
| | | | | | | | | | | | | | | | | | | | | | | | | | | | | | | | |
| | |
MATERIALS: 0.0% | | | | | | | | | |
Celanese Corp., Series A | | | 7,779,698 | | | | — | | | | (1,163,400 | ) | | | 6,616,298 | | | | 12,715,713 | | | | 50,758,496 | | | | 155,909,579 | | | | — | (c) |
| | |
TELECOMMUNICATION SERVICES: 0.7% | | | | | | | | | |
Zayo Group Holdings, Inc.(b) | | | 8,550,000 | | | | 5,551,900 | | | | (74,400 | ) | | | 14,027,500 | | | | — | | | | 282,742 | | | | 50,891,073 | | | | 516,212,000 | |
| | | | | | | | | | | | | | | | | | | | | | | | | | | | | | | | |
| | | | | | | | | | | | | | | | | | $ | 95,813,916 | | | $ | 159,000,889 | | | $ | 815,081,037 | | | $ | 5,300,574,665 | |
| | | | | | | | | | | | | | | | | | | | | | | | | | | | | | | | |
| | | | | | | | | | | | | | | | | | | | | | | | | | | | | | | | | |
| (a) | Net of foreign taxes, if any |
| (c) | Company was not an affiliate at year end |
FINANCIAL HIGHLIGHTS
| | | | | | | | | | | | | | | | | | | | |
SELECTED DATA AND RATIOS (for a share outstanding throughout each year) | | Year Ended December 31, | |
| | | 2017 | | | 2016 | | | 2015 | | | 2014 | | | 2013 | |
| | | | |
Net asset value, beginning of year | | | $184.30 | | | | $162.77 | | | | $180.94 | | | | $168.87 | | | | $121.90 | |
Income from investment operations: | | | | | | | | | | | | | | | | | | | | |
Net investment income | | | 3.09 | | | | 3.05 | | | | 2.42 | | | | 2.83 | | | | 2.11 | |
Net realized and unrealized gain (loss) | | | 30.03 | | | | 30.56 | | | | (10.55 | ) | | | 14.60 | | | | 46.97 | |
| | | | |
Total from investment operations | | | 33.12 | | | | 33.61 | | | | (8.13 | ) | | | 17.43 | | | | 49.08 | |
| | | | |
Distributions to shareholders from: | | | | | | | | | | | | | | | | | | | | |
Net investment income | | | (3.11 | ) | | | (3.03 | ) | | | (2.46 | ) | | | (2.80 | ) | | | (2.11 | ) |
Net realized gain | | | (10.70 | ) | | | (9.05 | ) | | | (7.58 | ) | | | (2.56 | ) | | | — | |
| | | | |
Total distributions | | | (13.81 | ) | | | (12.08 | ) | | | (10.04 | ) | | | (5.36 | ) | | | (2.11 | ) |
| | | | |
Net asset value, end of year | | | $203.61 | | | | $184.30 | | | | $162.77 | | | | $180.94 | | | | $168.87 | |
| | | | |
Total return | | | 18.32 | % | | | 21.27 | % | | | (4.47 | )% | | | 10.43 | % | | | 40.55 | % |
Ratios/supplemental data: | | | | | | | | | | | | | | | | | | | | |
Net assets, end of year (millions) | | | $70,901 | | | | $61,600 | | | | $54,845 | | | | $60,260 | | | | $54,848 | |
Ratios of expenses to average net assets | | | 0.52 | % | | | 0.52 | % | | | 0.52 | % | | | 0.52 | % | | | 0.52 | % |
Ratios of net investment income to average net assets | | | 1.58 | % | | | 1.83 | % | | | 1.36 | % | | | 1.62 | % | | | 1.45 | % |
Portfolio turnover rate | | | 13 | % | | | 16 | % | | | 15 | % | | | 17 | % | | | 15 | % |
See accompanying Notes to Financial Statements
DODGE & COX STOCK FUND §PAGE 13
REPORT OF INDEPENDENT REGISTERED PUBLIC ACCOUNTING FIRM
To the Board of Trustees of the Dodge & Cox Funds and Shareholders of Dodge & Cox Stock Fund
Opinion on the Financial Statements
We have audited the accompanying statement of assets and liabilities, including the portfolio of investments, of Dodge & Cox Stock Fund (one of the funds constituting Dodge & Cox Funds, referred to hereafter as the “Fund”) as of December 31, 2017, the related statement of operations for the year ended December 31, 2017, the statement of changes in net assets for each of the two years in the period ended December 31, 2017, including the related notes, and the financial highlights for each of the five years in the period ended December 31, 2017 (collectively referred to as the “financial statements”). In our opinion, the financial statements present fairly, in all material respects, the financial position of the Fund as of December 31, 2017, the results of its operations for the year then ended, the changes in its net assets for each of the two years in the period ended December 31, 2017 and the financial highlights for each of the five years in the period ended December 31, 2017 in conformity with accounting principles generally accepted in the United States of America.
Basis for Opinion
These financial statements are the responsibility of the Fund’s management. Our responsibility is to express an opinion on the Fund’s financial statements based on our audits. We are a public accounting firm registered with the Public Company Accounting Oversight Board (United States) (“PCAOB”) and are required to be independent with respect to the Fund in accordance with the U.S. federal securities laws and the applicable rules and regulations of the Securities and Exchange Commission and the PCAOB.
We conducted our audits of these financial statements in accordance with the standards of the PCAOB. Those standards require that we plan and perform the audit to obtain reasonable assurance about whether the financial statements are free of material misstatement, whether due to error or fraud.
Our audits included performing procedures to assess the risks of material misstatement of the financial statements, whether due to error or fraud, and performing procedures that respond to those risks. Such procedures included examining, on a test basis, evidence regarding the amounts and disclosures in the financial statements. Our audits also included evaluating the accounting principles used and significant estimates made by management, as well as evaluating the overall presentation of the financial statements. Our procedures included confirmation of securities owned as of December 31, 2017 by correspondence with the custodian, transfer agent and brokers; when replies were not received from brokers, we performed other auditing procedures. We believe that our audits provide a reasonable basis for our opinion.
PricewaterhouseCoopers LLP
San Francisco, California
February 16, 2018
We have served as the auditor of one or more investment companies in the Dodge & Cox Funds since 1931.
PAGE 14 § DODGE & COX STOCK FUND
SPECIAL 2017 TAX INFORMATION
(unaudited)
The following information is provided pursuant to provisions of the Internal Revenue Code:
The Fund designates up to a maximum amount of $1,421,082,251 of its distributions paid to shareholders in 2017 as qualified dividends (treated for federal income tax purposes in the hands of shareholders as taxable at a maximum rate of 20%).
For shareholders that are corporations, the Fund designates 90% of its ordinary dividends paid to shareholders in 2017 as dividends from domestic corporations eligible for the corporate dividends received deduction, provided that the shareholder otherwise satisfies applicable requirements to claim that deduction.
BOARD APPROVAL OF FUNDS’ INVESTMENT MANAGEMENT AGREEMENTS AND MANAGEMENT FEES
(unaudited)
The Board of Trustees is responsible for overseeing the performance of the Dodge & Cox Funds’ investment manager and determining whether to continue the Investment Management Agreements between the Funds and Dodge & Cox each year (the “Agreements”). At a meeting of the Board of Trustees of the Trust held on December 14, 2017, the Trustees, by a unanimous vote (including a separate vote of those Trustees who are not “interested persons” (as defined in the Investment Company Act of 1940) (the “Independent Trustees”)), approved the renewal of the Agreements for an additional one-year term through December 31, 2018 with respect to each Fund. During the course of the year, the Board received extensive information and materials relating to the investment management and administrative services provided by Dodge & Cox and the performance of each of the Funds.
INFORMATION RECEIVED
In 2016 and 2017, the Board requested, received, and discussed a number of special presentations on topics relevant to their consideration of the proposed renewal of the Funds’ Agreements. In addition to the foregoing and in advance of the meetings referred to below, the Board, including the Independent Trustees, requested, received, and reviewed materials relating to the Agreements and the services provided by Dodge & Cox. The Independent Trustees retained Morningstar to prepare an independent expense and performance summary for each Fund and comparable funds managed by other advisers identified by Morningstar. The Morningstar materials included information regarding advisory fee rates, expense ratios, and transfer agency, custodial, and distribution expenses, as well as performance comparisons to each Fund’s peer group and to a broad-based securities index or combination of indices. The Morningstar materials also included a comparison of expenses of various share classes offered by comparable funds. The materials reviewed by the Board contained information concerning, among other things, Dodge & Cox’s profitability, financial results and condition, advisory fee revenue, and separate account fee schedules. The Board additionally considered the Funds’ brokerage commissions,
turnover rates, sales and redemption data, and the significant investment that Dodge & Cox makes in research used in managing the Funds. The Board received and reviewed memoranda and related materials addressing, among other things, Dodge & Cox’s services to the Funds; how Dodge & Cox Funds’ fees compare to fees of peer group funds; the different fees, services, costs, and risks associated with other accounts managed by Dodge & Cox as compared to the Dodge & Cox Funds; and the ways in which the Funds realize economies of scale. Throughout the process of reviewing the services provided by Dodge & Cox and preparing for the meeting, the Independent Trustees found Dodge & Cox to be open, forthright, detailed, and very helpful in answering questions about all issues. The Board received copies of the Agreements and a memorandum from the independent legal counsel to the Independent Trustees discussing the factors generally regarded as appropriate to consider in evaluating advisory arrangements. The Trust’s Contract Review Committee, consisting solely of Independent Trustees, met with the independent legal counsel on November 9, 2017 and again on December 14, 2017 to discuss whether to renew the Agreements. The Board, including the Independent Trustees, subsequently concluded that the existing Agreements are fair and reasonable and voted to approve the Agreements. In considering the Agreements, the Board, including the Independent Trustees, did not identify any single factor or particular information as all-important or controlling. In reaching the decision to approve the Agreements, the Board considered several factors, discussed below, to be key factors and reached the conclusions described below.
NATURE, QUALITY, AND EXTENT OF THE SERVICES
The Board considered that Dodge & Cox provides a wide range of services to the Funds in addition to portfolio management. The extensive nature of services provided by Dodge & Cox has been documented in materials provided to the Board and in presentations made to the Board throughout the year. In particular, the Board considered the nature, quality, and extent of portfolio management, administrative, and shareholder services performed by Dodge & Cox. With regard to portfolio management services, the Board considered Dodge & Cox’s established long-term history of care and conscientiousness in the management of the Funds; its demonstrated consistency in investment approach and depth; the background and experience of the Dodge & Cox U.S. Equity Investment Committee, International Equity Investment Committee, Global Equity Investment Committee, U.S. Fixed Income Investment Committee, and Global Fixed Income Investment Committee, and research analysts responsible for managing the Funds; Dodge & Cox’s methods for assessing the regulatory and investment climate in various jurisdictions; its overall high level of attention to its core investment management function; and its commitment to the Funds and their shareholders. The Board also considered analysis provided by Morningstar regarding the degree of active management in the Dodge & Cox equity funds and concluded that Dodge & Cox is an active, high conviction manager of equity portfolios, not a “closet index” manager.
DODGE & COX STOCK FUND §PAGE 15
In the area of administrative and shareholder services, the Board considered the quality of Dodge & Cox’s work in areas such as compliance, legal services, trading, operations, proxy voting, technology, oversight of the Funds’ transfer agent and custodian/fund accounting agent, tax compliance, risk management, shareholder support, and shareholder communication through its website and other means. The Board also noted Dodge & Cox’s disclosure policy, its compliance record, and its reputation as a trusted, shareholder-friendly mutual fund family.
In addition, the Board considered that Dodge & Cox manages approximately $200 billion in Fund assets with fewer professionals than most comparable funds, and that on average these professionals have more experience and longer tenure than investment professionals at comparable funds. The Board also noted that Dodge & Cox is an investment research-oriented firm with no other business endeavors to distract management’s attention from its research efforts or to present material conflicts of interest with the operations of the Funds, that its investment professionals adhere to a consistent investment approach across the Funds, and that due to its careful and deliberate strategy with respect to new products, Dodge & Cox has had remarkable stability in its mutual fund product offerings over the course of the past 87 years and has the fewest funds of any of the 25 largest mutual fund families by assets. The Board further considered the “Gold” analyst rating awarded by Morningstar to all of the Funds (other than the Global Bond Fund). The Board concluded that it was satisfied with the nature, extent, and quality of investment management and other services provided to the Funds by Dodge & Cox.
INVESTMENT PERFORMANCE
The Board considered short-term and long-term investment performance for each Fund (including periods of outperformance or underperformance) as compared to both relevant indices and the performance of such Fund’s peer group. In assessing the performance of the Funds, the Board considered the Funds’ investment returns over various periods and the volatility thereof and concluded that the levels experienced were consistent with Dodge & Cox’s long-term approach and active investment style. The Board determined after extensive review and inquiry that Dodge & Cox’s historic, long-term, team-oriented, bottom-up investment approach remains consistent and that Dodge & Cox continues to be distinguished by its integrity, transparency, and independence. The Board considered that the performance of the Funds is the result of a value-oriented investment management process that emphasizes a long-term investment horizon, comprehensive independent research, a team approach, price discipline, low cost, and low portfolio turnover. The Board also considered that the investment performance delivered by Dodge & Cox to the Funds appeared to be consistent with the relevant performance delivered for other clients of Dodge & Cox. The Board concluded that Dodge & Cox has delivered favorable long-term performance for Fund investors consistent with the long-term investment strategies being pursued by the Funds.
COSTS AND ANCILLARY BENEFITS
Costs of Services to Funds: Fees and Expenses. The Board considered each Fund’s management fee rate and expense ratio relative to each Fund’s peer group and relative to management fees charged by Dodge & Cox to other clients. In particular, the Board considered that the Funds continue to be below their peer group median in expense ratios and that many media and industry reports specifically comment on the low cost of the Funds, which have been a defining characteristic of the Funds for many years. The Board also evaluated the operating structures of the Funds and Dodge & Cox, noting that the Funds do not charge front-end sales commissions or distribution fees, and Dodge & Cox bears, among other things, the significant cost of third party research, reimbursement for shareholder recordkeeping and administrative costs to third-party retirement plan administrators, and administrative and office overhead. The Board noted that expenses are well below industry averages.
When compared to peer group funds, the Funds are in the quartile with the lowest expense ratios. The Board also considered that the Funds receive numerous administrative, regulatory compliance, legal, operational, technology, tax compliance, risk management, and shareholder support services from Dodge & Cox without any additional administrative fee and that the Funds have relatively low transaction costs and portfolio turnover rates. The Board noted the Funds’ unusual single-share-class structure and reviewed Morningstar data (including asset-weighted average expense ratios) showing that the few peer group funds with lower expense ratios often have other share classes with significantly higher expense ratios than the Funds’. In this regard, the Board considered that many of the Funds’ shareholders would not be eligible to purchase comparably priced shares of many peer group funds, which typically make their lower-priced share classes available only to institutional investors. The Board determined that the Funds provide access for small investors to high quality investment management at a relatively low cost. The Board also considered that the Funds are priced to scale, i.e., management fee rates begin at relatively low levels with the result that, even without breakpoints, the Funds’ management fee rates are lower than those of many peer funds whose fee schedules include breakpoints. With respect to non-U.S. funds sponsored and managed by Dodge & Cox that are comparable to the Funds in many respects, the Board noted that the fee rates charged by Dodge & Cox are the same as or higher than the fee rates charged to the Funds.
The Board reviewed information regarding the fee rates Dodge & Cox charges to separate accounts that have investment programs similar to those of the Funds, including instances where separate account fees are lower than Fund fees. The Board considered the significant differences in the nature and scope of services Dodge & Cox provides to the Funds as compared to other client accounts, as well as material differences in regulatory, litigation, and other risks as between Dodge & Cox Funds and other types of clients. The Board noted that different markets exist for mutual fund and institutional separate account management services and that a comparison of Fund fee rates and separate
PAGE 16 § DODGE & COX STOCK FUND
account fee rates must consider the fact that separate account clients bear additional costs and responsibilities that are included in the cost of a Fund. The Board further noted that many sophisticated institutional investors in the Funds that are eligible to open separate accounts at Dodge & Cox have decided for various reasons to invest in the Funds. After consideration of these matters, the Board concluded that the overall costs incurred by the Funds for the services they receive (including the management fee paid to Dodge & Cox) are reasonable and that the fees are acceptable based upon the qualifications, experience, reputation, and performance of Dodge & Cox and the low overall expense ratios of the Funds.
Profitability and Costs of Services to Dodge & Cox; “Fall-out” Benefits. The Board reviewed reports of Dodge & Cox’s financial position, profitability, and estimated overall value and considered Dodge & Cox’s overall profitability within its context as a private, employee-owned S-Corporation and relative to the favorable services provided. The Board noted in particular that Dodge & Cox’s profits are not generated by high fee rates, but reflect an extraordinarily streamlined, efficient, and focused business approach toward investment management.
The Board recognized the importance of Dodge & Cox’s profitability—which is derived solely from management fees and does not include other business ventures—to maintain its independence, stability, company culture and ethics, and management continuity. The Board also considered that the compensation/profit structure at Dodge & Cox includes a return on shareholder employees’ investment in the firm, which is vital for remaining independent and facilitating retention of management and investment professionals. The Board also considered that in January 2015, Dodge & Cox closed the International Stock Fund to new investors to proactively manage the growth of the Fund. The Stock Fund and Balanced Fund were similarly closed to new investors during periods of significant growth in the past. While these actions are intended to benefit existing Fund shareholders, the effect is to reduce potential revenues to Dodge & Cox from new shareholders.
The Board also considered potential “fall-out” benefits (including the receipt of research from unaffiliated brokers and reputational benefits to non-U.S. funds sponsored and managed by Dodge & Cox) that Dodge & Cox might receive as a result of its association with the Funds and determined that they are acceptable. The Board also noted that Dodge & Cox continues to invest substantial sums in its business in order to provide enhanced services, systems, and research capabilities, all of which benefit the Funds. The Board concluded that Dodge & Cox’s profitability is the keystone of its independence, stability, and long-term investment performance and that the profitability of Dodge & Cox’s relationship with the Funds (including fall-out benefits) is fair and reasonable.
ECONOMIES OF SCALE
The Board considered whether there have been economies of scale with respect to the management of each Fund, whether the Funds have appropriately benefited from any economies of scale, and
whether the management fee rate is reasonable in relation to the level of Fund assets and any economies of scale that may exist. In the Board’s view, any consideration of economies of scale must take account of the Funds’ low fee and expense structure and of the fact that each Fund’s shareholders have benefited from the Fund’s relatively low fee structure from the time of each Fund’s inception (i.e., from the first dollar). An assessment of economies of scale must also take into account that Dodge & Cox invests significant time and resources in each new Fund for months (and sometimes years) prior to launch; in addition, in a Fund’s early periods of operations, expenses are capped, which means that Dodge & Cox subsidizes the operations of a new Fund for a period of time until it reaches scale. The Board also observed that, while total Fund assets have grown significantly over the long term, this growth has not been continuous or evenly distributed across all of the Funds (for example, the total assets of the Balanced Fund have actually declined over the past ten years).
In addition, the Board noted that Dodge & Cox has shared the benefits of economies of scale with the Funds by adding and enhancing services to the Funds over time, and that Dodge & Cox’s internal costs of providing investment management, technology, administrative, legal, and compliance services to the Funds continue to increase. For example, Dodge & Cox has increased its global research staff and investment resources over the years to add important new capabilities for the benefit of Fund shareholders and to address the increased complexity of investing in multinational and non-U.S. companies. In addition, Dodge & Cox has made substantial expenditures in other staff, technology, and infrastructure to enable it to integrate credit and equity analyses and to implement its strategy in a more effective and secure manner. Over the last ten years, Dodge & Cox has increased its spending on research, investment management, client servicing, cybersecurity, technology, third party research, data services, and computer systems for trading, operations, compliance, accounting, and communications at a rate that has significantly outpaced the Funds’ growth rate during the same period. The Board considered that Dodge & Cox has a history of voluntarily limiting asset growth in several Funds that experienced significant inflows by closing them to new investors in order to protect the Funds’ ability to achieve good investment returns for shareholders. The Board also observed that, even without fee breakpoints, the Funds are competitively priced in a very competitive market and that having a low fee from inception is better for shareholders than starting with a higher fee and adding breakpoints. The Board also noted that there are certain diseconomies of scale associated with managing large funds, insofar as certain of the costs and risks associated with portfolio management increase as assets grow. The Board concluded that the current Dodge & Cox fee structure is fair and reasonable and adequately shares economies of scale that may exist.
DODGE & COX STOCK FUND §PAGE 17
CONCLUSION
Based on their evaluation of all material factors and assisted by the advice of independent legal counsel to the Independent Trustees, the Board, including the Independent Trustees, concluded that the advisory fee structure was fair and reasonable, that each Fund was paying a competitive fee for the services provided, that Dodge & Cox’s services have provided value for Fund shareholders over the long term, and that approval of the Agreements was in the best interests of each Fund and its shareholders.
FUND HOLDINGS
The Fund provides a complete list of its holdings four times each fiscal year, as of the end of each quarter. The Fund files the lists with the Securities and Exchange Commission (SEC) on Form N-CSR (second and fourth quarters) and Form N-Q (first and third quarters). Shareholders may view the Fund’s Forms N-CSR and N-Q on the SEC’s website at sec.gov. Forms N-CSR and N-Q may also be reviewed and copied at the SEC’s Public Reference Room in Washington, DC. Information regarding the operations of the Public Reference Room may be obtained by calling 800-SEC-0330. A list of the Fund’s quarter-end holdings is also available at dodgeandcox.com on or about 15 days following each quarter end and remains available on the website until the list is updated in the subsequent quarter.
PROXY VOTING
For a free copy of the Fund’s proxy voting policies and procedures, please call 800-621-3979, visit the Fund’s website at dodgeandcox.com, or visit the SEC’s website at sec.gov. Information regarding how the Fund voted proxies relating to portfolio securities during the most recent 12-month period ending June 30 is also available at dodgeandcox.com or at sec.gov.
HOUSEHOLD MAILINGS
The Fund routinely mails shareholder reports and summary prospectuses to shareholders and, on occasion, proxy statements. In order to reduce the volume of mail, when possible, only one copy of these documents will be sent to shareholders who are part of the same family and share the same residential address.
If you have a direct account with the Funds and you do not want the mailing of shareholder reports and summary prospectuses combined with other members in your household, contact the Funds at 800-621-3979. Your request will be implemented within 30 days.
PAGE 18 § DODGE & COX STOCK FUND
DODGE & COX FUNDS—EXECUTIVE OFFICER & TRUSTEE INFORMATION
| | | | | | |
Name (Age) and
Address* | | Position with Trust (Year of Election or
Appointment) | | Principal Occupation During Past 5 Years | | Other Directorships Held by Trustees |
| INTERESTED TRUSTEES AND EXECUTIVE OFFICERS |
| Charles F. Pohl (59) | | Chairman and Trustee (Since 2014) | | Chairman (since 2013) and Director of Dodge & Cox; Chief Investment Officer, member of U.S. Equity Investment Committee (USEIC), Global Equity Investment Committee (GEIC), International Equity Investment Committee (IEIC), and U.S. Fixed Income Investment Committee (USFIIC), Portfolio Manager, and Investment Analyst; Co-President (2011-2013) | | — |
| Dana M. Emery (56) | | President and Trustee (Trustee since 1993) (President since 2014) | | Chief Executive Officer (since 2013), President, and Director of Dodge & Cox; Director of Fixed Income and member of USFIIC and Global Fixed Income Investment Committee (GFIIC); Co-President (2011-2013) | | — |
| Diana S. Strandberg (58) | | Senior Vice President (Since 2006) | | Senior Vice President and Director of Dodge & Cox; Director of International Equity and member of USEIC, GEIC, IEIC, and GFIIC; Portfolio Manager and Investment Analyst | | — |
Roberta R.W. Kameda (57) | | Secretary (Since 2017) | | Vice President, General Counsel, and Secretary (since 2017) of Dodge & Cox | | — |
| David H. Longhurst (60) | | Treasurer (Since 2006) | | Vice President and Assistant Treasurer of Dodge & Cox | | — |
| Katherine M. Primas (43) | | Chief Compliance Officer (Since 2010) | | Vice President and Chief Compliance Officer of Dodge & Cox | | — |
| INDEPENDENT TRUSTEES |
Caroline M. Hoxby (51) | | Trustee (Since 2017) | | Professor of Economics, Stanford University; Director of the Economics of Education Program, National Bureau of Economic Research; Senior Fellow, Hoover Institution and Stanford Institute for Economic Policy Research | | — |
Thomas A. Larsen (68) | | Trustee (Since 2002) | | Senior Counsel of Arnold & Porter (law firm) (since 2013); Partner of Arnold & Porter (until 2012); Director of Howard, Rice, Nemerovski, Canady, Falk & Rabkin (1977-2011) | | — |
| Ann Mather (57) | | Trustee (Since 2011) | | CFO, Pixar Animation Studios (1999-2004) | | Director, Alphabet Inc. (internet information services) (since 2005); Director, Glu Mobile, Inc. (multimedia software) (since 2004); Director, Netflix, Inc. (internet television) (since 2010); Director, Arista Networks (cloud networking) (since 2013); Director, Shutterfly, Inc. (internet photography services/publishing) (since 2013) |
| Robert B. Morris III (65) | | Trustee (Since 2011) | | Advisory Director, The Presidio Group (2005-2016); Partner and Managing Director—Global Investment Research at Goldman Sachs (until 2001) | | — |
| Gary Roughead (66) | | Trustee (Since 2013) | | Robert and Marion Oster Distinguished Military Fellow, Hoover Institution (since 2012); Admiral, United States Navy (Ret.); U.S. Navy Chief of Naval Operations (2008-2011) | | Director, Northrop Grumman Corp. (global security) (since 2012); Director, Maersk Line, Limited (shipping and transportation) (since 2016) |
| Mark E. Smith (66) | | Trustee (Since 2014) | | Executive Vice President, Managing Director—Fixed Income at Loomis Sayles & Company, L.P. (2003-2011) | | — |
| John B. Taylor (71) | | Trustee (Since 2005) (and 1995-2001) | | Professor of Economics, Stanford University (since 1984); Senior Fellow, Hoover Institution (since 1996); Under Secretary for International Affairs, United States Treasury (2001-2005) | | — |
| * | | The address for each Officer and Trustee is 555 California Street, 40th Floor, San Francisco, California 94104. Each Officer and Trustee oversees all six series in the Dodge & Cox Funds complex and serves for an indefinite term. |
Additional information about the Trust’s Trustees and Officers is available in the Trust’s Statement of Additional Information (SAI). You can get a free copy of the SAI by visiting the Funds’ website at dodgeandcox.com or calling
800-621-3979.
DODGE & COX STOCK FUND §PAGE 19
dodgeandcox.com
For Fund literature, transactions, and account
information, please visit the Funds’ website.
or write or call:
DODGE & COX FUNDS
c/o DST Asset Manager Solutions, Inc.
P.O. Box 8422
Boston, Massachusetts 02266-8422
(800) 621-3979
INVESTMENT MANAGER
Dodge & Cox
555 California Street, 40th Floor
San Francisco, California 94104
(415) 981-1710
This report is submitted for the general information of the shareholders of the Fund. The report is not authorized for distribution to prospective investors in the Fund unless it is accompanied by a current prospectus.
This report reflects our views, opinions, and portfolio holdings as of December 31, 2017, the end of the reporting period. Any such views are subject to change at any time based upon market or other conditions and Dodge & Cox disclaims any responsibility to update such views. These views may not be relied on as investment advice and, because investment decisions for a Dodge & Cox Fund are based on numerous factors, may not be relied on as an indication of trading intent on behalf of any Dodge & Cox Fund.
DODGE & COX FUNDS®
Annual Report
December 31, 2017
Global Stock Fund
ESTABLISHED 2008
TICKER: DODWX
12/17 GSF AR Printed on recycled paper
TO OUR SHAREHOLDERS
The Dodge & Cox Global Stock Fund had a total return of 21.5% for the year ended December 31, 2017, compared to a return of 22.4% for the MSCI World Index.
MARKET COMMENTARY
Global equity markets continued to rise during the fourth quarter and had exceptionally strong performance in 2017. For the year, the MSCI Emerging Markets Index was up 37% and the MSCI EAFE Index increased 25%. The S&P 500 Index reached an all-time high in mid-December and ended 2017 up nearly 22%.
Over the past decade, U.S. equity markets largely outperformed international markets because of higher U.S. corporate earnings growth and valuation expansion. In addition, headwinds from a strong U.S. dollar reduced international returns as measured in U.S. dollars. This trend reversed during 2017 as international equities outperformed U.S. markets. International equities benefited recently from increased earnings growth and a weaker U.S. dollar.
During 2017, U.S. growth stocks (the higher valuation portion of the equity market) outperformed value stocks (the lower valuation portion) by 17 percentage points overall.(a) Companies in sectors and industries associated with technology (e.g., Information Technology, Internet Retail, Media) led the market. The “FAANG” growth stocks—Facebook, Amazon, Apple, Netflix, and Google—were particularly strong, accounting for 20% of the S&P 500’s total return. The outperformance of these growth stocks had a negative impact on the Fund’s relative results.
INVESTMENT STRATEGY: FINDING OPPORTUNITIES IN HEALTH CARE AND ENERGY
At Dodge & Cox, our strong price discipline is an essential component of our investment strategy. Investment returns hinge on the purchase price: a good company is not always a good investment if the starting valuation is too high. We seek to invest in companies with valuations that do not fully reflect prospects for the company and where our analysis suggests the possibility of more positive developments. We constantly weigh valuation against company fundamentals and re-evaluate our thinking as prices change.
In response to diverging valuations, we made a number of gradual portfolio adjustments during 2017. We trimmed selected Information Technology, Media, and Financials holdings that had performed well. The Fund’s largest sale was DXC Technology, the company formed through the merger of Hewlett Packard Enterprise’s services division and Computer Sciences Corporation. As a result of the Fund’s investment in Hewlett Packard Enterprise, the Fund received DXC shares in April 2017, and the stock performed strongly. While the CEO has an impressive track record of shareholder value creation, management’s three-year plan embedded high expectations for margin expansion and earnings growth. We questioned whether these targets, even if achieved, would be sustainable over the long term. These concerns, combined with DXC’s higher valuation, led us to sell the stock (up 27% over the holding period). We reinvested most of the proceeds into the Health Care and Energy sectors, where we found more attractive valuations.
Health Care
Pharmaceutical companies, which comprise the majority of the investable Health Care sector, are an attractive area of the global market at 16 times forward earnings.(b) Many of these companies are stable businesses with strong balance sheets and growth potential from both new discoveries and expansion into emerging markets. In comparison, Consumer Staples, a large underweight for the Fund, shares some similar characteristics yet trades at 20 times forward earnings.
The Pharmaceuticals industry does face some challenges. For many companies, the United States is the largest market by revenue and earnings. As a result of industry consolidation and higher market shares, pharmacy benefit managers continue to exert increased pricing pressure on drug manufacturers. On the other hand, FDA approvals of new drugs are on the upswing. During 2017, we initiated new positions in GlaxoSmithKline, Eli Lilly, and Medtronic, and added to other Health Care holdings.(c) At year end, Health Care represented 19.3% of the Fund, compared to 11.7% for the MSCI World.
GlaxoSmithKline
The Fund recently re-established a position in GlaxoSmithKline, after selling it in 2015. Based in the United Kingdom, the company has leading therapeutic franchises in respiratory care and HIV. In addition to its traditional pharmaceuticals business, the company is diversified through strong and growing businesses in vaccines and over-the-counter consumer health.
In 2015, we sold GlaxoSmithKline based on market headwinds and a higher valuation. The company’s pharmaceuticals business was suffering from pricing pressure on a key respiratory drug, Advair, and the pipeline of new drug launches was weak. The valuation, at 20 times forward earnings, was relatively expensive and did not sufficiently compensate for the risks. Some of those risks, including continued weakness in Advair sales, materialized, and the valuation declined after we sold the position.
In the second half of 2017, however, we built a position in GlaxoSmithKline again, based on a more favorable fundamental long-term outlook and a lower valuation (12 times forward earnings). In the respiratory care division, declines in Advair sales should be offset by new drugs, aided by a new inhaler. The HIV segment is growing at healthy rates due to increased adoption of Dolutegravir, a drug that blocks an enzyme needed for HIV to replicate. Combined with continued growth in vaccines and consumer health, the company should achieve modest earnings growth. Meanwhile, the management team has also been revamped. The new CEO is focusing on renewing the pharmaceutical pipeline and has brought in a well-regarded head of research and development (R&D) to lead that effort. Improvements in the drug pipeline will take time to manifest, but in the meantime, the company continues to generate stable cash flow and has an attractive 6% dividend yield. On December 31, GlaxoSmithKline was a 1.9% position in the Fund.
Eli Lilly
During the second quarter of 2017, we initiated a position in Eli Lilly, a leading drug company focused on branded pharmaceuticals
PAGE 2 § DODGE & COX GLOBAL STOCK FUND
and animal health products. As the only pharmaceutical company with a presence across all major drug classes in the diabetes field, it has an advantage in contracting and marketing products. Until recently, Eli Lilly was losing market share to Novo Nordisk and Sanofi in the key area of diabetes classes, given its smaller emerging market footprint and lack of a basal insulin therapy. This trend reversed as Eli Lilly launched several new diabetes products during the last few years, and the company is now gaining share in most therapeutic areas within diabetes. Eli Lilly’s partnership with Boehringer Ingelheim, where costs and profits are shared 50/50, has been important in rejuvenating its diabetes portfolio.
After weathering two recent patent expirations, Eli Lilly is entering what could be an extended period of growth. The company’s four new drugs should each generate over $1 billion in annual sales. All of these recent product approvals have found commercial success and are driving future sales growth. If revenue grows as we expect, margins should improve significantly and boost earnings growth. The company has consistently had one of the better R&D groups in the Pharmaceuticals industry due to its stable organization, thoughtful leadership, and high funding.
Most importantly, the company’s newly appointed CEO leads a competent management team that appears to be well aligned with the interests of long-term shareholders and capable of navigating competitive and regulatory risks. Eli Lilly was a 1.2% position in the portfolio on December 31.
Energy
As the worst-performing sector (up 5%) of the MSCI World during 2017, we believe Energy is an increasingly attractive area of the market. Global supply and demand fundamentals are supportive of higher oil prices. Demand growth in the developing world continues to be healthy, and the dearth of investment in new supply over the past few years should lead to a tighter balance. We conduct ongoing research to test our investment thesis and recently met with industry executives and experts in Houston and the Middle East. Our trips reaffirmed that development costs in U.S. shale oil are rising with more activity and that other global sources of new supply are likely needed to satisfy demand. Our research also reinforced the importance of investing in oil producers with assets on the low end of the cost curve and management teams that are investing counter-cyclically.
The Fund remains modestly overweight the Energy sector—7.5% compared to 6.3% for the MSCI World—with growing exposure to exploration and production (E&P) companies. Given attractive valuations, we initiated positions in Suncor Energy (discussed below) and Occidental Petroleum (a multinational petroleum and natural gas E&P company), and added to other Energy holdings, including Anadarko Petroleum (a leading global E&P company with strong operational capabilities).
Suncor Energy
Suncor, a 1.7% position, is an integrated Canadian oil producer with most of its production coming from mining oil sands. Oil sands require large upfront capital expenditures but can produce for decades at relatively low ongoing costs. Suncor’s assets generate free cash flow across a wide range of oil prices. These characteristics, along with Suncor’s strong balance sheet, provide the company staying power through the oil cycle. In addition,
Suncor’s management has a track record of counter-cyclical capital allocation. When oil prices were high, management was disciplined and returned capital to shareholders through dividends and share buybacks. When oil prices declined, management opportunistically increased its ownership stake in a major oil sands asset called Syncrude. We view the company as offering a compelling combination of growth, resilience, and return of capital to shareholders.
IN CLOSING
The valuation differential between U.S. equities and international markets continues to be wide. At year end, the MSCI EAFE traded at 15 times forward estimated earnings and the MSCI Emerging Markets traded at 13 times, compared to 20 times for the S&P 500. Hence, on a bottom-up basis, the Fund is overweight international equities relative to the MSCI World. Overall, we remain optimistic about the long-term outlook for the portfolio and see attractive earnings prospects for companies in the Fund.
As an active, value-oriented manager, we believe the valuation disparities that characterize the current market offer significant opportunities. Our fundamental, bottom-up, price-disciplined investment approach requires conviction and patience. Accordingly, maintaining a long-term investment horizon and staying the course are essential.
Thank you for your continued confidence in our firm. As always, we welcome your comments and questions.
For the Board of Trustees,
| | |
| | |
Charles F. Pohl, Chairman | | Dana M. Emery, President |
January 30, 2018
| (a) | | The Russell 1000 Growth Index had a total return of 30.2% compared to 13.7% for the Russell 1000 Value Index during 2017. |
| (b) | | Unless otherwise specified, all weightings and characteristics are as of December 31, 2017. |
| (c) | | The use of specific examples does not imply that they are more or less attractive investments than the Fund’s other holdings. |
DODGE & COX GLOBAL STOCK FUND §PAGE 3
ANNUAL PERFORMANCE REVIEW
The Fund underperformed the MSCI World by 0.9 percentage points in 2017.
Key Detractors from Relative Results
| | § | | The Fund’s holdings in the Energy sector (down 10% compared to up 5% for the MSCI World sector) had a negative impact. Apache (down 32%) and Anadarko (down 23%) were notable detractors. | |
| | § | | Relative returns from holdings in the Industrials sector (up 20% compared to up 25% for the MSCI World sector), combined with the Fund’s average underweight position (5% versus 11%), also detracted from results. | |
| | § | | Additional detractors included Altice (down 47%), Magnit (down 34% since date of purchase), and Sprint (down 30%). | |
Key Contributors to Relative Results
| | § | | Relative returns from the Fund’s holdings in the Health Care sector (up 25% compared to up 20% for the MSCI World sector) contributed significantly to results. Alnylam Pharmaceuticals (up 239%) and Cigna (up 52%) were especially strong. | |
| | § | | Relative returns in the Financials sector (up 25% compared to up 23% for the MSCI World sector) aided performance. Kasikornbank (up 51%) and ICICI Bank (up 45%) were notable performers. | |
| | § | | Strong returns from the Fund’s holdings in emerging markets (up 41%) had a positive impact. Key contributors included Naspers (up 90%), Samsung Electronics (up 67%), and JD.com (up 63%), as well as several names already listed above. | |
| | § | | Millicom International (up 64%) was an additional contributor. | |
KEY CHARACTERISTICS OF DODGE & COX
Independent Organization
Dodge & Cox is one of the largest privately owned investment managers in the world. We remain committed to independence, with a goal of providing the highest quality investment management service to our existing clients.
Over 85 Years of Investment Experience
Dodge & Cox was founded in 1930. We have a stable and well-qualified team of investment professionals, most of whom have spent their entire careers at Dodge & Cox.
Experienced Investment Team
The Global Equity Investment Committee, which is the decision-making body for the Global Stock Fund, is an eight-member committee with an average tenure at Dodge & Cox of 22 years.
One Business with a Single Research Office
Dodge & Cox manages equity (domestic, international, and global), fixed income (domestic and global), and balanced investments, operating from one office in San Francisco.
Consistent Investment Approach
Our team decision-making process involves thorough, bottom-up fundamental analysis of each investment.
Long-Term Focus and Low Expenses
We invest with a three- to five-year investment horizon, which has historically resulted in low turnover relative to our peers. We manage Funds that maintain low expense ratios.
Risks: The Fund is subject to market risk, meaning holdings in the Fund may decline in value for extended periods due to the financial prospects of individual companies, or due to general market and economic conditions. Investing in non-U.S. securities may entail risk due to foreign economic and political developments; this risk may be increased when investing in emerging markets. The Fund is also subject to currency risk. Please read the prospectus and summary prospectus for specific details regarding the Fund’s risk profile.
PAGE 4 § DODGE & COX GLOBAL STOCK FUND
GROWTH OF $10,000 SINCE INCEPTION
FOR AN INVESTMENT MADE ON MAY 1, 2008
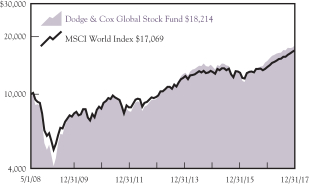
AVERAGE ANNUAL TOTAL RETURN
FOR PERIODS ENDED DECEMBER 31, 2017
| | | | | | | | | | | | | | | | |
| | | 1 Year | | | 3 Years | | | 5 Years | | | Since
Inception
(5/1/08) | |
Dodge & Cox Global Stock Fund | | | 21.51 | % | | | 9.37 | % | | | 13.26 | % | | | 6.40 | % |
MSCI World Index | | | 22.40 | | | | 9.26 | | | | 11.64 | | | | 5.69 | |
Returns represent past performance and do not guarantee future results. Investment return and share price will fluctuate with market conditions, and investors may have a gain or loss when shares are sold. Fund performance changes over time and currently may be significantly lower than stated. Performance is updated and published monthly. Visit the Fund’s website at dodgeandcox.com or call 800-621-3979 for current performance figures.
The Fund’s total returns include the reinvestment of dividend and capital gain distributions, but have not been adjusted for any income taxes payable by shareholders on these distributions or on Fund share redemptions. Index returns include dividends but, unlike Fund returns, do not reflect fees or expenses. The MSCI World Index is a broad-based, unmanaged equity market index aggregated from 23 developed market country indices, including the United States. MSCI makes no express or implied warranties or representations and shall have no liability whatsoever with respect to any MSCI data contained herein. The MSCI data may not be further redistributed or used as a basis for other indices or any securities or financial products. This report is not approved, reviewed, or produced by MSCI.
MSCI World is a service mark of MSCI Barra.
FUND EXPENSE EXAMPLE
As a Fund shareholder, you incur ongoing Fund costs, including management fees and other Fund expenses. All mutual funds have ongoing costs, sometimes referred to as operating expenses. The following example shows ongoing costs of investing in the Fund and can help you understand these costs and compare them with those of other mutual funds. The example assumes a $1,000 investment held for the six months indicated.
ACTUAL EXPENSES
The first line of the table below provides information about actual account values and expenses based on the Fund’s actual returns. You may use the information in this line, together with your account balance, to estimate the expenses that you paid over the period. Simply divide your account value by $1,000 (for example, an $8,600 account value divided by $1,000 = 8.6), then multiply the result by the number in the first line under the heading “Expenses Paid During Period” to estimate the expenses you paid on your account during this period.
HYPOTHETICAL EXAMPLE FOR COMPARISON WITH OTHER MUTUAL FUNDS
Information on the second line of the table can help you compare ongoing costs of investing in the Fund with those of other mutual funds. This information may not be used to estimate the actual ending account balance or expenses you paid during the period. The hypothetical “Ending Account Value” is based on the actual expense ratio of the Fund and an assumed 5% annual rate of return before expenses (not the Fund’s actual return). The amount under the heading “Expenses Paid During Period” shows the hypothetical expenses your account would have incurred under this scenario. You can compare this figure with the 5% hypothetical examples that appear in shareholder reports of other mutual funds.
| | | | | | | | | | | | |
Six Months Ended December 31, 2017 | | Beginning Account Value
7/1/2017 | | | Ending Account Value
12/31/2017 | | | Expenses Paid During Period* | |
Based on Actual Fund Return | | $ | 1,000.00 | | | $ | 1,095.50 | | | $ | 3.30 | |
Based on Hypothetical 5% Yearly Return | | | 1,000.00 | | | | 1,022.05 | | | | 3.19 | |
| * | | Expenses are equal to the Fund’s annualized expense ratio of 0.63%, multiplied by the average account value over the period, multiplied by 184/365 (to reflect the one-half year period). |
The expenses shown in the table highlight ongoing costs only and do not reflect any transactional fees or account maintenance fees. Though other mutual funds may charge such fees, please note that the Fund does not charge transaction fees (e.g., redemption fees, sales loads) or universal account maintenance fees (e.g., small account fees).
DODGE & COX GLOBAL STOCK FUND §PAGE 5
| | | | |
| FUND INFORMATION (unaudited) | | | December 31, 2017 | |
| | | | |
| GENERAL INFORMATION | | | |
Net Asset Value Per Share | | | $13.86 | |
Total Net Assets (billions) | | | $9.9 | |
Expense Ratio | | | 0.63% | |
Portfolio Turnover Rate | | | 18% | |
30-Day SEC Yield(a) | | | 1.15% | |
Number of Companies | | | 86 | |
Fund Inception | | | 2008 | |
No sales charges or distribution fees | | | | |
Investment Manager: Dodge & Cox, San Francisco. Managed by the Global Equity Investment Committee, whose eight members’ average tenure at Dodge & Cox is 22 years.
| | | | | | | | |
| PORTFOLIO CHARACTERISTICS | | Fund | | | MSCI
World | |
Median Market Capitalization (billions) | | | $50 | | | | $13 | |
Weighted Average Market Capitalization (billions) | | | $106 | | | | $126 | |
Price-to-Earnings Ratio(b) | | | 15.5x | | | | 17.0x | |
Countries Represented | | | 22 | | | | 23 | |
Emerging Markets (Brazil, China, India, Mexico, Russia, South Africa, South Korea, Thailand, Turkey) | | | 17.3% | | | | 0.0% | |
| | | | |
| TEN LARGEST HOLDINGS (%)(c) | | Fund | |
Novartis AG (Switzerland) | | | 2.5 | |
Naspers, Ltd. (South Africa) | | | 2.5 | |
Alphabet, Inc. (United States) | | | 2.4 | |
Sanofi (France) | | | 2.4 | |
Samsung Electronics Co., Ltd. (South Korea) | | | 2.2 | |
ICICI Bank, Ltd. (India) | | | 2.1 | |
Bank of America Corp. (United States) | | | 2.0 | |
Express Scripts Holding Co. (United States) | | | 1.9 | |
Charles Schwab Corp. (United States) | | | 1.9 | |
GlaxoSmithKline PLC (United Kingdom) | | | 1.9 | |
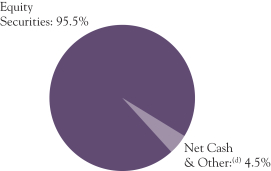
| | | | | | | | |
| REGION DIVERSIFICATION (%)(e) | | Fund | | | MSCI
World | |
United States | | | 42.9 | | | | 59.2 | |
Europe (excluding United Kingdom) | | | 22.4 | | | | 17.0 | |
United Kingdom | | | 10.6 | | | | 6.6 | |
Pacific (excluding Japan) | | | 9.0 | | | | 4.5 | |
Latin America | | | 4.2 | | | | 0.0 | |
Africa | | | 3.6 | | | | 0.0 | |
Canada | | | 1.7 | | | | 3.5 | |
Japan | | | 1.1 | | | | 8.9 | |
Middle East | | | 0.0 | | | | 0.3 | |
| | | | | | | | |
| SECTOR DIVERSIFICATION (%) | | Fund | | | MSCI
World | |
Financials | | | 24.3 | | | | 18.1 | |
Health Care | | | 19.3 | | | | 11.7 | |
Consumer Discretionary | | | 18.6 | | | | 12.3 | |
Information Technology | | | 12.8 | | | | 16.8 | |
Energy | | | 7.5 | | | | 6.3 | |
Industrials | | | 4.5 | | | | 11.6 | |
Materials | | | 3.4 | | | | 5.2 | |
Telecommunication Services | | | 3.2 | | | | 2.8 | |
Consumer Staples | | | 1.3 | | | | 9.1 | |
Real Estate | | | 0.6 | | | | 3.1 | |
Utilities | | | 0.0 | | | | 3.0 | |
| (a) | SEC Yield is an annualization of the Fund’s net investment income for the trailing 30-day period. Dividends paid by the Fund may be higher or lower than implied by the SEC Yield. |
| (b) | Price-to-earnings (P/E) ratios are calculated using 12-month forward earnings estimates from third-party sources. |
| (c) | The Fund’s portfolio holdings are subject to change without notice. The mention of specific securities is not a recommendation to buy, sell, or hold any particular security and is not indicative of Dodge & Cox’s current or future trading activity. |
| (d) | Net Cash & Other includes cash, short-term investments, derivatives, receivables, and payables. |
| (e) | The Fund may classify a company in a different category than the MSCI World. The Fund generally classifies a company based on its country of incorporation, but may designate a different country in certain circumstances. |
PAGE 6 § DODGE & COX GLOBAL STOCK FUND
| | | | |
| CONSOLIDATED PORTFOLIO OF INVESTMENTS | | | December 31, 2017 | |
| | | | | | | | |
| COMMON STOCKS: 91.4% | | | | | | |
| | |
| | | SHARES | | | VALUE | |
| CONSUMER DISCRETIONARY: 18.6% | |
AUTOMOBILES & COMPONENTS: 2.1% | |
Bayerische Motoren Werke AG (Germany) | | | 867,300 | | | $ | 90,088,665 | |
Honda Motor Co., Ltd. (Japan) | | | 3,289,100 | | | | 112,768,475 | |
| | | | | | | | |
| | | | | | | 202,857,140 | |
MEDIA: 12.3% | | | | | | | | |
Altice NV, Series A(a) (Netherlands) | | | 7,733,145 | | | | 80,896,709 | |
Charter Communications, Inc., Class A(a) (United States) | | | 364,797 | | | | 122,557,200 | |
Comcast Corp., Class A (United States) | | | 4,388,500 | | | | 175,759,425 | |
DISH Network Corp., Class A(a)
(United States) | | | 1,066,600 | | | | 50,930,150 | |
Grupo Televisa SAB ADR (Mexico) | | | 5,462,913 | | | | 101,992,586 | |
Liberty Global PLC LiLAC, Series A(a)
(United Kingdom) | | | 1,199,000 | | | | 24,159,850 | |
Liberty Global PLC LiLAC, Series C(a)
(United Kingdom) | | | 788,562 | | | | 15,684,498 | |
Liberty Global PLC, Series C(a)
(United Kingdom) | | | 5,326,500 | | | | 180,248,760 | |
Naspers, Ltd. (South Africa) | | | 888,200 | | | | 247,478,611 | |
Television Broadcasts, Ltd. (Hong Kong) | | | 2,509,500 | | | | 9,045,874 | |
Time Warner, Inc. (United States) | | | 644,966 | | | | 58,995,040 | |
Twenty-First Century Fox, Inc., Class A (United States) | | | 4,440,500 | | | | 153,330,465 | |
| | | | | | | | |
| | | | | | | 1,221,079,168 | |
RETAILING: 4.2% | | | | | | | | |
JD.com, Inc. ADR(a) (Cayman Islands/China) | | | 2,911,900 | | | | 120,610,898 | |
Liberty Interactive Corp. QVC Group,
Series A(a) (United States) | | | 3,729,716 | | | | 91,079,665 | |
Target Corp. (United States) | | | 1,548,900 | | | | 101,065,725 | |
The Priceline Group, Inc.(a) (United States) | | | 59,200 | | | | 102,874,208 | |
| | | | | | | | |
| | | | | | | 415,630,496 | |
| | | | | | | | |
| | | | | | | 1,839,566,804 | |
| CONSUMER STAPLES: 1.3% | |
FOOD & STAPLES RETAILING: 1.2% | | | | | | | | |
Magnit PJSC (Russia) | | | 917,921 | | | | 100,887,558 | |
Wal-Mart Stores, Inc. (United States) | | | 164,673 | | | | 16,261,459 | |
| | | | | | | | |
| | | | | | | 117,149,017 | |
FOOD, BEVERAGE & TOBACCO: 0.1% | | | | | | | | |
Anadolu Efes Biracilik ve Malt Sanayii AS (Turkey) | | | 2,529,185 | | | | 16,161,751 | |
| | | | | | | | |
| | | | | | | 133,310,768 | |
| ENERGY: 6.7% | | | | | | | | |
Anadarko Petroleum Corp. (United States) | | | 3,463,500 | | | | 185,782,140 | |
Apache Corp. (United States) | | | 1,934,532 | | | | 81,675,941 | |
National Oilwell Varco, Inc. (United States) | | | 1,598,700 | | | | 57,585,174 | |
Occidental Petroleum Corp. (United States) | | | 619,363 | | | | 45,622,279 | |
Saipem SPA(a) (Italy) | | | 5,874,230 | | | | 26,816,695 | |
Schlumberger, Ltd. (Curacao/United States) | | | 1,183,900 | | | | 79,783,021 | |
Suncor Energy, Inc. (Canada) | | | 4,545,400 | | | | 166,907,088 | |
Weatherford International PLC(a) (Ireland) | | | 4,434,175 | | | | 18,490,510 | |
| | | | | | | | |
| | | | | | | 662,662,848 | |
| FINANCIALS: 22.6% | | | | | | | | |
BANKS: 12.7% | | | | | | | | |
Banco Santander SA (Spain) | | | 7,093,633 | | | | 46,515,471 | |
Bank of America Corp. (United States) | | | 6,566,000 | | | | 193,828,320 | |
Barclays PLC (United Kingdom) | | | 66,562,221 | | | | 181,489,441 | |
BNP Paribas SA (France) | | | 1,306,700 | | | | 97,445,685 | |
ICICI Bank, Ltd. (India) | | | 43,078,436 | | | | 211,399,752 | |
Kasikornbank PCL- Foreign (Thailand) | | | 20,822,900 | | | | 152,186,633 | |
Standard Chartered PLC(a)
(United Kingdom) | | | 12,538,377 | | | | 131,946,147 | |
UniCredit SPA(a) (Italy) | | | 5,468,531 | | | | 101,874,849 | |
Wells Fargo & Co. (United States) | | | 2,405,373 | | | | 145,933,980 | |
| | | | | | | | |
| | | | 1,262,620,278 | |
| | | | | | | | |
| | |
| | | SHARES | | | VALUE | |
DIVERSIFIED FINANCIALS: 8.1% | |
American Express Co. (United States) | | | 739,700 | | | $ | 73,459,607 | |
Bank of New York Mellon Corp.
(United States) | | | 1,570,500 | | | | 84,587,130 | |
Capital One Financial Corp.
(United States) | | | 1,585,800 | | | | 157,913,964 | |
Charles Schwab Corp. (United States) | | | 3,644,200 | | | | 187,202,554 | |
Credit Suisse Group AG (Switzerland) | | | 5,622,799 | | | | 100,087,513 | |
Goldman Sachs Group, Inc.
(United States) | | | 532,100 | | | | 135,557,796 | |
UBS Group AG (Switzerland) | | | 3,515,100 | | | | 64,587,178 | |
| | | | | | | | |
| | | | 803,395,742 | |
INSURANCE: 1.8% | |
AEGON NV (Netherlands) | | | 10,924,706 | | | | 69,626,030 | |
Aviva PLC (United Kingdom) | | | 15,984,820 | | | | 109,240,805 | |
| | | | | | | | |
| | | | 178,866,835 | |
| | | | | | | | |
| | | | 2,244,882,855 | |
| HEALTH CARE: 19.3% | |
HEALTH CARE EQUIPMENT & SERVICES: 5.4% | |
Cigna Corp. (United States) | | | 628,800 | | | | 127,702,992 | |
Express Scripts Holding Co.(a)
(United States) | | | 2,568,800 | | | | 191,735,232 | |
Medtronic PLC (Ireland) | | | 1,128,100 | | | | 91,094,075 | |
UnitedHealth Group, Inc. (United States) | | | 560,800 | | | | 123,633,968 | |
| | | | | | | | |
| | | | 534,166,267 | |
PHARMACEUTICALS, BIOTECHNOLOGY & LIFE SCIENCES: 13.9% | |
Alnylam Pharmaceuticals, Inc.(a)
(United States) | | | 671,900 | | | | 85,364,895 | |
AstraZeneca PLC (United Kingdom) | | | 2,275,100 | | | | 156,124,209 | |
Bayer AG (Germany) | | | 724,720 | | | | 90,137,075 | |
Bristol-Myers Squibb Co. (United States) | | | 1,700,800 | | | | 104,225,024 | |
Eli Lilly and Co. (United States) | | | 1,389,000 | | | | 117,314,940 | |
GlaxoSmithKline PLC (United Kingdom) | | | 10,510,900 | | | | 185,915,186 | |
Merck & Co., Inc. (United States) | | | 511,000 | | | | 28,753,970 | |
Novartis AG (Switzerland) | | | 2,679,700 | | | | 226,546,524 | |
Novartis AG ADR (Switzerland) | | | 260,900 | | | | 21,905,164 | |
Roche Holding AG (Switzerland) | | | 494,000 | | | | 124,953,953 | |
Sanofi (France) | | | 2,709,762 | | | | 233,320,168 | |
| | | | | | | | |
| | | | 1,374,561,108 | |
| | | | | | | | |
| | | | 1,908,727,375 | |
| INDUSTRIALS: 4.5% | |
CAPITAL GOODS: 2.5% | |
Johnson Controls International PLC (Ireland) | | | 4,232,226 | | | | 161,290,133 | |
Schneider Electric SA (France) | | | 989,578 | | | | 83,927,247 | |
| | | | | | | | |
| | | | 245,217,380 | |
TRANSPORTATION: 2.0% | |
FedEx Corp. (United States) | | | 386,800 | | | | 96,522,072 | |
Union Pacific Corp. (United States) | | | 785,800 | | | | 105,375,780 | |
| | | | | | | | |
| | | | 201,897,852 | |
| | | | | | | | |
| | | | 447,115,232 | |
| INFORMATION TECHNOLOGY: 11.2% | |
SOFTWARE & SERVICES: 6.3% | |
Alphabet, Inc., Class C(a) (United States) | | | 226,999 | | | | 237,531,754 | |
Baidu, Inc. ADR(a)
(Cayman Islands/China) | | | 498,500 | | | | 116,753,685 | |
Dell Technologies, Inc., Class V(a)
(United States) | | | 1,252,416 | | | | 101,796,372 | |
Micro Focus International PLC ADR (United Kingdom) | | | 1,839,449 | | | | 61,787,092 | |
Microsoft Corp. (United States) | | | 1,275,000 | | | | 109,063,500 | |
| | | | | | | | |
| | | | | | | 626,932,403 | |
| | |
| See accompanying Notes to Consolidated Financial Statements | | DODGE & COX GLOBAL STOCK FUND §PAGE 7 |
| | | | |
| CONSOLIDATED PORTFOLIO OF INVESTMENTS | | | December 31, 2017 | |
| | | | | | | | |
| COMMON STOCKS (continued) | |
| | |
| | | SHARES | | | VALUE | |
TECHNOLOGY, HARDWARE & EQUIPMENT: 4.9% | |
Cisco Systems, Inc. (United States) | | | 2,083,700 | | | $ | 79,805,710 | |
Hewlett Packard Enterprise Co. (United States) | | | 10,120,300 | | | | 145,327,508 | |
HP Inc. (United States) | | | 2,324,302 | | | | 48,833,585 | |
Juniper Networks, Inc. (United States) | | | 2,427,168 | | | | 69,174,288 | |
Samsung Electronics Co., Ltd. (South Korea) | | | 26,724 | | | | 63,491,538 | |
TE Connectivity, Ltd. (Switzerland) | | | 823,815 | | | | 78,295,377 | |
| | | | | | | | |
| | | | 484,928,006 | |
| | | | | | | | |
| | | | 1,111,860,409 | |
| MATERIALS: 3.4% | |
Celanese Corp., Series A (United States) | | | 519,000 | | | | 55,574,520 | |
Cemex SAB de CV ADR (Mexico) | | | 9,877,786 | | | | 74,083,395 | |
LafargeHolcim, Ltd. (Switzerland) | | | 1,142,520 | | | | 64,371,740 | |
Linde AG (Germany) | | | 631,910 | | | | 147,826,956 | |
| | | | | | | | |
| | | | 341,856,611 | |
| REAL ESTATE: 0.6% | |
Hang Lung Group, Ltd. (Hong Kong) | | | 15,217,900 | | | | 55,983,851 | |
|
| TELECOMMUNICATION SERVICES: 3.2% | |
Millicom International Cellular SA SDR (Luxembourg) | | | 1,148,400 | | | | 77,529,783 | |
MTN Group, Ltd. (South Africa) | | | 10,293,600 | | | | 113,781,430 | |
Sprint Corp.(a) (United States) | | | 9,218,500 | | | | 54,296,965 | |
Zayo Group Holdings, Inc.(a) (United States) | | | 1,825,800 | | | | 67,189,440 | |
| | | | | | | | |
| | | | 312,797,618 | |
| | | | | | | | |
TOTAL COMMON STOCKS
(Cost $6,933,661,432) | | | $ | 9,058,764,371 | |
|
| PREFERRED STOCKS: 4.1% | |
| ENERGY: 0.8% | |
Petroleo Brasileiro SA(a) (Brazil) | | | 15,153,206 | | | | 74,114,705 | |
|
| FINANCIALS: 1.7% | |
BANKS: 1.7% | |
Itau Unibanco Holding SA (Brazil) | | | 13,148,729 | | | | 170,288,380 | |
|
| INFORMATION TECHNOLOGY: 1.6% | |
TECHNOLOGY, HARDWARE & EQUIPMENT: 1.6% | |
Samsung Electronics Co., Ltd. (South Korea) | | | 80,814 | | | | 157,539,887 | |
| | | | | | | | |
TOTAL PREFERRED STOCKS
(Cost $197,639,567) | | | $ | 401,942,972 | |
| | | | | | | | |
| SHORT-TERM INVESTMENTS: 5.0% | |
| | |
| | | SHARES/ PAR VALUE | | | VALUE | |
REPURCHASE AGREEMENT: 4.9% | |
Fixed Income Clearing Corporation(b)
0.80%, dated 12/29/17, due 1/2/18, maturity value $490,253,574 | | $ | 490,210,000 | | | $ | 490,210,000 | |
|
MONEY MARKET FUND: 0.1% | |
State Street Institutional Treasury Plus Money Market Fund | | | 9,862,910 | | | | 9,862,910 | |
| | | | | | | | |
TOTAL SHORT-TERM INVESTMENTS
(Cost $500,072,910) | | | $ | 500,072,910 | |
| | | | | | | | |
TOTAL INVESTMENTS
(Cost $7,631,373,909) | | | 100.5 | % | | $ | 9,960,780,253 | |
OTHER ASSETS LESS LIABILITIES | | | (0.5 | %) | | | (50,197,119 | ) |
| | | | | | | | |
| NET ASSETS | | | 100.0 | % | | $ | 9,910,583,134 | |
| | | | | | | | |
| (b) | Repurchase agreement is collateralized by U.S. Treasury Notes 1.375%-2.125%, 10/31/22-6/30/23. Total collateral value is $500,018,806. |
In determining a company’s country designation, the Fund generally references the country of incorporation. In cases where the Fund considers the country of incorporation to be a “jurisdiction of convenience” chosen primarily for tax purposes or in other limited circumstances, the Fund uses the country designation of an appropriate broad-based market index. In those cases, two countries are listed—the country of incorporation and the country designated by an appropriate index, respectively.
ADR: American Depositary Receipt
SDR: Swedish Depository Receipt
| | |
| PAGE 8 § DODGE & COX GLOBAL STOCK FUND | | See accompanying Notes to Consolidated Financial Statements |
| | | | |
| CONSOLIDATED PORTFOLIO OF INVESTMENTS | | | December 31, 2017 | |
FUTURES CONTRACTS
| | | | | | | | | | | | | | | | |
| Description | | Number of
Contracts | | | Expiration
Date | | | Notional
Amount | | | Value /
Unrealized
Appreciation
(Depreciation) | |
E-mini S&P 500 Index—Long Position | | | 3,147 | | | | Mar 2018 | | | $ | 421,068,600 | | | $ | 980,929 | |
CURRENCY FORWARD CONTRACTS | |
| | | | | | Contract Amount | | | | |
| Counterparty | | Settle Date | | | Receive U.S.
Dollar | | | Deliver Foreign
Currency | | | Unrealized
Appreciation
(Depreciation) | |
Contracts to sell CHF: | |
Citibank | | | 1/24/18 | | | | 11,692,632 | | | | 11,305,840 | | | $ | 74,210 | |
Citibank | | | 1/24/18 | | | | 6,167,290 | | | | 5,963,276 | | | | 39,142 | |
Citibank | | | 1/24/18 | | | | 5,006,499 | | | | 4,840,884 | | | | 31,775 | |
Goldman Sachs | | | 1/24/18 | | | | 11,519,211 | | | | 11,137,096 | | | | 74,199 | |
Goldman Sachs | | | 1/24/18 | | | | 6,075,818 | | | | 5,874,271 | | | | 39,136 | |
Goldman Sachs | | | 1/24/18 | | | | 4,932,244 | | | | 4,768,632 | | | | 31,770 | |
Goldman Sachs | | | 1/24/18 | | | | 5,004,429 | | | | 4,840,884 | | | | 29,705 | |
Goldman Sachs | | | 1/24/18 | | | | 11,687,798 | | | | 11,305,841 | | | | 69,375 | |
Goldman Sachs | | | 1/24/18 | | | | 6,164,740 | | | | 5,963,276 | | | | 36,592 | |
Citibank | | | 1/31/18 | | | | 7,652,319 | | | | 7,500,000 | | | | (58,811 | ) |
Citibank | | | 1/31/18 | | | | 7,658,532 | | | | 7,500,000 | | | | (52,599 | ) |
Goldman Sachs | | | 2/14/18 | | | | 20,219,789 | | | | 20,000,000 | | | | (363,618 | ) |
Contracts to sell CNH: | |
Citibank | | | 1/10/18 | | | | 3,413,621 | | | | 24,139,420 | | | | (291,330 | ) |
HSBC | | | 1/10/18 | | | | 6,824,925 | | | | 48,278,840 | | | | (584,976 | ) |
HSBC | | | 1/10/18 | | | | 3,413,862 | | | | 24,139,420 | | | | (291,088 | ) |
JPMorgan | | | 1/10/18 | | | | 3,413,380 | | | | 24,139,420 | | | | (291,571 | ) |
JPMorgan | | | 1/10/18 | | | | 3,414,345 | | | | 24,139,420 | | | | (290,605 | ) |
JPMorgan | | | 1/10/18 | | | | 3,414,104 | | | | 24,139,420 | | | | (290,847 | ) |
JPMorgan | | | 1/10/18 | | | | 3,414,828 | | | | 24,139,420 | | | | (290,123 | ) |
JPMorgan | | | 1/10/18 | | | | 3,414,828 | | | | 24,139,420 | | | | (290,122 | ) |
JPMorgan | | | 1/10/18 | | | | 3,413,862 | | | | 24,139,420 | | | | (291,088 | ) |
Citibank | | | 1/24/18 | | | | 7,252,384 | | | | 51,336,000 | | | | (621,041 | ) |
Citibank | | | 1/24/18 | | | | 6,771,705 | | | | 47,896,266 | | | | (574,167 | ) |
Citibank | | | 1/24/18 | | | | 6,775,536 | | | | 47,896,267 | | | | (570,335 | ) |
JPMorgan | | | 1/24/18 | | | | 19,020,716 | | | | 134,600,100 | | | | (1,622,959 | ) |
JPMorgan | | | 1/24/18 | | | | 3,626,192 | | | | 25,668,000 | | | | (310,520 | ) |
JPMorgan | | | 1/24/18 | | | | 3,626,192 | | | | 25,668,000 | | | | (310,520 | ) |
JPMorgan | | | 1/24/18 | | | | 6,769,790 | | | | 47,896,267 | | | | (576,081 | ) |
Citibank | | | 1/31/18 | | | | 5,989,021 | | | | 42,411,810 | | | | (513,347 | ) |
JPMorgan | | | 1/31/18 | | | | 30,644,004 | | | | 216,576,500 | | | | (2,560,431 | ) |
JPMorgan | | | 1/31/18 | | | | 11,638,937 | | | | 82,312,890 | | | | (980,867 | ) |
JPMorgan | | | 1/31/18 | | | | 7,722,920 | | | | 54,635,800 | | | | (653,570 | ) |
Citibank | | | 2/7/18 | | | | 6,024,463 | | | | 42,598,975 | | | | (504,123 | ) |
Citibank | | | 2/7/18 | | | | 2,509,838 | | | | 17,749,575 | | | | (210,406 | ) |
Citibank | | | 2/7/18 | | | | 2,517,670 | | | | 17,749,575 | | | | (202,574 | ) |
Citibank | | | 2/7/18 | | | | 6,038,981 | | | | 42,598,975 | | | | (489,604 | ) |
Citibank | | | 2/7/18 | | | | 6,042,408 | | | | 42,598,975 | | | | (486,178 | ) |
Citibank | | | 2/7/18 | | | | 2,516,243 | | | | 17,749,575 | | | | (204,002 | ) |
Citibank | | | 2/7/18 | | | | 2,510,193 | | | | 17,749,575 | | | | (210,051 | ) |
Citibank | | | 2/7/18 | | | | 6,023,611 | | | | 42,598,975 | | | | (504,975 | ) |
Bank of America | | | 5/16/18 | | | | 3,529,328 | | | | 24,959,408 | | | | (274,441 | ) |
Bank of America | | | 5/16/18 | | | | 3,530,876 | | | | 24,959,407 | | | | (272,893 | ) |
Goldman Sachs | | | 5/16/18 | | | | 3,545,017 | | | | 25,061,497 | | | | (274,310 | ) |
Goldman Sachs | | | 5/16/18 | | | | 3,536,275 | | | | 25,005,000 | | | | (274,442 | ) |
Goldman Sachs | | | 5/16/18 | | | | 3,530,046 | | | | 24,955,663 | | | | (273,152 | ) |
Goldman Sachs | | | 5/16/18 | | | | 3,544,717 | | | | 25,059,025 | | | | (274,233 | ) |
Bank of America | | | 6/13/18 | | | | 45,881,425 | | | | 320,000,000 | | | | (2,811,792 | ) |
Bank of America | | | 6/13/18 | | | | 10,716,582 | | | | 75,000,000 | | | | (695,891 | ) |
Bank of America | | | 6/13/18 | | | | 10,714,286 | | | | 75,000,000 | | | | (698,187 | ) |
Bank of America | | | 8/1/18 | | | | 5,871,921 | | | | 40,354,776 | | | | (251,487 | ) |
Bank of America | | | 8/1/18 | | | | 4,070,927 | | | | 27,977,448 | | | | (174,352 | ) |
JPMorgan | | | 8/1/18 | | | | 5,872,776 | | | | 40,354,777 | | | | (250,632 | ) |
| | | | | | | | | | | | | | | | |
| | | | | | Contract Amount | | | | |
| Counterparty | | Settle Date | | | Receive U.S.
Dollar | | | Deliver Foreign
Currency | | | Unrealized
Appreciation
(Depreciation) | |
JPMorgan | | | 8/1/18 | | | | 5,873,630 | | | | 40,354,776 | | | $ | (249,777 | ) |
JPMorgan | | | 8/1/18 | | | | 4,071,520 | | | | 27,977,449 | | | | (173,760 | ) |
JPMorgan | | | 8/1/18 | | | | 4,070,631 | | | | 27,977,449 | | | | (174,649 | ) |
JPMorgan | | | 8/1/18 | | | | 4,072,112 | | | | 27,977,448 | | | | (173,167 | ) |
JPMorgan | | | 8/1/18 | | | | 5,871,494 | | | | 40,354,777 | | | | (251,914 | ) |
Bank of America | | | 8/8/18 | | | | 9,366,533 | | | | 64,455,800 | | | | (409,884 | ) |
Credit Suisse | | | 8/8/18 | | | | 9,368,984 | | | | 64,455,800 | | | | (407,433 | ) |
Goldman Sachs | | | 8/8/18 | | | | 7,205,552 | | | | 49,581,400 | | | | (314,772 | ) |
JPMorgan | | | 8/8/18 | | | | 7,206,075 | | | | 49,581,400 | | | | (314,248 | ) |
JPMorgan | | | 8/8/18 | | | | 7,205,028 | | | | 49,581,400 | | | | (315,295 | ) |
JPMorgan | | | 8/15/18 | | | | 25,259,917 | | | | 172,651,536 | | | | (916,353 | ) |
UBS | | | 8/15/18 | | | | 2,248,430 | | | | 15,399,496 | | | | (86,339 | ) |
UBS | | | 8/15/18 | | | | 8,655,478 | | | | 59,281,368 | | | | (332,367 | ) |
Bank of America | | | 8/29/18 | | | | 6,039,970 | | | | 40,800,000 | | | | (140,719 | ) |
Bank of America | | | 8/29/18 | | | | 6,171,734 | | | | 41,616,000 | | | | (132,569 | ) |
Bank of America | | | 8/29/18 | | | | 11,363,809 | | | | 75,000,000 | | | | 2,247 | |
Citibank | | | 8/29/18 | | | | 6,045,743 | | | | 40,800,000 | | | | (134,946 | ) |
HSBC | | | 8/29/18 | | | | 40,667,900 | | | | 275,000,000 | | | | (991,157 | ) |
UBS | | | 8/29/18 | | | | 5,337,129 | | | | 36,000,000 | | | | (116,421 | ) |
UBS | | | 8/29/18 | | | | 5,861,715 | | | | 39,584,160 | | | | (134,790 | ) |
UBS | | | 8/29/18 | | | | 6,103,228 | | | | 41,199,840 | | | | (138,032 | ) |
Contracts to sell EUR: | |
Goldman Sachs | | | 2/14/18 | | | | 22,944,619 | | | | 19,560,547 | | | | (581,871 | ) |
Goldman Sachs | | | 2/14/18 | | | | 13,711,787 | | | | 11,689,453 | | | | (347,728 | ) |
Bank of America | | | 3/14/18 | | | | 17,809,575 | | | | 15,000,000 | | | | (262,807 | ) |
Bank of America | | | 3/14/18 | | | | 17,814,075 | | | | 15,000,000 | | | | (258,307 | ) |
Barclays | | | 3/14/18 | | | | 7,242,408 | | | | 6,000,000 | | | | 13,455 | |
| | | | |
| Counterparty | | Settle Date | | | Deliver U.S.
Dollar | | | Receive
Foreign
Currency | | | Unrealized
Appreciation
(Depreciation) | |
Contracts to buy CNH: | |
JPMorgan | | | 1/10/18 | | | | 3,639,566 | | | | 24,139,420 | | | | 65,385 | |
JPMorgan | | | 1/10/18 | | | | 10,918,697 | | | | 72,418,260 | | | | 196,154 | |
| | | | | | | | | | | | | | | | |
| | | $ | (28,674,501 | ) |
| | | | | | | | | | | | | | | | |
The listed counterparty may be the parent company or one of its subsidiaries.
CHF: Swiss Franc
CNH: Chinese Yuan Renminbi
EUR: Euro
| | |
| See accompanying Notes to Consolidated Financial Statements | | DODGE & COX GLOBAL STOCK FUND §PAGE 9 |
| | | | |
CONSOLIDATED STATEMENT OF ASSETS AND LIABILITIES | |
| |
| | | December 31, 2017 | |
ASSETS: | | | | |
Investments in securities, at value (cost $7,631,373,909) | | $ | 9,960,780,253 | |
Unrealized appreciation on currency forward contracts | | | 703,145 | |
Cash pledged as collateral for currency forward contracts | | | 20,780,000 | |
Cash | | | 100 | |
Cash denominated in foreign currency (cost $5,559,254) | | | 5,566,633 | |
Deposits with broker for futures contracts | | | 14,161,503 | |
Receivable for investments sold | | | 2,555,205 | |
Receivable for Fund shares sold | | | 68,253,583 | |
Dividends and interest receivable | | | 14,056,156 | |
Prepaid expenses and other assets | | | 58,307 | |
| | | | |
| | | 10,086,914,885 | |
| | | | |
LIABILITIES: | | | | |
Unrealized depreciation on currency forward contracts | | | 29,377,646 | |
Payable for variation margin for futures contracts | | | 1,526,295 | |
Payable for investments purchased | | | 133,885,824 | |
Payable for Fund shares redeemed | | | 2,041,466 | |
Deferred foreign capital gains tax | | | 3,859,673 | |
Management fees payable | | | 4,773,535 | |
Accrued expenses | | | 867,312 | |
| | | | |
| | | 176,331,751 | |
| | | | |
NET ASSETS | | $ | 9,910,583,134 | |
| | | | |
NET ASSETS CONSIST OF: | | | | |
Paid in capital | | $ | 7,489,657,243 | |
Undistributed net investment income | | | 849,242 | |
Undistributed net realized gain | | | 122,052,807 | |
Net unrealized appreciation | | | 2,298,023,842 | |
| | | | |
| | $ | 9,910,583,134 | |
| | | | |
Fund shares outstanding (par value $0.01 each, unlimited shares authorized) | | | 715,155,414 | |
Net asset value per share | | $ | 13.86 | |
|
CONSOLIDATED STATEMENT OF OPERATIONS | |
| |
| | | Year Ended
December 31, 2017 | |
INVESTMENT INCOME: | | | | |
Dividends (net of foreign taxes of $8,481,846) | | $ | 138,288,346 | |
Interest | | | 1,450,583 | |
| | | | |
| | | 139,738,929 | |
| | | | |
EXPENSES: | | | | |
Management fees | | | 50,930,077 | |
Custody and fund accounting fees | | | 825,845 | |
Transfer agent fees | | | 470,724 | |
Professional services | | | 236,832 | |
Shareholder reports | | | 48,992 | |
Registration fees | | | 305,629 | |
Trustees’ fees | | | 280,417 | |
ADR depositary services fees | | | 137,855 | |
Miscellaneous | | | 139,501 | |
| | | | |
| | | 53,375,872 | |
| | | | |
NET INVESTMENT INCOME | | | 86,363,057 | |
| | | | |
REALIZED AND UNREALIZED GAIN (LOSS): | | | | |
Net realized gain (loss) | | | | |
Investments in securities | | | 346,301,893 | |
Futures contracts | | | 33,454,193 | |
Currency forward contracts | | | (3,008,233 | ) |
Foreign currency transactions | | | 341,328 | |
Net change in unrealized appreciation/depreciation | | | | |
Investments in securities (net of change in deferred foreign capital gains tax of $3,859,673) | | | 1,205,872,842 | |
Futures contracts | | | 1,986,445 | |
Currency forward contracts | | | (53,942,290 | ) |
Foreign currency translation | | | 549,796 | |
| | | | |
Net realized and unrealized gain | | | 1,531,555,974 | |
| | | | |
NET CHANGE IN NET ASSETS
FROM OPERATIONS | | $ | 1,617,919,031 | |
| | | | |
| | | | | | | | |
CONSOLIDATED STATEMENT OF CHANGES IN NET ASSETS | |
| | |
| | | Year Ended
December 31, 2017 | | | Year Ended
December 31, 2016 | |
OPERATIONS: | | | | | | | | |
Net investment income | | $ | 86,363,057 | | | $ | 82,670,067 | |
Net realized gain | | | 377,089,181 | | | | 120,320,077 | |
Net change in unrealized appreciation/depreciation | | | 1,154,466,793 | | | | 830,600,421 | |
| | | | | | | | |
| | | 1,617,919,031 | | | | 1,033,590,565 | |
| | | | | | | | |
| | |
DISTRIBUTIONS TO SHAREHOLDERS FROM: | | | | | | | | |
Net investment income | | | (87,312,909 | ) | | | (81,276,853 | ) |
Net realized gain | | | (310,519,938 | ) | | | (116,688,671 | ) |
| | | | | | | | |
Total distributions | | | (397,832,847 | ) | | | (197,965,524 | ) |
| | | | | | | | |
| | |
FUND SHARE
TRANSACTIONS: | | | | | | | | |
Proceeds from sale of shares | | | 2,601,130,740 | | | | 1,117,120,169 | |
Reinvestment of distributions | | | 387,957,885 | | | | 192,513,037 | |
Cost of shares redeemed | | | (1,399,820,312 | ) | | | (751,808,292 | ) |
| | | | | | | | |
Net change from Fund share transactions | | | 1,589,268,313 | | | | 557,824,914 | |
| | | | | | | | |
Total change in net assets | | | 2,809,354,497 | | | | 1,393,449,955 | |
| | |
NET ASSETS: | | | | | | | | |
Beginning of year | | | 7,101,228,637 | | | | 5,707,778,682 | |
| | | | | | | | |
End of year (including undistributed net investment income of $849,242 and $1,478,327, respectively) | | $ | 9,910,583,134 | | | $ | 7,101,228,637 | |
| | | | | | | | |
| | |
SHARE INFORMATION: | | | | | | | | |
Shares sold | | | 195,795,071 | | | | 103,526,092 | |
Distributions reinvested | | | 28,276,808 | | | | 16,029,395 | |
Shares redeemed | | | (105,299,029 | ) | | | (69,004,235 | ) |
| | | | | | | | |
Net change in shares outstanding | | | 118,772,850 | | | | 50,551,252 | |
| | | | | | | | |
| | |
| PAGE 10 § DODGE & COX GLOBAL STOCK FUND | | See accompanying Notes to Consolidated Financial Statements |
NOTES TO CONSOLIDATED FINANCIAL STATEMENTS
NOTE 1—ORGANIZATION AND SIGNIFICANT ACCOUNTING POLICIES
Dodge & Cox Global Stock Fund (the “Fund”) is one of the series constituting the Dodge & Cox Funds (the “Trust” or the “Funds”). The Trust is organized as a Delaware statutory trust and is registered under the Investment Company Act of 1940, as amended, as an open-end management investment company. The Fund commenced operations on May 1, 2008, and seeks long-term growth of principal and income. The Fund invests primarily in a diversified portfolio of U.S. and foreign equity securities. Foreign investing, especially in developing countries, has special risks such as currency and market volatility and political and social instability. These and other risk considerations are discussed in the Fund’s Prospectus.
The financial statements have been prepared in conformity with accounting principles generally accepted in the United States of America, which require the use of estimates and assumptions by management. Actual results may differ from those estimates. Significant accounting policies are as follows:
Security valuation The Fund’s net assets are normally valued as of the scheduled close of trading on the New York Stock Exchange (NYSE), generally 4:00 p.m. Eastern Time, each day that the NYSE is open for business.
Portfolio holdings for which market quotes are readily available are valued at market value. Listed securities for example, are generally valued using the official quoted close price or the last sale on the exchange that is determined to be the primary market for the security. Exchange-traded derivatives are valued at the settlement price determined by the relevant exchange. Short-term securities less than 60 days to maturity may be valued at amortized cost if amortized cost approximates current value. Security values are not discounted based on the size of the Fund’s position and may differ from the value a Fund receives upon sale of the securities. Mutual funds are valued at their respective net asset values.
Investments initially valued in currencies other than the U.S. dollar are converted to the U.S. dollar using prevailing exchange rates. Currency forward contracts are valued based on the prevailing forward exchange rates of the underlying currencies. As a result, the Fund’s net assets may be affected by changes in the value of currencies in relation to the U.S. dollar.
If market quotations are not readily available or if normal valuation procedures produce valuations that are deemed unreliable or inappropriate under the circumstances existing at the time, the investment will be valued at fair value as determined in good faith by or under the direction of the Fund’s Board of Trustees. The Board of Trustees has appointed Dodge & Cox, the Fund’s investment manager, to make fair value determinations in accordance with the Dodge & Cox Funds Valuation Policies (“Valuation Policies”), subject to Board oversight. Dodge & Cox has established a Pricing Committee that is comprised of representatives from Treasury, Legal, Compliance, and Operations. The Pricing Committee is responsible for implementing the Valuation Policies, including determining the fair value of securities and other investments when necessary. The Pricing
Committee considers relevant indications of value that are reasonably available to it in determining the fair value assigned to a particular security, such as the value of similar financial instruments, trading volumes, contractual restrictions on disposition, related corporate actions, and changes in economic conditions. In doing so, the Pricing Committee employs various methods for calibrating fair valuation approaches, including a regular review of key inputs and assumptions, back-testing, and review of any related market activity.
As trading in securities on most foreign exchanges is normally completed before the close of the NYSE, the value of non-U.S. securities can change by the time the Fund calculates its net asset value. To address these changes, the Fund may utilize adjustment factors provided by an independent pricing service to systematically value non-U.S. securities at fair value. These adjustment factors are based on statistical analyses of subsequent movements and changes in U.S. markets and financial instruments trading in U.S. markets that represent foreign securities or baskets of securities.
Valuing securities through a fair value determination involves greater reliance on judgment than valuation of securities based on readily available market quotations. In some instances, lack of information and uncertainty as to the significance of information may lead to a conclusion that a prior valuation is the best indication of a security’s value. When fair value pricing is employed, the prices of securities used by the Fund to calculate its net asset value may differ from quoted or published prices for the same securities.
Security transactions, investment income, expenses, and distributions Security transactions are recorded on the trade date. Realized gains and losses on securities sold are determined on the basis of identified cost.
Dividend income and corporate action transactions are recorded on the ex-dividend date, or when the Fund first learns of the dividend/corporate action if the ex-dividend date has passed. Non-cash dividends, if any, are recorded at the fair market value of the securities received. Dividends characterized as return of capital for U.S. tax purposes are recorded as a reduction of cost of investments and/or realized gain. Interest income is recorded on the accrual basis.
Expenses are recorded on the accrual basis. Some expenses of the Trust can be directly attributed to a specific series. Expenses which cannot be directly attributed are allocated among the Funds in the Trust using methodologies determined by the nature of the expense.
Distributions to shareholders are recorded on the ex-dividend date.
Foreign taxes The Fund is subject to foreign taxes which may be imposed by certain countries in which the Fund invests. The Fund endeavors to record foreign taxes based on applicable foreign tax law. Withholding taxes are incurred on certain foreign dividends and are accrued at the time the associated dividend is recorded. The Fund files withholding tax reclaims in certain jurisdictions to recover a portion of amounts previously withheld. The Fund records a reclaim receivable based on, among other things, a jurisdiction’s legal obligation to pay reclaims as well as
DODGE & COX GLOBAL STOCK FUND §PAGE 11
NOTES TO CONSOLIDATED FINANCIAL STATEMENTS
payment history and market convention. In consideration of recent decisions rendered by European courts, the Fund has filed for additional reclaims related to prior years. A corresponding receivable is established when both the amount is known and significant contingencies or uncertainties regarding collectability are removed. These amounts, if any, are reported in “dividends and interest receivable” in the Consolidated Statement of Assets and Liabilities.
Capital gains taxes are incurred upon disposition of certain foreign securities. Expected capital gains taxes on appreciated securities, if any, are accrued as unrealized losses and incurred capital gains taxes are reflected as realized losses upon the sale of the related security. Currency taxes may be incurred when the Fund purchases certain foreign currencies related to securities transactions and are recorded as realized losses on foreign currency transactions.
Repurchase agreements Repurchase agreements are transactions under which a Fund purchases a security from a dealer counterparty and agrees to resell the security to that counterparty on a specified future date at the same price, plus a specified interest rate. The Fund’s repurchase agreements are secured by U.S. government or agency securities. It is the Fund’s policy that its custodian take possession of the underlying collateral securities, the fair value of which exceeds the principal amount of the repurchase transaction, including accrued interest, at all times. In the event of default by the counterparty, the Fund has the contractual right to liquidate the collateral securities and to apply the proceeds in satisfaction of the obligation.
Foreign currency translation The books and records of the Fund are maintained in U.S. dollars. Foreign currency amounts are translated into U.S. dollars at the prevailing exchange rates of such currencies against the U.S. dollar. The market value of investment securities and other assets and liabilities are translated at the exchange rate as of the valuation date. Purchases and sales of investment securities, income, and expenses are translated at the exchange rate prevailing on the transaction date.
Reported realized and unrealized gain (loss) on investments include foreign currency gain (loss) related to investment transactions.
Reported realized and unrealized gain (loss) on foreign currency transactions and translation include the following: disposing/holding of foreign currency, the difference between the trade and settlement dates on securities transactions, the difference between the accrual and payment dates on dividends, and currency losses on the purchase of foreign currency in certain countries that impose taxes on such transactions.
Consolidation The Fund may invest in certain securities through its wholly owned subsidiary, Dodge & Cox Global Stock Fund Cayman, Ltd. (the “Subsidiary”). The Subsidiary is a Cayman Islands exempted company and invests in certain securities consistent with the investment objective of the Fund. The Fund’s Consolidated Financial Statements, including the Consolidated Portfolio of Investments, consist of the holdings and accounts of the Fund and the Subsidiary. All intercompany transactions and balances have been eliminated. At December 31, 2017, the Subsidiary had net assets of $100, which represented less than 0.01% of the Fund’s consolidated net assets.
Indemnification Under the Trust’s organizational documents, its officers and trustees are indemnified against certain liabilities arising out of the performance of their duties to the Trust. In addition, in the normal course of business the Trust enters into contracts that provide general indemnities to other parties. The Trust’s maximum exposure under these arrangements is unknown as this would involve future claims that may be made against the Trust that have not yet occurred.
NOTE 2—VALUATION MEASUREMENTS
Various inputs are used in determining the value of the Fund’s investments. These inputs are summarized in the three broad levels listed below.
| § | | Level 1: Quoted prices in active markets for identical securities |
| § | | Level 2: Other significant observable inputs (including quoted prices for similar securities, market indices, interest rates, credit risk, forward exchange rates, etc.) |
| § | | Level 3: Significant unobservable inputs (including Fund management’s assumptions in determining the fair value of investments) |
The inputs or methodology used for valuing securities are not necessarily an indication of the risk associated with investing in those securities.
The following is a summary of the inputs used to value the Fund’s holdings at December 31, 2017:
| | | | | | | | |
| Classification(a) | | LEVEL 1
(Quoted Prices) | | | LEVEL 2
(Other Significant
Observable Inputs) | |
Securities | | | | | | | | |
Common Stocks | | | | | | | | |
Consumer Discretionary | | $ | 1,299,288,470 | | | $ | 540,278,334 | |
Consumer Staples | | | 16,261,459 | | | | 117,049,309 | |
Energy | | | 635,846,153 | | | | 26,816,695 | |
Financials | | | 978,483,351 | | | | 1,266,399,504 | |
Health Care | | | 891,730,260 | | | | 1,016,997,115 | |
Industrials | | | 363,187,985 | | | | 83,927,247 | |
Information Technology | | | 1,048,368,871 | | | | 63,491,538 | |
Materials | | | 129,657,915 | | | | 212,198,696 | |
Real Estate | | | — | | | | 55,983,851 | |
Telecommunication Services | | | 121,486,405 | | | | 191,311,213 | |
Preferred Stocks | | | | | | | | |
Energy | | | — | | | | 74,114,705 | |
Financials | | | — | | | | 170,288,380 | |
Information Technology | | | — | | | | 157,539,887 | |
Short-term Investments | | | | | | | | |
Repurchase Agreement | | | — | | | | 490,210,000 | |
Money Market Fund | | | 9,862,910 | | | | — | |
| | | | | | | | |
Total Securities | | $ | 5,494,173,779 | | | $ | 4,466,606,474 | |
| | | | | | | | |
Other Investments | | | | | | | | |
Futures Contracts | | | | | | | | |
Appreciation | | $ | 980,929 | | | $ | — | |
Currency Forward Contracts | | | | | | | | |
Appreciation | | | — | | | | 703,145 | |
Depreciation | | | — | | | | (29,377,646 | ) |
| | | | | | | | | |
| (a) | Transfers during the year between Level 1 and Level 2 relate to the use of systematic fair valuation or when significant observable inputs are used to fair value a specific security. On days when systematic fair valuation is used, securities whose primary market closes before the NYSE are classified as Level 2. There were no Level 3 securities at December 31, 2017 and 2016, and there were no transfers to Level 3 during the year. |
PAGE 12 § DODGE & COX GLOBAL STOCK FUND
NOTES TO CONSOLIDATED FINANCIAL STATEMENTS
NOTE 3—DERIVATIVE INSTRUMENTS
The Fund entered into various transactions involving derivative instruments, including currency forward contracts and futures contracts, in connection with its investment strategy. The Fund may use derivatives to minimize the impact of losses to one or more of its investments (as a ‘‘hedging technique’’) or to implement its investment strategy.
The Fund has entered into over-the-counter derivatives, such as currency forward contracts (each, an ‘‘OTC Derivative’’). Each OTC Derivative is subject to a negotiated master agreement (based on a form published by the International Swaps and Derivatives Association (‘‘ISDA’’)) governing all OTC Derivatives between the Fund and the relevant dealer counterparty. The master agreements specify (i) events of default and other events permitting a party to terminate some or all of the OTC Derivatives thereunder and (ii) the process by which those OTC Derivatives will be valued for purposes of determining termination payments. If some or all of the OTC Derivatives under a master agreement are terminated because of an event of default or similar event, the values of all terminated OTC Derivatives must be netted to determine a single payment owed by one party to the other. To the extent amounts owed to the Fund by its counterparties are not collateralized, the Fund is at risk of those counterparties’ non-performance. The Fund attempts to mitigate counterparty credit risk by entering into OTC Derivatives only with counterparties it believes to be of good credit quality, by exchanging collateral and by monitoring the financial stability of those counterparties.
Futures contracts Futures contracts involve an obligation to purchase or sell (depending on whether the Fund has entered a long or short futures contract, respectively) an asset at a future date, at a price set at the time of the contract. Upon entering into a futures contract, the Fund is required to deposit an amount of cash or liquid assets (referred to as initial margin) in a segregated account with the clearing broker. Subsequent payments (referred to as variation margin) to and from the clearing broker are made on a daily basis based on changes in the market value of futures contracts. Futures contracts are traded publicly and their market value changes daily. Changes in the market value of open futures contracts are recorded as unrealized appreciation or depreciation in the Consolidated Statement of Operations. Realized gains and losses on futures contracts are recorded in the Consolidated Statement of Operations at the closing or expiration of the contracts. Cash deposited with a broker as initial margin is recorded in the Consolidated Statement of Assets and Liabilities. A receivable and/or payable to brokers for daily variation margin is also recorded in the Consolidated Statement of Assets and Liabilities.
Investments in futures contracts may include certain risks, which may be different from, and potentially greater than, those of the underlying securities. To the extent the Fund uses futures, it is exposed to additional volatility and potential losses resulting from leverage.
The Fund has maintained long S&P 500 futures contracts to provide equity exposure that approximates the Fund’s “net cash and other” position, which includes cash, short-term investments,
receivables, and payables. During the year ended December 31, 2017, these S&P 500 futures contracts had notional values ranging from 1% to 6% of net assets.
Currency forward contracts A currency forward contract, an OTC Derivative, represents an obligation to purchase or sell a specific foreign currency at a future date at a price set at the time of the contract. The values of the currency forward contracts are adjusted daily based on the prevailing forward exchange rates of the underlying currencies. Changes in the value of open contracts are recorded as unrealized appreciation or depreciation in the Consolidated Statement of Operations. When the currency forward contract is closed, the Fund records a realized gain or loss in the Consolidated Statement of Operations equal to the difference between the value at the time the contract was opened and the value at the time it was closed.
Losses from these transactions may arise from unfavorable changes in currency values or if the counterparties do not perform under a contract’s terms.
The Fund has maintained currency forward contracts to hedge direct and/or indirect foreign currency exposure to the Chinese yuan renminbi, euro, and Swiss franc. During the year ended December 31, 2017, these currency forward contracts had U.S. dollar total values ranging from 6% to 8% of net assets.
Additional derivative information For financial reporting purposes, the Fund does not offset OTC Derivative assets and liabilities that are subject to a master netting arrangement in the Consolidated Statement of Assets and Liabilities. OTC Derivatives are presented in the Consolidated Statement of Assets and Liabilities as unrealized appreciation/depreciation on currency forward contracts. Cash collateral pledged or received by the Fund for OTC Derivatives are reported gross in the Consolidated Statement of Assets and Liabilities as cash pledged/(received) as collateral for currency forward contracts. Derivative information by counterparty is presented in the Consolidated Portfolio of Investments.
The netting of assets and liabilities and the offsetting of collateral pledged or received are based on contractual netting/set-off provisions in the ISDA master agreement. The following table presents the Fund’s net exposure for OTC Derivatives that are subject to enforceable master netting arrangements as of December 31, 2017. The net amount represents the receivable from (payable to) the counterparty in the event of a default.
| | | | | | | | | | | | | | | | |
| Counterparty | | Gross OTC Derivative Assets | | | Gross OTC Derivative Liabilities | | | Cash Collateral Pledged / (Received)(a) | | | Net Amount | |
Bank of America | | $ | 2,247 | | | $ | (6,383,329 | ) | | $ | 5,840,000 | | | $ | (541,082 | ) |
Barclays | | | 13,455 | | | | — | | | | — | | | | 13,455 | |
Citibank | | | 145,127 | | | | (5,628,489 | ) | | | — | | | | (5,483,362 | ) |
Credit Suisse | | | — | | | | (407,433 | ) | | | — | | | | (407,433 | ) |
Goldman Sachs | | | 280,777 | | | | (2,704,126 | ) | | | 1,880,000 | | | | (543,349 | ) |
HSBC | | | — | | | | (1,867,221 | ) | | | 1,680,000 | | | | (187,221 | ) |
JPMorgan | | | 261,539 | | | | (11,579,099 | ) | | | 10,740,000 | | | | (577,560 | ) |
UBS | | | — | | | | (807,949 | ) | | | 640,000 | | | | (167,949 | ) |
| | | | | | | | | | | | | | | | |
Total | | $ | 703,145 | | | $ | (29,377,646 | ) | | $ | 20,780,000 | | | $ | (7,894,501 | ) |
| | | | | | | | | | | | | | | | |
| | | | | | | | | | | | | | | | | |
| (a) | Cash collateral pledged/(received) in excess of OTC Derivative assets/liabilities, if any, is not presented. Total cash collateral pledged/(received) is presented in the Fund’s Consolidated Statement of Assets and Liabilities. |
DODGE & COX GLOBAL STOCK FUND §PAGE 13
NOTES TO CONSOLIDATED FINANCIAL STATEMENTS
NOTE 4—RELATED PARTY TRANSACTIONS
Management fees Under a written agreement approved by a unanimous vote of the Board of Trustees, the Fund pays a management fee monthly at an annual rate of 0.60% of the Fund’s average daily net assets to Dodge & Cox, investment manager of the Fund.
Fund officers and trustees All officers and two of the trustees of the Trust are officers or employees of Dodge & Cox. The Trust pays a fee only to those trustees who are not affiliated with Dodge & Cox.
NOTE 5—INCOME TAX INFORMATION AND DISTRIBUTIONS TO SHAREHOLDERS
A provision for federal income taxes is not required since the Fund intends to qualify as a regulated investment company under Subchapter M of the Internal Revenue Code and distribute all of its taxable income to shareholders. Distributions are determined in accordance with income tax regulations, and such amounts may differ from net investment income and realized gains for financial reporting purposes. Financial reporting records are adjusted for permanent book to tax differences at year end to reflect tax character.
Book to tax differences are primarily due to differing treatments of wash sales, net short-term realized gain (loss), foreign currency realized gain (loss), and derivatives. At December 31, 2017, the cost of investments in securities and derivatives for federal income tax purposes was $7,615,022,477.
Distributions during the years noted below were characterized as follows for federal income tax purposes:
| | | | | | | | |
| | | Year Ended December 31, 2017 | | | Year Ended December 31, 2016 | |
Ordinary income | | $ | 133,923,724 | | | $ | 113,206,589 | |
| | ($ | 0.204 per share | ) | | ($ | 0.195 per share | ) |
Long-term capital gain | | $ | 263,909,123 | | | $ | 84,758,935 | |
| | ($ | 0.402 per share | ) | | ($ | 0.146 per share | ) |
At December 31, 2017, the tax basis components of distributable earnings were as follows:
| | | | |
Unrealized appreciation | | $ | 2,630,762,579 | |
Unrealized depreciation | | | (312,698,375 | ) |
| | | | |
Net unrealized appreciation | | | 2,318,064,204 | |
Undistributed ordinary income | | | 849,242 | |
Undistributed long-term capital gain | | | 106,100,637 | |
Deferred loss(a) | | | (399,262 | ) |
| | | | | |
| (a) | Represents capital loss incurred between November 1, 2017 and December 31, 2017. As permitted by tax regulation, the Fund has elected to treat this loss as arising in 2018. |
Fund management has reviewed the tax positions for open periods (three years and four years, respectively, from filing the Fund’s Federal and State tax returns) as applicable to the Fund, and has determined that no provision for income tax is required in the Fund’s financial statements.
NOTE 6—LOAN FACILITIES
Pursuant to an exemptive order issued by the Securities and Exchange Commission (SEC), the Fund may participate in an interfund lending facility (Facility). The Facility allows the Fund to borrow money from or loan money to the Funds. Loans under the Facility are made for temporary or emergency purposes, such as to fund shareholder redemption requests. Interest on borrowings is the average of the current repurchase agreement rate and the bank loan rate. There was no activity in the Facility during the year.
All Funds in the Trust participate in a $500 million committed credit facility (Line of Credit) with State Street Bank and Trust Company, to be utilized for temporary or emergency purposes to fund shareholder redemptions or for other short-term liquidity purposes. The maximum amount available to the Fund is $250 million. Each Fund pays an annual commitment fee on its pro-rata portion of the Line of Credit. For the year ended December 31, 2017, the Fund’s commitment fee amounted to $55,344 and is reflected as a Miscellaneous Expense in the Consolidated Statement of Operations. Interest on borrowings is charged at the prevailing rate. There were no borrowings on the Line of Credit during the year.
NOTE 7—PURCHASES AND SALES OF INVESTMENTS
For the year ended December 31, 2017, purchases and sales of securities, other than short-term securities, aggregated $2,432,146,446 and $1,441,463,461, respectively.
NOTE 8—SUBSEQUENT EVENTS
Fund management has determined that no material events or transactions occurred subsequent to December 31, 2017, and through the date of the Fund’s financial statements issuance, which require additional disclosure in the Fund’s financial statements.
PAGE 14 § DODGE & COX GLOBAL STOCK FUND
CONSOLIDATED FINANCIAL HIGHLIGHTS
| | | | | | | | | | | | | | | | | | | | |
SELECTED DATA AND RATIOS (for a share outstanding throughout each year) | | Year Ended December 31, | |
| | | 2017 | | | 2016 | | | 2015 | | | 2014 | | | 2013 | |
| | | | |
Net asset value, beginning of year | | | $11.91 | | | | $10.46 | | | | $11.83 | | | | $11.48 | | | | $8.99 | |
Income from investment operations: | | | | | | | | | | | | | | | | | | | | |
Net investment income | | | 0.13 | | | | 0.14 | | | | 0.16 | | | | 0.16 | | | | 0.16 | |
Net realized and unrealized gain (loss) | | | 2.42 | | | | 1.65 | | | | (1.11 | ) | | | 0.64 | | | | 2.81 | |
| | | | |
Total from investment operations | | | 2.55 | | | | 1.79 | | | | (0.95 | ) | | | 0.80 | | | | 2.97 | |
| | | | |
Distributions to shareholders from: | | | | | | | | | | | | | | | | | | | | |
Net investment income | | | (0.13 | ) | | | (0.14 | ) | | | (0.19 | ) | | | (0.15 | ) | | | (0.16 | ) |
Net realized gain | | | (0.47 | ) | | | (0.20 | ) | | | (0.23 | ) | | | (0.30 | ) | | | (0.32 | ) |
| | | | |
Total distributions | | | (0.60 | ) | | | (0.34 | ) | | | (0.42 | ) | | | (0.45 | ) | | | (0.48 | ) |
| | | | |
Net asset value, end of year | | | $13.86 | | | | $11.91 | | | | $10.46 | | | | $11.83 | | | | $11.48 | |
| | | | |
Total return | | | 21.51 | % | | | 17.09 | % | | | (8.05 | )% | | | 6.95 | % | | | 33.17 | % |
Ratios/supplemental data: | | | | | | | | | | | | | | | | | | | | |
Net assets, end of year (millions) | | | $9,911 | | | | $7,101 | | | | $5,708 | | | | $5,895 | | | | $3,924 | |
Ratios of expenses to average net assets | | | 0.63 | % | | | 0.63 | % | | | 0.63 | % | | | 0.65 | % | | | 0.65 | % |
Ratios of net investment income to average net assets | | | 1.02 | % | | | 1.36 | % | | | 1.39 | % | | | 1.42 | % | | | 1.58 | % |
Portfolio turnover rate | | | 18 | % | | | 25 | % | | | 20 | % | | | 17 | % | | | 24 | % |
See accompanying Notes to Consolidated Financial Statements
DODGE & COX GLOBAL STOCK FUND §PAGE 15
REPORT OF INDEPENDENT REGISTERED PUBLIC ACCOUNTING FIRM
To the Board of Trustees of the Dodge & Cox Funds and Shareholders of Dodge & Cox Global Stock Fund
Opinion on the Financial Statements
We have audited the accompanying consolidated statement of assets and liabilities, including the consolidated portfolio of investments, of Dodge & Cox Global Stock Fund (one of the funds constituting Dodge & Cox Funds, referred to hereafter as the “Fund”) as of December 31, 2017, the related consolidated statement of operations for the year ended December 31, 2017, the consolidated statement of changes in net assets for each of the two years in the period ended December 31, 2017, including the related notes, and the consolidated financial highlights for each of the five years in the period ended December 31, 2017 (collectively referred to as the “consolidated financial statements”). In our opinion, the consolidated financial statements present fairly, in all material respects, the financial position of the Fund as of December 31, 2017, the results of their operations for the year then ended, the changes in their net assets for each of the two years in the period ended December 31, 2017 and the financial highlights for each of the five years in the period ended December 31, 2017 in conformity with accounting principles generally accepted in the United States of America.
Basis for Opinion
These consolidated financial statements are the responsibility of the Fund’s management. Our responsibility is to express an opinion on the Fund’s consolidated financial statements based on our audits. We are a public accounting firm registered with the Public Company Accounting Oversight Board (United States) (“PCAOB”) and are required to be independent with respect to the Fund in accordance with the U.S. federal securities laws and the applicable rules and regulations of the Securities and Exchange Commission and the PCAOB.
We conducted our audits of these consolidated financial statements in accordance with the standards of the PCAOB. Those standards require that we plan and perform the audit to obtain reasonable assurance about whether the consolidated financial statements are free of material misstatement, whether due to error or fraud.
Our audits included performing procedures to assess the risks of material misstatement of the consolidated financial statements, whether due to error or fraud, and performing procedures that respond to those risks. Such procedures included examining, on a test basis, evidence regarding the amounts and disclosures in the consolidated financial statements. Our audits also included evaluating the accounting principles used and significant estimates made by management, as well as evaluating the overall presentation of the consolidated financial statements. Our procedures included confirmation of securities owned as of December 31, 2017 by correspondence with the custodian, transfer agent and brokers; when replies were not received from brokers, we performed other auditing procedures. We believe that our audits provide a reasonable basis for our opinion.
PricewaterhouseCoopers LLP
San Francisco, California
February 16, 2018
We have served as the auditor of one or more investment companies in the Dodge & Cox Funds since 1931.
PAGE 16 § DODGE & COX GLOBAL STOCK FUND
SPECIAL 2017 TAX INFORMATION
(unaudited)
The following information is provided pursuant to provisions of the Internal Revenue Code:
In 2017, the Fund elected to pass through to shareholders foreign source income of $98,938,255 and foreign taxes paid of $8,481,846.
The Fund designates $138,777,119 of its distributions paid to shareholders in 2017 as qualified dividends (treated for federal income tax purposes in the hands of shareholders as taxable at a maximum rate of 20%).
For shareholders that are corporations, the Fund designates 38% of its ordinary dividends paid to shareholders in 2017 as dividends from domestic corporations eligible for the corporate dividends received deduction, provided that the shareholder otherwise satisfies applicable requirements to claim that deduction.
BOARD APPROVAL OF FUNDS’ INVESTMENT MANAGEMENT AGREEMENTS AND MANAGEMENT FEES
(unaudited)
The Board of Trustees is responsible for overseeing the performance of the Dodge & Cox Funds’ investment manager and determining whether to continue the Investment Management Agreements between the Funds and Dodge & Cox each year (the “Agreements”). At a meeting of the Board of Trustees of the Trust held on December 14, 2017, the Trustees, by a unanimous vote (including a separate vote of those Trustees who are not “interested persons” (as defined in the Investment Company Act of 1940) (the “Independent Trustees”)), approved the renewal of the Agreements for an additional one-year term through December 31, 2018 with respect to each Fund. During the course of the year, the Board received extensive information and materials relating to the investment management and administrative services provided by Dodge & Cox and the performance of each of the Funds.
INFORMATION RECEIVED
In 2016 and 2017, the Board requested, received, and discussed a number of special presentations on topics relevant to their consideration of the proposed renewal of the Funds’ Agreements. In addition to the foregoing and in advance of the meetings referred to below, the Board, including the Independent Trustees, requested, received, and reviewed materials relating to the Agreements and the services provided by Dodge & Cox. The Independent Trustees retained Morningstar to prepare an independent expense and performance summary for each Fund and comparable funds managed by other advisers identified by Morningstar. The Morningstar materials included information regarding advisory fee rates, expense ratios, and transfer agency, custodial, and distribution expenses, as well as performance comparisons to each Fund’s peer group and to a broad-based securities index or combination of indices. The Morningstar materials also included a comparison of expenses of various share classes offered by comparable funds. The materials reviewed by the Board contained information concerning, among other things,
Dodge & Cox’s profitability, financial results and condition, advisory fee revenue, and separate account fee schedules. The Board additionally considered the Funds’ brokerage commissions, turnover rates, sales and redemption data, and the significant investment that Dodge & Cox makes in research used in managing the Funds. The Board received and reviewed memoranda and related materials addressing, among other things, Dodge & Cox’s services to the Funds; how Dodge & Cox Funds’ fees compare to fees of peer group funds; the different fees, services, costs, and risks associated with other accounts managed by Dodge & Cox as compared to the Dodge & Cox Funds; and the ways in which the Funds realize economies of scale. Throughout the process of reviewing the services provided by Dodge & Cox and preparing for the meeting, the Independent Trustees found Dodge & Cox to be open, forthright, detailed, and very helpful in answering questions about all issues. The Board received copies of the Agreements and a memorandum from the independent legal counsel to the Independent Trustees discussing the factors generally regarded as appropriate to consider in evaluating advisory arrangements. The Trust’s Contract Review Committee, consisting solely of Independent Trustees, met with the independent legal counsel on November 9, 2017 and again on December 14, 2017 to discuss whether to renew the Agreements. The Board, including the Independent Trustees, subsequently concluded that the existing Agreements are fair and reasonable and voted to approve the Agreements. In considering the Agreements, the Board, including the Independent Trustees, did not identify any single factor or particular information as all-important or controlling. In reaching the decision to approve the Agreements, the Board considered several factors, discussed below, to be key factors and reached the conclusions described below.
NATURE, QUALITY, AND EXTENT OF THE SERVICES
The Board considered that Dodge & Cox provides a wide range of services to the Funds in addition to portfolio management. The extensive nature of services provided by Dodge & Cox has been documented in materials provided to the Board and in presentations made to the Board throughout the year. In particular, the Board considered the nature, quality, and extent of portfolio management, administrative, and shareholder services performed by Dodge & Cox. With regard to portfolio management services, the Board considered Dodge & Cox’s established long-term history of care and conscientiousness in the management of the Funds; its demonstrated consistency in investment approach and depth; the background and experience of the Dodge & Cox U.S. Equity Investment Committee, International Equity Investment Committee, Global Equity Investment Committee, U.S. Fixed Income Investment Committee, and Global Fixed Income Investment Committee, and research analysts responsible for managing the Funds; Dodge & Cox’s methods for assessing the regulatory and investment climate in various jurisdictions; its overall high level of attention to its core investment management function; and its commitment to the Funds and their shareholders. The Board also considered analysis provided by Morningstar regarding the degree of active management in the Dodge & Cox
DODGE & COX GLOBAL STOCK FUND §PAGE 17
equity funds and concluded that Dodge & Cox is an active, high conviction manager of equity portfolios, not a “closet index” manager.
In the area of administrative and shareholder services, the Board considered the quality of Dodge & Cox’s work in areas such as compliance, legal services, trading, operations, proxy voting, technology, oversight of the Funds’ transfer agent and custodian/fund accounting agent, tax compliance, risk management, shareholder support, and shareholder communication through its website and other means. The Board also noted Dodge & Cox’s disclosure policy, its compliance record, and its reputation as a trusted, shareholder-friendly mutual fund family.
In addition, the Board considered that Dodge & Cox manages approximately $200 billion in Fund assets with fewer professionals than most comparable funds, and that on average these professionals have more experience and longer tenure than investment professionals at comparable funds. The Board also noted that Dodge & Cox is an investment research-oriented firm with no other business endeavors to distract management’s attention from its research efforts or to present material conflicts of interest with the operations of the Funds, that its investment professionals adhere to a consistent investment approach across the Funds, and that due to its careful and deliberate strategy with respect to new products, Dodge & Cox has had remarkable stability in its mutual fund product offerings over the course of the past 87 years and has the fewest funds of any of the 25 largest mutual fund families by assets. The Board further considered the “Gold” analyst rating awarded by Morningstar to all of the Funds (other than the Global Bond Fund). The Board concluded that it was satisfied with the nature, extent, and quality of investment management and other services provided to the Funds by Dodge & Cox.
INVESTMENT PERFORMANCE
The Board considered short-term and long-term investment performance for each Fund (including periods of outperformance or underperformance) as compared to both relevant indices and the performance of such Fund’s peer group. In assessing the performance of the Funds, the Board considered the Funds’ investment returns over various periods and the volatility thereof and concluded that the levels experienced were consistent with Dodge & Cox’s long-term approach and active investment style. The Board determined after extensive review and inquiry that Dodge & Cox’s historic, long-term, team-oriented, bottom-up investment approach remains consistent and that Dodge & Cox continues to be distinguished by its integrity, transparency, and independence. The Board considered that the performance of the Funds is the result of a value-oriented investment management process that emphasizes a long-term investment horizon, comprehensive independent research, a team approach, price discipline, low cost, and low portfolio turnover. The Board also considered that the investment performance delivered by Dodge & Cox to the Funds appeared to be consistent with the relevant performance delivered for other clients of Dodge & Cox. The Board concluded that Dodge & Cox has delivered favorable
long-term performance for Fund investors consistent with the long-term investment strategies being pursued by the Funds.
COSTS AND ANCILLARY BENEFITS
Costs of Services to Funds: Fees and Expenses. The Board considered each Fund’s management fee rate and expense ratio relative to each Fund’s peer group and relative to management fees charged by Dodge & Cox to other clients. In particular, the Board considered that the Funds continue to be below their peer group median in expense ratios and that many media and industry reports specifically comment on the low cost of the Funds, which have been a defining characteristic of the Funds for many years. The Board also evaluated the operating structures of the Funds and Dodge & Cox, noting that the Funds do not charge front-end sales commissions or distribution fees, and Dodge & Cox bears, among other things, the significant cost of third party research, reimbursement for shareholder recordkeeping and administrative costs to third-party retirement plan administrators, and administrative and office overhead. The Board noted that expenses are well below industry averages.
When compared to peer group funds, the Funds are in the quartile with the lowest expense ratios. The Board also considered that the Funds receive numerous administrative, regulatory compliance, legal, operational, technology, tax compliance, risk management, and shareholder support services from Dodge & Cox without any additional administrative fee and that the Funds have relatively low transaction costs and portfolio turnover rates. The Board noted the Funds’ unusual single-share-class structure and reviewed Morningstar data (including asset-weighted average expense ratios) showing that the few peer group funds with lower expense ratios often have other share classes with significantly higher expense ratios than the Funds’. In this regard, the Board considered that many of the Funds’ shareholders would not be eligible to purchase comparably priced shares of many peer group funds, which typically make their lower-priced share classes available only to institutional investors. The Board determined that the Funds provide access for small investors to high quality investment management at a relatively low cost. The Board also considered that the Funds are priced to scale, i.e., management fee rates begin at relatively low levels with the result that, even without breakpoints, the Funds’ management fee rates are lower than those of many peer funds whose fee schedules include breakpoints. With respect to non-U.S. funds sponsored and managed by Dodge & Cox that are comparable to the Funds in many respects, the Board noted that the fee rates charged by Dodge & Cox are the same as or higher than the fee rates charged to the Funds.
The Board reviewed information regarding the fee rates Dodge & Cox charges to separate accounts that have investment programs similar to those of the Funds, including instances where separate account fees are lower than Fund fees. The Board considered the significant differences in the nature and scope of services Dodge & Cox provides to the Funds as compared to other client accounts, as well as material differences in regulatory, litigation, and other risks as between Dodge & Cox Funds and
PAGE 18 § DODGE & COX GLOBAL STOCK FUND
other types of clients. The Board noted that different markets exist for mutual fund and institutional separate account management services and that a comparison of Fund fee rates and separate account fee rates must consider the fact that separate account clients bear additional costs and responsibilities that are included in the cost of a Fund. The Board further noted that many sophisticated institutional investors in the Funds that are eligible to open separate accounts at Dodge & Cox have decided for various reasons to invest in the Funds. After consideration of these matters, the Board concluded that the overall costs incurred by the Funds for the services they receive (including the management fee paid to Dodge & Cox) are reasonable and that the fees are acceptable based upon the qualifications, experience, reputation, and performance of Dodge & Cox and the low overall expense ratios of the Funds.
Profitability and Costs of Services to Dodge & Cox; “Fall-out” Benefits. The Board reviewed reports of Dodge & Cox’s financial position, profitability, and estimated overall value and considered Dodge & Cox’s overall profitability within its context as a private, employee-owned S-Corporation and relative to the favorable services provided. The Board noted in particular that Dodge & Cox’s profits are not generated by high fee rates, but reflect an extraordinarily streamlined, efficient, and focused business approach toward investment management.
The Board recognized the importance of Dodge & Cox’s profitability—which is derived solely from management fees and does not include other business ventures—to maintain its independence, stability, company culture and ethics, and management continuity. The Board also considered that the compensation/profit structure at Dodge & Cox includes a return on shareholder employees’ investment in the firm, which is vital for remaining independent and facilitating retention of management and investment professionals. The Board also considered that in January 2015, Dodge & Cox closed the International Stock Fund to new investors to proactively manage the growth of the Fund. The Stock Fund and Balanced Fund were similarly closed to new investors during periods of significant growth in the past. While these actions are intended to benefit existing Fund shareholders, the effect is to reduce potential revenues to Dodge & Cox from new shareholders.
The Board also considered potential “fall-out” benefits (including the receipt of research from unaffiliated brokers and reputational benefits to non-U.S. funds sponsored and managed by Dodge & Cox) that Dodge & Cox might receive as a result of its association with the Funds and determined that they are acceptable. The Board also noted that Dodge & Cox continues to invest substantial sums in its business in order to provide enhanced services, systems, and research capabilities, all of which benefit the Funds. The Board concluded that Dodge & Cox’s profitability is the keystone of its independence, stability, and long-term investment performance and that the profitability of Dodge & Cox’s relationship with the Funds (including fall-out benefits) is fair and reasonable.
ECONOMIES OF SCALE
The Board considered whether there have been economies of scale with respect to the management of each Fund, whether the Funds have appropriately benefited from any economies of scale, and whether the management fee rate is reasonable in relation to the level of Fund assets and any economies of scale that may exist. In the Board’s view, any consideration of economies of scale must take account of the Funds’ low fee and expense structure and of the fact that each Fund’s shareholders have benefited from the Fund’s relatively low fee structure from the time of each Fund’s inception (i.e., from the first dollar). An assessment of economies of scale must also take into account that Dodge & Cox invests significant time and resources in each new Fund for months (and sometimes years) prior to launch; in addition, in a Fund’s early periods of operations, expenses are capped, which means that Dodge & Cox subsidizes the operations of a new Fund for a period of time until it reaches scale. The Board also observed that, while total Fund assets have grown significantly over the long term, this growth has not been continuous or evenly distributed across all of the Funds (for example, the total assets of the Balanced Fund have actually declined over the past ten years).
In addition, the Board noted that Dodge & Cox has shared the benefits of economies of scale with the Funds by adding and enhancing services to the Funds over time, and that Dodge & Cox’s internal costs of providing investment management, technology, administrative, legal, and compliance services to the Funds continue to increase. For example, Dodge & Cox has increased its global research staff and investment resources over the years to add important new capabilities for the benefit of Fund shareholders and to address the increased complexity of investing in multinational and non-U.S. companies. In addition, Dodge & Cox has made substantial expenditures in other staff, technology, and infrastructure to enable it to integrate credit and equity analyses and to implement its strategy in a more effective and secure manner. Over the last ten years, Dodge & Cox has increased its spending on research, investment management, client servicing, cybersecurity, technology, third party research, data services, and computer systems for trading, operations, compliance, accounting, and communications at a rate that has significantly outpaced the Funds’ growth rate during the same period. The Board considered that Dodge & Cox has a history of voluntarily limiting asset growth in several Funds that experienced significant inflows by closing them to new investors in order to protect the Funds’ ability to achieve good investment returns for shareholders. The Board also observed that, even without fee breakpoints, the Funds are competitively priced in a very competitive market and that having a low fee from inception is better for shareholders than starting with a higher fee and adding breakpoints. The Board also noted that there are certain diseconomies of scale associated with managing large funds, insofar as certain of the costs and risks associated with portfolio management increase as assets grow. The Board concluded that the current Dodge & Cox fee structure is fair and reasonable and adequately shares economies of scale that may exist.
DODGE & COX GLOBAL STOCK FUND §PAGE 19
CONCLUSION
Based on their evaluation of all material factors and assisted by the advice of independent legal counsel to the Independent Trustees, the Board, including the Independent Trustees, concluded that the advisory fee structure was fair and reasonable, that each Fund was paying a competitive fee for the services provided, that Dodge & Cox’s services have provided value for Fund shareholders over the long term, and that approval of the Agreements was in the best interests of each Fund and its shareholders.
PAGE 20 § DODGE & COX GLOBAL STOCK FUND
FUND HOLDINGS
The Fund provides a complete list of its holdings four times each fiscal year, as of the end of each quarter. The Fund files the lists with the Securities and Exchange Commission (SEC) on Form N-CSR (second and fourth quarters) and Form N-Q (first and third quarters). Shareholders may view the Fund’s Forms N-CSR and N-Q on the SEC’s website at sec.gov. Forms N-CSR and N-Q may also be reviewed and copied at the SEC’s Public Reference Room in Washington, DC. Information regarding the operations of the Public Reference Room may be obtained by calling 800-SEC-0330. A list of the Fund’s quarter-end holdings is also available at dodgeandcox.com on or about 15 days following each quarter end and remains available on the website until the list is updated in the subsequent quarter.
PROXY VOTING
For a free copy of the Fund’s proxy voting policies and procedures, please call 800-621-3979, visit the Fund’s website at dodgeandcox.com, or visit the SEC’s website at sec.gov. Information regarding how the Fund voted proxies relating to portfolio securities during the most recent 12-month period ending June 30 is also available at dodgeandcox.com or at sec.gov.
HOUSEHOLD MAILINGS
The Fund routinely mails shareholder reports and summary prospectuses to shareholders and, on occasion, proxy statements. In order to reduce the volume of mail, when possible, only one copy of these documents will be sent to shareholders who are part of the same family and share the same residential address.
If you have a direct account with the Funds and you do not want the mailing of shareholder reports and summary prospectuses combined with other members in your household, contact the Funds at 800-621-3979. Your request will be implemented within 30 days.
DODGE & COX GLOBAL STOCK FUND §PAGE 21
[THIS PAGE INTENTIONALLY LEFT BLANK]
PAGE 22 § DODGE & COX GLOBAL STOCK FUND
DODGE & COX FUNDS—EXECUTIVE OFFICER & TRUSTEE INFORMATION
| | | | | | |
Name (Age) and
Address* | | Position with Trust (Year of Election or
Appointment) | | Principal Occupation During Past 5 Years | | Other Directorships Held by Trustees |
| INTERESTED TRUSTEES AND EXECUTIVE OFFICERS |
| Charles F. Pohl (59) | | Chairman and Trustee (Since 2014) | | Chairman (since 2013) and Director of Dodge & Cox; Chief Investment Officer, member of U.S. Equity Investment Committee (USEIC), Global Equity Investment Committee (GEIC), International Equity Investment Committee (IEIC), and U.S. Fixed Income Investment Committee (USFIIC), Portfolio Manager, and Investment Analyst; Co-President (2011-2013) | | — |
| Dana M. Emery (56) | | President and Trustee (Trustee since 1993) (President since 2014) | | Chief Executive Officer (since 2013), President, and Director of Dodge & Cox; Director of Fixed Income and member of USFIIC and Global Fixed Income Investment Committee (GFIIC); Co-President (2011-2013) | | — |
| Diana S. Strandberg (58) | | Senior Vice President (Since 2006) | | Senior Vice President and Director of Dodge & Cox; Director of International Equity and member of USEIC, GEIC, IEIC and GFIIC; Portfolio Manager and Investment Analyst | | — |
Roberta R.W. Kameda (57) | | Secretary (Since 2017) | | Vice President, General Counsel, and Secretary (since 2017) of Dodge & Cox | | — |
| David H. Longhurst (60) | | Treasurer (Since 2006) | | Vice President and Assistant Treasurer of Dodge & Cox | | — |
| Katherine M. Primas (43) | | Chief Compliance Officer (Since 2010) | | Vice President and Chief Compliance Officer of Dodge & Cox | | — |
| INDEPENDENT TRUSTEES |
| Caroline M. Hoxby (51) | | Trustee (Since 2017) | | Professor of Economics, Stanford University; Director of the Economics of Education Program, National Bureau of Economic Research; Senior Fellow, Hoover Institution and Stanford Institute for Economic Policy Research | | — |
| Thomas A. Larsen (68) | | Trustee (Since 2002) | | Senior Counsel of Arnold & Porter (law firm) (since 2013); Partner of Arnold & Porter (until 2012); Director of Howard, Rice, Nemerovski, Canady, Falk & Rabkin (1977-2011) | | — |
| Ann Mather (57) | | Trustee (Since 2011) | | CFO, Pixar Animation Studios (1999-2004) | | Director, Alphabet Inc. (internet information services) (since 2005); Director, Glu Mobile, Inc. (multimedia software) (since 2004); Director, Netflix, Inc. (internet television) (since 2010); Director, Arista Networks (cloud networking) (since 2013); Director, Shutterfly, Inc. (internet photography services/publishing) (since 2013) |
| Robert B. Morris III (65) | | Trustee (Since 2011) | | Advisory Director, The Presidio Group (2005-2016); Partner and Managing Director—Global Investment Research at Goldman Sachs (until 2001) | | — |
| Gary Roughead (66) | | Trustee (Since 2013) | | Robert and Marion Oster Distinguished Military Fellow, Hoover Institution (since 2012); Admiral, United States Navy (Ret.); U.S. Navy Chief of Naval Operations (2008-2011) | | Director, Northrop Grumman Corp. (global security) (since 2012); Director, Maersk Line, Limited (shipping and transportation) (since 2016) |
| Mark E. Smith (66) | | Trustee (Since 2014) | | Executive Vice President, Managing Director—Fixed Income at Loomis Sayles & Company, L.P. (2003-2011) | | — |
| John B. Taylor (71) | | Trustee (Since 2005) (and 1995-2001) | | Professor of Economics, Stanford University (since 1984); Senior Fellow, Hoover Institution (since 1996); Under Secretary for International Affairs, United States Treasury (2001-2005) | | — |
| * | | The address for each Officer and Trustee is 555 California Street, 40th Floor, San Francisco, California 94104. Each Officer and Trustee oversees all six series in the Dodge & Cox Funds complex and serves for an indefinite term. |
Additional information about the Trust’s Trustees and Officers is available in the Trust’s Statement of Additional Information (SAI). You can get a free copy of the SAI by visiting the Funds’ website at dodgeandcox.com or calling 800-621-3979.
DODGE & COX GLOBAL STOCK FUND §PAGE 23
dodgeandcox.com
For Fund literature, transactions, and account information, please visit the Funds’ website.
or write or call:
DODGE & COX FUNDS
c/o DST Asset Manager Solutions, Inc.
P.O. Box 8422
Boston, Massachusetts 02266-8422
(800) 621-3979
INVESTMENT MANAGER
Dodge & Cox
555 California Street, 40th Floor
San Francisco, California 94104
(415) 981-1710
This report is submitted for the general information of the shareholders of the Fund. The report is not authorized for distribution to prospective investors in the Fund unless it is accompanied by a current prospectus.
This report reflects our views, opinions, and portfolio holdings as of December 31, 2017, the end of the reporting period. Any such views are subject to change at any time based upon market or other conditions and Dodge & Cox disclaims any responsibility to update such views. These views may not be relied on as investment advice and, because investment decisions for a Dodge & Cox Fund are based on numerous factors, may not be relied on as an indication of trading intent on behalf of any Dodge & Cox Fund.
DODGE & COX FUNDS®
Annual Report
December 31, 2017
International Stock Fund
ESTABLISHED 2001
TICKER: DODFX
(Closed to New Investors)
12/17 ISF AR Printed on recycled paper
TO OUR SHAREHOLDERS
The Dodge & Cox International Stock Fund had a total return of 23.9% for the year ended December 31, 2017, compared to a return of 25.0% for the MSCI EAFE (Europe, Australasia, Far East) Index.
MARKET COMMENTARY
Global equity markets delivered exceptionally strong performance in 2017. Every sector of the MSCI EAFE posted double-digit positive returns. Information Technology (up 39%) and Materials (up 34%) were the best-performing sectors of the MSCI EAFE, while the worst performers—Telecommunication Services (up 13%) and Health Care (up 17%)—still registered substantial gains.
Over the past decade, U.S. equity markets largely outperformed international markets because of higher U.S. corporate earnings growth, valuation expansion, and U.S. dollar appreciation that diminished international returns as measured in U.S. dollars. However, this trend reversed in 2017, as international equities outperformed U.S. markets: the MSCI Emerging Markets Index was up 37% and the MSCI EAFE increased 25%, while the S&P 500 Index rose nearly 22%. International equities benefited recently from increased earnings growth and a weaker U.S. dollar.
The valuation differential between U.S. equities and international markets continues to be wide. At year end, the MSCI EAFE traded at 15 times forward estimated earnings and the MSCI Emerging Markets traded at 13 times, compared to 20 times for the S&P 500.(a)
INVESTMENT STRATEGY: FINDING OPPORTUNITIES IN HEALTH CARE AND ENERGY
Dodge & Cox employs a long-term, valuation-oriented investment approach. We analyze each company using a three- to five-year time horizon. We concentrate our research on how a company’s fundamentals—the strength of the business franchise, its growth prospects, competitive positioning, and earnings power—could evolve over time. We then compare those fundamentals to the current valuation to identify potential price disparities.
Experience has taught us that share prices fluctuate more in the short term than underlying fundamentals. Those fluctuations provide us the opportunity to buy, sell, and adjust individual portfolio holdings. During 2017, we shifted away from areas of the market that performed very well and where valuations expanded, trimming selected holdings in the Financials and Information Technology sectors, as well as in Japan. We also reduced the Fund’s weighting in Chinese internet holdings, which were highlighted in our last letter for their excellent growth prospects. Our view of their fundamentals has not changed, but rising valuations led us to trim Tencent (through Naspers), JD.com, and Baidu; in addition, we sold 58.com.(b) We reinvested most of the proceeds into the Health Care and Energy sectors, where valuations are more appealing.
Health Care
Pharmaceutical companies, which comprise the majority of the investable Health Care sector, are an attractive area of the international market at 16 times forward earnings. Many of these companies are stable businesses with strong balance sheets and have growth potential from both new discoveries and expansion into emerging markets. In comparison, Consumer Staples, a large
underweight for the Fund, has some similar characteristics yet trades at 20 times forward earnings.
The Pharmaceuticals industry does face some challenges. For many companies, the United States is the largest market by revenue and earnings. As a result of industry consolidation and higher market shares, U.S. pharmacy benefit managers continue to exert increased pricing pressure on drug manufacturers. We have incorporated these risks into our analysis, but we believe current valuations help mitigate the downside potential of these investments. During 2017, we added to all of the Fund’s Health Care holdings. At year end, Health Care represented 15.5% of the Fund, compared to 10.1% for the MSCI EAFE.
GlaxoSmithKline
The Fund recently re-established a position in GlaxoSmithKline, after selling it in 2015. Based in the United Kingdom, the company has leading therapeutic franchises in respiratory care and HIV. In addition to its traditional pharmaceuticals business, the company is diversified through strong and growing businesses in vaccines and over-the-counter consumer health.
In 2015, we sold GlaxoSmithKline based on market headwinds and a higher valuation. The company’s pharmaceuticals business was suffering from pricing pressure on a key respiratory drug, Advair, and the pipeline of new drug launches was weak. The valuation, at 20 times forward earnings, was relatively expensive and did not sufficiently compensate for the risks. Some of those risks, including continued weakness in Advair sales, materialized, and the valuation declined after we sold the position.
In the second half of 2017, however, we built a position in GlaxoSmithKline again based on a more favorable fundamental long-term outlook and a lower valuation (12 times forward earnings). In the respiratory care division, declines in Advair sales should be offset by new drugs, aided by a new inhaler. The HIV segment is growing at healthy rates due to increased adoption of Dolutegravir, a drug that blocks an enzyme needed for HIV to replicate. Combined with continued growth in vaccines and consumer health, the company should achieve modest earnings growth. Meanwhile, the management team has also been revamped. The new CEO is focusing on renewing the pharmaceutical pipeline and has brought in a well-regarded head of research and development to lead that effort. Improvements in the drug pipeline will take time to manifest, but in the meantime, the company continues to generate stable cash flow and has an attractive 6% dividend yield. On December 31, GlaxoSmithKline was a 1.9% position in the Fund.
Energy
We discussed Energy in our last letter, noting that it was the worst-performing sector in the first half of 2017. Oil prices declined 16% in the first half but rebounded 40% in the second half. Unfortunately, the Fund’s holdings underperformed those in the MSCI EAFE Energy sector for the year. Specifically, our overweight in the Energy Equipment & Services (Oil Services) industry (2.7% compared to 0.1% for the MSCI EAFE) hurt performance, as Oil Services was down 23% compared to the overall Energy sector up 22%.
The Fund’s largest investment in Oil Services is Schlumberger (a 2.1% position), which is the industry’s leading global player. As
PAGE 2 § DODGE & COX INTERNATIONAL STOCK FUND
highlighted in our last letter, the stock price declined 22% in the first half, and we added to the position during the second quarter. The shares have remained weak—up only 4% in the second half—because a recovery in its international markets has not yet materialized. Since the current industry downturn started in 2014, the management team has done a remarkable job strengthening its business franchise through organic investments and selected acquisitions. We believe Schlumberger should benefit directly as higher oil prices spur producers to ramp up their investment in exploration and production.
We maintain our long-term view that Energy is an attractive area of the market. Demand growth continues to be substantial, and the dearth of investment in new supply over the past few years generates conditions that are supportive of higher oil prices in the longer term. We conduct ongoing research to test this thesis and recently met with industry executives and experts in Houston and the Middle East. One topic we focused on was U.S. shale oil, whose growth has surprised and disrupted the oil markets. Production of shale oil in the United States has increased to six million barrels a day from virtually nothing a decade ago, out of a global total of 98 million barrels a day. The key growth driver is the prodigious Permian Basin in Texas and New Mexico, which has altered the global cost curve because it can be economically viable at low oil prices. Our recent meetings reaffirmed that development costs are rising with more activity in the basin and that other global sources of new supply are likely needed to satisfy demand. Our research also reinforced the importance of investing in oil producers, such as Suncor Energy, whose assets are on the low end of the cost curve and whose management teams are investing counter-cyclically.
Suncor Energy
Suncor, a 1.9% position, is an integrated Canadian oil producer with most of its production coming from mining oil sands. We initially purchased the stock in the summer of 2016, as we viewed the valuation to be attractive relative to the business prospects. Oil sands require large upfront capital expenditures but can produce for decades at relatively low ongoing costs. Suncor’s assets generate free cash flow across a wide range of oil prices. These characteristics, along with Suncor’s strong balance sheet, provide the company staying power through the oil cycle. In addition, Suncor’s management has a track record of counter-cyclical capital allocation. When oil prices were high, management was disciplined and returned capital to shareholders through dividends and share buybacks. When oil prices declined, management opportunistically increased its ownership stake in a major oil sands asset called Syncrude. We added to our position in 2017 and view the company as offering a compelling combination of growth, resilience, and return of capital to shareholders.
Altice
Investing too early is a risk in implementing our value-oriented investment strategy. We may be attracted to a company because of its low valuation and the prospect of improving fundamentals, but we may inaccurately gauge the path and time needed to bring about that change in fundamentals. A case in point is Altice, which significantly detracted from performance in 2017.
Altice is a cable and telecommunications operator with major assets in Western Europe and the United States. Through a series of levered acquisitions, the company owns the second largest telecom company in France (SFR), U.S. cable operators
Cablevision and Suddenlink, and the incumbent telecom company in Portugal (Portugal Telecom). Altice is led by founder Patrick Drahi, who established a reputation for successfully consolidating the French cable market and improving profitability by re-engineering the cost structure of those businesses. We first bought Altice in early 2016. The valuation had declined due to skepticism about its recently announced Cablevision acquisition and high customer churn at SFR. We thought that was a good entry point given the significant opportunity to cut costs and improve operations at the recently acquired businesses.
Through the second quarter of 2017, the stock had appreciated 80% since our initial purchase. However, the company then reported disappointing third quarter results, with deteriorating revenue trends in France, Portugal, and U.S.-based Suddenlink. Because the company has high financial leverage, the impact on the stock was substantial—it was down 44% between the release of third quarter results and year end.
In these situations, we are careful not to be knee-jerk sellers or buyers. We concentrate our efforts on retesting the assumptions underlying our thesis. For Altice, management’s ability to improve revenue trends and cut costs is critical. Mr. Drahi responded by replacing the CEO at SFR with an executive who has an accomplished record of operational turnarounds and has been at Altice since its founding. While the competitive environment is intense, we believe the issues facing Altice can be fixed by the new management team. We also re-examined the company’s financial leverage with the help of our fixed income team and remain comfortable with the debt structure and maturity schedule. At the now lower valuation, we think Altice is very attractive. The U.S. cable operations are performing well, and we can attribute most of the company’s valuation to the stake in Altice USA, meaning we are paying little for the rest of the company. Based on these factors, we decided to add to the Fund’s position in Altice (0.8% on December 31).
IN CLOSING
Overall, we remain optimistic about the long-term outlook for the portfolio. International valuations are reasonable, and we see attractive earnings prospects for companies in the Fund. We believe a single quarter or year’s performance is too short of an interval to evaluate our strategy. Our active, bottom-up, value-oriented investment approach requires conviction and patience. Accordingly, maintaining a long-term investment horizon and staying the course are essential.
We thank our fellow shareholders for your continued confidence in Dodge & Cox. As always, we welcome your comments and questions.
For the Board of Trustees,
| | |
| | |
Charles F. Pohl, Chairman | | Dana M. Emery, President |
January 30, 2018
| (a) | | Unless otherwise specified, all weightings and characteristics are as of December 31, 2017. |
| (b) | | The use of specific examples does not imply that they are more or less attractive investments than the Fund’s other holdings. |
DODGE & COX INTERNATIONAL STOCK FUND §PAGE 3
ANNUAL PERFORMANCE REVIEW
The Fund underperformed the MSCI EAFE by 1.1 percentage points in 2017.
Key Detractors from Relative Results
| | § | | Weak returns from the Fund’s holdings in the Energy sector (up 1% compared to up 22% for the MSCI EAFE sector) hurt performance results, especially Schlumberger (down 17%). | |
| | § | | The Fund’s underweight position in Industrials, one of the strongest sectors of the market, and selection of holdings (up 22% compared to up 30% for the MSCI EAFE sector) hindered results. Johnson Controls International (down 6%) performed poorly. | |
| | § | | Additional detractors included Altice (down 47%), Magnit (down 38%), Grupo Televisa (down 10%), and Barclays (up 1%). | |
Key Contributors to Relative Results
| | § | | Strong returns from the Fund’s holdings in emerging markets (up 42%) contributed significantly, especially in the Information Technology, Consumer Discretionary, and Financials sectors. Samsung Electronics (up 61%), Kasikornbank (up 51%), ICICI Bank (up 45%), and the Fund’s Chinese internet-related holdings—Naspers (up 90%), JD.com (up 63%), and Baidu (up 42%)—were particularly notable. | |
| | § | | The Fund’s holdings in Japan (up 37% compared to up 24% for the MSCI EAFE region) helped results. Nintendo (up 77%) performed strongly. | |
| | § | | Within the Telecommunication Services sector, the Fund’s holdings outperformed (up 43% compared to up 13% for the MSCI EAFE sector). Millicom International Cellular (up 64%) performed exceptionally well. | |
KEY CHARACTERISTICS OF DODGE & COX
Independent Organization
Dodge & Cox is one of the largest privately owned investment managers in the world. We remain committed to independence, with a goal of providing the highest quality investment management service to our existing clients.
Over 85 Years of Investment Experience
Dodge & Cox was founded in 1930. We have a stable and well-qualified team of investment professionals, most of whom have spent their entire careers at Dodge & Cox.
Experienced Investment Team
The International Equity Investment Committee, which is the decision-making body for the International Stock Fund, is an eight-member committee with an average tenure at Dodge & Cox of 23 years.
One Business with a Single Research Office
Dodge & Cox manages equity (domestic, international, and global), fixed income (domestic and global), and balanced investments, operating from one office in San Francisco.
Consistent Investment Approach
Our team decision-making process involves thorough, bottom-up fundamental analysis of each investment.
Long-Term Focus and Low Expenses
We invest with a three- to five-year investment horizon, which has historically resulted in low turnover relative to our peers. We manage Funds that maintain low expense ratios.
Risks: The Fund is subject to market risk, meaning holdings in the Fund may decline in value for extended periods due to the financial prospects of individual companies, or due to general market and economic conditions. Investing in non-U.S. securities may entail risk due to foreign economic and political developments; this risk may be increased when investing in emerging markets. The Fund is also subject to currency risk. Please read the prospectus and summary prospectus for specific details regarding the Fund’s risk profile.
PAGE 4 § DODGE & COX INTERNATIONAL STOCK FUND
GROWTH OF $10,000 OVER 10 YEARS
FOR AN INVESTMENT MADE ON DECEMBER 31, 2007
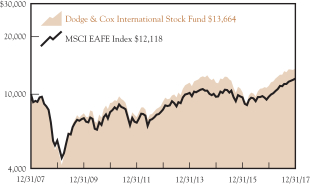
AVERAGE ANNUAL TOTAL RETURN
FOR PERIODS ENDED DECEMBER 31, 2017
| | | | | | | | | | | | | | | | |
| | | 1 Year | | | 3 Years | | | 5 Years | | | 10 Years | |
Dodge & Cox International
Stock Fund | | | 23.94 | % | | | 5.96 | % | | | 8.50 | % | | | 3.17 | % |
MSCI EAFE Index | | | 25.03 | | | | 7.80 | | | | 7.90 | | | | 1.94 | |
Returns represent past performance and do not guarantee future results. Investment return and share price will fluctuate with market conditions, and investors may have a gain or loss when shares are sold. Fund performance changes over time and currently may be significantly lower than stated. Performance is updated and published monthly. Visit the Fund’s website at dodgeandcox.com or call 800-621-3979 for current performance figures.
The Fund’s total returns include the reinvestment of dividend and capital gain distributions, but have not been adjusted for any income taxes payable by shareholders on these distributions or on Fund share redemptions. Index returns include dividends but, unlike Fund returns, do not reflect fees or expenses. The MSCI EAFE (Europe, Australasia, Far East) Index is a broad-based, unmanaged equity market index aggregated from 21 developed market country indices, excluding the United States and Canada. MSCI makes no express or implied warranties or representations and shall have no liability whatsoever with respect to any MSCI data contained herein. The MSCI data may not be further redistributed or used as a basis for other indices or any securities or financial products. This report is not approved, reviewed, or produced by MSCI.
MSCI EAFE is a service mark of MSCI Barra.
FUND EXPENSE EXAMPLE
As a Fund shareholder, you incur ongoing Fund costs, including management fees and other Fund expenses. All mutual funds have ongoing costs, sometimes referred to as operating expenses. The following example shows ongoing costs of investing in the Fund and can help you understand these costs and compare them with those of other mutual funds. The example assumes a $1,000 investment held for the six months indicated.
ACTUAL EXPENSES
The first line of the table below provides information about actual account values and expenses based on the Fund’s actual returns. You may use the information in this line, together with your account balance, to estimate the expenses that you paid over the period. Simply divide your account value by $1,000 (for example, an $8,600 account value divided by $1,000 = 8.6), then multiply the result by the number in the first line under the heading “Expenses Paid During Period” to estimate the expenses you paid on your account during this period.
HYPOTHETICAL EXAMPLE FOR COMPARISON WITH OTHER MUTUAL FUNDS
Information on the second line of the table can help you compare ongoing costs of investing in the Fund with those of other mutual funds. This information may not be used to estimate the actual ending account balance or expenses you paid during the period. The hypothetical “Ending Account Value” is based on the actual expense ratio of the Fund and an assumed 5% annual rate of return before expenses (not the Fund’s actual return). The amount under the heading “Expenses Paid During Period” shows the hypothetical expenses your account would have incurred under this scenario. You can compare this figure with the 5% hypothetical examples that appear in shareholder reports of other mutual funds.
| | | | | | | | | | | | |
Six Months Ended December 31, 2017 | | Beginning Account Value
7/1/2017 | | | Ending Account Value
12/31/2017 | | | Expenses Paid During Period* | |
Based on Actual Fund Return | | $ | 1,000.00 | | | $ | 1,082.40 | | | $ | 3.32 | |
Based on Hypothetical 5% Yearly Return | | | 1,000.00 | | | | 1,022.02 | | | | 3.22 | |
| * | | Expenses are equal to the Fund’s annualized expense ratio of 0.63%, multiplied by the average account value over the period, multiplied by 184/365 (to reflect the one-half year period). |
The expenses shown in the table highlight ongoing costs only and do not reflect any transactional fees or account maintenance fees. Though other mutual funds may charge such fees, please note that the Fund does not charge transaction fees (e.g., redemption fees, sales loads) or universal account maintenance fees (e.g., small account fees).
DODGE & COX INTERNATIONAL STOCK FUND §PAGE 5
| | | | |
| FUND INFORMATION (unaudited) | | | December 31, 2017 | |
| | | | |
| GENERAL INFORMATION | | | |
Net Asset Value Per Share | | | $46.32 | |
Total Net Assets (billions) | | | $65.7 | |
2016 Expense Ratio (per 5/1/17 Prospectus) | | | 0.64% | |
2017 Expense Ratio | | | 0.63% | |
Portfolio Turnover Rate | | | 17% | |
30-Day SEC Yield(a) | | | 1.63% | |
Number of Companies | | | 69 | |
Fund Inception | | | 2001 | |
No sales charges or distribution fees | | | | |
Investment Manager: Dodge & Cox, San Francisco. Managed by the International Equity Investment Committee, whose eight members’ average tenure at Dodge & Cox is 23 years.
| | | | | | | | |
| PORTFOLIO CHARACTERISTICS | | Fund | | | MSCI
EAFE | |
Median Market Capitalization (billions) | | | $36 | | | | $11 | |
Weighted Average Market Capitalization (billions) | | | $72 | | | | $60 | |
Price-to-Earnings Ratio(b) | | | 14.2x | | | | 14.9x | |
Countries Represented | | | 25 | | | | 21 | |
Emerging Markets (Brazil, China, India, Mexico, Russia, South Africa, South Korea, Thailand, Turkey, United Arab Emirates) | | | 26.1% | | | | 0.0% | |
| | | | |
| TEN LARGEST HOLDINGS (%)(c) | | Fund | |
Naspers, Ltd. (South Africa) | | | 4.1 | |
Samsung Electronics Co., Ltd. (South Korea) | | | 3.9 | |
Sanofi (France) | | | 3.3 | |
Novartis AG (Switzerland) | | | 3.1 | |
ICICI Bank, Ltd. (India) | | | 2.9 | |
Liberty Global PLC (United Kingdom) | | | 2.6 | |
Itau Unibanco Holding SA (Brazil) | | | 2.5 | |
BNP Paribas SA (France) | | | 2.3 | |
Barclays PLC (United Kingdom) | | | 2.3 | |
Honda Motor Co., Ltd. (Japan) | | | 2.2 | |
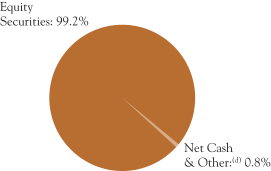
| | | | | | | | |
| REGION DIVERSIFICATION (%)(e) | | Fund | | | MSCI
EAFE | |
Europe (excluding United Kingdom) | | | 41.6 | | | | 45.7 | |
United Kingdom | | | 15.1 | | | | 17.8 | |
Pacific (excluding Japan) | | | 12.5 | | | | 12.0 | |
Japan | | | 10.4 | | | | 24.0 | |
Latin America | | | 7.0 | | | | 0.0 | |
Africa | | | 5.8 | | | | 0.0 | |
United States | | | 3.6 | | | | 0.0 | |
Canada | | | 2.9 | | | | 0.0 | |
Middle East | | | 0.3 | | | | 0.5 | |
| | | | | | | | |
| SECTOR DIVERSIFICATION (%) | | Fund | | | MSCI
EAFE | |
Financials | | | 28.1 | | | | 21.2 | |
Consumer Discretionary | | | 15.9 | | | | 12.3 | |
Health Care | | | 15.5 | | | | 10.1 | |
Information Technology | | | 12.3 | | | | 6.4 | |
Energy | | | 7.7 | | | | 5.3 | |
Industrials | | | 7.3 | | | | 14.6 | |
Materials | | | 6.1 | | | | 8.2 | |
Telecommunication Services | | | 3.3 | | | | 3.9 | |
Utilities | | | 1.3 | | | | 3.2 | |
Consumer Staples | | | 1.1 | | | | 11.2 | |
Real Estate | | | 0.6 | | | | 3.6 | |
| (a) | SEC Yield is an annualization of the Fund’s net investment income for the trailing 30-day period. Dividends paid by the Fund may be higher or lower than implied by the SEC Yield. |
| (b) | Price-to-earnings (P/E) ratios are calculated using 12-month forward earnings estimates from third-party sources. |
| (c) | The Fund’s portfolio holdings are subject to change without notice. The mention of specific securities is not a recommendation to buy, sell, or hold any particular security and is not indicative of Dodge & Cox’s current or future trading activity. |
| (d) | Net Cash & Other includes cash, short-term investments, derivatives, receivables, and payables. |
| (e) | The Fund may classify a company in a different category than the MSCI EAFE. The Fund generally classifies a company based on its country of incorporation, but may designate a different country in certain circumstances. |
PAGE 6 § DODGE & COX INTERNATIONAL STOCK FUND
| | | | |
| CONSOLIDATED PORTFOLIO OF INVESTMENTS | | | December 31, 2017 | |
| | | | | | | | |
| COMMON STOCKS: 93.3% | | | | | | |
| | |
| | | SHARES | | | VALUE | |
| CONSUMER DISCRETIONARY: 15.9% | | | | | |
AUTOMOBILES & COMPONENTS: 4.9% | | | | | |
Bayerische Motoren Werke AG (Germany) | | | 10,324,500 | | | $ | 1,072,432,175 | |
Honda Motor Co., Ltd. (Japan) | | | 42,473,755 | | | | 1,456,234,405 | |
NGK Spark Plug Co., Ltd. (Japan) | | | 5,104,300 | | | | 124,122,982 | |
Yamaha Motor Co., Ltd.(b) (Japan) | | | 16,675,000 | | | | 546,017,896 | |
| | | | | | | | |
| | | | | | | 3,198,807,458 | |
CONSUMER DURABLES & APPAREL: 0.3% | | | | | |
Panasonic Corp. (Japan) | | | 15,254,500 | | | | 223,394,307 | |
| | |
MEDIA: 9.2% | | | | | | | | |
Altice NV, Series A(a) (Netherlands) | | | 52,798,574 | | | | 552,327,788 | |
Grupo Televisa SAB ADR (Mexico) | | | 39,600,880 | | | | 739,348,430 | |
Liberty Global PLC LiLAC, Series A(a)(b) (United Kingdom) | | | 3,917,037 | | | | 78,928,296 | |
Liberty Global PLC LiLAC, Series C(a) (United Kingdom) | | | 5,535,198 | | | | 110,095,088 | |
Liberty Global PLC, Series A(a)(b) (United Kingdom) | | | 18,753,503 | | | | 672,125,548 | |
Liberty Global PLC, Series C(a) (United Kingdom) | | | 30,105,754 | | | | 1,018,778,715 | |
Naspers, Ltd. (South Africa) | | | 9,642,895 | | | | 2,686,793,805 | |
Television Broadcasts, Ltd.(b) (Hong Kong) | | | 40,022,900 | | | | 144,268,630 | |
| | | | | | | | |
| | | | | | | 6,002,666,300 | |
RETAILING: 1.5% | | | | | | | | |
JD.com, Inc. ADR(a)
(Cayman Islands/China) | | | 23,580,736 | | | | 976,714,085 | |
| | | | | | | | |
| | | | | | | 10,401,582,150 | |
| CONSUMER STAPLES: 1.1% | | | | | | | | |
FOOD & STAPLES RETAILING: 0.9% | | | | | | | | |
Magnit PJSC (Russia)(b) | | | 5,432,785 | | | | 597,110,661 | |
| | |
FOOD, BEVERAGE & TOBACCO: 0.2% | | | | | | | | |
Anadolu Efes Biracilik ve Malt Sanayii AS (Turkey) | | | 14,795,994 | | | | 94,547,916 | |
| | | | | | | | |
| | | | | | | 691,658,577 | |
| ENERGY: 5.9% | | | | | | | | |
Saipem SPA(a)(b) (Italy) | | | 56,980,627 | | | | 260,124,666 | |
Schlumberger, Ltd. (Curacao/United States) | | | 20,797,324 | | | | 1,401,531,664 | |
Statoil ASA (Norway) | | | 37,189,350 | | | | 795,557,740 | |
Suncor Energy, Inc. (Canada) | | | 34,660,400 | | | | 1,272,729,888 | |
Weatherford International PLC(a) (Ireland) | | | 34,997,592 | | | | 145,939,959 | |
| | | | | | | | |
| | | | | | | 3,875,883,917 | |
| FINANCIALS: 25.6% | | | | | | | | |
BANKS: 19.0% | | | | | | | | |
Axis Bank, Ltd. (India) | | | 37,106,383 | | | | 327,075,975 | |
Banco Santander SA (Spain) | | | 134,924,095 | | | | 884,745,215 | |
Barclays PLC (United Kingdom) | | | 548,445,300 | | | | 1,495,398,284 | |
BNP Paribas SA (France) | | | 20,503,458 | | | | 1,529,022,358 | |
ICICI Bank, Ltd.(b) (India) | | | 384,183,576 | | | | 1,885,312,473 | |
Kasikornbank PCL- Foreign(b) (Thailand) | | | 132,832,727 | | | | 970,823,730 | |
Lloyds Banking Group PLC
(United Kingdom) | | | 1,034,259,000 | | | | 947,066,036 | |
Mitsubishi UFJ Financial Group, Inc. (Japan) | | | 118,482,900 | | | | 869,356,176 | |
Societe Generale SA (France) | | | 17,567,542 | | | | 905,741,062 | |
Standard Chartered PLC(a) (United Kingdom) | | | 132,528,813 | | | | 1,394,651,493 | |
UniCredit SPA(a) (Italy) | | | 67,921,603 | | | | 1,265,331,223 | |
| | | | | | | | |
| | | | | | | 12,474,524,025 | |
| | | | | | | | |
| | |
| | | SHARES | | | VALUE | |
DIVERSIFIED FINANCIALS: 4.1% | | | | | | | | |
Credit Suisse Group AG (Switzerland) | | | 64,979,908 | | | $ | 1,156,661,901 | |
Haci Omer Sabanci Holding AS (Turkey) | | | 47,323,154 | | | | 138,818,181 | |
UBS Group AG (Switzerland) | | | 74,961,827 | | | | 1,377,364,202 | |
| | | | | | | | |
| | | | | | | 2,672,844,284 | |
INSURANCE: 2.5% | | | | | | | | |
AEGON NV(b) (Netherlands) | | | 134,755,530 | | | | 858,832,503 | |
Aviva PLC (United Kingdom) | | | 118,509,527 | | | | 809,898,144 | |
| | | | | | | | |
| | | | | | | 1,668,730,647 | |
| | | | | | | | |
| | | | | | | 16,816,098,956 | |
| HEALTH CARE: 15.5% | | | | | | | | |
HEALTH CARE EQUIPMENT & SERVICES: 1.1% | | | | | |
Koninklijke Philips NV (Netherlands) | | | 20,106,551 | | | | 760,658,989 | |
|
PHARMACEUTICALS, BIOTECHNOLOGY & LIFE SCIENCES: 14.4% | |
AstraZeneca PLC (United Kingdom) | | | 17,773,800 | | | | 1,219,691,647 | |
Bayer AG (Germany) | | | 11,119,650 | | | | 1,383,006,852 | |
GlaxoSmithKline PLC (United Kingdom) | | | 71,221,100 | | | | 1,259,747,883 | |
Novartis AG (Switzerland) | | | 13,123,070 | | | | 1,109,447,286 | |
Novartis AG ADR (Switzerland) | | | 11,028,500 | | | | 925,952,860 | |
Roche Holding AG (Switzerland) | | | 5,377,100 | | | | 1,360,101,018 | |
Sanofi (France) | | | 25,382,122 | | | | 2,185,491,191 | |
| | | | | | | | |
| | | | | | | 9,443,438,737 | |
| | | | | | | | |
| | | | | | | 10,204,097,726 | |
| INDUSTRIALS: 7.3% | | | | | | | | |
CAPITAL GOODS: 7.0% | | | | | | | | |
Johnson Controls International PLC (Ireland) | | | 30,934,775 | | | | 1,178,924,275 | |
Mitsubishi Electric Corp. (Japan) | | | 79,695,800 | | | | 1,324,206,617 | |
Nidec Corp. (Japan) | | | 5,156,700 | | | | 723,864,424 | |
Schneider Electric SA (France) | | | 12,185,546 | | | | 1,033,470,152 | |
Smiths Group PLC (United Kingdom) | | | 17,295,000 | | | | 345,989,130 | |
| | | | | | | | |
| | | | | | | 4,606,454,598 | |
TRANSPORTATION: 0.3% | | | | | | | | |
DP World, Ltd. (United Arab Emirates) | | | 8,256,304 | | | | 206,556,007 | |
| | | | | | | | |
| | | | | | | 4,813,010,605 | |
| INFORMATION TECHNOLOGY: 10.7% | | | | | |
SOFTWARE & SERVICES: 2.8% | | | | | | | | |
Baidu, Inc. ADR(a)
(Cayman Islands/China) | | | 4,106,987 | | | | 961,897,425 | |
Micro Focus International PLC
(United Kingdom) | | | 2,994,300 | | | | 101,620,536 | |
Micro Focus International PLC ADR (United Kingdom) | | | 12,527,673 | | | | 420,804,536 | |
Nintendo Co., Ltd. (Japan) | | | 948,430 | | | | 345,277,811 | |
| | | | | | | | |
| | | | | | | 1,829,600,308 | |
TECHNOLOGY, HARDWARE & EQUIPMENT: 7.9% | | | | | |
Brother Industries, Ltd. (Japan) | | | 9,224,000 | | | | 227,676,858 | |
Hewlett Packard Enterprise Co.
(United States) | | | 67,880,984 | | | | 974,770,930 | |
Kyocera Corp. (Japan) | | | 15,085,900 | | | | 985,727,421 | |
Samsung Electronics Co., Ltd.
(South Korea) | | | 625,427 | | | | 1,485,904,884 | |
TE Connectivity, Ltd. (Switzerland) | | | 7,976,962 | | | | 758,130,468 | |
Telefonaktiebolaget LM Ericsson (Sweden) | | | 115,264,300 | | | | 755,588,575 | |
| | | | | | | | |
| | | | | | | 5,187,799,136 | |
| | | | | | | | |
| | | | | | | 7,017,399,444 | |
| MATERIALS: 6.1% | | | | | | | | |
Agrium, Inc. (Canada) | | | 5,455,226 | | | | 627,350,990 | |
Akzo Nobel NV (Netherlands) | | | 7,432,535 | | | | 650,120,012 | |
Cemex SAB de CV ADR (Mexico) | | | 83,741,608 | | | | 628,062,060 | |
LafargeHolcim, Ltd. (Switzerland) | | | 11,930,483 | | | | 672,186,001 | |
Linde AG (Germany) | | | 6,087,637 | | | | 1,424,121,861 | |
| | | | | | | | |
| | | | | | | 4,001,840,924 | |
| | |
| See accompanying Notes to Consolidated Financial Statements | | DODGE & COX INTERNATIONAL STOCK FUND §PAGE 7 |
| | | | |
| CONSOLIDATED PORTFOLIO OF INVESTMENTS | | | December 31, 2017 | |
| | | | | | | | |
| COMMON STOCKS (continued) | | | | | | |
| | |
| | | SHARES | | | VALUE | |
| REAL ESTATE: 0.6% | | | | | | | | |
Hang Lung Group, Ltd.(b) (Hong Kong) | | | 111,345,400 | | | $ | 409,619,216 | |
|
| TELECOMMUNICATION SERVICES: 3.3% | |
America Movil SAB de CV, Series L (Mexico) | | | 505,100,600 | | | | 435,163,594 | |
Millicom International Cellular SA SDR(b) (Luxembourg) | | | 8,703,436 | | | | 587,578,809 | |
MTN Group, Ltd.(b) (South Africa) | | | 102,215,380 | | | | 1,129,848,850 | |
| | | | | | | | |
| | | | | | | 2,152,591,253 | |
| UTILITIES: 1.3% | | | | | | | | |
Engie (France) | | | 50,103,500 | | | | 860,847,454 | |
| | | | | | | | |
TOTAL COMMON STOCKS
(Cost $53,448,223,491) | | | | | | $ | 61,244,630,222 | |
| | |
| PREFERRED STOCKS: 5.9% | | | | | | |
| ENERGY: 1.8% | | | | | | | | |
Petroleo Brasileiro SA(a) (Brazil) | | | 235,671,000 | | | | 1,152,672,680 | |
| | |
| FINANCIALS: 2.5% | | | | | | | | |
BANKS: 2.5% | | | | | | | | |
Itau Unibanco Holding SA (Brazil) | | | 127,745,601 | | | | 1,654,425,418 | |
| |
| INFORMATION TECHNOLOGY: 1.6% | | | | | |
TECHNOLOGY, HARDWARE & EQUIPMENT: 1.6% | |
Samsung Electronics Co., Ltd.
(South Korea) | | | 548,216 | | | | 1,068,699,568 | |
| | | | | | | | |
| | |
TOTAL PREFERRED STOCKS
(Cost $3,097,108,119) | | | | | | $ | 3,875,797,666 | |
| | | | | | | | |
| SHORT-TERM INVESTMENTS: 1.0% | | | | |
| | |
| | | SHARES/ PAR VALUE | | | VALUE | |
REPURCHASE AGREEMENT: 0.9% | | | | | |
Fixed Income Clearing Corporation(c)
0.80%, dated 12/29/17, due 1/2/18, maturity value $587,131,185 | | $ | 587,079,000 | | | $ | 587,079,000 | |
| | |
MONEY MARKET FUND: 0.1% | | | | | | | | |
State Street Institutional Treasury Plus Money Market Fund | | | 65,666,651 | | | | 65,666,651 | |
| | | | | | | | |
TOTAL SHORT-TERM INVESTMENTS
(Cost $652,745,651) | | | $ | 652,745,651 | |
| | | | | | | | |
TOTAL INVESTMENTS
(Cost $57,198,077,261) | | | 100.2 | % | | $ | 65,773,173,539 | |
OTHER ASSETS LESS LIABILITIES | | | (0.2 | %) | | | (102,910,217 | ) |
| | | | | | | | |
| NET ASSETS | | | 100.0 | % | | $ | 65,670,263,322 | |
| | | | | | | | |
| (b) | See Note 9 regarding holdings of 5% voting securities |
| (c) | Repurchase agreement is collateralized by U.S. Treasury Notes 1.875%-2.125%, 4/30/22 - 6/30/22 and Federal Home Loan Bank 0.875%, 10/1/18. Total collateral value is $598,827,108. |
In determining a company’s country designation, the Fund generally references the country of incorporation. In cases where the Fund considers the country of incorporation to be a “jurisdiction of convenience” chosen primarily for tax purposes or in other limited circumstances, the Fund uses the country designation of an appropriate broad-based market index. In those cases, two countries are listed—the country of incorporation and the country designated by an appropriate index, respectively.
ADR: American Depositary Receipt
SDR: Swedish Depository Receipt
| | |
| PAGE 8 § DODGE & COX INTERNATIONAL STOCK FUND | | See accompanying Notes to Consolidated Financial Statements |
| | | | |
| CONSOLIDATED PORTFOLIO OF INVESTMENTS | | | December 31, 2017 | |
FUTURES CONTRACTS
| | | | | | | | | | | | | | | | |
| Description | | Number of
Contracts | | | Expiration
Date | | | Notional
Amount | | | Value /
Unrealized
Appreciation
(Depreciation) | |
Euro Stoxx 50 Index—Long Position | | | 6,002 | | | | Mar 2018 | | | $ | 251,548,238 | | | $ | (3,935,473 | ) |
Yen Denominated Nikkei 225 Index—Long Position | | | 1,808 | | | | Mar 2018 | | | | 182,123,807 | | | | 1,989,799 | |
| | | | | | | | | | | | | | | | |
| | | | | | | | | | | | | | $ | (1,945,674 | ) |
| | | | | | | | | | | | | | | | |
CURRENCY FORWARD CONTRACTS
| | | | | | | | | | | | | | | | |
| |
| | | | Contract Amount | | | | |
| Counterparty | | Settle Date | | | Receive U.S. Dollar | | | Deliver Foreign
Currency | | | Unrealized
Appreciation
(Depreciation) | |
Contracts to sell CHF: | |
Citibank | | | 1/24/18 | | | | 179,151,775 | | | | 173,225,434 | | | $ | 1,137,032 | |
Citibank | | | 1/24/18 | | | | 93,537,227 | | | | 90,443,016 | | | | 593,658 | |
Citibank | | | 1/24/18 | | | | 77,236,535 | | | | 74,681,550 | | | | 490,201 | |
Goldman Sachs | | | 1/24/18 | | | | 92,149,917 | | | | 89,093,120 | | | | 593,565 | |
Goldman Sachs | | | 1/24/18 | | | | 176,494,660 | | | | 170,639,979 | | | | 1,136,854 | |
Goldman Sachs | | | 1/24/18 | | | | 76,090,990 | | | | 73,566,900 | | | | 490,125 | |
Goldman Sachs | | | 1/24/18 | | | | 179,077,693 | | | | 173,225,434 | | | | 1,062,950 | |
Goldman Sachs | | | 1/24/18 | | | | 77,204,596 | | | | 74,681,550 | | | | 458,263 | |
Goldman Sachs | | | 1/24/18 | | | | 93,498,550 | | | | 90,443,017 | | | | 554,979 | |
Citibank | | | 1/31/18 | | | | 17,855,411 | | | | 17,499,999 | | | | (137,226 | ) |
Citibank | | | 1/31/18 | | | | 17,855,412 | | | | 17,500,000 | | | | (137,227 | ) |
Citibank | | | 1/31/18 | | | | 226,967,794 | | | | 222,450,000 | | | | (1,744,344 | ) |
Citibank | | | 1/31/18 | | | | 51,066,478 | | | | 50,050,000 | | | | (392,468 | ) |
Citibank | | | 1/31/18 | | | | 17,869,907 | | | | 17,500,000 | | | | (122,731 | ) |
Citibank | | | 1/31/18 | | | | 17,869,908 | | | | 17,500,001 | | | | (122,731 | ) |
Citibank | | | 1/31/18 | | | | 51,107,934 | | | | 50,050,000 | | | | (351,012 | ) |
Citibank | | | 1/31/18 | | | | 227,152,047 | | | | 222,450,000 | | | | (1,560,091 | ) |
Goldman Sachs | | | 2/14/18 | | | | 141,538,524 | | | | 140,000,000 | | | | (2,545,327 | ) |
UBS | | | 3/14/18 | | | | 142,215,865 | | | | 140,000,000 | | | | (2,167,468 | ) |
Contracts to sell CNH: | |
Citibank | | | 1/10/18 | | | | 43,446,075 | | | | 307,228,920 | | | | (3,707,831 | ) |
HSBC | | | 1/10/18 | | | | 43,449,147 | | | | 307,228,920 | | | | (3,704,759 | ) |
HSBC | | | 1/10/18 | | | | 86,862,670 | | | | 614,457,840 | | | | (7,445,143 | ) |
JPMorgan | | | 1/10/18 | | | | 43,443,003 | | | | 307,228,920 | | | | (3,710,903 | ) |
JPMorgan | | | 1/10/18 | | | | 43,461,440 | | | | 307,228,920 | | | | (3,692,466 | ) |
JPMorgan | | | 1/10/18 | | | | 43,449,147 | | | | 307,228,920 | | | | (3,704,759 | ) |
JPMorgan | | | 1/10/18 | | | | 43,452,220 | | | | 307,228,920 | | | | (3,701,687 | ) |
JPMorgan | | | 1/10/18 | | | | 43,461,440 | | | | 307,228,920 | | | | (3,692,466 | ) |
JPMorgan | | | 1/10/18 | | | | 43,455,293 | | | | 307,228,920 | | | | (3,698,614 | ) |
Citibank | | | 1/24/18 | | | | 85,079,297 | | | | 601,765,866 | | | | (7,213,795 | ) |
Citibank | | | 1/24/18 | | | | 88,991,029 | | | | 629,923,000 | | | | (7,620,534 | ) |
Citibank | | | 1/24/18 | | | | 85,127,439 | | | | 601,765,867 | | | | (7,165,653 | ) |
JPMorgan | | | 1/24/18 | | | | 44,495,515 | | | | 314,961,500 | | | | (3,810,267 | ) |
JPMorgan | | | 1/24/18 | | | | 44,495,515 | | | | 314,961,500 | | | | (3,810,267 | ) |
JPMorgan | | | 1/24/18 | | | | 85,055,246 | | | | 601,765,867 | | | | (7,237,846 | ) |
Citibank | | | 1/31/18 | | | | 102,920,012 | | | | 728,837,636 | | | | (8,821,759 | ) |
JPMorgan | | | 1/31/18 | | | | 376,020,262 | | | | 2,657,523,200 | | | | (31,418,013 | ) |
JPMorgan | | | 1/31/18 | | | | 145,333,865 | | | | 1,027,830,164 | | | | (12,247,957 | ) |
JPMorgan | | | 1/31/18 | | | | 98,291,639 | | | | 695,364,200 | | | | (8,318,151 | ) |
| | | | | | | | | | | | | | | | |
| | | | Contract Amount | | | | |
| Counterparty | | Settle Date | | | Receive U.S. Dollar | | | Deliver Foreign
Currency | | | Unrealized
Appreciation
(Depreciation) | |
Citibank | | | 2/7/18 | | | | 76,674,965 | | | | 542,168,675 | | | $ | (6,416,111 | ) |
Citibank | | | 2/7/18 | | | | 76,664,123 | | | | 542,168,675 | | | | (6,426,953 | ) |
Citibank | | | 2/7/18 | | | | 31,943,386 | | | | 225,903,625 | | | | (2,677,897 | ) |
Citibank | | | 2/7/18 | | | | 32,043,067 | | | | 225,903,625 | | | | (2,578,216 | ) |
Citibank | | | 2/7/18 | | | | 76,859,750 | | | | 542,168,675 | | | | (6,231,326 | ) |
Citibank | | | 2/7/18 | | | | 32,024,897 | | | | 225,903,625 | | | | (2,596,386 | ) |
Citibank | | | 2/7/18 | | | | 31,947,903 | | | | 225,903,625 | | | | (2,673,380 | ) |
Citibank | | | 2/7/18 | | | | 76,903,358 | | | | 542,168,675 | | | | (6,187,718 | ) |
Bank of America | | | 5/16/18 | | | | 47,078,342 | | | | 332,792,093 | | | | (3,638,575 | ) |
Bank of America | | | 5/16/18 | | | | 47,057,706 | | | | 332,792,094 | | | | (3,659,212 | ) |
Goldman Sachs | | | 5/16/18 | | | | 47,262,899 | | | | 334,120,337 | | | | (3,656,440 | ) |
Goldman Sachs | | | 5/16/18 | | | | 47,067,286 | | | | 332,742,176 | | | | (3,642,024 | ) |
Goldman Sachs | | | 5/16/18 | | | | 47,266,893 | | | | 334,153,300 | | | | (3,657,470 | ) |
Goldman Sachs | | | 5/16/18 | | | | 47,150,332 | | | | 333,400,000 | | | | (3,659,229 | ) |
Bank of America | | | 6/13/18 | | | | 28,571,429 | | | | 200,000,000 | | | | (1,861,832 | ) |
Bank of America | | | 6/13/18 | | | | 28,577,552 | | | | 200,000,000 | | | | (1,855,709 | ) |
Bank of America | | | 8/1/18 | | | | 50,833,132 | | | | 349,350,697 | | | | (2,177,115 | ) |
Bank of America | | | 8/1/18 | | | | 73,321,899 | | | | 503,904,752 | | | | (3,140,279 | ) |
JPMorgan | | | 8/1/18 | | | | 50,847,929 | | | | 349,350,697 | | | | (2,162,318 | ) |
JPMorgan | | | 8/1/18 | | | | 50,829,434 | | | | 349,350,699 | | | | (2,180,813 | ) |
JPMorgan | | | 8/1/18 | | | | 73,343,243 | | | | 503,904,752 | | | | (3,118,935 | ) |
JPMorgan | | | 8/1/18 | | | | 73,332,570 | | | | 503,904,752 | | | | (3,129,609 | ) |
JPMorgan | | | 8/1/18 | | | | 73,316,565 | | | | 503,904,753 | | | | (3,145,613 | ) |
JPMorgan | | | 8/1/18 | | | | 50,840,529 | | | | 349,350,698 | | | | (2,169,717 | ) |
Bank of America | | | 8/8/18 | | | | 116,911,358 | | | | 804,525,512 | | | | (5,116,096 | ) |
Credit Suisse | | | 8/8/18 | | | | 116,941,947 | | | | 804,525,513 | | | | (5,085,508 | ) |
Goldman Sachs | | | 8/8/18 | | | | 89,974,833 | | | | 619,116,825 | | | | (3,930,518 | ) |
JPMorgan | | | 8/8/18 | | | | 89,968,295 | | | | 619,116,825 | | | | (3,937,055 | ) |
JPMorgan | | | 8/8/18 | | | | 89,981,371 | | | | 619,116,825 | | | | (3,923,979 | ) |
JPMorgan | | | 8/15/18 | | | | 369,751,221 | | | | 2,527,249,599 | | | | (13,413,452 | ) |
UBS | | | 8/15/18 | | | | 136,768,981 | | | | 936,730,749 | | | | (5,251,868 | ) |
UBS | | | 8/15/18 | | | | 35,528,421 | | | | 243,334,152 | | | | (1,364,275 | ) |
Bank of America | | | 8/29/18 | | | | 90,004,449 | | | | 606,900,000 | | | | (1,933,302 | ) |
Bank of America | | | 8/29/18 | | | | 88,082,902 | | | | 595,000,000 | | | | (2,052,149 | ) |
Citibank | | | 8/29/18 | | | | 88,167,088 | | | | 595,000,000 | | | | (1,967,963 | ) |
UBS | | | 8/29/18 | | | | 77,833,126 | | | | 525,000,000 | | | | (1,697,801 | ) |
UBS | | | 8/29/18 | | | | 89,005,407 | | | | 600,831,000 | | | | (2,012,967 | ) |
UBS | | | 8/29/18 | | | | 85,483,341 | | | | 577,269,000 | | | | (1,965,685 | ) |
Contracts to sell EUR: | |
Goldman Sachs | | | 2/14/18 | | | | 241,327,451 | | | | 205,734,375 | | | | (6,120,019 | ) |
Goldman Sachs | | | 2/14/18 | | | | 403,825,299 | | | | 344,265,625 | | | | (10,240,934 | ) |
Bank of America | | | 3/14/18 | | | | 534,287,250 | | | | 450,000,000 | | | | (7,884,217 | ) |
Bank of America | | | 3/14/18 | | | | 534,422,250 | | | | 450,000,000 | | | | (7,749,217 | ) |
| | | | |
| Counterparty | | Settle Date | | | Deliver U.S. Dollar | | | Receive
Foreign
Currency | | | Unrealized
Appreciation
(Depreciation) | |
Contracts to buy CNH: | |
JPMorgan | | | 1/10/18 | | | | 138,965,211 | | | | 921,686,760 | | | | 2,496,509 | |
| | | | | | | | | | | | | | | | |
| | | $ | (303,279,241 | ) |
| | | | | |
The listed counterparty may be the parent company or one of its subsidiaries.
CHF: Swiss Franc
CNH: Chinese Yuan Renminbi
EUR: Euro
| | |
| See accompanying Notes to Consolidated Financial Statements | | DODGE & COX INTERNATIONAL STOCK FUND §PAGE 9 |
| | | | |
CONSOLIDATED STATEMENT OF ASSETS AND LIABILITIES | |
| |
| | | December 31, 2017 | |
ASSETS: | | | | |
Investments in securities, at value | | | | |
Unaffiliated issuers (cost $48,873,308,892) | | $ | 58,178,600,157 | |
Affiliated issuers (cost $8,324,768,369) | | | 7,594,573,382 | |
| | | | |
| | | 65,773,173,539 | |
Unrealized appreciation on currency forward contracts | | | 9,014,136 | |
Cash pledged as collateral for currency forward contracts | | | 199,070,000 | |
Cash | | | 100 | |
Cash denominated in foreign currency (cost $38,342,812) | | | 38,733,121 | |
Deposits with broker for futures contracts | | | 24,068,977 | |
Receivable for investments sold | | | 57,087,658 | |
Receivable for Fund shares sold | | | 74,973,463 | |
Dividends and interest receivable | | | 136,798,512 | |
Prepaid expenses and other assets | | | 3,908,826 | |
| | | | |
| | | 66,316,828,332 | |
| | | | |
LIABILITIES: | | | | |
Unrealized depreciation on currency forward contracts | | | 312,293,377 | |
Payable for variation margin for futures contracts | | | 1,598,837 | |
Payable for investments purchased | | | 88,545,701 | |
Payable for Fund shares redeemed | | | 171,147,929 | |
Deferred foreign capital gains tax | | | 32,878,609 | |
Management fees payable | | | 33,003,222 | |
Accrued expenses | | | 7,097,335 | |
| | | | |
| | | 646,565,010 | |
| | | | |
NET ASSETS | | $ | 65,670,263,322 | |
| | | | |
NET ASSETS CONSIST OF: | | | | |
Paid in capital | | $ | 59,169,975,465 | |
Distributions in excess of net investment income | | | (291,728,937 | ) |
Accumulated net realized loss | | | (1,447,727,463 | ) |
Net unrealized appreciation | | | 8,239,744,257 | |
| | | | |
| | $ | 65,670,263,322 | |
| | | | |
Fund shares outstanding (par value $0.01 each, unlimited shares authorized) | | | 1,417,794,549 | |
Net asset value per share | | $ | 46.32 | |
| |
CONSOLIDATED STATEMENT OF OPERATIONS | | | | |
| |
| | | Year Ended
December 31, 2017 | |
INVESTMENT INCOME: | | | | |
Dividends (net of foreign taxes of $136,506,323) | | | | |
Unaffiliated issuers | | $ | 1,184,727,544 | |
Affiliated issuers | | | 171,854,208 | |
Interest | | | 3,692,809 | |
| | | | |
| | | 1,360,274,561 | |
| | | | |
EXPENSES: | | | | |
Management fees | | | 370,322,745 | |
Custody and fund accounting fees | | | 8,742,365 | |
Transfer agent fees | | | 8,246,820 | |
Professional services | | | 273,134 | |
Shareholder reports | | | 1,559,911 | |
Registration fees | | | 223,036 | |
Trustees’ fees | | | 280,417 | |
ADR depositary services fees | | | 1,199,247 | |
Miscellaneous | | | 1,047,258 | |
| | | | |
| | | 391,894,933 | |
| | | | |
NET INVESTMENT INCOME | | | 968,379,628 | |
| | | | |
REALIZED AND UNREALIZED GAIN (LOSS): | | | | |
Net realized gain (loss) | | | | |
Investments in securities of unaffiliated issuers | | | (337,628,283 | ) |
Investments in securities of affiliated issuers | | | (90,929,380 | ) |
Futures contracts | | | 78,680,756 | |
Currency forward contracts | | | (30,130,018 | ) |
Foreign currency transactions | | | 8,561,476 | |
Net change in unrealized appreciation/depreciation | | | | |
Investments in securities of unaffiliated issuers | | | 11,198,204,562 | |
Investments in securities of affiliated issuers (net of change in deferred foreign capital gains tax of $32,878,609) | | | 1,702,269,703 | |
Futures contracts | | | (1,945,674 | ) |
Currency forward contracts | | | (623,406,532 | ) |
Foreign currency translation | | | 4,821,422 | |
| | | | |
Net realized and unrealized gain | | | 11,908,498,032 | |
| | | | |
NET CHANGE IN NET ASSETS
FROM OPERATIONS | | $ | 12,876,877,660 | |
| | | | |
| | | | | | | | |
CONSOLIDATED STATEMENT OF CHANGES IN NET ASSETS | |
| | |
| | | Year Ended December 31, 2017 | | | Year Ended
December 31, 2016 | |
OPERATIONS: | | | | | |
Net investment income | | $ | 968,379,628 | | | $ | 1,135,439,749 | |
Net realized gain (loss) | | | (371,445,449 | ) | | | 1,535,688,728 | |
Net change in unrealized appreciation/depreciation | | | 12,279,943,481 | | | | 1,535,796,846 | |
| | | | | | | | |
| | | 12,876,877,660 | | | | 4,206,925,323 | |
| | | | | | | | |
| | |
DISTRIBUTIONS TO SHAREHOLDERS FROM: | | | | | | | | |
Net investment income | | | (1,246,064,935 | ) | | | (1,185,247,471 | ) |
Net realized gain | | | — | | | | (757,672,431 | ) |
| | | | | | | | |
Total distributions | | | (1,246,064,935 | ) | | | (1,942,919,902 | ) |
| | | | | | | | |
| |
FUND SHARE
TRANSACTIONS: | | | | | |
Proceeds from sale of shares | | | 8,048,181,192 | | | | 6,854,611,384 | |
Reinvestment of distributions | | | 1,054,276,376 | | | | 1,655,896,889 | |
Cost of shares redeemed | | | (9,249,656,015 | ) | | | (13,616,468,513 | ) |
| | | | | | | | |
Net change from Fund share transactions | | | (147,198,447 | ) | | | (5,105,960,240 | ) |
| | | | | | | | |
Total change in net assets | | | 11,483,614,278 | | | | (2,841,954,819 | ) |
| |
NET ASSETS: | | | | | |
Beginning of year | | | 54,186,649,044 | | | | 57,028,603,863 | |
| | | | | | | | |
End of year (including distributions in excess of net investment income of $(291,728,937) and $(33,914,059), respectively) | | $ | 65,670,263,322 | | | $ | 54,186,649,044 | |
| | | | | | | | |
| |
SHARE INFORMATION: | | | | | |
Shares sold | | | 184,640,901 | | | | 194,723,459 | |
Distributions reinvested | | | 23,034,217 | | | | 43,438,957 | |
Shares redeemed | | | (212,133,063 | ) | | | (379,146,976 | ) |
| | | | | | | | |
Net change in shares outstanding | | | (4,457,945 | ) | | | (140,984,560 | ) |
| | | | | | | | |
| | |
| PAGE 10 § DODGE & COX INTERNATIONAL STOCK FUND | | See accompanying Notes to Consolidated Financial Statements |
NOTES TO CONSOLIDATED FINANCIAL STATEMENTS
NOTE 1—ORGANIZATION AND SIGNIFICANT ACCOUNTING POLICIES
Dodge & Cox International Stock Fund (the “Fund”) is one of the series constituting the Dodge & Cox Funds (the “Trust” or the “Funds”). The Trust is organized as a Delaware statutory trust and is registered under the Investment Company Act of 1940, as amended, as an open-end management investment company. On January 16, 2015, the Fund closed to new investors. The Fund commenced operations on May 1, 2001, and seeks long-term growth of principal and income. The Fund invests primarily in a diversified portfolio of foreign equity securities. Foreign investing, especially in developing countries, has special risks such as currency and market volatility and political and social instability. These and other risk considerations are discussed in the Fund’s Prospectus.
The financial statements have been prepared in conformity with accounting principles generally accepted in the United States of America, which require the use of estimates and assumptions by management. Actual results may differ from those estimates. Significant accounting policies are as follows:
Security valuation The Fund’s net assets are normally valued as of the scheduled close of trading on the New York Stock Exchange (NYSE), generally 4:00 p.m. Eastern Time, each day that the NYSE is open for business.
Portfolio holdings for which market quotes are readily available are valued at market value. Listed securities for example, are generally valued using the official quoted close price or the last sale on the exchange that is determined to be the primary market for the security. Exchange-traded derivatives are valued at the settlement price determined by the relevant exchange. Short-term securities less than 60 days to maturity may be valued at amortized cost if amortized cost approximates current value. Security values are not discounted based on the size of the Fund’s position and may differ from the value a Fund receives upon sale of the securities. Mutual funds are valued at their respective net asset values.
Investments initially valued in currencies other than the U.S. dollar are converted to the U.S. dollar using prevailing exchange rates. Currency forward contracts are valued based on the prevailing forward exchange rates of the underlying currencies. As a result, the Fund’s net assets may be affected by changes in the value of currencies in relation to the U.S. dollar.
If market quotations are not readily available or if normal valuation procedures produce valuations that are deemed unreliable or inappropriate under the circumstances existing at the time, the investment will be valued at fair value as determined in good faith by or under the direction of the Fund’s Board of Trustees. The Board of Trustees has appointed Dodge & Cox, the Fund’s investment manager, to make fair value determinations in accordance with the Dodge & Cox Funds Valuation Policies (“Valuation Policies”), subject to Board oversight. Dodge & Cox has established a Pricing Committee that is comprised of representatives from Treasury, Legal, Compliance, and Operations. The Pricing Committee is responsible for implementing the Valuation Policies, including determining the fair value of securities and other investments when necessary. The
Pricing Committee considers relevant indications of value that are reasonably available to it in determining the fair value assigned to a particular security, such as the value of similar financial instruments, trading volumes, contractual restrictions on disposition, related corporate actions, and changes in economic conditions. In doing so, the Pricing Committee employs various methods for calibrating fair valuation approaches, including a regular review of key inputs and assumptions, back-testing, and review of any related market activity.
As trading in securities on most foreign exchanges is normally completed before the close of the NYSE, the value of non-U.S. securities can change by the time the Fund calculates its net asset value. To address these changes, the Fund may utilize adjustment factors provided by an independent pricing service to systematically value non-U.S. securities at fair value. These adjustment factors are based on statistical analyses of subsequent movements and changes in U.S. markets and financial instruments trading in U.S. markets that represent foreign securities or baskets of securities.
Valuing securities through a fair value determination involves greater reliance on judgment than valuation of securities based on readily available market quotations. In some instances, lack of information and uncertainty as to the significance of information may lead to a conclusion that a prior valuation is the best indication of a security’s value. When fair value pricing is employed, the prices of securities used by the Fund to calculate its net asset value may differ from quoted or published prices for the same securities.
Security transactions, investment income, expenses, and distributions Security transactions are recorded on the trade date. Realized gains and losses on securities sold are determined on the basis of identified cost.
Dividend income and corporate action transactions are recorded on the ex-dividend date, or when the Fund first learns of the dividend/corporate action if the ex-dividend date has passed. Non-cash dividends, if any, are recorded at the fair market value of the securities received. Dividends characterized as return of capital for U.S. tax purposes are recorded as a reduction of cost of investments and/or realized gain. Interest income is recorded on the accrual basis.
Expenses are recorded on the accrual basis. Some expenses of the Trust can be directly attributed to a specific series. Expenses which cannot be directly attributed are allocated among the Funds in the Trust using methodologies determined by the nature of the expense.
Distributions to shareholders are recorded on the ex-dividend date.
Foreign taxes The Fund is subject to foreign taxes which may be imposed by certain countries in which the Fund invests. The Fund endeavors to record foreign taxes based on applicable foreign tax law. Withholding taxes are incurred on certain foreign dividends and are accrued at the time the associated dividend is recorded. The Fund files withholding tax reclaims in certain jurisdictions to recover a portion of amounts previously withheld. The Fund records a reclaim receivable based on, among other things, a jurisdiction’s legal obligation to pay reclaims as well as payment history and market
DODGE & COX INTERNATIONAL STOCK FUND §PAGE 11
NOTES TO CONSOLIDATED FINANCIAL STATEMENTS
convention. In consideration of recent decisions rendered by European courts, the Fund has filed for additional reclaims related to prior years. A corresponding receivable is established when both the amount is known and significant contingencies or uncertainties regarding collectability are removed. These amounts, if any, are reported in “dividends and interest receivable” in the Consolidated Statement of Assets and Liabilities.
Capital gains taxes are incurred upon disposition of certain foreign securities. Expected capital gains taxes on appreciated securities, if any, are accrued as unrealized losses and incurred capital gains taxes are reflected as realized losses upon the sale of the related security. Currency taxes may be incurred when the Fund purchases certain foreign currencies related to securities transactions and are recorded as realized losses on foreign currency transactions.
Repurchase agreements Repurchase agreements are transactions under which a Fund purchases a security from a dealer counterparty and agrees to resell the security to that counterparty on a specified future date at the same price, plus a specified interest rate. The Fund’s repurchase agreements are secured by U.S. government or agency securities. It is the Fund’s policy that its custodian take possession of the underlying collateral securities, the fair value of which exceeds the principal amount of the repurchase transaction, including accrued interest, at all times. In the event of default by the counterparty, the Fund has the contractual right to liquidate the collateral securities and to apply the proceeds in satisfaction of the obligation.
Foreign currency translation The books and records of the Fund are maintained in U.S. dollars. Foreign currency amounts are translated into U.S. dollars at the prevailing exchange rates of such currencies against the U.S. dollar. The market value of investment securities and other assets and liabilities are translated at the exchange rate as of the valuation date. Purchases and sales of investment securities, income, and expenses are translated at the exchange rate prevailing on the transaction date.
Reported realized and unrealized gain (loss) on investments include foreign currency gain (loss) related to investment transactions.
Reported realized and unrealized gain (loss) on foreign currency transactions and translation include the following: disposing/holding of foreign currency, the difference between the trade and settlement dates on securities transactions, the difference between the accrual and payment dates on dividends, and currency losses on the purchase of foreign currency in certain countries that impose taxes on such transactions.
Consolidation The Fund may invest in certain securities through its wholly owned subsidiary, Dodge & Cox International Stock Fund Cayman, Ltd. (the “Subsidiary”). The Subsidiary is a Cayman Islands exempted company and invests in certain securities consistent with the investment objective of the Fund. The Fund’s Consolidated Financial Statements, including the Consolidated Portfolio of Investments, consist of the holdings and accounts of the Fund and the Subsidiary. All intercompany transactions and balances have been eliminated. At December 31, 2017, the Subsidiary had net assets of $100, which represented less than 0.01% of the Fund’s consolidated net assets.
Indemnification Under the Trust’s organizational documents, its officers and trustees are indemnified against certain liabilities arising out of the performance of their duties to the Trust. In addition, in the normal course of business the Trust enters into contracts that provide general indemnities to other parties. The Trust’s maximum exposure under these arrangements is unknown as this would involve future claims that may be made against the Trust that have not yet occurred.
NOTE 2—VALUATION MEASUREMENTS
Various inputs are used in determining the value of the Fund’s investments. These inputs are summarized in the three broad levels listed below.
| § | | Level 1: Quoted prices in active markets for identical securities |
| § | | Level 2: Other significant observable inputs (including quoted prices for similar securities, market indices, interest rates, credit risk, forward exchange rates, etc.) |
| § | | Level 3: Significant unobservable inputs (including Fund management’s assumptions in determining the fair value of investments) |
The inputs or methodology used for valuing securities are not necessarily an indication of the risk associated with investing in those securities.
The following is a summary of the inputs used to value the Fund’s holdings at December 31, 2017:
| | | | | | | | |
| Classification(a) | | LEVEL 1
(Quoted Prices) | | | LEVEL 2
(Other Significant
Observable Inputs) | |
Securities | | | | | | | | |
Common Stocks | | | | | | | | |
Consumer Discretionary | | $ | 3,595,990,161 | | | $ | 6,805,591,989 | |
Consumer Staples | | | — | | | | 691,658,577 | |
Energy | | | 2,820,201,511 | | | | 1,055,682,406 | |
Financials | | | — | | | | 16,816,098,956 | |
Health Care | | | 925,952,860 | | | | 9,278,144,866 | |
Industrials | | | 1,178,924,275 | | | | 3,634,086,330 | |
Information Technology | | | 3,115,603,360 | | | | 3,901,796,084 | |
Materials | | | 1,255,413,050 | | | | 2,746,427,874 | |
Real Estate | | | — | | | | 409,619,216 | |
Telecommunication Services | | | 435,163,594 | | | | 1,717,427,659 | |
Utilities | | | — | | | | 860,847,454 | |
Preferred Stocks | | | | | | | | |
Energy | | | — | | | | 1,152,672,680 | |
Financials | | | — | | | | 1,654,425,418 | |
Information Technology | | | — | | | | 1,068,699,568 | |
Short-term Investments | | | | | | | | |
Repurchase Agreement | | | — | | | | 587,079,000 | |
Money Market Fund | | | 65,666,651 | | | | — | |
| | | | | | | | |
Total Securities | | $ | 13,392,915,462 | | | $ | 52,380,258,077 | |
| | | | | | | | |
Other Investments | | | | | | | | |
Futures Contracts | | | | | | | | |
Appreciation | | $ | 1,989,799 | | | $ | — | |
Depreciation | | | (3,935,473 | ) | | | — | |
Currency Forward Contracts | | | | | | | | |
Appreciation | | | — | | | | 9,014,136 | |
Depreciation | | | — | | | | (312,293,377 | ) |
| | | | | | | | | |
| (a) | Transfers during the year between Level 1 and Level 2 relate to the use of systematic fair valuation or when significant observable inputs are used to fair value a specific security. On days when systematic fair valuation is used, securities whose primary market closes before the NYSE are classified as Level 2. There were no Level 3 securities at December 31, 2017 and 2016, and there were no transfers to Level 3 during the year. |
PAGE 12 § DODGE & COX INTERNATIONAL STOCK FUND
NOTES TO CONSOLIDATED FINANCIAL STATEMENTS
NOTE 3—DERIVATIVE INSTRUMENTS
The Fund entered into various transactions involving derivative instruments, including currency forward contracts and futures contracts, in connection with its investment strategy. The Fund may use derivatives to minimize the impact of losses to one or more of its investments (as a “hedging technique”) or to implement its investment strategy.
The Fund has entered into over-the-counter derivatives, such as currency forward contracts (each, an “OTC Derivative”). Each OTC Derivative is subject to a negotiated master agreement (based on a form published by the International Swaps and Derivatives Association (“ISDA”)) governing all OTC Derivatives between the Fund and the relevant dealer counterparty. The master agreements specify (i) events of default and other events permitting a party to terminate some or all of the OTC Derivatives thereunder and (ii) the process by which those OTC Derivatives will be valued for purposes of determining termination payments. If some or all of the OTC Derivatives under a master agreement are terminated because of an event of default or similar event, the values of all terminated OTC Derivatives must be netted to determine a single payment owed by one party to the other. To the extent amounts owed to the Fund by its counterparties are not collateralized, the Fund is at risk of those counterparties’ non-performance. The Fund attempts to mitigate counterparty credit risk by entering into OTC Derivatives only with counterparties it believes to be of good credit quality, by exchanging collateral, and by monitoring the financial stability of those counterparties.
Futures contracts Futures contracts involve an obligation to purchase or sell (depending on whether the Fund has entered a long or short futures contract, respectively) an asset at a future date, at a price set at the time of the contract. Upon entering into a futures contract, the Fund is required to deposit an amount of cash or liquid assets (referred to as initial margin) in a segregated account with the clearing broker. Subsequent payments (referred to as variation margin) to and from the clearing broker are made on a daily basis based on changes in the market value of futures contracts. Futures contracts are traded publicly and their market value changes daily. Changes in the market value of open futures contracts are recorded as unrealized appreciation or depreciation in the Consolidated Statement of Operations. Realized gains and losses on futures contracts are recorded in the Consolidated Statement of Operations at the closing or expiration of the contracts. Cash deposited with a broker as initial margin is recorded in the Consolidated Statement of Assets and Liabilities. A receivable and/or payable to brokers for daily variation margin are also recorded in the Consolidated Statement of Assets and Liabilities.
Investments in futures contracts may include certain risks, which may be different from, and potentially greater than, those of the underlying securities. To the extent the Fund uses futures, it is exposed to additional volatility and potential losses resulting from leverage.
The Fund entered into long Euro Stoxx 50 futures contracts and long Yen Denominated Nikkei futures contracts to provide equity exposure that approximates the Fund’s “net cash and other” position, which includes cash, short-term investments, receivables, and payables. During the year ended December 31, 2017, these futures contracts had notional values up to 2% of net assets.
Currency forward contracts A currency forward contract, an OTC Derivative, represents an obligation to purchase or sell a specific foreign currency at a future date at a price set at the time of the contract. The values of the currency forward contracts are adjusted daily based on the prevailing forward exchange rates of the underlying currencies. Changes in the value of open contracts are recorded as unrealized appreciation or depreciation in the Consolidated Statement of Operations. When the currency forward contract is closed, the Fund records a realized gain or loss in the Consolidated Statement of Operations equal to the difference between the value at the time the contract was opened and the value at the time it was closed.
Losses from these transactions may arise from unfavorable changes in currency values or if the counterparties do not perform under a contract’s terms.
The Fund has maintained currency forward contracts to hedge direct and/or indirect foreign currency exposure to the Chinese yuan renminbi, euro, and Swiss franc. During the year ended December 31, 2017, these currency forward contracts had U.S. dollar total values ranging from 11% to 13% of net assets.
Additional derivative information For financial reporting purposes, the Fund does not offset OTC Derivative assets and liabilities that are subject to a master netting arrangement in the Consolidated Statement of Assets and Liabilities. OTC Derivatives are presented in the Consolidated Statement of Assets and Liabilities as unrealized appreciation/depreciation on currency forward contracts. Cash collateral pledged or received by the Fund for OTC Derivatives are reported gross in the Consolidated Statement of Assets and Liabilities as cash pledged/(received) as collateral for currency forward contracts. Derivative information by counterparty is presented in the Consolidated Portfolio of Investments.
The netting of assets and liabilities and the offsetting of collateral pledged or received are based on contractual netting/set-off provisions in the ISDA master agreement. The following table presents the Fund’s net exposure for OTC Derivatives that are subject to enforceable master netting arrangements as of December 31, 2017. The net amount represents the receivable from (payable to) the counterparty in the event of a default.
DODGE & COX INTERNATIONAL STOCK FUND §PAGE 13
NOTES TO CONSOLIDATED FINANCIAL STATEMENTS
| | | | | | | | | | | | | | | | |
| Counterparty | | Gross OTC Derivative Assets | | | Gross OTC
Derivative
Liabilities | | | Cash Collateral Pledged /
(Received)(a) | | | Net Amount | |
Bank of America | | $ | — | | | $ | (41,067,703 | ) | | $ | 34,070,000 | | | $ | (6,997,703 | ) |
Citibank | | | 2,220,891 | | | | (76,853,352 | ) | | | — | | | | (74,632,461 | ) |
Credit Suisse | | | — | | | | (5,085,508 | ) | | | — | | | | (5,085,508 | ) |
Goldman Sachs | | | 4,296,736 | | | | (37,451,961 | ) | | | 25,290,000 | | | | (7,865,225 | ) |
HSBC | | | — | | | | (11,149,902 | ) | | | 10,480,000 | | | | (669,902 | ) |
JPMorgan | | | 2,496,509 | | | | (126,224,887 | ) | | | 116,980,000 | | | | (6,748,378 | ) |
UBS | | | — | | | | (14,460,064 | ) | | | 12,250,000 | | | | (2,210,064 | ) |
| | | | | | | | | | | | | | | | |
Total | | $ | 9,014,136 | | | $ | (312,293,377 | ) | | $ | 199,070,000 | | | $ | (104,209,241 | ) |
| | | | | | | | | | | | | | | | |
| | | | | | | | | | | | | | | | | |
| (a) | Cash collateral pledged/(received) in excess of OTC Derivative assets/liabilities, if any, is not presented. Total cash collateral pledged/(received) is presented in the Fund’s Consolidated Statement of Assets and Liabilities. |
NOTE 4—RELATED PARTY TRANSACTIONS
Management fees Under a written agreement approved by a unanimous vote of the Board of Trustees, the Fund pays a management fee monthly at an annual rate of 0.60% of the Fund’s average daily net assets to Dodge & Cox, investment manager of the Fund.
Fund officers and trustees All officers and two of the trustees of the Trust are officers or employees of Dodge & Cox. The Trust pays a fee only to those trustees who are not affiliated with Dodge & Cox.
NOTE 5—INCOME TAX INFORMATION AND DISTRIBUTIONS TO SHAREHOLDERS
A provision for federal income taxes is not required since the Fund intends to continue to qualify as a regulated investment company under Subchapter M of the Internal Revenue Code and distribute all of its taxable income to shareholders. Distributions are determined in accordance with income tax regulations, and such amounts may differ from net investment income and realized gains for financial reporting purposes. Financial reporting records are adjusted for permanent book to tax differences at year end to reflect tax character.
Book to tax differences are primarily due to differing treatments of wash sales, net short-term realized gain (loss), investments in passive foreign investment companies, foreign currency realized gain (loss), and derivatives. At December 31, 2017, the cost of investments in securities and derivatives for federal income tax purposes was $57,320,971,235.
Distributions during the years noted below were characterized as follows for federal income tax purposes.
| | | | | | | | |
| | | Year Ended
December 31, 2017 | | | Year Ended
December 31, 2016 | |
Ordinary income | | $ | 1,246,064,935 | | | $ | 1,186,114,668 | |
| | ($ | 0.892 per share | ) | | ($ | 0.852 per share | ) |
Long-term capital gain | | | — | | | $ | 756,805,234 | |
| | | — | | | ($ | 0.543 per share | ) |
At December 31, 2017, the tax basis components of distributable earnings were as follows:
| | | | |
Unrealized appreciation | | $ | 13,799,638,111 | |
Unrealized depreciation | | | (5,652,660,722 | ) |
| | | | |
Net unrealized appreciation | | | 8,146,977,389 | |
Capital loss carryforward(a) | | | (1,533,865,207 | ) |
Deferred loss(b) | | | (82,697,219 | ) |
| | | | | |
| (a) | Represents accumulated long-term capital loss as of December 31, 2017, which may be carried forward to offset future capital gains. |
| (b) | Represents net realized specified loss and capital loss incurred between November 1, 2017 and December 31, 2017. As permitted by tax regulation, the Fund has elected to treat this loss as arising in 2018. |
Fund management has reviewed the tax positions for open periods (three years and four years, respectively, from filing the Fund’s Federal and State tax returns) as applicable to the Fund, and has determined that no provision for income tax is required in the Fund’s financial statements.
NOTE 6—LOAN FACILITIES
Pursuant to an exemptive order issued by the Securities and Exchange Commission (SEC), the Fund may participate in an interfund lending facility (Facility). The Facility allows the Fund to borrow money from or loan money to the Funds. Loans under the Facility are made for temporary or emergency purposes, such as to fund shareholder redemption requests. Interest on borrowings is the average of the current repurchase agreement rate and the bank loan rate. There was no activity in the Facility during the year.
All Funds in the Trust participate in a $500 million committed credit facility (Line of Credit) with State Street Bank and Trust Company, to be utilized for temporary or emergency purposes to fund shareholder redemptions or for other short-term liquidity purposes. The maximum amount available to the Fund is $250 million. Each Fund pays an annual commitment fee on its pro-rata portion of the Line of Credit. For the year ended December 31, 2017, the Fund’s commitment fee amounted to $384,466 and is reflected as a Miscellaneous Expense in the Consolidated Statement of Operations. Interest on borrowings is charged at the prevailing rate. There were no borrowings on the Line of Credit during the year.
NOTE 7—PURCHASES AND SALES OF INVESTMENTS
For the year ended December 31, 2017, purchases and sales of securities, other than short-term securities, aggregated $10,254,384,268 and $10,930,127,895 respectively.
NOTE 8—SUBSEQUENT EVENTS
Fund management has determined that no material events or transactions occurred subsequent to December 31, 2017, and through the date of the Fund’s financial statements issuance, which require additional disclosure in the Fund’s financial statements.
PAGE 14 § DODGE & COX INTERNATIONAL STOCK FUND
NOTES TO CONSOLIDATED FINANCIAL STATEMENTS
NOTE 9—HOLDINGS OF 5% VOTING SECURITIES
Each of the companies listed below was considered to be an affiliate of the Fund because the Fund owned 5% or more of the company’s voting securities during all or part of the year ended December 31, 2017. Transactions during the year in these securities were as follows:
| | | | | | | | | | | | | | | | | | | | | | | | | | | | | | | | |
| | | Shares at
Beginning of Year | | | Additions | | | Reductions | | | Shares at End of Year | | | Dividend
Income(a) | | | Realized
Gain (Loss) | | | Net Change in Unrealized Appreciation/
Depreciation | | | Value at
End of Year | |
| COMMON STOCKS: 11.6% | | | | | | | | | | | | | | | | | | | | | | | | | | | | | |
| CONSUMER DISCRETIONARY: 1.4% | | | | | | | | | | | | | | | | | | | | | | | | | |
Liberty Global PLC LiLAC, Series A(b) | | | 3,896,557 | | | | 20,480 | | | | — | | | | 3,917,037 | | | $ | — | | | $ | — | | | $ | (7,111,353 | ) | | $ | 78,928,296 | |
Liberty Global PLC, Series A(b) | | | 15,970,087 | | | | 2,783,416 | | | | — | | | | 18,753,503 | | | | — | | | | — | | | | 102,785,882 | | | | 672,125,548 | |
Television Broadcasts, Ltd. | | | 40,022,900 | | | | — | | | | — | | | | 40,022,900 | | | | 4,616,980 | | | | — | | | | 12,669,170 | | | | 144,268,630 | |
Yamaha Motor Co., Ltd. | | | 30,076,100 | | | | — | | | | (13,401,100 | ) | | | 16,675,000 | | | | 14,410,349 | | | | 12,056,143 | | | | 257,723,319 | | | | — | (c) |
| | | | | | | | | | | | | | | | | | | | | | | | | | | | | | | | |
| | | | | | | | | | | | | | | | | | | | | | | | | | | | | | | 895,322,474 | |
| | | | | | | | | | | | | | | | | | | | | | | | | | | | | | | | |
| CONSUMER STAPLES: 0.9% | | | | | | | | | | | | | | | | | | | | | | | | | | | | | |
Magnit PJSC | | | 1,394,237 | | | | 4,038,548 | | | | — | | | | 5,432,785 | | | | 9,532,349 | | | | — | | | | (194,899,598 | ) | | | 597,110,661 | |
| | | | | | | | |
| ENERGY: 0.4% | | | | | | | | | | | | | | | | | | | | | | | | | | | | | | | | |
Saipem SPA(b) | | | 56,980,627 | (d) | | | — | | | | — | | | | 56,980,627 | | | | — | | | | — | | | | (58,699,631 | ) | | | 260,124,666 | |
| | | | | | | | |
| FINANCIALS: 5.7% | | | | | | | | | | | | | | | | | | | | | | | | | | | | | | | | |
AEGON NV | | | 134,654,439 | | | | 7,587,670 | | | | (7,486,579 | ) | | | 134,755,530 | | | | 40,249,418 | | | | (56,388,810 | ) | | | 174,579,067 | | | | 858,832,503 | |
ICICI Bank, Ltd. | | | 364,368,485 | | | | 38,271,259 | | | | (18,456,168 | ) | | | 384,183,576 | | | | 13,974,428 | | | | 7,096,859 | | | | 591,080,878 | | | | 1,885,312,473 | |
Kasikornbank PCL- Foreign | | | 119,975,027 | | | | 21,398,800 | | | | (8,541,100 | ) | | | 132,832,727 | | | | 13,011,312 | | | | 731,041 | | | | 314,060,974 | | | | 970,823,730 | |
| | | | | | | | | | | | | | | | | | | | | | | | | | | | | | | | |
| | | | | | | | | | | | | | | | | | | | | | | | | | | | | | | 3,714,968,706 | |
| | | | | | | | | | | | | | | | | | | | | | | | | | | | | | | | |
| REAL ESTATE: 0.6% | | | | | | | | | | | | | | | | | | | | | | | | | | | | | | | | |
Hang Lung Group, Ltd. | | | 121,585,500 | | | | — | | | | (10,240,100 | ) | | | 111,345,400 | | | | 11,976,764 | | | | (16,997,527 | ) | | | 44,454,613 | | | | 409,619,216 | |
| | | | | | |
| TELCOMMUNICATION SERVICES: 2.6% | | | | | | | | | | | | | | | | | | | | | | | | | |
Millicom International Cellular SA SDR | | | 9,603,136 | | | | — | | | | (899,700 | ) | | | 8,703,436 | | | | 21,192,669 | | | | (37,427,086 | ) | | | 270,430,765 | | | | 587,578,809 | |
MTN Group, Ltd. | | | 88,829,080 | | | | 13,386,300 | | | | — | | | | 102,215,380 | | | | 42,889,939 | | | | — | | | | 195,195,617 | | | | 1,129,848,850 | |
| | | | | | | | | | | | | | | | | | | | | | | | | | | | | | | | |
| | | | | | | | | | | | | | | | | | | | | | | | | | | | | | | 1,717,427,659 | |
| | | | | | | | | | | | | | | | | | | | | | | | | | | | | | | | |
| | | | | | | | | | | | | | | | | | $ | 171,854,208 | | | $ | (90,929,380 | ) | | $ | 1,702,269,703 | | | $ | 7,594,573,382 | |
| | | | | | | | | | | | | | | | | | | | | | | | | | | | | | | | |
| | | | | | | | | | | | | | | | | | | | | | | | | | | | | | | | | |
| (a) | Net of foreign taxes, if any |
| (c) | Company was not an affiliate at year end |
| (d) | Shares reflect a reverse stock split on May 22, 2017 |
DODGE & COX INTERNATIONAL STOCK FUND §PAGE 15
CONSOLIDATED FINANCIAL HIGHLIGHTS
| | | | | | | | | | | | | | | | | | | | |
SELECTED DATA AND RATIOS (for a share outstanding throughout each year) | | Year Ended December 31, | |
| | | 2017 | | | 2016 | | | 2015 | | | 2014 | | | 2013 | |
| | | | |
Net asset value, beginning of year | | | $38.10 | | | | $36.48 | | | | $42.11 | | | | $43.04 | | | | $34.64 | |
Income from investment operations: | | | | | | | | | | | | | | | | | | | | |
Net investment income | | | 0.70 | | | | 0.82 | | | | 0.79 | | | | 0.98 | | | | 0.70 | |
Net realized and unrealized gain (loss) | | | 8.41 | | | | 2.19 | | | | (5.58 | ) | | | (0.94 | ) | | | 8.40 | |
| | | | |
Total from investment operations | | | 9.11 | | | | 3.01 | | | | (4.79 | ) | | | 0.04 | | | | 9.10 | |
| | | | |
Distributions to shareholders from: | | | | | | | | | | | | | | | | | | | | |
Net investment income | | | (0.89 | ) | | | (0.85 | ) | | | (0.84 | ) | | | (0.97 | ) | | | (0.70 | ) |
Net realized gain | | | — | | | | (0.54 | ) | | | — | | | | — | | | | — | |
| | | | |
Total distributions | | | (0.89) | | | | (1.39 | ) | | | (0.84 | ) | | | (0.97 | ) | | | (0.70 | ) |
| | | | |
Net asset value, end of year | | | $46.32 | | | | $38.10 | | | | $36.48 | | | | $42.11 | | | | $43.04 | |
| | | | |
Total return | | | 23.94 | % | | | 8.26 | % | | | (11.35 | )% | | | 0.07 | % | | | 26.31 | % |
Ratios/supplemental data: | | | | | | | | | | | | | | | | | | | | |
Net assets, end of year (millions) | | | $65,670 | | | | $54,187 | | | | $57,029 | | | | $64,040 | | | | $53,616 | |
Ratios of expenses to average net assets | | | 0.63 | % | | | 0.64 | % | | | 0.64 | % | | | 0.64 | % | | | 0.64 | % |
Ratios of net investment income to average net assets | | | 1.57 | % | | | 2.12 | % | | | 1.86 | % | | | 2.39 | % | | | 1.85 | % |
Portfolio turnover rate | | | 17 | % | | | 17 | % | | | 18 | % | | | 12 | % | | | 13 | % |
See accompanying Notes to Consolidated Financial Statements
PAGE 16 § DODGE & COX INTERNATIONAL STOCK FUND
REPORT OF INDEPENDENT REGISTERED PUBLIC ACCOUNTING FIRM
To the Board of Trustees of the Dodge & Cox Funds and Shareholders of Dodge & Cox International Stock Fund
Opinion on the Financial Statements
We have audited the accompanying consolidated statement of assets and liabilities, including the consolidated portfolio of investments, of Dodge & Cox International Stock Fund (one of the funds constituting Dodge & Cox Funds, referred to hereafter as the “Fund”) as of December 31, 2017, the related consolidated statement of operations for the year ended December 31, 2017, the consolidated statement of changes in net assets for each of the two years in the period ended December 31, 2017, including the related notes, and the consolidated financial highlights for each of the five years in the period ended December 31, 2017 (collectively referred to as the “consolidated financial statements”). In our opinion, the consolidated financial statements present fairly, in all material respects, the financial position of the Fund as of December 31, 2017, the results of their operations for the year then ended, the changes in their net assets for each of the two years in the period ended December 31, 2017 and the financial highlights for each of the five years in the period ended December 31, 2017 in conformity with accounting principles generally accepted in the United States of America.
Basis for Opinion
These consolidated financial statements are the responsibility of the Fund’s management. Our responsibility is to express an opinion on the Fund’s consolidated financial statements based on our audits. We are a public accounting firm registered with the Public Company Accounting Oversight Board (United States) (“PCAOB”) and are required to be independent with respect to the Fund in accordance with the U.S. federal securities laws and the applicable rules and regulations of the Securities and Exchange Commission and the PCAOB.
We conducted our audits of these consolidated financial statements in accordance with the standards of the PCAOB. Those standards require that we plan and perform the audit to obtain reasonable assurance about whether the consolidated financial statements are free of material misstatement, whether due to error or fraud.
Our audits included performing procedures to assess the risks of material misstatement of the consolidated financial statements, whether due to error or fraud, and performing procedures that respond to those risks. Such procedures included examining, on a test basis, evidence regarding the amounts and disclosures in the consolidated financial statements. Our audits also included evaluating the accounting principles used and significant estimates made by management, as well as evaluating the overall presentation of the consolidated financial statements. Our procedures included confirmation of securities owned as of December 31, 2017 by correspondence with the custodian, transfer agent and brokers; when replies were not received from brokers, we performed other auditing procedures. We believe that our audits provide a reasonable basis for our opinion.
PricewaterhouseCoopers LLP
San Francisco, California
February 16, 2018
We have served as the auditor of one or more investment companies in the Dodge & Cox Funds since 1931.
DODGE & COX INTERNATIONAL STOCK FUND §PAGE 17
SPECIAL 2017 TAX INFORMATION
(unaudited)
The following information is provided pursuant to provisions of the Internal Revenue Code:
In 2017, the Fund elected to pass through to shareholders foreign source income of $1,477,128,714 and foreign taxes paid of $136,506,323.
The Fund designates up to a maximum of $1,396,377,512 of its distributions paid to shareholders in 2017 as qualified dividends (treated for federal income tax purposes in the hands of shareholders as taxable at a maximum rate of 20%).
For shareholders that are corporations, the Fund designates 1% of its ordinary dividends paid to shareholders in 2017 as dividends from domestic corporations eligible for the corporate dividends received deduction, provided that the shareholder otherwise satisfies applicable requirements to claim that deduction.
BOARD APPROVAL OF FUNDS’ INVESTMENT MANAGEMENT AGREEMENTS AND MANAGEMENT FEES
(unaudited)
The Board of Trustees is responsible for overseeing the performance of the Dodge & Cox Funds’ investment manager and determining whether to continue the Investment Management Agreements between the Funds and Dodge & Cox each year (the “Agreements”). At a meeting of the Board of Trustees of the Trust held on December 14, 2017, the Trustees, by a unanimous vote (including a separate vote of those Trustees who are not “interested persons” (as defined in the Investment Company Act of 1940) (the “Independent Trustees”)), approved the renewal of the Agreements for an additional one-year term through December 31, 2018 with respect to each Fund. During the course of the year, the Board received extensive information and materials relating to the investment management and administrative services provided by Dodge & Cox and the performance of each of the Funds.
INFORMATION RECEIVED
In 2016 and 2017, the Board requested, received, and discussed a number of special presentations on topics relevant to their consideration of the proposed renewal of the Funds’ Agreements. In addition to the foregoing and in advance of the meetings referred to below, the Board, including the Independent Trustees, requested, received, and reviewed materials relating to the Agreements and the services provided by Dodge & Cox. The Independent Trustees retained Morningstar to prepare an independent expense and performance summary for each Fund and comparable funds managed by other advisers identified by Morningstar. The Morningstar materials included information regarding advisory fee rates, expense ratios, and transfer agency, custodial, and distribution expenses, as well as performance comparisons to each Fund’s peer group and to a broad-based securities index or combination of indices. The Morningstar materials also included a comparison of expenses of various share classes offered by comparable funds. The materials reviewed by the Board contained information concerning, among other things,
Dodge & Cox’s profitability, financial results and condition, advisory fee revenue, and separate account fee schedules. The Board additionally considered the Funds’ brokerage commissions, turnover rates, sales and redemption data, and the significant investment that Dodge & Cox makes in research used in managing the Funds. The Board received and reviewed memoranda and related materials addressing, among other things, Dodge & Cox’s services to the Funds; how Dodge & Cox Funds’ fees compare to fees of peer group funds; the different fees, services, costs, and risks associated with other accounts managed by Dodge & Cox as compared to the Dodge & Cox Funds; and the ways in which the Funds realize economies of scale. Throughout the process of reviewing the services provided by Dodge & Cox and preparing for the meeting, the Independent Trustees found Dodge & Cox to be open, forthright, detailed, and very helpful in answering questions about all issues. The Board received copies of the Agreements and a memorandum from the independent legal counsel to the Independent Trustees discussing the factors generally regarded as appropriate to consider in evaluating advisory arrangements. The Trust’s Contract Review Committee, consisting solely of Independent Trustees, met with the independent legal counsel on November 9, 2017 and again on December 14, 2017 to discuss whether to renew the Agreements. The Board, including the Independent Trustees, subsequently concluded that the existing Agreements are fair and reasonable and voted to approve the Agreements. In considering the Agreements, the Board, including the Independent Trustees, did not identify any single factor or particular information as all-important or controlling. In reaching the decision to approve the Agreements, the Board considered several factors, discussed below, to be key factors and reached the conclusions described below.
NATURE, QUALITY, AND EXTENT OF THE SERVICES
The Board considered that Dodge & Cox provides a wide range of services to the Funds in addition to portfolio management. The extensive nature of services provided by Dodge & Cox has been documented in materials provided to the Board and in presentations made to the Board throughout the year. In particular, the Board considered the nature, quality, and extent of portfolio management, administrative, and shareholder services performed by Dodge & Cox. With regard to portfolio management services, the Board considered Dodge & Cox’s established long-term history of care and conscientiousness in the management of the Funds; its demonstrated consistency in investment approach and depth; the background and experience of the Dodge & Cox U.S. Equity Investment Committee, International Equity Investment Committee, Global Equity Investment Committee, U.S. Fixed Income Investment Committee, and Global Fixed Income Investment Committee, and research analysts responsible for managing the Funds; Dodge & Cox’s methods for assessing the regulatory and investment climate in various jurisdictions; its overall high level of attention to its core investment management function; and its commitment to the Funds and their shareholders. The Board also considered analysis provided by Morningstar regarding the degree of active management in the Dodge & Cox
PAGE 18 § DODGE & COX INTERNATIONAL STOCK FUND
equity funds and concluded that Dodge & Cox is an active, high conviction manager of equity portfolios, not a “closet index” manager.
In the area of administrative and shareholder services, the Board considered the quality of Dodge & Cox’s work in areas such as compliance, legal services, trading, operations, proxy voting, technology, oversight of the Funds’ transfer agent and custodian/fund accounting agent, tax compliance, risk management, shareholder support, and shareholder communication through its website and other means. The Board also noted Dodge & Cox’s disclosure policy, its compliance record, and its reputation as a trusted, shareholder-friendly mutual fund family.
In addition, the Board considered that Dodge & Cox manages approximately $200 billion in Fund assets with fewer professionals than most comparable funds, and that on average these professionals have more experience and longer tenure than investment professionals at comparable funds. The Board also noted that Dodge & Cox is an investment research-oriented firm with no other business endeavors to distract management’s attention from its research efforts or to present material conflicts of interest with the operations of the Funds, that its investment professionals adhere to a consistent investment approach across the Funds, and that due to its careful and deliberate strategy with respect to new products, Dodge & Cox has had remarkable stability in its mutual fund product offerings over the course of the past 87 years and has the fewest funds of any of the 25 largest mutual fund families by assets. The Board further considered the “Gold” analyst rating awarded by Morningstar to all of the Funds (other than the Global Bond Fund). The Board concluded that it was satisfied with the nature, extent, and quality of investment management and other services provided to the Funds by Dodge & Cox.
INVESTMENT PERFORMANCE
The Board considered short-term and long-term investment performance for each Fund (including periods of outperformance or underperformance) as compared to both relevant indices and the performance of such Fund’s peer group. In assessing the performance of the Funds, the Board considered the Funds’ investment returns over various periods and the volatility thereof and concluded that the levels experienced were consistent with Dodge & Cox’s long-term approach and active investment style. The Board determined after extensive review and inquiry that Dodge & Cox’s historic, long-term, team-oriented, bottom-up investment approach remains consistent and that Dodge & Cox continues to be distinguished by its integrity, transparency, and independence. The Board considered that the performance of the Funds is the result of a value-oriented investment management process that emphasizes a long-term investment horizon, comprehensive independent research, a team approach, price discipline, low cost, and low portfolio turnover. The Board also considered that the investment performance delivered by Dodge & Cox to the Funds appeared to be consistent with the relevant performance delivered for other clients of Dodge & Cox. The Board concluded that Dodge & Cox has delivered favorable
long-term performance for Fund investors consistent with the long-term investment strategies being pursued by the Funds.
COSTS AND ANCILLARY BENEFITS
Costs of Services to Funds: Fees and Expenses. The Board considered each Fund’s management fee rate and expense ratio relative to each Fund’s peer group and relative to management fees charged by Dodge & Cox to other clients. In particular, the Board considered that the Funds continue to be below their peer group median in expense ratios and that many media and industry reports specifically comment on the low cost of the Funds, which have been a defining characteristic of the Funds for many years. The Board also evaluated the operating structures of the Funds and Dodge & Cox, noting that the Funds do not charge front-end sales commissions or distribution fees, and Dodge & Cox bears, among other things, the significant cost of third party research, reimbursement for shareholder recordkeeping and administrative costs to third-party retirement plan administrators, and administrative and office overhead. The Board noted that expenses are well below industry averages.
When compared to peer group funds, the Funds are in the quartile with the lowest expense ratios. The Board also considered that the Funds receive numerous administrative, regulatory compliance, legal, operational, technology, tax compliance, risk management, and shareholder support services from Dodge & Cox without any additional administrative fee and that the Funds have relatively low transaction costs and portfolio turnover rates. The Board noted the Funds’ unusual single-share-class structure and reviewed Morningstar data (including asset-weighted average expense ratios) showing that the few peer group funds with lower expense ratios often have other share classes with significantly higher expense ratios than the Funds’. In this regard, the Board considered that many of the Funds’ shareholders would not be eligible to purchase comparably priced shares of many peer group funds, which typically make their lower-priced share classes available only to institutional investors. The Board determined that the Funds provide access for small investors to high quality investment management at a relatively low cost. The Board also considered that the Funds are priced to scale, i.e., management fee rates begin at relatively low levels with the result that, even without breakpoints, the Funds’ management fee rates are lower than those of many peer funds whose fee schedules include breakpoints. With respect to non-U.S. funds sponsored and managed by Dodge & Cox that are comparable to the Funds in many respects, the Board noted that the fee rates charged by Dodge & Cox are the same as or higher than the fee rates charged to the Funds.
The Board reviewed information regarding the fee rates Dodge & Cox charges to separate accounts that have investment programs similar to those of the Funds, including instances where separate account fees are lower than Fund fees. The Board considered the significant differences in the nature and scope of services Dodge & Cox provides to the Funds as compared to other client accounts, as well as material differences in regulatory, litigation, and other risks as between Dodge & Cox Funds and
DODGE & COX INTERNATIONAL STOCK FUND §PAGE 19
other types of clients. The Board noted that different markets exist for mutual fund and institutional separate account management services and that a comparison of Fund fee rates and separate account fee rates must consider the fact that separate account clients bear additional costs and responsibilities that are included in the cost of a Fund. The Board further noted that many sophisticated institutional investors in the Funds that are eligible to open separate accounts at Dodge & Cox have decided for various reasons to invest in the Funds. After consideration of these matters, the Board concluded that the overall costs incurred by the Funds for the services they receive (including the management fee paid to Dodge & Cox) are reasonable and that the fees are acceptable based upon the qualifications, experience, reputation, and performance of Dodge & Cox and the low overall expense ratios of the Funds.
Profitability and Costs of Services to Dodge & Cox; “Fall-out” Benefits. The Board reviewed reports of Dodge & Cox’s financial position, profitability, and estimated overall value and considered Dodge & Cox’s overall profitability within its context as a private, employee-owned S-Corporation and relative to the favorable services provided. The Board noted in particular that Dodge & Cox’s profits are not generated by high fee rates, but reflect an extraordinarily streamlined, efficient, and focused business approach toward investment management.
The Board recognized the importance of Dodge & Cox’s profitability—which is derived solely from management fees and does not include other business ventures—to maintain its independence, stability, company culture and ethics, and management continuity. The Board also considered that the compensation/profit structure at Dodge & Cox includes a return on shareholder employees’ investment in the firm, which is vital for remaining independent and facilitating retention of management and investment professionals. The Board also considered that in January 2015, Dodge & Cox closed the International Stock Fund to new investors to proactively manage the growth of the Fund. The Stock Fund and Balanced Fund were similarly closed to new investors during periods of significant growth in the past. While these actions are intended to benefit existing Fund shareholders, the effect is to reduce potential revenues to Dodge & Cox from new shareholders.
The Board also considered potential “fall-out” benefits (including the receipt of research from unaffiliated brokers and reputational benefits to non-U.S. funds sponsored and managed by Dodge & Cox) that Dodge & Cox might receive as a result of its association with the Funds and determined that they are acceptable. The Board also noted that Dodge & Cox continues to invest substantial sums in its business in order to provide enhanced services, systems, and research capabilities, all of which benefit the Funds. The Board concluded that Dodge & Cox’s profitability is the keystone of its independence, stability, and long-term investment performance and that the profitability of Dodge & Cox’s relationship with the Funds (including fall-out benefits) is fair and reasonable.
ECONOMIES OF SCALE
The Board considered whether there have been economies of scale with respect to the management of each Fund, whether the Funds have appropriately benefited from any economies of scale, and whether the management fee rate is reasonable in relation to the level of Fund assets and any economies of scale that may exist. In the Board’s view, any consideration of economies of scale must take account of the Funds’ low fee and expense structure and of the fact that each Fund’s shareholders have benefited from the Fund’s relatively low fee structure from the time of each Fund’s inception (i.e., from the first dollar). An assessment of economies of scale must also take into account that Dodge & Cox invests significant time and resources in each new Fund for months (and sometimes years) prior to launch; in addition, in a Fund’s early periods of operations, expenses are capped, which means that Dodge & Cox subsidizes the operations of a new Fund for a period of time until it reaches scale. The Board also observed that, while total Fund assets have grown significantly over the long term, this growth has not been continuous or evenly distributed across all of the Funds (for example, the total assets of the Balanced Fund have actually declined over the past ten years).
In addition, the Board noted that Dodge & Cox has shared the benefits of economies of scale with the Funds by adding and enhancing services to the Funds over time, and that Dodge & Cox’s internal costs of providing investment management, technology, administrative, legal, and compliance services to the Funds continue to increase. For example, Dodge & Cox has increased its global research staff and investment resources over the years to add important new capabilities for the benefit of Fund shareholders and to address the increased complexity of investing in multinational and non-U.S. companies. In addition, Dodge & Cox has made substantial expenditures in other staff, technology, and infrastructure to enable it to integrate credit and equity analyses and to implement its strategy in a more effective and secure manner. Over the last ten years, Dodge & Cox has increased its spending on research, investment management, client servicing, cybersecurity, technology, third party research, data services, and computer systems for trading, operations, compliance, accounting, and communications at a rate that has significantly outpaced the Funds’ growth rate during the same period. The Board considered that Dodge & Cox has a history of voluntarily limiting asset growth in several Funds that experienced significant inflows by closing them to new investors in order to protect the Funds’ ability to achieve good investment returns for shareholders. The Board also observed that, even without fee breakpoints, the Funds are competitively priced in a very competitive market and that having a low fee from inception is better for shareholders than starting with a higher fee and adding breakpoints. The Board also noted that there are certain diseconomies of scale associated with managing large funds, insofar as certain of the costs and risks associated with portfolio management increase as assets grow. The Board concluded that the current Dodge & Cox fee structure is fair and reasonable and adequately shares economies of scale that may exist.
PAGE 20 § DODGE & COX INTERNATIONAL STOCK FUND
CONCLUSION
Based on their evaluation of all material factors and assisted by the advice of independent legal counsel to the Independent Trustees, the Board, including the Independent Trustees, concluded that the advisory fee structure was fair and reasonable, that each Fund was paying a competitive fee for the services provided, that Dodge & Cox’s services have provided value for Fund shareholders over the long term, and that approval of the Agreements was in the best interests of each Fund and its shareholders.
DODGE & COX INTERNATIONAL STOCK FUND §PAGE 21
FUND HOLDINGS
The Fund provides a complete list of its holdings four times each fiscal year, as of the end of each quarter. The Fund files the lists with the Securities and Exchange Commission (SEC) on Form N-CSR (second and fourth quarters) and Form N-Q (first and third quarters). Shareholders may view the Fund’s Forms N-CSR and N-Q on the SEC’s website at sec.gov. Forms N-CSR and N-Q may also be reviewed and copied at the SEC’s Public Reference Room in Washington, DC. Information regarding the operations of the Public Reference Room may be obtained by calling 800-SEC-0330. A list of the Fund’s quarter-end holdings is also available at dodgeandcox.com on or about 15 days following each quarter end and remains available on the website until the list is updated in the subsequent quarter.
PROXY VOTING
For a free copy of the Fund’s proxy voting policies and procedures, please call 800-621-3979, visit the Fund’s website at dodgeandcox.com, or visit the SEC’s website at sec.gov. Information regarding how the Fund voted proxies relating to portfolio securities during the most recent 12-month period ending June 30 is also available at dodgeandcox.com or at sec.gov.
HOUSEHOLD MAILINGS
The Fund routinely mails shareholder reports and summary prospectuses to shareholders and, on occasion, proxy statements. In order to reduce the volume of mail, when possible, only one copy of these documents will be sent to shareholders who are part of the same family and share the same residential address.
If you have a direct account with the Funds and you do not want the mailing of shareholder reports and summary prospectuses combined with other members in your household, contact the Funds at 800-621-3979. Your request will be implemented within 30 days.
PAGE 22 § DODGE & COX INTERNATIONAL STOCK FUND
DODGE & COX FUNDS—EXECUTIVE OFFICER & TRUSTEE INFORMATION
| | | | | | |
Name (Age) and
Address* | | Position with Trust (Year of Election or
Appointment) | | Principal Occupation During Past 5 Years | | Other Directorships Held by Trustees |
| INTERESTED TRUSTEES AND EXECUTIVE OFFICERS |
| Charles F. Pohl (59) | | Chairman and Trustee (Since 2014) | | Chairman (since 2013) and Director of Dodge & Cox; Chief Investment Officer, member of U.S. Equity Investment Committee (USEIC), Global Equity Investment Committee (GEIC), International Equity Investment Committee (IEIC), and U.S. Fixed Income Investment Committee (USFIIC), Portfolio Manager, and Investment Analyst; Co-President (2011-2013) | | — |
| Dana M. Emery (56) | | President and Trustee (Trustee since 1993) (President since 2014) | | Chief Executive Officer (since 2013), President, and Director of Dodge & Cox; Director of Fixed Income and member of USFIIC and Global Fixed Income Investment Committee (GFIIC); Co-President (2011-2013) | | — |
| Diana S. Strandberg (58) | | Senior Vice President (Since 2006) | | Senior Vice President and Director of Dodge & Cox; Director of International Equity and member of USEIC, GEIC, IEIC and GFIIC; Portfolio Manager and Investment Analyst | | — |
Roberta R.W. Kameda (57) | | Secretary (Since 2017) | | Vice President, General Counsel, and Secretary (since 2017) of Dodge & Cox | | — |
| David H. Longhurst (60) | | Treasurer (Since 2006) | | Vice President and Assistant Treasurer of Dodge & Cox | | — |
| Katherine M. Primas (43) | | Chief Compliance Officer (Since 2010) | | Vice President and Chief Compliance Officer of Dodge & Cox | | — |
| INDEPENDENT TRUSTEES |
Caroline M. Hoxby (51) | | Trustee (Since 2017) | | Professor of Economics, Stanford University; Director of the Economics of Education Program, National Bureau of Economic Research; Senior Fellow, Hoover Institution and Stanford Institute for Economic Policy Research | | — |
| Thomas A. Larsen (68) | | Trustee (Since 2002) | | Senior Counsel of Arnold & Porter (law firm) (since 2013); Partner of Arnold & Porter (until 2012); Director of Howard, Rice, Nemerovski, Canady, Falk & Rabkin (1977-2011) | | — |
| Ann Mather (57) | | Trustee (Since 2011) | | CFO, Pixar Animation Studios (1999-2004) | | Director, Alphabet Inc. (internet information services) (since 2005); Director, Glu Mobile, Inc. (multimedia software) (since 2004); Director, Netflix, Inc. (internet television) (since 2010); Director, Arista Networks (cloud networking) (since 2013); Director, Shutterfly, Inc. (internet photography services/publishing) (since 2013) |
| Robert B. Morris III (65) | | Trustee (Since 2011) | | Advisory Director, The Presidio Group (2005-2016); Partner and Managing Director—Global Investment Research at Goldman Sachs (until 2001) | | — |
| Gary Roughead (66) | | Trustee (Since 2013) | | Robert and Marion Oster Distinguished Military Fellow, Hoover Institution (since 2012); Admiral, United States Navy (Ret.); U.S. Navy Chief of Naval Operations (2008-2011) | | Director, Northrop Grumman Corp. (global security) (since 2012); Director, Maersk Line, Limited (shipping and transportation) (since 2016) |
| Mark E. Smith (66) | | Trustee (Since 2014) | | Executive Vice President, Managing Director—Fixed Income at Loomis Sayles & Company, L.P. (2003-2011) | | — |
| John B. Taylor (71) | | Trustee (Since 2005) (and 1995-2001) | | Professor of Economics, Stanford University (since 1984); Senior Fellow, Hoover Institution (since 1996); Under Secretary for International Affairs, United States Treasury (2001-2005) | | — |
| * | | The address for each Officer and Trustee is 555 California Street, 40th Floor, San Francisco, California 94104. Each Officer and Trustee oversees all six series in the Dodge & Cox Funds complex and serves for an indefinite term. |
Additional information about the Trust’s Trustees and Officers is available in the Trust’s Statement of Additional Information (SAI). You can get a free copy of the SAI by visiting the Funds’ website at dodgeandcox.com or calling
800-621-3979.
DODGE & COX INTERNATIONAL STOCK FUND §PAGE 23
dodgeandcox.com
For Fund literature, transactions, and account information, please visit the Funds’ website.
or write or call:
DODGE & COX FUNDS
c/o DST Asset Manager Solutions, Inc.
P.O. Box 8422
Boston, Massachusetts 02266-8422
(800) 621-3979
INVESTMENT MANAGER
Dodge & Cox
555 California Street, 40th Floor
San Francisco, California 94104
(415) 981-1710
This report is submitted for the general information of the shareholders of the Fund. The report is not authorized for distribution to prospective investors in the Fund unless it is accompanied by a current prospectus.
This report reflects our views, opinions, and portfolio holdings as of December 31, 2017, the end of the reporting period. Any such views are subject to change at any time based upon market or other conditions and Dodge & Cox disclaims any responsibility to update such views. These views may not be relied on as investment advice and, because investment decisions for a Dodge & Cox Fund are based on numerous factors, may not be relied on as an indication of trading intent on behalf of any Dodge & Cox Fund.
DODGE & COX FUNDS®
Annual Report
December 31, 2017
Balanced Fund
ESTABLISHED 1931
TICKER: DODBX
12/17 BF AR Printed on recycled paper
TO OUR SHAREHOLDERS
The Dodge & Cox Balanced Fund had a total return of 12.6% for the year ended December 31, 2017, compared to a return of 14.2% for the Combined Index (a 60/40 blend of stocks and fixed income securities).
MARKET COMMENTARY
U.S. equity markets continued to climb steadily during the fourth quarter, capping off a year of strong performance and low volatility. The S&P 500 reached an all-time high in mid-December and ended the year up nearly 22%. The period of sustained performance in U.S. equities since March 2009 is the second longest in U.S. history.
In fixed income, the U.S. investment-grade bond market delivered a 3.5% return in 2017, driven primarily by strong performance from corporate bonds. Short-term yields rose 70 basis points(a) (bps) due in part to Federal Reserve (Fed) rate hikes, while longer-term rates remained relatively unchanged—resulting in the flattest yield curve since 2007. In addition to the Fed’s actions, a number of other factors influenced markets over the course of the year, including generally healthy economic data and the prospect of business-friendly tax cuts.
INVESTMENT STRATEGY
We set the Fund’s asset allocation based on our long-term outlook for the Fund’s equity and fixed income holdings. At year end, the Fund’s 71% equity weighting (including 5% in preferred stocks) reflected our more positive outlook for total return potential from equities than from fixed income. We believe the equity and fixed income portfolios are well positioned, and we remain optimistic about the long-term outlook for the Fund.
EQUITY STRATEGY: FINDING OPPORTUNITIES IN HEALTH CARE AND ENERGY
At Dodge & Cox, our strong price discipline is an essential component of our investment strategy. Investment returns hinge on the purchase price: a good company is not always a good investment if the starting valuation is too high. We seek to invest in companies with valuations that do not fully reflect prospects for the company and where our analysis suggests the possibility of more positive developments. We constantly weigh valuation against company fundamentals and re-evaluate our thinking as prices change.
In response to diverging valuations, we made a number of gradual portfolio adjustments during 2017. We trimmed selected Information Technology, Media, and Financials holdings that had performed strongly. The portfolio’s largest sale was DXC Technology, the company formed through the merger of Hewlett Packard Enterprise’s services division and Computer Sciences Corporation. As a result of the Fund’s investment in Hewlett Packard Enterprise, the Fund received DXC shares in April 2017, and the stock performed strongly. While the CEO has an impressive track record of shareholder value creation, management’s three-year plan embedded high expectations for
margin expansion and earnings growth. We questioned whether these targets, even if achieved, would be sustainable over the long term. These concerns, combined with DXC’s higher valuation, led us to sell the stock (up 36% over the holding period). We redeployed these proceeds, and others, into more attractively valued companies in the Health Care and Energy sectors, where our long-term outlook is more positive than that of many other investors.
Health Care
In the Pharmaceuticals industry, we believe valuations are compelling, reflecting regulatory and pricing concerns. As a result of industry consolidation and higher market shares, pharmacy benefit managers have been able to exert increased pricing pressure on drug manufacturers. This trend could impact long-term profitability for pharmaceutical companies. Despite these challenges, the FDA has recently increased the pace of new drug approvals. Most of the portfolio’s pharmaceutical companies feature durable franchises with significant barriers to entry and growth potential from new discoveries and expansion into emerging markets.
Based on our evaluation of the risks and opportunities, the portfolio has significant exposure to the Pharmaceuticals and Biotechnology industries (14.3% compared to 7.4% for the S&P 500(b)). In 2017, we added tactically to several holdings as valuations became more attractive and initiated three new positions: Eli Lilly, Gilead Sciences, and GlaxoSmithKline.(c)
GlaxoSmithKline
The Fund recently re-established a position in GlaxoSmithKline, after selling it in 2015. Based in the United Kingdom, the company has leading therapeutic franchises in respiratory care and HIV. In addition to its traditional pharmaceuticals business, the company is diversified through strong and growing businesses in vaccines and over-the-counter consumer health.
In 2015, we sold GlaxoSmithKline based on market headwinds and a higher valuation. The company’s pharmaceuticals business was suffering from pricing pressure on a key respiratory drug, Advair, and the pipeline of new drug launches was weak. The valuation, at 20 times forward earnings, was relatively expensive and did not sufficiently compensate for the risks. Some of those risks, including continued weakness in Advair sales, materialized, and the valuation declined after we sold the position.
In the second half of 2017, however, we built a position in GlaxoSmithKline again based on a more favorable fundamental long-term outlook and a lower valuation (12 times forward earnings). In the respiratory care division, declines in Advair sales should be offset by new drugs, aided by a new inhaler. The HIV segment is growing at healthy rates due to increased adoption of Dolutegravir, a drug that blocks an enzyme needed for HIV to replicate. Combined with continued growth in vaccines and consumer health, the company should achieve modest earnings growth. Meanwhile, the management team has also been revamped. The new CEO is focusing on renewing the
PAGE 2 § DODGE & COX BALANCED FUND
pharmaceutical pipeline and has brought in a well-regarded head of research and development to lead that effort. Improvements in the drug pipeline will take time to manifest, but in the meantime, the company continues to generate stable cash flow and has an attractive 6% dividend yield. On December 31, GlaxoSmithKline was a 1.4% position in the equity portfolio.
Energy
While Energy was the second-worst performing sector (down 1%) of the S&P 500 during 2017, we continue to believe Energy is an attractive area of the market. Global supply and demand fundamentals are supportive of higher oil prices. Demand growth in the developing world continues to be healthy, and the dearth of investment in new supply over the past few years should lead to a tighter balance. We conduct ongoing research to test our investment thesis and recently met with industry executives and experts in Houston and the Middle East. Our trips reaffirmed that development costs in U.S. shale oil are rising with more activity and that many other global sources of new supply are likely needed to satisfy demand. Our research also reinforced the importance of investing in oil producers with assets on the low end of the cost curve and management teams that are investing counter-cyclically.
The portfolio remains modestly overweight the Energy sector (7.6% compared to 6.1% for the S&P 500), primarily due to investments in the Energy Equipment & Services (Oil Services) industry and growing exposure to exploration and production (E&P) companies. Oil services companies are particularly appealing due to their strong franchises and ability to expand earnings as producers reinvest in projects to meet growing global demand. Given attractive valuations, we recently added to selected holdings, including Anadarko Petroleum (a leading global E&P company with strong operational capabilities) and Baker Hughes.
Baker Hughes, a GE Company
We have held Baker Hughes in the Fund since 1998, actively adding to and trimming from the position given relative valuation opportunities and changing fundamentals over the years. In July 2017, GE Oil & Gas completed its acquisition of Baker Hughes, forming Baker Hughes GE (BHGE), now the second largest oilfield services company in the world after Schlumberger (also held in the equity portfolio, 1.5% at year end). By combining oilfield services (Baker Hughes) and oilfield equipment (GE Oil & Gas) businesses, BHGE is the only company that serves the upstream, midstream, and downstream segments of the Oil, Gas, and Consumable Fuels industry.
Adjusting for the $17.50 per share cash dividend the Fund received in July, the stock was weak in 2017. While oil service activity levels have started to rebound in North America due to the resurgence of U.S. shale oil, hopes for an international recovery have been delayed. During the second half of 2017, we added to BHGE given its lower valuation, earnings growth potential, diversified business model, and financial strength. Management is targeting a $1.6 billion improvement in EBITDA, driven by 75% cost savings and 25% revenue synergies. There is a long-term opportunity for BHGE to increase its market share with its improved scale. BHGE’s leadership position in compressors and
turbines generates long-term service contracts with attractive recurring revenue, which should reduce downside volatility. In addition, the company has a healthy balance sheet and recently announced a $3 billion share buyback. We believe BHGE provides attractive risk-reward diversification to the Fund’s Energy portfolio. The company was a 0.9% position in the equity portfolio on December 31.
FIXED INCOME STRATEGY
Our experienced and integrated team of fixed income investment professionals has looked for ways to add durable yield in an environment with less attractive opportunities in the market. Fuller valuations—U.S. credit spreads contracted by almost 30 bps—compelled us to continue to reduce credit(d) exposure in 2017. While we are comfortable with the portfolio’s current holdings, which we believe to be fairly valued relative to individual issuer fundamentals, these actions have reduced the portfolio’s yield advantage (49 bps at year end versus 82 bps at the beginning of the year) versus the Bloomberg Barclays U.S. Aggregate Bond Index (Bloomberg Barclays U.S. Agg).
We made other smaller adjustments to portfolio positioning throughout the year but retain the same general themes. We maintain a defensive posture with respect to interest rate risk, with a portfolio duration(e) of 4.3 years (compared to 6.0 years for the Bloomberg Barclays U.S. Agg). Despite the aforementioned reductions, the portfolio maintains sizeable credit exposure at 44% (13 percentage points more than the index), of which 37% is sourced from corporate bonds and 7% from government-related securities. The portfolio maintains 40% in securitized (primarily Agency(f) MBS) holdings, and the portfolio’s 15% weighting in U.S. Treasuries represents “dry powder” we can deploy as we uncover interesting opportunities and/or wait for a more interesting valuation environment.
Credit: Reducing Idiosyncratic Exposures at Fuller Valuations
Since early 2016, we have been selectively trimming the portfolio’s credit exposure into a strengthening market. Individual issuer trims reduced the portfolio’s credit weighting by two percentage points in 2017, following a similar decrease in 2016. The most recent year’s reductions were achieved through a combination of tactical, relative value-driven trims (e.g., Capital One, Dell, Kinder Morgan) and by taking advantage of liability management exercises (tender offers, make-whole calls) undertaken by corporate issuers (e.g., Cemex, Cigna, Time Warner, Vulcan Materials, Xerox). These companies offered attractive terms (higher-than-market prices) to buy back their debt primarily to retire high-coupon debt, extend maturities, and/or take advantage of related tax deductions prior to the expected implementation of tax reform. Attractively priced tenders like these provided the opportunity to selectively reduce exposure without incurring transaction costs.
At current valuations, the credit sector as a whole offers a less compelling value proposition relative to previous periods over the last decade but still represents reasonable value relative to alternatives. Corporate fundamentals are strong, with no obvious
DODGE & COX BALANCED FUND §PAGE 3
catalyst for broad-based deterioration. Profitability is robust, and liquidity is available for all but the most challenged issuers. Additionally, the operating environment is healthy, with strong and synchronized global growth, business-friendly policies likely to come out of Washington, and robust demand for credit. Furthermore, as active managers we seek to generate an above-market yield through our security selection efforts and have a portfolio that is differentiated from the broad credit market. Demonstrating this fact, the portfolio’s credit holdings offer a yield premium(g) of 167 bps, almost twice that of the broad investment-grade Credit Index (89 bps).
Stable MBS Weighting, but Alert to New Opportunities
The portfolio’s MBS performed well in 2017, benefiting from a benign interest rate environment and muted refinancing activity among the portfolio’s favored holdings. We kept the MBS weighting stable throughout 2017 at roughly a third of the portfolio.
The MBS market garnered a fair amount of attention in 2017 as the Fed began its “balance sheet normalization”(h) process late in the year. We foresaw no material impact to MBS valuations despite investor concerns earlier in the year, thanks to the transparency of the unwind program and the modest nature of the initial reduction. Importantly, since we have only modest overlap with the MBS featured on the Fed’s balance sheet, any potential normalization-related disruption would likely be minimal. We will continue to evaluate opportunities and risks in the MBS market as the Fed’s policy normalization evolves.
Mitigating Interest Rate Risk in the Fixed Income Portfolio
We made no major changes to the portfolio’s shorter-than-benchmark duration posture in 2017. In our analysis, longer-term interest rates are not reflecting the likely strengthening of global growth and inflation over the next several years. The passage of tax reform in December will likely continue to provide additional fiscal stimulus to an economy already operating above its long-term potential. Driven by the increasingly tight labor market, we expect core inflation measures to increase from the recent dip to approach 2% in the near future. Finally, a notable gap remains between market expectations for a very slow pace of future federal funds rate increases (implied by the forward curve) and the Fed’s stated expectations (which align more with our view). For these reasons, we continue to believe that a shorter relative duration is prudent.
IN CLOSING
U.S. equity valuations are now at the high end of the historical range. While we have a tempered return outlook for the overall
U.S. market, we are optimistic about the long-term prospects for the Fund’s equity portfolio, which continues to trade at a significant discount to the market. On December 31, the Fund’s equity portfolio of 66 companies traded at 16 times forward estimated earnings, compared to 20 times for the S&P 500.
Similarly, in fixed income, future returns may be low (or even negative) if yields rise substantially from current levels. In addition, the credit markets are unlikely to provide the important performance tailwind of the past two years, given current narrow spread levels.
As an active, value-oriented manager, we believe the valuation disparities that characterize the current market offer significant opportunities. Our fundamental, bottom-up, price-disciplined investment approach requires conviction and patience. Accordingly, maintaining a long-term investment horizon and staying the course are essential. We thank our fellow shareholders for your continued confidence in Dodge & Cox. As always, we welcome your comments and questions.
For the Board of Trustees,
| | |
| |
|
Charles F. Pohl, Chairman | | Dana M. Emery, President |
January 30, 2018
| (a) | | One basis point is equal to 1/100th of 1%. |
| (b) | | Unless otherwise specified, all weightings and characteristics are as of December 31, 2017. |
| (c) | | The use of specific examples does not imply that they are more or less attractive investments than the Fund’s other holdings. |
| (d) | | Credit securities refers to corporate bonds and government-related securities, as classified by Bloomberg. |
| (e) | | Duration is a measure of a bond’s (or a bond portfolio’s) price sensitivity to changes in interest rates. |
| (f) | | The U.S. Government does not guarantee the Fund’s shares, yield, or net asset value. The agency guarantee (by, for example, Ginnie Mae, Fannie Mae, or Freddie Mac) does not eliminate market risk. |
| (g) | | Yield premiums are one way to measure a security’s valuation. Narrowing yield premiums results in a higher valuation. Widening yield premiums results in a lower valuation. |
| (h) | | Balance sheet normalization refers to the Fed’s plan to shrink its balance sheet, which grew from $800 billion in 2007 to $4.5 trillion by 2015. During that time, the Fed purchased Treasuries and Agency MBS as an unconventional monetary policy tool to keep interest rates low in support of economic growth. Now that monetary policy is on a gradually tightening path, the Fed is reducing the size of its balance sheet by reducing these holdings. The normalization process consists largely of “runoff” (i.e., not reinvesting maturing bonds or MBS paydowns) at an accelerating monthly rate. |
PAGE 4 § DODGE & COX BALANCED FUND
ANNUAL PERFORMANCE REVIEW
The Fund underperformed the Combined Index by 1.6 percentage points in 2017. The Fund’s higher allocation to equities had a positive impact on relative results, which was partially offset by the impact of holding S&P 500 Index put options.
Equity Portfolio
| | § | | Returns from holdings in the Energy sector (down 16% compared to down 1% for the S&P 500 sector), combined with a higher average weighting (8% versus 6%), detracted from results. Apache (down 32%) and Baker Hughes (down 27%) were weak. | |
| | § | | Relative results were hindered by the strong performance of several large stocks not held by the portfolio (e.g., Amazon, Apple, Facebook). | |
| | § | | A number of individual holdings contributed, including Alnylam Pharmaceuticals (up 239%), Cigna (up 52%), Wal-Mart (up 47%), HP Inc. (up 46%), and several financial services companies. | |
Fixed Income Portfolio
| | § | | Security selection within credit was strongly positive as several corporate holdings performed well, including Bank of America capital securities, Citigroup capital securities, and Telecom Italia. Certain emerging market-domiciled holdings also outperformed, including Pemex and Rio Oil Finance Trust. | |
| | § | | The portfolio’s overweight to corporate bonds added to relative returns given the strong performance of credit. | |
| | § | | The portfolio’s lower exposure to long-term (10+ years) bonds detracted from relative returns as the yield curve flattened. | |
KEY CHARACTERISTICS OF DODGE & COX
Independent Organization
Dodge & Cox is one of the largest privately owned investment managers in the world. We remain committed to independence, with a goal of providing the highest quality investment management service to our existing clients.
Over 85 Years of Investment Experience
Dodge & Cox was founded in 1930. We have a stable and well-qualified team of investment professionals, most of whom have spent their entire careers at Dodge & Cox.
Experienced Investment Team
The U.S. Equity Investment Committee, which is responsible for determining the asset allocation of the Balanced Fund and managing the equity portion of the Balanced Fund, is an eight-member committee with an average tenure at Dodge & Cox of 24 years. The U.S. Fixed Income Investment Committee, which is responsible for managing the debt portion of the Balanced Fund, is an eight-member committee with an average tenure of 22 years.
One Business with a Single Research Office
Dodge & Cox manages equity (domestic, international, and global), fixed income (domestic and global), and balanced investments, operating from one office in San Francisco.
Consistent Investment Approach
Our team decision-making process involves thorough, bottom-up fundamental analysis of each investment.
Long-Term Focus and Low Expenses
We invest with a three- to five-year investment horizon, which has historically resulted in low turnover relative to our peers. We manage Funds that maintain low expense ratios.
Risks: The Fund is subject to market risk, meaning holdings in the Fund may decline in value for extended periods due to the financial prospects of individual companies or due to general market and economic conditions. The Fund also invests in individual bonds whose yields and market values fluctuate, so that an investment may be worth more or less than its original cost. Debt securities are subject to interest rate risk, credit risk, and prepayment and call risk, all of which could have adverse effects on the value of the Fund. A low interest rate environment creates an elevated risk of future negative returns. Financial intermediaries may restrict their market making activities for certain debt securities, which may reduce the liquidity and increase the volatility of such securities. Please read the prospectus and summary prospectus for specific details regarding the Fund’s risk profile.
DODGE & COX BALANCED FUND §PAGE 5
GROWTH OF $10,000 OVER 10 YEARS
FOR AN INVESTMENT MADE ON DECEMBER 31, 2007
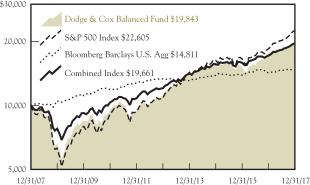
AVERAGE ANNUAL TOTAL RETURN
FOR PERIODS ENDED DECEMBER 31, 2017
| | | | | | | | | | | | | | | | |
| | | 1 Year | | | 5 Years | | | 10 Years | | | 20 Years | |
| | | | | | | | | | | | | | | | |
Dodge & Cox Balanced Fund | | | 12.59 | % | | | 12.24 | % | | | 7.09 | % | | | 8.46 | % |
S&P 500 Index | | | 21.83 | | | | 15.79 | | | | 8.50 | | | | 7.20 | |
Bloomberg Barclays U.S. Aggregate Bond Index (Bloomberg Barclays U.S. Agg) | | | 3.54 | | | | 2.10 | | | | 4.01 | | | | 4.98 | |
Combined Index(a) | | | 14.21 | | | | 10.27 | | | | 6.99 | | | | 6.62 | |
Returns represent past performance and do not guarantee future results. Investment return and share price will fluctuate with market conditions, and investors may have a gain or loss when shares are sold. Fund performance changes over time and currently may be significantly lower than stated. Performance is updated and published monthly. Visit the Fund’s website at dodgeandcox.com or call 800-621-3979 for current performance figures.
The Fund’s total returns include the reinvestment of dividend and capital gain distributions, but have not been adjusted for any income taxes payable by shareholders on these distributions or on Fund share redemptions. Index returns include dividends and/or interest income but, unlike Fund returns, do not reflect fees or expenses.
Standard & Poor’s, Standard & Poor’s 500, and S&P 500® are trademarks of S&P Global Inc. Bloomberg is a registered trademark of Bloomberg Finance L.P. and its affiliates. Barclays® is a trademark of Barclays Bank PLC.
| (a) | The Combined Index reflects an unmanaged portfolio (rebalanced monthly) of 60% of the S&P 500 Index, which is a market capitalization-weighted index of 500 large-capitalization stocks commonly used to represent the U.S. equity market, and 40% of the Bloomberg Barclays U.S. Aggregate Bond Index (Bloomberg Barclays U.S. Agg), which is a widely recognized, unmanaged index of U.S. dollar-denominated, investment-grade, taxable fixed income securities. The Fund may, however, invest up to 75% of its total assets in equity securities. |
FUND EXPENSE EXAMPLE
As a Fund shareholder, you incur ongoing Fund costs, including management fees and other Fund expenses. All mutual funds have ongoing costs, sometimes referred to as operating expenses. The following example shows ongoing costs of investing in the Fund and can help you understand these costs and compare them with those of other mutual funds. The example assumes a $1,000 investment held for the six months indicated.
ACTUAL EXPENSES
The first line of the table below provides information about actual account values and expenses based on the Fund’s actual returns. You may use the information in this line, together with your account balance, to estimate the expenses that you paid over the period. Simply divide your account value by $1,000 (for example, an $8,600 account value divided by $1,000 = 8.6), then multiply the result by the number in the first line under the heading “Expenses Paid During Period” to estimate the expenses you paid on your account during this period.
HYPOTHETICAL EXAMPLE FOR COMPARISON WITH OTHER MUTUAL FUNDS
Information on the second line of the table can help you compare ongoing costs of investing in the Fund with those of other mutual funds. This information may not be used to estimate the actual ending account balance or expenses you paid during the period. The hypothetical “Ending Account Value” is based on the actual expense ratio of the Fund and an assumed 5% annual rate of return before expenses (not the Fund’s actual return). The amount under the heading “Expenses Paid During Period” shows the hypothetical expenses your account would have incurred under this scenario. You can compare this figure with the 5% hypothetical examples that appear in shareholder reports of other mutual funds.
| | | | | | | | | | | | |
Six Months Ended
December 31, 2017 | | Beginning Account Value
7/1/2017 | | | Ending Account Value
12/31/2017 | | | Expenses Paid
During Period* | |
Based on Actual Fund Return | | $ | 1,000.00 | | | $ | 1,068.60 | | | $ | 2.72 | |
Based on Hypothetical 5% Yearly Return | | | 1,000.00 | | | | 1,022.57 | | | | 2.66 | |
| * | | Expenses are equal to the Fund’s annualized expense ratio of 0.52%, multiplied by the average account value over the period, multiplied by 184/365 (to reflect the one-half year period). |
The expenses shown in the table highlight ongoing costs only and do not reflect any transactional fees or account maintenance fees. Though other mutual funds may charge such fees, please note that the Fund does not charge transaction fees (e.g., redemption fees, sales loads) or universal account maintenance fees (e.g., small account fees).
PAGE 6 § DODGE & COX BALANCED FUND
| | | | |
| FUND INFORMATION (unaudited) | | | December 31, 2017 | |
| | | | |
| GENERAL INFORMATION | | | |
Net Asset Value Per Share | | | $107.00 | |
Total Net Assets (billions) | | | $16.4 | |
Expense Ratio | | | 0.53% | |
Portfolio Turnover Rate | | | 19% | |
30-Day SEC Yield(a) | | | 1.79% | |
Fund Inception | | | 1931 | |
No sales charges or distribution fees | | | | |
Investment Manager: Dodge & Cox, San Francisco. Managed by the U.S. Equity Investment Committee, whose eight members’ average tenure at Dodge & Cox is 24 years, and by the U.S. Fixed Income Investment Committee, whose eight members’ average tenure is 22 years.
| | | | |
| EQUITY PORTFOLIO (71.2%) | | Fund | |
Number of Common Stocks | | | 66 | |
Number of Preferred Stocks | | | 5 | |
Median Market Capitalization (billions)(b) | | | $52 | |
Price-to-Earnings Ratio(b)(c) | | | 16.1x | |
Foreign Securities not in the S&P 500(d) | | | 7.6 | % |
| | | | | | | | | | | | |
| FIVE LARGEST SECTORS (%) | | Common | | | Preferred | | | Fund | |
Financials | | | 19.0 | | | | 4.6 | | | | 23.6 | |
Health Care | | | 15.1 | | | | — | | | | 15.1 | |
Information Technology | | | 11.7 | | | | — | | | | 11.7 | |
Consumer Discretionary | | | 9.7 | | | | 0.3 | | | | 10.0 | |
Energy | | | 5.4 | | | | — | | | | 5.4 | |
| | | | | | | | | | | | |
| TEN LARGEST EQUITIES (%)(e) | | Common | | | Preferred | | | Fund | |
Wells Fargo & Co. | | | 2.5 | | | | 1.5 | | | | 4.0 | |
JPMorgan Chase & Co. | | | 1.7 | | | | 1.7 | | | | 3.4 | |
Bank of America Corp. | | | 2.5 | | | | 0.5 | | | | 3.0 | |
Charles Schwab Corp. | | | 2.7 | | | | — | | | | 2.7 | |
Capital One Financial Corp. | | | 2.6 | | | | — | | | | 2.6 | |
Comcast Corp. | | | 2.1 | | | | — | | | | 2.1 | |
Alphabet, Inc. | | | 2.0 | | | | — | | | | 2.0 | |
Microsoft Corp. | | | 1.9 | | | | — | | | | 1.9 | |
Charter Communications, Inc. | | | 1.8 | | | | — | | | | 1.8 | |
Novartis AG (Switzerland) | | | 1.8 | | | | — | | | | 1.8 | |
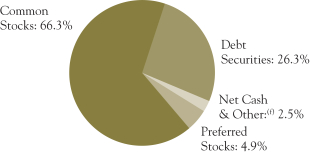
| | | | |
| FIXED INCOME PORTFOLIO (26.3%) | | Fund | |
Number of Credit Issuers | | | 46 | |
Effective Duration (years)(g) | | | 4.3 | |
| | | | |
| SECTOR DIVERSIFICATION (%) | | Fund | |
U.S. Treasury(h) | | | 4.1 | |
Government-Related(i) | | | 1.8 | |
Securitized | | | 10.6 | |
Corporate | | | 9.8 | |
| | | | |
| CREDIT QUALITY (%)(j) | | Fund | |
U.S. Treasury/Agency/GSE(h) | | | 13.8 | |
Aaa | | | 0.5 | |
Aa | | | 1.0 | |
A | | | 0.9 | |
Baa | | | 8.1 | |
Ba | | | 1.6 | |
B | | | 0.0 | |
Caa | | | 0.4 | |
| | | | |
| FIVE LARGEST CREDIT ISSUERS (%)(e) | | Fund | |
Charter Communications, Inc. | | | 0.6 | |
State of California GO | | | 0.6 | |
Bank of America Corp. | | | 0.6 | |
Petroleos Mexicanos | | | 0.5 | |
State of Illinois GO | | | 0.5 | |
| (a) | SEC Yield is an annualization of the Fund’s net investment income for the trailing 30-day period. Dividends paid by the Fund may be higher or lower than implied by the SEC Yield. |
| (b) | Excludes the Fund’s preferred stock positions. |
| (c) | Price-to-earnings (P/E) ratio is calculated using 12-month forward earnings estimates from third-party sources. |
| (d) | Foreign stocks are U.S. dollar denominated. |
| (e) | The Fund’s portfolio holdings are subject to change without notice. The mention of specific securities is not a recommendation to buy, sell, or hold any particular security and is not indicative of Dodge & Cox’s current or future trading activity. |
| (f) | Net Cash & Other includes cash, short-term investments, derivatives, receivables, and payables. |
| (g) | Interest rate derivatives reduce the duration of the fixed income portfolio by 0.6 years (i.e., total portfolio duration is 4.9 years without derivatives). |
| (h) | Data as presented excludes the Fund’s position in Treasury futures contracts. |
| (i) | The portfolio’s Government-Related holdings include tax-exempt municipal securities; the BBG Barclays U.S. Agg classifies these securities as Municipal Bonds. |
| (j) | The credit quality distribution shown for the Fund is based on the middle of Moody’s, S&P, and Fitch ratings, which is the methodology used by Bloomberg in constructing its indices. If a security is rated by only two agencies, the lower of the two ratings is used. Please note the Fund applies the highest of Moody’s, S&P, and Fitch ratings to determine compliance with the quality requirements stated in its prospectus. The credit quality of the investments in the portfolio does not apply to the stability or safety of the Fund or its shares. |
DODGE & COX BALANCED FUND §PAGE 7
| | | | |
| PORTFOLIO OF INVESTMENTS | | | December 31, 2017 | |
| | | | | | | | |
| COMMON STOCKS: 66.3% | | | | | | |
| | |
| | | SHARES | | | VALUE | |
| CONSUMER DISCRETIONARY: 9.7% | |
AUTOMOBILES & COMPONENTS: 0.3% | | | | | | | | |
Harley-Davidson, Inc. | | | 858,400 | | | $ | 43,675,392 | |
|
CONSUMER DURABLES & APPAREL: 0.2% | |
Mattel, Inc. | | | 2,650,000 | | | | 40,757,000 | |
| | |
MEDIA: 7.3% | | | | | | | | |
Charter Communications, Inc., Class A(a) | | | 898,207 | | | | 301,761,624 | |
Comcast Corp., Class A | | | 8,365,348 | | | | 335,032,187 | |
DISH Network Corp., Class A(a) | | | 1,685,032 | | | | 80,460,278 | |
News Corp., Class A | | | 1,137,504 | | | | 18,438,940 | |
Time Warner, Inc. | | | 2,003,491 | | | | 183,259,322 | |
Twenty-First Century Fox, Inc., Class A | | | 6,610,200 | | | | 228,250,206 | |
Twenty-First Century Fox, Inc., Class B | | | 1,565,000 | | | | 53,397,800 | |
| | | | | | | | |
| | | | | | | 1,200,600,357 | |
RETAILING: 1.9% | | | | | | | | |
Liberty Interactive Corp. QVC Group,
Series A(a) | | | 2,890,850 | | | | 70,594,557 | |
Target Corp. | | | 1,858,400 | | | | 121,260,600 | |
The Priceline Group, Inc.(a) | | | 66,900 | | | | 116,254,806 | |
| | | | | | | | |
| | | | | | | 308,109,963 | |
| | | | | | | | |
| | | | | | | 1,593,142,712 | |
| CONSUMER STAPLES: 0.3% | | | | | | | | |
FOOD & STAPLES RETAILING: 0.3% | | | | | | | | |
Wal-Mart Stores, Inc. | | | 426,047 | | | | 42,072,141 | |
| | |
| ENERGY: 5.4% | | | | | | | | |
Anadarko Petroleum Corp. | | | 4,288,892 | | | | 230,056,167 | |
Apache Corp. | | | 2,920,139 | | | | 123,288,269 | |
Baker Hughes, a GE Company | | | 3,200,079 | | | | 101,250,500 | |
Concho Resources, Inc.(a) | | | 584,900 | | | | 87,863,678 | |
National Oilwell Varco, Inc. | | | 3,100,000 | | | | 111,662,000 | |
Occidental Petroleum Corp. | | | 434,114 | | | | 31,976,837 | |
Schlumberger, Ltd. (Curacao/United States) | | | 2,679,221 | | | | 180,552,703 | |
Weatherford International PLC(a) (Ireland) | | | 4,970,000 | | | | 20,724,900 | |
| | | | | | | | |
| | | | | | | 887,375,054 | |
| FINANCIALS: 19.0% | | | | | | | | |
BANKS: 7.3% | | | | | | | | |
Bank of America Corp. | | | 13,675,400 | | | | 403,697,808 | |
BB&T Corp. | | | 1,854,584 | | | | 92,209,917 | |
JPMorgan Chase & Co. | | | 2,606,100 | | | | 278,696,334 | |
Wells Fargo & Co. | | | 6,805,106 | | | | 412,865,781 | |
| | | | | | | | |
| | | | | | | 1,187,469,840 | |
DIVERSIFIED FINANCIALS: 9.9% | | | | | | | | |
American Express Co. | | | 2,501,000 | | | | 248,374,310 | |
Bank of New York Mellon Corp. | | | 4,327,400 | | | | 233,073,764 | |
Capital One Financial Corp. | | | 4,250,059 | | | | 423,220,875 | |
Charles Schwab Corp. | | | 8,429,700 | | | | 433,033,689 | |
Goldman Sachs Group, Inc. | | | 1,109,600 | | | | 282,681,696 | |
| | | | | | | | |
| | | | | | | 1,620,384,334 | |
INSURANCE: 1.8% | | | | | | | | |
AEGON NV (Netherlands) | | | 11,909,591 | | | | 75,030,423 | |
Brighthouse Financial, Inc.(a) | | | 337,818 | | | | 19,809,648 | |
MetLife, Inc. | | | 4,072,300 | | | | 205,895,488 | |
| | | | | | | | |
| | | | | | | 300,735,559 | |
| | | | | | | | |
| | | | | | | 3,108,589,733 | |
| HEALTH CARE: 15.1% | | | | | | | | |
HEALTH CARE EQUIPMENT & SERVICES: 4.9% | | | | | |
Cigna Corp. | | | 959,859 | | | | 194,937,764 | |
Danaher Corp. | | | 468,100 | | | | 43,449,042 | |
Express Scripts Holding Co.(a) | | | 3,195,668 | | | | 238,524,660 | |
Medtronic PLC (Ireland) | | | 1,685,200 | | | | 136,079,900 | |
UnitedHealth Group, Inc. | | | 839,772 | | | | 185,136,135 | |
| | | | | | | | |
| | | | | | | 798,127,501 | |
| | | | | | | | |
| | |
| | | SHARES | | | VALUE | |
PHARMACEUTICALS, BIOTECHNOLOGY & LIFE SCIENCES: 10.2% | |
Alnylam Pharmaceuticals, Inc.(a) | | | 751,000 | | | $ | 95,414,550 | |
AstraZeneca PLC ADR (United Kingdom) | | | 5,860,899 | | | | 203,373,195 | |
Bristol-Myers Squibb Co. | | | 2,762,800 | | | | 169,304,384 | |
Eli Lilly and Co. | | | 1,910,000 | | | | 161,318,600 | |
Gilead Sciences, Inc. | | | 1,587,680 | | | | 113,741,395 | |
GlaxoSmithKline PLC ADR (United Kingdom) | | | 4,452,350 | | | | 157,924,855 | |
Merck & Co., Inc. | | | 1,184,775 | | | | 66,667,289 | |
Novartis AG ADR (Switzerland) | | | 3,415,200 | | | | 286,740,192 | |
Roche Holding AG ADR (Switzerland) | | | 4,391,000 | | | | 138,667,780 | |
Sanofi ADR (France) | | | 6,415,265 | | | | 275,856,395 | |
| | | | | | | | |
| | | | | | | 1,669,008,635 | |
| | | | | | | | |
| | | | | | | 2,467,136,136 | |
| INDUSTRIALS: 3.5% | | | | | | | | |
CAPITAL GOODS: 0.9% | | | | | | | | |
Johnson Controls International PLC (Ireland) | | | 3,941,302 | | | | 150,203,019 | |
| | |
TRANSPORTATION: 2.6% | | | | | | | | |
FedEx Corp. | | | 1,017,454 | | | | 253,895,471 | |
Union Pacific Corp. | | | 1,233,000 | | | | 165,345,300 | |
| | | | | | | | |
| | | | | | | 419,240,771 | |
| | | | | | | | |
| | | | | | | 569,443,790 | |
| INFORMATION TECHNOLOGY: 11.7% | | | | | |
SEMICONDUCTORS & SEMICONDUCTOR EQUIPMENT: 0.5% | |
Maxim Integrated Products, Inc. | | | 1,625,291 | | | | 84,970,213 | |
| | |
SOFTWARE & SERVICES: 5.2% | | | | | | | | |
Alphabet, Inc., Class A(a) | | | 2,000 | | | | 2,106,800 | |
Alphabet, Inc., Class C(a) | | | 307,995 | | | | 322,285,968 | |
Dell Technologies, Inc., Class V(a) | | | 1,272,163 | | | | 103,401,409 | |
Micro Focus International PLC ADR (United Kingdom) | | | 2,265,951 | | | | 76,113,294 | |
Microsoft Corp. | | | 3,668,400 | | | | 313,794,936 | |
Synopsys, Inc.(a) | | | 455,100 | | | | 38,792,724 | |
| | | | | | | | |
| | | | | | | 856,495,131 | |
| |
TECHNOLOGY, HARDWARE & EQUIPMENT: 6.0% | | | | | |
Cisco Systems, Inc. | | | 5,703,100 | | | | 218,428,730 | |
Corning, Inc. | | | 1,136,200 | | | | 36,347,038 | |
Hewlett Packard Enterprise Co. | | | 16,500,512 | | | | 236,947,352 | |
HP Inc. | | | 8,137,773 | | | | 170,974,611 | |
Juniper Networks, Inc. | | | 3,530,329 | | | | 100,614,377 | |
NetApp, Inc. | | | 1,121,891 | | | | 62,063,010 | |
TE Connectivity, Ltd. (Switzerland) | | | 1,570,036 | | | | 149,216,221 | |
| | | | | | | | |
| | | | | | | 974,591,339 | |
| | | | | | | | |
| | | | | | | 1,916,056,683 | |
| MATERIALS: 0.6% | | | | | | | | |
Celanese Corp., Series A | | | 1,002,532 | | | | 107,351,127 | |
| |
| TELECOMMUNICATION SERVICES: 1.0% | | | | | |
Sprint Corp.(a) | | | 15,802,971 | | | | 93,079,499 | |
Zayo Group Holdings, Inc.(a) | | | 2,110,000 | | | | 77,648,000 | |
| | | | | | | | |
| | | | | | | 170,727,499 | |
| | | | | | | | |
TOTAL COMMON STOCKS
(Cost $6,439,859,163) | | | | | | $ | 10,861,894,875 | |
| | |
| PREFERRED STOCKS: 4.9% | | | | | | |
| | |
| | | PAR VALUE | | | VALUE | |
| CONSUMER DISCRETIONARY: 0.3% | | | | | |
MEDIA: 0.3% | | | | | | | | |
NBCUniversal Enterprise, Inc.
5.25%(c) | | $ | 53,210,000 | | | $ | 56,535,625 | |
| | |
| PAGE 8 § DODGE & COX BALANCED FUND | | See accompanying Notes to Financial Statements |
| | | | |
| PORTFOLIO OF INVESTMENTS | | | December 31, 2017 | |
| | | | | | | | |
| PREFERRED STOCKS (continued) | | | | | | |
| | |
| | | PAR VALUE | | | VALUE | |
| FINANCIALS: 4.6% | | | | | | | | |
BANKS: 4.6% | | | | | | | | |
Bank of America Corp. 6.10%(g) | | $ | 16,008,000 | | | $ | 17,568,780 | |
Bank of America Corp. 6.25%(g) | | | 52,470,000 | | | | 57,981,974 | |
Citigroup, Inc. 5.95%(g) | | | 5,175,000 | | | | 5,504,906 | |
Citigroup, Inc. 5.95%(g) | | | 77,327,000 | | | | 82,353,255 | |
Citigroup, Inc. 6.25%(g) | | | 50,886,000 | | | | 56,127,258 | |
JPMorgan Chase & Co. 6.10%(g) | | | 254,565,000 | | | | 279,716,022 | |
Wells Fargo & Co. 5.875%(g) | | | 227,645,000 | | | | 252,128,220 | |
| | | | | | | | |
| | | | | | | 751,380,415 | |
| | | | | | | | |
TOTAL PREFERRED STOCKS
(Cost $739,141,278) | | | $ | 807,916,040 | |
|
| DEBT SECURITIES: 26.3% | |
| U.S. TREASURY: 4.1% | |
U.S. Treasury Inflation Indexed
0.125%, 4/15/20(h) | | | 46,103,816 | | | | 46,018,437 | |
0.125%, 4/15/21(h) | | | 33,018,111 | | | | 32,891,158 | |
U.S. Treasury Note/Bond
1.625%, 7/31/19 | | | 41,885,000 | | | | 41,727,723 | |
1.625%, 3/15/20 | | | 25,000,000 | | | | 24,844,561 | |
1.75%, 12/31/20 | | | 90,175,000 | | | | 89,541,353 | |
1.125%, 2/28/21 | | | 111,515,000 | | | | 108,435,973 | |
1.125%, 7/31/21 | | | 56,610,000 | | | | 54,739,865 | |
1.75%, 11/30/21 | | | 130,000,000 | | | | 128,179,180 | |
1.875%, 1/31/22 | | | 90,500,000 | | | | 89,553,667 | |
1.875%, 2/28/22 | | | 14,110,000 | | | | 13,956,312 | |
1.75%, 5/31/22 | | | 38,064,000 | | | | 37,397,377 | |
| | | | | | | | |
| | | | | | | 667,285,606 | |
| GOVERNMENT-RELATED: 1.8% | |
FEDERAL AGENCY: 0.0% | |
Small Business Admin. — 504 Program | |
Series 1998-20D 1, 6.15%, 4/1/18 | | | 38,426 | | | | 38,691 | |
Series 1998-20I 1, 6.00%, 9/1/18 | | | 59,575 | | | | 60,048 | |
Series 1999-20F 1, 6.80%, 6/1/19 | | | 88,081 | | | | 89,719 | |
Series 2000-20D 1, 7.47%, 4/1/20 | | | 505,324 | | | | 520,920 | |
Series 2000-20E 1, 8.03%, 5/1/20 | | | 87,642 | | | | 90,805 | |
Series 2000-20G 1, 7.39%, 7/1/20 | | | 185,857 | | | | 191,429 | |
Series 2000-20I 1, 7.21%, 9/1/20 | | | 92,431 | | | | 95,105 | |
Series 2001-20E 1, 6.34%, 5/1/21 | | | 398,393 | | | | 414,412 | |
Series 2001-20G 1, 6.625%, 7/1/21 | | | 417,284 | | | | 434,414 | |
Series 2003-20J 1, 4.92%, 10/1/23 | | | 1,581,266 | | | | 1,660,202 | |
Series 2007-20F 1, 5.71%, 6/1/27 | | | 1,905,370 | | | | 2,036,694 | |
| | | | | | | | |
| | | | | | | 5,632,439 | |
FOREIGN AGENCY: 0.6% | |
Petroleo Brasileiro SA (Brazil)
4.375%, 5/20/23 | | | 20,950,000 | | | | 20,718,921 | |
Petroleos Mexicanos (Mexico)
6.875%, 8/4/26 | | | 13,775,000 | | | | 15,617,406 | |
6.50%, 3/13/27(c) | | | 18,400,000 | | | | 20,111,200 | |
6.625%, 6/15/35 | | | 9,425,000 | | | | 10,069,105 | |
6.375%, 1/23/45 | | | 20,125,000 | | | | 20,232,669 | |
5.625%, 1/23/46 | | | 16,675,000 | | | | 15,432,713 | |
| | | | | | | | |
| | | | | | | 102,182,014 | |
LOCAL AUTHORITY: 1.2% | |
New Jersey Turnpike Authority RB
7.102%, 1/1/41 | | | 12,436,000 | | | | 18,578,514 | |
State of California GO
7.50%, 4/1/34 | | | 13,470,000 | | | | 19,946,645 | |
7.55%, 4/1/39 | | | 22,525,000 | | | | 35,445,565 | |
7.30%, 10/1/39 | | | 18,730,000 | | | | 27,942,538 | |
7.625%, 3/1/40 | | | 5,540,000 | | | | 8,667,053 | |
State of Illinois GO
5.665%, 3/1/18 | | | 28,485,000 | | | | 28,639,958 | |
| | | | | | | | |
| | |
| | | PAR VALUE | | | VALUE | |
5.877%, 3/1/19 | | $ | 10,225,000 | | | $ | 10,543,611 | |
5.00%, 11/1/20 | | | 8,000,000 | | | | 8,423,680 | |
5.00%, 11/1/21 | | | 10,500,000 | | | | 11,148,165 | |
5.10%, 6/1/33 | | | 22,615,000 | | | | 22,577,459 | |
| | | | | | | | |
| | | | | | | 191,913,188 | |
| | | | | | | | |
| | | | | | | 299,727,641 | |
| SECURITIZED: 10.6% | |
ASSET-BACKED: 0.9% | |
Auto Loan: 0.1% | |
Ford Credit Auto Owner Trust | |
Series 2015-REV1 A, 2.12%, 7/15/26(c) | | | 16,450,000 | | | | 16,413,576 | |
Series 2017-REV2 A, 2.36%, 3/15/29(c) | | | 6,721,000 | | | | 6,659,062 | |
| | | | | | | | |
| | | | | | | 23,072,638 | |
Credit Card: 0.3% | |
American Express Master Trust
Series 2017-4 A, 1.64%, 12/15/21 | | | 44,759,000 | | | | 44,527,251 | |
|
Other: 0.4% | |
Rio Oil Finance Trust (Brazil)
9.25%, 7/6/24(c) | | | 24,723,563 | | | | 26,701,448 | |
9.75%, 1/6/27(c) | | | 33,415,340 | | | | 36,088,567 | |
| | | | | | | | |
| | | | | | | 62,790,015 | |
Student Loan: 0.1% | |
SLM Student Loan Trust (Private Loans) | |
Series 2014-A A2A, 2.59%, 1/15/26(c) | | | 3,984,576 | | | | 3,992,689 | |
Series 2012-B A2, 3.48%, 10/15/30(c) | | | 1,955,966 | | | | 1,964,723 | |
Series 2012-E A2A, 2.09%, 6/15/45(c) | | | 7,586,403 | | | | 7,587,764 | |
Series 2012-C A2, 3.31%, 10/15/46(c) | | | 3,530,102 | | | | 3,539,014 | |
| | | | | | | | |
| | | | | | | 17,084,190 | |
| | | | | | | | |
| | | | | | | 147,474,094 | |
CMBS: 0.2% | |
Agency CMBS: 0.2% | |
Fannie Mae Multifamily DUS | |
Pool AL8144, 2.404%, 10/1/22 | | | 7,843,284 | | | | 7,873,281 | |
Pool AL9086, 2.304%, 7/1/23 | | | 1,696,776 | | | | 1,681,455 | |
Freddie Mac Multifamily DUS | |
Series K055 X1, 1.368%, 3/25/26(f) | | | 10,632,354 | | | | 980,766 | |
Series K056 X1, 1.267%, 5/25/26(f) | | | 4,659,718 | | | | 401,407 | |
Series K057 X1, 1.193%, 7/25/26(f) | | | 3,810,962 | | | | 317,353 | |
Series K064 X1, 0.609%, 3/25/27(f) | | | 9,573,443 | | | | 455,459 | |
Series K065 X1, 0.675%, 4/25/27(f) | | | 44,385,682 | | | | 2,353,440 | |
Series K066 X1, 0.753%, 6/25/27(f) | | | 38,062,933 | | | | 2,266,473 | |
Series K069 X1, 0.369%, 9/25/27(f) | | | 238,823,694 | | | | 7,664,330 | |
| | | | | | | | |
| | | | | | | 23,993,964 | |
MORTGAGE-RELATED: 9.5% | |
Federal Agency CMO & REMIC: 1.3% | |
Dept. of Veterans Affairs | |
Series 1995-1 1, 6.928%, 2/15/25(f) | | | 264,106 | | | | 285,136 | |
Series 1995-2C 3A, 8.793%, 6/15/25 | | | 115,283 | | | | 132,403 | |
Series 2002-1 2J, 6.50%, 8/15/31 | | | 7,633,812 | | | | 8,500,739 | |
Fannie Mae | |
Trust 2002-33 A1, 7.00%, 6/25/32 | | | 1,616,482 | | | | 1,890,024 | |
Trust 2009-66 ET, 6.00%, 5/25/39 | | | 2,100,382 | | | | 2,222,771 | |
Trust 2009-30 AG, 6.50%, 5/25/39 | | | 1,840,456 | | | | 2,015,328 | |
Trust 2001-T7 A1, 7.50%, 2/25/41 | | | 1,216,434 | | | | 1,402,570 | |
Trust 2001-T5 A3, 7.50%, 6/19/41(f) | | | 520,023 | | | | 612,469 | |
Trust 2001-T4 A1, 7.50%, 7/25/41 | | | 1,284,240 | | | | 1,491,989 | |
Trust 2001-T8 A1, 7.50%, 7/25/41 | | | 1,313,636 | | | | 1,513,824 | |
Trust 2001-W3 A, 7.00%, 9/25/41(f) | | | 841,721 | | | | 904,972 | |
Trust 2001-T10 A2, 7.50%, 12/25/41 | | | 998,555 | | | | 1,158,150 | |
Trust 2013-106 MA, 4.00%, 2/25/42 | | | 8,219,358 | | | | 8,565,271 | |
Trust 2002-W6 2A1, 7.00%, 6/25/42(f) | | | 1,321,277 | | | | 1,505,772 | |
| | |
| See accompanying Notes to Financial Statements | | DODGE & COX BALANCED FUND §PAGE 9 |
| | | | |
| PORTFOLIO OF INVESTMENTS | | | December 31, 2017 | |
| | | | | | | | |
| DEBT SECURITIES (continued) | |
| | |
| | | PAR VALUE | | | VALUE | |
Trust 2002-W8 A2, 7.00%, 6/25/42 | | $ | 1,662,430 | | | $ | 1,924,197 | |
Trust 2003-W2 1A1, 6.50%, 7/25/42 | | | 2,853,857 | | | | 3,292,602 | |
Trust 2003-W2 1A2, 7.00%, 7/25/42 | | | 1,103,050 | | | | 1,295,073 | |
Trust 2003-W4 4A, 7.50%, 10/25/42(f) | | | 1,325,085 | | | | 1,481,862 | |
Trust 2012-121 NB, 7.00%, 11/25/42 | | | 2,023,299 | | | | 2,298,907 | |
Trust 2004-T1 1A2, 6.50%, 1/25/44 | | | 1,674,727 | | | | 1,894,246 | |
Trust 2004-W2 5A, 7.50%, 3/25/44 | | | 2,674,601 | | | | 3,008,375 | |
Trust 2004-W8 3A, 7.50%, 6/25/44 | | | 442,871 | | | | 512,793 | |
Trust 2005-W4 1A2, 6.50%, 8/25/45 | | | 4,258,484 | | | | 4,831,192 | |
Trust 2009-11 MP, 7.00%, 3/25/49 | | | 3,935,354 | | | | 4,453,259 | |
USD LIBOR 1-month | | | | | | | | |
+0.55%, 2.102%, 9/25/43 | | | 8,236,012 | | | | 8,325,175 | |
Freddie Mac | |
Series 1078 GZ, 6.50%, 5/15/21 | | | 56,783 | | | | 58,521 | |
Series 16 PK, 7.00%, 8/25/23 | | | 1,424,438 | | | | 1,534,853 | |
Series T-48 1A4, 5.538%, 7/25/33 | | | 25,335,091 | | | | 27,333,698 | |
Series T-51 1A, 6.50%, 9/25/43(f) | | | 169,674 | | | | 194,089 | |
Series T-59 1A1, 6.50%, 10/25/43 | | | 9,068,221 | | | | 10,396,253 | |
Series 4281 BC, 4.50%, 12/15/43(f) | | | 50,345,837 | | | | 53,804,626 | |
USD LIBOR 1-month
+0.61%, 2.087%, 9/15/43 | | | 17,718,394 | | | | 17,934,252 | |
Ginnie Mae | |
USD LIBOR 1-Month
+0.62%, 1.863%, 9/20/64 | | | 4,024,408 | | | | 4,028,061 | |
USD LIBOR 12-Month
+0.23%, 2.01%, 10/20/67 | | | 22,468,957 | | | | 22,472,862 | |
+0.23%, 2.01%, 10/20/67 | | | 13,996,305 | | | | 13,995,783 | |
| | | | | | | | |
| | | | | | | 217,272,097 | |
Federal Agency Mortgage Pass-Through: 8.2% | |
Fannie Mae, 15 Year | | | | | | | | |
6.00%, 3/1/18-3/1/22 | | | 185,758 | | | | 193,149 | |
6.50%, 4/1/18-11/1/18 | | | 3,006 | | | | 3,014 | |
7.00%, 11/1/18 | | | 1,350 | | | | 1,351 | |
4.50%, 1/1/25-1/1/27 | | | 10,367,108 | | | | 10,938,183 | |
3.50%, 11/1/25-12/1/29 | | | 27,511,526 | | | | 28,412,223 | |
4.00%, 9/1/26-3/1/29 | | | 64,319,757 | | | | 67,084,198 | |
Fannie Mae, 20 Year | | | | | | | | |
4.00%, 11/1/30-2/1/37 | | | 49,341,332 | | | | 52,104,694 | |
4.50%, 1/1/31-12/1/34 | | | 76,231,564 | | | | 81,369,368 | |
3.50%, 6/1/35-4/1/37 | | | 87,449,892 | | | | 90,641,013 | |
Fannie Mae, 30 Year | | | | | | | | |
6.50%, 12/1/28-8/1/39 | | | 17,785,977 | | | | 20,178,203 | |
5.50%, 7/1/33-8/1/37 | | | 11,500,028 | | | | 12,761,132 | |
6.00%, 9/1/36-8/1/37 | | | 15,862,399 | | | | 17,987,283 | |
7.00%, 4/1/37-8/1/37 | | | 5,404,298 | | | | 6,313,200 | |
4.50%, 1/1/39-3/1/47 | | | 224,721,197 | | | | 240,235,321 | |
Fannie Mae, 40 Year | | | | | | | | |
4.50%, 6/1/56 | | | 45,672,423 | | | | 48,806,183 | |
Fannie Mae, Hybrid ARM | | | | | | | | |
1-Year U.S. Treasury CMT
+2.03%, 3.17%, 9/1/34 | | | 1,049,744 | | | | 1,101,698 | |
USD LIBOR 12-Month | | | | | | | | |
+1.36%, 3.106%, 12/1/34 | | | 1,401,756 | | | | 1,454,284 | |
+1.58%, 3.284%, 1/1/35 | | | 1,050,090 | | | | 1,098,670 | |
+1.50%, 3.249%, 8/1/35 | | | 919,367 | | | | 955,382 | |
+1.64%, 3.367%, 5/1/37 | | | 1,027,438 | | | | 1,075,251 | |
+1.85%, 4.189%, 7/1/39 | | | 1,506,345 | | | | 1,578,053 | |
+1.78%, 3.763%, 11/1/40 | | | 2,271,268 | | | | 2,353,136 | |
+1.78%, 3.571%, 12/1/40 | | | 3,982,966 | | | | 4,109,523 | |
+1.57%, 2.635%, 11/1/43 | | | 4,909,822 | | | | 5,092,741 | |
+1.55%, 2.70%, 4/1/44 | | | 13,265,464 | | | | 13,624,784 | |
+1.60%, 2.809%, 11/1/44 | | | 20,538,518 | | | | 20,957,816 | |
+1.60%, 2.811%, 12/1/44 | | | 14,195,472 | | | | 14,480,883 | |
+1.59%, 2.942%, 9/1/45 | | | 4,454,470 | | | | 4,508,209 | |
+1.59%, 2.84%, 12/1/45 | | | 18,322,121 | | | | 18,564,141 | |
+1.59%, 2.637%, 1/1/46 | | | 16,756,550 | | | | 16,916,996 | |
| | | | | | | | |
| | |
| | | PAR VALUE | | | VALUE | |
+1.61%, 3.188%, 6/1/47 | | $ | 14,349,156 | | | $ | 14,602,339 | |
+1.61%, 3.156%, 7/1/47 | | | 19,216,941 | | | | 19,541,022 | |
+1.60%, 2.747%, 8/1/47 | | | 24,373,465 | | | | 24,652,199 | |
USD LIBOR 6-Month
+1.54%, 3.056%, 1/1/35 | | | 1,661,428 | | | | 1,721,154 | |
Freddie Mac, Hybrid ARM | | | | | | | | |
1-Year U.S. Treasury CMT
+2.25%, 3.497%, 10/1/35 | | | 2,183,424 | | | | 2,300,504 | |
USD LIBOR 12-Month
+1.96%, 3.802%, 5/1/34 | | | 1,743,880 | | | | 1,850,536 | |
+1.57%, 3.292%, 4/1/37 | | | 2,157,202 | | | | 2,249,230 | |
+1.79%, 3.541%, 9/1/37 | | | 1,282,410 | | | | 1,347,082 | |
+1.94%, 3.959%, 1/1/38 | | | 261,185 | | | | 274,328 | |
+2.06%, 3.776%, 2/1/38 | | | 5,307,845 | | | | 5,639,310 | |
+1.96%, 3.823%, 7/1/38 | | | 247,860 | | | | 262,313 | |
+1.74%, 3.48%, 10/1/38 | | | 1,215,747 | | | | 1,274,193 | |
+1.80%, 3.595%, 10/1/41 | |
| 946,
582 |
| | | 973,809 | |
+1.80%, 2.555%, 8/1/42 | | | 7,771,035 | | | | 8,004,099 | |
+1.62%, 2.959%, 5/1/44 | | | 13,282,571 | | | | 13,535,590 | |
+1.61%, 2.994%, 5/1/44 | | | 1,650,880 | | | | 1,679,749 | |
+1.62%, 2.945%, 6/1/44 | | | 3,919,195 | | | | 3,988,850 | |
+1.62%, 3.121%, 6/1/44 | | | 4,751,908 | | | | 4,849,422 | |
+1.63%, 3.079%, 1/1/45 | | | 23,421,956 | | | | 23,838,154 | |
+1.62%, 2.736%, 10/1/45 | | | 10,432,192 | | | | 10,548,655 | |
+1.62%, 2.816%, 10/1/45 | | | 11,367,339 | | | | 11,497,414 | |
+1.63%, 3.249%, 7/1/47 | | | 11,194,996 | | | | 11,391,930 | |
Freddie Mac Gold, 15 Year | | | | | | | | |
6.50%, 3/1/18 | | | 110 | | | | 110 | |
4.50%, 9/1/24-9/1/26 | | | 7,085,929 | | | | 7,429,160 | |
4.00%, 3/1/25-11/1/26 | | | 27,659,966 | | | | 28,826,995 | |
Freddie Mac Gold, 20 Year | | | | | | | | |
6.50%, 10/1/26 | | | 3,296,587 | | | | 3,606,995 | |
4.50%, 4/1/31-6/1/31 | | | 9,736,665 | | | | 10,387,064 | |
Freddie Mac Gold, 30 Year | | | | | | | | |
7.75%, 7/25/21 | | | 155,397 | | | | 160,737 | |
7.47%, 3/17/23 | | | 70,110 | | | | 74,241 | |
6.50%, 12/1/32-4/1/33 | | | 5,194,769 | | | | 5,911,253 | |
7.00%, 11/1/37-9/1/38 | | | 4,272,736 | | | | 4,811,218 | |
5.50%, 12/1/37 | | | 600,318 | | | | 667,507 | |
6.00%, 2/1/39 | | | 1,453,886 | | | | 1,633,237 | |
4.50%, 9/1/41-8/1/47 | | | 309,040,369 | | | | 328,913,276 | |
Ginnie Mae, 30 Year | | | | | | | | |
7.97%, 4/15/20-1/15/21 | | | 149,604 | | | | 156,682 | |
7.50%, 11/15/24-10/15/25 | | | 591,875 | | | | 653,501 | |
| | | | | | | | |
| | | | | | | 1,344,153,940 | |
| | | | | | | | |
| | | | | | | 1,561,426,037 | |
| | | | | | | | |
| | | | | | | 1,732,894,095 | |
| CORPORATE: 9.8% | |
FINANCIALS: 3.8% | |
Bank of America Corp. | | | | | | | | |
4.20%, 8/26/24 | | | 5,825,000 | | | | 6,132,830 | |
6.625%, 5/23/36(b) | | | 37,275,000 | | | | 48,271,125 | |
3.004%, 12/20/23(c)(g) | | | 36,273,000 | | | | 36,361,029 | |
Barclays PLC (United Kingdom) | | | | | | | | |
4.375%, 9/11/24 | | | 18,275,000 | | | | 18,721,495 | |
4.836%, 5/9/28 | | | 4,525,000 | | | | 4,708,497 | |
BNP Paribas SA (France) | | | | | | | | |
4.25%, 10/15/24 | | | 31,175,000 | | | | 32,904,796 | |
4.375%, 9/28/25(c) | | | 13,700,000 | | | | 14,311,856 | |
4.375%, 5/12/26(c) | | | 8,000,000 | | | | 8,363,150 | |
4.625%, 3/13/27(c) | | | 4,275,000 | | | | 4,559,232 | |
Boston Properties, Inc. | | | | | | | | |
3.85%, 2/1/23 | | | 7,800,000 | | | | 8,124,726 | |
3.125%, 9/1/23 | | | 17,550,000 | | | | 17,685,509 | |
3.80%, 2/1/24 | | | 5,000,000 | | | | 5,180,324 | |
| | |
| PAGE 10 § DODGE & COX BALANCED FUND | | See accompanying Notes to Financial Statements |
| | | | |
| PORTFOLIO OF INVESTMENTS | | | December 31, 2017 | |
| | | | | | | | |
| DEBT SECURITIES (continued) | |
| | |
| | | PAR VALUE | | | VALUE | |
3.65%, 2/1/26 | | $ | 4,450,000 | | | $ | 4,519,568 | |
Capital One Financial Corp. | | | | | | | | |
3.50%, 6/15/23 | | | 21,006,000 | | | | 21,370,842 | |
4.20%, 10/29/25 | | | 10,175,000 | | | | 10,465,739 | |
Cigna Corp. | | | | | | | | |
7.875%, 5/15/27 | | | 17,587,000 | | | | 23,724,170 | |
Citigroup, Inc. | | | | | | | | |
4.00%, 8/5/24 | | | 5,925,000 | | | | 6,177,792 | |
USD LIBOR 3-Month
+6.37%, 7.75%, 10/30/40(b) | | | 37,080,925 | | | | 40,670,359 | |
Equity Residential | | | | | | | | |
3.00%, 4/15/23 | | | 14,775,000 | | | | 14,946,633 | |
2.85%, 11/1/26 | | | 6,000,000 | | | | 5,818,844 | |
HSBC Holdings PLC (United Kingdom) | | | | | | | | |
4.30%, 3/8/26 | | | 4,600,000 | | | | 4,889,385 | |
6.50%, 5/2/36 | | | 27,355,000 | | | | 35,677,143 | |
6.50%, 9/15/37 | | | 12,665,000 | | | | 16,644,161 | |
JPMorgan Chase & Co.
8.75%, 9/1/30(b) | | | 23,042,000 | | | | 33,877,272 | |
Lloyds Banking Group PLC (United Kingdom)
4.50%, 11/4/24 | | | 19,575,000 | | | | 20,535,340 | |
4.65%, 3/24/26 | | | 11,100,000 | | | | 11,717,596 | |
Navient Corp.
8.45%, 6/15/18 | | | 22,754,000 | | | | 23,334,227 | |
Royal Bank of Scotland Group PLC (United Kingdom)
6.125%, 12/15/22 | | | 43,156,000 | | | | 47,296,306 | |
6.00%, 12/19/23 | | | 8,825,000 | | | | 9,736,990 | |
Unum Group
7.19%, 2/1/28 | | | 8,305,000 | | | | 9,980,583 | |
7.25%, 3/15/28 | | | 2,030,000 | | | | 2,547,995 | |
6.75%, 12/15/28 | | | 11,368,000 | | | | 13,915,112 | |
Wells Fargo & Co.
2.15%, 12/6/19 | | | 22,800,000 | | | | 22,762,086 | |
4.30%, 7/22/27 | | | 21,995,000 | | | | 23,413,623 | |
USD LIBOR 3-Month
+0.65%, 2.159%, 12/6/19 | | | 11,575,000 | | | | 11,682,965 | |
| | | | | | | | |
| | | | | | | 621,029,300 | |
INDUSTRIALS: 5.6% | |
AT&T, Inc. | | | | | | | | |
5.35%, 9/1/40 | | | 27,575,000 | | | | 29,078,152 | |
4.75%, 5/15/46 | | | 7,000,000 | | | | 6,840,483 | |
5.65%, 2/15/47 | | | 5,175,000 | | | | 5,658,956 | |
4.50%, 3/9/48 | | | 24,560,000 | | | | 22,991,829 | |
BHP Billiton, Ltd. (Australia)
6.75%, 10/19/75(b)(c)(g) | | | 7,525,000 | | | | 8,786,115 | |
Burlington Northern Santa Fe LLC(e) | | | | | | | | |
5.72%, 1/15/24 | | | 3,597,215 | | | | 3,940,083 | |
5.342%, 4/1/24 | | | 7,331,181 | | | | 7,910,149 | |
5.629%, 4/1/24 | | | 11,439,857 | | | | 12,361,189 | |
Cemex SAB de CV (Mexico) | | | | | | | | |
6.00%, 4/1/24(c) | | | 10,575,000 | | | | 11,183,062 | |
5.70%, 1/11/25(c) | | | 22,475,000 | | | | 23,711,125 | |
6.125%, 5/5/25(c) | | | 8,100,000 | | | | 8,642,700 | |
Charter Communications, Inc. | | | | | | | | |
8.75%, 2/14/19 | | | 7,840,000 | | | | 8,358,646 | |
8.25%, 4/1/19 | | | 21,815,000 | | | | 23,313,799 | |
4.125%, 2/15/21 | | | 2,260,000 | | | | 2,327,118 | |
4.908%, 7/23/25 | | | 11,600,000 | | | | 12,330,162 | |
4.20%, 3/15/28 | | | 5,000,000 | | | | 4,962,015 | |
6.55%, 5/1/37 | | | 11,000,000 | | | | 12,928,469 | |
6.75%, 6/15/39 | | | 6,160,000 | | | | 7,386,233 | |
6.484%, 10/23/45 | | | 22,970,000 | | | | 26,760,900 | |
5.375%, 5/1/47 | | | 4,100,000 | | | | 4,200,482 | |
| | | | | | | | |
| | |
| | | PAR VALUE | | | VALUE | |
Cox Enterprises, Inc. | | | | | | | | |
3.25%, 12/15/22(c) | | $ | 6,240,000 | | | $ | 6,251,418 | |
2.95%, 6/30/23(c) | | | 37,166,000 | | | | 36,631,915 | |
3.85%, 2/1/25(c) | | | 24,125,000 | | | | 24,681,564 | |
CRH PLC (Ireland)
3.875%, 5/18/25(c) | | | 17,100,000 | | | | 17,845,782 | |
Dell Technologies, Inc.
4.42%, 6/15/21(c) | | | 6,165,000 | | | | 6,423,435 | |
5.45%, 6/15/23(c) | | | 14,966,000 | | | | 16,170,566 | |
Dillard’s, Inc. | | | | | | | | |
7.875%, 1/1/23 | | | 8,660,000 | | | | 9,873,163 | |
7.75%, 7/15/26 | | | 50,000 | | | | 57,012 | |
7.75%, 5/15/27 | | | 540,000 | | | | 622,763 | |
7.00%, 12/1/28 | | | 15,135,000 | | | | 16,662,591 | |
DowDuPont Inc.
7.375%, 11/1/29 | | | 17,000,000 | | | | 22,664,334 | |
9.40%, 5/15/39 | | | 5,677,000 | | | | 9,697,549 | |
Ford Motor Credit Co. LLC(e) | | | | | | | | |
2.681%, 1/9/20 | | | 13,000,000 | | | | 13,030,671 | |
5.75%, 2/1/21 | | | 12,700,000 | | | | 13,787,002 | |
5.875%, 8/2/21 | | | 12,945,000 | | | | 14,213,567 | |
4.25%, 9/20/22 | | | 4,243,000 | | | | 4,448,590 | |
Imperial Brands PLC (United Kingdom) | |
3.75%, 7/21/22(c) | | | 10,475,000 | | | | 10,823,550 | |
4.25%, 7/21/25(c) | | | 44,175,000 | | | | 46,308,553 | |
Kinder Morgan, Inc. | | | | | | | | |
4.30%, 6/1/25 | | | 11,050,000 | | | | 11,507,413 | |
5.50%, 3/1/44 | | | 25,893,000 | | | | 27,559,457 | |
5.40%, 9/1/44 | | | 20,119,000 | | | | 21,254,080 | |
Macy’s, Inc.
6.70%, 7/15/34 | | | 5,890,000 | | | | 6,161,336 | |
Naspers, Ltd. (South Africa) | | | | | | | | |
6.00%, 7/18/20(c) | | | 16,900,000 | | | | 18,143,232 | |
5.50%, 7/21/25(c) | | | 20,075,000 | | | | 21,861,033 | |
4.85%, 7/6/27(c) | | | 14,200,000 | | | | 14,724,207 | |
RELX PLC (United Kingdom)
3.125%, 10/15/22 | | | 17,458,000 | | | | 17,588,916 | |
Telecom Italia SPA (Italy) | | | | | | | | |
7.175%, 6/18/19 | | | 27,527,000 | | | | 29,213,029 | |
5.303%, 5/30/24(c) | | | 15,025,000 | | | | 16,039,187 | |
7.20%, 7/18/36 | | | 11,596,000 | | | | 14,408,030 | |
7.721%, 6/4/38 | | | 7,062,000 | | | | 9,109,980 | |
TransCanada Corp. (Canada) | | | | | | | | |
5.625%, 5/20/75(b)(g) | | | 20,570,000 | | | | 21,649,925 | |
5.875%, 8/15/76(b)(g) | | | 4,500,000 | | | | 4,871,250 | |
5.30%, 3/15/77(b)(g) | | | 20,885,000 | | | | 21,537,656 | |
Twenty-First Century Fox, Inc.
6.15%, 3/1/37 | | | 15,000,000 | | | | 19,631,205 | |
6.65%, 11/15/37 | | | 4,638,000 | | | | 6,374,741 | |
Ultrapar Participacoes SA (Brazil)
5.25%, 10/6/26(c) | | | 12,050,000 | | | | 12,269,551 | |
Union Pacific Corp.
6.176%, 1/2/31 | | | 8,177,455 | | | | 9,465,568 | |
Verizon Communications, Inc.
4.272%, 1/15/36 | | | 11,847,000 | | | | 11,777,241 | |
4.522%, 9/15/48 | | | 7,000,000 | | | | 6,886,247 | |
5.012%, 4/15/49 | | | 49,149,000 | | | | 51,500,736 | |
Xerox Corp.
6.35%, 5/15/18 | | | 6,029,000 | | | | 6,116,525 | |
4.50%, 5/15/21 | | | 13,311,000 | | | | 13,906,809 | |
Zoetis, Inc.
3.25%, 2/1/23 | | | 2,150,000 | | | | 2,182,788 | |
4.50%, 11/13/25 | | | 17,545,000 | | | | 19,117,554 | |
| | | | | | | | |
| | | | | | | 928,723,388 | |
| | |
| See accompanying Notes to Financial Statements | | DODGE & COX BALANCED FUND §PAGE 11 |
| | | | |
| PORTFOLIO OF INVESTMENTS | | | December 31, 2017 | |
| | | | | | | | |
| DEBT SECURITIES (continued) | |
| | |
| | | PAR VALUE | | | VALUE | |
UTILITIES: 0.4% | |
Dominion Energy, Inc. | | | | | | | | |
4.104%, 4/1/21 | | $ | 5,300,000 | | | $ | 5,514,926 | |
5.75%, 10/1/54(b)(g) | | | 22,950,000 | | | | 24,786,000 | |
Enel SPA (Italy) | | | | | | | | |
6.80%, 9/15/37(c) | | | 13,700,000 | | | | 18,308,496 | |
6.00%, 10/7/39(c) | | | 13,352,000 | | | | 16,601,052 | |
| | | | | | | | |
| | | | | | | 65,210,474 | |
| | | | | | | | |
| | | | | | | 1,614,963,162 | |
| | | | | | | | |
TOTAL DEBT SECURITIES
(Cost $4,142,536,327) | | | | | | $ | 4,314,870,504 | |
|
| EQUITY INDEX PUT OPTIONS PURCHASED: 0.4% | |
| | |
| | | CONTRACTS | | | VALUE | |
Counterparty: Goldman Sachs
S&P 500 Index, 6/15/18 at $2,375
Notional Amount $601,562,250 | | | 225,000 | | | $ | 6,211,005 | |
S&P 500 Index, 6/15/18 at $2,475 Notional Amount $267,361,000 | | | 100,000 | | | | 3,890,239 | |
S&P 500 Index, 12/21/18 at $2,550 Notional Amount $401,041,500 | | | 150,000 | | | | 15,158,554 | |
Counterparty: JPMorgan
S&P 500 Index, 6/15/18 at $2,375
Notional Amount $601,562,250 | | | 225,000 | | | | 6,211,005 | |
S&P 500 Index, 12/21/18 at $2,375 Notional Amount $401,041,500 | | | 150,000 | | | | 9,742,521 | |
S&P 500 Index, 12/21/18 at $2,475 Notional Amount $267,361,000 | | | 100,000 | | | | 8,373,515 | |
S&P 500 Index, 12/21/18 at $2,575 Notional Amount $334,201,250 | | | 125,000 | | | | 13,458,402 | |
| | | | | | | | |
| | | | 63,045,241 | |
| | | | | | | | |
TOTAL EQUITY INDEX PUT OPTIONS PURCHASED
(Cost $150,900,607) | | | | | | $ | 63,045,241 | |
|
| SHORT-TERM INVESTMENTS: 2.2% | |
| | |
| | | SHARES/
PAR VALUE | | | VALUE | |
REPURCHASE AGREEMENT: 2.1% | |
Fixed Income Clearing Corporation(d)
0.80%, dated 12/29/17, due 1/2/18, maturity value $341,815,381 | | $ | 341,785,000 | | | $ | 341,785,000 | |
|
MONEY MARKET FUND: 0.1% | |
State Street Institutional Treasury Plus Money Market Fund | | | 16,450,454 | | | | 16,450,454 | |
| | | | | | | | |
TOTAL SHORT-TERM INVESTMENTS
(Cost $358,235,454) | | | | | | $ | 358,235,454 | |
| | | | | | | | |
TOTAL INVESTMENTS
(Cost $11,830,672,829) | | | 100.1 | % | | $ | 16,405,962,114 | |
OTHER ASSETS LESS LIABILITIES | | | (0.1 | %) | | | (18,997,339 | ) |
| | | | | | | | |
| NET ASSETS | | | 100.0 | % | | $ | 16,386,964,775 | |
| | | | | | | | |
| (c) | Security exempt from registration under Rule 144A of the Securities Act of 1933. The security may be resold in transactions exempt from registration, normally to qualified institutional buyers. As of December 31, 2017, all such securities in total represented $578,595,478 or 3.5% of net assets. These securities have been deemed liquid by Dodge & Cox, investment manager, pursuant to procedures approved by the Fund’s Board of Trustees. |
| (d) | Repurchase agreement is collateralized by Federal Home Loan Bank 0.875%, 10/1/18, Fannie Mae 1.875%, 9/18/18, U.S. Treasury Notes 1.00%-1.875%, 8/15/18-10/31/22. Total collateral value is $348,621,292. |
| (e) | Subsidiary (see below) |
| (f) | Variable rate security: interest rate is determined by the interest rates of underlying pool of assets that collateralize the security. The interest rate of the security may change due to a change in the interest rates or the composition of underlying pool of assets. The interest rate shown is the rate as of period end. |
| (g) | Variable rate security: fixed-to-float security pays an initial fixed interest rate and will pay a floating interest rate established at a predetermined time in the future. The interest rate shown is the rate as of period end. |
In determining a company’s country designation, the Fund generally references the country of incorporation. In cases where the Fund considers the country of incorporation to be a “jurisdiction of convenience” chosen primarily for tax purposes or in other limited circumstances, the Fund uses the country designation of an appropriate broad-based market index. In those cases, two countries are listed — the country of incorporation and the country designated by an appropriate index, respectively.
Debt securities are grouped by parent company unless otherwise noted. Actual securities may be issued by the listed parent company or one of its subsidiaries.
ADR: American Depositary Receipt
ARM: Adjustable Rate Mortgage
CMBS: Commercial Mortgage-Backed Security
CMO: Collateralized Mortgage Obligation
CMT: Constant Maturity Treasury
DUS: Delegated Underwriting and Servicing
GO: General Obligation
RB: Revenue Bond
REMIC: Real Estate Mortgage Investment Conduit
FUTURES CONTRACTS
| | | | | | | | | | | | | | | | |
| Description | | Number of
Contracts | | | Expiration
Date | | | Notional
Amount | | | Value /
Unrealized
Appreciation
(Depreciation) | |
10 Year U.S. Treasury Note—Short Position | | | 1,041 | | | | Mar 2018 | | | $ | (129,132,797 | ) | | $ | 793,460 | |
Ultra Long Term U.S. Treasury Bond—Short Position | | | 569 | | | | Mar 2018 | | | | (95,396,406 | ) | | | (486,796 | ) |
| | | | | | | | | | | | | | | | |
| | | | | | | | | | | | | | $ | 306,664 | |
| | | | | | | | | | | | | | | | |
| | |
| PAGE 12 § DODGE & COX BALANCED FUND | | See accompanying Notes to Financial Statements |
| | | | |
STATEMENT OF ASSETS AND LIABILITIES | |
| |
| | | December 31, 2017 | |
ASSETS: | | | | |
Investments in securities, at value (cost $11,830,672,829) | | $ | 16,405,962,114 | |
Deposits with broker for futures contracts | | | 3,198,361 | |
Receivable for investments sold | | | 8,429,879 | |
Receivable for Fund shares sold | | | 12,812,800 | |
Dividends and interest receivable | | | 54,490,123 | |
Prepaid expenses and other assets | | | 94,964 | |
| | | | |
| | | 16,484,988,241 | |
| | | | |
LIABILITIES: | | | | |
Cash received as collateral for options purchased | | | 59,790,000 | |
Payable for variation margin for futures contracts | | | 460,396 | |
Payable for investments purchased | | | 5,277,585 | |
Payable for Fund shares redeemed | | | 24,732,189 | |
Management fees payable | | | 6,952,606 | |
Accrued expenses | | | 810,690 | |
| | | | |
| | | 98,023,466 | |
| | | | |
NET ASSETS | | $ | 16,386,964,775 | |
| | | | |
NET ASSETS CONSIST OF: | | | | |
Paid in capital | | $ | 11,720,649,151 | |
Undistributed net investment income | | | 2,270,590 | |
Undistributed net realized gain | | | 88,449,085 | |
Net unrealized appreciation | | | 4,575,595,949 | |
| | | | |
| | $ | 16,386,964,775 | |
| | | | |
Fund shares outstanding (par value $0.01 each, unlimited shares authorized) | | | 153,151,682 | |
Net asset value per share | | $ | 107.00 | |
| |
STATEMENT OF OPERATIONS | | | | |
| |
| | | Year Ended December 31, 2017 | |
INVESTMENT INCOME: | | | | |
Dividends (net of foreign taxes of $4,287,101) | | $ | 223,914,730 | |
Interest | | | 196,710,999 | |
| | | | |
| | | 420,625,729 | |
| | | | |
EXPENSES: | | | | |
Management fees | | | 79,556,879 | |
Custody and fund accounting fees | | | 284,461 | |
Transfer agent fees | | | 1,790,864 | |
Professional services | | | 163,472 | |
Shareholder reports | | | 292,367 | |
Registration fees | | | 120,066 | |
Trustees’ fees | | | 280,417 | |
ADR depositary services fees | | | 857,536 | |
Miscellaneous | | | 255,600 | |
| | | | |
| | | 83,601,662 | |
| | | | |
NET INVESTMENT INCOME | | | 337,024,067 | |
| | | | |
REALIZED AND UNREALIZED GAIN (LOSS): | | | | |
Net realized gain (loss) | | | | |
Investments in securities | | | 869,513,542 | |
Futures contracts | | | (11,400,433 | ) |
Net change in unrealized appreciation/depreciation | | | | |
Investments in securities | | | 695,834,784 | |
Futures contracts | | | (1,157,643 | ) |
| | | | |
Net realized and unrealized gain | | | 1,552,790,250 | |
| | | | |
NET CHANGE IN NET ASSETS
FROM OPERATIONS | | $ | 1,889,814,317 | |
| | | | |
| | | | | | | | |
STATEMENT OF CHANGES IN NET ASSETS | |
| | |
| | | Year Ended
December 31, 2017 | | | Year Ended
December 31, 2016 | |
OPERATIONS: | | | | | | | | |
Net investment income | | $ | 337,024,067 | | | $
| 342,632,985
|
|
Net realized gain | | | 858,113,109 | | | | 652,399,623 | |
Net change in unrealized appreciation/depreciation | | | 694,677,141 | | | | 1,209,354,799 | |
| | | | | | | | |
| | | 1,889,814,317 | | | | 2,204,387,407 | |
| | | | | | | | |
| | |
DISTRIBUTIONS TO SHAREHOLDERS FROM: | | | | | | | | |
Net investment income | | | (338,037,335 | ) | | | (342,522,606 | ) |
Net realized gain | | | (994,897,721 | ) | | | (577,591,290 | ) |
| | | | | | | | |
Total distributions | | | (1,332,935,056 | ) | | | (920,113,896 | ) |
| | | | | | | | |
| | |
FUND SHARE
TRANSACTIONS: | | | | | | | | |
Proceeds from sale of shares | | | 1,562,877,163 | | | | 1,311,438,514 | |
Reinvestment of distributions | | | 1,265,331,879 | | | | 873,912,502 | |
Cost of shares redeemed | | | (2,379,686,448 | ) | | | (2,357,390,650 | ) |
| | | | | | | | |
Net change from Fund share transactions | | | 448,522,594 | | | | (172,039,634 | ) |
| | | | | | | | |
Total change in net assets | | | 1,005,401,855 | | | | 1,112,233,877 | |
| | |
NET ASSETS: | | | | | | | | |
Beginning of year | | | 15,381,562,920 | | | | 14,269,329,043 | |
| | | | | | | | |
End of year (including undistributed net investment income of $2,270,590 and $2,394,380, respectively) | | $ | 16,386,964,775 | | | $
| 15,381,562,920
|
|
| | | | | | | | |
| | |
SHARE INFORMATION: | | | | | | | | |
Shares sold | | | 14,655,810 | | | | 13,426,666 | |
Distributions reinvested | | | 11,918,105 | | | | 8,834,100 | |
Shares redeemed | | | (22,251,076 | ) | | | (24,554,403 | ) |
| | | | | | | | |
Net change in shares outstanding | | | 4,322,839 | | | | (2,293,637 | ) |
| | | | | | | | |
| | |
| See accompanying Notes to Financial Statements | | DODGE & COX BALANCED FUND §PAGE 13 |
NOTES TO FINANCIAL STATEMENTS
NOTE 1—ORGANIZATION AND SIGNIFICANT ACCOUNTING POLICIES
Dodge & Cox Balanced Fund (the “Fund”) is one of the series constituting the Dodge & Cox Funds (the “Trust” or the “Funds”). The Trust is organized as a Delaware statutory trust and is registered under the Investment Company Act of 1940, as amended, as an open-end management investment company. The Fund commenced operations on June 26, 1931, and seeks regular income, conservation of principal, and an opportunity for long-term growth of principal and income. Risk considerations and investment strategies of the Fund are discussed in the Fund’s Prospectus.
The financial statements have been prepared in conformity with accounting principles generally accepted in the United States of America, which require the use of estimates and assumptions by management. Actual results may differ from those estimates. Significant accounting policies are as follows:
Security valuation The Fund’s net assets are normally valued as of the scheduled close of trading on the New York Stock Exchange (NYSE), generally 4:00 p.m. Eastern Time, each day that the NYSE is open for business. Portfolio securities and other financial instruments for which market quotes are readily available are valued at market value. Listed securities are generally valued using the official quoted close price or the last sale on the exchange that is determined to be the primary market for the security.
Debt securities, certain preferred stocks, and derivatives traded over the counter are valued using prices received from independent pricing services which utilize dealer quotes, recent transaction data, pricing models, and other inputs to arrive at market-based valuations. Pricing models may consider quoted prices for similar securities, interest rates, cash flows (including prepayment speeds), and credit risk. Exchange-traded derivatives are valued at the settlement price determined by the relevant exchange. Short-term securities less than 60 days to maturity may be valued at amortized cost if amortized cost approximates current value. Mutual funds are valued at their respective net asset values. Security values are not discounted based on the size of the Fund’s position and may differ from the value a Fund receives upon sale of the securities. All securities held by the Fund are denominated in U.S. dollars.
If market quotations are not readily available or if normal valuation procedures produce valuations that are deemed unreliable or inappropriate under the circumstances existing at the time, the investment will be valued at fair value as determined in good faith by or under the direction of the Fund’s Board of Trustees. The Board of Trustees has appointed Dodge & Cox, the Fund’s investment manager, to make fair value determinations in accordance with the Dodge & Cox Funds Valuation Policies (“Valuation Policies”), subject to Board oversight. Dodge & Cox has established a Pricing Committee that is comprised of representatives from Treasury, Legal, Compliance, and Operations. The Pricing Committee is responsible for implementing the Valuation Policies, including determining the fair value of
securities and other investments when necessary. The Pricing Committee considers relevant indications of value that are reasonably available to it in determining the fair value assigned to a particular security, such as the value of similar financial instruments, trading volumes, contractual restrictions on disposition, related corporate actions, and changes in economic conditions. In doing so, the Pricing Committee employs various methods for calibrating fair valuation approaches, including a regular review of key inputs and assumptions, back-testing, and review of any related market activity.
Valuing securities through a fair value determination involves greater reliance on judgment than valuation of securities based on readily available market quotations. In some instances, lack of information and uncertainty as to the significance of information may lead to a conclusion that a prior valuation is the best indication of a security’s value. When fair value pricing is employed, the prices of securities used by the Fund to calculate its net asset value may differ from quoted or published prices for the same securities.
Security transactions, investment income, expenses, and distributions Security transactions are recorded on the trade date. Realized gains and losses on securities sold are determined on the basis of identified cost.
Dividend income and corporate action transactions are recorded on the ex-dividend date, or when the Fund first learns of the dividend/corporate action if the ex-dividend date has passed. Non-cash dividends, if any, are recorded at the fair market value of the securities received. Dividends characterized as return of capital for U.S. tax purposes are recorded as a reduction of cost of investments and/or realized gain.
Interest income is recorded on the accrual basis. Interest income includes coupon interest, amortization of premium and accretion of discount on debt securities, and gain/loss on paydowns. The ability of the issuers of the debt securities held by the Fund to meet their obligations may be affected by economic developments in a specific industry, state, or region. Debt obligations may be placed on non-accrual status and related interest income may be reduced by ceasing current accruals and writing off interest receivables when the collection of all or a portion of interest has become doubtful. A debt obligation is removed from non-accrual status when the issuer resumes interest payments or when collectibility of interest is reasonably assured.
Expenses are recorded on the accrual basis. Some expenses of the Trust can be directly attributed to a specific series. Expenses which cannot be directly attributed are allocated among the Funds in the Trust using methodologies determined by the nature of the expense.
Distributions to shareholders are recorded on the ex-dividend date.
Foreign taxes The Fund may be subject to foreign taxes which may be imposed by certain countries in which the Fund invests. The Fund endeavors to record foreign taxes based on applicable foreign tax law. Withholding taxes are incurred on certain foreign dividends and are accrued at the time the associated dividend is recorded. The Fund files withholding tax
PAGE 14 § DODGE & COX BALANCED FUND
NOTES TO FINANCIAL STATEMENTS
reclaims in certain jurisdictions to recover a portion of amounts previously withheld. The Fund records a reclaim receivable based on, among other things, a jurisdiction’s legal obligation to pay reclaims as well as payment history and market convention. In consideration of recent decisions rendered by European courts, the Fund has filed for additional reclaims related to prior years. A corresponding receivable is established when both the amount is known and significant contingencies or uncertainties regarding collectability are removed. These amounts, if any, are reported in “dividends and interest receivable” in the Statement of Assets and Liabilities.
Repurchase agreements Repurchase agreements are transactions under which a Fund purchases a security from a dealer counterparty and agrees to resell the security to that counterparty on a specified future date at the same price, plus a specified interest rate. The Fund’s repurchase agreements are secured by U.S. government or agency securities. It is the Fund’s policy that its custodian take possession of the underlying collateral securities, the fair value of which exceeds the principal amount of the repurchase transaction, including accrued interest, at all times. In the event of default by the counterparty, the Fund has the contractual right to liquidate the collateral securities and to apply the proceeds in satisfaction of the obligation.
Indemnification Under the Trust’s organizational documents, its officers and trustees are indemnified against certain liabilities arising out of the performance of their duties to the Trust. In addition, in the normal course of business the Trust enters into contracts that provide general indemnities to other parties. The Trust’s maximum exposure under these arrangements is unknown as this would involve future claims that may be made against the Trust that have not yet occurred.
NOTE 2—VALUATION MEASUREMENTS
Various inputs are used in determining the value of the Fund’s investments. These inputs are summarized in the three broad levels listed below.
| § | | Level 1: Quoted prices in active markets for identical securities |
| § | | Level 2: Other significant observable inputs (including quoted prices for similar securities, market indices, interest rates, credit risk, forward exchange rates, etc.) |
| § | | Level 3: Significant unobservable inputs (including Fund management’s assumptions in determining the fair value of investments) |
The inputs or methodology used for valuing securities are not necessarily an indication of the risk associated with investing in those securities.
The following is a summary of the inputs used to value the Fund’s holdings at December 31, 2017:
| | | | | | | | |
| Classification(a) | | LEVEL 1
(Quoted Prices) | | | LEVEL 2
(Other Significant
Observable Inputs) | |
Securities | | | | | | | | |
Common Stocks(b) | | $ | 10,861,894,875 | | | $ | — | |
Preferred Stocks | | | — | | | | 807,916,040 | |
Debt Securities | | | | | | | | |
U.S. Treasury | | | — | | | | 667,285,606 | |
Government-Related | | | — | | | | 299,727,641 | |
Securitized | | | — | | | | 1,732,894,095 | |
Corporate | | | — | | | | 1,614,963,162 | |
Equity Index Put Options
Purchased | | | — | | | | 63,045,241 | |
Short-term Investments | | | | | | | | |
Repurchase Agreement | | | — | | | | 341,785,000 | |
Money Market Fund | | | 16,450,454 | | | | — | |
| | | | | | | | |
Total Securities | | $ | 10,878,345,329 | | | $ | 5,527,616,785 | |
| | | | | | | | |
Other Investments | | | | | | | | |
Futures Contracts | | | | | | | | |
Appreciation | | $ | 793,460 | | | $ | — | |
Depreciation | | | (486,796 | ) | | | — | |
| | | | | | | | | |
| (a) | There were no transfers between Level 1 and Level 2 during the year ended December 31, 2017. There were no Level 3 securities at December 31, 2017 and 2016, and there were no transfers to Level 3 during the year. |
| (b) | All common stocks held in the Fund are Level 1 securities. For a detailed break-out of common stocks by major industry classification, please refer to the Portfolio of Investments. |
NOTE 3—DERIVATIVE INSTRUMENTS
The Fund entered into various transactions involving derivative instruments, including Treasury futures contracts and purchased equity index put options, in connection with its investment strategy. The Fund may use derivatives to minimize the impact of losses to one or more of its investments (as a “hedging technique”) or to implement its investment strategy.
The Fund has entered into over-the-counter derivatives, such as put options (each, an “OTC Derivative”). Each OTC Derivative is subject to a negotiated master agreement (based on a form published by the International Swaps and Derivatives Association (“ISDA”)) governing all OTC Derivatives between the Fund and the relevant dealer counterparty. The master agreements specify (i) events of default and other events permitting a party to terminate some or all of the OTC Derivatives thereunder and (ii) the process by which those OTC Derivatives will be valued for purposes of determining termination payments. If some or all of the OTC Derivatives under a master agreement are terminated because of an event of default or similar event, the values of all terminated OTC Derivatives must be netted to determine a single payment owed by one party to the other. To the extent amounts owed to the Fund by its counterparties are not collateralized, the Fund is at risk of those counterparties’ non-performance. The Fund attempts to mitigate counterparty credit risk by entering into OTC Derivatives only with counterparties it believes to be of good credit quality, by exchanging collateral, and by monitoring the financial stability of those counterparties.
DODGE & COX BALANCED FUND §PAGE 15
NOTES TO FINANCIAL STATEMENTS
Futures contracts Futures contracts involve an obligation to purchase or sell (depending on whether the Fund has entered a long or short futures contract, respectively) an asset at a future date, at a price set at the time of the contract. Upon entering into a futures contract, the Fund is required to deposit an amount of cash or liquid assets (referred to as initial margin) in a segregated account with the clearing broker. Subsequent payments (referred to as variation margin) to and from the clearing broker are made on a daily basis based on changes in the market value of futures contracts. Futures contracts are traded publicly and their market value changes daily. Changes in the market value of open futures contracts are recorded as unrealized appreciation or depreciation in the Statement of Operations. Realized gains and losses on futures contracts are recorded in the Statement of Operations at the closing or expiration of the contracts. Cash deposited with a broker as initial margin is recorded in the Statement of Assets and Liabilities. A receivable and/or payable to brokers for daily variation margin is also recorded in the Statement of Assets and Liabilities.
Investments in futures contracts may include certain risks, which may be different from, and potentially greater than, those of the underlying securities. To the extent the Fund uses futures, it is exposed to additional volatility and potential losses resulting from leverage.
The Fund has maintained short Treasury futures contracts to assist with the management of the portfolio’s interest rate exposure. During the year ended December 31, 2017, these Treasury futures contracts had notional values ranging from 1% to 3% of net assets.
Equity index put options An equity index put option gives its holder the right (but not the obligation) to sell the future value of an equity stock index, such as the S&P 500 index, at a predetermined strike price. A put option has value at its expiration if the index price is lower than the strike price. The buyer of an equity index put option pays a premium amount to purchase the contract, but has no payment obligations thereafter. Cash collateral received from the counterparty is recorded in the Statement of Assets and Liabilities. Changes in the value of open equity index put options are recorded as unrealized appreciation or depreciation and realized gains or losses are recorded at the closing or expiration of the options in the Statement of Operations within investments in securities. For the year ended December 31, 2017, the change in unrealized appreciation/depreciation and realized gain (loss) was ($87,855,366) and ($77,934,498), respectively.
The Fund purchased over-the-counter equity index put options to hedge against a general downturn in the equity markets. During the year ended December 31, 2017, these equity index put options had values up to 1% of net assets.
Additional derivative information For financial reporting purposes, the Fund does not offset OTC Derivative assets and liabilities that are subject to a master netting arrangement in the Statement of Assets and Liabilities. OTC Derivatives are presented in the Statement of Assets and Liabilities as investments. Collateral held by the Fund for OTC Derivatives are reported gross and
presented as “Cash received as collateral for options purchased” in the Statement of Assets and Liabilities.
The netting of assets and liabilities and the offsetting of collateral pledged or received are based on contractual netting/set-off provisions in the ISDA master agreement. The following table presents the Fund’s net exposure for OTC Derivatives that are subject to enforceable master netting arrangements as of December 31, 2017. The net amount represents the receivable from (payable to) the counterparty in the event of a default.
| | | | | | | | | | | | | | | | |
| Counterparty | | Gross OTC Derivative Assets | | | Gross OTC Derivative Liabilities | | | Cash Collateral Pledged/ (Received)(a) | | | Net Amount | |
Goldman Sachs | | $ | 25,259,798 | | | $ | — | | | $ | (23,830,000 | ) | | $ | 1,429,798 | |
JPMorgan | | | 37,785,443 | | | | — | | | | (35,960,000 | ) | | | 1,825,443 | |
| | | | | | | | | | | | | | | | |
Total | | $ | 63,045,241 | | | $ | — | | | $ | (59,790,000 | ) | | $ | 3,255,241 | |
| | | | | | | | | | | | | | | | |
| | | | | | | | | | | | | | | | | |
| (a) | Cash collateral received in excess of OTC Derivative assets/liabilities, if any, is not presented. Total cash collateral received is presented in the Fund’s Statement of Assets and Liabilities. |
NOTE 4—RELATED PARTY TRANSACTIONS
Management fees Under a written agreement approved by a unanimous vote of the Board of Trustees, the Fund pays a management fee monthly at an annual rate of 0.50% of the Fund’s average daily net assets to Dodge & Cox, investment manager of the Fund.
Fund officers and trustees All officers and two of the trustees of the Trust are officers or employees of Dodge & Cox. The Trust pays a fee only to those trustees who are not affiliated with Dodge & Cox.
NOTE 5—INCOME TAX INFORMATION AND DISTRIBUTIONS TO SHAREHOLDERS
A provision for federal income taxes is not required since the Fund intends to continue to qualify as a regulated investment company under Subchapter M of the Internal Revenue Code and distribute all of its taxable income to shareholders. Distributions are determined in accordance with income tax regulations, and such amounts may differ from net investment income and realized gains for financial reporting purposes. Financial reporting records are adjusted for permanent book to tax differences at year end to reflect tax character.
Book to tax differences are primarily due to differing treatments of wash sales, net short-term realized gain (loss), certain dividends, derivatives, and Treasury Inflation-Protected Securities. At December 31, 2017, the cost of investments in securities and derivatives for federal income tax purposes was $11,834,927,609.
Distributions during the years noted below were characterized as follows for federal income tax purposes:
| | | | | | | | |
| | | Year Ended
December 31, 2017 | | | Year Ended
December 31, 2016 | |
Ordinary income | | $ | 381,953,061 | | | $ | 353,285,575 | |
| | ($ | 2.589 per share | ) | | ($ | 2.414 per share | ) |
Long-term capital gain | | $ | 950,981,995 | | | $ | 566,828,321 | |
| | ($ | 6.491 per share | ) | | ($ | 3.884 per share | ) |
PAGE 16 § DODGE & COX BALANCED FUND
NOTES TO FINANCIAL STATEMENTS
At December 31, 2017, the tax basis components of distributable earnings were as follows:
| | | | |
Unrealized appreciation | | $ | 4,906,320,807 | |
Unrealized depreciation | | | (334,979,638 | ) |
| | | | |
Net unrealized appreciation | | | 4,571,341,169 | |
Undistributed ordinary income | | | 2,283,411 | |
Undistributed long-term capital gain | | | 168,781,846 | |
Deferred loss(a) | | | (76,090,802 | ) |
| | | | | |
| (a) | Represents capital loss incurred between November 1, 2017 and December 31, 2017. As permitted by tax regulation, the Fund has elected to treat this loss as arising in 2018. |
Fund management has reviewed the tax positions for open periods (three years and four years, respectively, from filing the Fund’s Federal and State tax returns) as applicable to the Fund, and has determined that no provision for income tax is required in the Fund’s financial statements.
NOTE 6—LOAN FACILITIES
Pursuant to an exemptive order issued by the Securities and Exchange Commission (SEC), the Fund may participate in an interfund lending facility (Facility). The Facility allows the Fund to borrow money from or loan money to the Funds. Loans under the Facility are made for temporary or emergency purposes, such as to fund shareholder redemption requests. Interest on borrowings is the average of the current repurchase agreement rate and the bank loan rate. There was no activity in the Facility during the year.
All Funds in the Trust participate in a $500 million committed credit facility (Line of Credit) with State Street Bank and Trust Company, to be utilized for temporary or emergency purposes to fund shareholder redemptions or for other short-term liquidity purposes. The maximum amount available to the Fund is $250 million. Each Fund pays an annual commitment fee on its
pro-rata portion of the Line of Credit. For the year ended December 31, 2017, the Fund’s commitment fee amounted to $100,085 and is reflected as a Miscellaneous Expense in the Statement of Operations. Interest on borrowings is charged at the prevailing rate. There were no borrowings on the Line of Credit during the year.
NOTE 7—PURCHASES AND SALES OF INVESTMENTS
For the year ended December 31, 2017, purchases and sales of securities, other than short-term securities and U.S. government securities, aggregated $1,859,442,282 and $2,815,555,417, respectively. For the year ended December 31, 2017, purchases and sales of U.S. government securities aggregated $1,169,456,463 and $846,434,667, respectively.
NOTE 8—NEW ACCOUNTING GUIDANCE
In March 2017, the Financial Accounting Standards Board issued an update to amend the amortization period for certain purchased callable debt securities held at a premium. The amendments shorten the amortization period for premiums to the earliest call date, but do not require an accounting change for securities held at a discount. The amendments are effective for financial statements for fiscal years beginning after December 15, 2018, and interim periods within those fiscal years. Management is evaluating the impact, if any, of this guidance on the Fund’s financial statements and disclosures.
NOTE 9—SUBSEQUENT EVENTS
Fund management has determined that no material events or transactions occurred subsequent to December 31, 2017, and through the date of the Fund’s financial statements issuance, which require additional disclosure in the Fund’s financial statements.
FINANCIAL HIGHLIGHTS
| | | | | | | | | | | | | | | | | | | | |
SELECTED DATA AND RATIOS (for a share outstanding throughout each year) | | Year Ended December 31, | |
| | | 2017 | | | 2016 | | | 2015 | | | 2014 | | | 2013 | |
| | | | |
Net asset value, beginning of year | | | $103.35 | | | | $94.42 | | | | $102.48 | | | | $98.30 | | | | $78.06 | |
Income from investment operations: | | | | | | | | | | | | | | | | | | | | |
Net investment income | | | 2.28 | | | | 2.34 | | | | 2.06 | | | | 2.03 | | | | 1.66 | |
Net realized and unrealized gain (loss) | | | 10.45 | | | | 12.89 | | | | (4.99 | ) | | | 6.59 | | | | 20.30 | |
| | | | |
Total from investment operations | | | 12.73 | | | | 15.23 | | | | (2.93 | ) | | | 8.62 | | | | 21.96 | |
| | | | |
Distributions to shareholders from: | | | | | | | | | | | | | | | | | | | | |
Net investment income | | | (2.29 | ) | | | (2.34 | ) | | | (2.06 | ) | | | (2.03 | ) | | | (1.65 | ) |
Net realized gain | | | (6.79 | ) | | | (3.96 | ) | | | (3.07 | ) | | | (2.41 | ) | | | (0.07 | ) |
| | | | |
Total distributions | | | (9.08 | ) | | | (6.30 | ) | | | (5.13 | ) | | | (4.44 | ) | | | (1.72 | ) |
| | | | |
Net asset value, end of year | | | $107.00 | | | | $103.35 | | | | $94.42 | | | | $102.48 | | | | $98.30 | |
| | | | |
Total return | | | 12.59 | % | | | 16.55 | % | | | (2.88 | )% | | | 8.85 | % | | | 28.37 | % |
Ratios/supplemental data: | | | | | | | | | | | | | | | | | | | | |
Net assets, end of year (millions) | | | $16,387 | | | | $15,382 | | | | $14,269 | | | | $15,465 | | | | $14,404 | |
Ratios of expenses to average net assets | | | 0.53 | % | | | 0.53 | % | | | 0.53 | % | | | 0.53 | % | | | 0.53 | % |
Ratios of net investment income to average net assets | | | 2.12 | % | | | 2.41 | % | | | 2.03 | % | | | 2.00 | % | | | 1.85 | % |
Portfolio turnover rate | | | 19 | % | | | 24 | % | | | 20 | % | | | 23 | % | | | 25 | % |
See accompanying Notes to Financial Statements
DODGE & COX BALANCED FUND §PAGE 17
REPORT OF INDEPENDENT REGISTERED PUBLIC ACCOUNTING FIRM
To the Board of Trustees of the Dodge & Cox Funds and Shareholders of Dodge & Cox Balanced Fund
Opinion on the Financial Statements
We have audited the accompanying statement of assets and liabilities, including the portfolio of investments, of Dodge & Cox Balanced Fund (one of the funds constituting Dodge & Cox Funds, referred to hereafter as the “Fund”) as of December 31, 2017, the related statement of operations for the year ended December 31, 2017, the statement of changes in net assets for each of the two years in the period ended December 31, 2017, including the related notes, and the financial highlights for each of the five years in the period ended December 31, 2017 (collectively referred to as the “financial statements”). In our opinion, the financial statements present fairly, in all material respects, the financial position of the Fund as of December 31, 2017, the results of its operations for the year then ended, the changes in its net assets for each of the two years in the period ended December 31, 2017 and the financial highlights for each of the five years in the period ended December 31, 2017 in conformity with accounting principles generally accepted in the United States of America.
Basis for Opinion
These financial statements are the responsibility of the Fund’s management. Our responsibility is to express an opinion on the Fund’s financial statements based on our audits. We are a public accounting firm registered with the Public Company Accounting Oversight Board (United States) (“PCAOB”) and are required to be independent with respect to the Fund in accordance with the U.S. federal securities laws and the applicable rules and regulations of the Securities and Exchange Commission and the PCAOB.
We conducted our audits of these financial statements in accordance with the standards of the PCAOB. Those standards require that we plan and perform the audit to obtain reasonable assurance about whether the financial statements are free of material misstatement, whether due to error or fraud.
Our audits included performing procedures to assess the risks of material misstatement of the financial statements, whether due to error or fraud, and performing procedures that respond to those risks. Such procedures included examining, on a test basis, evidence regarding the amounts and disclosures in the financial statements. Our audits also included evaluating the accounting principles used and significant estimates made by management, as well as evaluating the overall presentation of the financial statements. Our procedures included confirmation of securities owned as of December 31, 2017 by correspondence with the custodian, transfer agent and brokers; when replies were not received from brokers, we performed other auditing procedures. We believe that our audits provide a reasonable basis for our opinion.
PricewaterhouseCoopers LLP
San Francisco, California
February 16, 2018
We have served as the auditor of one or more investment companies in the Dodge & Cox Funds since 1931.
PAGE 18 § DODGE & COX BALANCED FUND
SPECIAL 2017 TAX INFORMATION
(unaudited)
The following information is provided pursuant to provisions of the Internal Revenue Code:
The Fund designates $226,646,608 of its distributions paid to shareholders in 2017 as qualified dividends (treated for federal income tax purposes in the hands of shareholders as taxable at a maximum rate of 20%).
For shareholders that are corporations, the Fund designates 48% of its ordinary dividends paid to shareholders in 2017 as dividends from domestic corporations eligible for the corporate dividends received deduction, provided that the shareholder otherwise satisfies applicable requirements to claim that deduction.
BOARD APPROVAL OF FUNDS’ INVESTMENT MANAGEMENT AGREEMENTS AND MANAGEMENT FEES
(unaudited)
The Board of Trustees is responsible for overseeing the performance of the Dodge & Cox Funds’ investment manager and determining whether to continue the Investment Management Agreements between the Funds and Dodge & Cox each year (the “Agreements”). At a meeting of the Board of Trustees of the Trust held on December 14, 2017, the Trustees, by a unanimous vote (including a separate vote of those Trustees who are not “interested persons” (as defined in the Investment Company Act of 1940) (the “Independent Trustees”)), approved the renewal of the Agreements for an additional one-year term through December 31, 2018 with respect to each Fund. During the course of the year, the Board received extensive information and materials relating to the investment management and administrative services provided by Dodge & Cox and the performance of each of the Funds.
INFORMATION RECEIVED
In 2016 and 2017, the Board requested, received, and discussed a number of special presentations on topics relevant to their consideration of the proposed renewal of the Funds’ Agreements. In addition to the foregoing and in advance of the meetings referred to below, the Board, including the Independent Trustees, requested, received, and reviewed materials relating to the Agreements and the services provided by Dodge & Cox. The Independent Trustees retained Morningstar to prepare an independent expense and performance summary for each Fund and comparable funds managed by other advisers identified by Morningstar. The Morningstar materials included information regarding advisory fee rates, expense ratios, and transfer agency, custodial, and distribution expenses, as well as performance comparisons to each Fund’s peer group and to a broad-based securities index or combination of indices. The Morningstar materials also included a comparison of expenses of various share classes offered by comparable funds. The materials reviewed by the Board contained information concerning, among other things, Dodge & Cox’s profitability, financial results and condition, advisory fee revenue, and separate account fee schedules. The Board additionally considered the Funds’ brokerage commissions, turnover rates, sales and redemption data, and the significant investment that Dodge & Cox makes in research used in managing
the Funds. The Board received and reviewed memoranda and related materials addressing, among other things, Dodge & Cox’s services to the Funds; how Dodge & Cox Funds’ fees compare to fees of peer group funds; the different fees, services, costs, and risks associated with other accounts managed by Dodge & Cox as compared to the Dodge & Cox Funds; and the ways in which the Funds realize economies of scale. Throughout the process of reviewing the services provided by Dodge & Cox and preparing for the meeting, the Independent Trustees found Dodge & Cox to be open, forthright, detailed, and very helpful in answering questions about all issues. The Board received copies of the Agreements and a memorandum from the independent legal counsel to the Independent Trustees discussing the factors generally regarded as appropriate to consider in evaluating advisory arrangements. The Trust’s Contract Review Committee, consisting solely of Independent Trustees, met with the independent legal counsel on November 9, 2017 and again on December 14, 2017 to discuss whether to renew the Agreements. The Board, including the Independent Trustees, subsequently concluded that the existing Agreements are fair and reasonable and voted to approve the Agreements. In considering the Agreements, the Board, including the Independent Trustees, did not identify any single factor or particular information as all-important or controlling. In reaching the decision to approve the Agreements, the Board considered several factors, discussed below, to be key factors and reached the conclusions described below.
NATURE, QUALITY, AND EXTENT OF THE SERVICES
The Board considered that Dodge & Cox provides a wide range of services to the Funds in addition to portfolio management. The extensive nature of services provided by Dodge & Cox has been documented in materials provided to the Board and in presentations made to the Board throughout the year. In particular, the Board considered the nature, quality, and extent of portfolio management, administrative, and shareholder services performed by Dodge & Cox. With regard to portfolio management services, the Board considered Dodge & Cox’s established long-term history of care and conscientiousness in the management of the Funds; its demonstrated consistency in investment approach and depth; the background and experience of the Dodge & Cox U.S. Equity Investment Committee, International Equity Investment Committee, Global Equity Investment Committee, U.S. Fixed Income Investment Committee, and Global Fixed Income Investment Committee, and research analysts responsible for managing the Funds; Dodge & Cox’s methods for assessing the regulatory and investment climate in various jurisdictions; its overall high level of attention to its core investment management function; and its commitment to the Funds and their shareholders. The Board also considered analysis provided by Morningstar regarding the degree of active management in the Dodge & Cox equity funds and concluded that Dodge & Cox is an active, high conviction manager of equity portfolios, not a “closet index” manager.
In the area of administrative and shareholder services, the Board considered the quality of Dodge & Cox’s work in areas such as compliance, legal services, trading, operations, proxy voting, technology, oversight of the Funds’ transfer agent and custodian/
DODGE & COX BALANCED FUND §PAGE 19
fund accounting agent, tax compliance, risk management, shareholder support, and shareholder communication through its website and other means. The Board also noted Dodge & Cox’s disclosure policy, its compliance record, and its reputation as a trusted, shareholder-friendly mutual fund family.
In addition, the Board considered that Dodge & Cox manages approximately $200 billion in Fund assets with fewer professionals than most comparable funds, and that on average these professionals have more experience and longer tenure than investment professionals at comparable funds. The Board also noted that Dodge & Cox is an investment research-oriented firm with no other business endeavors to distract management’s attention from its research efforts or to present material conflicts of interest with the operations of the Funds, that its investment professionals adhere to a consistent investment approach across the Funds, and that due to its careful and deliberate strategy with respect to new products, Dodge & Cox has had remarkable stability in its mutual fund product offerings over the course of the past 87 years and has the fewest funds of any of the 25 largest mutual fund families by assets. The Board further considered the “Gold” analyst rating awarded by Morningstar to all of the Funds (other than the Global Bond Fund). The Board concluded that it was satisfied with the nature, extent, and quality of investment management and other services provided to the Funds by Dodge & Cox.
INVESTMENT PERFORMANCE
The Board considered short-term and long-term investment performance for each Fund (including periods of outperformance or underperformance) as compared to both relevant indices and the performance of such Fund’s peer group. In assessing the performance of the Funds, the Board considered the Funds’ investment returns over various periods and the volatility thereof and concluded that the levels experienced were consistent with Dodge & Cox’s long-term approach and active investment style. The Board determined after extensive review and inquiry that Dodge & Cox’s historic, long-term, team-oriented, bottom-up investment approach remains consistent and that Dodge & Cox continues to be distinguished by its integrity, transparency, and independence. The Board considered that the performance of the Funds is the result of a value-oriented investment management process that emphasizes a long-term investment horizon, comprehensive independent research, a team approach, price discipline, low cost, and low portfolio turnover. The Board also considered that the investment performance delivered by Dodge & Cox to the Funds appeared to be consistent with the relevant performance delivered for other clients of Dodge & Cox. The Board concluded that Dodge & Cox has delivered favorable long-term performance for Fund investors consistent with the long-term investment strategies being pursued by the Funds.
COSTS AND ANCILLARY BENEFITS
Costs of Services to Funds: Fees and Expenses. The Board considered each Fund’s management fee rate and expense ratio relative to each Fund’s peer group and relative to management fees charged by Dodge & Cox to other clients. In particular, the Board
considered that the Funds continue to be below their peer group median in expense ratios and that many media and industry reports specifically comment on the low cost of the Funds, which have been a defining characteristic of the Funds for many years. The Board also evaluated the operating structures of the Funds and Dodge & Cox, noting that the Funds do not charge front-end sales commissions or distribution fees, and Dodge & Cox bears, among other things, the significant cost of third party research, reimbursement for shareholder recordkeeping and administrative costs to third-party retirement plan administrators, and administrative and office overhead. The Board noted that expenses are well below industry averages.
When compared to peer group funds, the Funds are in the quartile with the lowest expense ratios. The Board also considered that the Funds receive numerous administrative, regulatory compliance, legal, operational, technology, tax compliance, risk management, and shareholder support services from Dodge & Cox without any additional administrative fee and that the Funds have relatively low transaction costs and portfolio turnover rates. The Board noted the Funds’ unusual single-share-class structure and reviewed Morningstar data (including asset-weighted average expense ratios) showing that the few peer group funds with lower expense ratios often have other share classes with significantly higher expense ratios than the Funds’. In this regard, the Board considered that many of the Funds’ shareholders would not be eligible to purchase comparably priced shares of many peer group funds, which typically make their lower-priced share classes available only to institutional investors. The Board determined that the Funds provide access for small investors to high quality investment management at a relatively low cost. The Board also considered that the Funds are priced to scale, i.e., management fee rates begin at relatively low levels with the result that, even without breakpoints, the Funds’ management fee rates are lower than those of many peer funds whose fee schedules include breakpoints. With respect to non-U.S. funds sponsored and managed by Dodge & Cox that are comparable to the Funds in many respects, the Board noted that the fee rates charged by Dodge & Cox are the same as or higher than the fee rates charged to the Funds.
The Board reviewed information regarding the fee rates Dodge & Cox charges to separate accounts that have investment programs similar to those of the Funds, including instances where separate account fees are lower than Fund fees. The Board considered the significant differences in the nature and scope of services Dodge & Cox provides to the Funds as compared to other client accounts, as well as material differences in regulatory, litigation, and other risks as between Dodge & Cox Funds and other types of clients. The Board noted that different markets exist for mutual fund and institutional separate account management services and that a comparison of Fund fee rates and separate account fee rates must consider the fact that separate account clients bear additional costs and responsibilities that are included in the cost of a Fund. The Board further noted that many sophisticated institutional investors in the Funds that are eligible to open separate accounts at Dodge & Cox have decided for various reasons to invest in the Funds. After consideration of these
PAGE 20 § DODGE & COX BALANCED FUND
matters, the Board concluded that the overall costs incurred by the Funds for the services they receive (including the management fee paid to Dodge & Cox) are reasonable and that the fees are acceptable based upon the qualifications, experience, reputation, and performance of Dodge & Cox and the low overall expense ratios of the Funds.
Profitability and Costs of Services to Dodge & Cox; “Fall-out” Benefits. The Board reviewed reports of Dodge & Cox’s financial position, profitability, and estimated overall value and considered Dodge & Cox’s overall profitability within its context as a private, employee-owned S-Corporation and relative to the favorable services provided. The Board noted in particular that Dodge & Cox’s profits are not generated by high fee rates, but reflect an extraordinarily streamlined, efficient, and focused business approach toward investment management.
The Board recognized the importance of Dodge & Cox’s profitability—which is derived solely from management fees and does not include other business ventures—to maintain its independence, stability, company culture and ethics, and management continuity. The Board also considered that the compensation/profit structure at Dodge & Cox includes a return on shareholder employees’ investment in the firm, which is vital for remaining independent and facilitating retention of management and investment professionals. The Board also considered that in January 2015, Dodge & Cox closed the International Stock Fund to new investors to proactively manage the growth of the Fund. The Stock Fund and Balanced Fund were similarly closed to new investors during periods of significant growth in the past. While these actions are intended to benefit existing Fund shareholders, the effect is to reduce potential revenues to Dodge & Cox from new shareholders.
The Board also considered potential “fall-out” benefits (including the receipt of research from unaffiliated brokers and reputational benefits to non-U.S. funds sponsored and managed by Dodge & Cox) that Dodge & Cox might receive as a result of its association with the Funds and determined that they are acceptable. The Board also noted that Dodge & Cox continues to invest substantial sums in its business in order to provide enhanced services, systems, and research capabilities, all of which benefit the Funds. The Board concluded that Dodge & Cox’s profitability is the keystone of its independence, stability, and long-term investment performance and that the profitability of Dodge & Cox’s relationship with the Funds (including fall-out benefits) is fair and reasonable.
ECONOMIES OF SCALE
The Board considered whether there have been economies of scale with respect to the management of each Fund, whether the Funds have appropriately benefited from any economies of scale, and whether the management fee rate is reasonable in relation to the level of Fund assets and any economies of scale that may exist. In the Board’s view, any consideration of economies of scale must take account of the Funds’ low fee and expense structure and of the fact that each Fund’s shareholders have benefited from the Fund’s relatively low fee structure from the time of each Fund’s inception (i.e., from the first dollar). An assessment of economies
of scale must also take into account that Dodge & Cox invests significant time and resources in each new Fund for months (and sometimes years) prior to launch; in addition, in a Fund’s early periods of operations, expenses are capped, which means that Dodge & Cox subsidizes the operations of a new Fund for a period of time until it reaches scale. The Board also observed that, while total Fund assets have grown significantly over the long term, this growth has not been continuous or evenly distributed across all of the Funds (for example, the total assets of the Balanced Fund have actually declined over the past ten years).
In addition, the Board noted that Dodge & Cox has shared the benefits of economies of scale with the Funds by adding and enhancing services to the Funds over time, and that Dodge & Cox’s internal costs of providing investment management, technology, administrative, legal, and compliance services to the Funds continue to increase. For example, Dodge & Cox has increased its global research staff and investment resources over the years to add important new capabilities for the benefit of Fund shareholders and to address the increased complexity of investing in multinational and non-U.S. companies. In addition, Dodge & Cox has made substantial expenditures in other staff, technology, and infrastructure to enable it to integrate credit and equity analyses and to implement its strategy in a more effective and secure manner. Over the last ten years, Dodge & Cox has increased its spending on research, investment management, client servicing, cybersecurity, technology, third party research, data services, and computer systems for trading, operations, compliance, accounting, and communications at a rate that has significantly outpaced the Funds’ growth rate during the same period. The Board considered that Dodge & Cox has a history of voluntarily limiting asset growth in several Funds that experienced significant inflows by closing them to new investors in order to protect the Funds’ ability to achieve good investment returns for shareholders. The Board also observed that, even without fee breakpoints, the Funds are competitively priced in a very competitive market and that having a low fee from inception is better for shareholders than starting with a higher fee and adding breakpoints. The Board also noted that there are certain diseconomies of scale associated with managing large funds, insofar as certain of the costs and risks associated with portfolio management increase as assets grow. The Board concluded that the current Dodge & Cox fee structure is fair and reasonable and adequately shares economies of scale that may exist.
CONCLUSION
Based on their evaluation of all material factors and assisted by the advice of independent legal counsel to the Independent Trustees, the Board, including the Independent Trustees, concluded that the advisory fee structure was fair and reasonable, that each Fund was paying a competitive fee for the services provided, that Dodge & Cox’s services have provided value for Fund shareholders over the long term, and that approval of the Agreements was in the best interests of each Fund and its shareholders.
DODGE & COX BALANCED FUND §PAGE 21
FUND HOLDINGS
The Fund provides a complete list of its holdings four times each fiscal year, as of the end of each quarter. The Fund files the lists with the SEC on Form N-CSR (second and fourth quarters) and Form N-Q (first and third quarters). Shareholders may view the Fund’s Forms N-CSR and N-Q on the SEC’s website at sec.gov. Forms N-CSR and N-Q may also be reviewed and copied at the SEC’s Public Reference Room in Washington, DC. Information regarding the operations of the Public Reference Room may be obtained by calling 800-SEC-0330. A list of the Fund’s quarter-end holdings is also available at dodgeandcox.com on or about 15 days following each quarter end and remains available on the website until the list is updated in the subsequent quarter.
PROXY VOTING
For a free copy of the Fund’s proxy voting policies and procedures, please call 800-621-3979, visit the Fund’s website at dodgeandcox.com, or visit the SEC’s website at sec.gov. Information regarding how the Fund voted proxies relating to portfolio securities during the most recent 12-month period ending June 30 is also available at dodgeandcox.com or at sec.gov.
HOUSEHOLD MAILINGS
The Fund routinely mails shareholder reports and summary prospectuses to shareholders and, on occasion, proxy statements. In order to reduce the volume of mail, when possible, only one copy of these documents will be sent to shareholders who are part of the same family and share the same residential address.
If you have a direct account with the Funds and you do not want the mailing of shareholder reports and summary prospectuses combined with other members in your household, contact the Funds at 800-621-3979. Your request will be implemented within 30 days.
PAGE 22 § DODGE & COX BALANCED FUND
DODGE & COX FUNDS—EXECUTIVE OFFICER & TRUSTEE INFORMATION
| | | | | | |
Name (Age) and
Address* | | Position with Trust (Year of Election or
Appointment) | | Principal Occupation During Past 5 Years | | Other Directorships Held by Trustees |
| INTERESTED TRUSTEES AND EXECUTIVE OFFICERS |
| Charles F. Pohl (59) | | Chairman and Trustee (Since 2014) | | Chairman (since 2013) and Director of Dodge & Cox; Chief Investment Officer, member of U.S. Equity Investment Committee (USEIC), Global Equity Investment Committee (GEIC), International Equity Investment Committee (IEIC), and U.S. Fixed Income Investment Committee (USFIIC), Portfolio Manager, and Investment Analyst; Co-President (2011-2013) | | — |
| Dana M. Emery (56) | | President and Trustee (Trustee since 1993) (President since 2014) | | Chief Executive Officer (since 2013), President, and Director of Dodge & Cox; Director of Fixed Income and member of USFIIC and Global Fixed Income Investment Committee (GFIIC); Co-President (2011-2013) | | — |
| Diana S. Strandberg (58) | | Senior Vice President (Since 2006) | | Senior Vice President and Director of Dodge & Cox; Director of International Equity and member of USEIC, GEIC, IEIC and GFIIC; Portfolio Manager and Investment Analyst | | — |
Roberta R.W. Kameda (57) | | Secretary (Since 2017) | | Vice President, General Counsel, and Secretary (since 2017) of Dodge & Cox | | — |
| David H. Longhurst (60) | | Treasurer (Since 2006) | | Vice President and Assistant Treasurer of Dodge & Cox | | — |
| Katherine M. Primas (43) | | Chief Compliance Officer (Since 2010) | | Vice President and Chief Compliance Officer of Dodge & Cox | | — |
| INDEPENDENT TRUSTEES |
| Caroline M. Hoxby (51) | | Trustee (Since 2017) | | Professor of Economics, Stanford University; Director of the Economics of Education Program, National Bureau of Economic Research; Senior Fellow, Hoover Institution and Stanford Institute for Economic Policy Research | | — |
| Thomas A. Larsen (68) | | Trustee (Since 2002) | | Senior Counsel of Arnold & Porter (law firm) (since 2013); Partner of Arnold & Porter (until 2012); Director of Howard, Rice, Nemerovski, Canady, Falk & Rabkin (1977-2011) | | — |
| Ann Mather (57) | | Trustee (Since 2011) | | CFO, Pixar Animation Studios (1999-2004) | | Director, Alphabet Inc. (internet information services) (since 2005); Director, Glu Mobile, Inc. (multimedia software) (since 2004); Director, Netflix, Inc. (internet television) (since 2010); Director, Arista Networks (cloud networking) (since 2013); Director, Shutterfly, Inc. (internet photography services/publishing) (since 2013) |
| Robert B. Morris III (65) | | Trustee (Since 2011) | | Advisory Director, The Presidio Group (2005-2016); Partner and Managing Director—Global Investment Research at Goldman Sachs (until 2001) | | — |
| Gary Roughead (66) | | Trustee (Since 2013) | | Robert and Marion Oster Distinguished Military Fellow, Hoover Institution (since 2012); Admiral, United States Navy (Ret.); U.S. Navy Chief of Naval Operations (2008-2011) | | Director, Northrop Grumman Corp. (global security) (since 2012); Director, Maersk Line, Limited (shipping and transportation) (since 2016) |
| Mark E. Smith (66) | | Trustee (Since 2014) | | Executive Vice President, Managing Director—Fixed Income at Loomis Sayles & Company, L.P. (2003-2011) | | — |
| John B. Taylor (71) | | Trustee (Since 2005) (and 1995-2001) | | Professor of Economics, Stanford University (since 1984); Senior Fellow, Hoover Institution (since 1996); Under Secretary for International Affairs, United States Treasury (2001-2005) | | — |
| * | | The address for each Officer and Trustee is 555 California Street, 40th Floor, San Francisco, California 94104. Each Officer and Trustee oversees all six series in the Dodge & Cox Funds complex and serves for an indefinite term. |
Additional information about the Trust’s Trustees and Officers is available in the Trust’s Statement of Additional Information (SAI). You can get a free copy of the SAI by visiting the Funds’ website at dodgeandcox.com or calling
800-621-3979.
DODGE & COX BALANCED FUND §PAGE 23
dodgeandcox.com
For Fund literature, transactions, and account information, please visit the Funds’ website.
or write or call:
DODGE & COX FUNDS
c/o DST Asset Manager Solutions, Inc.
P.O. Box 8422
Boston, Massachusetts 02266-8422
(800) 621-3979
INVESTMENT MANAGER
Dodge & Cox
555 California Street, 40th Floor
San Francisco, California 94104
(415) 981-1710
This report is submitted for the general information of the shareholders of the Fund. The report is not authorized for distribution to prospective investors in the Fund unless it is accompanied by a current prospectus.
This report reflects our views, opinions, and portfolio holdings as of December 31, 2017, the end of the reporting period. Any such views are subject to change at any time based upon market or other conditions and Dodge & Cox disclaims any responsibility to update such views. These views may not be relied on as investment advice and, because investment decisions for a Dodge & Cox Fund are based on numerous factors, may not be relied on as an indication of trading intent on behalf of any Dodge & Cox Fund.
DODGE & COX FUNDS®
Annual Report
December 31, 2017
Income Fund
ESTABLISHED 1989
TICKER: DODIX
12/17 IF AR Printed on recycled paper
TO OUR SHAREHOLDERS
The Dodge & Cox Income Fund had a total return of 4.4% for the year ended December 31, 2017, compared to a return of 3.5% for the Bloomberg Barclays U.S. Aggregate Bond Index (Bloomberg Barclays U.S. Agg).
MARKET COMMENTARY
The U.S. investment-grade bond market delivered a 3.5% return in 2017, driven primarily by strong performance from corporate bonds. Short term yields rose 70 basis points(a) (bps) due in part to Federal Reserve (Fed) rate hikes, while longer term rates remained relatively unchanged—resulting in the flattest yield curve since 2007.
Generally favorable U.S. economic data buoyed investor sentiment, although soft pockets remain. Third quarter GDP growth of 3.2% (on an annualized basis) represented the strongest quarter in more than two years and was accompanied by robust figures for retail sales and housing activity, as well as rising consumer confidence. While the unemployment rate fell to a 17-year low of 4.1%, wage growth was subdued and core inflation remained below the Fed’s target of 2%. The Fed raised short-term rates three times (by 25 bps each time) in 2017, signaled expectations for three additional hikes in 2018, and started the process of gradually reducing its $4.5 trillion in bond holdings. Policymakers indicated a continued cautious approach to future policy changes given stubbornly low inflation. Jerome Powell, confirmed to succeed Janet Yellen as Fed Chair, is believed to largely represent continuity in monetary policy, though with a more laissez-faire stance on regulation.
In Washington, the heightened level of political discord weighed on the legislative agenda and raised concerns that proposed pro-growth policies may be delayed or derailed. Nonetheless, a significant overhaul of the U.S. tax system was passed by Congress and signed into law in late December. Many investors welcomed the business-friendly elements of the bill, including a reduction in corporate tax rates, but questions remain regarding the potential impact of a significantly higher national debt burden on growth.
Investment-grade corporate bonds continued their strong run in 2017, returning 6.4%(b) and outperforming comparable-duration(c) Treasuries by 3.5 percentage points. Investors demonstrated a robust appetite for risk assets as credit yield premiums(d) ended 2017 at their narrowest level in ten years. The corporate sector benefited from the stable economic backdrop and solid corporate earnings as well as the prospect of lower corporate tax rates. Meanwhile, Agency(e) mortgage-backed securities (MBS) returned 2.5% and outperformed comparable-duration Treasuries by 0.5 percentage points.
INVESTMENT STRATEGY
We are pleased to report another strong year of both absolute and relative performance for the Fund, led by outperformance from a wide variety of individual credit holdings as well as our overweighting of the credit sector generally. Fuller valuations—U.S. credit spreads contracted by almost 30 bps—compelled us to continue to reduce credit(f) exposure. While we are comfortable
with the Fund’s current holdings, which we believe to be fairly valued relative to individual issuer fundamentals, these actions have reduced the Fund’s yield advantage (28 bps at year end versus 66 bps at the beginning of the year).
We made other smaller adjustments to Fund positioning throughout the year but retain the same general themes in the Fund’s portfolio. We maintain a defensive posture with respect to interest rate risk, with a Fund duration of 4.2 years(g) (compared to 6.0 years for the Bloomberg Barclays U.S. Agg). Despite the aforementioned reductions, the Fund maintains sizeable credit exposure at 41% (10 percentage points more than the index), of which 34% is sourced from corporate bonds and 7% from government-related securities. The Fund maintains 36% in securitized (primarily Agency MBS) holdings, and the Fund’s 23% weighting in U.S. Treasuries and cash represents “dry powder” we can deploy as we uncover interesting opportunities and/or wait for a more interesting valuation environment. We remain vigilant in searching for these opportunities across the investment universe. As an example, we have unearthed a number of attractive investments away from credit over the past year (e.g., Home Equity Conversion Mortgages, Treasury Inflation-Protected Securities). Our experienced and integrated team of fixed income investment professionals has looked for ways to add durable yield in an environment with less attractive opportunities in the credit market.
Credit: Reducing Idiosyncratic Exposures at Fuller Valuations
The most meaningful change to Fund positioning throughout 2017 was a further reduction to the credit weighting, a recurring theme since early 2016 when, from a credit weighting peak of 55%, we began the process of selectively trimming into a strengthening market. Individual issuer trims reduced the Fund’s credit weighting by six percentage points in 2017, following a similar decrease in 2016. The most recent year’s reductions were achieved through a combination of tactical, relative value-driven trims (e.g., Capital One, Dell, Kinder Morgan)(h) and by taking advantage of liability management exercises (tender offers, make-whole calls) undertaken by corporate issuers (e.g., Cemex, Cigna, Time Warner, Vulcan Materials, Xerox). These companies offered attractive terms (higher-than-market prices) to buy back their debt primarily to retire high-coupon debt, extend maturities, and/or take advantage of related tax deductions prior to the expected implementation of tax reform. Attractively priced tenders like these provided the opportunity to selectively reduce exposure without incurring transaction costs.
Notwithstanding the broad-based reduction to many of the Fund’s credit holdings, we still found new opportunities in credit over the course of 2017. For example, we added to an existing position in TransCanada Corp., a Canadian midstream energy company, through the purchase of a newly issued hybrid security at an attractive spread. We also bought a small position in short-dated, tax-exempt State of Illinois securities at new issue after an unsuccessful syndication process widened spreads to an attractive level.
PAGE 2 § DODGE & COX INCOME FUND
At current valuations, the credit sector as a whole offers a less compelling value proposition relative to previous periods over the last decade but still represents reasonable value relative to alternatives. Corporate fundamentals are strong, with no obvious catalyst for broad-based deterioration. Profitability is robust, and liquidity is available for all but the most challenged issuers. Additionally, the operating environment is healthy, with strong and synchronized global growth, business-friendly policies likely to come out of Washington, and robust demand for credit. Furthermore, as active managers we seek to generate an above-market yield through our security selection efforts and have a Fund portfolio that is differentiated from the broad credit market. Demonstrating this fact, the Fund’s credit holdings offer a yield premium of 163 bps, almost twice that of the broad investment-grade Credit Index (89 bps).
Stable MBS Weighting, but Alert to New Opportunities
The Fund’s MBS performed well in 2017, benefiting from a benign interest rate environment and muted refinancing activity among the Fund’s holdings. We kept the Fund’s weighting stable throughout 2017 at roughly a third of the portfolio, but shifted the underlying mix of holdings as valuations changed during the year. For example, we reduced 15- and 20-year MBS due to high valuations, limited upside potential in a slow-to-moderate prepayment environment, and better opportunities elsewhere. We deployed most of the proceeds into newly issued 30-year premium MBS, which we viewed as more attractive. We also introduced a new type of security to the Fund in 2017, establishing a small position in Ginnie Mae-guaranteed Home Equity Conversion Mortgages. Our structured products team is continuously canvassing the market for interesting opportunities. These new positions, while small, offer interesting relative value versus high-quality alternatives as well as diversification benefits.
The MBS market garnered a fair amount of attention in 2017 as the Fed began its “balance sheet normalization”(i) process late in the year. We foresaw no material impact to MBS valuations despite investor concerns earlier in the year, thanks to the transparency of the unwind program and the modest nature of the initial reduction. Importantly, since we have only modest overlap with the MBS featured on the Fed’s balance sheet, any potential normalization-related disruption would likely be minimal. We will continue to evaluate opportunities and risks in the MBS market as the Fed’s policy normalization evolves.
Mitigating Interest Rate Risk in the Fund
We made no major changes to the Fund’s shorter-than-benchmark duration posture in 2017. In our analysis, longer-term interest rates are not reflecting the likely strengthening of global growth and inflation over the next several years. The successful passage of tax reform in December will likely continue to provide additional fiscal stimulus to an economy already operating above its long-term potential. Driven by the increasingly tight labor market, we expect core inflation measures to increase from the recent dip to approach
2% in the near future. Finally, a notable gap remains between market expectations for a very slow pace of future federal funds rate increases (implied by the forward curve) and the Fed’s stated expectations (which align more with our view). For these reasons, we continue to believe that a shorter relative duration is prudent.
IN CLOSING
While we are pleased with the Fund’s relative results, we caution shareholders to temper their expectations for future returns given the low starting level of interest rates, which increases the risk of low (or even negative) returns if yields rise substantially from current levels. In addition, the credit markets are unlikely to provide the important performance tailwind of the past two years, given current narrow spread levels.
That said, we believe bonds serve a vital defensive role in a diversified portfolio, providing liquidity, income generation, downside protection, and low correlation to riskier asset classes. We have positioned the Fund defensively from a duration standpoint and will continue to seek opportunities to build portfolio yield through our bottom-up, research-driven investment approach.
Thank you for your continued confidence in our firm. As always, we welcome your comments and questions.
For the Board of Trustees,
| | |
| | |
Charles F. Pohl, Chairman | | Dana M. Emery, President |
January 30, 2018
| (a) | One basis point is equal to 1/100th of 1%. |
| (b) | Sector returns as calculated and reported by Bloomberg. |
| (c) | Duration is a measure of a bond’s (or a bond portfolio’s) price sensitivity to changes in interest rates. |
| (d) | Yield premiums are one way to measure a security’s valuation. Narrowing yield premiums results in a higher valuation. Widening yield premiums results in a lower valuation. |
| (e) | The U.S. Government does not guarantee the Fund’s shares, yield, or net asset value. The agency guarantee (by, for example, Ginnie Mae, Fannie Mae, or Freddie Mac) does not eliminate market risk. |
| (f) | Credit securities refers to corporate bonds and government-related securities, as classified by Bloomberg. |
| (g) | Unless otherwise specified, all weightings and characteristics are as of December 31, 2017. |
| (h) | The use of specific examples does not imply that they are more or less attractive investments than the Fund’s other holdings. |
| (i) | Balance sheet normalization refers to the Fed’s plan to shrink its balance sheet, which grew from $800 billion in 2007 to $4.5 trillion by 2015. During that time, the Fed purchased Treasuries and Agency MBS as an unconventional monetary policy tool to keep interest rates low in support of economic growth. Now that monetary policy is on a gradually tightening path, the Fed is reducing the size of its balance sheet by reducing these holdings. The normalization process consists largely of “runoff” (i.e., not reinvesting maturing bonds or MBS paydowns) at an accelerating monthly rate. |
DODGE & COX INCOME FUND §PAGE 3
ANNUAL PERFORMANCE REVIEW
The Fund outperformed the Bloomberg Barclays U.S. Agg by 0.8 percentage points in 2017.
Key Contributors to Relative Results
| | § | | Security selection within credit was strongly positive as several corporate holdings performed well, including Bank of America capital securities, Citigroup capital securities, and Telecom Italia. Certain emerging market-domiciled holdings also outperformed, including Pemex and Rio Oil Finance Trust. | |
| | § | | The Fund’s overweight to corporate bonds and underweight to U.S. Treasuries added to relative returns given the strong performance of credit. | |
| | § | | The Fund’s nominal yield advantage benefited returns. | |
Key Detractors from Relative Results
| | § | | The Fund’s lower exposure to long-term (10+ years) bonds detracted from relative returns as the yield curve flattened. | |
| | § | | Certain corporate holdings underperformed, including Macy’s and Verizon. | |
KEY CHARACTERISTICS OF DODGE & COX
Independent Organization
Dodge & Cox is one of the largest privately owned investment managers in the world. We remain committed to independence, with a goal of providing the highest quality investment management service to our existing clients.
Over 85 Years of Investment Experience
Dodge & Cox was founded in 1930. We have a stable and well-qualified team of investment professionals, most of whom have spent their entire careers at Dodge & Cox.
Experienced Investment Team
The U.S. Fixed Income Investment Committee, which is the decision-making body for the Income Fund, is an eight-member committee with an average tenure at Dodge & Cox of 22 years.
One Business with a Single Research Office
Dodge & Cox manages equity (domestic, international, and global), fixed income (domestic and global), and balanced investments, operating from one office in San Francisco.
Consistent Investment Approach
Our team decision-making process involves thorough, bottom-up fundamental analysis of each investment.
Long-Term Focus and Low Expenses
We invest with a three- to five-year investment horizon, which has historically resulted in low turnover relative to our peers. We manage Funds that maintain low expense ratios.
Risks: The Fund invests in individual bonds whose yields and market values fluctuate, so that an investment may be worth more or less than its original cost. Debt securities are subject to interest rate risk, credit risk, and prepayment and call risk, all of which could have adverse effects on the value of the Fund. A low interest rate environment creates an elevated risk of future negative returns. Financial intermediaries may restrict their market making activities for certain debt securities, which may reduce the liquidity and increase the volatility of such securities. Please read the prospectus and summary prospectus for specific details regarding the Fund’s risk profile.
PAGE 4 § DODGE & COX INCOME FUND
GROWTH OF $10,000 OVER 10 YEARS
FOR AN INVESTMENT MADE ON DECEMBER 31, 2007
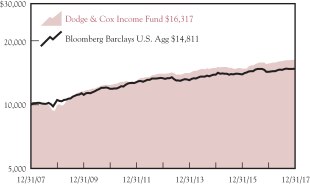
AVERAGE ANNUAL TOTAL RETURN
FOR PERIODS ENDED DECEMBER 31, 2017
| | | | | | | | | | | | | | | | |
| | | 1 Year | | | 5 Years | | | 10 Years | | | 20 Years | |
Dodge & Cox Income Fund | | | 4.36 | % | | | 3.07 | % | | | 5.01 | % | | | 5.50 | % |
Bloomberg Barclays U.S. Aggregate Bond Index (Bloomberg Barclays U.S. Agg) | | | 3.54 | | | | 2.10 | | | | 4.01 | | | | 4.98 | |
Returns represent past performance and do not guarantee future results. Investment return and share price will fluctuate with market conditions, and investors may have a gain or loss when shares are sold. Fund performance changes over time and currently may be significantly lower than stated. Performance is updated and published monthly. Visit the Fund’s website at dodgeandcox.com or call 800-621-3979 for current performance figures.
The Fund’s total returns include the reinvestment of dividend and capital gain distributions, but have not been adjusted for any income taxes payable by shareholders on these distributions or on Fund share redemptions. Index returns include interest income but, unlike Fund returns, do not reflect fees or expenses. The Bloomberg Barclays U.S. Aggregate Bond Index (Bloomberg Barclays U.S. Agg) is a widely recognized, unmanaged index of U.S. dollar-denominated, investment-grade, taxable debt securities.
Bloomberg is a registered trademark of Bloomberg Finance L.P. and its affiliates. Barclays® is a trademark of Barclays Bank PLC.
FUND EXPENSE EXAMPLE
As a Fund shareholder, you incur ongoing Fund costs, including management fees and other Fund expenses. All mutual funds have ongoing costs, sometimes referred to as operating expenses. The following example shows ongoing costs of investing in the Fund and can help you understand these costs and compare them with those of other mutual funds. The example assumes a $1,000 investment held for the six months indicated.
ACTUAL EXPENSES
The first line of the table below provides information about actual account values and expenses based on the Fund’s actual returns. You may use the information in this line, together with your account balance, to estimate the expenses that you paid over the period. Simply divide your account value by $1,000 (for example, an $8,600 account value divided by $1,000 = 8.6), then multiply the result by the number in the first line under the heading “Expenses Paid During Period” to estimate the expenses you paid on your account during this period.
HYPOTHETICAL EXAMPLE FOR COMPARISON WITH OTHER MUTUAL FUNDS
Information on the second line of the table can help you compare ongoing costs of investing in the Fund with those of other mutual funds. This information may not be used to estimate the actual ending account balance or expenses you paid during the period. The hypothetical “Ending Account Value” is based on the actual expense ratio of the Fund and an assumed 5% annual rate of return before expenses (not the Fund’s actual return). The amount under the heading “Expenses Paid During Period” shows the hypothetical expenses your account would have incurred under this scenario. You can compare this figure with the 5% hypothetical examples that appear in shareholder reports of other mutual funds.
| | | | | | | | | | | | |
Six Months Ended December 31, 2017 | | Beginning Account Value
7/1/2017 | | | Ending Account Value
12/31/2017 | | | Expenses Paid
During Period* | |
Based on Actual Fund Return | | $ | 1,000.00 | | | $ | 1,016.10 | | | $ | 2.15 | |
Based on Hypothetical 5% Yearly Return | | | 1,000.00 | | | | 1,023.07 | | | | 2.16 | |
| * | | Expenses are equal to the Fund’s annualized expense ratio of 0.42%, multiplied by the average account value over the period, multiplied by 184/365 (to reflect the one-half year period). |
The expenses shown in the table highlight ongoing costs only and do not reflect any transactional fees or account maintenance fees. Though other mutual funds may charge such fees, please note that the Fund does not charge transaction fees (e.g., redemption fees, sales loads) or universal account maintenance fees (e.g., small account fees).
DODGE & COX INCOME FUND §PAGE 5
| | | | |
| FUND INFORMATION (unaudited) | | | December 31, 2017 | |
| | | | |
| GENERAL INFORMATION | | | |
Net Asset Value Per Share | | | $13.76 | |
Total Net Assets (billions) | | | $54.3 | |
Expense Ratio | | | 0.43% | |
Portfolio Turnover Rate | | | 19% | |
30-Day SEC Yield(a) | | | 2.64% | |
Number of Credit Issuers | | | 51 | |
Fund Inception | | | 1989 | |
No sales charges or distribution fees | | | | |
Investment Manager: Dodge & Cox, San Francisco. Managed by the U.S. Fixed Income Investment Committee, whose eight members’ average tenure at Dodge & Cox is 22 years.
| | | | | | | | |
| PORTFOLIO CHARACTERISTICS | | Fund | | | BBG Barclays
U.S. Agg | |
Effective Duration (years)(b) | | | 4.2 | | | | 6.0 | |
| | | | |
| FIVE LARGEST CREDIT ISSUERS (%)(c) | | Fund | |
Charter Communications, Inc. | | | 2.2 | |
State of California GO | | | 2.0 | |
Bank of America Corp. | | | 1.9 | |
Petroleos Mexicanos | | | 1.7 | |
State of Illinois GO | | | 1.7 | |
| | | | | | | | |
| CREDIT QUALITY (%)(d) | | Fund | | | BBG Barclays
U.S. Agg | |
U.S. Treasury/Agency/GSE(e) | | | 52.7 | | | | 67.5 | |
Aaa | | | 1.7 | | | | 4.3 | |
Aa | | | 3.7 | | | | 3.2 | |
A | | | 3.9 | | | | 11.5 | |
Baa | | | 28.0 | | | | 13.5 | |
Ba | | | 5.5 | | | | 0.0 | |
B | | | 0.0 | | | | 0.0 | |
Caa | | | 1.4 | | | | 0.0 | |
Net Cash & Other(g) | | | 3.1 | | | | 0.0 | |
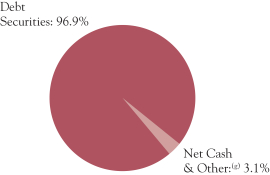
| | | | | | | | |
| SECTOR DIVERSIFICATION (%) | | Fund | | | BBG Barclays
U.S. Agg | |
U.S. Treasury(e) | | | 19.5 | | | | 37.0 | |
Government-Related(f) | | | 6.9 | | | | 6.8 | |
Securitized | | | 36.1 | | | | 30.5 | |
Corporate | | | 34.4 | | | | 25.7 | |
Net Cash & Other(g) | | | 3.1 | | | | 0.0 | |
| | | | | | | | |
| MATURITY DIVERSIFICATION (%)(e) | | Fund | | | BBG Barclays
U.S. Agg | |
0-1 Years to Maturity | | | 9.6 | | | | 0.0 | |
1-5 | | | 45.0 | | | | 39.5 | |
5-10 | | | 28.2 | | | | 44.3 | |
10-15 | | | 2.4 | | | | 1.4 | |
15-20 | | | 4.7 | | | | 2.2 | |
20-25 | | | 4.4 | | | | 4.1 | |
25 and Over | | | 5.7 | | | | 8.5 | |
| (a) | SEC Yield is an annualization of the Fund’s net investment income for the trailing 30-day period. Dividends paid by the Fund may be higher or lower than implied by the SEC Yield. |
| (b) | Interest rate derivatives reduce total Fund duration by 0.2 years (i.e., total portfolio duration is 4.4 years without derivatives). |
| (c) | The Fund’s portfolio holdings are subject to change without notice. The mention of specific securities is not a recommendation to buy, sell, or hold any particular security and is not indicative of Dodge & Cox’s current or future trading activity. |
| (d) | The credit quality distributions shown for the Fund and the Index are based on the middle of Moody’s, S&P, and Fitch ratings, which is the methodology used by Bloomberg in constructing its indices. If a security is rated by only two agencies, the lower of the two ratings is used. Please note the Fund applies the highest of Moody’s, S&P, and Fitch ratings to determine compliance with the quality requirements stated in its prospectus. On that basis, the Fund held 3.4% in securities rated below investment grade. The credit quality of the investments in the portfolio does not apply to the stability or safety of the Fund or its shares. |
| (e) | Data as presented excludes the Fund’s position in Treasury futures contracts. |
| (f) | The portfolio’s Government-Related holdings include tax-exempt municipal securities; the BBG Barclays U.S. Agg classifies these securities as Municipal Bonds. |
| (g) | Net Cash & Other includes cash, short-term investments, derivatives, receivables, and payables. |
PAGE 6 § DODGE & COX INCOME FUND
| | | | |
| PORTFOLIO OF INVESTMENTS | | | December 31, 2017 | |
| | | | | | | | |
| DEBT SECURITIES: 96.9% | | | | |
| | |
| | | PAR VALUE | | | VALUE | |
| U.S. TREASURY: 19.5% | | | | | | | | |
U.S. Treasury Inflation Indexed | | | | | | | | |
0.125%, 4/15/20(g) | | $ | 564,584,787 | | | $ | 563,539,238 | |
0.125%, 4/15/21(g) | | | 390,493,152 | | | | 388,991,725 | |
U.S. Treasury Note/Bond | | | | | | | | |
0.875%, 1/15/18 | | | 600,000,000 | | | | 599,925,858 | |
0.75%, 2/28/18 | | | 500,000,000 | | | | 499,521,795 | |
0.625%, 6/30/18 | | | 140,000,000 | | | | 139,420,292 | |
0.75%, 7/31/18 | | | 500,000,000 | | | | 497,537,270 | |
0.75%, 8/31/18 | | | 350,000,000 | | | | 347,864,408 | |
1.50%, 8/31/18 | | | 250,000,000 | | | | 249,684,182 | |
0.875%, 10/15/18 | | | 300,000,000 | | | | 298,049,847 | |
1.25%, 12/31/18 | | | 165,000,000 | | | | 164,079,048 | |
1.125%, 2/28/19 | | | 600,000,000 | | | | 595,050,534 | |
1.50%, 2/28/19 | | | 496,995,000 | | | | 494,991,862 | |
1.25%, 4/30/19 | | | 300,000,000 | | | | 297,598,347 | |
1.625%, 7/31/19 | | | 600,000,000 | | | | 597,747,024 | |
0.875%, 9/15/19 | | | 600,000,000 | | | | 589,888,272 | |
1.375%, 12/15/19 | | | 165,000,000 | | | | 163,355,278 | |
1.625%, 12/31/19 | | | 500,000,000 | | | | 497,318,365 | |
1.375%, 1/15/20 | | | 250,000,000 | | | | 247,389,938 | |
1.50%, 5/31/20 | | | 175,000,000 | | | | 173,257,231 | |
1.625%, 6/30/20 | | | 200,000,000 | | | | 198,501,252 | |
1.375%, 9/15/20 | | | 600,000,000 | | | | 591,387,162 | |
1.75%, 11/15/20 | | | 350,000,000 | | | | 347,960,707 | |
1.375%, 5/31/21 | | | 450,000,000 | | | | 439,843,761 | |
1.125%, 7/31/21 | | | 250,000,000 | | | | 241,741,148 | |
2.00%, 12/31/21 | | | 165,000,000 | | | | 164,152,187 | |
1.875%, 7/31/22 | | | 200,000,000 | | | | 197,267,934 | |
2.00%, 10/31/22 | | | 500,000,000 | | | | 495,580,260 | |
2.00%, 11/30/22 | | | 500,000,000 | | | | 495,378,730 | |
| | | | | | | | |
| | | | | | | 10,577,023,655 | |
| GOVERNMENT-RELATED: 6.9% | | | | | |
FEDERAL AGENCY: 0.1% | | | | | | | | |
Small Business Admin. — 504 Program | | | | | | | | |
Series 1998-20B 1, 6.15%, 2/1/18 | | | 1,560 | | | | 1,565 | |
Series 1998-20C 1, 6.35%, 3/1/18 | | | 57,764 | | | | 58,114 | |
Series 1998-20H 1, 6.15%, 8/1/18 | | | 60,155 | | | | 60,630 | |
Series 1998-20L 1, 5.80%, 12/1/18 | | | 35,161 | | | | 35,403 | |
Series 1999-20C 1, 6.30%, 3/1/19 | | | 36,808 | | | | 37,237 | |
Series 1999-20E 1, 6.30%, 5/1/19 | | | 1,085 | | | | 1,098 | |
Series 1999-20G 1, 7.00%, 7/1/19 | | | 78,513 | | | | 80,094 | |
Series 1999-20I 1, 7.30%, 9/1/19 | | | 44,487 | | | | 45,560 | |
Series 2000-20C 1, 7.625%, 3/1/20 | | | 2,646 | | | | 2,730 | |
Series 2000-20G 1, 7.39%, 7/1/20 | | | 1,972 | | | | 2,031 | |
Series 2001-20G 1, 6.625%, 7/1/21 | | | 503,177 | | | | 523,833 | |
Series 2001-20L 1, 5.78%, 12/1/21 | | | 1,284,900 | | | | 1,333,023 | |
Series 2002-20A 1, 6.14%, 1/1/22 | | | 9,908 | | | | 10,370 | |
Series 2002-20L 1, 5.10%, 12/1/22 | | | 367,428 | | | | 382,061 | |
Series 2003-20G 1, 4.35%, 7/1/23 | | | 28,178 | | | | 29,010 | |
Series 2004-20L 1, 4.87%, 12/1/24 | | | 670,944 | | | | 698,896 | |
Series 2005-20B 1, 4.625%, 2/1/25 | | | 1,332,451 | | | | 1,381,272 | |
Series 2005-20D 1, 5.11%, 4/1/25 | | | 50,527 | | | | 53,012 | |
Series 2005-20E 1, 4.84%, 5/1/25 | | | 1,976,546 | | | | 2,057,044 | |
Series 2005-20G 1, 4.75%, 7/1/25 | | | 2,229,299 | | | | 2,315,465 | |
Series 2005-20H 1, 5.11%, 8/1/25 | | | 25,515 | | | | 26,772 | |
Series 2005-20I 1, 4.76%, 9/1/25 | | | 2,673,475 | | | | 2,780,093 | |
Series 2006-20A 1, 5.21%, 1/1/26 | | | 2,496,590 | | | | 2,636,898 | |
Series 2006-20B 1, 5.35%, 2/1/26 | | | 727,486 | | | | 769,617 | |
Series 2006-20C 1, 5.57%, 3/1/26 | | | 3,474,231 | | | | 3,682,769 | |
Series 2006-20G 1, 6.07%, 7/1/26 | | | 5,936,574 | | | | 6,353,910 | |
Series 2006-20H 1, 5.70%, 8/1/26 | | | 49,158 | | | | 52,167 | |
Series 2006-20I 1, 5.54%, 9/1/26 | | | 102,206 | | | | 108,298 | |
Series 2006-20J 1, 5.37%, 10/1/26 | | | 2,158,423 | | | | 2,286,776 | |
Series 2006-20L 1, 5.12%, 12/1/26 | | | 2,025,709 | | | | 2,137,172 | |
Series 2007-20A 1, 5.32%, 1/1/27 | | | 4,607,722 | | | | 4,889,955 | |
Series 2007-20C 1, 5.23%, 3/1/27 | | | 7,341,943 | | | | 7,744,535 | |
Series 2007-20D 1, 5.32%, 4/1/27 | | | 6,885,126 | | | | 7,296,545 | |
| | | | | | | | |
| | |
| | | PAR VALUE | | | VALUE | |
Series 2007-20G 1, 5.82%, 7/1/27 | | $ | 4,916,078 | | | $ | 5,271,950 | |
| | | | | | | | |
| | | | | | | 55,145,905 | |
FOREIGN AGENCY: 2.1% | | | | | | | | |
Petroleo Brasileiro SA (Brazil) | | | | | | | | |
5.375%, 1/27/21 | | | 118,335,000 | | | | 123,068,400 | |
4.375%, 5/20/23 | | | 38,625,000 | | | | 38,198,966 | |
6.25%, 3/17/24 | | | 31,505,000 | | | | 33,458,310 | |
Petroleos Mexicanos (Mexico) | | | | | | | | |
4.875%, 1/18/24 | | | 123,065,000 | | | | 127,489,187 | |
6.875%, 8/4/26 | | | 120,490,000 | | | | 136,605,537 | |
6.50%, 3/13/27(b) | | | 124,765,000 | | | | 136,368,145 | |
6.625%, 6/15/35 | | | 112,290,000 | | | | 119,963,899 | |
5.50%, 6/27/44 | | | 16,603,000 | | | | 15,274,096 | |
6.375%, 1/23/45 | | | 166,156,000 | | | | 167,044,935 | |
5.625%, 1/23/46 | | | 190,720,000 | | | | 176,511,360 | |
6.75%, 9/21/47 | | | 65,661,000 | | | | 68,540,235 | |
| | | | | | | | |
| | | | | | | 1,142,523,070 | |
LOCAL AUTHORITY: 4.6% | | | | | | | | |
L.A. Unified School District GO | | | | | | | | |
5.75%, 7/1/34 | | | 6,075,000 | | | | 7,746,779 | |
6.758%, 7/1/34 | | | 185,585,000 | | | | 256,315,155 | |
New Jersey Turnpike Authority RB | | | | | | | | |
7.414%, 1/1/40 | | | 41,065,000 | | | | 63,384,649 | |
7.102%, 1/1/41 | | | 148,277,000 | | | | 221,515,459 | |
New Valley Generation
4.929%, 1/15/21 | | | 247,539 | | | | 262,549 | |
State of California GO | | | | | | | | |
7.50%, 4/1/34 | | | 194,406,000 | | | | 287,880,293 | |
7.55%, 4/1/39 | | | 169,895,000 | | | | 267,348,471 | |
7.30%, 10/1/39 | | | 196,920,000 | | | | 293,777,071 | |
7.625%, 3/1/40 | | | 119,575,000 | | | | 187,069,109 | |
7.60%, 11/1/40 | | | 16,760,000 | | | | 26,764,547 | |
State of Illinois GO | | | | | | | | |
5.665%, 3/1/18 | | | 204,685,000 | | | | 205,798,486 | |
5.877%, 3/1/19 | | | 120,575,000 | | | | 124,332,117 | |
5.00%, 11/1/20 | | | 145,585,000 | | | | 153,295,181 | |
5.00%, 11/1/21 | | | 117,990,000 | | | | 125,273,523 | |
5.10%, 6/1/33 | | | 306,400,000 | | | | 305,891,376 | |
| | | | | | | | |
| | | | | | | 2,526,654,765 | |
SOVEREIGN: 0.1% | | | | | | | | |
Spain Government International (Spain) 4.00%, 3/6/18(b) | | | 55,790,000 | | | | 55,884,843 | |
| | | | | | | | |
| | | | | | | 3,780,208,583 | |
| SECURITIZED: 36.1% | | | | | | | | |
ASSET-BACKED: 3.0% | | | | | | | | |
Auto Loan: 0.5% | | | | | | | | |
Ford Credit Auto Owner Trust | | | | | | | | |
Series 2015-REV1 A, 2.12%, 7/15/26(b) | | | 207,826,000 | | | | 207,365,831 | |
Series 2017-REV1 A, 2.62%, 8/15/28(b) | | | 16,176,000 | | | | 16,183,729 | |
Series 2017-REV2 A, 2.36%, 3/15/29(b) | | | 32,121,000 | | | | 31,824,986 | |
| | | | | | | | |
| | | | | | | 255,374,546 | |
Credit Card: 0.9% | | | | | | | | |
American Express Master Trust | | | | | | | | |
Series 2017-3 A, 1.77%, 4/15/20 | | | 185,705,000 | | | | 184,077,593 | |
Series 2017-4 A, 1.64%, 12/15/21 | | | 246,302,000 | | | | 245,026,722 | |
Series 2017-6 A, 2.04%, 5/15/23 | | | 59,190,000 | | | | 58,898,525 | |
Chase Issuance Trust Series 2012-A4 A4, 1.58%, 8/16/21 | | | 14,693,000 | | | | 14,571,574 | |
| | | | | | | | |
| | | | | | | 502,574,414 | |
Other: 1.3% | | | | | | | | |
Rio Oil Finance Trust (Brazil) | | | | | | | | |
9.25%, 7/6/24(b) | | | 435,401,054 | | | | 470,233,138 | |
9.75%, 1/6/27(b) | | | 238,846,701 | | | | 257,954,437 | |
| | | | | | | | |
| | | | | | | 728,187,575 | |
| | |
| See accompanying Notes to Financial Statements | | DODGE & COX INCOME FUND §PAGE 7 |
| | | | |
| PORTFOLIO OF INVESTMENTS | | | December 31, 2017 | |
| | | | | | | | |
| DEBT SECURITIES (continued) | | | | | | |
| | |
| | | PAR VALUE | | | VALUE | |
Student Loan: 0.3% | | | | | | | | |
Navient Student Loan Trust (Private Loans)
Series 2014-AA A2A,
2.74%, 2/15/29(b) | | $ | 27,579,765 | | | $ | 27,648,858 | |
SLM Student Loan Trust
(Private Loans) | | | | | | | | |
Series 2013-A A2A, 1.77%, 5/17/27(b) | | | 41,081,906 | | | | 41,045,733 | |
Series 2012-B A2, 3.48%, 10/15/30(b) | | | 14,569,681 | | | | 14,634,913 | |
Series 2013-C A2A, 2.94%, 10/15/31(b) | | | 27,391,279 | | | | 27,569,191 | |
Series 2012-E A2A, 2.09%, 6/15/45(b) | | | 8,044,066 | | | | 8,045,508 | |
Series 2012-C A2, 3.31%, 10/15/46(b) | | | 33,115,851 | | | | 33,199,459 | |
| | | | | | | | |
| | | | | | | 152,143,662 | |
| | | | | | | | |
| | | | | | | 1,638,280,197 | |
CMBS: 0.2% | | | | | | | | |
Agency CMBS: 0.2% | | | | | | | | |
Fannie Mae Multifamily DUS | | | | | | | | |
Pool AL6028, 2.70%, 7/1/21 | | | 2,275,240 | | | | 2,294,047 | |
Pool AL6455, 2.765%, 11/1/21 | | | 9,386,202 | | | | 9,374,361 | |
Pool AL6445, 2.58%, 1/1/22 | | | 8,535,017 | | | | 8,542,575 | |
Freddie Mac Multifamily Interest Only | | | | | | | | |
Series K055 X1, 1.368%, 3/25/26(e) | | | 119,902,274 | | | | 11,060,205 | |
Series K056 X1, 1.267%, 5/25/26(e) | | | 41,566,430 | | | | 3,580,698 | |
Series K057 X1, 1.193%, 7/25/26(e) | | | 44,369,418 | | | | 3,694,806 | |
Series K064 X1, 0.609%, 3/25/27(e) | | | 107,053,304 | | | | 5,093,093 | |
Series K065 X1, 0.675%, 4/25/27(e) | | | 480,786,950 | | | | 25,492,526 | |
Series K066 X1, 0.753%, 6/25/27(e) | | | 384,288,501 | | | | 22,882,612 | |
Series K067 X1, 0.579%, 7/25/27(e) | | | 481,741,616 | | | | 22,909,704 | |
Series K069 X1, 0.369%, 9/25/27(e) | | | 101,161,635 | | | | 3,246,479 | |
Series K070 X1, 0.327%, 11/25/27(e) | | | 122,250,000 | | | | 3,561,094 | |
| | | | | | | | |
| | | | | | | 121,732,200 | |
MORTGAGE-RELATED: 32.9% | | | | | | | | |
Federal Agency CMO & REMIC: 3.2% | | | | | |
Dept. of Veterans Affairs | | | | | | | | |
Series 1995-2D 4A, 9.293%, 5/15/25 | | | 95,752 | | | | 110,721 | |
Series 1997-2 Z, 7.50%, 6/15/27 | | | 6,804,965 | | | | 7,637,719 | |
Series 1998-2 2A, 8.839%, 8/15/27(e) | | | 22,887 | | | | 25,863 | |
Series 1998-1 1A, 8.183%, 3/15/28(e) | | | 163,170 | | | | 182,262 | |
Fannie Mae | | | | | | | | |
Trust 1998-58 PX, 6.50%, 9/25/28 | | | 271,890 | | | | 299,998 | |
Trust 1998-58 PC, 6.50%, 10/25/28 | | | 1,455,052 | | | | 1,608,957 | |
Trust 2001-69 PQ, 6.00%, 12/25/31 | | | 1,731,253 | | | | 1,901,215 | |
Trust 2002-33 A1, 7.00%, 6/25/32 | | | 1,935,752 | | | | 2,263,322 | |
Trust 2002-69 Z, 5.50%, 10/25/32 | | | 224,951 | | | | 247,690 | |
Trust 2008-24 GD, 6.50%, 3/25/37 | | | 795,831 | | | | 869,425 | |
Trust 2007-47 PE, 5.00%, 5/25/37 | | | 3,243,779 | | | | 3,441,807 | |
Trust 2009-53 QM, 5.50%, 5/25/39 | | | 1,567,492 | | | | 1,648,588 | |
Trust 2009-30 AG, 6.50%, 5/25/39 | | | 7,840,213 | | | | 8,585,158 | |
Trust 2009-40 TB, 6.00%, 6/25/39 | | | 3,566,114 | | | | 3,848,799 | |
Trust 2010-123 WT, 7.00%, 11/25/40 | | | 33,004,841 | | | | 37,828,406 | |
Trust 2001-T3 A1, 7.50%, 11/25/40 | | | 107,337 | | | | 122,891 | |
Trust 2001-T7 A1, 7.50%, 2/25/41 | | | 62,559 | | | | 72,132 | |
Trust 2001-T5 A2, 7.00%, 6/19/41(e) | | | 41,224 | | | | 44,422 | |
Trust 2001-T5 A3, 7.50%, 6/19/41(e) | | | 198,736 | | | | 234,066 | |
Trust 2011-58 AT, 4.00%, 7/25/41 | | | 8,571,544 | | | | 8,984,334 | |
Trust 2001-T4 A1, 7.50%, 7/25/41 | | | 1,800,958 | | | | 2,092,296 | |
Trust 2001-T10 A1, 7.00%, 12/25/41 | | | 2,054,415 | | | | 2,384,976 | |
Trust 2013-106 MA, 4.00%, 2/25/42 | | | 18,460,001 | | | | 19,236,894 | |
Trust 2002-90 A1, 6.50%, 6/25/42 | | | 4,275,992 | | | | 4,888,146 | |
Trust 2002-W6 2A1, 7.00%, 6/25/42(e) | | | 2,420,421 | | | | 2,758,394 | |
Trust 2002-W8 A2, 7.00%, 6/25/42 | | | 1,370,283 | | | | 1,586,048 | |
Trust 2003-W2 1A2, 7.00%, 7/25/42 | | | 6,914,396 | | | | 8,118,084 | |
Trust 2002-T16 A3, 7.50%, 7/25/42 | | | 3,195,038 | | | | 3,738,938 | |
Trust 2003-W4 3A, 7.00%, 10/25/42(e) | | | 2,027,672 | | | | 2,299,556 | |
Trust 2012-121 NB, 7.00%, 11/25/42 | | | 1,079,205 | | | | 1,226,212 | |
| | | | | | | | |
| | |
| | | PAR VALUE | | | VALUE | |
Trust 2003-7 A1, 6.50%, 12/25/42 | | $ | 3,512,754 | | | $ | 3,944,960 | |
Trust 2003-W1 2A, 7.50%, 12/25/42(e) | | | 2,566,265 | | | | 2,880,145 | |
Trust 2004-T1 1A2, 6.50%, 1/25/44 | | | 2,129,071 | | | | 2,408,144 | |
Trust 2004-W2 2A2, 7.00%, 2/25/44 | | | 94,998 | | | | 108,208 | |
Trust 2004-W2 5A, 7.50%, 3/25/44 | | | 4,221,122 | | | | 4,747,893 | |
Trust 2004-W8 3A, 7.50%, 6/25/44 | | | 3,147,033 | | | | 3,643,896 | |
Trust 2004-W15 1A2, 6.50%, 8/25/44 | | | 752,499 | | | | 852,417 | |
Trust 2005-W1 1A3, 7.00%, 10/25/44 | | | 5,690,437 | | | | 6,551,194 | |
Trust 2001-79 BA, 7.00%, 3/25/45 | | | 648,105 | | | | 742,244 | |
Trust 2006-W1 1A1, 6.50%, 12/25/45 | | | 388,447 | | | | 437,889 | |
Trust 2006-W1 1A2, 7.00%, 12/25/45 | | | 2,677,551 | | | | 3,084,327 | |
Trust 2006-W1 1A3, 7.50%, 12/25/45 | | | 47,618 | | | | 55,902 | |
Trust 2006-W1 1A4, 8.00%, 12/25/45 | | | 3,222,563 | | | | 3,770,637 | |
Trust 2007-W10 1A, 6.335%, 8/25/47(e) | | | 10,297,731 | | | | 11,277,513 | |
Trust 2007-W10 2A, 6.346%, 8/25/47(e) | | | 3,132,549 | | | | 3,427,626 | |
USD LIBOR 1-month | | | | | | | | |
+0.55%, 2.102%, 9/25/43 | | | 37,633,463 | | | | 38,040,883 | |
USD LIBOR 1-Month | | | | | | | | |
+0.40%, 1.952%, 7/25/44 | | | 1,515,378 | | | | 1,497,932 | |
Freddie Mac | | | | | | | | |
Series 2456 CJ, 6.50%, 6/15/32 | | | 172,367 | | | | 195,365 | |
Series 3312 AB, 6.50%, 6/15/32 | | | 2,835,032 | | | | 3,187,999 | |
Series T-41 2A, 5.507%, 7/25/32(e) | | | 223,310 | | | | 242,709 | |
Series 2587 ZU, 5.50%, 3/15/33 | | | 4,053,742 | | | | 4,440,486 | |
Series 2610 UA, 4.00%, 5/15/33 | | | 1,713,179 | | | | 1,772,894 | |
Series T-48 1A, 5.087%, 7/25/33(e) | | | 2,579,348 | | | | 2,787,319 | |
Series 2708 ZD, 5.50%, 11/15/33 | | | 16,113,688 | | | | 17,952,934 | |
Series 3204 ZM, 5.00%, 8/15/34 | | | 7,362,671 | | | | 7,913,416 | |
Series 3330 GZ, 5.50%, 6/15/37 | | | 1,357,561 | | | | 1,468,857 | |
Series 3427 Z, 5.00%, 3/15/38 | | | 3,166,120 | | | | 3,402,317 | |
Series T-51 1A, 6.50%, 9/25/43(e) | | | 57,689 | | | | 65,990 | |
Series 4283 DW, 4.50%, 12/15/43(e) | | | 83,482,950 | | | | 89,054,519 | |
Series 4283 EW, 4.50%, 12/15/43(e) | | | 49,111,825 | | | | 52,298,755 | |
Series 4281 BC, 4.50%, 12/15/43(e) | | | 137,359,867 | | | | 146,796,572 | |
Series 4319 MA, 4.50%, 3/15/44(e) | | | 26,919,213 | | | | 28,864,931 | |
USD LIBOR 1-month | | | | | | | | |
+0.53%, 2.007%, 8/15/43 | | | 68,670,022 | | | | 68,945,028 | |
Ginnie Mae | | | | | | | | |
USD LIBOR 1-Month | | | | | | | | |
+0.65%, 1.893%, 10/20/64 | | | 8,240,351 | | | | 8,258,273 | |
+0.63%, 1.873%, 4/20/65 | | | 11,729,515 | | | | 11,745,208 | |
+0.60%, 1.843%, 7/20/65 | | | 8,842,193 | | | | 8,842,225 | |
+0.60%, 1.843%, 8/20/65 | | | 8,251,832 | | | | 8,251,955 | |
+0.62%, 1.863%, 9/20/65 | | | 1,911,683 | | | | 1,913,473 | |
+0.75%, 1.993%, 11/20/65 | | | 33,356,298 | | | | 33,576,459 | |
+0.75%, 1.993%, 10/20/66 | | | 56,130,546 | | | | 56,549,353 | |
+0.57%, 1.813%, 9/20/67 | | | 34,846,345 | | | | 34,993,254 | |
USD LIBOR 12-Month | | | | | | | | |
+0.30%, 2.026%, 9/20/66 | | | 20,809,235 | | | | 20,870,138 | |
+0.25%, 1.957%, 2/20/67 | | | 20,571,052 | | | | 20,617,325 | |
+0.20%, 2.136%, 3/20/67 | | | 3,534,561 | | | | 3,536,052 | |
+0.30%, 2.10%, 4/20/67 | | | 25,019,650 | | | | 25,182,022 | |
+0.30%, 2.07%, 5/20/67 | | | 22,387,540 | | | | 22,494,474 | |
+0.20%, 2.099%, 5/20/67 | | | 49,364,038 | | | | 49,374,784 | |
+0.20%, 2.01%, 6/20/67 | | | 109,128,575 | | | | 109,104,872 | |
+0.20%, 1.93%, 8/20/67 | | | 24,434,904 | | | | 24,401,429 | |
+0.25%, 1.98%, 9/20/67 | | | 25,399,285 | | | | 25,417,798 | |
+0.27%, 2.02%, 9/20/67 | | | 72,183,317 | | | | 72,320,805 | |
+0.23%, 2.01%, 10/20/67 | | | 161,935,904 | | | | 161,964,048 | |
+0.23%, 2.01%, 10/20/67 | | | 78,411,015 | | | | 78,408,090 | |
+0.22%, 2.019%, 10/20/67 | | | 39,279,404 | | | | 39,250,227 | |
+0.25%, 2.03%, 10/20/67 | | | 49,992,416 | | | | 50,057,002 | |
+0.20%, 2.06%, 11/20/67 | | | 19,047,904 | | | | 19,034,328 | |
+0.22%, 2.06%, 11/20/67 | | | 22,540,853 | | | | 22,546,619 | |
+0.22%, 2.08%, 11/20/67 | | | 135,221,940 | | | | 135,292,107 | |
+0.18%, 2.12%, 12/20/67 | | | 34,845,000 | | | | 34,798,722 | |
| | | | | | | | |
| | | | | | | 1,723,950,262 | |
| | |
| PAGE 8 § DODGE & COX INCOME FUND | | See accompanying Notes to Financial Statements |
| | | | |
| PORTFOLIO OF INVESTMENTS | | | December 31, 2017 | |
| | | | | | | | |
| DEBT SECURITIES (continued) | | | | | | |
| | |
| | | PAR VALUE | | | VALUE | |
Federal Agency Mortgage Pass-Through: 29.6% | |
Fannie Mae, 15 Year | | | | | | | | |
6.00%, 2/1/18-3/1/23 | | $ | 27,143,740 | | | $ | 28,417,812 | |
6.50%, 4/1/18-12/1/19 | | | 2,651 | | | | 2,669 | |
5.50%, 12/1/18-7/1/25 | | | 99,323,937 | | | | 104,221,357 | |
4.00%, 9/1/25-5/1/29 | | | 203,856,036 | | | | 212,269,762 | |
5.00%, 9/1/25 | | | 39,501,725 | | | | 41,691,126 | |
3.50%, 10/1/25-2/1/31 | | | 919,141,766 | | | | 949,245,492 | |
4.50%, 3/1/29 | | | 25,470,784 | | | | 26,876,852 | |
Fannie Mae, 20 Year | | | | | | | | |
4.50%, 3/1/29-1/1/34 | | | 441,751,156 | | | | 471,444,017 | |
4.00%, 9/1/30-3/1/37 | | | 2,023,259,726 | | | | 2,136,662,094 | |
3.50%, 11/1/35-4/1/37 | | | 185,473,322 | | | | 192,575,066 | |
3.50%, 3/1/37 | | | 275,479,067 | | | | 285,795,808 | |
Fannie Mae, 30 Year | | | | | | | | |
6.00%, 11/1/28-2/1/39 | | | 112,191,027 | | | | 127,259,246 | |
7.00%, 4/1/32-2/1/39 | | | 67,440,141 | | | | 78,514,122 | |
6.50%, 12/1/32-8/1/39 | | | 45,959,850 | | | | 51,918,018 | |
5.50%, 2/1/33-11/1/39 | | | 168,998,472 | | | | 187,266,857 | |
4.50%, 11/1/35-11/1/47 | | | 2,812,760,568 | | | | 3,006,803,990 | |
4.50%, 2/1/47 | | | 240,303,104 | | | | 255,882,190 | |
4.50%, 6/1/47 | | | 278,796,582 | | | | 297,057,923 | |
5.00%, 7/1/37-7/1/40 | | | 27,614,846 | | | | 29,825,397 | |
4.00%, 10/1/40-8/1/41 | | | 53,971,675 | | | | 56,720,946 | |
Fannie Mae, 40 Year
4.50%, 1/1/52-6/1/56 | | | 182,058,037 | | | | 195,174,564 | |
Fannie Mae, Hybrid ARM | | | | | | | | |
1-Year U.S. Treasury CMT | | | | | | | | |
+2.14%, 3.226%, 10/1/33 | | | 1,722,333 | | | | 1,808,710 | |
+2.14%, 3.243%, 8/1/34 | | | 522,044 | | | | 550,361 | |
+1.97%, 3.178%, 9/1/34 | | | 1,809,584 | | | | 1,891,438 | |
+2.29%, 3.293%, 1/1/36 | | | 13,503,660 | | | | 14,264,964 | |
+2.12%, 3.121%, 7/1/36 | | | 64,680 | | | | 67,972 | |
+2.14%, 3.113%, 12/1/36 | | | 2,283,579 | | | | 2,401,223 | |
USD LIBOR 12-Month | | | | | | | | |
+1.67%, 3.40%, 7/1/34 | | | 2,067,971 | | | | 2,176,688 | |
+1.36%, 3.111%, 10/1/34 | | | 1,148,326 | | | | 1,190,717 | |
+1.94%, 3.68%, 1/1/35 | | | 845,582 | | | | 894,158 | |
+1.40%, 3.148%, 4/1/35 | | | 2,587,488 | | | | 2,686,630 | |
+1.75%, 3.557%, 6/1/35 | | | 716,669 | | | | 755,667 | |
+1.40%, 3.15%, 7/1/35 | | | 805,192 | | | | 833,091 | |
+1.44%, 3.22%, 7/1/35 | | | 409,314 | | | | 425,743 | |
+1.54%, 3.336%, 7/1/35 | | | 1,224,610 | | | | 1,277,329 | |
+1.75%, 3.539%, 7/1/35 | | | 1,385,778 | | | | 1,460,702 | |
+1.40%, 3.152%, 8/1/35 | | | 4,129,404 | | | | 4,312,953 | |
+1.40%, 3.152%, 8/1/35 | | | 1,620,992 | | | | 1,683,962 | |
+1.75%, 3.503%, 8/1/35 | | | 2,574,032 | | | | 2,705,527 | |
+1.77%, 3.517%, 9/1/35 | | | 2,428,512 | | | | 2,559,330 | |
+1.60%, 3.352%, 10/1/35 | | | 2,674,705 | | | | 2,800,804 | |
+1.75%, 3.498%, 10/1/35 | | | 1,517,289 | | | | 1,596,404 | |
+1.62%, 3.374%, 12/1/35 | | | 829,377 | | | | 867,745 | |
+1.62%, 3.369%, 1/1/36 | | | 2,533,470 | | | | 2,651,215 | |
+1.71%, 3.443%, 1/1/36 | | | 3,782,713 | | | | 3,981,031 | |
+1.72%, 3.518%, 11/1/36 | | | 1,471,908 | | | | 1,548,908 | |
+1.74%, 3.493%, 12/1/36 | | | 809,524 | | | | 849,177 | |
+1.61%, 3.33%, 1/1/37 | | | 2,331,559 | | | | 2,430,050 | |
+2.02%, 3.741%, 2/1/37 | | | 4,966,819 | | | | 5,254,603 | |
+1.93%, 3.678%, 4/1/37 | | | 357,933 | | | | 380,528 | |
+1.19%, 2.94%, 8/1/37 | | | 118,088 | | | | 118,061 | |
+1.82%, 3.608%, 8/1/37 | | | 1,761,779 | | | | 1,858,310 | |
+1.49%, 3.276%, 11/1/37 | | | 488,267 | | | | 505,463 | |
+2.02%, 4.89%, 4/1/38 | | | 155,461 | | | | 160,652 | |
+1.73%, 3.494%, 5/1/38 | | | 130,100,002 | | | | 136,664,771 | |
+1.89%, 5.037%, 5/1/38 | | | 1,902,539 | | | | 1,997,528 | |
+1.87%, 3.622%, 9/1/38 | | | 835,528 | | | | 880,561 | |
+1.61%, 3.36%, 10/1/38 | | | 6,286,528 | | | | 6,559,525 | |
+1.70%, 3.459%, 10/1/38 | | | 3,696,473 | | | | 3,869,252 | |
+1.75%, 3.485%, 10/1/38 | | | 1,483,457 | | | | 1,558,759 | |
| | | | | | | | |
| | |
| | | PAR VALUE | | | VALUE | |
+1.74%, 3.772%, 6/1/39 | | $ | 620,309 | | | $ | 652,666 | |
+1.76%, 4.088%, 12/1/39 | | | 2,510,531 | | | | 2,610,429 | |
+1.71%, 2.607%, 4/1/42 | | | 11,889,446 | | | | 12,245,186 | |
+1.67%, 2.348%, 9/1/42 | | | 10,259,431 | | | | 10,374,516 | |
+1.68%, 2.479%, 11/1/42 | | | 9,532,778 | | | | 9,767,772 | |
+1.57%, 2.285%, 12/1/42 | | | 16,320,348 | | | | 16,353,180 | |
+1.59%, 2.384%, 2/1/43 | | | 16,252,932 | | | | 16,392,629 | |
+1.80%, 3.486%, 2/1/43 | | | 3,661,038 | | | | 3,820,573 | |
+1.56%, 2.279%, 5/1/43 | | | 3,673,758 | | | | 3,676,493 | |
+1.47%, 1.91%, 6/1/43 | | | 4,045,355 | | | | 4,157,968 | |
+1.44%, 1.924%, 9/1/43 | | | 8,655,768 | | | | 8,863,990 | |
+1.56%, 2.961%, 9/1/43 | | | 5,340,949 | | | | 5,437,422 | |
+1.56%, 3.267%, 9/1/43 | | | 3,065,173 | | | | 3,124,887 | |
+1.61%, 2.302%, 10/1/43 | | | 40,524,262 | | | | 41,085,551 | |
+1.54%, 2.649%, 11/1/43 | | | 13,362,582 | | | | 13,577,650 | |
+1.61%, 2.893%, 11/1/43 | | | 14,587,231 | | | | 14,783,215 | |
+1.56%, 3.131%, 12/1/43 | | | 6,557,518 | | | | 6,710,787 | |
+1.55%, 2.418%, 2/1/44 | | | 2,460,456 | | | | 2,530,461 | |
+1.59%, 2.704%, 2/1/44 | | | 5,714,021 | | | | 5,795,611 | |
+1.58%, 2.942%, 2/1/44 | | | 9,731,235 | | | | 9,941,492 | |
+1.56%, 2.702%, 4/1/44 | | | 16,144,093 | | | | 16,575,441 | |
+1.65%, 2.844%, 4/1/44 | | | 33,218,329 | | | | 34,210,094 | |
+1.59%, 2.948%, 4/1/44 | | | 6,376,490 | | | | 6,512,789 | |
+1.59%, 2.955%, 4/1/44 | | | 5,199,854 | | | | 5,300,477 | |
+1.58%, 3.189%, 4/1/44 | | | 21,296,790 | | | | 21,749,172 | |
+1.57%, 2.47%, 5/1/44 | | | 15,210,524 | | | | 15,591,706 | |
+1.56%, 3.039%, 5/1/44 | | | 25,864,097 | | | | 26,417,935 | |
+1.58%, 2.846%, 7/1/44 | | | 12,376,419 | | | | 12,603,026 | |
+1.59%, 2.867%, 7/1/44 | | | 17,169,229 | | | | 17,529,143 | |
+1.56%, 2.933%, 7/1/44 | | | 8,896,890 | | | | 9,066,894 | |
+1.59%, 2.955%, 7/1/44 | | | 5,540,037 | | | | 5,632,247 | |
+1.57%, 2.957%, 7/1/44 | | | 6,115,741 | | | | 6,237,895 | |
+1.58%, 3.086%, 7/1/44 | | | 13,463,027 | | | | 13,737,689 | |
+1.57%, 2.786%, 8/1/44 | | | 24,091,464 | | | | 24,510,968 | |
+1.58%, 2.79%, 8/1/44 | | | 10,400,575 | | | | 10,583,016 | |
+1.58%, 2.914%, 8/1/44 | | | 7,195,083 | | | | 7,336,851 | |
+1.57%, 3.012%, 8/1/44 | | | 8,131,923 | | | | 8,303,613 | |
+1.58%, 2.674%, 9/1/44 | | | 9,949,097 | | | | 10,100,091 | |
+1.58%, 2.764%, 9/1/44 | | | 11,315,704 | | | | 11,504,218 | |
+1.65%, 2.832%, 9/1/44 | | | 37,325,676 | | | | 38,016,669 | |
+1.58%, 2.866%, 9/1/44 | | | 5,577,927 | | | | 5,685,257 | |
+1.63%, 2.952%, 9/1/44 | | | 18,964,043 | | | | 19,342,258 | |
+1.59%, 2.991%, 9/1/44 | | | 8,232,611 | | | | 8,373,175 | |
+1.57%, 2.472%, 10/1/44 | | | 8,009,803 | | | | 8,083,692 | |
+1.60%, 2.606%, 10/1/44 | | | 7,679,664 | | | | 7,781,572 | |
+1.57%, 2.673%, 10/1/44 | | | 15,528,351 | | | | 15,755,957 | |
+1.57%, 2.748%, 10/1/44 | | | 34,256,617 | | | | 34,837,319 | |
+1.57%, 2.754%, 10/1/44 | | | 10,293,936 | | | | 10,470,271 | |
+1.58%, 2.79%, 10/1/44 | | | 18,654,058 | | | | 19,032,562 | |
+1.56%, 2.844%, 10/1/44 | | | 7,588,630 | | | | 7,724,394 | |
+1.60%, 2.848%, 10/1/44 | | | 16,301,343 | | | | 16,651,676 | |
+1.60%, 2.86%, 10/1/44 | | | 12,062,483 | | | | 12,315,522 | |
+1.58%, 2.905%, 10/1/44 | | | 5,291,811 | | | | 5,385,162 | |
+1.60%, 2.924%, 10/1/44 | | | 19,096,614 | | | | 19,505,357 | |
+1.56%, 2.959%, 10/1/44 | | | 10,859,800 | | | | 11,074,982 | |
+1.58%, 2.734%, 11/1/44 | | | 6,658,210 | | | | 6,760,429 | |
+1.60%, 2.797%, 11/1/44 | | | 8,962,324 | | | | 9,112,338 | |
+1.60%, 2.819%, 11/1/44 | | | 16,723,421 | | | | 17,020,534 | |
+1.58%, 2.847%, 11/1/44 | | | 19,515,721 | | | | 19,888,156 | |
+1.56%, 2.915%, 11/1/44 | | | 18,840,689 | | | | 19,203,526 | |
+1.57%, 2.926%, 11/1/44 | | | 16,086,396 | | | | 16,387,659 | |
+1.58%, 2.698%, 12/1/44 | | | 4,709,584 | | | | 4,789,293 | |
+1.59%, 2.715%, 12/1/44 | | | 5,994,406 | | | | 6,081,526 | |
+1.58%, 2.752%, 12/1/44 | | | 5,566,060 | | | | 5,649,919 | |
+1.57%, 2.761%, 12/1/44 | | | 34,503,780 | | | | 35,068,508 | |
+1.60%, 2.82%, 12/1/44 | | | 12,310,223 | | | | 12,520,939 | |
+1.59%, 2.988%, 12/1/44 | �� | | 9,726,764 | | | | 9,911,541 | |
+1.57%, 2.922%, 1/1/45 | | | 13,704,112 | | | | 13,952,127 | |
+1.58%, 2.749%, 2/1/45 | | | 18,142,588 | | | | 18,416,698 | |
| | |
| See accompanying Notes to Financial Statements | | DODGE & COX INCOME FUND §PAGE 9 |
| | | | |
| PORTFOLIO OF INVESTMENTS | | | December 31, 2017 | |
| | | | | | | | |
| DEBT SECURITIES (continued) | | | | | | |
| | |
| | | PAR VALUE | | | VALUE | |
+1.57%, 3.009%, 3/1/45 | | $ | 173,160,400 | | | $ | 176,731,015 | |
+1.59%, 3.102%, 3/1/45 | | | 4,727,360 | | | | 4,803,843 | |
+1.61%, 2.578%, 4/1/45 | | | 6,074,817 | | | | 6,128,296 | |
+1.57%, 2.846%, 4/1/45 | | | 40,305,605 | | | | 41,058,549 | |
+1.60%, 2.643%, 8/1/45 | | | 14,063,524 | | | | 14,205,464 | |
+1.58%, 2.673%, 8/1/45 | | | 12,599,194 | | | | 12,734,925 | |
+1.59%, 2.829%, 10/1/45 | | | 29,079,025 | | | | 29,466,452 | |
+1.60%, 2.624%, 11/1/45 | | | 21,877,547 | | | | 22,075,290 | |
+1.61%, 2.917%, 3/1/46 | | | 6,022,028 | | | | 6,102,962 | |
+1.60%, 2.437%, 4/1/46 | | | 40,840,706 | | | | 41,189,046 | |
+1.59%, 2.679%, 4/1/46 | | | 7,028,886 | | | | 7,093,429 | |
+1.61%, 2.716%, 4/1/46 | | | 6,926,116 | | | | 6,995,620 | |
+1.58%, 2.802%, 4/1/46 | | | 18,252,927 | | | | 18,471,551 | |
+1.61%, 2.913%, 4/1/46 | | | 5,814,194 | | | | 5,874,035 | |
+1.58%, 2.499%, 5/1/46 | | | 11,177,438 | | | | 11,305,233 | |
+1.59%, 2.702%, 6/1/46 | | | 10,648,694 | | | | 10,759,712 | |
+1.60%, 2.758%, 6/1/46 | | | 3,635,345 | | | | 3,680,379 | |
+1.59%, 2.706%, 7/1/46 | | | 3,564,872 | | | | 3,602,432 | |
+1.62%, 2.308%, 12/1/46 | | | 9,201,834 | | | | 9,176,383 | |
+1.61%, 3.136%, 6/1/47 | | | 29,779,921 | | | | 30,272,423 | |
+1.61%, 3.188%, 6/1/47 | | | 33,819,221 | | | | 34,415,943 | |
+1.59%, 3.166%, 7/1/47 | | | 25,421,176 | | | | 25,921,058 | |
+1.61%, 3.177%, 7/1/47 | | | 10,043,213 | | | | 10,218,207 | |
+1.60%, 2.747%, 8/1/47 | | | 32,451,640 | | | | 32,822,756 | |
+1.61%, 3.024%, 8/1/47 | | | 9,842,318 | | | | 9,976,730 | |
+1.61%, 3.038%, 8/1/47 | | | 9,578,695 | | | | 9,711,400 | |
+1.59%, 3.215%, 8/1/47 | | | 13,172,164 | | | | 13,434,510 | |
+1.57%, 2.957%, 10/1/47 | | | 8,068,873 | | | | 8,189,068 | |
+1.61%, 3.092%, 10/1/47 | | | 12,022,555 | | | | 12,201,816 | |
+1.61%, 2.906%, 11/1/47 | | | 8,199,853 | | | | 8,262,000 | |
+1.59%, 3.004%, 11/1/47 | | | 20,095,711 | | | | 20,414,786 | |
USD LIBOR 6-Month | | | | | | | | |
+1.42%, 2.975%, 8/1/34 | | | 1,853,442 | | | | 1,910,047 | |
+1.50%, 2.995%, 1/1/35 | | | 1,384,073 | | | | 1,428,505 | |
+1.57%, 3.07%, 11/1/35 | | | 1,887,690 | | | | 1,960,444 | |
Freddie Mac, Hybrid ARM | | | | | | | | |
1-Year U.S. Treasury CMT | | | | | | | | |
+2.25%, 2.996%, 2/1/34 | | | 4,001,376 | | | | 4,229,732 | |
+2.25%, 3.50%, 11/1/34 | | | 1,154,373 | | | | 1,215,945 | |
+2.25%, 3.106%, 2/1/35 | | | 870,309 | | | | 922,475 | |
+2.13%, 2.875%, 4/1/35 | | | 644,201 | | | | 670,138 | |
+1.67%, 2.647%, 1/1/36 | | | 2,404,108 | | | | 2,483,653 | |
+2.25%, 3.106%, 1/1/36 | | | 5,458,972 | | | | 5,762,573 | |
USD LIBOR 12-Month | | | | | | | | |
+1.78%, 3.529%, 9/1/33 | | | 5,148,381 | | | | 5,426,509 | |
+1.80%, 3.548%, 8/1/34 | | | 822,348 | | | | 867,123 | |
+1.63%, 3.25%, 1/1/35 | | | 569,817 | | | | 596,842 | |
+1.79%, 3.522%, 3/1/35 | | | 1,114,932 | | | | 1,176,744 | |
+1.72%, 3.468%, 8/1/35 | | | 1,219,067 | | | | 1,281,130 | |
+1.87%, 3.62%, 8/1/35 | | | 2,277,032 | | | | 2,403,510 | |
+1.83%, 3.583%, 9/1/35 | | | 1,602,417 | | | | 1,688,291 | |
+1.63%, 3.375%, 10/1/35 | | | 1,970,622 | | | | 2,059,375 | |
+1.61%, 3.34%, 1/1/36 | | | 1,754,780 | | | | 1,830,533 | |
+1.89%, 3.624%, 4/1/36 | | | 2,957,427 | | | | 3,126,154 | |
+1.78%, 3.529%, 12/1/36 | | | 1,478,939 | | | | 1,551,560 | |
+1.77%, 3.398%, 1/1/37 | | | 2,362,064 | | | | 2,484,959 | |
+1.57%, 3.246%, 3/1/37 | | | 2,645,715 | | | | 2,754,081 | |
+1.57%, 3.292%, 4/1/37 | | | 1,349,621 | | | | 1,407,197 | |
+1.79%, 3.508%, 4/1/37 | | | 1,865,579 | | | | 1,962,926 | |
+1.63%, 3.436%, 5/1/37 | | | 2,497,795 | | | | 2,611,382 | |
+1.63%, 3.377%, 7/1/37 | | | 5,834,930 | | | | 6,093,063 | |
+2.09%, 3.835%, 10/1/37 | | | 114,694 | | | | 120,906 | |
+2.02%, 5.866%, 1/1/38 | | | 820,616 | | | | 856,344 | |
+1.62%, 3.314%, 2/1/38 | | | 7,784,943 | | | | 8,125,726 | |
+1.76%, 3.505%, 4/1/38 | | | 6,399,134 | | | | 6,712,612 | |
+1.86%, 3.581%, 4/1/38 | | | 8,694,305 | | | | 9,162,750 | |
+1.92%, 5.25%, 5/1/38 | | | 1,609,046 | | | | 1,682,705 | |
| | | | | | | | |
| | |
| | | PAR VALUE | | | VALUE | |
+1.68%, 3.44%, 6/1/38 | | $ | 3,115,660 | | | $ | 3,258,995 | |
+1.63%, 4.633%, 6/1/38 | | | 572,681 | | | | 587,194 | |
+1.74%, 3.48%, 10/1/38 | | | 598,789 | | | | 627,576 | |
+1.73%, 3.493%, 10/1/38 | | | 2,504,322 | | | | 2,626,726 | |
+1.78%, 4.099%, 11/1/39 | | | 1,814,283 | | | | 1,903,777 | |
+1.82%, 3.325%, 7/1/43 | | | 2,827,699 | | | | 2,947,503 | |
+1.71%, 2.432%, 8/1/43 | | | 43,606,483 | | | | 44,971,136 | |
+1.64%, 2.769%, 10/1/43 | | | 2,629,596 | | | | 2,666,449 | |
+1.59%, 2.933%, 1/1/44 | | | 5,071,231 | | | | 5,162,391 | |
+1.61%, 3.086%, 1/1/44 | | | 3,742,306 | | | | 3,820,454 | |
+1.62%, 2.884%, 2/1/44 | | | 10,907,587 | | | | 11,122,241 | |
+1.63%, 3.11%, 4/1/44 | | | 7,152,305 | | | | 7,311,034 | |
+1.64%, 3.123%, 4/1/44 | | | 3,585,952 | | | | 3,666,297 | |
+1.63%, 3.006%, 5/1/44 | | | 101,556,088 | | | | 103,580,517 | |
+1.62%, 2.805%, 6/1/44 | | | 7,804,628 | | | | 7,954,580 | |
+1.63%, 3.096%, 6/1/44 | | | 21,933,974 | | | | 22,413,271 | |
+1.62%, 3.043%, 7/1/44 | | | 7,606,722 | | | | 7,755,461 | |
+1.63%, 3.064%, 7/1/44 | | | 5,642,302 | | | | 5,756,687 | |
+1.61%, 2.845%, 8/1/44 | | | 9,150,237 | | | | 9,308,677 | |
+1.62%, 3.015%, 8/1/44 | | | 9,546,646 | | | | 9,731,936 | |
+1.63%, 3.081%, 8/1/44 | | | 11,330,137 | | | | 11,570,522 | |
+1.62%, 2.738%, 9/1/44 | | | 11,634,461 | | | | 11,815,403 | |
+1.62%, 2.762%, 9/1/44 | | | 13,585,885 | | | | 13,833,986 | |
+1.62%, 2.854%, 9/1/44 | | | 8,549,119 | | | | 8,695,977 | |
+1.62%, 2.782%, 10/1/44 | | | 6,359,389 | | | | 6,473,881 | |
+1.62%, 2.814%, 10/1/44 | | | 16,873,311 | | | | 17,192,580 | |
+1.61%, 2.856%, 10/1/44 | | | 14,787,188 | | | | 15,039,699 | |
+1.63%, 3.01%, 10/1/44 | | | 15,495,723 | | | | 15,827,028 | |
+1.63%, 3.012%, 10/1/44 | | | 14,707,873 | | | | 15,026,172 | |
+1.60%, 2.72%, 11/1/44 | | | 20,028,491 | | | | 20,365,564 | |
+1.63%, 2.751%, 11/1/44 | | | 7,563,566 | | | | 7,667,631 | |
+1.63%, 2.802%, 11/1/44 | | | 15,115,195 | | | | 15,363,989 | |
+1.61%, 2.884%, 11/1/44 | | | 9,421,938 | | | | 9,579,899 | |
+1.62%, 2.911%, 11/1/44 | | | 14,151,729 | | | | 14,424,775 | |
+1.61%, 2.924%, 11/1/44 | | | 8,294,809 | | | | 8,447,158 | |
+1.61%, 2.928%, 11/1/44 | | | 26,928,726 | | | | 27,412,016 | |
+1.63%, 2.937%, 11/1/44 | | | 11,302,700 | | | | 11,502,932 | |
+1.63%, 2.942%, 11/1/44 | | | 18,952,817 | | | | 19,342,430 | |
+1.60%, 2.964%, 11/1/44 | | | 6,746,987 | | | | 6,874,496 | |
+1.62%, 2.964%, 11/1/44 | | | 13,148,719 | | | | 13,386,310 | |
+1.63%, 2.784%, 12/1/44 | | | 4,762,414 | | | | 4,822,959 | |
+1.63%, 2.847%, 12/1/44 | | | 22,122,658 | | | | 22,481,417 | |
+1.62%, 2.89%, 12/1/44 | | | 14,674,843 | | | | 14,961,543 | |
+1.63%, 2.896%, 12/1/44 | | | 19,257,209 | | | | 19,626,531 | |
+1.62%, 2.939%, 12/1/44 | | | 9,468,822 | | | | 9,628,161 | |
+1.62%, 2.674%, 1/1/45 | | | 14,943,796 | | | | 15,159,019 | |
+1.63%, 2.828%, 1/1/45 | | | 11,170,073 | | | | 11,369,136 | |
+1.62%, 2.873%, 1/1/45 | | | 10,630,211 | | | | 10,798,536 | |
+1.62%, 2.901%, 1/1/45 | | | 18,371,383 | | | | 18,678,221 | |
+1.63%, 3.079%, 1/1/45 | | | 31,023,774 | | | | 31,575,053 | |
+1.62%, 2.922%, 2/1/45 | | | 16,128,821 | | | | 16,389,166 | |
+1.62%, 2.687%, 4/1/45 | | | 9,008,149 | | | | 9,115,519 | |
+1.63%, 2.606%, 5/1/45 | | | 50,099,604 | | | | 50,514,409 | |
+1.63%, 2.742%, 6/1/45 | | | 6,389,152 | | | | 6,461,646 | |
+1.63%, 2.638%, 8/1/45 | | | 13,007,609 | | | | 13,117,132 | |
+1.63%, 2.74%, 8/1/45 | | | 39,615,813 | | | | 40,058,352 | |
+1.60%, 2.786%, 8/1/45 | | | 11,066,844 | | | | 11,203,065 | |
+1.63%, 2.805%, 9/1/45 | | | 11,397,152 | | | | 11,527,364 | |
+1.63%, 2.73%, 5/1/46 | | | 259,783,148 | | | | 262,585,429 | |
+1.62%, 2.747%, 5/1/46 | | | 20,105,776 | | | | 20,379,764 | |
+1.62%, 2.642%, 7/1/46 | | | 28,065,474 | | | | 28,271,251 | |
+1.63%, 2.535%, 9/1/46 | | | 49,995,920 | | | | 50,095,260 | |
+1.63%, 3.161%, 6/1/47 | | | 14,376,163 | | | | 14,597,965 | |
+1.63%, 3.18%, 8/1/47 | | | 9,845,232 | | | | 9,999,614 | |
+1.64%, 3.106%, 10/1/47 | | | 10,054,398 | | | | 10,189,221 | |
+1.64%, 3.116%, 11/1/47 | | | 4,157,210 | | | | 4,206,567 | |
| | |
| PAGE 10 § DODGE & COX INCOME FUND | | See accompanying Notes to Financial Statements |
| | | | |
| PORTFOLIO OF INVESTMENTS | | | December 31, 2017 | |
| | | | | | | | |
| DEBT SECURITIES (continued) | | | | | | |
| | |
| | | PAR VALUE | | | VALUE | |
USD LIBOR 6-Month | | | | | | | | |
+1.60%, 3.081%, 8/1/36 | | $ | 2,356,360 | | | $ | 2,446,325 | |
Freddie Mac Gold, 15 Year | | | | | | | | |
6.00%, 1/1/18-11/1/23 | | | 10,459,673 | | | | 10,987,700 | |
5.50%, 10/1/20-12/1/24 | | | 4,833,675 | | | | 4,981,064 | |
4.50%, 3/1/25-6/1/26 | | | 13,447,553 | | | | 14,090,231 | |
4.00%, 6/1/26-6/1/27 | | | 214,282,240 | | | | 223,257,411 | |
Freddie Mac Gold, 20 Year | | | | | | | | |
6.50%, 10/1/26 | | | 2,425,012 | | | | 2,653,353 | |
6.00%, 12/1/27 | | | 19,360,977 | | | | 21,630,796 | |
4.50%, 5/1/30-1/1/34 | | | 111,465,614 | | | | 119,053,713 | |
4.00%, 9/1/31-10/1/35 | | | 244,007,461 | | | | 257,978,786 | |
4.00%, 1/1/35 | | | 258,939,561 | | | | 273,892,639 | |
3.50%, 7/1/35-1/1/36 | | | 192,397,595 | | | | 199,989,492 | |
Freddie Mac Gold, 30 Year | | | | | | | | |
7.90%, 2/17/21 | | | 131,899 | | | | 134,488 | |
7.00%, 4/1/31-11/1/38 | | | 3,828,097 | | | | 4,269,655 | |
6.50%, 12/1/32-10/1/38 | | | 11,684,035 | | | | 12,999,587 | |
6.00%, 2/1/33-2/1/39 | | | 22,166,225 | | | | 24,861,092 | |
5.50%, 3/1/34-12/1/38 | | | 57,259,565 | | | | 63,655,564 | |
4.50%, 3/1/39-10/1/47 | | | 2,448,123,894 | | | | 2,606,207,843 | |
4.50%, 6/1/47 | | | 370,864,926 | | | | 394,329,935 | |
Ginnie Mae, 20 Year
4.00%, 1/20/35 | | | 10,009,459 | | | | 10,446,269 | |
Ginnie Mae, 30 Year | | | | | | | | |
7.80%, 6/15/20-1/15/21 | | | 132,828 | | | | 136,536 | |
8.00%, 9/15/20 | | | 2,260 | | | | 2,328 | |
7.85%, 1/15/21 | | | 3,418 | | | | 3,428 | |
7.50%, 12/15/23-5/15/25 | | | 894,993 | | | | 985,732 | |
7.00%, 5/15/28 | | | 292,305 | | | | 325,726 | |
| | | | | | | | |
| | | | | | | 16,074,319,171 | |
Private Label CMO & REMIC: 0.1% | | | | | | | | |
GSMPS Mortgage Loan Trust
Series 2004-4 1A4, 8.50%, 6/25/34(b) | | | 3,776,342 | | | | 4,313,959 | |
Seasoned Credit Risk Transfer Trust
Series 2017-4 M45T, 4.50%, 6/25/57 | | | 36,690,000 | | | | 39,034,711 | |
| | | | | | | | |
| | | | | | | 43,348,670 | |
| | | | | | | | |
| | | | | | | 17,841,618,103 | |
| | | | | | | | |
| | | | | | | 19,601,630,500 | |
| CORPORATE: 34.4% | | | | | | | | |
Financials: 12.9% | | | | | | | | |
Bank of America Corp. | | | | | | | | |
4.20%, 8/26/24 | | | 163,140,000 | | | | 171,761,344 | |
3.004%, 12/20/23(b)(f) | | | 391,866,000 | | | | 392,817,004 | |
4.25%, 10/22/26 | | | 157,024,000 | | | | 165,432,571 | |
6.625%, 5/23/36(a) | | | 246,428,000 | | | | 319,124,260 | |
Barclays PLC (United Kingdom) | | | | | | | | |
4.375%, 9/11/24 | | | 239,204,000 | | | | 245,048,239 | |
4.836%, 5/9/28 | | | 48,925,000 | | | | 50,908,998 | |
BNP Paribas SA (France) | | | | | | | | |
4.25%, 10/15/24 | | | 379,446,000 | | | | 400,500,184 | |
4.375%, 9/28/25(b) | | | 147,190,000 | | | | 153,763,657 | |
4.375%, 5/12/26(b) | | | 112,772,000 | | | | 117,891,150 | |
4.625%, 3/13/27(b) | | | 36,810,000 | | | | 39,257,386 | |
Boston Properties, Inc. | | | | | | | | |
5.875%, 10/15/19 | | | 48,079,000 | | | | 50,675,806 | |
5.625%, 11/15/20 | | | 79,385,000 | | | | 85,852,353 | |
4.125%, 5/15/21 | | | 52,852,000 | | | | 55,233,581 | |
3.85%, 2/1/23 | | | 76,031,000 | | | | 79,196,284 | |
3.125%, 9/1/23 | | | 19,500,000 | | | | 19,650,565 | |
3.80%, 2/1/24 | | | 64,024,000 | | | | 66,333,019 | |
3.20%, 1/15/25 | | | 42,125,000 | | | | 41,980,775 | |
3.65%, 2/1/26 | | | 19,580,000 | | | | 19,886,101 | |
Capital One Financial Corp. | | | | | | | | |
3.50%, 6/15/23 | | | 155,385,000 | | | | 158,083,797 | |
3.75%, 4/24/24 | | | 36,940,000 | | | | 37,941,235 | |
| | | | | | | | |
| | |
| | | PAR VALUE | | | VALUE | |
3.20%, 2/5/25 | | $ | 67,240,000 | | | $ | 66,566,866 | |
4.20%, 10/29/25 | | | 121,149,000 | | | | 124,610,688 | |
Cigna Corp. | | | | | | | | |
4.00%, 2/15/22 | | | 62,964,000 | | | | 65,749,837 | |
7.65%, 3/1/23 | | | 7,217,000 | | | | 8,720,140 | |
7.875%, 5/15/27 | | | 26,720,000 | | | | 36,044,228 | |
Citigroup, Inc. | | | | | | | | |
3.50%, 5/15/23 | | | 72,730,000 | | �� | | 74,019,996 | |
4.00%, 8/5/24 | | | 31,300,000 | | | | 32,635,427 | |
USD LIBOR 3-Month | | | | | | | | |
+1.70%, 3.116%, 5/15/18 | | | 79,070,000 | | | | 79,499,982 | |
+6.37%, 7.75%, 10/30/40(a) | | | 387,793,025 | | | | 425,331,390 | |
Equity Residential | | | | | | | | |
4.75%, 7/15/20 | | | 5,200,000 | | | | 5,480,999 | |
4.625%, 12/15/21 | | | 108,687,000 | | | | 116,407,559 | |
3.00%, 4/15/23 | | | 47,300,000 | | | | 47,849,458 | |
3.375%, 6/1/25 | | | 77,890,000 | | | | 79,408,015 | |
HSBC Holdings PLC (United Kingdom) | | | | | | | | |
5.10%, 4/5/21 | | | 85,935,000 | | | | 92,322,576 | |
9.30%, 6/1/21 | | | 100,000 | | | | 119,782 | |
4.30%, 3/8/26 | | | 116,100,000 | | | | 123,403,818 | |
6.50%, 5/2/36 | | | 189,105,000 | | | | 246,635,938 | |
6.50%, 9/15/37 | | | 201,366,000 | | | | 264,632,304 | |
6.80%, 6/1/38 | | | 29,650,000 | | | | 40,398,395 | |
JPMorgan Chase & Co. | | | | | | | | |
3.375%, 5/1/23 | | | 92,238,000 | | | | 93,742,496 | |
4.125%, 12/15/26 | | | 106,000,000 | | | | 111,790,049 | |
4.25%, 10/1/27 | | | 95,322,000 | | | | 101,283,365 | |
8.75%, 9/1/30(a) | | | 58,208,000 | | | | 85,579,734 | |
Lloyds Banking Group PLC
(United Kingdom) | | | | | | | | |
4.50%, 11/4/24 | | | 218,317,000 | | | | 229,027,529 | |
4.582%, 12/10/25 | | | 69,101,000 | | | | 72,438,246 | |
4.65%, 3/24/26 | | | 118,232,000 | | | | 124,810,347 | |
Navient Corp.
8.45%, 6/15/18 | | | 230,726,000 | | | | 236,609,513 | |
Royal Bank of Scotland Group PLC
(United Kingdom) | | | | | | | | |
6.125%, 12/15/22 | | | 292,243,000 | | | | 320,280,250 | |
6.00%, 12/19/23 | | | 264,370,000 | | | | 291,690,427 | |
Unum Group | | | | | | | | |
7.19%, 2/1/28 | | | 11,295,000 | | | | 13,573,833 | |
7.25%, 3/15/28 | | | 25,060,000 | | | | 31,454,556 | |
6.75%, 12/15/28 | | | 8,107,000 | | | | 9,923,453 | |
Wells Fargo & Co. | | | | | | | | |
2.15%, 12/6/19 | | | 280,875,000 | | | | 280,407,939 | |
4.30%, 7/22/27 | | | 247,864,000 | | | | 263,850,608 | |
USD LIBOR 3-Month | | | | | | | | |
+0.65%, 2.159%, 12/6/19 | | | 135,850,000 | | | | 137,117,131 | |
| | | | | | | | |
| | | | | | | 7,004,755,183 | |
Industrials: 20.1% | | | | | | | | |
AT&T, Inc. | | | | | | | | |
8.25%, 11/15/31(b) | | | 100,978,000 | | | | 140,031,009 | |
5.35%, 9/1/40 | | | 59,744,000 | | | | 63,000,730 | |
4.75%, 5/15/46 | | | 112,670,000 | | | | 110,102,465 | |
5.65%, 2/15/47 | | | 120,390,000 | | | | 131,648,640 | |
5.45%, 3/1/47 | | | 70,375,000 | | | | 75,152,544 | |
4.50%, 3/9/48 | | | 250,175,000 | | | | 234,201,171 | |
BHP Billiton, Ltd. (Australia)
6.75%, 10/19/75(a)(b)(f) | | | 111,122,000 | | | | 129,744,936 | |
Burlington Northern Santa Fe LLC(d) | | | | | | | | |
4.70%, 10/1/19 | | | 33,445,000 | | | | 34,857,720 | |
8.251%, 1/15/21 | | | 2,730,097 | | | | 2,896,068 | |
3.05%, 9/1/22 | | | 39,535,000 | | | | 40,307,309 | |
5.943%, 1/15/23 | | | 33,313 | | | | 34,401 | |
3.85%, 9/1/23 | | | 79,525,000 | | | | 84,061,601 | |
| | |
| See accompanying Notes to Financial Statements | | DODGE & COX INCOME FUND §PAGE 11 |
| | | | |
| PORTFOLIO OF INVESTMENTS | | | December 31, 2017 | |
| | | | | | | | |
| DEBT SECURITIES (continued) | |
| | |
| | | PAR VALUE | | | VALUE | |
5.72%, 1/15/24 | | $ | 13,351,861 | | | $ | 14,624,491 | |
5.342%, 4/1/24 | | | 4,070,855 | | | | 4,392,344 | |
5.629%, 4/1/24 | | | 16,984,374 | | | | 18,352,244 | |
5.996%, 4/1/24 | | | 34,098,558 | | | | 37,914,555 | |
3.442%, 6/16/28(b) | | | 82,216,543 | | | | 83,837,368 | |
Cemex SAB de CV (Mexico) | | | | | | | | |
6.00%, 4/1/24(b) | | | 113,175,000 | | | | 119,682,562 | |
5.70%, 1/11/25(b) | | | 207,411,000 | | | | 218,818,605 | |
6.125%, 5/5/25(b) | | | 105,300,000 | | | | 112,355,100 | |
7.75%, 4/16/26(b) | | | 47,783,000 | | | | 54,114,248 | |
Charter Communications, Inc. | | | | | | | | |
8.75%, 2/14/19 | | | 130,460,000 | | | | 139,090,423 | |
8.25%, 4/1/19 | | | 237,543,000 | | | | 253,863,382 | |
5.00%, 2/1/20 | | | 20,700,000 | | | | 21,601,518 | |
4.125%, 2/15/21 | | | 33,095,000 | | | | 34,077,866 | |
4.00%, 9/1/21 | | | 40,609,000 | | | | 41,820,720 | |
4.908%, 7/23/25 | | | 122,505,000 | | | | 130,216,074 | |
4.20%, 3/15/28 | | | 68,500,000 | | | | 67,979,605 | |
6.55%, 5/1/37 | | | 46,188,000 | | | | 54,285,468 | |
6.75%, 6/15/39 | | | 112,072,000 | | | | 134,381,486 | |
6.484%, 10/23/45 | | | 206,766,000 | | | | 240,890,038 | |
5.375%, 5/1/47 | | | 57,310,000 | | | | 58,714,543 | |
Cox Enterprises, Inc. | | | | | | | | |
3.25%, 12/15/22(b) | | | 110,233,000 | | | | 110,434,708 | |
2.95%, 6/30/23(b) | | | 251,295,000 | | | | 247,683,828 | |
3.85%, 2/1/25(b) | | | 263,159,000 | | | | 269,230,081 | |
3.50%, 8/15/27(b) | | | 73,648,000 | | | | 72,621,180 | |
CRH PLC (Ireland)
3.875%, 5/18/25(b) | | | 196,754,000 | | | | 205,335,034 | |
CSX Corp.
9.75%, 6/15/20 | | | 10,067,000 | | | | 11,761,245 | |
6.251%, 1/15/23 | | | 12,935,299 | | | | 14,592,310 | |
Dell Technologies, Inc.
4.42%, 6/15/21(b) | | | 61,430,000 | | | | 64,005,124 | |
5.45%, 6/15/23(b) | | | 178,108,000 | | | | 192,443,347 | |
Dillard’s, Inc.
7.13%, 8/1/18 | | | 23,565,000 | | | | 24,080,090 | |
7.875%, 1/1/23 | | | 275,000 | | | | 313,524 | |
7.75%, 7/15/26 | | | 21,016,000 | | | | 23,963,200 | |
7.75%, 5/15/27 | | | 12,848,000 | | | | 14,817,148 | |
7.00%, 12/1/28 | | | 28,225,000 | | | | 31,073,778 | |
DowDuPont Inc.
7.375%, 11/1/29 | | | 69,100,000 | | | | 92,123,852 | |
9.40%, 5/15/39 | | | 153,811,000 | | | | 262,742,610 | |
5.25%, 11/15/41 | | | 37,853,000 | | | | 44,046,278 | |
FedEx Corp.
8.00%, 1/15/19 | | | 16,875,000 | | | | 17,858,945 | |
Ford Motor Credit Co. LLC(d)
2.681%, 1/9/20 | | | 110,925,000 | | | | 111,186,709 | |
8.125%, 1/15/20 | | | 7,091,000 | | | | 7,854,426 | |
5.75%, 2/1/21 | | | 192,923,000 | | | | 209,435,411 | |
5.875%, 8/2/21 | | | 162,085,000 | | | | 177,968,789 | |
3.219%, 1/9/22 | | | 30,125,000 | | | | 30,307,123 | |
Imperial Brands PLC (United Kingdom)
3.75%, 7/21/22(b) | | | 124,595,000 | | | | 128,740,834 | |
4.25%, 7/21/25(b) | | | 499,413,000 | | | | 523,533,519 | |
Kinder Morgan, Inc.
4.30%, 6/1/25 | | | 119,770,000 | | | | 124,727,864 | |
6.50%, 2/1/37 | | | 50,861,000 | | | | 59,483,181 | |
6.95%, 1/15/38 | | | 92,139,000 | | | | 114,485,795 | |
6.50%, 9/1/39 | | | 72,546,000 | | | | 85,559,615 | |
5.00%, 8/15/42 | | | 57,054,000 | | | | 57,908,603 | |
5.00%, 3/1/43 | | | 71,101,000 | | | | 72,114,835 | |
5.50%, 3/1/44 | | | 80,632,000 | | | | 85,821,424 | |
5.40%, 9/1/44 | | | 66,004,000 | | | | 69,727,833 | |
Macy’s, Inc.
6.65%, 7/15/24 | | | 52,526,000 | | | | 57,576,033 | |
7.00%, 2/15/28 | | | 24,800,000 | | | | 26,759,823 | |
| | | | | | | | |
| | |
| | | PAR VALUE | | | VALUE | |
6.70%, 9/15/28 | | $ | 34,115,000 | | | $ | 36,243,960 | |
6.90%, 4/1/29 | | | 81,337,000 | | | | 85,806,139 | |
6.70%, 7/15/34 | | | 77,960,000 | | | | 81,551,398 | |
4.50%, 12/15/34 | | | 154,923,000 | | | | 131,640,962 | |
6.375%, 3/15/37 | | | 21,354,000 | | | | 21,763,172 | |
Naspers, Ltd. (South Africa)
6.00%, 7/18/20(b) | | | 220,010,000 | | | | 236,194,816 | |
5.50%, 7/21/25(b) | | | 257,875,000 | | | | 280,817,623 | |
4.85%, 7/6/27(b) | | | 71,502,000 | | | | 74,141,568 | |
Nordstrom, Inc.
6.95%, 3/15/28 | | | 20,107,000 | | | | 22,783,136 | |
RELX PLC (United Kingdom)
8.625%, 1/15/19 | | | 28,613,000 | | | | 30,331,726 | |
3.125%, 10/15/22 | | | 144,337,000 | | | | 145,419,367 | |
Telecom Italia SPA (Italy)
6.999%, 6/4/18 | | | 165,232,000 | | | | 168,280,530 | |
7.175%, 6/18/19 | | | 200,711,000 | | | | 213,004,549 | |
5.303%, 5/30/24(b) | | | 235,732,000 | | | | 251,643,910 | |
7.20%, 7/18/36 | | | 53,458,000 | | | | 66,421,565 | |
7.721%, 6/4/38 | | | 139,877,000 | | | | 180,441,330 | |
TransCanada Corp. (Canada)
5.625%, 5/20/75(a)(f) | | | 237,639,000 | | | | 250,115,047 | |
5.875%, 8/15/76(a)(f) | | | 76,814,000 | | | | 83,151,155 | |
5.30%, 3/15/77(a)(f) | | | 189,486,000 | | | | 195,407,437 | |
Twenty-First Century Fox, Inc.
6.20%, 12/15/34 | | | 14,795,000 | | | | 19,093,466 | |
6.40%, 12/15/35 | | | 49,525,000 | | | | 65,773,670 | |
6.15%, 3/1/37 | | | 31,905,000 | | | | 41,755,573 | |
6.65%, 11/15/37 | | | 79,075,000 | | | | 108,685,342 | |
6.15%, 2/15/41 | | | 44,858,000 | | | | 59,505,170 | |
Ultrapar Participacoes SA (Brazil)
5.25%, 10/6/26(b) | | | 153,400,000 | | | | 156,194,948 | |
Union Pacific Corp.
7.60%, 1/2/20 | | | 387,688 | | | | 420,641 | |
6.061%, 1/17/23 | | | 3,853,811 | | | | 4,098,659 | |
4.698%, 1/2/24 | | | 2,550,358 | | | | 2,686,966 | |
5.082%, 1/2/29 | | | 6,258,160 | | | | 6,779,896 | |
5.866%, 7/2/30 | | | 38,608,115 | | | | 43,528,805 | |
6.176%, 1/2/31 | | | 33,611,783 | | | | 38,906,311 | |
Verizon Communications, Inc.
4.272%, 1/15/36 | | | 166,472,000 | | | | 165,491,763 | |
4.522%, 9/15/48 | | | 208,601,000 | | | | 205,211,140 | |
5.012%, 4/15/49 | | | 422,976,000 | | | | 443,215,025 | |
Xerox Corp.
6.35%, 5/15/18 | | | 37,981,000 | | | | 38,532,386 | |
5.625%, 12/15/19 | | | 87,407,000 | | | | 91,906,552 | |
2.75%, 9/1/20 | | | 22,690,000 | | | | 22,422,210 | |
4.50%, 5/15/21 | | | 63,744,000 | | | | 66,597,221 | |
4.07%, 3/17/22 | | | 2,349,000 | | | | 2,371,328 | |
Zoetis, Inc.
3.45%, 11/13/20 | | | 39,377,000 | | | | 40,303,908 | |
4.50%, 11/13/25 | | | 166,139,000 | | | | 181,029,994 | |
| | | | | | | | |
| | | | | | | 10,889,039,697 | |
Utilities: 1.4% | |
Dominion Energy, Inc.
2.962%, 7/1/19 | | | 10,000,000 | | | | 10,076,472 | |
4.104%, 4/1/21 | | | 97,451,000 | | | | 101,402,844 | |
5.75%, 10/1/54(a)(f) | | | 232,036,000 | | | | 250,598,880 | |
Enel SPA (Italy)
6.80%, 9/15/37(b) | | | 159,830,000 | | | | 213,594,664 | |
6.00%, 10/7/39(b) | | | 142,387,000 | | | | 177,035,196 | |
| | | | | | | | |
| | | | | | | 752,708,056 | |
| | | | | | | | |
| | | | | | | 18,646,502,936 | |
| | | | | | | | |
TOTAL DEBT SECURITIES
(Cost $51,204,219,992) | | | | | | $ | 52,605,365,674 | |
| | |
| PAGE 12 § DODGE & COX INCOME FUND | | See accompanying Notes to Financial Statements |
| | | | |
| PORTFOLIO OF INVESTMENTS | | | December 31, 2017 | |
| | | | | | | | |
|
| SHORT-TERM INVESTMENTS: 2.6% | |
| | |
| | | SHARES/
PAR VALUE | | | VALUE | |
COMMERCIAL PAPER: 0.7% | |
Anthem, Inc.
1/23/18(b) | | $ | 75,000,000 | | | $ | 74,935,833 | |
2/2/18(b) | | | 21,750,000 | | | | 21,722,933 | |
Dominion Energy, Inc.
1/19/18(b) | | | 46,750,000 | | | | 46,714,236 | |
1/29/18(b) | | | 63,500,000 | | | | 63,423,447 | |
Mondelez International, Inc.
2/2/18(b) | | | 175,250,000 | | | | 175,012,136 | |
| | | | | | | | |
| | | | | | | 381,808,585 | |
REPURCHASE AGREEMENT: 1.8% | |
Fixed Income Clearing Corporation(c)
0.80%, dated 12/29/17, due 1/2/18, maturity value $949,272,372 | | | 949,188,000 | | | | 949,188,000 | |
|
MONEY MARKET FUND: 0.1% | |
State Street Institutional Treasury Plus Money Market Fund | | | 54,298,781 | | | | 54,298,781 | |
| | | | | | | | |
TOTAL SHORT-TERM INVESTMENTS
(Cost $1,385,295,366) | | | $ | 1,385,295,366 | |
| | | | | | | | |
TOTAL INVESTMENTS
(Cost $52,589,515,358) | | | 99.5 | % | | $ | 53,990,661,040 | |
OTHER ASSETS LESS LIABILITIES | | | 0.5 | % | | | 296,099,218 | |
| | | | | | | | |
| NET ASSETS | | | 100.0 | % | | $ | 54,286,760,258 | |
| | | | | | | | |
| (b) | Security exempt from registration under Rule 144A of the Securities Act of 1933. The security may be resold in transactions exempt from registration, normally to qualified institutional buyers. As of December 31, 2017, all such securities in total represented $6,480,044,720 or 11.9% of net assets. These securities have been deemed liquid by Dodge & Cox, investment manager, pursuant to procedures approved by the Fund’s Board of Trustees. |
| (c) | Repurchase agreement is collateralized by U.S. Treasury Notes 1.875%-7.25%, 4/30/22-10/31/22 and U.S. Treasury Inflation Indexed 0.125%, 4/15/22-7/15/22. Total collateral value is $968,179,830. |
| (d) | Subsidiary (see below) |
| (e) | Variable rate security: interest rate is determined by the interest rates of underlying pool of assets that collateralize the security. The interest rate of the security may change due to a change in the interest rates or the composition of underlying pool of assets. The interest rate shown is the rate as of period end. |
| (f) | Variable rate security: fixed-to-float security pays an initial fixed interest rate and will pay a floating interest rate established at a predetermined time in the future. The interest rate shown is the rate as of period end. |
Debt securities are grouped by parent company unless otherwise noted. Actual securities may be issued by the listed parent company or one of its subsidiaries. In determining a parent company’s country designation, the Fund generally references the country of incorporation.
ARM: Adjustable Rate Mortgage
CMBS: Commercial Mortgage-Backed Security
CMO: Collateralized Mortgage Obligation
CMT: Constant Maturity Treasury
DUS: Delegated Underwriting and Servicing
GO: General Obligation
RB: Revenue Bond
REMIC: Real Estate Mortgage Investment Conduit
FUTURES CONTRACTS
| | | | | | | | | | | | | | | | |
| Description | | Number of
Contracts | | | Expiration
Date | | | Notional
Amount | | | Value /
Unrealized
Appreciation
(Depreciation) | |
10 Year U.S. Treasury Note—Short Position | | | 3,517 | | | | Mar 2018 | | | $ | (436,272,859 | ) | | $ | 2,779,852 | |
Ultra Long Term U.S. Treasury Bond—Short Position | | | 1,922 | | | | Mar 2018 | | | | (322,235,313 | ) | | | (1,539,775 | ) |
| | | | | | | | | | | | | | | | |
| | | | | | | | | | | | | | $ | 1,240,077 | |
| | | | | | | | | | | | | | | | |
| | |
| See accompanying Notes to Financial Statements | | DODGE & COX INCOME FUND §PAGE 13 |
| | | | |
STATEMENT OF ASSETS AND LIABILITIES | |
| |
| | | December 31, 2017 | |
ASSETS: | | | | |
Investments in securities, at value (cost $52,589,515,358) | | $ | 53,990,661,040 | |
Deposits with broker for futures contracts | | | 10,804,553 | |
Receivable for investments sold | | | 33,168,943 | |
Receivable for Fund shares sold | | | 63,057,887 | |
Interest receivable | | | 375,929,410 | |
Prepaid expenses and other assets | | | 259,478 | |
| | | | |
| | | 54,473,881,311 | |
| | | | |
LIABILITIES: | | | | |
Payable for variation margin for futures contracts | | | 1,555,283 | |
Payable for Fund shares redeemed | | | 164,004,240 | |
Management fees payable | | | 18,359,350 | |
Accrued expenses | | | 3,202,180 | |
| | | | |
| | | 187,121,053 | |
| | | | |
NET ASSETS | | $ | 54,286,760,258 | |
| | | | |
NET ASSETS CONSIST OF: | | | | |
Paid in capital | | $ | 52,744,467,279 | |
Undistributed net investment income | | | 18,087,643 | |
Undistributed net realized gain | | | 121,819,577 | |
Net unrealized appreciation | | | 1,402,385,759 | |
| | | | |
| | $ | 54,286,760,258 | |
| | | | |
Fund shares outstanding (par value $0.01 each, unlimited shares authorized) | | | 3,944,162,976 | |
Net asset value per share | | $ | 13.76 | |
|
STATEMENT OF OPERATIONS | |
| |
| | | Year Ended
December 31, 2017 | |
INVESTMENT INCOME: | | | | |
Dividends | | $ | 28,952,405 | |
Interest | | | 1,593,092,442 | |
| | | | |
| | | 1,622,044,847 | |
| | | | |
EXPENSES: | | | | |
Management fees | | | 201,181,006 | |
Custody and fund accounting fees | | | 751,800 | |
Transfer agent fees | | | 8,301,507 | |
Professional services | | | 193,625 | |
Shareholder reports | | | 1,538,745 | |
Registration fees | | | 1,243,103 | |
Trustees’ fees | | | 280,416 | |
Miscellaneous | | | 839,944 | |
| | | | |
| | | 214,330,146 | |
| | | | |
NET INVESTMENT INCOME | | | 1,407,714,701 | |
| | | | |
REALIZED AND UNREALIZED GAIN (LOSS): | | | | |
Net realized gain (loss) | | | | |
Investments in securities | | | 309,542,730 | |
Futures contracts | | | (71,177,652 | ) |
Net change in unrealized appreciation/depreciation | | | | |
Investments in securities | | | 510,829,588 | |
Futures contracts | | | (12,355,215 | ) |
| | | | |
Net realized and unrealized gain | | | 736,839,451 | |
| | | | |
NET CHANGE IN NET ASSETS
FROM OPERATIONS | | $ | 2,144,554,152 | |
| | | | |
| | | | | | | | |
STATEMENT OF CHANGES IN NET ASSETS | |
| | |
| | | Year Ended December 31, 2017 | | | Year Ended
December 31, 2016 | |
OPERATIONS: | | | | | | | | |
Net investment income | | $ | 1,407,714,701 | | | $ | 1,412,514,115 | |
Net realized gain | | | 238,365,078 | | | | 179,878,274 | |
Net change in unrealized appreciation/depreciation | | | 498,474,373 | | | | 843,698,150 | |
| | | | | | | | |
| | | 2,144,554,152 | | | | 2,436,090,539 | |
| | | | | | | | |
| | |
DISTRIBUTIONS TO SHAREHOLDERS FROM: | | | | | | | | |
Net investment income | | | (1,404,908,219 | ) | | | (1,410,152,555 | ) |
Net realized gain | | | (140,759,824 | ) | | | (62,011,941 | ) |
| | | | | | | | |
Total distributions | | | (1,545,668,043 | ) | | | (1,472,164,496 | ) |
| | | | | | | | |
| | |
FUND SHARE
TRANSACTIONS: | | | | | | | | |
Proceeds from sale of shares | | | 14,912,910,845 | | | | 11,299,892,007 | |
Reinvestment of distributions | | | 1,266,629,663 | | | | 1,208,984,389 | |
Cost of shares redeemed | | | (9,124,121,824 | ) | | | (9,965,599,733 | ) |
| | | | | | | | |
Net change from Fund share transactions | | | 7,055,418,684 | | | | 2,543,276,663 | |
| | | | | | | | |
Total change in net assets | | | 7,654,304,793 | | | | 3,507,202,706 | |
| | |
NET ASSETS: | | | | | | | | |
Beginning of year | | | 46,632,455,465 | | | | 43,125,252,759 | |
| | | | | | | | |
End of year (including undistributed net investment income of $18,087,643 and $15,281,161, respectively) | | $ | 54,286,760,258 | | | $ | 46,632,455,465 | |
| | | | | | | | |
| | |
SHARE INFORMATION: | | | | | | | | |
Shares sold | | | 1,083,349,260 | | | | 830,115,244 | |
Distributions reinvested | | | 92,213,550 | | | | 88,916,899 | |
Shares redeemed | | | (663,262,463 | ) | | | (732,099,399 | ) |
| | | | | | | | |
Net change in shares outstanding | | | 512,300,347 | | | | 186,932,744 | |
| | | | | | | | |
| | |
| PAGE 14 § DODGE & COX INCOME FUND | | See accompanying Notes to Financial Statements |
NOTES TO FINANCIAL STATEMENTS
NOTE 1—ORGANIZATION AND SIGNIFICANT ACCOUNTING POLICIES
Dodge & Cox Income Fund (the “Fund”) is one of the series constituting the Dodge & Cox Funds (the “Trust” or the “Funds”). The Trust is organized as a Delaware statutory trust and is registered under the Investment Company Act of 1940, as amended, as an open-end management investment company. The Fund commenced operations on January 3, 1989, and seeks high and stable current income consistent with long-term preservation of capital. Risk considerations and investment strategies of the Fund are discussed in the Fund’s Prospectus.
The financial statements have been prepared in conformity with accounting principles generally accepted in the United States of America, which require the use of estimates and assumptions by management. Actual results may differ from those estimates. Significant accounting policies are as follows:
Security valuation The Fund’s net assets are normally valued as of the scheduled close of trading on the New York Stock Exchange (NYSE), generally 4:00 p.m. Eastern Time, each day that the NYSE is open for business.
Debt securities and derivatives traded over the counter are valued using prices received from independent pricing services which utilize dealer quotes, recent transaction data, pricing models, and other inputs to arrive at market-based valuations. Pricing models may consider quoted prices for similar securities, interest rates, cash flows (including prepayment speeds), and credit risk. Exchange-traded derivatives are valued at the settlement price determined by the relevant exchange. Short-term securities less than 60 days to maturity may be valued at amortized cost if amortized cost approximates current value. Mutual funds are valued at their respective net asset values. Security values are not discounted based on the size of the Fund’s position and may differ from the value a Fund receives upon sale of the securities. All securities held by the Fund are denominated in U.S. dollars.
If market quotations are not readily available or if normal valuation procedures produce valuations that are deemed unreliable or inappropriate under the circumstances existing at the time, the investment will be valued at fair value as determined in good faith by or under the direction of the Fund’s Board of Trustees. The Board of Trustees has appointed Dodge & Cox, the Fund’s investment manager, to make fair value determinations in accordance with the Dodge & Cox Funds Valuation Policies (“Valuation Policies”), subject to Board oversight. Dodge & Cox has established a Pricing Committee that is comprised of representatives from Treasury, Legal, Compliance, and Operations. The Pricing Committee is responsible for implementing the Valuation Policies, including determining the fair value of securities and other investments when necessary. The Pricing Committee considers relevant indications of value that are reasonably available to it in determining the fair value assigned to a particular security, such as the value of similar financial instruments, trading volumes, contractual restrictions on disposition, related corporate actions, and changes in economic conditions. In doing so, the Pricing Committee employs various
methods for calibrating fair valuation approaches, including a regular review of key inputs and assumptions, back-testing, and review of any related market activity.
Valuing securities through a fair value determination involves greater reliance on judgment than valuation of securities based on readily available market quotations. In some instances, lack of information and uncertainty as to the significance of information may lead to a conclusion that a prior valuation is the best indication of a security’s value. When fair value pricing is employed, the prices of securities used by the Fund to calculate its net asset value may differ from quoted or published prices for the same securities.
Security transactions, investment income, expenses, and distributions Security transactions are recorded on the trade date. Realized gains and losses on securities sold are determined on the basis of identified cost.
Interest income is recorded on the accrual basis. Interest income includes coupon interest, amortization of premium and accretion of discount on debt securities, and gain/loss on paydowns. The ability of the issuers of the debt securities held by the Fund to meet their obligations may be affected by economic developments in a specific industry, state, or region. Debt obligations may be placed on non-accrual status and related interest income may be reduced by ceasing current accruals and writing off interest receivables when the collection of all or a portion of interest has become doubtful. A debt obligation is removed from non-accrual status when the issuer resumes interest payments or when collectibility of interest is reasonably assured. Dividend income is recorded on the ex-dividend date.
Expenses are recorded on the accrual basis. Some expenses of the Trust can be directly attributed to a specific series. Expenses which cannot be directly attributed are allocated among the Funds in the Trust using methodologies determined by the nature of the expense.
Distributions to shareholders are recorded on the ex-dividend date.
Repurchase agreements Repurchase agreements are transactions under which a Fund purchases a security from a dealer counterparty and agrees to resell the security to that counterparty on a specified future date at the same price, plus a specified interest rate. The Fund’s repurchase agreements are secured by U.S. government or agency securities. It is the Fund’s policy that its custodian take possession of the underlying collateral securities, the fair value of which exceeds the principal amount of the repurchase transaction, including accrued interest, at all times. In the event of default by the counterparty, the Fund has the contractual right to liquidate the securities and to apply the proceeds in satisfaction of the obligation.
Futures contracts Futures contracts involve an obligation to purchase or sell (depending on whether the Fund has entered a long or short futures contract, respectively) an asset at a future date, at a price set at the time of the contract. Upon entering into a futures contract, the Fund is required to deposit an amount of cash or liquid assets (referred to as initial margin) in a segregated account with the clearing broker. Subsequent payments (referred
DODGE & COX INCOME FUND §PAGE 15
NOTES TO FINANCIAL STATEMENTS
to as variation margin) to and from the clearing broker are made on a daily basis based on changes in the market value of futures contracts. Futures contracts are traded publicly and their market value changes daily. Changes in the market value of open futures contracts are recorded as unrealized appreciation or depreciation in the Statement of Operations. Realized gains and losses on futures contracts are recorded in the Statement of Operations at the closing or expiration of the contracts. Cash deposited with a broker as initial margin is recorded in the Statement of Assets and Liabilities. A receivable and/or payable to brokers for daily variation margin is also recorded in the Statement of Assets and Liabilities.
Investments in futures contracts may include certain risks, which may be different from, and potentially greater than, those of the underlying securities. To the extent the Fund uses futures, it is exposed to additional volatility and potential losses resulting from leverage.
The Fund has maintained short Treasury futures contracts to assist with the management of the portfolio’s interest rate exposure. During the year ended December 31, 2017, these Treasury futures contracts had notional values ranging from 1% to 6% of net assets.
Indemnification Under the Trust’s organizational documents, its officers and trustees are indemnified against certain liabilities arising out of the performance of their duties to the Trust. In addition, in the normal course of business the Trust enters into contracts that provide general indemnities to other parties. The Trust’s maximum exposure under these arrangements is unknown as this would involve future claims that may be made against the Trust that have not yet occurred.
NOTE 2—VALUATION MEASUREMENTS
Various inputs are used in determining the value of the Fund’s investments. These inputs are summarized in the three broad levels listed below.
| § | | Level 1: Quoted prices in active markets for identical securities |
| § | | Level 2: Other significant observable inputs (including quoted prices for similar securities, market indices, interest rates, credit risk, forward exchange rates, etc.) |
| § | | Level 3: Significant unobservable inputs (including Fund management’s assumptions in determining the fair value of investments) |
The inputs or methodology used for valuing securities are not necessarily an indication of the risk associated with investing in those securities.
The following is a summary of the inputs used to value the Fund’s holdings at December 31, 2017:
| | | | | | | | |
| Classification(a) | | LEVEL 1 (Quoted Prices) | | | LEVEL 2 (Other Significant Observable Inputs) | |
Securities | | | | | | | | |
Debt Securities | | | | | | | | |
U.S. Treasury | | $ | — | | | $ | 10,577,023,655 | |
Government-Related | | | — | | | | 3,780,208,583 | |
Securitized | | | — | | | | 19,601,630,500 | |
Corporate | | | — | | | | 18,646,502,936 | |
Short-term Investments | | | | | | | | |
Commercial Paper | | | — | | | | 381,808,585 | |
Repurchase Agreement | | | — | | | | 949,188,000 | |
Money Market Fund | | | 54,298,781 | | | | — | |
| | | | | | | | |
Total Securities | | $ | 54,298,781 | | | $ | 53,936,362,259 | |
| | | | | | | | |
Other Investments | | | | | | | | |
Futures Contracts | | | | | | | | |
Appreciation | | $ | 2,779,852 | | | $ | — | |
Depreciation | | | (1,539,775 | ) | | | — | |
| | | | | | | | | |
| (a) | There were no transfers between Level 1 and Level 2 during the year ended December 31, 2017. There were no Level 3 securities at December 31, 2017 and 2016, and there were no transfers to Level 3 during the year. |
NOTE 3—RELATED PARTY TRANSACTIONS
Management fees Under a written agreement approved by a unanimous vote of the Board of Trustees, the Fund pays a management fee monthly at an annual rate of 0.50% of the Fund’s average daily net assets up to $100 million and 0.40% of the Fund’s average daily net assets in excess of $100 million to Dodge & Cox, investment manager of the Fund. The agreement further provides that Dodge & Cox shall waive its fee to the extent that such fee plus all other ordinary operating expenses of the Fund exceed 1% of the average daily net assets for the year.
Fund officers and trustees All officers and two of the trustees of the Trust are officers or employees of Dodge & Cox. The Trust pays a fee only to those trustees who are not affiliated with Dodge & Cox.
NOTE 4—INCOME TAX INFORMATION AND DISTRIBUTIONS TO SHAREHOLDERS
A provision for federal income taxes is not required since the Fund intends to continue to qualify as a regulated investment company under Subchapter M of the Internal Revenue Code and distribute all of its taxable income to shareholders. Distributions are determined in accordance with income tax regulations, and such amounts may differ from net investment income and realized gains for financial reporting purposes. Financial reporting records are adjusted for permanent book to tax differences at year end to reflect tax character.
Book to tax differences are primarily due to differing treatments of wash sales, net short-term realized gain (loss), derivatives, and Treasury Inflation-Protected Securities. At December 31, 2017, the cost of investments in securities and derivatives for federal income tax purposes was $52,591,193,948.
PAGE 16 § DODGE & COX INCOME FUND
NOTES TO FINANCIAL STATEMENTS
Distributions during the years noted below were characterized as follows for federal income tax purposes:
| | | | | | | | |
| | | Year Ended December 31, 2017 | | | Year Ended December 31, 2016 | |
Ordinary income | | $ | 1,404,908,219 | | | $ | 1,410,152,555 | |
| | ($ | 0.380 per share | ) | | ($ | 0.422 per share | ) |
Long-term capital gain | | $ | 140,759,824 | | | $ | 62,011,941 | |
| | ($ | 0.037 per share | ) | | ($ | 0.019 per share | ) |
At December 31, 2017, the tax basis components of distributable earnings were as follows:
| | | | |
Unrealized appreciation | | $ | 1,688,694,291 | |
Unrealized depreciation | | | (287,987,122 | ) |
| | | | |
Net unrealized appreciation | | | 1,400,707,169 | |
Undistributed ordinary income | | | 18,241,722 | |
Undistributed long-term capital gain | | | 123,344,088 | |
| | | | | |
Fund management has reviewed the tax positions for open periods (three years and four years, respectively, from filing the Fund’s Federal and State tax returns) as applicable to the Fund, and has determined that no provision for income tax is required in the Fund’s financial statements.
NOTE 5—LOAN FACILITIES
Pursuant to an exemptive order issued by the Securities and Exchange Commission (SEC), the Fund may participate in an interfund lending facility (Facility). The Facility allows the Fund to borrow money from or loan money to the Funds. Loans under the Facility are made for temporary or emergency purposes, such as to fund shareholder redemption requests. Interest on borrowings is the average of the current repurchase agreement rate and the bank loan rate. There was no activity in the Facility during the year.
All Funds in the Trust participate in a $500 million committed credit facility (Line of Credit) with State Street Bank and Trust Company, to be utilized for temporary or emergency purposes to fund shareholder redemptions or for other short-term liquidity purposes. The maximum amount available to the Fund is $250 million. Each Fund pays an annual commitment fee on its pro-rata portion of the Line of Credit. For the year ended December 31, 2017, the Fund’s commitment fee amounted to $310,989 and is reflected as a Miscellaneous Expense in the Statement of Operations. Interest on borrowings is charged at the prevailing rate. There were no borrowings on the Line of Credit during the year.
NOTE 6—PURCHASES AND SALES OF INVESTMENTS
For the year ended December 31, 2017, purchases and sales of securities, other than short-term securities and U.S. government securities, aggregated $3,555,045,411 and $3,917,623,132, respectively. For the year ended December 31, 2017, purchases and sales of U.S. government securities aggregated $12,814,074,438 and $5,623,433,104, respectively.
NOTE 7—NEW ACCOUNTING GUIDANCE
In March 2017, the Financial Accounting Standards Board issued an update to amend the amortization period for certain purchased callable debt securities held at a premium. The amendments shorten the amortization period for premiums to the earliest call date, but do not require an accounting change for securities held at a discount. The amendments are effective for financial statements for fiscal years beginning after December 15, 2018, and interim periods within those fiscal years. Management is evaluating the impact, if any, of this guidance on the Fund’s financial statements and disclosures.
NOTE 8—SUBSEQUENT EVENTS
Fund management has determined that no material events or transactions occurred subsequent to December 31, 2017, and through the date of the Fund’s financial statements issuance, which require additional disclosure in the Fund’s financial statements.
DODGE & COX INCOME FUND §PAGE 17
FINANCIAL HIGHLIGHTS
| | | | | | | | | | | | | | | | | | | | |
SELECTED DATA AND RATIOS (for a share outstanding throughout each year) | | Year Ended December 31, | |
| | | 2017 | | | 2016 | | | 2015 | | | 2014 | | | 2013 | |
| | | | |
Net asset value, beginning of year | | | $13.59 | | | | $13.29 | | | | $13.78 | | | | $13.53 | | | | $13.86 | |
Income from investment operations: | | | | | | | | | | | | | | | | | | | | |
Net investment income | | | 0.38 | | | | 0.42 | | | | 0.40 | | | | 0.39 | | | | 0.42 | |
Net realized and unrealized gain (loss) | | | 0.21 | | | | 0.32 | | | | (0.48 | ) | | | 0.35 | | | | (0.33 | ) |
| | | | |
Total from investment operations | | | 0.59 | | | | 0.74 | | | | (0.08 | ) | | | 0.74 | | | | 0.09 | |
| | | | |
Distributions to shareholders from: | | | | | | | | | | | | | | | | | | | | |
Net investment income | | | (0.38 | ) | | | (0.42 | ) | | | (0.40 | ) | | | (0.39 | ) | | | (0.42 | ) |
Net realized gain | | | (0.04 | ) | | | (0.02 | ) | | | (0.01 | ) | | | (0.10 | ) | | | — | |
| | | | |
Total distributions | | | (0.42 | ) | | | (0.44 | ) | | | (0.41 | ) | | | (0.49 | ) | | | (0.42 | ) |
| | | | |
Net asset value, end of year | | | $13.76 | | | | $13.59 | | | | $13.29 | | | | $13.78 | | | | $13.53 | |
| | | | |
Total return | | | 4.36 | % | | | 5.62 | % | | | (0.59 | )% | | | 5.48 | % | | | 0.64 | % |
Ratios/supplemental data: | | | | | | | | | | | | | | | | | | | | |
Net assets, end of year (millions) | | | $54,287 | | | | $46,632 | | | | $43,125 | | | | $39,128 | | | | $24,654 | |
Ratios of expenses to average net assets | | | 0.43 | % | | | 0.43 | % | | | 0.43 | % | | | 0.44 | % | | | 0.43 | % |
Ratios of net investment income to average net assets | | | 2.80 | % | | | 3.11 | % | | | 2.97 | % | | | 2.89 | % | | | 3.00 | % |
Portfolio turnover rate | | | 19 | % | | | 27 | % | | | 24 | % | | | 27 | % | | | 38 | % |
See accompanying Notes to Financial Statements
REPORT OF INDEPENDENT REGISTERED PUBLIC ACCOUNTING FIRM
To the Board of Trustees of the Dodge & Cox Funds and Shareholders of Dodge & Cox Income Fund
Opinion on the Financial Statements
We have audited the accompanying statement of assets and liabilities, including the portfolio of investments, of Dodge & Cox Income Fund (one of the funds constituting Dodge & Cox Funds, referred to hereafter as the “Fund”) as of December 31, 2017, the related statement of operations for the year ended December 31, 2017, the statement of changes in net assets for each of the two years in the period ended December 31, 2017, including the related notes, and the financial highlights for each of the five years in the period ended December 31, 2017 (collectively referred to as the “financial statements”). In our opinion, the financial statements present fairly, in all material respects, the financial position of the Fund as of December 31, 2017, the results of its operations for the year then ended, the changes in its net assets for each of the two years in the period ended December 31, 2017 and the financial highlights for each of the five years in the period ended December 31, 2017 in conformity with accounting principles generally accepted in the United States of America.
Basis for Opinion
These financial statements are the responsibility of the Fund’s management. Our responsibility is to express an opinion on the Fund’s financial statements based on our audits. We are a public accounting firm registered with the Public Company Accounting Oversight Board (United States) (“PCAOB”) and are required to be independent with respect to the Fund in accordance with the U.S. federal securities laws and the applicable rules and regulations of the Securities and Exchange Commission and the PCAOB.
We conducted our audits of these financial statements in accordance with the standards of the PCAOB. Those standards require that we plan and perform the audit to obtain reasonable assurance about whether the financial statements are free of material misstatement, whether due to error or fraud.
Our audits included performing procedures to assess the risks of material misstatement of the financial statements, whether due to error or fraud, and performing procedures that respond to those risks. Such procedures included examining, on a test basis, evidence regarding the amounts and disclosures in the financial statements. Our audits also included evaluating the accounting principles used and significant estimates made by management, as well as evaluating the overall presentation of the financial statements. Our procedures included confirmation of securities owned as of December 31, 2017 by correspondence with the custodian, transfer agent and brokers. We believe that our audits provide a reasonable basis for our opinion.
PricewaterhouseCoopers LLP
San Francisco, California
February 16, 2018
We have served as the auditor of one or more investment companies in the Dodge & Cox Funds since 1931.
PAGE 18 § DODGE & COX INCOME FUND
BOARD APPROVAL OF FUNDS’ INVESTMENT MANAGEMENT AGREEMENTS AND MANAGEMENT FEES
(unaudited)
The Board of Trustees is responsible for overseeing the performance of the Dodge & Cox Funds’ investment manager and determining whether to continue the Investment Management Agreements between the Funds and Dodge & Cox each year (the “Agreements”). At a meeting of the Board of Trustees of the Trust held on December 14, 2017, the Trustees, by a unanimous vote (including a separate vote of those Trustees who are not “interested persons” (as defined in the Investment Company Act of 1940) (the “Independent Trustees”)), approved the renewal of the Agreements for an additional one-year term through December 31, 2018 with respect to each Fund. During the course of the year, the Board received extensive information and materials relating to the investment management and administrative services provided by Dodge & Cox and the performance of each of the Funds.
INFORMATION RECEIVED
In 2016 and 2017, the Board requested, received, and discussed a number of special presentations on topics relevant to their consideration of the proposed renewal of the Funds’ Agreements. In addition to the foregoing and in advance of the meetings referred to below, the Board, including the Independent Trustees, requested, received, and reviewed materials relating to the Agreements and the services provided by Dodge & Cox. The Independent Trustees retained Morningstar to prepare an independent expense and performance summary for each Fund and comparable funds managed by other advisers identified by Morningstar. The Morningstar materials included information regarding advisory fee rates, expense ratios, and transfer agency, custodial, and distribution expenses, as well as performance comparisons to each Fund’s peer group and to a broad-based securities index or combination of indices. The Morningstar materials also included a comparison of expenses of various share classes offered by comparable funds. The materials reviewed by the Board contained information concerning, among other things, Dodge & Cox’s profitability, financial results and condition, advisory fee revenue, and separate account fee schedules. The Board additionally considered the Funds’ brokerage commissions, turnover rates, sales and redemption data, and the significant investment that Dodge & Cox makes in research used in managing the Funds. The Board received and reviewed memoranda and related materials addressing, among other things, Dodge & Cox’s services to the Funds; how Dodge & Cox Funds’ fees compare to fees of peer group funds; the different fees, services, costs, and risks associated with other accounts managed by Dodge & Cox as compared to the Dodge & Cox Funds; and the ways in which the Funds realize economies of scale. Throughout the process of reviewing the services provided by Dodge & Cox and preparing for the meeting, the Independent Trustees found Dodge & Cox to be open, forthright, detailed, and very helpful in answering questions about all issues. The Board received copies of the Agreements and a memorandum from the independent legal counsel to the
Independent Trustees discussing the factors generally regarded as appropriate to consider in evaluating advisory arrangements. The Trust’s Contract Review Committee, consisting solely of Independent Trustees, met with the independent legal counsel on November 9, 2017 and again on December 14, 2017 to discuss whether to renew the Agreements. The Board, including the Independent Trustees, subsequently concluded that the existing Agreements are fair and reasonable and voted to approve the Agreements. In considering the Agreements, the Board, including the Independent Trustees, did not identify any single factor or particular information as all-important or controlling. In reaching the decision to approve the Agreements, the Board considered several factors, discussed below, to be key factors and reached the conclusions described below.
NATURE, QUALITY, AND EXTENT OF THE SERVICES
The Board considered that Dodge & Cox provides a wide range of services to the Funds in addition to portfolio management. The extensive nature of services provided by Dodge & Cox has been documented in materials provided to the Board and in presentations made to the Board throughout the year. In particular, the Board considered the nature, quality, and extent of portfolio management, administrative, and shareholder services performed by Dodge & Cox. With regard to portfolio management services, the Board considered Dodge & Cox’s established long-term history of care and conscientiousness in the management of the Funds; its demonstrated consistency in investment approach and depth; the background and experience of the Dodge & Cox U.S. Equity Investment Committee, International Equity Investment Committee, Global Equity Investment Committee, U.S. Fixed Income Investment Committee, and Global Fixed Income Investment Committee, and research analysts responsible for managing the Funds; Dodge & Cox’s methods for assessing the regulatory and investment climate in various jurisdictions; its overall high level of attention to its core investment management function; and its commitment to the Funds and their shareholders. The Board also considered analysis provided by Morningstar regarding the degree of active management in the Dodge & Cox equity funds and concluded that Dodge & Cox is an active, high conviction manager of equity portfolios, not a “closet index” manager.
In the area of administrative and shareholder services, the Board considered the quality of Dodge & Cox’s work in areas such as compliance, legal services, trading, operations, proxy voting, technology, oversight of the Funds’ transfer agent and custodian/fund accounting agent, tax compliance, risk management, shareholder support, and shareholder communication through its website and other means. The Board also noted Dodge & Cox’s disclosure policy, its compliance record, and its reputation as a trusted, shareholder-friendly mutual fund family.
In addition, the Board considered that Dodge & Cox manages approximately $200 billion in Fund assets with fewer professionals than most comparable funds, and that on average these professionals have more experience and longer tenure than investment professionals at comparable funds. The Board also
DODGE & COX INCOME FUND §PAGE 19
noted that Dodge & Cox is an investment research-oriented firm with no other business endeavors to distract management’s attention from its research efforts or to present material conflicts of interest with the operations of the Funds, that its investment professionals adhere to a consistent investment approach across the Funds, and that due to its careful and deliberate strategy with respect to new products, Dodge & Cox has had remarkable stability in its mutual fund product offerings over the course of the past 87 years and has the fewest funds of any of the 25 largest mutual fund families by assets. The Board further considered the “Gold” analyst rating awarded by Morningstar to all of the Funds (other than the Global Bond Fund). The Board concluded that it was satisfied with the nature, extent, and quality of investment management and other services provided to the Funds by Dodge & Cox.
INVESTMENT PERFORMANCE
The Board considered short-term and long-term investment performance for each Fund (including periods of outperformance or underperformance) as compared to both relevant indices and the performance of such Fund’s peer group. In assessing the performance of the Funds, the Board considered the Funds’ investment returns over various periods and the volatility thereof and concluded that the levels experienced were consistent with Dodge & Cox’s long-term approach and active investment style. The Board determined after extensive review and inquiry that Dodge & Cox’s historic, long-term, team-oriented, bottom-up investment approach remains consistent and that Dodge & Cox continues to be distinguished by its integrity, transparency, and independence. The Board considered that the performance of the Funds is the result of a value-oriented investment management process that emphasizes a long-term investment horizon, comprehensive independent research, a team approach, price discipline, low cost, and low portfolio turnover. The Board also considered that the investment performance delivered by Dodge & Cox to the Funds appeared to be consistent with the relevant performance delivered for other clients of Dodge & Cox. The Board concluded that Dodge & Cox has delivered favorable long-term performance for Fund investors consistent with the long-term investment strategies being pursued by the Funds.
COSTS AND ANCILLARY BENEFITS
Costs of Services to Funds: Fees and Expenses. The Board considered each Fund’s management fee rate and expense ratio relative to each Fund’s peer group and relative to management fees charged by Dodge & Cox to other clients. In particular, the Board considered that the Funds continue to be below their peer group median in expense ratios and that many media and industry reports specifically comment on the low cost of the Funds, which have been a defining characteristic of the Funds for many years. The Board also evaluated the operating structures of the Funds and Dodge & Cox, noting that the Funds do not charge front-end sales commissions or distribution fees, and Dodge & Cox bears, among other things, the significant cost of third party research, reimbursement for shareholder recordkeeping and administrative costs to third-party retirement plan administrators, and administrative and office overhead. The Board noted that expenses are well below industry averages.
When compared to peer group funds, the Funds are in the quartile with the lowest expense ratios. The Board also considered that the Funds receive numerous administrative, regulatory compliance, legal, operational, technology, tax compliance, risk management, and shareholder support services from Dodge & Cox without any additional administrative fee and that the Funds have relatively low transaction costs and portfolio turnover rates. The Board noted the Funds’ unusual single-share-class structure and reviewed Morningstar data (including asset-weighted average expense ratios) showing that the few peer group funds with lower expense ratios often have other share classes with significantly higher expense ratios than the Funds’. In this regard, the Board considered that many of the Funds’ shareholders would not be eligible to purchase comparably priced shares of many peer group funds, which typically make their lower-priced share classes available only to institutional investors. The Board determined that the Funds provide access for small investors to high quality investment management at a relatively low cost. The Board also considered that the Funds are priced to scale, i.e., management fee rates begin at relatively low levels with the result that, even without breakpoints, the Funds’ management fee rates are lower than those of many peer funds whose fee schedules include breakpoints. With respect to non-U.S. funds sponsored and managed by Dodge & Cox that are comparable to the Funds in many respects, the Board noted that the fee rates charged by Dodge & Cox are the same as or higher than the fee rates charged to the Funds.
The Board reviewed information regarding the fee rates Dodge & Cox charges to separate accounts that have investment programs similar to those of the Funds, including instances where separate account fees are lower than Fund fees. The Board considered the significant differences in the nature and scope of services Dodge & Cox provides to the Funds as compared to other client accounts, as well as material differences in regulatory, litigation, and other risks as between Dodge & Cox Funds and other types of clients. The Board noted that different markets exist for mutual fund and institutional separate account management services and that a comparison of Fund fee rates and separate account fee rates must consider the fact that separate account clients bear additional costs and responsibilities that are included in the cost of a Fund. The Board further noted that many sophisticated institutional investors in the Funds that are eligible to open separate accounts at Dodge & Cox have decided for various reasons to invest in the Funds. After consideration of these matters, the Board concluded that the overall costs incurred by the Funds for the services they receive (including the management fee paid to Dodge & Cox) are reasonable and that the fees are acceptable based upon the qualifications, experience, reputation, and performance of Dodge & Cox and the low overall expense ratios of the Funds.
Profitability and Costs of Services to Dodge & Cox; “Fall-out” Benefits. The Board reviewed reports of Dodge & Cox’s financial position, profitability, and estimated overall value and considered Dodge & Cox’s overall profitability within its context as a private, employee-owned S-Corporation
PAGE 20 § DODGE & COX INCOME FUND
and relative to the favorable services provided. The Board noted in particular that Dodge & Cox’s profits are not generated by high fee rates, but reflect an extraordinarily streamlined, efficient, and focused business approach toward investment management.
The Board recognized the importance of Dodge & Cox’s profitability—which is derived solely from management fees and does not include other business ventures—to maintain its independence, stability, company culture and ethics, and management continuity. The Board also considered that the compensation/profit structure at Dodge & Cox includes a return on shareholder employees’ investment in the firm, which is vital for remaining independent and facilitating retention of management and investment professionals. The Board also considered that in January 2015, Dodge & Cox closed the International Stock Fund to new investors to proactively manage the growth of the Fund. The Stock Fund and Balanced Fund were similarly closed to new investors during periods of significant growth in the past. While these actions are intended to benefit existing Fund shareholders, the effect is to reduce potential revenues to Dodge & Cox from new shareholders.
The Board also considered potential “fall-out” benefits (including the receipt of research from unaffiliated brokers and reputational benefits to non-U.S. funds sponsored and managed by Dodge & Cox) that Dodge & Cox might receive as a result of its association with the Funds and determined that they are acceptable. The Board also noted that Dodge & Cox continues to invest substantial sums in its business in order to provide enhanced services, systems, and research capabilities, all of which benefit the Funds. The Board concluded that Dodge & Cox’s profitability is the keystone of its independence, stability, and long-term investment performance and that the profitability of Dodge & Cox’s relationship with the Funds (including fall-out benefits) is fair and reasonable.
ECONOMIES OF SCALE
The Board considered whether there have been economies of scale with respect to the management of each Fund, whether the Funds have appropriately benefited from any economies of scale, and whether the management fee rate is reasonable in relation to the level of Fund assets and any economies of scale that may exist. In the Board’s view, any consideration of economies of scale must take account of the Funds’ low fee and expense structure and of the fact that each Fund’s shareholders have benefited from the Fund’s relatively low fee structure from the time of each Fund’s inception (i.e., from the first dollar). An assessment of economies of scale must also take into account that Dodge & Cox invests significant time and resources in each new Fund for months (and sometimes years) prior to launch; in addition, in a Fund’s early periods of operations, expenses are capped, which means that Dodge & Cox subsidizes the operations of a new Fund for a period of time until it reaches scale. The Board also observed that, while total Fund assets have grown significantly over the long term, this growth has not been continuous or evenly distributed across all of the Funds (for example, the total assets of the Balanced Fund have actually declined over the past ten years).
In addition, the Board noted that Dodge & Cox has shared the benefits of economies of scale with the Funds by adding and enhancing services to the Funds over time, and that Dodge & Cox’s internal costs of providing investment management, technology, administrative, legal, and compliance services to the Funds continue to increase. For example, Dodge & Cox has increased its global research staff and investment resources over the years to add important new capabilities for the benefit of Fund shareholders and to address the increased complexity of investing in multinational and non-U.S. companies. In addition, Dodge & Cox has made substantial expenditures in other staff, technology, and infrastructure to enable it to integrate credit and equity analyses and to implement its strategy in a more effective and secure manner. Over the last ten years, Dodge & Cox has increased its spending on research, investment management, client servicing, cybersecurity, technology, third party research, data services, and computer systems for trading, operations, compliance, accounting, and communications at a rate that has significantly outpaced the Funds’ growth rate during the same period. The Board considered that Dodge & Cox has a history of voluntarily limiting asset growth in several Funds that experienced significant inflows by closing them to new investors in order to protect the Funds’ ability to achieve good investment returns for shareholders. The Board also observed that, even without fee breakpoints, the Funds are competitively priced in a very competitive market and that having a low fee from inception is better for shareholders than starting with a higher fee and adding breakpoints. The Board also noted that there are certain diseconomies of scale associated with managing large funds, insofar as certain of the costs and risks associated with portfolio management increase as assets grow. The Board concluded that the current Dodge & Cox fee structure is fair and reasonable and adequately shares economies of scale that may exist.
CONCLUSION
Based on their evaluation of all material factors and assisted by the advice of independent legal counsel to the Independent Trustees, the Board, including the Independent Trustees, concluded that the advisory fee structure was fair and reasonable, that each Fund was paying a competitive fee for the services provided, that Dodge & Cox’s services have provided value for Fund shareholders over the long term, and that approval of the Agreements was in the best interests of each Fund and its shareholders.
DODGE & COX INCOME FUND §PAGE 21
FUND HOLDINGS
The Fund provides a complete list of its holdings four times each fiscal year, as of the end of each quarter. The Fund files the lists with the Securities and Exchange Commission (SEC) on Form N-CSR (second and fourth quarters) and Form N-Q (first and third quarters). Shareholders may view the Fund’s Forms N-CSR and N-Q on the SEC’s website at sec.gov. Forms N-CSR and N-Q may also be reviewed and copied at the SEC’s Public Reference Room in Washington, DC. Information regarding the operations of the Public Reference Room may be obtained by calling 800-SEC-0330. A list of the Fund’s quarter-end holdings is also available at dodgeandcox.com on or about 15 days following each quarter end and remains available on the web site until the list is updated in the subsequent quarter.
PROXY VOTING
For a free copy of the Fund’s proxy voting policies and procedures, please call 800-621-3979, visit the Fund’s website at dodgeandcox.com, or visit the SEC’s website at sec.gov. Information regarding how the Fund voted proxies relating to portfolio securities during the most recent 12-month period ending June 30 is also available at dodgeandcox.com or at sec.gov.
HOUSEHOLD MAILINGS
The Fund routinely mails shareholder reports and summary prospectuses to shareholders and, on occasion, proxy statements. In order to reduce the volume of mail, when possible, only one copy of these documents will be sent to shareholders who are part of the same family and share the same residential address.
If you have a direct account with the Funds and you do not want the mailing of shareholder reports and summary prospectuses combined with other members in your household, contact the Funds at 800-621-3979. Your request will be implemented within 30 days.
PAGE 22 § DODGE & COX INCOME FUND
DODGE & COX FUNDS—EXECUTIVE OFFICER & TRUSTEE INFORMATION
| | | | | | |
Name (Age) and
Address* | | Position with Trust (Year of Election or
Appointment) | | Principal Occupation During Past 5 Years | | Other Directorships Held by Trustees |
| INTERESTED TRUSTEES AND EXECUTIVE OFFICERS |
| Charles F. Pohl (59) | | Chairman and Trustee (Since 2014) | | Chairman (since 2013) and Director of Dodge & Cox; Chief Investment Officer, member of U.S. Equity Investment Committee (USEIC), Global Equity Investment Committee (GEIC), International Equity Investment Committee (IEIC), and U.S. Fixed Income Investment Committee (USFIIC), Portfolio Manager, and Investment Analyst; Co-President (2011-2013) | | — |
| Dana M. Emery (56) | | President and Trustee (Trustee since 1993) (President since 2014) | | Chief Executive Officer (since 2013), President, and Director of Dodge & Cox; Director of Fixed Income and member of USFIIC and Global Fixed Income Investment Committee (GFIIC); Co-President (2011-2013) | | — |
| Diana S. Strandberg (58) | | Senior Vice President (Since 2006) | | Senior Vice President and Director of Dodge & Cox; Director of International Equity and member of USEIC, GEIC, IEIC and GFIIC; Portfolio Manager and Investment Analyst | | — |
Roberta R.W. Kameda (57) | | Secretary (Since 2017) | | Vice President, General Counsel, and Secretary (since 2017) of Dodge & Cox | | — |
| David H. Longhurst (60) | | Treasurer (Since 2006) | | Vice President and Assistant Treasurer of Dodge & Cox | | — |
| Katherine M. Primas (43) | | Chief Compliance Officer (Since 2010) | | Vice President and Chief Compliance Officer of Dodge & Cox | | — |
| INDEPENDENT TRUSTEES |
| Caroline M. Hoxby (51) | | Trustee (Since 2017) | | Professor of Economics, Stanford University; Director of the Economics of Education Program, National Bureau of Economic Research; Senior Fellow, Hoover Institution and Stanford Institute for Economic Policy Research | | — |
| Thomas A. Larsen (68) | | Trustee (Since 2002) | | Senior Counsel of Arnold & Porter (law firm) (since 2013); Partner of Arnold & Porter (until 2012); Director of Howard, Rice, Nemerovski, Canady, Falk & Rabkin (1977-2011) | | — |
| Ann Mather (57) | | Trustee (Since 2011) | | CFO, Pixar Animation Studios (1999-2004) | | Director, Alphabet Inc. (internet information services) (since 2005); Director, Glu Mobile, Inc. (multimedia software) (since 2004); Director, Netflix, Inc. (internet television) (since 2010); Director, Arista Networks (cloud networking) (since 2013); Director, Shutterfly, Inc. (internet photography services/publishing) (since 2013) |
| Robert B. Morris III (65) | | Trustee (Since 2011) | | Advisory Director, The Presidio Group (2005-2016); Partner and Managing Director—Global Investment Research at Goldman Sachs (until 2001) | | — |
| Gary Roughead (66) | | Trustee (Since 2013) | | Robert and Marion Oster Distinguished Military Fellow, Hoover Institution (since 2012); Admiral, United States Navy (Ret.); U.S. Navy Chief of Naval Operations (2008-2011) | | Director, Northrop Grumman Corp. (global security) (since 2012); Director, Maersk Line, Limited (shipping and transportation) (since 2016) |
| Mark E. Smith (66) | | Trustee (Since 2014) | | Executive Vice President, Managing Director—Fixed Income at Loomis Sayles & Company, L.P. (2003-2011) | | — |
| John B. Taylor (71) | | Trustee (Since 2005) (and 1995-2001) | | Professor of Economics, Stanford University (since 1984); Senior Fellow, Hoover Institution (since 1996); Under Secretary for International Affairs, United States Treasury (2001-2005) | | — |
| * | | The address for each Officer and Trustee is 555 California Street, 40th Floor, San Francisco, California 94104. Each Officer and Trustee oversees all six series in the Dodge & Cox Funds complex and serves for an indefinite term. |
Additional information about the Trust’s Trustees and Officers is available in the Trust’s Statement of Additional Information (SAI). You can get a free copy of the SAI by visiting the Funds’ website at dodgeandcox.com or calling
800-621-3979.
DODGE & COX INCOME FUND §PAGE 23
dodgeandcox.com
For Fund literature, transactions, and account
information, please visit the Funds’ website.
or write or call:
DODGE & COX FUNDS
c/o DST Asset Manager Solutions, Inc.
P.O. Box 8422
Boston, Massachusetts 02266-8422
(800) 621-3979
INVESTMENT MANAGER
Dodge & Cox
555 California Street, 40th Floor
San Francisco, California 94104
(415) 981-1710
This report is submitted for the general information of the shareholders of the Fund. The report is not authorized for distribution to prospective investors in the Fund unless it is accompanied by a current prospectus.
This report reflects our views, opinions, and portfolio holdings as of December 31, 2017, the end of the reporting period. Any such views are subject to change at any time based upon market or other conditions and Dodge & Cox disclaims any responsibility to update such views. These views may not be relied on as investment advice and, because investment decisions for a Dodge & Cox Fund are based on numerous factors, may not be relied on as an indication of trading intent on behalf of any Dodge & Cox Fund.
DODGE & COX FUNDS®
Annual Report
December 31, 2017
Global Bond Fund
ESTABLISHED 2014
TICKER: DODLX
12/17 GBF AR Printed on recycled paper
TO OUR SHAREHOLDERS
The Dodge & Cox Global Bond Fund had a total return of 8.3% for the year ended December 31, 2017, compared to a return of 7.4% for the Bloomberg Barclays Global Aggregate Bond Index (Bloomberg Barclays Global Agg).
MARKET COMMENTARY
Global markets delivered healthy returns in 2017 amid synchronized global growth and muted financial market volatility. Real GDP growth in the G7 countries beat expectations for the first time since 2010, and emerging market growth accelerated, driven by better-than-expected economic data from China and a rally in key commodity prices during the second half of the year.
Corporate bonds continued their long stretch of outperformance as yield premiums(a) fell to their lowest level since mid-2007. This strength was underpinned by robust corporate earnings and balance sheets, as well as optimism around the new U.S. tax bill signed into law in December, which significantly reduces statutory corporate tax rates.
Growth momentum in the United States was strong, although inflation remained subdued. In December, as widely anticipated, the Federal Reserve (Fed) hiked interest rates for the third time in 2017. Jerome Powell was confirmed to succeed Janet Yellen as Fed Chair, and is widely seen as maintaining continuity in Fed monetary policy. The flattening of the U.S. yield curve was notable, as 2-year yields rose by 70 basis points(b) but longer-term rates fell modestly, resulting in the flattest curve since 2007.
In the eurozone, the economic expansion was solid and broad-based, providing support for the euro, which rose 14% against the U.S. dollar. In October, the European Central Bank (ECB) announced it would extend its asset-purchase program through September 2018, but at a significantly reduced pace. Brexit risk lingered over the course of the year, but negotiators announced “sufficient progress” in December toward a provisional agreement between the European Union and the United Kingdom, alleviating near-term tail risks for the UK economy.
Emerging market currencies generally strengthened versus the U.S. dollar, with the Polish zloty and other central and eastern European currencies performing best. Interest rate movements in the emerging markets varied, reflecting divergences in growth and inflation dynamics, central bank actions, and political events. For example, ten-year interest rates rose in India on growth and fiscal concerns related to economic policies and higher oil prices, while they fell in Indonesia, supported by subdued price pressures, robust export growth, and sovereign ratings upgrades.
INVESTMENT STRATEGY
2017 was a strong year for the Fund’s performance. The positive economic and financial market backdrop propelled returns of “risk assets,” including many of the Fund’s corporate and emerging market holdings. As in 2016, last year the Fund’s significant allocation to credit(c) and strong security selection were the dominant contributors to the Fund’s 8.3% return. Currency and interest rate positioning also contributed positively to returns, led by the Fund’s sizeable weighting in Mexican government bonds.
During the year, we made a number of incremental changes to individual holdings. In aggregate, we reduced the Fund’s credit exposure and increased high-quality, short-duration(d) holdings. We also added incrementally to our emerging market bond holdings. Below we review investment themes in the three key dimensions of the Fund—credit, currency, and rates.
Credit: A Valuation-Driven Approach
Credit valuations are less compelling than they have been in recent years, but remain a relatively attractive sector of the bond market. The Fund’s 47%(e) weighting in credit boosted performance in an environment of declining credit yield premiums and continues to be an important driver of the Fund’s significant yield advantage relative to the Bloomberg Barclays Global Agg (3.9% versus 1.7%).
Our positive outlook for credit is supported by strong corporate profitability and liquidity, as well as manageable leverage levels, a well-capitalized global banking system, and stability in commodity prices. However, valuation discipline is an essential element of our investment philosophy. Consequently, we have capitalized on the strong market environment by selectively reducing the Fund’s credit exposure in each of the last seven quarters. The Fund’s credit weighting declined 10 percentage points in the last year and 20 percentage points over the last two years. During the year, several companies (e.g., Time Warner, Vulcan Materials)(f) conducted tenders in which they offered to buy back their debt from bondholders at above-market prices. We participated in the tenders, taking advantage of an efficient and attractive way to reduce our credit exposure.
As we have scaled back credit exposure, we have increased the Fund’s holdings of a variety of short-dated, high-quality bonds. Our experienced fixed income research team identified several opportunities to pick up incremental yield versus short-term U.S. Treasuries through investments in commercial paper, hedged Japanese Treasury Discount Bills, agency-guaranteed mortgage-backed securities, and asset-backed bonds.
The Fund’s largest corporate sector concentration is the Communications sector (13% weighting). Concerns about acquisitions and technological changes have kept valuations at levels we deem attractive, and we believe the issuers held by the Fund have sufficient scale, diversity, and cash flows to succeed, even in the face of long-term secular challenges.
We continue to find value in euro-denominated emerging market credit securities, including bonds issued by the governments of Peru and Indonesia, as well as by Pemex, Mexico’s national oil company. These bonds trade at a discount to comparable U.S. dollar-denominated bonds (i.e., those with equivalent issuer, maturity, and seniority level). By virtue of its global mandate and active currency management, the Fund is able to take advantage of these opportunities and purchase whichever bonds are most attractively priced.
Currency: Opportunities in Emerging Markets
The Fund remains largely invested in U.S. dollars (84% weighting), reflecting our view that U.S. economic prospects and
PAGE 2 § DODGE & COX GLOBAL BOND FUND
policies continue to support the outlook for the U.S. dollar, especially with respect to other developed markets. However, we remain enthusiastic about the return prospects for emerging market government bonds and increased the Fund’s exposure incrementally throughout 2017.
For example, we initiated a position in rupiah-dominated Indonesia government bonds given a reasonable currency valuation and attractive real yield levels, combined with an improving fundamental outlook. The Indonesian government, led by President Joko Widodo, has implemented a number of investor-friendly economic reforms in recent years, resulting in lower macroeconomic volatility and an upward trend in sovereign credit ratings. The outlook for growth and investment is positive, debt levels remain low, foreign reserves have risen, and inflation dynamics are stable.
We also established a small position in the Argentine peso via our purchase of bonds issued by the Province of Buenos Aires, the largest of Argentina’s 23 provinces. These bonds offer high real yields that we believe adequately compensate for currency depreciation risks over our extended investment time horizon. President Mauricio Macri is leading Argentina through an ambitious institutional and macroeconomic reform agenda aimed at lowering inflation, reigniting growth, and attracting investment following nearly two decades of economic mismanagement under previous governments. We believe Argentina’s improving credit profile will provide support for the currency and drive yield premiums lower.
The Mexican peso remains the Fund’s largest non-U.S. dollar currency exposure (6% weighting) and was a large contributor to returns in 2017. We trimmed our exposure early in the year after a period of strong appreciation, but our view is that Mexican currency and rates valuations reflect excessive pessimism relative to our more sanguine view of the risk-return prospects.
Duration: Remaining Defensive but Finding Pockets of Value
We continue to believe that the market is underpricing upside risks to inflation and interest rates in the United States and a number of other developed markets. Output gaps are closing in Europe and Japan, and U.S. growth is running above potential. In addition, important impending changes related to the new U.S. tax reform and the end of the ECB’s asset purchases are likely to provide upward pressure on interest rates. To mitigate potential
performance headwinds due to rising interest rates, the Fund maintains a relatively low overall duration (3.6 years).
In contrast to developed markets, several emerging markets offer high nominal and real rate levels, moderating inflation, and steep yield curves, providing attractive return opportunities. This underscores a key benefit of the global nature of the Fund: the ability to find pockets of value in various countries, as economic cycles and valuation levels differ across the globe. The Fund holds longer-term bonds in India, Indonesia, Mexico, and Peru.
IN CLOSING
At Dodge & Cox, our intensive fundamental research process, credit-oriented investment strategy, and long-term investment horizon differentiate our global bond investment approach. As we look forward, our return outlook is tempered by the generally low level of yields and yield premiums, as well as by the dichotomy between low asset price volatility and high geopolitical uncertainty. Nonetheless, we remain optimistic about the Fund’s positioning and continue to find investment opportunities across the global bond universe.
Thank you for your continued confidence in our firm. As always, we welcome your comments and questions.
For the Board of Trustees,
| | |
| | |
Charles F. Pohl, Chairman | | Dana M. Emery, President |
January 30, 2018
| (a) | | Yield premiums are one way to measure a security’s valuation. Narrowing yield premiums result in a higher valuation. Widening yield premiums result in a lower valuation. |
| (b) | | One basis point is equal to 1/100th of 1%. |
| (c) | | Credit securities refers to corporate bonds and government-related securities, as classified by Bloomberg. |
| (d) | | Duration is a measure of a bond’s (or a bond portfolio’s) price sensitivity to changes in interest rates. |
| (e) | | Unless otherwise specified, all weightings and characteristics are as of December 31, 2017. |
| (f) | | The use of specific examples does not imply that they are more or less attractive investments than the Fund’s other holdings. |
DODGE & COX GLOBAL BOND FUND §PAGE 3
ANNUAL PERFORMANCE REVIEW
The Fund outperformed the Barclays Global Agg by 0.9 percentage points in 2017.
Key Contributors to Relative Results
| | § | | Security selection was strong, led by Rio Oil Finance Trust, Telecom Italia, Indonesia sovereign credit, and Naspers. | |
| | § | | The Fund’s large position in the Mexican peso (8% versus 0%(a) in the Bloomberg Barclays Global Agg) added to relative returns as the currency appreciated 5% versus the U.S. dollar. | |
| | § | | The Fund’s overweight to corporate bonds (49% versus 19% in the Bloomberg Barclays Global Agg) benefited relative returns as credit yield premiums declined. | |
Key Detractors from Relative Results
| | § | | Currency positioning hurt relative returns, predominantly due to the Fund’s lack of exposure to the euro (24% in the Bloomberg Barclays Global Agg), which appreciated 14% versus the U.S. dollar. Lack of exposure to other appreciating developed market currencies, including the Japanese yen and the British pound (combined 22% in the Bloomberg Barclays Global Agg), also detracted. | |
| | | | Unless otherwise noted, figures cited in this section denote Fund positioning at the beginning of the year. | |
KEY CHARACTERISTICS OF DODGE & COX
Independent Organization
Dodge & Cox is one of the largest privately owned investment managers in the world. We remain committed to independence, with a goal of providing the highest quality investment management service to our existing clients.
Over 85 Years of Investment Experience
Dodge & Cox was founded in 1930. We have a stable and well-qualified team of investment professionals, most of whom have spent their entire careers at Dodge & Cox.
Experienced Investment Team
The Global Fixed Income Investment Committee, which is the decision-making body for the Global Bond Fund, is a six-member committee with an average tenure at Dodge & Cox of 22 years.
One Business with a Single Research Office
Dodge & Cox manages equity (domestic, international, and global), fixed income (domestic and global), and balanced investments, operating from one office in San Francisco.
Consistent Investment Approach
Our team decision-making process involves thorough, bottom-up fundamental analysis of each investment.
Long-Term Focus and Low Expenses
We invest with a three- to five-year investment horizon, which has historically resulted in low turnover relative to our peers. We manage Funds that maintain low expense ratios.
Risks: The yields and market values of the instruments in which the Fund invests may fluctuate. Accordingly, an investment may be worth more or less than its original cost. Debt securities are subject to interest rate risk, credit risk, and prepayment and call risk, all of which could have adverse effects on the value of the Fund. A low interest rate environment creates an elevated risk of future negative returns. Financial intermediaries may restrict their market making activities for certain debt securities, which may reduce the liquidity and increase the volatility of such securities. Investing in non-U.S. securities may entail risk due to foreign economic and political developments; this risk may be increased when investing in emerging markets. The Fund is also subject to currency risk. Please read the prospectus and summary prospectus for specific details regarding the Fund’s risk profile.
PAGE 4 § DODGE & COX GLOBAL BOND FUND
GROWTH OF $10,000 SINCE INCEPTION
FOR AN INVESTMENT MADE ON DECEMBER 5, 2012
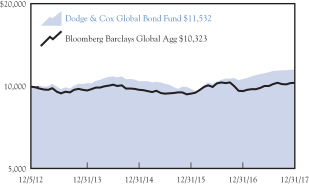
AVERAGE ANNUAL TOTAL RETURN
FOR PERIODS ENDED DECEMBER 31, 2017
| | | | | | | | | | | | | | | | |
| | | 1 Year | | | 3 Years | | | 5 Years | | | Since
Inception
(12/5/12) | |
| | | | | | | | | | | | | | | | |
Dodge & Cox Global Bond Fund(a) | | | 8.31 | % | | | 3.34 | % | | | 2.86 | % | | | 2.86 | % |
Bloomberg Barclays Global Aggregate Bond Index (Bloomberg Barclays Global Agg) | | | 7.39 | | | | 2.02 | | | | 0.79 | | | | 0.64 | |
| (a) | | Expense reimbursements have been in effect for the Fund since its inception. Without the expense reimbursements, returns for the Fund would have been lower. The Fund’s returns since May 1, 2014 are as presented in the Financial Highlights. |
Returns represent past performance and do not guarantee future results. Investment return and share price will fluctuate with market conditions, and investors may have a gain or loss when shares are sold. Fund performance changes over time and currently may be significantly lower than stated. Performance is updated and published monthly. Visit the Fund’s website at dodgeandcox.com or call 800-621-3979 for current performance figures.
A private fund managed and funded by Dodge & Cox (the “Private Fund”) was reorganized into the Fund and the Fund commenced operations on May 1, 2014. The Private Fund commenced operations on December 5, 2012 and had an investment objective, policies, and strategies that were, in all material respects, the same as those of the Fund, and was managed in a manner that, in all material respects, complied with the investment guidelines and restrictions of the Fund. However, the Private Fund was not registered as an investment company under the Investment Company Act of 1940 (the “1940 Act”), and therefore was not subject to certain investment limitations, diversification requirements, liquidity requirements, and other restrictions imposed by the 1940 Act and the Internal Revenue Code, which, if applicable, may have adversely affected its performance.
The Fund’s total returns include the reinvestment of dividend and capital gain distributions, but have not been adjusted for any income taxes payable by shareholders on these distributions or on Fund share redemptions. Index returns include interest income but, unlike Fund returns, do not reflect fees or expenses. The Bloomberg Barclays Global Aggregate Bond Index (Bloomberg Barclays Global Agg) is a widely recognized, unmanaged index of multi-currency investment-grade, debt securities.
Bloomberg is a registered trademark of Bloomberg Finance L.P. and its affiliates. Barclays® is a trademark of Barclays Bank PLC.
FUND EXPENSE EXAMPLE
As a Fund shareholder, you incur ongoing Fund costs, including management fees and other Fund expenses. All mutual funds have ongoing costs, sometimes referred to as operating expenses. The following example shows ongoing costs of investing in the Fund and can help you understand these costs and compare them with those of other mutual funds. The example assumes a $1,000 investment held for the six months indicated.
ACTUAL EXPENSES
The first line of the table below provides information about actual account values and expenses based on the Fund’s actual returns. You may use the information in this line, together with your account balance, to estimate the expenses that you paid over the period. Simply divide your account value by $1,000 (for example, an $8,600 account value divided by $1,000 = 8.6), then multiply the result by the number in the first line under the heading “Expenses Paid During Period” to estimate the expenses you paid on your account during this period.
HYPOTHETICAL EXAMPLE FOR COMPARISON WITH OTHER MUTUAL FUNDS
Information on the second line of the table can help you compare ongoing costs of investing in the Fund with those of other mutual funds. This information may not be used to estimate the actual ending account balance or expenses you paid during the period. The hypothetical “Ending Account Value” is based on the actual expense ratio of the Fund and an assumed 5% annual rate of return before expenses (not the Fund’s actual return). The amount under the heading “Expenses Paid During Period” shows the hypothetical expenses your account would have incurred under this scenario. You can compare this figure with the 5% hypothetical examples that appear in shareholder reports of other mutual funds.
| | | | | | | | | | | | |
Six Months Ended December 31, 2017 | | Beginning Account Value
7/1/2017 | | | Ending Account Value
12/31/2017 | | | Expenses Paid
During Period* | |
Based on Actual Fund Return | | $ | 1,000.00 | | | $ | 1,023.70 | | | $ | 2.30 | |
Based on Hypothetical 5% Yearly Return | | | 1,000.00 | | | | 1,022.94 | | | | 2.30 | |
| * | | Expenses are equal to the Fund’s annualized net expense ratio of 0.45%, multiplied by the average account value over the period, multiplied by 184/365 (to reflect the one-half year period). |
The expenses shown in the table highlight ongoing costs only and do not reflect any transactional fees or account maintenance fees. Though other mutual funds may charge such fees, please note that the Fund does not charge transaction fees (e.g., redemption fees, sales loads) or universal account maintenance fees (e.g., small account fees).
DODGE & COX GLOBAL BOND FUND §PAGE 5
| | | | |
| FUND INFORMATION (unaudited) | | | December 31, 2017 | |
| | | | |
| GENERAL INFORMATION | | | |
Net Asset Value Per Share | | | $10.92 | |
Total Net Assets (millions) | | | $156.3 | |
Net Expense Ratio(a) | | | 0.45% | |
Gross Expense Ratio | | | 1.06% | |
Portfolio Turnover Rate | | | 46% | |
30-Day SEC Yield (using net expenses)(a)(b) | | | 3.49% | |
30-Day SEC Yield (using gross expenses) | | | 2.88% | |
Number of Credit Issuers | | | 45 | |
Fund Inception | | | May 1, 2014 | |
No sales charges or distribution fees | | | | |
Investment Manager: Dodge & Cox, San Francisco. Managed by the Global Fixed Income Investment Committee, whose six members’ average tenure at Dodge & Cox is 22 years.
| | | | | | | | |
| PORTFOLIO CHARACTERISTICS | | Fund | | | BBG Barclays
Global Agg | |
Effective Duration (years)(c) | | | 3.6 | | | | 7.0 | |
Emerging Markets(d) | | | 27.7% | | | | 4.9% | |
Non-USD Currency Exposure(e) | | | 16.5% | | | | 55.5% | |
| | | | |
| FIVE LARGEST CREDIT ISSUERS (%)(f) | | Fund | |
AT&T, Inc. | | | 2.0 | |
Kinder Morgan, Inc. | | | 1.9 | |
Naspers, Ltd. | | | 1.9 | |
Telecom Italia SPA | | | 1.8 | |
TransCanada Corp. | | | 1.7 | |
| | | | | | | | |
| CREDIT QUALITY (%)(g)(h) | | Fund | | | BBG Barclays
Global Agg | |
Aaa | | | 25.1 | | | | 39.6 | |
Aa | | | 0.5 | | | | 16.3 | |
A | | | 18.4 | | | | 26.8 | |
Baa | | | 39.7 | | | | 17.3 | |
Ba | | | 9.2 | | | | 0.0 | |
B | | | 1.6 | | | | 0.0 | |
Caa | | | 1.2 | | | | 0.0 | |
Net Cash & Other(i) | | | 4.3 | | | | 0.0 | |
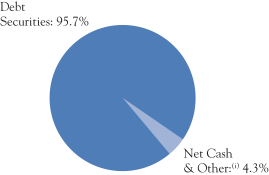
| | | | | | | | |
| SECTOR DIVERSIFICATION (%)(h) | | Fund | | | BBG Barclays
Global Agg | |
Government | | | 24.7 | | | | 53.7 | |
Government-Related | | | 8.9 | | | | 12.1 | |
Securitized | | | 24.0 | | | | 15.2 | |
Corporate | | | 38.1 | | | | 19.0 | |
Net Cash & Other(i) | | | 4.3 | | | | 0.0 | |
| | | | | | | | |
| REGION DIVERSIFICATION (%)(d)(h) | | Fund | | | BBG Barclays
Global Agg | |
United States | | | 49.5 | | | | 38.6 | |
Latin America | | | 19.1 | | | | 1.1 | |
Europe (excluding United Kingdom) | | | 6.6 | | | | 26.6 | |
United Kingdom | | | 6.2 | | | | 5.7 | |
Japan | | | 5.1 | | | | 16.6 | |
Pacific (excluding Japan) | | | 4.9 | | | | 5.3 | |
Africa | | | 2.6 | | | | 0.0 | (j) |
Canada | | | 1.7 | | | | 3.3 | |
Middle East | | �� | 0.0 | | | | 0.6 | |
Other | | | 0.0 | | | | 2.2 | |
| (a) | Effective May 1, 2017, Dodge & Cox has contractually agreed to reimburse the Fund for all ordinary expenses to the extent necessary to maintain total annual fund operating expenses at 0.45% through April 30, 2018. The term of the agreement renews annually thereafter unless terminated with 30 days’ written notice by either party prior to the end of the term. For periods prior to May 1, 2017, the Fund’s Net Expense Ratio was 0.60%. |
| (b) | SEC Yield is an annualization of the Fund’s net investment income for the trailing 30-day period. Dividends paid by the Fund may be higher or lower than implied by the SEC Yield. |
| (c) | Interest rate derivatives reduce total Fund duration by 1.7 years (i.e., total portfolio duration is 5.3 years without derivatives). |
| (d) | The Fund may classify an issuer in a different category than the Bloomberg Barclays Global Aggregate Bond Index. The Fund generally classifies a corporate issuer based on the country of incorporation of the parent company, but may designate a different country in certain circumstances. |
| (e) | Non-USD Currency Exposure for the Fund reflects the value of the portfolio’s non-U.S. Dollar denominated investments, as well as the impact of currency derivatives. |
| (f) | The Fund’s portfolio holdings are subject to change without notice. The mention of specific securities is not a recommendation to buy, sell, or hold any particular security and is not indicative of Dodge & Cox’s current or future trading activity. |
| (g) | The credit quality distributions shown for the Fund and the Index are based on the middle of Moody’s, S&P, and Fitch ratings, which is the methodology used by Bloomberg in constructing its indices. If a security is rated by only two agencies, the lower of the two ratings is used. Please note the Fund applies the highest of Moody’s, S&P, and Fitch ratings to comply with the quality requirements stated in its prospectus. On that basis, the Fund held 7.0% in securities rated below investment grade. The credit quality of the investments in the portfolio does not apply to the stability or safety of the Fund or its shares. |
| (h) | Excludes the Fund’s derivative contracts. |
| (i) | Net Cash & Other includes cash, short-term investments, derivatives, receivables, and payables. |
PAGE 6 § DODGE & COX GLOBAL BOND FUND
| | | | |
| PORTFOLIO OF INVESTMENTS | | | December 31, 2017 | |
| | | | | | | | | | |
| DEBT SECURITIES: 95.7% | | | | | | | | |
| | | |
| | | | | PAR VALUE | | | VALUE | |
| GOVERNMENT: 24.7% | | | | | | | | | | |
Colombia Government (Colombia)
7.75%, 4/14/21 | | COP | | | 12,775,000,000 | | | $ | 4,541,412 | |
India Government (India)
8.24%, 2/15/27 | | INR | | | 240,000,000 | | | | 3,910,284 | |
Indonesia Government (Indonesia)
8.25%, 5/15/36 | | IDR | | | 28,200,000,000 | | | | 2,330,637 | |
Japan Treasury Discount Bill (Japan) | | | | | | | | | | |
1/15/18 | | JPY | | | 155,000,000 | | | | 1,375,692 | |
1/22/18 | | JPY | | | 150,000,000 | | | | 1,331,349 | |
2/13/18 | | JPY | | | 435,000,000 | | | | 3,861,298 | |
5/10/18 | | JPY | | | 160,000,000 | | | | 1,420,764 | |
Mexico Government (Mexico) | | | | | | | | | | |
2.00%, 6/9/22(a) | | MXN | | | 29,419,402 | | | | 1,407,373 | |
5.75%, 3/5/26 | | MXN | | | 174,700,000 | | | | 7,853,926 | |
Peru Government GDN (Peru)
6.35%, 8/12/28(c) | | PEN | | | 9,050,000 | | | | 3,054,778 | |
Poland Government (Poland)
1.50%, 4/25/20 | | PLN | | | 5,550,000 | | | | 1,579,497 | |
U.S. Treasury Note/Bond (United States)
0.875%, 5/31/18 | | USD | | | 6,040,000 | | | | 6,026,316 | |
| | | | | | | | | | |
| | | | | | | | | 38,693,326 | |
| GOVERNMENT-RELATED: 8.9% | | | | | | | | |
Chicago Transit Authority RB (United States)
6.899%, 12/1/40 | | USD | | | 1,625,000 | | | | 2,203,321 | |
Indonesia Government International (Indonesia)
3.75%, 6/14/28(c) | | EUR | | | 1,100,000 | | | | 1,521,378 | |
Peru Government International (Peru)
3.75%, 3/1/30 | | EUR | | | 1,025,000 | | | | 1,497,337 | |
Petroleo Brasileiro SA (Brazil)
7.25%, 3/17/44 | | USD | | | 800,000 | | | | 832,000 | |
Petroleos Mexicanos (Mexico) | | | | | | | | | | |
4.875%, 2/21/28 | | EUR | | | 525,000 | | | | 699,216 | |
5.50%, 6/27/44 | | USD | | | 56,000 | | | | 51,518 | |
6.375%, 1/23/45 | | USD | | | 535,000 | | | | 537,862 | |
6.75%, 9/21/47 | | USD | | | 861,000 | | | | 898,755 | |
Province of Buenos Aires Argentina (Argentina) | | | | | | | | | | |
5.375%, 1/20/23(c) | | EUR | | | 1,200,000 | | | | 1,526,288 | |
BADLARPP
+3.83%, 25.361%, 5/31/22 | | ARS | | | 19,200,000 | | | | 1,039,307 | |
State of California GO (United States)
7.30%, 10/1/39 | | USD | | | 500,000 | | | | 745,930 | |
State of Illinois GO (United States) | | | | | | | | | | |
5.665%, 3/1/18 | | USD | | | 800,000 | | | | 804,352 | |
5.877%, 3/1/19 | | USD | | | 700,000 | | | | 721,812 | |
5.10%, 6/1/33 | | USD | | | 800,000 | | | | 798,672 | |
| | | | | | | | | | |
| | | | | | | | | 13,877,748 | |
| SECURITIZED: 24.0% | | | | | | | | | | |
ASSET-BACKED: 4.3% | | | | | | | | | | |
Auto Loan: 0.6% | | | | | | | | | | |
Ford Credit Auto Owner Trust (United States) | | | | | | | | | | |
Series 2017-C A3,
2.01%, 3/15/22 | | USD | | | 345,000 | | | | 343,929 | |
Series 2015-1 A,
2.12%, 7/15/26(c) | | USD | | | 550,000 | | | | 548,782 | |
| | | | | | | | | | |
| | | | | | | | | 892,711 | |
| | | | | | | | | | |
| | | |
| | | | | PAR VALUE | | | VALUE | |
Credit Card: 1.0% | | | | | | | | | | |
American Express Master Trust (United States)
Series 2017-3 A,
1.77%, 4/15/20 | | USD | | | 1,240,000 | | | $ | 1,229,133 | |
Chase Issuance Trust (United States)
Series 2016-A5 A5,
1.27%, 7/15/21 | | USD | | | 280,000 | | | | 276,706 | |
| | | | | | | | | | |
| | | | | | | | | 1,505,839 | |
Other: 1.2% | | | | | | | | | | |
Rio Oil Finance Trust (Brazil) | | | | | | | | | | |
9.25%, 7/6/24(c) | | USD | | | 1,200,758 | | | | 1,296,818 | |
9.75%, 1/6/27(c) | | USD | | | 564,383 | | | | 609,533 | |
| | | | | | | | | | |
| | | | | | | | | 1,906,351 | |
Student Loan: 1.5% | | | | | | | | | | |
Navient Student Loan Trust (United States)
Series 2017-A B, 3.91%, 12/16/58(c) | | USD | | | 1,050,000 | | | | 1,039,976 | |
Navient Student Loan Trust (Private Loans) (United States)
Series 2015-CA B, 3.25%, 5/15/40(c) | | USD | | | 1,350,000 | | | | 1,360,158 | |
| | | | | | | | | | |
| | | | | | | | | 2,400,134 | |
| | | | | | | | | | |
| | | | | | | | | 6,705,035 | |
MORTGAGE-RELATED: 19.7% | | | | | | | | | | |
Federal Agency CMO & REMIC: 3.2% | | | | | |
Fannie Mae (United States)
Trust 2004-W9 1A3,
6.05%, 2/25/44 | | USD | | | 556,538 | | | | 617,288 | |
Freddie Mac (United States) | | | | | | | | | | |
Series 4283 EW, 4.50%, 12/15/43(f) | | USD | | | 144,289 | | | | 153,652 | |
Series 4319 MA, 4.50%, 3/15/44(f) | | USD | | | 516,097 | | | | 553,401 | |
Ginnie Mae (United States) | | | | | | | | | | |
Series 2010-169 JZ,
4.00%, 12/20/40 | | USD | | | 748,048 | | | | 769,525 | |
USD LIBOR 1-Month
+0.75%, 1.993%, 10/20/66 | | USD | | | 2,229,434 | | | | 2,246,069 | |
USD LIBOR 12-Month
+0.22%, 2.019%, 10/20/67 | | USD | | | 697,282 | | | | 696,764 | |
| | | | | | | | | | |
| | | | | | | | | 5,036,699 | |
Federal Agency Mortgage Pass-Through: 16.5% | | | | | |
Fannie Mae, 15 Year (United States) 5.00%, 7/1/25 | | USD | | | 21,695 | | | | 22,974 | |
Fannie Mae, 20 Year (United States) | | | | | | | | | | |
4.00%, 11/1/30-9/1/35 | | USD | | | 1,384,273 | | | | 1,458,095 | |
3.50%, 3/1/37 | | USD | | | 2,098,129 | | | | 2,176,704 | |
Fannie Mae, 30 Year (United States) 4.50%, 4/1/39-4/1/46 | | USD | | | 6,822,533 | | | | 7,312,218 | |
4.50%, 1/1/46(h) | | USD | | | 2,326,000 | | | | 2,474,631 | |
Fannie Mae, Hybrid ARM (United States)
| | | | | | | | | | |
USD LIBOR 12-Month | | | | | | | | | | |
+1.58%, 2.914%, 8/1/44 | | USD | | | 149,723 | | | | 152,673 | |
+1.58%, 2.764%, 9/1/44 | | USD | | | 250,989 | | | | 255,170 | |
Freddie Mac, Hybrid ARM (United States) | | | | | | | | | | |
USD LIBOR 12-Month | | | | | | | | | | |
+1.63%, 3.012%, 10/1/44 | | USD | | | 301,437 | | | | 307,960 | |
+1.60%, 2.72%, 11/1/44 | | USD | | | 823,546 | | | | 837,406 | |
| | |
| See accompanying Notes to Financial Statements | | DODGE & COX GLOBAL BOND FUND §PAGE 7 |
| | | | |
| PORTFOLIO OF INVESTMENTS | | | December 31, 2017 | |
| | | | | | | | | | | | |
| DEBT SECURITIES (continued) | |
| | | |
| | | | | | PAR VALUE | | | VALUE | |
+1.62%, 2.674%, 1/1/45 | | | USD | | | | 827,458 | | | $ | 839,375 | |
+1.63%, 2.73%, 5/1/46 | | | USD | | | | 1,315,593 | | | | 1,329,784 | |
Freddie Mac Gold, 30 Year (United States) | | | | | | | | | | | | |
6.00%, 2/1/35 | | | USD | | | | 78,527 | | | | 87,906 | |
4.50%, 8/1/44-8/1/47 | | | USD | | | | 7,990,157 | | | | 8,496,442 | |
| | | | | | | | | | | | |
| | | | | | | | | | | 25,751,338 | |
| | | | | | | | | | | | |
| | | | | | | | | | | 30,788,037 | |
| | | | | | | | | | | | |
| | | | | | | | | | | 37,493,072 | |
| CORPORATE: 38.1% | | | | | | | | | | | | |
FINANCIALS: 9.9% | | | | | | | | | | | | |
Bank of America Corp. (United States) | | | | | | | | | | | | |
4.25%, 10/22/26 | | | USD | | | | 1,075,000 | | | | 1,132,566 | |
6.625%, 5/23/36(b) | | | USD | | | | 325,000 | | | | 420,875 | |
Barclays PLC (United Kingdom)
4.836%, 5/9/28 | | | USD | | | | 1,400,000 | | | | 1,456,772 | |
BNP Paribas SA (France)
4.375%, 9/28/25(c) | | | USD | | | | 1,375,000 | | | | 1,436,409 | |
Capital One Financial Corp. (United States)
3.75%, 4/24/24 | | | USD | | | | 1,100,000 | | | | 1,129,815 | |
Citigroup, Inc. (United States)
| | | | | | | | | | | | |
USD LIBOR 3-Month | | | | | | | | | | | | |
+6.37, 7.75%, 10/30/40(b) | | | USD | | | | 1,350,000 | | | | 1,480,680 | |
HSBC Holdings PLC (United Kingdom) | | | | | | | | | | | | |
5.75%, 12/20/27 | | | GBP | | | | 650,000 | | | | 1,104,112 | |
6.00%, 3/29/40 | | | GBP | | | | 600,000 | | | | 1,117,729 | |
JPMorgan Chase & Co. (United States)
4.25%, 10/1/27 | | | USD | | | | 1,500,000 | | | | 1,593,809 | |
Lloyds Banking Group PLC
(United Kingdom)
| | | | | | | | | | | | |
4.50%, 11/4/24 | | | USD | | | | 1,125,000 | | | | 1,180,192 | |
4.582%, 12/10/25 | | | USD | | | | 1,100,000 | | | | 1,153,125 | |
Navient Corp. (United States)
8.45%, 6/15/18 | | | USD | | | | 675,000 | | | | 692,212 | |
Royal Bank of Scotland Group PLC
(United Kingdom)
6.00%, 12/19/23 | | | USD | | | | 1,425,000 | | | | 1,572,262 | |
| | | | | | | | | | | | |
| | | | | | | | | | | 15,470,558 | |
INDUSTRIALS: 25.0% | | | | | | | | | | | | |
AT&T, Inc. (United States)
| | | | | | | | | | | | |
4.75%, 5/15/46 | | | USD | | | | 1,650,000 | | | | 1,612,400 | |
4.50%, 3/9/48 | | | USD | | | | 1,675,000 | | | | 1,568,050 | |
Becton, Dickinson and Co.
(United States)
2.894%, 6/6/22 | | | USD | | | | 1,500,000 | | | | 1,490,429 | |
Cemex SAB de CV (Mexico)
7.75%, 4/16/26(c) | | | USD | | | | 1,675,000 | | | | 1,896,937 | |
Charter Communications, Inc.
(United States)
| | | | | | | | | | | | |
7.30%, 7/1/38 | | | USD | | | | 425,000 | | | | 532,377 | |
6.75%, 6/15/39 | | | USD | | | | 1,300,000 | | | | 1,558,783 | |
6.484%, 10/23/45 | | | USD | | | | 250,000 | | | | 291,259 | |
Concho Resources, Inc. (United States)
4.875%, 10/1/47 | | | USD | | | | 500,000 | | | | 547,633 | |
Cox Enterprises, Inc. (United States)
8.375%, 3/1/39(c) | | | USD | | | | 975,000 | | | | 1,371,006 | |
Dell Technologies, Inc. (United States)
| | | | | | | | | | | | |
4.42%, 6/15/21(c) | | | USD | | | | 150,000 | | | | 156,288 | |
5.45%, 6/15/23(c) | | | USD | | | | 550,000 | | | | 594,268 | |
Ford Motor Credit Co. LLC(d)
(United States)
5.875%, 8/2/21 | | | USD | | | | 1,375,000 | | | | 1,509,745 | |
Grupo Televisa SAB (Mexico)
8.50%, 3/11/32 | | | USD | | | | 1,114,000 | | | | 1,477,420 | |
| | | | | | | | | | | | |
| | | |
| | | | | | PAR VALUE | | | VALUE | |
HCA Holdings, Inc. (United States)
4.75%, 5/1/23 | | | USD | | | | 1,850,000 | | | $ | 1,905,500 | |
Imperial Brands PLC (United Kingdom)
4.25%, 7/21/25(c) | | | USD | | | | 1,400,000 | | | | 1,467,617 | |
Kinder Morgan, Inc. (United States)
6.95%, 1/15/38 | | | USD | | | | 2,375,000 | | | | 2,951,017 | |
LafargeHolcim, Ltd. (Switzerland)
7.125%, 7/15/36 | | | USD | | | | 1,150,000 | | | | 1,509,461 | |
Macy’s, Inc. (United States) | | | | | | | | | | | | |
6.70%, 9/15/28 | | | USD | | | | 50,000 | | | | 53,120 | |
6.90%, 4/1/29 | | | USD | | | | 75,000 | | | | 79,121 | |
6.70%, 7/15/34 | | | USD | | | | 425,000 | | | | 444,579 | |
Millicom International Cellular SA
(Luxembourg)
5.125%, 1/15/28(c) | | | USD | | | | 1,400,000 | | | | 1,400,000 | |
Molex Electronic Technologies LLC(d)
(United States)
2.878%, 4/15/20(c) | | | USD | | | | 731,000 | | | | 731,116 | |
MTN Group, Ltd. (South Africa)
4.755%, 11/11/24(c) | | | USD | | | | 1,125,000 | | | | 1,117,688 | |
Naspers, Ltd. (South Africa)
5.50%, 7/21/25(c) | | | USD | | | | 2,700,000 | | | | 2,940,214 | |
RELX PLC (United Kingdom) | | | | | | | | | | | | |
8.625%, 1/15/19 | | | USD | | | | 58,000 | | | | 61,484 | |
3.125%, 10/15/22 | | | USD | | | | 574,000 | | | | 578,304 | |
Telecom Italia SPA (Italy)
| | | | | | | | | | | | |
7.175%, 6/18/19 | | | USD | | | | 200,000 | | | | 212,250 | |
6.375%, 6/24/19 | | | GBP | | | | 800,000 | | | | 1,159,426 | |
7.721%, 6/4/38 | | | USD | | | | 1,150,000 | | | | 1,483,500 | |
TransCanada Corp. (Canada)
| | | | | | | | | | | | |
5.625%, 5/20/75(b)(g) | | | USD | | | | 1,800,000 | | | | 1,894,500 | |
5.30%, 3/15/77(b)(g) | | | USD | | | | 750,000 | | | | 773,438 | |
Twenty-First Century Fox, Inc.
(United States)
| | | | | | | | | | | | |
6.15%, 3/1/37 | | | USD | | | | 275,000 | | | | 359,905 | |
6.65%, 11/15/37 | | | USD | | | | 850,000 | | | | 1,168,290 | |
Ultrapar Participacoes SA (Brazil)
5.25%, 10/6/26(c) | | | USD | | | | 600,000 | | | | 610,932 | |
Verizon Communications, Inc.
(United States)
5.012%, 4/15/49 | | | USD | | | | 1,450,000 | | | | 1,519,381 | |
| | | | | | | | | | | | |
| | | | | | | | | | | 39,027,438 | |
UTILITIES: 3.2% | | | | | | | | | | | | |
Dominion Energy, Inc.
(United States)
5.75%, 10/1/54(b)(g) | | | USD | | | | 1,750,000 | | | | 1,890,000 | |
Enel SPA (Italy)
| | | | | | | | | | | | |
6.80%, 9/15/37(c) | | | USD | | | | 650,000 | | | | 868,651 | |
6.00%, 10/7/39(c) | | | USD | | | | 505,000 | | | | 627,886 | |
The Southern Co. (United States)
5.50%, 3/15/57(b)(g) | | | USD | | | | 1,600,000 | | | | 1,696,401 | |
| | | | | | | | | | | | |
| | | | | | | | | | | 5,082,938 | |
| | | | | | | | | | | | |
| | | | | | | | | | | 59,580,934 | |
| | | | | | | | | | | | |
TOTAL DEBT SECURITIES
(Cost $145,644,333) | | | | | | | | | | $ | 149,645,080 | |
| |
| SHORT-TERM INVESTMENTS: 5.7% | | | | |
COMMERCIAL PAPER: 1.9% | | | | | | | | | | | | |
Dominion Energy, Inc. (United States)
1/29/18(c) | | | USD | | | | 1,500,000 | | | | 1,498,192 | |
Mondelez International, Inc.
(United States)
2/2/18(c) | | | USD | | | | 1,500,000 | | | | 1,497,960 | |
| | | | | | | | | | | | |
| | | | | | | | | | | 2,996,152 | |
REPURCHASE AGREEMENT: 3.7% | | | | | | | | | | | | |
Fixed Income Clearing Corporation(e)
0.80%, dated 12/29/17, due 1/2/18, maturity value $5,686,505 | | | USD | | | | 5,686,000 | | | | 5,686,000 | |
| | |
| PAGE 8 § DODGE & COX GLOBAL BOND FUND | | See accompanying Notes to Financial Statements |
| | | | |
| PORTFOLIO OF INVESTMENTS | | | December 31, 2017 | |
| | | | | | | | | | | | |
| SHORT-TERM INVESTMENTS (continued) | | | | |
| | | |
| | | | | | SHARES | | | VALUE | |
MONEY MARKET FUND: 0.1% | | | | | | | | | | | | |
State Street Institutional Treasury Plus Money Market Fund | | | | | | | 155,554 | | | $ | 155,554 | |
| | | | | | | | | | | | |
TOTAL SHORT-TERM INVESTMENTS
(Cost $8,837,706) | | | | | | | | | | $ | 8,837,706 | |
| | | | | | | | | | | | |
TOTAL INVESTMENTS
(Cost $154,482,039) | | | | | | | 101.4 | % | | $ | 158,482,786 | |
OTHER ASSETS LESS LIABILITIES | | | | | | | (1.4 | %) | | | (2,153,985 | ) |
| | | | | | | | | | | | |
| NET ASSETS | | | | | | | 100.0 | % | | $ | 156,328,801 | |
| | | | | | | | | | | | |
| (c) | Security exempt from registration under Rule 144A of the Securities Act of 1933. The security may be resold in transactions exempt from registration, normally to qualified institutional buyers. As of December 31, 2017, all such securities in total represented $29,172,875 or 18.7% of net assets. These securities have been deemed liquid by Dodge & Cox, investment manager, pursuant to procedures approved by the Fund’s Board of Trustees. |
| (d) | Subsidiary (see below) |
| (e) | Repurchase agreement is collateralized by U.S. Treasury Note 1.375%, 6/30/23. Total collateral value is $5,803,606. |
| (f) | Variable rate security: interest rate is determined by the interest rates of underlying pool of assets that collateralize the security. The interest rate of the security may change due to a change in the interest rates or the composition of underlying pool of assets. The interest rate shown is the rate as of period end. |
| (g) | Variable rate security: fixed-to-float security pays an initial fixed interest rate and will pay a floating interest rate established at a predetermined time in the future. The interest rate shown is the rate as of period end. |
| (h) | The security was purchased on a to-be-announced (TBA) when-issued basis. |
Debt securities are grouped by parent company unless otherwise noted. Actual securities may be issued by the listed parent company or one of its subsidiaries. In determining a parent company’s country designation, the Fund generally references the country of incorporation.
ARM:Adjustable Rate Mortgage
CMO:Collateralized Mortgage Obligation
GDN:Global Depositary Note
GO:General Obligation
RB:Revenue Bond
REMIC:Real Estate Mortgage Investment Conduit
ARS:Argentine Peso
COP:Colombian Peso
EUR:Euro
GBP:British Pound
IDR:Indonesian Rupiah
INR:Indian Rupee
JPY:Japanese Yen
MXN:Mexican Peso
PEN:Peruvian Sol
PLN:Polish Zloty
USD:United States Dollar
FUTURES CONTRACTS
| | | | | | | | | | | | | | | | |
| Description | | Number of
Contracts | | | Expiration
Date | | | Notional
Amount | | | Value /
Unrealized
Appreciation
(Depreciation) | |
10 Year U.S. Treasury Note—Short Position | | | 108 | | | | Mar 2018 | | | $ | (13,397,062 | ) | | $ | 80,753 | |
Euro-Bund Future—Short Position | | | 23 | | | | Mar 2018 | | | | (4,461,808 | ) | | | 38,322 | |
Long Term U.S. Treasury Bond—Short Position | | | 27 | | | | Mar 2018 | | | | (4,131,000 | ) | | | 3,743 | |
| | | | | | | | | | | | | | | | |
| | | | | | | | | | | | | | $ | 122,818 | |
| | | | | | | | | | | | | | | | |
CENTRALLY CLEARED INTEREST RATE SWAPS
| | | | | | | | | | | | | | | | | | | | |
Notional Amount | | Expiration
Date | | | Fixed
Rate | | | Value | | | Upfront
Payments (Receipts) | | | Unrealized
Appreciation
(Depreciation) | |
Pay Fixed (Semi-Annually) / Receive USD LIBOR 3-Month (Quarterly): | |
$3,450,000 | | | 3/21/28 | | | | 2.250 | % | | $ | 59,956 | | | $ | 62,706 | | | $ | (2,750 | ) |
1,750,000 | | | 7/29/45 | | | | 2.774 | % | | | (89,092 | ) | | | — | | | | (89,092 | ) |
960,000 | | | 3/21/48 | | | | 2.500 | % | | | 17,001 | | | | 15,854 | | | | 1,147 | |
| | | | | | | | | | | | | | | | | | | | |
| | | | | | | | | | $ | (12,135 | ) | | $ | 78,560 | | | $ | (90,695 | ) |
| | | | | | | | | | | | | | | | | | | | |
CURRENCY FORWARD CONTRACTS
| | | | | | | | | | | | | | | | |
| | | | | | Contract Amount | | | | |
| Counterparty | | Settle Date | | | Receive U.S. Dollar | | | Deliver
Foreign
Currency | | | Unrealized
Appreciation
(Depreciation) | |
Contracts to sell EUR: | |
Barclays | | | 1/10/18 | | | | 1,092,700 | | | | 950,000 | | | $ | (47,631 | ) |
Barclays | | | 1/10/18 | | | | 1,244,454 | | | | 1,075,000 | | | | (45,921 | ) |
Barclays | | | 2/14/18 | | | | 3,454,431 | | | | 2,900,000 | | | | (33,551 | ) |
Barclays | | | 4/25/18 | | | | 176,727 | | | | 150,000 | | | | (4,513 | ) |
JPMorgan | | | 4/25/18 | | | | 176,635 | | | | 150,000 | | | | (4,605 | ) |
Contracts to sell GBP: | |
Barclays | | | 1/10/18 | | | | 1,067,675 | | | | 825,000 | | | | (46,439 | ) |
Barclays | | | 3/14/18 | | | | 2,080,066 | | | | 1,570,000 | | | | (44,508 | ) |
Citibank | | | 4/25/18 | | | | 133,538 | | | | 100,000 | | | | (1,997 | ) |
Contracts to sell INR: | |
Barclays | | | 1/31/18 | | | | 477,658 | | | | 31,000,000 | | | | (6,537 | ) |
Contracts to sell JPY: | |
Barclays | | | 2/13/18 | | | | 4,013,511 | | | | 435,000,000 | | | | 145,499 | |
Barclays | | | 1/16/18 | | | | 1,386,633 | | | | 155,000,000 | | | | 10,240 | |
Credit Suisse | | | 5/10/18 | | | | 1,423,332 | | | | 160,000,000 | | | | (6,484 | ) |
Goldman Sachs | | | 1/22/18 | | | | 1,330,554 | | | | 150,000,000 | | | | (1,824 | ) |
| | | | |
| Counterparty | | Settle Date | | | Deliver U.S. Dollar | | | Receive
Foreign
Currency | | | Unrealized
Appreciation
(Depreciation) | |
Contracts to buy EUR: | |
Barclays | | | 1/10/18 | | | | 514,706 | | | | 425,000 | | | | (4,558 | ) |
Barclays | | | 1/10/18 | | | | 591,265 | | | | 500,000 | | | | 8,909 | |
Contracts to buy INR: | |
Barclays | | | 1/31/18 | | | | 473,934 | | | | 31,000,000 | | | | 10,261 | |
| | | | | | | | | | | | | | | | |
| | | | | | | | | | | | | | $ | (73,659 | ) |
| | | | | |
The listed counterparty may be the parent company or one of its subsidiaries.
| | |
| See accompanying Notes to Financial Statements | | DODGE & COX GLOBAL BOND FUND §PAGE 9 |
| | | | |
| STATEMENT OF ASSETS AND LIABILITIES | |
| |
| | | December 31, 2017 | |
ASSETS: | | | | |
Investments in securities, at value (cost $154,482,039) | | $ | 158,482,786 | |
Unrealized appreciation on currency forward contracts | | | 174,909 | |
Cash denominated in foreign currency (cost $9) | | | 9 | |
Deposits with broker for futures contracts | | | 253,108 | |
Deposits with broker for swaps | | | 337,770 | |
Receivable for investments sold | | | 62,675 | |
Receivable for Fund shares sold | | | 321,294 | |
Dividends and interest receivable | | | 1,747,843 | |
Expense reimbursement receivable | | | 61,441 | |
Prepaid expenses and other assets | | | 18,758 | |
| | | | |
| | | 161,460,593 | |
| | | | |
LIABILITIES: | | | | |
Unrealized depreciation on currency forward contracts | | | 248,568 | |
Payable for variation margin for futures contracts | | | 26,543 | |
Payable for variation margin for swaps | | | 16,914 | |
Payable for investments purchased | | | 4,579,211 | |
Payable for Fund shares redeemed | | | 87,415 | |
Deferred foreign capital gains tax | | | 1,333 | |
Management fees payable | | | 64,384 | |
Accrued expenses | | | 107,424 | |
| | | | |
| | | 5,131,792 | |
| | | | |
NET ASSETS | | $ | 156,328,801 | |
| | | | |
NET ASSETS CONSIST OF: | | | | |
Paid in capital | | $ | 152,613,709 | |
Distributions in excess of net investment income | | | (240,339 | ) |
Accumulated net realized loss | | | (490 | ) |
Net unrealized appreciation | | | 3,955,921 | |
| | | | |
| | $ | 156,328,801 | |
| | | | |
Fund shares outstanding (par value $0.01 each, unlimited shares authorized) | | | 14,316,759 | |
Net asset value per share | | $ | 10.92 | |
| |
STATEMENT OF OPERATIONS | | | | |
| |
| | | Year Ended
December 31, 2017 | |
INVESTMENT INCOME: | | | | |
Dividends | | $ | 129,452 | |
Interest (net of foreign taxes of $15,182) | | | 5,068,054 | |
| | | | |
| | | 5,197,506 | |
| | | | |
EXPENSES: | | | | |
Management fees | | | 647,574 | |
Custody and fund accounting fees | | | 26,602 | |
Transfer agent fees | | | 35,480 | |
Professional services | | | 260,889 | |
Shareholder reports | | | 23,461 | |
Registration fees | | | 68,963 | |
Trustees’ fees | | | 280,417 | |
Miscellaneous | | | 30,935 | |
| | | | |
Total expenses | | | 1,374,321 | |
| | | | |
Expenses reimbursed by investment manager | | | (732,924 | ) |
| | | | |
Net expenses | | | 641,397 | |
| | | | |
NET INVESTMENT INCOME | | | 4,556,109 | |
| | | | |
REALIZED AND UNREALIZED GAIN (LOSS): | | | | |
Net realized gain (loss) | | | | |
Investments in securities | | | 1,735,489 | |
Futures contracts | | | (496,034 | ) |
Swaps | | | (143,394 | ) |
Currency forward contracts | | | (418,070 | ) |
Foreign currency transactions | | | 12,876 | |
Net change in unrealized appreciation/depreciation | | | | |
Investments in securities (net of change in deferred foreign capital gains tax of $1,333) | | | 5,012,721 | |
Futures contracts | | | 120,907 | |
Swaps | | | 64,781 | |
Currency forward contracts | | | (586,311 | ) |
Foreign currency translation | | | 8,545 | |
| | | | |
Net realized and unrealized gain | | | 5,311,510 | |
| | | | |
NET CHANGE IN NET ASSETS
FROM OPERATIONS | | $ | 9,867,619 | |
| | | | |
| | | | | | | | |
STATEMENT OF CHANGES IN NET ASSETS | |
| | |
| | | Year Ended
December 31, 2017 | | | Year Ended
December 31, 2016 | |
OPERATIONS: | | | | | | | | |
Net investment income | | $ | 4,556,109 | | | $ | 2,907,554 | |
Net realized gain (loss) | | | 690,867 | | | | (2,032,686 | ) |
Net change in unrealized appreciation/depreciation | | | 4,620,643 | | | | 5,078,974 | |
| | | | | | | | |
| | | 9,867,619 | | | | 5,953,842 | |
| | | | | | | | |
| | |
DISTRIBUTIONS TO SHAREHOLDERS FROM: | | | | | | | | |
Net investment income | | | (3,391,849 | ) | | | (1,791,680 | ) |
Net realized gain | | | (165,630 | ) | | | — | |
| | | | | | | | |
Total distributions | | | (3,557,479 | ) | | | (1,791,680 | ) |
| | | | | | | | |
| | |
FUND SHARE
TRANSACTIONS: | | | | | | | | |
Proceeds from sale of shares | | | 49,240,188 | | | | 64,939,219 | |
Reinvestment of distributions | | | 3,475,556 | | | | 1,748,223 | |
Cost of shares redeemed | | | (12,459,063 | ) | | �� | (28,749,476 | ) |
| | | | | | | | |
Net change from Fund share transactions | | | 40,256,681 | | | | 37,937,966 | |
| | | | | | | | |
Total change in net assets | | | 46,566,821 | | | | 42,100,128 | |
| | |
NET ASSETS: | | | | | | | | |
Beginning of year | | | 109,761,980 | | | | 67,661,852 | |
| | | | | | | | |
End of year (including distributions in excess of net investment income of $(240,339) and $(1,355,951), respectively) | | $ | 156,328,801 | | | $ | 109,761,980 | |
| | | | | | | | |
| | |
SHARE INFORMATION: | | | | | | | | |
Shares sold | | | 4,519,727 | | | | 6,359,396 | |
Distributions reinvested | | | 317,453 | | | | 169,730 | |
Shares redeemed | | | (1,146,936 | ) | | | (2,901,699 | ) |
| | | | | | | | |
Net change in shares outstanding | | | 3,690,244 | | | | 3,627,427 | |
| | | | | | | | |
| | |
| PAGE 10 § DODGE & COX GLOBAL BOND FUND | | See accompanying Notes to Financial Statements |
NOTES TO FINANCIAL STATEMENTS
NOTE 1—ORGANIZATION AND SIGNIFICANT ACCOUNTING POLICIES
Dodge & Cox Global Bond Fund (the “Fund”) is one of the series constituting the Dodge & Cox Funds (the “Trust” or the “Funds”). The Trust is organized as a Delaware statutory trust and is registered under the Investment Company Act of 1940, as amended, as an open-end management investment company. The Fund1 seeks a high rate of total return consistent with long-term preservation of capital. Foreign investing, especially in developing countries, has special risks such as currency and market volatility and political and social instability. These and other risk considerations are discussed in the Fund’s Prospectus.
The financial statements have been prepared in conformity with accounting principles generally accepted in the United States of America, which require the use of estimates and assumptions by management. Actual results may differ from those estimates. Significant accounting policies are as follows:
Security valuation The Fund’s net assets are normally valued as of the scheduled close of trading on the New York Stock Exchange (NYSE), generally 4:00 p.m. Eastern Time, each day that the NYSE is open for business.
Debt securities and derivatives traded over the counter are valued using prices received from independent pricing services which utilize dealer quotes, recent transaction data, pricing models, and other inputs to arrive at market-based valuations. Pricing models may consider quoted prices for similar securities, interest rates, cash flows (including prepayment speeds), and credit risk. Exchange-traded derivatives are valued at the settlement price determined by the relevant exchange. Other financial instruments for which market quotes are readily available are valued at market value. Short-term securities less than 60 days to maturity may be valued at amortized cost if amortized cost approximates current value. Mutual funds are valued at their respective net asset values. Security values are not discounted based on the size of the Fund’s position and may differ from the value a Fund receives upon sale of the securities.
Investments initially valued in currencies other than the U.S. dollar are converted to the U.S. dollar using prevailing exchange rates. Currency forward contracts are valued based on the prevailing forward exchange rates of the underlying currencies. As a result, the Fund’s net assets may be affected by changes in the value of currencies in relation to the U.S. dollar.
If market quotations are not readily available or if normal valuation procedures produce valuations that are deemed unreliable or inappropriate under the circumstances existing at the time, the investment will be valued at fair value as determined in good faith by or under the direction of the Fund’s Board of Trustees.
| 1 | | The Fund’s predecessor, Dodge & Cox Global Bond Fund, L.L.C. (the “Private Fund”), was organized on August 31, 2012 and commenced operations on December 5, 2012 as a private investment fund that reorganized into, and had the same investment manager as, the Fund. The Fund commenced operations on May 1, 2014, upon the transfer of assets from the Private Fund. This transaction was accomplished through a transfer of Private Fund net assets valued at $10,725,688 in exchange for 1,000,000 shares of the Fund. Immediately after the transfer, the shares of the Fund were distributed to the sole owner of the Private Fund and the investment manager of the Fund, Dodge & Cox, which became the initial shareholder of the Fund. |
The Board of Trustees has appointed Dodge & Cox, the Fund’s investment manager, to make fair value determinations in accordance with the Dodge & Cox Funds Valuation Policies (“Valuation Policies”), subject to Board oversight. Dodge & Cox has established a Pricing Committee that is comprised of representatives from Treasury, Legal, Compliance, and Operations. The Pricing Committee is responsible for implementing the Valuation Policies, including determining the fair value of securities and other investments when necessary. The Pricing Committee considers relevant indications of value that are reasonably available to it in determining the fair value assigned to a particular security, such as the value of similar financial instruments, trading volumes, contractual restrictions on disposition, related corporate actions, and changes in economic conditions. In doing so, the Pricing Committee employs various methods for calibrating fair valuation approaches, including a regular review of key inputs and assumptions, back-testing, and review of any related market activity.
Valuing securities through a fair value determination involves greater reliance on judgment than valuation of securities based on readily available market quotations. In some instances, lack of information and uncertainty as to the significance of information may lead to a conclusion that a prior valuation is the best indication of a security’s value. When fair value pricing is employed, the prices of securities used by the Fund to calculate its net asset value may differ from quoted or published prices for the same securities.
Security transactions, investment income, expenses, and distributions Security transactions are recorded on the trade date. Realized gains and losses on securities sold are determined on the basis of identified cost.
Interest income is recorded on the accrual basis. Interest income includes coupon interest, amortization of premium and accretion of discount on debt securities, gain/loss on paydowns, and inflation adjustments to the principal amount of inflation-indexed securities. The ability of the issuers of the debt securities held by the Fund to meet their obligations may be affected by economic developments in a specific industry, state, region, or country. Debt obligations may be placed on non-accrual status and related interest income may be reduced by ceasing current accruals and writing off interest receivables when the collection of all or a portion of interest has become doubtful. A debt obligation is removed from non-accrual status when the issuer resumes interest payments or when collectability of interest is reasonably assured. Dividend income is recorded on the ex-dividend date.
Expenses are recorded on the accrual basis. Some expenses of the Trust can be directly attributed to a specific series. Expenses which cannot be directly attributed are allocated among the Funds in the Trust using methodologies determined by the nature of the expense.
Distributions to shareholders are recorded on the ex-dividend date.
Foreign taxes The Fund is subject to foreign taxes which may be imposed by certain countries in which the Fund invests. The Fund endeavors to record foreign taxes based on applicable foreign tax law. Withholding taxes are incurred on certain foreign receipts and are accrued at the time the associated interest income is recorded.
DODGE & COX GLOBAL BOND FUND §PAGE 11
NOTES TO FINANCIAL STATEMENTS
Capital gains taxes are incurred upon disposition of certain foreign securities. Expected capital gains taxes on appreciated securities, if any, are accrued as unrealized losses and incurred capital gains taxes are reflected as realized losses upon the sale of the related security. Currency taxes may be incurred when the Fund purchases certain foreign currencies related to securities transactions and are recorded as realized losses on foreign currency transactions.
Repurchase agreements Repurchase agreements are transactions under which a Fund purchases a security from a dealer counterparty and agrees to resell the security to that counterparty on a specified future date at the same price, plus a specified interest rate. The Fund’s repurchase agreements are secured by U.S. government or agency securities. It is the Fund’s policy that its custodian take possession of the underlying collateral securities, the fair value of which exceeds the principal amount of the repurchase transaction, including accrued interest, at all times. In the event of default by the counterparty, the Fund has the contractual right to liquidate the securities and to apply the proceeds in satisfaction of the obligation.
Foreign currency translation The books and records of the Fund are maintained in U.S. dollars. Foreign currency amounts are translated into U.S. dollars at the prevailing exchange rates of such currencies against the U.S. dollar. The market value of investment securities and other assets and liabilities are translated at the exchange rate as of the valuation date. Purchases and sales of investment securities, income, and expenses are translated at the exchange rate prevailing on the transaction date.
Reported realized and unrealized gain (loss) on investments includes foreign currency gain (loss) related to investment transactions.
Reported realized and unrealized gain (loss) on foreign currency transactions and translation include the following: holding/disposing of foreign currency, the difference between the trade and settlement dates on securities transactions, the difference between the accrual and payment dates on interest, and currency losses on the purchase of foreign currency in certain countries that impose taxes on such transactions.
Indemnification Under the Trust’s organizational documents, its officers and trustees are indemnified against certain liabilities arising out of the performance of their duties to the Trust. In addition, in the normal course of business the Trust enters into contracts that provide general indemnities to other parties. The Trust’s maximum exposure under these arrangements is unknown as this would involve future claims that may be made against the Trust that have not yet occurred.
NOTE 2—VALUATION MEASUREMENTS
Various inputs are used in determining the value of the Fund’s investments. These inputs are summarized in the three broad levels listed below.
| § | | Level 1: Quoted prices in active markets for identical securities |
| § | | Level 2: Other significant observable inputs (including quoted prices for similar securities, market indices, interest rates, credit risk, forward exchange rates, etc.) |
| § | | Level 3: Significant unobservable inputs (including Fund management’s assumptions in determining the fair value of investments) |
The inputs or methodology used for valuing securities are not necessarily an indication of the risk associated with investing in those securities.
The following is a summary of the inputs used to value the Fund’s holdings at December 31, 2017:
| | | | | | | | |
| Classification(a) | | LEVEL 1
(Quoted Prices) | | | LEVEL 2
(Other Significant
Observable Inputs) | |
Securities | | | | | | | | |
Debt Securities | | | | | | | | |
Government | | $ | — | | | $
| 38,693,326
|
|
Government-Related | | | — | | | | 13,877,748 | |
Securitized | | | — | | | | 37,493,072 | |
Corporate | | | — | | | | 59,580,934 | |
Short-term Investments | | | | | | | | |
Commercial Paper | | | — | | | | 2,996,152 | |
Repurchase Agreement | | | — | | | | 5,686,000 | |
Money Market Fund | | | 155,554 | | | | — | |
| | | | | | | | |
Total Securities | | $ | 155,554 | | | $ | 158,327,232 | |
| | | | | | | | |
Other Investments | | | | | | | | |
Futures Contracts | | | | | | | | |
Appreciation | | $ | 122,818 | | | $ | — | |
Swaps | | | | | | | | |
Appreciation | | | — | | | | 1,147 | |
Depreciation | | | — | | | | (91,842 | ) |
Currency Forward Contracts | | | | | | | | |
Appreciation | | | — | | | | 174,909 | |
Depreciation | | | — | | | | (248,568 | ) |
| | | | | | | | | |
| (a) | There were no transfers between Level 1 and Level 2 during the year ended December 31, 2017. There were no Level 3 securities at December 31, 2017 and 2016, and there were no transfers to Level 3 during the year. |
NOTE 3—DERIVATIVE INSTRUMENTS
The Fund entered into various currency or interest rate-related transactions involving derivative instruments, including currency forward contracts, futures contracts, and swaps, in connection with its investment strategy. The Fund may use derivatives to minimize the impact of losses to one or more of its investments (as a “hedging technique”) or to implement its investment strategy.
The Fund has entered into over-the-counter derivatives, such as currency forward contracts (each, an “OTC Derivative”). Each OTC Derivative is subject to a negotiated master agreement (based on a form published by the International Swaps and Derivatives Association (“ISDA”)) governing all OTC Derivatives between the Fund and the relevant dealer counterparty. The master agreements specify (i) events of default and other events permitting a party to terminate some or all of the OTC Derivatives thereunder and (ii) the process by which those OTC Derivatives will be valued for purposes of determining termination payments. If some or all of the OTC Derivatives under a master agreement are terminated because of an event of default or similar event, the values of all terminated OTC Derivatives must be netted to
PAGE 12 § DODGE & COX GLOBAL BOND FUND
NOTES TO FINANCIAL STATEMENTS
determine a single payment owed by one party to the other. To the extent amounts owed to the Fund by its counterparties are not collateralized, the Fund is at risk of those counterparties’ non-performance. The Fund attempts to mitigate counterparty credit risk by entering into OTC Derivatives only with counterparties it believes to be of good credit quality, by exchanging collateral, and by monitoring the financial stability of those counterparties.
Futures contracts Futures contracts involve an obligation to purchase or sell (depending on whether the Fund has entered a long or short futures contract, respectively) an asset at a future date, at a price set at the time of the contract. Upon entering into a futures contract, the Fund is required to deposit an amount of cash or liquid assets (referred to as initial margin) in a segregated account with the clearing broker. Subsequent payments (referred to as variation margin) to and from the clearing broker are made on a daily basis based on changes in the market value of futures contracts. Futures contracts are traded publicly and their market value changes daily. Changes in the market value of open futures contracts are recorded as unrealized appreciation or depreciation in the Statement of Operations. Realized gains and losses on futures contracts are recorded in the Statement of Operations at the closing or expiration of the contracts. Cash deposited with a broker as initial margin is recorded in the Statement of Assets and Liabilities. A receivable and/or payable to brokers for daily variation margin is also recorded in the Statement of Assets and Liabilities.
Investments in futures contracts may include certain risks, which may be different from, and potentially greater than, those of the underlying securities. To the extent the Fund uses futures, it is exposed to additional volatility and potential losses resulting from leverage.
The Fund has maintained short Treasury futures contracts and short Euro-Bund futures contracts to assist with the management of the portfolio’s interest rate exposure. During the year ended December 31, 2017, these futures contracts had total notional values ranging from 14% to 18% of net assets.
Interest rate swaps Interest rate swaps are agreements that obligate two parties to exchange a series of cash flows at specified payment dates calculated by reference to specified interest rates, such as an exchange of floating rate payments for fixed rate payments. Upon entering into a centrally cleared interest rate swap, the Fund is required to post an amount of cash or liquid assets (referred to as initial margin) in a segregated account with the clearing broker. Subsequent payments (referred to as variation margin) to and from the clearing broker are made on a daily basis based on changes in the market value of each interest rate swap. Changes in the market value of open interest rate swaps are recorded as unrealized appreciation or depreciation in the Statement of Operations. Realized gains and losses on interest rate swaps are recorded in the Statement of Operations, both upon the exchange of cash flows on each specified payment date and upon the closing or expiration of the swap. Cash deposited with the clearing broker as initial margin is recorded in the Statement of Assets and Liabilities. A receivable and/or payable to brokers for daily variation margin is also recorded in the Statement of Assets and Liabilities.
Investments in interest rate swaps may include certain risks including unfavorable changes in interest rates, or a default or failure by the clearing broker or clearinghouse.
The Fund has maintained interest rate swaps in connection with the management of the portfolio’s interest rate exposure. During the year ended December 31, 2017, these interest rate swaps had U.S. dollar notional values ranging from 2% to 5% of net assets.
Currency forward contracts A currency forward contract, an OTC Derivative, represents an obligation to purchase or sell a specific foreign currency at a future date at a price set at the time of the contract. The values of the currency forward contracts are adjusted daily based on the prevailing forward exchange rates of the underlying currencies. Changes in the value of open contracts are recorded as unrealized appreciation or depreciation in the Statement of Operations. When the currency forward contract is closed, the Fund records a realized gain or loss in the Statement of Operations equal to the difference between the value at the time the contract was opened and the value at the time it was closed.
Losses from these transactions may arise from unfavorable changes in currency values or if the counterparties do not perform under a contract’s terms.
The Fund has maintained Indian rupee currency forward contracts as a substitute for a direct investment in India. During the year ended December 31, 2017, these Indian rupee currency forward contracts had U.S. dollar total values up to 3% of net assets.
The Fund has maintained currency forward contracts to hedge direct and/or indirect foreign currency exposure to the British pound, euro, Czech koruna, and Japanese yen. During the year ended December 31, 2017, these currency forward contracts had U.S. dollar total values ranging from 10% to 12% of net assets.
Additional derivative information For financial reporting purposes, the Fund does not offset OTC Derivative assets and liabilities that are subject to a master netting arrangement in the Statement of Assets and Liabilities. OTC Derivatives are presented in the Statement of Assets and Liabilities as unrealized appreciation/(depreciation) on currency forward contracts. Cash collateral pledged or received by the Fund for OTC Derivatives, if any, are reported gross in the Statement of Assets and Liabilities as cash pledged/(received) as collateral for currency forward contracts. Derivative information by counterparty is presented in the Portfolio of Investments.
The netting of assets and liabilities and the offsetting of collateral pledged or received are based on contractual netting/set-off provisions in the ISDA master agreement. The following table presents the Fund’s net exposure for OTC Derivatives that are subject to enforceable master netting arrangements as of December 31, 2017. The net amount represents the receivable from (payable to) the counterparty in the event of a default.
| | | | | | | | | | | | | | | | |
| Counterparty | | Gross OTC Derivative Assets | | | Gross OTC Derivative Liabilities | | | Cash Collateral Pledged / (Received) | | | Net Amount | |
Barclays | | $ | 174,909 | | | $ | (233,658 | ) | | $ | — | | | $ | (58,749 | ) |
Citibank | | | — | | | | (1,997 | ) | | | — | | | | (1,997 | ) |
Credit Suisse | | | — | | | | (6,484 | ) | | | — | | | | (6,484 | ) |
Goldman Sachs | | | — | | | | (1,824 | ) | | | — | | | | (1,824 | ) |
JPMorgan | | | — | | | | (4,605 | ) | | | — | | | | (4,605 | ) |
| | | | | | | | | | | | | | | | |
Total | | $ | 174,909 | | | $ | (248,568 | ) | | $ | — | | | $ | (73,659 | ) |
| | | | | | | | | | | | | | | | |
DODGE & COX GLOBAL BOND FUND §PAGE 13
NOTES TO FINANCIAL STATEMENTS
NOTE 4—RELATED PARTY TRANSACTIONS
Management fees Under a written agreement approved by a unanimous vote of the Board of Trustees, the Fund pays a management fee monthly at an annual rate of 0.50% of the Fund’s average daily net assets to Dodge & Cox, investment manager of the Fund. Effective May 1, 2017, Dodge & Cox has contractually agreed to reimburse the Fund for all ordinary expenses to the extent necessary to maintain the ratio of total operating expenses to average net assets (“net expense ratio”) at 0.45% through April 30, 2018. The term of the agreement is renewable annually thereafter unless terminated with 30 days’ written notice by either party prior to the end of the term. For periods prior to May 1, 2017, the Fund’s net expense ratio was 0.60%.
Fund officers and trustees All officers and two of the trustees of the Trust are officers or employees of Dodge & Cox. The Trust pays a fee only to those trustees who are not affiliated with Dodge & Cox.
Share ownership At December 31, 2017, Dodge & Cox owned 10% of the Fund’s outstanding shares.
NOTE 5—INCOME TAX INFORMATION AND DISTRIBUTIONS TO SHAREHOLDERS
A provision for federal income taxes is not required since the Fund intends to continue to qualify as a regulated investment company under Subchapter M of the Internal Revenue Code and distribute all of its taxable income to shareholders. Distributions are determined in accordance with income tax regulations, and such amounts may differ from net investment income and realized gains for financial reporting purposes. Financial reporting records are adjusted for permanent book to tax differences at year end to reflect tax character.
Book to tax differences are primarily due to differing treatments of wash sales, net short-term realized gain (loss), foreign currency realized gain (loss), straddles, and derivatives. At December 31, 2017, the cost of investments in securities and derivatives for federal income tax purposes was $155,167,259.
Distributions during the years noted below were characterized as follows for federal income tax purposes:
| | | | | | | | |
| | | Year Ended
December 31, 2017 | | | Year Ended
December 31, 2016 | |
Ordinary income | | $ | 3,557,479 | | | $ | 1,791,680 | |
| | ($ | 0.268 per share | ) | | ($ | 0.175 per share | ) |
Long-term capital gain | | | — | | | | — | |
At December 31, 2017, the tax basis components of distributable earnings were as follows:
| | | | |
Unrealized appreciation | | $ | 4,358,276 | |
Unrealized depreciation | | | (1,084,285 | ) |
| | | | |
Net unrealized appreciation | | | 3,273,991 | |
Undistributed ordinary income | | | 258,485 | |
Undistributed long-term capital gain | | | 185,906 | |
| | | | | |
Fund management has reviewed the tax positions for the open period (three years from filing the Fund’s federal and State tax returns) applicable to the Fund, and has determined that no provision for income tax is required in the Fund’s financial statements.
NOTE 6—LOAN FACILITIES
Pursuant to an exemptive order issued by the Securities and Exchange Commission (SEC), the Fund may participate in an interfund lending facility (Facility). The Facility allows the Fund to borrow money from or loan money to the Funds. Loans under the Facility are made for temporary or emergency purposes, such as to fund shareholder redemption requests. Interest on borrowings is the average of the current repurchase agreement rate and the bank loan rate. There was no activity in the Facility during the year.
All Funds in the Trust participate in a $500 million committed credit facility (Line of Credit) with State Street Bank and Trust Company, to be utilized for temporary or emergency purposes to fund shareholder redemptions or for other short-term liquidity purposes. The maximum amount available to the Fund is $250 million. Each Fund pays an annual commitment fee on its pro-rata portion of the Line of Credit. For the year ended December 31, 2017, the Fund’s commitment fee amounted to $796 and is reflected as a Miscellaneous Expense in the Statement of Operations. Interest on borrowings is charged at the prevailing rate. There were no borrowings on the Line of Credit during the year.
NOTE 7—PURCHASES AND SALES OF INVESTMENTS
For the year ended December 31, 2017, purchases and sales of securities, other than short-term securities and U.S. government securities, aggregated $52,774,629 and $36,485,878, respectively. For the year ended December 31, 2017, purchases and sales of U.S. government securities aggregated $28,032,808 and $17,588,104, respectively.
NOTE 8—NEW ACCOUNTING GUIDANCE
In March 2017, the Financial Accounting Standards Board issued an update to amend the amortization period for certain purchased callable debt securities held at a premium. The amendments shorten the amortization period for premiums to the earliest call date, but do not require an accounting change for securities held at a discount. The amendments are effective for financial statements for fiscal years beginning after December 15, 2018, and interim periods within those fiscal years. Management is evaluating the impact, if any, of this guidance on the Fund’s financial statements and disclosures.
NOTE 9—SUBSEQUENT EVENTS
Fund management has determined that no material events or transactions occurred subsequent to December 31, 2017, and through the date of the Fund’s financial statements issuance, which require additional disclosure in the Fund’s financial statements.
PAGE 14 § DODGE & COX GLOBAL BOND FUND
FINANCIAL HIGHLIGHTS
| | | | | | | | | | | | | | | | |
SELECTED DATA AND RATIOS (for a share outstanding throughout each period) | | Year Ended December 31, | | | Period from May 1, 2014
(commencement of Fund operations)
to December 31, 2014 | |
| | 2017 | | | 2016 | | | 2015 | | |
Net asset value, beginning of period | | | $10.33 | | | | $9.67 | | | | $10.31 | | | | $10.73 | |
Income from investment operations: | | | | | | | | | | | | | | | | |
Net investment income | | | 0.37 | | | | 0.30 | | | | 0.34 | | | | 0.16 | |
Net realized and unrealized gain (loss) | | | 0.49 | | | | 0.54 | | | | (0.98 | ) | | | (0.44 | ) |
| | | | |
Total from investment operations | | | 0.86 | | | | 0.84 | | | | (0.64 | ) | | | (0.28 | ) |
| | | | |
Distributions to shareholders from: | | | | | | | | | | | | | | | | |
Net investment income | | | (0.26 | ) | | | (0.18 | ) | | | — | | | | (0.14 | ) |
Net realized gain | | | (0.01 | ) | | | — | | | | — | | | | — | |
| | | | |
Total distributions | | | (0.27 | ) | | | (0.18 | ) | | | — | | | | (0.14 | ) |
| | | | |
Net asset value, end of period | | | $10.92 | | | | $10.33 | | | | $9.67 | | | | $10.31 | |
| | | | |
Total return | | | 8.31 | % | | | 8.64 | % | | | (6.21 | )% | | | (2.59 | )% |
Ratios/supplemental data: | | | | | | | | | | | | | | | | |
Net assets, end of period (millions) | | | $156 | | | | $110 | | | | $68 | | | | $65 | |
Ratios of expenses to average net assets | | | 0.49 | % | | | 0.60 | % | | | 0.60 | % | | | 0.60 | %(a) |
Ratio of expenses to average net assets, before reimbursement by investment manager | | | 1.06 | % | | | 1.33 | % | | | 1.41 | % | | | 2.18 | %(a) |
Ratios of net investment income to average net assets | | | 3.51 | % | | | 3.77 | % | | | 3.39 | % | | | 2.83 | %(a) |
Portfolio turnover rate | | | 46 | % | | | 73 | % | | | 55 | % | | | 36 | % |
See accompanying Notes to Financial Statements
DODGE & COX GLOBAL BOND FUND §PAGE 15
REPORT OF INDEPENDENT REGISTERED PUBLIC ACCOUNTING FIRM
To the Board of Trustees of the Dodge & Cox Funds and Shareholders of Dodge & Cox Global Bond Fund
Opinion on the Financial Statements
We have audited the accompanying statement of assets and liabilities, including the portfolio of investments, of Dodge & Cox Global Bond Fund (one of the funds constituting Dodge & Cox Funds, referred to hereafter as the “Fund”) as of December 31, 2017, the related statement of operations for the year ended December 31, 2017, the statement of changes in net assets for each of the two years in the period ended December 31, 2017, including the related notes, and the financial highlights for each of the periods indicated therein (collectively referred to as the “financial statements”). In our opinion, the financial statements present fairly, in all material respects, the financial position of the Fund as of December 31, 2017, the results of its operations for the year then ended, the changes in its net assets for each of the two years in the period ended December 31, 2017 and the financial highlights for each of the periods indicated therein in conformity with accounting principles generally accepted in the United States of America.
Basis for Opinion
These financial statements are the responsibility of the Fund’s management. Our responsibility is to express an opinion on the Fund’s financial statements based on our audits. We are a public accounting firm registered with the Public Company Accounting Oversight Board (United States) (“PCAOB”) and are required to be independent with respect to the Fund in accordance with the U.S. federal securities laws and the applicable rules and regulations of the Securities and Exchange Commission and the PCAOB.
We conducted our audits of these financial statements in accordance with the standards of the PCAOB. Those standards require that we plan and perform the audit to obtain reasonable assurance about whether the financial statements are free of material misstatement, whether due to error or fraud.
Our audits included performing procedures to assess the risks of material misstatement of the financial statements, whether due to error or fraud, and performing procedures that respond to those risks. Such procedures included examining, on a test basis, evidence regarding the amounts and disclosures in the financial statements. Our audits also included evaluating the accounting principles used and significant estimates made by management, as well as evaluating the overall presentation of the financial statements. Our procedures included confirmation of securities owned as of December 31, 2017 by correspondence with the custodian, transfer agent and brokers; when replies were not received from brokers, we performed other auditing procedures. We believe that our audits provide a reasonable basis for our opinion.
PricewaterhouseCoopers LLP
San Francisco, California
February 16, 2018
We have served as the auditor of one or more investment companies in the Dodge & Cox Funds since 1931.
PAGE 16 § DODGE & COX GLOBAL BOND FUND
BOARD APPROVAL OF FUNDS’ INVESTMENT MANAGEMENT AGREEMENTS AND MANAGEMENT FEES
(unaudited)
The Board of Trustees is responsible for overseeing the performance of the Dodge & Cox Funds’ investment manager and determining whether to continue the Investment Management Agreements between the Funds and Dodge & Cox each year (the “Agreements”). At a meeting of the Board of Trustees of the Trust held on December 14, 2017, the Trustees, by a unanimous vote (including a separate vote of those Trustees who are not “interested persons” (as defined in the Investment Company Act of 1940) (the “Independent Trustees”)), approved the renewal of the Agreements for an additional one-year term through December 31, 2018 with respect to each Fund. During the course of the year, the Board received extensive information and materials relating to the investment management and administrative services provided by Dodge & Cox and the performance of each of the Funds.
INFORMATION RECEIVED
In 2016 and 2017, the Board requested, received, and discussed a number of special presentations on topics relevant to their consideration of the proposed renewal of the Funds’ Agreements. In addition to the foregoing and in advance of the meetings referred to below, the Board, including the Independent Trustees, requested, received, and reviewed materials relating to the Agreements and the services provided by Dodge & Cox. The Independent Trustees retained Morningstar to prepare an independent expense and performance summary for each Fund and comparable funds managed by other advisers identified by Morningstar. The Morningstar materials included information regarding advisory fee rates, expense ratios, and transfer agency, custodial, and distribution expenses, as well as performance comparisons to each Fund’s peer group and to a broad-based securities index or combination of indices. The Morningstar materials also included a comparison of expenses of various share classes offered by comparable funds. The materials reviewed by the Board contained information concerning, among other things, Dodge & Cox’s profitability, financial results and condition, advisory fee revenue, and separate account fee schedules. The Board additionally considered the Funds’ brokerage commissions, turnover rates, sales and redemption data, and the significant investment that Dodge & Cox makes in research used in managing the Funds. The Board received and reviewed memoranda and related materials addressing, among other things, Dodge & Cox’s services to the Funds; how Dodge & Cox Funds’ fees compare to fees of peer group funds; the different fees, services, costs, and risks associated with other accounts managed by Dodge & Cox as compared to the Dodge & Cox Funds; and the ways in which the Funds realize economies of scale. Throughout the process of reviewing the services provided by Dodge & Cox and preparing for the meeting, the Independent Trustees found Dodge & Cox to be open, forthright, detailed, and very helpful in answering questions about all issues. The Board received copies of the Agreements and a memorandum from the independent legal counsel to the
Independent Trustees discussing the factors generally regarded as appropriate to consider in evaluating advisory arrangements. The Trust’s Contract Review Committee, consisting solely of Independent Trustees, met with the independent legal counsel on November 9, 2017 and again on December 14, 2017 to discuss whether to renew the Agreements. The Board, including the Independent Trustees, subsequently concluded that the existing Agreements are fair and reasonable and voted to approve the Agreements. In considering the Agreements, the Board, including the Independent Trustees, did not identify any single factor or particular information as all-important or controlling. In reaching the decision to approve the Agreements, the Board considered several factors, discussed below, to be key factors and reached the conclusions described below.
NATURE, QUALITY, AND EXTENT OF THE SERVICES
The Board considered that Dodge & Cox provides a wide range of services to the Funds in addition to portfolio management. The extensive nature of services provided by Dodge & Cox has been documented in materials provided to the Board and in presentations made to the Board throughout the year. In particular, the Board considered the nature, quality, and extent of portfolio management, administrative, and shareholder services performed by Dodge & Cox. With regard to portfolio management services, the Board considered Dodge & Cox’s established long-term history of care and conscientiousness in the management of the Funds; its demonstrated consistency in investment approach and depth; the background and experience of the Dodge & Cox U.S. Equity Investment Committee, International Equity Investment Committee, Global Equity Investment Committee, U.S. Fixed Income Investment Committee, and Global Fixed Income Investment Committee, and research analysts responsible for managing the Funds; Dodge & Cox’s methods for assessing the regulatory and investment climate in various jurisdictions; its overall high level of attention to its core investment management function; and its commitment to the Funds and their shareholders. The Board also considered analysis provided by Morningstar regarding the degree of active management in the Dodge & Cox equity funds and concluded that Dodge & Cox is an active, high conviction manager of equity portfolios, not a “closet index” manager.
In the area of administrative and shareholder services, the Board considered the quality of Dodge & Cox’s work in areas such as compliance, legal services, trading, operations, proxy voting, technology, oversight of the Funds’ transfer agent and custodian/fund accounting agent, tax compliance, risk management, shareholder support, and shareholder communication through its website and other means. The Board also noted Dodge & Cox’s disclosure policy, its compliance record, and its reputation as a trusted, shareholder-friendly mutual fund family.
In addition, the Board considered that Dodge & Cox manages approximately $200 billion in Fund assets with fewer professionals than most comparable funds, and that on average these professionals have more experience and longer tenure than investment professionals at comparable funds. The Board also noted that
DODGE & COX GLOBAL BOND FUND §PAGE 17
Dodge & Cox is an investment research-oriented firm with no other business endeavors to distract management’s attention from its research efforts or to present material conflicts of interest with the operations of the Funds, that its investment professionals adhere to a consistent investment approach across the Funds, and that due to its careful and deliberate strategy with respect to new products, Dodge & Cox has had remarkable stability in its mutual fund product offerings over the course of the past 87 years and has the fewest funds of any of the 25 largest mutual fund families by assets. The Board further considered the “Gold” analyst rating awarded by Morningstar to all of the Funds (other than the Global Bond Fund). The Board concluded that it was satisfied with the nature, extent, and quality of investment management and other services provided to the Funds by Dodge & Cox.
INVESTMENT PERFORMANCE
The Board considered short-term and long-term investment performance for each Fund (including periods of outperformance or underperformance) as compared to both relevant indices and the performance of such Fund’s peer group. In assessing the performance of the Funds, the Board considered the Funds’ investment returns over various periods and the volatility thereof and concluded that the levels experienced were consistent with Dodge & Cox’s long-term approach and active investment style. The Board determined after extensive review and inquiry that Dodge & Cox’s historic, long-term, team-oriented, bottom-up investment approach remains consistent and that Dodge & Cox continues to be distinguished by its integrity, transparency, and independence. The Board considered that the performance of the Funds is the result of a value-oriented investment management process that emphasizes a long-term investment horizon, comprehensive independent research, a team approach, price discipline, low cost, and low portfolio turnover. The Board also considered that the investment performance delivered by Dodge & Cox to the Funds appeared to be consistent with the relevant performance delivered for other clients of Dodge & Cox. The Board concluded that Dodge & Cox has delivered favorable long-term performance for Fund investors consistent with the long-term investment strategies being pursued by the Funds.
COSTS AND ANCILLARY BENEFITS
Costs of Services to Funds: Fees and Expenses. The Board considered each Fund’s management fee rate and expense ratio relative to each Fund’s peer group and relative to management fees charged by Dodge & Cox to other clients. In particular, the Board considered that the Funds continue to be below their peer group median in expense ratios and that many media and industry reports specifically comment on the low cost of the Funds, which have been a defining characteristic of the Funds for many years. The Board also evaluated the operating structures of the Funds and Dodge & Cox, noting that the Funds do not charge front-end sales commissions or distribution fees, and Dodge & Cox bears, among other things, the significant cost of third party research, reimbursement for shareholder recordkeeping and administrative costs to third-party retirement plan administrators, and administrative and office overhead. The Board noted that expenses are well below industry averages.
When compared to peer group funds, the Funds are in the quartile with the lowest expense ratios. The Board also considered that the Funds receive numerous administrative, regulatory compliance, legal, operational, technology, tax compliance, risk management, and shareholder support services from Dodge & Cox without any additional administrative fee and that the Funds have relatively low transaction costs and portfolio turnover rates. The Board noted the Funds’ unusual single-share-class structure and reviewed Morningstar data (including asset-weighted average expense ratios) showing that the few peer group funds with lower expense ratios often have other share classes with significantly higher expense ratios than the Funds’. In this regard, the Board considered that many of the Funds’ shareholders would not be eligible to purchase comparably priced shares of many peer group funds, which typically make their lower-priced share classes available only to institutional investors. The Board determined that the Funds provide access for small investors to high quality investment management at a relatively low cost. The Board also considered that the Funds are priced to scale, i.e., management fee rates begin at relatively low levels with the result that, even without breakpoints, the Funds’ management fee rates are lower than those of many peer funds whose fee schedules include breakpoints. With respect to non-U.S. funds sponsored and managed by Dodge & Cox that are comparable to the Funds in many respects, the Board noted that the fee rates charged by Dodge & Cox are the same as or higher than the fee rates charged to the Funds.
The Board reviewed information regarding the fee rates Dodge & Cox charges to separate accounts that have investment programs similar to those of the Funds, including instances where separate account fees are lower than Fund fees. The Board considered the significant differences in the nature and scope of services Dodge & Cox provides to the Funds as compared to other client accounts, as well as material differences in regulatory, litigation, and other risks as between Dodge & Cox Funds and other types of clients. The Board noted that different markets exist for mutual fund and institutional separate account management services and that a comparison of Fund fee rates and separate account fee rates must consider the fact that separate account clients bear additional costs and responsibilities that are included in the cost of a Fund. The Board further noted that many sophisticated institutional investors in the Funds that are eligible to open separate accounts at Dodge & Cox have decided for various reasons to invest in the Funds. After consideration of these matters, the Board concluded that the overall costs incurred by the Funds for the services they receive (including the management fee paid to Dodge & Cox) are reasonable and that the fees are acceptable based upon the qualifications, experience, reputation, and performance of Dodge & Cox and the low overall expense ratios of the Funds.
Profitability and Costs of Services to Dodge & Cox; “Fall-out” Benefits. The Board reviewed reports of Dodge & Cox’s financial position, profitability, and estimated overall value and considered Dodge & Cox’s overall profitability within its context as a private, employee-owned S-Corporation
PAGE 18 § DODGE & COX GLOBAL BOND FUND
and relative to the favorable services provided. The Board noted in particular that Dodge & Cox’s profits are not generated by high fee rates, but reflect an extraordinarily streamlined, efficient, and focused business approach toward investment management.
The Board recognized the importance of Dodge & Cox’s profitability—which is derived solely from management fees and does not include other business ventures—to maintain its independence, stability, company culture and ethics, and management continuity. The Board also considered that the compensation/profit structure at Dodge & Cox includes a return on shareholder employees’ investment in the firm, which is vital for remaining independent and facilitating retention of management and investment professionals. The Board also considered that in January 2015, Dodge & Cox closed the International Stock Fund to new investors to proactively manage the growth of the Fund. The Stock Fund and Balanced Fund were similarly closed to new investors during periods of significant growth in the past. While these actions are intended to benefit existing Fund shareholders, the effect is to reduce potential revenues to Dodge & Cox from new shareholders.
The Board also considered potential “fall-out” benefits (including the receipt of research from unaffiliated brokers and reputational benefits to non-U.S. funds sponsored and managed by Dodge & Cox) that Dodge & Cox might receive as a result of its association with the Funds and determined that they are acceptable. The Board also noted that Dodge & Cox continues to invest substantial sums in its business in order to provide enhanced services, systems, and research capabilities, all of which benefit the Funds. The Board concluded that Dodge & Cox’s profitability is the keystone of its independence, stability, and long-term investment performance and that the profitability of Dodge & Cox’s relationship with the Funds (including fall-out benefits) is fair and reasonable.
ECONOMIES OF SCALE
The Board considered whether there have been economies of scale with respect to the management of each Fund, whether the Funds have appropriately benefited from any economies of scale, and whether the management fee rate is reasonable in relation to the level of Fund assets and any economies of scale that may exist. In the Board’s view, any consideration of economies of scale must take account of the Funds’ low fee and expense structure and of the fact that each Fund’s shareholders have benefited from the Fund’s relatively low fee structure from the time of each Fund’s inception (i.e., from the first dollar). An assessment of economies of scale must also take into account that Dodge & Cox invests significant time and resources in each new Fund for months (and sometimes years) prior to launch; in addition, in a Fund’s early periods of operations, expenses are capped, which means that Dodge & Cox subsidizes the operations of a new Fund for a period of time until it reaches scale. The Board also observed that, while total Fund assets have grown significantly over the long term, this growth has not been continuous or evenly distributed across all of the Funds (for example, the total assets of the Balanced Fund have actually declined over the past ten years).
In addition, the Board noted that Dodge & Cox has shared the benefits of economies of scale with the Funds by adding and enhancing services to the Funds over time, and that Dodge & Cox’s internal costs of providing investment management, technology, administrative, legal, and compliance services to the Funds continue to increase. For example, Dodge & Cox has increased its global research staff and investment resources over the years to add important new capabilities for the benefit of Fund shareholders and to address the increased complexity of investing in multinational and non-U.S. companies. In addition, Dodge & Cox has made substantial expenditures in other staff, technology, and infrastructure to enable it to integrate credit and equity analyses and to implement its strategy in a more effective and secure manner. Over the last ten years, Dodge & Cox has increased its spending on research, investment management, client servicing, cybersecurity, technology, third party research, data services, and computer systems for trading, operations, compliance, accounting, and communications at a rate that has significantly outpaced the Funds’ growth rate during the same period. The Board considered that Dodge & Cox has a history of voluntarily limiting asset growth in several Funds that experienced significant inflows by closing them to new investors in order to protect the Funds’ ability to achieve good investment returns for shareholders. The Board also observed that, even without fee breakpoints, the Funds are competitively priced in a very competitive market and that having a low fee from inception is better for shareholders than starting with a higher fee and adding breakpoints. The Board also noted that there are certain diseconomies of scale associated with managing large funds, insofar as certain of the costs and risks associated with portfolio management increase as assets grow. The Board concluded that the current Dodge & Cox fee structure is fair and reasonable and adequately shares economies of scale that may exist.
CONCLUSION
Based on their evaluation of all material factors and assisted by the advice of independent legal counsel to the Independent Trustees, the Board, including the Independent Trustees, concluded that the advisory fee structure was fair and reasonable, that each Fund was paying a competitive fee for the services provided, that Dodge & Cox’s services have provided value for Fund shareholders over the long term, and that approval of the Agreements was in the best interests of each Fund and its shareholders.
DODGE & COX GLOBAL BOND FUND §PAGE 19
FUND HOLDINGS
The Fund provides a complete list of its holdings four times each fiscal year, as of the end of each quarter. The Fund files the lists with the Securities and Exchange Commission (SEC) on Form N-CSR (second and fourth quarters) and Form N-Q (first and third quarters). Shareholders may view the Fund’s Forms N-CSR and N-Q on the SEC’s website at sec.gov. Forms N-CSR and N-Q may also be reviewed and copied at the SEC’s Public Reference Room in Washington, DC. Information regarding the operations of the Public Reference Room may be obtained by calling 800-SEC-0330. A list of the Fund’s quarter-end holdings is also available at dodgeandcox.com on or about 15 days following each quarter end and remains available on the web site until the list is updated in the subsequent quarter.
PROXY VOTING
For a free copy of the Fund’s proxy voting policies and procedures, please call 800-621-3979, visit the Fund’s website at www.dodgeandcox.com, or visit the SEC’s website at sec.gov. Information regarding how the Fund voted proxies relating to portfolio securities during the most recent 12-month period ending June 30 is also available at dodgeandcox.com or at sec.gov.
HOUSEHOLD MAILINGS
The Fund routinely mails shareholder reports and summary prospectuses to shareholders and, on occasion, proxy statements. In order to reduce the volume of mail, when possible, only one copy of these documents will be sent to shareholders who are part of the same family and share the same residential address.
If you have a direct account with the Funds and you do not want the mailing of shareholder reports and summary prospectuses combined with other members in your household, contact the Funds at 800-621-3979. Your request will be implemented within 30 days.
PAGE 20 § DODGE & COX GLOBAL BOND FUND
THIS PAGE INTENTIONALLY LEFT BLANK
DODGE & COX GLOBAL BOND FUND §PAGE 21
THIS PAGE INTENTIONALLY LEFT BLANK
PAGE 22 § DODGE & COX GLOBAL BOND FUND
DODGE & COX FUNDS—EXECUTIVE OFFICER & TRUSTEE INFORMATION
| | | | | | |
Name (Age) and
Address* | | Position with Trust (Year of Election or
Appointment) | | Principal Occupation During Past 5 Years | | Other Directorships Held by Trustees |
| INTERESTED TRUSTEES AND EXECUTIVE OFFICERS |
| Charles F. Pohl (59) | | Chairman and Trustee (Since 2014) | | Chairman (since 2013) and Director of Dodge & Cox; Chief Investment Officer, member of U.S. Equity Investment Committee (USEIC), Global Equity Investment Committee (GEIC), International Equity Investment Committee (IEIC), and U.S. Fixed Income Investment Committee (USFIIC), Portfolio Manager, and Investment Analyst; Co-President (2011-2013) | | — |
| Dana M. Emery (56) | | President and Trustee (Trustee since 1993) (President since 2014) | | Chief Executive Officer (since 2013), President, and Director of Dodge & Cox; Director of Fixed Income and member of USFIIC and Global Fixed Income Investment Committee (GFIIC); Co-President (2011-2013) | | — |
| Diana S. Strandberg (58) | | Senior Vice President (Since 2006) | | Senior Vice President and Director of Dodge & Cox; Director of International Equity and member of USEIC, GEIC, IEIC and GFIIC; Portfolio Manager and Investment Analyst | | — |
Roberta R.W. Kameda (57) | | Secretary (Since 2017) | | Vice President, General Counsel, and Secretary (since 2017) of Dodge & Cox | | — |
| David H. Longhurst (60) | | Treasurer (Since 2006) | | Vice President and Assistant Treasurer of Dodge & Cox | | — |
| Katherine M. Primas (43) | | Chief Compliance Officer (Since 2010) | | Vice President and Chief Compliance Officer of Dodge & Cox | | — |
| INDEPENDENT TRUSTEES |
| Caroline M. Hoxby (51) | | Trustee (Since 2017) | | Professor of Economics, Stanford University; Director of the Economics of Education Program, National Bureau of Economic Research; Senior Fellow, Hoover Institution and Stanford Institute for Economic Policy Research | | — |
Thomas A. Larsen (68) | | Trustee (Since 2002) | | Senior Counsel of Arnold & Porter (law firm) (since 2013); Partner of Arnold & Porter (until 2012); Director of Howard, Rice, Nemerovski, Canady, Falk & Rabkin (1977-2011) | | — |
| Ann Mather (57) | | Trustee (Since 2011) | | CFO, Pixar Animation Studios (1999-2004) | | Director, Alphabet Inc. (internet information services) (since 2005); Director, Glu Mobile, Inc. (multimedia software) (since 2004); Director, Netflix, Inc. (internet television) (since 2010); Director, Arista Networks (cloud networking) (since 2013); Director, Shutterfly, Inc. (internet photography services/publishing) (since 2013) |
| Robert B. Morris III (65) | | Trustee (Since 2011) | | Advisory Director, The Presidio Group (2005-2016); Partner and Managing Director—Global Investment Research at Goldman Sachs (until 2001) | | — |
| Gary Roughead (66) | | Trustee (Since 2013) | | Robert and Marion Oster Distinguished Military Fellow, Hoover Institution (since 2012); Admiral, United States Navy (Ret.); U.S. Navy Chief of Naval Operations (2008-2011) | | Director, Northrop Grumman Corp. (global security) (since 2012); Director, Maersk Line, Limited (shipping and transportation) (since 2016) |
| Mark E. Smith (66) | | Trustee (Since 2014) | | Executive Vice President, Managing Director—Fixed Income at Loomis Sayles & Company, L.P. (2003-2011) | | — |
| John B. Taylor (71) | | Trustee (Since 2005) (and 1995-2001) | | Professor of Economics, Stanford University (since 1984); Senior Fellow, Hoover Institution (since 1996); Under Secretary for International Affairs, United States Treasury (2001-2005) | | — |
| * | | The address for each Officer and Trustee is 555 California Street, 40th Floor, San Francisco, California 94104. Each Officer and Trustee oversees all six series in the Dodge & Cox Funds complex and serves for an indefinite term. |
Additional information about the Trust’s Trustees and Officers is available in the Trust’s Statement of Additional Information (SAI). You can get a free copy of the SAI by visiting the Funds’ website at dodgeandcox.com or calling 800-621-3979.
DODGE & COX GLOBAL BOND FUND §PAGE 23
dodgeandcox.com
For Fund literature, transactions, and account
information, please visit the Funds’ website.
or write or call:
DODGE & COX FUNDS
c/o DST Asset Manager Solutions, Inc.
P.O. Box 8422
Boston, Massachusetts 02266-8422
(800) 621-3979
INVESTMENT MANAGER
Dodge & Cox
555 California Street, 40th Floor
San Francisco, California 94104
(415) 981-1710
This report is submitted for the general information of the shareholders of the Fund. The report is not authorized for distribution to prospective investors in the Fund unless it is accompanied by a current prospectus.
This report reflects our views, opinions, and portfolio holdings as of December 31, 2017, the end of the reporting period. Any such views are subject to change at any time based upon market or other conditions and Dodge & Cox disclaims any responsibility to update such views. These views may not be relied on as investment advice and, because investment decisions for a Dodge & Cox Fund are based on numerous factors, may not be relied on as an indication of trading intent on behalf of any Dodge & Cox Fund.
ITEM 2. CODE OF ETHICS.
A code of ethics, as defined in Item 2 of Form N-CSR, adopted by the registrant and applicable to the registrant’s principal executive officer and principal financial officer was in effect during the entire period covered by this report. A copy of the code of ethics as revised May 1, 2014 is filed as an exhibit to this Form N-CSR. No substantive amendments were approved or waivers were granted to this code of ethics during the period covered by this report.
ITEM 3. AUDIT COMMITTEE FINANCIAL EXPERT.
The Board of Trustees of the registrant has determined that Ann Mather, Robert B. Morris III and Mark E. Smith, members of the registrant’s Audit and Compliance Committee, are each an “audit committee financial expert” and are “independent”, as defined in Item 3 of Form N-CSR.
ITEM 4. PRINCIPAL ACCOUNTANT FEES AND SERVICES.
(a) - (d) Aggregate fees billed to the registrant for the fiscal years ended December 31, 2017 and December 31, 2016 for professional services rendered by the registrant’s principal accountant were as follows:
| | | | |
| | | 2017 | | 2016 |
| (a) Audit Fees | | $353,000 | | $353,000 |
(b) Audit-Related Fees | | — | | — |
(c) Tax Fees | | 237,600 | | 224,000 |
(d) All Other Fees | | — | | — |
Audit fees include amounts related to the audit of the registrant’s annual financial statements and services normally provided by the accountant in connection with statutory and regulatory filings. Tax fees include amounts related to tax advice and tax return preparation, compliance, and reviews.
(e)(1) The registrant’s Audit and Compliance Committee has adopted policies and procedures (“Policies”) which require the registrant’s Audit and Compliance Committee to pre-approve all audit and non-audit services provided by the principal accountant to the registrant. The policies also require the Audit and Compliance Committee to pre-approve any engagement of the principal accountant to provide non-audit services to the registrant’s investment adviser, if the services directly impact the registrant’s operations and financial reporting. The Policies do not apply in the case of audit services that the principal accountant provides to the registrant’s adviser. If a service (other than the engagement of the principal accountant to audit the registrant’s financial statements) is required to be pre-approved under the Policies between regularly scheduled Audit and Compliance Committee meetings, pre-approval may be authorized by a designated Audit and Compliance Committee member with ratification at the next scheduled Audit and Compliance Committee meeting.
(e)(2) No services included in (b) - (d) above were approved pursuant to paragraph (c)(7)(i)(C) of Rule 2-01 of Regulation S-X.
(f) Less than 50% of the hours expended on the principal accountant’s engagement to audit the registrant’s financial statements for the most recent fiscal year were attributed to work performed by persons other than the principal accountant’s full-time, permanent employees.
(g) For the fiscal years ended December 31, 2017 and December 31, 2016, the aggregate fees billed by the registrant’s principal accountant for non-audit services rendered to the registrant, for non-audit services rendered to the registrant’s investment adviser, and for non-audit services rendered to entities controlled by the adviser were $700,700 and $660,000, respectively.
(h) All non-audit services described under (g) above that were not pre-approved by the registrant’s Audit and Compliance Committee were considered by the registrant’s Audit and Compliance Committee and found to be compatible with maintaining the principal accountant’s independence.
ITEM 5. AUDIT COMMITTEE OF LISTED REGISTRANTS.
Not applicable.
ITEM 6. SCHEDULE OF INVESTMENTS.
Not applicable. The complete schedule of investments is included in Item 1 of this Form N-CSR.
ITEM 7. DISCLOSURE OF PROXY VOTING POLICIES AND PROCEDURES FOR CLOSED-END MANAGEMENT INVESTMENT COMPANIES.
Not applicable.
ITEM 8. PORTFOLIO MANAGERS OF CLOSED-END MANAGEMENT INVESTMENT COMPANIES.
Not applicable.
ITEM 9. PURCHASES OF EQUITY SECURITIES BY CLOSED-END MANAGEMENT INVESTMENT COMPANY AND AFFILIATED PURCHASERS.
Not applicable.
ITEM 10. SUBMISSION OF MATTERS TO A VOTE OF SECURITY HOLDERS.
The registrant has adopted the following procedures by which shareholders may recommend nominees to the registrant’s Board of Trustees.
1. The shareholder must submit any such recommendation in writing to the registrant to the attention of the Secretary at the address of the principal executive offices of the registrant. The shareholder’s recommendation is then considered by the registrant’s Nominating Committee.
2. The shareholder recommendation must include:
(i) A statement in writing setting forth (a) the name, date of birth, business address and residence address of the person recommended by the shareholder (the “candidate”); and (b) whether the recommending shareholder believes that the candidate is or will be an “interested person” of the registrant (as defined in the Investment Company Act of 1940) and, if not an “interested person,” information regarding the candidate that will be sufficient for the registrant to make such determination and, if applicable, similar information regarding whether the candidate would satisfy the standards for independence of a Board member under listing standards of the New York Stock Exchange or other applicable securities exchange.
(ii) The written and manually signed consent of the candidate to be named as a nominee and to serve as a Trustee if elected;
(iii) The recommending shareholder’s name as it appears on the registrant’s books and the number of all shares of the registrant owned beneficially and of record by the recommending shareholder (as evidenced to the Nominating Committee’s satisfaction by a recent brokerage or account statement); and
(iv) A description of all arrangements or understandings between the recommending shareholder and the candidate and any other person or persons (including their names) pursuant to which the recommendation is being made by the recommending shareholder.
In addition, the Nominating Committee may require the candidate to furnish such other information as it may reasonably require or deem necessary to determine the eligibility of such candidate to serve on the Board or to satisfy applicable law and information regarding the candidate that would be required to be disclosed if the candidate were a nominee in a proxy statement or other filing required to be made in connection with solicitation of proxies for election of Trustees.
ITEM 11. CONTROLS AND PROCEDURES.
(a) An evaluation was performed within 90 days of the filing of this report, under the supervision and with the participation of the registrant’s management, including the principal executive officer and principal financial officer, of the effectiveness of the design and operation of the registrant’s disclosure controls and procedures. Based on that evaluation, the principal executive officer and principal financial officer concluded that the registrant’s disclosure controls and procedures were effective.
(b) The registrant’s principal executive officer and principal financial officer are aware of no changes in the registrant’s internal control over financial reporting that occurred during the second fiscal quarter of the period covered by this report that has materially affected, or is reasonably likely to materially affect, the registrant’s internal control over financial reporting.
ITEM 12. EXHIBITS.
(a)(1) The registrant’s code of ethics pursuant to Item 2 of Form N-CSR is attached. (EX.99A)
(a)(2) Certifications pursuant to Section 302 of the Sarbanes-Oxley Act of 2002 are attached. (EX.99B)
(a)(3) Not applicable.
(b) Certifications pursuant to Section 906 of the Sarbanes-Oxley Act of 2002 are attached. (EX.99C)
SIGNATURES
Pursuant to the requirements of the Securities Exchange Act of 1934 and the Investment Company Act of 1940, the registrant has duly caused this report to be signed on its behalf by the undersigned, thereunto duly authorized.
| | |
| Dodge & Cox Funds |
| |
| By | | /s/ Charles F. Pohl |
| | Charles F. Pohl |
| | Chairman - Principal Executive Officer |
| |
| Date | | February 26, 2018 |
Pursuant to the requirements of the Securities Exchange Act of 1934 and the Investment Company Act of 1940, this report has been signed below by the following persons on behalf of the registrant and in the capacities and on the dates indicated.
| | |
| Dodge & Cox Funds |
| |
| By | | /s/ Charles F. Pohl |
| | Charles F. Pohl |
| | Chairman - Principal Executive Officer |
| |
| By | | /s/ David H. Longhurst |
| | David H. Longhurst |
| | Treasurer - Principal Financial Officer |
| |
| Date | | February 26, 2018 |